Generalised influential rule search scheme for fuzzy function approximation
Upload
khangminh22Category
view
3download
0
n. 16/2008 Generalised software for statistical cooperation
G. Barcaroli, S. Bergamasco, M. Jouvenal, G. Pieraccini e L. Tininini
Le collane esistenti presso l'ISTAT - Rivista di Statistica Ufficiale, Contributi ISTAT e
Documenti ISTAT - costituiscono strumenti per promuovere e valorizzare l'attività di ricerca e per diffondere i risultati degli studi svolti, in materia di statistica ufficiale, all'interno dell' ISTAT, del SISTAN, o da studiosi esterni.
La Rivista di Statistica Ufficiale accoglie lavori che hanno come oggetto la misurazione dei fenomeni economici, sociali, demografici e ambientali, la costruzione di sistemi informativi e di indicatori, le questioni di natura metodologica, tecnologica o istituzionale connesse al funzionamento dei sistemi statistici e al perseguimento dei fini della statistica ufficiale.
I lavori pubblicati in Contributi ISTAT sono diffusi allo scopo di stimolare il dibattito intorno ai risultati preliminari di ricerca in corso.
I Documenti ISTAT forniscono indicazioni su linee, progressi e miglioramenti di prodotto e di processo che caratterizzano l'attività dell'Istituto.
Il Comitato di redazione esamina le proposte di lavori da pubblicare nelle tre collane sopra indicate. Quelli pubblicati nei Contributi ISTAT e nei Documenti ISTAT sono valutati preventivamente dai dirigenti dell'Istituto, mentre i lavori pubblicati nella Rivista di Statistica Ufficiale sono subordinati al giudizio di referee esterni.
Direttore responsabile della Rivista di Statistica Ufficiale: Patrizia Cacioli Comitato di Redazione delle Collane Scientifiche dell’Istituto Nazionale di Statistica Coordinatore: Giulio Barcaroli Membri: Corrado C. Abbate Rossana Balestrino Giovanni A. Barbieri
Giovanna Bellitti Riccardo Carbini Giuliana Coccia Fabio Crescenzi Carla De Angelis Carlo M. De Gregorio Gaetano Fazio Saverio Gazzelloni Antonio Lollobrigida Susanna Mantegazza Luisa Picozzi Valerio Terra Abrami Roberto Tomei Leonello Tronti Nereo Zamaro
Segreteria: Gabriella Centi, Carlo Deli e Antonio Trobia
Responsabili organizzativi per la Rivista di Statistica Ufficiale: Giovanni Seri e Carlo Deli
Responsabili organizzativi per i Contributi ISTAT e i Documenti ISTAT: Giovanni Seri e Antonio Trobia
ISTAT – Produzione libraria e centro stampa
n. 16/2008 Generalised software for statistical cooperation G. Barcaroli(*), S. Bergamasco(**), M. Jouvenal(***) G. Pieraccini(****) e L. Tininini(*****) (*) ISTAT - Servizio Metodologie, tecnologie e software per la produzione dell’informazione statistica (**) ISTAT - Servizio Gestione e analisi integrata dell’output (***) ISTAT - Ufficio delle Relazioni internazionali e della cooperazione internazionale (****) Statistics and IT Consultant
(*****) CNR - Istituto di Analisi dei Sistemi ed informatica I lavori pubblicati riflettono esclusivamente le opinioni degli autori e non impegnano la responsabilità dell'Istituto

Contributi e Documenti Istat 2008
Istituto Nazionale di Statistica Servizio Produzione Editoriale
Produzione libraria e centro stampa:Carla PecorarioVia Tuscolana, 1788 - 00173 Roma
Sommario In questo lavoro viene presentato il risultato dell’analisi dell’utilizzo di software generalizzato nei progetti di cooperazione statistica internazionale. Il software in questione deve rispondere ai seguenti requisiti: (i) deve essere generalizzato, cioè applicabile a casi differenti senza o con limitata necessità di sviluppare codice ad hoc; (ii) deve essere portabile, deve cioè poter essere eseguito su differenti piattaforme elaborative senza necessità di intervento; (iii) deve essere disponibile a titolo gratuito. I requisiti di cui sopra possono garantire la sostenibilità delle soluzioni che i paesi donatori propongono ai paesi in via di sviluppo. Per ogni fase di una tipica indagine statistica vengono proposti uno o più software generalizzati free o open source: di ognuno di essi vengono fornite indicazioni sul loro utilizzo, e sulle eventuali esperienze già condotte nell’ambito di progetti di cooperazione. Abstract In this paper, the analysis of the use of generalised software in international statistical cooperation projects is illustrated. This software has to be compliant to the following requisites: (i) it has to be generalised, i.e. applicable to different cases without (or with a very limited) need to develop ad hoc code; (ii) it must be portable, i.e. it can be run on different platforms with no need to be modified; (iii) it does not require financial resources to be acquired. The above requisites underpin the sustainability of the solutions that donor countries design for the statistical agencies of developing countries. For each phase of a statistical survey, one or more generalised software are considered, together with the indications for their usage, and experiences already made with them are reported. Keywords: statistical cooperation, generalised software Le collane esistenti presso l'ISTAT - Contributi e Documenti - costituiscono strumenti per promuovere e valorizzare l'attività di ricerca e per diffondere i risultati degli studi svolti, in materia di statistica ufficiale, all'interno dell'ISTAT e del Sistan, o da studiosi esterni. I lavori pubblicati Contributi Istat vengono fatti circolare allo scopo di suscitare la discussione attorno ai risultati preliminari di ricerca in corso. I Documenti Istat hanno lo scopo di fornire indicazioni circa le linee, i progressi ed i miglioramenti di prodotto e di processo che caratterizzano l'attività dell'Istituto. I lavori pubblicati riflettono esclusivamente le opinioni degli autori e non impegnano la responsabilità dell'Istituto.


INTRODUCTION...............................................................................................................5
I. THE PRODUCTION PROCESS IN A STATISTICAL SURVEY AND RELATED GENERALISED SOFTWARE..............................................................................................6
1. Sampling design and sampling units selection ........................................................................................................... 7 1.1. Methodology ............................................................................................................................................................ 7 1.2. Software ................................................................................................................................................................... 8
2. Computer aided survey information collection ......................................................................................................... 10 2.1. CSPro..................................................................................................................................................................... 11 2.2. LimeSurvey............................................................................................................................................................. 12
3. Data integration: record linkage ................................................................................................................................ 13 3.1. Methodology .......................................................................................................................................................... 14 3.2. Software: RELAIS .................................................................................................................................................. 14
4. Data editing and imputation ...................................................................................................................................... 16 4.1. Methodology .......................................................................................................................................................... 16 4.2. Software ................................................................................................................................................................. 17
5. Sampling estimates and errors calculation ................................................................................................................ 22 5.1. Methodology .......................................................................................................................................................... 22 5.2. Software ................................................................................................................................................................. 23
6. Data analysis and data mining ................................................................................................................................... 25 6.1. Statistical software .................................................................................................................................................. 25 6.2. Data mining............................................................................................................................................................ 27
7. Statistical disclosure control ....................................................................................................................................... 30 7.1. Methodology .......................................................................................................................................................... 30 7.2. Software ................................................................................................................................................................. 31
8. Tabulation and traditional dissemination ................................................................................................................. 33 8.1. Software ................................................................................................................................................................. 33
9. Web dissemination ...................................................................................................................................................... 35 9.1. Statistical dissemination systems ............................................................................................................................. 35
9.2. GIS............................................................................................................................................................................ 41
9.3. Microdata dissemination: Microdata Management Toolkit ................................................................................. 41
II. COOPERATION EXPERIENCES ................................................................................43
1. IT Strategy (Bosnia Herzegovina, Tunisia).............................................................................................................. 43
2. Sampling design (Bosnia Herzegovina, Albania) .................................................................................................... 44
3. Computer aided information collection (Bosnia Herzegovina, Albania, Kosovo, Cape Verde) ............................ 45
4. Data editing and imputation (Bosnia Herzegovina, Cape Verde).......................................................................... 45
5. Sampling estimates (Bosnia Herzegovina, Albania) .............................................................................................. 45
6. Data analysis and data mining (Bosnia Herzegovina) ............................................................................................ 46

7. Statistical disclosure control (Bosnia Herzegovina) ................................................................................................ 46
8. Tabulation (Albania) .................................................................................................................................................. 46
9. Statistical dissemination systems (Bosnia Herzegovina, Kosovo) ......................................................................... 47
10. GIS (Kosovo, Bosnia Herzegovina).......................................................................................................................... 47
11. Microdata dissemination (Bosnia Herzegovina) .................................................................................................... 48
III. CONCLUSIONS AND RECOMMENDATIONS .........................................................48
REFERENCES ..................................................................................................................50
5
Introduction The present article aims at reporting and analysing the generalised open software that ISTAT, the Italian National Institute of Statistics, has developed and applied in its technical cooperation activities. Through the analysis of the different phases of a statistical survey, one or more generalised software are considered, indications on their usage are indicated and experiences occurred in cooperation activities are described, together with a few conclusion and recommendations. Results are derived from several years of work, stemming from the consideration that in statistical cooperation activities one of the most frequent requests received alongside statistical methodology and its application concerns statistical software. From a very general standpoint, the issue of the use of statistical software has an impact not only on the way each phase of the statistical production process is tackled, performed and mastered, but it has to do with the very sustainability of the statistical system that is supported and fostered through technical cooperation. Donors often dedicate limited time and resources to cooperation activities, and once methodologies are transferred and acquired, the required objectives and results are obtained by supplying beneficiary institutions with the software applications used by the relevant partner: this is often either a commercial software, whose costly licenses expire, or software developed ad hoc by the partner institution, whose replicability is low or even null; training is also frequently provided, rendering that specific intervention acceptable, but limited, and with no given relation with the overall IT framework of the beneficiary institution. In these institutions, the situation is worsened by the high human resources turnover, especially of the one expert in software development, which - as it becomes experienced - finds more remunerative positions and flees away. The fastly changing IT environment and knowledge creates an additional pressure for these institution to optimise their approach. As a result, the managers of a statistical institution in development have to urgently face the issue with a comprehensive strategy, as it touches aspects like scientific independence, sustainability of development processes and human and financial resource management. ISTAT has attempted to support the institutions involved in its cooperation programmes and to tackle the mentioned issues, by fostering the use of generalised open software wherever possible. The different phases of the most relevant surveys carried out by any statistical agency is therefore described in the following chapters through the analysis of the statistical software required, bearing in mind that this should be at least:
- generalised, i.e. applicable to different cases without (or with a very limited) need to develop ad hoc code;
- portable, i.e. it can be run on different platforms with no need to be modified; - possibly not costly
The analysis of the solutions ISTAT has adopted internally over time is also briefly outlined, together with the experience of ISTAT in this field in technical cooperation.

6
I. The production process in a statistical survey and related generalised software
The production of statistical information in an institute responsible for official statistics is mainly, although not exclusively, based on the statistical survey. This is, in turn, characterised by a standard process organised in different steps.
Figure 1: The production process in a statistical survey The main goal of people working in an environment where several different surveys are regularly carried out, is to make available for each survey stage – from sample design to data analysis and dissemination – generalised IT solutions, i.e. systems designed so as to ensure production functionalities, that have the following features:
1. implement advanced methodologies and techniques; 2. are operable with no or limited need for further software development; 3. are provided with adequate documentation and user-friendly interface, usable also by
non expert users.
Planning of data collection
Definition of information contents
Choice of the sampling strategy
Design and implementation of procedures for treatment of errors
Definition of microdata files for dissemination
Definition of aggregates for dissemination
Selection of sampling units
DESIGN IMPLEMENTATION
Treatment of errors and item non response
Data analysis
Microdata and aggregate data dissemination
Documentation
Data collection, storage and coding
Design and implementation of Data Warehouse
Integration of total non response and calculation of estimates
7
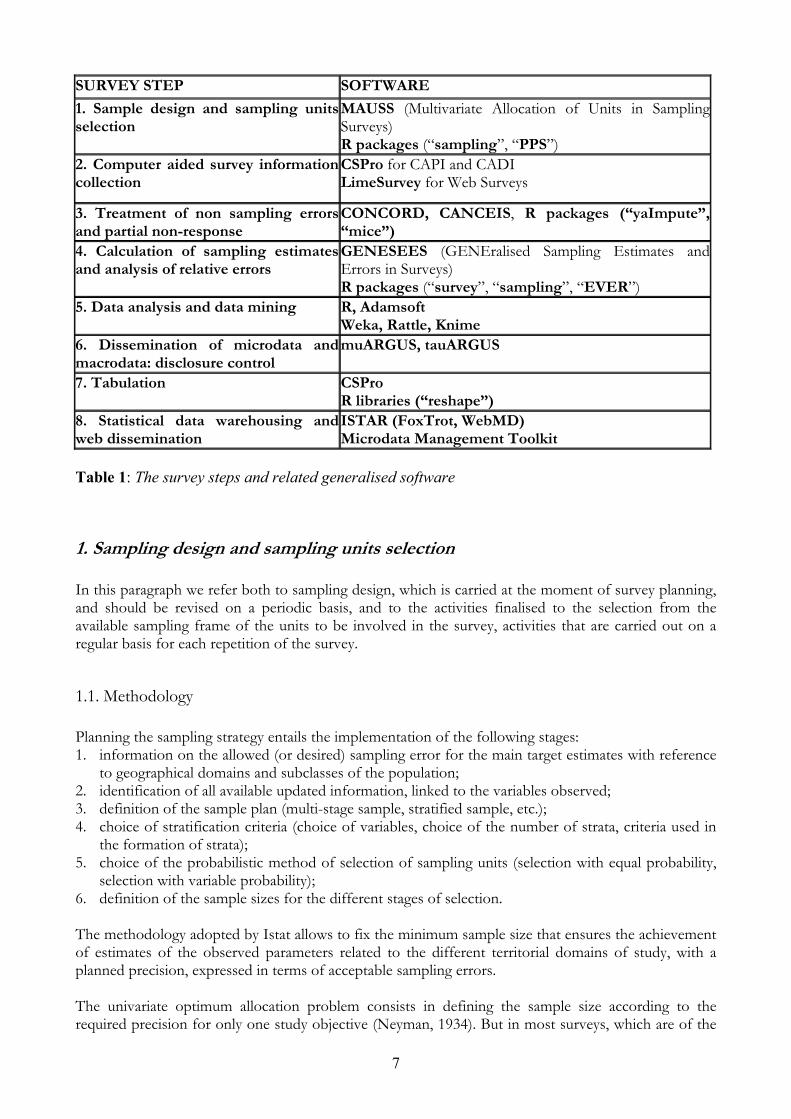
SURVEY STEP SOFTWARE 1. Sample design and sampling units selection
MAUSS (Multivariate Allocation of Units in Sampling Surveys) R packages (“sampling”, “PPS”)
2. Computer aided survey information collection
CSPro for CAPI and CADI LimeSurvey for Web Surveys
3. Treatment of non sampling errors and partial non-response
CONCORD, CANCEIS, R packages (“yaImpute”, “mice”)
4. Calculation of sampling estimates and analysis of relative errors
GENESEES (GENEralised Sampling Estimates and Errors in Surveys) R packages (“survey”, “sampling”, “EVER”)
5. Data analysis and data mining R, Adamsoft Weka, Rattle, Knime
6. Dissemination of microdata and macrodata: disclosure control
muARGUS, tauARGUS
7. Tabulation CSPro R libraries (“reshape”)
8. Statistical data warehousing and web dissemination
ISTAR (FoxTrot, WebMD) Microdata Management Toolkit
Table 1: The survey steps and related generalised software
1. Sampling design and sampling units selection In this paragraph we refer both to sampling design, which is carried at the moment of survey planning, and should be revised on a periodic basis, and to the activities finalised to the selection from the available sampling frame of the units to be involved in the survey, activities that are carried out on a regular basis for each repetition of the survey.
1.1. Methodology Planning the sampling strategy entails the implementation of the following stages: 1. information on the allowed (or desired) sampling error for the main target estimates with reference
to geographical domains and subclasses of the population; 2. identification of all available updated information, linked to the variables observed; 3. definition of the sample plan (multi-stage sample, stratified sample, etc.); 4. choice of stratification criteria (choice of variables, choice of the number of strata, criteria used in
the formation of strata); 5. choice of the probabilistic method of selection of sampling units (selection with equal probability,
selection with variable probability); 6. definition of the sample sizes for the different stages of selection. The methodology adopted by Istat allows to fix the minimum sample size that ensures the achievement of estimates of the observed parameters related to the different territorial domains of study, with a planned precision, expressed in terms of acceptable sampling errors. The univariate optimum allocation problem consists in defining the sample size according to the required precision for only one study objective (Neyman, 1934). But in most surveys, which are of the
8
multipurpose kind, the sample size should be planned by considering a set of different sample objectives, i.e. the sample size must be planned with the aim of ensuring given precision levels for a set of different estimates. This multivariate allocation problem can be dealt with according to two different approaches: the first one considers a weighted average of the stratum variances and finds the optimal allocation for the average variance; the second one requires that each variance satisfies an inequality constraint, and, by using convex programming, looks for the least cost allocation that satisfies all constraints. The first approach is simple to implement, but the choice of weights is arbitrary. The solution based on the convex programming approach, on the contrary, gives on “objective” optimal solution. Moreover, by using Bethel algorithm it is possible to obtain “scalable” solutions, in the sense that if the optimal solution exceeds the budgetary constraint, it is possible to scale down the solution vector of allocation in strata, maintaining its optimality (Bethel, 1989). A non-trivial problem is in finding the optimal stratification of the population, according to the particular targets of the current survey. This problem has been explored first by Dalenius (Dalenius 1952). A linked problem is in the determination of so called “take-all” strata, i.e. the strata in which all units must be selected: this is particular convenient in business surveys, where large units should be in any case observed (Hidiroglou 1986). Once having defined the sampling strategy and the (multivariate) allocation of units, sample implementation requires the actual selection of units from the available sampling frame. For this operation, a number of different methods can be used, depending on the adopted sampling strategy. In official statistics, methods that can lead to a precise identification of inclusion probabilities are privileged.
1.2. Software
1.2.1. MAUSS ISTAT has developed a software that allows the determination of the allocation of the sample in multivariate cases and for several domains for surveys with unit stage sampling, letting users to chose among different alternative solutions. A subsequent step of development (whose planning stage is already underway) of a new software function for two-stage sample designs is foreseen. MAUSS (Multivariate Allocation of Units in Sampling Surveys), is based on Bethel’s method and allows to:
1. determine the sample size; 2. allocate the total amount of units in the different strata of the population.
Required inputs are: • desired precision for each estimate of interest; • variability of target estimates in the population strata; • available budget and costs associated with data collection.
9
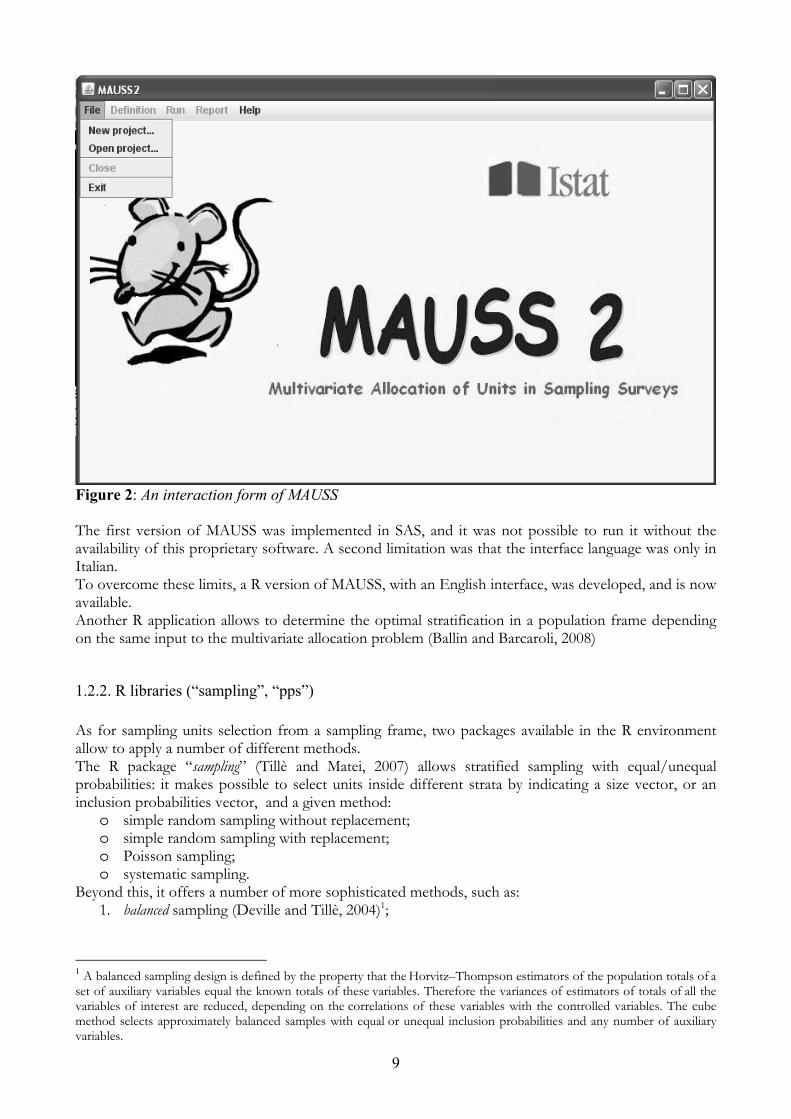
Figure 2: An interaction form of MAUSS The first version of MAUSS was implemented in SAS, and it was not possible to run it without the availability of this proprietary software. A second limitation was that the interface language was only in Italian. To overcome these limits, a R version of MAUSS, with an English interface, was developed, and is now available. Another R application allows to determine the optimal stratification in a population frame depending on the same input to the multivariate allocation problem (Ballin and Barcaroli, 2008)
1.2.2. R libraries (“sampling”, “pps”) As for sampling units selection from a sampling frame, two packages available in the R environment allow to apply a number of different methods. The R package “sampling” (Tillè and Matei, 2007) allows stratified sampling with equal/unequal probabilities: it makes possible to select units inside different strata by indicating a size vector, or an inclusion probabilities vector, and a given method:
o simple random sampling without replacement; o simple random sampling with replacement; o Poisson sampling; o systematic sampling.
Beyond this, it offers a number of more sophisticated methods, such as: 1. balanced sampling (Deville and Tillè, 2004)1;
1 A balanced sampling design is defined by the property that the Horvitz–Thompson estimators of the population totals of a set of auxiliary variables equal the known totals of these variables. Therefore the variances of estimators of totals of all the variables of interest are reduced, depending on the correlations of these variables with the controlled variables. The cube
method selects approximately balanced samples with equal or unequal inclusion probabilities and any number of auxiliary
variables.
10
2. Brewer method for sampling with unequal probabilities without replacement and a fixed sample size (Brewer, Hanif, 1983);
3. maximum entropy or conditional Poisson sampling (Lee, Williams 1999). The R package “sampling” also allows multistage sampling. With this function, it is possible to perform, for example:
1. two-stage cluster sampling: in a first step, m clusters (PSUs, primary stage units) are selected from a sampling frame, by applying one of the four standard methods (simple random sampling with or without replacement, Poisson or systematic), and then in each cluster i a number of n i secondary stage units (SSUs) are selected, and final inclusion probabilities π i are calculated for each of them.
2. two-stage stratified sampling: it is possible to indicate if primary or secondary units, or both, are stratified, and along which variables;
3. two stage element sampling: after selecting m PSUs, then n SSUs are sampled from the obtained list.
The R package “pps” (Gambino, 2005) is specialised in sampling methods that yield probability proportional to the size of units. PPS systematic sampling has the great advantage that it is easy to implement. It also has the property that the inclusion probability of a unit is proportional to its size. Thus it is a type of so-called πps sampling, i.e., a unit’s inclusion probability π i is proportional to its size . Like simple systematic sampling, the PPS version has the disadvantage that there is no variance estimator for it (Cochran, 1977). The Sampford method (Sampford, 1967) has several desirable properties. It is a πps scheme, it is relatively easy to implement, it selects units without replacement, and since joint inclusion probabilities can be computed explicitly, variances and variance estimators are available. The version of Sampford method implemented in this package is the one described briefly by Cochran (1977, pages 262-263).
2. Computer aided survey information collection
Notwithstanding the completeness and accuracy of the collection of statistical information, if the data intake is not made in the correct way the quality of results can be badly affected. This is the main reason why data intake is a critical phase in the whole production process and this is even truer when dealing with sample survey instead of census. The data intake phase offers the greatest opportunity to use sophisticated technology; however, the main aim of implementing a particular technology should be to assist in the effective and efficient processing of a survey, and not to implement technology for technology’s sake. Moreover, in some cases the adoption of new technologies is not cost-effective; this is often the case in many developing countries where labor cost is low and the adoption of sophisticated technology, like for example optical recognition, risks to be more expensive than traditional key-entry systems. Operations at the processing center need to be carefully managed for a successful outcome of the data entry phase. The quality of the staff employed as managers and data entry operators, and the software tools they are provided with, have a large impact on the success of the data entry operations and are critical to the achievement of the entire operation. A good application for manual data entry should have the following main characteristics: o the screens for data entry resemble the physical questionnaires as closely as possible to facilitate
accurate and quick data entry; o range checks are performed and out-of-range value flagged during data recording; o consistency checks both within records and between records are performed; o tables for automatic coding of values are incorporated; o a mechanism for retrieving records in order to correct and/or append new data are included;

11
o a mechanism to avoid double recording of the same questionnaires is included. During the development of the data entry application it is important to adopt the data entry operator’s view. Indeed, once the system has been designed, the hard work comes when operators start inserting data in it. It is possible to relieve much of the tedium of data entry by ensuring that screens are logically organized, easy on the eyes and efficient.
2.1. CSPro One of the most used software for developing data intake systems is CSPro. This is a public-domain software package for entering, tabulating and mapping survey and census data. It is developed jointly by the U.S. Census Bureau, Macro International, and Serpro SA, with major funding from the U.S. Agency for International Development. It works mainly in Microsoft Windows environment like Windows 98, XP, 2000 and Vista. CSPro is available at no cost and is freely distributed. It is available for download at the address www.census.gov/ipc/www/cspro CSPro is suitable for most of the needs of a survey, although its use requires some training of the IT experts that use it. As for the training aspect of CSPro, the US Census Bureau runs workshops on it. CSPro permits to create, modify, and run data entry, batch editing, and tabulation applications from a single, integrated development environment. CSPro also provides tools to produce thematic maps and to convert ERSI maps to CSPro map files. The major limit of CSPro is that it does not support the client/server capability of a network, so that each data entry application has to work on a local machine. This restriction implies that a certain amount of work is required for creating the final complete dataset. Indeed, starting from the local files coming from the different machines a concatenation file has to be generated; moreover, also the backup and restore operations will prove longer and, altogether, less safe. But it is to be underlined that all these operations can be automated with special CSPro functions (i.e. file concatenation) or with some simple backup and scheduling software. Good backup and scheduling software can be easily found among open source applications. Another limit of CSPro is the text format of the saved data. Although CSPro allows an easy export of data in the formats used by the most used statistical software, it can not export data in a professional Relational Database Management System (RDBMS) like MySQL or PostgreSQL. Data entry CSPro permits to create a stand-alone data entry environment in which it is possible to add, modify, verify and view questionnaires data. This stand-alone data entry application normally contains data, dictionaries and forms. A data dictionary describes the overall organization of a data file while a form is the interface used for entering the data into the different fields. Each dictionary allows to define records, fields, value sets and labels. It also allows to describe the organization of each record and the characteristics of each field in the record: names, position in the data record, type of data, length, number of decimal places, valid values, and other documentation. Each data entry application can contain an unlimited number of forms that, eventually, can scroll if it is required. The forms can contain fields from different physical records, different kinds of rosters and skip patterns. With his powerful Visual Basic-like language, a CSPro application can execute procedures before and/or after a value is entered in a field, create consistency checks of unlimited complexity and display user-defined messages. It can also manage automatically the indexing of the questionnaires to avoid duplication. Usually in a questionnaire the different answers to a question are pre-coded and codes are written on the right of each modality. However it is sometimes necessary to leave the possibility to enter a not predefined textual answer to some specific questions. Since the recording and the treatment of textual value are not very easy from a statistical point of view, normally this textual answer should be recoded. This recoding operation can happen before, during or
12
after the data entry operations and can be performed using codifier personnel or accessing look-up lists of CSPro. Menu selection using look-up lists is very appropriate for this purpose, because it allows operators to choose among displayed alternatives and will dramatically speed up the coding operations. It is also to be underlined that since CSPro has a real and powerful programming language, an ad hoc batch procedure can be developed to automatically recode the textual value of a specific field at the end of the data entry operation. The problem of this kind of approach is not the difficult to develop such kind of procedures but the efficiency of the algorithm adopted for the proper identification of the textual values. CSPro permits also to concatenate two or more data files. For using this utility the only information needed is the name and location of the files to be combined. CSPro easily allows the exporting of the recorded data to SPSS, SAS, and STATA formats. Since CSPro support also the exporting in text delimited format (tab, comma, semicolon), it is also possible to export CSPro datasets in a way that they can be easily read by other software systems. Data validation Over the years, question on whether editing or not recorded data have generated great discussions and even controversies. But, whatever the quality of the data is, should be at least guaranteed that mistakes are not added from the data entry operator side. This operation can be done by carefully examining the recorded data. In CSPro, two ways of data validation are available: double keying and consistency checking. CSPro supports both dependent and independent double keying. Using independent double keying, operators can key data into separate data files and use CSPro utilities to compare them. Using dependent double keying, operators can key data a second time and have CSPro immediately compare it to what was keyed the first time on a field by field basis. The consistency checking available in CSPro is called Batch Editing; the major purpose of the Batch Editing procedure is not to correct the mistake done during the interview but to ensure that paper questionnaire and recorded data are identical. More precisely, a batch editing application will use a set of consistency checking defined by the user to perform the following activities:
o validate single data items; o test consistency between items; o generate “suspected data” report; o retrieve records in order to correct data entry operator mistakes;
Batch Editing is better carried out as a separate step, with errors reported on paper that can be used for underlining the “suspected values” to be checked with paper data. Operators should run the Batch edit procedure periodically to check the mistakes underlined in the reports and to verify them with the values written in the correspondent paper questionnaires. Normally this operation is carried out at a specific geographic level (i.e. when all the questionnaires of an enumeration area are recorded), but could also be carried out on a working day basis. It is anyway important to bear in mind that if a batch editing procedures is realized, a much longer and accurate training of the operators must be performed to make them capable of properly using these features.
2.2. LimeSurvey LimeSurvey (former PHPSurveyor) is an open source tool for web surveys. Its functionalities allow to:
1. design the electronic questionnaire; 2. enable a list of respondents using an automatic identification system; 3. reach all respondents by email; 4. monitor the response flow;

13
5. solicit non respondents; 6. store responses in a database (MySql); 7. export responses in an external dataset suitable for statistical analysis,
with no need to further develop ad hoc software. Its weaknesses are:
• no possibility to use already available information on respondents; • problems with the treatment of complex response paths in the questionnaire.
The software is currently used in Istat mainly for small surveys when timeliness in obtaining result is the most important feature.
Figure 3: An interaction form of PHPSurveyor / LimeSurvey
3. Data integration: record linkage In many situations it is necessary to link data from different sources, taking care in referring correctly the information pertaining to the same units. For instance, given a statistical survey on households consumptions and income, it can be useful to link fiscal data in order to perform editing and imputation of observed items. If common and unique identifiers on both datasets are identified, to join the datasets is a straightforward task, but this is a very uncommon situation. So, it will be necessary to compare a subset of common variables in order to perform the record linkage. The task is complicated by the fact that matching variables are generally subject to errors and missing values, so a methodology to deal with these complex situations is required, together with software enabling to ally it.

14
3.1. Methodology Given two sets A and B of units, with dimensions respectively An and Bn , the objective of record linkage is to find all the couples (a,b), where a ∈ A and b∈ B, such that a and b are referred to the same unit. Considering as a starting point the Cartesian product of the two sets
B b A, a | b)(a, ∈∈=Ω with dimension BA n n N || ×==Ω the individuation of the subset of couples that are related to the same unit is performed by comparing the values of k matching variables. Matching variables could identify units in a unique way and with certainty if they were not affected by errors or missing values. For this reason, in practical situations a probabilistic approach as the one defined by Fellegi and Sunter (Fellegi, Sunter 1969) is preferable to exact or deterministic linkage. According to this approach, the comparison between matching variables is performed on the basis of a suitable function, chosen accordingly on the nature of the variable (continuous or categorical). Results of all comparisons are grouped in a vector γ . The probabilistic model assumes that the distribution of vector γ is given by a mixture of two distributions, one generated by couples (a,b) that represent the same unit (the m distribution), the other one generated by couples (a,b) that represent different units (the u distribution). An estimate of the probability of linkage between a and b is given by the likelihood ratio
U)|Pr(M)|Pr(
)u()m(
r γγ
γγ
==
where M is the set of couples that are true links, while U is the set of couples that refer to units that do not link, with Ω=∪ UM and φ UM =∩ . When the number of matching variables is below four, Fellegi and Sunter give a set of equations that allow to explicitly obtain estimates of m( γ ) and u( γ ). When matching variables are more than three, these estimates are generally obtained by means of the EM algorithm, with the underlying assumption of a latent variables model, where the latent variable is the unknown link state. Once r values have been estimated for all couples (a,b), then a couple will be considered as a link if its r value is above a threshold value mT . Conversely, if r value is below a threshold value uT , the couple will be considered as a non-link. All couples whose r values lay inside the interval ( uT , mT ) will be considered as uncertain, and decisions will be taken by manual inspection. Thresholds uT , mT are determined in such a way so to minimise false positives, false negatives, and the area of the uncertainty region.
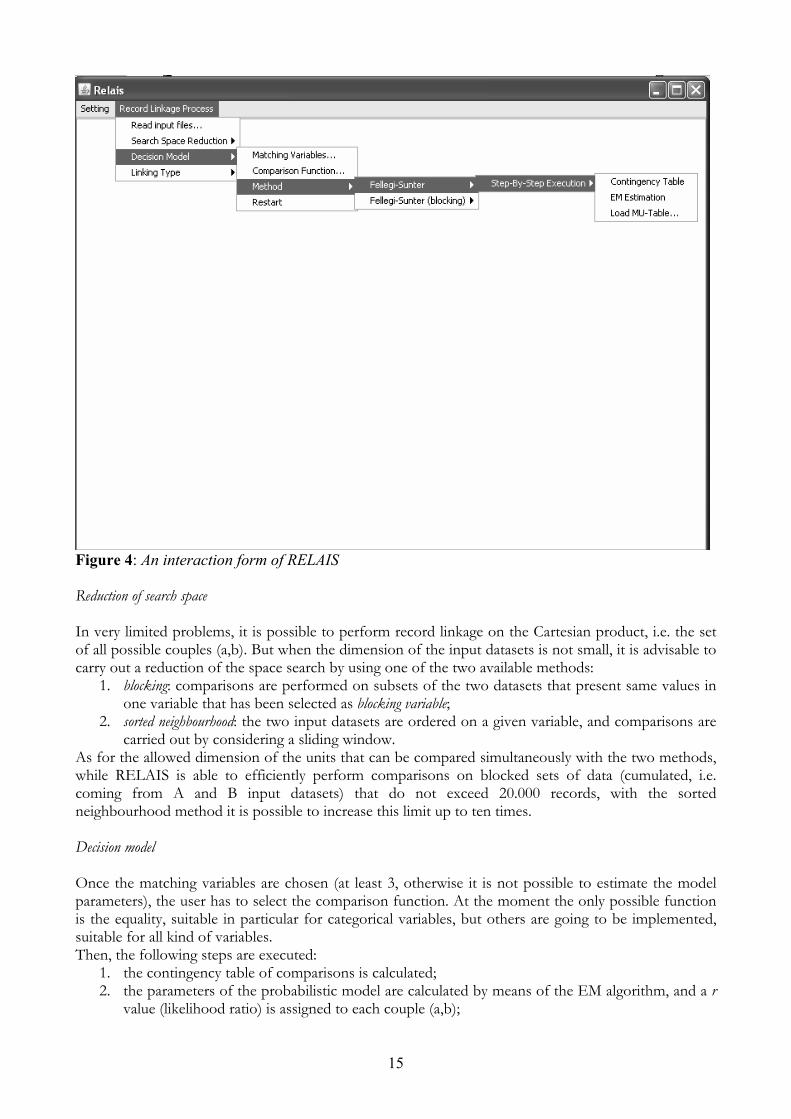
3.2. Software: RELAIS The generalised software for record linkage RELAIS has been developed in ISTAT by using Java and R (Cibella et al, 2008). It allows to perform the following steps:
1. reduction of search space; 2. estimation of the decision model; 3. matching.
15
Figure 4: An interaction form of RELAIS Reduction of search space In very limited problems, it is possible to perform record linkage on the Cartesian product, i.e. the set of all possible couples (a,b). But when the dimension of the input datasets is not small, it is advisable to carry out a reduction of the space search by using one of the two available methods:
1. blocking: comparisons are performed on subsets of the two datasets that present same values in one variable that has been selected as blocking variable;
2. sorted neighbourhood: the two input datasets are ordered on a given variable, and comparisons are carried out by considering a sliding window.
As for the allowed dimension of the units that can be compared simultaneously with the two methods, while RELAIS is able to efficiently perform comparisons on blocked sets of data (cumulated, i.e. coming from A and B input datasets) that do not exceed 20.000 records, with the sorted neighbourhood method it is possible to increase this limit up to ten times. Decision model Once the matching variables are chosen (at least 3, otherwise it is not possible to estimate the model parameters), the user has to select the comparison function. At the moment the only possible function is the equality, suitable in particular for categorical variables, but others are going to be implemented, suitable for all kind of variables. Then, the following steps are executed:
1. the contingency table of comparisons is calculated; 2. the parameters of the probabilistic model are calculated by means of the EM algorithm, and a r
value (likelihood ratio) is assigned to each couple (a,b);

16
3. results are visualised with the MU Table, reporting for each configuration of the comparison vector, the corresponding estimated frequencies of links and non links.
Matching At this point, it is necessary to distinguish between two situations:
o the target of record linkage is of the 1:1 type, i.e. it is required to identify for each unit a ∈ A, the linked unit b∈ B;
o the target of the m:n type, i.e. links are between sets of units in the two datasets. In the first case (1:1), constraints must be given to ensure that each a is linked to just one b, and viceversa. This problem can be handled as a linear programming one, and it is solved by applying the “lpsolve” R package. The algorithm can handle situations characterised by near 1.000 couples with a r value greater than one. Once obtained the “reduced” contingency table, the mT and uT threshold values have to be chosen. In doing this, the user is supported by the distribution of r values contained in the reduced contingency table. Finally, the following output files are produced:
o files containing couples of record identified as possible links; o one file containing linked couples.
The (n:m) case is performed in an analogous way, without the necessity of solving the linear programming problem.
4. Data editing and imputation Edit and imputation of data is defined as all the activities finalised (i) to the localisation of item non responses and errors in collected data, (ii) integration of missing values and (iii) correction of errors. Procedures that implement these activities can be interactive (i.e. carried out by expert personnel on individual data), automatic (applied in a batch mode to data) or mixed.
4.1. Methodology The objectives of the inspection and correction phases are, generally, to guarantee a higher quality of estimates produced (quality being intended as accuracy), but also of making elementary data presentable once they are distributed for external use. To achieve this, we can distinguish between the deterministic approach, and the non deterministic approach. The latter, on turn, can be detailed as “minimum change” based, or “data driven”. A deterministic procedure for editing and imputation is based on “deterministic” rules, of the type “if within the current observation a certain inconsistency involving a set of variables is present, then act in the sense of modifying the value of a determined variable assigning it a pre-defined value”. From a qualitative viewpoint this method was greatly limited, but it dominated uncontested the data treatment processes at the Institutes of statistics until the mid 1970s. In 1976 Fellegi and Holt proposed a completely different methodology (Fellegi and Holt, 1976), which was immediately adopted by Statistics Canada, and later by other Institutes including ISTAT. The methodology in question is based on a non deterministic or probabilistic method. The objective is not only - or not so much - to eliminate, in any way, data inconsistencies; but, analysing inconsistencies found in a given observation, to identify those variables whose values are most probably erroneous, and proceed to correct them by assigning the values most likely to be closest to their true value, producing in this way greater accuracy in the estimates produced and distributed. This approach is known as the “minimum change” approach, in the sense that by identifying the minimum set of variables to be modified in order to eliminate inconsistencies in the observation, the identification of most probable erroneous values in the record is obtained.
17
This approach is correct in case of random errors, i.e. errors that happen completely by chance during the different phases of questionnaires compilation or data entry operations. In case of systematic errors, i.e. errors caused by precise factors (imperfections in questionnaire wording or structure, incorrect behaviour of data entry operators, etc.), the deterministic approach is preferable, because for any given cause the action to correct consequent errors is determined. In various situations, even in case of random errors, the minimum change performs poorly: for example, when relationships between observations are considered, rather than inside a single observation. For instance, in a given household, it is possible to define constraints involving relation to the head of family, and age, marital status, sex of single components. To deal specifically with this hierarchical structure of data, a different approach for error localisation and imputation was defined, known as the Nearest-neighbour Imputation Methodology, or the data driven approach (Bankier, 2006). The systems CONCORD and CANCEIS permit to automatically treat the location of errors in data, and the imputation of both errors and missing values. The CONCORD (CONtrollo e CORrezione Dati) system is composed by different modules, and its most important one (SCIA: Sistema Controllo e Imputazione Automatici) allows to apply the Fellegi-Holt approach for editing and imputation of data, and can be utilised in surveys where categorical variables are prevalent (mainly household surveys). One of the other modules, GRANADA, allows to apply the deterministic approach for systematic errors treatment. The CANCEIS system implements the data driven approach to error localisation and imputation, and can be applied both to continuous and categorical variables, and is especially helpful in the case of hierarchies of units (e.g. households and individuals).
4.2. Software
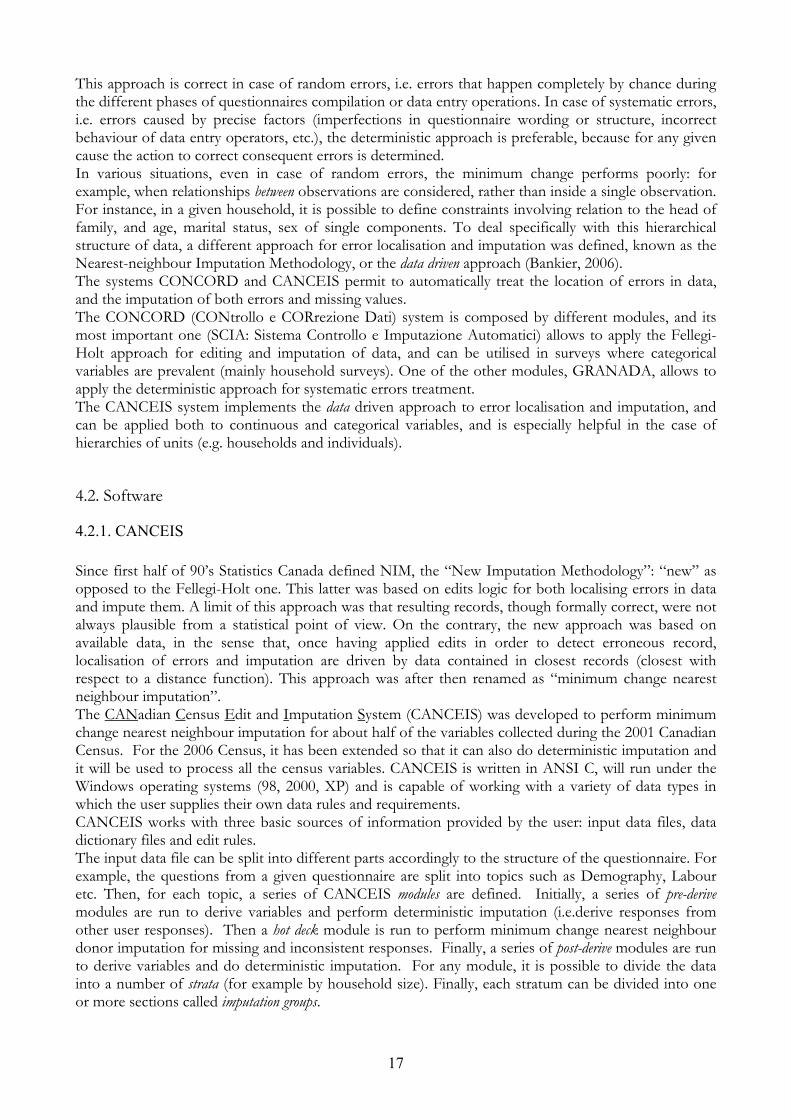
4.2.1. CANCEIS Since first half of 90’s Statistics Canada defined NIM, the “New Imputation Methodology”: “new” as opposed to the Fellegi-Holt one. This latter was based on edits logic for both localising errors in data and impute them. A limit of this approach was that resulting records, though formally correct, were not always plausible from a statistical point of view. On the contrary, the new approach was based on available data, in the sense that, once having applied edits in order to detect erroneous record, localisation of errors and imputation are driven by data contained in closest records (closest with respect to a distance function). This approach was after then renamed as “minimum change nearest neighbour imputation”. The CANadian Census Edit and Imputation System (CANCEIS) was developed to perform minimum change nearest neighbour imputation for about half of the variables collected during the 2001 Canadian Census. For the 2006 Census, it has been extended so that it can also do deterministic imputation and it will be used to process all the census variables. CANCEIS is written in ANSI C, will run under the Windows operating systems (98, 2000, XP) and is capable of working with a variety of data types in which the user supplies their own data rules and requirements. CANCEIS works with three basic sources of information provided by the user: input data files, data dictionary files and edit rules. The input data file can be split into different parts accordingly to the structure of the questionnaire. For example, the questions from a given questionnaire are split into topics such as Demography, Labour etc. Then, for each topic, a series of CANCEIS modules are defined. Initially, a series of pre-derive modules are run to derive variables and perform deterministic imputation (i.e.derive responses from other user responses). Then a hot deck module is run to perform minimum change nearest neighbour donor imputation for missing and inconsistent responses. Finally, a series of post-derive modules are run to derive variables and do deterministic imputation. For any module, it is possible to divide the data into a number of strata (for example by household size). Finally, each stratum can be divided into one or more sections called imputation groups.
18
Figure 5: An interaction form of CANCEIS Information about the variables is contained in the Data Dictionary. The data dictionary lists what variables are being used, what values are considered valid for each variable and provides labels for the numeric values of the coded variables (e.g. “Male”, “Female” for Sex) that can be used in the edits to make them easier to read. CANCEIS can process three types of variables: numeric (discrete or continuous), categorical or alphanumeric. Edit rules can be defined and grouped inside the Decision Logic Tables (DLT), referred to given units. In CANCEIS the basic entity that is processed is called the unit. CANCEIS also allows the user to work at a finer level called the sub-unit. In the context of the Census, both unit and sub-unit variables could be used within the same DLT. The unit can be a household or a family while the sub-units can be the persons within the household or family. Alternatively, the unit can be a person with no sub-units defined. Thus a DLT can refer to household level variables as well as groups of variables associated with each person in the household. With the use of the Interface or the DLT Editor, the data dictionary can help to write the edit rules accurately. CANCEIS initially identifies valid and invalid responses for each record based on information stored in the Data Dictionary. CANCEIS then uses edit rules defined in DLTs specified by the user to identify inconsistent responses between two or more variables. These inconsistent responses plus the invalid responses can then be resolved using minimum change nearest neighbour donor imputation or deterministically through the use of actions in the DLTs. The processing of the data is usually performed using a combination of the three following main software engines: the DLT Analyzer, the Imputation Engine and the Derive Engine The DLT Analyzer uses the decision logic tables and the data dictionary information to check the edit rules specified by the user for any syntax error or inconsistency and then it creates one unified DLT that is used by the Imputation Engine or the Derive Engine. The Imputation Engine applies the rules
19
of the unified DLT to the actual data and determines which units pass and fail the edit rules. Then, it searches for passed units that resemble each failed unit (these are called nearest-neighbour donors), and uses data from a nearest-neighbour donor to perform minimum change imputation. This donor search and selection are based on distance measures applied to each variable. On the other hand, the DLTs processed by the Derive Engine allows the user not only to specify the edits but also specify deterministic imputation actions that should be performed to fix a failed record without reference to any donor.
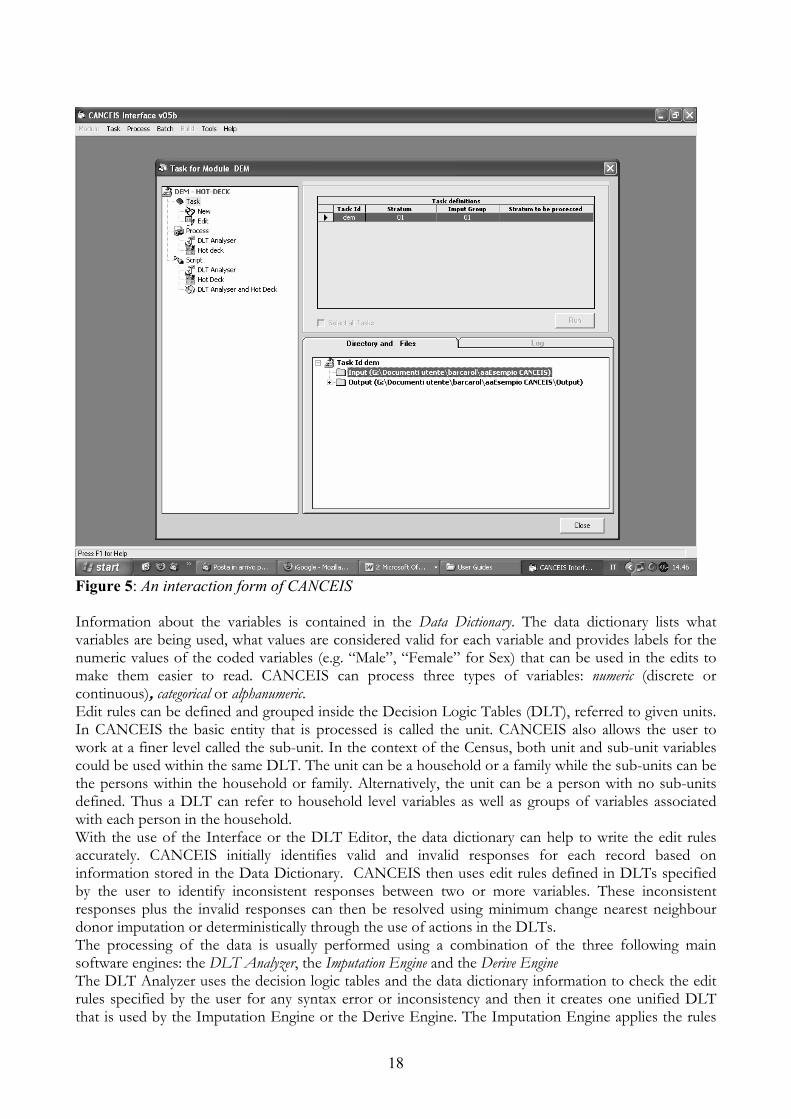
4.2.2. CONCORD Three different modules are available in CONCORD:
1. the SCIA module (Automatic Imputation and Checking System), which facilitates integral application of the Fellegi-Holt methodology for the location and imputation of errors, to a limited extent for categorical variables;
2. the GRANADA module (management of rules for data analysis), which enables the deterministic location of errors through application of IF-THEN type rules to be carried out on variables of both categorical and continuous type;
3. the RIDA module (Information Reconstruction with Automatic Donation) which enables imputation of both categorical and continuous variables through donor.
Figure 6: The initial form of CONCORD (JAVA version) In the methodology proposed, by means of use of the SCIA3 module in CONCORD it is possible to carry out operations 1 and 2, illustrated in Fig. 7, of definition and execution of the probabilistic step of the overall checking and correction procedure. The definition step foresees:
20
o indication of edits that represent both the formal and substantial rules which may be identifiable from the questionnaire and from knowledge of the surveyed phenomena (initial set of edits);
o the generation of the minimal set of edits, obtained by the first through a process of elimination of the redundant and contradictory edits;
o the generation of the complete set of edits, obtained by the minimal through generation of all implicit edits, those, which are logically contained in the initial edits, whose elucidation is fundamental for the purpose of correct location of errors.
The execution step is intended for the application of the complete set of edits obtained in this way, from the data set to be treated. This produces a set of statistics (correct and erroneous records; distribution of edits by frequency of activation; variables by frequency of imputation) whose examination on behalf of the statistician (operation 3: analysis of results) enables individuation of eventual systematic errors. The combined use of the GRANADA and RIDA modules facilitates carrying out operations 4 and 5 of definition and execution of the deterministic step. GRANADA allows definition of the IF-THEN rules already introduced. Taking into account that the IF part of these rules express the same condition of error defined in a corresponding edit of the probabilistic step, CONCORD offers the possibility of importing all the rules previously defined through SCIA, initiating the deterministic module, the user need do no more than choose which rules to maintain, indicating them with the THEN part, which corresponds to deterministic location of the error. At this point, applying the rules thus defined, it is possible to divide the initial set of data into two subsets, the first one without errors, and the second with errors in the data. GRANADA would also enable the variables judged to be erroneous to be directly imputed, indicating the precise value to assign; from a statistical point of view this operation is to be avoided, or at least to be reduced to a minimum, as it may create considerable bias in the original distributions. It is therefore advisable to limit the use of GRANADA to the setting up of check characters in variables judged as erroneous, characters which will be used by the RIDA module to recognise the values to be imputed. Through RIDA, correction is carried out by extracting the new values from an error free record similar to that which is erroneous. The similarity is calculated using some variables, known as “match”, chosen on the basis of their correlation with the variable to be corrected. This method requires that the variable used to calculate the distance between erroneous record and donor is correct. To search the donor one proceeds to compare the erroneous record with all those that are correct, choosing that with a minimum distance. The variables, used to identify similarity between records, are distinguished between strata variables and match variables. The strata variables are used to limit the search to within the subsets of records which present the same values for these variables. The match variables are used to calculate the function mixed distance for all records of the strata. The selected donor is that closest *to the erroneous record, that is with a minimum distance.

21
Figure 7: The methodology for setting up the checking and correction procedure by means of Concord’s different modules
4.2.3. R libraries (“yaImpute”, “mice”) The R packages “yaImpute” (Crookston and Finley, 2008) is used to impute attributes measured on some observations to observations where they are not measured. Attributes measured on all observations are called X variables and those measured only a subset observations are Y variables. Reference observations have X and Y variables and target observations have only X variables. yaImpute picks k-references that are nearby the targets in an appropriate p dimensional space and, when k=1, imputes the Y-variables from the closest reference to the target (when k>1 other logic is used). How the p-dimensional space is computed depends on the method used. Relationships among the X-variables are used for some methods (e.g. Euclidean and Mahalanobis) while the relationships between the X and Y variables within the reference data may be used define the distance measure for other methods (e.g. most similar neighbour and gradient nearest neighbour). The package also includes a new method for using the Random Forest regression algorithm to define distances. Tools that support building the imputations and, evaluating the quality of the imputed results are included.
22
The R package “mice” (Van Bureen and Oudshoorn, 2007) allows to generate multiple imputations for incomplete multivariate data by Gibbs Sampling (Casella and George, 1992). Gibbs sampling is an algorithm to generate a sequence of samples from the joint probability distribution of two or more random variables. The purpose of such a sequence is to approximate the joint distribution, or to compute an integral (such as an expected value). Gibbs sampling is a special case of the Metropolis-Hastings algorithm, and thus an example of a Markov Chain Monte Carlo algorithm. Missing data can occur anywhere in the data. The algorithm imputes an incomplete column (the target column) by generating appropriate imputation values given other columns in the data. Each incomplete column is a target column, and has its own specific set of predictors. The default predictor set consists of all other columns in the data. For predictors that are incomplete themselves, the most recently generated imputations are used to complete the predictors prior to imputation of the target column. A separate univariate imputation model can be specified for each column. The default imputation method depends on the measurement level of the target column. In addition to these, several other methods are provided. Users may also write their own imputation functions, and call these from within the algorithm. In some cases, an imputation model may need transformed data in addition to the original data (e.g. log or quadratic transforms). In order to maintain consistency among different transformations of the same data, the function has a special built-in method using the ~ mechanism. This method can be used to ensure that a data transform always depends on the most recently generated imputations in the untransformed (active) column. The data may contain categorical variables that are used in a regressions on other variables. The algorithm creates dummy variables for the categories of these variables, and imputes these from the corresponding categorical variable. Built-in imputation methods are:
o Bayesian linear regression (Numeric) o Predictive mean matching (Numeric) o Unconditional mean imputation (Numeric) o Logistic regression (2 categories) o Polytomous logistic regression (>= 2 categories) o Linear discriminant analysis (>= 2 categories) o Random sample from the observed values (Any)
5. Sampling estimates and errors calculation
5.1. Methodology In actual surveys, generally based on complex sampling plans, the weight to assign to each unit is obtained with a multi-phase procedure:
1. an initial weight is calculated, the direct weight or basic weight, fixed according to the sample design adopted, as the reciprocal of the inclusion probability of the sampling unit;
2. correction factors of the basic weight are then calculated taking account of total non response and of the constraints of equality among known parameters of the population and the corresponding sampling estimates;
3. the final weight is calculated as the product of the basic weight and the correction factors. Calibration estimators are used in most sample surveys on businesses and population carried out by Istat. Standard methodologies adopted by Istat for the assessment of sampling errors in sample surveys are based on Woodruff linearisation method (1971) in case the adopted estimators are nonlinear functions of the sample data. Relevant statistics that are calculated allow to analyse:

23
• the overall efficiency of the sample design adopted, by means of the statistic deff expressed by the ratio of the variance of the complex sample used and the variance of an hypothetical random simple sample of the same size in terms of final sampling units;
• the impact on the efficiency of estimates due to the unit stratification, to the definition of the sampling stages and to the weighting of units (stratification, staging, weighting effects ).
5.2. Software
5.2.1. GENESEES GENESEES (GENEralised software for Sampling Errors and Estimates in Surveys) is a generalised software that can be used to:
1. assign sampling weight to observations taking account of the survey design, of total non-response and of the availability of auxiliary information (calibration estimators), in order to avoid bias and variability of the estimates (thus maximising their accuracy);
2. produce the estimates of interest; 3. calculate sampling errors to support the accuracy of estimates, and present them synthetically
through regression models; 4. evaluate the efficiency of the sample (deff) for its optimisation and documentation.
Figure 8: An example form of GENESEES (SAS version) GENESEES is available for free, but having been implemented in SAS, it is not possible to run it without the availability of this proprietary software. A second limitation is that the interface language in only in Italian. To overcome these limits, a project has been started to develop an R version of GENESEES, with the same approach already followed for the software MAUSS .

24
5.2.2. R libraries (“survey”, “sampling”,”EVER”) The R package “survey” (Lumley, 2004 and 2006) allows to perform post-stratification, raking, and calibration (or GREG estimation). These methods all involve adjusting the sampling weights so that the known population totals for auxiliary variables are reproduced exactly. The calibrate() function implements the following calibration method:
1. linear (Euclidean distance); 2. bounded linear (Euclidean distance with constraints on final weight values), 3. raking; 4. bounded raking; 5. logit calibration functions.
Post-stratification is done with the postStratify function, for survey designs with or without replicate weights. Raking is a way to approximate post-stratification on a set of variables when only their marginal population distributions are known. Calibration, or GREG estimation, allows continuous as well as discrete auxiliary variables. The method is motivated by regression estimation of a total but can be computed simply by reweighting, using the calibrate() function. The method is described for estimation of a total in Särndal et al (1992). Survey designs are specified using the svydesign function. The main arguments to this function are:
o id to specify sampling units (PSUs and optionally later stages); o strata to specify strata; o weights to specify sampling weights; o fpc to specify finite population size corrections.
These arguments should be given as formulas, referring to columns in a data frame given as the data argument. The resulting survey design object contains all the data and meta-data needed for analysis, and will be supplied as an argument to analysis functions. Replicate weights present in the data file can be specified as an argument to svrepdesign, but it is also possible to create replicate weights from a survey design object. There are three types of replicate weight that can be created with as.svrepdesign:
o jackknife (JK1 and JKn) weights omit one PSU at a time; o balanced repeated replicates (BRR and Fay) omit or downweight half the sample; o bootstrap replicates resample PSUs from an estimated population.
All these types of weights are created by as.svrepdesign, according to the type argument. The default is JK1 weights for an unstratified sample and JKn for a stratified sample. The R package “sampling”, already introduced in the sampling design paragraph, allows to perform regression estimation by using function regressionestimator() with the following parameters:
1. the matrix of calibration variables; 2. the vector of inclusion probabilities; 3. the vector of population totals; 4. the vector of weights for the distance;
The bounded version is boundedregressionestimator(), with previous inputs, plus: 5. the smallest acceptable value for the final weights; 6. the largest acceptable value for the final weights.
It is also possible to apply raking ratio estimators, with same parameters, and usual bounded version. Finally, the function checkcalibration() checks the validity of the calibration. In some cases, the regression or the raking ratio estimators do not exist, and the g-weights do not allow calibration. The function returns TRUE or FALSE.

25
The “EVER” package (the acronym stands for Estimation of Variance by Efficient Replication) has been developed in ISTAT (Zardetto, 2008) and is downloadable from CRAN (Comprehensive R Archive Network, http://cran.r-project.org). EVER is mainly intended for calculating estimates and standard errors from complex surveys. Variance estimation is based on the extended DAGJK (Delete-A-group Jackknife) technique proposed by Kott (2001). The advantage of the DAGJK method over the traditional jackknife is that, unlike the latter, it remains computationally manageable even when dealing with “complex and big” surveys (tens of thousands of PSUs arranged in a large number of strata with widely varying sizes). In fact, the DAGJK method is known to provide, for a broad range of sampling designs and estimators, (nearly) unbiased standard error estimates even with a “small” number (e.g. a few tens) of replicate weights. Besides his peculiar computational efficiency, the DAGJK method takes advantage of the strong points it shares with the most common replication methods. As a remarkable example, EVER is designed to fully exploit DAGJK's versatility: the package provides the user with a user-friendly tool for calculating estimates, standard errors and confidence intervals for estimators defined by the user themselves (even non-analytic). This functionality makes EVER especially appealing whenever variance estimation by Taylor linearisations can be applied only at the price of crude approximations (e.g. poverty estimates). The current version (1.0) of the EVER package provides the following main features:
• delete-a-group-jackknife replication; • calibration of replicate weights; • estimates, standard errors and confidence intervals for:
o totals; o means; o absolute and relative frequency distributions; o contingency tables; o ratios; o quantiles; o regression coefficients;
• estimates, standard errors and confidence intervals for user-defined estimators (even non-analytic); • domain (subpopulation) estimation.
6. Data analysis and data mining
6.1. Statistical software
6.1.1. R system and language R is an open source project which is attempting to provide a modern piece of statistical software for the GNU suite of software. The current R is the result of a collaborative effort with contributions from all over the world (R Development Core Team, 2007). From Wikipedia2: “The R programming language, sometimes described as GNU S, is a programming language and software environment for statistical computing and graphics. It was originally created by Ross Ihaka and Robert Gentleman at the University of Auckland, New Zealand, and is now developed by the R Development Core Team. R is considered by its developers to be an implementation of the S programming language, with semantics derived from Scheme. The name R comes partly from the first name of the two original authors, and partly as a word play on the name 'S'. R is widely used for statistical software development and data analysis, and has become a de-facto standard among statisticians for the development of statistical software. R's source code is freely available under the GNU General Public License, and pre-compiled binary versions are provided for
2 http://en.wikipedia.org/wiki/R_%28programming_language%29#References
26
Microsoft Windows, Mac OS X, and several Linux and other Unix-like operating systems. R uses a command line interface, though several graphical user interfaces are available. R supports a wide variety of statistical and numerical techniques. R is also highly extensible through the use of packages, which are user-submitted libraries for specific functions or specific areas of study. Due to its S heritage, R has stronger object-oriented programming facilities than most statistical computing languages. Extending R is also eased by its permissive lexical scoping rules. Another of R's strengths is its graphical facilities, which produce publication-quality graphs which can include mathematical symbols. Although R is mostly used by statisticians and other practitioners requiring an environment for statistical computation and software development, it can also be used as a general matrix calculation toolbox with comparable benchmark results to GNU Octave and its proprietary counterpart, MATLAB. Although R is widely applauded for being free, open source and the de-facto standard in many research communities, many have complained about its poor handling of memory, the slowness of its loops and the lack of standardization between packages. It should be taken into account that this was especially true for versions up to R 1.9.0. Since version 2.0.0 (October 4, 2004), that introduced "lazy loading", fast loading of data with minimal expense of system memory is now possible. The capabilities of R are extended through user-submitted packages, which allow specialized statistical techniques, graphical devices, as well as programming interfaces and import/export capabilities to many external data formats. These packages are developed in R, LaTeX, Java, and often C and Fortran. A core set of packages are included with the installation of R, with over 1000 more available at the Comprehensive R Archive Network3. Notable packages are listed along with comments on the official R Task View pages.”
6.1.2. ADaMSoft ADaMSoft is a free and Open Source statistical software developed in Java. It is multilingual and multiplatform. It contains data management methods, Data Mining techniques and it offers several facilities in order to create dynamical reports or to store documents. It permits to collect, organize, transform and extract/produce data from/to various sources. It synthesizes the information by using statistical and other mathematical procedures; creates ready to use reports that can be presented to all level of type of information users; such reports can be published on a web site, shared with other people, etc.; archives/retrieves files in/from a client or in/from one or more servers; has no limitation for the amount of data that can be analyzed. Using the ADaMSoft Web Application Serverit is possible to use all the possibilities of the software through the web; in other words to let that internet users can access to the ADaMSoft procedures without having it installed.
3 http://cran.r-project.org/

27
Figure 9: An example form of ADaMSoft
6.2. Data mining Data mining is an interdisciplinary field that combines artificial intelligence, computer science, machine learning, database management, data visualization, mathematical algorithms, and statistics. More precisely, data mining can be defined as “the process that makes use of one or more machine learning techniques to analyse and extract knowledge from data contained in a database” (Roiger, Geatz 2002). Also, as the “automated or assisted process of exploration and analysis of large amount of data, with the aim of discovering models and rules” (Berry, Linoff 2001). The idea to build mechanisms to automatically learn rules from a set of examples was pursued by Artificial Intelligence experts since the 70’s, in the field of Machine Learning. Data Mining is the natural evolution of these techniques, stressing on practical applications. Learning techniques can be classified in
o supervised: in a subset of the observed population, the true values of the variables to be predicted are available (classification and regression trees, neural networks, support vector machines, linear and logistic regression, Bayesian methods)
o unsupervised, when values to be predicted are available in no subset of the population (clustering, association rules).
Until recently, only commercial data mining systems were available, like SAS Enterprise Miner or SPSS Clementine. In last years, a number of open source or freeware systems began to appear. We cite Weka, RapidMiner and Knime, all stand alone systems, and also Rattle, that is a R package allowing data mining in R. Actually, also Weka is available as a R package, with an interface that allows to call its functionalities from inside the R system.
28
6.2.1 Weka
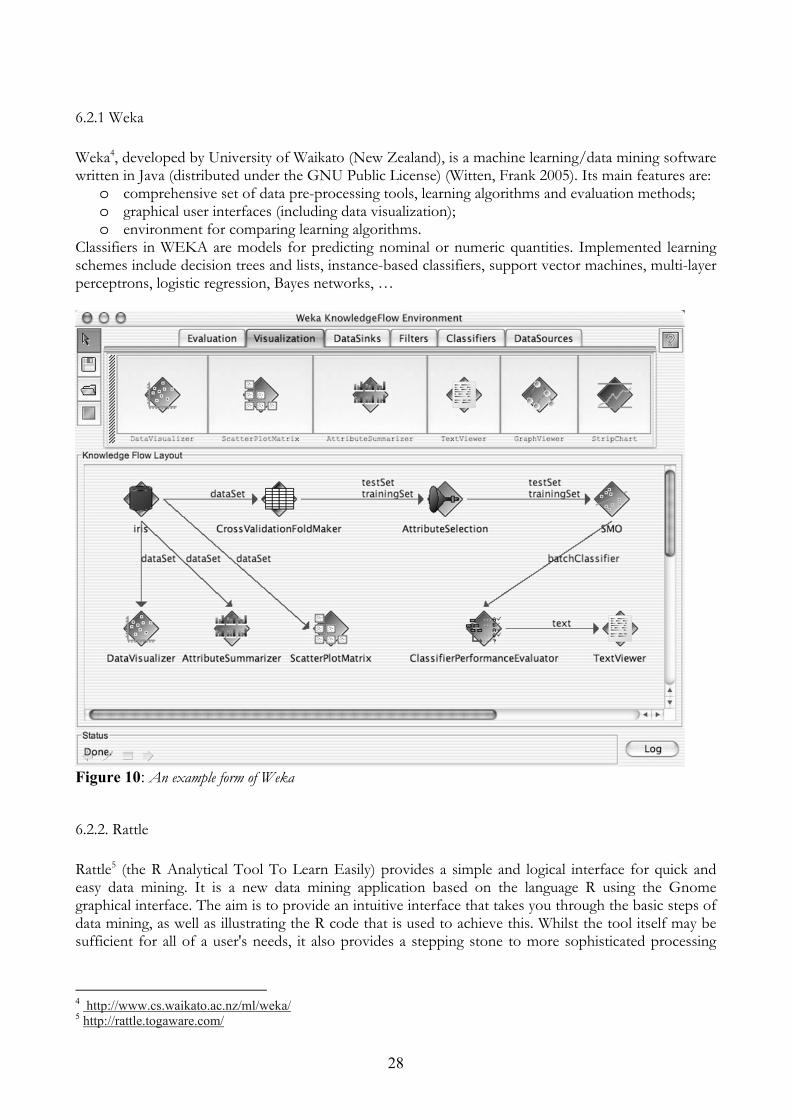
Weka4, developed by University of Waikato (New Zealand), is a machine learning/data mining software written in Java (distributed under the GNU Public License) (Witten, Frank 2005). Its main features are:
o comprehensive set of data pre-processing tools, learning algorithms and evaluation methods; o graphical user interfaces (including data visualization); o environment for comparing learning algorithms.
Classifiers in WEKA are models for predicting nominal or numeric quantities. Implemented learning schemes include decision trees and lists, instance-based classifiers, support vector machines, multi-layer perceptrons, logistic regression, Bayes networks, …
Figure 10: An example form of Weka
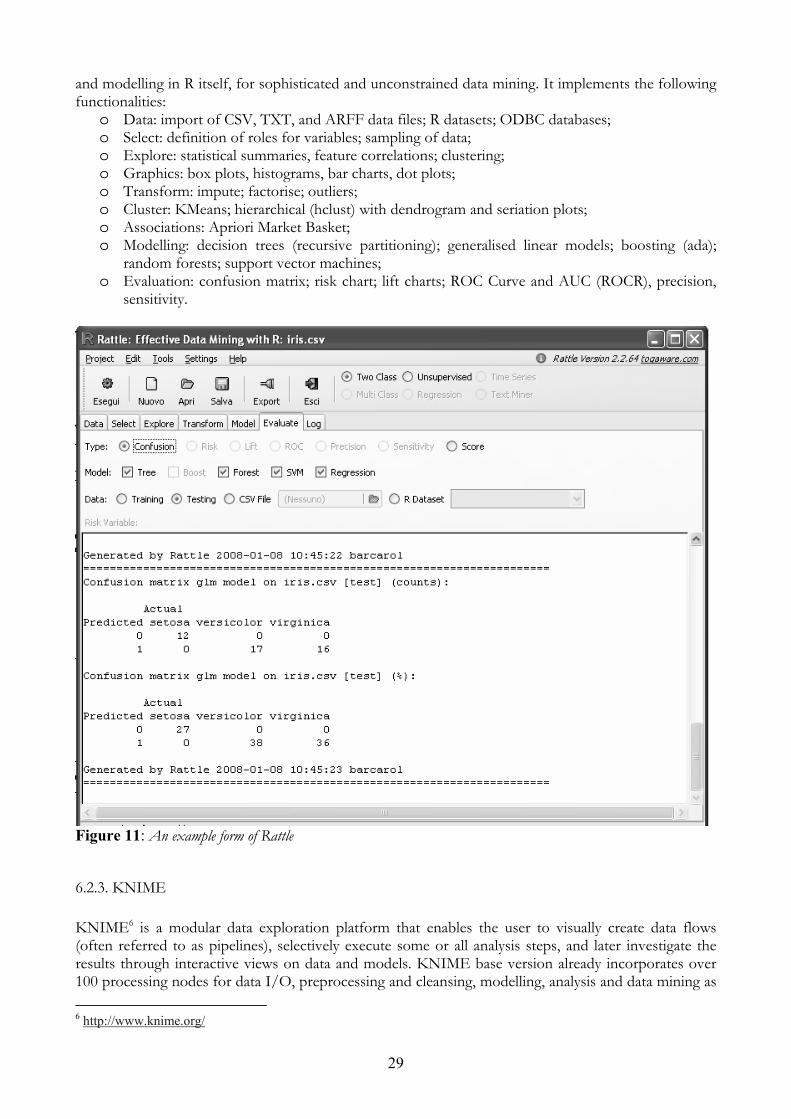
6.2.2. Rattle Rattle5 (the R Analytical Tool To Learn Easily) provides a simple and logical interface for quick and easy data mining. It is a new data mining application based on the language R using the Gnome graphical interface. The aim is to provide an intuitive interface that takes you through the basic steps of data mining, as well as illustrating the R code that is used to achieve this. Whilst the tool itself may be sufficient for all of a user's needs, it also provides a stepping stone to more sophisticated processing
4 http://www.cs.waikato.ac.nz/ml/weka/ 5 http://rattle.togaware.com/
29
and modelling in R itself, for sophisticated and unconstrained data mining. It implements the following functionalities:
o Data: import of CSV, TXT, and ARFF data files; R datasets; ODBC databases; o Select: definition of roles for variables; sampling of data; o Explore: statistical summaries, feature correlations; clustering; o Graphics: box plots, histograms, bar charts, dot plots; o Transform: impute; factorise; outliers; o Cluster: KMeans; hierarchical (hclust) with dendrogram and seriation plots; o Associations: Apriori Market Basket; o Modelling: decision trees (recursive partitioning); generalised linear models; boosting (ada);
random forests; support vector machines; o Evaluation: confusion matrix; risk chart; lift charts; ROC Curve and AUC (ROCR), precision,
sensitivity.
Figure 11: An example form of Rattle
6.2.3. KNIME KNIME6 is a modular data exploration platform that enables the user to visually create data flows (often referred to as pipelines), selectively execute some or all analysis steps, and later investigate the results through interactive views on data and models. KNIME base version already incorporates over 100 processing nodes for data I/O, preprocessing and cleansing, modelling, analysis and data mining as 6 http://www.knime.org/
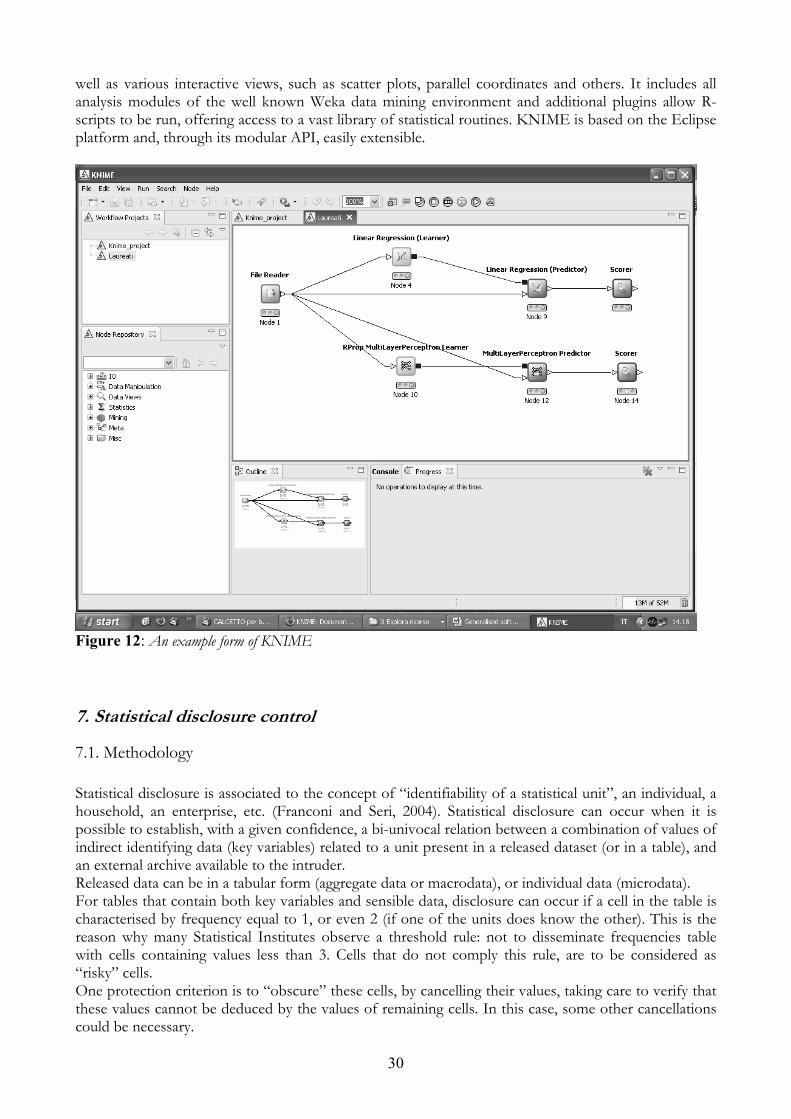
30
well as various interactive views, such as scatter plots, parallel coordinates and others. It includes all analysis modules of the well known Weka data mining environment and additional plugins allow R-scripts to be run, offering access to a vast library of statistical routines. KNIME is based on the Eclipse platform and, through its modular API, easily extensible.
Figure 12: An example form of KNIME
7. Statistical disclosure control
7.1. Methodology Statistical disclosure is associated to the concept of “identifiability of a statistical unit”, an individual, a household, an enterprise, etc. (Franconi and Seri, 2004). Statistical disclosure can occur when it is possible to establish, with a given confidence, a bi-univocal relation between a combination of values of indirect identifying data (key variables) related to a unit present in a released dataset (or in a table), and an external archive available to the intruder. Released data can be in a tabular form (aggregate data or macrodata), or individual data (microdata). For tables that contain both key variables and sensible data, disclosure can occur if a cell in the table is characterised by frequency equal to 1, or even 2 (if one of the units does know the other). This is the reason why many Statistical Institutes observe a threshold rule: not to disseminate frequencies table with cells containing values less than 3. Cells that do not comply this rule, are to be considered as “risky” cells. One protection criterion is to “obscure” these cells, by cancelling their values, taking care to verify that these values cannot be deduced by the values of remaining cells. In this case, some other cancellations could be necessary.
31
Another protection criterion consists in perturbing cell, by for instance rounding values to certain fixed numbers. All this is valid and useful when tables are taken one by one, without possibility of linking them together. But, as they usually derive from an unique dataset of elementary data, it can happen that “safe” tables, once linked and analysed , are no longer safe. In many situations, beyond tables dissemination, Statistical Institutes provide also to release microdata datasets, where each record contains information related to one statistical unit. Probabilistic models have been defined in order to evaluate the risk of disclosure related to a given collection of elementary data. Once evaluated, this risk can be compared with a threshold fixed by the Institute, below which elementary data can be considered “safe”. If risk is higher than the threshold, actions must be taken in order to transform data and decrease risk. In doing so, the objective is to contain the loss of information in the minimum required to get safe data. We can classify most applied protection methods in the following three categories: o global recoding: it consists in the aggregation of values of key variables (for instance, instead of yearly
age, age classes); o local suppression: some variables in some records are obscured to avoid identification; o data perturbation: it is the same kind of action used for tabular data. (rounding of values).
7.2. Software ARGUS is a generalised software use to ensure confidentiality both of microdata and aggregate data. Two versions are in fact available:
1. tau-Argus is used for aggregate data (tables). It allows to o identify the sensitive cells (using the dominance rule, or the prior-posterior rule) o apply a series of protection techniques (re-design of tables, rounding or suppression).
2. mu-Argus is used for microdata: o it allows to assess the risk of disclosure associated with a given dataset; o if this exceed a prefixed threshold, the software allows to apply different protection
techniques (recoding, local suppression, microaggregation). Protection techniques are based on algorithms that make sure that the loss of information be as low as possible.
7.2.1. tau-Argus The use of tau-Argus can follow two different flows:
o a more complete one starts from available microdata, with associated metadata, requires the specification of tables to be produced from microdata, alongside with safety criteria: then, tabulation is carried out;
o a quicker flows directly starts from already produced tabular data, which are simply read inside the system.
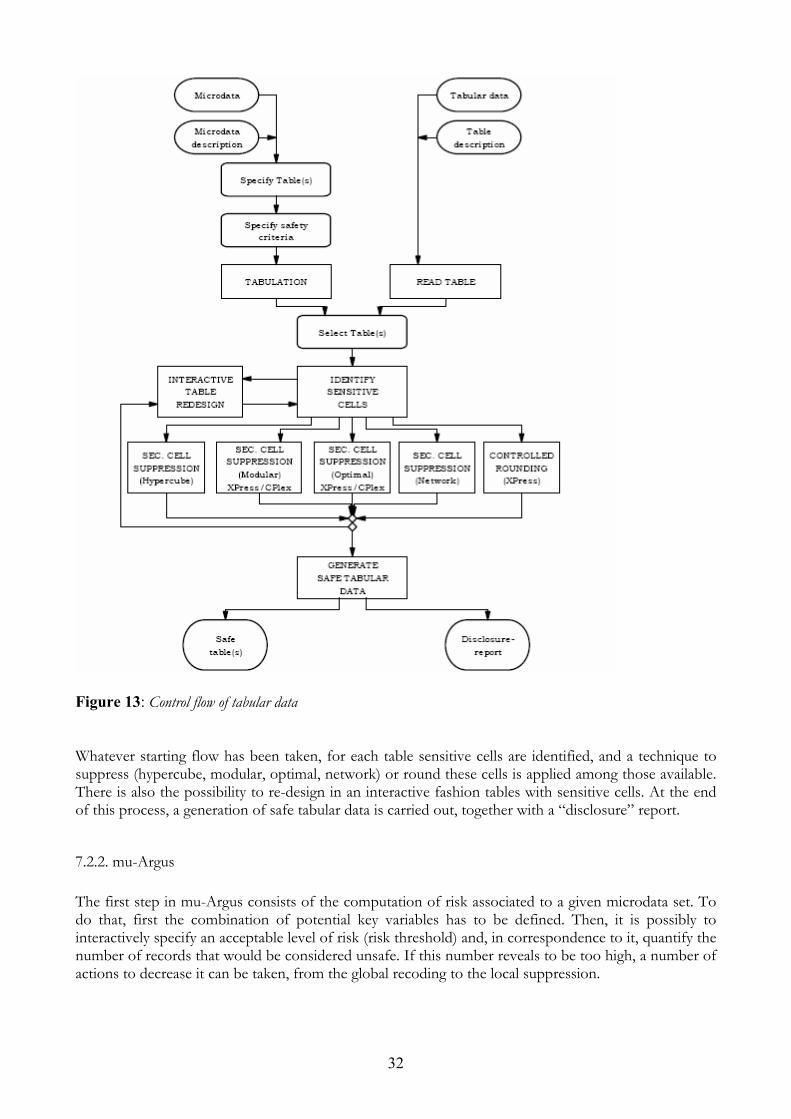
32
Figure 13: Control flow of tabular data Whatever starting flow has been taken, for each table sensitive cells are identified, and a technique to suppress (hypercube, modular, optimal, network) or round these cells is applied among those available. There is also the possibility to re-design in an interactive fashion tables with sensitive cells. At the end of this process, a generation of safe tabular data is carried out, together with a “disclosure” report.
7.2.2. mu-Argus The first step in mu-Argus consists of the computation of risk associated to a given microdata set. To do that, first the combination of potential key variables has to be defined. Then, it is possibly to interactively specify an acceptable level of risk (risk threshold) and, in correspondence to it, quantify the number of records that would be considered unsafe. If this number reveals to be too high, a number of actions to decrease it can be taken, from the global recoding to the local suppression.

33
Figure 14: Control flow of microdata When, after these operations, the number of unsafe records in correspondence of the chosen threshold becomes negligible, it is possible to save the new, safe version of microdata than can be disseminated.
8. Tabulation and traditional dissemination
8.1. Software
8.1.1. CSPro: tabulation and thematic maps CrossTab is the module of CSPro that allows to tabulate data. CrossTab is a versatile tool that enables the user to quickly and easily produce basic frequency distributions and cross-tabulations from one or more data files. The only requirements are that:
o the data to be tabulated must be in ASCII text format, with all items in fixed positions; o all the data files to be used in a single run share the same format; o must exist a data dictionary describing the data file.
Each of these requirements is easily met: if the data are in a proprietary format they must be exported to ASCII-text format. Moreover, if dictionary does not exist, CSPro will ask to create it while the CrossTab application is created. One of the most remarkable aspect of the data tabulation in CSPro is that there is no programming language to learn: the system is entirely menu-driven.
34
CrossTab can be used for a number of different purposes. The statistical organization may generate tables for dissemination or to be used internally, as a tool for examining the data quality and designing the edits, test the edits, test the tables coherence, etc. The most important capabilities of the CrossTab module of CSpro are: o to produce cross tabulation: can display relationships between two or more data items. Both
dependent and independent variables can be used in each dimension (row and column); o to tabulate counts and/or percents: in addition to the quantitative numbers generated in a
tabulation, the user can decide to show the distribution of values for a field as a percentage of either row or column totals, or as a percentage of the table total;
o to tabulate values and/or weights: tabulation allows the use of a data field (or a constant value) as a weighting factor during tabulation. This is particularly useful in the case of a survey, where the weight assigned to each case or observation in the sample must be taken into account in order to produce the estimations for the whole population;
o to produce summary statistics: cross tabulation allows the inclusion of summary statistics in the tables. Available statistics include Mean, Mode, Median, Minimum value, Maximum value, Standard Deviation, and Variance, as well as Percentiles (N-tiles) and others;
o to produce tables by area: the "Area Processing" feature groups table data according to areas defined by the user;
o to create multiple subtables: subtables are themselves cross tabulations nested within a larger cross tabulation. Each subtable has one independent variable in the rows and one independent variable in the columns. It may optionally have one dependent variable in the rows and one dependent variable in the columns;
o to restrict a universe: when a universe is defined, CrossTab will only tabulate data records that meet the conditions stipulated. The "universe" specification acts as a filter, as the tables produced use only a subset of the data file's records;
o to format tables for printing: cross tabulation gives the user a complete control over all aspects of the Table Format. These include the text font, its colors, its indentation, its alignment, its borders and the text itself. Other formats control the presentation of numbers, headers and footers on the printed page, and margins;
o to save tabulations in different formats: CSPro lets the user toi select an entire table or parts of a table. The tables can be saved in several formats: CSPro tables (.tbw), rich text format (.rtf), HTML files (.htm) and ASCII tab-delimited;
If a digitalized map of the country is available, CSPro can be used to produce thematic maps from one or more values in a tabulation. In many cases, such maps are more effective than tables in communicating information. The thematic map generated can often dramatically illustrate existing conditions, particularly where the distribution of the resource is uneven. Map Viewer permit to generate a thematic map of a selected variable at a selected geographic level, to combine two variables as a difference, percent change, ratio or percent ratio, to vary the number of intervals, size of the intervals, colors, titles and legends and to change lowest geographic level shown. Copy a map to a word processor and saving it in GIF format are other features available.
8.1.2. R package “reshape” In R there are various functions enabling the user to produce tables. For instance, table() and xtabs(), applied to categorical variables (factors), produce contingency tables, i.e. tables in which each cell contains the frequency of observations characterised by given values of factors. But it is desirable to obtain whatever kind of table, with cells containing frequencies, sums, means, and, more in general, the result of a given function applied to observations. Package “reshape” (Wickham, 2007) allows to obtain this in a very convenient way. Its applications are characterised by two different steps. First, starting from the initial data frame, organised as usual in observations (rows) and variables (columns), we produce a derived data frame in which a clear distinction is made between identifiers and
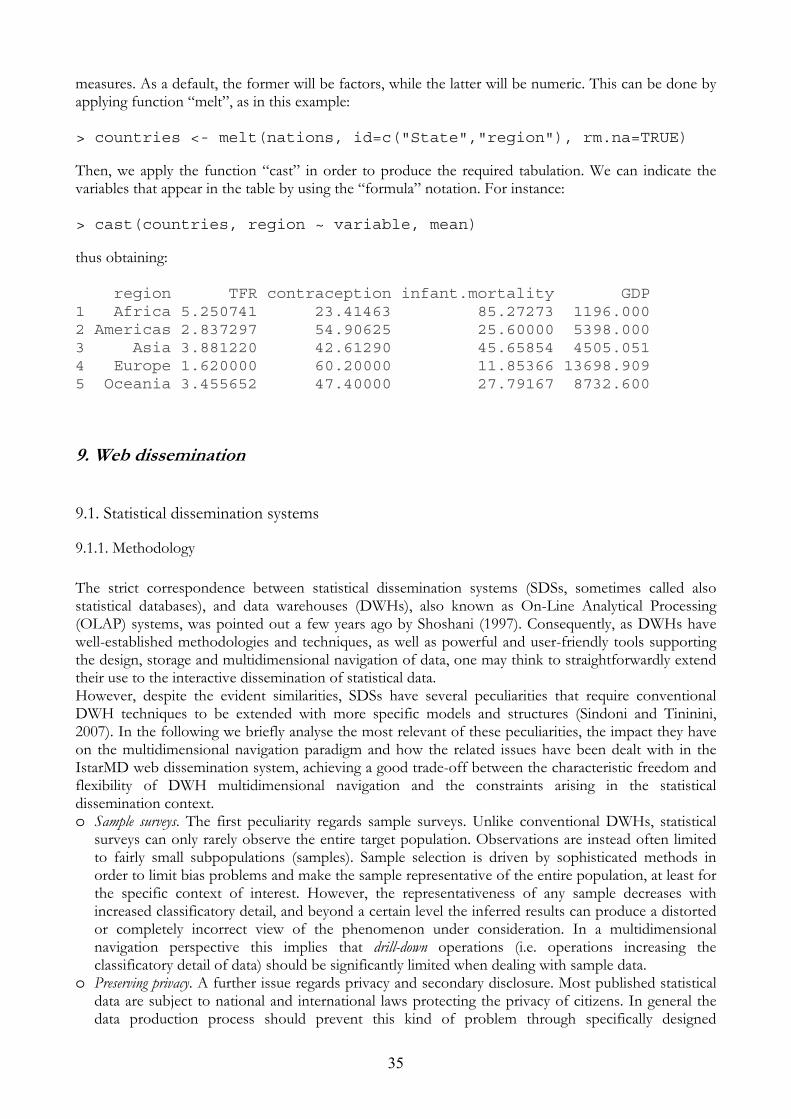
35
measures. As a default, the former will be factors, while the latter will be numeric. This can be done by applying function “melt”, as in this example: > countries <- melt(nations, id=c("State","region"), rm.na=TRUE) Then, we apply the function “cast” in order to produce the required tabulation. We can indicate the variables that appear in the table by using the “formula” notation. For instance: > cast(countries, region ~ variable, mean) thus obtaining: region TFR contraception infant.mortality GDP 1 Africa 5.250741 23.41463 85.27273 1196.000 2 Americas 2.837297 54.90625 25.60000 5398.000 3 Asia 3.881220 42.61290 45.65854 4505.051 4 Europe 1.620000 60.20000 11.85366 13698.909 5 Oceania 3.455652 47.40000 27.79167 8732.600
9. Web dissemination
9.1. Statistical dissemination systems
9.1.1. Methodology The strict correspondence between statistical dissemination systems (SDSs, sometimes called also statistical databases), and data warehouses (DWHs), also known as On-Line Analytical Processing (OLAP) systems, was pointed out a few years ago by Shoshani (1997). Consequently, as DWHs have well-established methodologies and techniques, as well as powerful and user-friendly tools supporting the design, storage and multidimensional navigation of data, one may think to straightforwardly extend their use to the interactive dissemination of statistical data. However, despite the evident similarities, SDSs have several peculiarities that require conventional DWH techniques to be extended with more specific models and structures (Sindoni and Tininini, 2007). In the following we briefly analyse the most relevant of these peculiarities, the impact they have on the multidimensional navigation paradigm and how the related issues have been dealt with in the IstarMD web dissemination system, achieving a good trade-off between the characteristic freedom and flexibility of DWH multidimensional navigation and the constraints arising in the statistical dissemination context. o Sample surveys. The first peculiarity regards sample surveys. Unlike conventional DWHs, statistical
surveys can only rarely observe the entire target population. Observations are instead often limited to fairly small subpopulations (samples). Sample selection is driven by sophisticated methods in order to limit bias problems and make the sample representative of the entire population, at least for the specific context of interest. However, the representativeness of any sample decreases with increased classificatory detail, and beyond a certain level the inferred results can produce a distorted or completely incorrect view of the phenomenon under consideration. In a multidimensional navigation perspective this implies that drill-down operations (i.e. operations increasing the classificatory detail of data) should be significantly limited when dealing with sample data.
o Preserving privacy. A further issue regards privacy and secondary disclosure. Most published statistical data are subject to national and international laws protecting the privacy of citizens. In general the data production process should prevent this kind of problem through specifically designed

36
techniques of secondary disclosure control, providing a “reasonable certainty” that no sensitive information can be disclosed from the published data. This control is typically based on complex algorithmic techniques, which are incompatible with on-line processing times and therefore with typical DWH and Web interactions.
o Microdata unavailability. All DWHs are based on the classification and aggregation of microdata in fact tables. Aggregate data are precomputed, stored in materialized views and later used to speed up the computation of cube elements, but if the result cannot be obtained by using the materialized views alone, the microdata can be accessed and aggregated online. In SDSs it is often the case that microdata are not available and only statistical tables (i.e. a collection of already aggregated data) are available for dissemination. This is particularly true in international statistical organizations, whose mission is to collect aggregated data from their member states and publish them in a harmonized way. Even when microdata are available, data in some selected statistical tables represent the only data that the survey manager wants to be made accessible to users.
o Filter questions and heterogeneous hierarchies. Statistical questionnaires have quite complex structures and cannot be easily mapped to data warehouse dimensions. This is due to “filter questions”, used to drive the flow of responses through the questionnaire. These questions cause several modeling problems, as they require complex generalization hierarchies and a consequent proliferation of fact tables, or alternatively a flat structure with null value issues to be tackled. This problem is analogous to that of heterogeneous hierarchies described by Lehner (1998).
The differences between multidimensional navigation in a conventional DWH and an SDS are depicted in the following figure, where the dimension levels are represented with an increasing level of detail on the dimension axes (e.g., if D2 is an area dimension, D2,1, D2,2 and D2,3 may correspond to the national, regional and municipality level) and the grey areas represent the dimension level combinations which can be accessed by users.
D1
D2
D3D3,3
D3,2
D3,1
D2,1 D2,2 D2,3
D1,1D1,2
D1,3D1
D2
D3D3,3
D2,3
D1,3
(a) (b) Figure 15: Conventional data warehouse vs a statistical diffusion system In conventional DWHs (a) the user is free to drill-down and roll-up along any dimensional hierarchy, independently of the detail level of the other dimensions. In contrast, drill-down on a dimension in an SDS (b) can only be performed starting from certain combinations of the other dimensions and conversely, rolling-up on a dimension increases the number of possible explorations (drill-down) on other dimensions. Broadly speaking, there are two main approaches to the multidimensional navigation in SDSs and they are both based on the idea of splitting the entire cube in several subcubes, where free multidimensional navigation is “safe”. In the former approach the user first selects the subcube of interest and then performs a conventional (completely free) multidimensional navigation on the selected subcube. We call this the free subcube navigation paradigm. In the latter approach no preliminary subcube selection is required, although the navigation is constrained by the defined subcubes. In other words the user can navigate on (the permitted subsections of) the entire cube and the interface continuously “adapts” to
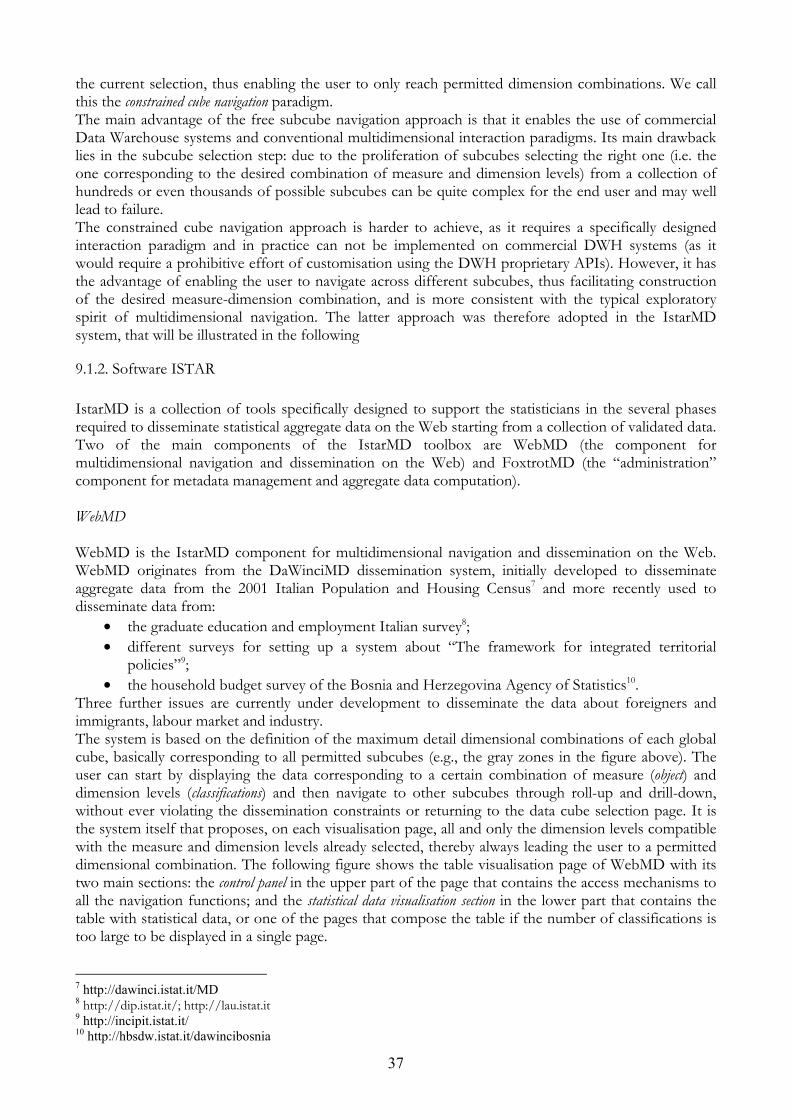
37
the current selection, thus enabling the user to only reach permitted dimension combinations. We call this the constrained cube navigation paradigm. The main advantage of the free subcube navigation approach is that it enables the use of commercial Data Warehouse systems and conventional multidimensional interaction paradigms. Its main drawback lies in the subcube selection step: due to the proliferation of subcubes selecting the right one (i.e. the one corresponding to the desired combination of measure and dimension levels) from a collection of hundreds or even thousands of possible subcubes can be quite complex for the end user and may well lead to failure. The constrained cube navigation approach is harder to achieve, as it requires a specifically designed interaction paradigm and in practice can not be implemented on commercial DWH systems (as it would require a prohibitive effort of customisation using the DWH proprietary APIs). However, it has the advantage of enabling the user to navigate across different subcubes, thus facilitating construction of the desired measure-dimension combination, and is more consistent with the typical exploratory spirit of multidimensional navigation. The latter approach was therefore adopted in the IstarMD system, that will be illustrated in the following
9.1.2. Software ISTAR IstarMD is a collection of tools specifically designed to support the statisticians in the several phases required to disseminate statistical aggregate data on the Web starting from a collection of validated data. Two of the main components of the IstarMD toolbox are WebMD (the component for multidimensional navigation and dissemination on the Web) and FoxtrotMD (the “administration” component for metadata management and aggregate data computation). WebMD WebMD is the IstarMD component for multidimensional navigation and dissemination on the Web. WebMD originates from the DaWinciMD dissemination system, initially developed to disseminate aggregate data from the 2001 Italian Population and Housing Census7 and more recently used to disseminate data from:
• the graduate education and employment Italian survey8; • different surveys for setting up a system about “The framework for integrated territorial
policies”9; • the household budget survey of the Bosnia and Herzegovina Agency of Statistics10.
Three further issues are currently under development to disseminate the data about foreigners and immigrants, labour market and industry. The system is based on the definition of the maximum detail dimensional combinations of each global cube, basically corresponding to all permitted subcubes (e.g., the gray zones in the figure above). The user can start by displaying the data corresponding to a certain combination of measure (object) and dimension levels (classifications) and then navigate to other subcubes through roll-up and drill-down, without ever violating the dissemination constraints or returning to the data cube selection page. It is the system itself that proposes, on each visualisation page, all and only the dimension levels compatible with the measure and dimension levels already selected, thereby always leading the user to a permitted dimensional combination. The following figure shows the table visualisation page of WebMD with its two main sections: the control panel in the upper part of the page that contains the access mechanisms to all the navigation functions; and the statistical data visualisation section in the lower part that contains the table with statistical data, or one of the pages that compose the table if the number of classifications is too large to be displayed in a single page. 7 http://dawinci.istat.it/MD 8 http://dip.istat.it/; http://lau.istat.it 9 http://incipit.istat.it/ 10 http://hbsdw.istat.it/dawincibosnia
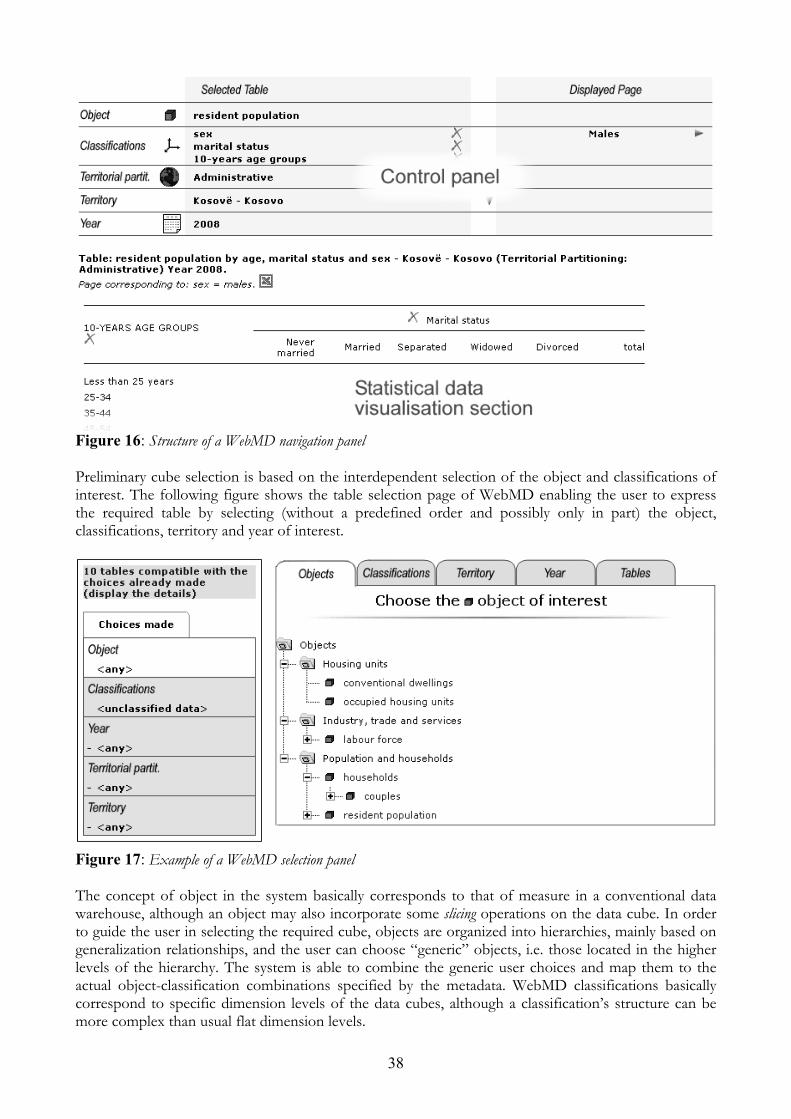
38
Figure 16: Structure of a WebMD navigation panel Preliminary cube selection is based on the interdependent selection of the object and classifications of interest. The following figure shows the table selection page of WebMD enabling the user to express the required table by selecting (without a predefined order and possibly only in part) the object, classifications, territory and year of interest.
Figure 17: Example of a WebMD selection panel The concept of object in the system basically corresponds to that of measure in a conventional data warehouse, although an object may also incorporate some slicing operations on the data cube. In order to guide the user in selecting the required cube, objects are organized into hierarchies, mainly based on generalization relationships, and the user can choose “generic” objects, i.e. those located in the higher levels of the hierarchy. The system is able to combine the generic user choices and map them to the actual object-classification combinations specified by the metadata. WebMD classifications basically correspond to specific dimension levels of the data cubes, although a classification’s structure can be more complex than usual flat dimension levels.
39
Classifications can be shared by several cubes, enabling a user to perform classification-based navigations; the user can select a combination of classifications and ask the system to show all available statistical aggregates (cubes) classified in that way, independently of the measure. As with objects, classifications are organized into hierarchies, to enable the user to express generic queries and consequently facilitate access to data. Broadly speaking, the user has basically four ways to browse the information in the system, namely:
• by performing some selection in one of the tabs (objects, classifications, territory and year) and then browsing the information in the other four tab panels to analyse which data have been made available for publication. For instance after an object's selection he/she may view either all (and only) classifications that are available to classify it, or the territorial partitionings for which that object was elaborated, or also the list of statistical tables having that (or a more specific) object as component. Likewise, by selecting a specific year, the user can browse the other tab panels to view the tables available in that year, and correspondingly the objects and classifications constituting them, as well as the territories for which such tables are available in the selected year.
• by directly selecting an (unclassified) table from the “tables” tab panel and viewing the corresponding data. The system will automatically select the most recent year and less detailed compatible territory (e.g. the whole country) to display the data. As mentioned above, the hyperlinks in the table visualisation page (mainly in the control panel section) enable the user to navigate among the data by changing the classifications, territory and year, and by performing so called operations of drill-down, roll-up and slicing.
• by performing a complete selection of all parameters defining the statistical table (i.e. object, classifications, territory and year) and only finally selecting the actual table of interest by clicking on its (hyperlinked) description.
• by selecting the year and territory of interest and then performing a multiple table selection on the “tables” tab panel, to contemporarily view all tables of interest.
WebMD fully supports multi-lingual dissemination of statistical data: in any phase of the table selection or visualisation process the user can indeed switch from one language to the other, always maintaining the current selection and visualisation context. The system currently supports both Oracle and MySQL Database Management Systems for back-end storage. FoxtrotMD FoxtrotMD is IstarMD administration component, specifically designed for metadata management and aggregate data computation. By FoxtrotMD the dissemination administrator can: o manage the objects of interest for the statistical tables to be disseminated, in particular their
descriptions in the two languages chosen for publication, the related statistical tables (i.e. tables defined using a given object), as well as the parent relationships between them. As mentioned above, objects can indeed be arranged into a hierarchical structure based on generalization. More formally, an object O'' will be made child of another object O' if:
- O'' and O' are obtained by applying the same aggregation function (e.g. count or sum) on the same type of microdata, and O'' is obtained from a subset of the microdata from which O' is obtained (e.g. “Resident population 6 years of age and over” will be made child of “Resident population”);
- a generalization relationship exists between the two objects (e.g. “Resident population” and “Population measures”). Abstract objects like “Population measures” are mainly introduced to facilitate the user access to data and do not correspond to actual statistical tables.
o manage the classifications of interest for the statistical tables to be disseminated, in particular their descriptions in the two languages chosen for publication, the corresponding modalities in both languages, the related statistical tables (i.e. tables defined using a given combination of classifications), as well as the parent relationships between them. Similar to objects, classifications can indeed be arranged into a hierarchical structure based on generalization and level of detail. More formally, a classification C'' will be made child of another classification C' if:
40
- C'' is a more detailed version of C': for example “Age by single year” is made child of “Age by ten year groups”. This is typical in DWH dimension hierarchies;
- a generalization relationship exists between the two classifications (e.g. “Age by ten year groups” and “Age”). Abstract classifications like “Age” are mainly introduced to facilitate the user access to data and do not correspond to actual statistical tables.
o manage the statistical tables to be disseminated, defined by the combination of an object with a certain number of classifications. Each table will have its own multi-language descriptions, object and classification components and possibly multiple spatio-temporal instanciations, i.e. combinations of territories and years for which data are available (and have to be disseminated). FoxtrotMD also enables the dissemination administrator to define the rules to extract and aggregate the data to be disseminated, starting from one or more tables of (validated) microdata.
o compute and store the aggregate data to be disseminated. By using the specified rules, the ETL component of FoxtrotMD can aggregate the data and store them in the aggregate data table used during statistical table visualisation by WebMD. The aggregation process is automatically performed at all levels of the territorial partitioning hierarchy specified by the administrator.
The following figure shows the user interface of the FoxtrotMD component for statistical table management.
Figure 18: Example of a FoxTrotMD tables definition form The system allows the user to manage the entire workflow, by driving (and partially constraining) his/her activities in a series of consecutive and interdependent steps. For example, only classifications that are not currently related to statistical tables can be modified and the data can not be modified after a statistical table has been published (unless the whole process is restarted from scratch). The process of aggregate computation is organised in several phases aiming at verifying the compliance of microdata structure and contents to what specified in the metadata. Alerts and blocking errors can be issued during the various phases. In the former case the user can check if the warnings actually correspond to what expected and possibly enable the process prosecution. In the latter case some errors in the data or metadata prevent the system to complete the process, a correction activity is required and the process will have to be restarted from the first phase.
41
9.2. GIS The use of Geographic Information System (GIS) enhances the data dissemination through the visual impact of maps. A GIS digital database provides the ability to create interactively outputs such as maps, geographical summaries or reports, and geographical base files (files containing both the digital map and attribute data). The database can be also integrated into or just linked to a web-based data warehouse for statistical information. Outputs can be either hard copy or digital files. Geographical and tabular summaries are common types of GIS outputs. Such summaries differ from those created by a traditional database query because they are based on data aggregated by spatial entities for map analysis. The implementation of a GIS-based dissemination programme requires the following steps:
1. Planning the dissemination of statistical georeferenced information (identification of the user needs, analysis of the available data, definition of products, units of agglomeration, and variables)
2. Ensuring consistency with the National Spatial Data Infrastructure (NSDI), if available 3. Defining the strategy for the dissemination of the statistical georeferenced information (open,
restricted access) and rules to protect confidentiality
The products for the dissemination of statistical georeferenced information are: 1. Reference maps 2. Thematic maps in digital or hardcopy format 3. Census atlases printed or in digital format 4. Digital geographic databases 5. Web-GIS database
The above mentioned products require update digital cartography and the use of GIS software together with conceptual capacities to analyse georeferenced statistical data. Nowadays, a large number of GIS software can be used to perform basic GIS functions in the field of statistics, and, instead, a selected number of them are suitable for complex spatial statistical analyses.
PostgreSQL and PostGIS
The market has traditionally offered commercial licensed packages, but open source or free software is finally fastly taking pace, and this constitutes an important asset for cooperation. Training and testing with PostgreSQL and its spatial application PostGIS are underway.
9.3. Microdata dissemination: Microdata Management Toolkit The Microdata Management Toolkit is a software suite developed by the World Bank Data Group for the International Household Survey Network aiming at promoting the adoption of international standards and best practices for microdata documentation, dissemination and preservation (Dupriez 2006). The Toolkit is composed of three core modules. The '''Metadata Editor''' is used to document data in accordance with international metadata standards (DDI and Dublin Core) (DCMI 2006).

42
Figure 19: Example of a Metadata Editor form The '''Explorer''' is a free reader for files generated by the '''Metadata Editor'''. It allows users to view the metadata and to export the data into various common formats (STATA, SPSS, etc). The '''CD-ROM Builder''' is used to generate user-friendly outputs (CD-ROM, website) for dissemination and archiving. To complement the core models, extra utilities and reporting tools are also available in the package.
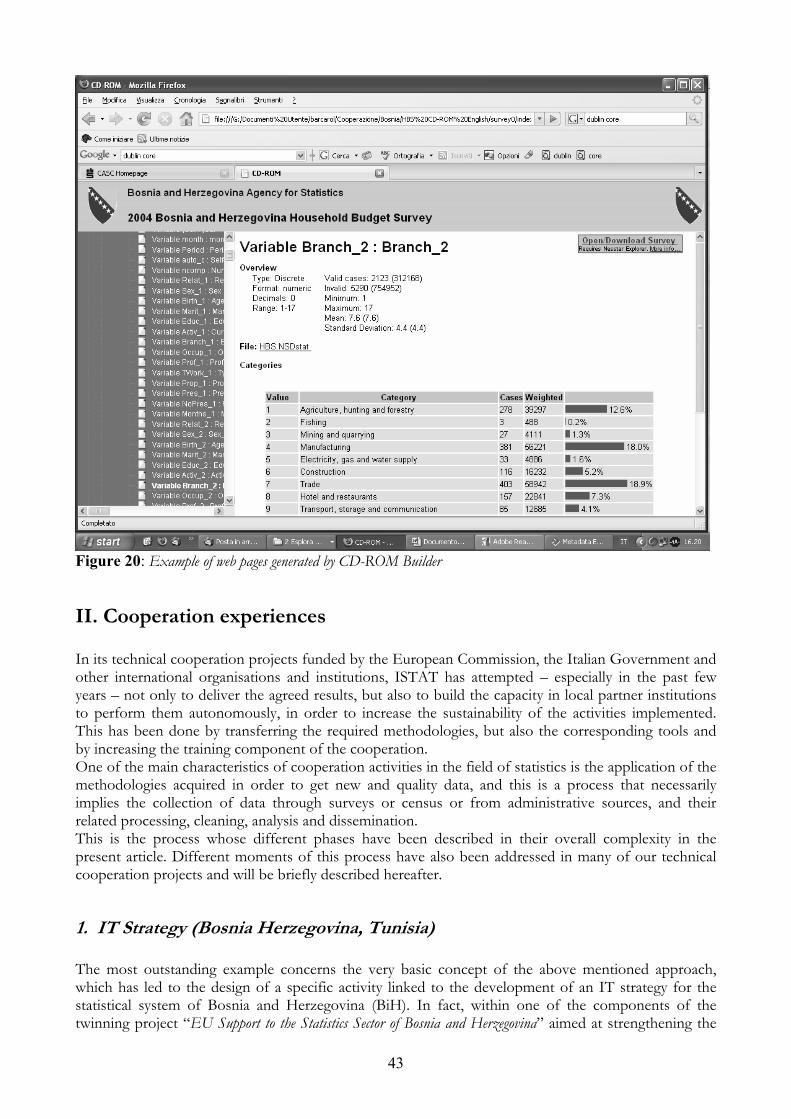
43
Figure 20: Example of web pages generated by CD-ROM Builder
II. Cooperation experiences
In its technical cooperation projects funded by the European Commission, the Italian Government and other international organisations and institutions, ISTAT has attempted – especially in the past few years – not only to deliver the agreed results, but also to build the capacity in local partner institutions to perform them autonomously, in order to increase the sustainability of the activities implemented. This has been done by transferring the required methodologies, but also the corresponding tools and by increasing the training component of the cooperation. One of the main characteristics of cooperation activities in the field of statistics is the application of the methodologies acquired in order to get new and quality data, and this is a process that necessarily implies the collection of data through surveys or census or from administrative sources, and their related processing, cleaning, analysis and dissemination. This is the process whose different phases have been described in their overall complexity in the present article. Different moments of this process have also been addressed in many of our technical cooperation projects and will be briefly described hereafter.
1. IT Strategy (Bosnia Herzegovina, Tunisia) The most outstanding example concerns the very basic concept of the above mentioned approach, which has led to the design of a specific activity linked to the development of an IT strategy for the statistical system of Bosnia and Herzegovina (BiH). In fact, within one of the components of the twinning project “EU Support to the Statistics Sector of Bosnia and Herzegovina” aimed at strengthening the

44
institutional capacity of Bosnian statistics, a specific activity was targeted at the design and adoption of an IT Strategy common to the three Statistical Institutes of Bosnia and Herzegovina. The primary objective of this activity was to provide a common platform in order to urge the three Bosnian Statistical Institutions to adopt the same standards for their statistical production process. A linked, and not less valuable advantage of the adoption of such a strategy, was to provide Bosnian statisticians with a concrete tool aimed at requiring compliance to the strategy from their providers of technical cooperation activities, in order to avoid the proliferation of ad hoc IT applications, which they will be unable to adjust and/or maintain in the future. The proposed IT Strategy goes through the whole statistical production process of Bosnia and Herzegovina by analysing the present situation and capacity, and by proposing for each single step of the process viable open source solutions; this with the aim not only of standardising the IT approach to the production process, but also and especially to become independent from costly and extremely diversified solutions. In doing that, the proposal had to take into account the already consolidated presence of proprietary software (from Microsoft: SQLServer, VisualBasic, etc.), so in some cases open source software has to be considered as an additional choice (this is the case, for instance, of MySql). The Strategy is completed with Action and Training plans in order to assist BiH statistics during the transition period and to guide them in their future requests from donors. The Twinning project in BiH has also provided a number of other areas where it has been possible to apply the principles outlined above, as each of its many components (i.e. National Accounts, Business Register, Business Statistics, External Trade Statistics, Agriculture Statistics and Financial Sector Statistics) were potentially liable to be upgraded from an IT point of view. However, as it is often the case in technical cooperation projects, whose aim is the methodological improvement and the compliance to EU and international standards - and this not necessarily from the point of the tools needed to reach them – it has been impossible to intervene following the open source approach in all areas, although significant efforts have been made, like i.e. to develop MySql databases for production indices, R applications for business surveys, etc. A similar approach will be implemented in the general cooperation framework between the two Institutes of Statistics of Italy and Tunisia, initiated at the occasion of the EU funded Twinning project in Tunisia “Développement du Système d’Informations Statistiques sur les Entreprises (SISE) à l’Institut National de la Statistique”. Although the work within the Twinning project itself will have inevitably to follow practices initiated in the past, this very work has shown the need to pursue a more thorough analysis of the way the work is performed with the existing knowledge, technologies and manpower, and how this can be optimised in the future from a technical, financial and human resource point of view.
2. Sampling design (Bosnia Herzegovina, Albania) The project “2004 Bosnia and Herzegovina Household Budget Survey” funded by the Italian Government, allowed for the implementation of a number of applications using the software approach and tools which are described in the present document, but these have been increased and improved during the second project, still funded by the Italian Government and DfID11, which aimed at the implementation of the “2007 Bosnia and Herzegovina Household Budget Survey”. For the BiH HBSs, and especially the 2007 one, open source and generalised software applications were used for the sampling design, data editing and imputation procedures, production of weights and estimates, for the dissemination of microdata and for the web dissemination of results. In particular, for what concerns sampling design, the 2007 Household Budget Survey sampling design was carried out using R software (package “sampling”). An application using R has been used also to draw the sample design for the “Albania Household Budget Survey”, a project funded by the World Bank and DfID with some technical assistance provided by ISTAT.
11 The UK Department for International Development
45
3. Computer aided information collection (Bosnia Herzegovina, Albania, Kosovo, Cape Verde) In the first “2004 Bosnia and Herzegovina Household Budget Survey” the software Blaise was used for entering survey data, and this same application has been updated and used also for the 2007 one. The basic knowledge of the Blaise software has been acquired by Bosnian statisticians which have used it also for their new Labour Force Survey, which has now reached its third wave. Nevertheless, for future development and in view of the progressive adoption of an open source approach, the use of CSPro has been advised. CSPro has been satisfactorily used in the “Albanian Household Budget Survey”, giving very good results, as it has allowed user friendly forms for data entry, the use of checks for reducing entry errors as well as advanced tabulation. CSPro has also been used for the Census Integrated System developed in the framework of the EU funded project “Support to the statistical system and preparation for the Census”, for the setting up of the Kosovo Population and Housing Census. The system is a complete environment aimed not only at managing census data collection, but also logistics activities, data processing procedures, data analysis and data dissemination. The IT approach was based on a strategy aimed at implementing a unique Census Integrated System consisting of four different applications (the Census Logistics Tool, the Phases Monitoring Tool, the Data Entry System and the Operators Monitoring Tool), able to work separately and to communicate with each other conceptually and technically during data processing. Finally, CSPRo was utilised also to develop the data entry programmes for the several agricultural surveys developed within the Italian Government funded project in Cape Verde “Renforcement du Service Statistique du Ministère de l’Environnement, Développement Rural et Ressources Marines : création d’un système permanent de statistiques agricoles”.
4. Data editing and imputation (Bosnia Herzegovina, Cape Verde) For the data editing and imputation of the “2004 Bosnia and Herzegovina Household Budget Survey” a version of the generalised software CONCORD has been developed by excluding SAS as required software, in order to make it usable directly in Bosnian Institutions, but under the constraint to be run only on LINUX platforms. This caused problems to local researchers, as they are not acquainted with this operative system. A decision was therefore taken to develop a Java version of CONCORD, running on both Windows and LINUX platforms. This new version was used for the 2007 HBS, and upon BiH request detailed training has been provided both in the methodology for data editing and imputation and in the design of the procedure in order to allow Bosnian statisticians to develop their own data editing and imputation procedures, not only for their HBS but also for other surveys and the census. A CONCORD application has been used also for cleaning the Albanian HBS data, and some work was initiated during the project in Cape Verde: in the latter, further implementation of the procedures, including the production of weights and estimates were continued in SPSS, as this was compliant to the overall IT strategy adopted by the whole public administration in Cape Verde.
5. Sampling estimates (Bosnia Herzegovina, Albania) The software GENESEES for re-weighting data and for calculating sampling errors in 2004 HBS in BiH. For the next 2007 HBS, it was decided not to use GENESEES, because of its dependency on SAS, but instead the R package “EVER”, that was completed at the very moment of estimates

46
calculation. A training course on “EVER” has been scheduled in the next months so to allow BiH statisticians to use it autonomously.
6. Data analysis and data mining (Bosnia Herzegovina) Again for the HBS in Bosnia Herzegovina, substantial improvements towards using open source software have been attained between the 2004 and the 2007 surveys. Whereas, based on the software traditionally in use in both statistical institutes in Italy and in Bosnia Herzegovina, the 2004 HBS data where processed and analysed using SAS and SPSS respectively, in 2007 all analysis and tabulation was produced using R, with some double checking in SPSS; some specific work related to poverty analysis was carried out in STATA. Another significant application implemented during the 2007 HBS concerns data mining techniques applied to a subset of data which presented dubious results12, stemming from the analysis of controls carried out during the fieldwork. After having given different flags to interviews where controls were reported as positive or negative (in terms of interviews correctly carried out, or not correctly, or fake), the data mining instrument “Rattle” (an R package) has been used to model the “degree of incorrectness” of the interviews, that has been used to exclude a number of them by the dataset of the observations. By using the subset of controlled interviews as a training set, the probability of non correct or false interview was modelled by using as explanatory variable the interviewer identifier and the frequency of expenses recorded in the diary. All possible Rattle modelling tools were evaluated, from linear (logistic model) to non linear (Support Vector Machines, Classification Trees, Random Forest, etc.). The one with the highest prediction capability was Random Forest. All interviews in the dataset were scored, including the not controlled ones; allowing the identification of incorrect interviews, the fixing of an exclusion threshold, and the cancellation of the households exceeding that threshold.
7. Statistical disclosure control (Bosnia Herzegovina) In 2004 Bosnia and Herzegovina HBS, in order to allow access from external users to survey microdata, mainly for statistical analysis purposes, a standard file has been produced, rearranging data in such a way that the risk of statistical disclosure could be assumed as reasonably low. By using mu-Argus software, the following procedures were performed: o a measure of risk was given to each record in the dataset, and records with an associated risk
exceeding the given threshold were identified; o a combination of two different protection methods was applied: local suppression, to only riskful
records, and global recoding, to the whole set of records. The HBS dataset is a file in which each record is related to an observed household (households dataset). In order to apply the Argus methodology, it was required to produce a derived dataset, in which each record refers to a single component of a given household (individuals dataset): this is a hierarchical file, with dependency links between subsets of units. The evaluation of the risk, and the consequent protection, was carried out on this individuals file. After this, the households file was re-composed, and this was the standard file disseminated to external users.
8. Tabulation (Albania) Although not entirely under the auspices of the ISTAT implemented component of the Albanian HBS, all the tabulation for this survey has been designed and produced together with the World Bank by 12 Actually, estimates regarding one of BiH territorial entity were much lower than previous 2004 estimates
47
using CSPro, thus constituting, together with the data entry and the consistency checking component, a complete application for this survey. As mentioned, for the 2007 BiH HBS, and following ad hoc training, tabulation was also developed using R, although parallel work still exists in SPSS.
9. Statistical dissemination systems (Bosnia Herzegovina, Kosovo) Web statistical dissemination will be ensured both for the 2007 HBS in Bosnia Herzegovina as well as for the Kosovo Population and Housing Census by using the software newly released by Istat “IstarMD”. This release will replace the WebMD suite which was used for the 2004 HBS in Bosnia Herzegovina, which had the drawback of not running on an open source platform, but which was running on an ORACLE based one, thus requiring the use of a server residing in ISTAT, accessed remotely from BiH. The newly released IstarMD, explained into great detail in par. 10.1.1. above, was specifically developed for the Kosovo Population and Housing Census, and takes fully into account not only Kosovo specificities (including multilingual requirements), but also the EUROSTAT requirements concerning the production and dissemination of data based on electronic hypercubes, included in the unified publication programme foreseen by the newly approved European Regulation on Population and Housing Censuses. This new version can make use not only of ORACLE databases, but also of MySql ones, thus enabling a complete portability on whatever platform. In this way, the next 2007 BiH HBS Statistical Dissemination System will be entirely resident in BiH Institutions. Training courses have also been planned in order to make BiH statisticians autonomous in designing and implementing their dissemination data warehouses.
10. GIS (Kosovo, Bosnia Herzegovina) The integration into the census website of an interactive web GIS application has been planned as well in Kosovo within the project “Support to the statistical system and preparation for the Census”, . This tool will be designed in order to provide users with thematic maps, reference spatial information and tabular data, according to international standards, mainly described in the INSPIRE EU directive and its implementation rules. The web mapping application is foreseen to be linked to the main data retrieval system, providing the needed spatial dimension to the census results.
In Bosnia Herzegovina, the Institutes of Statistics of BiH are in the process of receiving technical assistance and training in the field of cartography and GIS, with the aim to begin the implementation of a comprehensive geo-referenced system to be used for dissemination purposes and for data collection and analysis. The outcome will be a basic Spatial Data Infrastructure (SDI) for statistics in selected areas of the country, by defining a data model and procedures for its future extension to the rest of the country. It is intended to be used for statistical applications requiring geo-coded statistical data to support Institutional duties and other National Institutions as well, and as a first support for the preparation and execution of the foreseen Population and Housing Census that will be conducted in 2011. It is proposed that the IT infrastructure for the implementation of the GIS database for statistics in Bosnia Herzegovina is developed in an open source environment, linked to the web-based data warehouse.
The capacity building and training follows mainly two objectives: i) to provide conceptual and methodological capabilities for the use of geo-spatial technologies in the field of statistics according to European standards and recommendations; ii) to transfer specific know-how in the use of digital
48
cartographic data for the analysis and dissemination of statistical data using GIS software tools and new data collection techniques. Specific training activities are already underway using PostgreSQL and PostGIS software for the benfit of GIS experts of the Statistical Offices of Albania, Kosovo and Bosnia Herzegovina.,
11. Microdata dissemination (Bosnia Herzegovina) Starting from the safe microdata set of 2004 BiH HBS, the Microdata Management Toolkit has been used in order to create the web pages in the BiH Agency for Statistics (BHAS) site for microdata dissemination. First, Metadata Editor was used to load validated data, associate metadata (record layout, variables type, classifications) to them, and document all phase of the production process, from sampling design to data collection, editing and imputation, weighting and sampling variance estimation. The CD-Builder component of the Toolkit has then been used to generate web pages for the BHAS (Statistical Agency of BiH) official site; versions were produced in English and subsequently in the local languages for use in the websites also for the two Entity Statistical Institutes. The same procedure will be replicated for the 2007 BiH HBS.
III. Conclusions and recommendations The convenience to adopt free or open source software solutions to develop statistical applications is always self-evident from the point of view of costs. Also considering quality, nowadays there is no evidence of a superiority of proprietary software with respect to open source, in particular on the statistical side. On the contrary, the world community of statisticians is collaborating in producing more and more open software that is “on the edge”, i.e. containing most advanced techniques. This convenience has proven even higher in the context of statistical cooperation projects, where sustainability is a key issue. In those situations, where funding is limited and not guaranteed, investments should be maximised in other relevant fields aimed at the development and strengthening of statistical capacity, rather than for providing proprietary software. The experience of ISTAT in the application and adoption of free or open source software in statistical cooperation has shown that the approach is positive, providing returns that go even beyond the methodological and IT sphere. In fact, in these programmes, and from a more general point of view, ISTAT engaged to make beneficiary institutions aware of the need to develop and adopt an IT strategy, allowing them to invest in training and human resources, concentrating on a limited number of required software applications, developed and maintained on a long term basis within the house; in addition, such strategy would also provide these institutions with a defined set of standards to be adhered to by collaborating institutions. In line with this approach, ISTAT also worked to facilitate the coordination of donors’ efforts, aiming at their compliance to the IT requirements and standards of beneficiary institutions, accepting to allocate adequate resources to develop and deliver the statistical software applications needed for the technical intervention provided. From a more technical point of view, the application of these principles is facilitated in the partners institutions of cooperation programmes, as they are fairly new in their organisations, at least for what concerns their IT component: this means that – as opposed to the case of ISTAT itself, for example – they have minor constraints and are able to adopt more promptly a coordinated IT strategy without going through a complex transition process, which is a difficult one for the production process itself
49
and especially for the resources involved. This is not the case in ISTAT, where obstacles of different nature hinder the fast adoption of a comprehensive approach of this kind, especially because its production process is based on years and years of work and of software development based on different characteristics. Nevertheless, ISTAT has been experimenting since long now the development and use of generalised software for statistical production processes. Recently, a strategic decision of adopting open source instruments for producing this generalised software has been taken, also because of the need to make this software portable everywhere, in particular in Institutions involved in cooperation. The work developed in the context of ISTAT’s cooperation projects has often triggered capacities and means to test new applications, or to transform existing ones in an “open” environment, with important returns also for ISTAT’s internal experience and use. The advantages within technical cooperation activities are paramount. So far, an almost complete line of generalised software and tools are available, to cover all the phases of a statistical survey. The emphasis in now on the need to share knowledge on these instruments, obviously together with a continuous effort to improve their quality and usability.

50
References Bankier, M. (2006) - “Imputing Numeric and Qualitative Variables Simultaneously”, Social Survey
Methods Division Report, Statistics Canada, 2006. Bethel, J. (1989) - “Sample Allocation in Multivariate Surveys”. Survey Methodology, Vol. 15, pp. 47-57. Berry M.J.A., Linoff G.S. (2001) – “Mastering Data Mining: The Art and Science of Customer
Relationship Management” – Wiley Bianchini, R. (2007) – “Desk Review of the Study on technology for production of cartographic
documentation for 2011 Census in Bosnia Herzegovina”, CIRPS, Sapienza University of Rome, Population, Health and GIS section, 2007
Brewer K.R.V., Hanif M. - (1983), "Sampling with Unequal Probabilities", Springer-Verlag. New-
YorkChromy, J. B. (1987) - Design Optimization With Multiple Objectives. In Proceedings of the Section on Survey Research Methods, 1987. American Statistical Association, pp. 194-199.
Cartography Group, BiH Agency for Statistics, Federal Institute of Statistics, and the Republika Srpska
Institute of Statistics, (2007) – “Study on technology for production of cartographic documentation for 2011 Census”, Cartography Group, BiH Agency for Statistics, Federal Institute of Statistics, and the Republika Srpska Institute of Statistics, UNFPA, 2007
Casella G., George E.I. (1992) - "Explaining the Gibbs sampler". The American Statistician, 46:167-174,
1992 Cibella N., Fortini M., Scannapieco M., Spina R., Tosco L., Tuoto T. (2008) – RELAIS Versione 1.0
Guida Utente all’Utilizzo – ISTAT Cochran, W.G. (1977). “Sampling Techniques” - John Wiley and Sons, New York. Crookston, N.L., Finley, A.O. (2008) – “yaImpute: An R Package for k-NN Imputation” – Journal of
Statistical Software, January 2008, Volume 23, Issue 10. Dalenius, T (1952) – “The problem of optimum stratification in a Special Type of Design”,
Skandinavsik Aktuaretidskrift, 35 61-70 Deville J-C, Sarndal C-E, Sautory O (1993) Generalized Raking Procedures in Survey Sampling. JASA
88:1013-1020 Deville J.C., Tillè Y. (2004) - Efficient balanced sampling: The cube method - Biometrika 2004 91(4)
pp. 893-912 DCMI 2006 – “Dublin Core Metadata Element Set, Version 1.1” – DCMI Recommendation
(http://dublincore.org/documents/dces) Dupriez O. 2006– “Microdata Management Toolkit Version 1.0 – User’s Guide”– International
Household Survey Network Washington D.C. - September 2006 (http://www.surveynetwork.org/toolkit)
51
Franconi L., Seri G. (a cura di) 2004 – “Metodologie e tecniche di tutela della riservatezza nel rilascio di informazione statistica” – Metodi e norme n.20 – ISTAT 2004
Fellegi I.P., Holt D. (1976) - “A systematic method to edit and imputation”, Journal of the American
Statistical Association, vol.71, pp.17-35, 1976 Fellegi I. P, Sunter A. B (1969) - “A Theory for Record Linkage”, Journal of the American Statistical
Association, Vol. 64, pp. 1183-1210, 1969 Gambino, J.G. (2005). pps: Functions for PPS sampling. R package version 0.94 Geman S., Geman D. (1984) - "Stochastic Relaxation, Gibbs Distributions, and the Bayesian
Restoration of Images". IEEE Transactions on Pattern Analysis and Machine Intelligence, 6:721-741, 1984 Hidiroglou, M.A. (1986) – “The Construction of a Self-Representing Stratum of Large Units in Survey
Design”, The American Statistician, Vol.40 N.1 February 1986 Kott, P.S. (2001) - "The Delete-A-Group Jackknife" - Journal of Official Statistics, Vol.17, No.4, pp. 521-
526. Lumley T. (2006) - survey: analysis of complex survey samples. R package version 3.6-5. Lumley T. (2004) - “Analysis of complex survey samples” - Journal of Statistical Software 9(1):1-19 Neyman, J. (1934) – On the two different aspects of the representative method: the method of
representative sampling and the method of purposive sampling, Journal of Royal Statistical Society, 558-625
R Development Core Team (2007). R: A language and environment for statistical computing. R
Foundation for Statistical Computing, Vienna, Austria. ISBN 3-900051-07-0, URL http://www.R-project.org.
Roiger R, Geatz M. (2002). “Data Mining: A Tutorial Based Primer” - Addison Wesley; 2002 Sampford, M.R. (1967). “On sampling without replacement with unequal probabilities of selection” -
Biometrika, 54, 499-513. Särndal C.E., Swensson B., Wretman J. (1992) – “Model Assisted Survey Sampling Springer” -Verlag
New York Shao and Tu "The Jackknife and Bootstrap". Springer. Shoshani A. (1997). OLAP and Statistical Databases: Similarities and Differences. In ACM Symposium
on Principles of Database Systems (PODS 97), pp.185-196. Sindoni G., Tininini L. (2007). Statistical Dissemination Systems and the Web. In Handbook of
Research on Public Information Technology, G.D. Garson and M. Khosrow-Pour (editors). Information Science Reference.
Tillé Y, Matei A. (2007). sampling: Survey Sampling. R package version 0.8. Van Buuren S., Oudshoorn G.C.M. (2007). “mice: Multivariate Imputation by Chained Equations”. R
package version 1.16. http://web.inter.nl.net/users/S.van.Buuren/mi/hmtl/mice.htm

52
Vanderhoeft C. (2001) – “Generalized Calibration at Statistics Belgium” - Statistics Belgium Working
Paper No 3. http://www.statbel.fgov.be/studies/paper03_en.asp Wickham H. (2007) - reshape: Flexibly reshape data.. R package version 0.8.0. Willighagen E. (2005) - genalg: R Based Genetic Algorithm. R package version 0.1.1. Witten I. H., Frank E. (2005 ) - “Data Mining: Practical Machine Learning Tools and Techniques” -
Morgan Kaufmann June 2005 D. Zardetto (2008) "EVER: Estimation of Variance by Efficient Replication". R package version 1.0,
Istat, Italy.
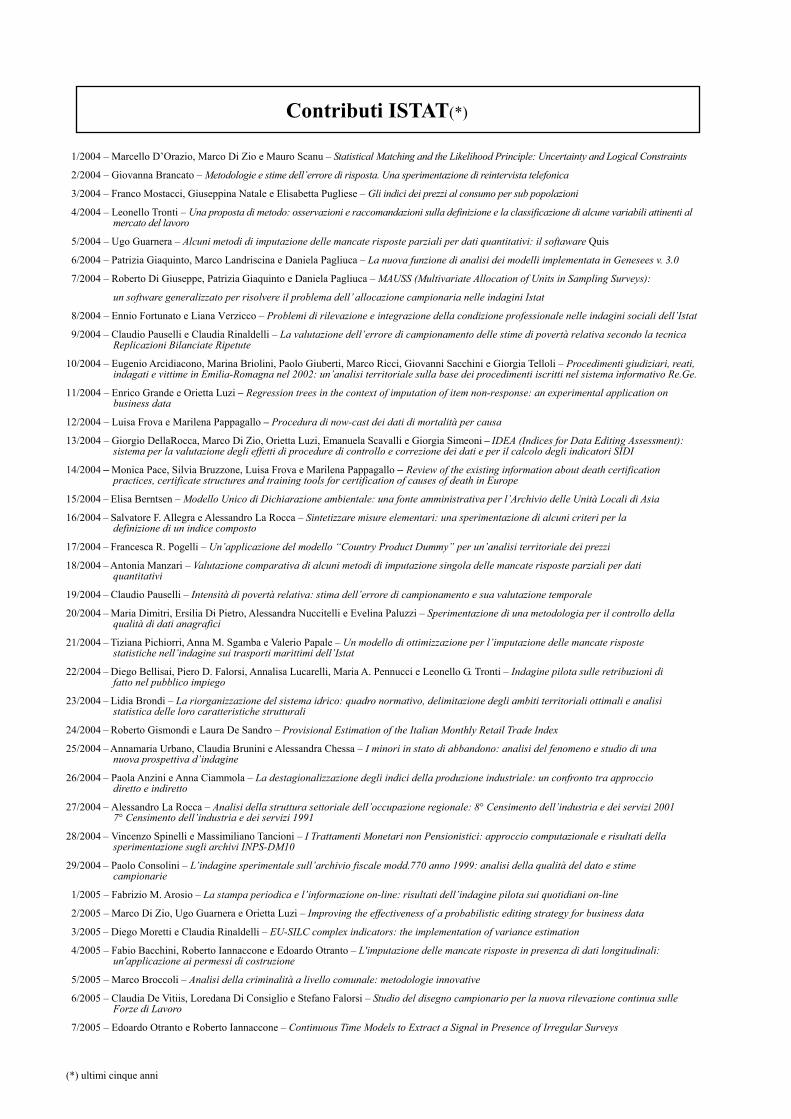
(*) ultimi cinque anni
1/2004 – Marcello D’Orazio, Marco Di Zio e Mauro Scanu – Statistical Matching and the Likelihood Principle: Uncertainty and Logical Constraints
2/2004 – Giovanna Brancato – Metodologie e stime dell’errore di risposta. Una sperimentazione di reintervista telefonica
3/2004 – Franco Mostacci, Giuseppina Natale e Elisabetta Pugliese – Gli indici dei prezzi al consumo per sub popolazioni
4/2004 – Leonello Tronti – Una proposta di metodo: osservazioni e raccomandazioni sulla definizione e la classificazione di alcune variabili attinenti al mercato del lavoro
5/2004 – Ugo Guarnera – Alcuni metodi di imputazione delle mancate risposte parziali per dati quantitativi: il softaware Quis 6/2004 – Patrizia Giaquinto, Marco Landriscina e Daniela Pagliuca – La nuova funzione di analisi dei modelli implementata in Genesees v. 3.0 7/2004 – Roberto Di Giuseppe, Patrizia Giaquinto e Daniela Pagliuca – MAUSS (Multivariate Allocation of Units in Sampling Surveys):
un software generalizzato per risolvere il problema dell’ allocazione campionaria nelle indagini Istat
8/2004 – Ennio Fortunato e Liana Verzicco – Problemi di rilevazione e integrazione della condizione professionale nelle indagini sociali dell’Istat
9/2004 – Claudio Pauselli e Claudia Rinaldelli – La valutazione dell’errore di campionamento delle stime di povertà relativa secondo la tecnica Replicazioni Bilanciate Ripetute
10/2004 – Eugenio Arcidiacono, Marina Briolini, Paolo Giuberti, Marco Ricci, Giovanni Sacchini e Giorgia Telloli – Procedimenti giudiziari, reati, indagati e vittime in Emilia-Romagna nel 2002: un’analisi territoriale sulla base dei procedimenti iscritti nel sistema informativo Re.Ge.
11/2004 – Enrico Grande e Orietta Luzi – Regression trees in the context of imputation of item non-response: an experimental application on business data
12/2004 – Luisa Frova e Marilena Pappagallo – Procedura di now-cast dei dati di mortalità per causa
13/2004 – Giorgio DellaRocca, Marco Di Zio, Orietta Luzi, Emanuela Scavalli e Giorgia Simeoni – IDEA (Indices for Data Editing Assessment): sistema per la valutazione degli effetti di procedure di controllo e correzione dei dati e per il calcolo degli indicatori SIDI
14/2004 – Monica Pace, Silvia Bruzzone, Luisa Frova e Marilena Pappagallo – Review of the existing information about death certification practices, certificate structures and training tools for certification of causes of death in Europe
15/2004 – Elisa Berntsen – Modello Unico di Dichiarazione ambientale: una fonte amministrativa per l’Archivio delle Unità Locali di Asia
16/2004 – Salvatore F. Allegra e Alessandro La Rocca – Sintetizzare misure elementari: una sperimentazione di alcuni criteri per la definizione di un indice composto
17/2004 – Francesca R. Pogelli – Un’applicazione del modello “Country Product Dummy” per un’analisi territoriale dei prezzi
18/2004 – Antonia Manzari – Valutazione comparativa di alcuni metodi di imputazione singola delle mancate risposte parziali per dati quantitativi
19/2004 – Claudio Pauselli – Intensità di povertà relativa: stima dell’errore di campionamento e sua valutazione temporale
20/2004 – Maria Dimitri, Ersilia Di Pietro, Alessandra Nuccitelli e Evelina Paluzzi – Sperimentazione di una metodologia per il controllo della qualità di dati anagrafici
21/2004 – Tiziana Pichiorri, Anna M. Sgamba e Valerio Papale – Un modello di ottimizzazione per l’imputazione delle mancate risposte statistiche nell’indagine sui trasporti marittimi dell’Istat
22/2004 – Diego Bellisai, Piero D. Falorsi, Annalisa Lucarelli, Maria A. Pennucci e Leonello G. Tronti – Indagine pilota sulle retribuzioni di fatto nel pubblico impiego
23/2004 – Lidia Brondi – La riorganizzazione del sistema idrico: quadro normativo, delimitazione degli ambiti territoriali ottimali e analisi statistica delle loro caratteristiche strutturali
24/2004 – Roberto Gismondi e Laura De Sandro – Provisional Estimation of the Italian Monthly Retail Trade Index
25/2004 – Annamaria Urbano, Claudia Brunini e Alessandra Chessa – I minori in stato di abbandono: analisi del fenomeno e studio di una nuova prospettiva d’indagine
26/2004 – Paola Anzini e Anna Ciammola – La destagionalizzazione degli indici della produzione industriale: un confronto tra approccio diretto e indiretto
27/2004 – Alessandro La Rocca – Analisi della struttura settoriale dell’occupazione regionale: 8° Censimento dell’industria e dei servizi 2001 7° Censimento dell’industria e dei servizi 1991
28/2004 – Vincenzo Spinelli e Massimiliano Tancioni – I Trattamenti Monetari non Pensionistici: approccio computazionale e risultati della sperimentazione sugli archivi INPS-DM10
29/2004 – Paolo Consolini – L’indagine sperimentale sull’archivio fiscale modd.770 anno 1999: analisi della qualità del dato e stime campionarie
1/2005 – Fabrizio M. Arosio – La stampa periodica e l’informazione on-line: risultati dell’indagine pilota sui quotidiani on-line
2/2005 – Marco Di Zio, Ugo Guarnera e Orietta Luzi – Improving the effectiveness of a probabilistic editing strategy for business data
3/2005 – Diego Moretti e Claudia Rinaldelli – EU-SILC complex indicators: the implementation of variance estimation
4/2005 – Fabio Bacchini, Roberto Iannaccone e Edoardo Otranto – L'imputazione delle mancate risposte in presenza di dati longitudinali: un'applicazione ai permessi di costruzione
5/2005 – Marco Broccoli – Analisi della criminalità a livello comunale: metodologie innovative
6/2005 – Claudia De Vitiis, Loredana Di Consiglio e Stefano Falorsi – Studio del disegno campionario per la nuova rilevazione continua sulle Forze di Lavoro
7/2005 – Edoardo Otranto e Roberto Iannaccone – Continuous Time Models to Extract a Signal in Presence of Irregular Surveys
Contributi ISTAT(*)
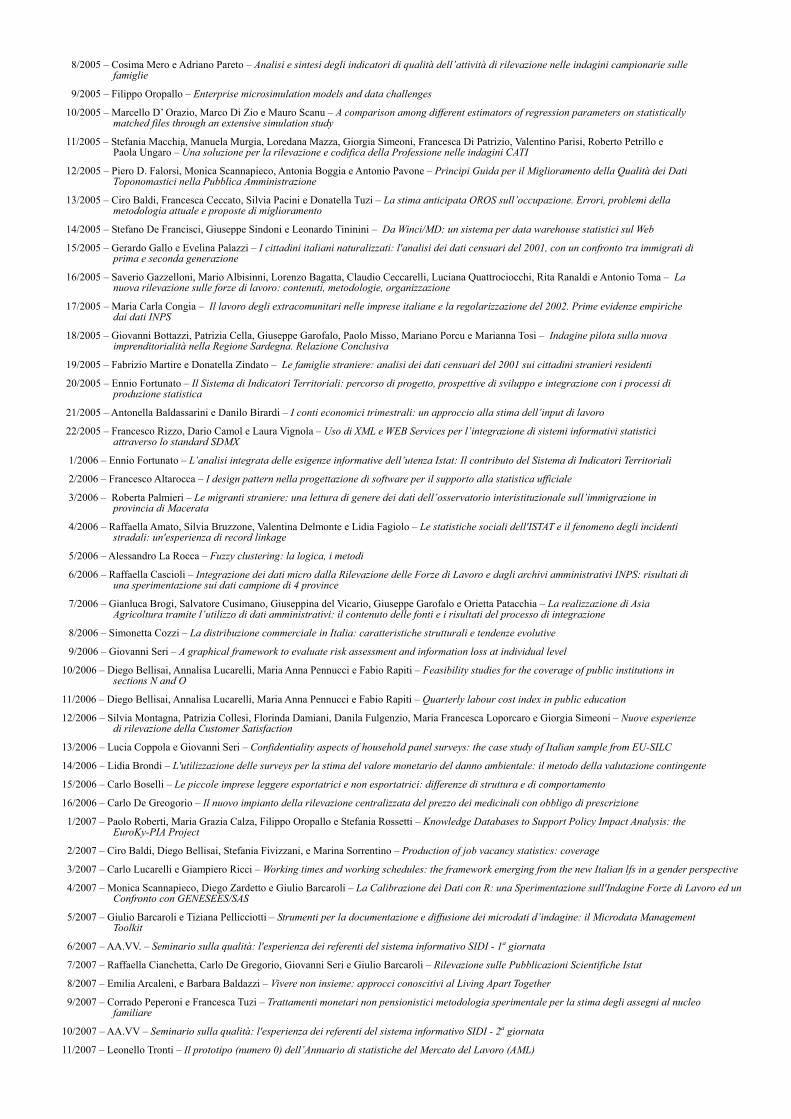
8/2005 – Cosima Mero e Adriano Pareto – Analisi e sintesi degli indicatori di qualità dell’attività di rilevazione nelle indagini campionarie sulle famiglie
9/2005 – Filippo Oropallo – Enterprise microsimulation models and data challenges
10/2005 – Marcello D’ Orazio, Marco Di Zio e Mauro Scanu – A comparison among different estimators of regression parameters on statistically matched files through an extensive simulation study
11/2005 – Stefania Macchia, Manuela Murgia, Loredana Mazza, Giorgia Simeoni, Francesca Di Patrizio, Valentino Parisi, Roberto Petrillo e Paola Ungaro – Una soluzione per la rilevazione e codifica della Professione nelle indagini CATI
12/2005 – Piero D. Falorsi, Monica Scannapieco, Antonia Boggia e Antonio Pavone – Principi Guida per il Miglioramento della Qualità dei Dati Toponomastici nella Pubblica Amministrazione
13/2005 – Ciro Baldi, Francesca Ceccato, Silvia Pacini e Donatella Tuzi – La stima anticipata OROS sull’occupazione. Errori, problemi della metodologia attuale e proposte di miglioramento
14/2005 – Stefano De Francisci, Giuseppe Sindoni e Leonardo Tininini – Da Winci/MD: un sistema per data warehouse statistici sul Web
15/2005 – Gerardo Gallo e Evelina Palazzi – I cittadini italiani naturalizzati: l'analisi dei dati censuari del 2001, con un confronto tra immigrati di prima e seconda generazione
16/2005 – Saverio Gazzelloni, Mario Albisinni, Lorenzo Bagatta, Claudio Ceccarelli, Luciana Quattrociocchi, Rita Ranaldi e Antonio Toma – La nuova rilevazione sulle forze di lavoro: contenuti, metodologie, organizzazione
17/2005 – Maria Carla Congia – Il lavoro degli extracomunitari nelle imprese italiane e la regolarizzazione del 2002. Prime evidenze empiriche dai dati INPS
18/2005 – Giovanni Bottazzi, Patrizia Cella, Giuseppe Garofalo, Paolo Misso, Mariano Porcu e Marianna Tosi – Indagine pilota sulla nuova imprenditorialità nella Regione Sardegna. Relazione Conclusiva
19/2005 – Fabrizio Martire e Donatella Zindato – Le famiglie straniere: analisi dei dati censuari del 2001 sui cittadini stranieri residenti
20/2005 – Ennio Fortunato – Il Sistema di Indicatori Territoriali: percorso di progetto, prospettive di sviluppo e integrazione con i processi di produzione statistica
21/2005 – Antonella Baldassarini e Danilo Birardi – I conti economici trimestrali: un approccio alla stima dell’input di lavoro
22/2005 – Francesco Rizzo, Dario Camol e Laura Vignola – Uso di XML e WEB Services per l’integrazione di sistemi informativi statistici attraverso lo standard SDMX
1/2006 – Ennio Fortunato – L’analisi integrata delle esigenze informative dell’utenza Istat: Il contributo del Sistema di Indicatori Territoriali
2/2006 – Francesco Altarocca – I design pattern nella progettazione di software per il supporto alla statistica ufficiale
3/2006 – Roberta Palmieri – Le migranti straniere: una lettura di genere dei dati dell’osservatorio interistituzionale sull’immigrazione in provincia di Macerata
4/2006 – Raffaella Amato, Silvia Bruzzone, Valentina Delmonte e Lidia Fagiolo – Le statistiche sociali dell'ISTAT e il fenomeno degli incidenti stradali: un'esperienza di record linkage
5/2006 – Alessandro La Rocca – Fuzzy clustering: la logica, i metodi
6/2006 – Raffaella Cascioli – Integrazione dei dati micro dalla Rilevazione delle Forze di Lavoro e dagli archivi amministrativi INPS: risultati di una sperimentazione sui dati campione di 4 province
7/2006 – Gianluca Brogi, Salvatore Cusimano, Giuseppina del Vicario, Giuseppe Garofalo e Orietta Patacchia – La realizzazione di Asia Agricoltura tramite l’utilizzo di dati amministrativi: il contenuto delle fonti e i risultati del processo di integrazione
8/2006 – Simonetta Cozzi – La distribuzione commerciale in Italia: caratteristiche strutturali e tendenze evolutive
9/2006 – Giovanni Seri – A graphical framework to evaluate risk assessment and information loss at individual level
10/2006 – Diego Bellisai, Annalisa Lucarelli, Maria Anna Pennucci e Fabio Rapiti – Feasibility studies for the coverage of public institutions in sections N and O
11/2006 – Diego Bellisai, Annalisa Lucarelli, Maria Anna Pennucci e Fabio Rapiti – Quarterly labour cost index in public education
12/2006 – Silvia Montagna, Patrizia Collesi, Florinda Damiani, Danila Fulgenzio, Maria Francesca Loporcaro e Giorgia Simeoni – Nuove esperienze di rilevazione della Customer Satisfaction
13/2006 – Lucia Coppola e Giovanni Seri – Confidentiality aspects of household panel surveys: the case study of Italian sample from EU-SILC
14/2006 – Lidia Brondi – L'utilizzazione delle surveys per la stima del valore monetario del danno ambientale: il metodo della valutazione contingente
15/2006 – Carlo Boselli – Le piccole imprese leggere esportatrici e non esportatrici: differenze di struttura e di comportamento
16/2006 – Carlo De Greogorio – Il nuovo impianto della rilevazione centralizzata del prezzo dei medicinali con obbligo di prescrizione
1/2007 – Paolo Roberti, Maria Grazia Calza, Filippo Oropallo e Stefania Rossetti – Knowledge Databases to Support Policy Impact Analysis: the EuroKy-PIA Project
2/2007 – Ciro Baldi, Diego Bellisai, Stefania Fivizzani, e Marina Sorrentino – Production of job vacancy statistics: coverage
3/2007 – Carlo Lucarelli e Giampiero Ricci – Working times and working schedules: the framework emerging from the new Italian lfs in a gender perspective
4/2007 – Monica Scannapieco, Diego Zardetto e Giulio Barcaroli – La Calibrazione dei Dati con R: una Sperimentazione sull'Indagine Forze di Lavoro ed un Confronto con GENESEES/SAS
5/2007 – Giulio Barcaroli e Tiziana Pellicciotti – Strumenti per la documentazione e diffusione dei microdati d’indagine: il Microdata Management Toolkit
6/2007 – AA.VV. – Seminario sulla qualità: l'esperienza dei referenti del sistema informativo SIDI - 1a giornata
7/2007 – Raffaella Cianchetta, Carlo De Gregorio, Giovanni Seri e Giulio Barcaroli – Rilevazione sulle Pubblicazioni Scientifiche Istat
8/2007 – Emilia Arcaleni, e Barbara Baldazzi – Vivere non insieme: approcci conoscitivi al Living Apart Together
9/2007 – Corrado Peperoni e Francesca Tuzi – Trattamenti monetari non pensionistici metodologia sperimentale per la stima degli assegni al nucleo familiare
10/2007 – AA.VV – Seminario sulla qualità: l'esperienza dei referenti del sistema informativo SIDI - 2a giornata
11/2007 – Leonello Tronti – Il prototipo (numero 0) dell’Annuario di statistiche del Mercato del Lavoro (AML)
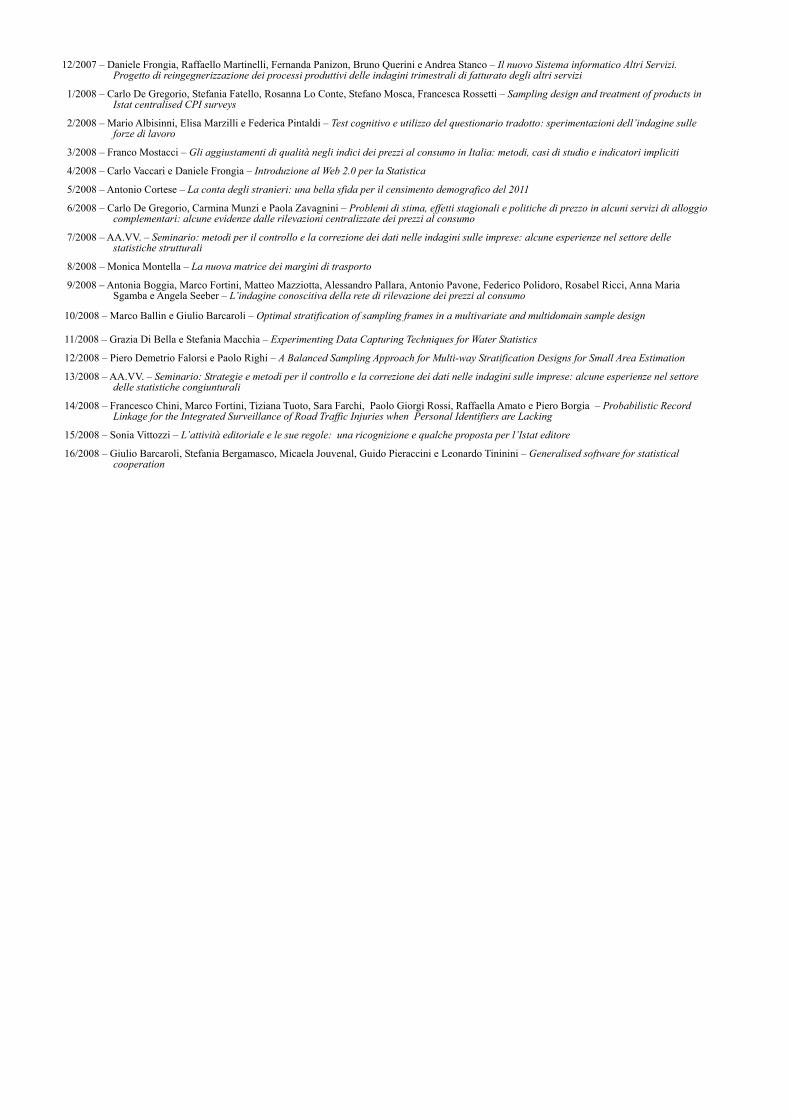
12/2007 – Daniele Frongia, Raffaello Martinelli, Fernanda Panizon, Bruno Querini e Andrea Stanco – Il nuovo Sistema informatico Altri Servizi. Progetto di reingegnerizzazione dei processi produttivi delle indagini trimestrali di fatturato degli altri servizi
1/2008 – Carlo De Gregorio, Stefania Fatello, Rosanna Lo Conte, Stefano Mosca, Francesca Rossetti – Sampling design and treatment of products in Istat centralised CPI surveys
2/2008 – Mario Albisinni, Elisa Marzilli e Federica Pintaldi – Test cognitivo e utilizzo del questionario tradotto: sperimentazioni dell’indagine sulle forze di lavoro
3/2008 – Franco Mostacci – Gli aggiustamenti di qualità negli indici dei prezzi al consumo in Italia: metodi, casi di studio e indicatori impliciti
4/2008 – Carlo Vaccari e Daniele Frongia – Introduzione al Web 2.0 per la Statistica
5/2008 – Antonio Cortese – La conta degli stranieri: una bella sfida per il censimento demografico del 2011
6/2008 – Carlo De Gregorio, Carmina Munzi e Paola Zavagnini – Problemi di stima, effetti stagionali e politiche di prezzo in alcuni servizi di alloggio complementari: alcune evidenze dalle rilevazioni centralizzate dei prezzi al consumo
7/2008 – AA.VV. – Seminario: metodi per il controllo e la correzione dei dati nelle indagini sulle imprese: alcune esperienze nel settore delle statistiche strutturali
8/2008 – Monica Montella – La nuova matrice dei margini di trasporto
9/2008 – Antonia Boggia, Marco Fortini, Matteo Mazziotta, Alessandro Pallara, Antonio Pavone, Federico Polidoro, Rosabel Ricci, Anna Maria Sgamba e Angela Seeber – L’indagine conoscitiva della rete di rilevazione dei prezzi al consumo
10/2008 – Marco Ballin e Giulio Barcaroli – Optimal stratification of sampling frames in a multivariate and multidomain sample design
11/2008 – Grazia Di Bella e Stefania Macchia – Experimenting Data Capturing Techniques for Water Statistics
12/2008 – Piero Demetrio Falorsi e Paolo Righi – A Balanced Sampling Approach for Multi-way Stratification Designs for Small Area Estimation
13/2008 – AA.VV. – Seminario: Strategie e metodi per il controllo e la correzione dei dati nelle indagini sulle imprese: alcune esperienze nel settore delle statistiche congiunturali
14/2008 – Francesco Chini, Marco Fortini, Tiziana Tuoto, Sara Farchi, Paolo Giorgi Rossi, Raffaella Amato e Piero Borgia – Probabilistic Record Linkage for the Integrated Surveillance of Road Traffic Injuries when Personal Identifiers are Lacking
15/2008 – Sonia Vittozzi – L’attività editoriale e le sue regole: una ricognizione e qualche proposta per l’Istat editore
16/2008 – Giulio Barcaroli, Stefania Bergamasco, Micaela Jouvenal, Guido Pieraccini e Leonardo Tininini – Generalised software for statistical cooperation
Copyright © 2022 FDOKUMEN