Gene Expression Profiling of Human Liver Transplants Identifies an Early Transcriptional Signature...
16
American Journal of Transplantation 2008; 8: 1221–1236 Blackwell Munksgaard C 2008 The Authors Journal compilation C 2008 The American Society of Transplantation and the American Society of Transplant Surgeons doi: 10.1111/j.1600-6143.2008.02249.x Gene Expression Profiling of Human Liver Transplants Identifies an Early Transcriptional Signature Associated with Initial Poor Graft Function V. Defamie a,b, † , R. Cursio b,c,f, † , K. Le Brigand a,b , C. Moreilhon a,b , M.-C. Saint-Paul d , M. Laurens b,e , D. Crenesse b,e , B. Cardinaud a,b , P. Auberger b,f , J. Gugenheim c , P. Barbry a,b, † and B. Mari a,b, †, ∗ a CNRS, Institut de Pharmacologie Mol ´ eculaire et Cellulaire, UMR6097, 660, route des Lucioles F-06560 Sophia Antipolis, France b University of Nice Sophia-Antipolis, Nice, France c Service de Chirurgie Digestive et Transplantation H´ epatique, H ˆ opital Archet 2, Nice, France d Service d’Anatomie et Cytologie Pathologiques, H ˆ opital Pasteur, Nice, France e INSERM U568, Liver Unit, Facult ´ e de M ´ edecine, Nice, France f INSERM U526, IFR50, Facult ´ e de M ´ edecine Pasteur, Nice, France ∗ Corresponding author: Bernard Mari, [email protected] †Contributed equally to this work. Present address: Princess Margaret Hospital, 610 University Avenue, Toronto, Ontario, Canada Liver ischemia-reperfusion injury occurring in ortho- topic liver transplantation (OLT) may be responsible for early graft failure. Molecular mechanisms underly- ing initial poor graft function (IPGF) have been poorly documented in human. The purpose of this study was to identify the major transcriptional alterations occur- ring in human livers during OLT. Twenty-one RNA ex- tracts derived from liver transplant biopsies taken after graft reperfusion were compared with 7 RNA derived from normal control livers. Three hundred seventy-one genes were significantly modulated and classified in molecular pathways relevant to liver metabolism, in- flammatory response, cell proliferation and liver pro- tection. Grafts were then subdivided into two groups based on their peak levels of serum aspartate amino transferase within 72 h after OLT (group 1, non-IPGF: 14 patients; group 2, IPGF: 7 patients). The two cor- responding data sets were compared using a super- vised prediction method. A new set of genes able to correctly classify 71% of the patients was defined. These genes were functionally associated with oxida- tive stress, inflammation and inhibition of cell prolif- eration. This study provides a comprehensive picture of the transcriptional events associated with human OLT and IPGF. We anticipate that such alterations pro- vide a framework for the elucidation of the molecular mechanisms leading to IPGF. Key words: Early outcome analysis, gene expres- sion profiling, injury mechanisms and biomarkers, is- chemia/reperfusion injury, orthotopic liver transplant, stress response Received 13 September 2007, revised 5 March 2008 and accepted for publication 8 March 2008 Introduction Orthotopic liver transplantation (OLT) represents the pri- mary therapy for end-stage liver disease and acute liver failure. However, initial poor graft function (IPGF), an event mainly due to the unavoidable preservation injury of the transplanted organ, occurs in about 20% of cases and can lead to primary graft non function (PNF) in serious cases (1,2). These preservation-related complications are major causes of both acute and chronic rejection and an increased need for re-transplantation. The elucidation of the molecu- lar mechanisms leading to IPGF is an important health is- sue, as it may provide new strategies to handle the grafts. A large number of factors and mediators can play a role in these damages (3–5). Hypothermia reduces liver metabolic rate and prolongs the time period during which anoxic cells can retain essential metabolic functions. However, decreasing temperature also induce cell injury, which is attributed to alterations of calcium homeostasis, modifi- cations of cytoskeleton and local tissue destruction due to proteases release (6–8). Following liver reperfusion, an ordered sequence of inflammatory events is driven by ox- idant stress generated in Kupffer cells and hepatocytes (9–11). Production of reactive oxygen species (ROS), in- cluding superoxide, hydrogen peroxide and hydroxyl rad- icals has long been implicated in I/R injury. However, oxygen-independent factors, such as tissue pH changes are also important (12). Inflammatory responses (13,14) and microcirculatory disturbances (15) further aggravate injury. Kupffer cells represent central source of mediators contributing to injury such as ROS, proinflammatory cy- tokines and chemokines. Together with activated comple- ment factors, these inflammatory mediators activate and 1221
-
Upload
independent -
Category
Documents
-
view
0 -
download
0
Transcript of Gene Expression Profiling of Human Liver Transplants Identifies an Early Transcriptional Signature...

American Journal of Transplantation 2008; 8: 1221–1236Blackwell Munksgaard
C© 2008 The AuthorsJournal compilation C© 2008 The American Society of
Transplantation and the American Society of Transplant Surgeons
doi: 10.1111/j.1600-6143.2008.02249.x
Gene Expression Profiling of Human Liver TransplantsIdentifies an Early Transcriptional SignatureAssociated with Initial Poor Graft Function
V. Defamiea,b,†, R. Cursiob,c,f,†, K. Le Briganda,b,
C. Moreilhona,b, M.-C. Saint-Pauld, M. Laurensb,e,
D. Crenesseb,e, B. Cardinauda,b, P. Aubergerb,f,
J. Gugenheimc, P. Barbrya,b,† and B. Maria,b,†,∗
aCNRS, Institut de Pharmacologie Moleculaire etCellulaire, UMR6097, 660, route des Lucioles F-06560Sophia Antipolis, FrancebUniversity of Nice Sophia-Antipolis, Nice, FrancecService de Chirurgie Digestive et TransplantationHepatique, Hopital Archet 2, Nice, FrancedService d’Anatomie et Cytologie Pathologiques, HopitalPasteur, Nice, FranceeINSERM U568, Liver Unit, Faculte de Medecine, Nice,FrancefINSERM U526, IFR50, Faculte de Medecine Pasteur,Nice, France∗Corresponding author: Bernard Mari,[email protected]†Contributed equally to this work.Present address: Princess Margaret Hospital, 610University Avenue, Toronto, Ontario, Canada
Liver ischemia-reperfusion injury occurring in ortho-topic liver transplantation (OLT) may be responsiblefor early graft failure. Molecular mechanisms underly-ing initial poor graft function (IPGF) have been poorlydocumented in human. The purpose of this study wasto identify the major transcriptional alterations occur-ring in human livers during OLT. Twenty-one RNA ex-tracts derived from liver transplant biopsies taken aftergraft reperfusion were compared with 7 RNA derivedfrom normal control livers. Three hundred seventy-onegenes were significantly modulated and classified inmolecular pathways relevant to liver metabolism, in-flammatory response, cell proliferation and liver pro-tection. Grafts were then subdivided into two groupsbased on their peak levels of serum aspartate aminotransferase within 72 h after OLT (group 1, non-IPGF:14 patients; group 2, IPGF: 7 patients). The two cor-responding data sets were compared using a super-vised prediction method. A new set of genes ableto correctly classify 71% of the patients was defined.These genes were functionally associated with oxida-tive stress, inflammation and inhibition of cell prolif-eration. This study provides a comprehensive pictureof the transcriptional events associated with humanOLT and IPGF. We anticipate that such alterations pro-
vide a framework for the elucidation of the molecularmechanisms leading to IPGF.
Key words: Early outcome analysis, gene expres-sion profiling, injury mechanisms and biomarkers, is-chemia/reperfusion injury, orthotopic liver transplant,stress response
Received 13 September 2007, revised 5 March 2008 andaccepted for publication 8 March 2008
Introduction
Orthotopic liver transplantation (OLT) represents the pri-mary therapy for end-stage liver disease and acute liverfailure. However, initial poor graft function (IPGF), an eventmainly due to the unavoidable preservation injury of thetransplanted organ, occurs in about 20% of cases and canlead to primary graft non function (PNF) in serious cases(1,2). These preservation-related complications are majorcauses of both acute and chronic rejection and an increasedneed for re-transplantation. The elucidation of the molecu-lar mechanisms leading to IPGF is an important health is-sue, as it may provide new strategies to handle the grafts.
A large number of factors and mediators can play a role inthese damages (3–5). Hypothermia reduces liver metabolicrate and prolongs the time period during which anoxiccells can retain essential metabolic functions. However,decreasing temperature also induce cell injury, which isattributed to alterations of calcium homeostasis, modifi-cations of cytoskeleton and local tissue destruction dueto proteases release (6–8). Following liver reperfusion, anordered sequence of inflammatory events is driven by ox-idant stress generated in Kupffer cells and hepatocytes(9–11). Production of reactive oxygen species (ROS), in-cluding superoxide, hydrogen peroxide and hydroxyl rad-icals has long been implicated in I/R injury. However,oxygen-independent factors, such as tissue pH changesare also important (12). Inflammatory responses (13,14)and microcirculatory disturbances (15) further aggravateinjury. Kupffer cells represent central source of mediatorscontributing to injury such as ROS, proinflammatory cy-tokines and chemokines. Together with activated comple-ment factors, these inflammatory mediators activate and
1221
Defamie et al.
recruit neutrophils into postischemic livers (16). This leadsto enhanced ROS production (17) and additional proteasesrelease (18). In addition, endothelin-1 (ET1)-mediated vaso-constriction of sinusoids promotes heterogeneous closureof microvessels, which in turn prolongs ischemia in certainareas of the liver (19). Most of these events culminate ineither necrosis or apoptosis, which often share featuresand mechanisms in ischemic livers (4).
The complexity of the I/R injury process and the limitedknowledge of the functional hierarchy among the manymolecules involved have thus rendered the identification ofmolecular targets suitable for therapeutic intervention verydifficult. Transcriptomic and proteomic approaches may ef-ficiently shed some light on this issue, by revealing withouta priori the major biological responses happening in com-plex systems. Only few recent studies have investigatedthe molecular effectors of liver injury associated with OLTusing one of these high-throughput technologies (20–23).
In this study, we report gene expression profiling data thatcharacterizes the early response of the grafts following abrain-dead donor OLT, that is, the most common procedurefor liver transplantation. We propose a small gene signatureable to discriminate livers with normal function from thoseexhibiting IPGF.
Materials and Methods
Patients and tissue collection
From March 2003 to July 2004, 21 consecutive patients undergoing OLTat the Service de Transplantation Hepatique, Archet 2, Centre HospitalierUniversitaire of Nice, were included in the study, according to standardcriteria. The OLT was performed as previously described (24). The mediantime of cold preservation was 575 min (range 225–710 min). Followingreperfusion, a biopsy (10 mm2) was obtained before abdominal closure.The median time between graft reperfusion and biopsy done was 45 min(range 15–105 min). The collected biopsy was split into three pieces. Onewas directly immerged in a solution of RNAlater® (Ambion Corporation,Austin, TX) and stored at −20◦C prior to RNA isolation, the second piecewas snap frozen in liquid nitrogen for protein preparation and the third waspreserved in 10% formalin for histological scoring. RNAs isolated from liverbiopsies from five patients undergoing tumor surgical resection and twocommercial RNA (Stratagene®) were used as control.
Donor demographics
Donors included 14 males and seven females. Causes of brain death in-cluded head injury caused by cerebrovascular (10 cases), road traffic acci-dents (seven cases) or other causes (three cases) and hypoxic brain injury(one case). Median age of the donor was 43 years (range 19–65). Serumaspartate amino transferase (AST) values were within normal range (10–39 IU/L) in all except donor 7 (AST of 135 IU/L) and donor 10 (AST of 171IU/L). Histology was normal in 13 donors, eight showed low to moderatefatty infiltration. The average preoperative serum levels of AST of the fivecontrol patients were 38.2 IU/L (range 22–64). Preoperative serum levelsof the prothrombin time were normal in all patients. Histological analysisof liver biopsies performed during surgical intervention showed no patho-logic findings in all cases. No clinical information was available for the twocommercial liver samples.
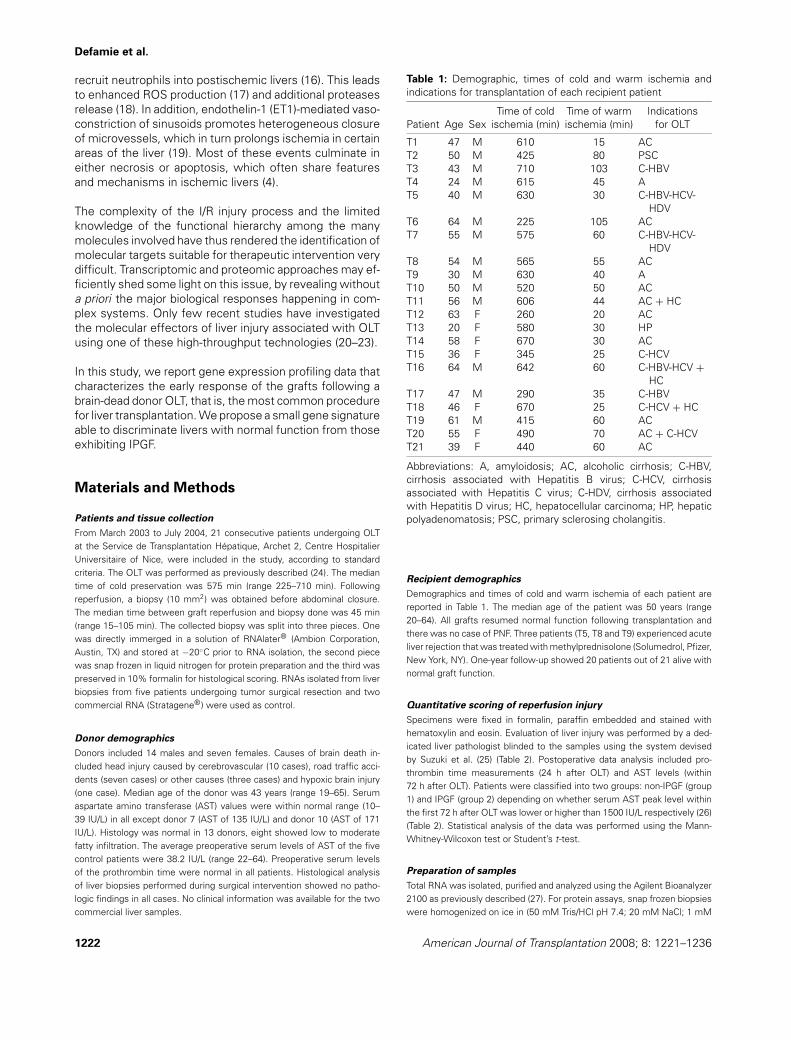
Table 1: Demographic, times of cold and warm ischemia andindications for transplantation of each recipient patient
Time of cold Time of warm IndicationsPatient Age Sex ischemia (min) ischemia (min) for OLT
T1 47 M 610 15 ACT2 50 M 425 80 PSCT3 43 M 710 103 C-HBVT4 24 M 615 45 AT5 40 M 630 30 C-HBV-HCV-
HDVT6 64 M 225 105 ACT7 55 M 575 60 C-HBV-HCV-
HDVT8 54 M 565 55 ACT9 30 M 630 40 AT10 50 M 520 50 ACT11 56 M 606 44 AC + HCT12 63 F 260 20 ACT13 20 F 580 30 HPT14 58 F 670 30 ACT15 36 F 345 25 C-HCVT16 64 M 642 60 C-HBV-HCV +
HCT17 47 M 290 35 C-HBVT18 46 F 670 25 C-HCV + HCT19 61 M 415 60 ACT20 55 F 490 70 AC + C-HCVT21 39 F 440 60 AC
Abbreviations: A, amyloidosis; AC, alcoholic cirrhosis; C-HBV,cirrhosis associated with Hepatitis B virus; C-HCV, cirrhosisassociated with Hepatitis C virus; C-HDV, cirrhosis associatedwith Hepatitis D virus; HC, hepatocellular carcinoma; HP, hepaticpolyadenomatosis; PSC, primary sclerosing cholangitis.
Recipient demographics
Demographics and times of cold and warm ischemia of each patient arereported in Table 1. The median age of the patient was 50 years (range20–64). All grafts resumed normal function following transplantation andthere was no case of PNF. Three patients (T5, T8 and T9) experienced acuteliver rejection that was treated with methylprednisolone (Solumedrol, Pfizer,New York, NY). One-year follow-up showed 20 patients out of 21 alive withnormal graft function.
Quantitative scoring of reperfusion injury
Specimens were fixed in formalin, paraffin embedded and stained withhematoxylin and eosin. Evaluation of liver injury was performed by a ded-icated liver pathologist blinded to the samples using the system devisedby Suzuki et al. (25) (Table 2). Postoperative data analysis included pro-thrombin time measurements (24 h after OLT) and AST levels (within72 h after OLT). Patients were classified into two groups: non-IPGF (group1) and IPGF (group 2) depending on whether serum AST peak level withinthe first 72 h after OLT was lower or higher than 1500 IU/L respectively (26)(Table 2). Statistical analysis of the data was performed using the Mann-Whitney-Wilcoxon test or Student’s t-test.
Preparation of samples
Total RNA was isolated, purified and analyzed using the Agilent Bioanalyzer2100 as previously described (27). For protein assays, snap frozen biopsieswere homogenized on ice in (50 mM Tris/HCl pH 7.4; 20 mM NaCl; 1 mM
1222 American Journal of Transplantation 2008; 8: 1221–1236

Transcriptome Investigation of Liver Graft Injury
Table 2: Quantitative scoring of reperfusion injury
Necrosis (hepatocyte Inflammation Sinusoidal Histological Prothrombin time AST peakPatients Steatosis ballooning) (granulocytic infiltration) congestion score at 24h (%) (IU/L)
Group 1 T2 0 0 0 0 0 − 48 858T4 0 0 1 0 1 − 50 515T5 0 1 0 1 2 −/+ 44 999T6 1 1 1 0 2 −/+ 41 184T8 1 1 1 0 2 −/+ 51 574
T10 0 1 3 1 5 + 73 336T12 1 1 3 1 5 ++ 25 630T13 0 1 1 1 3 −/+ 70 394T14 2 1 2 2 5 ++ 60 333T15 2 0 0 1 1 −/+ 75 306T16 0 1 2 1 4 + 43 659T17 0 1 1 2 4 + 52 1290T19 0 1 0 1 2 −/+ 43 435T20 1 1 1 1 3 + 26 1304
Group 2 T1 2 1 3 1 5 ++ 38 2304T3 2 1 3 1 5 ++ 18 5788T7 1 1 1 1 3 + 37 3539T9 0 1 2 1 4 + 49 2271
T11 2 1 3 1 5 ++ 39 1676T18 1 1 1 1 3 + 60 2037T21 2 1 2 1 4 ++ 46 1805
PMSF; 2 lg/mL aprotinin, 10 lg/mL leupeptin) using a Polytron homoge-nizer.
Microarray analysis
Pangenomic microarrays were printed using human RNG/MRC oligonu-cleotide collection (25 299 distinct probes) as previously described (28)(http://www.microarray.fr/). Experimental data and associated microarraydesigns have been deposited in the NBCI Gene Expression Omnibus(GEO) (http://www.ncbi.nlm.nih.gov/geo/) under serie GSE7706 and plat-form record GPL 1456. All calculations were performed with the followingpackages of the Bioconductor suite of statistical packages (29): limma (30),topGO (31), randomForest (32), pamr (33).
Differential gene expression analysis. While the experiments were per-formed with dual labeling, we decided to build the data sets based on thesignal in the Cy3 channel, in order to limit the dye bias (34). Background wasevaluated according to Kooperberg et al. (35), then normalized by the Gquan-tile method available in the limma package. All normalized data sets wereregistered in the GEO data base under the accession number GSE7706. Theaveraged normalized signal was calculated for each gene for transplantedand control groups. Differentially expressed genes were selected using aBenjamini-Hochberg correction of the p-value for multiple tests, based ona p-value below 0.001.
Prediction analysis. Prediction analysis was performed using Random For-est (32). A 20-fold cross validation approach was carried out on balancedsamplings of the groups. Prediction accuracy was slightly improved by adimensionality reduction strategy of the training sets in order to performthe random forest on probes found differentially expressed between group1 and group 2 (Benjamini-Hochberg corrected p-value p < 0.03). Predictionscore was based on results obtained for the test sets, and only for them. Assimilar results were obtained with prediction analysis for microarrays (PAM)(33), we only show results obtained with the random forest approach. Fi-nal selection of the most informative genes within the predictor set (371genes) was performed using a Student’s t-test in order to pick up genes
with the most impact on classification. Unsupervised hierarchical cluster-ing was performed with the MeV (v.3) software in order to visualize theresults.
Biological theme analysis
The expression analysis systematic explorer (EASE) program, available athttp://david.abcc.ncifcrf.gov/ease/ease.jsp (36) was used to classify genesusing the gene ontology molecular function and biological process providedby NCBI (37).
Enzyme activity assays
Twenty micrograms of protein were incubated at 37◦C in 100 lL of reactioncontaining 20 lM fluorogenic substrates (DEVD-AMC for caspase-3, MCA-PLGL-Dpa-ARNH2 for MMP or MCA-PLAQAV-Dpa-RSSSR-NH2 for TACE)as previously described (38). Activities were measured in absence or pres-ence of selective inhibitors (DEVD-CHO for caspase-3, RXPO3 for MMPand TAPI-1 for TACE). To determine specific activities, absorbance value ofthe inhibited sample was subtracted from that of the non inhibited sample.Data are given as means ± standard error of the mean (SEM). The datawere compared using the Student’s t-test, a p-value < 0.05 was acceptedas statistically significant.
Results
Grading of I/R injury
Histological evaluation of the specimen after transplan-tation showed some abnormalities compared to controllivers and particularly a significant PMN infiltration ob-served in nine cases (Table 2). A high level of transam-inases within the first postoperative days after OLT hasbeen often used as an appropriate criterion for IPGF eval-uation (26,39,40). Accordingly, we classified the patientsinto two groups: non-IPGF (group 1, 14 patients) and IPGF
American Journal of Transplantation 2008; 8: 1221–1236 1223

Defamie et al.
Figure 1: Comparison of clinical data in
IPGF and in non-IPGF groups. A. Multi-ple correlation analysis of the main clinicalrecords. The bottom left triangle containsthe different plots, while the top right indi-cates Pearson’s correlation coefficient forthe symmetric pair of parameters. Group1 (non-IPGF): white spot; group 2 (IPGF):black triangle B. Box plot representationof the clinical data in patients belonging togroup 1 (non-IPGF) and in patients belong-ing to group 2 (IPGF). P-value is showninto each sub-title. The histological scorecounts the number of patients categorizedinto the groups (−), (+/−), (+), (++), as ex-plained in Table 2.
(group 2, seven patients) depending on whether serumAST peak level within the first 3 days after OLT waslower or higher than 1500 IU/L respectively. Figure 1 de-tails the correlation between age of the donors, surgi-
cal records (time of cold and warm ischemia) and labo-ratory data (histological score, AST levels and prothrombintime measurements). The AST level was found to be posi-tively correlated with the time of cold ischemia (R = 0.45),
1224 American Journal of Transplantation 2008; 8: 1221–1236

Transcriptome Investigation of Liver Graft Injury
Figure 2: Caspase-3, MMP and TACE activities in samples
from control and transplanted livers. Samples of liver lysatesfrom control (white, n = 3) and transplanted livers: group 1 (non-IPGF, n = 14) or group 2 (IPGF, n = 6) were analyzed for caspase-3(panel A), global MMP (panel B) and TACE (panel C) activities us-ing selective fluorogenic substrates as described in the materialsand method section. Results are expressed as mean ± S.E.M. ∗indicates a p-value of less than 0.05 in a Student’s t- test.
the histological score (R = 0.38) and inversely correlatedwith the prothrombin time measurements (R = −0.54) (Fig-ure 1A). Moreover, the histological score was significantlygreater in patients from group 2 versus group 1 (p = 0.002)while the prothrombin time values were lower in group 1compared to group 2 (but nonsignificant, p = 0.143) (Fig-ure 1B). Altogether, these data indicate that the AST-basedclassification fits well with the histological evaluation andto a lesser extent with liver function.
Caspase-3 and TACE activities are detected at higher
levels in liver extracts associated with IPGF
Since the expression and/or processing of several pro-teases related to inflammation, apoptosis and ECM degra-dation have been shown to be modulated following liverI/R injury (8,41,42), we measured the activity of caspases,MMPs and ADAMs using selective fluorogenic substratesand inhibitors in protein samples from control, group 1 andgroup 2. An increase in caspase-3 activity was detectedin transplanted livers from patients with IPGF (group 2)(Figure 2A) whereas no difference was observed withselective substrates for caspase-8 and caspase-9 (datanot shown). In addition, the global MMP activity using abroad range specific substrate was similar in the threegroups (Figure 2B). Interestingly, the activity of the TNFa-converting enzyme (TACE, ADAM17) was gradually in-creased from control to group 2 liver samples (Figure 2C).Overall, these data confirm the inflammatory and apoptoticstatus of livers from group 2 patients.
Changes in liver transcriptome profile after I/R injury
Gene expression profiling of 21 human liver transplant biop-sies and seven control livers was performed with long-oligonucleotide microarrays (28). Using the empirical Bayesapproach defined in the limma package from bioconduc-tor, a first list of 150 significantly modulated genes wasestablished, which discriminated control and transplantedlivers. We wondered then whether supervised classifica-tion would be valid ad hoc approach to discriminate con-trol and transplanted livers. Using cross-validation meth-ods, it was possible to assess in test groups the robust-ness of classifiers defined in training groups. Classifica-tion was either assessed using random forest or PAM.Both algorithms led to identical results, with a predic-tion accuracy equal to 93% (data not shown). One con-trol (control 4) and one transplanted (T12) livers were con-sistently misclassified. In order to improve our list of dif-ferentially expressed genes, we then performed a sec-ond limma analysis on the 26 correctly classified samples,which led to a final list of 371 genes (204 up-regulated and167 down-regulated). This list defines the genes that aredifferentially expressed between transplanted and controllivers (Table 3 and Table S1). Functional annotations withthe EASE program (36) associated with our informationsystem ‘Mediante’ (43) were used to identify importantbiological themes over-represented among that list.Table 4 summarizes the most significant themes that
American Journal of Transplantation 2008; 8: 1221–1236 1225

Defamie et al.
Table 3: List of the 50 most differentially expressed genes between transplanted and control livers
Unigene ID RNG ID Symbol Name A M log2(ratio) p-Value
Hs.1955 42668 SAA2 Serum amyloid A2 (SAA2) 14.32 3.02 3.75E-23Hs.407856 97933 SPINK1 Serine peptidase inhibitor, Kazal type 1
(SPINK1)13.27 4.75 1.96E-18
Hs.487046 153524 #NA;SOD2 Superoxide dismutase 2, mitochondrial(SOD2), nuclear gene encodingmitochondrial protein, transcriptvariant 3
15.25 1.26 5.53E-17
Hs.322452 146205 #NA Unknown mRNA, partial sequence, 14.71 −1.87 1.78E-13Hs.76452 86803 CRP C-reactive protein, pentraxin-related
(CRP)13.41 3.73 3.42E-13
Hs.632144 86489 SAA1 Serum amyloid A1 (SAA1), transcriptvariant 1
13.23 3.48 6.14E-12
Hs.374503 129602 MORF4L1 Mortality factor 4 like 1 (MORF4L1),transcript variant 2
8.77 4.85 1.08E-11
Hs.368592 100758 #NA zv90f03,s1 Soares NhHMPu S1 cDNAclone IMAGE:767069 3′, mRNAsequence
12.80 −1.51 2.54E-11
Hs.336994 26070 MTSS1 Metastasis suppressor 1 (MTSS1) 13.14 −1.12 3.19E-11Hs.584916 28316 RNF43 Ring finger protein 43 (RNF43) 9.52 −2.06 3.79E-11Hs.2795 12620 LDHA Lactate dehydrogenase A (LDHA) 15.19 0.96 7.90E-11Hs.200938 78560 LOC492311 Similar to bovine IgA regulatory protein
(LOC492311)9.02 −1.55 8.07E-11
Hs.317192 29144 DNAJB11 DnaJ (Hsp40) homolog, subfamily B,member 11 (DNAJB11)
11.17 1.80 8.19E-11
Hs.537144 61434 SGMS2 Sphingomyelin synthase 2 (SGMS2) 9.30 1.72 8.81E-11Hs.444488 17542 SPP2 Secreted phosphoprotein 2, 24kDa
(SPP2)12.08 −3.15 1.84E-10
Hs.591095 9168 PDIA3 Protein disulfide isomerase family A,member 3 (PDIA3)
13.28 1.53 2.34E-10
Hs.75231Hs.571886Hs.6980
19633 AFARP1AKR7A2AKR7A3
Aldo-keto reductase family 7, member A3(aflatoxin aldehyde reductase) (AKR7A3)
12.44 −1.44 2.71E-10
Hs.296031 160050 #NA cDNA clone IMAGE:5262734, 8.69 −1.24 3.66E-10Hs.632687 142062 HSPA5 Heat shock 70kDa protein 5
(glucose-regulated protein, 78kDa)(HSPA5)
15.11 1.03 5.52E-10
Hs.75498 8163 CCL20 Chemokine (C-C motif) ligand 20(CCL20)
10.74 3.28 5.61E-10
Hs.436446 10044 ARMET Arginine-rich, mutated in early stagetumors (ARMET)
12.33 1.81 8.57E-10
Hs.188882 14086 NUDT3 Nudix (nucleoside diphosphate linkedmoiety X)-type motif 3 (NUDT3)
9.31 1.47 9.21E-10
Hs.278839 40298 C20orf77 Chromosome 20 open reading frame 77(C20orf77)
9.34 1.85 1.28E-09
Hs.524496 38562 C1orf113 Chromosome 1 open reading frame 113(C1orf113)
10.28 2.43 1.68E-09
Hs.590868 48457 ZGPAT Zinc finger, CCCH-type with G patchdomain (ZGPAT), transcript variant 4
9.76 −2.54 1.92E-09
Hs.515951 25257 SH3YL1 SH3 domain containing, Ysc84-like 1 (S.cerevisiae) (SH3YL1)
10.26 −0.85 2.15E-09
Hs.21765 40441 FADS3 Fatty acid desaturase 3 (FADS3) 8.93 1.19 2.42E-09162707 C1orf130 Chromosome 1 open reading frame 130
(C1orf130)8.24 −1.81 2.64E-09
Hs.505146 56933 CLDN14 Claudin 14 (CLDN14), transcript variant 2 10.82 −1.55 2.90E-09Hs.55016 41111 EPS8L2 EPS8-like 2 (EPS8L2) 9.33 1.16 3.14E-09Hs.527061 97685 RGS12 Regulator of G-protein signaling 12
(RGS12), transcript variant 29.47 1.75 3.38E-09
Hs.356368 27751 HAO2 Hydroxyacid oxidase 2 (long chain)(HAO2), transcript variant 1
11.94 −1.84 3.72E-09
Continued
1226 American Journal of Transplantation 2008; 8: 1221–1236

Transcriptome Investigation of Liver Graft Injury
Table 3: Continued
Unigene ID RNG ID Symbol Name A M log2(ratio) p-Value
Hs.277704 15261 HYOU1 Hypoxia up-regulated 1 (HYOU1) 9.65 1.49 4.63E-09Hs.594688 8347 DDX21 DEAD (Asp-Glu-Ala-Asp) box
polypeptide 21 (DDX21)11.95 1.70 4.83E-09
54416 MGC4473 Hypothetical protein MGC4473(MGC4473)
9.63 1.12 4.95E-09
Hs.128316 73482 #NA cDNA FLJ39287 fis, cloneOCBBF2011897
12.29 1.48 5.28E-09
Hs.144073 77395 QSOX2 Quiescin Q6 sulfhydryl oxidase 2(QSOX2)
8.22 0.82 5.74E-09
Hs.518808 90718 AFP Alpha-fetoprotein (AFP) 9.91 −1.56 5.88E-09Hs.503911 16511 NNMT Nicotinamide N-methyltransferase
(NNMT)15.41 0.83 6.75E-09
Hs.534494 110217 AMN Amnionless homolog (mouse) (AMN) 8.35 −0.86 7.53E-09Hs.91521 75558 #NA Genomic DNA; cDNA DKFZp761M1511
(from clone DKFZp761M1511)8.76 −1.48 1.53E-08
Hs.546452 44746 ANGPTL6 Angiopoietin-like 6 (ANGPTL6) 9.69 −0.68 1.62E-08Hs.509736 17990 HSP90AB1 Heat shock protein 90kDa alpha
(cytosolic), class B member 1(HSP90AB1)
15.23 0.83 1.67E-08
Hs.135411 49905 ARPM1 Actin related protein M1 (ARPM1) 8.21 1.69 1.70E-08Hs.482873 27172 TMED5 Transmembrane emp24 protein
transport domain containing 5(TMED5)
12.16 1.02 1.75E-08
Hs.513457 88206 IL4R Interleukin 4 receptor (IL4R), transcriptvariant 1
10.82 1.19 1.76E-08
Hs.179080 54335 SLC32A1 solute carrier family 32 (GABA vesiculartransporter), member 1 (SLC32A1)
9.85 1.26 1.86E-08
Hs.503709 133876 TMEM123 Transmembrane protein 123 (TMEM123) 10.90 1.00 2.03E-08Hs.535274 172650 KCND3 Potassium voltage-gated channel,
Shal-related subfamily, member 3(KCND3), transcript variant 2
9.29 1.07 2.44E-08
Hs.192316 49262 CDC2L1;CDC2L2
Cell division cycle 2-like 1 (PITSLREproteins) (CDC2L1), transcript variant6
8.31 0.87 2.58E-08
Genes were ranked according to the statistical p-values obtained using the limma package from bioconductor. A corresponds tothe logarithm (base 2) of the average fluorescence intensity for each probe. M corresponds to the logarithm (base 2) of the ratioof Transplanted/Control. All genes from the list displayed significant false discovery rate p-values using the Benjamini-Hochbergcorrection (p < 0.001). RNG oligo IDs give access to transcripts and probes annotations through our microarray system Mediante(http://www.microarray.fr). #NA, not annotated.
were identified using this analysis (Fisher test probability<0.05; full list of significantly over-represented themes inTable S2). These themes were essentially linked to livermetabolism, inflammatory response, cell proliferation andresponse to stress.
Global down-regulation of the genes associated with livermetabolism indicates that physiological functions of liverwere inhibited after cold ischemia and warm reperfusion(Table 4). Indeed, we found a diminution of expression intranscripts related to the oxidoreductase group, in line witha down regulation of many cytochromes.
Inversely, many genes implicated in inflammatory pro-cess were up-regulated in transplanted livers. Acute phaseresponse genes such as LPS-binding protein (LBP), C-reactive protein (CRP), serum amyloıd proteins (SAA1,
SAA2) were highly expressed in transplanted samples. Thiswas also the case for Toll like receptor TLR10, the cytopro-tective interleukin IL-11, IL-4 receptor (IL4R) and the pro-inflammatory chemokine CCL20 (MIP3A), as well as othergenes commonly up-regulated in infectious and traumaticconditions.
Several genes that were over-expressed in transplantedlivers encode factors involved in cell response to oxida-tive stress-mediated injury, such as superoxide dismutase2 (SOD2) and glutathione peroxidase 2 (GPX2). A largeproportion of up-regulated genes were coding for heatshock proteins, which play a protective role against mul-tiple stresses including oxidative stress: Hsp40 (DNAJC6and DNAJB11), Hsp70-4 (HSPA4), and Hsp90 (HSP90AB1).Additional up-regulation of endoplasmic reticulum (ER)resident chaperones GRP58, GRP78 (HSPA5) and HYOU1
American Journal of Transplantation 2008; 8: 1221–1236 1227

Defamie et al.
Table 4: GO data base functional analysis of the 371 genes regulated in response to OLT
Gene Ontology categories Up Down Total on chip Fisher probability
Biological process Acute-phase response 5 0 20 2.08 10−5
Immune response 12 15 685 7.57 10−5
Lipid metabolism 4 17 498 2.03 10−4
Carboxylic acid metabolism 8 9 405 8.74 10−4
Regulation of cell cycle 11 5 373 9.87 10−4
Catecholamine metabolism 1 2 13 1.38 10−3
Response to stress 14 11 759 1.97 10−3
Inflammatory response 7 2 177 4.28 10−3
Amino acid and derivative metabolism 8 4 291 5.71 10−3
Folic acid and derivative metabolism 0 2 7 6.20 10−3
Pyrimidine nucleotide metabolism 3 0 24 8.45 10−3
Regulation of cell growth 4 1 74 1. 10−2
JAK-STAT cascade 3 0 26 1.06 10−2
Molecular function Oxidoreductase activity, acting on the 0 2 4 1.90 10−3
Transferase activity,transferring glycosyl groups 4 5 163 2.81 10−3
Class II major histocompatibilty 0 2 5 3.13 10−3
Sulfotransferase activity 1 3 35 3.49 10−3
Glutathione transferase activity 0 3 19 4.55 10−3
Cysteine protease inhibitor activity 1 2 22 6.95 10−3
Chaperone activity 8 0 157 7.64 10−3
Electron transporter activity 6 6 302 8.76 10−3
Most significant themes identified by EASE analysis. The number of genes down- and up-regulated between transplanted and controlsamples and the total number of genes on chip are represented. The probability to obtain the number of genes in a certain pathway inthe list of our differentially expressed genes (both up and down-regulated) was compared with the representation of the same pathwayamong all the genes on the microarray and was calculated as a Fisher’s exact probability.
(ORP150/GRP170) is likely to correspond to the ERadaptive response named the ‘unfolded protein response’(UPR) that aims to limit the accumulation of newly syn-thesized proteins in the ER lumen (44). In parallel, wealso found deregulation of several factors known to regu-late translation (EIF2S1, EIF2S2, EIF4A2, EIF4EBP2, TARS,GARS) that could be linked with alterations in protein syn-thesis.
Several modulated genes were associated with the regu-lation of cell growth and/or cell cycle. This was the case forthe cyclin-dependent kinase 6 (CDK6) that is important forcell cycle G1 phase progression and G1/S transition, thecyclin-dependent inhibitor Kip2 (CDKN1C) and the tumor-suppressor PTEN. Altogether, this suggests an importantregulatory role of these proteins in hepatocyte cell cycleprogression during liver regeneration.
Prediction analysis of IPGF
The same approach using prediction learning methods wasthen used to test whether an early modification of a setof genes immediately after surgery would be able to pre-dict IPGF, revealed later on by a raise in the serum ASTlevel during the first three postoperative days. RF mod-els were trained on training sets, limited to those genesfound positive during ‘limma’ analysis. The models werethen used to predict the status of the samples remainingin the test set. This approach was repeated 20 times inorder to cross-validate the results and reduce bias due to
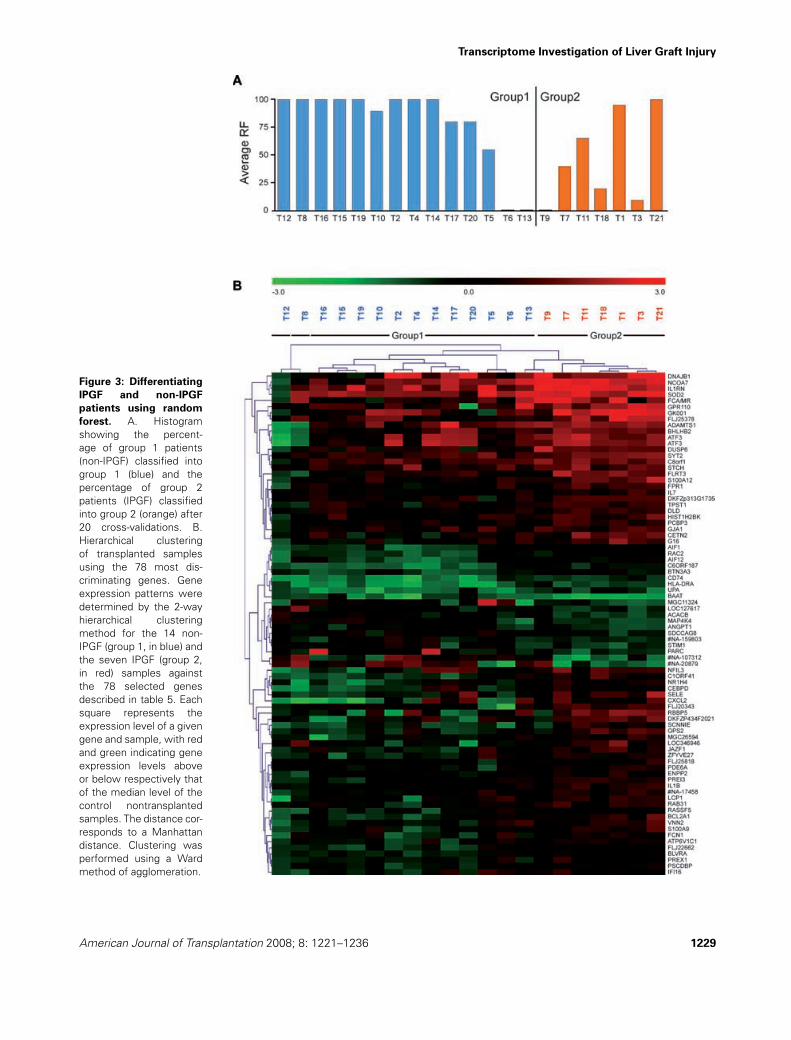
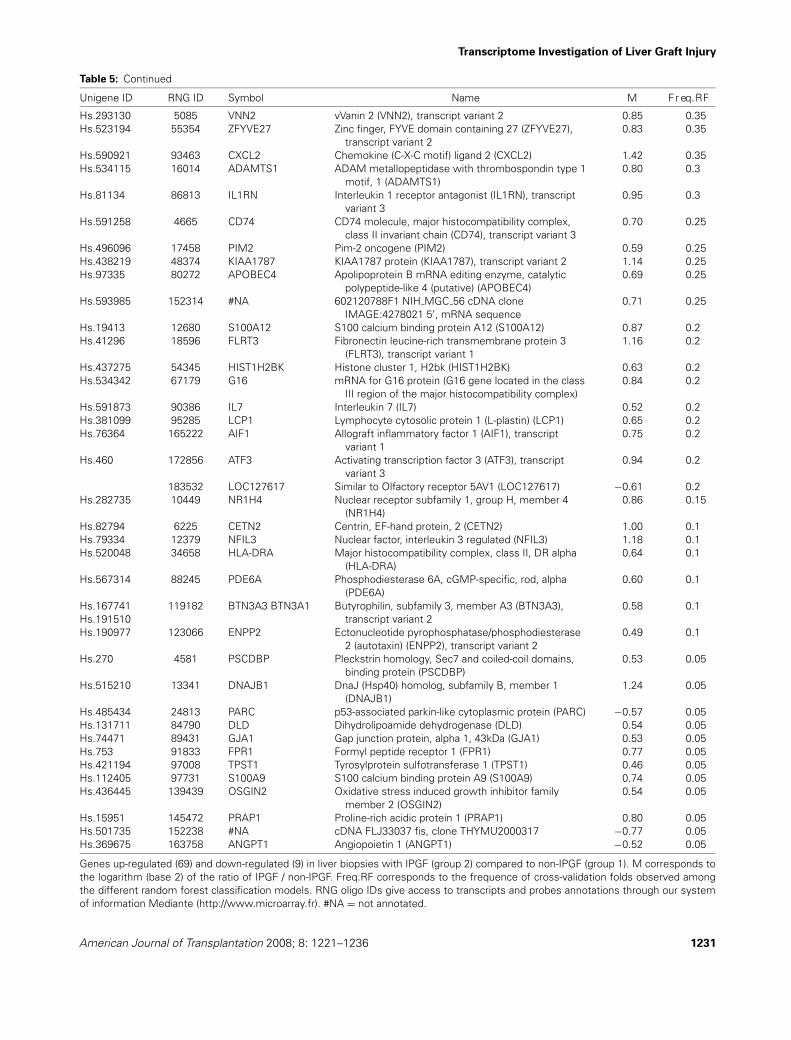
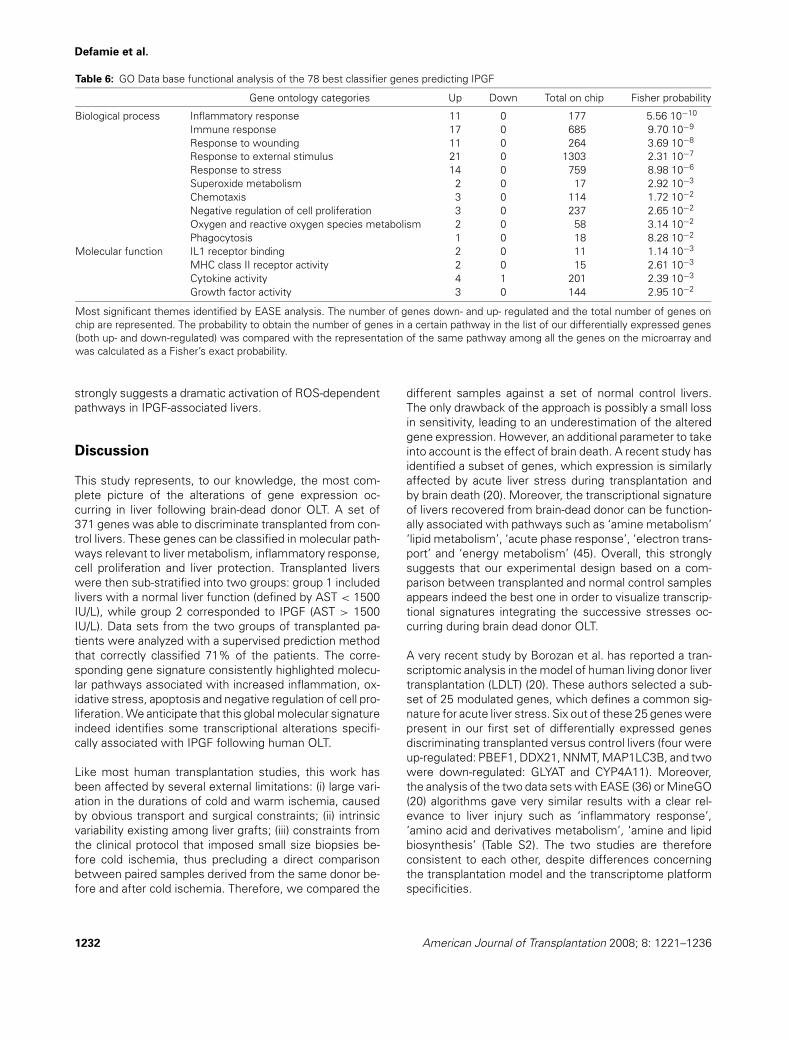
overfitting. Overall, a prediction accuracy of 71% (12/14in group 1 and 3/7 from group 2) was found (Figure 3A).Similar results were obtained with PAM algorithm (datanot shown). From an initial selection of 371 genes corre-sponding to those used in at least one RF model, we thenpicked up the most discriminating genes between group1 and group 2, based on a Student’s t-test below 0.02.Seventy-eight genes were selected, 88% of them beingexpressed at higher levels in the IPGF samples comparedto the non-IPGF samples (Table 5). Nonsupervised hierar-chical clustering of the samples using this gene expressionpattern was performed in order to visualize the expres-sion profiles of these genes across the different conditions(Figure 3B). This suggests the existence of a gene expres-sion pattern specific to IPGF samples. Moreover, usingEASE program (36) combined with Mediante (43), func-tional annotation of this set of 78 genes was associatedwith terms such as ‘inflammatory response’, ‘immune re-sponse’, ‘response to stress’, ‘superoxide metabolism’and ‘negative regulation of cell proliferation’ (Table 6).
One of the most significant signature corresponded tothe global up-regulation of inflammatory gene expressionin livers from IPGF samples (group 2) with the presenceof allograft inflammatory factor 1 (AIF1), two S100 fam-ily proteins, IL1 and its receptor antagonist (IL1RN), thechemokine MIP2 (CXCL2), the selectin E (SELE) and theformyl peptide receptor (FPR1). Moreover, the modulationof factors related to oxidative stress (SOD2, PREX1, RAC2)
1228 American Journal of Transplantation 2008; 8: 1221–1236
Transcriptome Investigation of Liver Graft Injury
Figure 3: Differentiating
IPGF and non-IPGF
patients using random
forest. A. Histogramshowing the percent-age of group 1 patients(non-IPGF) classified intogroup 1 (blue) and thepercentage of group 2patients (IPGF) classifiedinto group 2 (orange) after20 cross-validations. B.Hierarchical clusteringof transplanted samplesusing the 78 most dis-criminating genes. Geneexpression patterns weredetermined by the 2-wayhierarchical clusteringmethod for the 14 non-IPGF (group 1, in blue) andthe seven IPGF (group 2,in red) samples againstthe 78 selected genesdescribed in table 5. Eachsquare represents theexpression level of a givengene and sample, with redand green indicating geneexpression levels aboveor below respectively thatof the median level of thecontrol nontransplantedsamples. The distance cor-responds to a Manhattandistance. Clustering wasperformed using a Wardmethod of agglomeration.
American Journal of Transplantation 2008; 8: 1221–1236 1229

Defamie et al.
Table 5: List of the best 78 classifier genes predicting IPGF
Unigene ID RNG ID Symbol Name M Fr eq.RF
Hs.227817 7427 BCL2A1 BCL2-related protein A1 (BCL2A1) 1.06 1Hs.440829 10543 CEBPD CCAAT/enhancer binding protein (C/EBP), delta
(CEBPD)0.98 1
Hs.153310 33693 PREX1 Phosphatidylinositol 3,4,5-trisphosphate-dependentRAC exchanger 1 (PREX1)
0.67 1
Hs.171426 73164 NCOA7 Nuclear receptor coactivator 7 (NCOA7) 1.07 1Hs.284712 91419 BAAT Bile acid Coenzyme A: amino acid N-acyltransferase
(glycine N-choloyltransferase) (BAAT)−0.81 1
Hs.585051 138984 ARSK Arylsulfatase family, member K (ARSK) 0.62 1Hs.381220 151167 FAM26F Family with sequence similarity 26, member F
(FAM26F)0.80 1
Hs.76364 164153 AIF1 Allograft inflammatory factor 1 (AIF1), transcriptvariant 3
0.66 1
Hs.368944 74353 JAZF1 JAZF zinc finger 1 (JAZF1) 1.00 0.95Hs.591530 83625 SDCCAG8 Serologically defined colon cancer antigen 8
(SDCCAG8)−0.60 0.95
Hs.89546 86664 SELE Selectin E (endothelial adhesion molecule 1) (SELE) 1.31 0.95Hs.202011 36443 CCDC47 Coiled-coil domain containing 47 (CCDC47) 1.59 0.9Hs.152670 141537 EFCAB3 EF-hand calcium binding domain 3 (EFCAB3) 0.44 0.9Hs.352341 17552 STCH Stress 70 protein chaperone, microsome-associated,
60kDa (STCH)0.64 0.85
Hs.487046 86908 SOD2 Superoxide dismutase 2, mitochondrial (SOD2),nuclear gene encoding mitochondrial protein,transcript variant 3
0.69 0.85
Hs.145519 46477 FCAMR Fc receptor, IgA, IgM, high affinity (FCAMR) 1.57 0.8Hs.414614 52157 SCNN1B Epithelial sodium channel beta subunit (SCNN1B)
mRNA, partial cds1.08 0.8
Hs.488143 90146 BLVRA Biliverdin reductase A (BLVRA) 0.57 0.8Hs.298654 101364 DUSP6 Dual specificity phosphatase 6 (DUSP6), transcript
variant 10.85 0.8
Hs.440898 94887 FCN1 Ficolin (collagen/fibrinogen domain containing) 1(FCN1)
0.80 0.75
Hs.591288 107318 #NA yz81e09,s1 Soares multiple sclerosis 2NbHMSPcDNA clone IMAGE:289480 3′, mRNA sequence
1.24 0.75
Hs.583755 158282 #NA cDNA FLJ31059 fis, clone HSYRA2000832, 0.82 0.75Hs.99196 50147 MAG1 Lung cancer metastasis-associated protein (MAG1) −0.99 0.7Hs.86905 134784 ATP6V1C1 ATPase, H+ transporting, lysosomal 42kDa, V1
subunit C1 (ATP6V1C1)0.77 0.7
60068 FLJ25378 Hypothetical protein FLJ25378 (FLJ25378) 1.14 0.65Hs.1197 117447 MOBKL3 MOB1, Mps One Binder kinase activator-like 3 (yeast)
(MOBKL3), transcript variant 10.61 0.65
Hs.519230 10350 RBBP5 Retinoblastoma binding protein 5 (RBBP5) 1.52 0.6Hs.99528 14328 RAB31 RAB31, member RAS oncogene family (RAB31) 0.66 0.6Hs.497579 46203 RASSF5 Ras association (RalGDS/AF-6) domain family 5
(RASSF5), transcript variant 30.55 0.6
Hs.256897 63800 GPR110 G protein-coupled receptor 110 (GPR110), transcriptvariant 1
1.08 0.6
Hs.126256 88435 IL1B Interleukin 1, beta (IL1B) 0.68 0.6Hs.517601 97600 RAC2 Ras-related C3 botulinum toxin substrate 2 (rho family,
small GTP binding protein Rac2) (RAC2)0.63 0.55
Hs.171825 5425 BHLHB2 Basic helix-loop-helix domain containing, class B, 2(BHLHB2)
0.95 0.5
Hs.153648Hs.585015
69861 PPFIA4 SYT2 cDNA FLJ37111 fis, clone BRACE2021254, highly sim-ilar to SYNAPTOTAGMIN II
0.64 0.5
Hs.234898 90657 ACACB Acetyl-Coenzyme A carboxylase beta (ACACB) −0.76 0.5Hs.431550 154988 #NA Full length insert cDNA YR35E08, −0.80 0.5Hs.474049 36672 PCBP3 Poly(rC) binding protein 3 (PCBP3) 0.53 0.45Hs.380250 11036 IFI16 Interferon, gamma-inducible protein 16 (IFI16) 0.61 0.4Hs.525462 27278 C1orf41 Chromosome 1 open reading frame 41 (C1orf41) 1.02 0.4Hs.131933 43620 FLJ22662 Hypothetical protein FLJ22662 (FLJ22662) 0.67 0.4
Continued
1230 American Journal of Transplantation 2008; 8: 1221–1236
Transcriptome Investigation of Liver Graft Injury
Table 5: Continued
Unigene ID RNG ID Symbol Name M Fr eq.RF
Hs.293130 5085 VNN2 vVanin 2 (VNN2), transcript variant 2 0.85 0.35Hs.523194 55354 ZFYVE27 Zinc finger, FYVE domain containing 27 (ZFYVE27),
transcript variant 20.83 0.35
Hs.590921 93463 CXCL2 Chemokine (C-X-C motif) ligand 2 (CXCL2) 1.42 0.35Hs.534115 16014 ADAMTS1 ADAM metallopeptidase with thrombospondin type 1
motif, 1 (ADAMTS1)0.80 0.3
Hs.81134 86813 IL1RN Interleukin 1 receptor antagonist (IL1RN), transcriptvariant 3
0.95 0.3
Hs.591258 4665 CD74 CD74 molecule, major histocompatibility complex,class II invariant chain (CD74), transcript variant 3
0.70 0.25
Hs.496096 17458 PIM2 Pim-2 oncogene (PIM2) 0.59 0.25Hs.438219 48374 KIAA1787 KIAA1787 protein (KIAA1787), transcript variant 2 1.14 0.25Hs.97335 80272 APOBEC4 Apolipoprotein B mRNA editing enzyme, catalytic
polypeptide-like 4 (putative) (APOBEC4)0.69 0.25
Hs.593985 152314 #NA 602120788F1 NIH MGC 56 cDNA cloneIMAGE:4278021 5′, mRNA sequence
0.71 0.25
Hs.19413 12680 S100A12 S100 calcium binding protein A12 (S100A12) 0.87 0.2Hs.41296 18596 FLRT3 Fibronectin leucine-rich transmembrane protein 3
(FLRT3), transcript variant 11.16 0.2
Hs.437275 54345 HIST1H2BK Histone cluster 1, H2bk (HIST1H2BK) 0.63 0.2Hs.534342 67179 G16 mRNA for G16 protein (G16 gene located in the class
III region of the major histocompatibility complex)0.84 0.2
Hs.591873 90386 IL7 Interleukin 7 (IL7) 0.52 0.2Hs.381099 95285 LCP1 Lymphocyte cytosolic protein 1 (L-plastin) (LCP1) 0.65 0.2Hs.76364 165222 AIF1 Allograft inflammatory factor 1 (AIF1), transcript
variant 10.75 0.2
Hs.460 172856 ATF3 Activating transcription factor 3 (ATF3), transcriptvariant 3
0.94 0.2
183532 LOC127617 Similar to Olfactory receptor 5AV1 (LOC127617) −0.61 0.2Hs.282735 10449 NR1H4 Nuclear receptor subfamily 1, group H, member 4
(NR1H4)0.86 0.15
Hs.82794 6225 CETN2 Centrin, EF-hand protein, 2 (CETN2) 1.00 0.1Hs.79334 12379 NFIL3 Nuclear factor, interleukin 3 regulated (NFIL3) 1.18 0.1Hs.520048 34658 HLA-DRA Major histocompatibility complex, class II, DR alpha
(HLA-DRA)0.64 0.1
Hs.567314 88245 PDE6A Phosphodiesterase 6A, cGMP-specific, rod, alpha(PDE6A)
0.60 0.1
Hs.167741Hs.191510
119182 BTN3A3 BTN3A1 Butyrophilin, subfamily 3, member A3 (BTN3A3),transcript variant 2
0.58 0.1
Hs.190977 123066 ENPP2 Ectonucleotide pyrophosphatase/phosphodiesterase2 (autotaxin) (ENPP2), transcript variant 2
0.49 0.1
Hs.270 4581 PSCDBP Pleckstrin homology, Sec7 and coiled-coil domains,binding protein (PSCDBP)
0.53 0.05
Hs.515210 13341 DNAJB1 DnaJ (Hsp40) homolog, subfamily B, member 1(DNAJB1)
1.24 0.05
Hs.485434 24813 PARC p53-associated parkin-like cytoplasmic protein (PARC) −0.57 0.05Hs.131711 84790 DLD Dihydrolipoamide dehydrogenase (DLD) 0.54 0.05Hs.74471 89431 GJA1 Gap junction protein, alpha 1, 43kDa (GJA1) 0.53 0.05Hs.753 91833 FPR1 Formyl peptide receptor 1 (FPR1) 0.77 0.05Hs.421194 97008 TPST1 Tyrosylprotein sulfotransferase 1 (TPST1) 0.46 0.05Hs.112405 97731 S100A9 S100 calcium binding protein A9 (S100A9) 0.74 0.05Hs.436445 139439 OSGIN2 Oxidative stress induced growth inhibitor family
member 2 (OSGIN2)0.54 0.05
Hs.15951 145472 PRAP1 Proline-rich acidic protein 1 (PRAP1) 0.80 0.05Hs.501735 152238 #NA cDNA FLJ33037 fis, clone THYMU2000317 −0.77 0.05Hs.369675 163758 ANGPT1 Angiopoietin 1 (ANGPT1) −0.52 0.05
Genes up-regulated (69) and down-regulated (9) in liver biopsies with IPGF (group 2) compared to non-IPGF (group 1). M corresponds tothe logarithm (base 2) of the ratio of IPGF / non-IPGF. Freq.RF corresponds to the frequence of cross-validation folds observed amongthe different random forest classification models. RNG oligo IDs give access to transcripts and probes annotations through our systemof information Mediante (http://www.microarray.fr). #NA = not annotated.
American Journal of Transplantation 2008; 8: 1221–1236 1231
Defamie et al.
Table 6: GO Data base functional analysis of the 78 best classifier genes predicting IPGF
Gene ontology categories Up Down Total on chip Fisher probability
Biological process Inflammatory response 11 0 177 5.56 10−10
Immune response 17 0 685 9.70 10−9
Response to wounding 11 0 264 3.69 10−8
Response to external stimulus 21 0 1303 2.31 10−7
Response to stress 14 0 759 8.98 10−6
Superoxide metabolism 2 0 17 2.92 10−3
Chemotaxis 3 0 114 1.72 10−2
Negative regulation of cell proliferation 3 0 237 2.65 10−2
Oxygen and reactive oxygen species metabolism 2 0 58 3.14 10−2
Phagocytosis 1 0 18 8.28 10−2
Molecular function IL1 receptor binding 2 0 11 1.14 10−3
MHC class II receptor activity 2 0 15 2.61 10−3
Cytokine activity 4 1 201 2.39 10−3
Growth factor activity 3 0 144 2.95 10−2
Most significant themes identified by EASE analysis. The number of genes down- and up- regulated and the total number of genes onchip are represented. The probability to obtain the number of genes in a certain pathway in the list of our differentially expressed genes(both up- and down-regulated) was compared with the representation of the same pathway among all the genes on the microarray andwas calculated as a Fisher’s exact probability.
strongly suggests a dramatic activation of ROS-dependentpathways in IPGF-associated livers.
Discussion
This study represents, to our knowledge, the most com-plete picture of the alterations of gene expression oc-curring in liver following brain-dead donor OLT. A set of371 genes was able to discriminate transplanted from con-trol livers. These genes can be classified in molecular path-ways relevant to liver metabolism, inflammatory response,cell proliferation and liver protection. Transplanted liverswere then sub-stratified into two groups: group 1 includedlivers with a normal liver function (defined by AST < 1500IU/L), while group 2 corresponded to IPGF (AST > 1500IU/L). Data sets from the two groups of transplanted pa-tients were analyzed with a supervised prediction methodthat correctly classified 71% of the patients. The corre-sponding gene signature consistently highlighted molecu-lar pathways associated with increased inflammation, ox-idative stress, apoptosis and negative regulation of cell pro-liferation. We anticipate that this global molecular signatureindeed identifies some transcriptional alterations specifi-cally associated with IPGF following human OLT.
Like most human transplantation studies, this work hasbeen affected by several external limitations: (i) large vari-ation in the durations of cold and warm ischemia, causedby obvious transport and surgical constraints; (ii) intrinsicvariability existing among liver grafts; (iii) constraints fromthe clinical protocol that imposed small size biopsies be-fore cold ischemia, thus precluding a direct comparisonbetween paired samples derived from the same donor be-fore and after cold ischemia. Therefore, we compared the
different samples against a set of normal control livers.The only drawback of the approach is possibly a small lossin sensitivity, leading to an underestimation of the alteredgene expression. However, an additional parameter to takeinto account is the effect of brain death. A recent study hasidentified a subset of genes, which expression is similarlyaffected by acute liver stress during transplantation andby brain death (20). Moreover, the transcriptional signatureof livers recovered from brain-dead donor can be function-ally associated with pathways such as ‘amine metabolism’‘lipid metabolism’, ‘acute phase response’, ‘electron trans-port’ and ‘energy metabolism’ (45). Overall, this stronglysuggests that our experimental design based on a com-parison between transplanted and normal control samplesappears indeed the best one in order to visualize transcrip-tional signatures integrating the successive stresses oc-curring during brain dead donor OLT.
A very recent study by Borozan et al. has reported a tran-scriptomic analysis in the model of human living donor livertransplantation (LDLT) (20). These authors selected a sub-set of 25 modulated genes, which defines a common sig-nature for acute liver stress. Six out of these 25 genes werepresent in our first set of differentially expressed genesdiscriminating transplanted versus control livers (four wereup-regulated: PBEF1, DDX21, NNMT, MAP1LC3B, and twowere down-regulated: GLYAT and CYP4A11). Moreover,the analysis of the two data sets with EASE (36) or MineGO(20) algorithms gave very similar results with a clear rel-evance to liver injury such as ‘inflammatory response’,‘amino acid and derivatives metabolism’, ‘amine and lipidbiosynthesis’ (Table S2). The two studies are thereforeconsistent to each other, despite differences concerningthe transplantation model and the transcriptome platformspecificities.
1232 American Journal of Transplantation 2008; 8: 1221–1236

Transcriptome Investigation of Liver Graft Injury
During the preparation of this article, a second study byConti et al. (23) provided a gene expression profile in hu-man liver transplantation, comparing in five cases, the geneexpression levels in reperfused livers versus the basal val-ues before retrieval for the same donor. Interestingly, thisstudy also reported a profound modulation of genes en-coding either heat shock proteins or proteins involved ininflammatory and apoptotic processes. A careful compari-son of these data sets with our study will be of great inter-est when these samples will be made available in a publicdata base repository (which is not currently the case).
Many of the genes present in our data set provide insightsinto the molecular pathogenesis of the stress undergoneby the liver during transplantation. Numerous studies sug-gest that formation of oxygen free radicals (OFRs) suchas the superoxide radical, hydroxyl and hydrogen perox-ide following re-oxygenation may initiate the cascade ofhepato-cellular injury, necrosis/apoptosis, and subsequentinflammatory infiltration (46,47). Up-regulation of a set ofgenes encoding factors involved in protection from oxida-tive stress-mediated injury (SOD2, GPX2 and several heatshock proteins) may thus represent a central transcriptionalresponse during liver I/R. In particular, the induction ofSOD2, an enzyme well known for its ability of scavengingsuperoxide radicals and for converting them into hydrogenperoxide and oxygen, is likely to mediate a major beneficialeffect as suggested by several reports (48). Up-regulationof several other transcripts coding for ER chaperones rein-forces this observation and is in agreement with a recentreport describing distinct ER stress responses during hu-man liver transplantation (49).
Interestingly, STAT3, as well as its inhibitor SOCs1 are alsoover-expressed in the transplanted condition. STAT3 is atranscription factor activated via gp130 receptor by IL-6 sig-naling in adult liver and may represent one of the centralfactors for hepato-cellular protection and liver regeneration.An extensive body of work has demonstrated that STAT3plays a crucial role in the expression of stress-responsivegenes in a variety of cells and organs, in particular throughthe regulation of the protective genes (iNOS and COX-2)(50). STAT3 has also antiapoptotic properties and antago-nizes the pro-apoptotic effects of STAT1 following heartI/R injury (51). Haga et al. (52) demonstrated that STAT3provides hepato-protection against Fas-mediated apoptoticliver damage by two mechanisms: induction of anticaspaseregulators (FLIP, Bcl-2, and Bcl-xl) and reduction of oxida-tive injury via up-regulation of an antioxidant protein, Ref-1.Finally, STATs have been shown to play a major role in cellgrowth and differentiation in numerous models. In partic-ular STAT3 is important for cell cycle progression from G1to S phase and contributes to the mitogenic response ofhepatocytes during liver regeneration following partial hep-atectomy (53,54).
In the second part of our study, we have used a super-vised classification algorithm to identify a group of genes,
which would be capable of predicting IPGF. Different pa-rameters like serum transaminase levels, bilirubine levelsor prothrombin time have been used routinely to detectearly liver dysfunction after OLT (55–57). IPGF is a seri-ous complication after OLT, which can lead to PNF, leadingto allograft and recipient death in the absence of retrans-plantation. The definition of IPGF is variable within the lit-erature (26,39,40,58,59). We used the criteria proposedby Nanashima (26) for an aminotransferase level above1500 IU/L within 72 h after OLT, which reflects poor hepaticallograft function as early as possible. The occurrence ofIPGF is due to multiple risk factors such as severe steato-sis, longer hepatic cold and warm ischemia times and anearly prediction of IPGF would help to reduce the risk ofPNF. This study provides evidence for the potential appli-cation of gene expression pattern as biologically relevantmarkers for IPGF.
Since our data set was limited to 21 samples and did notallow a priori split into a training and a test set, we used therandom forest method that has been shown to be compet-itive with alternative methods without requiring any fine-tuning of parameters (60). A first selection of 371 genesof interest was made followed by a further selection ofthe most informative genes using a Student’s t-test. Itled to the identification of 78 biologically relevant genes.These genes were linked functionally to pathways asso-ciated with ‘inflammatory response’, ‘immune response’,‘response to stress’, ‘superoxide metabolism’ and ‘nega-tive regulation of cell proliferation’. The modulation of fac-tors related to oxidative stress and proliferation stronglysuggests an activation of ROS-dependent pathways andinhibition of cell proliferation in livers associated with se-vere I/R injury. Elevated levels of both Rac2 and PREX1,one of the key activator of Rac1, in IPGF-associated sam-ples strongly suggest that these small GTP-binding pro-teins may play a central role through the production of ROS,lipid peroxides and activation of NFjB. Such a situation re-sults in acute liver necrosis and apoptosis as suggestedby several reports (61,62). The net increase in caspase-3activity observed in the IPGF-associated samples (group 2,Figure 2A) is in agreement with such a hypothesis, as wellas the induction of the pro-inflammatory cytokine IL1. Onthe other hand, the presence of SOD2 among these clas-sifiers indicates that protective cellular mechanisms werenot impaired in the IPGF-associated samples, in line withthe observation that in this study, all IPGF-associated graftsrecovered. Importantly, several of the 78 genes selected,such as CEBPD, ATF3, NR1H4, BHLHB2 and ZNF227 in-deed corresponded to proteins with transcriptional activ-ity and were up-regulated in the livers with IPGF (group2). CEBPD, a bZIP transcription factor, which can func-tion both as a homodimer and an heterodimer with therelated protein CEBP-alpha could play an important role inthe regulation of genes involved in immune and inflamma-tory responses, especially associated with the activationand/or differentiation of macrophages. The ATF3, a mem-ber of the mammalian activation transcription factor/cAMP
American Journal of Transplantation 2008; 8: 1221–1236 1233
Defamie et al.
responsive element-binding (CREB) protein family of tran-scription factors, is known to repress transcription of pro-moters with ATF binding sites and to antagonize the ac-tion of members of the NFjB complex. The ATF3 couldtherefore represent a negative regulator of NFjB-mediatedsurvival pathway. The nuclear Bile Acid Receptor (FXR,NR1H4) may promote liver homeostasis not only by reg-ulating expression of appropriate metabolic target genesbut also by inhibiting liver regrowth (63). Finally, BHLHB2(STRA13, DEC1), a hypoxia-inducible bHLH transcriptionrepressor implicated in the pVHL/HIF, TGFb and Jak/STATpathways could interact with STAT3 and in turn mediateapoptosis and growth arrest (64–66).
In summary, our data obtained by microarray profiling de-picts the complex transcriptional process originating fromseveral cell types. Further investigations are needed nowto assign the relative contribution of specific cells in thisglobal response and the expression of the correspondingproteins. However, we believe that our results are biologi-cally meaningful as they (i) identify correctly functional fam-ilies of proteins involved in acute liver stress and (ii) cor-respond well with those from recent liver transplantationtranscriptomic studies (20,23). We propose that the pat-tern of alterations of a limited set of genes could predictearly the degree of liver injury and prospectively identify pa-tients at risk for IPGF following OLT. Additional studies arewarranted to confirm the robustness of this signature on alarger set of liver transplants and explore the precise func-tion of these candidate genes in the molecular pathwaysassociated with liver injury.
Ethical guidelines
Patients undergoing OLT at the Service de TransplantationHepatique, Archet 2, CHU of Nice, were included in thestudy, according to standard criteria. Informed consent wasobtained for all patients before the transplantation proce-dure and approved by the local Ethics committee (protocol‘Incitation a la Recherche Clinique’ 1999 No 99-D-07, CHUof Nice, France).
Acknowledgments
We are grateful to the surgeons of the Service de Chirurgie Digestive etTransplantation Hepatique at Archet 2 Hospital (CHU, Nice) for their partic-ipation to this study. We wish to thank Eric Chevet for critical reading ofthe article. We acknowledge the excellent support of the Nice-Sophia An-tipolis Transcriptome Platform of the Marseille-Nice Genopole in which themicroarray experiments were carried out. Special thanks are due to VirginieMagnone and Geraldine Rios for microarray production. We are also gratefulfor the thoughtful comments made by anonymous reviewers, which havegreatly enriched the quality of our article.
This work was supported by grants from the Centre National de laRecherche Scientifique (CNRS), Institut National de la Sante et de laRecherche Medicale (INSERM) and University of Nice-Sophia Antipo-lis. VD was recipient of successive fellowships from the ‘AssociationMediterraneenne pour le Developpement des Transplantations’, of awards
from the ‘Association des Jeunes Transplanteurs des Alpes Maritimes’, theassociation ‘Vaincre la Mucoviscidose’ and the ‘Fondation pour la RechercheMedicale’. RC is a recipient of a ‘Contrat d’Incitation a la Recherche’ n 99-D-07 from CHU of Nice (1999).
References
1. Markin RS, Wisecarver JL, Radio SJ et al. Frozen section evaluationof donor livers before transplantation. Transplantation 1993; 56:1403–1409.
2. Farmer DG, Amersi F, Kupiec-Weglinski J, Busuttil RW. Currentstatus of ischemia and reperfusion injury in the liver. TransplantRev 2000; 14: 106–126.
3. Bilzer M, Gerbes AL. Preservation injury of the liver: Mechanismsand novel therapeutic strategies. J Hepatol 2000; 32: 508–515.
4. Jaeschke H, Lemasters JJ. Apoptosis versus oncotic necrosis inhepatic ischemia/reperfusion injury. Gastroenterology 2003; 125:1246–1257.
5. Casillas-Ramirez A, Mosbah IB, Ramalho F, Rosello-Catafau J,Peralta C. Past and future approaches to ischemia-reperfusion le-sion associated with liver transplantation. Life Sci 2006.
6. Upadhya AG, Harvey RP, Howard TK, Lowell JA, Shenoy S,Strasberg SM. Evidence of a role for matrix metalloproteinasesin cold preservation injury of the liver in humans and in the rat.Hepatology 1997; 26: 922–928.
7. Huet PM, Nagaoka MR, Desbiens G et al. Sinusoidal endothelialcell and hepatocyte death following cold ischemia-warm reperfu-sion of the rat liver. Hepatology 2004; 39: 1110–1119.
8. Defamie V, Laurens M, Patrono D et al. Matrix metalloproteinaseinhibition protects rat livers from prolonged cold ischemia-warmreperfusion injury. Hepatology 2008; 47: 177–185.
9. Lemasters JJ, Thurman RG. Reperfusion injury after liver preser-vation for transplantation. Annu Rev Pharmacol Toxicol 1997; 37:327–338.
10. Kumamoto Y, Suematsu M, Shimazu M et al. Kupffer cell-independent acute hepatocellular oxidative stress and decreasedbile formation in post-cold-ischemic rat liver. Hepatology 1999; 30:1454–1463.
11. Jaeschke H. Xanthine oxidase-induced oxidant stress during hep-atic ischemia-reperfusion: Are we coming full circle after 20 years?Hepatology 2002; 36: 761–763.
12. Lemasters JJ, Nieminen AL, Qian T, Trost LC, Herman B. The mito-chondrial permeability transition in toxic, hypoxic and reperfusioninjury. Mol Cell Biochem 1997; 174: 159–165.
13. Jaeschke H. Redox considerations in hepatic injury and inflamma-tion. Antioxid Redox Signal 2002; 4: 699–700.
14. Jaeschke H. Mechanisms of Liver Injury. II. Mechanisms ofneutrophil-induced liver cell injury during hepatic ischemia-reperfusion and other acute inflammatory conditions. Am J PhysiolGastrointest Liver Physiol 2006; 290: G1083–1088.
15. Menger MD, Vollmar B. Role of microcirculation in transplantation.Microcirculation 2000; 7: 291–306.
16. Colletti LM, Kunkel SL, Walz A et al. The role of cytokine networksin the local liver injury following hepatic ischemia/reperfusion inthe rat. Hepatology 1996; 23: 506–514.
17. Jaeschke H, Farhood A. Neutrophil and Kupffer cell-induced oxi-dant stress and ischemia-reperfusion injury in rat liver. Am J Physiol1991; 260(3 Pt 1): G355–362.
18. Mavier P, Preaux AM, Guigui B, Lescs MC, Zafrani ES, DhumeauxD. In vitro toxicity of polymorphonuclear neutrophils to rat hepato-cytes: Evidence for a proteinase-mediated mechanism. Hepatol-ogy 1988; 8: 254–258.
1234 American Journal of Transplantation 2008; 8: 1221–1236

Transcriptome Investigation of Liver Graft Injury
19. Pannen BH, Al-Adili F, Bauer M, Clemens MG, Geiger KK. Role ofendothelins and nitric oxide in hepatic reperfusion injury in the rat.Hepatology 1998; 27: 755–764.
20. Borozan I, Chen L, Sun J et al. Gene expression profiling of acuteliver stress during living donor liver transplantation. Am J Transplant2006; 6: 806–824.
21. Vascotto C, Cesaratto L, D’Ambrosio C et al. Proteomic analysis ofliver tissues subjected to early ischemia/reperfusion injury duringhuman orthotopic liver transplantation. Proteomics 2006; 6: 3455–3465.
22. Emadali A, Muscatelli-Groux B, Delom F et al. Proteomic analysisof ischemia-reperfusion injury upon human liver transplantation re-veals the protective role of IQGAP1. Mol Cell Proteomics 2006; 5:1300–1313.
23. Conti A, Scala S, D’Agostino P et al. Wide gene expression profilingof ischemia-reperfusion injury in human liver transplantation. LiverTranspl 2007; 13: 99–113.
24. Busuttil RW, Klintmalm GB. The recipient hepatectomy and graft-ing. In: Busuttil RW, Klintmalm GB (eds). Transplantation of theLiver, Philadelphia, PA: WB Saunders 1996: 405–418.
25. Suzuki S, Toledo-Pereyra LH, Rodriguez FJ, Cejalvo D. Neutrophilinfiltration as an important factor in liver ischemia and reperfusioninjury. Modulating effects of FK506 and cyclosporine. Transplanta-tion 1993; 55: 1265–1272.
26. Nanashima A, Pillay P, Verran DJ et al. Analysis of initial poor graftfunction after orthotopic liver transplantation: Experience of anAustralian single liver transplantation center. Transplant Proc 2002;34: 1231–1235.
27. Moreilhon C, Gras D, Hologne C et al. Live Staphylococcus au-reus and bacterial soluble factors induce different transcriptionalresponses in human airway cells. Physiol Genomics 2005; 20: 244–255.
28. Le Brigand K, Russell R, Moreilhon C et al. An open-accesslong oligonucleotide microarray resource for analysis of the hu-man and mouse transcriptomes. Nucleic Acids Res 2006; 34:E87.
29. Gentleman RC, Carey VJ, Bates DM et al. Bioconductor: Open soft-ware development for computational biology and bioinformatics.Genome Biol 2004; 5: R80.
30. Wettenhall JM, Smyth GK. limmaGUI: A graphical user interfacefor linear modeling of microarray data. Bioinformatics 2004; 20:3705–3706.
31. Alexa A, Rahnenfuhrer J, Lengauer T. Improved scoring of func-tional groups from gene expression data by decorrelating GO graphstructure. Bioinformatics 2006; 22: 1600–1607.
32. Breiman L. Random forests. Machine Learning 2001; 45: 5–32.33. Tibshirani R, Hastie T, Narasimhan B, Chu G. Diagnosis of multiple
cancer types by shrunken centroids of gene expression. Proc NatlAcad Sci U S A 2002; 99: 6567–6572.
34. Yang YH, Dudoit S, Luu P et al. Normalization for cDNA microarraydata: a robust composite method addressing single and multipleslide systematic variation. Nucleic Acids Res 2002; 30: e15.
35. Kooperberg C, Fazzio TG, Delrow JJ, Tsukiyama T. Improved back-ground correction for spotted DNA microarrays. J Comput Biol2002; 9: 55–66.
36. Hosack DA, Dennis G Jr., Sherman BT, Lane HC, Lempicki RA.Identifying biological themes within lists of genes with EASE.Genome Biol 2003; 4: R70.
37. Ashburner M, Ball CA, Blake JA et al. Gene ontology: Tool for theunification of biology. The Gene Ontology Consortium. Nat Genet2000; 25: 25–29.
38. Pottier N, Chupin C, Defamie V et al. Relationships between earlyinflammatory response to bleomycin and sensitivity to lung fi-
brosis: A role for dipeptidyl-peptidase I and tissue inhibitor ofmetalloproteinase-3? Am J Respir Crit Care Med 2007; 176: 1098–1107.
39. Ploeg RJ, D’Alessandro AM, Knechtle SJ et al. Risk factors for pri-mary dysfunction after liver transplantation–a multivariate analysis.Transplantation 1993; 55: 807–813.
40. Chen H, Peng CH, Shen BY et al. Multi-factor analysis of initial poorgraft function after orthotopic liver transplantation. HepatobiliaryPancreat Dis Int 2007; 6: 141–146.
41. Mueller TH, Kienle K, Beham A, Geissler EK, Jauch KW, RentschM. Caspase 3 inhibition improves survival and reduces early graftinjury after ischemia and reperfusion in rat liver transplantation.Transplantation 2004; 78: 1267–1273.
42. Tang ZY, Loss G, Carmody I, Cohen AJ. TIMP-3 ameliorates hep-atic ischemia/reperfusion injury through inhibition of tumor necro-sis factor-alpha-converting enzyme activity in rats. Transplantation2006; 82: 1518–1523.
43. Le Brigand K, Barbry P. Mediante: A web-based microarray datamanager. Bioinformatics 2007; 23: 1304–1306.
44. Kaufman RJ, Scheuner D, Schroder M et al. The unfolded proteinresponse in nutrient sensing and differentiation. Nat Rev Mol CellBiol 2002; 3: 411–421.
45. Colombo G, Gatti S, Turcatti F et al. Alteration in the transcrip-tional profile of livers from brain-dead organ donors. Transplanta-tion 2006; 82: 69–79.
46. Komatsu H, Koo A, Ghadishah E et al. Neutrophil accumulation inischemic reperfused rat liver: Evidence for a role for superoxidefree radicals. Am J Physiol 1992; 262(4 Pt 1): G669–676.
47. Koo A, Komatsu H, Tao G, Inoue M, Guth PH, Kaplowitz N. Contri-bution of no-reflow phenomenon to hepatic injury after ischemia-reperfusion: Evidence for a role for superoxide anion. Hepatology1992; 15: 507–514.
48. Jaeschke H. Reactive oxygen and ischemia/reperfusion injury ofthe liver. Chem Biol Interact 1991; 79: 115–136.
49. Emadali A, Nguyen DT, Rochon C, Tzimas GN, Metrakos PP,Chevet E. Distinct endoplasmic reticulum stress responses aretriggered during human liver transplantation. J Pathol 2005.
50. Bolli R, Dawn B, Xuan YT. Role of the JAK-STAT pathway in pro-tection against myocardial ischemia/reperfusion injury. Trends Car-diovasc Med 2003; 13: 72–79.
51. Stephanou A, Brar BK, Scarabelli TM et al. Ischemia-induced STAT-1 expression and activation play a critical role in cardiomyocyteapoptosis. J Biol Chem 2000; 275: 10002–10008.
52. Haga S, Terui K, Zhang HQ et al. Stat3 protects against Fas-inducedliver injury by redox-dependent and -independent mechanisms. JClin Invest 2003; 112: 989–998.
53. Debonera F, Aldeguer X, Shen X et al. Activation of interleukin-6/STAT3 and liver regeneration following transplantation. J SurgRes 2001; 96: 289–295.
54. Li W, Liang X, Kellendonk C, Poli V, Taub R. STAT3 contributes tothe mitogenic response of hepatocytes during liver regeneration.J Biol Chem 2002; 277: 28411–28417.
55. Russo FP, Bassanello M, Senzolo M, Cillo U, Burra P. Functionaland morphological graft monitoring after liver transplantation. ClinChim Acta 2001; 310: 17–23.
56. Ben-Ari Z, Weiss-Schmilovitz H, Sulkes J et al. Serum cholestasismarkers as predictors of early outcome after liver transplantation.Clin Transplant 2004; 18: 130–136.
57. Deschenes M, Belle SH, Krom RA, Zetterman RK, Lake JR. Earlyallograft dysfunction after liver transplantation: A definition andpredictors of outcome. National institute of diabetes and digestiveand kidney diseases liver transplantation database. Transplantation1998; 66: 302–310.
American Journal of Transplantation 2008; 8: 1221–1236 1235

Defamie et al.
58. Gonzalez FX, Rimola A, Grande L et al. Predictive factors of earlypostoperative graft function in human liver transplantation. Hepa-tology 1994; 20: 565–573.
59. Ardite E, Ramos C, Rimola A, Grande L, Fernandez-Checa JC. Hep-atocellular oxidative stress and initial graft injury in human livertransplantation. J Hepatol 1999; 31: 921–927.
60. Diaz-Uriarte R, Alvarez de Andres S. Gene selection and classifica-tion of microarray data using random forest. BMC Bioinformatics2006; 7: 3.
61. Kim KS, Takeda K, Sethi R et al. Protection from reoxygenationinjury by inhibition of rac1. J Clin Invest 1998; 101: 1821–1826.
62. Ozaki M, Deshpande SS, Angkeow P et al. Inhibition of the Rac1GTPase protects against nonlethal ischemia/reperfusion-inducednecrosis and apoptosis in vivo. Faseb J 2000; 14: 418–429.
63. Huang W, Ma K, Zhang J et al. Nuclear receptor-dependent bileacid signaling is required for normal liver regeneration. Science2006; 312: 233–236.
64. Sun H, Taneja R. Stra13 expression is associated with growtharrest and represses transcription through histone deacetylase(HDAC)-dependent and HDAC-independent mechanisms. ProcNatl Acad Sci U S A 2000; 97: 4058–4063.
65. Ivanov SV, Salnikow K, Ivanova AV, Bai L, Lerman MI. Hypoxicrepression of STAT1 and its downstream genes by a pVHL/HIF-1target DEC1/STRA13. Oncogene 2006.
66. Ivanova AV, Ivanov SV, Zhang X, Ivanov VN, Timofeeva OA, LermanMI. STRA13 interacts with STAT3 and modulates transcription ofSTAT3-dependent targets. J Mol Biol 2004; 340: 641–653.
Supplementary Material
The following supplementary material is available for thisarticle:
Table S1: Full list of the differentially expressed genes
between transplanted and control livers. The 371 genes
are ranked according to the statistical p-values obtainedusing the limma package from Bioconductor. A corre-sponds to the logarithm (base 2) of the average fluores-cence intensity for each probe. M corresponds to the log-arithm (base 2) of the ratio of Transplanted / Control. Allgenes from the list displayed significant false discoveryrate p-values using the Benjamini-Hochberg correction (p <
0.001). RNG oligo IDs give access to transcripts and probesannotations through our system of information Mediante(http://www.microarray.fr).
Table S2: GO Data base functional analysis of the 371
genes regulated in response to OLT. Full list of themesidentified by EASE analysis. The number of genes modu-lated between transplanted and control samples and thetotal number of genes on chip are represented. The proba-bility to obtain the number of genes in a certain pathway inthe list of our differentially expressed genes was comparedwith the representation of the same pathway among all thegenes on the microarray and was calculated as a Fisher’sexact probability.
This material is available as part of the online articlefrom: http://www.blackwellpublishing.com/doi/abs/10.1111/j.1600-6143.2008.02249.x
(This link will take you to the article abstract)
Please note: Blackwell Publishing is not responsible forthe content or functionality of any supplementary materialssupplied by the authors. Any queries (other than missingmaterial) should be directed to the corresponding authorfor the article.
1236 American Journal of Transplantation 2008; 8: 1221–1236