
Gene expression profiling of brains from bovine spongiform encephalopathy (BSE)-infected cynomolgus...
17
RESEARCH ARTICLE Open Access Gene expression profiling of brains from bovine spongiform encephalopathy (BSE)-infected cynomolgus macaques Maura Barbisin 1† , Silvia Vanni 1† , Ann-Christin Schmädicke 2 , Judith Montag 2,4 , Dirk Motzkus 2 , Lennart Opitz 3 , Gabriela Salinas-Riester 3 and Giuseppe Legname 1* Abstract Background: Prion diseases are fatal neurodegenerative disorders whose pathogenesis mechanisms are not fully understood. In this context, the analysis of gene expression alterations occurring in prion-infected animals represents a powerful tool that may contribute to unravel the molecular basis of prion diseases and therefore discover novel potential targets for diagnosis and therapeutics. Here we present the first large-scale transcriptional profiling of brains from BSE-infected cynomolgus macaques, which are an excellent model for human prion disorders. Results: The study was conducted using the GeneChip® Rhesus Macaque Genome Array and revealed 300 transcripts with expression changes greater than twofold. Among these, the bioinformatics analysis identified 86 genes with known functions, most of which are involved in cellular development, cell death and survival, lipid homeostasis, and acute phase response signaling. RT-qPCR was performed on selected gene transcripts in order to validate the differential expression in infected animals versus controls. The results obtained with the microarray technology were confirmed and a gene signature was identified. In brief, HBB and HBA2 were down-regulated in infected macaques, whereas TTR, APOC1 and SERPINA3 were up-regulated. Conclusions: Some genes involved in oxygen or lipid transport and in innate immunity were found to be dysregulated in prion infected macaques. These genes are known to be involved in other neurodegenerative disorders such as Alzheimer’s and Parkinson’s diseases. Our results may facilitate the identification of potential disease biomarkers for many neurodegenerative diseases. Keywords: Prion diseases, BSE, Non-human primates, Neurodegeneration, Transcriptome, Microarray, RT-qPCR, Biomarker, Serpina3, Hemoglobin Background Prion diseases, or transmissible spongiform encephalop- athies (TSEs), are incurable and fatal neurodegenerative disorders that affect both humans and animals; their origin may be sporadic, acquired or genetic [1,2]. TSEs include Creutzfeldt-Jakob Disease (CJD), Gerstmann-Sträussler- Scheinker syndrome (GSS), kuru and fatal familial insomnia (FFI) in humans [2], bovine spongiform encephalopathy (BSE) in cattle [3], scrapie in sheep and goats [4], chronic wasting disease (CWD) in cervids [5], transmissible mink encephalopathy, and feline spongiform encephalopathy (FSE) [6]. A major event that leads to the development of prion diseases is the conversion of the cellular form of the prion protein (PrP C ) into an abnormally folded, β-sheet enriched and protease resistant isoform (PrP Sc ). PrP Sc is prone to accumulate and aggregate in the brain of affected individ- uals [1,2,4] leading to neuronal loss, spongiosis and astro- gliosis, which are hallmarks of neurodegeneration. The underlying conversion mechanism of PrP C into PrP Sc is poorly understood and it is further complicated by the ex- istence of several different strains characterized by distinct * Correspondence: [email protected] † Equal contributors 1 Department of Neuroscience, Scuola Internazionale Superiore di Studi Avanzati (SISSA), Via Bonomea 265, 34136 Trieste, Italy Full list of author information is available at the end of the article © 2014 Barbisin et al.; licensee BioMed Central Ltd. This is an Open Access article distributed under the terms of the Creative Commons Attribution License (http://creativecommons.org/licenses/by/2.0), which permits unrestricted use, distribution, and reproduction in any medium, provided the original work is properly credited. The Creative Commons Public Domain Dedication waiver (http://creativecommons.org/publicdomain/zero/1.0/) applies to the data made available in this article, unless otherwise stated. Barbisin et al. BMC Genomics 2014, 15:434 http://www.biomedcentral.com/1471-2164/15/434
Transcript of Gene expression profiling of brains from bovine spongiform encephalopathy (BSE)-infected cynomolgus...

RESEARCH ARTICLE Open Access
Gene expression profiling of brains from bovinespongiform encephalopathy (BSE)-infectedcynomolgus macaquesMaura Barbisin1†, Silvia Vanni1†, Ann-Christin Schmädicke2, Judith Montag2,4, Dirk Motzkus2, Lennart Opitz3,Gabriela Salinas-Riester3 and Giuseppe Legname1*
Abstract
Background: Prion diseases are fatal neurodegenerative disorders whose pathogenesis mechanisms are not fullyunderstood. In this context, the analysis of gene expression alterations occurring in prion-infected animals represents apowerful tool that may contribute to unravel the molecular basis of prion diseases and therefore discover novelpotential targets for diagnosis and therapeutics. Here we present the first large-scale transcriptional profiling of brainsfrom BSE-infected cynomolgus macaques, which are an excellent model for human prion disorders.
Results: The study was conducted using the GeneChip® Rhesus Macaque Genome Array and revealed 300 transcriptswith expression changes greater than twofold. Among these, the bioinformatics analysis identified 86 genes withknown functions, most of which are involved in cellular development, cell death and survival, lipid homeostasis, andacute phase response signaling. RT-qPCR was performed on selected gene transcripts in order to validate the differentialexpression in infected animals versus controls. The results obtained with the microarray technology were confirmedand a gene signature was identified. In brief, HBB and HBA2 were down-regulated in infected macaques, whereas TTR,APOC1 and SERPINA3 were up-regulated.
Conclusions: Some genes involved in oxygen or lipid transport and in innate immunity were found to be dysregulatedin prion infected macaques. These genes are known to be involved in other neurodegenerative disorders such asAlzheimer’s and Parkinson’s diseases. Our results may facilitate the identification of potential disease biomarkers formany neurodegenerative diseases.
Keywords: Prion diseases, BSE, Non-human primates, Neurodegeneration, Transcriptome, Microarray, RT-qPCR,Biomarker, Serpina3, Hemoglobin
BackgroundPrion diseases, or transmissible spongiform encephalop-athies (TSEs), are incurable and fatal neurodegenerativedisorders that affect both humans and animals; their originmay be sporadic, acquired or genetic [1,2]. TSEs includeCreutzfeldt-Jakob Disease (CJD), Gerstmann-Sträussler-Scheinker syndrome (GSS), kuru and fatal familial insomnia(FFI) in humans [2], bovine spongiform encephalopathy
(BSE) in cattle [3], scrapie in sheep and goats [4], chronicwasting disease (CWD) in cervids [5], transmissible minkencephalopathy, and feline spongiform encephalopathy(FSE) [6].A major event that leads to the development of prion
diseases is the conversion of the cellular form of the prionprotein (PrPC) into an abnormally folded, β-sheet enrichedand protease resistant isoform (PrPSc). PrPSc is prone toaccumulate and aggregate in the brain of affected individ-uals [1,2,4] leading to neuronal loss, spongiosis and astro-gliosis, which are hallmarks of neurodegeneration. Theunderlying conversion mechanism of PrPC into PrPSc ispoorly understood and it is further complicated by the ex-istence of several different strains characterized by distinct
* Correspondence: [email protected]†Equal contributors1Department of Neuroscience, Scuola Internazionale Superiore di StudiAvanzati (SISSA), Via Bonomea 265, 34136 Trieste, ItalyFull list of author information is available at the end of the article
© 2014 Barbisin et al.; licensee BioMed Central Ltd. This is an Open Access article distributed under the terms of the CreativeCommons Attribution License (http://creativecommons.org/licenses/by/2.0), which permits unrestricted use, distribution, andreproduction in any medium, provided the original work is properly credited. The Creative Commons Public DomainDedication waiver (http://creativecommons.org/publicdomain/zero/1.0/) applies to the data made available in this article,unless otherwise stated.
Barbisin et al. BMC Genomics 2014, 15:434http://www.biomedcentral.com/1471-2164/15/434

tertiary and quaternary structures as well as different clin-ical patterns [7,8]. Several hypotheses exist about the con-tribution of unknown molecules other than PrP to prionpropagation [9-11]. To address this issue, several animalstudies have investigated the host response to prion infec-tion of different origin and strain. The differential tran-scription profile after prion infection has been extensivelyexplored (reviewed in [6,12]); however, most of the studiesinvolved animal models such as mice [13-18], sheep[4,19-22] and cattle [23-28], all not closely related tohumans. Some expression analyses have been conductedin non-human primates focusing mainly on the suscepti-bility to the infection and the variety of clinical symptoms[29-33], but none has investigated large-scale transcrip-tome changes due to prion infection. All these investiga-tions suggest that besides the PrP-encoding gene (PRNPin humans), other genes are key players and contribute tothe genetic susceptibility to acquired TSEs [6,34]. Themain genes identified so far are related to oxidative stress,mitochondrial apoptotic pathways, endosome/lysosomefunction, immunity, synapse function, metal ion binding,activated cholesterol biosynthesis, immune and inflamma-tory response, protease inhibitors, calcium binding pro-teins, regulation of the actin cytoskeleton, ion transport,cell adhesion, and transcription processes [6]. Dysregula-tion of these genes seems to cause increased oxidativestress that in turn determines oxidation of proteins,lipids and DNA as well as mitochondrial dysfunctionand ER stress [6]. Apart from TSEs, transcriptionalchanges of these genes are common to other neurode-generative pathologies [12] and, together with func-tional proteomics data, may help to identify novelselective biomarkers of prion diseases and neurodegen-eration in general.To accomplish that, we performed a large-scale tran-
scriptional profiling in BSE-infected cynomolgus ma-caques (Macaca fascicularis). They are known to be anexcellent model for studying human acquired prion dis-eases [32,33,35-37], as shown by BSE transmission viathe intracranial and oral routes, which lead to a diseasepattern comparable to that of human maladies in termsof preclinical incubation time, clinical symptoms andpathophysiology [35]. The objective of this study was toidentify genes that are differentially expressed in braintissue of intracranially infected monkeys compared tonon-infected ones using an unbiased genomic approachsuch as expression microarrays with subsequent datavalidation by RT-qPCR. Our study aims at revealing bio-logical processes that are relevant to the pathogenesis ofhuman prion diseases using a systematic approach thatconnects the identified DEGs into potential networks ofinteracting pathways. This may allow us to discovernovel selective markers as potential targets for diagnosticand therapeutic strategies.
ResultsPrPSc content in brain tissueThe relative amount of PrPSc in brain homogenate of 6BSE-infected macaques was examined by Western Blot.Densitometric analysis of the monoglycosylated band re-vealed that the relative amount of PrPSc strongly differedbetween the individual macaques. We wondered whetherthis discrepancy might be due to the preclinical incubationtime or rather correspond to the gradual accumulation ofPrPSc during the clinical phase of disease as reported forsCJD [38,39]. As anticipated, we found a significant correl-ation between PrPSc content and the duration of thesymptomatic phase (Figure 1). The correlation analysis in-cludes only the 6 intracranially inoculated macaques.Since these animals were housed in one social group, en-vironmental factors, which may influence the diseasecourse and duration, are identical. Such factors can be dif-ferent for the orally inoculated animal, which was there-fore omitted from the analysis. The infected animals wereat an advanced stage of prion disease and the details oftheir clinical course have been previously described [33].Briefly, animal A1 showed the shortest duration of disease(17 days) and a short pre-clinical incubation time(931 days) together with the lowest PrPSc content, whileanimal A5 showed the longest survival period (143 days),compared to an average clinical phase of about 90 days,together with the highest PrPSc content and the secondlongest pre-clinical phase (1340 days).
Microarray analysis of brain gene expression incynomolgus macaquesTo investigate differential mRNA expression in BSE-infected macaques we used brain samples from 6 animalsthat were intracranially challenged [33]. One macaque that
Figure 1 Correlation between PrPSc content and duration ofclinical phase. Western Blot analysis from PK-treated homogenatesof brain samples derived from BSE-infected macaques was performed.The monoglycosylated bands of PrPSc were analyzed densitometrically.Relative amounts of PrPSc from brain homogenates were averaged andcorrelated to the disease duration.
Barbisin et al. BMC Genomics 2014, 15:434 Page 2 of 17http://www.biomedcentral.com/1471-2164/15/434

was orally infected with 50 mg BSE-homogenate was alsoincluded in our study. For comparison purposes, we used5 brain samples derived from non-infected age- and sex-matched control macaques.RNA was isolated from the gyrus frontalis superior of
all animals and checked for quality by nano-scale elec-trophoresis, which resulted in an overall RNA IntegrityNumber (RIN) of about 6. This value is indicative of atleast partially degraded RNA within the sample; onepossible reason for the reduced RNA integrity may bethe procedure utilized to remove the gyrus frontalis su-perior region from the frozen tissue slide. The biopsystamp was plugged into a cordless screwdriver that wasused to drill a borehole in the frozen tissue block of +/−1 cm height. This method was chosen to ensure that thematerial did not thaw; however, the local heat inducedby the rotating biopsy stamp may have led to substantialdegradation of the RNA. Nonetheless, human brain ma-terial exhibiting a comparable RIN value was successfullyused for similar studies [40]. All samples were analyzedusing the GeneChip® Rhesus Macaque Genome Array(Affymetrix®) that contains 52,024 rhesus probe sets toenable gene expression studies of Macaca mulatta tran-scriptome interrogating more than 47,000 transcripts.The genomes of M. mulatta and M. fascicularis exhibita small genetic divergence of approximately 0.4% [41,42]that presumably allows for the detection of homologuetranscripts with high specificity.
Raw data were quality checked and analyzed usingAffymetrix® proprietary analysis tools, a hierarchicalclustering was performed and a heat map was generated.Then the signals were aligned to the annotation libraryand a spreadsheet containing gene symbols, p-valuesand expression fold changes was created. Microarraydata were submitted to Gene Expression Omnibus (GEO).The bioinformatics analysis identified 300 probe sets thatwere up- or down-regulated about twofold (≥ |1.95|). Be-cause among them no candidate appeared using FDR0.05, we chose as criteria an unadjusted p-value of ≤ 0.005together with a fold change ≥ |2.0|. Additional file 1 liststhe resulting 86 probe sets that were then used to generatethe heat map shown in Figure 2.
Functional classification of differentially expressed genes(DEGs)We used the Ingenuity Pathways Analysis (IPA®, see sec-tion: Availability of supporting data) to annotate genesaccording to their functional relationships and to deter-mine potential regulatory networks and pathways. Amongthe 300 differentially expressed (about twofold, (≥ |1.95|)probe sets identified, 105 were associated to mapped IDs;53 of the latter were identified as network eligible genes,while 86 were identified as function eligible genes. Itshould be emphasized that the designation of functionalclass in the present study is neither definitive nor exclu-sive, as annotation of gene function is incomplete, and
Figure 2 Condition trees of the clustering analysis. The cluster analysis was performed using a hierarchical approach with the averagelinkage-method (R and Partek® Software, Partek® Inc.): 86 probe sets showed a differential expression with FC ≥ 2. The color represents the level ofexpression (red: up-regulation, blue: down-regulation) and the sample information is listed across the bottom. The names of the known genesare indicated. More details on all genes are reported in Additional file 1.
Barbisin et al. BMC Genomics 2014, 15:434 Page 3 of 17http://www.biomedcentral.com/1471-2164/15/434
multifunctional gene products can be involved in severalcellular pathways. First, we identified key biological func-tions and/or diseases that contain a disproportionatelyhigh number of genes from the DEG list compared to thetotal gene population from the microarray. The analysiswas started by identifying the top categories (p < 0.01) ofDEGs within three main classes. In the “Diseases andDisorders” class the categories were cancer and develop-mental disorder, while within the “Molecular and Cellularfunctions” class most genes were involved in cellular de-velopment and cell death/survival. The main categoriesfor the “Physiological System Development and Function”class were tissue morphology as well as nervous systemdevelopment and function. As a second step, genes wereclustered in relation to the main pathways they belong to:the top two canonical pathways in our DEG list wereLXR/RXR activation, which is associated with lipid metab-olism and transport, and acute phase response signaling.
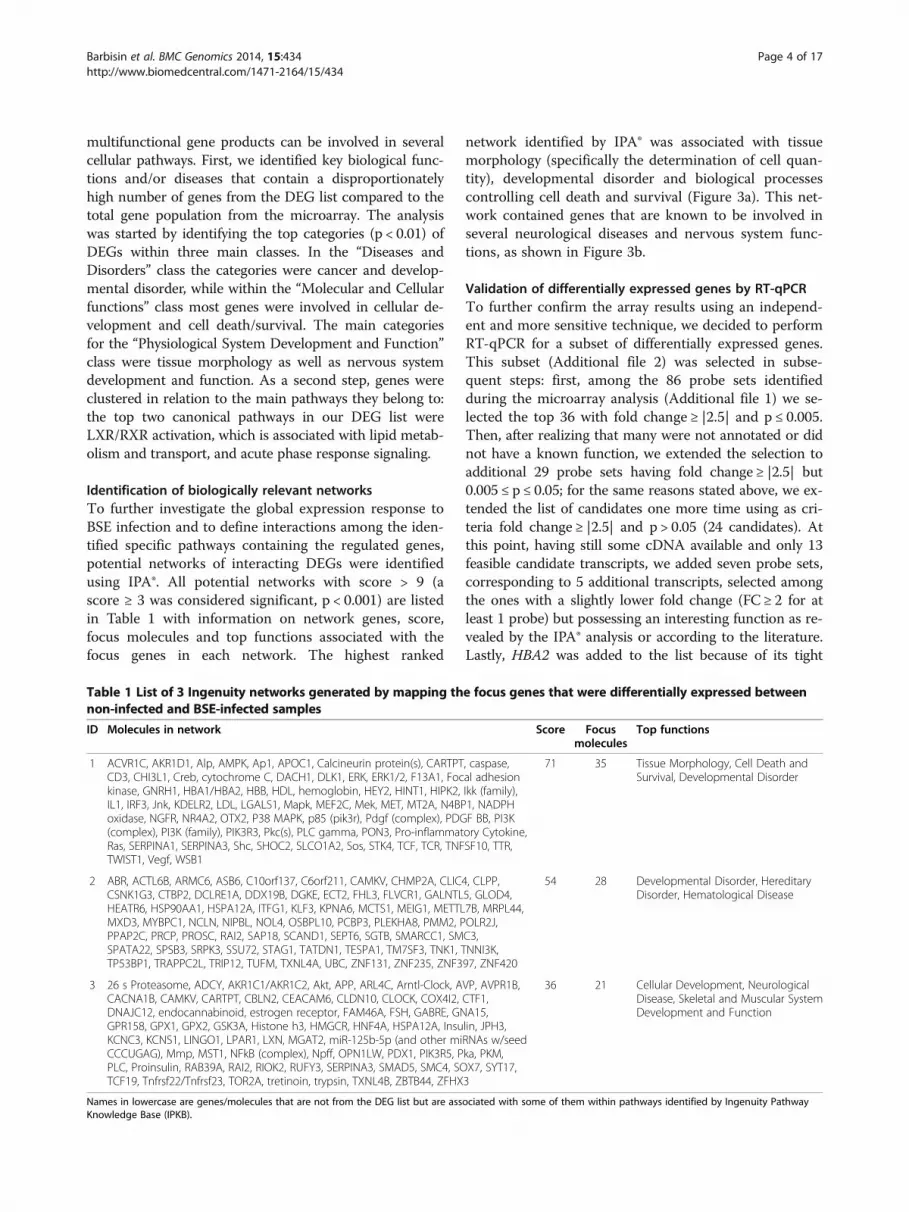
Identification of biologically relevant networksTo further investigate the global expression response toBSE infection and to define interactions among the iden-tified specific pathways containing the regulated genes,potential networks of interacting DEGs were identifiedusing IPA®. All potential networks with score > 9 (ascore ≥ 3 was considered significant, p < 0.001) are listedin Table 1 with information on network genes, score,focus molecules and top functions associated with thefocus genes in each network. The highest ranked
network identified by IPA® was associated with tissuemorphology (specifically the determination of cell quan-tity), developmental disorder and biological processescontrolling cell death and survival (Figure 3a). This net-work contained genes that are known to be involved inseveral neurological diseases and nervous system func-tions, as shown in Figure 3b.
Validation of differentially expressed genes by RT-qPCRTo further confirm the array results using an independ-ent and more sensitive technique, we decided to performRT-qPCR for a subset of differentially expressed genes.This subset (Additional file 2) was selected in subse-quent steps: first, among the 86 probe sets identifiedduring the microarray analysis (Additional file 1) we se-lected the top 36 with fold change ≥ |2.5| and p ≤ 0.005.Then, after realizing that many were not annotated or didnot have a known function, we extended the selection toadditional 29 probe sets having fold change ≥ |2.5| but0.005 ≤ p ≤ 0.05; for the same reasons stated above, we ex-tended the list of candidates one more time using as cri-teria fold change ≥ |2.5| and p > 0.05 (24 candidates). Atthis point, having still some cDNA available and only 13feasible candidate transcripts, we added seven probe sets,corresponding to 5 additional transcripts, selected amongthe ones with a slightly lower fold change (FC ≥ 2 for atleast 1 probe) but possessing an interesting function as re-vealed by the IPA® analysis or according to the literature.Lastly, HBA2 was added to the list because of its tight
Table 1 List of 3 Ingenuity networks generated by mapping the focus genes that were differentially expressed betweennon-infected and BSE-infected samples
ID Molecules in network Score Focusmolecules
Top functions
1 ACVR1C, AKR1D1, Alp, AMPK, Ap1, APOC1, Calcineurin protein(s), CARTPT, caspase,CD3, CHI3L1, Creb, cytochrome C, DACH1, DLK1, ERK, ERK1/2, F13A1, Focal adhesionkinase, GNRH1, HBA1/HBA2, HBB, HDL, hemoglobin, HEY2, HINT1, HIPK2, Ikk (family),IL1, IRF3, Jnk, KDELR2, LDL, LGALS1, Mapk, MEF2C, Mek, MET, MT2A, N4BP1, NADPHoxidase, NGFR, NR4A2, OTX2, P38 MAPK, p85 (pik3r), Pdgf (complex), PDGF BB, PI3K(complex), PI3K (family), PIK3R3, Pkc(s), PLC gamma, PON3, Pro-inflammatory Cytokine,Ras, SERPINA1, SERPINA3, Shc, SHOC2, SLCO1A2, Sos, STK4, TCF, TCR, TNFSF10, TTR,TWIST1, Vegf, WSB1
71 35 Tissue Morphology, Cell Death andSurvival, Developmental Disorder
2 ABR, ACTL6B, ARMC6, ASB6, C10orf137, C6orf211, CAMKV, CHMP2A, CLIC4, CLPP,CSNK1G3, CTBP2, DCLRE1A, DDX19B, DGKE, ECT2, FHL3, FLVCR1, GALNTL5, GLOD4,HEATR6, HSP90AA1, HSPA12A, ITFG1, KLF3, KPNA6, MCTS1, MEIG1, METTL7B, MRPL44,MXD3, MYBPC1, NCLN, NIPBL, NOL4, OSBPL10, PCBP3, PLEKHA8, PMM2, POLR2J,PPAP2C, PRCP, PROSC, RAI2, SAP18, SCAND1, SEPT6, SGTB, SMARCC1, SMC3,SPATA22, SPSB3, SRPK3, SSU72, STAG1, TATDN1, TESPA1, TM7SF3, TNK1, TNNI3K,TP53BP1, TRAPPC2L, TRIP12, TUFM, TXNL4A, UBC, ZNF131, ZNF235, ZNF397, ZNF420
54 28 Developmental Disorder, HereditaryDisorder, Hematological Disease
3 26 s Proteasome, ADCY, AKR1C1/AKR1C2, Akt, APP, ARL4C, Arntl-Clock, AVP, AVPR1B,CACNA1B, CAMKV, CARTPT, CBLN2, CEACAM6, CLDN10, CLOCK, COX4I2, CTF1,DNAJC12, endocannabinoid, estrogen receptor, FAM46A, FSH, GABRE, GNA15,GPR158, GPX1, GPX2, GSK3A, Histone h3, HMGCR, HNF4A, HSPA12A, Insulin, JPH3,KCNC3, KCNS1, LINGO1, LPAR1, LXN, MGAT2, miR-125b-5p (and other miRNAs w/seedCCCUGAG), Mmp, MST1, NFkB (complex), Npff, OPN1LW, PDX1, PIK3R5, Pka, PKM,PLC, Proinsulin, RAB39A, RAI2, RIOK2, RUFY3, SERPINA3, SMAD5, SMC4, SOX7, SYT17,TCF19, Tnfrsf22/Tnfrsf23, TOR2A, tretinoin, trypsin, TXNL4B, ZBTB44, ZFHX3
36 21 Cellular Development, NeurologicalDisease, Skeletal and Muscular SystemDevelopment and Function
Names in lowercase are genes/molecules that are not from the DEG list but are associated with some of them within pathways identified by Ingenuity PathwayKnowledge Base (IPKB).
Barbisin et al. BMC Genomics 2014, 15:434 Page 4 of 17http://www.biomedcentral.com/1471-2164/15/434

Figure 3 (See legend on next page.)
Barbisin et al. BMC Genomics 2014, 15:434 Page 5 of 17http://www.biomedcentral.com/1471-2164/15/434
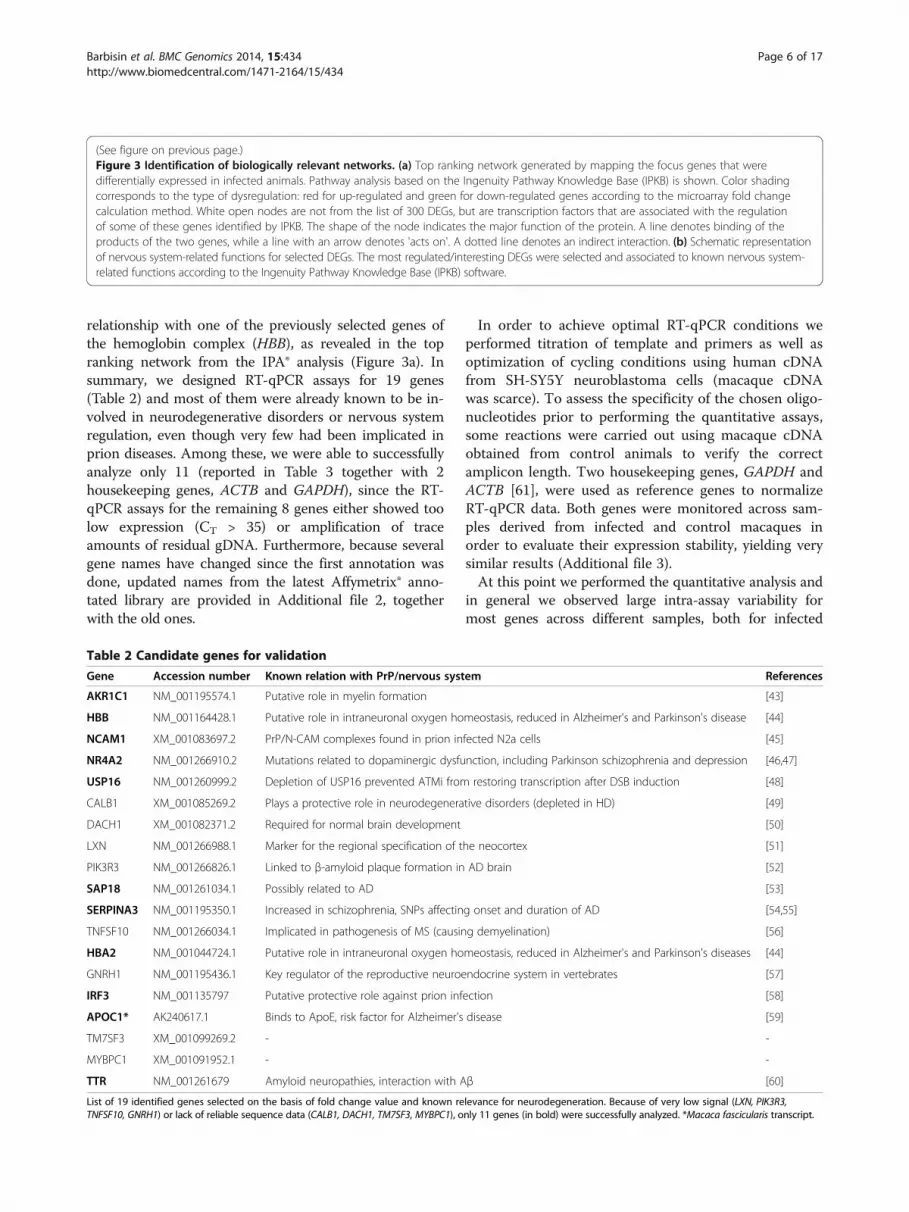
relationship with one of the previously selected genes ofthe hemoglobin complex (HBB), as revealed in the topranking network from the IPA® analysis (Figure 3a). Insummary, we designed RT-qPCR assays for 19 genes(Table 2) and most of them were already known to be in-volved in neurodegenerative disorders or nervous systemregulation, even though very few had been implicated inprion diseases. Among these, we were able to successfullyanalyze only 11 (reported in Table 3 together with 2housekeeping genes, ACTB and GAPDH), since the RT-qPCR assays for the remaining 8 genes either showed toolow expression (CT > 35) or amplification of traceamounts of residual gDNA. Furthermore, because severalgene names have changed since the first annotation wasdone, updated names from the latest Affymetrix® anno-tated library are provided in Additional file 2, togetherwith the old ones.
In order to achieve optimal RT-qPCR conditions weperformed titration of template and primers as well asoptimization of cycling conditions using human cDNAfrom SH-SY5Y neuroblastoma cells (macaque cDNAwas scarce). To assess the specificity of the chosen oligo-nucleotides prior to performing the quantitative assays,some reactions were carried out using macaque cDNAobtained from control animals to verify the correctamplicon length. Two housekeeping genes, GAPDH andACTB [61], were used as reference genes to normalizeRT-qPCR data. Both genes were monitored across sam-ples derived from infected and control macaques inorder to evaluate their expression stability, yielding verysimilar results (Additional file 3).At this point we performed the quantitative analysis and
in general we observed large intra-assay variability formost genes across different samples, both for infected
(See figure on previous page.)Figure 3 Identification of biologically relevant networks. (a) Top ranking network generated by mapping the focus genes that weredifferentially expressed in infected animals. Pathway analysis based on the Ingenuity Pathway Knowledge Base (IPKB) is shown. Color shadingcorresponds to the type of dysregulation: red for up-regulated and green for down-regulated genes according to the microarray fold changecalculation method. White open nodes are not from the list of 300 DEGs, but are transcription factors that are associated with the regulationof some of these genes identified by IPKB. The shape of the node indicates the major function of the protein. A line denotes binding of theproducts of the two genes, while a line with an arrow denotes 'acts on'. A dotted line denotes an indirect interaction. (b) Schematic representationof nervous system-related functions for selected DEGs. The most regulated/interesting DEGs were selected and associated to known nervous system-related functions according to the Ingenuity Pathway Knowledge Base (IPKB) software.
Table 2 Candidate genes for validation
Gene Accession number Known relation with PrP/nervous system References
AKR1C1 NM_001195574.1 Putative role in myelin formation [43]
HBB NM_001164428.1 Putative role in intraneuronal oxygen homeostasis, reduced in Alzheimer's and Parkinson's disease [44]
NCAM1 XM_001083697.2 PrP/N-CAM complexes found in prion infected N2a cells [45]
NR4A2 NM_001266910.2 Mutations related to dopaminergic dysfunction, including Parkinson schizophrenia and depression [46,47]
USP16 NM_001260999.2 Depletion of USP16 prevented ATMi from restoring transcription after DSB induction [48]
CALB1 XM_001085269.2 Plays a protective role in neurodegenerative disorders (depleted in HD) [49]
DACH1 XM_001082371.2 Required for normal brain development [50]
LXN NM_001266988.1 Marker for the regional specification of the neocortex [51]
PIK3R3 NM_001266826.1 Linked to β-amyloid plaque formation in AD brain [52]
SAP18 NM_001261034.1 Possibly related to AD [53]
SERPINA3 NM_001195350.1 Increased in schizophrenia, SNPs affecting onset and duration of AD [54,55]
TNFSF10 NM_001266034.1 Implicated in pathogenesis of MS (causing demyelination) [56]
HBA2 NM_001044724.1 Putative role in intraneuronal oxygen homeostasis, reduced in Alzheimer's and Parkinson's diseases [44]
GNRH1 NM_001195436.1 Key regulator of the reproductive neuroendocrine system in vertebrates [57]
IRF3 NM_001135797 Putative protective role against prion infection [58]
APOC1* AK240617.1 Binds to ApoE, risk factor for Alzheimer's disease [59]
TM7SF3 XM_001099269.2 - -
MYBPC1 XM_001091952.1 - -
TTR NM_001261679 Amyloid neuropathies, interaction with Aβ [60]
List of 19 identified genes selected on the basis of fold change value and known relevance for neurodegeneration. Because of very low signal (LXN, PIK3R3,TNFSF10, GNRH1) or lack of reliable sequence data (CALB1, DACH1, TM7SF3, MYBPC1), only 11 genes (in bold) were successfully analyzed. *Macaca fascicularis transcript.
Barbisin et al. BMC Genomics 2014, 15:434 Page 6 of 17http://www.biomedcentral.com/1471-2164/15/434

(Additional file 4) and for control animals (Additional file 5).Interestingly, we found a completely different expressionpattern for B6, the only orally-infected sample, comparedto the intracranially infected animals, except for a coupleof genes (AKR1C1, NCAM1), suggesting that the routeof infection might play a role in determining the geneexpression changes (Additional file 6). Therefore we de-cided to rerun the microarray clustering analysis exclud-ing this animal in order to verify its influence on thefinal results. As shown in Additional file 7, the compari-son of the clustering analysis with (panel A) and without(panel B) the orally challenged animal B6 does not showmarked differences.Using SYBR® Green-based RT-qPCR we confirmed
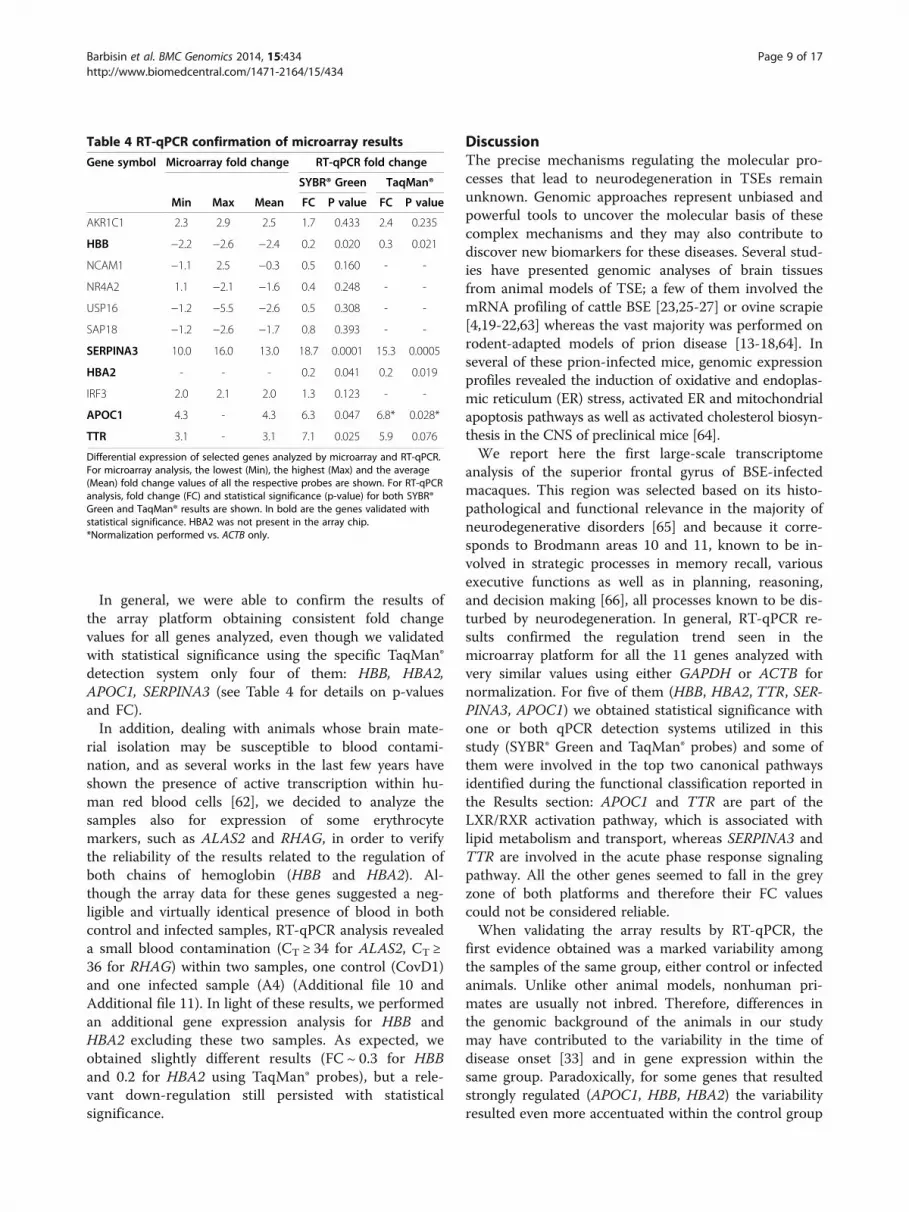
the statistically significant up-regulation of TTR (FC =7.11), SERPINA3 (FC = 18.73) and APOC1 (FC = 6.33)as well as the down-regulation of HBB (FC = 0.19) and
HBA2 (FC = 0.22), normalizing the data against GAPDH(Figure 4). Similar results were obtained against ACTB(Additional file 8). For all the other genes the RT-qPCRresults confirmed the regulation trend of the microarrays,but without statistical significance (p-value > 0.05).In order to confirm the SYBR® Green -based results
we performed an additional RT-qPCR analysis usingFAM-labeled TaqMan® probes, providing more sensitiveand specific detection signals for those genes thatshowed a significant fold change. Using this approachwe confirmed the regulation of SERPINA3, APOC1,HBB and HBA2, but not of TTR, which showed com-parable trends in FC but lost statistical significance(Figure 5). This may be due to higher variability amongtriplicates, caused by CT values higher than 35 obtainedwith the TaqMan® probe chemistry compared to SYBR®Green detection system (Additional file 9).
Table 3 Genes analyzed by RT-qPCR
Gene Chromosome Primer sequence Amplicon length (bp) Accession number
ACTB 3 F: GTTGCGTTACACCCTTTCTTG 146 NM_001033084.1
R: CTGTCACCTTCACCGTTCC
GAPDH 11 F: CCTGCACCACCAACTGCTTA 74 NM_001195426.1
R: CATGAGTCCTTCCACGATACCA
AKR1C1 9 F: CCGCCATATTGATTCTGCTCAT 132 NM_001195574.1
R: TGGGAATTGCACCAAAGCTT
HBB 14 F: GTCCTCTCCTGATGCTGTTATG 102 NM_001164428.1
R: TTGAGGTTGTCCAGGTGATTC
NCAM1 14 F: GAGCAAGAGGAAGATGACGAG 150 XM_001083697.2
R: GACTTTGAGGTGGATGGTCG
NR4A2 12 F: CCAGTGGAGGGTAAACTCATC 145 NM_001266910.2
R: AGGAGAAGGCAGAAATGTCG
USP16 3 F: GCAGAACTTGTCACAAACACC 146 NM_001260999.2
R: CTAAAGTAAGAGGGCCTGGAG
SAP18 17 F: GGAAATGTACCGTCCAGCGA 109 NM_001261034.1
R: TGCCCTTCTTTCTAGCTTCTGG
SERPINA3 7 F: GCTGGGCATTGAGGAAGTCT 123 NM_001195350.1
R: GTGCCCTCCTCAGACACATC
HBA2 20 F: CGACAAGAGCAACGTCAAGG 126 NM_001044724.1
R: TCGAAGTGGGGGAAGTAGGT
IRF3 19 F: TGGGTTGTGTTTAGCAGAGG 90 NM_001135797
R: GAAAAGTCCCCAACTCCTGAG
APOC1* 19 F: TTCTGTCGATGGTCTTGGAAG 138 AK240617.1
R: CACTCTGTTTGATGCGGTTG
TTR 18 F: TCACTTGGCATCTCCCCATTC 114 NM_001261679
R: GGTGGAATAGGAGTAGGGGCT
Primers (F: forward and R: reverse) used for gene amplification, amplicon length and GenBank® accession numbers of the macaque cDNA sequences used forprimer design. All primers were designed according to the genome sequence of Macaca mulatta.*Apolipoprotein C-I (APOC1) primers were designed according to the genome sequence of Macaca fascicularis because the Macaca mulatta mRNA sequence wasnot annotated (TSA Macaca mulatta Mamu_450725, accession number: JV045807.1). Homology between the two sequences was 99%.
Barbisin et al. BMC Genomics 2014, 15:434 Page 7 of 17http://www.biomedcentral.com/1471-2164/15/434
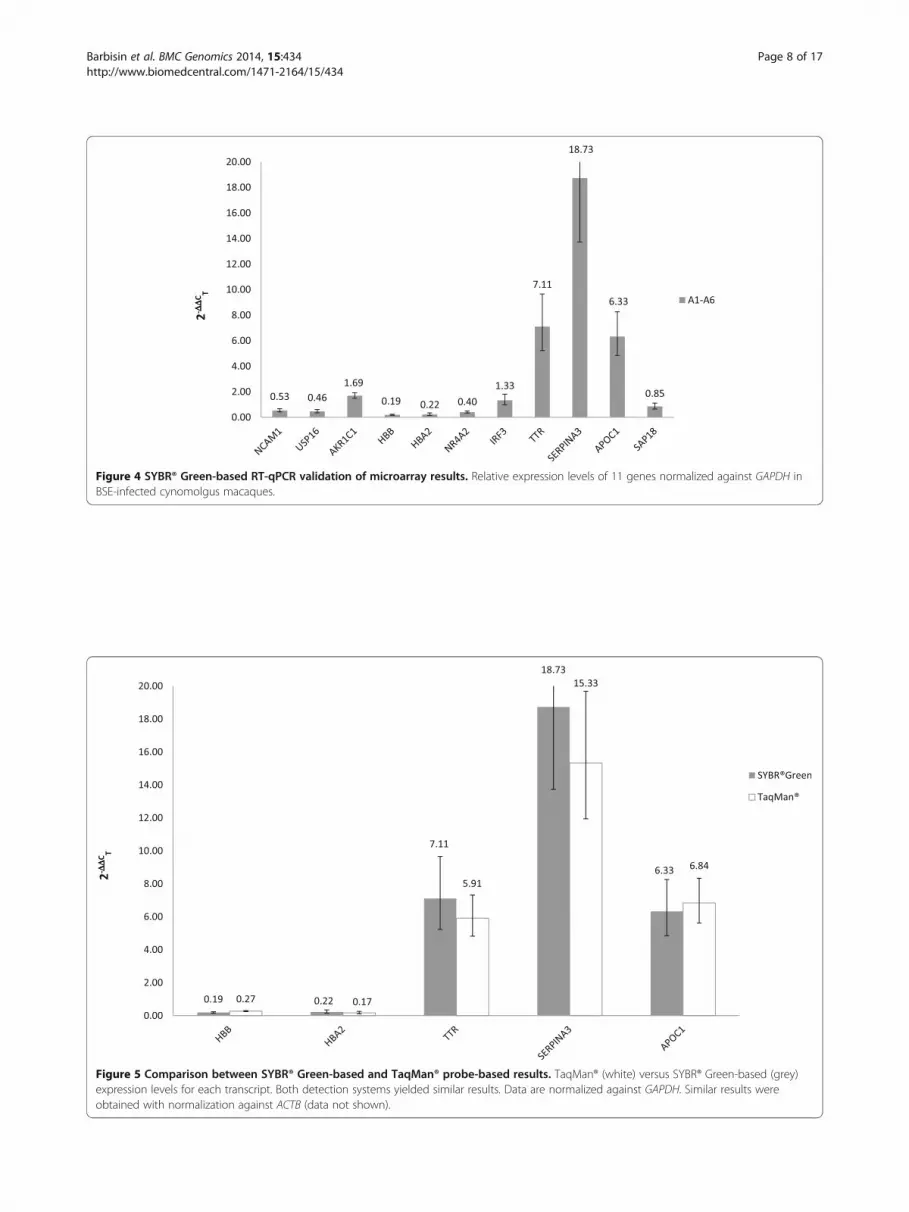
Figure 4 SYBR® Green-based RT-qPCR validation of microarray results. Relative expression levels of 11 genes normalized against GAPDH inBSE-infected cynomolgus macaques.
Figure 5 Comparison between SYBR® Green-based and TaqMan® probe-based results. TaqMan® (white) versus SYBR® Green-based (grey)expression levels for each transcript. Both detection systems yielded similar results. Data are normalized against GAPDH. Similar results wereobtained with normalization against ACTB (data not shown).
Barbisin et al. BMC Genomics 2014, 15:434 Page 8 of 17http://www.biomedcentral.com/1471-2164/15/434
In general, we were able to confirm the results ofthe array platform obtaining consistent fold changevalues for all genes analyzed, even though we validatedwith statistical significance using the specific TaqMan®detection system only four of them: HBB, HBA2,APOC1, SERPINA3 (see Table 4 for details on p-valuesand FC).In addition, dealing with animals whose brain mate-
rial isolation may be susceptible to blood contami-nation, and as several works in the last few years haveshown the presence of active transcription within hu-man red blood cells [62], we decided to analyze thesamples also for expression of some erythrocytemarkers, such as ALAS2 and RHAG, in order to verifythe reliability of the results related to the regulation ofboth chains of hemoglobin (HBB and HBA2). Al-though the array data for these genes suggested a neg-ligible and virtually identical presence of blood in bothcontrol and infected samples, RT-qPCR analysis revealeda small blood contamination (CT ≥ 34 for ALAS2, CT ≥36 for RHAG) within two samples, one control (CovD1)and one infected sample (A4) (Additional file 10 andAdditional file 11). In light of these results, we performedan additional gene expression analysis for HBB andHBA2 excluding these two samples. As expected, weobtained slightly different results (FC ~ 0.3 for HBBand 0.2 for HBA2 using TaqMan® probes), but a rele-vant down-regulation still persisted with statisticalsignificance.
DiscussionThe precise mechanisms regulating the molecular pro-cesses that lead to neurodegeneration in TSEs remainunknown. Genomic approaches represent unbiased andpowerful tools to uncover the molecular basis of thesecomplex mechanisms and they may also contribute todiscover new biomarkers for these diseases. Several stud-ies have presented genomic analyses of brain tissuesfrom animal models of TSE; a few of them involved themRNA profiling of cattle BSE [23,25-27] or ovine scrapie[4,19-22,63] whereas the vast majority was performed onrodent-adapted models of prion disease [13-18,64]. Inseveral of these prion-infected mice, genomic expressionprofiles revealed the induction of oxidative and endoplas-mic reticulum (ER) stress, activated ER and mitochondrialapoptosis pathways as well as activated cholesterol biosyn-thesis in the CNS of preclinical mice [64].We report here the first large-scale transcriptome
analysis of the superior frontal gyrus of BSE-infectedmacaques. This region was selected based on its histo-pathological and functional relevance in the majority ofneurodegenerative disorders [65] and because it corre-sponds to Brodmann areas 10 and 11, known to be in-volved in strategic processes in memory recall, variousexecutive functions as well as in planning, reasoning,and decision making [66], all processes known to be dis-turbed by neurodegeneration. In general, RT-qPCR re-sults confirmed the regulation trend seen in themicroarray platform for all the 11 genes analyzed withvery similar values using either GAPDH or ACTB fornormalization. For five of them (HBB, HBA2, TTR, SER-PINA3, APOC1) we obtained statistical significance withone or both qPCR detection systems utilized in thisstudy (SYBR® Green and TaqMan® probes) and some ofthem were involved in the top two canonical pathwaysidentified during the functional classification reported inthe Results section: APOC1 and TTR are part of theLXR/RXR activation pathway, which is associated withlipid metabolism and transport, whereas SERPINA3 andTTR are involved in the acute phase response signalingpathway. All the other genes seemed to fall in the greyzone of both platforms and therefore their FC valuescould not be considered reliable.When validating the array results by RT-qPCR, the
first evidence obtained was a marked variability amongthe samples of the same group, either control or infectedanimals. Unlike other animal models, nonhuman pri-mates are usually not inbred. Therefore, differences inthe genomic background of the animals in our studymay have contributed to the variability in the time ofdisease onset [33] and in gene expression within thesame group. Paradoxically, for some genes that resultedstrongly regulated (APOC1, HBB, HBA2) the variabilityresulted even more accentuated within the control group
Table 4 RT-qPCR confirmation of microarray results
Gene symbol Microarray fold change RT-qPCR fold change
SYBR® Green TaqMan®
Min Max Mean FC P value FC P value
AKR1C1 2.3 2.9 2.5 1.7 0.433 2.4 0.235
HBB −2.2 −2.6 −2.4 0.2 0.020 0.3 0.021
NCAM1 −1.1 2.5 −0.3 0.5 0.160 - -
NR4A2 1.1 −2.1 −1.6 0.4 0.248 - -
USP16 −1.2 −5.5 −2.6 0.5 0.308 - -
SAP18 −1.2 −2.6 −1.7 0.8 0.393 - -
SERPINA3 10.0 16.0 13.0 18.7 0.0001 15.3 0.0005
HBA2 - - - 0.2 0.041 0.2 0.019
IRF3 2.0 2.1 2.0 1.3 0.123 - -
APOC1 4.3 - 4.3 6.3 0.047 6.8* 0.028*
TTR 3.1 - 3.1 7.1 0.025 5.9 0.076
Differential expression of selected genes analyzed by microarray and RT-qPCR.For microarray analysis, the lowest (Min), the highest (Max) and the average(Mean) fold change values of all the respective probes are shown. For RT-qPCRanalysis, fold change (FC) and statistical significance (p-value) for both SYBR®Green and TaqMan® results are shown. In bold are the genes validated withstatistical significance. HBA2 was not present in the array chip.*Normalization performed vs. ACTB only.
Barbisin et al. BMC Genomics 2014, 15:434 Page 9 of 17http://www.biomedcentral.com/1471-2164/15/434

if compared to that of the infected group. The experi-mental and control animals were housed in differentanimal facilities and this may have generated slight dif-ferences in diet and/or housing conditions that may havecontributed to the above-mentioned effect.We also reported a peculiar dysregulation pattern of
the orally infected sample (B6) for several genes, show-ing a completely opposite trend compared to intracrani-ally infected animals. Although no data are available forPrPSc deposition in brain or other tissues of this animal,the significantly longer incubation period (1950 dayscompared to an average of 1100 days for the other ani-mals) could suggest a correlation between the mRNAexpression profile and the route of infection [67]. None-theless, this different pattern may be due to the age dif-ference at the time of euthanasia: 7.1 +/− 0.7 years forthe intracranially infected macaques versus 9.9 years forthe orally infected animal.Concerning hemoglobin (Hb), a few years ago its ex-
pression was unexpectedly discovered in mesencephalicdopaminergic neurons of different mouse strains, as wellas in rats and humans affected by Parkinson's disease(PD) and multiple sclerosis (MS) [68-70].Hb expression is known to decrease in neurons of PD,
Alzheimer’s disease (AD), argyrophilic grain disease(AGD) and dementia with Lewy bodies (DLB) brains[44] as well as in the CNS of scrapie-infected mice[13,14]. Also, it has been shown that Hb binds to Aβ en-hancing its aggregation and co-localizes in amyloid pla-ques in AD brains [71]. If we consider a possible similarinteraction with β-rich PrPSc isoforms in prion diseases,we can hypothesize that in our animal model down-regulated Hb fails to promote aggregation of the prionprotein, thus leading to a higher presence of toxic spe-cies like oligomers [72]. Moreover, in PD it has been hy-pothesized that Hb may act as oxygen storage moleculein oligodendrocytes [68]. Oxygen would be later releasedto neighboring neurons in hypoxia conditions to main-tain the aerobic metabolism [68,69]. When down-regulated, Hb would not be available for this function andcells would be damaged by the defective oxygen homeo-stasis. Our results indicated a strong down-regulation(about 70-80% lower expression than normal) of bothHBB and HBA2 in symptomatic advanced-stage BSE-infected macaques. The data were analyzed with a verystringent procedure after excluding any major effect of po-tential blood contamination, thus confirming the robust-ness of the results.Taken together, all these data indicate a possible gen-
eral role for hemoglobin in neurodegenerative disorders,possibly related to an alteration of O2 homeostasis andoxidative metabolism [68]. One point that needs furtherinvestigation is whether this alteration (down-regulation)occurs as an early/late consequence of the disease, or
may act as a susceptibility factor that influences the onsetof the pathology. Furthermore, future studies may investi-gate the localization of the observed down-regulation interms of cell population: it could involve neurons as wellas astrocytes or microglia.Another crucial molecule, APOC1, was significantly
up-regulated in BSE-infected brains samples comparedto controls. Apolipoprotein C-I, whose gene APOC1 ispart of the APOE/C-I/C-IV/C-II gene cluster, (apoC-I) isa small 6.6 kDa component of lipoproteins (mainlyHDL) that is known to inhibit receptor-mediated lipo-protein clearance, especially particles containing apoE[73]. Increasing evidence indicates a role for this gene inneurodegenerative disorders, especially in AD and MS[74-76]. A disruption in lipid metabolism and signalingis one of the early alterations apparent in many neurode-generative diseases, including prion diseases [77,78]; in-deed, cholesterol metabolites are investigated by anumber of studies aimed at the identification of earlybiomarkers for neurodegenerative disorders [79-81]. Sev-eral genes involved in cholesterol metabolism and lipidbiosynthesis have been found to be up-regulated inpreclinical scrapie-infected mice [64]. Since APOC1 isable to activate cholesterol esterification via lecithin-cholesterol acyltransferase [75], its up-regulation couldlead to an increase in cholesterol biosynthesis, consistentwith the concomitant presence of prion disease. In fact,in vitro studies have shown that depletion of cellularcholesterol reduces the conversion of PrPC to PrPSc [82]and evidence exists also in AD, where altered cholesterolmetabolism has been found [83]. Hypercholesterolemiahas also been shown to influence amyloid precursor pro-tein processing [84]. One explanation for altered choles-terol homeostasis affecting prion disease developmentcould lie in the fact that PrP is localized in cholesterol-rich lipid rafts [85].SERPINA3, a serpin peptidase inhibitor involved in
acute phase response pathways, is another gene that wefound highly regulated in our animal model. It is exten-sively reported to be regulated in other neurodegenera-tive disease models and in particular it is well known tointeract with APP to promote amyloid plaque formation —a hallmark of AD [86]. Indeed, increased levels ofSERPINA3 have been found in the brain and peri-pheral blood of AD patients [87], mainly due to per-sistent and almost chronic inflammation [88]. In priondisease studies, SERPINA3 was found increased in brainsof scrapie-infected mice [77], in mice infected with RMLprior to clinical onset [89] as well as in urine and cerebro-spinal fluid of CJD patients [90]. Being an acute phaseprotein, its up-regulation is explained by the onset of aninflammatory condition, particularly as a response of theinnate immune system [91]. Interestingly, two β-sheets ofSERPINA3 exhibit a polymorphism mimicking changes in
Barbisin et al. BMC Genomics 2014, 15:434 Page 10 of 17http://www.biomedcentral.com/1471-2164/15/434
the serpin structure that normally occur during the forma-tion of its stable complex with the target proteinase. Inthis conformation, SERPINA3 can bind Aβ, thus imposinga β-strand conformation that upon dissociation leads to afaster formation of fibrils [86]. Therefore, an intriguing hy-pothesis may be envisioned in which PrP conversion intoβ-sheet conformation can be assisted by SERPINA3,which would accelerate the formation of toxic species likePrP oligomers.Transthyretin, a protein in the same pathway of acute
phase response as SERPINA3, was found to be up-regulated at the transcription level in our BSE-infectedmacaques according to the SYBR® Green assay. Eventhough we were not able to confirm the statistical sig-nificance using the TaqMan® assay, this gene seems to beof interest. Indeed, TTR, carrier of the thyroid hormonethyroxine (T4) in serum and CSF, is associated withsystemic amyloidosis in humans [92], but also with ananti-amyloidogenic effect preventing Aβ deposition inneuronal cell cultures [93]. Moreover, increased mRNAand protein levels have been shown in neurons from theAD mouse model ‘APP23’ and in human AD brain witha neuroprotective role [94,95]. Even in prion modelsTTR levels have been found strongly increased in thecortex of scrapie-infected mice [15]. Our study now pro-vides indication that up-regulation of TTR may also befound in BSE-infected macaques, further reinforcing thehypothesis of a common mechanism in AD and TSEs.Taken together, these data may suggest innate immunesystem activation and inflammatory response in thesediseases [96], leading to a sustained up-regulation ofboth SERPINA3 and TTR genes simultaneously: SER-PINA3 as inflammation effect, TTR as attempt toneutralize the infectious agent preventing its deposition.However, analysis of the microarray data did not revealrelevant deregulation of other genes typically involved inneuroinflammation and/or immune response, such ascytokines and other mediators. Even though some au-thors have reported alteration of these pathways [97], inour array IL6, TNFα, GFAP and CD68 showed a foldchange < |2|, suggesting that inflammatory responsesmay not be particularly severe in this model.One last point that remains to be addressed is the ex-
pression of the prion protein gene itself (PRNP inhumans) upon infection. Because of shortage of cDNA,we were not able to validate its levels in our samples.Nevertheless, our microarray data did not identify anychanges between control and infected samples, at leastat the mRNA level. This is in agreement with findingsreported for BSE-infected cattle [3], but differs from thesituation in sporadic CJD patients who show reducedmRNA expression [97]. Whether this disagreement isrelated to the host or the infectious agent needs to beexplored.
ConclusionsTo our knowledge, this is the first genome-wide expres-sion study in the gyrus frontalis superior region of cyno-molgus macaques inoculated with BSE. Using microarrayand RT-qPCR technologies we identified a gene signatureable to distinguish infected macaques from control ani-mals. These results could be extremely helpful in under-standing the progression of the disease, allowing for theidentification of some key players which, if not being thecause of the onset, could be some of the target genes af-fected by the disease. Therefore, after deeper investiga-tions to validate these targets at the protein level andconfirm their specificity for prion diseases, they may beexploited as potential biomarkers to set up pre-clinicaldiagnostic tests.In particular, our findings support the hypothesis of a
potential shared mechanism underlying the onset andthe development of all neurodegenerative disorders, asthe majority of our DEGs are known to be involved inother diseases such as AD or PD. This is in concordancewith very recent data supporting the idea of a unifyingrole of prions in these diseases in general and maybe aprion-like behavior for most neurodegenerative disorders[98]. Furthermore, some of the DEG transcripts we foundare present also in blood (hemoglobin, transthyretin, ser-pin peptidase inhibitor) and among them hemoglobin ex-hibited decreased expression throughout the entire courseof the infection, including preclinical time points, inmouse models. Therefore, there is the intriguing possibil-ity to employ these "readily available" biomarkers for diag-nostic purposes, especially if additional studies willconfirm the expression level of the proteins encoded bythese DEGs in brain and/or blood tissue.In general, our results suggest that, in order to identify
potential biomarkers and drug targets for prion diseasesand other neurodegenerative disorders, a combination ofvarious pathways has to be targeted, including oxygenhomeostasis, lipid metabolism and inflammation response.In summary, large-scale transcriptome analyses of hu-
man TSEs are rare [97,99] and primate models are avalid approach to better understand the mechanisms ofthese fatal diseases. Even with all the limitations dis-cussed above, our BSE-infected macaques are, to ourknowledge, the closest available model for human vCJDand these results, obtained with an unbiased metho-dology as the gene expression microarray technology,are contributing to shed some light on the molecularbasis of TSEs as well as neurodegeneration as a whole.
MethodsEthics statementEthics approval for the study was issued by the LowerSaxony Ministry for consumer protection and foodsafety (509.42502/08/07.98). Animal experimentation
Barbisin et al. BMC Genomics 2014, 15:434 Page 11 of 17http://www.biomedcentral.com/1471-2164/15/434
was performed in accordance with section 8 of the GermanAnimal Protection Law in compliance with EC Directive86/609.
SamplesSamples were derived from six BSE-infected macaques,Macaca fascicularis (A1 to A6) that were intracraniallyinoculated with a single dose of 50 mg brain homoge-nate (10% wt/vol) [33,37]. One cynomolgus macaque(B6) was orally inoculated with the same material; inocu-lation was performed per os, as single dose.Brain material from five age- and sex-matched non-
infected cynomolgus macaques (CovA, CovB, CovC, CovD1,CovD2) was obtained from Covance Laboratory MünsterGmbH and processed in an equivalent manner.
Tissue and RNA extractionAt autopsy of seven BSE-infected cynomolgus macaques atadvanced stage of disease and five non-infected control ani-mals, one hemisphere of the brain was sliced dorso-ventrallyand snap-frozen on dry-ice plates. The gyrus frontalis superiorregion was macroscopically identified on the frozen tissue andremoved via a biopsy stamp. Total RNA (RNA>200 bases)was isolated by manually homogenizing the material withmicro pestles (Kisker Biotech GmbH) in TRIzol (Invitro-gen). RNA isolation was performed according to the sup-plier’s instructions. Following RNA isolation, a DNase Idigestion was performed using 1 unit of enzyme per μgRNA (Fermentas) for 30 min at 37°C, and heat inactivatedfor 5 min at 95°C followed by precipitation with SodiumAcetate/Ethanol. RNA was checked for quantity and purityon a Spectrophotometer 2000 (PEQLAB) and for integrity ofthe 18S and 28S ribosomal bands by capillary electro-phoresis using the 2100 Bioanalyzer (Agilent Technologies).
Immunoblot analysisPK-treated (50 μg/mL for 1 hour at 37°C) and untreatedbrain homogenates corresponding to 0.7 mg or 0.3 mgbrain tissue, respectively, were separated on 12% Bis/TrisAcrylamide gels (NuPAGE, Invitrogen) and transferredto nitrocellulose membranes (Protran, Schleicher &Schüll, Germany). Detection of macaque PrPSc was per-formed using the monoclonal anti-PrP antibody 11C6and a Peroxidase conjugated anti-mouse IgG-antibody(Sigma-Aldrich, Germany). Signal was visualized using achemiluminescent substrate (Super Signal West Pico,Pierce) and high sensitivity films (Amersham). Densito-metric analysis of PrPSc was performed using the ImageJ program 1.37v.
Microarray analysis using the GeneChip® Rhesus Macaquegenome arraySamples were labeled using the GeneChip® 3’IVT Ex-press Kit (Affymetrix®). Reverse transcription of RNA
was performed using 500 ng of total RNA to synthesizefirst-strand cDNA. This cDNA was then converted intoa double-stranded DNA template for transcription. Invitro transcription included a linear RNA amplification(aRNA) and the incorporation of a biotin-conjugatednucleotide. The aRNA was then purified to remove un-incorporated NTPs, salts, enzymes, and inorganic phos-phate. The labeled aRNA of each animal was fragmented(50–100 bp) and hybridized to a GeneChip® Rhesus Ma-caque Genome Array (Cat N° 900656; Affymetrix®). Thedegree of fragmentation and the length distribution ofthe aRNA were checked by capillary electrophoresis usingthe Agilent 2100 Bioanalyzer (Agilent Technologies).The hybridization was performed for 16 h at 1 × g
and 45°C in the GeneChip® Hybridization Oven 640(Affymetrix®). Washing and staining of the arrays wereperformed on the Gene Chip® Fluidics Station 450(Affymetrix®) according to the manufacturer's recommen-dations. The antibody signal amplification and washingand staining protocol were used to stain the arrays withstreptavidin R-phycoerythrin (SAPE; Invitrogen). To amp-lify staining, SAPE solution was added twice with a bio-tinylated anti-streptavidin antibody (Vector Laboratories,Burlingame, CA, USA) staining step in-between. Arrayswere scanned using the GeneChip® Scanner 3000 7G(Affymetrix®).
Microarray data analysisIntensity data from the CEL. files were imported to thePartek® software including a quality control based on in-ternal controls. All chips passed the quality control andwere analyzed using the Limma package [100] of Bio-conductor [101,102] and the Partek® software. Themicroarray data discussed in this paper were generatedconforming to the MIAME guidelines and are depositedin the NCBI’s Gene Expression Omnibus (GEO) data-base [103]. They are accessible through GEO series ac-cession number GSE52436 (see section: Availability ofsupporting data).The microarray data analysis consisted of the following
steps: 1. quantile method normalization, 2. global clus-tering and PCA-analysis, 3. fitting the data to a linearmodel, 4. detection of differential gene expression and 5.over-representation analysis of differentially expressedgenes. Quantile-normalization was applied to the log2-transformed intensity values as a method for between-array normalization to ensure that the intensities hadsimilar distributions across arrays.For cluster analysis, we used a hierarchical approach
with the average linkage-method. Distances were mea-sured as 1 - Pearson's Correlation Coefficient. The PCAwas performed using the princomp-function in thePartek® software. To estimate the average group valuesfor each gene and assess differential gene expression, a
Barbisin et al. BMC Genomics 2014, 15:434 Page 12 of 17http://www.biomedcentral.com/1471-2164/15/434

simple linear model was fitted to the data, and group-value averages and standard deviations for each genewere obtained. To find genes with significant expressionchanges between groups, empirical Bayes statistics wereapplied to the data by moderating the standard errors ofthe estimated values [100].P-values were obtained from the moderated t-statistic
and corrected for multiple testing with the Benjamini–Hochberg method [104]. The p-value adjustment guaran-tees a smaller number of false positive findings by control-ling the false discovery rate (FDR). For each gene, the nullhypothesis, that there is no differential expression betweendegradation levels, was rejected when its FDR was lowerthan 0.05. Because no candidates appeared using FDR0.05, we made the selection using another p-value(unadjusted p-value ≤ 0.005) and a fold change ≥ |2|.
Reverse transcription and RT-qPCRValidation by quantitative reverse transcription real-timePCR (RT-qPCR) was performed using gene-specific pri-mer pairs. cDNA synthesis was accomplished using100 ng RNA, 10 ng random hexamer primer, 2 mMdNTPs, 0.5 U RNase inhibitor and 5 U reverse tran-scriptase (Bioline) in 1× reaction buffer. For each samplea negative control was carried along by omission of thereverse transcriptase (−RT control).The cDNA was diluted 1:10 prior to RT-qPCR. Ten ng
RNA equivalent was added to the reaction mix including2× iQ™ SYBR® Green Supermix (Bio-Rad Laboratories,Inc.), 400 nM of the corresponding forward and reverseprimer (Sigma), and quantified in technical triplicates onan iQ5 Multicolor Real-Time PCR Detection System(Bio-Rad Laboratories, Inc.). All primers used for RT-qPCR are listed in Table 3.After initial denaturation for 3 min at 95°C, 45 cy-
cles were performed at 95°C for 15 sec and 58°C for1 min. Differential gene expression of candidates wasnormalized to GAPDH and ACTB expression. –RTcontrols were included in the plates for each primerpair and sample. The relative expression ratio wascalculated using the ΔΔCT method [105,106]. Signifi-cance was calculated with the unpaired student t-test(p < 0.05). Melting curve analysis and gel electrophor-esis of amplification products were performed foreach primer pair to verify that artificial products orprimer dimers were not responsible for the signalsobtained. Some results were further confirmed usingTaqMan® MGB probes and iQ™ Multiplex Powermix(Bio-Rad Laboratories, Inc.). The primer sequences,the reaction setup and the cycling conditions werethe same as described above.The probe sequences used for the detection of specific
targets were:
GAPDH: 5’-FAM CTGGCCAAGGTCATCCATGA-3’;ACTB: 5’-FAM-ACAAGATGAGATTGGCATGGC-3’;HBB: 5’-FAM-AAGTGCTTGGTGCCTTTAGTGATGG-3’;HBA2: 5’-FAM-TGGCGAGTATGGTGCGGAGG-3’;SERPINA3: 5’-FAM-TTCCTGGCCCCTGTGATCCC-3’;TTR: 5’-FAM-ATCGTTGGCTGTGAATACCACCTCTG-3’;APOC1: 5’-FAM-TGGAGGACAAGGCTTGGGAAGTG-3’.
Availability of supporting dataThe microarray data set supporting the results of thisarticle is available in the Gene Expression Omnibus(GEO) repository, [http://www.ncbi.nlm.nih.gov/geo/query/acc.cgi?token=wnmjowqqhrcpzod&acc=GSE52436].The DEGs were analyzed for their functions, pathways
and networks using Ingenuity Pathways Analysis-IPA®[http://www.ingenuity.com/products/ipa/try-ipa-for-free].
Additional files
Additional file 1: List of 86 differentially expressed probe sets withp values ≤ 0.005 and FC ≥ │2│. Probe ID, Gene Symbol, Gene Name andRefSeq Transcript IDs annotation as of release 29 of the Affymetrix®Rhesus Annotation library (01/July/09). P-values and fold changes arereported for all 86 probe sets.
Additional file 2: List of 97 differentially expressed probe setsselected as RT-qPCR candidates. Probe IDs and Previous Gene Symbolannotation as of release 29 of the Affymetrix® Rhesus Annotation library(01/July/09). Current Gene Symbol annotation as of the latest Affymetrix®Rhesus Annotation library (release 32 - 09/June/11). Gene Name andRefSeq Transcript IDs as of Ensembl release 72 (June 2013). Annotationusing alignment with the human genome has been performed (as statedin the gene name column) for the most highly regulated probe sets withunknown macaque annotation. P-values and fold changes are reportedfor all genes.
Additional file 3: Evaluation of reference gene expression stabilityacross non-infected and BSE-infected samples. For each sample,average values of absolute CTs (+/−SD) of triplicate wells for GAPDH(grey) and ACTB (white) are shown.
Additional file 4: ΔCT values for all genes showing variabilityamong BSE-infected samples. ΔCT values (+/−SD) normalized againstGAPDH. Very similar results were obtained with normalization againstACTB (data not shown).
Additional file 5: ΔCT values for all genes showing variabilityamong non-infected samples. ΔCT values (+/−SD) normalized againstGAPDH. Very similar results were obtained with normalization againstACTB (data not shown).
Additional file 6: ΔΔCT values of selected genes in the infectedsamples. ΔΔCT values (+/−SD) for HBB, NR4A2, NCAM1, USP16 andAKR1C1 normalized against GAPDH in the orally-infected animal B6 (white)compared to intracranially infected samples A1-A6 (grey). Only 5 genes wereanalyzed for animal B6 due to shortage of cDNA.
Additional file 7: Cluster analysis. Cluster analysis was performed usinga hierarchical approach with the average linkage-method for all animals(panel A) or excluding the orally infected one, B6 (panel B).
Additional file 8: SYBR® Green-based RT-qPCR validation of microarrayresults. Relative expression levels of 11 genes in BSE-infected cynomolgusmacaques normalized against ACTB as reference gene.
Additional file 9: Comparison between SYBR® Green -based andTaqMan® probe-based results for TTR. Average values of absolute CTs
(+/− SD) of triplicate wells for TTR obtained with SYBR® Green (grey) andTaqMan® probe (white) detection methods inBSE-infected samples are shown.
Barbisin et al. BMC Genomics 2014, 15:434 Page 13 of 17http://www.biomedcentral.com/1471-2164/15/434

Additional file 10: RT-qPCR analysis of blood specific marker RHAG.CT values for the erythrocyte marker RHAG were monitored acrossBSE-infected (solid fill) and non-infected (dotted fill) samples. Humanblood cDNA was used as positive control (gradient fill). Note that foralmost all the samples CT values were ≥ 35 therefore indicating a verylow expression level. Primer sequence (3’-5’): RHAG: F = AGGCAAGCTCAACATGGTTC, R = GGGTGAATTGCCATATCCGC.
Additional file 11: RT-qPCR analysis of blood specific markerALAS2. CT values for the erythrocyte marker ALAS2 were monitoredacross BSE-infected (solid fill) and non-infected (dotted fill) samples.Human blood cDNA was used as positive control (gradient fill). Note thatfor almost all the samples CT values were≥ 35 therefore indicating a verylow expression level. Primer sequence (3’-5’): ALAS2: F = TCCCTTCATGCTGTCGGAAC, R = GAGCTAGGCAGATCTGTTTTGAA.
AbbreviationsRT-qPCR: Reverse transcriptase quantitative polymerase chain reaction;HBB: Hemoglobin, beta; HBA2: Hemoglobin, alpha 2; TTR: Transthyretin;APOC1: Apolipoprotein C-I; SERPINA3: serpin peptidase inhibitor, clade A (alpha-1antiproteinase, antitrypsin), member 3; TSE: Transmissible spongiformencephalopathy; CJD: Creutzfeldt-Jakob disease; GSS: Gerstmann-Sträussler-Scheinker syndrome; FFI: Fatal familial insomnia; BSE: Bovine spongiformencephalopathy; CWD: Chronic wasting disease; FSE: Feline spongiformencephalopathy; PrPC: Cellular prion protein; PrPSc: Scrapie prion protein;PRNP: Prion protein; ER: Endoplasmic reticulum; DEG: Differentially expressedgene; RIN: RNA integrity number; FDR: False discovery rate; IPA: Ingenuitypathways analysis; GAPDH: Glyceraldehyde-3-phosphate dehydrogenase;ACTB: Actin, beta; AKR1C1: Aldo-keto reductase family 1, member C1;NCAM1: Neural cell adhesion molecule 1; USP16: Ubiquitin specific peptidase 16;NR4A2: Nuclear receptor subfamily 4, group A, member 2; ALAS2:Aminolevulinate, delta-, synthase 2; RHAG: Rh-associated glycoprotein; FC: Foldchange; Hb: Hemoglobin; SN: Substantia nigra; PD: Parkinson's disease;MS: Multiple sclerosis; AD: Alzheimer’s disease; AGD: Argyrophilic grain disease;DLB: Dementia with Lewy bodies; Hpt: Haptoglobin; CNS: Central nervoussystem; HDAC: Histone deacetylase; APP: Amyloid beta precursor protein;PS1: Presenilin 1; RML: Rocky mountain laboratory; Aβ: Amyloid beta; HDL: Highdensity lipoprotein; LDL: Low density lipoprotein; APOE: Apolipoprotein E;LOAD: Late onset Alzheimer’s disease; IRF3: Interferon regulatory factor 3;vCJD: Variant Creutzfeldt-Jakob disease; DNase I: Deoxyribonuclease I; dNTP:2'-deoxynucleoside 5'-triphosphate; MGB: Minor groove binder; PCA: Principalcomponent analysis; PK: Proteinase K.
Competing interestsThe authors declare that they have no competing interests.
Authors’ contributionsMB conceived and designed the RT-qPCR validation studies, carried out theinitial optimization experiments, supervised all the experiments as well as thedata interpretation, and wrote the manuscript. SV carried out the functionalclassification of the DEGs, performed most of the RT-qPCR experiments withthe related statistical analysis, and provided the initial draft of the manuscript.ACS performed RNA isolation and cDNA preparation of BSE-infected andnon-infected brain material, and contributed to the drafting of the manuscript.JM performed the immunoblot analysis. DM provided tissues and contributedto the drafting of the manuscript. GSR and LO performed microarrays andprimary data analysis. GL conceived and designed the whole project,contributed to the drafting of the manuscript and gave final approval of theversion to be published. All authors read and approved the final manuscript.
AcknowledgementsThe authors wish to thank Dr. Lisa Gasperini for the RT-qPCR initial technicalsupport, Dr. Paolo Vatta for suggestions on primer design and usefuldiscussions, and Prof. Stefano Gustincich for useful discussions. This work wassupported by the European Regional Development Fund, Cross-BorderCooperation Italy–Slovenia, Programme 2007–2013, Strategic ProjectTRANS2CARE to GL and by the European Community’s Seventh FrameworkProgramme (FP7/2007–2013) under grant agreement n° 222887—thePRIORITY project to GL. Samples were derived from an EU study supportedby grants QLK1-CT-2002-01096 and BMH4-CT-98-6029.
Author details1Department of Neuroscience, Scuola Internazionale Superiore di StudiAvanzati (SISSA), Via Bonomea 265, 34136 Trieste, Italy. 2Unit of InfectionModels, German Primate Center, Kellnerweg 4, 37077 Göttingen, Germany.3Microarray Core Facility, University Medical Center Göttingen,Justus-von-Liebig-Weg 11, 37077 Göttingen, Germany. 4Molecular and CellPhysiology, Hannover Medical School, Carl-Neuberg Str. 1, D-30625Hannover, Germany.
Received: 13 January 2014 Accepted: 7 May 2014Published: 5 June 2014
References1. Prusiner SB: Prions. Proc Natl Acad Sci U S A 1998, 95(23):13363–13383.2. Colby DW, Prusiner SB: Prions. Cold Spring Harbor Perspect Biol 2011,
3(1):a006833.3. Tang Y, Xiang W, Hawkins SA, Kretzschmar HA, Windl O: Transcriptional
changes in the brains of cattle orally infected with the bovinespongiform encephalopathy agent precede detection of infectivity.J Virol 2009, 83(1):9464–9473.
4. Filali H, Vidal E, Bolea R, Marquez M, Marco P, Vargas A, Pumarola M,Martin-Burriel I, Badiola JJ: Gene and protein patterns of potentialprion-related markers in the central nervous system of clinical andpreclinical infected sheep. Vet Res 2013, 44(3):14.
5. Basu U, Almeida LM, Dudas S, Graham CE, Czub S, Moore SS, Guan LL:Gene expression alterations in rocky mountain elk infected with chronicwasting disease. Prion 2012, 6(3):282–301.
6. Basu U, Guan LL, Moore SS: Functional genomics approach foridentification of molecular processes underlying neurodegenerativedisorders in prion diseases. Curr Genomics 2012, 13(5):369–378.
7. Legname G, Nguyen HO, Peretz D, Cohen FE, DeArmond SJ, Prusiner SB:Continuum of prion protein structures enciphers a multitude of prionisolate-specified phenotypes. Proc Natl Acad Sci U S A 2006,103(50):19105–19110.
8. Collinge J, Clarke AR: A general model of prion strains and theirpathogenicity. Science 2007, 318(5852):930–936.
9. Deleault NR, Piro JR, Walsh DJ, Wang F, Ma J, Geoghegan JC, SupattaponeS: Isolation of phosphatidylethanolamine as a solitary cofactor for prionformation in the absence of nucleic acids. Proc Natl Acad Sci U S A 2012,109(22):8546–8551.
10. Deleault NR, Walsh DJ, Piro JR, Wang F, Wang X, Ma J, Rees JR, SupattaponeS: Cofactor molecules maintain infectious conformation and restrictstrain properties in purified prions. Proc Natl Acad Sci U S A 2012,109(28):E1938–E1946.
11. Miller MB, Wang DW, Wang F, Noble GP, Ma J, Woods VL Jr, Li S,Supattapone S: Cofactor molecules induce structural transformationduring infectious prion formation. Structure 2013, 21(11):2061–2068.
12. Benetti F, Gustincich S, Legname G: Gene expression profiling andtherapeutic interventions in neurodegenerative diseases: acomprehensive study on potentiality and limits. Expert Opin Drug Discov2012, 7(3):245–259.
13. Booth S, Bowman C, Baumgartner R, Sorensen G, Robertson C, Coulthart M,Phillipson C, Somorjai RL: Identification of central nervous system genesinvolved in the host response to the scrapie agent during preclinicaland clinical infection. J Gen Virol 2004, 85(Pt 11):3459–3471.
14. Kim HO, Snyder GP, Blazey TM, Race RE, Chesebro B, Skinner PJ: Priondisease induced alterations in gene expression in spleen and brain priorto clinical symptoms. Adv Appl Bioinform Chem 2008, 1:29–50.
15. Riemer C, Neidhold S, Burwinkel M, Schwarz A, Schultz J, Kratzschmar J,Monning U, Baier M: Gene expression profiling of scrapie-infected braintissue. Biochem Biophys Res Commun 2004, 323(2):556–564.
16. Xiang W, Windl O, Wunsch G, Dugas M, Kohlmann A, Dierkes N, Westner IM,Kretzschmar HA: Identification of differentially expressed genes inscrapie-infected mouse brains by using global gene expressiontechnology. J Virol 2004, 78(201):11051–11060.
17. Sorensen G, Medina S, Parchaliuk D, Phillipson C, Robertson C, Booth SA:Comprehensive transcriptional profiling of prion infection in mousemodels reveals networks of responsive genes. BMC Genomics 2008, 9:114.
18. Skinner PJ, Abbassi H, Chesebro B, Race RE, Reilly C, Haase AT: Geneexpression alterations in brains of mice infected with three strains ofscrapie. BMC Genomics 2006, 7:114.
Barbisin et al. BMC Genomics 2014, 15:434 Page 14 of 17http://www.biomedcentral.com/1471-2164/15/434

19. Filali H, Martin-Burriel I, Harders F, Varona L, Lyahyai J, Zaragoza P, PumarolaM, Badiola JJ, Bossers A, Bolea R: Gene expression profiling and associationwith prion-related lesions in the medulla oblongata of symptomaticnatural scrapie animals. PLoS One 2011, 6(5):e19909.
20. Hedman C, Lyahyai J, Filali H, Marin B, Serrano C, Monleon E, Moreno B,Zaragoza P, Badiola JJ, Martin-Burriel I, Bolea R: Differential gene expressionand apoptosis markers in presymptomatic scrapie affected sheep. VetMicrobiol 2012, 159(1-2):23–32.
21. Filali H, Martin-Burriel I, Harders F, Varona L, Serrano C, Acin C, Badiola JJ,Bossers A, Bolea R: Medulla oblongata transcriptome changes duringpresymptomatic natural scrapie and their association with prion-relatedlesions. BMC Genomics 2012, 13:399.
22. Filali H, Martin-Burriel I, Harders F, Varona L, Hedman C, Mediano DR,Monzon M, Bossers A, Badiola JJ, Bolea R: Gene expression profiling ofmesenteric lymph nodes from sheep with natural scrapie. BMC Genomics2014, 15:59.
23. Almeida LM, Basu U, Khaniya B, Taniguchi M, Williams JL, Moore SS, GuanLL: Gene expression in the medulla following oral infection of cattle withbovine spongiform encephalopathy. J Toxic Environ Health A 2011,74(2-4):110–126.
24. Khaniya B, Almeida L, Basu U, Taniguchi M, Williams JL, Barreda DR, MooreSS, Guan LL: Microarray analysis of differentially expressed genes fromPeyer's patches of cattle orally challenged with bovine spongiformencephalopathy. J Toxic Environ Health A 2009, 72(17-18):1008–1013.
25. Almeida LM, Basu U, Williams JL, Moore SS, Guan LL: Microarray analysis incaudal medulla of cattle orally challenged with bovine spongiformencephalopathy. Genet Mol Res 2011, 10(4):3948–3962.
26. Tang Y, Xiang W, Terry L, Kretzschmar HA, Windl O: Transcriptional analysisimplicates endoplasmic reticulum stress in bovine spongiformencephalopathy. PLoS One 2010, 5(12):e14207.
27. Basu U, Almeida L, Olson NE, Meng Y, Williams JL, Moore SS, Guan LL:Transcriptome analysis of the medulla tissue from cattle in response tobovine spongiform encephalopathy using digital gene expression tagprofiling. J Toxic Environ Health A 2011, 74(2-4):127–137.
28. Panelli S, Strozzi F, Capoferri R, Barbieri I, Martinelli N, Capucci L, LombardiG, Williams JL: Analysis of gene expression in white blood cells of cattleorally challenged with bovine amyloidotic spongiform encephalopathy.J Toxic Environ Health A 2011, 74(2-4):96–102.
29. Race B, Meade-White KD, Miller MW, Barbian KD, Rubenstein R, LaFauci G,Cervenakova L, Favara C, Gardner D, Long D, Parnell M, Striebel J, Priola SA,Ward A, Williams ES, Race R, Chesebro B: Susceptibilities of nonhumanprimates to chronic wasting disease. Emerg Infect Dis 2009, 15(9):1366–1376.
30. Greenwood AD, Vincendeau M, Schmadicke AC, Montag J, Seifarth W, MotzkusD: Bovine spongiform encephalopathy infection alters endogenousretrovirus expression in distinct brain regions of cynomolgus macaques(Macaca fascicularis). Mol Neurodegener 2011, 6(1):44.
31. Montag J, Hitt R, Opitz L, Schulz-Schaeffer WJ, Hunsmann G, Motzkus D:Upregulation of miRNA hsa-miR-342-3p in experimental and idiopathicprion disease. Mol Neurodegener 2009, 4:36.
32. Herzog C, Riviere J, Lescoutra-Etchegaray N, Charbonnier A, Leblanc V, SalesN, Deslys JP, Lasmezas CI: PrPTSE distribution in a primate model ofvariant, sporadic, and iatrogenic Creutzfeldt-Jakob disease. J Virol 2005,79(22):14339–14345.
33. Montag J, Schulz-Schaeffer W, Schrod A, Hunsmann G, Motzkus D:Asynchronous onset of clinical disease in BSE-infected Macaques. EmergInfect Dis 2013, 19(7):1125–1127.
34. Tamguney G, Giles K, Glidden DV, Lessard P, Wille H, Tremblay P, Groth DF,Yehiely F, Korth C, Moore RC, Tatzelt J, Rubinstein E, Boucheix C, Yang X,Stanley P, Lisanti MP, Dwek RA, Rudd PM, Moskovitz J, Epstein CJ, Cruz TD,Kuziel WA, Maeda N, Sap J, Ashe KH, Carlson GA, Tesseur I, Wyss-Coray T,Mucke L, Weisgraber KH, et al: Genes contributing to prion pathogenesis.J Gen Virol 2008, 89(Pt 7):1777–1788.
35. Lasmézas CI, Comoy E, Hawkins S, Herzog C, Mouthon F, Konold T, Auvré F,Correia E, Lescoutra-Etchegaray N, Salès N, Wells G, Brown P, Deslys J-P:Risk of oral infection with bovine spongiform encephalopathy agent inprimates. Lancet 2005, 365(9461):781–783.
36. Holznagel E, Yutzy B, Schulz-Schaeffer W, Kruip C, Hahmann U, Bierke P,Torres JM, Kim YS, Thomzig A, Beekes M, Hunsmann G, Loewer J: Foodbornetransmission of bovine spongiform encephalopathy to nonhumanprimates. Emerg Infect Dis 2013, 19(5):712–720.
37. Yutzy B, Holznagel E, Coulibaly C, Stuke A, Hahmann U, Deslys JP,Hunsmann G, Lower J: Time-course studies of 14-3-3 protein isoforms incerebrospinal fluid and brain of primates after oral or intracerebralinfection with bovine spongiform encephalopathy agent. J Gen Virol2007, 88(Pt 22):3469–3478.
38. Cali I, Castellani R, Alshekhlee A, Cohen Y, Blevins J, Yuan J, Langeveld JP,Parchi P, Safar JG, Zou WQ, Gambetti P: Co-existence of scrapie prionprotein types 1 and 2 in sporadic Creutzfeldt-Jakob disease: its effect onthe phenotype and prion-type characteristics. Brain 2009,132(Pt 10):2643–2658.
39. Parchi P, Castellani R, Capellari S, Ghetti B, Young K, Chen SG, Farlow M,Dickson DW, Sima AA, Trojanowski JQ, Petersen RB, Gambetti P: Molecularbasis of phenotypic variability in sporadic Creutzfeldt-Jakob disease.Ann Neurol 1996, 39(6):767–778.
40. Antonell A, Llado A, Altirriba J, Botta-Orfila T, Balasa M, Fernandez M, FerrerI, Sanchez-Valle R, Molinuevo JL: A preliminary study of the whole-genomeexpression profile of sporadic and monogenic early-onset Alzheimer'sdisease. Neurobiol Aging 2013, 34(7):1772–1778.
41. Osada N, Uno Y, Mineta K, Kameoka Y, Takahashi I, Terao K: Ancient genome-wide admixture extends beyond the current hybrid zone between Macacafascicularis and M. mulatta. Mol Ecol 2010, 19(14):2884–2895.
42. Osada N, Hashimoto K, Kameoka Y, Hirata M, Tanuma R, Uno Y, Inoue I,Hida M, Suzuki Y, Sugano S, Terao K, Kusuda J, Takahashi I: Large-scaleanalysis of Macaca fascicularis transcripts and inference of geneticdivergence between M. fascicularis and M. mulatta. BMC Genomics 2008,9:90.
43. Zhang Y, Dufort I, Rheault P, Luu-The V: Characterization of a human20alpha-hydroxysteroid dehydrogenase. J Mol Endocrinol 2000,25(2):221–228.
44. Ferrer I, Gomez A, Carmona M, Huesa G, Porta S, Riera-Codina M, Biagioli M,Gustincich S, Aso E: Neuronal hemoglobin is reduced in Alzheimer'sdisease, argyrophilic grain disease, Parkinson's disease, and dementiawith Lewy bodies. J Alzheimers Dis 2011, 23(3):537–550.
45. Schmitt-Ulms G, Legname G, Baldwin MA, Ball HL, Bradon N, Bosque PJ,Crossin KL, Edelman GM, DeArmond SJ, Cohen FE, Prusiner SB: Binding ofneural cell adhesion molecules (N-CAMs) to the cellular prion protein.J Mol Biol 2001, 314(5):1209–1225.
46. Le WD, Xu P, Jankovic J, Jiang H, Appel SH, Smith RG, Vassilatis DK:Mutations in NR4A2 associated with familial Parkinson disease. Nat Genet2003, 33(1):85–89.
47. Xing G, Zhang L, Russell S, Post R: Reduction of dopamine-relatedtranscription factors Nurr1 and NGFI-B in the prefrontal cortex inschizophrenia and bipolar disorders. Schizophr Res 2006, 84(1):36–56.
48. Shanbhag NM, Rafalska-Metcalf IU, Balane-Bolivar C, Janicki SM, GreenbergRA: ATM-dependent chromatin changes silence transcription in cis toDNA double-strand breaks. Cell 2010, 141(6):970–981.
49. Soontornniyomkij V, Risbrough VB, Young JW, Soontornniyomkij B, Jeste DV,Achim CL: Hippocampal calbindin-1 immunoreactivity correlate ofrecognition memory performance in aged mice. Neurosci Lett 2012,516(1):161–165.
50. Backman M, Machon O, Van Den Bout CJ, Krauss S: Targeted disruption ofmouse Dach1 results in postnatal lethality. Dev Dyn 2003, 226(1):139–144.
51. Liu Q, Yu L, Gao J, Fu Q, Zhang J, Zhang P, Chen J, Zhao S: Cloning, tissueexpression pattern and genomic organization of latexin, a humanhomologue of rat carboxypeptidase A inhibitor. Mol Biol Rep 2000,27(4):241–246.
52. Silver M, Janousova E, Hua X, Thompson PM, Montana G, Alzheimer'sDisease Neuroimaging I: Identification of gene pathways implicated inAlzheimer's disease using longitudinal imaging phenotypes with sparseregression. NeuroImage 2012, 63(3):1681–1694.
53. Guttula SV, Allam A, Gumpeny RS: Analyzing microarray data ofAlzheimer's using cluster analysis to identify the biomarker genes.Int J Alzheimers Dis 2012, 2012:649456.
54. Saetre P, Emilsson L, Axelsson E, Kreuger J, Lindholm E, Jazin E:Inflammation-related genes up-regulated in schizophrenia brains. BMCPsychiatry 2007, 7:46.
55. Kamboh MI, Minster RL, Kenney M, Ozturk A, Desai PP, Kammerer CM,DeKosky ST: Alpha-1-antichymotrypsin (ACT or SERPINA3) polymorphismmay affect age-at-onset and disease duration of Alzheimer's disease.Neurobiol Aging 2006, 27(10):1435–1439.
Barbisin et al. BMC Genomics 2014, 15:434 Page 15 of 17http://www.biomedcentral.com/1471-2164/15/434

56. Mc Guire C, Beyaert R, van Loo G: Death receptor signalling in centralnervous system inflammation and demyelination. Trends Neurosci 2011,34(12):619–628.
57. Stevenson TJ, Hahn TP, MacDougall-Shackleton SA, Ball GF: Gonadotropin-releasing hormone plasticity: a comparative perspective. FrontNeuroendocrinol 2012, 33(3):287–300.
58. Ishibashi D, Atarashi R, Fuse T, Nakagaki T, Yamaguchi N, Satoh K, Honda K,Nishida N: Protective role of interferon regulatory factor 3-mediatedsignaling against prion infection. J Virol 2012, 86(9):4947–4955.
59. Lucatelli JF, Barros AC, Silva VK, Machado Fda S, Constantin PC, Dias AA,Hutz MH, de Andrade FM: Genetic influences on Alzheimer's disease:evidence of interactions between the genes APOE, APOC1 and ACE in asample population from the South of Brazil. Neurochem Res 2011,36(8):1533–1539.
60. Li X, Buxbaum JN: Transthyretin and the brain re-visited: is neuronalsynthesis of transthyretin protective in Alzheimer's disease? MolNeurodegener 2011, 6:79.
61. Noriega NC, Kohama SG, Urbanski HF: Microarray analysis of relative geneexpression stability for selection of internal reference genes in therhesus macaque brain. BMC Mol Biol 2010, 11:47.
62. Kabanova S, Kleinbongard P, Volkmer J, Andree B, Kelm M, Jax TW:Gene expression analysis of human red blood cells. Int J Med Sci 2009,6(4):156–159.
63. Cosseddu GM, Andreoletti O, Maestrale C, Robert B, Ligios C, Piumi F,Agrimi U, Vaiman D: Gene expression profiling on sheep brain revealsdifferential transcripts in scrapie-affected/not-affected animals. Brain Res2007, 1142:217–222.
64. Brown AR, Rebus S, McKimmie CS, Robertson K, Williams A, Fazakerley JK:Gene expression profiling of the preclinical scrapie-infected hippocampus.Biochem Biophys Res Commun 2005, 334(1):86–95.
65. Liang WS, Dunckley T, Beach TG, Grover A, Mastroeni D, Ramsey K, CaselliRJ, Kukull WA, McKeel D, Morris JC, Hulette CM, Schmechel D, Reiman EM,Rogers J, Stephan DA: Altered neuronal gene expression in brain regionsdifferentially affected by Alzheimer's disease: a reference data set. PhysiolGenomics 2008, 33(2):240–256.
66. Koechlin E, Hyafil A: Anterior prefrontal function and the limits of humandecision-making. Science 2007, 318(5850):594–598.
67. Langevin C, Andreoletti O, Le Dur A, Laude H, Beringue V: Markedinfluence of the route of infection on prion strain apparent phenotypein a scrapie transgenic mouse model. Neurobiol Dis 2011, 41(1):219–225.
68. Biagioli M, Pinto M, Cesselli D, Zaninello M, Lazarevic D, Roncaglia P, SimoneR, Vlachouli C, Plessy C, Bertin N, Beltrami A, Kobayashi K, Gallo V, Santoro C,Ferrer I, Rivella S, Beltrami CA, Carninci P, Raviola E, Gustincich S:Unexpected expression of alpha- and beta-globin in mesencephalicdopaminergic neurons and glial cells. Proc Natl Acad Sci U S A 2009,106(36):15454–15459.
69. Richter F, Meurers BH, Zhu C, Medvedeva VP, Chesselet MF: Neuronsexpress hemoglobin alpha- and beta-chains in rat and human brains.J Comp Neurol 2009, 515(5):538–547.
70. Broadwater L, Pandit A, Clements R, Azzam S, Vadnal J, Sulak M, Yong VW,Freeman EJ, Gregory RB, McDonough J: Analysis of the mitochondrialproteome in multiple sclerosis cortex. Biochim Biophys Acta 2011,1812(5):630–641.
71. Johnson VE, Stewart W, Smith DH: Traumatic brain injury and amyloid-beta pathology: a link to Alzheimer's disease? Nat Rev Neurosci 2010,11(5):361–370.
72. Wu CW, Liao PC, Yu L, Wang ST, Chen ST, Wu CM, Kuo YM: Hemoglobinpromotes Abeta oligomer formation and localizes in neurons andamyloid deposits. Neurobiol Dis 2004, 17(3):367–377.
73. Cudaback E, Li X, Yang Y, Yoo T, Montine KS, Craft S, Montine TJ, Keene CD:Apolipoprotein C-I is an APOE genotype-dependent suppressor of glialactivation. J Neuroinflammation 2012, 9:192.
74. Ki CS, Na DL, Kim DK, Kim HJ, Kim JW: Genetic association of anapolipoprotein C-I (APOC1) gene polymorphism with late-onsetAlzheimer's disease. Neurosci Lett 2002, 319(2):75–78.
75. Petit-Turcotte C, Stohl SM, Beffert U, Cohn JS, Aumont N, Tremblay M, DeaD, Yang L, Poirier J, Shachter NS: Apolipoprotein C-I expression in thebrain in Alzheimer's disease. Neurobiol Dis 2001, 8(6):953–963.
76. Huang R, Hughes M, Mobley S, Lanham I, Poduslo SE: APOE genotypes inAfrican American female multiple sclerosis patients. Neurosci Lett 2007,414(1):51–56.
77. Xiang W, Hummel M, Mitteregger G, Pace C, Windl O, Mansmann U,Kretzschmar HA: Transcriptome analysis reveals altered cholesterolmetabolism during the neurodegeneration in mouse scrapie model.J Neurochem 2007, 102(3):834–847.
78. Katsel P, Li C, Haroutunian V: Gene expression alterations in thesphingolipid metabolism pathways during progression of dementia andAlzheimer's disease: a shift toward ceramide accumulation at the earliestrecognizable stages of Alzheimer's disease? Neurochem Res 2007,32(4-5):845–856.
79. Bach C, Gilch S, Rost R, Greenwood AD, Horsch M, Hajj GN, Brodesser S,Facius A, Schadler S, Sandhoff K, Beckers J, Leib-Mosch C, Schatzl HM,Vorberg I: Prion-induced activation of cholesterogenic gene expressionby Srebp2 in neuronal cells. J Biol Chem 2009, 284(45):31260–31269.
80. Gilch S, Bach C, Lutzny G, Vorberg I, Schatzl HM: Inhibition of cholesterolrecycling impairs cellular PrP(Sc) propagation. Cell Mol Life Sci 2009,66(24):3979–3991.
81. Leoni V, Shafaati M, Salomon A, Kivipelto M, Bjorkhem I, Wahlund LO:Are the CSF levels of 24S-hydroxycholesterol a sensitive biomarker formild cognitive impairment? Neurosci Lett 2006, 397(1-2):83–87.
82. Taraboulos A, Scott M, Semenov A, Avrahami D, Laszlo L, Prusiner SB:Cholesterol depletion and modification of COOH-terminal targetingsequence of the prion protein inhibit formation of the scrapie isoform.J Cell Biol 1995, 129(1):121–132.
83. Cutler RG, Kelly J, Storie K, Pedersen WA, Tammara A, Hatanpaa K, TroncosoJC, Mattson MP: Involvement of oxidative stress-induced abnormalities inceramide and cholesterol metabolism in brain aging and Alzheimer'sdisease. Proc Natl Acad Sci U S A 2004, 101(7):2070–2075.
84. Refolo LM, Malester B, LaFrancois J, Bryant-Thomas T, Wang R, Tint GS,Sambamurti K, Duff K, Pappolla MA: Hypercholesterolemia accelerates theAlzheimer's amyloid pathology in a transgenic mouse model. NeurobiolDis 2000, 7(4):321–331.
85. Patel NV, Forman BM: Linking lipids, Alzheimer's and LXRs? Nucl ReceptSignal 2004, 2:e001.
86. Janciauskiene S, Wright HT: Inflammation, antichymotrypsin, and lipidmetabolism: autogenic etiology of Alzheimer's disease. Bioessays 1998,20(12):1039–1046.
87. Matsubara E, Hirai S, Amari M, Shoji M, Yamaguchi H, Okamoto K, Ishiguro K,Harigaya Y, Wakabayashi K: Alpha 1-antichymotrypsin as a possiblebiochemical marker for Alzheimer-type dementia. Ann Neurol 1990,28(4):561–567.
88. Akiyama H, Barger S, Barnum S, Bradt B, Bauer J, Cole GM, Cooper NR,Eikelenboom P, Emmerling M, Fiebich BL, Finch CE, Frautschy S, Griffin WS,Hampel H, Hull M, Landreth G, Lue L, Mrak R, Mackenzie IR, McGeer PL,O'Banion MK, Pachter J, Pasinetti G, Plata-Salaman C, Rogers J, Rydel R, ShenY, Streit W, Strohmeyer R, Tooyoma I: Inflammation and Alzheimer'sdisease. Neurobiol Aging 2000, 21(3):383–421.
89. Hwang D, Lee IY, Yoo H, Gehlenborg N, Cho JH, Petritis B, Baxter D, PitstickR, Young R, Spicer D, Price ND, Hohmann JG, Dearmond SJ, Carlson GA,Hood LE: A systems approach to prion disease. Mol Syst Biol 2009, 5:252.
90. Miele G, Seeger H, Marino D, Eberhard R, Heikenwalder M, Stoeck K, BasagniM, Knight R, Green A, Chianini F, Wuthrich RP, Hock C, Zerr I, Aguzzi A:Urinary alpha1-antichymotrypsin: a biomarker of prion infection. PLoSOne 2008, 3(12):e3870.
91. Cray C, Zaias J, Altman NH: Acute phase response in animals: a review.Comp Med 2009, 59(6):517–526.
92. Hanna M: Novel drugs targeting transthyretin amyloidosis. Curr Heart FailRep 2014, 11(11):50–57.
93. Cascella R, Conti S, Mannini B, Li X, Buxbaum JN, Tiribilli B, Chiti F, Cecchi C:Transthyretin suppresses the toxicity of oligomers formed by misfoldedproteins in vitro. Biochim Biophys Acta 2013, 1832(12):2302–2314.
94. Li X, Masliah E, Reixach N, Buxbaum JN: Neuronal production oftransthyretin in human and murine Alzheimer's disease: is it protective?J Neurosci 2011, 31(35):12483–12490.
95. Buxbaum JN, Ye Z, Reixach N, Friske L, Levy C, Das P, Golde T, Masliah E,Roberts AR, Bartfai T: Transthyretin protects Alzheimer's mice from thebehavioral and biochemical effects of Abeta toxicity. Proc Natl Acad Sci U S A2008, 105(7):2681–2686.
96. McGeer PL, McGeer EG: History of innate immunity in neurodegenerativedisorders. Front Pharmacol 2011, 2:77.
97. Llorens F, Ansoleaga B, Garcia-Esparcia P, Zafar S, Grau-Rivera O, Lopez-Gonzalez I, Blanco R, Carmona M, Yague J, Nos C, Del Rio JA, Gelpi E, Zerr I,
Barbisin et al. BMC Genomics 2014, 15:434 Page 16 of 17http://www.biomedcentral.com/1471-2164/15/434

Ferrer I: PrP mRNA and protein expression in brain and PrP(c) in CSF inCreutzfeldt-Jakob disease MM1 and VV2. Prion 2013, 7(5):383–393.
98. Prusiner SB: Cell biology. A unifying role for prions in neurodegenerativediseases. Science 2012, 336(6088):1511–1513.
99. Xiang W, Windl O, Westner IM, Neumann M, Zerr I, Lederer RM, KretzschmarHA: Cerebral gene expression profiles in sporadic Creutzfeldt-Jakobdisease. Ann Neurol 2005, 58(2):242–257.
100. Smyth GK: Linear models and empirical bayes methods for assessingdifferential expression in microarray experiments. Stat Appl Genet Mol Biol2004, 3(1). Article3.
101. Gentleman RC, Carey VJ, Bates DM, Bolstad B, Dettling M, Dudoit S, Ellis B,Gautier L, Ge Y, Gentry J, Hornik K, Hothorn T, Huber W, Iacus S, Irizarry R,Leisch F, Li C, Maechler M, Rossini AJ, Sawitzki G, Smith C, Smyth G, TierneyL, Yang JY, Zhang J: Bioconductor: open software development forcomputational biology and bioinformatics. Genome Biol 2004, 5(10):R80.
102. Irizarry RA, Hobbs B, Collin F, Beazer-Barclay YD, Antonellis KJ, Scherf U,Speed TP: Exploration, normalization, and summaries of high densityoligonucleotide array probe level data. Biostatistics 2003, 4(2):249–264.
103. Edgar R, Domrachev M, Lash AE: Gene expression omnibus: NCBI geneexpression and hybridization array data repository. Nucleic Acids Res 2002,30(1):207–210.
104. Benjamini Y, Hochberg Y: Controlling the false discovery rate - a practicaland powerful approach to multiple testing. J Roy Stat Soc B Met 1995,57(1):289–300.
105. Livak KJ, Schmittgen TD: Analysis of relative gene expression data usingreal-time quantitative PCR and the 2(−Delta Delta C(T)) Method. Methods2001, 25(4):402–408.
106. Winer J, Jung CK, Shackel I, Williams PM: Development and validation ofreal-time quantitative reverse transcriptase-polymerase chain reactionfor monitoring gene expression in cardiac myocytes in vitro. AnalBiochem 1999, 270(1):41–49.
doi:10.1186/1471-2164-15-434Cite this article as: Barbisin et al.: Gene expression profiling of brainsfrom bovine spongiform encephalopathy (BSE)-infected cynomolgusmacaques. BMC Genomics 2014 15:434.
Submit your next manuscript to BioMed Centraland take full advantage of:
• Convenient online submission
• Thorough peer review
• No space constraints or color figure charges
• Immediate publication on acceptance
• Inclusion in PubMed, CAS, Scopus and Google Scholar
• Research which is freely available for redistribution
Submit your manuscript at www.biomedcentral.com/submit
Barbisin et al. BMC Genomics 2014, 15:434 Page 17 of 17http://www.biomedcentral.com/1471-2164/15/434