GAVA: Spectral simulation for in vivo MRS applications
16
GAVA: Spectral Simulation for In Vivo MRS Applications Brian J. Soher Department of Radiology, Duke University Medical Center Karl Young and Aaron Bernstein Department of Radiology, University of California San Francisco/VAMC San Francisco Zakaria Aygula and Andrew A. Maudsley Department of Radiology, Miller School of Medicine, University of Miami Abstract An application that provides a flexible and easy to use interface to the GAMMA spectral simulation package is described that is targeted at investigations using in vivo MR spectroscopic methods. The program makes available a number of widely used spatially-localized MRS pulse sequences and NMR parameters for commonly-observed tissue metabolites, enabling spectra to be simulated for any pulse sequence parameter and viewed in an integrated display. The application is interfaced with a database for storage of all simulation parameters and results of the simulations. This application provides a convenient method for generating a priori spectral information used in parametric spectral analyses and for visual examination of the effects of difference pulse sequences and parameter settings. Keywords MR spectroscopy; spectral simulation; parametric spectral analysis; GAMMA; software 1. Introduction Acquisition and analysis methods for biomedical applications of magnetic resonance spectroscopy (MRS) have changed radically in the past decade with the development of improved spatial localization techniques; improved MR instrumentation suitable for studies in animals and humans; and sophisticated spectral analysis methods that utilize the increased computational capabilities that have become available. For in vivo measurements, MR spectroscopic data is complicated by the inherent overlap and complex shapes of the signals of interest. Methods to improve detection of specific spectral contributions include spectral editing [4,18,28,33,46-48]; spectral fitting using constrained parametric model optimization and incorporating a priori metabolic information [6,7,23,24,31,35,40,45,50]; and use of multidimensional spectral acquisition methods [42-44]. In all of these areas of research, spectral simulation methods are becoming an increasingly important tool. While simulation techniques have been used in scientific studies for decades, only the recent advent of open source tools and increases in desktop computational power have made these Address Correspondence to: Brian J. Soher, Ph.D., Radiology Department, Duke University Medical Center Box 3808, Durham, NC 27710, Tel: 919-684-7350, Email: [email protected] Publisher's Disclaimer: This is a PDF file of an unedited manuscript that has been accepted for publication. As a service to our customers we are providing this early version of the manuscript. The manuscript will undergo copyediting, typesetting, and review of the resulting proof before it is published in its final citable form. Please note that during the production process errorsmaybe discovered which could affect the content, and all legal disclaimers that apply to the journal pertain. NIH Public Access Author Manuscript J Magn Reson. Author manuscript; available in PMC 2008 April 1. Published in final edited form as: J Magn Reson. 2007 April ; 185(2): 291–299. NIH-PA Author Manuscript NIH-PA Author Manuscript NIH-PA Author Manuscript
-
Upload
independent -
Category
Documents
-
view
1 -
download
0
Transcript of GAVA: Spectral simulation for in vivo MRS applications

GAVA: Spectral Simulation for In Vivo MRS Applications
Brian J. SoherDepartment of Radiology, Duke University Medical Center
Karl Young and Aaron BernsteinDepartment of Radiology, University of California San Francisco/VAMC San Francisco
Zakaria Aygula and Andrew A. MaudsleyDepartment of Radiology, Miller School of Medicine, University of Miami
AbstractAn application that provides a flexible and easy to use interface to the GAMMA spectral simulationpackage is described that is targeted at investigations using in vivo MR spectroscopic methods. Theprogram makes available a number of widely used spatially-localized MRS pulse sequences andNMR parameters for commonly-observed tissue metabolites, enabling spectra to be simulated forany pulse sequence parameter and viewed in an integrated display. The application is interfaced witha database for storage of all simulation parameters and results of the simulations. This applicationprovides a convenient method for generating a priori spectral information used in parametric spectralanalyses and for visual examination of the effects of difference pulse sequences and parametersettings.
KeywordsMR spectroscopy; spectral simulation; parametric spectral analysis; GAMMA; software
1. IntroductionAcquisition and analysis methods for biomedical applications of magnetic resonancespectroscopy (MRS) have changed radically in the past decade with the development ofimproved spatial localization techniques; improved MR instrumentation suitable for studies inanimals and humans; and sophisticated spectral analysis methods that utilize the increasedcomputational capabilities that have become available. For in vivo measurements, MRspectroscopic data is complicated by the inherent overlap and complex shapes of the signalsof interest. Methods to improve detection of specific spectral contributions include spectralediting [4,18,28,33,46-48]; spectral fitting using constrained parametric model optimizationand incorporating a priori metabolic information [6,7,23,24,31,35,40,45,50]; and use ofmultidimensional spectral acquisition methods [42-44]. In all of these areas of research,spectral simulation methods are becoming an increasingly important tool.
While simulation techniques have been used in scientific studies for decades, only the recentadvent of open source tools and increases in desktop computational power have made these
Address Correspondence to: Brian J. Soher, Ph.D., Radiology Department, Duke University Medical Center Box 3808, Durham, NC27710, Tel: 919-684-7350, Email: [email protected]'s Disclaimer: This is a PDF file of an unedited manuscript that has been accepted for publication. As a service to our customerswe are providing this early version of the manuscript. The manuscript will undergo copyediting, typesetting, and review of the resultingproof before it is published in its final citable form. Please note that during the production process errorsmaybe discovered which couldaffect the content, and all legal disclaimers that apply to the journal pertain.
NIH Public AccessAuthor ManuscriptJ Magn Reson. Author manuscript; available in PMC 2008 April 1.
Published in final edited form as:J Magn Reson. 2007 April ; 185(2): 291–299.
NIH
-PA Author Manuscript
NIH
-PA Author Manuscript
NIH
-PA Author Manuscript

techniques available to individual investigators. Introduced in 1994 [36], the GAMMA C++library is a flexible and efficient tool for describing and simulating MR experiments. Since theearly 1990s, there have been reports of a number of other NMR simulation libraries [5,16,22]and application tools [1,2,15,17,27,29,32,49] which have sought to provide similarfunctionality in either a more optimized or user friendly fashion. The growth in available toolsreflects the consensus among MR scientists that simulation methods are a necessary anddesirable step in the development of increasingly sophisticated data acquisition/analysismethods for viewing complex molecular systems. Despite the increase in available tools,GAMMA has maintained a strong presence in the field due to its flexibility, performance,straightforward elegant design and standard C++ implementation. There have been numerousreports of spectral simulations that have made use of the GAMMA library [3,8-14,19,21,22,25,26,30,34,37-39,41,50,51]. However, use of the GAMMA library also requires familiaritywith C++ programming and it provides only rudimentary tools for the display, storage andanalysis of results. In this report we describe an application that provides a coherentdevelopment framework and convenient graphical interface to pre-compiled modulesdeveloped using GAMMA, which is termed GAVA (GAmma Visual Analysis).
The primary goal for GAVA was to shorten times for pulse sequence development andsequence parameter optimization for observation of specific metabolite structures, and toprovide a method for generating and visualizing basis functions used in a parametric spectralanalysis procedure [40,52]. Secondary goals included providing advanced users with sourcecode examples of how to create MR simulations both with and without pulsed gradients,providing non-technical users with access to libraries of pre-compiled MR sequences forcreating their own simulations, and creating generalized access to a database of previoussimulation results, all accessed through straightforward graphical user interfaces (GUI).Finally, GAVA was designed to be extensible, cross-platform compatible, and freely available.
2. Methods2.1. Program Structure
The GAVA program is comprised of three core program elements: 1) an IDL-based GUI frontend, 2) MR simulations based on the GAMMA C++ library, and 3) a MySQL-based relationaldatabase for persistent storage of inputs and results. These elements were chosen based onease-of-use, cross-platform interconnectivity, maturity of development and extensivedocumentation. A general flow diagram of the interconnectivity of the GAVA core elementsis shown in Figure 1.
IDL (ITT Visual Information Solutions) is a fourth generation programming language anddevelopment environment that is easy to use and includes a variety of well integrated dataanalysis, plotting and GUI development functionality. As an interpreted language, it lends itselfto rapid code development, recompilation and debugging. IDL provides access to C++ sharedlibraries using a CALL_EXTERNAL mechanism that passes parameters via the argv/argcformalism. GAMMA [36] is an object-oriented library written in C++ that facilitates softwaredevelopment for simulation of MR experiments. It provides C++ objects that encapsulate theoperations common to MR experiments. This allows abstract entities such as density matrices,operators, commutators, spin systems, and ideal and real RF pulses to be easily described andapplied in program procedures. MySQL is a robust relational database [http://dev.mysql.com/downloads] that was incorporated into the GAVA project as a persistent data storagemechanism for information relative to the GAVA program, including: MR simulation inputs,MR pulse sequence storage and simulation results storage for future access. MySQL wasintegrated into GAVA using the C++ API (application programming interface) in both IDLand the GAMMA simulations.
Soher et al. Page 2
J Magn Reson. Author manuscript; available in PMC 2008 April 1.
NIH
-PA Author Manuscript
NIH
-PA Author Manuscript
NIH
-PA Author Manuscript

The control and data flow logic of the GAVA environment is contained in the IDL GUI frontend. The central data construct is referred to as an Experiment and is composed of one or moreSimulations. Any single Simulation is composed of a set of one metabolite and one pulsesequence timing. Thus, an Experiment with five metabolites and eight variations in pulsesequence timings would contain 40 Simulations. Only one Experiment at a time can be loadedinto GAVA, either from results stored in the database or from a new spectral simulation.However, multiple GAVA sessions can be run to analyze multiple data sets from the sameExperiment or compare different Experiments for results stored in the database. GAVA couldalso be used effectively in a distributed computing environment with all instances connectedto the same MySQL GAVA database.
The loaded Experiment can be acted upon by various GAVA modules, each with its own GUI,including: the ‘Experiment Browser’, ‘New Experiment’, ‘Add To Experiment’, Plot andUtility modules. Details for module features are listed below. MySQL database access forExperiment results is transparent to the user and a variety of graphical and text output functionsare available in each module. There are twelve MR pulse sequence simulations provided withthe standard GAVA installation as well as the functionality to develop and share stand-aloneuser-contributed pulse sequence libraries to create new Experiments. Non-technical users canimplement the standard GAVA installation and create, store and analyze spectral simulationsfrom the MR sequence library without any expertise in IDL, C++ or SQL programming. Userswith C++ programming experience can add their own simulation functionality to the GAVAenvironment by modifying only the GAMMA code in the provided C++ templates, as describedbelow.
To facilitate cross-platform compatibility and program extensibility, platform dependent codewas kept to a minimum and based where possible on templates. The main GAVA C++ sharedlibrary contains only five basic MR pulse sequences and two procedures that provide databaseconnectivity between IDL and MySQL. The MR sequence list inside GAVA is extended byimporting stand-alone pulse sequence libraries. This extension mechanism is based on usinga C++ pulse sequence procedure template and making changes only to the GAMMA objectcalls used to describe the MR simulation. The template passes in 24 standard control and I/Ovariables from the GAVA environment and up to 30 additional user-defined variables. Thesevariables can be utilized at the user’s discretion to control simulation setup, metaboliteinitialization, ongoing timing changes (via two GAVA incremented loop variables), densitymatrix post-processing and the output of results back to the GAVA environment. Commonuses of the user-defined variables might be to loop over effective field strengths to simulatethe effects of gradients or as a list of RF pulse files to analyze the effects of various real pulseson metabolites of interest. One or more template procedures (a.k.a. pulse sequences) can becompiled into a shared library that can subsequently be imported into the GAVA environment.
2.2. Experiment Explorer ModuleThe Experiment Explorer module is the initial GUI that appears when GAVA is started up(Figure 2). From this module, the user can run a new Experiment or load results fromExperiments stored in the database. All other GAVA modules can be launched from theExplorer, but some require that an Experiment be loaded first. Experiments are listed anddifferentiated in the Explorer by a short name (40 characters) and a longer comment string.The comment string is updated as each name is selected. Experiments can be sorted and listedbased on the nuclei involved and the field strength for which they were run by selecting valuesfrom the relevant pull-down menus. As the user selects an Experiment name, the relevant datais loaded from the database. Only the last user-selected result is loaded into memory, andrunning a new Experiment will supersede the last loaded result. Also listed on the browser arethe metabolites included in the selected Experiment.
Soher et al. Page 3
J Magn Reson. Author manuscript; available in PMC 2008 April 1.
NIH
-PA Author Manuscript
NIH
-PA Author Manuscript
NIH
-PA Author Manuscript

Action buttons along the left of the Browser launch GAVA widgets for running newExperiments, plotting results and viewing a text listing of the loaded Experiment. Utilitymodules and ASCII output options are accessed from the menu bar. Utilities include a moduleto manage database content, and a module to set global values for simulation binning andnormalization. These and the network TCP/IP module are discussed in the following section.
A network connection module allows the host address, database name, login and password tobe set for connection to a GAVA MySQL database. These values can be reset at any time,allowing users access to data on either local or networked GAVA databases. Experimentsloaded from one location can subsequently be saved to a different database. This is the mostdirect form of collaboration, although other forms of data import/export exist to accommodatevarious network security issues.
2.3. New/AddTo Experiment Module (Spectral Simulations)The New Experiment module (Figure 3) launches a widget on which to enter all informationnecessary to run and store the results from an Experiment. Users select the pulse sequence,nucleus, field strength and one or more metabolites to be simulated from drop-down widgetlists. The investigator’s name, a short Experiment name and a longer Experiment comment aretyped into text widgets. Up to two loop variables can be set for a simulation. Each loop variablehas a start value, a step value and a “number of steps” entry. Depending on the sequenceselected, the loop widgets reconfigure their labels to provide useful information about thevalues that should be entered in each field, including the loop variable name and unit type. Anyadditional, fixed variables that need to be passed to the simulation are set up in a scrolled listin an optional third column of the widget. The Experiment is not actually performed until theRun Simulation button is pressed, and upon finishing, the results can either be sent to the PlotWidget for viewing, or submitted to the database for storage. Another more immediate outputoption is for GAVA to dump the results from the final transition table, consisting of frequencies,amplitudes and phases for all resonance lines for all metabolites and sequence timings, to a tabdelineated text file for external processing.
An Experiment can consist of up to three dimensions depending on the metabolites selectedand settings for the two loop variables. Loop variable usage depends on the pulse sequencetimings or other parameter variations inherent to GAMMA simulation procedures. Forexample, an ideal pulse FID simulation has no sequence timings and creates only a 1D result(for the metabolites selected) while an ideal STEAM simulation gives a 3D result based on themetabolites selected and the TE and TM pulse sequence timings that are linked to the loopvariables. However, loop variables are not limited to use as sequence timings. The raw loopvariables are passed in the standard list of parameters to each simulation and can be used toiterate over any variable set up by the programmer (e.g. pulse train length, RF file lists, etc.).
The basic GAVA installation includes five predefined pulse sequences packaged in a singlelibrary and seven stand-alone libraries. The five basic sequences make use of ideal RF pulses(defined in GAMMA) in their simulations, including: one-pulse, spin-echo, STEAM, PRESSand J-PRESS sequences. The seven stand-alone libraries demonstrate a variety of extensionsto the standard PRESS pulse sequence. Two are examples of how to add a Carr-Purcell pulsetrain, and loop over either sequence timings or the number of pulses in the train. One generatesbasis functions for TE-averaged PRESS acquisitions [20], and four investigate corrections forPRESS acquisitions due to chemical shift artifacts caused by real RF localization pulses byincluding the effects of spatial variations of the B1 profiles and a full simulation using completeuser-defined time-domain RF pulse shapes [25]. The source code for all seven libraries servesas examples for how to create and integrate additional pulse sequences into the GAVAenvironment.
Soher et al. Page 4
J Magn Reson. Author manuscript; available in PMC 2008 April 1.
NIH
-PA Author Manuscript
NIH
-PA Author Manuscript
NIH
-PA Author Manuscript
2.4. Plot Widget ModuleThe Plot module is used to display and analyze the currently loaded Experiment. The majorityof spectral simulations are run to either maximize or minimize the signal coherence of one ormore metabolites and/or resonance groups based on variations in pulse sequence timings. Thetools used most often to determine signal areas are plots of individual metabolites or integralplots over specified PPM spectral ranges. The four main windows for the Plot widget (Figure4) are the Plot Controls widget and three display windows used to visualize 1) 1D and stackplots, 2) regional integral plots and 3) integral contour plots which also include a grayscaleimage display option. All three displays can be independently turned on or off, resized andcontrolled by settings located on the Control Widget.
The 1D and Stack Plot window displays one or more metabolite spectra plotted for specificIndex1 and Index2 values, which are linked to the Experiment loop variables, or it can showa stack plot of spectra for one metabolite along either the Index1 or Index2 range (Figure 5).The horizontal axis is always displayed in field-independent PPM values, and can be zoomedin and out along any sub-section using the mouse. A left and right cursor can also be set usingthe mouse. The digital resolution, and hence display quality and analysis accuracy, of thedisplayed spectra and plots is controlled by the user-defined linewidth, sweep width andspectral points widget entries. Both Gaussian and Lorentzian line shapes are supported andreal, imaginary, magnitude and overlaid complex plots can be displayed.
The displays in both the Integral Plot and Contour Plot base their range of integral calculationson the cursor locations set in the 1D Plot display and the first metabolite selected from thedisplay list. Changes to the cursor locations trigger automatic updates in both displays. IntegralPlot controls allow the user to select for integration along either Index1 or Index2 dimension.Contour Plot controls include the number of steps that are used to delineate the iso-lines in theplot and also the ability to flip between contour plots and grayscale images that reflect theintegral values. All display window contents can be output to a variety of graphical file formatsincluding: CGM, TIFF, JPEG and encapsulated postscript. Alternatively, displays can be sentdirectly to an attached printer or output to a tab-delineated text file of plot values.
2.5. Utilities ModuleThe Utilities module provides a full set of widgets for managing metabolite parameters,Experiments and pulse sequences. Metabolite chemical shift and J-coupling descriptions canbe deleted, added, viewed and edited through a widget interface or imported from a file inGAMMA ‘sysfile’ format. Experiments can be deleted or accessed for a textual description ofthe simulation settings used to create it. Pulse sequences can be deleted or new ones addedthrough a widget interface that collects the information necessary to call the shared library/function and to properly label the widget entries in the New Experiment module. An Import/Export scheme exists where all the relevant settings are written to an SQL script file to facilitatepulse-sequence library collaborations.
The Global SimParams widget is also part of the Utilities module, and plays an important rolein running new Experiments. Spectral simulation results need to be binned to merge the valuesin the final transition table into a manageable number of spectral lines and normalized to ensurethat results are comparable between pulse sequence timings and the ranges of metabolites beingsimulated. This is accomplished using a single reference proton at a spectral location distantfrom all other resonance groups. The GAVA environment passes in parameters for locatingthe reference peak and binning lines via the standard variables passed to the pulse sequence C++ template. However it is up to the user to include the reference proton in the metabolitedescription, and ensure that the Global SimParams reflect those settings. This setup provides
Soher et al. Page 5
J Magn Reson. Author manuscript; available in PMC 2008 April 1.
NIH
-PA Author Manuscript
NIH
-PA Author Manuscript
NIH
-PA Author Manuscript

the flexibility to process a wide variety of nuclei, RF pulses, J-coupling and chemical shifts inany simulation library.
3. ResultsWith the release of the GAVA environment, we have achieved our initial development goal ofproviding a GUI based control and display program that interfaces the functionality of theGAMMA library with the powerful query and storage functions of the MySQL database.Research applications for this tool have included: 1) Simulating multiple metabolites for asingle TE and pulse sequence for use as basis functions in spectral analysis tools [39,50]. 2)Simulating one metabolite for multiple, progressive sequence timings to determine optimalpulse sequence settings for a clinical MR spectroscopic data acquisition. 3) Simulation of highfield NMR metabolite basis groups for dynamically labeled multi-nuclear metabolomicsprobes. 4) Evaluation of chemical shift artifacts for clinical MR spectroscopic data acquisitionsusing non-ideal RF pulses [25]. All of these applications were explored using only the built-in pulse sequence simulations. To date, a variety of specific add-on pulse sequences simulationsexist and more are under development in response to a growing number of research questionsaddressable using spectral simulation.
Two examples of spectral development and analysis are shown in Figures 6 and 7. The resultsshown in both figures were created using multiple CGM outputs of the 1D/Stack, Integral andContour windows for the various metabolites. Results from a 1H PRESS sequence simulationat 3T that depict the effects of TE averaging for four overlapping metabolites are shown inFigure 6. The four stack plots display metabolite peak variations for 30 different TE valuesdue to J-coupling. Region integral plots on the right show how the signals from the variousmultiplet resonance groups disperse or refocus at increasing TE. The TE averaged spectra atbottom left, show the effects of summing the 30 spectra. Metabolite peaks for GABA,glutamine, glutamate and myo-inositol resolve into simpler spectral patterns with less overlap.
In Figure 7 are shown the results for lactate from a PRESS sequence simulation at 1.5T usingreal RF pulses with Gaussian weighted Sinc envelopes with a FWHM width of 1399 Hz anda pulse length of 1.7ms. RF pulses were applied at the resonance frequency (4.7 ppm). Thisshows the effects of the different chemical shift values for the doublet and quartet resonancegroups, 1.3 and 4.17 ppm respectively, across the two spatial dimensions in the simulation.Resonance groups at different chemical shifts are rotated by varying flip angles based on thebandwidth and shape of the RF pulses applied. Simulation parameters were: TE=288ms, 30x30spatial locations simulated across a FOV=30mm for RF pulses and applied gradients witheffective bandwidths of 20mm. The stack plots show peak variations in the SpatDim1 (spatialdimension 1) direction for the SpatDim2 (spatial dimension 2) location fixed at the center ofthe FOV. The top and bottom contour/grayscale images show the variation in regional areasof the quartet and doublet peak areas, respectively, for all spatial locations in the PRESS voxel.Note that spatially, at the edges of the RF pulse bandwidth where the effective flip angles ofthe refocusing pulses are much lower than 180°, metabolite areas show a decreasing spread ofareas, indicated by the darkening grayscale and closely spaced contour lines, respectively. Also,note that the chemical shift effects for lactate are more noticeably displayed by the blackenedregions in the grayscale images than by the contour lines as the metabolite signals not affectedby both refocusing pulses end up out of phase with other spatial regions.
4. DiscussionThe GAVA program is available on request from the authors at no cost. The end-user downloadincludes pre-compiled GAVA, GAMMA and MySQL binaries for Windows and source codeand Makefiles only for Linux (x86), and is distributed for use with the IDL Virtual Machine.
Soher et al. Page 6
J Magn Reson. Author manuscript; available in PMC 2008 April 1.
NIH
-PA Author Manuscript
NIH
-PA Author Manuscript
NIH
-PA Author Manuscript
Extensions to GAVA developed by outside users can be redistributed freely, and a number ofpulse sequence add-on libraries have already been added to the standard distribution. For usersthat wish to contribute to the development of the GAVA environment, a development downloadis also available. It contains the GAVA source code for the main library, source code forselected pulse sequence add-on libraries and the GAMMA and MySQL installations used inthe current GAVA release. A full IDL development license is necessary to extend the GAVAGUI code, and a C++ compiler is required to create standalone pulse sequence libraries.Suggestions for compiling the GAVA main library on platforms other than Windows and Linux(x86) are available in the development appendix of the user manual.
A short term and simple extension of the functionality of the current application will be thesimulation and graphical representation of two dimension NMR experiments. The currentinfrastructure allows for one or both of the looping variables to account for the sequencetimings. In addition, the graphical representation of the results is straightforward in terms ofstack plots and 3D contour plots. All that is necessary is the addition of a means for the userto identify the pulse sequence as a 2D sequence which could then be used to optionally applya 2D Fourier transform to simulation results.
Finally, the performance of much of the functionality provided by GAVA is inherentlyamenable to speedup via straightforward parallelization. A number of standard multi-processorand distributed solutions could be applied to the GAVA architecture to take advantage of thegreatly increased performance such systems offer.
Acknowledgements
The authors would like to thank Dr. Govindaraju Varanavasi for his extensive beta testing of the development code.This work was supported by PHS grants R01EB00207 and R01EB000822.
References1. Allman T, Bain A, Garbow J. SIMPLTN, a Program for the Simulation of Pulse NMR Spectra. J Magn
Reson 1996;A123(1):26–31.2. Bak M, Rasmusson JT, Nielsen NC. SIMPSON: a general simulation program for solid-state NMR
spectroscopy. J Magn Reson 2000;147(2):296–330. [PubMed: 11097821]3. Baldus M, Petkova AT, Herzfeld J, Griffin RG. Cross-polarization in the tilted frame - Assignment
and spectral simplification in heteronuclear spin systems. Mol Phys 1998;95:1197–1207.4. Bax A, De Jong PG, Mehlkopf AF, Smidt J. Separation of the different orders of NMR multiple-
quantum transitions by the use of pulsed field gradients. Chem Phys Lett 1980;69:567–570.5. Blanton WB. BlochLib: a fast NMR C++ tool kit. J Magn Reson 2003;162(2):269–283. [PubMed:
12810011]6. Choi C, Coupland NJ, Hanstock CC, Ogilvie CJ, Higgins AC, Gheorghiu D, Allen PS. Brain gamma-
aminobutyric acid measurement by proton double-quantum filtering with selective J rewinding. MagnReson Med 2005;54:272–279. [PubMed: 16032672]
7. De Graaf AA, Bovee WMMJ. Improved quantification of in vivo 1H NMR spectra by optimization ofsignal acquisition and processing and by incorporation of prior knowledge into the spectral fitting.Magn Reson Med 1990;15:305–319. [PubMed: 1975420]
8. Devaux PF, Hoatson GL, Favre E, Fellmann P, Farren B, McKay AL, Bloom M. Interaction ofcytochrome c with mixed dimyristoylphosphatidylcholine-dimiristoylphosphatidylserine bilayers: adeuterium nuclearXmagnetic resonance study. Biochemistry 1986;25:3804–3812. [PubMed:3017405]
9. Dusold S, Milius W, Sebald A. Iterative lineshape fitting of MAS NMR spectra: A tool to investigatehomonuclearJ-coupling in isolated spin pairs. J Magn Reson 1998;135(2):500–513. [PubMed:9878477]
10. Ebel A, Soher BJ, Maudsley AA. Assessment of 3D 1H NMR echo-planar spectroscopic imagingusing automated spectral analysis. Magn Reson Med 2001;46:1072–1078. [PubMed: 11746571]
Soher et al. Page 7
J Magn Reson. Author manuscript; available in PMC 2008 April 1.
NIH
-PA Author Manuscript
NIH
-PA Author Manuscript
NIH
-PA Author Manuscript

11. Eykyn TR, Ghose R, Bodenhausen G. Offset profiles of selective pulses in isotopically labeledmacromolecules. J Magn Reson 1999;136:211–213. [PubMed: 9986763]
12. Filip C, Hafner S, Schnell I, Demco DE, Spiess HW. Solid-state nuclear-magneticresonance spectraof dipolar-coupled multi-spin systems under fast magic-angle-spinning. J Chem Phys 1999;110:423–440.
13. Govindaraju V, Gauger G, Manley G, Ebel A, Meeker M, Maudsley AA. Volumetric protonspectroscopic imaging of mild traumatic brain injury. AJNR 2004;25:730–737. [PubMed: 15140711]
14. Govindaraju V, Meyerhoff DJ, Maudsley AA, Vermathen M, Weiner MW. Effects of brainmembranes on 1H nuclear magnetic resonance signal intensity of ethanol in vitro. Alcohol andAlcoholism 1997;32:671–681. [PubMed: 9463721]
15. Graveron-Demilly D, Diop A, Briguet A, Fenet B. Product-operator algebra for strongly coupled spinsystems. Journal of Magnetic Resonance 1993;101:233–239.
16. Guntert P, Schaefer N, Otting G, Wuthrich K. POMA: A complete mathematica implementation ofthe NMR product-operator formalism. J Magn Reson 1993;(A101):103–105.
17. Helgstrand M, Allard P. QSim, a program for NMR simulations. J Biolmol NMR 2004;30:71–80.18. Hennig J, Thiel T, Speck O. Improved sensitivity to overlapping multiplet signals in in vivo proton
spectroscopy using a multiecho volume selective (CPRESS) experiment. Magn Reson Med1997;37:816–820. [PubMed: 9178230]
19. Hughes E, Brouwer EB, Harris RK. 19F solid-state NMR magic-angle-turning experiments usingmultiple-pulse homonuclear decoupling. J Magn Reson 1999;138:256–267. [PubMed: 10341129]
20. Hurd R, Sailasuta N, Srinivasan R, Vigneron DB, Pelletier D, Nelson SJ. Measurement of brainglutamate using TE-averaged PRESS at 3T. Magn Reson Med 2004;51(3):435–440. [PubMed:15004781]
21. Kaikkonen A, Ylinen EE, Punkkinen M. Multiple-quantum coherences of molecular groups - 19F inCf3Cooag. Appl Magn Reson 1998;15:509–518.
22. Kanters RPF, Char BW, Addison AW. A computer-algebra application for the description of NMRexperiments using the product-operator formalism. J Magn Reson 1993;A 101:23–29.
23. Kim H, Thompson RB, Hanstock CC, Allen PS. Variability of metabolite yield using STEAM orPRESS sequences in vivo at 3.0 T, illustrated with myo-inositol. Magn Reson Med 2005;53(4):760–769. [PubMed: 15799042]
24. Kim H, Wild JM, Allen PS. Strategy for the spectral filtering of myo-inositol and other stronglycoupled spins. Magn Reson Med 2004;51(2):263–272. [PubMed: 14755650]
25. Maudsley A, Govindaraju V, Young K, Aygula Z, Pattany PM, Soher BJ, Matson G. Numericalsimulation of PRESS localized MR spectroscopy. J Magn Reson 2005;173(1):54–63. [PubMed:15705513]
26. McClung RED. Coherence transfer pathways and phase cycles - The decoding of a pulse sequence.Concepts Magn Reson 1999;11:1–28.
27. Meresi GH, Cuperlovic M, Palke WE, Gerig JT. Pulsed Field Gradients in Simulations of One- andTwo-Dimensional NMR Spectra. J Magn Reson 1999;137(1):186–195. [PubMed: 10053147]
28. Mescher M, Merkle H, Kirsch J, Garwood M, Gruetter R. Simultaneous in vivo spectral editing andwater suppression. NMR Biomed 1998;11:266–272. [PubMed: 9802468]
29. Naressi A, Couturier C, Devos JM, Janssen M, Mangeat C, de Beer R, Graveron-Demilly D. Java-based graphical user interface for the MRUI quantitation package. Magma 2001;12(23):141–152.[PubMed: 11390270]
30. Pelupessy P, Chiarparin E, Bodenhausen G. Excitation of selected proton signals in NMR ofisotopically labeled macromolecules. J Magn Reson 1999;138:178–181. [PubMed: 10329243]
31. Provencher SW. Estimation of metabolite concentrations from localized in vivo proton NMR spectra.Magn Reson Med 1993;30(6):672–679. [PubMed: 8139448]
32. Ratiney H, Sdika M, Coenradie Y, Cavassila S, van Ormondt D, Graveron-Demilly D. Time-domainsemi-parametric estimation based on a metabolite basis set. NMR Biomed 2005;18(1):1–13.[PubMed: 15660450]
33. Rothman DL, Arias-Mendoza F, Shulman GI, Shulman RG. A pulse sequence for simplifyinghydrogen NMR spectra of biological tissues. J Magn Reson 1984;60:430–436.
Soher et al. Page 8
J Magn Reson. Author manuscript; available in PMC 2008 April 1.
NIH
-PA Author Manuscript
NIH
-PA Author Manuscript
NIH
-PA Author Manuscript

34. Sierra GA, Schuler MA, Schweiger A. Right-angle spinning for sensitivity improvement in pulseEPR experiments. Chem Phys Lett 1999;303:475–481.
35. Slotboom J, Boesch C, Kreis R. Versatile frequency domain fitting using time domain models andprior knowledge. Magn Reson Med 1998;39:899–911. [PubMed: 9621913]
36. Smith SA, Levante TO, Meier BH, Ernst RR. Computer simulations in magnetic resonance. An object-oriented programming approach. J Magn Reson 1994;A106:75–105.
37. Smith SA, Murali N. Relaxation effects in a system of a spin-1/2 nucleus coupled to a quadrupolarspin subjected to RF irradiation - Evaluation of broad-band decoupling schemes. J Magn Reson1999;136:211–213. [PubMed: 9986763]
38. Soher BJ, Maudsley AA. Evaluation of variable line-shape models and prior information in automated1H spectroscopic imaging analysis. Magn Reson Med 2004;52(6):1246–1254. [PubMed: 15562473]
39. Soher BJ, Vermathen P, Schuff N, Wiedermann D, Meyerhoff D, Weiner M, Maudsley AA. ShortTE in vivo 1H MR spectroscopic imaging at 1.5 T: Automated spectral analysis and metabolite imageformation. Magn Reson Imaging 2000;18:1159–1165. [PubMed: 11118771]
40. Soher BJ, Young K, Govindaraju V, Maudsley AA. Automated spectral analysis III: Application toin vivo proton MR spectroscopy and spectroscopic imaging. Magn Reson Med 1998;40:822–831.[PubMed: 9840826]
41. Suhy J, Miller RG, Rule R, Schuff N, Licht J, Dronsky V, Gelinas D, Maudsley AA, Weiner MW.Early detection and longitudinal changes in amyotrophic lateral sclerosis by 1H MRSI. Neurology2002;58(5):773–779. [PubMed: 11889242]
42. Thomas MA, Binesh N, Yue K, DeBruhl N. Volume-localized two-dimensional correlated magneticresonance spectroscopy of human breast cancer. Magn Reson Imaging 2001;14:181–186.
43. Thomas MA, Ryner LN, Mehta MP, Turski PA, Sorenson JA. Localized 2D J-resolved 1H MRspectroscopy of human brain tumors in vivo. Magn Reson Imaging 1996;6:453–459.
44. Thomas MA, Yue K, Binesh N, Davanzo P, Kumar A, Siegel B, Frye M, Curran J, Lufkin R, MartinP, Guze B. Localized two-dimensional shift correlated MR spectroscopy of human brain. MagnReson Med 2001;46:58–67. [PubMed: 11443711]
45. Thompson RB, Allen PS. Response of metabolites with coupled spins to the STEAM sequence. MagnReson Med 2001;45:955–965. [PubMed: 11378872]
46. Trabesinger AH, Meier D, Boesiger P. In vivo 1H NMR spectroscopy of individual human brainmetabolites at moderate field strengths. Magn Reson Imaging 2003;21:1295–1302. [PubMed:14725936]
47. Trabesinger AH, Meier D, Dydak U, Lamerichs R, Boesiger P. Optimizing PRESS localized citratedetection at 3 Tesla. Magn Reson Med 2005;54:51–58. [PubMed: 15968673]
48. van Dijk JE, Mehlkopf AF, Bovee WMMJ. Comparison of double and zero quantum NMR editingtechniques for in vivo use. NMR Biomed 1992;5:75–86. [PubMed: 1622767]
49. Veshtort M, Griffin RG. SPINEVOLUTION: a powerful tool for the simulation of solid and liquidstate NMR experiments. J Magn Reson 2006;178:248–282. [PubMed: 16338152]
50. Young K, Govindaraju V, Soher BJ, Maudsley AA. Automated spectral analysis I: Formation of apriori information by spectral simulation. Magn Reson Med 1998;40:812–815. [PubMed: 9840824]
51. Young K, Matson GB, Govindaraju V, Maudsley AA. Spectral simulations incorporating gradientcoherence selection. J Magn Reson 1999;140:146–152. [PubMed: 10479557]
52. Young K, Soher BJ, Maudsley AA. Automated spectral analysis II: Application of wavelet shrinkagefor characterization of non-parameterized signals. Magn Reson Med 1998;40:816–821. [PubMed:9840825]
Soher et al. Page 9
J Magn Reson. Author manuscript; available in PMC 2008 April 1.
NIH
-PA Author Manuscript
NIH
-PA Author Manuscript
NIH
-PA Author Manuscript

Figure 1.Flow diagram for GAVA environment interconnectivity of IDL, GAMMA and MySQL.
Soher et al. Page 10
J Magn Reson. Author manuscript; available in PMC 2008 April 1.
NIH
-PA Author Manuscript
NIH
-PA Author Manuscript
NIH
-PA Author Manuscript

Figure 2.GAVA Experiment Browser widget, the first widget displayed upon startup, it provides accessto new/saved results, utilities and visualization and analysis widgets.
Soher et al. Page 11
J Magn Reson. Author manuscript; available in PMC 2008 April 1.
NIH
-PA Author Manuscript
NIH
-PA Author Manuscript
NIH
-PA Author Manuscript

Figure 3.GAVA New Experiment widget, allows users to define and run spectral simulations.
Soher et al. Page 12
J Magn Reson. Author manuscript; available in PMC 2008 April 1.
NIH
-PA Author Manuscript
NIH
-PA Author Manuscript
NIH
-PA Author Manuscript

Figure 4.GAVA Plot widget display with the 1D/Stack Plot, Integral Plot and Contour Plot windowsopen. The 1D/Stack Plot display is in 1D mode, showing results for both glutamate and myo-inositol for a single simulation timing.
Soher et al. Page 13
J Magn Reson. Author manuscript; available in PMC 2008 April 1.
NIH
-PA Author Manuscript
NIH
-PA Author Manuscript
NIH
-PA Author Manuscript
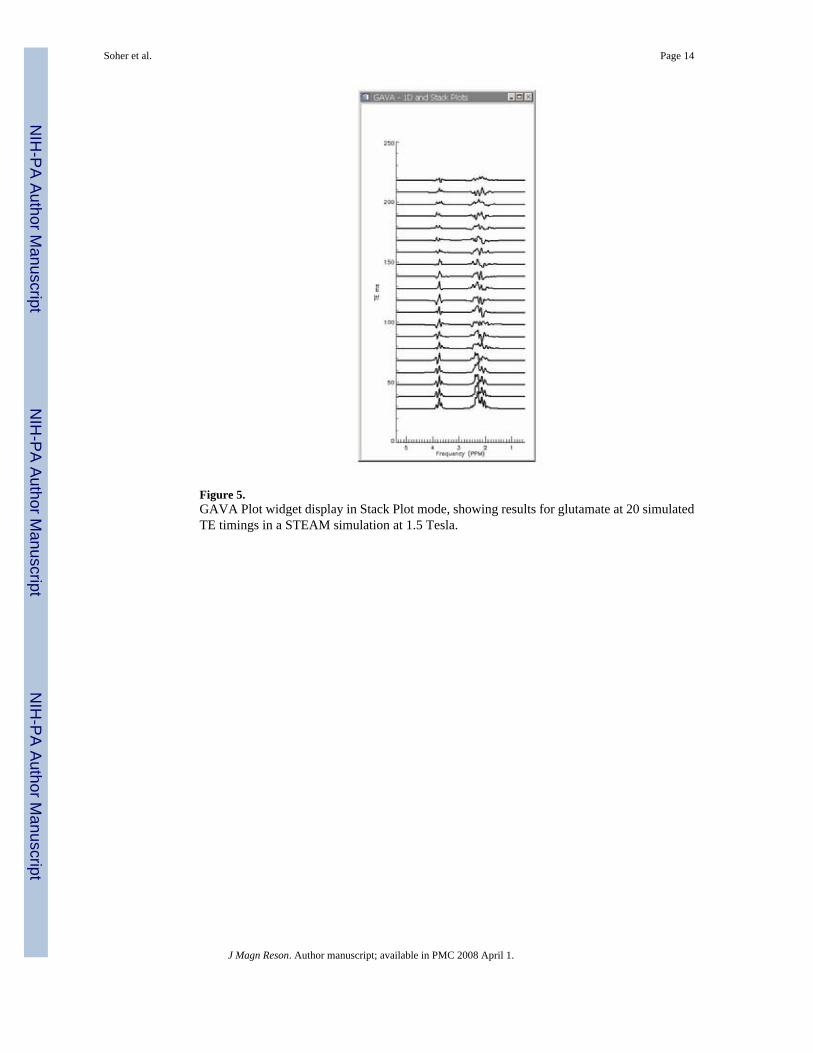
Figure 5.GAVA Plot widget display in Stack Plot mode, showing results for glutamate at 20 simulatedTE timings in a STEAM simulation at 1.5 Tesla.
Soher et al. Page 14
J Magn Reson. Author manuscript; available in PMC 2008 April 1.
NIH
-PA Author Manuscript
NIH
-PA Author Manuscript
NIH
-PA Author Manuscript

Figure 6.Results from a PRESS sequence simulation that shows the effects of TE averaging of 3T PRESSspectra for four overlapping metabolites. The four stack plots (top left) show metabolite peakvariations for 30 different TE values due to J-coupling. Region integral plots (right) show howthe signals from the various multiplet resonance groups refocus at each TE. The TE averagedspectra (bottom left), show the effects of summing the 30 spectra for each metabolite.Metabolite peaks for GABA, glutamine, glutamate and myo-inositol resolve into simplerspectral patterns with less overlap when TE averaging is applied.
Soher et al. Page 15
J Magn Reson. Author manuscript; available in PMC 2008 April 1.
NIH
-PA Author Manuscript
NIH
-PA Author Manuscript
NIH
-PA Author Manuscript

Figure 7.Results for lactate from a PRESS sequence simulation at 1.5T using real RF pulses withGaussian weighted Sinc pulse envelopes. This shows the effects of chemical shift across thespatial dimension for the doublet and quartet peaks at 1.3 and 4.17 ppm. Resonance groups atdifferent chemical shifts are rotated by varying flip angles based on the bandwidth of the RFpulses applied. Parameters: TE=288ms, 30x30 spatial locations simulated across aFOV=30mm for RF pulses and applied gradients with an effective bandwidth of 20mm. Stackplots show peak variations in SpatDim1 for SpatDim2 fixed on center. The top and bottomcontour/grayscale images show the variation in regional areas of the quartet and doublet peakareas, respectively, for all spatial locations in the PRESS voxel.
Soher et al. Page 16
J Magn Reson. Author manuscript; available in PMC 2008 April 1.
NIH
-PA Author Manuscript
NIH
-PA Author Manuscript
NIH
-PA Author Manuscript