Volumetric in vivo imaging of intracochlear microstructures in mice by high-speed spectral domain...
7
Volumetric in vivo imaging of intracochlear microstructures in mice by high-speed spectral domain optical coherence tomography Hrebesh M. Subhash Viviana Davila Oregon Health and Science University School of Medicine Department of Biomedical Engineering Biophotonics and Imaging Laboratory 3181 SW Sam Jackson Park Road Portland, Oregon 97239 Hai Sun Oregon Health and Science University School of Medicine Department of Biomedical Engineering Biophotonics and Imaging Laboratory and Department of Neurological Surgery 3181 SW Sam Jackson Park Road Portland, Oregon 97239 Anh T. Nguyen-Huynh Oregon Health and Science University School of Medicine Department of Otolaryngology-Head and Neck Surgery 3181 SW Sam Jackson Park Road Portland, Oregon 97239 Alfred L. Nuttall Oregon Health and Science University School of Medicine Oregon Hearing Research Center 3181 SW Sam Jackson Park Road Portland, Oregon 97239 Ruikang K. Wang Oregon Health and Science University School of Medicine Department of Biomedical Engineering Biophotonics and Imaging Laboratory and Department of Anesthesiology & Peri-operative Medicine 3181 SW Sam Jackson Park Road Portland, Oregon 97239 Abstract. There is considerable interest in developing new methods for in vivo imaging of the complex anatomy of the mammalian co- chlea for clinical as well as fundamental studies. In this study, we explored, the feasibility of spectral domain optical coherence tomog- raphy SD-OCT for 3-D in vivo imaging of the cochlea in mice. The SD-OCT system employed in this study used a broadband light source centered at 1300 nm, and the imaging speed of the system was 47,000 A-scans per second using the InGaAs camera. The system was capable of providing fully processed, high-resolution B-scan images 512 axial 128 lateral pixels at 280 frames per sec. The 3-D imaging acquisition time for a whole cochlea was 0.45 sec. The traditional SD-OCT structural imaging algorithm was used to recon- struct 3-D cochlear morphology. We demonstrated that SD-OCT can be successfully used for in vivo imaging of important morphological features within the mouse cochlea, such as the otic capsule and struc- tures within, including Reissner’s membrane, the basilar membrane, tectorial membrane, organ of Corti, and modiolus of the apical and middle turns. © 2010 Society of Photo-Optical Instrumentation Engineers. DOI: 10.1117/1.3456554 Keywords: optical coherence tomography; in vivo imaging; anatomy; cochlea; sen- sorineural hearing loss. Paper 10020R received Jan. 14, 2010; revised manuscript received Apr. 29, 2010; accepted for publication May 6, 2010; published online Jun. 30, 2010. 1 Introduction Hearing loss is one of the most common health problems among the populations of the industrialized world. According to the National Center for Health Statistics, 36 million 17% of American adults have some degree of hearing loss, making it a public health issue third in line after heart disease and arthritis. 1–3 Hearing loss can be categorized by where or what part of the auditory system is damaged. There are two basic types of hearing loss: conductive hearing loss and sensorineu- ral hearing loss SNHL. 4 Conductive hearing loss occurs when sound is not conducted efficiently over the outer ear canal, the eardrum, and the tiny bones, or ossicles, of the middle ear to the inner ear. Conductive hearing loss usually involves a reduction in sound level, or a diminished ability to hear faint sounds, that primarily involves the middle ear struc- tures ossicles or tympanic membrane, or both or the external ear canal. SNHL occurs when there is damage to the inner ear 1083-3668/2010/153/036024/7/$25.00 © 2010 SPIE Address all correspondence to: Ruikang K. Wang, Oregon Health and Science University School of Medicine, 3181 SW Sam Jackson Park Road, Portland, Oregon 97239. Tel: 503-418-9317; Fax: 503-418-9311; E-mail: [email protected], or [email protected]. Journal of Biomedical Optics 153, 036024 May/June 2010 Journal of Biomedical Optics May/June 2010 Vol. 153 036024-1
Transcript of Volumetric in vivo imaging of intracochlear microstructures in mice by high-speed spectral domain...

Vmo
HVOSDB3P
HOSDB
D3P
AOSD3P
AOSO3P
ROSDB
D3P
1Hatoia
AUOw
Journal of Biomedical Optics 15�3�, 036024 �May/June 2010�
J
olumetric in vivo imaging of intracochlearicrostructures in mice by high-speed spectral domainptical coherence tomography
rebesh M. Subhashiviana Davilaregon Health and Science University
chool of Medicineepartment of Biomedical Engineeringiophotonics and Imaging Laboratory181 SW Sam Jackson Park Roadortland, Oregon 97239
ai Sunregon Health and Science University
chool of Medicineepartment of Biomedical Engineeringiophotonics and Imaging Laboratory
andepartment of Neurological Surgery181 SW Sam Jackson Park Roadortland, Oregon 97239
nh T. Nguyen-Huynhregon Health and Science University
chool of Medicineepartment of Otolaryngology-Head and Neck Surgery181 SW Sam Jackson Park Roadortland, Oregon 97239
lfred L. Nuttallregon Health and Science University
chool of Medicineregon Hearing Research Center181 SW Sam Jackson Park Roadortland, Oregon 97239
uikang K. Wangregon Health and Science University
chool of Medicineepartment of Biomedical Engineeringiophotonics and Imaging Laboratory
andepartment of Anesthesiology & Peri-operative Medicine181 SW Sam Jackson Park Roadortland, Oregon 97239
Abstract. There is considerable interest in developing new methodsfor in vivo imaging of the complex anatomy of the mammalian co-chlea for clinical as well as fundamental studies. In this study, weexplored, the feasibility of spectral domain optical coherence tomog-raphy �SD-OCT� for 3-D in vivo imaging of the cochlea in mice. TheSD-OCT system employed in this study used a broadband light sourcecentered at 1300 nm, and the imaging speed of the system was47,000 A-scans per second using the InGaAs camera. The system wascapable of providing fully processed, high-resolution B-scan images�512 �axial��128 �lateral� pixels� at 280 frames per sec. The 3-Dimaging acquisition time for a whole cochlea was �0.45 sec. Thetraditional SD-OCT structural imaging algorithm was used to recon-struct 3-D cochlear morphology. We demonstrated that SD-OCT canbe successfully used for in vivo imaging of important morphologicalfeatures within the mouse cochlea, such as the otic capsule and struc-tures within, including Reissner’s membrane, the basilar membrane,tectorial membrane, organ of Corti, and modiolus of the apical andmiddle turns. © 2010 Society of Photo-Optical Instrumentation Engineers.
�DOI: 10.1117/1.3456554�
Keywords: optical coherence tomography; in vivo imaging; anatomy; cochlea; sen-sorineural hearing loss.Paper 10020R received Jan. 14, 2010; revised manuscript received Apr. 29, 2010;accepted for publication May 6, 2010; published online Jun. 30, 2010.
Introductionearing loss is one of the most common health problems
mong the populations of the industrialized world. Accordingo the National Center for Health Statistics, 36 million �17%�f American adults have some degree of hearing loss, makingt a public health issue third in line after heart disease andrthritis.1–3 Hearing loss can be categorized by where or what
ddress all correspondence to: Ruikang K. Wang, Oregon Health and Scienceniversity School of Medicine, 3181 SW Sam Jackson Park Road, Portland,regon 97239. Tel: 503-418-9317; Fax: 503-418-9311; E-mail:[email protected], or [email protected].
ournal of Biomedical Optics 036024-
part of the auditory system is damaged. There are two basictypes of hearing loss: conductive hearing loss and sensorineu-ral hearing loss �SNHL�.4 Conductive hearing loss occurswhen sound is not conducted efficiently over the outer earcanal, the eardrum, and the tiny bones, or ossicles, of themiddle ear to the inner ear. Conductive hearing loss usuallyinvolves a reduction in sound level, or a diminished ability tohear faint sounds, that primarily involves the middle ear struc-tures �ossicles or tympanic membrane, or both� or the externalear canal. SNHL occurs when there is damage to the inner ear
1083-3668/2010/15�3�/036024/7/$25.00 © 2010 SPIE
May/June 2010 � Vol. 15�3�1

�ccdntciibrdtmcp
mccaeaeaibcoMbcNsaiwpce�steas
maa2gBtiidBtsl
Subhash et al.: Volumetric in vivo imaging of intracochlear microstructures in mice…
J
cochlea� or to the nerve pathways from the inner ear �retro-ochlear� to the brain. Sometimes conductive hearing loss oc-urs in combination with SNHL. In other words, there may beamage in the outer, middle, or inner ear and the auditoryerve, which is then referred to as mixed hearing loss. Sincehe structures of the middle and inner ear are difficult to ac-ess, there is a need to develop new methodologies for non-nvasive imaging of the microanatomy of the cochlea. In vivomaging of intracochlear structures, such as Reissner’s mem-rane, the organ of Corti, and the basilar membrane, couldeveal morphological changes associated with inner-ear disor-ers, like Meniere’s syndrome, sudden and subacute SNHL,he presence of a perilymphatic fistula, and certain autoim-
une inner ear diseases. In vivo imaging of those structuresould improve the ability to diagnose and understand theseoorly understood disease conditions.
In clinical otolaryngology, a number of in vivo imagingodalities have been developed to visualize the mi-
roanatomy of the inner ear. Computed tomography �CT� isommonly used to look for gross abnormalities in the bonynatomy of the otic capsule in the areas affected by SNHL,specially when considering congenital malformations.5 CT islso used to evaluate other bony defects associated with inner-ar pathology, such as superior canal dehiscence syndrome6
nd widened vestibular aqueduct.7 Magnetic resonance imag-ng �MRI�, particularly with gadolinium enhancement, haseen used to diagnose intra- and retro-cochlear pathology as aause of SNHL, such as by acoustic neuroma8 and cochleartosclerosis.9 The feasibility of high-resolution MRI �HR-RI� as a diagnostic tool for SNHL, tinnitus, and vertigo has
een demonstrated.10 Functional MRI was also used to studyentral auditory processing in cochlear implant recipients.11
evertheless, at present neither CT nor MRI has sufficientpatial resolution �on the order of a few millimeters� to visu-lize the cochlear microanatomy. High-resolution ultrasoundmaging �high-frequency ultrasound �HF-US��, �20 MHz,hich is a relatively new area of ultrasound imaging, canrovide an order of magnitude better imaging resolution thanonventional low-frequency ultrasound imaging.12,13 How-ver, the spatial resolution of HF-US is still limited60 to 100 �m� when evaluating intracochlear anatomicaltructures, because it has a shallow penetration depth in bone;he cochlea is located deep in the skull and is surroundedntirely by the dense bone of the otic capsule. Moreover, thecoustic trauma induced by HF-US is another major concernince it may cause damage to the hearing mechanism.
Optical coherence tomography �OCT� is a noninvasive �orinimally invasive�, cross-sectional imaging technique that is
ble to image highly scattering in vivo tissue microstructurest a reasonably high spatial resolution between 2 and0 �m.14 The principle of OCT is based on optical coherenceating, which can be thought of as an analog to ultrasound-mode imaging except that light reflected from biological
issue layers is detected rather than acoustic reflections. OCTmaging is performed by directing a focused beam of lightnto the biological tissue and measuring the delay time �echoelay� for the backscattered light to return to the instrument.ackscatter or reflections are returned from each microstruc-
ural feature within the tissue during a single axial �depth�can. A cross-sectional image of the tissue is constructed byaterally scanning the light beam over the tissue and subse-
ournal of Biomedical Optics 036024-
quently assembling adjacent axial scans. Early versions oftime-domain OCT �TD-OCT� imaging systems achieved no-table successes in several areas, but they are limited by rela-tively low signal-to-noise ratios �SNR� and require long data-acquisition times, so they are not ideal for 3-D in vivoimaging.15 In recent years, frequency-domain optical coher-ence tomography �FD-OCT�, an alternative OCT imaging mo-dality that is also referred to as spectral-domain OCT �SD-OCT�, has proven its high speed and high sensitivity forimaging.16,17 Due to its high sensitivity ��140-dB dynamicrange� and its noncontact and noninvasive �minimally inva-sive� scanning nature, SD-OCT has quickly become an indis-pensable imaging tool in many fundamental research andclinical applications. High-speed SD-OCT is capable of sev-eral tens of thousands of depth scans per second for 3-D invivo imaging of biological specimens. In SD-OCT, the inter-ference pattern in the optical frequency spectrum is analyzedto provide both high-sensitivity and high-speed depth-resolved measurements of the biological specimens. However,the feasibility of high-resolution OCT imaging of the inner earhas not been investigated widely, and only a few studies havepreviously reported its use for cochlear imaging. PreviousOCT inner-ear imaging studies have demonstrated OCT’s ca-pability for distinguishing different structural and morpho-logical features of mouse cochlea in vivo, in situ, and exvivo.15,18–22 To our knowledge, no publication has addressedthe feasibility of OCT for in vivo high-resolution 3-D imagingof cochlear microstructures.
2 Materials and Method2.1 High-Speed Spectral Domain OCT SystemFigure 1 illustrates the schematic of the high-speed SD-OCTsystem used in this study, which is similar to one describedpreviously.23 Briefly, light from a 56-nm-bandwidth, low-coherence broadband infrared superluminescent diode lightsource �1300�28 nm� was split into two paths in a 10:90fiber-based Michelson interferometer. One beam was coupledonto a stationary reference mirror, and the second was focusedand scanned using a pair of galvo mirrors. The light emergingat the output of the interferometer was sent to a custom-builthigh-speed spectrometer. The spectrometer consisted of atransmission grating �1175 lines /mm�, a camera lens with afocal length of 100 mm, and a 1024-element line scan infra-red InGaAs detector with a 25-�m pixel pitch size. The spec-tral resolution of the designed spectrometer was around0.141 mm, which provided a total depth range of 3.3 mm inair �2.45 mm in biological tissue by assuming the refractiveindex of the sample was �1.35�.
One main requirement of the high-speed SD-OCT applica-tion is utilization of the camera’s full acquisition capability. Inour system, the integrating time was set at 17 �s, and themaximum line rate of the camera was 47 KHz. CameraLink™
and a high-speed frame-grabber board �PCI 1428, NationalInstruments, USA� were used to transfer the raw fringe datafrom the camera to the host computer. A custom-designed,high-speed software was developed under the Lab VIEW2009 platform for real-time data acquisition, processing, dis-play, and archiving. The axial resolution of the system was13 �m in air ��9.6 �m in tissue�. We used an objective lenswith a 50-mm focal length to deliver the probe beam of
May/June 2010 � Vol. 15�3�2

4vep
2FcBcoo1wc
ceetrcOTitch�d
FPc
Subhash et al.: Volumetric in vivo imaging of intracochlear microstructures in mice…
J
-mm diameter onto the sample, providing a �16-�m trans-erse resolution �in tissue� and a �2-mm depth of focus. Thestimated SNR of the system was around 90 dB with a lightower on the sample arm at 3 mW.
.2 Image Acquisition and Reconstructionor in vivo imaging, our imaging protocol provided 3-Dochlear imaging at 280 B-scan frames per second �fps�. Each-scan encompassed a 1.5 mm�2.45 mm �x-z� slice of co-hlea. A series of 125 cross-sectional B-scan images werebtained from the medial to lateral direction �1.25 mm�, andnly �0.45 sec was required to capture a 3-D volume of.5 mm�1.25 mm�2.45 mm �128�125�512 voxelsith a voxel size of �12�10�10 �m3� that covered the
ochlea.Before applying the traditional SD-OCT algorithms to re-
onstruct the OCT images, all the spectral interferograms inach B scan along the x direction were ensemble-averaged atach wavelength to obtain a reference spectrum, which washen subtracted from each A-scan. This operation effectivelyemoved/minimized the autocorrelation, self-cross-orrelation, and camera noise artifacts presented in the finalCT images,24 and considerably improved the image quality.he subtracted spectral interferograms were then converted
nto the equal frequency space by use of the spline interpola-ion method, because the spectral interferogram data matricesaptured by the CCD camera were functions of wavelength;owever, the Fourier transform relationship was between timedistance� and frequency �wavenumber�. After scaling theepth range by the refractive index of 1.35 for biological tis-
ig. 1 Experimental setup of high-speed SD-OCT system: SLD=suC=polarization controller, L1–L5=lenses, RM=reference mirror, LAamera, COMP=computer.
ournal of Biomedical Optics 036024-
sue, the reconstructed 2-D OCT images were stacked sequen-tially to form a 3-D volume with a physical size of1.5 mm�1.25 mm�2.45 mm �X�Y �Z�.
2.3 Animal Model and Surgical TechniqueSince the penetration depth of our OCT system to access thecochlea was limited by the presence of the thick, bony mas-toid bulla on the cochlear surface, surgical access to the co-chlea was required to visualize the cochlear microstructure.Healthy C57 BL/6 mice weighing around 20 to 30 gm�3 months old� were used in this study. The experimental pro-tocol was in compliance with the federal guidelines for careand handling of small rodents and approved by the Institu-tional Animal Care and Use Committee �IACUC� of OregonHealth and Science University �OHSU�.
Animals were initially anesthetized by a single subcutane-ous �s.c.� injection of ketamine �75 mg /kg� and xylazine�10 mg /kg�. The mouse was then placed on a heating pad andmaintained at 37�1 °C. Prior to surgically exposing the co-chlea, the mouse head was immobilized and positioned ontoan imaging platform to minimize the translation of move-ments due to breathing, which is essential for in vivo imaging.The imaging platform was based on a standard mouse stereo-taxic instrument.
Under sterile surgical conditions, a ventral incision ap-proach with a longitudinal, paramedian incision was used toaccess and remove the bone of the tympanic bulla to permitdirect access to the inner ear with minimal blood loss ormortality.25 This approach provided a more direct view of thecochlear turns and round window niche area compared to the
inescent diode, OC=optical circulator, FC=10:90 fiber coupler,ilot laser for beam guiding, DG=diffraction grating, CCD=line-scan
perlumSER=p
May/June 2010 � Vol. 15�3�3

rgrcarssestmOcwcv
33IbsFoaatptcslsdwmsm
Fwctis
Subhash et al.: Volumetric in vivo imaging of intracochlear microstructures in mice…
J
etroauricular approach. After incision, the left submandibularland and posterior belly of the left digastric muscle wereemoved by cauterization to reveal a well-defined sterno-leidomastoid muscle and facial nerve extending anteriorlybove the bulla. The bony bulla was exposed, and the dorsalegion of the bulla was surgically removed using a microcissor to provide a clear view of the intact cochlea and thetapedial artery �SA� with its medial margin laying over thedge of the round window niche and coursing anterior-uperiorly toward the oval window. After surgery, the anes-hetized mouse with exposed and intact cochlea �Fig. 2� was
oved under the beam emanating straight down from the SD-CT imaging probe for image scanning. During imaging, lo-
al anesthesia with isoflurane �0.2 L /min O2, 0.8 L /min air�as applied, and the breathing interval of the animal was
ontrolled by adjusting the concentration of isoflurane in theaporizing chamber of the anesthetic station.
Results and Discussion.1 Resultsn vivo OCT images of a portion of the apical, middle, andasal turns of the mouse cochlea were obtained through aurgically prepared opening through the bone of the bulla.igure 3�a� shows the in vivo 2-D OCT cross-sectional imagef the cochlea imaged through the intact osseous otic capsule,nd Fig. 3�b� shows a standard cochlear cross-sectional im-ge, that was imaged using orthogonal-plane fluorescence op-ical sectioning microscopy �OPFOS� described in otherublications.26,27 Figure 4 shows an enlarged view of one ofhe turns shown in Fig. 3�a�. The bony labyrinth of the co-hlea has a spiral shape something like the space inside a snailhell. As shown in Fig. 3, the cochlea consists of relativelyarge fluid-filled spaces referred to as the scala vestibuli �SV�,cala media �SM�, and scala tympani �ST�. Figure 3�a� alsoemonstrates that the OCT imaging method is able to detect aide variety of tissue types ranging from acellular gelatinousaterial �the tectorial membrane� to dense bone �the otic cap-
ule� to the epithelial organ of Corti, which contains the re-arkably delicate hair cells.
ig. 2 Surgical view of the left cochlea in mouse. �a� Ventral surgicalindow through the bulla exposes the middle and basal turns of the
ochlea �within the rectangular box�. White scale bar=1 mm. �b� Op-ically magnified view of the exposed cochlea with otic capsule leftntact. The dotted rectangle shows the approximate region of the OCTcan. White scale bar=200 �m.
ournal of Biomedical Optics 036024-
For a better view of the cochlear structures, the 2-D cross-sectional OCT images from the apical to middle turns areshown in Video 1. The cochlea is oriented at a slight anglerelative to the imaging beam such that the two cross-sectionalhalves of the apical turn are seen at the upper right-hand cor-ner at the beginning of the video clip. As the video clipprogresses through the cochlea, the right-hand cross-sectionof the turn ends at the most apical end of the cochlea, calledthe helicotrema, and the left-hand cross section continues intothe middle turn. Figure 5 �Video 2� shows a 3-D volumetricprojection image of the cochlear microanatomy obtained bySD-OCT. The dashed line in Fig. 5 indicates the first B-scan.The location of the SA is indicated with the black lines, andthe direction of the C-scan is shown with the dotted arrow. Toreveal the internal cochlear turns more clearly, the imagetransparency was increased with 3-D reconstruction software�Amira�. As can be seen in both the 3-D OCT image of thecochlea �Fig. 5� and the cross-sectional OPFOS image �Fig.3�b��, the diameter of each turn becomes progressivelysmaller from the base to the apex. The cochlear structuresexist in a complex, helical geometry spiraling around a central
Fig. 3 �a� In vivo 2-D cross-sectional OCT image of apical turns of thespiral-shaped cochlea �1.5 mm�2.45 mm�. Compare this image withthe first frame of Video 1. White bar=250 �m. �b� Optical cross-sectional image using OPFOS.26 O=otic capsule, M=modiolus, RM=Reissner’s membrane, ST=scala tympani, SM=scala media, OC=organ of Corti, and SV=scala vestibuli. White bar=250 �m.
Fig. 4 �a� Enlarged in vivo 2-D cross-sectional OCT image of a singleapical turn of the cochlea. Both the tectorial membrane �TM� overly-ing the organ of Corti �OC� and the basilar membrane �BM� are visiblein this image. �b� Optical sectioning of a single apical turn of thecochlea using OPFOS27 �reprinted with permission of Elsevier�. O=otic capsule, M=modiolus, RM=Reissner’s membrane, BM=basilar membrane, ST=scala tympani, SM=scala media, OC=organ of Corti, and SV=scala vestibuli.
May/June 2010 � Vol. 15�3�4

pccmtmaflswS
F�la
Vfh
Subhash et al.: Volumetric in vivo imaging of intracochlear microstructures in mice…
J
illar of spongy bone with nerve fibers, the modiolus �M�. Inomparison with the standard in vitro OPFOS image, the OCTross-sectional image presented here demonstrates a similaricroanatomy, both in morphology and scale. For example,
he thickness of the organ of Corti �OC� measures approxi-ately 80 �m at its greatest dimension in both the OCT im-
ge and the OPFOS image. In addition, the cross-sectionaly-through movie �Video 1� rendered from the 2-D OCTtack images clearly reveals the spiral canal of the cochlea,hich is divided lengthwise into three passages �SV, SM, andT� separated by Reissner’s membrane and the basilar mem-
ig. 5 3-D volumetric projection image of the cochlear microanatomyVideo 2�. Dashed line indicates the location of the first B scan. Theocation of the stapedial artery �SA� is indicated with the back lines,nd the direction of the C scan is shown with the dotted arrow.
ideo 1 Flythrough of the 2-D cross-sectional images of the cochlearom the middle to apical turns �QuickTime, 3910.36 KB�. �URL:ttp://dx.doi.org/10.1117/1.3456554.1�.
ournal of Biomedical Optics 036024-
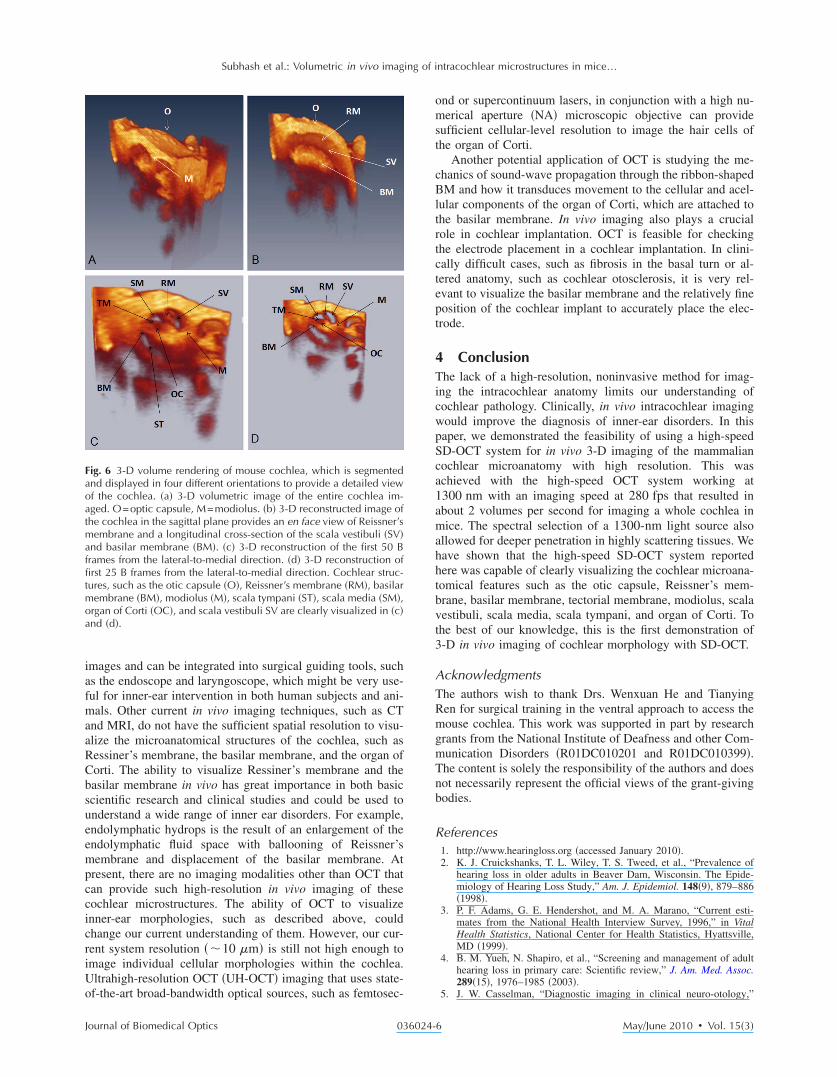
brane �BM�. The SV and the ST are connected to each other atthe helicotrema �Figs. 5, 6�b�, and 6�c��.
Figure 4 shows the enlarged, detailed 2-D cross-sectionalimage of the cochlea imaged with OCT �Fig. 4�a�� in com-parison with an OPFOS image �Fig. 4�b�� illustrating thecochlear microanatomy. Figure 6 shows several views of 3-Dvolume-rendering based on segmentation of OCT data in thesagittal and coronal planes. From the sagittally segmented,3-D–rendered, and resliced OCT image of the cochlear struc-ture, OCT volume-rendering clearly reveals the cochlear duct�SM� located between Reissner’s membrane and the basilarmembrane, which can be seen in both Figs. 5 and 6. Figure6�d� also shows the ability of OCT to visualize the organ ofCorti in vivo, which resides within the cochlear duct on thebasilar membrane. The tectorial membrane is adherent to theorgan of Corti in the scala media space. The organ of Corti isa highly organized structure that is responsible for the trans-duction of mechanical vibrations into neural impulses. Theorgan of Corti is visible in the 3-D OCT reconstruction �Fig.6�d��; however, the detail of individual hair cells within theorgan of Corti is beyond the resolution of our present system.
3.2 DiscussionIn the present study, the feasibility of high-speed SD-OCT forclear visualization of the inner ear microanatomical featureswas successfully demonstrated. A tool that provides in vivohigh-resolution imaging to reveal anatomic and physiologicalinformation of the inner ear in a relatively noninvasive andnondestructive manner might shed light on fundamental is-sues concerning hearing function and loss, enable clinicallysignificant diagnoses, and guide future surgical efforts to re-store hearing function by micromanipulation. The results ofthe current study of in vivo imaging of cochlear morphologywith high-speed SD-OCT suggest that this imaging modalitydeserves exploration for such applications.
As an alternative in vivo imaging modality for viewingintracochlear structures, SD-OCT has several potential advan-tages over other cochlear imaging modalities such as CT,MRI, and HR-US. First, SD-OCT is relatively inexpensiveand portable. Second, it has the potential to provide real-time
Video 2 3-D volumetric reconstruction of the cross-sectional OCTimages of the apical and middle turns of the cochlea �QuickTime,185 KB�. �URL: http://dx.doi.org/10.1117/1.3456554.2�.
May/June 2010 � Vol. 15�3�5
iafmaaRCbsueempccicriUo
Faoatmaffitmoa
Subhash et al.: Volumetric in vivo imaging of intracochlear microstructures in mice…
J
mages and can be integrated into surgical guiding tools, suchs the endoscope and laryngoscope, which might be very use-ul for inner-ear intervention in both human subjects and ani-als. Other current in vivo imaging techniques, such as CT
nd MRI, do not have the sufficient spatial resolution to visu-lize the microanatomical structures of the cochlea, such asessiner’s membrane, the basilar membrane, and the organ oforti. The ability to visualize Ressiner’s membrane and theasilar membrane in vivo has great importance in both basiccientific research and clinical studies and could be used tonderstand a wide range of inner ear disorders. For example,ndolymphatic hydrops is the result of an enlargement of thendolymphatic fluid space with ballooning of Reissner’sembrane and displacement of the basilar membrane. At
resent, there are no imaging modalities other than OCT thatan provide such high-resolution in vivo imaging of theseochlear microstructures. The ability of OCT to visualizenner-ear morphologies, such as described above, couldhange our current understanding of them. However, our cur-ent system resolution ��10 �m� is still not high enough tomage individual cellular morphologies within the cochlea.ltrahigh-resolution OCT �UH-OCT� imaging that uses state-f-the-art broad-bandwidth optical sources, such as femtosec-
ig. 6 3-D volume rendering of mouse cochlea, which is segmentednd displayed in four different orientations to provide a detailed viewf the cochlea. �a� 3-D volumetric image of the entire cochlea im-ged. O=optic capsule, M=modiolus. �b� 3-D reconstructed image ofhe cochlea in the sagittal plane provides an en face view of Reissner’sembrane and a longitudinal cross-section of the scala vestibuli �SV�
nd basilar membrane �BM�. �c� 3-D reconstruction of the first 50 Brames from the lateral-to-medial direction. �d� 3-D reconstruction ofrst 25 B frames from the lateral-to-medial direction. Cochlear struc-
ures, such as the otic capsule �O�, Reissner’s membrane �RM�, basilarembrane �BM�, modiolus �M�, scala tympani �ST�, scala media �SM�,rgan of Corti �OC�, and scala vestibuli SV are clearly visualized in �c�nd �d�.
ournal of Biomedical Optics 036024-
ond or supercontinuum lasers, in conjunction with a high nu-merical aperture �NA� microscopic objective can providesufficient cellular-level resolution to image the hair cells ofthe organ of Corti.
Another potential application of OCT is studying the me-chanics of sound-wave propagation through the ribbon-shapedBM and how it transduces movement to the cellular and acel-lular components of the organ of Corti, which are attached tothe basilar membrane. In vivo imaging also plays a crucialrole in cochlear implantation. OCT is feasible for checkingthe electrode placement in a cochlear implantation. In clini-cally difficult cases, such as fibrosis in the basal turn or al-tered anatomy, such as cochlear otosclerosis, it is very rel-evant to visualize the basilar membrane and the relatively fineposition of the cochlear implant to accurately place the elec-trode.
4 ConclusionThe lack of a high-resolution, noninvasive method for imag-ing the intracochlear anatomy limits our understanding ofcochlear pathology. Clinically, in vivo intracochlear imagingwould improve the diagnosis of inner-ear disorders. In thispaper, we demonstrated the feasibility of using a high-speedSD-OCT system for in vivo 3-D imaging of the mammaliancochlear microanatomy with high resolution. This wasachieved with the high-speed OCT system working at1300 nm with an imaging speed at 280 fps that resulted inabout 2 volumes per second for imaging a whole cochlea inmice. The spectral selection of a 1300-nm light source alsoallowed for deeper penetration in highly scattering tissues. Wehave shown that the high-speed SD-OCT system reportedhere was capable of clearly visualizing the cochlear microana-tomical features such as the otic capsule, Reissner’s mem-brane, basilar membrane, tectorial membrane, modiolus, scalavestibuli, scala media, scala tympani, and organ of Corti. Tothe best of our knowledge, this is the first demonstration of3-D in vivo imaging of cochlear morphology with SD-OCT.
AcknowledgmentsThe authors wish to thank Drs. Wenxuan He and TianyingRen for surgical training in the ventral approach to access themouse cochlea. This work was supported in part by researchgrants from the National Institute of Deafness and other Com-munication Disorders �R01DC010201 and R01DC010399�.The content is solely the responsibility of the authors and doesnot necessarily represent the official views of the grant-givingbodies.
References1. http://www.hearingloss.org �accessed January 2010�.2. K. J. Cruickshanks, T. L. Wiley, T. S. Tweed, et al., “Prevalence of
hearing loss in older adults in Beaver Dam, Wisconsin. The Epide-miology of Hearing Loss Study,” Am. J. Epidemiol. 148�9�, 879–886�1998�.
3. P. F. Adams, G. E. Hendershot, and M. A. Marano, “Current esti-mates from the National Health Interview Survey, 1996,” in VitalHealth Statistics, National Center for Health Statistics, Hyattsville,MD �1999�.
4. B. M. Yueh, N. Shapiro, et al., “Screening and management of adulthearing loss in primary care: Scientific review,” J. Am. Med. Assoc.289�15�, 1976–1985 �2003�.
5. J. W. Casselman, “Diagnostic imaging in clinical neuro-otology,”
May/June 2010 � Vol. 15�3�6

1
1
1
1
1
1
Subhash et al.: Volumetric in vivo imaging of intracochlear microstructures in mice…
J
Curr. Opin. Neurol. 15�1�, 23–30 �2002�.6. L. B. Minor, J. P. Carey, P. D. Cremer, L. R. Lustig, S. O. Streubel,
and M. J. Ruckenstein, “Dehiscence of bone overlying the superiorcanal as a cause of apparent conductive hearing loss,” Otol. Neurotol.24�2�, 270–278 �2003�.
7. J. E. McClay, R. Tandy, K. Grundfast, et al., “Major and minor tem-poral bone abnormalities in children with and without congenital sen-sorineural hearing loss,” Arch. Otolaryngol. Head Neck Surg. 128�6�,664–671 �2002�.
8. J. L. Hegarty, S. Patel, N. Fischbein, R. K. Jackler, and A. K. Lal-wani, “The value of enhanced magnetic resonance imaging in theevaluation of endocochlear disease,” Laryngoscope 112�1�, 8–17�2002�.
9. J. P. Goh, L. L. Chan, and T. Y. Tan, “MRI of cochlear otosclerosis,”Br. J. Radiol. 75�894�, 502–505 �2002�.
0. R. Klingebiel, N. Thieme, D. Kivelitz, C. Enzweiler, M. Werbs, andR. Lehmann, “Three-dimensional imaging of the inner ear byvolume-rendered reconstructions of magnetic resonance data,” Arch.Otolaryngol. Head Neck Surg. 128�5�, 549–553 �2002�.
1. F. Lazeyras, C. Boex, A. Sigrist, et al., “Functional MRI of auditorycortex activated by multisiteelectrical stimulation of the cochlea,”Neuroimage 17�2�, 1010–1017 �2002�.
2. J. A. Brown, Z. Torbatian, R. B. Adamson, R. Van Wijhe, R. J.Pennings, G. R. Lockwood, and M. L. Bance, “High-frequency exvivo ultrasound imaging of the auditory system,” Ultrasound Med.Biol. 35�11�, 1899–1907 �2009�.
3. J. Mamou, O. Aristizábal, R. H. Silverman, J. A. Ketterling, and D.H. Turnbull, “High-frequency chirp ultrasound imaging with an an-nular array for ophthalmologic and small-animal imaging,” Ultra-sound Med. Biol. 35�7�, 1198–1208 �2009�.
4. D. Huang, E. Swanson, C. Lin, et al., “Optical coherence tomogra-phy,” Science 254, 1178–1181 �1991�.
5. B. J. F. Wong, Y. Zhao, M. Yamaguchi, N. Nassif, Z. Chen, and J. F.De Boer, “Imaging the internal structure of the rat cochlea usingoptical coherence tomography at 0.827 �m and 1.3 �m,” Arch. Oto-laryngol. Head Neck Surg. 130�3�, 334–338 �2004�.
ournal of Biomedical Optics 036024-
16. A. F. Fercher, W. Drexler, C. K. Hitzenberger, and T. Lasser, “Opticalcoherence tomography—Principles and applications,” Rep. Prog.Phys. 66, 239–303 �2003�.
17. P. H. Tomlins and R. K. Wang, “Theory, development and applica-tions of optical coherence tomography,” J. Phys. D 38, 2519–2535�2005�.
18. B. J. Wong, J. F. de Boer, B. H. Park, Z. Chen, and J. S. Nelson,“Optical coherence tomography of the rat cochlea,” J. Biomed. Opt.5�4�, 367–370 �2000�.
19. S. S. Hong and D. M. Freeman, “Doppler optical coherence micros-copy for studies of cochlear mechanics,” J. Biomed. Opt. 11, 045014�2006�.
20. A. Sepehr, H. R. Djalilian, J. E. Chang, Z. Chen, and B. J. Wong,“Optical coherence tomography of the cochlea in the porcine model,”Laryngoscope 118�8�, 1449–1451 �2008�.
21. N. Choudhury, F. Y. Chen, X. R. Shi, A. L. Nuttall, and R. K. Wang,“Volumetric imaging of blood flow within cochlea in gerbil in vivo,”IEEE J. Sel. Top. Quantum Electron. 15, 1–6 �2009�.
22. J. Lin, H. Staecker, and M. S. Jafri, “Optical coherence tomographyimaging of the inner ear: A feasibility study with implications forcochlear implantation,” Ann. Otol. Rhinol. Laryngol. 117�5�, 341–346�2008�.
23. R. K. Wang and S. Hurst, “Mapping of cerebrovascular blood perfu-sion in mice with skin and cranium intact by optical microangiogra-phy at 1300 nm wavelength,” Opt. Express 15�18�, 11402–11412�2007�.
24. R. K. Wang and Z. Ma, “A practical approach to eliminate autocor-relation artifacts for volume-rate spectral domain optical coherencetomography,” Phys. Med. Biol. 51, 3231–3239 �2006�.
25. J. Jero, C. J. Tseng, A. N. Mhatre, and A. K. Lalwani, “A surgicalapproach appropriate for targeted cochlear gene therapy in themouse,” Hear. Res. 151, 106–114 �2001�.
26. Mouse Cochlear Database, University of Minnesota, http://mousecochlea.umn.edu/index.php �accessed January 2010�.
27. P. A. Santi, I. Rapson, and A. H Voie, “Development of the mousecochlea database �MCD�,” Hear. Res. 243, 11–17 �2008�.
May/June 2010 � Vol. 15�3�7