
Discovering and Domesticating Wild Tropical Cultivatable ...
Upload
independentCategory
view
1download
0
Discovering Phonetic Coherencein Acoustic Patterns*
Catherine T. Best,t Michael Studdert-Kennedy,tt SharonManuel,ttt and Judith Rubin-Spitztttt
Despite spectral and temporal discontinuities in the speech signal, listenersnormally report coherent phonetic patterns corresponding to the phonemes of alanguage that they know. What is the basis for the internal coherence of phoneticsegments? On one account, listeners achieve coherence by extracting andintegrating discrete cues; on another, coherence arises automatically from general
.principles of auditory form perception; on a third, listeners perceive speechpatterns as coherent because they are the acoustic consequences of coordinatedarticulatory gestures in a familiar language. We tested these accounts in threeexperiments by training listeners to hear a continuum of three-tone, modulatedsine wave patterns, modeled after a minimal pair contrast between three-formantsynthetic speech syllables, either as distorted speech signals carrying a phoneticcontrast (Speech listeners), or as distorted musical chords carrying a nonspeechauditory contrast (Music listeners). While the Music listeners could neitherintegrate the '6ine wave patterns nor perceive their auditory coherence to arrive atconsistent, categorical percepts, the Speech listeners judged them as speech almostas reliably as the synthetic syllables on which they were modeled. The outcomeis consistent with the hypothesis that listeners perceive the phonetic coherenceof a speech signal by recognizing acoustic patterns that reflect the coordinatedarticulatory gestures from which they arose.
INTRODUCTION
To master their native language. children must learn not only to listen. but to speak..In the speech Signal, they must discover infonnation that not only distinguishes amongthe words they hear. but also speCifies how the words are to be spoken. This dualfunction of the speech Signal has been largely disregarded in research on speechperception. Researchers have generally accepted the linguist's deSCription of speech as asequence of syllables or phonemes. compounded from "bundles' of features." and havethen looked in the signal for the "information-bearing elements" or "cues" thatcorrespond to the linguiSt's abstract descriptors. without conSidering whether or howthese cues might specify the articulatory gestures that give rise to them. The strategyhas been successful to the extent that we now have detailed lists of cues-pitch contours.
Haskins Laboratories
Status Report on Speech Research
95
SR-97/98
1989

96
formant patterns, silent gaps, patches of band-limited noise, and so on-that may bemimicked by terminal analog synthesis to render intelligible speech.
Such synthesiS typically proceeds, however, without appeal to general principles ofeither auditory or articulatory organization. or of their interrelationship. Even if anexperimenter follows certain "rules for synthesis." the rules are rarely more than asummary of previous experimenters' prescriptions for copying spectrograms within theconstraints of a particular synthesizing device (but see Mattingly, 1981). The criterionfor a successful copy is simply a listener's judgment as to whether or not thesynthesized pattern renders an acceptable phonetic form (i.e., an acceptable acousticarticulatory pattern of sound) in the language under study.
What is the basis for listeners' phonetic percepts? What do they listen for in thesignal? From the facts of speech synthesis, we might suppose that they listen fordiscrete acoustic cues. However. the notion of cue extraction poses a logical puzzle ofdefinition, as noted by Bailey and Summerfield (1980). To establish that a particularpiece of acoustic "stuff' deseIVes the status of a cue. researchers commonly use speechsynthesis to set all other portions of the array at values that will ensure perceptualambiguity. They then manipulate the potential cue, so that particular settings resolvethe ambiguity. However, when the ambiguity is resolved-that is. when listenersconsistently identify the pattern as an instance of a particular phonetic categorywhich is the cue? Is it the element that was manipulated or is it the context? The contextwithout the cue is ambiguous. and the cue without its context is typically heard asnonspeech (e.g., Mattingly, Liberman, Syrdal, & Halwes, 1971). We have no grounds forpreferring one to the other as an effective or necessary component of the pattern.
If neither cue nor context (itself composed of an indefinite number of other cues) canindependently and unambiguously specify the speech sounds we hear, the functionalunit of speech perception must be the entire acoustic pattern that the acoustic cuescompose. What is this pattern; and why do the diverse "cues" that compose it cohereperceptually?1
According to one account listeners extract discrete cues, but Judge them only inrelation to each other, so that the phonetic segment is a result of their perceptualintegration (e.g.• Cutting. 1976; Jusczyk. Smith. & Murphy, 1981; Pastore, 1981;Schouten. 1980). The reason why isolated cues are often heard as nonspeech is thatperceptual categorization depends on the relations among cues, and these relations aredestroyed when a cue is removed from context. A variant of this view treats thesupposed cues as independent "features" to which liSteners assign weights on the basisof their representation in the signal. Listeners then sum or multiply the weights andcompare the integrated outcome with a stored "prototype" to arrive at a probabilisticestimate of the percept (Oden & Massaro, 1978). We will refer to the mechanismproposed by these accounts as cue integration.
According to another account, cues have no functional role in determining the soundpattern of speech. Rather, the pattern coh~res according to Gestalt principles analogousto those in visual form perception, such as proximity, similarity, good continuationand closure (Bregman. 1981). Thus. the melodic coherence of vowel sequences, essentialto prosody. may be maintained across consonantal constrictions by the smoothcontour of their fundamental frequenCies (Bregman, 1981). The harmonics of a vowelformant may cohere by virtue of temporal proximity, that is. of their simultaneousonsets and offsets (DalWin. 1984). Temporal proximity may also account for coherenceof the spectrally diverse cues to voicing in consonant-vowel (CV) syllables, discussedbelow. Good continuation and spectral similarity may be at work in a CV syllable whena stop consonant release burst effectively conveys information about place ofarticulation only if it is spectrally continuous with the follOWing formant transition
Best et al.

97
(Dorman, Studdert-Kennedy, & Raphael, 1977). Finally, formant transitions mayperform not only segmental functions, but also syllabic functions, by eliminating fromthe signal abrupt discontinuities that might excite an unwanted increase in neuralfiring (Delgutte, 1982). The transitions would thus assure syllabic coherence and,incidentally, correct perception of the temporal order of syllabic components in rapidspeech (Cole & Scott, 1974: Dorman, Cutting & Raphael, 1975). If this account is correct.phonetic forms emerge from the signal by virtue of their auditory coherence. Noticethat this account, unlike that based on cues, has nothing to say about the units oflinguistic information that the speech signal conveys. Principles of auditory coherenceare presumed to apply not only to phonetic segments, but to every other unit oflinguistic analysis, from the feature to the prosodic contour.
A final account invokes a principle that we will call phonetic coherence. The basisfor perceptual coherence, according to this account, is said to be the coordinated patternof articulatory gestures that produced the signal. The principle is implicit in the wellknown explanation offered over 20 years ago by Abramson and Lisker (1965) for thespectral and temporal diversity of covarytng cues to voicing distinctions in manylanguages: release burst intensity, degree of aspiration and first formant (Fl) onsetfrequency. They proposed that all these cues arise from the relative timing of laryngealand supralaryngeal gestures in stop-vowel syllables:
"Laryngeal vibration provides the periodic or quasi-periodic carrier thatwe call voicing. Voicing yields harmonic excitation of a low frequencyband dUring closure, and of the full formant pattern after release of thestop. Should the onset of voicing be delayed until some time after therelease, however, there will be an interval between release and voicingonset when the relatively Unimpeded air rushing through the glottis willprovide the turbulent excitation of a voiceless carrier, commonly calledaspiration. This aspiration is accompanied by considerable attenuationof the first formant, an effect presumably to be ascribed to the presence ofthe tracheal tube below the open glottis. Finally, the intensity of theburst, that is, the transient shock excitation of the oral cavity uponrelease of the stop, may vary depending on the pressures developedbehind the stop closure where such pressures will in tum be affected bythe phasing of laryngeal closure. Thus it seems reasonable to us tosuppose that all these acoustic features [cuesl. despite their physicaldissimilarities, can be ascribed ultimately to actions of the laryngealmechanisms." (Abramson & Lisker, 1965, pp. 1-2).
Variations in voice onset time underlie voicing distinctions in many, if not all,languages, and this elegant account of the articulatory origin of the diverse cues tovoicing has been Widely accepted. What is important here, however, is the generalprinciple that the model proposes: the speech Signal coheres not because of (perhapseven in spite of) its auditory properties, but because coordinated patterns of gesture (i.e..of phonetically functional articulatory actions, such as lip closure, velum lowering,tongue raising, etc.), give rise to coordinated patterns of spectral and temporal change.By adopting the articulatory gesture, and its acoustic correlates, as its linguisticprimitive, this account proposes an objectively observable unit common to bothproduction and perception. Gestures thus form both the patterns of information thatlisteners listen for in synthetic speech, and the patterns that children must discover innatural speech if they are to learn how to talk. Thus, the phonetic coherence account isthe only account discussed here to offer a direct, concrete basis for the perceptionproduction link, and hence, for imitation. This gestural account is compatible with any
Discovering Phonetic Coherence in Acoustic Patterns

98
level of abstract linguistic unit from the phoneme (Fowler & Smith, 1986: Studdert~
Kennedy, 1987) to the word (Browman & Goldstein, 1986).
To summarize, each of these accounts offers a view, implicit or explicit, of (1) theinformation (i.e., the linguistic structure) that a speaker encodes in the signal, and (2)the mechanism by which a listener recovers that structure. Both the simple cueextraction and the cue integration accounts propose that the information is acollection, or sequence, of abstract linguistic elements-features, phonemes, or perhapssyllables-and that the recovery mechanism entails the simple extraction, or theextraction and integration, of discrete "cues" to those elements. The auditory coherenceaccount, the least lingUistically oriented, is neutral on the nature of the linguisticinformation, but proposes that listeners perceive the sound patterns of speech(whatever they may be) according to general principles of auditory form perception.Finally, the phonetic coherence account proposes that the linguistic structure of thesignal is articulatory, a pattern of gestures, and that listeners recover this structurebecause it is implicit in the acoustic signal to which it gives rise. Whether thearticulatory gestures are grouped and segregated so as to specify abstract units at anintermediate phonological level (phonemes, syllables) or only at the level of lexicalitems (morphemes. words) is a separate iSsue, not considered here.
The following three experiments were designed to test these accounts of speechperception. First, they bring further experimental eVidence to bear on the argumentspresented aboveconceming the role of cues in speech perception: They ask whetherlisteners can better learn to identify, and discriminate between, contrasting acousticpatterns by focusing attention on a discrete acoustic cue, or by focusing on the entireacoustic pattern of which the cue is a part. Second, if attention to the entire patternyields superior performance, the experiments are so designed that we can ask furtherwhether the contrasting patterns emerge according to principles of cue integration orauditory form perception, or from listeners' directing attention to their potentialphonetic coherence.
We compared the perceptual effects of an attentional focus on a phonetic contrast, Ir Ivs. 11/, with the effects of attention to a discrete acoustic cue Signaling that contrast,both in and out of context. Our stimulus materials were a continuum of sine wavespeech syllables. Sine wave speech can be heard either as distorted, thoughrecognizable, speech, or as sounds unrelated to speech (e.g., distorted musical chords orbird-like chirps) (Best, Morrongiello, & Robson, 1981; Remez, Rubin, Pisoni, & Carrell,1980). This dissociation allowed us to compare perceptual responses to the same signalunder nonspeech (auditory) and speech (phonetic) modes of attention.
EXPERIMENT 1
The first experiment investigated which of the views outlined above best accounts forthe discrete perceptual categories in a minimal P&ir speech contrast: simple cueextraction, cue integration. auditory coherence or phonetic coherence.
To test these possibilities, we developed a sine wave syllable continuum based on thetime-varying formant frequencies characteristic of American English Iral vs. Ila/. Themembers of this continuum differed only in the direction and rate of the third formant(F3) transition. which varied systematically in apprOXimately equal steps. Twoadditional series were developed for control comparisons: synthetic full-formantversions of the syllable continuum and frequency-modulated Single tonescorresponding to the F3 elements of the sine wave syllable series. Listeners participatedin one of two conditions: speech bias or music bias. Pre-test instructions and perceptualtraining tasks were deSigned to focus the speech listeners' attention on hearing the sine
Best et ai.
99
wave syllables as distorted versions of lral and Ila/. the music listeners' attention onhearing them as carrying a binary contrast (steady vs. rising) on the transition of theF3 tone. the highest tone in a distorted three-tone musical chord.
If the speech categories depend on extraction of a Single cue (F3 transition). bothgroups of listeners should perform identically in categorizing both the sine wavecontinuum and the full-formant continuum: the 50 crossover points on theiridentification functions (i.e.• their category boundaries) and the slopes of thesefunctions should be the same. Moreover. both groups should categorize the isolatedsingle tones (F3) exactly as they categorize the sine wave and full-formant syllables.
If the speech categories depend on the extraction and integration of acoustic cues. wewould expect that music listeners. trained to attend to the sine wave F3 transition.should be able to extract' and integrate that transition no less consistently than speechlisteners. They may assign a different weight to the transition in the overall structure.and thus discover a somewhat different perceptual organization with a differentcategory boundary from that of the speech listeners. but the consistency (i.e.. the slope)of the sine wave categorization functions should be roughly the same for the two groups.
Similarly. if the speech categories reflect the operation of general Gestalt prtnciplesof auditory form perception. music listeners should be able to discover at least someconsistent pattern (either the same as or different from that of the speech listeners) inthe sine wave stimuli. Thus. on the auditory coherence account. we would again expectthe slopes. if not the category boundaries. to be essentially the same for both groups.
Finally. if the speech categories depend on phonetic coherence. the two groups shoulddiffer in their judgments of the sine wave syllables. The speech listeners shouldrecognize the phonetic coherence of the sine wave syllables and should categorize themas they categorize the full-fonnant versions. with perhaps somewhat shallower slopes(Le.. greater response variability) for the sine waves, due to the phonetically'impoverished and unfamiliar patterns of the sine wave "dialect." By contrast. theMusic listeners (unable to suppress the perceptual influence of the lower tones. orperhaps to reject the automatically given auditory coherence of the sine wave patterns)should have difficulty in separating the F3 tone perceptually from its chordlike frame.and therefore in categorizing the sine wave syllables on the basis of the F3 binarycontrast. Their difficulties should be evident in flat sine wave syllable slopes. or at leastin significantly shallower slopes for these patterns than the speech listeners show.Thus. the main test of the competing hypotheses lies in the effects of instructioncondition on the slopes of the sti'le wave syllable functions.
Method
Subjects
Twenty-four subjects were tested in a between-groups design. with 12 subjects each inthe speech bias group (3 males. 9 females) and in the music bias group (7 males, 5females) (Experiment la). In 'addition. 5 of the music subjects returned for a secondsession under speech bias conditions. permitting a partial within-group test(Experiment Ib). It was not possible to conduct a full Within-group study. with conditionorders counterbalanced. since our own and other researchers' experience with sinewave speech indicates that once subjects have perceived the stimuli as speech. it isextremely uncommon for them to be able to revert to hearing them again as nonspeech.
All subjects were young adults with normal hearing. and with negative personal andfamily history of language and speech disorders. Each was paid $4 per test session.Based on their answers. to posttest questionnaires (see Procedure). one female subject
Discovering Phonetic Coherence in Acoustic Patterns

100
was eliminated from the speech group for failure to hear any of the sine wave syllablesas speechlike, and one female was eliminated from the music group because she hadheard the sine wave syllables as "sounding like r," thus reducing the n of each group to11. This was necessary because evaluation of the hypotheses depended on consistentgroup differences in hearing the sine wave syllables as either speech or nonspeech.
Stimuli
The full-fonnant Iral -/lal series ·was developed first, using the OVE-IIIc serialresonance synthesizer. The continuum contained 10 items, differing from each otheronly in the onset frequency, and in the duration of the initial steady-state portion. ofthe F3 transition (see Figure 1). These F3 properties were varied in nearly equal steps(slightly constrained by the step-size limitations of the syntheSizer). Each stimulus was330 ms in duration. The series was designed to be biased toward perception of more Ilalthan Iral tokens. This was done so that the phonetic category boundary should fallneither at the perceived shift from steady to rising F3 transitions nor at the continuummidpoint, since these physical properties were two likely foci for a psychoacousticallybased category distinction.
SINEWAVE LA-RA SERIES
3000
2500
NJ::: 2000->uffi 1500::>o~ 1000LA..
500 --J/o 50 100 150 200 250 300 350
TIME· (MSEC)
Figure 1. Schematic diagram of the center frequencies of the three formants in each of the sinewavesyllables, and each of the full-formant syllables, in the IO-item stimulus continua.
Best et al.
101
The /1/ biasing was accomplished by using a rapid F1 transition, a long-durationsteady-state at the onset of F1, and a steady-state F2. in the portion of the stimuli thatwas kept constant throughout the series, and by including one stimulus (the first on thecontinuum) with a slightly falling F3 transition. These formant characteristics areassociated with natural tokens of /1/; natural /r/ typically has short steady-states atthe onsets of the formant transitions. a relatively slow F1 transition. a slightly risingF2 transition. and a clearly rising F3 transition (MacKain. Best. & Strange, 1981). In allstimuli FO began at 119 Hz and fell steadily to 100Hz by the end of the stimulus. In theconstant portion of the stimuli. F1 onset began at 349 Hz. remained there for 75 ms.then rose linearly to 673 Hz by 100 ms , where it remained to the end of the syllable. Thesteady-state frequency of F2 was 1297 Hz. The constant portion of F3 was a steady-state2870 Hz in the final part of the stimulus, beginning at 125 ms into the syllable. The F3onset frequencies for the 10 stimulus items were 3019 (at the Ilal end ofthe continuum),2870 (a flat F3). 2729. 2576, 2431. 2278,2119, 1972, 1821, and 1670 Hz (at the lra/ end ofthe continuum). In the first stimulus (lla!), the steady-state onset ended and the F3transition began at 65 ms into the stimulus. In the tenth stimulus (Ira!). thisbreakpOint occurred at 20 ms into the stimulus. The temporal position of thebreakpoint was varied systematically in 5 ms steps for .the inteIVening stimuli.
The sine wave syllable continuum was generated with a multiple sine wavesyntheSizer program developed for the PDP-ll/45 computer at Haskins Laboratories.The frequency characteristics of the sine wave syllables rn1rnicked those from the fullformant continuum. except that each. formant was now represented as a single. timevarying tone rather than as the Wider band of harmonics found in the formants ofnatural and synthetic speech. In the sine wave syllables, there was no tone to representthe Original FO contour (see Figure 1). The isolated F3 tone continuum was made up ofthe F3 tones from the sine wave syllable continuum. presented without the tonescorresponding to F1 and F2.
Four additional stimulus series were developed for the perceptual training sequencesthat were presented in each condition before the categorization test for the sine wavesyllables. These series were designed to focus the listener's attention either on thephonetic properties of the sine wave syllables. or on their properties as three-notechords differing only in the onset characteristics of the highest note. There were twospeech bias training series. one based on the endpoint lra/ stimulus of the sine wavesyllable continuum, and the other based on the sine wave Ilal syllable with the flat F3(the second stimulus in the continuum). Each speech training series contained 11stimuli that provided a gradual, stepWise change from the full-formant syllable to thecorresponding sine wave syllable. The first item of each series was the pure fullformant version of the syllable; the last item was the pure sine wave version of thesyllable. The nine intervening stimuli were produced by mixing the exactlysynchronized. matching sine wave and full-formant syllables in inversely variedproportions, i.e., the relative amplitude of the full-formant stimulus was reduced inequal steps, while the amplitude of the sine wave syllable was correspondinglyincreased. The two music bias training series also consisted of 11 items each, but thetransformations progressed from the isolated endpoint F3 tone at the /ra/ end of thecontinuum to the corresponding endpoint sine wave syllable, and from the isolated flatF3 tone at the /la/ end of the continuum to the corresponding sine wave syllable.
Procedure
The subjects were tested in groups of 2 to 5 in a sound-attenuated experimental room.The stimuli were presented to them at a comfortable listening level (75 dB SPL) overTDH-39 headsets. .
Discovering Phonetic Coherence in Acoustic Patterns

102
All subjects first completed the experimental task. consisting of the appropriateperceptual training sequence for the condition randomly assigned to their group(speech bias or music bias), followed by the categorization test with the sine wavesyllables. This task was administered first so that the subjects' performance witn thesine wave syllables could not be influenced by exposure to the full-formant and isolatedF3 sine wave continua. The speech subjects were instructed that they would be tested ontheir ability to categorize compute~-distorted versions of the syllables /la/ and /ra/.whereas the music subjects were instructed that they would be asked to categorizecomputer-distorted chords according to whether or not there was a rising frequencyglide at the onset of the highest tone in the chords.
The subjects were then told that they would first receive some perceptual training toaid in focusing their attention on the identities of the distorted syllables (speech group),or on the steady-state vs. upgliding properties of the highest notes in the distortedchords (music group). Each training sequence proceeded in five steps. The speechsubjects first heard the pair of full-formant clear-case stimuli (lla/ and /ra/) repeatedfive times. whereas the music subjects heard five repetitions of the clear-case F3 tones(flat and rising onsets). with I-sec interstimulus intervals (ISIs) and 3-sec intertrialintervals (Ins). Next. the subjects completed a 10-item practice test to categorize arandomized sequence of these clear-case syllables or F3 tones. presented individuallywith 3-sec ISIs. by entering their choices on an answer sheet. Third. they listened to. butdid not explicitly categorize. the gradual II-step transformation. beginning with thepair of full-formant syllables or the pair of F3 tones. and ending with the clear-casepair of computer-distorted sine wave stimuli. This transformation was then played inreverse order. The forward and reverse transformation was played three. times. withISIs of 3-sec. and interblock intervals (IBIs) of 6-sec. Fourth. subjects heard the pair ofclear-case sine wave stimuli presented five times with I-sec ISIs and3-sec ms. Finally. they were given a randomized 20-item practice sequence of the clearcase sine wave stimuli presented one at a time with 3-sec ISIs. and they wrote theirchoices on answer sheets. For all practice trials. the correct answers were printed on theanswer sheets but were covered by a strip of paper; the subjects uncovered each correctanswer only after writing down their own response.
Subjects in both conditions then took a categorization test with the complete series ofsine wave syllables. The test contained 20 blocks of the 10 items in the sine wavesyllable continuum. randomized within each block. The stimuli were presentedindividually. with 3-sec ISIs and 6-sec IBIs. Subjects in the speech group circled "la" or"ra" on their answer sheets to indicate the category identity of each item in the test.Music subjects circled "steady" or "upglide" to indicate whether the highest tone in thedistorted chord had a flat frequency trajectory or a rising glissando at the onset.
After they had finished the sine wave syllable test, subjects in both groups completedcategorization tests with the two control series. the full-formant syllables and theisolated F3 tones. Each control test contained 20 randOmized blocks of the 10 items in agiven series, with 3- sec ISIs and 6-sec IBIs as before. On the full-formant syllable test.all subjects circled "la" or "ra" to indicate category aSSignments. and on the F3 tone testthey circled "steady" or "upglide."
At the end of the test session. each subject answered a questionnaire about what thesine wave syllables had sounded like to them. whether they had been able to maintainthe perceptual focus intended by their group's instructions. and whether they had madeany judgments on the basis of the opposing group's perceptual set. i.e.. whether thespeech listeners had categorized the stimuli on the basis of musical (or nonspeech)properties. and whether the music listeners had heard any as syllables.
Best et ai.

103
Results
Experiment la: Between-groups comparison
The categorization data were tabulated, for each subject on each continuum, as thepercentage of times that each item was categorized as "la" in the full-formant syllabletest and in the speech condition of the sine wave syllable test. or categorized as "steady"in the F3 tone test and in the music condition of the sine wave syllable test.
Figure 2 displays the averaged results for the two groups. The category boundaries(50% crossovers) fall at somewhat different points on the three continua (highest forthe sine wave syllables, lowest for the F3 tones), but are essentially the same for the twogroups. The slopes of the functions clearly differ across continua (steepest for the fullformant syllables, shallowest for the sine wave syllables), and are roughly the same forthe two groups on the F3 tones and full-formant syllables. The groups differ markedlyon the slopes of their sine wave syllable functions, with the slope for the music listenersbeing the shallower.
To test the significance of these effects, the data of each subject were first submitted toa probit analySiS (Finney, 1971), to determine the mean (category boundary) and slope(reciprocal of the standard deviation) of the best-fitting ogive curve by the method ofleast squares.2 Table 1 lists the mean category boundaries and slopes, together withtheir standard errors, for each group on each continuum. High slope values indicatesteep slopes: low values indicate shallow slopes. Note that the computed mean categoryboundaries and slopes, based on individual probit analyses, are not expected tocorrespond exactly with those read' from the group functions of Figure 2 (e.g., therelatively steep mean slope value of 2.30, listed ih Table 1 for the speech listeners onthe full formant syllables, was due to very steep slopes given by 3 out of the 11 listeners,but is not apparent in the group function of Figure 2). On the sine wave syllables, themusic listeners were less consistent than the speech listeners in their categoryboundaries (higher standard error), but more consistent in their (low) slope values(lower standard error).
TABLE 1. Experiment 1a: Mean category boundaries and slopes, determined fromindividual probit analyses on stimulus items 2 through 10, for speech and music listeners.
Category Boundaries Slopes
Sine Full- Sine Full-wave F3 formant wave F3 formant
Speech Listeners (n-11)
M 6.24 5.13 5.56 0.80 1.03 2.30SE (0.17) (0.26) (0.27) (0.15) (0.18) (0.54)
Music Listeners (n-11)
M 6.69 5.18 5.67 0.14 0.96 1.70SE (1.16) (0.24) (0.20) (0.05) (0.10) (0.35)
Discovering Phonetic Coherence in Acoustic Patterns

104
SINEWAVE SYLLABLE LABELINGl- 1000 -MUSIC GROUP«w -<> SPEECH GROUPIii 80·a::0· 50% CrossoverC( 60-'·0w-'w 40al«-'
~ 20wUa::wQ.
0
F3 SINEWAVE LABELING100 -MUSIC GROUP
l- -<> SPEECH GROUP0
80«wIii·0 60
50% Crossoverw-'Wal«-' 40~zwUa:: 20wQ.
0
SYNTHETIC SYLLABLE LABELING100
~ 80·owu:l 60al:)
i 40w~WQ. 20
1 234LA or FLAT
- MUSIC GROUP-<> SPEECH GROUP
50% Crossover
6 7 8 9 10RA or RISING
STIMULUS NUMBER
Figure 2. Labeling functions for the speech and music listeners on each of the three stimulus continua inExperiment la.
Two-factor (instruction group x stimulus continuum) analyses of variance were thencarried out on the categoxy boundaries and on the slopes. In these analyses. instructiongroup was a between-groups variable. stimulus continuum a within-groups variable.The categoxy boundary analysis yielded no significant effects and no Significantinteraction. The slope analysis yielded a significant effect of stimulus continuum, F(2,
Best et al.

105
40) =15.21, P < .001. an effect just short of significance for instruction condition, F(1.20) =3.59, P < .07, and no significant interaction, F(2, 40) =0.67, p> .10. Scheffe tests ofthe stimulus continuum effect showed that slopes were significantly steeper for the fullformant syllables than for the F3 tones, F(1.20) = 8.90, P < .05, and steeper for the F3tones, than for the sine wave syllables, F(I,20) = 14.19, P < .02.
The lack of an interaction in the slope analysis was unexpected, given the functionsillustrated in Figure 2. Presumably. the fact that the music group had a shallower meanslope than the speech group on all three continua gave rise to the marginal effect ofinstruction condition, but the interaction failed to reach significance due to the largecomponent contributed to the error variance by performance on the full formantsyllables (see Table 1). Nonetheless, since a test of the slope difference betweeninstruction groups on the sinewave syllables was a key to distinguishing among thecompeting hypotheses, we carried out a planned comparison by means of a simple t-teston these data (for which the error variance was relatively low: See Table 1). The resultwas highly significant. t(20) = 4.18, P < .0005.
Finally, as a test for category formation on the sine wave syllable continuum, wecarried out for each group a one-factor analysis of variance with repeated measures onstimulus items. For the Speech listeners there was a Significant effect of stimulus item,F(8,80) = 110.18, P < .0001; Scheffe tests between all possible pairs yielded Significantdifferences between all items in the group 2 through 5 and all items in the group 7through 10 (p < .05), but none between items within these groups. indicating the presenceof two distinct categories. For the music group· there was a significant effect of stimulusitem, F(8,80) = 5.88, P < .0001; but Scheffe tests between all possible item pairs yieldedsignificant differences only between item 2 and items 7 and 10, indicating no consistentcategorization.
Experiment lb: Within-groups comparison
The data for the 5 subjects who served in both instruction conditions were treated inthe same way as the data of Expenment la.3 Figure 3 displays the group functions, andTable 2 lists the mean category boundaries and slopes, with their standard errors. Thegeneral pattern of results is similar to that of the between groups comparison. On thesine wave syllables the Music condition yields a higher standard error than the Speechcondition for the category boundaries, a lower standard error for the slopes.
A two-factor analysis of variance with repeated measures on both factors(instruction condition and stimulus continuum) was carried out on the categoryboundaries and on the slopes. The category bqundary analysis yielded a significanteffect of stimulus continuum, F(2,8) = 9.70, P < .01, but no effect of instruction conditionand no Significant interaction. None of the three possible pair-by-pair categoryboundary comparisons between stimulus continua was Significant on post hoc Scheffetests. The slope analysis yielded a Significant effect of stimulus condition, F(2,8) =6.08P < .02, but no effect of instruction condition and no Significant interaction. None ofthree pair-by-patr slope comparisons between stimulus continua was significant byScheffe tests. Again, despite the lack of an interaction, 'we carried out the planned t test(for matched pairs) to compare the slopes of the sine wave syllable functions betweenthe two instruction conditions. The result was highly significant. t(4) = 6.02, P < .004.
Tests for category formation on the sine wave syllable continuum yielded asignificant effect of stimulus item for the speech condition, F(8.32)24.27. p.0001, withitems 2 through 5 and 7 through 10 again falling into distinct categOries. according toScheffe tests (p < .05 for all between-category comparisons, but not significant for anywithin-category comparisons). For the music condition there was a significant effect of
Discovering Phonetic Coherence in Acoustic Patterns

la;
stimulus items, but none of the Scheffe tests between item pairs was significant,indicating the absence of clearcut categories.
SINEWAVE SYLLABLE LABELING~ 100Q .. AS MUSIC<w
00- AS SPEECH....III 80.a:0
~ 6050% Crossover
:'QW-' 40UJCD<-'....
20zUJUa:UJ0. 0
F3 SINEWAVE LABELING100 .. AS MUSIC
~ 00- AS SPEECHQ
80<UJ....III.Q 60
50% Crossoverw-'UJCD<-' 40....ZWua: 20w0.
0
SYNTHETIC SYLLABLE LABELING100
~ 80:'QUJ
ill 60CD<-'
~ 40UJUa:UJ0. 20
.. AS MUSIC-0- AS SPEECH
50% Crossover
1 2 3 4 5 678 910LA or FlAT RA or RISING
STIMULUS NUMBER
Figure 3. Labeling functions for the speech and music listeners on each of the three stimulus continua inExperiment lb.
Best et ai.

107
TABLE 2. Experiment 1b: Mean category boundaries and slopes, determined fromindividual probit analyses on stimulus items 2 through 10, for the 5 listeners who served inboth speech and music instruction conditions.
Category Boundaries Slopes
Sine Full- Sine Full-wave F3 formant wave F3 formant
Speech Listeners (n.11)
M 5.97 5.00 5.31 0.71 1.20 1.54SE (0.43) (0.11 ) (0.44) (0.14) (0.17) (0.20)
Music Listeners (n..11)
M 7.15 4.75 5.48 0.14 1.34 1.79SE (0.68) (0.19) (0.21 ) (0.07) (0.20) (0.64)
Discussion
The significant effect of stimulus· continuum in the within-group comparison ofcategory boundaries disconfirmed the prediction of the simple cue extractionhypothesis that boundaries would be identical on the three continua. There were nogrounds in either experiment for rejecting the null hypothesis of equal categoryboundaries on the sine wave and full-formant continua,
The most decisive results came from the slope analyses. The two groups performedidentically on the two control continua (F3 tones and full-formant syllables), butdiffered on the sine wave syllable continuum. Here, the significantly shallower slopesfor the music than for the speech listeners, on both between-groups and within-groupcomparisons, suggest that attention to phonetic properties of the syllables facilitatedcategorization, whereas attention to purely auditory properties hindered it. Thisoutcome is predicted only by the phonetic coherence hypothesis.
Nonetheless, as the stimulus item analysis indicated, the identification function ofthe music listeners on the sine wave syllables was not flat. Although they gave noevidence of reliable category formation, the music listeners' functions sloped in thesame direction as that of the speech listeners in both experiments. We were thereforeconcerned that the music listeners might have been influenced by factors other thanattentional mode. Specifically, the music group might have been disadvantaged by lackof practice with the crucial acoustic features of the category exemplars (I.e., steady vs.rising F3 tones) before the categorization test on the sine wave syllables. In addition,the words "steady" vs. "upglide" may have been more arbitrary as labels for the sinewave syllable endpoints in the music condition than were the "la" and "ra" labels in thespeech condition.
EXPERIMENT 2
To meet the foregoing objections, we performed a second experiment in which we hadeach group first complete the control test that would constitute practice for the sinewave syllable categorizations (the F3 categorization test for the music listeners, the
Discovering Phonetic Coherence in Acoustic Patterns

108
full-fonnant syllable test for the speech listeners) before completing the sine wavesyllable test itself. We also prOvided the music listeners with nonverbal symbols of theendpoint F3 trajectories ( -vs. ".--) to use as category identifiers in the sine wavesyllable test rather than the perhaps arbitrary verbal labels used in Experiment 1.
Method
Subjects
Thirty young adults were tested. Of these, 13 were tested in the music bias condition(six males, seven females) and 17 were tested in the speech bias condition (four males.13 females). On the basis of their answers on the posttest questionnaires (seeExperiment I), six subjects were eliminated from the analyses, leaVing a total of 12subjects in each group. One female was withdrawn from the music group because shebegan to hear words or names in the sine wave syllables, while five subjects (one male.four females) were withdrawn from the speech group for failing to hear the sine wavespeech patterns as syllables. It may be of interest that of the latter participants, one wasnot a native speaker of English, ana another was dyslexic. All remaining subjectslacked any personal or familial history of language and speech problems. weremonolingual English speakers, and had nonnal hearing. Each received $4 for theirparticipation in the test sesSion.
Stimuli
The stimuli designed for Experiment 1 were used again in this experiment.
Procedure
The procedures were identical to those deSCribed in Experiment I, except in thefollOWing respects. The music bias group used nonverbal labels ( - vs. ".--) ratherthan the words "steady" and "upgUde" to identify the items in the sine wave syllableand isolated F3 tone continua, and they completed the F3 categorization test before thetraining sequence and test with the sine wave syllable continuum. They did not take acategorization test with the full-fonnant syllables. The speech bias group, on the otherhand, completed the categorization test with full-fonnant syllables before the trainingand test with the sine wave syllables~ They again used "la" and "ra" as their categorylabels. They did not take a test with the isolated F3 tones.
. Results
The data were treated as in the previous experiment. Figure 4 displays the groupfunctions, and Table 3 lists the mean category boundaries and slopes, with theirstandard errors. For the speech listeners the category boundary is somewhat higher.and the slope shallower, on the sine wave syllables than on the full-fonnant syllablesand the F3 tones. For music listeners the prOjected category boundary falls outSide thecontinuum for the sine wave syllables, because most of the stimuli were labeled as.. -" (steady) across the whole series; their F3 category boundary falls well below thecontinuum midpoint. The sine wave syllable slope for the music listeners is close tozero, very much shallower than on the F3 tone senes. The two groups differ strikinglyin both category boundary and slope on the sine wave syllable continuum. Once again,the pattern of standard errors indicates that the music listeners were highly Variable intheir sine wave syllable boundaries, 'but highly consistent in their low slope values.
To test the Significance of the category boundary and slope variations, we carried outt tests for correlated samples on the sine wave syllable and control continua for eachgroup, and t tests for independent samples, comparing the groups on the sine wavesyllable continuum. For the speech listeners, category boundaries on sine wave and fullformant syllables did not differ, but slopes differed Significantly, being shallower for
Best et aI.

109
the sine wave syllables, t(11) = 3.45, P < .05. For the music listeners, despite the largedifference in means, category boundaries. did not differ significantly on sine wavesyllables and F3 tones, presumably due to the very high variability of their data.However, their slopes on the two continua differed significantly, being shallower forthe sine wave syllables, t(11) = 3.84 P < .0034. The two groups did not differ in theircategory boundaries on the sine wave syllable continuum (presumably again due to thehigh variability of the music listeners), but they did differ significantly in their slopes.t.(22) = 5.62 P < .O(XH.
SINEWAVE SYLLABLE LABELING~ 100c
.. MUSIC GROUP..'" ..,. SPEECH GROUP...l" 80
'"0:c 80 50% Cro••oyerr'0
'"oJ 40'"III~...
20z'"(J
'"'"0.
F3 SINEWAVE LABELING100
~.. MUSIC GROUP
c ..,. SPEECH GROUP.. 80
'"...l"c 60 50-'1. Croasoye,
'"oJ
'"III..oJ .0...z'"(J
'" 20'"0.
SYNTHETIC SYLLABLE LABELING100
~ 80
c~w 60III
~
~ .0
~0. 20
.. MUSIC GROUP
..,. SPEECH GROUP
50·;. Croslover
1 2 3 • 5 6 7 8 9 10LA «II' FLAT RA or RISING
STIMULUS NUMBER
Figure 4. Labeling functions for the speech and music listeners on each of the three stimulus continua inExperiment 2.
Discovering Phonetic Coherence in Acoustic Patterns

110
TABLE 3. Experiment 2: Mean category boundaries and slopes, determined fromindividual probit analyses on stimulus items 2 through 10, for speech and music listeners.
Category Boundaries Slopes
Sine Full- Sine Full-wave F3 formant wave F3 formant
Speech listeners (n.11)
M 5.90 - 5.66 061 - 2.27SE (0.24) - (0.33) (0.10) - (0.46)
Music listeners (n.11)
M 10.81 3.97 - 0.04 1.25 -SE (7.74) (0.20) - (0.02) (0.31 ) -
Tests for category fonnaUon on the sine wave syllables, analogous to those ofExperiment 1, showed that stimuli 2 through 5 and 6 through 10 fell into distinctcategories for the speech listeners (p <: .05 for all between-category comparisons: notsignificant for any within-category comparisons). For the music listeners, there was noeffect of stimulus item, indicating that the slope of their mean function did not differSignificantly from zero.
Discussion
The results replicate and strengthen those of Experiment 1. The shallower slopes forthe speech listeners on sine wave than on full fonnant syllables indicate, notunexpectedly, that their responses were less consistent for the phoneticallyimpoverished and unfamiliar syllables of the sine wave dialect than for standardsynthetic speech. Otherwise, they treated the two fonns of speech identically, as thephonetic coherence hypothesis predicts. The music listeners, on the other hand, despitetheir practice with the F3 tones before hearing the sine wave syllables, performed evenless consistently than in Experiment 1. They categorized isolated F3 tones with fairconsistency, but they were quite unable to exploit this supposed cue when they heard itin the context of the two lower tones.
Nonetheless, the possibility remained that the group differences might beattributable to the use of labels per se. People have had so much more experience withnaming words and syllables than with labeling nonspeech sounds, particularly withlabeling slight differences in the onset properties of Single notes within a chord, thatthis experiential difference alone might account for the relatively poor perfonnance ofthe music listeners on the sine wave syllable task. Moreover, the memory demands ofthe task, which requires listeners to remember the category exemplars in order to labelindividual items from the continuum, may be much greater for the music listeners thanfor the speech.listeners.
EXPERIMENT 3
A categorization task that does not require labels and that prOVides the subject withcategory exemplars on each trial would circumvent the difficulties noted above, as
Best et ai.

111
would a discrimination task. We therefore conducted a third study, using an AXEcategorization procedure that provides clear-case exemplars on each trial, but does notrequire category labels (e.g., Bailey, Summerfield, & Dorman, 1977; Best et al.,1981), aswell as an AXE discrimination task that places relatively low demands on short-termmemory (Best et al., 1981).
Method
Subjects
Thirty-four young adults were tested in the third experiment. The speech biascondition was run on 12 subjects (6 males, 6 females), and the music bias condition on22 subjects (13 males, 9 females). All had normal hearing and a negative personal andfamily history of language or speech difficulties, and each was paid $4 forparticipation. Subsequently, on the basis of posttest questionnaire answers, 1 femalespeech subject was eliminated because she did not hear the sine wave syllables asspeech. Nine subjects were eliminated from the music condition: 8 of these had begun tohear the sine wave syllables as words or syllables (6 males, 2 females), and theremaining subject (a female) had failed to perceive the full-formant series as Ilal andIra/. The final sampfes were therefore unequal, with ns of 11 and 13 for the speech andmusic groups, respectively.
Stimuli
The stimuli were the same as in the first two experiments.
ProcedureThe subjects were tested under the same listening conditions as before. All subjects
completed two tests on each of the three stimulus continua: an AXE categorization testand an AXE discrimination test. They completed the categorization test before thediscrimination test for each continuum, in the order (1) sine wave syllables, (2) isolatedF3 tones, and (3) full-formant syllables. As in Experiment 1, the sine wave syllable testwas presented first to prevent any possible tilfluence of exposure to the other stimulusseries on performance with the sine wave syllables. The sine wave syllable test waspreceded by the appropriate instruction and training set for the condition randomlyassigned to each subject.
On each trial of the AXB categorization tests, three stimuli were presented. The firstand third stimuli were constant throughout the test: the endpoint Iral or rising F3 itemfrom the appropriate continuum, and the second Ilal or flat F3 item. The middlestimulus, X, varied randomly among the ten items of the stimulus series. The subject'stask on each trial was to indicate whether X belonged in the same perceptual category asA (first) or B (third). Each AXB categorization test contained 10 blocked randomizationsof the trials for the 10 items in the continuum, with 1.5-sec ISIs, 3.5-sec ms, and 5-secIBIs.
In the AXE discrimination tests, three stimuli were also presented on each trial.However, the first and third stimuli (A and B, respectively) were always three stepsapart on the appropriate stimulus continuum and varied from trial to trial, while themiddle stimulus (X) always matched either A or B. The subject's task on thediscrimination tests was to indicate whether X was identical to A or to B. Eachdiscrimination test contained five randomizations of the 28 possible AXBconfigurations, blocked in groups of 14 trials, with 1.5-sec ISIs, 3.5-sec ITIs, and 5-secIBIs.
Discovering Phonetic Coherence in Acoustic Patterns

112
Results
Categorization
The data were treated as in the previous experiments. Figure 5 displays the groupcategorization functions. and Table 4 lists the mean category boundaries and slopes.with their standard errors. Category boundaries appear to differ across continua. beinglowest on the F3 tones for both groups. The slopes on the sine wave syllables aresomewhat steeper than in the previous experiments: but they are still shallowest on thesine wave and steepest on the full-formant syllables for both groups. The musiclisteners again give a shallower slope than the speech listeners on the sine wavesyllables. and the pattern of standard errors for this continuum replicates that of theprevious experiments.
SINEWAVE SYLLABLE CATEGORIZATION100
.. MUSIC GROUPo()o SPEECH GROUP
F3 SINEWAVE CATEGORIZATION100
.. MUSIC GROUPo()o SPEECH GROUP
50% Crossover
SYNTHETIC SYLLABLE CATEGORIZATION100
.. MUSIC GROUP
..,. SPEECH GROUP
1 2 3 ~ 5 6 7 8 9 '0LA or FLAT RA Of RISING
STIMULUS NUMBER
Figure S. AXB categorization functions for the speech and music listeners on each of the three stimuluscontinua in Experiment 3.
Best et aI,
113
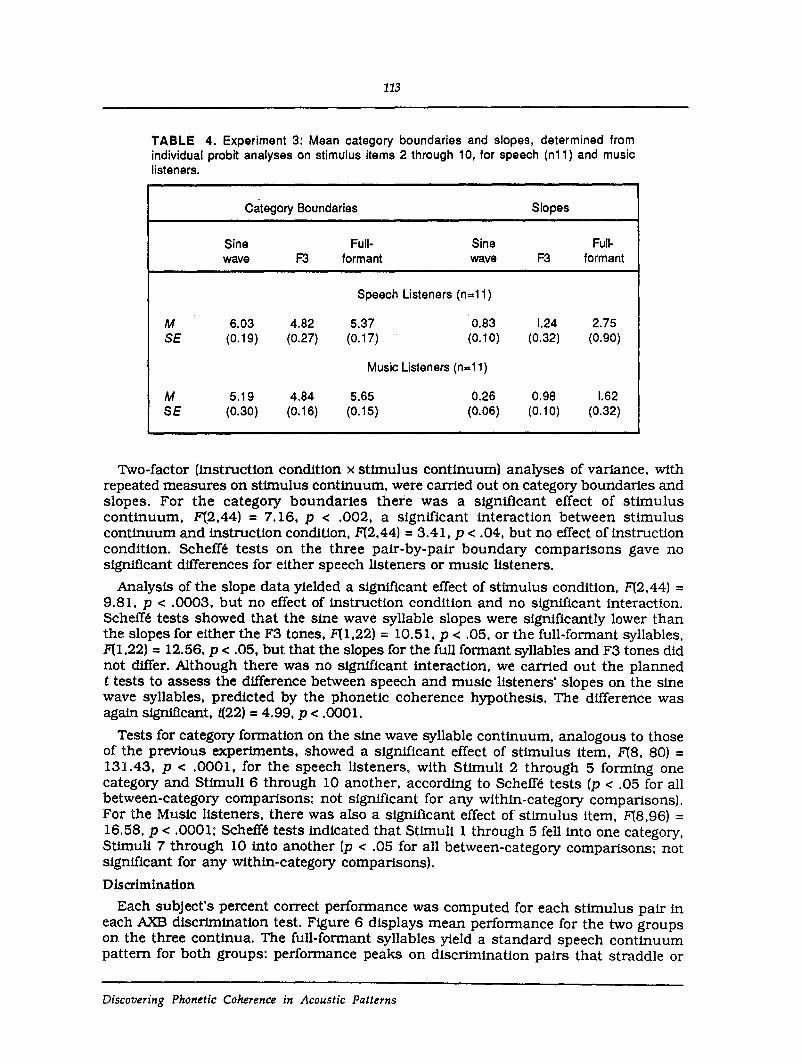
TABLE 4. Experiment 3: Mean category boundaries and slopes, determined fromindividual probit analyses on stimulus items 2 through 10, for speech (n11) and musiclisteners.
Category Boundaries Slopes
Sine Full- Sine Full-wave F3 formant wave F3 formant
Speech Listeners (n=11)
M 6.03 4.82 5.37 0.83 1.24 2.75SE (0.19) (0.27) (0.17) (0.10) (0.32) (0.90)
Music Listeners (n.11)
M 5.19 4.84 5.65 0.26 0.98 1.62SE (0.30) (0.16) (0.15) (0.06) (0.10) (0.32)
Two-factor (instruction condition x stimulus continuum) analyses of variance, withrepeated measures on stimulus continuum, were carried out on category boundartes andslopes. For the category boundaries there was a Significant effect of stimuluscontinuum, F(2,44) = 7.16, P < .002, a significant interaction between stimuluscontinuum and instruction condition, F(2,44) = 3.41, P < .04, but no effect of instructioncondition. Scheffe tests on the three pair-by-pair boundary comparisons gave nosignificant differences for either speech listeners or music listeners.
Analysis of the slope data yielded a significant effect of stimulus condition, F(2,44) =9.81, P < .0003, but no effect of instruction condition and no significant interaction.Scheffe tests showed that the sine wave syllable slopes were signifi~ant1y lower thanthe slopes for either the F3 tones, F(1,22) =10.51, P < .05, or the full-formant syllables,F(1,22) = 12.56, P < .05, but that the slopes for the full formant syllables and F3 tones didnot differ. Although there was no significant interaction, we carried out the plannedt tests to assess the difference between speech and music listeners' slopes on the sinewave syllables, predicted by the phonetic coherence hypothesis. The difference wasagain significant, t(22) = 4.99, P < .0001.
Tests for category formation on the sine wave syllable continuum, analogous to thoseof the previous experiments, showed a significant effect of stimulus item, F(8, 80) =131.43, P < .0001, for the speech listeners, with Stimuli 2 through 5 forming onecategory and Stimuli 6 through 10 another, according to Scheffe tests (p < .05 for allbetween-category compartsons; not significant for any within-category compartsons).For the Music listeners, there was also a significant effect of stimulus item, F(8,96) =16.58, P < .0001; Scheffe tests indicated that Stimuli 1 through 5 fell into one category,Stimuli 7 through 10 into another (p < .05 for all between-category comparisons; notsignificant for any within-category comparisons).
Discrimination
Each subject's percent correct peIformance was computed for each stimulus pair ineach AXB discrimination test. Figure 6 displays mean peIformance for the two groupson the three continua. The full-formant syllables yield a standard speech continuumpattern for both groups: performance peaks on discrimination pairs that straddle or
Discovering Phonetic Coherence in Acoustic Patterns

114
abut the category boundary. We see a similar, though somewhat flattened, function forthe speech listeners on the sine wave syllables. By contrast, the music listeners show nosystematic peaks on the sine wave syllables: performance declines across thecontinuum, as it does for both groups on the F3 tones. although the latter elicit agenerally higher level of discrimination than the other continua.
SINEWAVE SYLLABLE DISCRIMINATION100
... MUSIC GROUP
..,. SPEECH GROUP90
13"'a:a: 800u...z"' 70l£"'Cl.
60
•50
F3 SINEWAVE DISCRIMINATION100
... MUSIC GROUP
..,. SPEECH GROUP90...
u"'a:a: 800u...z"' 70Ua:
"'Cl.
60
•50 .
SYNTHETIC SYLLABLE DISCRIMINATION100
... MUSIC GROUP
.... SPEECH GROUP90
tl"'a:a: 800u...zw 70Ua:
"'Cl.
60 . e50 .
104 2·5 3·1 4·1 5·1 I·' 1 6 10
DISCRIMINATION PAIR
Figure 6. Discrimination functions for the speech and music listeners on each of the three stimuluscontinua in Experiment 3. The markers above the abcissa indicate the status of each stimulus pair withrespect to categorization judgments. Triangles indicate pairs that straddle the category boundary for agiven group. Circles indicate pairs in which one item is at or near the boundary. Filled markers representthe music listeners' data, open markers the speech listeners data.
Best et al.

115
A three factor (instruction condition x stimulus continuum x discrimination pair)analysis of variance. with repeated measures on stimulus continua and discriminationpairs. was carried out. A significant stimulus continuum effect, Fl2,44) = 51.99. P <.00001. indicated that discrimination performance was highest overall for the isolatedF3 tones and lowest for the sine wave syllables. A significant interaction betweeninstruction condition and stimulus continuum. Fl2.44) = 5.56. P < .01. combined withScheffe tests. indicated that the two groups differed in performance only on the sinewave syllable test. on which the speech listeners outperformed the music listeners.FlI.22) = 13.88. P < .05. Further SchefTe tests showed that performance on the sine waveand full-formant syllable tests did not differ for the speech listeners. but did differSignificantly for the music listeners. F(1.12) = 75.58. p. < 001.
The effect of discrimination pair was significant, Fl6.132) = 16.29. P < .00001.indicating that overall performance level was not uniform throughout the stimuluscontinua. but rather showed higher performance on some discrimination pairs than onothers. A significant interaction between discrimination pair and stimulus continuum.FlI2.264) = 5.29. P < .00001. indicated further that the pattern of the discriminationfunction differed among the three stimulus continua. A three-way interaction ofinstruction group with discrimination pair and stimulus continuum. Fl12.264) = 3.01. P< .005. evidently arose because. according to a Scheffe test of the instruction bydiscrimination pair interaction. Fl6.132) = 6.01. P < .01. only the speech group showed apeak in performance level near the category boundary on the sine wave syllable test.
Discussion
The influence of 'attentional mode on perception of the sine wave syllablesdemonstrated in the previous experiments was replicated in Experiment 3. Evidentlythe difference in the way speech and music listeners categorize these syllables reflects atrue difference in perceptual response. and is not simply a function of differences inability to assign labels to speech versus nonspeech stimuli. nor in the influence ofshort-term memory for the speech versus nonspeech category exemplars. Althoughremoval of the requirement for overt labeling. as well as presentation of categoryexemplars for comparison with the target item on each trial. certainly permitted themusic listeners to form somewhat more consistent sine wave syllable categories thanwere obsexved in the previous experiments. these listeners were still less consistentthan the speech listeners. and gave no evidence of a peak at their sine wave syllablecategory boundary in the discrimination test. Evidently their categories. such as theyare, are less robust and more dependent on experimental conditions than those of thespeech listeners. Thus. support for the phonetic coherence hypotheSis. over thealternative psychoacoustic hypotheses. was considerably strengthened by the thirdexperiment.
GENERAL DISCUSSION
The results of these three experiments are inconsistent with the claim that speechperception entails the simple extraction, or the extraction and integration. of discreteinformation-bearing elements or cues. All listeners could correctly classify. withinpsychophysical limits. the transitions on the isolated F3 tones as steady or rising.However. music listeners. biased to listen for the transition in the context of the lowerFl and F2 tones. could not then reliably recover the target pattern. They also could noteither integrate the F3 cue with other cues in the Fl·F2 array or apprehend the auditorycoherence of the total pattern so as to arrive at a unitary. distinctive percept for eachcategory. By contrast. listeners biased to hear the sine wave patterns as speech were
Discovering Phonetic Coherence in Acoustic Patterns
116
eVidently immune to whatever psychoacoustic interactions blocked consistentjudgments of the patterns by music listeners, in that the fonner classified the sine wavesyllables only somewhat less consistently than they classified the full-formantsyllables. These results agree with those of several other studies of sine wave speech inarguing for a specialized mode of speech perception (e.g., Best et al., 1981; Tomiak.Mullenix, & Sawusch, 1987; Williams, J987).
How are we to characterize this mode? What did the speech listeners in theseexperiments do that the music listeners did not? Consider, first, the music listeners'performance with the sine wave syllables. In Experiment 1, and particularly inExperiment 3, where labeling was not reqUired so that listeners could compare wholesignals without attempting to isolate distinctive cues. the music group's categorizationfunction sloped in the "correct" direction. At least some of these listeners graspedcertain contrastive properties of the signals. even though, according to the post-testquestionnaire, they did not perceive them as speech. One suspects that, with sufficientlyprolonged training under suitable experimental conditions (such as those provided byAXB categorization, as used in Experiment 3), these listeners might even come to renderjudgments of the sine wave syllables no less consistent than those of the speechlisteners. But if they did so, it would remain notable that they reqUire extensivetraining whereas the speech listeners require very little. Moreover, even if extensivetraining aided the music listeners, would they then be perceiving the patterns asspeech? The answer would surely be yes, if they could tell us the names of the soundsthey had heard-that is, if they had discovered the articulatory patterns implied by thesignals. But if they could not tell us the names, the answer would be no. Their conditionmight, in fact, be much like that of non-human animals trained to distinguish betweenspeech sound categories (Kluender, Diehl, & Killeen, 1987). Alternatively, they might becategorizing the patterns on adventitious nonspeech properties. rather as a color-blindindividual might correctly classify two objects of different colors on the basis of theirdifferences in brightness rather than of their differences in hue.
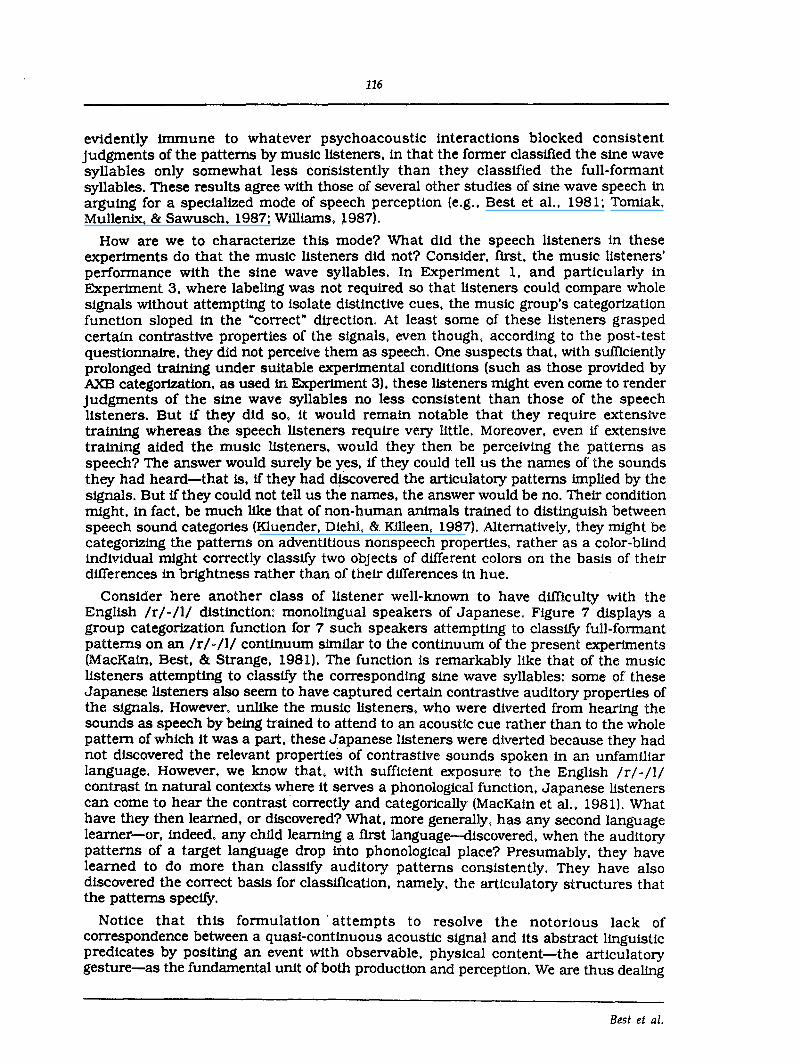
Consider here another class of listener well-known to have difficulty with theEnglish /r/-/l/ distinction: monolingual speakers of Japanese. Figure 7 displays agroup categorization function for 7 such speakers attempting to classify full-formantpatterns on an /r/-/l/ continuum similar to the continuum of the present experiments(MacKain, Best, & Strange, 1981). The function is remarkably like that of the musiclisteners attempting to classify the corresponding sine wave syllables: some of theseJapanese listeners also seem to have captured certain contrastive auditory properties ofthe signals. However, unlike the music listeners, who were diverted from hearing thesounds as speech by being trained to attend to an acoustic cue rather than to the wholepattern of which it was a part, these Japanese listeners were diverted because they hadnot discovered the relevant properties of contrastive sounds spoken in an unfamiliarlanguage. However, we know that. with sufficient exposure to the English /r/-/llcontrast in natural contexts where it serves a phonological function. Japanese listenerscan come to hear the contrastcorrectly and categOrically (MacKain et al., 1981). Whathave they then learned, or discovered? What, more generally, has any second languagelearner-or, indeed, any child learning a first language-discovered, when the auditorypatterns of a target language drop iilto phonological place? Presumably, they havelearned to do more than classify auditory patterns consistently. They have alsodiscovered the correct baSis for classification, namely, the articulatory structures thatthe patterns specify.
Notice that this formulation' attempts to resolve the notorious lack ofcorrespondence between a quasi-continuous acoustic signal and its abstract linguisticpredicates by positing an event with observable. phySical content-the articulatorygesture-as the fundamental unit of both production and perception. We are thus dealing
Best et al.

117
with patterns of movement in space and time, accessible to treatment according togeneral principles of motor control (Browman & Goldstein, 1986: Kelso, Tuller &Harris, 1983: Saltzman & Kelso, 1987). The task for perceptual theory is then to uncoverthe acoustic properties that specify a particular pattern of gestures. These acousticproperties will not simply be a collection of independent cues, arrived at by(articulatorily) unconstrained manipulation of a tenninal analog synthesizer, but setsof correlated properties that arise from coordinated patterns of gesture, tested bysystematic articulatory synthesis.
100
80
C/)WC/)
Z00-C/)Wc:.......~
a~
.......
I- 40Zw()a:Ll.l0-
20
l%:W>oenenol%:U'j..oIII
O.....-I._....._ .........._ ....................._ ........._~
2 3 4 5 6 7 8
STI MULUS NUMBER9 10
Figure 7. Labeling of a rock-lock continuum by Japanese adults without extensive English conversationexperience. Adapted from "Categorical Perception of English IrI and III by Japanese Bilinguals" by K. S.MacKain, C. T. Best, and W. Strange, 1981, Applied Psycholinguistics, 2, p. 378. Copyright 1981 byCambridge University Press. Reprinted by permission.
Discovering Phonetic Coherence in Acoustic Patterns

118
We should emphasize that we are not here arguing for a "motor theory" of speechperception. We are not proposing that the process of arriving at a speech percept engagesmechanisms outside the auditory system that humans share with many other animals.What is specific to speech, and to humans, is the final percept, a phonological structuredetermined by the structure of the articulatory gestures from which the Signal arose (cf.Repp, 1987). Since (as the Japanese listeners show) this structure is inaccessible to adulthumans, unless they can assimilate the sounds to the phonological categories of alanguage they know (see Best, McRoberts, & Sithole, 1988), we assume aforttort that it isalso inaccessible to the infant who does not yet know a language. The infant's task is todiscover the phonetic coherence of phonological categories in the surrounding languageby focusing attention on recurrent auditory contrasts that Signal changes of meaning inthat language (see Jusczyk, 1986: Studdert-Kennedy, 1986, 1987). An articulatory"representation" of the phonologically contrastive patterns is then an automaticconsequence of the species-specific perceptuomotor link that underlies the child'scapacity to imitate speech patterns, and so to learn to talk.
Finally, although we have couched our experimental procedures in terms ofattention, we do not mean to imply that the processes of speech perception can beengaged or disengaged at wilt For, although some listeners can choose to attend or notto attend to particular aspects of a speech signal, such as a speaker's "accent." or eventhe spectral properties of a fricative noise (Repp, 1981), it is difficult, if not impossible,to hear natural speech, spoken clearly in a language that we know, as nonspeech. And,as we have already remarked, listeners who have once heard a particular sine wavepattern as speech find it dltT1cult later to hear that pattern-or any other sine wavepattern modeled on speech-as entirely devoid of phonetic structure. Evidently,perceiving speech-like patterns as speech is·as mandatory, automatic and unconsciousas, say, perceiving the rhythm and melody of a nonspeech auditory form.
ACKNOWLEDGMENT
Preparation of this paper was supported in part by NIH Grant HD-O 1994 to HaskinsLaboratories. We thank Len Katz for statistical advice, Michael Dorman, Peter Jusczyk,and Bruno Repp for useful comments on the texts of earlier versions.
REFERENCES
Abramson, A. S., &: Lisker, L. (1965). Voice onset time in stop consonants: Acoustic analysis and synthesis.In D. E. Commins (Ed.), Proceedings of the 5th International Congress of Acoustics (A51). Liege: G.Thone.
Bailey, P. I., &: Summerfield, Q. (1980). Information in speech: Observations on the perception of [s1-stopclusters. Journal of Experimental Psychology: Human Perception and Performance, 6, 536-563.
Bailey, P. I., Summerfield, Q., &: Dorman, M. F. (1977). On the identification of sine-wave analogues ofcertain speech sounds. Haskins Laboratories Status Report, SR51/52, 1-25.
Best, C. T., Morrongiello, B., &: Robson, R. (1981). Perceptual equivalence of acoustic cues in speech andnonspeech perception. Perception and Psychophysics, 29, 191-211.
Best, C. T., McRoberts, G. W., &: Sithole, N. M. (1988). Examination of perceptual reorganization for nonnative speech contrasts: Zulu click discrimination by English-speaking adults and infants. Journal ofExperimental Psychology: Human Perception and Performance, 14, 345·360.
Bregman, A. (1981). Asking the "what for" question in auditory perception. In M. Kubovy &: I. R.Pomerantz (Eds.), Perceptual organization (pp. 99-118). Hillsdale, NJ: Lawrence Erlbaum Associates.
Browman, C. P., &: Goldstein, L. (1986). Towards an articulatory phonology. Phonology Yearbook, 3,219-252.Cole, R. A., &: Scott, B. (1974). Toward a theory of speech perception. Psychological Review, 81,348-374.Cutting, I. E. (1976). Auditory and linguistic processes in speech perception: Inferences from six fusions in
dichotic listening. Psychological Review, 83, 114-140.
Best et ai.

119
Darwin, C. ]. (1984). Perceiving vowels in the presence of another sound: Constraints on formantperception. Journal of the Acoustical Scociety of America, 76, 1636-1647.
Delgutte, B. (1982). Some correlates of phonetic distinctions at the level of the auditory nerve. In R.Carlson & B. Granstrom (Eds.), The representation of speech in the peripheral auditory system (pp. 131149). New York: Elsevier Biomedical Press.
Dorman, M. F., Cutting,]. E., & Raphael, L. (1975). Perception of temporal order in vowel sequences withand without formant transitions. Journal of Experimental Psychology: Human Perception andPerformance, 1, 121-129.
Dorman, M. F., Studdert-Kennedy, M., & Raphael, L.]. (1977). Stop consonant recognition: Release burstsand formant transitions as functionally equivalent, context-dependent cues. Perception andPsychophysics, 22, 109-122.
Finney, D.]. (1971). Probit analysis. Cambridge: Cambrideg University Press.Fowler, C. A., & Smith, M. (1986). Speech perception as "vector analysis": An approach to the problems of
segmentation and invariance. In ]. S. Perkell & D. H. Klatt (Eds.), Invariance and variability of speechprocesses (pp. 123-136). Hillsdale, N]: Lawrence Erlbaum Associates.
]usczyk, P. W. (1986). Toward a model of the development of speech perception. In ]. S. Perkell & D. H.Klatt (Eds.), Invariance and variability of speech processes (pp. 1-19). Hillsdale, N]: Erlbaum Associates.
]usczyk, P. W., Smith, L. B., & Murphy, C. (1981). The perceptual classification of speech. Perception andPsychophysics, 30, 10-23.
Kelso, ]. A. S., Tuller, B., & Harris, K. (1983). A 'dynamic pattern' perspective on the control andcoordination of movement. In P. MacNeilage (Ed.), The production of speech. New York: SpringerVerlag.
Kluender, K. R., Diehl, R. L., & Killeen, P. R (1987). Japanese quail can learn phonetic categories. Science,237,1195-1197.
MacKain, K. S., Best, C. T., & Strange, W. (1981). Categorical perception of English /r/ and /1/ byJapanese bilinguals. Applied Psycholinguistics, 2, 369-390.
Mattingly, I. G. (1981). Phonetic representation and speech synthesis by rule. In T. Myers, ]. Laver, & ].Anderson (Eds.). The cognitive representation of speech (pp. 415-420). Amsterdam: North Holland.
Mattingly, I. G., Liberman, A. M., Syrdal, A. M., & Halwes, T. (1971). Discrimination in speech andnonspeech modes. Cognitive Psychology, 2, 131-157.
Oden, G. C., & Massaro, D. W. (1978). Integration of featural information in speech perception.Psychological Review, 85, 172-191-
Pastore, R. E. (1981). Possible psychoacoustic factors in speech perception. In P. D. Eimas & ]. L. Miller(Eds.), Perspectives on the study of speech. Hillsdale, N]: Lawrence Erlbaum Associates.
Remez, R E., Rubin, P. E., Pisoni, D. B., & Carrell, T. D. (1980). Speech perception without traditionalspeech cues. Science, 212, 947-950.
Repp, B. H. (1981). Two strategies in fricative discrimination. Perception and Psychophysics, 30, 217-227.Repp, B. H. (1987). The role of psychophysics in understanding speech perception. In M. E. H. Schouten
(Ed.), The Psychophysics of Speech Perception (pp. 3-27). Boston: Martinus Nijhoff.Saltzman, E., & Kelso, ]. A. S. (1987). Skilled actions: A task-dynamic approach. Psychological Review, 94,
84-106.Schouten, M. E. H. (1980). The case against a speech mode of perception. Acta Otolaryngologica, 44, 71-98.Studdert-Kennedy, M. (1986). Sources of variability in early speech development. In]. S. Perkell & D. H.
Klatt (Eds.), Invariance and variability of speech processes, Hillsdale (pp. 58-76). N]: Lawrence ErlbaumAssociates.
Studdert-Kennedy, M. (1987). The phoneme as a perceptuomotor structure. In A. Allport, D. MacKay, W.Prinz, & E. Scheerer (Eds.), Language perception and production (pp. 67-84). London: Academic Press.
Tomiak, G. R, Mullenix,]. W., & Sawusch, ]. R. (1987). Integral processing of ph9nemes: Evidence for aphonetic mode of perception. Journal of the Acoustical Scociety of America, 81, 755-764.
Williams, D. R (1987). The role of dynamic information in the perception of coarticulated vowels.Unpublished doctoral dissertation, University of Connecticut.
Discovering Phonetic Coherence in Acoustic Patterns

120
FOOTNOTES
"Perception and Psychophysics, 1989,45(3), 237-250.
tAlso Wesleyan University.
ttAlso University of Connecticut and Yale University.
tttMassachusetts Institute of Technology.
ttttNYNEX Science and Technology, White Plains, NY.
lIn this paper we use the term cohere, and-its derivatives, to refer to the effect of a perceptual processby which listeners apprehend a complex signal as a unitary pattern, or configuration, rather than asa collection of discrete elements. In vision, we may add to the many examples familiar fromtextbook treatments of Gestalt principles, the phenomenon of face recognition, where the identity ofa face emerges as a holistic pattern, not simply a collection of discrete features. In speech, theunitary patterns would correspond to units of linguistic function, such as phonemes, syllables,morphemes, words.
2Because the first stimulus on the continuum had a slightly falling transition (originally intended tohelp bias the full-formant series toward /1/, as noted above), listeners (particularly the musiclisteners on the sine wave syllables, and both groups on the F3 tones) tended to judge this stimuluswith slightly less consistency than its neighbors (see Figures 2 through 5). As a result, probit analysestended to yield lower slopes than were characteristic of the main bodies of the functions, and so toexaggerate the slope differences between groups and conditions. We therefore omitted thisstimulus from the probit analyses: all computed means and slopes in this and the followingexperiments are based on analyses of individual functions for stimuli 2 through 10.
Note, further, that by converting the standard deviations of the underlying distributions into theirreciprocals (the slopes of the cumulative functions), we went some way toward homogenizing thegroup variances, as appropriate for subsequent analyses of variance. At the same time, we reducedthe apparent differences between groups across stimulus continua. For example, in Table 1 thedifference between the mean slopes for the two instruction conditions is not much greater on thesine wave syllables (0.80 - 0.14 =0.66) than on the full formant syllables (2.30 • 1.70 =0.60). But thedifference between the mean standard deviations for the two conditions is very much greater on thesine wave syllables (1/0.14 -1/0.80 =5.89) than on the full formant syllables 0/1.70 -1/2.30 =0.15).The reader should bear this in mind when comparing slopes depicted in the figures with slopevalues listed in the tables.
3Qne of the five music subjects from Experiment la, who returned to take the speech test, later turnedout to be the one we rejected from that experiment because she had heard some of the sine wavesyllables as "sounding like r." However, her data were not appreciably different from those of othermusic listeners, and so we retained her in Experiment lb. If her tendency to hear some of the sinewave syllables as r-like had facilitated her categorization of these syllables, the result wouldpresumably have been to reduce the differences between instruction conditions. However, theresults of statistical analyses on the data of Experiment Ib were unchanged when this fifth subject'sdata were eliminated.
Best et aI.
Copyright © 2022 FDOKUMEN


![Phonetic detail in assimilation: Problems in Germanic phonology [1972]](https://static.fdokumen.com/doc/165x107/631db0714265d1c0f107156f/phonetic-detail-in-assimilation-problems-in-germanic-phonology-1972.jpg)