Non-alcoholic fatty liver disease: Spectral patterns observed from an in vivo phosphorus magnetic...
7
Non-alcoholic fatty liver disease: Spectral patterns observed from an in vivo phosphorus magnetic resonance spectroscopy study Jill M. Abrigo 2 , Jiayun Shen 1,3 , Vincent W.-S. Wong 1,3 , David K.-W. Yeung 4 , Grace L.-H. Wong 1,3 , Angel M.-L. Chim 1,3 , Anthony W.-H. Chan 5 , Paul C.-L. Choi 5 , Francis K.-L. Chan 1,3 , Henry L.-Y. Chan 1,3,⇑ , Winnie C.-W. Chu 1,2,⇑ 1 Institute of Digestive Disease, The Chinese University of Hong Kong, Hong Kong; 2 Department of Imaging and Interventional Radiology, The Chinese University of Hong Kong, Hong Kong; 3 Department of Medicine and Therapeutics, The Chinese University of Hong Kong, Hong Kong; 4 Department of Clinical Oncology, The Chinese University of Hong Kong, Hong Kong; 5 Department of Anatomical and Cellular Pathology, The Chinese University of Hong Kong, Hong Kong Background & Aims: Liver biopsy is the gold standard for diagnosing non-alcoholic fatty liver disease (NAFLD) but with practical constraints. Phosphorus magnetic resonance spectros- copy ( 31 P-MRS) allows in vivo assessment of hepatocellular metab- olism and has shown potential for biochemical differentiation in diffuse liver disease. Our aims were to describe spectroscopic signatures in biopsy-proven NAFLD and to determine diagnostic performance of 31 P-MRS for non-alcoholic steatohepatitis (NASH). Methods: 31 P-MRS was performed in 151 subjects, comprised of healthy controls (n = 19) and NAFLD patients with non-NASH (n = 37) and NASH (n = 95). Signal intensity ratios for phospho- monoesters (PME) including phosphoethanolamine (PE), phos- phodiesters (PDE) including glycerophosphocholine (GPC), total nucleotide triphosphate (NTP) including a-NTP, and inorganic phosphate (Pi), expressed relative to total phosphate (TP) or [PME+PDE] and converted to percentage, were obtained. Results: Compared to controls, both NAFLD groups had increased PDE/TP (p <0.001) and decreased Pi/TP (p = 0.011). Non-NASH patients showed decreased PE/[PME+PDE] (p = 0.048), increased GPC/[PME+PDE] (p <0.001), and normal NTP/TP and a-NTP/TP. Whereas, NASH patients had normal PE/[PME+PDE] and GPC/ [PME+PDE], but decreased NTP/TP (p = 0.004) and a-NTP/TP (p <0.001). The latter was significantly different between non- NASH and NASH (p = 0.047) and selected as discriminating parameter, with area under the receiver-operating characteristics curve of 0.71 (95% confidence interval, 0.62–0.79). An a-NTP/TP cutoff of 16.36% gave 91% sensitivity and cutoff of 10.57% gave 91% specificity for NASH. Conclusions: 31 P-MRS shows distinct biochemical changes in different NAFLD states, and has fair diagnostic accuracy for NASH. Ó 2013 European Association for the Study of the Liver. Published by Elsevier B.V. All rights reserved. Introduction Liver biopsy remains the gold standard for the diagnosis and lon- gitudinal assessment of non-alcoholic fatty liver disease (NAFLD), but is invasive, carries a small risk of complications, suffers from sampling error and is impractical for assessing large populations. Consequently, the development of surrogate diagnostic markers to distinguish potentially progressive non-alcoholic steatohepati- tis (NASH) from benign simple steatosis has become an emerging priority [1,2]. NASH is marked by liver cell injury and inflamma- tion, and may evolve to cirrhosis and its complications, including hepatocellular carcinoma [3]. Currently, conventional ultrasound and proton/ 1 H-magnetic resonance spectroscopy (MRS) qualifies and quantifies hepatic fat, respectively [4,5], while ultrasound elastography detects advanced fibrosis [6]. To date there is no reliable non-invasive imaging technique to identify NASH. Phosphorus/ 31 P-MRS has been employed in the differentiation of various chronic liver diseases with thematic results [7,8]. The phosphomonoesters (PME) signal mainly represents cell Journal of Hepatology 2014 vol. 60 j 809–815 Keywords: Non-alcoholic steatohepatitis; Simple steatosis; Liver fibrosis; Phosphorus metabolites; Adenosine triphosphate. Received 21 December 2012; received in revised form 10 November 2013; accepted 19 November 2013; available online 26 November 2013 ⇑ Corresponding authors. Addresses: Department of Medicine and Therapeutics, Prince of Wales Hospital, 30-32 Ngan Shing Street, Shatin, Hong Kong. Tel.: +852 26323593; fax: +852 26373852 (H.L.-Y. Chan). Department of Imaging and Interventional Radiology, Prince of Wales Hospital, 30-32 Ngan Shing Street, Shatin, Hong Kong. Tel.: +852 26322299; fax: +852 26360012 (W.C.-W. Chu). E-mail addresses: [email protected] (H.L.-Y. Chan), [email protected] (W.C.-W. Chu). Abbreviations: NAFLD, non-alcoholic fatty liver disease; 31 P-MRS, phosphorus m- agnetic resonance spectroscopy; NASH, non-alcoholic steatohepatitis; PME, ph- osphomonoesters; PE, phosphoethanolamine; PDE, phosphodiesters; GPC, glycerophosphocholine; NTP, nucleotide triphosphate; Pi, inorganic phosphate; TP, total phosphate; 1 H-MRS, proton magnetic resonance spectroscopy; NDP, n- ucleotide diphosphate; ATP, adenosine triphosphate; NAD/NADPH, nicotinamide adenine dinucleotide/phosphate; MRI, magnetic resonance imaging; IHTG, intra- hepatic triglyceride; VOI, volume of interest; TR, repetition time; TE, echo time; AMARES, advanced method for accurate, robust, and efficient spectral fitting; PC, phosphocholine; GPE, glycerophosphorylethanolamine; AUROC, area under rec- eiver-operating characteristics curve; PPV, positive predictive value; NPV, neg- ative predictive value; CV, coefficient of variation; ICC, intraclass correlation coefficient; BMI, body mass index; ALT, alanine aminotransferase; ER, endoplas- mic reticulum; ROS, reactive oxygen species. Research Article
-
Upload
independent -
Category
Documents
-
view
2 -
download
0
Transcript of Non-alcoholic fatty liver disease: Spectral patterns observed from an in vivo phosphorus magnetic...
Research Article
Non-alcoholic fatty liver disease: Spectral patterns observed from anin vivo phosphorus magnetic resonance spectroscopy study
Jill M. Abrigo2, Jiayun Shen1,3, Vincent W.-S. Wong1,3, David K.-W. Yeung4, Grace L.-H. Wong1,3,Angel M.-L. Chim1,3, Anthony W.-H. Chan5, Paul C.-L. Choi5, Francis K.-L. Chan1,3,
Henry L.-Y. Chan1,3,⇑, Winnie C.-W. Chu1,2,⇑
1Institute of Digestive Disease, The Chinese University of Hong Kong, Hong Kong; 2Department of Imaging and Interventional Radiology,The Chinese University of Hong Kong, Hong Kong; 3Department of Medicine and Therapeutics,
The Chinese University of Hong Kong, Hong Kong; 4Department of Clinical Oncology, The Chinese University of Hong Kong, Hong Kong;5Department of Anatomical and Cellular Pathology, The Chinese University of Hong Kong, Hong Kong
Background & Aims: Liver biopsy is the gold standard fordiagnosing non-alcoholic fatty liver disease (NAFLD) but withpractical constraints. Phosphorus magnetic resonance spectros-copy (31P-MRS) allows in vivo assessment of hepatocellular metab-olism and has shown potential for biochemical differentiation indiffuse liver disease. Our aims were to describe spectroscopicsignatures in biopsy-proven NAFLD and to determine diagnosticperformance of 31P-MRS for non-alcoholic steatohepatitis (NASH).Methods: 31P-MRS was performed in 151 subjects, comprised ofhealthy controls (n = 19) and NAFLD patients with non-NASH(n = 37) and NASH (n = 95). Signal intensity ratios for phospho-monoesters (PME) including phosphoethanolamine (PE), phos-phodiesters (PDE) including glycerophosphocholine (GPC), totalnucleotide triphosphate (NTP) including a-NTP, and inorganicphosphate (Pi), expressed relative to total phosphate (TP) or[PME+PDE] and converted to percentage, were obtained.
Journal of Hepatology 20
Keywords: Non-alcoholic steatohepatitis; Simple steatosis; Liver fibrosis;Phosphorus metabolites; Adenosine triphosphate.Received 21 December 2012; received in revised form 10 November 2013; accepted 19November 2013; available online 26 November 2013⇑ Corresponding authors. Addresses: Department of Medicine and Therapeutics,Prince of Wales Hospital, 30-32 Ngan Shing Street, Shatin, Hong Kong. Tel.: +85226323593; fax: +852 26373852 (H.L.-Y. Chan). Department of Imaging andInterventional Radiology, Prince of Wales Hospital, 30-32 Ngan Shing Street,Shatin, Hong Kong. Tel.: +852 26322299; fax: +852 26360012 (W.C.-W. Chu).E-mail addresses: [email protected] (H.L.-Y. Chan), [email protected](W.C.-W. Chu).Abbreviations: NAFLD, non-alcoholic fatty liver disease; 31P-MRS, phosphorus m-agnetic resonance spectroscopy; NASH, non-alcoholic steatohepatitis; PME, ph-osphomonoesters; PE, phosphoethanolamine; PDE, phosphodiesters; GPC,glycerophosphocholine; NTP, nucleotide triphosphate; Pi, inorganic phosphate;TP, total phosphate; 1H-MRS, proton magnetic resonance spectroscopy; NDP, n-ucleotide diphosphate; ATP, adenosine triphosphate; NAD/NADPH, nicotinamideadenine dinucleotide/phosphate; MRI, magnetic resonance imaging; IHTG, intra-hepatic triglyceride; VOI, volume of interest; TR, repetition time; TE, echo time;AMARES, advanced method for accurate, robust, and efficient spectral fitting; PC,phosphocholine; GPE, glycerophosphorylethanolamine; AUROC, area under rec-eiver-operating characteristics curve; PPV, positive predictive value; NPV, neg-ative predictive value; CV, coefficient of variation; ICC, intraclass correlationcoefficient; BMI, body mass index; ALT, alanine aminotransferase; ER, endoplas-mic reticulum; ROS, reactive oxygen species.
Results: Compared to controls, both NAFLD groups had increasedPDE/TP (p <0.001) and decreased Pi/TP (p = 0.011). Non-NASHpatients showed decreased PE/[PME+PDE] (p = 0.048), increasedGPC/[PME+PDE] (p <0.001), and normal NTP/TP and a-NTP/TP.Whereas, NASH patients had normal PE/[PME+PDE] and GPC/[PME+PDE], but decreased NTP/TP (p = 0.004) and a-NTP/TP(p <0.001). The latter was significantly different between non-NASH and NASH (p = 0.047) and selected as discriminatingparameter, with area under the receiver-operating characteristicscurve of 0.71 (95% confidence interval, 0.62–0.79). An a-NTP/TPcutoff of 16.36% gave 91% sensitivity and cutoff of 10.57% gave91% specificity for NASH.Conclusions: 31P-MRS shows distinct biochemical changes indifferent NAFLD states, and has fair diagnostic accuracy for NASH.� 2013 European Association for the Study of the Liver. Publishedby Elsevier B.V. All rights reserved.
Introduction
Liver biopsy remains the gold standard for the diagnosis and lon-gitudinal assessment of non-alcoholic fatty liver disease (NAFLD),but is invasive, carries a small risk of complications, suffers fromsampling error and is impractical for assessing large populations.Consequently, the development of surrogate diagnostic markersto distinguish potentially progressive non-alcoholic steatohepati-tis (NASH) from benign simple steatosis has become an emergingpriority [1,2]. NASH is marked by liver cell injury and inflamma-tion, and may evolve to cirrhosis and its complications, includinghepatocellular carcinoma [3].
Currently, conventional ultrasound and proton/1H-magneticresonance spectroscopy (MRS) qualifies and quantifies hepaticfat, respectively [4,5], while ultrasound elastography detectsadvanced fibrosis [6]. To date there is no reliable non-invasiveimaging technique to identify NASH.
Phosphorus/31P-MRS has been employed in the differentiationof various chronic liver diseases with thematic results [7,8]. Thephosphomonoesters (PME) signal mainly represents cell
14 vol. 60 j 809–815
Frequency (ppm)15 -15 -2010 -105 0 -5
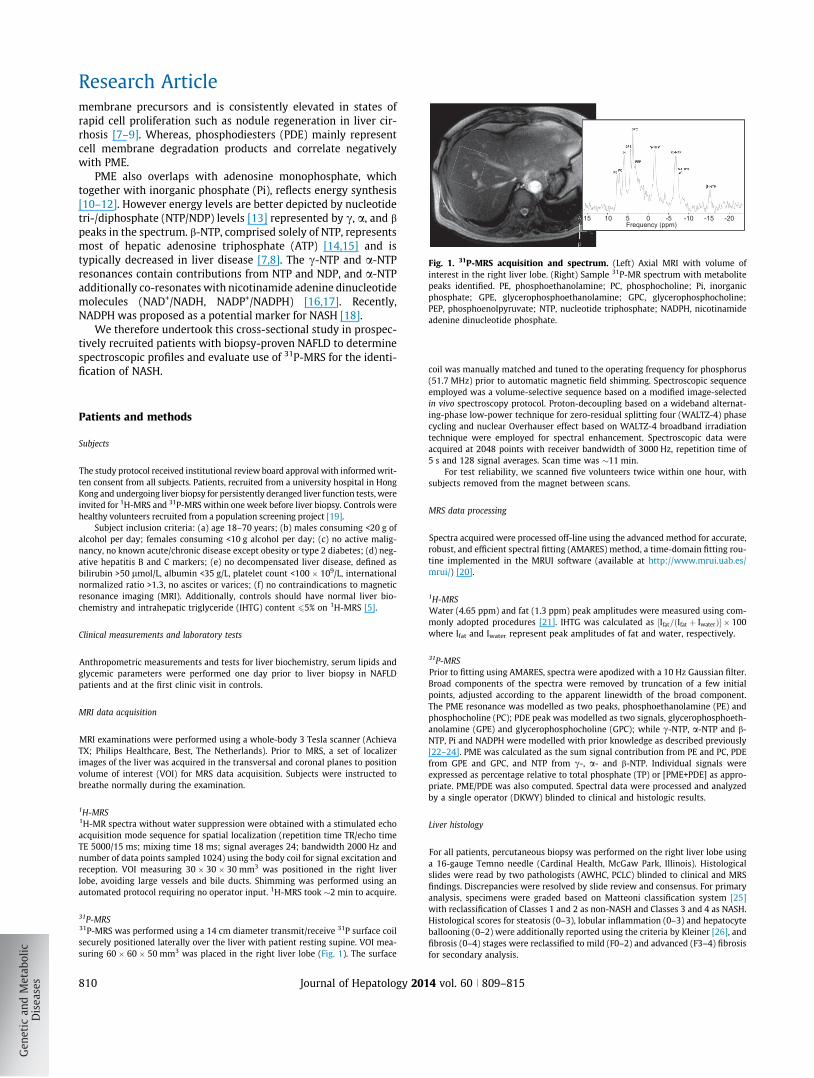
Fig. 1. 31P-MRS acquisition and spectrum. (Left) Axial MRI with volume ofinterest in the right liver lobe. (Right) Sample 31P-MR spectrum with metabolitepeaks identified. PE, phosphoethanolamine; PC, phosphocholine; Pi, inorganicphosphate; GPE, glycerophosphoethanolamine; GPC, glycerophosphocholine;PEP, phosphoenolpyruvate; NTP, nucleotide triphosphate; NADPH, nicotinamideadenine dinucleotide phosphate.
Research Article
membrane precursors and is consistently elevated in states ofrapid cell proliferation such as nodule regeneration in liver cir-rhosis [7–9]. Whereas, phosphodiesters (PDE) mainly representcell membrane degradation products and correlate negativelywith PME.PME also overlaps with adenosine monophosphate, whichtogether with inorganic phosphate (Pi), reflects energy synthesis[10–12]. However energy levels are better depicted by nucleotidetri-/diphosphate (NTP/NDP) levels [13] represented by c, a, and bpeaks in the spectrum. b-NTP, comprised solely of NTP, representsmost of hepatic adenosine triphosphate (ATP) [14,15] and istypically decreased in liver disease [7,8]. The c-NTP and a-NTPresonances contain contributions from NTP and NDP, and a-NTPadditionally co-resonates with nicotinamide adenine dinucleotidemolecules (NAD+/NADH, NADP+/NADPH) [16,17]. Recently,NADPH was proposed as a potential marker for NASH [18].
We therefore undertook this cross-sectional study in prospec-tively recruited patients with biopsy-proven NAFLD to determinespectroscopic profiles and evaluate use of 31P-MRS for the identi-fication of NASH.
Patients and methods
Subjects
The study protocol received institutional review board approval with informed writ-ten consent from all subjects. Patients, recruited from a university hospital in HongKong and undergoing liver biopsy for persistently deranged liver function tests, wereinvited for 1H-MRS and 31P-MRS within one week before liver biopsy. Controls werehealthy volunteers recruited from a population screening project [19].
Subject inclusion criteria: (a) age 18–70 years; (b) males consuming <20 g ofalcohol per day; females consuming <10 g alcohol per day; (c) no active malig-nancy, no known acute/chronic disease except obesity or type 2 diabetes; (d) neg-ative hepatitis B and C markers; (e) no decompensated liver disease, defined asbilirubin >50 lmol/L, albumin <35 g/L, platelet count <100 � 109/L, internationalnormalized ratio >1.3, no ascites or varices; (f) no contraindications to magneticresonance imaging (MRI). Additionally, controls should have normal liver bio-chemistry and intrahepatic triglyceride (IHTG) content 65% on 1H-MRS [5].
Clinical measurements and laboratory tests
Anthropometric measurements and tests for liver biochemistry, serum lipids andglycemic parameters were performed one day prior to liver biopsy in NAFLDpatients and at the first clinic visit in controls.
MRI data acquisition
MRI examinations were performed using a whole-body 3 Tesla scanner (AchievaTX; Philips Healthcare, Best, The Netherlands). Prior to MRS, a set of localizerimages of the liver was acquired in the transversal and coronal planes to positionvolume of interest (VOI) for MRS data acquisition. Subjects were instructed tobreathe normally during the examination.
1H-MRS1H-MR spectra without water suppression were obtained with a stimulated echoacquisition mode sequence for spatial localization (repetition time TR/echo timeTE 5000/15 ms; mixing time 18 ms; signal averages 24; bandwidth 2000 Hz andnumber of data points sampled 1024) using the body coil for signal excitation andreception. VOI measuring 30 � 30 � 30 mm3 was positioned in the right liverlobe, avoiding large vessels and bile ducts. Shimming was performed using anautomated protocol requiring no operator input. 1H-MRS took �2 min to acquire.
31P-MRS31P-MRS was performed using a 14 cm diameter transmit/receive 31P surface coilsecurely positioned laterally over the liver with patient resting supine. VOI mea-suring 60 � 60 � 50 mm3 was placed in the right liver lobe (Fig. 1). The surface
810 Journal of Hepatology 201
coil was manually matched and tuned to the operating frequency for phosphorus(51.7 MHz) prior to automatic magnetic field shimming. Spectroscopic sequenceemployed was a volume-selective sequence based on a modified image-selectedin vivo spectroscopy protocol. Proton-decoupling based on a wideband alternat-ing-phase low-power technique for zero-residual splitting four (WALTZ-4) phasecycling and nuclear Overhauser effect based on WALTZ-4 broadband irradiationtechnique were employed for spectral enhancement. Spectroscopic data wereacquired at 2048 points with receiver bandwidth of 3000 Hz, repetition time of5 s and 128 signal averages. Scan time was �11 min.
For test reliability, we scanned five volunteers twice within one hour, withsubjects removed from the magnet between scans.
MRS data processing
Spectra acquired were processed off-line using the advanced method for accurate,robust, and efficient spectral fitting (AMARES) method, a time-domain fitting rou-tine implemented in the MRUI software (available at http://www.mrui.uab.es/mrui/) [20].
1H-MRSWater (4.65 ppm) and fat (1.3 ppm) peak amplitudes were measured using com-monly adopted procedures [21]. IHTG was calculated as ½Ifat=ðIfat þ IwaterÞ� � 100where Ifat and Iwater represent peak amplitudes of fat and water, respectively.
31P-MRSPrior to fitting using AMARES, spectra were apodized with a 10 Hz Gaussian filter.Broad components of the spectra were removed by truncation of a few initialpoints, adjusted according to the apparent linewidth of the broad component.The PME resonance was modelled as two peaks, phosphoethanolamine (PE) andphosphocholine (PC); PDE peak was modelled as two signals, glycerophosphoeth-anolamine (GPE) and glycerophosphocholine (GPC); while c-NTP, a-NTP and b-NTP, Pi and NADPH were modelled with prior knowledge as described previously[22–24]. PME was calculated as the sum signal contribution from PE and PC, PDEfrom GPE and GPC, and NTP from c-, a- and b-NTP. Individual signals wereexpressed as percentage relative to total phosphate (TP) or [PME+PDE] as appro-priate. PME/PDE was also computed. Spectral data were processed and analyzedby a single operator (DKWY) blinded to clinical and histologic results.
Liver histology
For all patients, percutaneous biopsy was performed on the right liver lobe usinga 16-gauge Temno needle (Cardinal Health, McGaw Park, Illinois). Histologicalslides were read by two pathologists (AWHC, PCLC) blinded to clinical and MRSfindings. Discrepancies were resolved by slide review and consensus. For primaryanalysis, specimens were graded based on Matteoni classification system [25]with reclassification of Classes 1 and 2 as non-NASH and Classes 3 and 4 as NASH.Histological scores for steatosis (0–3), lobular inflammation (0–3) and hepatocyteballooning (0–2) were additionally reported using the criteria by Kleiner [26], andfibrosis (0–4) stages were reclassified to mild (F0–2) and advanced (F3–4) fibrosisfor secondary analysis.
4 vol. 60 j 809–815
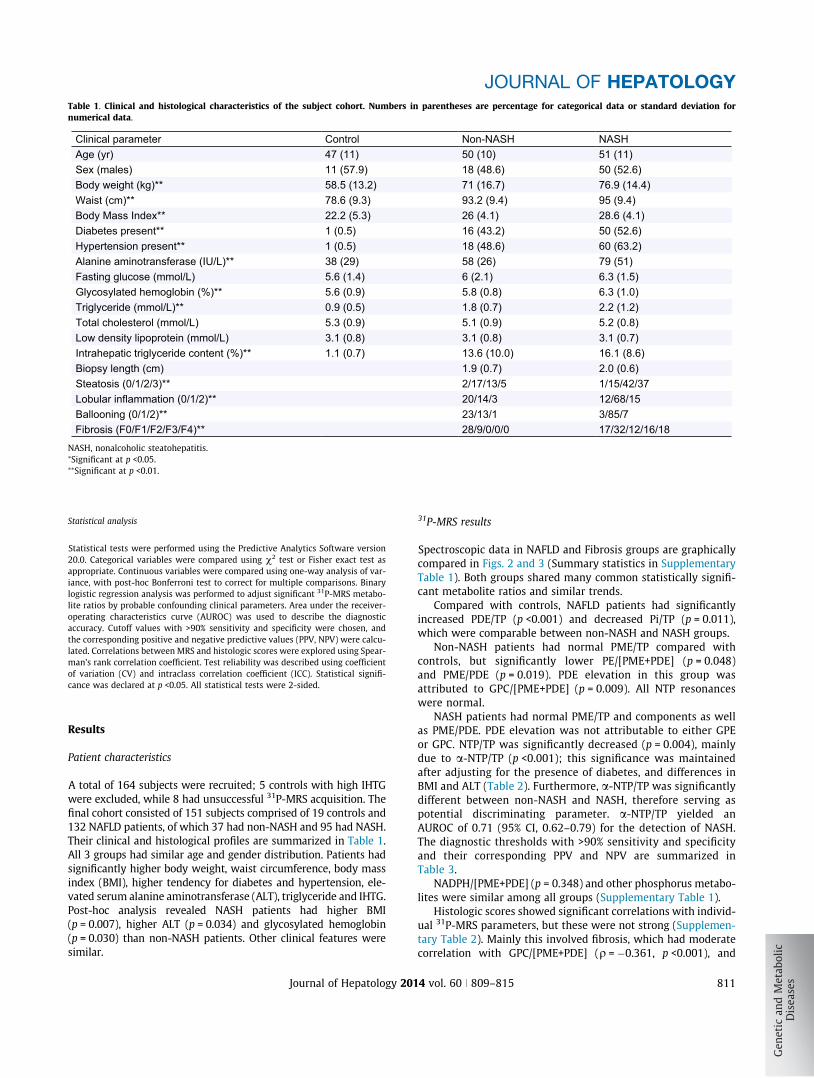
Table 1. Clinical and histological characteristics of the subject cohort. Numbers in parentheses are percentage for categorical data or standard deviation fornumerical data.
Clinical parameter Control Non-NASH NASHAge (yr) 47 (11) 50 (10) 51 (11)Sex (males) 11 (57.9) 18 (48.6) 50 (52.6)Body weight (kg)** 58.5 (13.2) 71 (16.7) 76.9 (14.4)Waist (cm)** 78.6 (9.3) 93.2 (9.4) 95 (9.4)Body Mass Index** 22.2 (5.3) 26 (4.1) 28.6 (4.1)Diabetes present** 1 (0.5) 16 (43.2) 50 (52.6)Hypertension present** 1 (0.5) 18 (48.6) 60 (63.2)Alanine aminotransferase (IU/L)** 38 (29) 58 (26) 79 (51)Fasting glucose (mmol/L) 5.6 (1.4) 6 (2.1) 6.3 (1.5)Glycosylated hemoglobin (%)** 5.6 (0.9) 5.8 (0.8) 6.3 (1.0)Triglyceride (mmol/L)** 0.9 (0.5) 1.8 (0.7) 2.2 (1.2)Total cholesterol (mmol/L) 5.3 (0.9) 5.1 (0.9) 5.2 (0.8)Low density lipoprotein (mmol/L) 3.1 (0.8) 3.1 (0.8) 3.1 (0.7)Intrahepatic triglyceride content (%)** 1.1 (0.7) 13.6 (10.0) 16.1 (8.6)Biopsy length (cm) 1.9 (0.7) 2.0 (0.6)Steatosis (0/1/2/3)** 2/17/13/5 1/15/42/37
20/14/3 12/68/15Ballooning (0/1/2)**Lobular inflammation (0/1/2)**
23/13/1 3/85/7Fibrosis (F0/F1/F2/F3/F4)** 28/9/0/0/0 17/32/12/16/18
NASH, nonalcoholic steatohepatitis.⁄Significant at p <0.05.⁄⁄Significant at p <0.01.
JOURNAL OF HEPATOLOGY
Statistical analysis
Statistical tests were performed using the Predictive Analytics Software version20.0. Categorical variables were compared using v2 test or Fisher exact test asappropriate. Continuous variables were compared using one-way analysis of var-iance, with post-hoc Bonferroni test to correct for multiple comparisons. Binarylogistic regression analysis was performed to adjust significant 31P-MRS metabo-lite ratios by probable confounding clinical parameters. Area under the receiver-operating characteristics curve (AUROC) was used to describe the diagnosticaccuracy. Cutoff values with >90% sensitivity and specificity were chosen, andthe corresponding positive and negative predictive values (PPV, NPV) were calcu-lated. Correlations between MRS and histologic scores were explored using Spear-man’s rank correlation coefficient. Test reliability was described using coefficientof variation (CV) and intraclass correlation coefficient (ICC). Statistical signifi-cance was declared at p <0.05. All statistical tests were 2-sided.
Results
Patient characteristics
A total of 164 subjects were recruited; 5 controls with high IHTGwere excluded, while 8 had unsuccessful 31P-MRS acquisition. Thefinal cohort consisted of 151 subjects comprised of 19 controls and132 NAFLD patients, of which 37 had non-NASH and 95 had NASH.Their clinical and histological profiles are summarized in Table 1.All 3 groups had similar age and gender distribution. Patients hadsignificantly higher body weight, waist circumference, body massindex (BMI), higher tendency for diabetes and hypertension, ele-vated serum alanine aminotransferase (ALT), triglyceride and IHTG.Post-hoc analysis revealed NASH patients had higher BMI(p = 0.007), higher ALT (p = 0.034) and glycosylated hemoglobin(p = 0.030) than non-NASH patients. Other clinical features weresimilar.
Journal of Hepatology 201
31P-MRS results
Spectroscopic data in NAFLD and Fibrosis groups are graphicallycompared in Figs. 2 and 3 (Summary statistics in SupplementaryTable 1). Both groups shared many common statistically signifi-cant metabolite ratios and similar trends.
Compared with controls, NAFLD patients had significantlyincreased PDE/TP (p <0.001) and decreased Pi/TP (p = 0.011),which were comparable between non-NASH and NASH groups.
Non-NASH patients had normal PME/TP compared withcontrols, but significantly lower PE/[PME+PDE] (p = 0.048)and PME/PDE (p = 0.019). PDE elevation in this group wasattributed to GPC/[PME+PDE] (p = 0.009). All NTP resonanceswere normal.
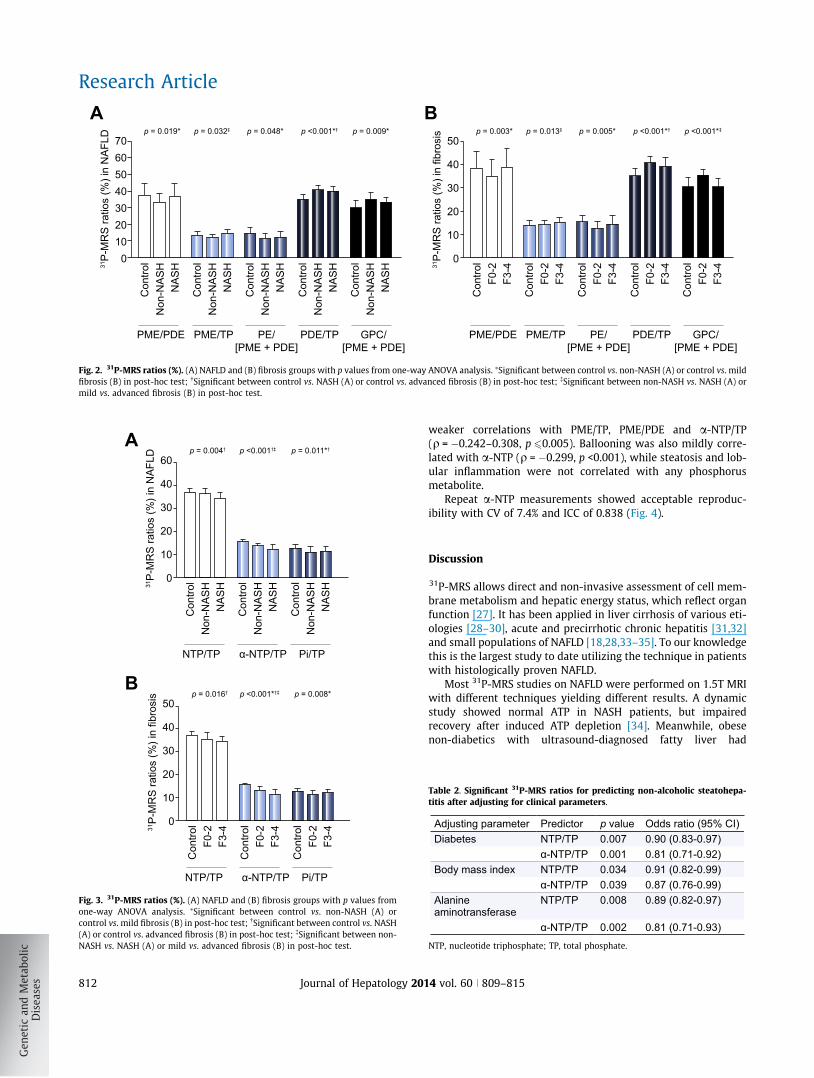
NASH patients had normal PME/TP and components as wellas PME/PDE. PDE elevation was not attributable to either GPEor GPC. NTP/TP was significantly decreased (p = 0.004), mainlydue to a-NTP/TP (p <0.001); this significance was maintainedafter adjusting for the presence of diabetes, and differences inBMI and ALT (Table 2). Furthermore, a-NTP/TP was significantlydifferent between non-NASH and NASH, therefore serving aspotential discriminating parameter. a-NTP/TP yielded anAUROC of 0.71 (95% CI, 0.62–0.79) for the detection of NASH.The diagnostic thresholds with >90% sensitivity and specificityand their corresponding PPV and NPV are summarized inTable 3.
NADPH/[PME+PDE] (p = 0.348) and other phosphorus metabo-lites were similar among all groups (Supplementary Table 1).
Histologic scores showed significant correlations with individ-ual 31P-MRS parameters, but these were not strong (Supplemen-tary Table 2). Mainly this involved fibrosis, which had moderatecorrelation with GPC/[PME+PDE] (q = �0.361, p <0.001), and
4 vol. 60 j 809–815 811
706050403020100
Con
trol
Non
-NA
SH
NA
SH
Con
trol
Non
-NA
SH
NA
SH
Con
trol
Non
-NA
SH
NA
SH
Con
trol
Non
-NA
SH
NA
SH
Con
trol
Non
-NA
SH
NA
SH31
P-M
RS
ratio
s (%
) in
NA
FLD
PME/PDE PME/TP PDE/TPPE/[PME + PDE]
GPC/[PME + PDE]
p = 0.019* p = 0.032‡ p = 0.048* p = 0.009*p <0.001*†
A50
40
30
20
10
0
Con
trol
F0-2
F3-4
Con
trol
F0-2
F3-4
Con
trol
F0-2
F3-4
Con
trol
F0-2
F3-4
Con
trol
F0-2
F3-431
P-M
RS
ratio
s (%
) in
fibro
sis
PME/PDE PME/TP PDE/TPPE/[PME + PDE]
GPC/[PME + PDE]
p = 0.003* p = 0.013‡ p = 0.005* p <0.001*‡p <0.001*†
B
Fig. 2. 31P-MRS ratios (%). (A) NAFLD and (B) fibrosis groups with p values from one-way ANOVA analysis. ⁄Significant between control vs. non-NASH (A) or control vs. mildfibrosis (B) in post-hoc test; �Significant between control vs. NASH (A) or control vs. advanced fibrosis (B) in post-hoc test; �Significant between non-NASH vs. NASH (A) ormild vs. advanced fibrosis (B) in post-hoc test.
60
40
30
20
10
0
Con
trol
Non
-NA
SH
NA
SH
Con
trol
Non
-NA
SH
NA
SH
Con
trol
Non
-NA
SH
NA
SH31
P-M
RS
rat
ios
(%)
in N
AF
LD
NTP/TP α-NTP/TP Pi/TP
p = 0.004† p <0.001†‡ p = 0.011*†A
B
NTP/TP α-NTP/TP Pi/TP
50
40
30
20
10
0
Con
trol
F0-
2F
3-4
Con
trol
F0-
2F
3-4
Con
trol
F0-
2F
3-431
P-M
RS
rat
ios
(%)
in fi
bros
is p = 0.016† p <0.001*†‡ p = 0.008*
Fig. 3. 31P-MRS ratios (%). (A) NAFLD and (B) fibrosis groups with p values fromone-way ANOVA analysis. ⁄Significant between control vs. non-NASH (A) orcontrol vs. mild fibrosis (B) in post-hoc test; �Significant between control vs. NASH(A) or control vs. advanced fibrosis (B) in post-hoc test; �Significant between non-NASH vs. NASH (A) or mild vs. advanced fibrosis (B) in post-hoc test.
Research Article
812 Journal of Hepatology 201
weaker correlations with PME/TP, PME/PDE and a-NTP/TP(q = �0.242–0.308, p 60.005). Ballooning was also mildly corre-lated with a-NTP (q = �0.299, p <0.001), while steatosis and lob-ular inflammation were not correlated with any phosphorusmetabolite.
Repeat a-NTP measurements showed acceptable reproduc-ibility with CV of 7.4% and ICC of 0.838 (Fig. 4).
Discussion
31P-MRS allows direct and non-invasive assessment of cell mem-brane metabolism and hepatic energy status, which reflect organfunction [27]. It has been applied in liver cirrhosis of various eti-ologies [28–30], acute and precirrhotic chronic hepatitis [31,32]and small populations of NAFLD [18,28,33–35]. To our knowledgethis is the largest study to date utilizing the technique in patientswith histologically proven NAFLD.
Most 31P-MRS studies on NAFLD were performed on 1.5T MRIwith different techniques yielding different results. A dynamicstudy showed normal ATP in NASH patients, but impairedrecovery after induced ATP depletion [34]. Meanwhile, obesenon-diabetics with ultrasound-diagnosed fatty liver had
Table 2. Significant 31P-MRS ratios for predicting non-alcoholic steatohepa-titis after adjusting for clinical parameters.
Adjusting parameter Predictor p value Odds ratio (95% CI)Diabetes NTP/TP 0.007 0.90 (0.83-0.97)
α-NTP/TP 0.001 0.81 (0.71-0.92) Body mass index NTP/TP 0.034 0.91 (0.82-0.99)
α-NTP/TP 0.039 0.87 (0.76-0.99)Alanine aminotransferase
NTP/TP 0.008 0.89 (0.82-0.97)
α-NTP/TP 0.002 0.81 (0.71-0.93)
NTP, nucleotide triphosphate; TP, total phosphate.
4 vol. 60 j 809–815
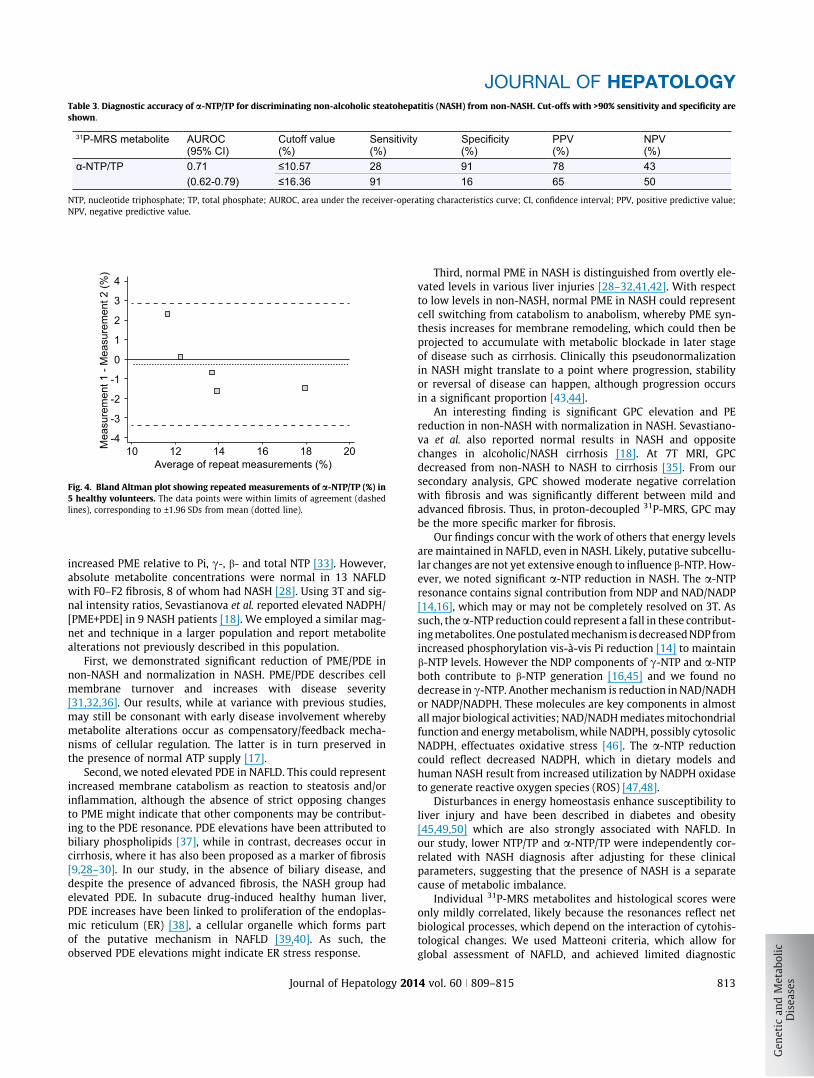
Table 3. Diagnostic accuracy of a-NTP/TP for discriminating non-alcoholic steatohepatitis (NASH) from non-NASH. Cut-offs with >90% sensitivity and specificity areshown.
31P-MRS metabolite AUROC(95% CI)
Cutoff value (%)
Sensitivity(%) (%)
Specificity PPV(%)
NPV(%)
α-NTP/TP 0.71 ≤10.57 28 91 78 43(0.62-0.79) ≤16.36 91 16 65 50
NTP, nucleotide triphosphate; TP, total phosphate; AUROC, area under the receiver-operating characteristics curve; CI, confidence interval; PPV, positive predictive value;NPV, negative predictive value.
4
3
2
1
0
10 12 14 16 18 20
-1
-2
-3
-4
Average of repeat measurements (%)
Mea
sure
men
t 1 -
Mea
sure
men
t 2 (%
)
Fig. 4. Bland Altman plot showing repeated measurements of a-NTP/TP (%) in5 healthy volunteers. The data points were within limits of agreement (dashedlines), corresponding to ±1.96 SDs from mean (dotted line).
JOURNAL OF HEPATOLOGY
increased PME relative to Pi, c-, b- and total NTP [33]. However,absolute metabolite concentrations were normal in 13 NAFLDwith F0–F2 fibrosis, 8 of whom had NASH [28]. Using 3T and sig-nal intensity ratios, Sevastianova et al. reported elevated NADPH/[PME+PDE] in 9 NASH patients [18]. We employed a similar mag-net and technique in a larger population and report metabolitealterations not previously described in this population.
First, we demonstrated significant reduction of PME/PDE innon-NASH and normalization in NASH. PME/PDE describes cellmembrane turnover and increases with disease severity[31,32,36]. Our results, while at variance with previous studies,may still be consonant with early disease involvement wherebymetabolite alterations occur as compensatory/feedback mecha-nisms of cellular regulation. The latter is in turn preserved inthe presence of normal ATP supply [17].
Second, we noted elevated PDE in NAFLD. This could representincreased membrane catabolism as reaction to steatosis and/orinflammation, although the absence of strict opposing changesto PME might indicate that other components may be contribut-ing to the PDE resonance. PDE elevations have been attributed tobiliary phospholipids [37], while in contrast, decreases occur incirrhosis, where it has also been proposed as a marker of fibrosis[9,28–30]. In our study, in the absence of biliary disease, anddespite the presence of advanced fibrosis, the NASH group hadelevated PDE. In subacute drug-induced healthy human liver,PDE increases have been linked to proliferation of the endoplas-mic reticulum (ER) [38], a cellular organelle which forms partof the putative mechanism in NAFLD [39,40]. As such, theobserved PDE elevations might indicate ER stress response.
Journal of Hepatology 201
Third, normal PME in NASH is distinguished from overtly ele-vated levels in various liver injuries [28–32,41,42]. With respectto low levels in non-NASH, normal PME in NASH could representcell switching from catabolism to anabolism, whereby PME syn-thesis increases for membrane remodeling, which could then beprojected to accumulate with metabolic blockade in later stageof disease such as cirrhosis. Clinically this pseudonormalizationin NASH might translate to a point where progression, stabilityor reversal of disease can happen, although progression occursin a significant proportion [43,44].
An interesting finding is significant GPC elevation and PEreduction in non-NASH with normalization in NASH. Sevastiano-va et al. also reported normal results in NASH and oppositechanges in alcoholic/NASH cirrhosis [18]. At 7T MRI, GPCdecreased from non-NASH to NASH to cirrhosis [35]. From oursecondary analysis, GPC showed moderate negative correlationwith fibrosis and was significantly different between mild andadvanced fibrosis. Thus, in proton-decoupled 31P-MRS, GPC maybe the more specific marker for fibrosis.
Our findings concur with the work of others that energy levelsare maintained in NAFLD, even in NASH. Likely, putative subcellu-lar changes are not yet extensive enough to influence b-NTP. How-ever, we noted significant a-NTP reduction in NASH. The a-NTPresonance contains signal contribution from NDP and NAD/NADP[14,16], which may or may not be completely resolved on 3T. Assuch, the a-NTP reduction could represent a fall in these contribut-ing metabolites. One postulated mechanism is decreased NDP fromincreased phosphorylation vis-à-vis Pi reduction [14] to maintainb-NTP levels. However the NDP components of c-NTP and a-NTPboth contribute to b-NTP generation [16,45] and we found nodecrease in c-NTP. Another mechanism is reduction in NAD/NADHor NADP/NADPH. These molecules are key components in almostall major biological activities; NAD/NADH mediates mitochondrialfunction and energy metabolism, while NADPH, possibly cytosolicNADPH, effectuates oxidative stress [46]. The a-NTP reductioncould reflect decreased NADPH, which in dietary models andhuman NASH result from increased utilization by NADPH oxidaseto generate reactive oxygen species (ROS) [47,48].
Disturbances in energy homeostasis enhance susceptibility toliver injury and have been described in diabetes and obesity[45,49,50] which are also strongly associated with NAFLD. Inour study, lower NTP/TP and a-NTP/TP were independently cor-related with NASH diagnosis after adjusting for these clinicalparameters, suggesting that the presence of NASH is a separatecause of metabolic imbalance.
Individual 31P-MRS metabolites and histological scores wereonly mildly correlated, likely because the resonances reflect netbiological processes, which depend on the interaction of cytohis-tological changes. We used Matteoni criteria, which allow forglobal assessment of NAFLD, and achieved limited diagnostic
4 vol. 60 j 809–815 813
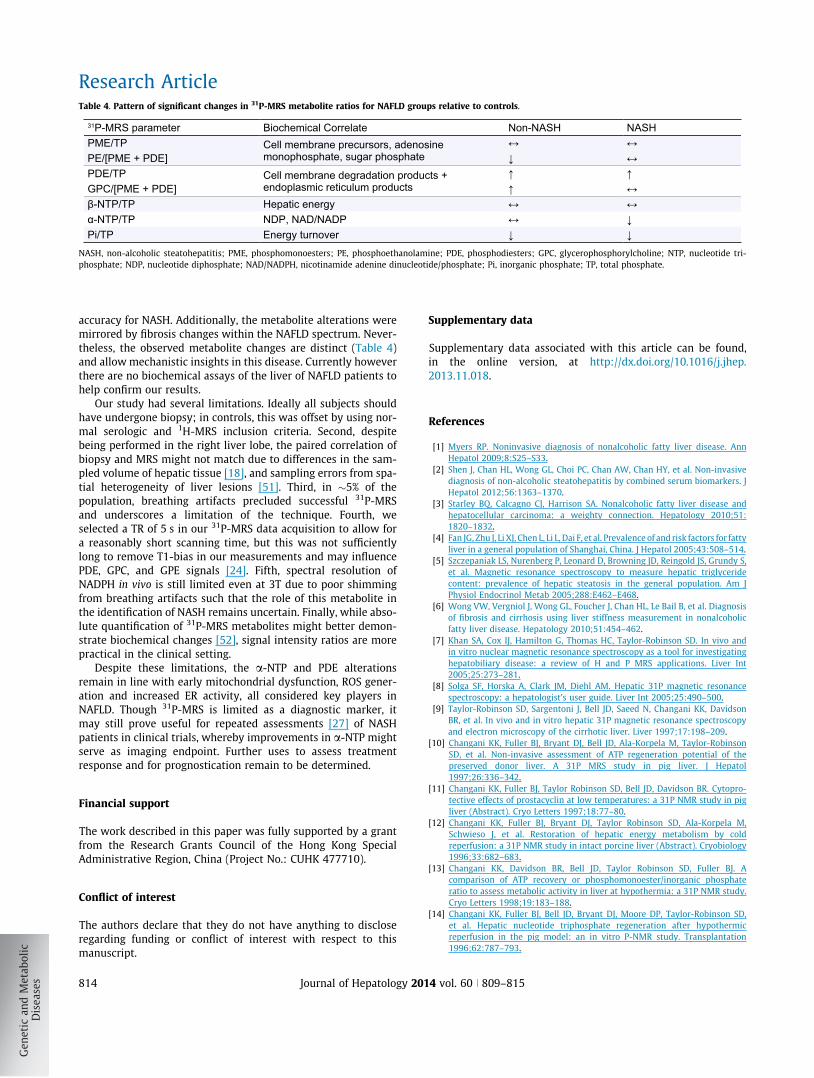
Table 4. Pattern of significant changes in 31P-MRS metabolite ratios for NAFLD groups relative to controls.
31P-MRS parameter Biochemical Correlate Non-NASH NASHPME/TP Cell membrane precursors, adenosine
monophosphate, sugar phosphate↔ ↔
PE/[PME + PDE] ↓ ↔PDE/TP Cell membrane degradation products +
endoplasmic reticulum products↑ ↑
GPC/[PME + PDE] ↑ ↔β-NTP/TP Hepatic energy ↔ ↔α-NTP/TP NDP, NAD/NADP ↔ ↓Pi/TP Energy turnover ↓ ↓
NASH, non-alcoholic steatohepatitis; PME, phosphomonoesters; PE, phosphoethanolamine; PDE, phosphodiesters; GPC, glycerophosphorylcholine; NTP, nucleotide tri-phosphate; NDP, nucleotide diphosphate; NAD/NADPH, nicotinamide adenine dinucleotide/phosphate; Pi, inorganic phosphate; TP, total phosphate.
Research Article
accuracy for NASH. Additionally, the metabolite alterations weremirrored by fibrosis changes within the NAFLD spectrum. Never-theless, the observed metabolite changes are distinct (Table 4)and allow mechanistic insights in this disease. Currently howeverthere are no biochemical assays of the liver of NAFLD patients tohelp confirm our results.
Our study had several limitations. Ideally all subjects shouldhave undergone biopsy; in controls, this was offset by using nor-mal serologic and 1H-MRS inclusion criteria. Second, despitebeing performed in the right liver lobe, the paired correlation ofbiopsy and MRS might not match due to differences in the sam-pled volume of hepatic tissue [18], and sampling errors from spa-tial heterogeneity of liver lesions [51]. Third, in �5% of thepopulation, breathing artifacts precluded successful 31P-MRSand underscores a limitation of the technique. Fourth, weselected a TR of 5 s in our 31P-MRS data acquisition to allow fora reasonably short scanning time, but this was not sufficientlylong to remove T1-bias in our measurements and may influencePDE, GPC, and GPE signals [24]. Fifth, spectral resolution ofNADPH in vivo is still limited even at 3T due to poor shimmingfrom breathing artifacts such that the role of this metabolite inthe identification of NASH remains uncertain. Finally, while abso-lute quantification of 31P-MRS metabolites might better demon-strate biochemical changes [52], signal intensity ratios are morepractical in the clinical setting.
Despite these limitations, the a-NTP and PDE alterationsremain in line with early mitochondrial dysfunction, ROS gener-ation and increased ER activity, all considered key players inNAFLD. Though 31P-MRS is limited as a diagnostic marker, itmay still prove useful for repeated assessments [27] of NASHpatients in clinical trials, whereby improvements in a-NTP mightserve as imaging endpoint. Further uses to assess treatmentresponse and for prognostication remain to be determined.
Financial support
The work described in this paper was fully supported by a grantfrom the Research Grants Council of the Hong Kong SpecialAdministrative Region, China (Project No.: CUHK 477710).
Conflict of interest
The authors declare that they do not have anything to discloseregarding funding or conflict of interest with respect to thismanuscript.
814 Journal of Hepatology 201
Supplementary data
Supplementary data associated with this article can be found,in the online version, at http://dx.doi.org/10.1016/j.jhep.2013.11.018.
References
[1] Myers RP. Noninvasive diagnosis of nonalcoholic fatty liver disease. AnnHepatol 2009;8:S25–S33.
[2] Shen J, Chan HL, Wong GL, Choi PC, Chan AW, Chan HY, et al. Non-invasivediagnosis of non-alcoholic steatohepatitis by combined serum biomarkers. JHepatol 2012;56:1363–1370.
[3] Starley BQ, Calcagno CJ, Harrison SA. Nonalcoholic fatty liver disease andhepatocellular carcinoma: a weighty connection. Hepatology 2010;51:1820–1832.
[4] Fan JG, Zhu J, Li XJ, Chen L, Li L, Dai F, et al. Prevalence of and risk factors for fattyliver in a general population of Shanghai, China. J Hepatol 2005;43:508–514.
[5] Szczepaniak LS, Nurenberg P, Leonard D, Browning JD, Reingold JS, Grundy S,et al. Magnetic resonance spectroscopy to measure hepatic triglyceridecontent: prevalence of hepatic steatosis in the general population. Am JPhysiol Endocrinol Metab 2005;288:E462–E468.
[6] Wong VW, Vergniol J, Wong GL, Foucher J, Chan HL, Le Bail B, et al. Diagnosisof fibrosis and cirrhosis using liver stiffness measurement in nonalcoholicfatty liver disease. Hepatology 2010;51:454–462.
[7] Khan SA, Cox IJ, Hamilton G, Thomas HC, Taylor-Robinson SD. In vivo andin vitro nuclear magnetic resonance spectroscopy as a tool for investigatinghepatobiliary disease: a review of H and P MRS applications. Liver Int2005;25:273–281.
[8] Solga SF, Horska A, Clark JM, Diehl AM. Hepatic 31P magnetic resonancespectroscopy: a hepatologist’s user guide. Liver Int 2005;25:490–500.
[9] Taylor-Robinson SD, Sargentoni J, Bell JD, Saeed N, Changani KK, DavidsonBR, et al. In vivo and in vitro hepatic 31P magnetic resonance spectroscopyand electron microscopy of the cirrhotic liver. Liver 1997;17:198–209.
[10] Changani KK, Fuller BJ, Bryant DJ, Bell JD, Ala-Korpela M, Taylor-RobinsonSD, et al. Non-invasive assessment of ATP regeneration potential of thepreserved donor liver. A 31P MRS study in pig liver. J Hepatol1997;26:336–342.
[11] Changani KK, Fuller BJ, Taylor Robinson SD, Bell JD, Davidson BR. Cytopro-tective effects of prostacyclin at low temperatures: a 31P NMR study in pigliver (Abstract). Cryo Letters 1997;18:77–80.
[12] Changani KK, Fuller BJ, Bryant DJ, Taylor Robinson SD, Ala-Korpela M,Schwieso J, et al. Restoration of hepatic energy metabolism by coldreperfusion: a 31P NMR study in intact porcine liver (Abstract). Cryobiology1996;33:682–683.
[13] Changani KK, Davidson BR, Bell JD, Taylor Robinson SD, Fuller BJ. Acomparison of ATP recovery or phosphomonoester/inorganic phosphateratio to assess metabolic activity in liver at hypothermia: a 31P NMR study.Cryo Letters 1998;19:183–188.
[14] Changani KK, Fuller BJ, Bell JD, Bryant DJ, Moore DP, Taylor-Robinson SD,et al. Hepatic nucleotide triphosphate regeneration after hypothermicreperfusion in the pig model: an in vitro P-NMR study. Transplantation1996;62:787–793.
4 vol. 60 j 809–815
JOURNAL OF HEPATOLOGY
[15] Changani KK, Fuller BJ, Bell JD, Taylor-Robinson S, Davidson BR. Bioenergetictargeting during organ preservation: (31)P magnetic resonance spectros-copy investigations into the use of fructose to sustain hepatic ATP turnoverduring cold hypoxia in porcine livers. Cryobiology 2000;41:72–87.
[16] Changani KK, Ala-Korpela M, Fuller BJ, Mierisova S, Bryant DJ, Taylor-Robinson SD, et al. Incorporation of metabolite prior knowledge for dataanalysis: biochemical implications of dynamic 31P NMR ex vivo pig liverstudies. NMR Biomed 1999;12:197–204.
[17] Changani KK, Fuller BJ, Bell JD, Taylor-Robinson SD, Moore DP, Davidson BR.Improved preservation solutions for organ storage: a dynamic study ofhepatic metabolism. Transplantation 1999;68:345–355.
[18] Sevastianova K, Hakkarainen A, Kotronen A, Corner A, Arkkila P, Arola J, et al.Nonalcoholic fatty liver disease: detection of elevated nicotinamide adeninedinucleotide phosphate with in vivo 3.0-T 31P MR spectroscopy with protondecoupling. Radiology 2010;256:466–473.
[19] Wong VW, Chu WC, Wong GL, Chan RS, Chim AM, Ong A, et al. Prevalence ofnon-alcoholic fatty liver disease and advanced fibrosis in Hong KongChinese: a population study using proton-magnetic resonance spectroscopyand transient elastography. Gut 2012;61:409–415.
[20] Vanhamme L, van den Boogaart A, Van Huffel S. Improved method foraccurate and efficient quantification of MRS data with use of priorknowledge. J Magn Reson 1997;129:35–43.
[21] van Werven JR, Hoogduin JM, Nederveen AJ, van Vliet AA, Wajs E,Vandenberk P, et al. Reproducibility of 3.0 Tesla magnetic resonancespectroscopy for measuring hepatic fat content. J Magn Reson Imaging2009;30:444–448.
[22] Hamilton G, Patel N, Forton DM, Hajnal JV, Taylor-Robinson SD. Priorknowledge for time domain quantification of in vivo brain or liver 31P MRspectra. NMR Biomed 2003;16:168–176.
[23] Naressi A, Couturier C, Castang I, de Beer R, Graveron-Demilly D. Java-basedgraphical user interface for MRUI, a software package for quantitation ofin vivo/medical magnetic resonance spectroscopy signals. Comput Biol Med2001;31:269–286.
[24] Schmid AI, Chmelik M, Szendroedi J, Krssak M, Brehm A, Moser E, et al.Quantitative ATP synthesis in human liver measured by localized 31Pspectroscopy using the magnetization transfer experiment. NMR Biomed2008;21:437–443.
[25] Matteoni CA, Younossi ZM, Gramlich T, Boparai N, Liu YC, McCullough AJ.Nonalcoholic fatty liver disease: a spectrum of clinical and pathologicalseverity. Gastroenterology 1999;116:1413–1419.
[26] Kleiner DE, Brunt EM, Van Natta M, Behling C, Contos MJ, Cummings OW,et al. Design and validation of a histological scoring system for nonalcoholicfatty liver disease. Hepatology 2005;41:1313–1321.
[27] Changani KK, Taylor-Robinson SD, Bell JD, Fuller BJ, Davidson BR. Noninva-sive metabolic assessment of human donor livers: metabolite assignmentin 31P magnetic resonance spectroscopy. Transplantation 1998;65:1526–1528.
[28] Noren B, Dahlqvist O, Lundberg P, Almer S, Kechagias S, Ekstedt M, et al.Separation of advanced from mild fibrosis in diffuse liver disease using 31Pmagnetic resonance spectroscopy. Eur J Radiol 2008;66:313–320.
[29] Dezortova M, Taimr P, Skoch A, Spicak J, Hajek M. Etiology and functionalstatus of liver cirrhosis by 31P MR spectroscopy. World J Gastroenterol2005;11:6926–6931.
[30] Menon DK, Sargentoni J, Taylor-Robinson SD, Bell JD, Cox IJ, Bryant DJ, et al.Effect of functional grade and etiology on in vivo hepatic phosphorus-31magnetic resonance spectroscopy in cirrhosis: biochemical basis of spectralappearances. Hepatology 1995;21:417–427.
[31] Lim AK, Patel N, Hamilton G, Hajnal JV, Goldin RD, Taylor-Robinson SD. Therelationship of in vivo 31P MR spectroscopy to histology in chronic hepatitisC. Hepatology 2003;37:788–794.
[32] Yamane Y, Umeda M, O’Uchi T, Mitsushima T, Nakata K, Nagataki S.Phosphorus-31 nuclear magnetic resonance in vivo spectroscopy of humanliver during hepatitis A virus infection. Dig Dis Sci 1994;39:33–38.
[33] Sharma R, Sinha S, Danishad KA, Vikram NK, Gupta A, Ahuja V, et al.Investigation of hepatic gluconeogenesis pathway in non-diabetic Asian
Journal of Hepatology 201
Indians with non-alcoholic fatty liver disease using in vivo ((31)P)phosphorus magnetic resonance spectroscopy. Atherosclerosis2009;203:291–297.
[34] Cortez-Pinto H, Chatham J, Chacko VP, Arnold C, Rashid A, Diehl AM.Alterations in liver ATP homeostasis in human nonalcoholic steatohepatitis:a pilot study. JAMA 1999;282:1659–1664.
[35] Traussnigg S, Halilbasic E, Kienbacher C, Gajdosik M, Valkovic L, Chmelik M,et al. High-field MR-spectroscopy in patients with NAFLD allows novelinsights in altered hepatic lipid and energy metabolism with potentialdistinction of NASH and advanced fibrosis. (Abstract). J Hepatol2013;58:S551.
[36] Jalan R, Sargentoni J, Coutts GA, Bell JD, Rolles K, Burroughs AK, et al. Hepaticphosphorus-31 magnetic resonance spectroscopy in primary biliary cirrho-sis and its relation to prognostic models. Gut 1996;39:141–146.
[37] Taylor-Robinson SD, Sargentoni J, Bell JD, Thomas EL, Marcus CD, ChanganiKK, et al. In vivo and in vitro hepatic phosphorus-31 magnetic resonancespectroscopy and electron microscopy in chronic ductopenic rejection ofhuman liver allografts. Gut 1998;42:735–743.
[38] Block W, Reichel C, Traber F, Skodra T, Lamerichs R, Kreft B, et al. Effect ofcytochrome P450 induction on phosphorus metabolites and proton relax-ation times measured by in vivo 31P-magnetic resonance spectroscopy and1H-magnetic resonance relaxometry in human liver. Hepatology1997;26:1587–1591.
[39] Gentile CL, Frye MA, Pagliassotti MJ. Fatty acids and the endoplasmicreticulum in nonalcoholic fatty liver disease. Biofactors 2011;37:8–16.
[40] Hotamisligil GS. Inflammation and metabolic disorders. Nature 2006;444:860–867.
[41] Menon DK, Harris M, Sargentoni J, Taylor-Robinson SD, Cox IJ, Morgan MY. Invivo hepatic 31P magnetic resonance spectroscopy in chronic alcoholabusers. Gastroenterology 1995;108:776–788.
[42] Angus PW, Dixon RM, Rajagopalan B, Ryley NG, Simpson KJ, Peters TJ, et al. Astudy of patients with alcoholic liver disease by 31P nuclear magneticresonance spectroscopy. Clin Sci (Lond) 1990;78:33–38.
[43] Wong VW, Wong GL, Choi PC, Chan AW, Li MK, Chan HY, et al. Diseaseprogression of non-alcoholic fatty liver disease: a prospective study withpaired liver biopsies at 3 years. Gut 2010;59:969–974.
[44] Fassio E, Alvarez E, Dominguez N, Landeira G, Longo C. Natural history ofnonalcoholic steatohepatitis: a longitudinal study of repeat liver biopsies.Hepatology 2004;40:820–826.
[45] Abdelmalek MF, Lazo M, Horska A, Bonekamp S, Lipkin EW, Balasubraman-yam A, et al. Higher dietary fructose is associated with impaired hepaticadenosine triphosphate homeostasis in obese individuals with type 2diabetes. Hepatology 2012;56:952–960.
[46] Ying W. NAD+/NADH and NADP+/NADPH in cellular functions and cell death:regulation and biological consequences. Antioxid Redox Signal2008;10:179–206.
[47] Chalasani N, Gorski JC, Asghar MS, Asghar A, Foresman B, Hall SD, et al.Hepatic cytochrome P450 2E1 activity in non-diabetic patients withnonalcoholic steatohepatitis. Hepatology 2003;37:544–550.
[48] Leclercq IA, Farrell GC, Field J, Bell DR, Gonzalez FJ, Robertson GR. CYP2E1and CYP4A as microsomal catalysts of lipid peroxides in murine nonalco-holic steatohepatitis. J Clin Invest 2000;105:1067–1075.
[49] Nair S, chacko VP, Arnold C, Diehl AM. Hepatic ATP reserve and efficiency ofreplenishing: comparison between obese and nonobese normal individuals.Am J Gastroenterol 2003;98:466–470.
[50] Szendroedi J, Chmelik M, Schmid AI, Nowotny P, Brehm A, Krssak M, et al.Abnormal hepatic energy homeostasis in type 2 diabetes. Hepatology2009;50:1079–1086.
[51] Ratziu V, Charlotte F, Heurtier A, Gombert S, Giral P, Bruckert E, et al.Sampling variability of liver biopsy in nonalcoholic fatty liver disease.Gastroenterology 2005;128:1898–1906.
[52] Noren B, Lundberg P, Ressner M, Wirell S, Almer S, Smedby O. Absolutequantification of human liver metabolite concentrations by localized in vivo31P NMR spectroscopy in diffuse liver disease. Eur Radiol 2005;15:148–157.
4 vol. 60 j 809–815 815