Mrs. Bectors Food Specialities
36
Please refer to important disclosures at the end of this report Market Cap Rs22bn/US$302mn Year to March FY20 FY21E FY22E FY23E Bloomberg BECTORS IN Net Revenue (Rs mn) 7,621 8,655 10,492 12,209 Shares Outstanding (mn) 58.7 Net Profit (Rs mn) 304 635 716 869 52-week Range (Rs) 594/288 Dil. EPS (Rs) 5.3 10.8 12.2 14.8 Free Float (%) 32.1 % Chg YoY (8.3) 103.9 12.7 21.4 FII (%) 16.9 P/E (x) 70.6 34.6 30.7 25.3 Daily Volume (US$'000) NA CEPS (Rs) 12.6 18.4 22.0 25.5 Absolute Return 3m (%) NA EV/EBITDA (x) 23.8 16.8 14.6 12.6 Absolute Return 12m (%) NA Dividend Yield (%) 0.2 0.3 0.4 0.5 Sensex Return 3m (%) 16.9 RoCE (%) 10.7 15.4 16.0 18.2 Sensex Return 12m (%) 15.0 RoE (%) 9.5 14.9 14.6 15.4 Equity Research January 31, 2021 BSE Sensex: 46286 ICICI Securities Limited is the author and distributor of this report Initiating coverage Consumer Staples & Discretionary Target price: Rs400 Shareholding pattern Dec ‘20 Promoters 51.1 Institutional investors 10.5 MFs and other 5.3 Banks/FIs 0.1 Insurance 1.7 FIIs 3.4 Others 38.4 Source: BSE Price chart 300 350 400 450 500 550 600 650 24-Dec 29-Dec 3-Jan 8-Jan 13-Jan 18-Jan 23-Jan 28-Jan (Rs) Mrs. Bectors Food Specialities ADD Multiple drivers of growth; initiate at ADD Rs375 Research Analysts: Manoj Menon [email protected] +91 22 6637 7209 Vismaya Agarwal, CFA [email protected] +91 22 2277 7632 Karan Bhuwania [email protected] +91 22 6637 7351 INDIA We believe the expansion of domestic biscuits and branded breads business into new regions driven by sales initiatives will be a key driver for growth. Further, focus on premiumisation within existing product segments with focus on increasing sales realisations, volume and provide differential offerings to customers will drive margin expansion. Strong relationships with institutional customers (QSRs, Mondelez, exports) augurs well for adopting innovations faster to drive penetration and customer acquisitions. We initiate coverage with an ADD rating and DCF-based target price of Rs400 (implied P/E of 27xFY23E). Sales driven initiatives to accelerate growth: We expect Mrs. Bectors growth to be driven by (1) Expansion of domestic biscuit business in NCR and Uttar Pradesh, (2) Distribution reach expansion in existing markets and (3) Expansion of branded bakery business into metros – Mumbai and Bengaluru. Focus on premiumisation to drive margin expansion in domestic branded business: We expect margin expansion to be driven by (1) expand product offering to niche biscuits and bakery products, (2) reducing the contribution of lower margin glucose biscuits, (3) targeting developed and emerging export markets and (4) premium products in bakery segment such as sub-breads, frozen doughs, pizzas, garlic breads, cheese garlic bun fills and frozen cookies. Growth in Chain Food Service market to drive growth in institutional bakery segment: The chain food service market in India is projected to grow at a CAGR of 19% to Rs966bn by FY25. We believe that strong relationships with these large QSR players will help the institutional bakery division to mirror the strong growth expected in the QSR industry in India. New product development and innovations to improve penetration and help recruit new customers: We believe that Mrs. Bectors Food is well positioned to capitalise its relationships with large institutions to accelerate new product launches and innovation. In biscuits, it can benefit from its relationship with Mondelez (the largest global biscuit manufacturer) and its experience in biscuits exports business. Similarly, in branded breads segment, the company is likely to benefit from its relationship with reputed QSRs. Valuations and risks: We model revenue / EBITDA / PAT CAGR of 17% / 24% / 42% over FY20-23E. Initiate at ADD with a DCF-based target price of Rs400. At our target price, the stock will trade at 27x P/E multiple March-23E. Key downside risks are delays or failures distribution expansion or steep rise in competitive intensity and raw material prices.
-
Upload
khangminh22 -
Category
Documents
-
view
2 -
download
0
Transcript of Mrs. Bectors Food Specialities
Please refer to important disclosures at the end of this report
Market Cap Rs22bn/US$302mn Year to March FY20 FY21E FY22E FY23E
Bloomberg BECTORS IN Net Revenue (Rs mn) 7,621 8,655 10,492 12,209
Shares Outstanding (mn) 58.7 Net Profit (Rs mn) 304 635 716 869
52-week Range (Rs) 594/288 Dil. EPS (Rs) 5.3 10.8 12.2 14.8
Free Float (%) 32.1 % Chg YoY (8.3) 103.9 12.7 21.4
FII (%) 16.9 P/E (x) 70.6 34.6 30.7 25.3
Daily Volume (US$'000) NA CEPS (Rs) 12.6 18.4 22.0 25.5
Absolute Return 3m (%) NA EV/EBITDA (x) 23.8 16.8 14.6 12.6
Absolute Return 12m (%) NA Dividend Yield (%) 0.2 0.3 0.4 0.5
Sensex Return 3m (%) 16.9 RoCE (%) 10.7 15.4 16.0 18.2
Sensex Return 12m (%) 15.0 RoE (%) 9.5 14.9 14.6 15.4
Equity Research January 31, 2021
BSE Sensex: 46286
ICICI Securities Limited is the author and distributor of this report
Initiating coverage
Consumer Staples & Discretionary
Target price: Rs400
Shareholding pattern
Dec ‘20
Promoters 51.1 Institutional investors 10.5 MFs and other 5.3 Banks/FIs 0.1 Insurance 1.7 FIIs 3.4 Others 38.4
Source: BSE
Price chart
300
350
400
450
500
550
600
650
24
-Dec
29
-Dec
3-J
an
8-J
an
13
-Jan
18
-Jan
23
-Jan
28
-Jan
(Rs)
Mrs. Bectors Food Specialities ADD
Multiple drivers of growth; initiate at ADD Rs375
Research Analysts:
Manoj Menon [email protected]
+91 22 6637 7209
Vismaya Agarwal, CFA [email protected]
+91 22 2277 7632
Karan Bhuwania [email protected]
+91 22 6637 7351
INDIA
We believe the expansion of domestic biscuits and branded breads business into
new regions driven by sales initiatives will be a key driver for growth. Further,
focus on premiumisation within existing product segments with focus on
increasing sales realisations, volume and provide differential offerings to
customers will drive margin expansion. Strong relationships with institutional
customers (QSRs, Mondelez, exports) augurs well for adopting innovations faster
to drive penetration and customer acquisitions. We initiate coverage with an ADD
rating and DCF-based target price of Rs400 (implied P/E of 27xFY23E).
Sales driven initiatives to accelerate growth: We expect Mrs. Bectors growth to
be driven by (1) Expansion of domestic biscuit business in NCR and Uttar Pradesh,
(2) Distribution reach expansion in existing markets and (3) Expansion of branded
bakery business into metros – Mumbai and Bengaluru.
Focus on premiumisation to drive margin expansion in domestic branded
business: We expect margin expansion to be driven by (1) expand product offering
to niche biscuits and bakery products, (2) reducing the contribution of lower margin
glucose biscuits, (3) targeting developed and emerging export markets and (4)
premium products in bakery segment such as sub-breads, frozen doughs, pizzas,
garlic breads, cheese garlic bun fills and frozen cookies.
Growth in Chain Food Service market to drive growth in institutional bakery
segment: The chain food service market in India is projected to grow at a CAGR of
19% to Rs966bn by FY25. We believe that strong relationships with these large
QSR players will help the institutional bakery division to mirror the strong growth
expected in the QSR industry in India.
New product development and innovations to improve penetration and help
recruit new customers: We believe that Mrs. Bectors Food is well positioned to
capitalise its relationships with large institutions to accelerate new product launches
and innovation. In biscuits, it can benefit from its relationship with Mondelez (the
largest global biscuit manufacturer) and its experience in biscuits exports business.
Similarly, in branded breads segment, the company is likely to benefit from its
relationship with reputed QSRs.
Valuations and risks: We model revenue / EBITDA / PAT CAGR of 17% / 24% /
42% over FY20-23E. Initiate at ADD with a DCF-based target price of Rs400. At our
target price, the stock will trade at 27x P/E multiple March-23E. Key downside risks
are delays or failures distribution expansion or steep rise in competitive intensity and
raw material prices.

Mrs. Bectors Food Specialities, January 31, 2021 ICICI Securities
2
TABLE OF CONTENT
Investment thesis ............................................................................................................. 3
#1 Sales driven initiatives to accelerate growth .............................................................. 3
#2 Focus on premiumisation to drive margin expansion in domestic branded business 7
#3 Growth in Chain Food Service market to drive growth in institutional bakery segment
........................................................................................................................................ 9
#4 New product development and innovations to improve penetration and help recruit
new customers .............................................................................................................. 10
Financial performance, assumptions, estimates........................................................ 11
Valuations and risks ...................................................................................................... 15
DCF assumptions .......................................................................................................... 15
Relative valuation .......................................................................................................... 17
Risks ................................................................................................................................ 18
Company description .................................................................................................... 19
Operations ..................................................................................................................... 19
Industry – Category Size ............................................................................................... 22
Domestic biscuits market .............................................................................................. 22
Global Biscuits Export Market ....................................................................................... 25
Indian Breads and Buns Retail Market ......................................................................... 25
Promoters and management profile ............................................................................ 27
Shareholding pattern ..................................................................................................... 29
Financials ........................................................................................................................ 30
Index of tables and charts ............................................................................................. 35
Mrs. Bectors Food Specialities, January 31, 2021 ICICI Securities
3
Investment thesis
#1 Sales driven initiatives to accelerate growth
Expansion of domestic biscuit business in NCR and Uttar Pradesh
Mrs. Bectors Food’s domestic biscuits segment (contributes 37% to sales) has a
strong presence in North India (market size of Rs80bn – accounts for 25% of the total
mid-premium and premium biscuit market in India. In FY20, it had a market share of
~5% of the premium and mid-premium biscuits market in North India.
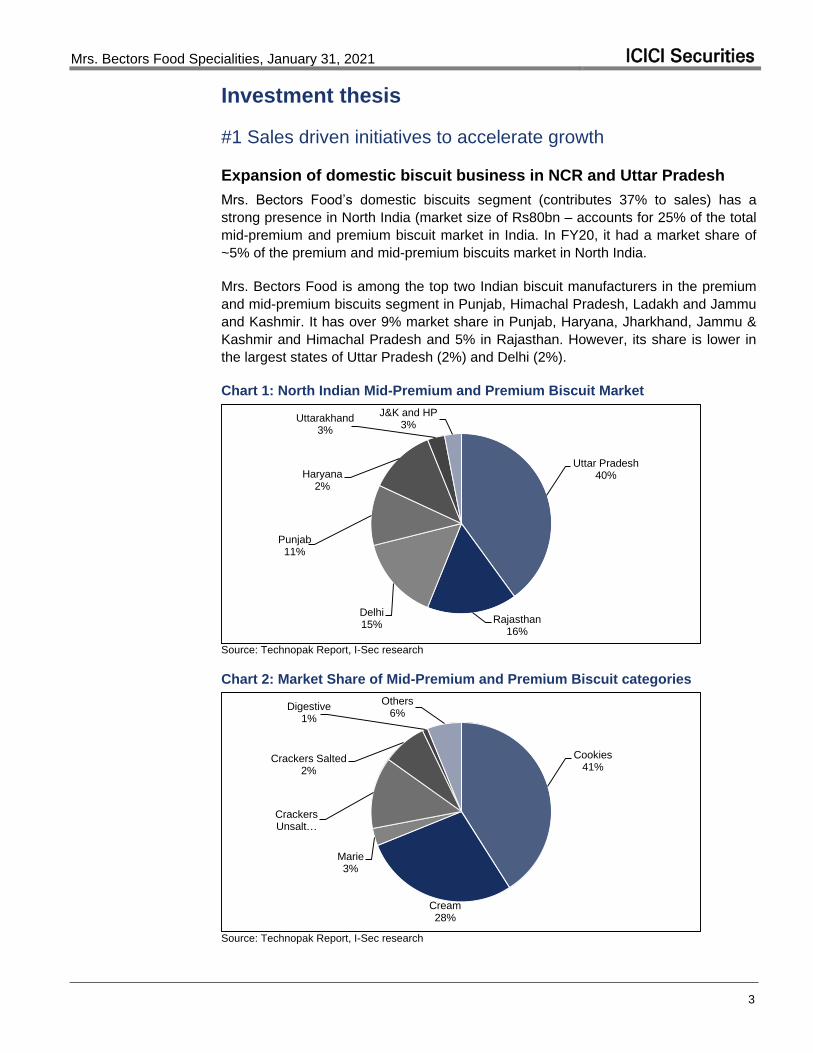
Mrs. Bectors Food is among the top two Indian biscuit manufacturers in the premium
and mid-premium biscuits segment in Punjab, Himachal Pradesh, Ladakh and Jammu
and Kashmir. It has over 9% market share in Punjab, Haryana, Jharkhand, Jammu &
Kashmir and Himachal Pradesh and 5% in Rajasthan. However, its share is lower in
the largest states of Uttar Pradesh (2%) and Delhi (2%).
Chart 1: North Indian Mid-Premium and Premium Biscuit Market
Uttar Pradesh40%
Rajasthan16%
Delhi15%
Punjab 11%
Haryana 2%
Uttarakhand3%
J&K and HP3%
Source: Technopak Report, I-Sec research
Chart 2: Market Share of Mid-Premium and Premium Biscuit categories
Cookies41%
Cream28%
Marie3%
Crackers Unsalt…
Crackers Salted2%
Digestive1%
Others6%
Source: Technopak Report, I-Sec research
Mrs. Bectors Food Specialities, January 31, 2021 ICICI Securities
4
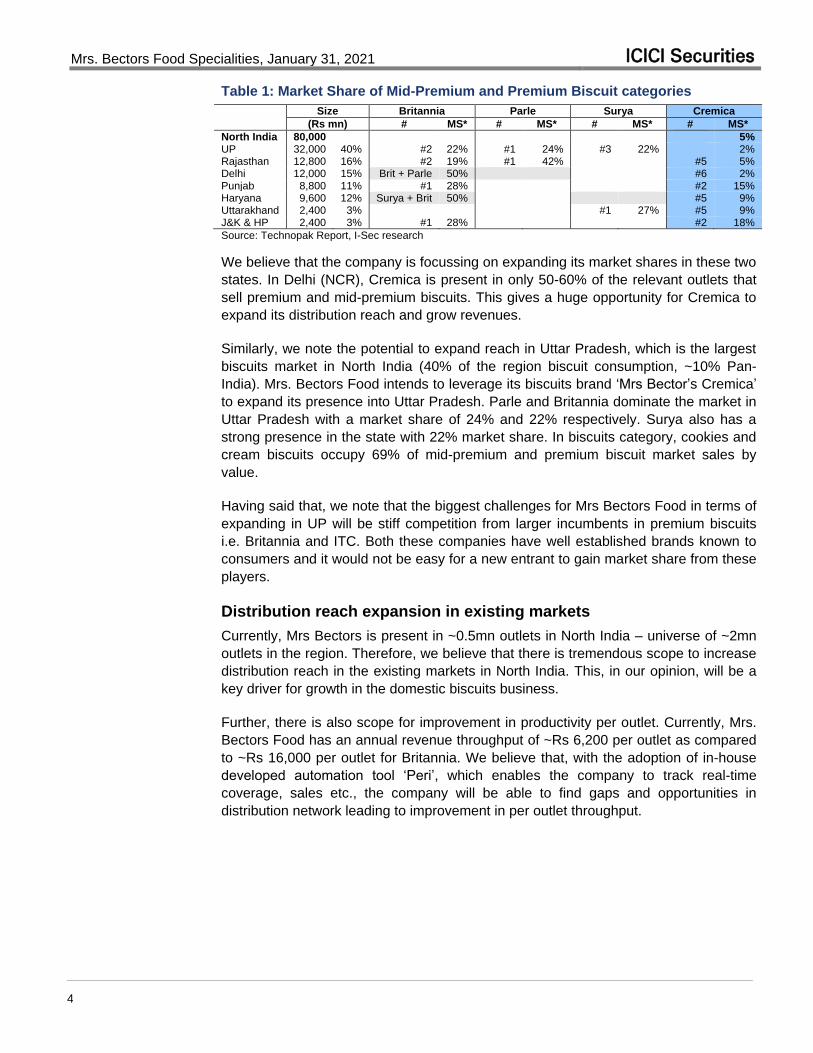
Table 1: Market Share of Mid-Premium and Premium Biscuit categories
Size Britannia Parle Surya Cremica
(Rs mn) # MS* # MS* # MS* # MS*
North India 80,000 5% UP 32,000 40% #2 22% #1 24% #3 22% 2% Rajasthan 12,800 16% #2 19% #1 42% #5 5% Delhi 12,000 15% Brit + Parle 50% #6 2% Punjab 8,800 11% #1 28% #2 15% Haryana 9,600 12% Surya + Brit 50% #5 9% Uttarakhand 2,400 3% #1 27% #5 9% J&K & HP 2,400 3% #1 28% #2 18%
Source: Technopak Report, I-Sec research
We believe that the company is focussing on expanding its market shares in these two
states. In Delhi (NCR), Cremica is present in only 50-60% of the relevant outlets that
sell premium and mid-premium biscuits. This gives a huge opportunity for Cremica to
expand its distribution reach and grow revenues.
Similarly, we note the potential to expand reach in Uttar Pradesh, which is the largest
biscuits market in North India (40% of the region biscuit consumption, ~10% Pan-
India). Mrs. Bectors Food intends to leverage its biscuits brand ‘Mrs Bector’s Cremica’
to expand its presence into Uttar Pradesh. Parle and Britannia dominate the market in
Uttar Pradesh with a market share of 24% and 22% respectively. Surya also has a
strong presence in the state with 22% market share. In biscuits category, cookies and
cream biscuits occupy 69% of mid-premium and premium biscuit market sales by
value.
Having said that, we note that the biggest challenges for Mrs Bectors Food in terms of
expanding in UP will be stiff competition from larger incumbents in premium biscuits
i.e. Britannia and ITC. Both these companies have well established brands known to
consumers and it would not be easy for a new entrant to gain market share from these
players.
Distribution reach expansion in existing markets
Currently, Mrs Bectors is present in ~0.5mn outlets in North India – universe of ~2mn
outlets in the region. Therefore, we believe that there is tremendous scope to increase
distribution reach in the existing markets in North India. This, in our opinion, will be a
key driver for growth in the domestic biscuits business.
Further, there is also scope for improvement in productivity per outlet. Currently, Mrs.
Bectors Food has an annual revenue throughput of ~Rs 6,200 per outlet as compared
to ~Rs 16,000 per outlet for Britannia. We believe that, with the adoption of in-house
developed automation tool ‘Peri’, which enables the company to track real-time
coverage, sales etc., the company will be able to find gaps and opportunities in
distribution network leading to improvement in per outlet throughput.

Mrs. Bectors Food Specialities, January 31, 2021 ICICI Securities
5
Chart 3: Revenue and growth rates – Domestic Biscuits
(10)
(5)
-
5
10
15
20
25
30
-
500
1,000
1,500
2,000
2,500
3,000
3,500
4,000
4,500
5,000
FY
16
FY
17
FY
18
FY
19
FY
20
FY
21E
FY
22E
FY
23E
(%)
(Rs m
n)
Value (Rs mn) - Domestic Growth YoY - RHS
Source: Company data, I-Sec research
Chart 4: Volume and growth rates – Domestic Biscuits
(10)
(5)
-
5
10
15
20
25
-
10,000
20,000
30,000
40,000
50,000
60,000
FY
16
FY
17
FY
18
FY
19
FY
20
FY
21E
FY
22E
FY
23E
(%)
(MT
)
Volumes (MT) - Domestic Growth YoY - RHS
Source: Company data, I-Sec research
Expansion of branded bakery business into metros – Mumbai and
Bengaluru
Similar to the domestic biscuits business, Mrs. Bectors Food’s presence in branded
breads business is largely in North India and within that primarily in NCR. Mrs Bectors
Food sells it branded breads under the brand ‘English Oven’. It is currently one of the
fastest growing largescale bakery brands in India and is one of the largest selling
brands in the premium bakery segment in Delhi / NCR.
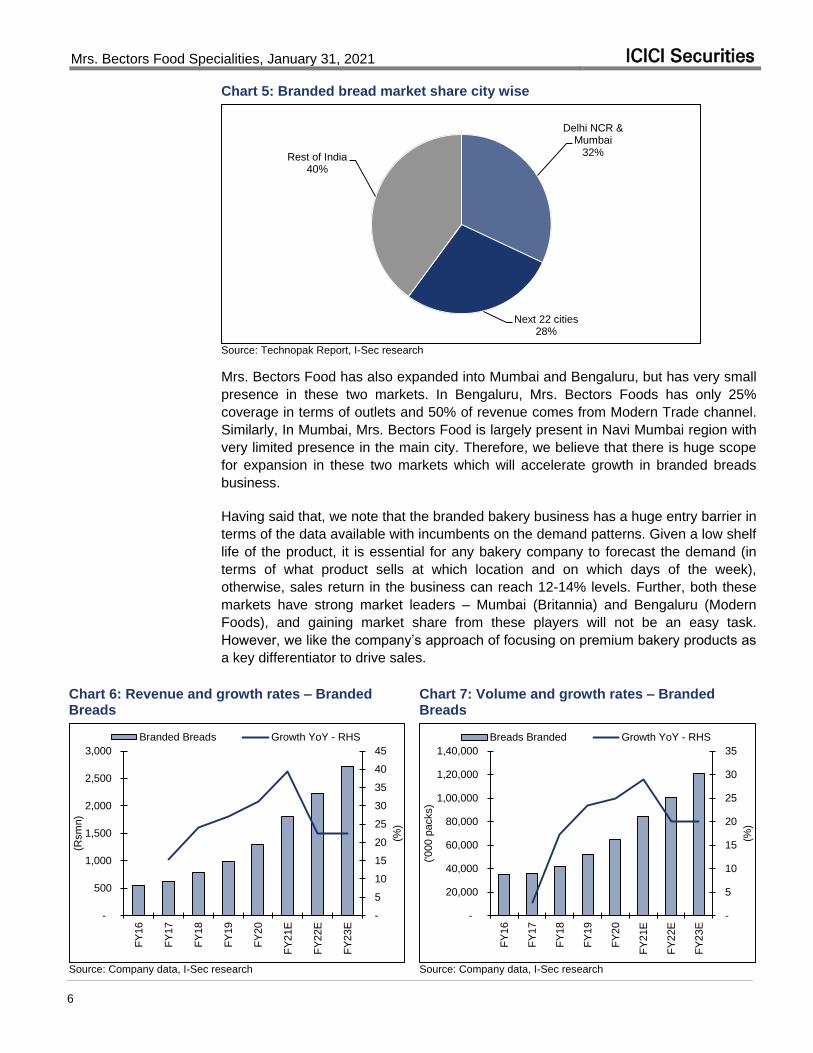
The demand for breads in India is concentrated mainly around metros, tier I and larger
tier II cities due to higher disposable incomes and changing meal preferences. Delhi
NCR and Mumbai amount for about 32% of overall branded breads market.
Mrs. Bectors Food Specialities, January 31, 2021 ICICI Securities
6
Chart 5: Branded bread market share city wise
Delhi NCR & Mumbai
32%
Next 22 cities 28%
Rest of India 40%
Source: Technopak Report, I-Sec research
Mrs. Bectors Food has also expanded into Mumbai and Bengaluru, but has very small
presence in these two markets. In Bengaluru, Mrs. Bectors Foods has only 25%
coverage in terms of outlets and 50% of revenue comes from Modern Trade channel.
Similarly, In Mumbai, Mrs. Bectors Food is largely present in Navi Mumbai region with
very limited presence in the main city. Therefore, we believe that there is huge scope
for expansion in these two markets which will accelerate growth in branded breads
business.
Having said that, we note that the branded bakery business has a huge entry barrier in
terms of the data available with incumbents on the demand patterns. Given a low shelf
life of the product, it is essential for any bakery company to forecast the demand (in
terms of what product sells at which location and on which days of the week),
otherwise, sales return in the business can reach 12-14% levels. Further, both these
markets have strong market leaders – Mumbai (Britannia) and Bengaluru (Modern
Foods), and gaining market share from these players will not be an easy task.
However, we like the company’s approach of focusing on premium bakery products as
a key differentiator to drive sales.
Chart 6: Revenue and growth rates – Branded Breads
Chart 7: Volume and growth rates – Branded Breads
-
5
10
15
20
25
30
35
40
45
-
500
1,000
1,500
2,000
2,500
3,000
FY
16
FY
17
FY
18
FY
19
FY
20
FY
21E
FY
22E
FY
23E
(%)
(Rsm
n)
Branded Breads Growth YoY - RHS
-
5
10
15
20
25
30
35
-
20,000
40,000
60,000
80,000
1,00,000
1,20,000
1,40,000
FY
16
FY
17
FY
18
FY
19
FY
20
FY
21E
FY
22E
FY
23E
(%)
('000 p
acks)
Breads Branded Growth YoY - RHS
Source: Company data, I-Sec research Source: Company data, I-Sec research
Mrs. Bectors Food Specialities, January 31, 2021 ICICI Securities
7
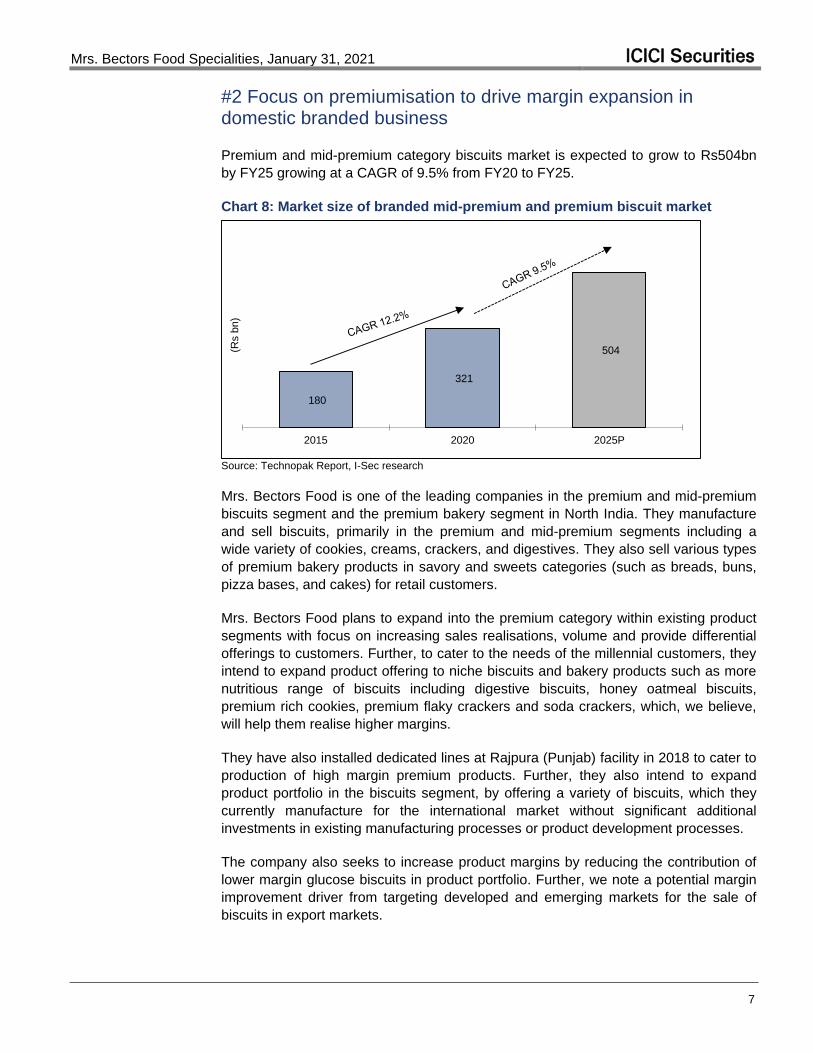
#2 Focus on premiumisation to drive margin expansion in domestic branded business
Premium and mid-premium category biscuits market is expected to grow to Rs504bn
by FY25 growing at a CAGR of 9.5% from FY20 to FY25.
Chart 8: Market size of branded mid-premium and premium biscuit market
180
321
504
2015 2020 2025P
(Rs b
n)
Source: Technopak Report, I-Sec research Mrs. Bectors Food is one of the leading companies in the premium and mid-premium
biscuits segment and the premium bakery segment in North India. They manufacture
and sell biscuits, primarily in the premium and mid-premium segments including a
wide variety of cookies, creams, crackers, and digestives. They also sell various types
of premium bakery products in savory and sweets categories (such as breads, buns,
pizza bases, and cakes) for retail customers.
Mrs. Bectors Food plans to expand into the premium category within existing product
segments with focus on increasing sales realisations, volume and provide differential
offerings to customers. Further, to cater to the needs of the millennial customers, they
intend to expand product offering to niche biscuits and bakery products such as more
nutritious range of biscuits including digestive biscuits, honey oatmeal biscuits,
premium rich cookies, premium flaky crackers and soda crackers, which, we believe,
will help them realise higher margins.
They have also installed dedicated lines at Rajpura (Punjab) facility in 2018 to cater to
production of high margin premium products. Further, they also intend to expand
product portfolio in the biscuits segment, by offering a variety of biscuits, which they
currently manufacture for the international market without significant additional
investments in existing manufacturing processes or product development processes.
The company also seeks to increase product margins by reducing the contribution of
lower margin glucose biscuits in product portfolio. Further, we note a potential margin
improvement driver from targeting developed and emerging markets for the sale of
biscuits in export markets.
Mrs. Bectors Food Specialities, January 31, 2021 ICICI Securities
8
For the bakery segment, the company recently introduced new premium products
such as sub-breads, frozen doughs, pizzas, garlic breads, cheese garlic bun fills and
frozen cookies. The company is also in the process of installing a dedicated line at
their Greater Noida facility to cater to the production of high margin products including
desserts and frozen products such as frozen pizzas, sandwiches, and cakes, aiming to
cater to the institutional customers such as multiplexes, cloud kitchens, hotels
restaurants, cafés as well as retail customers. It also intends to dedicate its Khopoli
(Mumbai) facility for manufacturing premium bakery products such as pizza puffs, sub
breads, footlong breads, croissants and other premium breads with automated
machinery. We believe that focus on high margin products in bakery will be a key
driver for margin expansion.
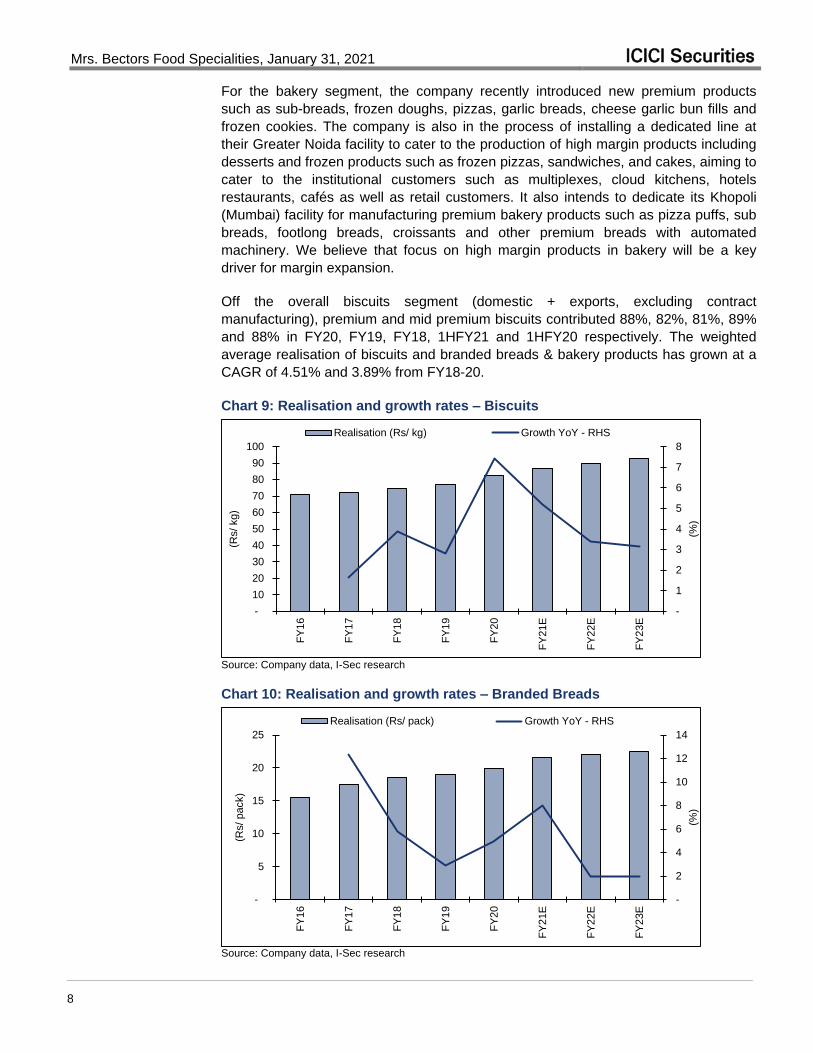
Off the overall biscuits segment (domestic + exports, excluding contract
manufacturing), premium and mid premium biscuits contributed 88%, 82%, 81%, 89%
and 88% in FY20, FY19, FY18, 1HFY21 and 1HFY20 respectively. The weighted
average realisation of biscuits and branded breads & bakery products has grown at a
CAGR of 4.51% and 3.89% from FY18-20.
Chart 9: Realisation and growth rates – Biscuits
-
1
2
3
4
5
6
7
8
-
10
20
30
40
50
60
70
80
90
100
FY
16
FY
17
FY
18
FY
19
FY
20
FY
21E
FY
22E
FY
23E
(%)
(Rs/ kg)
Realisation (Rs/ kg) Growth YoY - RHS
Source: Company data, I-Sec research
Chart 10: Realisation and growth rates – Branded Breads
-
2
4
6
8
10
12
14
-
5
10
15
20
25
FY
16
FY
17
FY
18
FY
19
FY
20
FY
21E
FY
22E
FY
23E
(%)
(Rs/ pack)
Realisation (Rs/ pack) Growth YoY - RHS
Source: Company data, I-Sec research
Mrs. Bectors Food Specialities, January 31, 2021 ICICI Securities
9
#3 Growth in Chain Food Service market to drive growth in institutional bakery segment
The chain food service market in India is estimated at Rs397bn (FY20) and is
projected to grow at a CAGR of 19% to Rs966bn by FY25.
In the chain market, QSRs (Quick Service Restaurants) and the CDRs (Casual Dining
Restaurants) constitute 81% of the total chain market (FY20) and their share is
expected to grow to 85% by FY25. QSRs are likely to be the key driver of this growth –
attaining deeper penetration in Tier II & Tier III cities through operating model linked to
centralized commissaries, support from processed food vendors & robust supply
chain.
The market share of CDRs is expected to decrease from 34% in FY20 to 31% in
FY25. However, the segment will grow at a healthy CAGR of 17.6% to reach Rs302bn
in the coming five years. The growth for CDRs will be fuelled by more CDRs in the
chain segment making inroads in Tier II and Tier III cities.
The chain market is dominated by the international QSR brands operating in India
such as Domino’s, McDonald’s, KFC, Subway, Burger King etc. The overall share of
these key international brands in terms of number of outlets in the chain QSR market
is around 45%, contributing ~57% share to the total revenue in QSR chain market.
Mrs. Bectors Food manufactures and sells a variety of bakery and frozen products
such as buns, kulchas, pizzas, and cakes to QSR customers with pan-India presence,
cloud kitchens such as Rebel Foods Private Limited since 2015, multiplexes such as
PVR Limited, as well as certain hotels, restaurants and cafés. They are the sole
supplier of burger buns and pan muffins (frozen) to Connaught Plaza Restaurants
Private Limited and have been associated since the year 1995 and preferred supplier
of burger buns and pan muffins (fresh) to Hardcastle Restaurants Private Limited
since 2007.
We believe that these strong relationships with these large QSR players will help the
institutional bakery division to mirror the strong growth expected in the QSR industry in
India. Further, the stringent adoption of quality standards due to these QSR customers
will further help them acquire new customers.

Mrs. Bectors Food Specialities, January 31, 2021 ICICI Securities
10
#4 New product development and innovations to improve penetration and help recruit new customers
We like Mrs. Bectors Food’s focus on new product development as a key growth driver
across its portfolio.
In the recent past, within biscuits segments, the company has launched new products
such as ‘Trufills’, ‘Premium Sugar and Classic Crackers’, ‘Pista Almond Cookies’,
‘Choco Chip Cookies’, ‘Honey Oatmeal Cookies’. In bakery, it introduced new
premium products such as sub breads, frozen doughs, pizzas, garlic breads, cheese
garlic bun fills and frozen cookies.
We believe that Mrs Bectors Food is well positioned to capitalise its relationships with
large institutions to accelerate new product launches and innovation. In biscuits, it can
benefit from its relationship with Mondelez (the largest global biscuit manufacturer –
Mrs. Bectors Food does contract manufacturing for Oreos and Chocobakes for
Mondelez) and its experience in biscuits exports business. Similarly, in branded
breads segment, the company is likely to benefit from its relationship with reputed
QSRs and introduce products which are supplied to them to retail consumers. For
example, they have recently introduced ‘sub breads’ branded as ‘English Oven Sub’,
which helps customers create varied ranges of ‘DIY sandwiches’ at home.
Further, the company tends to benefit by working closely with these institutions, as
they are able to incorporate stringent quality standards and industry best practices
required by these customers in overall manufacturing process, thereby further
improving operational standards and quality of products.
Mrs. Bectors Food Specialities, January 31, 2021 ICICI Securities
11
Financial performance, assumptions, estimates
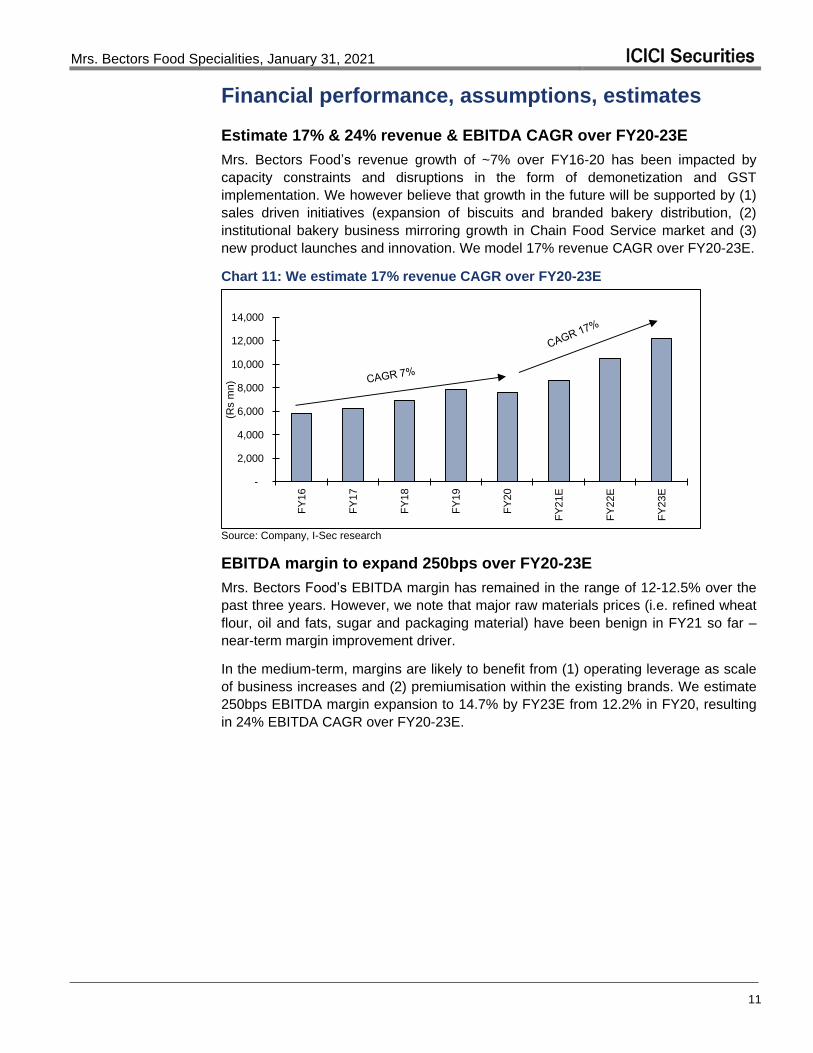
Estimate 17% & 24% revenue & EBITDA CAGR over FY20-23E
Mrs. Bectors Food’s revenue growth of ~7% over FY16-20 has been impacted by
capacity constraints and disruptions in the form of demonetization and GST
implementation. We however believe that growth in the future will be supported by (1)
sales driven initiatives (expansion of biscuits and branded bakery distribution, (2)
institutional bakery business mirroring growth in Chain Food Service market and (3)
new product launches and innovation. We model 17% revenue CAGR over FY20-23E.
Chart 11: We estimate 17% revenue CAGR over FY20-23E
-
2,000
4,000
6,000
8,000
10,000
12,000
14,000
FY
16
FY
17
FY
18
FY
19
FY
20
FY
21E
FY
22E
FY
23E
(Rs m
n)
Source: Company, I-Sec research
EBITDA margin to expand 250bps over FY20-23E
Mrs. Bectors Food’s EBITDA margin has remained in the range of 12-12.5% over the
past three years. However, we note that major raw materials prices (i.e. refined wheat
flour, oil and fats, sugar and packaging material) have been benign in FY21 so far –
near-term margin improvement driver.
In the medium-term, margins are likely to benefit from (1) operating leverage as scale
of business increases and (2) premiumisation within the existing brands. We estimate
250bps EBITDA margin expansion to 14.7% by FY23E from 12.2% in FY20, resulting
in 24% EBITDA CAGR over FY20-23E.

Mrs. Bectors Food Specialities, January 31, 2021 ICICI Securities
12
Chart 12: EBITDA margin to expand 250bps over FY20-23E
-
2.0
4.0
6.0
8.0
10.0
12.0
14.0
16.0
18.0
FY
16
FY
17
FY
18
FY
19
FY
20
FY
21E
FY
22E
FY
23E
(%)
(70bps)
Source: Company, I-Sec research
Chart 13: Gross margin Chart 14: Staff costs (as a % of sales)
39
40
41
42
43
44
45
46
47
48
49
FY
16
FY
17
FY
18
FY
19
FY
20
FY
21E
FY
22E
FY
23E
(%)
12.0
12.5
13.0
13.5
14.0
14.5
15.0
15.5
16.0
FY
16
FY
17
FY
18
FY
19
FY
20
FY
21E
FY
22E
FY
23E
(%)
Source: Company, I-Sec research
Source: Company, I-Sec research
Chart 15: Other opex (as a % of sales)
-
5.0
10.0
15.0
20.0
25.0
FY
16
FY
17
FY
18
FY
19
FY
20
FY
21E
FY
22E
FY
23E
(%)
Source: Company data, I-Sec research
Mrs. Bectors Food Specialities, January 31, 2021 ICICI Securities
13
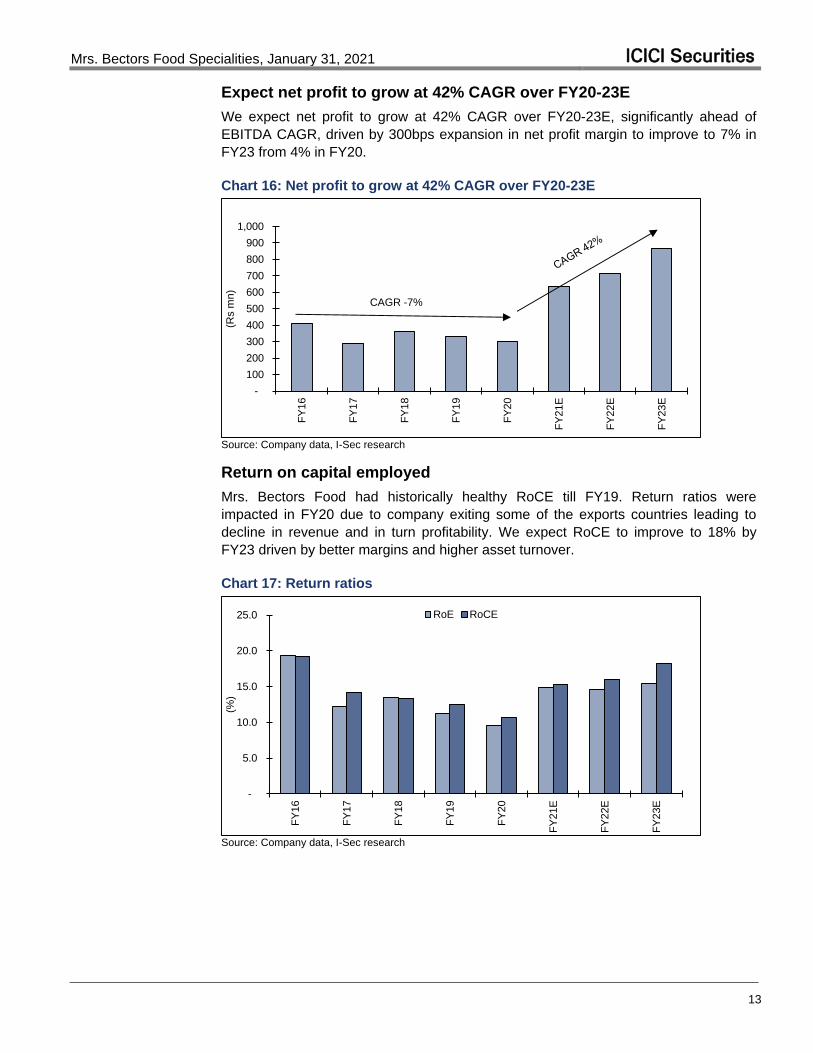
Expect net profit to grow at 42% CAGR over FY20-23E
We expect net profit to grow at 42% CAGR over FY20-23E, significantly ahead of
EBITDA CAGR, driven by 300bps expansion in net profit margin to improve to 7% in
FY23 from 4% in FY20.
Chart 16: Net profit to grow at 42% CAGR over FY20-23E
-
100
200
300
400
500
600
700
800
900
1,000
FY
16
FY
17
FY
18
FY
19
FY
20
FY
21E
FY
22E
FY
23E
(Rs m
n)
CAGR -7%
Source: Company data, I-Sec research
Return on capital employed
Mrs. Bectors Food had historically healthy RoCE till FY19. Return ratios were
impacted in FY20 due to company exiting some of the exports countries leading to
decline in revenue and in turn profitability. We expect RoCE to improve to 18% by
FY23 driven by better margins and higher asset turnover.
Chart 17: Return ratios
-
5.0
10.0
15.0
20.0
25.0
FY
16
FY
17
FY
18
FY
19
FY
20
FY
21E
FY
22E
FY
23E
(%)
RoE RoCE
Source: Company data, I-Sec research
Mrs. Bectors Food Specialities, January 31, 2021 ICICI Securities
14
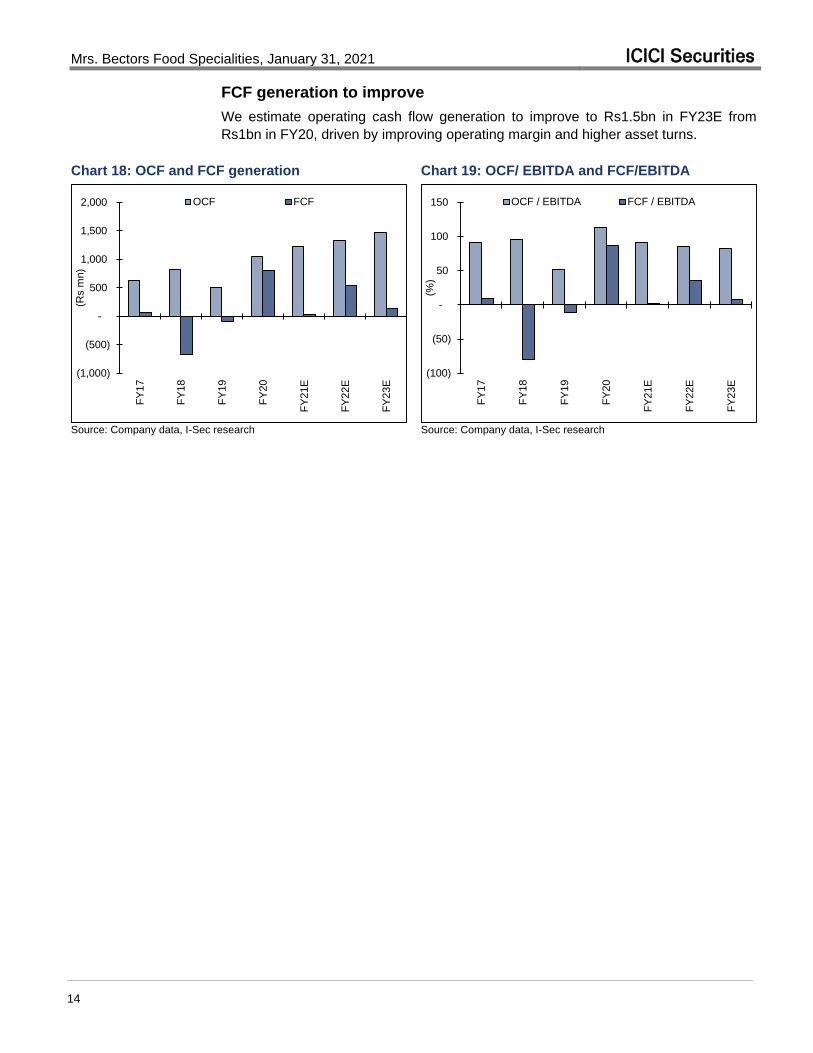
FCF generation to improve
We estimate operating cash flow generation to improve to Rs1.5bn in FY23E from
Rs1bn in FY20, driven by improving operating margin and higher asset turns.
Chart 18: OCF and FCF generation Chart 19: OCF/ EBITDA and FCF/EBITDA
(1,000)
(500)
-
500
1,000
1,500
2,000
FY
17
FY
18
FY
19
FY
20
FY
21E
FY
22E
FY
23E
(Rs m
n)
OCF FCF
(100)
(50)
-
50
100
150
FY
17
FY
18
FY
19
FY
20
FY
21E
FY
22E
FY
23E
(%)
OCF / EBITDA FCF / EBITDA
Source: Company data, I-Sec research Source: Company data, I-Sec research
Mrs. Bectors Food Specialities, January 31, 2021 ICICI Securities
15
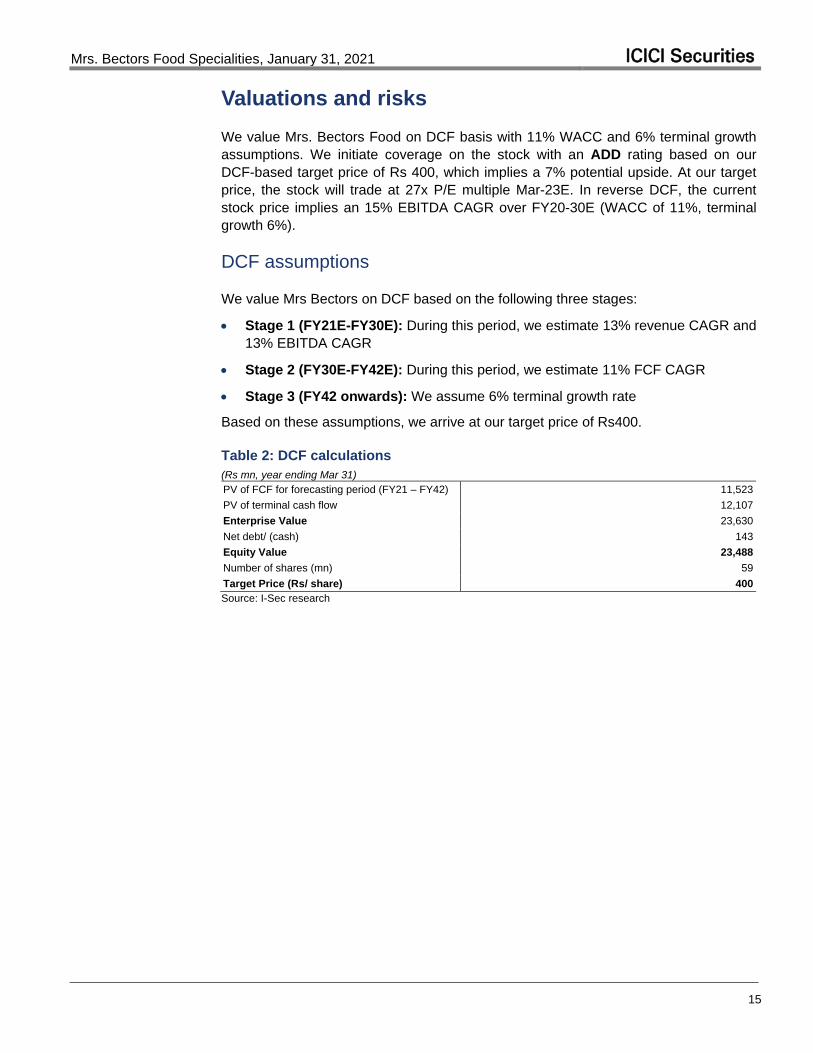
Valuations and risks
We value Mrs. Bectors Food on DCF basis with 11% WACC and 6% terminal growth
assumptions. We initiate coverage on the stock with an ADD rating based on our
DCF-based target price of Rs 400, which implies a 7% potential upside. At our target
price, the stock will trade at 27x P/E multiple Mar-23E. In reverse DCF, the current
stock price implies an 15% EBITDA CAGR over FY20-30E (WACC of 11%, terminal
growth 6%).
DCF assumptions
We value Mrs Bectors on DCF based on the following three stages:
Stage 1 (FY21E-FY30E): During this period, we estimate 13% revenue CAGR and
13% EBITDA CAGR
Stage 2 (FY30E-FY42E): During this period, we estimate 11% FCF CAGR
Stage 3 (FY42 onwards): We assume 6% terminal growth rate
Based on these assumptions, we arrive at our target price of Rs400.
Table 2: DCF calculations
(Rs mn, year ending Mar 31)
PV of FCF for forecasting period (FY21 – FY42) 11,523
PV of terminal cash flow 12,107
Enterprise Value 23,630
Net debt/ (cash) 143
Equity Value 23,488
Number of shares (mn) 59
Target Price (Rs/ share) 400
Source: I-Sec research
Mrs. Bectors Food Specialities, January 31, 2021 ICICI Securities
16
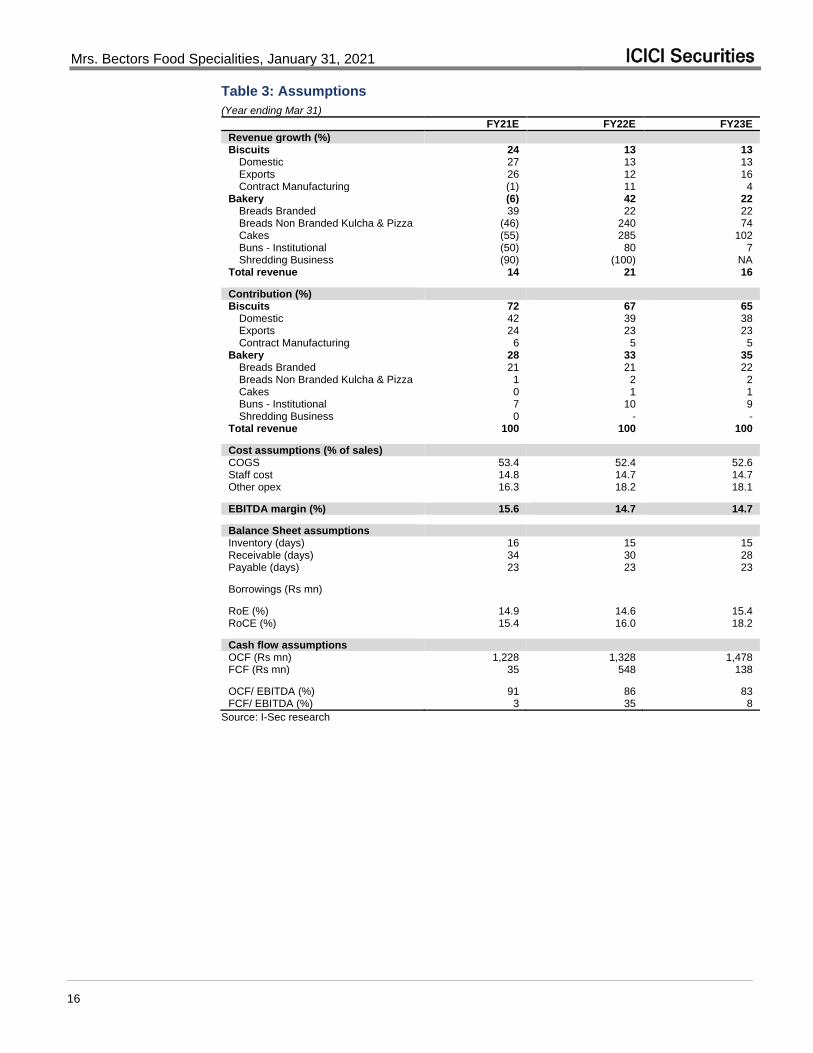
Table 3: Assumptions
(Year ending Mar 31)
FY21E FY22E FY23E
Revenue growth (%) Biscuits 24 13 13
Domestic 27 13 13 Exports 26 12 16 Contract Manufacturing (1) 11 4
Bakery (6) 42 22 Breads Branded 39 22 22 Breads Non Branded Kulcha & Pizza (46) 240 74 Cakes (55) 285 102 Buns - Institutional (50) 80 7 Shredding Business (90) (100) NA
Total revenue 14 21 16
Contribution (%) Biscuits 72 67 65
Domestic 42 39 38 Exports 24 23 23 Contract Manufacturing 6 5 5
Bakery 28 33 35 Breads Branded 21 21 22 Breads Non Branded Kulcha & Pizza 1 2 2 Cakes 0 1 1 Buns - Institutional 7 10 9 Shredding Business 0 - -
Total revenue 100 100 100
Cost assumptions (% of sales) COGS 53.4 52.4 52.6
Staff cost 14.8 14.7 14.7 Other opex 16.3 18.2 18.1
EBITDA margin (%) 15.6 14.7 14.7
Balance Sheet assumptions Inventory (days) 16 15 15
Receivable (days) 34 30 28 Payable (days) 23 23 23
Borrowings (Rs mn)
RoE (%) 14.9 14.6 15.4 RoCE (%) 15.4 16.0 18.2
Cash flow assumptions OCF (Rs mn) 1,228 1,328 1,478
FCF (Rs mn) 35 548 138
OCF/ EBITDA (%) 91 86 83 FCF/ EBITDA (%) 3 35 8
Source: I-Sec research

Mrs. Bectors Food Specialities, January 31, 2021 ICICI Securities
17
Relative valuation
Table 4: Valuation summary
Company CMP
(Rs) TP
(Rs) Upside
(%) Rating
PE (x) EV/EBITDA (x) ADTV Market Cap
FY22E FY23E FY22E FY23E (US$ mn) (Rs bn) (US$ bn)
Staples
Bajaj Consumer 209 250 19 ADD 14 14 12 11 1.6 33 0.4 Britannia 3,501 3,200 (9) REDUCE 44 39 33 29 41.2 870 11.8 Colgate 1,603 1,700 6 ADD 43 38 28 25 17.1 415 5.6 Dabur 515 580 13 ADD 49 42 42 36 28.5 941 12.8 Emami 483 540 12 ADD 29 25 25 23 4.9 216 2.9 GCPL 745 850 14 ADD 39 33 29 25 17.4 797 10.8 HUL 2,264 2,600 15 ADD 59 51 41 35 71.6 5,638 76.4 ITC 203 240 18 ADD 17 16 13 12 93.2 2,557 34.7 Jyothy Labs 162 190 17 BUY 23 19 17 15 1.4 58 0.8 Marico 416 470 13 ADD 41 36 29 25 16.5 530 7.2 Mrs. Bectors Food 375 400 7 ADD 31 25 15 13 34.0 23 0.3 Nestle 17,060 17,500 3 HOLD 63 52 42 35 38.5 1,679 22.8 Tata Consumer 560 720 29 BUY 45 37 28 24 33.4 529 7.2 Varun Beverages 899 1,015 13 ADD 39 30 17 15 4.6 258 3.5 Zydus Wellness 1,933 2,500 29 BUY 34 27 28 24 1.4 124 1.7 Discretionary Avenue Supermarts 2,652 2,600 (2) REDUCE 74 58 52 41 24.6 1,838 24.9 Bata 1,501 1,400 (7) REDUCE 50 43 22 19 17.2 200 2.7 Jubilant Foodworks 2,590 3,000 16 ADD 59 51 26 24 39.8 359 4.9 Page Industries 27,176 31,000 14 ADD 61 49 40 34 19.0 327 4.4 Sheela Foam 1,954 2,300 18 BUY 32 25 21 18 0.7 98 1.3 Titan 1,420 1,600 13 ADD 56 45 35 28 51.6 1,332 18.1 United Spirits 579 700 21 ADD 41 34 26 22 19.7 461 6.3 Westlife Development 465 500 8 ADD 64 52 23 19 1.9 71 1.0 Paints Akzo Nobel 2,228 3,000 35 BUY 37 32 24 20 0.6 109 1.5 Asian Paints 2,407 2,950 23 ADD 61 53 40 35 83.7 2,411 32.7 Berger Paints 707 770 9 HOLD 97 84 61 53 11.5 727 9.9 Kansai Nerolac 549 650 18 HOLD 48 42 30 26 2.6 330 4.5
Source: Bloomberg, I-Sec research
EV/ sales (x) P/B (x) P/CEPS (x) RoE (%) RoCE (%) CAGR (FY20-22E) (%)
Company FY22E FY23E FY22E FY23E FY22E FY23E FY22E FY23E FY22E FY23E Revenues EBITDA PAT
Staples Bajaj Consumer 3.2 3.0 3 3 14 14 24 21 25 24 4 7 8 Britannia 6.2 5.5 16 13 40 35 36 32 25 24 9 17 16 Colgate 8.4 7.6 22 20 36 32 57 61 68 72 7 12 14 Dabur 8.6 7.6 11 9 43 37 23 24 18 19 11 13 10 Emami 7.2 6.6 10 8 28 23 36 36 35 34 8 13 21 GCPL 6.8 6.1 8 7 35 30 22 23 18 19 8 12 12 HUL 10.3 9.1 12 11 52 45 20 23 19 21 15 16 14 ITC 4.7 4.3 4 4 15 14 25 26 27 27 5 3 (1) Jyothy Labs 2.9 2.6 4 4 19 16 19 20 18 19 11 18 21 Marico 6.1 5.4 15 13 37 32 37 39 33 36 9 11 11 Mrs. Bectors Food 2.2 1.9 4 4 17 15 15 15 16 18 17 29 53 Nestle 10.4 8.9 64 47 54 45 120 104 46 44 12 17 15 Tata Consumer 4.0 3.6 3 3 36 31 8 9 9 10 14 19 29 Varun Beverages 3.3 2.9 6 5 21 18 16 18 16 19 12 8 19 Zydus Wellness 5.7 5.2 3 2 31 26 8 9 8 9 6 12 40 Discretionary
Avenue Supermarts 4.7 3.8 12 10 63 50 17 18 22 23 22 26 31 Bata 5.9 5.2 9 8 28 24 19 19 26 26 2 1 9 Jubilant Foodworks 7.1 6.2 19 15 35 31 37 33 28 27 10 21 39 Page Industries 8.6 7.4 26 21 53 43 47 47 38 38 10 19 20 Sheela Foam 3.0 2.7 7 5 25 20 24 24 23 24 18 21 20 Titan 4.2 3.4 14 12 47 38 29 29 33 35 19 20 23 United Spirits 4.5 4.0 8 7 33 27 21 22 23 24 2 3 14 Westlife Development 4.2 3.6 12 10 28 24 20 21 26 33 6 21 221 Paints
Akzo Nobel 3.4 3.0 7 6 28 24 19 19 19 19 2 3 6 Asian Paints 9.0 7.9 17 14 49 43 30 29 27 26 12 18 18 Berger Paints 10.2 9.0 20 18 74 64 22 23 19 19 4 4 4 Kansai Nerolac 4.9 4.4 7 6 37 33 15 15 14 14 6 10 10
Source: Bloomberg, I-Sec research
Mrs. Bectors Food Specialities, January 31, 2021 ICICI Securities
18
Risks
Risks to the Cremica brand name: The promoter’s brother have rights to the
Cremica brand name for selling products in other categories – ice creams, bakery,
condiments and namkeens. We note that any potential mishap with the brand in these
categories could create a risk for the brand image in biscuits as well. Having said that,
the brands used by the three brothers have different logos, thereby limiting any
potential negative impact.
Limited potential to use the Cremica brand: Given the arrangement between the
brothers of the promoter, Mrs. Bectors Food can only use the brand Cremica for
selling biscuits and wafer. Therefore, any potential expansion beyond these categories
will require the company to either use their bakery brand (English Oven) or invest
behind creating a new brand.
Failure in distribution expansion: Given that, in our opinion, expansion of
distribution reach into new geographies is a key growth driver for the company, any
failure / inability to do so could impact our earnings growth.
Steep rise in competitive pressures and input prices: Steep rise in competitive
pressures (more so given the company is planning to expand aggressively into Uttar
Pradesh where the incumbents are strong), significant increase in raw materials in a
short timeframe can hurt Mrs. Bectors Food’s earnings.
Mrs. Bectors Food Specialities, January 31, 2021 ICICI Securities
19
Company description
Operations
Product Portfolio
Mrs. Bectors Food’s diversified product portfolio can be classified under two key
categories – biscuits and bakery products.
Table 5: Performance of product segments
Product Segment Particulars FY18 FY19 FY20
Biscuits Gross Margin 42.1% 43.6% 44.4%
EBITDA 10.3% 10.4% 8.8%
Bakery Products Gross Margin 50.8% 50.8% 50.1%
EBITDA 16.7% 15.4% 17.7%
Source: Company Data
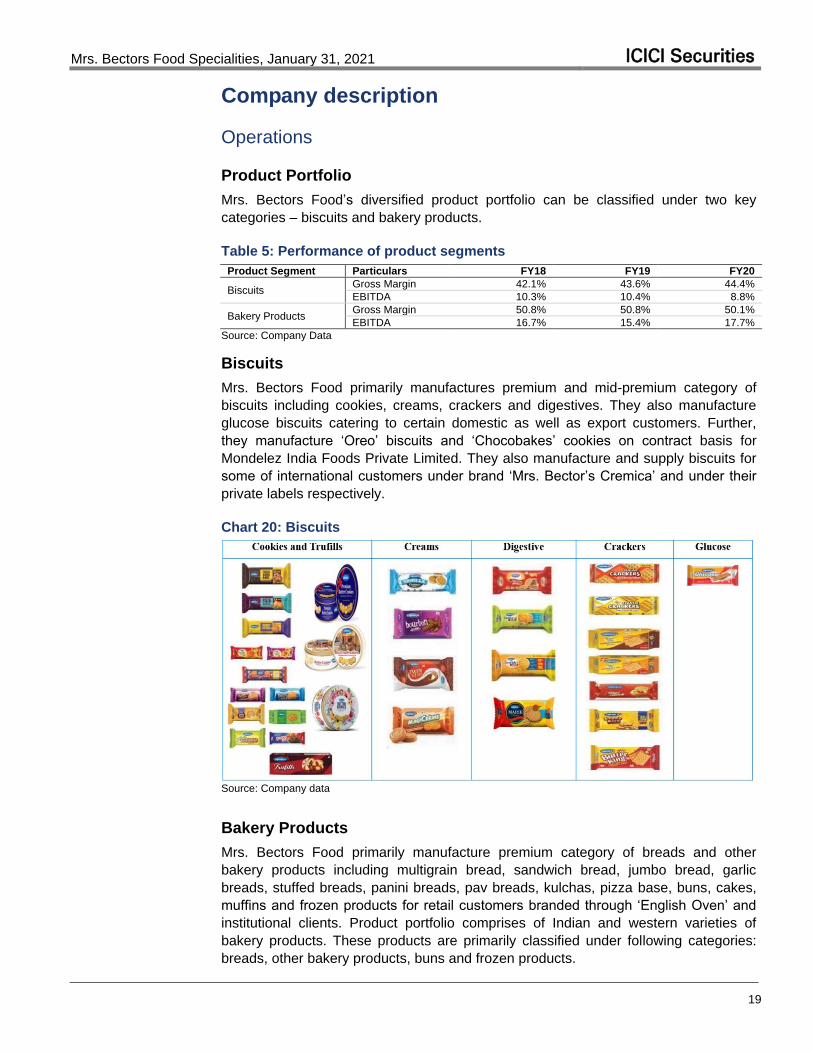
Biscuits
Mrs. Bectors Food primarily manufactures premium and mid-premium category of
biscuits including cookies, creams, crackers and digestives. They also manufacture
glucose biscuits catering to certain domestic as well as export customers. Further,
they manufacture ‘Oreo’ biscuits and ‘Chocobakes’ cookies on contract basis for
Mondelez India Foods Private Limited. They also manufacture and supply biscuits for
some of international customers under brand ‘Mrs. Bector’s Cremica’ and under their
private labels respectively.
Chart 20: Biscuits
Source: Company data
Bakery Products
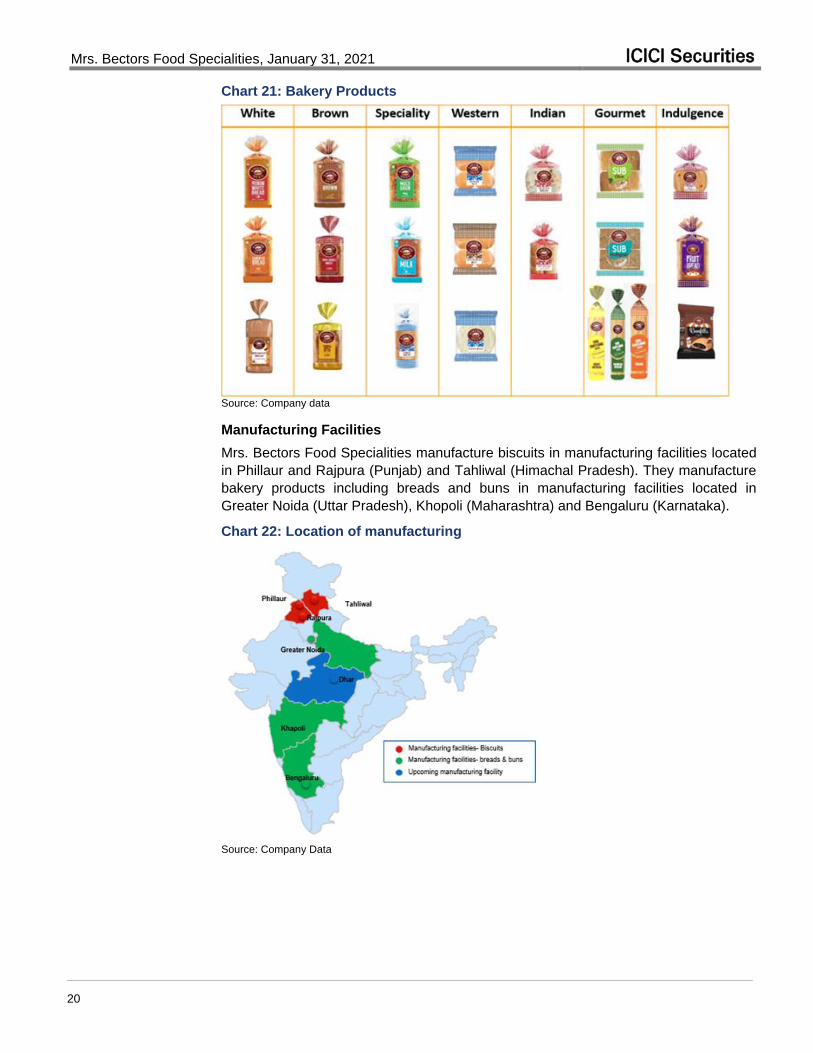
Mrs. Bectors Food primarily manufacture premium category of breads and other
bakery products including multigrain bread, sandwich bread, jumbo bread, garlic
breads, stuffed breads, panini breads, pav breads, kulchas, pizza base, buns, cakes,
muffins and frozen products for retail customers branded through ‘English Oven’ and
institutional clients. Product portfolio comprises of Indian and western varieties of
bakery products. These products are primarily classified under following categories:
breads, other bakery products, buns and frozen products.
Mrs. Bectors Food Specialities, January 31, 2021 ICICI Securities
20
Chart 21: Bakery Products
Source: Company data
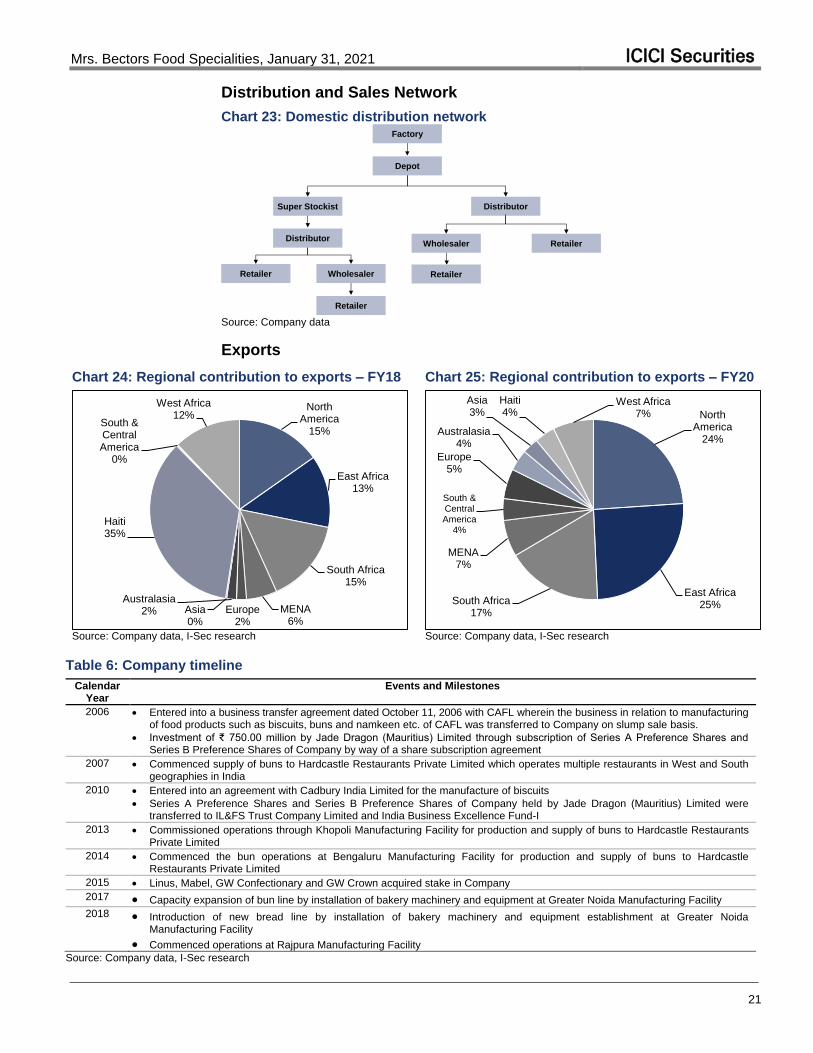
Manufacturing Facilities
Mrs. Bectors Food Specialities manufacture biscuits in manufacturing facilities located
in Phillaur and Rajpura (Punjab) and Tahliwal (Himachal Pradesh). They manufacture
bakery products including breads and buns in manufacturing facilities located in
Greater Noida (Uttar Pradesh), Khopoli (Maharashtra) and Bengaluru (Karnataka).
Chart 22: Location of manufacturing
Source: Company Data
Mrs. Bectors Food Specialities, January 31, 2021 ICICI Securities
21
Distribution and Sales Network
Chart 23: Domestic distribution network Factory
Depot
Super Stockist Distributor
Retailer Wholesaler
Retailer
Wholesaler Retailer
Retailer
Distributor
Source: Company data
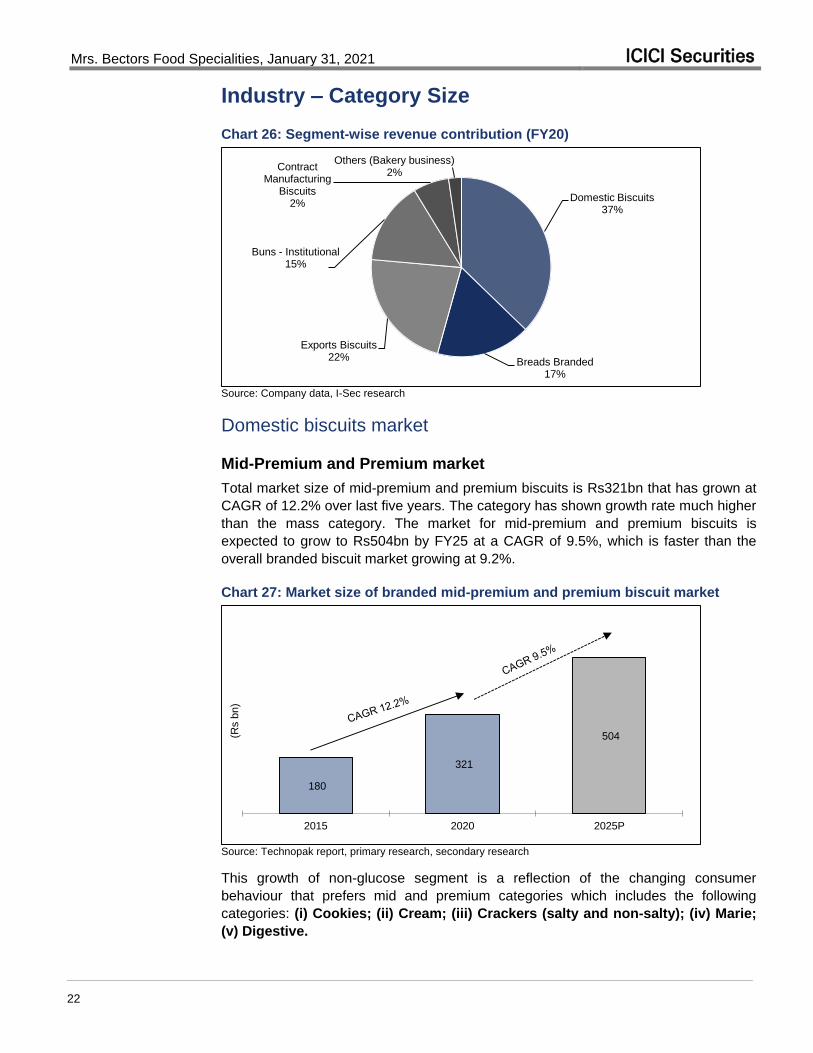
Exports
Chart 24: Regional contribution to exports – FY18 Chart 25: Regional contribution to exports – FY20
North America
15%
East Africa13%
South Africa15%
MENA6%
Europe2%
Australasia2% Asia
0%
Haiti35%
South & Central America
0%
West Africa12%
North America
24%
East Africa25%South Africa
17%
MENA7%
South & Central America
4%
Europe5%
Australasia4%
Asia3%
Haiti4%
West Africa7%
Source: Company data, I-Sec research
Source: Company data, I-Sec research
Table 6: Company timeline
Calendar Year
Events and Milestones
2006 Entered into a business transfer agreement dated October 11, 2006 with CAFL wherein the business in relation to manufacturing of food products such as biscuits, buns and namkeen etc. of CAFL was transferred to Company on slump sale basis.
Investment of ₹ 750.00 million by Jade Dragon (Mauritius) Limited through subscription of Series A Preference Shares and Series B Preference Shares of Company by way of a share subscription agreement
2007 Commenced supply of buns to Hardcastle Restaurants Private Limited which operates multiple restaurants in West and South geographies in India
2010 Entered into an agreement with Cadbury India Limited for the manufacture of biscuits
Series A Preference Shares and Series B Preference Shares of Company held by Jade Dragon (Mauritius) Limited were transferred to IL&FS Trust Company Limited and India Business Excellence Fund-I
2013 Commissioned operations through Khopoli Manufacturing Facility for production and supply of buns to Hardcastle Restaurants Private Limited
2014 Commenced the bun operations at Bengaluru Manufacturing Facility for production and supply of buns to Hardcastle Restaurants Private Limited
2015 Linus, Mabel, GW Confectionary and GW Crown acquired stake in Company
2017 Capacity expansion of bun line by installation of bakery machinery and equipment at Greater Noida Manufacturing Facility
2018 Introduction of new bread line by installation of bakery machinery and equipment establishment at Greater Noida Manufacturing Facility
Commenced operations at Rajpura Manufacturing Facility
Source: Company data, I-Sec research
Mrs. Bectors Food Specialities, January 31, 2021 ICICI Securities
22
Industry – Category Size
Chart 26: Segment-wise revenue contribution (FY20)
Domestic Biscuits37%
Breads Branded17%
Exports Biscuits22%
Buns - Institutional15%
Contract Manufacturing
Biscuits2%
Others (Bakery business)2%
Source: Company data, I-Sec research
Domestic biscuits market
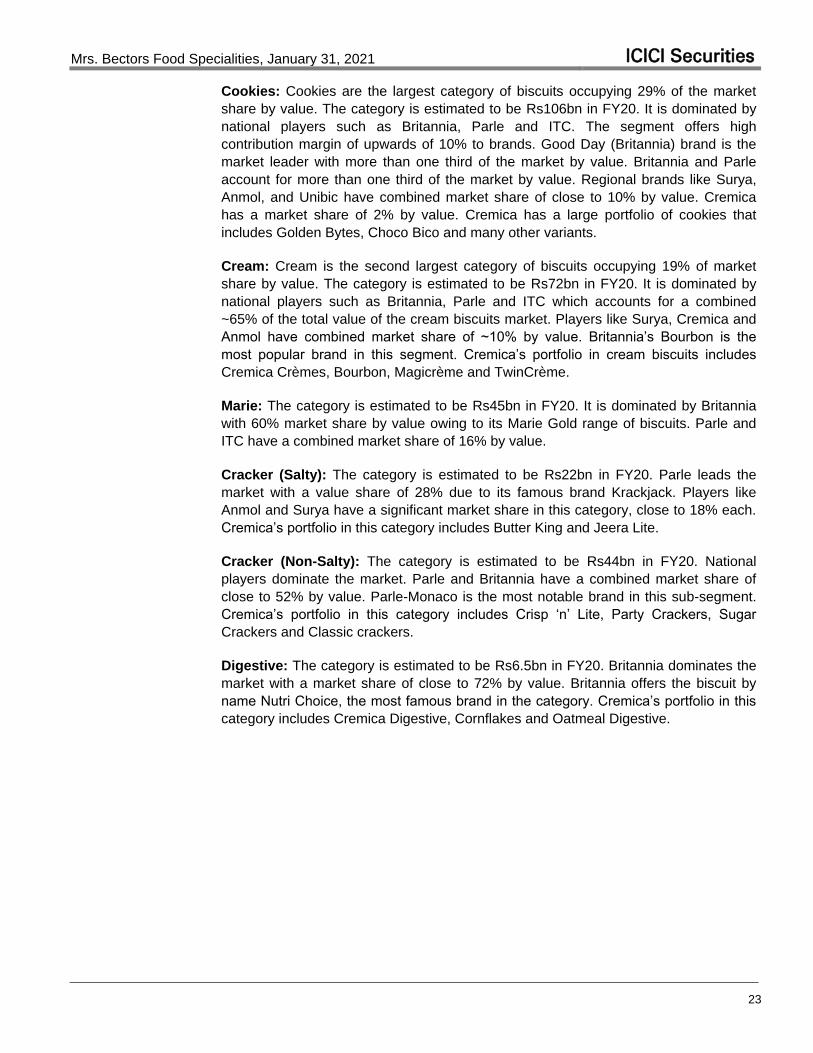
Mid-Premium and Premium market
Total market size of mid-premium and premium biscuits is Rs321bn that has grown at
CAGR of 12.2% over last five years. The category has shown growth rate much higher
than the mass category. The market for mid-premium and premium biscuits is
expected to grow to Rs504bn by FY25 at a CAGR of 9.5%, which is faster than the
overall branded biscuit market growing at 9.2%.
Chart 27: Market size of branded mid-premium and premium biscuit market
180
321
504
2015 2020 2025P
(Rs b
n)
Source: Technopak report, primary research, secondary research
This growth of non-glucose segment is a reflection of the changing consumer
behaviour that prefers mid and premium categories which includes the following
categories: (i) Cookies; (ii) Cream; (iii) Crackers (salty and non-salty); (iv) Marie;
(v) Digestive.
Mrs. Bectors Food Specialities, January 31, 2021 ICICI Securities
23
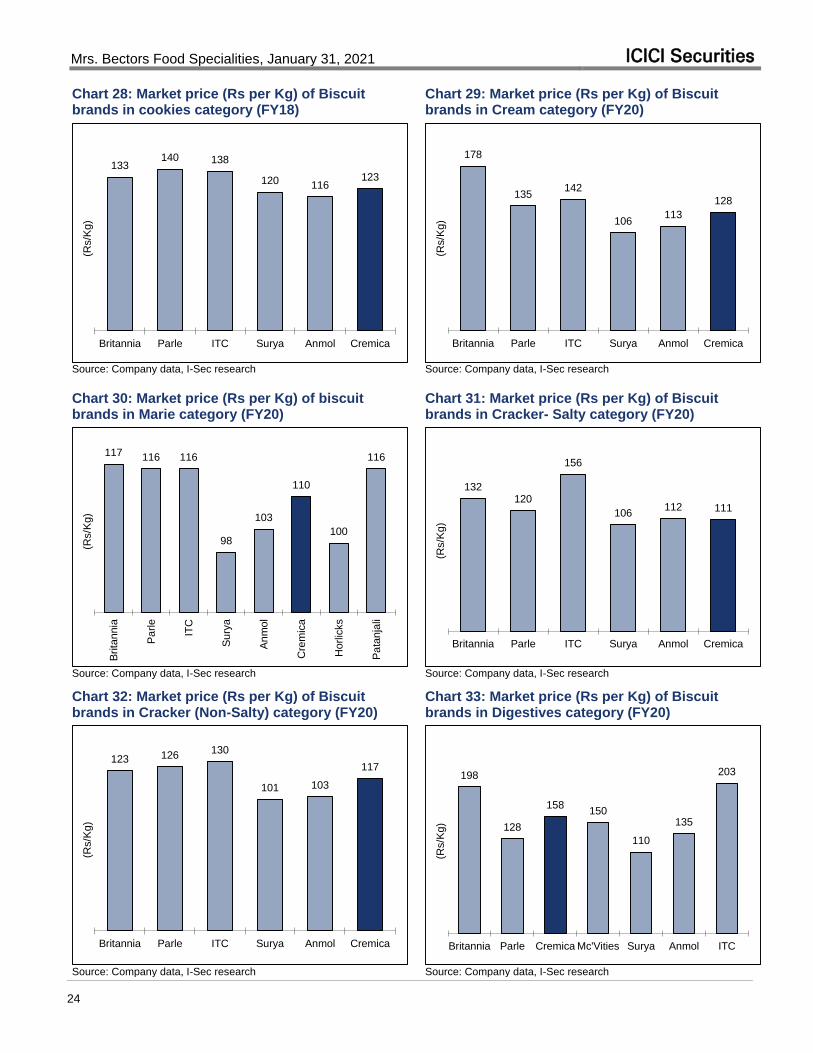
Cookies: Cookies are the largest category of biscuits occupying 29% of the market
share by value. The category is estimated to be Rs106bn in FY20. It is dominated by
national players such as Britannia, Parle and ITC. The segment offers high
contribution margin of upwards of 10% to brands. Good Day (Britannia) brand is the
market leader with more than one third of the market by value. Britannia and Parle
account for more than one third of the market by value. Regional brands like Surya,
Anmol, and Unibic have combined market share of close to 10% by value. Cremica
has a market share of 2% by value. Cremica has a large portfolio of cookies that
includes Golden Bytes, Choco Bico and many other variants.
Cream: Cream is the second largest category of biscuits occupying 19% of market
share by value. The category is estimated to be Rs72bn in FY20. It is dominated by
national players such as Britannia, Parle and ITC which accounts for a combined
~65% of the total value of the cream biscuits market. Players like Surya, Cremica and
Anmol have combined market share of ~10% by value. Britannia’s Bourbon is the
most popular brand in this segment. Cremica’s portfolio in cream biscuits includes
Cremica Crèmes, Bourbon, Magicrème and TwinCrème.
Marie: The category is estimated to be Rs45bn in FY20. It is dominated by Britannia
with 60% market share by value owing to its Marie Gold range of biscuits. Parle and
ITC have a combined market share of 16% by value.
Cracker (Salty): The category is estimated to be Rs22bn in FY20. Parle leads the
market with a value share of 28% due to its famous brand Krackjack. Players like
Anmol and Surya have a significant market share in this category, close to 18% each.
Cremica’s portfolio in this category includes Butter King and Jeera Lite.
Cracker (Non-Salty): The category is estimated to be Rs44bn in FY20. National
players dominate the market. Parle and Britannia have a combined market share of
close to 52% by value. Parle-Monaco is the most notable brand in this sub-segment.
Cremica’s portfolio in this category includes Crisp ‘n’ Lite, Party Crackers, Sugar
Crackers and Classic crackers.
Digestive: The category is estimated to be Rs6.5bn in FY20. Britannia dominates the
market with a market share of close to 72% by value. Britannia offers the biscuit by
name Nutri Choice, the most famous brand in the category. Cremica’s portfolio in this
category includes Cremica Digestive, Cornflakes and Oatmeal Digestive.
Mrs. Bectors Food Specialities, January 31, 2021 ICICI Securities
24
Chart 28: Market price (Rs per Kg) of Biscuit brands in cookies category (FY18)
Chart 29: Market price (Rs per Kg) of Biscuit brands in Cream category (FY20)
133140 138
120 116123
Britannia Parle ITC Surya Anmol Cremica
(Rs/K
g)
178
135142
106113
128
Britannia Parle ITC Surya Anmol Cremica
(Rs/K
g)
Source: Company data, I-Sec research Source: Company data, I-Sec research
Chart 30: Market price (Rs per Kg) of biscuit brands in Marie category (FY20)
Chart 31: Market price (Rs per Kg) of Biscuit brands in Cracker- Salty category (FY20)
117 116 116
98
103
110
100
116
Brita
nnia
Pa
rle
ITC
Su
rya
An
mol
Cre
mic
a
Horlic
ks
Pa
tanja
li
(Rs/K
g)
132120
156
106112 111
Britannia Parle ITC Surya Anmol Cremica
(Rs/K
g)
Source: Company data, I-Sec research
Source: Company data, I-Sec research
Chart 32: Market price (Rs per Kg) of Biscuit brands in Cracker (Non-Salty) category (FY20)
Chart 33: Market price (Rs per Kg) of Biscuit brands in Digestives category (FY20)
123 126130
101 103
117
Britannia Parle ITC Surya Anmol Cremica
(Rs/K
g)
198
128
158150
110
135
203
Britannia Parle Cremica Mc'Vities Surya Anmol ITC
(Rs/K
g)
Source: Company data, I-Sec research Source: Company data, I-Sec research
Mrs. Bectors Food Specialities, January 31, 2021 ICICI Securities
25
Global Biscuits Export Market
While global export of biscuits has grown at 0.7% by value in the Financial Year 2017-
19, it has grown by volume at a CAGR of 11.7% during the same period. The faster
growth in volume has been due to increase in consumption in developing markets like
Africa, Asia etc.
Table 7: Global Biscuits Export Market
World Exports 2017 2018 2019 CAGR(2017-2019)
Value (in million USD) 8,055 8,584 8,168 0.70%
Volume (in 000' Ton) 5,141 4,862 6,420 11.70%
Source: Technopak Report, Secondary research HS Code: 190531
India’s biscuit export market
Indian biscuit exports have maintained a share of ~2% of total world exports by value
since 2017 and 2-3% by volume. India has exported USD 169-181 million worth of
biscuits per annum in Financial Year 2017-19.
Table 8: India’s biscuits export market
India’s Share of world exports (by value) USD million 2017 2018 2019
Total exports (world) 8,055 8,584 8,168
India’s exports 169 163 181
India’s share 2.10% 1.90% 2.20%
India’s share of world exports (by volume) ‘000 tonnes 2017 2018 2019
Total exports (World) 5,141 4,862 6,420
India’s exports 150 138 149
India’s share 2.90% 2.80% 2.30%
Source: Technopak Report, Secondary research
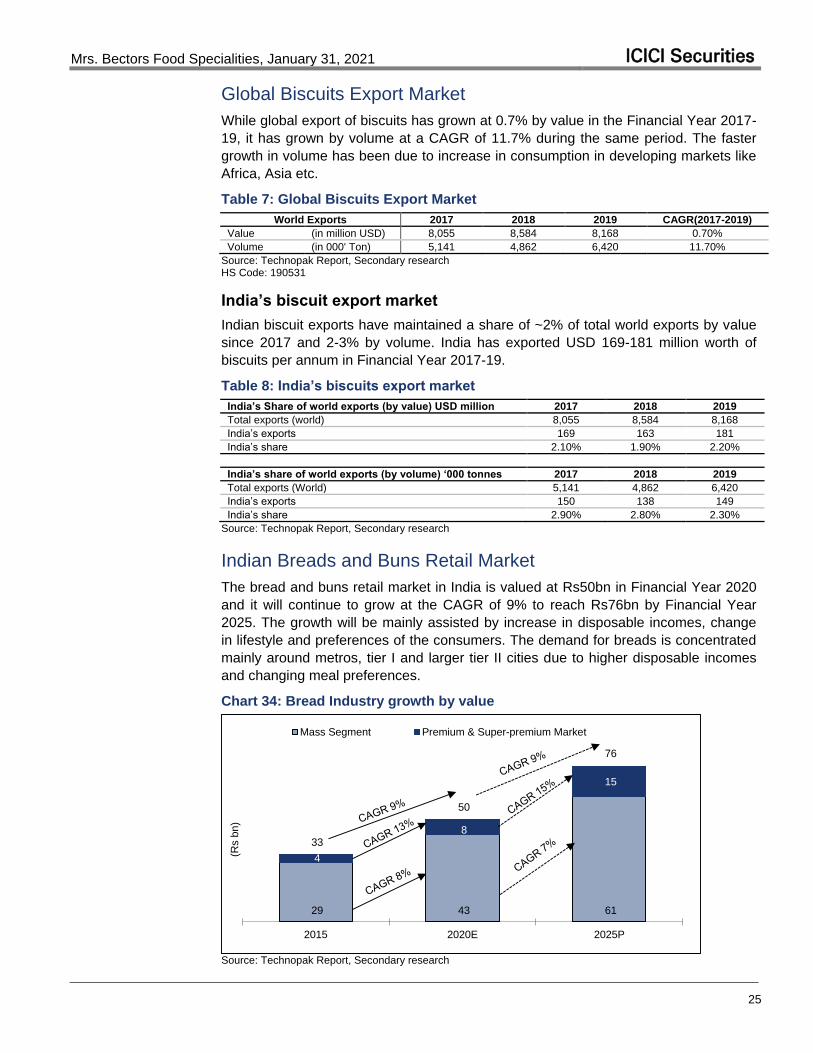
Indian Breads and Buns Retail Market
The bread and buns retail market in India is valued at Rs50bn in Financial Year 2020
and it will continue to grow at the CAGR of 9% to reach Rs76bn by Financial Year
2025. The growth will be mainly assisted by increase in disposable incomes, change
in lifestyle and preferences of the consumers. The demand for breads is concentrated
mainly around metros, tier I and larger tier II cities due to higher disposable incomes
and changing meal preferences.
Chart 34: Bread Industry growth by value
29 43 61
4
8
15
33
50
76
2015 2020E 2025P
(Rs b
n)
Mass Segment Premium & Super-premium Market
Source: Technopak Report, Secondary research
Mrs. Bectors Food Specialities, January 31, 2021 ICICI Securities
26
Indian Food Services Market
The Indian food services market has gained momentum in the last decade due to
changing consumption patterns that have seen an increase in a tendency to eat out
that had not traditionally been a feature of Indians' lifestyles. This has ensured a
constant growth of the Indian food services market, which has evolved considerably
since the 1980s, when the numbers of organized brands were negligible and the
market was widely dominated by unorganized players. A noticeable shift began in
1996 with the opening up of restaurants such as McDonald's, Pizza Hut and Domino's
Pizza, followed by Subway, KFC, Burger King, Haldiram's, Moti Mahal and Taco Bell,
amongst others.
Food Services Market Structure
The food services market can be broken down into three broad segments:
unorganized, organized standalone and chain. The three segments can be divided
further as shown below:
Table 9: Food Services Market Structure
Key Segments in the Food Services Market Average Price Point per
person (INR)
Unorganized Formats
The unorganized segment dominates the Indian food service market and comprises of Dhabas and roadside eateries that have been the most common options for eating out. The segment lacks standardization in terms of menu, operations and format.
10-100
Organized Formats*
Fine Dining A full-service restaurant with high quality interiors, specific cuisine speciality, high standard of service translating to high Average per customer. Fine dining targets rich and upper middle-class consumer segments as it offers unique ambience and upscale service with highly trained staff.
Regular fine dine – 1,000-1,500. Premium fine dine
- >1,500
Casual Dining
A restaurant serving moderately priced food in an ambience oriented towards affordable dining with table service. The offering bridges the gap between fast food establishments and fine dining restaurants
Affordable casual dine - 250-500. Premium casual
dine - 500-1,000
PBCL These formats mainly serve alcohol and related beverages and include nightclubs, sports bars, etc. Example: Beer Cafe, Shiros, Pint Room, Xtreme Sports Bar
750-1,500
Quick Service
Restaurants
The formats focused on speed of service, affordability and convenience including the dine in/takeaway/delivery sub-formats. McDonald's, KFC, Domino's, Haldiram's, Subway and Bikanervala are some of the leading names in the category.
75-250
Cafes Comprises of coffee bars and parlours (for example Café Coffee Day, Costa Coffee, Starbucks, and Barista) and chai bars. These are casual restaurants that emphasize on serving beverages and food as accompaniment.
50-200
Frozen Dessert
It comprises of small kiosk formats of ice cream brands and now extended dine-in concept of frozen yogurt and ice cream brands
50-150
* Organized Formats- The organized formats comprises of Chained and Standalone formats. Chained formats are domestic and international formats with more than three outlets present across the country Source: Technopak Research & Analysis
Table 10: Key National players driving QSR market growth
Brand India Entry Store Count
(As on March 20) Business Model
Store Size (Sq. ft.)
Positioning
Domino’s 1996 1,335 Master Franchisee 1,300-1,500 Delivery & Dine-in McDonald’s 1996 484* JV + Franchisee 2,500-3,000 Destination Format Burger King 2014 255 Joint Venture 700-800 Convenience Subway 2001 520 Micro Franchisee 500-600 Health Focus KFC Re-entry in 2004 449 Regional Franchisee 2,500-3,000 Dine-in
Source: Brand Websites, Primary Research
*represents only McDonald’s South & West Franchisee outlet number
Mrs. Bectors Food Specialities, January 31, 2021 ICICI Securities
27
Promoters and management profile
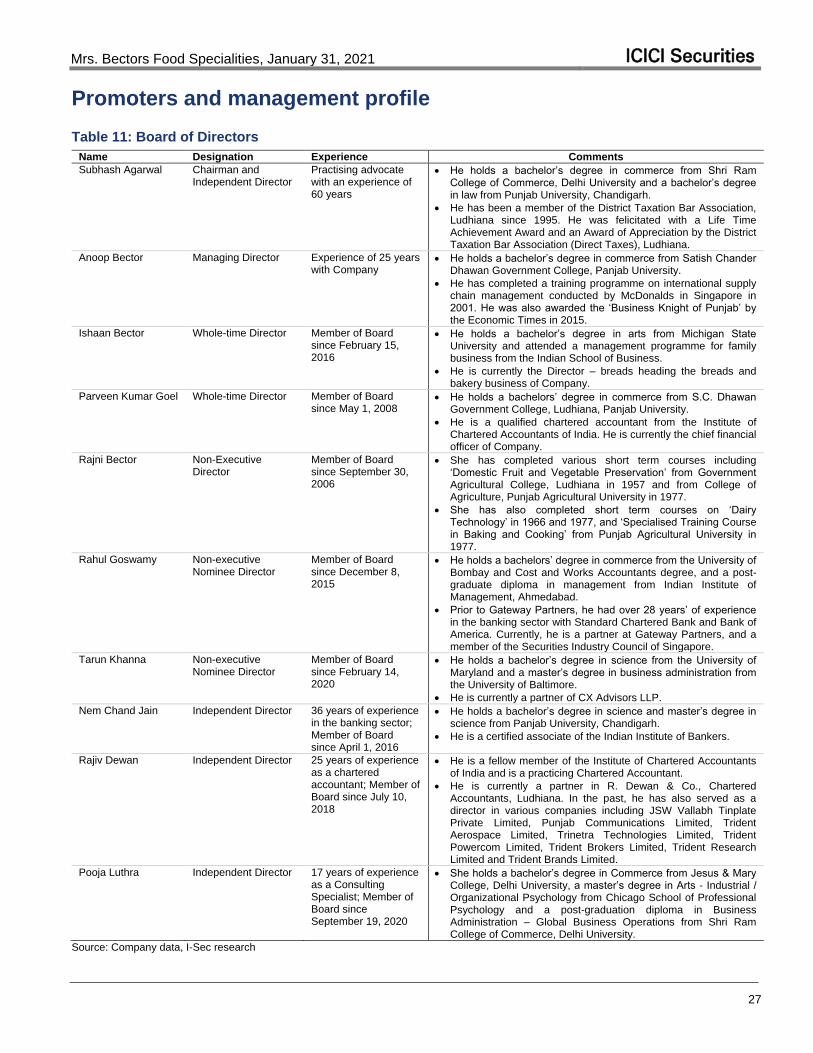
Table 11: Board of Directors
Name Designation Experience Comments
Subhash Agarwal Chairman and Independent Director
Practising advocate with an experience of 60 years
He holds a bachelor’s degree in commerce from Shri Ram College of Commerce, Delhi University and a bachelor’s degree in law from Punjab University, Chandigarh.
He has been a member of the District Taxation Bar Association, Ludhiana since 1995. He was felicitated with a Life Time Achievement Award and an Award of Appreciation by the District Taxation Bar Association (Direct Taxes), Ludhiana.
Anoop Bector Managing Director Experience of 25 years with Company
He holds a bachelor’s degree in commerce from Satish Chander Dhawan Government College, Panjab University.
He has completed a training programme on international supply chain management conducted by McDonalds in Singapore in 2001. He was also awarded the ‘Business Knight of Punjab’ by the Economic Times in 2015.
Ishaan Bector Whole-time Director Member of Board since February 15, 2016
He holds a bachelor’s degree in arts from Michigan State University and attended a management programme for family business from the Indian School of Business.
He is currently the Director – breads heading the breads and bakery business of Company.
Parveen Kumar Goel Whole-time Director Member of Board since May 1, 2008
He holds a bachelors’ degree in commerce from S.C. Dhawan Government College, Ludhiana, Panjab University.
He is a qualified chartered accountant from the Institute of Chartered Accountants of India. He is currently the chief financial officer of Company.
Rajni Bector Non-Executive Director
Member of Board since September 30, 2006
She has completed various short term courses including ‘Domestic Fruit and Vegetable Preservation’ from Government Agricultural College, Ludhiana in 1957 and from College of Agriculture, Punjab Agricultural University in 1977.
She has also completed short term courses on ‘Dairy Technology’ in 1966 and 1977, and ‘Specialised Training Course in Baking and Cooking’ from Punjab Agricultural University in 1977.
Rahul Goswamy Non-executive Nominee Director
Member of Board since December 8, 2015
He holds a bachelors’ degree in commerce from the University of Bombay and Cost and Works Accountants degree, and a post-graduate diploma in management from Indian Institute of Management, Ahmedabad.
Prior to Gateway Partners, he had over 28 years’ of experience in the banking sector with Standard Chartered Bank and Bank of America. Currently, he is a partner at Gateway Partners, and a member of the Securities Industry Council of Singapore.
Tarun Khanna Non-executive Nominee Director
Member of Board since February 14, 2020
He holds a bachelor’s degree in science from the University of Maryland and a master’s degree in business administration from the University of Baltimore.
He is currently a partner of CX Advisors LLP.
Nem Chand Jain Independent Director 36 years of experience in the banking sector; Member of Board since April 1, 2016
He holds a bachelor’s degree in science and master’s degree in science from Panjab University, Chandigarh.
He is a certified associate of the Indian Institute of Bankers.
Rajiv Dewan Independent Director 25 years of experience as a chartered accountant; Member of Board since July 10, 2018
He is a fellow member of the Institute of Chartered Accountants of India and is a practicing Chartered Accountant.
He is currently a partner in R. Dewan & Co., Chartered Accountants, Ludhiana. In the past, he has also served as a director in various companies including JSW Vallabh Tinplate Private Limited, Punjab Communications Limited, Trident Aerospace Limited, Trinetra Technologies Limited, Trident Powercom Limited, Trident Brokers Limited, Trident Research Limited and Trident Brands Limited.
Pooja Luthra Independent Director 17 years of experience as a Consulting Specialist; Member of Board since September 19, 2020
She holds a bachelor’s degree in Commerce from Jesus & Mary College, Delhi University, a master’s degree in Arts - Industrial / Organizational Psychology from Chicago School of Professional Psychology and a post-graduation diploma in Business Administration – Global Business Operations from Shri Ram College of Commerce, Delhi University.
Source: Company data, I-Sec research

Mrs. Bectors Food Specialities, January 31, 2021 ICICI Securities
28
Table 12: Management profile
Name Designation Experience Comments
Manoj Verma National Sales Director (Domestic sales)
26 years of experience in sales and marketing
He holds a bachelor’s degree in arts from Agra University and a diploma in marketing management from the National Institute of Sales in New Delhi.
He has previously worked with Colgate Palmolive (India) Limited, Aditya Birla Retail Limited and Mondelez India Foods Private Limited (erstwhile Cadbury India Limited) while holding various positions.
Neeraj Aggarwal Vice President (Biscuits and Projects operations)
He holds a bachelor’s degree in electrical engineering from Thapar Institute of Engineering and Technology in Patiala, Punjab.
He has previously worked with Britannia Industries Limited as unit head.
Romel Kumar National Sales Manager
15 years of experience in the FMCG sector
He holds a bachelor’s degree in arts from Magadh University and a post graduate degree in business management from Birla Institute of Management Technology, New Delhi.
He has previously worked with Pepsico India and UNIBIC Foods.
Rajeev Dubey Director-Bread sales 26 years of experience in sales
He holds a bachelor’s degree in Commerce from University of Delhi.
He has previously worked with Ready Roti India Pvt Limited (Harvest Gold) as general manager (sales and marketing).
Asim Bhaumik Group Head of Quality, Technical, Research and Development
23 years of experience in production and operations
He holds a bachelor’s degree in science (chemistry) from the University of Calcutta and a master’s degree in chemistry from University of Calcutta.
He has previously worked with Dabur India Limited as an additional general manager (operations) and Britannia Industries Limited as unit head.
Shantilal Sukalal Chaudhari
General Manager -Operations
24 years of experience in production
He holds a degree of master of science in food technology from Central Food Technological Research Institute in Mysore.
He has previously worked with Al Rashed Food Limited as production-manager, Mini Bakeries (Nairobi) Limited as operations manager.
Gurpreet Singh Amrit
Chief Marketing Officer
19 years of experience in the consumer goods industry
He holds a post graduate diploma in management from Symbiosis, Pune.
He has previously worked with Dabur India Limited, Wrigley India (P) Limited, Bajaj Corp Limited, and Emami Limited.
Deep M.S Bajaj Group Senior Corporate Chef
14 years of experience in the hotel industry.
He has completed a three year diploma course in hotel management and catering technology and a diploma in a two year kitchen management programme from the Oberoi Centre of Learning and Development.
He has previously worked with Kilimanjaro Hotel, Kempinski, Djibouti Palace Kempinski, Oberoi Group of Hotels & Resorts, Trident Hotel and The Ritz Carlton Hotel Company.
Deepak Kumar Jain
Head of Finance and Corporate Strategy
10 years in finance and business planning
He is a qualified chartered accountant from the Institute of Chartered Accountants of India and Company Secretary from the Indian Institute of Company Secretaries of India. He holds a bachelor’s degree of commerce from the Maharshi Dayanand Saraswati University of Ajmer.
He has previously worked with Parag Milk Foods Limited, JSW Steel Limited and ICICI Prudential Life Insurance Limited.
Suvir Bector Vice president - Exports
He has graduated with bachelor’s degree in arts with honours in management with marketing from University of Exeter and has a master’s in global supply chain management from Cass Business School, City University in London.
Neha Bector Assistant General Manager
8 years of experience in management
She holds a bachelor’s degree in commerce from Lady Shri Ram College of Women, University of Delhi and a master of science in finance with a specialism in corporate finance from Cass Business School, City University in London.
She has previously worked with Lotus Integrated Texpark Limited as the chief executive officer and Trident Limited as a front line entrepreneur in the corporate division.
Mayank Arora Vice President (Human resources)
10 years of experience in human resources
He holds a bachelor’s degree in law from Bharati Vidyapeeth in Pune, a degree in MBA-LLM from the National Law University in Jodhpur and also a master’s degree in business laws from National Law School of India University in Bengaluru.
He has previously worked with Cargill India Private Limited as head- sales HR.
Atul Sud Company Secretary He holds a bachelor’s degree in arts from Kurukshetra University. He also completed a bachelor’s degree in law from Kurukshetra University in 2008 and a post graduate diploma in business administration from Symbiosis Centre for Distance Learning in 2011.
He has previously worked with Nahar Poly Films Limited as a company secretary July 2011 until August 12, 2016.
Source: Company data, I-Sec research
Mrs. Bectors Food Specialities, January 31, 2021 ICICI Securities
29
Shareholding pattern
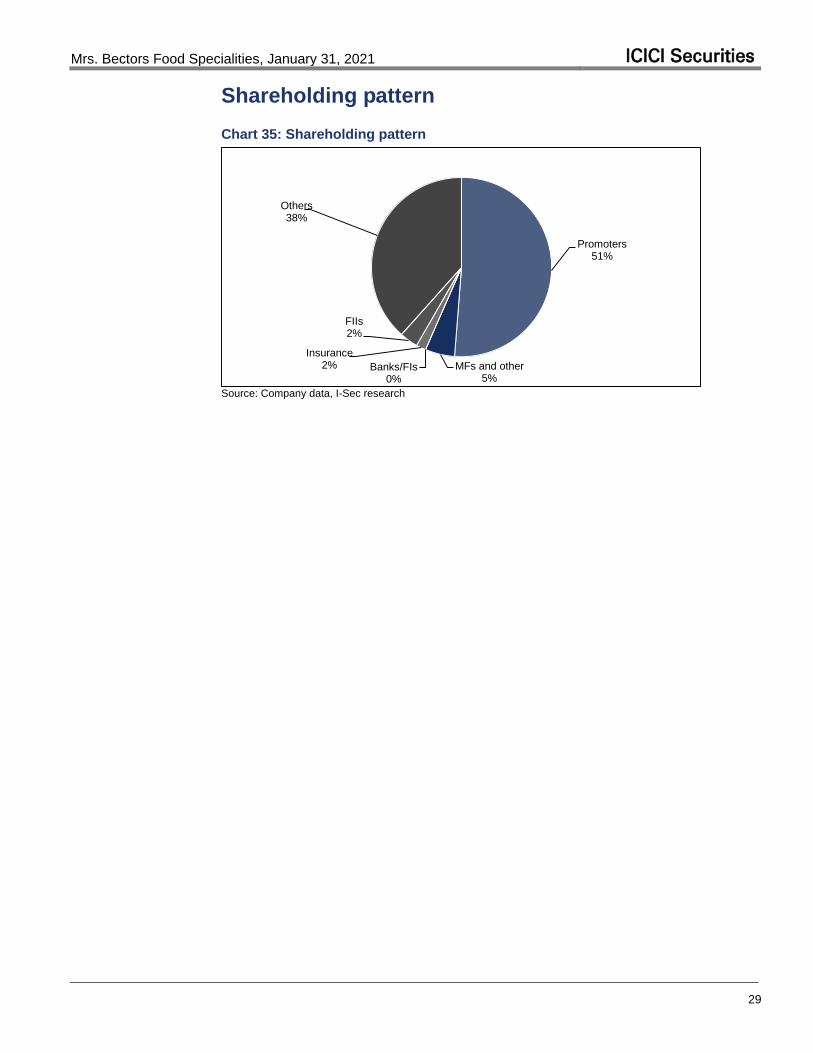
Chart 35: Shareholding pattern
Promoters51%
MFs and other5%
Banks/FIs0%
Insurance2%
FIIs2%
Others38%
Source: Company data, I-Sec research

Mrs. Bectors Food Specialities, January 31, 2021 ICICI Securities
30
Financials
Table 13: Profit and loss statement
(Rs mn, year ending Mar 31)
FY18 FY19 FY20 FY21E FY22E FY23E
Net Revenue 6,906 7,837 7,621 8,655 10,492 12,209
Less:
Cost of goods sold 3,828 4,240 4,075 4,622 5,497 6,417 Employee cost 913 1,097 1,179 1,278 1,544 1,791 Other expenses 1,311 1,538 1,440 1,407 1,907 2,211
Total operating expenses 6,051 6,876 6,693 7,307 8,948 10,419
EBITDA 855 961 928 1,347 1,544 1,790
Less: D&A 283 352 415 442 575 628
EBIT 571 609 513 905 970 1,162
Less: Gross Interest 61 127 150 118 96 51 Add: Other Income 18 24 29 61 83 51
Recurring PBT 528 506 391 849 957 1,162
Less: Taxes 169 175 88 214 241 292 Less: Minority Interest 0 1 0 - - -
Net Income (Reported) 359 331 304 635 716 869
Extraordinary items - - - - - -
Recurring Net Income 359 331 304 635 716 869
Source: Company data, I-Sec research
Mrs. Bectors Food Specialities, January 31, 2021 ICICI Securities
31
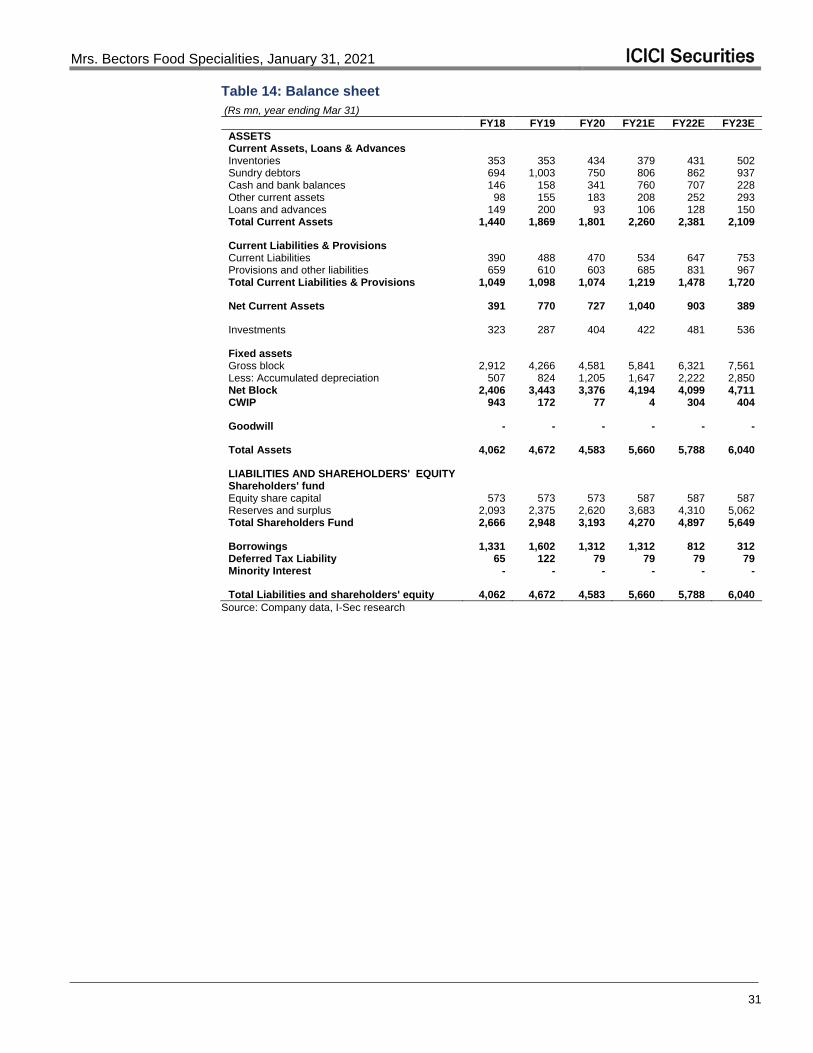
Table 14: Balance sheet
(Rs mn, year ending Mar 31)
FY18 FY19 FY20 FY21E FY22E FY23E
ASSETS Current Assets, Loans & Advances Inventories 353 353 434 379 431 502
Sundry debtors 694 1,003 750 806 862 937 Cash and bank balances 146 158 341 760 707 228 Other current assets 98 155 183 208 252 293 Loans and advances 149 200 93 106 128 150 Total Current Assets 1,440 1,869 1,801 2,260 2,381 2,109
Current Liabilities & Provisions Current Liabilities 390 488 470 534 647 753
Provisions and other liabilities 659 610 603 685 831 967 Total Current Liabilities & Provisions 1,049 1,098 1,074 1,219 1,478 1,720
Net Current Assets 391 770 727 1,040 903 389
Investments 323 287 404 422 481 536
Fixed assets Gross block 2,912 4,266 4,581 5,841 6,321 7,561
Less: Accumulated depreciation 507 824 1,205 1,647 2,222 2,850 Net Block 2,406 3,443 3,376 4,194 4,099 4,711 CWIP 943 172 77 4 304 404
Goodwill - - - - - -
Total Assets 4,062 4,672 4,583 5,660 5,788 6,040
LIABILITIES AND SHAREHOLDERS' EQUITY Shareholders' fund Equity share capital 573 573 573 587 587 587
Reserves and surplus 2,093 2,375 2,620 3,683 4,310 5,062 Total Shareholders Fund 2,666 2,948 3,193 4,270 4,897 5,649
Borrowings 1,331 1,602 1,312 1,312 812 312 Deferred Tax Liability 65 122 79 79 79 79 Minority Interest - - - - - -
Total Liabilities and shareholders' equity 4,062 4,672 4,583 5,660 5,788 6,040
Source: Company data, I-Sec research
Mrs. Bectors Food Specialities, January 31, 2021 ICICI Securities
32
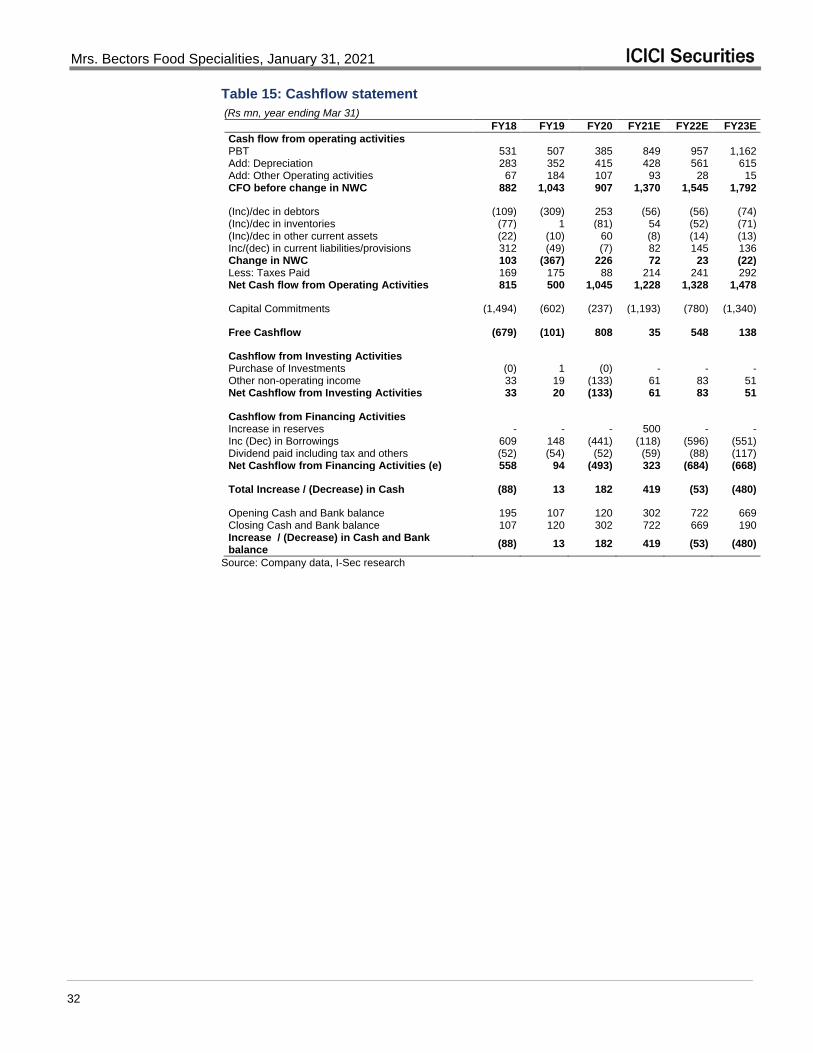
Table 15: Cashflow statement
(Rs mn, year ending Mar 31)
FY18 FY19 FY20 FY21E FY22E FY23E
Cash flow from operating activities
PBT 531 507 385 849 957 1,162 Add: Depreciation 283 352 415 428 561 615 Add: Other Operating activities 67 184 107 93 28 15 CFO before change in NWC 882 1,043 907 1,370 1,545 1,792
(Inc)/dec in debtors (109) (309) 253 (56) (56) (74) (Inc)/dec in inventories (77) 1 (81) 54 (52) (71) (Inc)/dec in other current assets (22) (10) 60 (8) (14) (13) Inc/(dec) in current liabilities/provisions 312 (49) (7) 82 145 136 Change in NWC 103 (367) 226 72 23 (22) Less: Taxes Paid 169 175 88 214 241 292 Net Cash flow from Operating Activities 815 500 1,045 1,228 1,328 1,478
Capital Commitments (1,494) (602) (237) (1,193) (780) (1,340)
Free Cashflow (679) (101) 808 35 548 138
Cashflow from Investing Activities
Purchase of Investments (0) 1 (0) - - - Other non-operating income 33 19 (133) 61 83 51 Net Cashflow from Investing Activities 33 20 (133) 61 83 51
Cashflow from Financing Activities
Increase in reserves - - - 500 - - Inc (Dec) in Borrowings 609 148 (441) (118) (596) (551) Dividend paid including tax and others (52) (54) (52) (59) (88) (117) Net Cashflow from Financing Activities (e) 558 94 (493) 323 (684) (668)
Total Increase / (Decrease) in Cash (88) 13 182 419 (53) (480)
Opening Cash and Bank balance 195 107 120 302 722 669 Closing Cash and Bank balance 107 120 302 722 669 190 Increase / (Decrease) in Cash and Bank balance
(88) 13 182 419 (53) (480)
Source: Company data, I-Sec research
Mrs. Bectors Food Specialities, January 31, 2021 ICICI Securities
33
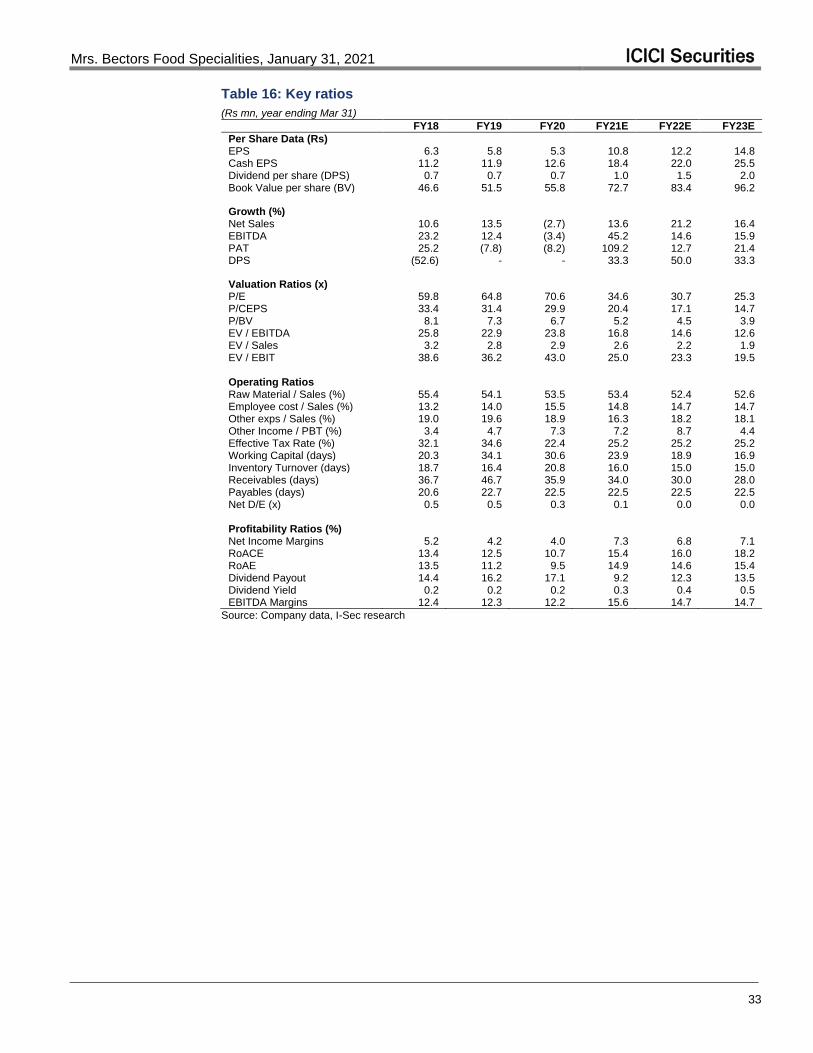
Table 16: Key ratios
(Rs mn, year ending Mar 31)
FY18 FY19 FY20 FY21E FY22E FY23E
Per Share Data (Rs)
EPS 6.3 5.8 5.3 10.8 12.2 14.8 Cash EPS 11.2 11.9 12.6 18.4 22.0 25.5 Dividend per share (DPS) 0.7 0.7 0.7 1.0 1.5 2.0 Book Value per share (BV) 46.6 51.5 55.8 72.7 83.4 96.2
Growth (%)
Net Sales 10.6 13.5 (2.7) 13.6 21.2 16.4 EBITDA 23.2 12.4 (3.4) 45.2 14.6 15.9 PAT 25.2 (7.8) (8.2) 109.2 12.7 21.4 DPS (52.6) - - 33.3 50.0 33.3
Valuation Ratios (x)
P/E 59.8 64.8 70.6 34.6 30.7 25.3 P/CEPS 33.4 31.4 29.9 20.4 17.1 14.7 P/BV 8.1 7.3 6.7 5.2 4.5 3.9 EV / EBITDA 25.8 22.9 23.8 16.8 14.6 12.6 EV / Sales 3.2 2.8 2.9 2.6 2.2 1.9 EV / EBIT 38.6 36.2 43.0 25.0 23.3 19.5
Operating Ratios
Raw Material / Sales (%) 55.4 54.1 53.5 53.4 52.4 52.6 Employee cost / Sales (%) 13.2 14.0 15.5 14.8 14.7 14.7 Other exps / Sales (%) 19.0 19.6 18.9 16.3 18.2 18.1 Other Income / PBT (%) 3.4 4.7 7.3 7.2 8.7 4.4 Effective Tax Rate (%) 32.1 34.6 22.4 25.2 25.2 25.2 Working Capital (days) 20.3 34.1 30.6 23.9 18.9 16.9 Inventory Turnover (days) 18.7 16.4 20.8 16.0 15.0 15.0 Receivables (days) 36.7 46.7 35.9 34.0 30.0 28.0 Payables (days) 20.6 22.7 22.5 22.5 22.5 22.5 Net D/E (x) 0.5 0.5 0.3 0.1 0.0 0.0
Profitability Ratios (%)
Net Income Margins 5.2 4.2 4.0 7.3 6.8 7.1 RoACE 13.4 12.5 10.7 15.4 16.0 18.2 RoAE 13.5 11.2 9.5 14.9 14.6 15.4 Dividend Payout 14.4 16.2 17.1 9.2 12.3 13.5 Dividend Yield 0.2 0.2 0.2 0.3 0.4 0.5 EBITDA Margins 12.4 12.3 12.2 15.6 14.7 14.7
Source: Company data, I-Sec research
Mrs. Bectors Food Specialities, January 31, 2021 ICICI Securities
34
Price charts
Akzo Nobel Asian Paints Avenue Supermarts Bajaj Consumer Bata India
1,300
1,500
1,700
1,900
2,100
2,300
2,500
2,700
Jan
-18
Jul-1
8
Jan
-19
Jul-1
9
Jan
-20
Jul-2
0
Jan
-21
(Rs)
600
1,100
1,600
2,100
2,600
3,100
Jan
-18
Jul-1
8
Jan
-19
Jul-1
9
Jan
-20
Jul-2
0
Jan
-21
(Rs)
400
800
1,200
1,600
2,000
2,400
2,800
3,200
Jan
-18
Ju
l-1
8
Jan
-19
Ju
l-1
9
Jan
-20
Ju
l-2
0
Jan
-21
(Rs)
100
175
250
325
400
475
550
Jan
-18
Jul-1
8
Jan
-19
Jul-1
9
Jan
-20
Jul-2
0
Jan
-21
(Rs)
0
500
1,000
1,500
2,000
Jan
-18
Ju
l-1
8
Jan
-19
Ju
l-1
9
Jan
-20
Ju
l-2
0
Jan
-21
(Rs)
Berger Paints Britannia Colgate Dabur Emami
100
200
300
400
500
600
700
800
900
Jan
-18
Jul-1
8
Jan
-19
Jul-1
9
Jan
-20
Jul-2
0
Jan
-21
(Rs)
1,000
1,500
2,000
2,500
3,000
3,500
4,000
4,500
Jan
-18
Ju
l-1
8
Jan
-19
Ju
l-1
9
Jan
-20
Ju
l-2
0
Jan
-21
(Rs)
600
800
1,000
1,200
1,400
1,600
1,800
Jan
-18
Ju
l-1
8
Jan
-19
Ju
l-1
9
Jan
-20
Ju
l-2
0
Jan
-21
(Rs)
200
250
300
350
400
450
500
550
600
Jan
-18
Jul-1
8
Jan
-19
Jul-1
9
Jan
-20
Jul-2
0
Jan
-21
(Rs)
0
100
200
300
400
500
600
700
Jan
-18
Ju
l-1
8
Jan
-19
Ju
l-1
9
Jan
-20
Ju
l-2
0
Jan
-21
(Rs)
GCPL HUL ITC Jubilant Foodworks Jyothy Labs
320
420
520
620
720
820
920
1,020
Ja
n-1
8
Jul-1
8
Ja
n-1
9
Jul-1
9
Ja
n-2
0
Jul-2
0
Ja
n-2
1
(Rs)
800
1100
1400
1700
2000
2300
2600
Ja
n-1
8
Ju
l-18
Ja
n-1
9
Ju
l-19
Ja
n-2
0
Ju
l-20
Ja
n-2
1
(Rs)
125
175
225
275
325
375
Jan
-18
Jul-1
8
Jan
-19
Jul-1
9
Jan
-20
Jul-2
0
Jan
-21
(Rs)
200
700
1,200
1,700
2,200
2,700
3,200
Jan
-18
Jul-1
8
Jan
-19
Jul-1
9
Jan
-20
Jul-2
0
Jan
-21
(Rs)
0
50
100
150
200
250
300
Jan
-18
Ju
l-1
8
Jan
-19
Ju
l-1
9
Jan
-20
Ju
l-2
0
Jan
-21
(Rs)
Kansai Nerolac Marico Nestle Page Industries Sheela Foam
250300350400450500550600650700
Jan
-18
Ju
l-1
8
Jan
-19
Ju
l-1
9
Jan
-20
Ju
l-2
0
Jan
-21
(Rs)
200
250
300
350
400
450
Ja
n-1
8
Jul-1
8
Ja
n-1
9
Jul-1
9
Ja
n-2
0
Jul-2
0
Ja
n-2
1
(Rs)
4,0006,0008,000
10,00012,00014,00016,00018,00020,000
Jan
-18
Jul-1
8
Jan
-19
Jul-1
9
Jan
-20
Jul-2
0
Jan
-21
(Rs)
12,000
17,000
22,000
27,000
32,000
37,000
42,000
Jan
-18
Jul-1
8
Jan
-19
Jul-1
9
Jan
-20
Jul-2
0
Jan
-21
(Rs)
800
1,000
1,200
1,400
1,600
1,800
2,000
2,200
Jan
-18
Jul-1
8
Jan
-19
Jul-1
9
Jan
-20
Jul-2
0
Jan
-21
(Rs)
Tata Consumer Titan United Spirits Varun Beverages Westlife Development
0
100
200
300
400
500
600
700
Jan
-18
Jul-1
8
Jan
-19
Jul-1
9
Jan
-20
Jul-2
0
Jan
-21
(Rs)
350
550
750
950
1,150
1,350
1,550
1,750
Jan
-18
Jul-1
8
Jan
-19
Jul-1
9
Jan
-20
Jul-2
0
Jan
-21
(Rs)
200
400
600
800
Jan
-18
Ju
l-1
8
Jan
-19
Ju
l-1
9
Jan
-20
Ju
l-2
0
Jan
-21
(Rs)
0
200
400
600
800
1,000
1,200
Jan
-18
Ju
l-1
8
Jan
-19
Ju
l-1
9
Jan
-20
Ju
l-2
0
Jan
-21
(Rs)
100
200
300
400
500
600
Jan
-18
Ju
l-1
8
Jan
-19
Ju
l-1
9
Jan
-20
Ju
l-2
0
Jan
-21
(Rs)
Zydus Wellness
500
1,000
1,500
2,000
2,500
Jan
-18
Ju
l-1
8
Jan
-19
Ju
l-1
9
Jan
-20
Ju
l-2
0
Jan
-21
(Rs)
Source: Bloomberg
Mrs. Bectors Food Specialities, January 31, 2021 ICICI Securities
35
Index of tables and charts
Tables
Table 1: Market Share of Mid-Premium and Premium Biscuit categories ............................ 4 Table 2: DCF calculations ................................................................................................... 15 Table 3: Assumptions ......................................................................................................... 16 Table 4: Valuation summary ............................................................................................... 17 Table 5: Performance of product segments ........................................................................ 19 Table 6: Company timeline ................................................................................................. 21 Table 7: Global Biscuits Export Market ............................................................................... 25 Table 8: India’s biscuits export market ............................................................................... 25 Table 9: Food Services Market Structure ........................................................................... 26 Table 10: Key National players driving QSR market growth .............................................. 26 Table 11: Board of Directors ............................................................................................... 27 Table 12: Management profile ............................................................................................ 28 Table 13: Profit and loss statement .................................................................................... 30 Table 14: Balance sheet ..................................................................................................... 31 Table 15: Cashflow statement ............................................................................................ 32 Table 16: Key ratios ............................................................................................................ 33
Charts
Chart 1: North Indian Mid-Premium and Premium Biscuit Market ........................................ 3 Chart 2: Market Share of Mid-Premium and Premium Biscuit categories ............................ 3 Chart 3: Revenue and growth rates – Domestic Biscuits ..................................................... 5 Chart 4: Volume and growth rates – Domestic Biscuits ....................................................... 5 Chart 5: Branded bread market share city wise .................................................................... 6 Chart 6: Revenue and growth rates – Branded Breads ........................................................ 6 Chart 7: Volume and growth rates – Branded Breads .......................................................... 6 Chart 8: Market size of branded mid-premium and premium biscuit market ........................ 7 Chart 9: Realisation and growth rates – Biscuits .................................................................. 8 Chart 10: Realisation and growth rates – Branded Breads .................................................. 8 Chart 11: We estimate 17% revenue CAGR over FY20-23E ............................................. 11 Chart 12: EBITDA margin to expand 250bps over FY20-23E ............................................ 12 Chart 13: Gross margin ....................................................................................................... 12 Chart 14: Staff costs (as a % of sales) ............................................................................... 12 Chart 15: Other opex (as a % of sales) .............................................................................. 12 Chart 16: Net profit to grow at 42% CAGR over FY20-23E ................................................ 13 Chart 17: Return ratios ........................................................................................................ 13 Chart 18: OCF and FCF generation ................................................................................... 14 Chart 19: OCF/ EBITDA and FCF/EBITDA ........................................................................ 14 Chart 20: Biscuits ................................................................................................................ 19 Chart 21: Bakery Products .................................................................................................. 20 Chart 22: Location of manufacturing ................................................................................... 20 Chart 23: Domestic distribution network ............................................................................. 21 Chart 24: Regional contribution to exports – FY18 ............................................................. 21 Chart 25: Regional contribution to exports – FY20 ............................................................. 21 Chart 26: Segment-wise revenue contribution (FY20) ....................................................... 22 Chart 27: Market size of branded mid-premium and premium biscuit market .................... 22 Chart 28: Market price (Rs per Kg) of Biscuit brands in cookies category (FY18) ............. 24 Chart 29: Market price (Rs per Kg) of Biscuit brands in Cream category (FY20) .............. 24 Chart 30: Market price (Rs per Kg) of biscuit brands in Marie category (FY20) ................. 24 Chart 31: Market price (Rs per Kg) of Biscuit brands in Cracker- Salty category (FY20) .. 24 Chart 32: Market price (Rs per Kg) of Biscuit brands in Cracker (Non-Salty) category
(FY20) ........................................................................................................................... 24 Chart 33: Market price (Rs per Kg) of Biscuit brands in Digestives category (FY20) ......... 24 Chart 34: Bread Industry growth by value .......................................................................... 25 Chart 35: Shareholding pattern ........................................................................................... 29
Mrs. Bectors Food Specialities, January 31, 2021 ICICI Securities
36
his report may be distributed in Singapore by ICICI Securities, Inc. (Singapore branch). Any recipients of this report in Singapore should contact ICICI Securities,
Inc. (Singapore branch) in respect of any matters arising from, or in connection with, this report. The contact details of ICICI Securities, Inc. (Singapore branch) are
as follows: Address: 10 Collyer Quay, #40-92 Ocean Financial Tower, Singapore - 049315, Tel: +65 6232 2451 and email: [email protected],
"In case of eligible investors based in Japan, charges for brokerage services on execution of transactions do not in substance constitute charge for research reports
and no charges are levied for providing research reports to such investors."
New I-Sec investment ratings (all ratings based on absolute return; All ratings and target price refers to 12-month performance horizon, unless mentioned otherwise)
BUY: >15% return; ADD: 5% to 15% return; HOLD: Negative 5% to Positive 5% return; REDUCE: Negative 5% to Negative 15% return; SELL: < negative 15% return
ANALYST CERTIFICATION I/We, Manoj Menon, MBA, CMA; Vismaya Agarwal, CFA, BTech, PGDM; Karan Bhuwania, MBA; authors and the names subscribed to this report, hereby certify that all of the views expressed in this research report accurately reflect our views about the subject issuer(s) or securities. We also certify that no part of our compensation was, is, or will be directly or indirectly related to the specific recommendation(s) or view(s) in this report. Analysts are not registered as research analysts by FINRA and are not associated persons of the ICICI Securities Inc. It is also confirmed that above mentioned Analysts of this report have not received any compensation from the companies mentioned in the report in the preceding twelve months and do not serve as an officer, director or employee of the companies mentioned in the report. Terms & conditions and other disclosures: ICICI Securities Limited (ICICI Securities) is a full-service, integrated investment banking and is, inter alia, engaged in the business of stock brokering and distribution of financial products. ICICI Securities is Sebi registered stock broker, merchant banker, investment adviser, portfolio manager and Research Analyst. ICICI Securities is registered with Insurance Regulatory Development Authority of India Limited (IRDAI) as a composite corporate agent and with PFRDA as a Point of Presence. ICICI Securities Limited Research Analyst SEBI Registration Number – INH000000990. ICICI Securities Limited SEBI Registration is INZ000183631 for stock broker. ICICI Securities is a subsidiary of ICICI Bank which is India’s largest private sector bank and has its various subsidiaries engaged in businesses of housing finance, asset management, life insurance, general insurance, venture capital fund management, etc. (“associates”), the details in respect of which are available on www.icicibank.com. ICICI Securities is one of the leading merchant bankers/ underwriters of securities and participate in virtually all securities trading markets in India. We and our associates might have investment banking and other business relationship with a significant percentage of companies covered by our Investment Research Department. ICICI Securities and its analysts, persons reporting to analysts and their relatives are generally prohibited from maintaining a financial interest in the securities or derivatives of any companies that the analysts cover. Recommendation in reports based on technical and derivative analysis centre on studying charts of a stock's price movement, outstanding positions, trading volume etc as opposed to focusing on a company's fundamentals and, as such, may not match with the recommendation in fundamental reports. Investors may visit icicidirect.com to view the Fundamental and Technical Research Reports. Our proprietary trading and investment businesses may make investment decisions that are inconsistent with the recommendations expressed herein. ICICI Securities Limited has two independent equity research groups: Institutional Research and Retail Research. This report has been prepared by the Institutional Research. The views and opinions expressed in this document may or may not match or may be contrary with the views, estimates, rating, and target price of the Retail Research. The information and opinions in this report have been prepared by ICICI Securities and are subject to change without any notice. The report and information contained herein is strictly confidential and meant solely for the selected recipient and may not be altered in any way, transmitted to, copied or distributed, in part or in whole, to any other person or to the media or reproduced in any form, without prior written consent of ICICI Securities. While we would endeavour to update the information herein on a reasonable basis, ICICI Securities is under no obligation to update or keep the information current. Also, there may be regulatory, compliance or other reasons that may prevent ICICI Securities from doing so. Non-rated securities indicate that rating on a particular security has been suspended temporarily and such suspension is in compliance with applicable regulations and/or ICICI Securities policies, in circumstances where ICICI Securities might be acting in an advisory capacity to this company, or in certain other circumstances. This report is based on information obtained from public sources and sources believed to be reliable, but no independent verification has been made nor is its accuracy or completeness guaranteed. This report and information herein is solely for informational purpose and shall not be used or considered as an offer document or solicitation of offer to buy or sell or subscribe for securities or other financial instruments. Though disseminated to all the customers simultaneously, not all customers may receive this report at the same time. ICICI Securities will not treat recipients as customers by virtue of their receiving this report. Nothing in this report constitutes investment, legal, accounting and tax advice or a representation that any investment or strategy is suitable or appropriate to your specific circumstances. The securities discussed and opinions expressed in this report may not be suitable for all investors, who must make their own investment decisions, based on their own investment objectives, financial positions and needs of specific recipient. This may not be taken in substitution for the exercise of independent judgment by any recipient. The recipient should independently evaluate the investment risks. The value and return on investment may vary because of changes in interest rates, foreign exchange rates or any other reason. ICICI Securities accepts no liabilities whatsoever for any loss or damage of any kind arising out of the use of this report. Past performance is not necessarily a guide to future performance. Investors are advised to see Risk Disclosure Document to understand the risks associated before investing in the securities markets. Actual results may differ materially from those set forth in projections. Forward-looking statements are not predictions and may be subject to change without notice. ICICI Securities or its associates might have managed or co-managed public offering of securities for the subject company or might have been mandated by the subject company for any other assignment in the past twelve months. ICICI Securities or its associates might have received any compensation from the companies mentioned in the report during the period preceding twelve months from the date of this report for services in respect of managing or co-managing public offerings, corporate finance, investment banking or merchant banking, brokerage services or other advisory service in a merger or specific transaction. ICICI Securities or its associates might have received any compensation for products or services other than investment banking or merchant banking or brokerage services from the companies mentioned in the report in the past twelve months. ICICI Securities encourages independence in research report preparation and strives to minimize conflict in preparation of research report. ICICI Securities or its associates or its analysts did not receive any compensation or other benefits from the companies mentioned in the report or third party in connection with preparation of the research report. Accordingly, neither ICICI Securities nor Research Analysts and their relatives have any material conflict of interest at the time of publication of this report. Compensation of our Research Analysts is not based on any specific merchant banking, investment banking or brokerage service transactions. ICICI Securities or its subsidiaries collectively or Research Analysts or their relatives do not own 1% or more of the equity securities of the Company mentioned in the report as of the last day of the month preceding the publication of the research report. Since associates of ICICI Securities and ICICI Securities as a entity are engaged in various financial service businesses, they might have financial interests or beneficial ownership in various companies including the subject company/companies mentioned in this report. ICICI Securities may have issued other reports that are inconsistent with and reach different conclusion from the information presented in this report. Neither the Research Analysts nor ICICI Securities have been engaged in market making activity for the companies mentioned in the report. We submit that no material disciplinary action has been taken on ICICI Securities by any Regulatory Authority impacting Equity Research Analysis activities. This report is not directed or intended for distribution to, or use by, any person or entity who is a citizen or resident of or located in any locality, state, country or other jurisdiction, where such distribution, publication, availability or use would be contrary to law, regulation or which would subject ICICI Securities and affiliates to any registration or licensing requirement within such jurisdiction. The securities described herein may or may not be eligible for sale in all jurisdictions or to certain category of investors. Persons in whose possession this document may come are required to inform themselves of and to observe such restriction. This report has not been prepared by ICICI Securities, Inc. However, ICICI Securities, Inc. has reviewed the report and, in so far as it includes current or historical information, it is believed to be reliable, although its accuracy and completeness cannot be guaranteed.