lesson 4.3 - Math with Mrs. Boles
6
128 Lesson 4.3 ~ Dot Plots A dot plot is a useful way to visually display the spread of data. It consists of a number line with dots equally spaced above each value. e number of dots represents the number of times each value is in the data set. In the dot plot below there are three dots above the number 6. is means there are three people that have six fish. Clusters and gaps in the data are easy to see in a dot plot. 3 4 5 6 7 8 9 10 Number of Fish in Students’ Aquariums e dot plot below shows the number of siblings for each student in Darla’s class. Use the plot to answer the questions below. Number of Siblings 0 2 3 4 5 6 7 8 9 10 1 a. How many students are in Darla’s class? b. What is the mode of the number of siblings? c. How many students have either 0 siblings or 1 sibling? d. What percent of students have 3 or more siblings? a. Count the number of dots in the dot plot. ere are 25 students in Darla’s class. b. Look for the largest stack of dots in the dot plot. ere are ten people with 1 sibling. One sibling is the mode of the data set. c. Count the number of dots above the 0 and 1. ere are 15 students with either 1 sibling or no siblings. d. ere are 5 (2 + 1 + 1 + 1) students with 3 or more siblings and 25 total students in the class. 5 __ 25 = 5 ÷ 25 = 0.2 → 0.2 ∙ 100 = 20% 20% of students have 3 or more siblings. EXAMPLE 1 solutions DOT PLOTS LESSON 4.3
-
Upload
khangminh22 -
Category
Documents
-
view
1 -
download
0
Transcript of lesson 4.3 - Math with Mrs. Boles

128 Lesson 4.3 ~ Dot Plots
A dot plot is a useful way to visually display the spread of data. It consists of a number line with dots equally spaced above each value. The number of dots represents the number of times each value is in the data set. In the dot plot below there are three dots above the number 6. This means there are three people that have six fish. Clusters and gaps in the data are easy to see in a dot plot.
3 4 5 6 7 8 9 10
Number of Fish in Students’ Aquariums
The dot plot below shows the number of siblings for each student in darla’s class. use the plot to answer the questions below.
number of siblings
0 2 3 4 5 6 7 8 9 101
a. how many students are in darla’s class?b. what is the mode of the number of siblings?c. how many students have either 0 siblings or 1 sibling?d. what percent of students have 3 or more siblings?
a. Count the number of dots in the dot plot. There are 25 students in Darla’s class.b. Look for the largest stack of dots in the dot plot. There are ten people with 1 sibling. One sibling is the mode of the data set.c. Count the number of dots above the 0 and 1. There are 15 students with either 1 sibling or no siblings. d. There are 5 (2 + 1 + 1 + 1) students with 3 or more siblings and 25 total students in the class.
5 __ 25
= 5 ÷ 25 = 0.2 → 0.2 ∙ 100 = 20% 20% of students have 3 or more siblings.
ExamplE 1
solutions
doT ploTs
lesson 4.3

Lesson 4.3 ~ Dot Plots 129
step 1: Find your height to the nearest inch and record your answer using only inches. If you are 5 feet 2 inches tall, for example, you would use the process below to convert your measurement to inches: 5 feet ∙ 12 inches per foot = 60 inches Add the 2 extra inches (60 + 2) 5’ 2” = 62 inches tall
step 2: Record the height data for all the students in your class, including your own.
step 3: What are the minimum (lowest) and maximum (highest) values in the height data? What is the range of the data?
step 4: Make a number line that extends from the minimum to the maximum value in step 3. Evenly space “tick marks” along the number line for each of the values between the minimum and maximum.
step 5: Using your data set from step 2, put a dot above the number line for each data value. If a data value occurs more than once, stack the dots as shown in example 1. step 6: Describe the spread of your data. Are your values clustered together or are they spread out?
step 7: Based on your dot plot, what is the mode of the data? How can you tell by looking at your dot plot?
step 8: What is the median of your data set? How does the median compare with the mode?
Michelle made three dot plots to show the answers to her statistical question. Which dot plot is drawn correctly?
Number of Bicycles at Home
1 2 3 4 50
Number of Bicycles at Home
4 51 2 30
Number of Bicycles at Home
1 2 3 4 50
The first dot plot looks as if there are as many people with 2 bicycles as those with 0 bicycles. This is because the dots are not equally spaced above the number line. The second dot plot does not have the values equally spaced along the number line. The third dot plot is drawn correctly.
ExplorE! how Tall?

130 Lesson 4.3 ~ Dot Plots
sydney asked ten of her friends the number of statesthat they have visited. These were their answers: 3, 0, 1, 4, 2, 0, 2, 1, 7, 2
a. make a dot plot of the results.b. what are the mean, median and mode of the data?
a. The minimum value is 0 and the maximum is 7. Create a number line that extends to these values.
0 2 4 6 8
Place dots above each value, stacking dots when a value occurs more than once.
b. To find the mean, divide the sum 3 + 0 + 1 + 4 + 2 + 0 + 2 + 1 + 7 + 2 _________________________ 10 = 22 __ 10 = 2.2 of all answers by the total number of answers. The mean is 2.2. To find the median list the values from 0 0 1 1 2 2 2 3 4 7 least to greatest. Find the average of the 5th and 2 + 2 ____
2 = 2
6th values. The median is 2. The mode is the value which shows up the most often. The mode is 2.
ExErcisEs
1. Make a dot plot to represent each data set: a. 10, 5, 7, 2, 5, 8, 8, 9, 7, 1, 9, 10, 8, 6, 8, 9 b. 62, 66, 68, 76, 68, 70, 68, 80, 68, 70, 66, 64, 68, 66, 70
2. Why is it important to equally space the dots above each value in a dot plot?
3. Taylor recorded the pulse rates (in beats per minute) of 12 of his classmates: 69, 92, 64, 78, 80, 82, 86, 93, 75, 66, 74, 71 a. Make a dot plot of the data Taylor collected. b. Do you think a dot plot is a good way to display this data? Explain your reasoning.
4. Explain whether or not each data set below should be displayed in a dot plot. a. The number of cell phones in students’ households. b. The cost of 20 new cars in a car lot. c. The year students in your class were born.
ExamplE 2
solutions
Lesson 4.3 ~ Dot Plots 131
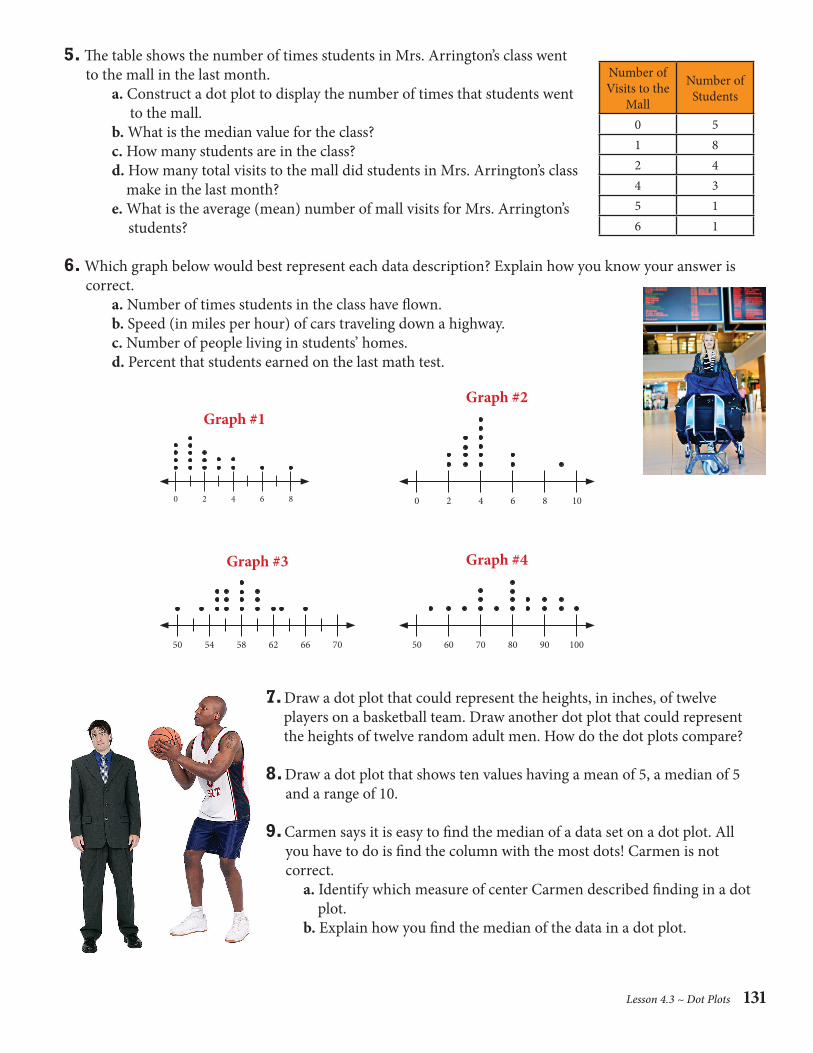
5. The table shows the number of times students in Mrs. Arrington’s class went to the mall in the last month. a. Construct a dot plot to display the number of times that students went to the mall. b. What is the median value for the class? c. How many students are in the class? d. How many total visits to the mall did students in Mrs. Arrington’s class make in the last month? e. What is the average (mean) number of mall visits for Mrs. Arrington’s students?
6. Which graph below would best represent each data description? Explain how you know your answer is correct. a. Number of times students in the class have flown. b. Speed (in miles per hour) of cars traveling down a highway. c. Number of people living in students’ homes. d. Percent that students earned on the last math test.
Graph #1
0 2 4 6 8
Graph #2
0 2 4 6 8 10
Graph #3
50 54 58 62 66 70
Graph #4
50 60 70 80 90 100
7. Draw a dot plot that could represent the heights, in inches, of twelve players on a basketball team. Draw another dot plot that could represent the heights of twelve random adult men. How do the dot plots compare?
8. Draw a dot plot that shows ten values having a mean of 5, a median of 5 and a range of 10.
9. Carmen says it is easy to find the median of a data set on a dot plot. All you have to do is find the column with the most dots! Carmen is not correct. a. Identify which measure of center Carmen described finding in a dot plot. b. Explain how you find the median of the data in a dot plot.
Number of Visits to the
Mall
Number of Students
0 51 82 44 35 16 1

132 Lesson 4.3 ~ Dot Plots
10. The dot plot below shows the length, in inches, of fifteen babies born today at a hospital.
16 18 20 22 24
Length of Baby (inches)
a. What is the range of the data? b. What length appears most often? c. What is the median baby length? d. What is the mean baby length? e. What percent of babies born were at least 20 inches in length?
11. A police officer noted the following about the speed (in miles per hour) of twenty cars on a stretch of road on the interstate. Draw a dot plot that includes each description below.
◆ half of the cars drove at least 65 mph◆ 20% of the cars drove over 70 mph◆ 30% of the cars drove 60 mph or slower◆ the most common speed traveled was 60 mph
12. Cameron surveyed ten of his classmates. He asked them how much pocket change they had and he noted the following characteristics about the data. Draw a dot plot that includes each description at the right.
13. Ask ten people how many siblings they have. Record your data in a dot plot. Find the mean, median, mode and range of your data.
rEviEw
Find the three measures of center. round answers to the nearest tenth, if necessary. 14. 10, 13, 14, 15, 20, 22, 25 15. 20, 18, 32, 43, 20, 7, 28, 32
use the range to find the missing value in each ordered data set.
16. ___, 16, 22, 23, 28, 32, 35 17. 45, 62, 64, 72, 75, 77, ___ Range = 24 Range = 34
◆ the mode and minimum was $0◆ the range was $0.80◆ half the students had $0.15 or less◆ the mean was $0.26

Lesson 4.3 ~ Dot Plots 133
Classify each data set as either categorical or numerical.
18. the time that students wake up in the morning on a school day
19. type of transportation for students to get to school
20. Which statistical question will give more varied answers? Explain your reasoning. A. How many yards can you throw a football? or B. How many feet can you throw a football?
tic-tAc-toe ~ mA k e it com ple te! In lesson 4.2, you learned how to find the measures of center given a data set. In this Tic-Tac-Toe, you will find a data set to go with the given statistical measures.
1. Use the partial data set and the statistics provided to find the remaining data pieces: 25, 33, 20, ____, ____, ____ Mean = 27 Median = 26 Mode = None Range = 14
2. Justin’s teacher gave him the following statistics about his six test scores:Mean = 84 Median = 84 Mode = 86 Range = 26
He recalls that his lowest test score was a 72. What were his six test scores?
Create a data set with five numbers and the following statistics. There are many possible answers.
3. Mean = 8 and Range = 10 4. Mean = 12 and Range = 15
note: exercises 5 and 6 can have multiple answers.5. Jack planted seven seeds for bean plants. He let the plants grow for 2 months and then collected the following statistics about his plants. The mean height of his plants was 11 inches. The median height was 8 inches and the mode was 15 inches. The smallest plant grew to only 2 inches and the range of their heights was 26 inches. Give one possible data set for the heights of Jack’s seven bean plants.
6. Tamara has to monitor the weight of her five turkeys for her 4-H project. The turkeys have a mean weight of 12.5 pounds, a median of 13 pounds and a maximum of 15.2 pounds. The range of their weights is 6.8 pounds. What are the possible weights for her turkeys?
tic-tAc-toe ~ ne w stu de n t Brochu r e
A new student has just joined the class. Make a brochure describing how to find the mean, median and mode of data sets. Include the definitions of each as well as examples showing how to find the values. Use pictures, symbols and markings to illustrate the concepts. Also, include a section on how to find these values from dot plots.
On a separate sheet of paper, create a short quiz (6-10 questions) that the student could take to demonstrate knowledge of these concepts. Create a key for the quiz as well.