Gas Meter Design Guide - Texas Instruments
8
Application Report Gas Meter Design Guide ABSTRACT This document describes a process for designing and testing a gas meter with TI’s ultrasonic solutions. This process comprises transducer selection, iterative tube design and configuration, and calibrated flow testing with sensitivity and power optimizations. Demo source code and schematics are provided to accelerate the development of a variety of ultrasonic applications. The source files can be downloaded from USSSW_Lib_Gas. An overview of MSP430 ™ MCUs and how to enable a variety of end equipment with them can be found at the MSP430™ ultra-low-power sensing & measurement MCUs overview. Table of Contents 1 Introduction............................................................................................................................................................................. 2 1.1 TI's Ultrasonic Sensing Solution.........................................................................................................................................2 2 Design Process....................................................................................................................................................................... 3 2.1 Transducer Selection......................................................................................................................................................... 3 2.2 Flow Tube Design.............................................................................................................................................................. 3 2.3 Optimizing the Number of Pulses and Excitation Frequency............................................................................................. 4 3 Design Metrics and Calibrated Flow Testing........................................................................................................................5 3.1 Repeatability...................................................................................................................................................................... 5 3.2 Accuracy.............................................................................................................................................................................5 3.3 Sensitivity and Power Optimizations.................................................................................................................................. 7 4 OpenSCAD Design Files........................................................................................................................................................ 7 5 References.............................................................................................................................................................................. 7 Trademarks MSP430 ™ is a trademark of Texas Instruments. All trademarks are the property of their respective owners. www.ti.com Table of Contents SLAA974 – OCTOBER 2020 Submit Document Feedback Gas Meter Design Guide 1 Copyright © 2020 Texas Instruments Incorporated
-
Upload
khangminh22 -
Category
Documents
-
view
1 -
download
0
Transcript of Gas Meter Design Guide - Texas Instruments

Application ReportGas Meter Design Guide
ABSTRACT
This document describes a process for designing and testing a gas meter with TI’s ultrasonic solutions. Thisprocess comprises transducer selection, iterative tube design and configuration, and calibrated flow testing withsensitivity and power optimizations.
Demo source code and schematics are provided to accelerate the development of a variety of ultrasonicapplications. The source files can be downloaded from USSSW_Lib_Gas. An overview of MSP430™ MCUs andhow to enable a variety of end equipment with them can be found at the MSP430™ ultra-low-power sensing &measurement MCUs overview.
Table of Contents1 Introduction.............................................................................................................................................................................2
1.1 TI's Ultrasonic Sensing Solution.........................................................................................................................................22 Design Process.......................................................................................................................................................................3
2.1 Transducer Selection......................................................................................................................................................... 32.2 Flow Tube Design.............................................................................................................................................................. 32.3 Optimizing the Number of Pulses and Excitation Frequency............................................................................................. 4
3 Design Metrics and Calibrated Flow Testing........................................................................................................................53.1 Repeatability...................................................................................................................................................................... 53.2 Accuracy.............................................................................................................................................................................53.3 Sensitivity and Power Optimizations.................................................................................................................................. 7
4 OpenSCAD Design Files........................................................................................................................................................ 75 References.............................................................................................................................................................................. 7
TrademarksMSP430™ is a trademark of Texas Instruments.All trademarks are the property of their respective owners.
www.ti.com Table of Contents
SLAA974 – OCTOBER 2020Submit Document Feedback
Gas Meter Design Guide 1
Copyright © 2020 Texas Instruments Incorporated

1 IntroductionCurrent gas meters often rely on mechanical diaphragms to measure flow rates. Because of the construction ofthese meters, small gas flows (or leaks) cannot be detected. In addition, these meters are often expensive tomanufacture.
Ultrasonic technology is well suited for gas meters because differences in the speed of sound in a flow tube cangive enough resolution to detect small flows that diaphragm based solutions cannot. There are two methods forultrasonic gas metering commonly found in the market: time-to-digital conversion (TDC) and analog-to-digitalconversion (ADC) based.
The ADC-based approach provides the following advantages over the TDC zero-crossing approach:
• Improved accuracy. The correlation acts as a digital filter to suppress noise, which results in a benefit ofapproximately three times lower standard deviation. Similarly, the correlation approach also acts as a low-pass filter that suppresses other interference like line noise.
• Improved zero-flow drift. Exciting the transducers over a range of transmit frequencies (instead of just onefrequency) can account for resonance shifts over temperature and reduce the zero flow drift of the gas meter.
1.1 TI's Ultrasonic Sensing SolutionTI’s ultrasonic sensing technology comprises an ADC based cross-correlation approach that uses frequencyinformation to determine the ultrasonic time of flight with much higher accuracy than existing TDC-basedtechniques. More about how this unique algorithm works and TI’s ultrasonic sensing subsystem (USS) can befound in TIDM-02003.
TI’s ultrasonic sensing subsystem enables a single-chip solution that can be connected to ultrasonic transducersalong with an op-amp and mux for high-resolution flow measurements. TI’s USS is integrated with the low-energy accelerator (LEA) and the MSP CPU to enable autonomous low-power operation with an average currentconsumption of less than 20 µA (at one measurement per second).
TI’s ultrasonic sensing subsystem (see Figure 1-1) comprises a programmable pulse generator (PPG) and ahigh-speed sigma-delta analog-to-digital converter with a programmable gain amplifier (PGA) that canautonomously excite and capture ultrasonic waveforms for subsequent processing via an integrated low-energyaccelerator (LEA).
Figure 1-1. TI's Ultrasonic Subsystem
This ultrasonic subsystem first excites an “upstream” (UPS) transducer connected to CH0_OUT while capturingthe waveform from a “downstream” (DNS) transducer connected to CH0_IN. The ultrasonic subsystemsubsequently excites the “downstream” transducer connected to CH1_OUT while capturing the waveform fromthe “upstream” transducer connected to CH1_IN. These waveforms are then processed by the low-energyaccelerator to determine the difference between the upstream and downstream time of flight.
Introduction www.ti.com
2 Gas Meter Design Guide SLAA974 – OCTOBER 2020Submit Document Feedback
Copyright © 2020 Texas Instruments Incorporated
2 Design ProcessFigure 2-1 shows the overall design process for a 7000 l/h (liters per hour) gas meter system with TI’s ultrasonicsolutions. This process begins with transducer evaluation at low flow rates. This process continues with iterativetube optimization and configuration tuning at higher flow rates. The process is completed with calibrated oventesting with sensitivity and power optimizations.
Figure 2-1. Design Process
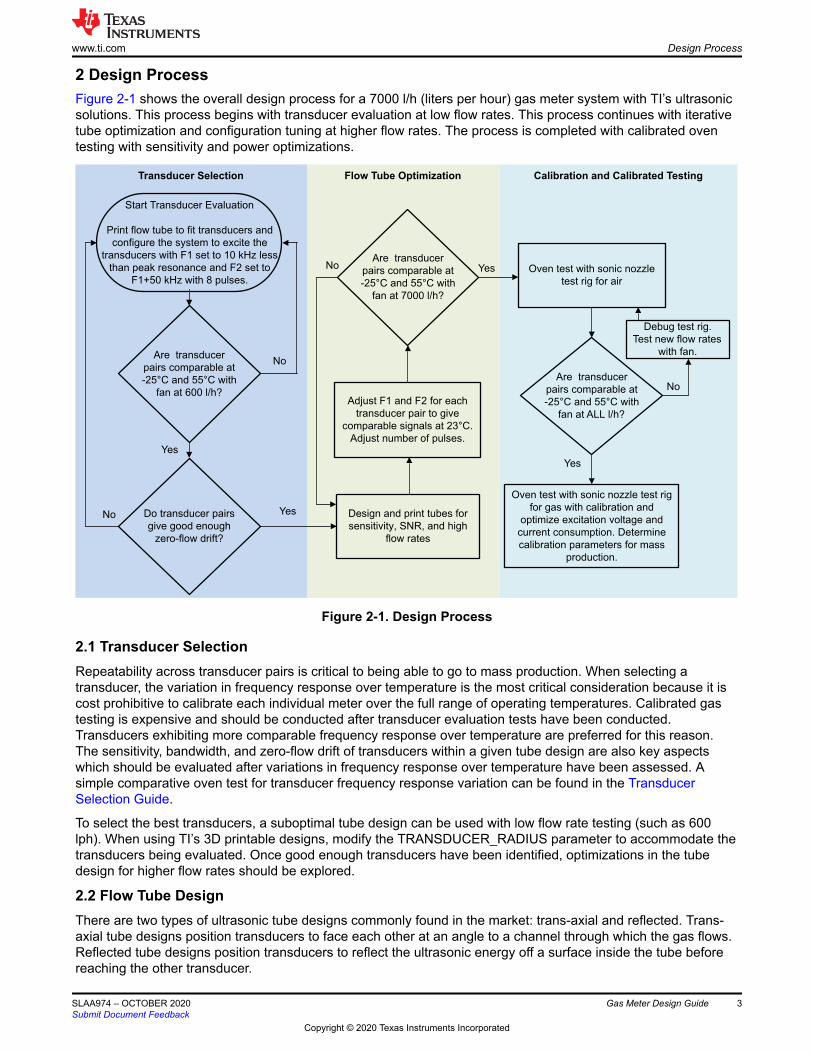
2.1 Transducer SelectionRepeatability across transducer pairs is critical to being able to go to mass production. When selecting atransducer, the variation in frequency response over temperature is the most critical consideration because it iscost prohibitive to calibrate each individual meter over the full range of operating temperatures. Calibrated gastesting is expensive and should be conducted after transducer evaluation tests have been conducted.Transducers exhibiting more comparable frequency response over temperature are preferred for this reason.The sensitivity, bandwidth, and zero-flow drift of transducers within a given tube design are also key aspectswhich should be evaluated after variations in frequency response over temperature have been assessed. Asimple comparative oven test for transducer frequency response variation can be found in the TransducerSelection Guide.
To select the best transducers, a suboptimal tube design can be used with low flow rate testing (such as 600lph). When using TI’s 3D printable designs, modify the TRANSDUCER_RADIUS parameter to accommodate thetransducers being evaluated. Once good enough transducers have been identified, optimizations in the tubedesign for higher flow rates should be explored.
2.2 Flow Tube DesignThere are two types of ultrasonic tube designs commonly found in the market: trans-axial and reflected. Trans-axial tube designs position transducers to face each other at an angle to a channel through which the gas flows.Reflected tube designs position transducers to reflect the ultrasonic energy off a surface inside the tube beforereaching the other transducer.
www.ti.com Design Process
SLAA974 – OCTOBER 2020Submit Document Feedback
Gas Meter Design Guide 3
Copyright © 2020 Texas Instruments Incorporated

While trans-axial tube designs can enable stronger ultrasonic signals over a shorter ultrasonic path, reflectedtube designs can enable greater sensitivity over a longer ultrasonic path at the expense of ultrasonic signalstrength. Figure 2-2 shows these two types of ultrasonic tube designs.
Figure 2-2. Trans-Axial and Reflected Flow Tube Designs
In both of these designs, there are four key design considerations that can significantly affect the characteristicsof the design: flow channel dimensions, ultrasonic angle, collimating elements, and flow plates. Table 2-1 showshow these four elements relate to the accuracy, sensitivity, and signal strength of a given design.
Table 2-1. Tube Design ConsiderationsProperty Accuracy Sensitivity Signal Strength
Ultrasonic Angle ✓ ✓Channel Dimensions ✓ ✓Flow Plates ✓ ✓Collimating Elements ✓ ✓
The height and width of the flow channel can have a significant affect on the characteristics of a given tubedesign. While reducing the width of the channel can accelerate the flow of gas through the tube to give greatersensitivity, doing so also reduces the strength of the ultrasonic signal. Increasing the height of the channel canalso increase the sensitivity of the tube at the expense of ultrasonic signal strength.
The angle at which the ultrasonic signal comes in contact with the gas can also have a significant affect on thesensitivity of the tube. An ultrasonic angle that is more closely aligned with the flow gives greater sensitivity atthe expense of ultrasonic signal strength. The accuracy of measurements can also be compromised if theultrasonic angle is too small.
Collimating elements are commonly introduced to attenuate ultrasonic reflections within a tube while giving arepresentative measurement of flow though the tube. Addition of these elements can improve the accuracy of agiven design at the expense of signal strength.
Flow plates are commonly used to minimize flow interactions with the transducer face. While these can givemore accurate measurements at higher flow rates, these also come with a reduction in ultrasonic signal strength.
2.3 Optimizing the Number of Pulses and Excitation FrequencyThere are various configuration parameters that can be optimized for power consumption, flow performance,standard deviation, and zero flow drift. The relationship between these four aspects and the associatedconfiguration parameters can be seen in Table 2-2. The transmit frequency and number of pulses are the mostcritical parameters because these can have the greatest impact on flow performance (and accuracy). More
Design Process www.ti.com
4 Gas Meter Design Guide SLAA974 – OCTOBER 2020Submit Document Feedback
Copyright © 2020 Texas Instruments Incorporated

details on how to configure these and other less critical parameters can be found in the Quick Start Guide forGas Flow Meter.
The transmit frequency for a given transducer pair can significantly affect accuracy over temperature. Thisfrequency may need to be shifted by a few kHz to ensure ultrasonic signals are comparable at 23°C. This isbased on the assumption that the frequency response of each transducer could vary by a few kHz over theoperating temperature range. Transducer pairs without significant variation in their impedance over temperaturemay not require this transmit frequency tuning.
Table 2-2. Configuration Tuning
ParameterChange to Parameter Affects...
PowerConsumption
FlowPerformance
StandardDeviation Zero Flow Drift
Number of Pulses ✔ ✔ ✔ ✔UPS0 to UPS1 Gap ✔GUI Based Gain Control ✔ ✔Transmit Frequency ✔ ✔ ✔Envelope Crossing Threshold ✔Capture Duration ✔ ✔ ✔
After determining the best transmit frequency, the number of pulses can be increased to give a lower standarddeviation in low-flow measurements. Because the additional ultrasonic energy can have negative effects on theaccuracy of measurements at high flows, increases in the number of pulses should be tested at temperatureextremes and higher flow rates before proceeding with more advanced testing.
3 Design Metrics and Calibrated Flow TestingThe key design metrics of a complete gas meter include repeatability, accuracy, sensitivity, and currentconsumption.
3.1 RepeatabilityThe repeatability of the meter pertains to cost effectively manufacture, calibration, and qualification of thesemeters on a mass production line. Because gas meters must operate over a wide range of temperatures (from-25°C to 55°C), the frequency response of transducers over this range of temperature is a critical aspect ofrepeatability. If the variations in frequency response are too high, a cost effective calibration method at roomtemperature is not possible. A simple method for determining the repeatability of a given transducer across arepresentative production lot is described in the Transducer Selection Guide.
3.2 AccuracyThe accuracy of a meter pertains to the percentage in error that can be measured at a given flow rate overtemperature. Gas meters have three flow ranges over which accuracy requirements can vary. The zero-flow driftof a given transducer in a tube design determines the minimum flow (or leakage) a meter can detect with acommon accuracy requirement of ±10%. Details on zero-flow drift testing can be found in the TIDM-02003 user’sguide. For European markets, the low flow range of a gas meter is typically between 40 liters per hour (lph) and600 lph with a ±3% accuracy requirement. The high flow range of a gas meter is typically between 600 lph and7000 lph with an accuracy requirement of ±1.5%.
Accuracy testing of a given tube design is typically first conducted with air in an oven that is set to operatingtemperature extremes (in addition to room temperature) with a sonic nozzle test rig that has been calibrated toprovide a deterministic flow through the gas meter. After representative testing over temperature has beenconducted over enough meters, calibration for mass production is limited to flow testing at room temperature.Measurements at flow rates ranging from 40 lph to 7000 lph are taken for a few minutes at temperatures typicallyranging from -25°C to 55°C to determine variations in reported flows across multiple meters. Figure 3-1 shows asonic nozzle flow test system.
Because this system involves multiple pneumatic valves and a large oven that can test multiple meters at thesame time, there is often noise from the test equipment that can adversly affect the ultrasonic measurement
www.ti.com Design Metrics and Calibrated Flow Testing
SLAA974 – OCTOBER 2020Submit Document Feedback
Gas Meter Design Guide 5
Copyright © 2020 Texas Instruments Incorporated

results. It is recommended to conduct initial testing with a high-precision fan and the oven turned off aftertemperature stabilization to distinguish between gas meter and test fixture problems.
After enough testing has been conducted with air, a separate (more elaborate) test fixture that introduces avariety of compressed natural gas mixtures is used. Problems not seen in air testing often arise due to theincreased attenuation of methane and the decrease in time of flight (which can move the received ultrasonicsignal into the excitation “ring down” time zone of the transmitting transducer). Because the time of flightdecreases in methane, secondary reflections like the one shown in Figure 3-2 can occur earlier and requiresome adjustment to the timing between upstream and downstream measurements.
Figure 3-1. Sonic Nozzle Test and Calibration System
Design Metrics and Calibrated Flow Testing www.ti.com
6 Gas Meter Design Guide SLAA974 – OCTOBER 2020Submit Document Feedback
Copyright © 2020 Texas Instruments Incorporated

Figure 3-2. Secondary Reflection
3.3 Sensitivity and Power OptimizationsThe sensitivity of a meter pertains to the standard deviation in measurements. As mentioned previously, theADC-based approach provides a standard deviation that can be 3 times lower than the TDC approach. Tubedesigns with a longer ultrasonic path (or lower ultrasonic angle) can provide greater sensitivity provided theultrasonic signal strength is strong enough to overcome ambient noise. The TIDM-02003 user’s guide describeshow to measure the standard deviation. The excitation voltage of the transducer can be increased to lower thestandard deviation in measurements at lower flow rates and for high concentration methane applications.
The current consumption of a gas meter is typically measured with a power analyzer. The TIDM-02003 user’sguide includes a typical current profile for a measurement that consumes less than 20 µA when averaged over a1-second measurement period. This current consumption can be further reduced by reducing the frequency atwhich the absolute time of flight measurements are taken. Because a number of measurements need to betaken to get a mean value at low flow rates, a tube design with higher sensitivity (and lower standard deviation)can give a more accurate result with fewer measurements (and lower current consumption).
4 OpenSCAD Design FilesOpenSCAD (http://www.openscad.org/) is a freely available CAD tool that enables parametric generation of 3Dmodels that can be exported for 3D printing. The parametric 3D flow tubes used in this paper are available fromhttps://www.ti.com/lit/zip/slaa974.
5 References1. USSSW_Lib_Gas2. Ultrasonic sensing subsystem reference design for gas flow measurement (TIDM-02003)3. Ultrasonic sensing subsystem reference design for gas flow measurement user’s guide4. Transducer Selection Guide5. OpenSCAD6. MSP430 MCUs Ultrasonic Sensing Design Center
www.ti.com Design Metrics and Calibrated Flow Testing
SLAA974 – OCTOBER 2020Submit Document Feedback
Gas Meter Design Guide 7
Copyright © 2020 Texas Instruments Incorporated

IMPORTANT NOTICE AND DISCLAIMER
TI PROVIDES TECHNICAL AND RELIABILITY DATA (INCLUDING DATASHEETS), DESIGN RESOURCES (INCLUDING REFERENCE DESIGNS), APPLICATION OR OTHER DESIGN ADVICE, WEB TOOLS, SAFETY INFORMATION, AND OTHER RESOURCES “AS IS” AND WITH ALL FAULTS, AND DISCLAIMS ALL WARRANTIES, EXPRESS AND IMPLIED, INCLUDING WITHOUT LIMITATION ANY IMPLIED WARRANTIES OF MERCHANTABILITY, FITNESS FOR A PARTICULAR PURPOSE OR NON-INFRINGEMENT OF THIRD PARTY INTELLECTUAL PROPERTY RIGHTS.These resources are intended for skilled developers designing with TI products. You are solely responsible for (1) selecting the appropriate TI products for your application, (2) designing, validating and testing your application, and (3) ensuring your application meets applicable standards, and any other safety, security, or other requirements. These resources are subject to change without notice. TI grants you permission to use these resources only for development of an application that uses the TI products described in the resource. Other reproduction and display of these resources is prohibited. No license is granted to any other TI intellectual property right or to any third party intellectual property right. TI disclaims responsibility for, and you will fully indemnify TI and its representatives against, any claims, damages, costs, losses, and liabilities arising out of your use of these resources.TI’s products are provided subject to TI’s Terms of Sale (www.ti.com/legal/termsofsale.html) or other applicable terms available either on ti.com or provided in conjunction with such TI products. TI’s provision of these resources does not expand or otherwise alter TI’s applicable warranties or warranty disclaimers for TI products.
Mailing Address: Texas Instruments, Post Office Box 655303, Dallas, Texas 75265Copyright © 2020, Texas Instruments Incorporated