Fuzzy logic-driven and SVM-driven hybrid computational intelligence models applied to oil and gas...
13
Fuzzy logic-driven and SVM-driven hybrid computational intelligence models applied to oil and gas reservoir characterization Fatai Anifowose * , Abdulazeez Abdulraheem 1 Center for Petroleum and Minerals, The Research Institute, King Fahd University of Petroleum and Minerals, Dhahran 31261, Saudi Arabia article info Article history: Received 15 May 2010 Received in revised form 13 July 2010 Accepted 26 May 2011 Available online 7 July 2001 Keywords: Hybrid computational intelligence Petroleum reservoir characterization Type-2 Fuzzy logic Support vector machines Functional networks abstract This work demonstrates the capabilities of two hybrid models as Computational Intelligence tools in the prediction of two important oil and gas reservoir properties, viz., porosity and permeability. The hybrid modeling was based on the combination of three existing Artificial Intelligence techniques: Functional Networks, Type-2 Fuzzy Logic System, and Support Vector Machines, using six datasets by utilizing the functional approximation capabilities of Functional Networks, the ability of Type-2 Fuzzy Logic to handle uncertainties and the scalability and robustness of Support Vector Machines in handling small and high- dimensional data. The hybridization was done in a way that allows one technique to further improve on the output of the other. Various Artificial intelligence techniques have been used in the prediction of oil and gas reservoir properties but each technique have exhibited specific capabilities, demonstrated certain limitations and posed a number of challenges. They have proven clearly that no single technique is perfect in all situations; hence the need for hybrid models that will combine the best characteristics of each technique in a single package and in the process, increase the confidence in the prediction of various oil and gas reservoir properties. This will result in increased production of more crude oil and hydrocarbons to meet the increasing world’s demand. The results showed that the hybrid models perform better with higher correlation coefficients than the individual techniques when used alone for the same sets of data. In terms of execution time, the hybrid models took less time for both training and testing than the Type-2 Fuzzy Logic, but more time than Functional Networks and Support Vector Machines. This could be the price to pay for having better and more robust models. This work has demonstrated a successful application of the hybridization of three Artificial Intelligence techniques in one of the real-life problems encountered in oil and gas production where high quality information and accurate predictions are required for better and more efficient exploration, resource evaluation and their management. Ó 2011 Elsevier B.V. All rights reserved. 1. Introduction Petroleum reservoir characterization is a process for quantita- tively describing various reservoir properties in spatial variability by using available field data. It plays a crucial role in modern reservoir management: making sound reservoir decisions and improving the reliability of the reservoir predictions. The ultimate goal is a reservoir model with realistic tolerance for imprecision and uncertainty. Porosity and permeability are two fundamental reservoir properties which relate to the amount of fluid contained in a reservoir and its ability to flow. These properties make signif- icant impacts on petroleum field operations and reservoir management (Lim, 2005). A good number of studies have been carried out on the appli- cation of various Computational Intelligence (CI) schemes, such as Logistic Regression, K-Nearest Neighbor, Multilayer Perceptrons, Radial Basis Function, Bayesian Belief Networks, Naïve Bayes, Random Forests, Functional Networks, Support Vector Machines, Artificial Neural Networks, Probabilistic Networks, Adaptive-Neuro Fuzzy Systems and Decision Trees (Duch et al., 1997; Giovanni and Vincenzo, 2005; Guojie, 2004; Hosmer and Lemeshow, 2000; Lauría and Duchessi, 2006; Salah et al., 2005), to predict the char- acteristics of oil and gas reservoirs such as depth, temperature, pressure, volume, drive mechanism, structure and seal, well spacing, well-bore integrity, porosity, and permeability. CI covers many existing branches of science viz. Artificial Neural Networks, * Corresponding author. Tel.: þ966 3 860 4383; fax: þ966 3 860 3989. E-mail addresses: [email protected] (F. Anifowose), [email protected] (A. Abdulraheem). 1 Tel.: þ966 3 860 2604; fax: þ966 3 860 3989. Contents lists available at ScienceDirect Journal of Natural Gas Science and Engineering journal homepage: www.elsevier.com/locate/jngse 1875-5100/$ e see front matter Ó 2011 Elsevier B.V. All rights reserved. doi:10.1016/j.jngse.2011.05.002 Journal of Natural Gas Science and Engineering 3 (2011) 505e517
Transcript of Fuzzy logic-driven and SVM-driven hybrid computational intelligence models applied to oil and gas...
lable at ScienceDirect
Journal of Natural Gas Science and Engineering 3 (2011) 505e517
Contents lists avai
Journal of Natural Gas Science and Engineering
journal homepage: www.elsevier .com/locate/ jngse
Fuzzy logic-driven and SVM-driven hybrid computational intelligence modelsapplied to oil and gas reservoir characterization
Fatai Anifowose*, Abdulazeez Abdulraheem1
Center for Petroleum and Minerals, The Research Institute, King Fahd University of Petroleum and Minerals, Dhahran 31261, Saudi Arabia
a r t i c l e i n f o
Article history:Received 15 May 2010Received in revised form13 July 2010Accepted 26 May 2011Available online 7 July 2001
Keywords:Hybrid computational intelligencePetroleum reservoir characterizationType-2 Fuzzy logicSupport vector machinesFunctional networks
* Corresponding author. Tel.: þ966 3 860 4383; faxE-mail addresses: [email protected] (F. Anifo
(A. Abdulraheem).1 Tel.: þ966 3 860 2604; fax: þ966 3 860 3989.
1875-5100/$ e see front matter � 2011 Elsevier B.V.doi:10.1016/j.jngse.2011.05.002
a b s t r a c t
This work demonstrates the capabilities of two hybrid models as Computational Intelligence tools in theprediction of two important oil and gas reservoir properties, viz., porosity and permeability. The hybridmodeling was based on the combination of three existing Artificial Intelligence techniques: FunctionalNetworks, Type-2 Fuzzy Logic System, and Support Vector Machines, using six datasets by utilizing thefunctional approximation capabilities of Functional Networks, the ability of Type-2 Fuzzy Logic to handleuncertainties and the scalability and robustness of Support Vector Machines in handling small and high-dimensional data. The hybridization was done in a way that allows one technique to further improve onthe output of the other. Various Artificial intelligence techniques have been used in the prediction of oiland gas reservoir properties but each technique have exhibited specific capabilities, demonstratedcertain limitations and posed a number of challenges. They have proven clearly that no single techniqueis perfect in all situations; hence the need for hybrid models that will combine the best characteristics ofeach technique in a single package and in the process, increase the confidence in the prediction ofvarious oil and gas reservoir properties. This will result in increased production of more crude oil andhydrocarbons to meet the increasing world’s demand. The results showed that the hybrid modelsperform better with higher correlation coefficients than the individual techniques when used alone forthe same sets of data. In terms of execution time, the hybrid models took less time for both training andtesting than the Type-2 Fuzzy Logic, but more time than Functional Networks and Support VectorMachines. This could be the price to pay for having better and more robust models. This work hasdemonstrated a successful application of the hybridization of three Artificial Intelligence techniques inone of the real-life problems encountered in oil and gas production where high quality information andaccurate predictions are required for better and more efficient exploration, resource evaluation and theirmanagement.
� 2011 Elsevier B.V. All rights reserved.
1. Introduction
Petroleum reservoir characterization is a process for quantita-tively describing various reservoir properties in spatial variabilityby using available field data. It plays a crucial role in modernreservoir management: making sound reservoir decisions andimproving the reliability of the reservoir predictions. The ultimategoal is a reservoir model with realistic tolerance for imprecisionand uncertainty. Porosity and permeability are two fundamentalreservoir properties which relate to the amount of fluid contained
: þ966 3 860 3989.wose), [email protected]
All rights reserved.
in a reservoir and its ability to flow. These properties make signif-icant impacts on petroleum field operations and reservoirmanagement (Lim, 2005).
A good number of studies have been carried out on the appli-cation of various Computational Intelligence (CI) schemes, such asLogistic Regression, K-Nearest Neighbor, Multilayer Perceptrons,Radial Basis Function, Bayesian Belief Networks, Naïve Bayes,Random Forests, Functional Networks, Support Vector Machines,Artificial Neural Networks, Probabilistic Networks, Adaptive-NeuroFuzzy Systems and Decision Trees (Duch et al., 1997; Giovanni andVincenzo, 2005; Guojie, 2004; Hosmer and Lemeshow, 2000;Lauría and Duchessi, 2006; Salah et al., 2005), to predict the char-acteristics of oil and gas reservoirs such as depth, temperature,pressure, volume, drive mechanism, structure and seal, wellspacing, well-bore integrity, porosity, and permeability. CI coversmany existing branches of science viz. Artificial Neural Networks,
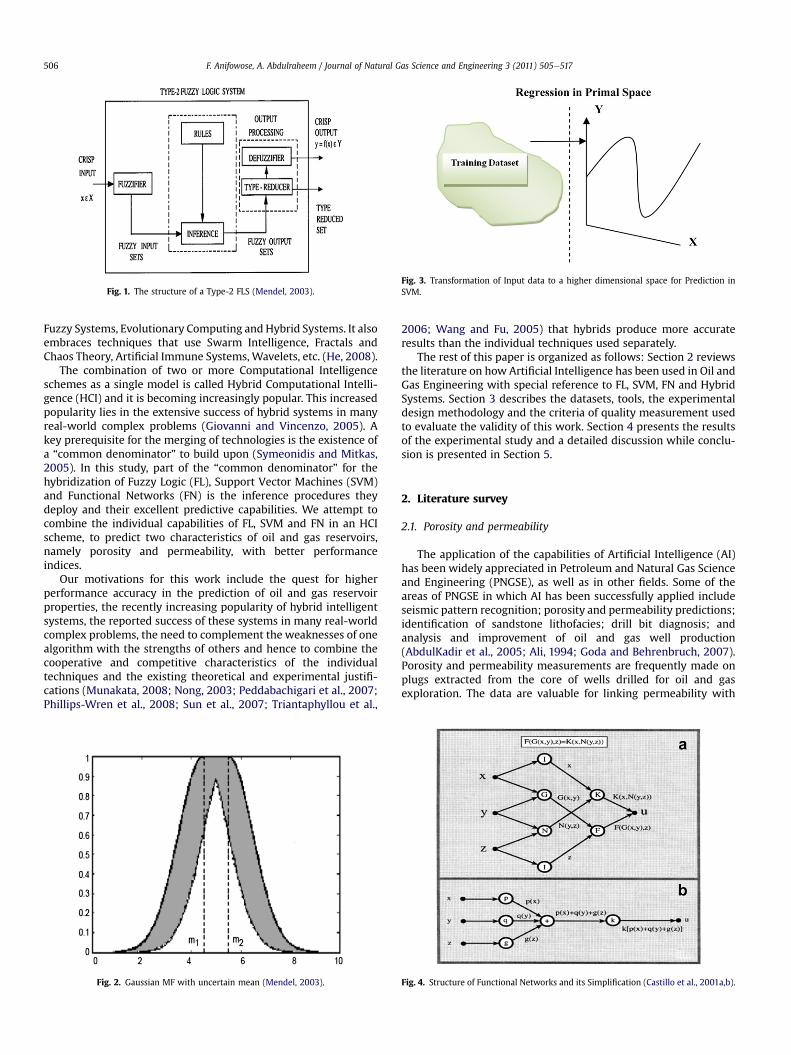
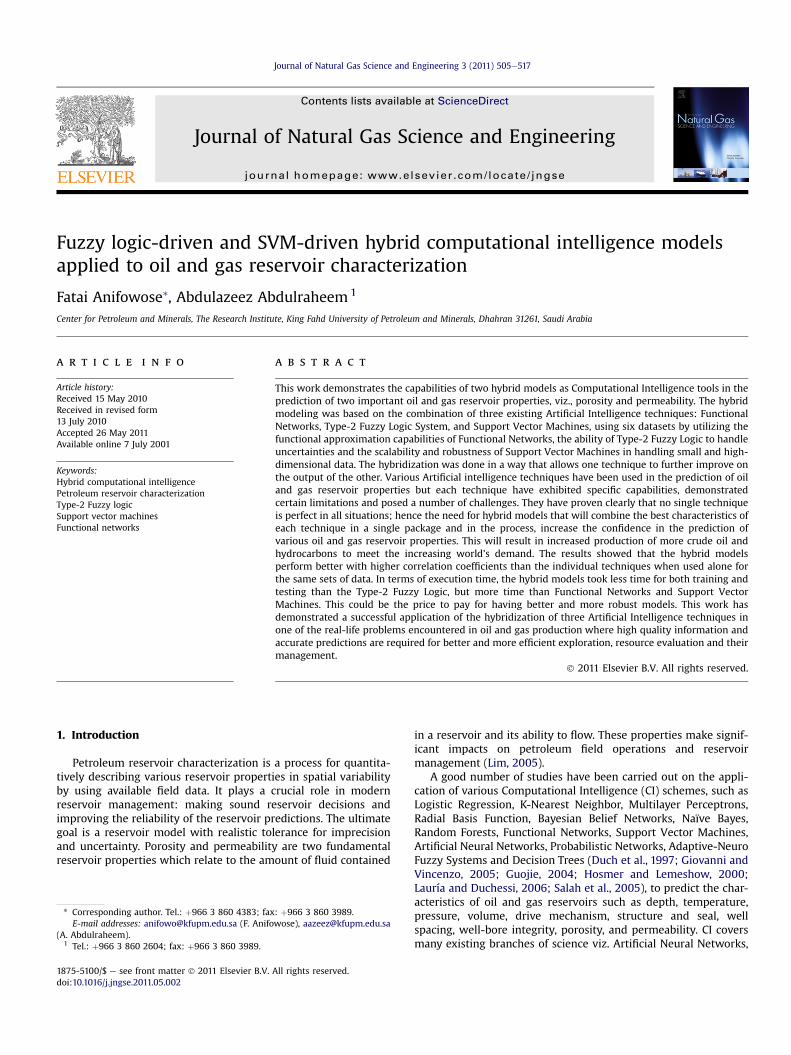
Fig. 1. The structure of a Type-2 FLS (Mendel, 2003).Fig. 3. Transformation of Input data to a higher dimensional space for Prediction inSVM.
F. Anifowose, A. Abdulraheem / Journal of Natural Gas Science and Engineering 3 (2011) 505e517506
Fuzzy Systems, Evolutionary Computing and Hybrid Systems. It alsoembraces techniques that use Swarm Intelligence, Fractals andChaos Theory, Artificial Immune Systems, Wavelets, etc. (He, 2008).
The combination of two or more Computational Intelligenceschemes as a single model is called Hybrid Computational Intelli-gence (HCI) and it is becoming increasingly popular. This increasedpopularity lies in the extensive success of hybrid systems in manyreal-world complex problems (Giovanni and Vincenzo, 2005). Akey prerequisite for the merging of technologies is the existence ofa “common denominator” to build upon (Symeonidis and Mitkas,2005). In this study, part of the “common denominator” for thehybridization of Fuzzy Logic (FL), Support Vector Machines (SVM)and Functional Networks (FN) is the inference procedures theydeploy and their excellent predictive capabilities. We attempt tocombine the individual capabilities of FL, SVM and FN in an HCIscheme, to predict two characteristics of oil and gas reservoirs,namely porosity and permeability, with better performanceindices.
Our motivations for this work include the quest for higherperformance accuracy in the prediction of oil and gas reservoirproperties, the recently increasing popularity of hybrid intelligentsystems, the reported success of these systems in many real-worldcomplex problems, the need to complement the weaknesses of onealgorithm with the strengths of others and hence to combine thecooperative and competitive characteristics of the individualtechniques and the existing theoretical and experimental justifi-cations (Munakata, 2008; Nong, 2003; Peddabachigari et al., 2007;Phillips-Wren et al., 2008; Sun et al., 2007; Triantaphyllou et al.,
Fig. 2. Gaussian MF with uncertain mean (Mendel, 2003).
2006; Wang and Fu, 2005) that hybrids produce more accurateresults than the individual techniques used separately.
The rest of this paper is organized as follows: Section 2 reviewsthe literature on how Artificial Intelligence has been used in Oil andGas Engineering with special reference to FL, SVM, FN and HybridSystems. Section 3 describes the datasets, tools, the experimentaldesign methodology and the criteria of quality measurement usedto evaluate the validity of this work. Section 4 presents the resultsof the experimental study and a detailed discussion while conclu-sion is presented in Section 5.
2. Literature survey
2.1. Porosity and permeability
The application of the capabilities of Artificial Intelligence (AI)has been widely appreciated in Petroleum and Natural Gas Scienceand Engineering (PNGSE), as well as in other fields. Some of theareas of PNGSE in which AI has been successfully applied includeseismic pattern recognition; porosity and permeability predictions;identification of sandstone lithofacies; drill bit diagnosis; andanalysis and improvement of oil and gas well production(AbdulKadir et al., 2005; Ali, 1994; Goda and Behrenbruch, 2007).Porosity and permeability measurements are frequently made onplugs extracted from the core of wells drilled for oil and gasexploration. The data are valuable for linking permeability with
Fig. 4. Structure of Functional Networks and its Simplification (Castillo et al., 2001a,b).
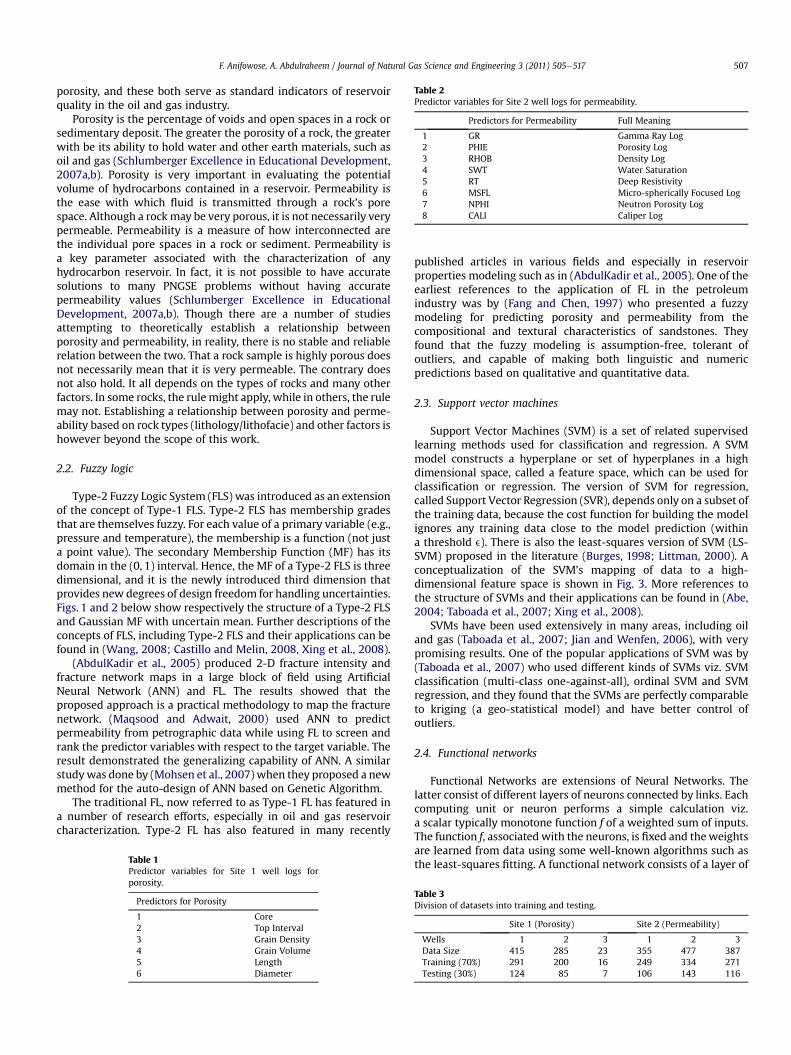
Table 2Predictor variables for Site 2 well logs for permeability.
Predictors for Permeability Full Meaning
1 GR Gamma Ray Log2 PHIE Porosity Log3 RHOB Density Log4 SWT Water Saturation5 RT Deep Resistivity6 MSFL Micro-spherically Focused Log7 NPHI Neutron Porosity Log8 CALI Caliper Log
F. Anifowose, A. Abdulraheem / Journal of Natural Gas Science and Engineering 3 (2011) 505e517 507
porosity, and these both serve as standard indicators of reservoirquality in the oil and gas industry.
Porosity is the percentage of voids and open spaces in a rock orsedimentary deposit. The greater the porosity of a rock, the greaterwith be its ability to hold water and other earth materials, such asoil and gas (Schlumberger Excellence in Educational Development,2007a,b). Porosity is very important in evaluating the potentialvolume of hydrocarbons contained in a reservoir. Permeability isthe ease with which fluid is transmitted through a rock’s porespace. Although a rockmay be very porous, it is not necessarily verypermeable. Permeability is a measure of how interconnected arethe individual pore spaces in a rock or sediment. Permeability isa key parameter associated with the characterization of anyhydrocarbon reservoir. In fact, it is not possible to have accuratesolutions to many PNGSE problems without having accuratepermeability values (Schlumberger Excellence in EducationalDevelopment, 2007a,b). Though there are a number of studiesattempting to theoretically establish a relationship betweenporosity and permeability, in reality, there is no stable and reliablerelation between the two. That a rock sample is highly porous doesnot necessarily mean that it is very permeable. The contrary doesnot also hold. It all depends on the types of rocks and many otherfactors. In some rocks, the rule might apply, while in others, the rulemay not. Establishing a relationship between porosity and perme-ability based on rock types (lithology/lithofacie) and other factors ishowever beyond the scope of this work.
2.2. Fuzzy logic
Type-2 Fuzzy Logic System (FLS) was introduced as an extensionof the concept of Type-1 FLS. Type-2 FLS has membership gradesthat are themselves fuzzy. For each value of a primary variable (e.g.,pressure and temperature), the membership is a function (not justa point value). The secondary Membership Function (MF) has itsdomain in the (0, 1) interval. Hence, the MF of a Type-2 FLS is threedimensional, and it is the newly introduced third dimension thatprovides new degrees of design freedom for handling uncertainties.Figs. 1 and 2 below show respectively the structure of a Type-2 FLSand Gaussian MF with uncertain mean. Further descriptions of theconcepts of FLS, including Type-2 FLS and their applications can befound in (Wang, 2008; Castillo and Melin, 2008, Xing et al., 2008).
(AbdulKadir et al., 2005) produced 2-D fracture intensity andfracture network maps in a large block of field using ArtificialNeural Network (ANN) and FL. The results showed that theproposed approach is a practical methodology to map the fracturenetwork. (Maqsood and Adwait, 2000) used ANN to predictpermeability from petrographic data while using FL to screen andrank the predictor variables with respect to the target variable. Theresult demonstrated the generalizing capability of ANN. A similarstudywas done by (Mohsen et al., 2007) when they proposed a newmethod for the auto-design of ANN based on Genetic Algorithm.
The traditional FL, now referred to as Type-1 FL has featured ina number of research efforts, especially in oil and gas reservoircharacterization. Type-2 FL has also featured in many recently
Table 1Predictor variables for Site 1 well logs forporosity.
Predictors for Porosity
1 Core2 Top Interval3 Grain Density4 Grain Volume5 Length6 Diameter
published articles in various fields and especially in reservoirproperties modeling such as in (AbdulKadir et al., 2005). One of theearliest references to the application of FL in the petroleumindustry was by (Fang and Chen, 1997) who presented a fuzzymodeling for predicting porosity and permeability from thecompositional and textural characteristics of sandstones. Theyfound that the fuzzy modeling is assumption-free, tolerant ofoutliers, and capable of making both linguistic and numericpredictions based on qualitative and quantitative data.
2.3. Support vector machines
Support Vector Machines (SVM) is a set of related supervisedlearning methods used for classification and regression. A SVMmodel constructs a hyperplane or set of hyperplanes in a highdimensional space, called a feature space, which can be used forclassification or regression. The version of SVM for regression,called Support Vector Regression (SVR), depends only on a subset ofthe training data, because the cost function for building the modelignores any training data close to the model prediction (withina threshold e). There is also the least-squares version of SVM (LS-SVM) proposed in the literature (Burges, 1998; Littman, 2000). Aconceptualization of the SVM’s mapping of data to a high-dimensional feature space is shown in Fig. 3. More references tothe structure of SVMs and their applications can be found in (Abe,2004; Taboada et al., 2007; Xing et al., 2008).
SVMs have been used extensively in many areas, including oiland gas (Taboada et al., 2007; Jian and Wenfen, 2006), with verypromising results. One of the popular applications of SVM was by(Taboada et al., 2007) who used different kinds of SVMs viz. SVMclassification (multi-class one-against-all), ordinal SVM and SVMregression, and they found that the SVMs are perfectly comparableto kriging (a geo-statistical model) and have better control ofoutliers.
2.4. Functional networks
Functional Networks are extensions of Neural Networks. Thelatter consist of different layers of neurons connected by links. Eachcomputing unit or neuron performs a simple calculation viz.a scalar typically monotone function f of a weighted sum of inputs.The function f, associated with the neurons, is fixed and theweightsare learned from data using some well-known algorithms such asthe least-squares fitting. A functional network consists of a layer of
Table 3Division of datasets into training and testing.
Site 1 (Porosity) Site 2 (Permeability)
Wells 1 2 3 1 2 3Data Size 415 285 23 355 477 387Training (70%) 291 200 16 249 334 271Testing (30%) 124 85 7 106 143 116
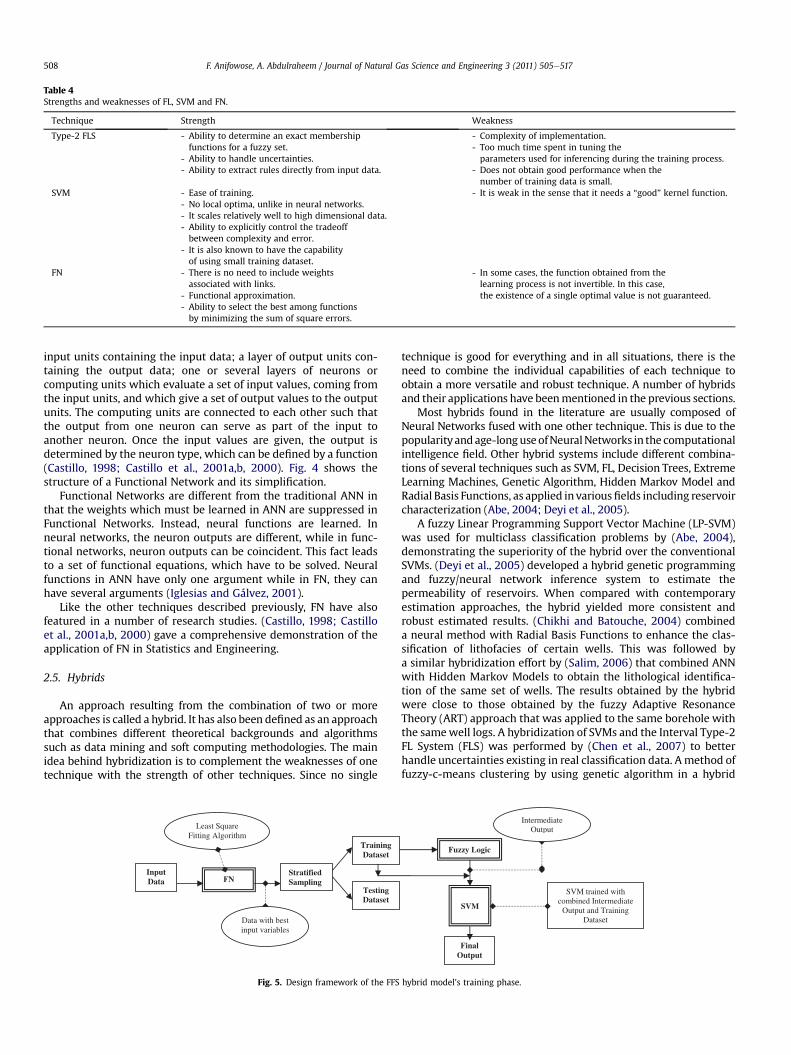
Table 4Strengths and weaknesses of FL, SVM and FN.
Technique Strength Weakness
Type-2 FLS - Ability to determine an exact membershipfunctions for a fuzzy set.
- Ability to handle uncertainties.- Ability to extract rules directly from input data.
- Complexity of implementation.- Too much time spent in tuning theparameters used for inferencing during the training process.
- Does not obtain good performance when thenumber of training data is small.
SVM - Ease of training.- No local optima, unlike in neural networks.- It scales relatively well to high dimensional data.- Ability to explicitly control the tradeoffbetween complexity and error.
- It is also known to have the capabilityof using small training dataset.
- It is weak in the sense that it needs a “good” kernel function.
FN - There is no need to include weightsassociated with links.
- Functional approximation.- Ability to select the best among functionsby minimizing the sum of square errors.
- In some cases, the function obtained from thelearning process is not invertible. In this case,the existence of a single optimal value is not guaranteed.
F. Anifowose, A. Abdulraheem / Journal of Natural Gas Science and Engineering 3 (2011) 505e517508
input units containing the input data; a layer of output units con-taining the output data; one or several layers of neurons orcomputing units which evaluate a set of input values, coming fromthe input units, and which give a set of output values to the outputunits. The computing units are connected to each other such thatthe output from one neuron can serve as part of the input toanother neuron. Once the input values are given, the output isdetermined by the neuron type, which can be defined by a function(Castillo, 1998; Castillo et al., 2001a,b, 2000). Fig. 4 shows thestructure of a Functional Network and its simplification.
Functional Networks are different from the traditional ANN inthat the weights which must be learned in ANN are suppressed inFunctional Networks. Instead, neural functions are learned. Inneural networks, the neuron outputs are different, while in func-tional networks, neuron outputs can be coincident. This fact leadsto a set of functional equations, which have to be solved. Neuralfunctions in ANN have only one argument while in FN, they canhave several arguments (Iglesias and Gálvez, 2001).
Like the other techniques described previously, FN have alsofeatured in a number of research studies. (Castillo, 1998; Castilloet al., 2001a,b, 2000) gave a comprehensive demonstration of theapplication of FN in Statistics and Engineering.
2.5. Hybrids
An approach resulting from the combination of two or moreapproaches is called a hybrid. It has also been defined as an approachthat combines different theoretical backgrounds and algorithmssuch as data mining and soft computing methodologies. The mainidea behind hybridization is to complement the weaknesses of onetechnique with the strength of other techniques. Since no single
FN
Least Square Fitting Algorithm
Input Data
Data with best input variables
Stratified Sampling
Training Dataset
Testing Dataset
Fig. 5. Design framework of the FFS
technique is good for everything and in all situations, there is theneed to combine the individual capabilities of each technique toobtain a more versatile and robust technique. A number of hybridsand their applications have beenmentioned in the previous sections.
Most hybrids found in the literature are usually composed ofNeural Networks fused with one other technique. This is due to thepopularityandage-longuseofNeuralNetworks in the computationalintelligence field. Other hybrid systems include different combina-tions of several techniques such as SVM, FL, Decision Trees, ExtremeLearning Machines, Genetic Algorithm, Hidden Markov Model andRadial Basis Functions, as applied in variousfields including reservoircharacterization (Abe, 2004; Deyi et al., 2005).
A fuzzy Linear Programming Support Vector Machine (LP-SVM)was used for multiclass classification problems by (Abe, 2004),demonstrating the superiority of the hybrid over the conventionalSVMs. (Deyi et al., 2005) developed a hybrid genetic programmingand fuzzy/neural network inference system to estimate thepermeability of reservoirs. When compared with contemporaryestimation approaches, the hybrid yielded more consistent androbust estimated results. (Chikhi and Batouche, 2004) combineda neural method with Radial Basis Functions to enhance the clas-sification of lithofacies of certain wells. This was followed bya similar hybridization effort by (Salim, 2006) that combined ANNwith Hidden Markov Models to obtain the lithological identifica-tion of the same set of wells. The results obtained by the hybridwere close to those obtained by the fuzzy Adaptive ResonanceTheory (ART) approach that was applied to the same borehole withthe samewell logs. A hybridization of SVMs and the Interval Type-2FL System (FLS) was performed by (Chen et al., 2007) to betterhandle uncertainties existing in real classification data. Amethod offuzzy-c-means clustering by using genetic algorithm in a hybrid
Fuzzy Logic
SVM
Final Output
Intermediate Output
SVM trained with combined Intermediate
Output and TrainingDataset
hybrid model’s training phase.
FN
Fuzzy Logic
SVM
Least Square Fitting Algorithm
Input Data
Final Output
Data with best input variables
Stratified Sampling
Training Dataset
Testing Dataset
Intermediate Output
SVM trained with combined Intermediate
Output and TrainingDataset
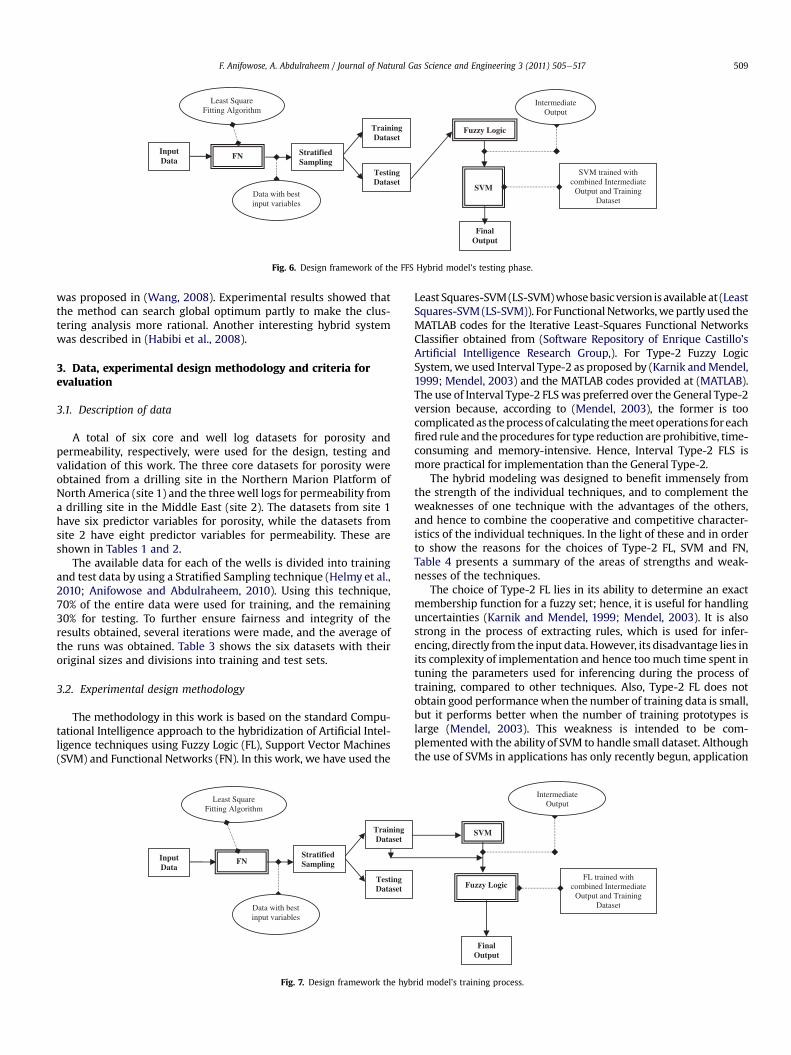
Fig. 6. Design framework of the FFS Hybrid model’s testing phase.
F. Anifowose, A. Abdulraheem / Journal of Natural Gas Science and Engineering 3 (2011) 505e517 509
was proposed in (Wang, 2008). Experimental results showed thatthe method can search global optimum partly to make the clus-tering analysis more rational. Another interesting hybrid systemwas described in (Habibi et al., 2008).
3. Data, experimental design methodology and criteria forevaluation
3.1. Description of data
A total of six core and well log datasets for porosity andpermeability, respectively, were used for the design, testing andvalidation of this work. The three core datasets for porosity wereobtained from a drilling site in the Northern Marion Platform ofNorth America (site 1) and the threewell logs for permeability froma drilling site in the Middle East (site 2). The datasets from site 1have six predictor variables for porosity, while the datasets fromsite 2 have eight predictor variables for permeability. These areshown in Tables 1 and 2.
The available data for each of the wells is divided into trainingand test data by using a Stratified Sampling technique (Helmy et al.,2010; Anifowose and Abdulraheem, 2010). Using this technique,70% of the entire data were used for training, and the remaining30% for testing. To further ensure fairness and integrity of theresults obtained, several iterations were made, and the average ofthe runs was obtained. Table 3 shows the six datasets with theiroriginal sizes and divisions into training and test sets.
3.2. Experimental design methodology
The methodology in this work is based on the standard Compu-tational Intelligence approach to the hybridization of Artificial Intel-ligence techniques using Fuzzy Logic (FL), Support Vector Machines(SVM) and Functional Networks (FN). In this work, we have used the
FN
Least Square Fitting Algorithm
Input Data
Data with best input variables
Stratified Sampling
Training Dataset
Testing Dataset
Fig. 7. Design framework the hyb
Least Squares-SVM(LS-SVM)whosebasic version is available at (LeastSquares-SVM(LS-SVM)). For Functional Networks,wepartly used theMATLAB codes for the Iterative Least-Squares Functional NetworksClassifier obtained from (Software Repository of Enrique Castillo’sArtificial Intelligence Research Group,). For Type-2 Fuzzy LogicSystem, we used Interval Type-2 as proposed by (Karnik andMendel,1999; Mendel, 2003) and the MATLAB codes provided at (MATLAB).The use of Interval Type-2 FLS was preferred over the General Type-2version because, according to (Mendel, 2003), the former is toocomplicatedas theprocessof calculating themeetoperations foreachfired rule and the procedures for type reduction are prohibitive, time-consuming and memory-intensive. Hence, Interval Type-2 FLS ismore practical for implementation than the General Type-2.
The hybrid modeling was designed to benefit immensely fromthe strength of the individual techniques, and to complement theweaknesses of one technique with the advantages of the others,and hence to combine the cooperative and competitive character-istics of the individual techniques. In the light of these and in orderto show the reasons for the choices of Type-2 FL, SVM and FN,Table 4 presents a summary of the areas of strengths and weak-nesses of the techniques.
The choice of Type-2 FL lies in its ability to determine an exactmembership function for a fuzzy set; hence, it is useful for handlinguncertainties (Karnik and Mendel, 1999; Mendel, 2003). It is alsostrong in the process of extracting rules, which is used for infer-encing, directly from the input data. However, its disadvantage lies inits complexity of implementation and hence toomuch time spent intuning the parameters used for inferencing during the process oftraining, compared to other techniques. Also, Type-2 FL does notobtain good performancewhen the number of training data is small,but it performs better when the number of training prototypes islarge (Mendel, 2003). This weakness is intended to be com-plementedwith the ability of SVM to handle small dataset. Althoughthe use of SVMs in applications has only recently begun, application
Fuzzy Logic
SVM
Final Output
Intermediate Output
FL trained with combined Intermediate
Output and TrainingDataset
rid model’s training process.
FN
Fuzzy Logic
SVM
Least Square Fitting Algorithm
Input Data
Final Output
Data with best input variables
Stratified Sampling
Training Dataset
Testing Dataset
Intermediate Output
SVM trained with combined Intermediate
Output and TrainingDataset
Fig. 8. Design framework the hybrid model’s testing process.
F. Anifowose, A. Abdulraheem / Journal of Natural Gas Science and Engineering 3 (2011) 505e517510
developers have already reported state-of-the-art performances ina variety of applications in pattern recognition, regression estima-tion, and time series prediction (Jian and Wenfen, 2006).
The strengths of SVM lie mainly in its relative ease of training,absence of local optima unlike in the case of ANN, it scales relativelywell to high dimensional data, it has the ability to explicitly controlthe tradeoff between complexity and error, and it has the ability tohandle non-traditional data like trees as input to the system,instead of feature vectors. However, it is weak in the sense that itneeds a “good” kernel function (Littman, 2000). This weakness isintended to be complemented with the ability of Type-2 FL to learndirectly from the input data.
The learning process of the Least-Squares Functional Networkconsists of obtaining the neural functions from a set of training databased on minimizing the sum of squared errors between the inputand the target output by suggesting an approximation to each ofthe functions and selecting the best among them (Castillo et al.,2001a,b). This capability of FN is good for variable selection anddimensionality reduction of candidate input variables. However,a major limitation of the Least-Squares Functional Network is that,
Fig. 9. (a) Initial Functional Network, (b) and (c) its equivalents.
in some cases, the function obtained from the learning process isnot invertible. In this case, the existence of a single optimal value isnot guaranteed (Castillo et al., 2000).
3.3. Framework of the hybrid models
To achieve our aim, two different hybrid models were built: FN-Fuzzy Logic-SVM (FFS) and FN-SVM-Fuzzy Logic (FSF). FN was usedas the base for each of the models. This is due to its functionalapproximation capability and its ability to select the best variablesfor the system directly from the training data.
The following subsections describe the design framework of thetwo hybrid models and the optimized parameters of each of thetechniques before they were used in the hybrids.
3.3.1. FN-Fuzzy Logic-SVM (FFS)This model is composed of three major blocks containing,
respectively: Functional Networks (FN), Type-2 Fuzzy Logic andSupport VectorMachines (SVM) sequentially. The FN block, using itsleast-squares fitting algorithm, was used to select the dominantvariables from the input data. The dominant variables are thosevariables that can explain the most variability in the output. In thisstudy, “dominant variables” or “relevant variables” have been usedto mean “data with best input variables”. The entire data was pro-cessed by the least-squares fitting algorithm and the dominantvariables were extracted. The identified dominant variables wereused in the next blocks of the hybrid models instead of the originaldatasets.
Fig. 10. Initial Topology of FN corresponding to the combined Functional Equations.
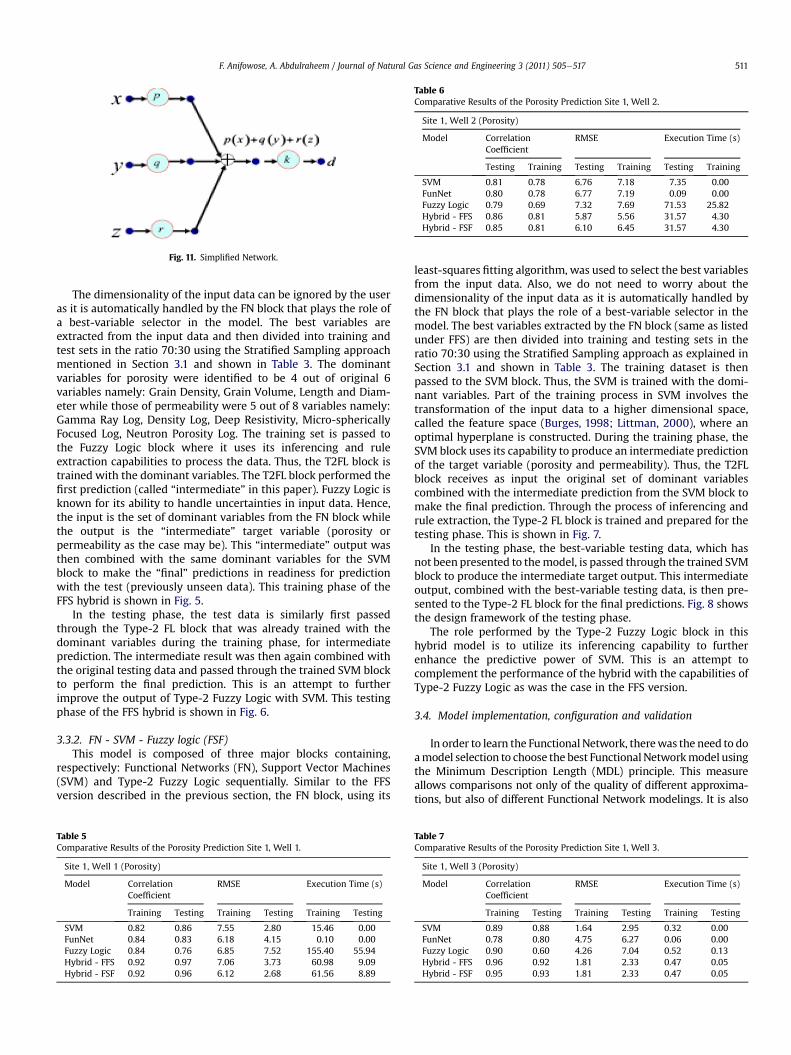
Fig. 11. Simplified Network.
Table 6Comparative Results of the Porosity Prediction Site 1, Well 2.
Site 1, Well 2 (Porosity)
Model CorrelationCoefficient
RMSE Execution Time (s)
Testing Training Testing Training Testing Training
SVM 0.81 0.78 6.76 7.18 7.35 0.00FunNet 0.80 0.78 6.77 7.19 0.09 0.00Fuzzy Logic 0.79 0.69 7.32 7.69 71.53 25.82Hybrid - FFS 0.86 0.81 5.87 5.56 31.57 4.30Hybrid - FSF 0.85 0.81 6.10 6.45 31.57 4.30
F. Anifowose, A. Abdulraheem / Journal of Natural Gas Science and Engineering 3 (2011) 505e517 511
The dimensionality of the input data can be ignored by the useras it is automatically handled by the FN block that plays the role ofa best-variable selector in the model. The best variables areextracted from the input data and then divided into training andtest sets in the ratio 70:30 using the Stratified Sampling approachmentioned in Section 3.1 and shown in Table 3. The dominantvariables for porosity were identified to be 4 out of original 6variables namely: Grain Density, Grain Volume, Length and Diam-eter while those of permeability were 5 out of 8 variables namely:Gamma Ray Log, Density Log, Deep Resistivity, Micro-sphericallyFocused Log, Neutron Porosity Log. The training set is passed tothe Fuzzy Logic block where it uses its inferencing and ruleextraction capabilities to process the data. Thus, the T2FL block istrained with the dominant variables. The T2FL block performed thefirst prediction (called “intermediate” in this paper). Fuzzy Logic isknown for its ability to handle uncertainties in input data. Hence,the input is the set of dominant variables from the FN block whilethe output is the “intermediate” target variable (porosity orpermeability as the case may be). This “intermediate” output wasthen combined with the same dominant variables for the SVMblock to make the “final” predictions in readiness for predictionwith the test (previously unseen data). This training phase of theFFS hybrid is shown in Fig. 5.
In the testing phase, the test data is similarly first passedthrough the Type-2 FL block that was already trained with thedominant variables during the training phase, for intermediateprediction. The intermediate result was then again combined withthe original testing data and passed through the trained SVM blockto perform the final prediction. This is an attempt to furtherimprove the output of Type-2 Fuzzy Logic with SVM. This testingphase of the FFS hybrid is shown in Fig. 6.
3.3.2. FN - SVM - Fuzzy logic (FSF)This model is composed of three major blocks containing,
respectively: Functional Networks (FN), Support Vector Machines(SVM) and Type-2 Fuzzy Logic sequentially. Similar to the FFSversion described in the previous section, the FN block, using its
Table 5Comparative Results of the Porosity Prediction Site 1, Well 1.
Site 1, Well 1 (Porosity)
Model CorrelationCoefficient
RMSE Execution Time (s)
Training Testing Training Testing Training Testing
SVM 0.82 0.86 7.55 2.80 15.46 0.00FunNet 0.84 0.83 6.18 4.15 0.10 0.00Fuzzy Logic 0.84 0.76 6.85 7.52 155.40 55.94Hybrid - FFS 0.92 0.97 7.06 3.73 60.98 9.09Hybrid - FSF 0.92 0.96 6.12 2.68 61.56 8.89
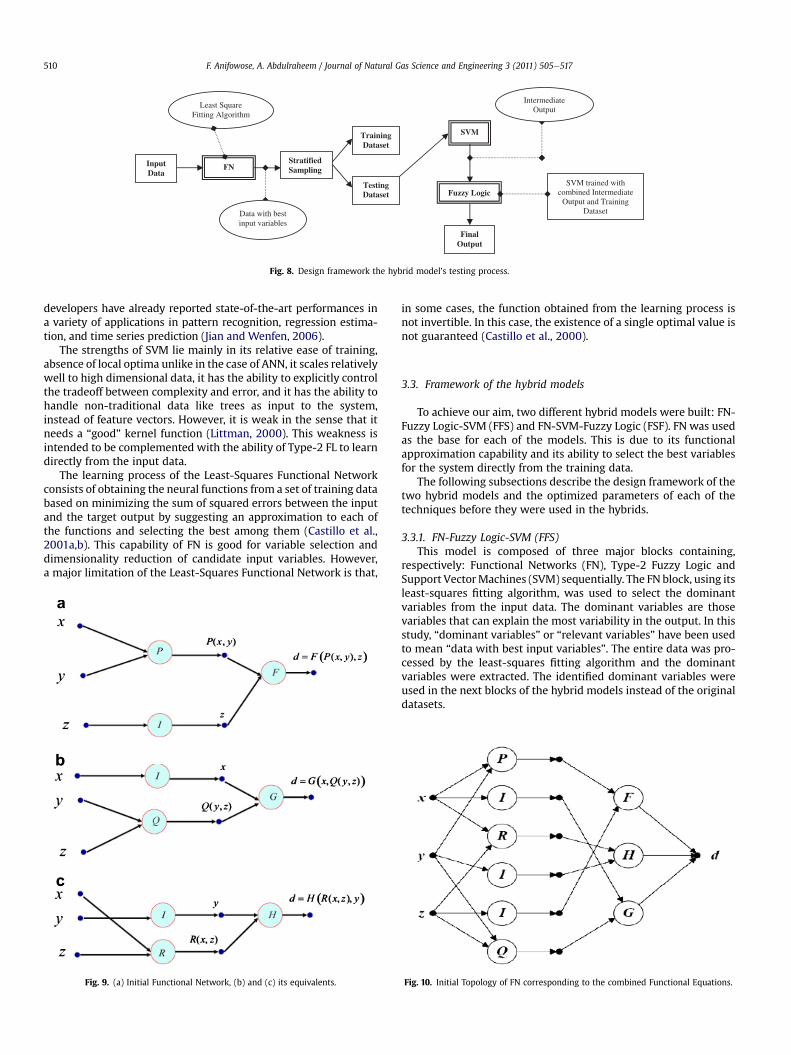
least-squares fitting algorithm, was used to select the best variablesfrom the input data. Also, we do not need to worry about thedimensionality of the input data as it is automatically handled bythe FN block that plays the role of a best-variable selector in themodel. The best variables extracted by the FN block (same as listedunder FFS) are then divided into training and testing sets in theratio 70:30 using the Stratified Sampling approach as explained inSection 3.1 and shown in Table 3. The training dataset is thenpassed to the SVM block. Thus, the SVM is trained with the domi-nant variables. Part of the training process in SVM involves thetransformation of the input data to a higher dimensional space,called the feature space (Burges, 1998; Littman, 2000), where anoptimal hyperplane is constructed. During the training phase, theSVM block uses its capability to produce an intermediate predictionof the target variable (porosity and permeability). Thus, the T2FLblock receives as input the original set of dominant variablescombined with the intermediate prediction from the SVM block tomake the final prediction. Through the process of inferencing andrule extraction, the Type-2 FL block is trained and prepared for thetesting phase. This is shown in Fig. 7.
In the testing phase, the best-variable testing data, which hasnot been presented to themodel, is passed through the trained SVMblock to produce the intermediate target output. This intermediateoutput, combined with the best-variable testing data, is then pre-sented to the Type-2 FL block for the final predictions. Fig. 8 showsthe design framework of the testing phase.
The role performed by the Type-2 Fuzzy Logic block in thishybrid model is to utilize its inferencing capability to furtherenhance the predictive power of SVM. This is an attempt tocomplement the performance of the hybrid with the capabilities ofType-2 Fuzzy Logic as was the case in the FFS version.
3.4. Model implementation, configuration and validation
In order to learn the Functional Network, therewas the need to doamodel selection to choose the best FunctionalNetworkmodel usingthe Minimum Description Length (MDL) principle. This measureallows comparisons not only of the quality of different approxima-tions, but also of different Functional Network modelings. It is also
Table 7Comparative Results of the Porosity Prediction Site 1, Well 3.
Site 1, Well 3 (Porosity)
Model CorrelationCoefficient
RMSE Execution Time (s)
Training Testing Training Testing Training Testing
SVM 0.89 0.88 1.64 2.95 0.32 0.00FunNet 0.78 0.80 4.75 6.27 0.06 0.00Fuzzy Logic 0.90 0.60 4.26 7.04 0.52 0.13Hybrid - FFS 0.96 0.92 1.81 2.33 0.47 0.05Hybrid - FSF 0.95 0.93 1.81 2.33 0.47 0.05
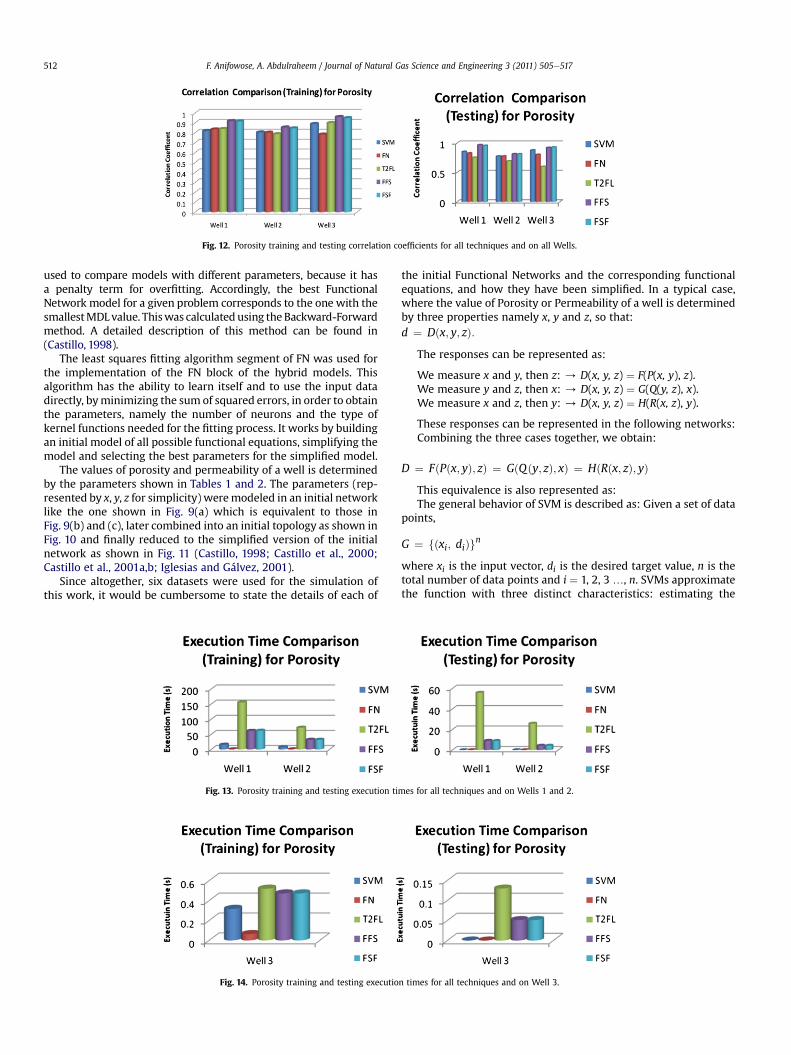
Fig. 12. Porosity training and testing correlation coefficients for all techniques and on all Wells.
F. Anifowose, A. Abdulraheem / Journal of Natural Gas Science and Engineering 3 (2011) 505e517512
used to compare models with different parameters, because it hasa penalty term for overfitting. Accordingly, the best FunctionalNetwork model for a given problem corresponds to the one with thesmallestMDL value. Thiswas calculated using the Backward-Forwardmethod. A detailed description of this method can be found in(Castillo, 1998).
The least squares fitting algorithm segment of FN was used forthe implementation of the FN block of the hybrid models. Thisalgorithm has the ability to learn itself and to use the input datadirectly, byminimizing the sum of squared errors, in order to obtainthe parameters, namely the number of neurons and the type ofkernel functions needed for the fitting process. It works by buildingan initial model of all possible functional equations, simplifying themodel and selecting the best parameters for the simplified model.
The values of porosity and permeability of a well is determinedby the parameters shown in Tables 1 and 2. The parameters (rep-resented by x, y, z for simplicity) weremodeled in an initial networklike the one shown in Fig. 9(a) which is equivalent to those inFig. 9(b) and (c), later combined into an initial topology as shown inFig. 10 and finally reduced to the simplified version of the initialnetwork as shown in Fig. 11 (Castillo, 1998; Castillo et al., 2000;Castillo et al., 2001a,b; Iglesias and Gálvez, 2001).
Since altogether, six datasets were used for the simulation ofthis work, it would be cumbersome to state the details of each of
Fig. 13. Porosity training and testing execution ti
Fig. 14. Porosity training and testing executio
the initial Functional Networks and the corresponding functionalequations, and how they have been simplified. In a typical case,where the value of Porosity or Permeability of a well is determinedby three properties namely x, y and z, so that:d ¼ Dðx; y; zÞ:
The responses can be represented as:
We measure x and y, then z: / D(x, y, z) ¼ F(P(x, y), z).We measure y and z, then x: / D(x, y, z) ¼ G(Q(y, z), x).We measure x and z, then y: / D(x, y, z) ¼ H(R(x, z), y).
These responses can be represented in the following networks:Combining the three cases together, we obtain:
D ¼ FðPðx; yÞ; zÞ ¼ GðQðy; zÞ; xÞ ¼ HðRðx; zÞ; yÞThis equivalence is also represented as:The general behavior of SVM is described as: Given a set of data
points,
G ¼ fðxi; diÞgn
where xi is the input vector, di is the desired target value, n is thetotal number of data points and i ¼ 1, 2, 3 ., n. SVMs approximatethe function with three distinct characteristics: estimating the
mes for all techniques and on Wells 1 and 2.
n times for all techniques and on Well 3.
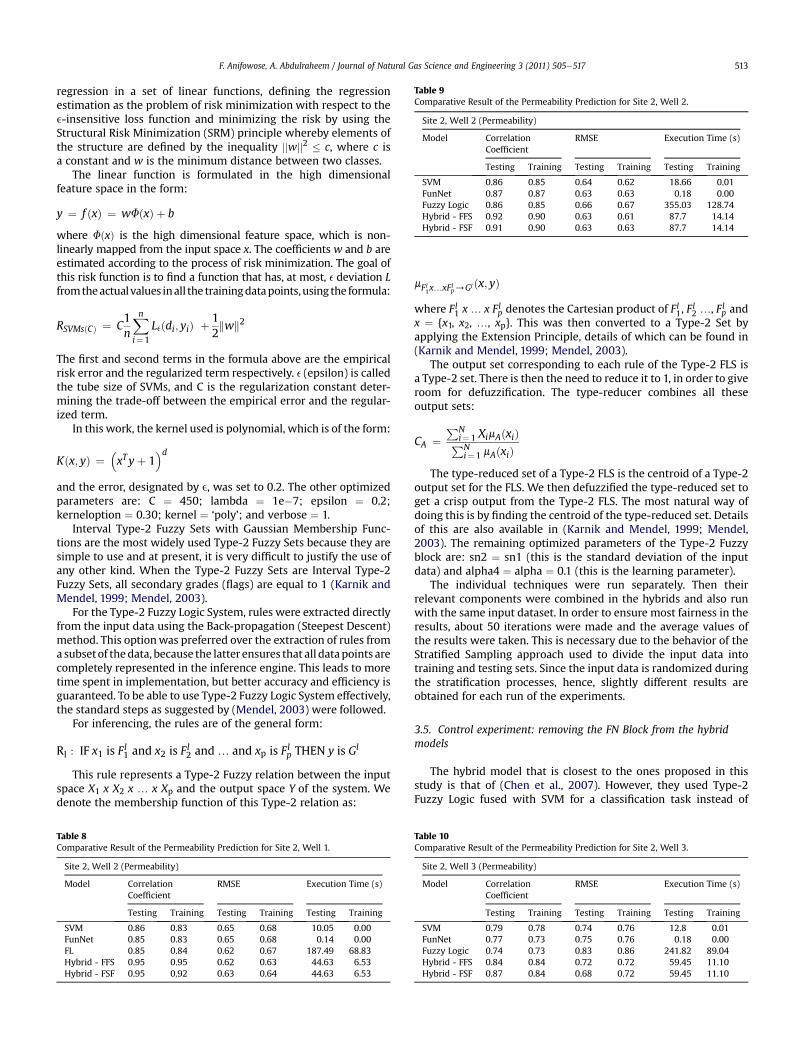
Table 9Comparative Result of the Permeability Prediction for Site 2, Well 2.
Site 2, Well 2 (Permeability)
Model CorrelationCoefficient
RMSE Execution Time (s)
Testing Training Testing Training Testing Training
SVM 0.86 0.85 0.64 0.62 18.66 0.01FunNet 0.87 0.87 0.63 0.63 0.18 0.00Fuzzy Logic 0.86 0.85 0.66 0.67 355.03 128.74Hybrid - FFS 0.92 0.90 0.63 0.61 87.7 14.14Hybrid - FSF 0.91 0.90 0.63 0.63 87.7 14.14
F. Anifowose, A. Abdulraheem / Journal of Natural Gas Science and Engineering 3 (2011) 505e517 513
regression in a set of linear functions, defining the regressionestimation as the problem of risk minimization with respect to thee-insensitive loss function and minimizing the risk by using theStructural Risk Minimization (SRM) principle whereby elements ofthe structure are defined by the inequality jjwjj2 � c, where c isa constant and w is the minimum distance between two classes.
The linear function is formulated in the high dimensionalfeature space in the form:
y ¼ f ðxÞ ¼ wFðxÞ þ b
where FðxÞ is the high dimensional feature space, which is non-linearly mapped from the input space x. The coefficients w and b areestimated according to the process of risk minimization. The goal ofthis risk function is to find a function that has, at most, e deviation Lfromtheactualvalues inall the trainingdatapoints,using the formula:
RSVMsðCÞ ¼ C1n
Xni¼1
Leðdi; yiÞ þ 12kwk2
The first and second terms in the formula above are the empiricalrisk error and the regularized term respectively. e (epsilon) is calledthe tube size of SVMs, and C is the regularization constant deter-mining the trade-off between the empirical error and the regular-ized term.
In this work, the kernel used is polynomial, which is of the form:
Kðx; yÞ ¼�xTyþ 1
�dand the error, designated by e, was set to 0.2. The other optimizedparameters are: C ¼ 450; lambda ¼ 1e�7; epsilon ¼ 0.2;kerneloption ¼ 0.30; kernel ¼ ‘poly’; and verbose ¼ 1.
Interval Type-2 Fuzzy Sets with Gaussian Membership Func-tions are the most widely used Type-2 Fuzzy Sets because they aresimple to use and at present, it is very difficult to justify the use ofany other kind. When the Type-2 Fuzzy Sets are Interval Type-2Fuzzy Sets, all secondary grades (flags) are equal to 1 (Karnik andMendel, 1999; Mendel, 2003).
For the Type-2 Fuzzy Logic System, rules were extracted directlyfrom the input data using the Back-propagation (Steepest Descent)method. This optionwas preferred over the extraction of rules froma subsetof thedata, because the latter ensures that all datapoints arecompletely represented in the inference engine. This leads to moretime spent in implementation, but better accuracy and efficiency isguaranteed. To be able to use Type-2 Fuzzy Logic System effectively,the standard steps as suggested by (Mendel, 2003) were followed.
For inferencing, the rules are of the general form:
Rl : IF x1 is Fl1 and x2 is Fl2 and . and xp is Flp THEN y is Gl
This rule represents a Type-2 Fuzzy relation between the inputspace X1 x X2 x . x Xp and the output space Y of the system. Wedenote the membership function of this Type-2 relation as:
Table 8Comparative Result of the Permeability Prediction for Site 2, Well 1.
Site 2, Well 2 (Permeability)
Model CorrelationCoefficient
RMSE Execution Time (s)
Testing Training Testing Training Testing Training
SVM 0.86 0.83 0.65 0.68 10.05 0.00FunNet 0.85 0.83 0.65 0.68 0.14 0.00FL 0.85 0.84 0.62 0.67 187.49 68.83Hybrid - FFS 0.95 0.95 0.62 0.63 44.63 6.53Hybrid - FSF 0.95 0.92 0.63 0.64 44.63 6.53
mFl1x.xFl
p/Gl ðx; yÞ
where Fl1 x. x Flp denotes the Cartesian product of Fl1, Fl2 ., Flp and
x ¼ {x1, x2, ., xp}. This was then converted to a Type-2 Set byapplying the Extension Principle, details of which can be found in(Karnik and Mendel, 1999; Mendel, 2003).
The output set corresponding to each rule of the Type-2 FLS isa Type-2 set. There is then the need to reduce it to 1, in order to giveroom for defuzzification. The type-reducer combines all theseoutput sets:
CA ¼PN
i¼1 XimAðxiÞPNi¼1 mAðxiÞ
The type-reduced set of a Type-2 FLS is the centroid of a Type-2output set for the FLS. We then defuzzified the type-reduced set toget a crisp output from the Type-2 FLS. The most natural way ofdoing this is by finding the centroid of the type-reduced set. Detailsof this are also available in (Karnik and Mendel, 1999; Mendel,2003). The remaining optimized parameters of the Type-2 Fuzzyblock are: sn2 ¼ sn1 (this is the standard deviation of the inputdata) and alpha4 ¼ alpha ¼ 0.1 (this is the learning parameter).
The individual techniques were run separately. Then theirrelevant components were combined in the hybrids and also runwith the same input dataset. In order to ensure most fairness in theresults, about 50 iterations were made and the average values ofthe results were taken. This is necessary due to the behavior of theStratified Sampling approach used to divide the input data intotraining and testing sets. Since the input data is randomized duringthe stratification processes, hence, slightly different results areobtained for each run of the experiments.
3.5. Control experiment: removing the FN Block from the hybridmodels
The hybrid model that is closest to the ones proposed in thisstudy is that of (Chen et al., 2007). However, they used Type-2Fuzzy Logic fused with SVM for a classification task instead of
Table 10Comparative Result of the Permeability Prediction for Site 2, Well 3.
Site 2, Well 3 (Permeability)
Model CorrelationCoefficient
RMSE Execution Time (s)
Testing Training Testing Training Testing Training
SVM 0.79 0.78 0.74 0.76 12.8 0.01FunNet 0.77 0.73 0.75 0.76 0.18 0.00Fuzzy Logic 0.74 0.73 0.83 0.86 241.82 89.04Hybrid - FFS 0.84 0.84 0.72 0.72 59.45 11.10Hybrid - FSF 0.87 0.84 0.68 0.72 59.45 11.10
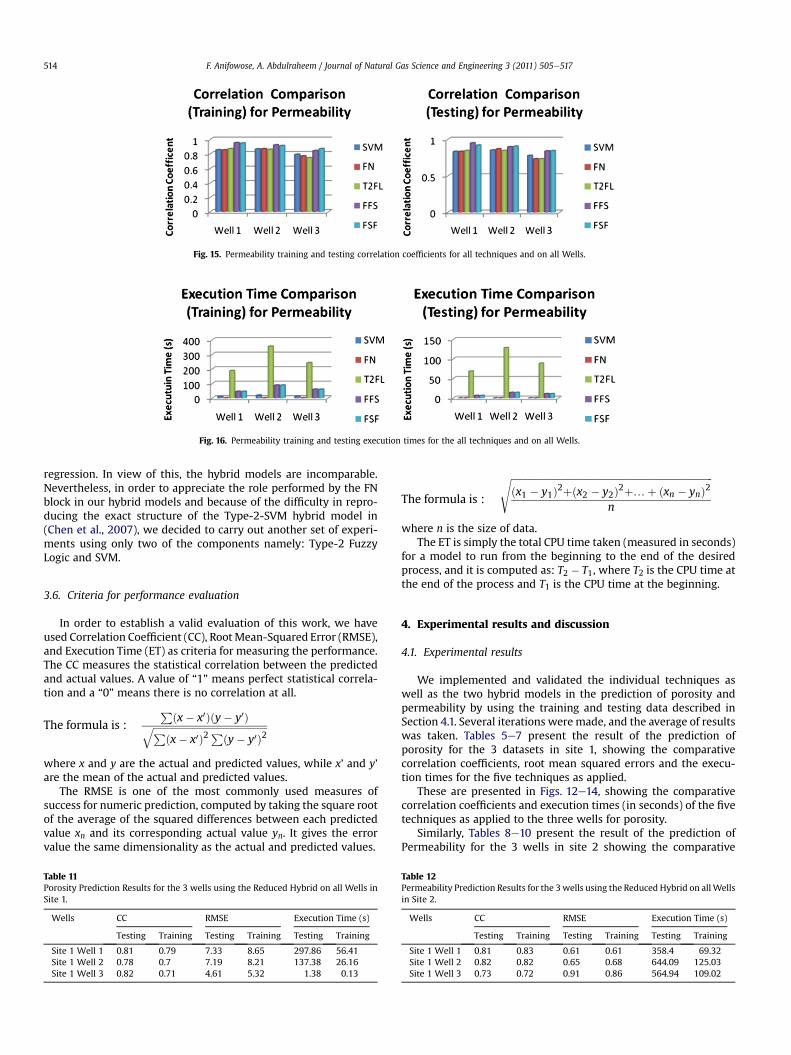
Fig. 15. Permeability training and testing correlation coefficients for all techniques and on all Wells.
Fig. 16. Permeability training and testing execution times for the all techniques and on all Wells.
F. Anifowose, A. Abdulraheem / Journal of Natural Gas Science and Engineering 3 (2011) 505e517514
regression. In view of this, the hybrid models are incomparable.Nevertheless, in order to appreciate the role performed by the FNblock in our hybrid models and because of the difficulty in repro-ducing the exact structure of the Type-2-SVM hybrid model in(Chen et al., 2007), we decided to carry out another set of experi-ments using only two of the components namely: Type-2 FuzzyLogic and SVM.
3.6. Criteria for performance evaluation
In order to establish a valid evaluation of this work, we haveused Correlation Coefficient (CC), RootMean-Squared Error (RMSE),and Execution Time (ET) as criteria for measuring the performance.The CC measures the statistical correlation between the predictedand actual values. A value of “1” means perfect statistical correla-tion and a “0” means there is no correlation at all.
The formula is :Pðx� x0Þðy� y0ÞffiffiffiffiffiffiffiffiffiffiffiffiffiffiffiffiffiffiffiffiffiffiffiffiffiffiffiffiffiffiffiffiffiffiffiffiffiffiffiffiffiffiffiffiffiffiffiPðx� x0Þ2 Pðy� y0Þ2
qwhere x and y are the actual and predicted values, while x’ and y’are the mean of the actual and predicted values.
The RMSE is one of the most commonly used measures ofsuccess for numeric prediction, computed by taking the square rootof the average of the squared differences between each predictedvalue xn and its corresponding actual value yn. It gives the errorvalue the same dimensionality as the actual and predicted values.
Table 11Porosity Prediction Results for the 3 wells using the Reduced Hybrid on all Wells inSite 1.
Wells CC RMSE Execution Time (s)
Testing Training Testing Training Testing Training
Site 1 Well 1 0.81 0.79 7.33 8.65 297.86 56.41Site 1 Well 2 0.78 0.7 7.19 8.21 137.38 26.16Site 1 Well 3 0.82 0.71 4.61 5.32 1.38 0.13
The formula is :
ffiffiffiffiffiffiffiffiffiffiffiffiffiffiffiffiffiffiffiffiffiffiffiffiffiffiffiffiffiffiffiffiffiffiffiffiffiffiffiffiffiffiffiffiffiffiffiffiffiffiffiffiffiffiffiffiffiffiffiffiffiffiffiffiffiffiffiffiffiffiffiffiffiffiffiffiffiffiffiffiffiffiffiðx1 � y1Þ2þðx2 � y2Þ2þ.þ ðxn � ynÞ2
n
s
where n is the size of data.The ET is simply the total CPU time taken (measured in seconds)
for a model to run from the beginning to the end of the desiredprocess, and it is computed as: T2 � T1, where T2 is the CPU time atthe end of the process and T1 is the CPU time at the beginning.
4. Experimental results and discussion
4.1. Experimental results
We implemented and validated the individual techniques aswell as the two hybrid models in the prediction of porosity andpermeability by using the training and testing data described inSection 4.1. Several iterations were made, and the average of resultswas taken. Tables 5e7 present the result of the prediction ofporosity for the 3 datasets in site 1, showing the comparativecorrelation coefficients, root mean squared errors and the execu-tion times for the five techniques as applied.
These are presented in Figs. 12e14, showing the comparativecorrelation coefficients and execution times (in seconds) of the fivetechniques as applied to the three wells for porosity.
Similarly, Tables 8e10 present the result of the prediction ofPermeability for the 3 wells in site 2 showing the comparative
Table 12Permeability Prediction Results for the 3wells using the Reduced Hybrid on allWellsin Site 2.
Wells CC RMSE Execution Time (s)
Testing Training Testing Training Testing Training
Site 1 Well 1 0.81 0.83 0.61 0.61 358.4 69.32Site 1 Well 2 0.82 0.82 0.65 0.68 644.09 125.03Site 1 Well 3 0.73 0.72 0.91 0.86 564.94 109.02

Fig. 17. Comparative correlation coefficient for the hybrids for porosity on all Wells in Site 1.
Fig. 18. Comparative execution time for the 3 hybrids for porosity on Wells 1 and 2 in Site 1.
F. Anifowose, A. Abdulraheem / Journal of Natural Gas Science and Engineering 3 (2011) 505e517 515
correlation coefficients, root mean squared errors and the execu-tion times (in seconds) for the five techniques as applied to thethree permeability wells.
These are also presented in Figs. 15 and 16, showing thecomparative correlation coefficients and execution times (inseconds) of the five techniques as applied to the three wells forpermeability.
Tables 11 and 12 respectively show the comparative results forPorosity and Permeability predictions using the reduced hybridmodel described in Section 3.3.2. This was done in order toappreciate the role performed by the FN block in the FFS and FSFmodels.
Comparisons of the performance of the Type-2-SVMmodel withthe FFS and FSF Hybrids are summarized in Figs. 17e21. Thesefigures show comparative performance of all 3 hybrids models interms of correlation coefficients and execution times (alsomeasured in seconds).
4.2. Discussion of results
In the prediction of porosity and permeability using the FFS andFSF hybrid models, the results showed that the hybrid modelsperformed better than, or competitively equal to, the three
Fig. 19. Comparative execution time for the 3
individual techniques used separately, in terms of their correlationcoefficient. A special characteristic was observed in the result of site1 well 3 for Porosity (Table 7) where SVM demonstrated its abilityto withstand a shortage of training data but FL demonstratedotherwise. Still, the hybrid models performed better than theindividual components due to the cooperative spirit that has beenbuilt into them.
In terms of execution time, the results showed that FunctionalNetworks are the fastest in terms of both training and testing, fol-lowed by SVM. Type-2 Fuzzy Logic took the most time for bothtraining and testing, due to its complexity as described in Section3.2 and Table 4. The hybrid models proved to be faster than theFuzzy Logic component, but not for SVM and FN. This is the price forobtaining better models in terms reliability and robustness.
The root mean-squared errors also showed similar trends. Theywere lowest for the hybrid models. However, since the root mean-squared errors are generally low for all the models, the little vari-ations may not effectively demonstrate the true performance ofthesemodels. Hence, moreweight is given to correlation coefficientand execution time for the evaluation of the models.
When compared to the Type-2-SVM hybrid, used as a controlexperiment, the FFS and FSF Hybrids also proved to be better interms of both correlation coefficient and execution time
hybrids for porosity on Wells 3 in Site 1.
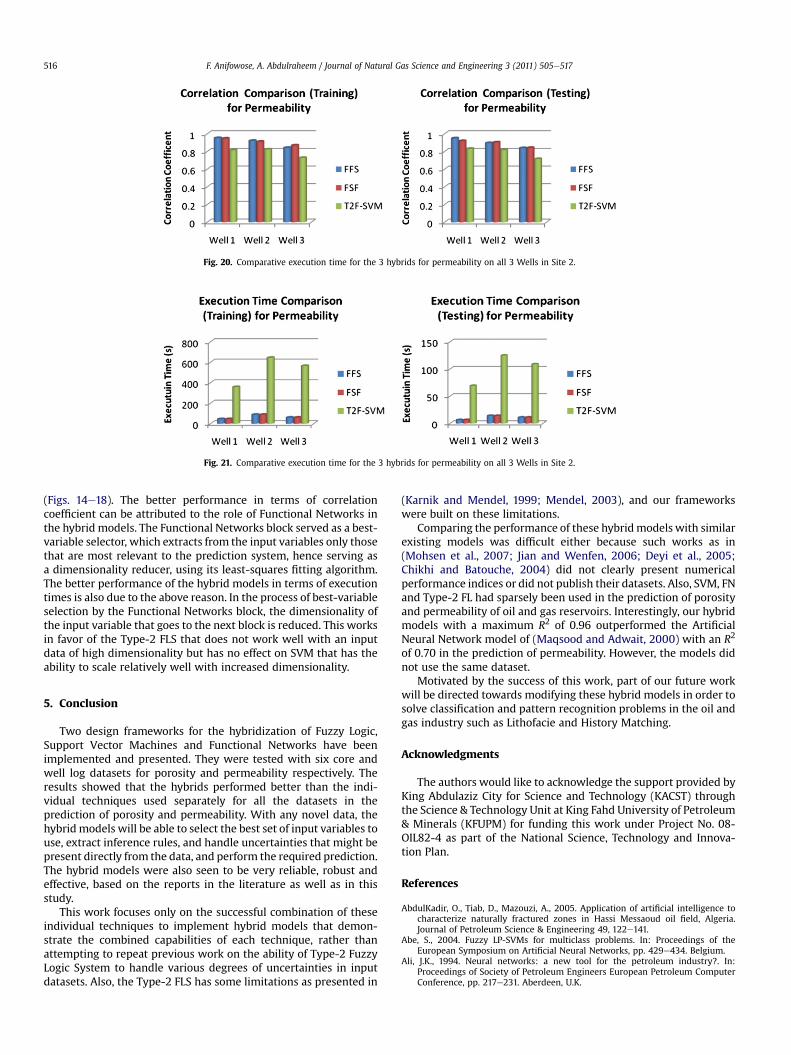
Fig. 20. Comparative execution time for the 3 hybrids for permeability on all 3 Wells in Site 2.
Fig. 21. Comparative execution time for the 3 hybrids for permeability on all 3 Wells in Site 2.
F. Anifowose, A. Abdulraheem / Journal of Natural Gas Science and Engineering 3 (2011) 505e517516
(Figs. 14e18). The better performance in terms of correlationcoefficient can be attributed to the role of Functional Networks inthe hybrid models. The Functional Networks block served as a best-variable selector, which extracts from the input variables only thosethat are most relevant to the prediction system, hence serving asa dimensionality reducer, using its least-squares fitting algorithm.The better performance of the hybrid models in terms of executiontimes is also due to the above reason. In the process of best-variableselection by the Functional Networks block, the dimensionality ofthe input variable that goes to the next block is reduced. This worksin favor of the Type-2 FLS that does not work well with an inputdata of high dimensionality but has no effect on SVM that has theability to scale relatively well with increased dimensionality.
5. Conclusion
Two design frameworks for the hybridization of Fuzzy Logic,Support Vector Machines and Functional Networks have beenimplemented and presented. They were tested with six core andwell log datasets for porosity and permeability respectively. Theresults showed that the hybrids performed better than the indi-vidual techniques used separately for all the datasets in theprediction of porosity and permeability. With any novel data, thehybridmodels will be able to select the best set of input variables touse, extract inference rules, and handle uncertainties that might bepresent directly from the data, and perform the required prediction.The hybrid models were also seen to be very reliable, robust andeffective, based on the reports in the literature as well as in thisstudy.
This work focuses only on the successful combination of theseindividual techniques to implement hybrid models that demon-strate the combined capabilities of each technique, rather thanattempting to repeat previous work on the ability of Type-2 FuzzyLogic System to handle various degrees of uncertainties in inputdatasets. Also, the Type-2 FLS has some limitations as presented in
(Karnik and Mendel, 1999; Mendel, 2003), and our frameworkswere built on these limitations.
Comparing the performance of these hybridmodels with similarexisting models was difficult either because such works as in(Mohsen et al., 2007; Jian and Wenfen, 2006; Deyi et al., 2005;Chikhi and Batouche, 2004) did not clearly present numericalperformance indices or did not publish their datasets. Also, SVM, FNand Type-2 FL had sparsely been used in the prediction of porosityand permeability of oil and gas reservoirs. Interestingly, our hybridmodels with a maximum R2 of 0.96 outperformed the ArtificialNeural Network model of (Maqsood and Adwait, 2000) with an R2
of 0.70 in the prediction of permeability. However, the models didnot use the same dataset.
Motivated by the success of this work, part of our future workwill be directed towards modifying these hybrid models in order tosolve classification and pattern recognition problems in the oil andgas industry such as Lithofacie and History Matching.
Acknowledgments
The authors would like to acknowledge the support provided byKing Abdulaziz City for Science and Technology (KACST) throughthe Science & Technology Unit at King Fahd University of Petroleum& Minerals (KFUPM) for funding this work under Project No. 08-OIL82-4 as part of the National Science, Technology and Innova-tion Plan.
References
AbdulKadir, O., Tiab, D., Mazouzi, A., 2005. Application of artificial intelligence tocharacterize naturally fractured zones in Hassi Messaoud oil field, Algeria.Journal of Petroleum Science & Engineering 49, 122e141.
Abe, S., 2004. Fuzzy LP-SVMs for multiclass problems. In: Proceedings of theEuropean Symposium on Artificial Neural Networks, pp. 429e434. Belgium.
Ali, J.K., 1994. Neural networks: a new tool for the petroleum industry?. In:Proceedings of Society of Petroleum Engineers European Petroleum ComputerConference, pp. 217e231. Aberdeen, U.K.
F. Anifowose, A. Abdulraheem / Journal of Natural Gas Science and Engineering 3 (2011) 505e517 517
Anifowose, F., Abdulraheem, A., 14-17 February, 2010. Prediction of Porosity andPermeability of Oil and Gas Reservoirs Using Hybrid Computational IntelligenceModels SPE Paper 126649-MS-P Presented at the North Africa TechnicalConference and Exhibition, Cairo, Egypt.
Burges, C.J., 1998. A tutorial on support vector machines for pattern recognition.Data Mining and Knowledge Discovery 2, 121e167.
Castillo, E., Hadi, S., Lacruz, B., 2001a. Optimal transformations in multiple linearregression using functional networks, international work-conference on artifi-cial and natural neural networks. Lecture Notes in Computer Science, Series2084, 316e324.
Castillo, O., Melin, P., 2008. Intelligent systems with interval type-2 Fuzzy logic.International Journal of Innovative Computing, Information and Control 4(No.4), 771e784.
Castillo, E., Gutiérrez, J., Cobo, A., Castillo, C., 2000. A minimax method for learningfunctional networks. Neural Processing Letters 11, 39e49.
Castillo, E., Gutiérrez, J., Hadi, S., Lacruz, B., 2001b. Some applications of functionalnetworks in statistics and engineering. Technometrics 43, 10e24.
Castillo, E., 1998. Functional networks. Neural Processing Letters 7, 151e159.Chen, X., Li, Y., Harrison, R., Zhang, Y.Q., 2007. Type-2 Fuzzy logic based classifier
fusion for support vector machines. Applied Soft Computing Journal.doi:10.1016/j.asoc.2007.02.019.
Chikhi, S., Batouche, M., 2004. Probabilistic neural method combined with radial-bias functions applied to reservoir characterization in the Algerian Triassicprovince. Journal of Geophysics and Engineering 1, 134e142.
Deyi, X., Dave, W., Tina, Y., San, R., 2005. Permeability Estimation Using a HybridGenetic Programming and Fuzzy/Neural Inference Approach. Society of Petro-leum Engineers Annual Technical Conference and Exhibition, Dallas, Texas,U.S.A.
Duch, W., Adamczak, R., Jankowski, N., 1997. Initialization and Optimization ofMultilayered Perceptrons, Third Conference on Neural Networks and TheirApplications. Kule, Poland.
Fang, J.H., Chen, H.C., 1997. Fuzzy modeling and the prediction of porosity andpermeability from the compositional and textural attributes of sandstone.Journal of Petroleum Geology 20 (2), 185e204.
Giovanni, A., Vincenzo, L., 2005. Using FML and Fuzzy technology in adaptiveambient intelligence environments. International Journal of ComputationalIntelligence Research 1 (No. 2), 171e182.
Goda, H.M., Behrenbruch, H.R., 2007. Use of Artificial Intelligence Techniques forPredicting Irreducible Water Saturation in Australian Hydrocarbons Basins.Society of Petroleum Engineers Asia Pacific Oil & Gas Conference and Exhibi-tion, Jakarta, Indonesia.
L. Guojie, Radial Basis Function Neural Network for Speaker Verification, A Masterof Engineering thesis, the Nanyang Technological University, Singapore (2004).
Habibi, J., Moshiri, B., Sedigh, A.K., 2008. Contractive predictive control of mixedlogical dynamical hybrid systems. International Journal of InnovativeComputing, Information and Control 4 (No.6), 1283e1298.
He, J., 2008. Computational Intelligence, Research Interests. http://www.cs.bham.ac.uk/%7Ejxh/hejunrs.html.
Helmy, T., Anifowose, F., Faisal, K., January, 2010. Hybrid computational models forthe characterization of oil and gas reservoirs. Elsevier International Journal ofExpert Systems with Applications 37, 5353e5363. doi:10.1016/j.eswa.2010.01.021.
Hosmer, D., Lemeshow, S., 2000. Applied Logistic Regression. John Wiley and Sons.392 pages.
Iglesias, A., Gálvez, A., 2001. Applying Functional Networks to Fit Data Points fromB-Spline Surfaces. Computer Graphics International (CGI’01), pp. 329e332.
Jian, H., Wenfen, H., 2006. Novel approach to predict potentiality of enhanced oilrecovery. In: Proceedings of the Society of Petroleum Engineers IntelligentEnergy Conference and Exhibition Amsterdam, The Netherlands.
Karnik, N., Mendel, J., 1999. Type-2 Fuzzy logic systems. IEEE Transactions on FuzzySystems 7 (No. 6).
Lauría, J.M., Duchessi, J.P., 2006. A Bayesian Belief Network for IT ImplementationDecision Support, a Technical Presentation on Decision Support Systems at theInternational Federation for Information Processing International Conferenceon Decision Support Systems.
Least Squares-SVM (LS-SVM), Basic Version available at: http://www.esat.kuleuven.be/sista/lssvmlab/.
Lim, J., 2005. Reservoir properties determination using Fuzzy logic and neuralnetworks from well data in offshore Korea. Journal of Petroleum Science andEngineering 49, 182e192.
Littman, W., 2000. Introduction to support vector machines. Lecture Notes inComputer Science (LNCS) 536.
Maqsood, A., Adwait, C., 2000. Using artificial intelligence to predict permeabilityfrom petrographic data. Computers & Geosciences 26, 915e925.
Professor Mendel’s MATLAB Codes for Type-2 Fuzzy Logic System from his book’swebsite: sipi.usc.edu/%7Emendel/software/.
Mendel, J., 2003. Type-2 fuzzy sets: some questions and answers. IEEE Connections,Newsletter of the IEEE Neural Networks Society 1, 10e13.
Mohsen, S., Morteza, A., Ali, Y.V., 2007. Design of neural networks using geneticalgorithm for the permeability estimation of the reservoir. Journal of PetroleumScience and Engineering 59, 97e105.
Munakata, T., 2008. Fundamentals of the New Artificial Intelligence Neural,Evolutionary, Fuzzy and More, second ed. Springer Science þ Business Media.
Nong, Y., 2003. The Handbook of Data Mining. Lawrence Erlbaum Associates, pp.561e617.
Peddabachigari, S., Abraham, A., Grosan, C., Thomas, J., 2007. Modeling intrusiondetection system using hybrid intelligent systems. Journal of Network andComputer Applications 30, 114e132.
Phillips-Wren, G., Ichalkaranje, N., Jain, C., 2008. Intelligent Decision Making: An AI-Based Approach, Studies in Computational Intelligence, vol. 97. Springer-Verlag,Berlin Heidelberg, pp. 88e355.
A. Salah, S. Rahman, K. Nath, An Enhancement of k-Nearest Neighbor ClassificationUsing Genetic Algorithm, Technical Presentation, Midwest Instruction andComputing Symposium (2005).
Schlumberger Excellence in Educational Development, 2007a. Science Lab Projectfor Porosity. http://www.seed.slb.com/en/scictr/lab/porosity/index.htm.
Schlumberger Excellence in Educational Development, 2007b. Science Lab Project forPermeability. http://www.seed.slb.com/en/scictr/lab/permeability/index.htm.
Salim, C., 2006. A Fuzzy ART versus Hybrid NN-HMM Methods for LithologyIdentification in the Triassic Province, vol. 1. 2nd Information and Communi-cation Technologies (ICTTA ’06). 1884e1887.
Software Repository of Enrique Castillo’s Artificial Intelligence Research Group:http://ccaix3.unican.es/%7EAIGroup.
Sun, Z., Au, K., Choi, T., 2007. A neuro-Fuzzy inference system through integration ofFuzzy logic and extreme learning machines. IEEE Transactions on Systems, Manand Cybernetics 37 (No. 5), 1321e1331.
Symeonidis, L.A., Mitkas, A.P., 2005. Agent Intelligence through Data Mining, Mul-tiagent Systems, Artificial Societies, and Simulated Organizations Series. In:International Book Series, vol. 14.
Taboada, J., Matías, J.M., Ordóñez, C., García, P.J., 2007. Creating a quality map ofa slate deposit using support vector machines. Elsevier Journal of Computa-tional and Applied Mathematics 204, 84e94.
Triantaphyllou, E., Felici, G., 2006. Data Mining and Knowledge DiscoveryApproaches Based on Rule Induction Techniques. Springer Science þ BusinessMedia, Pp. 48.
Wang, L., Fu, X., 2005. Data Mining with Computational Intelligence. Springer-Verlag, Berlin Heidelberg, Pp. 229.
Wang, Y., 2008. Fuzzy clustering analysis by using genetic algorithm, innovativecomputing. Information and Control Express Letters 2 (No.4), 331e337.
Xing, Y., Wu, X., Xu, Z., 2008. Multiclass least squares auto-correlation waveletsupport vector machines. International Journal of Innovative Computing,Information and Control Express Letters 2 (No. 4), 345e350.