Fuzzy logic and rigid control of a seeded semi-batch, anti-solvent, isothermal crystallizer
12
Chemical Engineering Science 63 (2008) 991 – 1002 www.elsevier.com/locate/ces Fuzzy logic and rigid control of a seeded semi-batch, anti-solvent, isothermal crystallizer M. Sheikhzadeh, M. Trifkovic, S. Rohani ∗ Department of Chemical and Biochemical Engineering, The University of Western Ontario, London, Ont., Canada N6A 5B9 Received 26 September 2006; received in revised form 5 October 2007; accepted 13 October 2007 Available online 11 December 2007 Abstract The objective of this study was to investigate the closed-loop control strategy for a batch crystallizer using two different control methods. The isothermal crystallization of paracetamol (PA) in isopropanol–water mixtures at 20 ◦ C was used as the model system. The annuated total reflectance-Fourier transform infrared spectroscopy (ATR-FTIR) and the focus beam reflectance measurement (FBRM) were used for in situ measurement of the concentration of paracetamol and chord length counts, respectively. The controlled variables were the supersaturation and the difference in the chord length counts between two sampling intervals and the manipulated variable was the anti-solvent (water) flow rate. The rigid logic control (RLC) and the fuzzy logic control (FLC) were applied. The direct objective of this study was to maintain the controlled variables inside their predetermined ranges. The indirect objectives were minimization of the batch time and maximizing the final crystals size and they were closely related to the meeting of the direct objectives. The experiments conducted with FLC resulted in approximately 30% reduction of time of the experiment and an increase of 80 m in the final volume weighted mean size. 2007 Elsevier Ltd. All rights reserved. Keywords: Semi-batch crystallization; Fuzzy logic control; In situ measurement; Supersaturation; Paracetamol 1. Introduction Crystallization from solution is an industrially important unit operation due to its ability to provide high purity separation. The crystal size distribution (CSD) is important in the produc- tion of high quality products and affects the efficiency of down- stream operations, such as filtration and washing. Semi-batch crystallizers are heavily used in industry, and the majority of these crystallizers are seeded. It is well known that control of the supersaturation has a strong influence on the CSD and crys- tallization time (Chung et al., 1999). Recent improvement of technology for on-line measurement of concentration and size distribution have allowed for the control and optimization of crystallization processes. Recently, Zhou et al. (2006) and Yu et al. (2006) have proposed the feedback control strategy for controlling the supersaturation by manipulating the anti-solvent addition rate. ∗ Corresponding author. E-mail address: [email protected] (S. Rohani). 0009-2509/$ - see front matter 2007 Elsevier Ltd. All rights reserved. doi:10.1016/j.ces.2007.10.024 Fuzzy set theory has been used successfully in all the techni- cal fields, including controls, modeling, image/signal process- ing and expert systems. The most successful and active field, however, is fuzzy control. The primary thrust of this control scheme is to utilize the human operator’s knowledge and ex- perience to emulate human controller behavior. The important advantage of fuzzy controllers is that a mathematical model of the system to be controlled is not required, and a satisfactory nonlinear controller can often be developed empirically with- out complicated mathematics ( Ying, 2000). Another advantage of fuzzy logic control (FLC) is an easy implementation and ability to control several controlled variables by less number of manipulated variables. This is extremely beneficial in processes where huge interaction between parameters exists. This study is the first comprehensive investigation of the use of a single input/multi output FLC of a semi-batch seeded crystallizer. The performance of the FLC was compared with a rigid logic controller (RLC), using a look-up table. The system considered was the anti-solvent (water) crystallization of paracetamol in isopropanol and water mixture at 20 ◦ C.
Transcript of Fuzzy logic and rigid control of a seeded semi-batch, anti-solvent, isothermal crystallizer
Chemical Engineering Science 63 (2008) 991–1002www.elsevier.com/locate/ces
Fuzzy logic and rigid control of a seeded semi-batch, anti-solvent,isothermal crystallizer
M. Sheikhzadeh, M. Trifkovic, S. Rohani∗
Department of Chemical and Biochemical Engineering, The University of Western Ontario, London, Ont., Canada N6A 5B9
Received 26 September 2006; received in revised form 5 October 2007; accepted 13 October 2007Available online 11 December 2007
Abstract
The objective of this study was to investigate the closed-loop control strategy for a batch crystallizer using two different control methods.The isothermal crystallization of paracetamol (PA) in isopropanol–water mixtures at 20 ◦C was used as the model system. The annuated totalreflectance-Fourier transform infrared spectroscopy (ATR-FTIR) and the focus beam reflectance measurement (FBRM) were used for in situmeasurement of the concentration of paracetamol and chord length counts, respectively. The controlled variables were the supersaturation andthe difference in the chord length counts between two sampling intervals and the manipulated variable was the anti-solvent (water) flow rate.The rigid logic control (RLC) and the fuzzy logic control (FLC) were applied. The direct objective of this study was to maintain the controlledvariables inside their predetermined ranges. The indirect objectives were minimization of the batch time and maximizing the final crystals sizeand they were closely related to the meeting of the direct objectives. The experiments conducted with FLC resulted in approximately 30%reduction of time of the experiment and an increase of 80 �m in the final volume weighted mean size.� 2007 Elsevier Ltd. All rights reserved.
Keywords: Semi-batch crystallization; Fuzzy logic control; In situ measurement; Supersaturation; Paracetamol
1. Introduction
Crystallization from solution is an industrially important unitoperation due to its ability to provide high purity separation.The crystal size distribution (CSD) is important in the produc-tion of high quality products and affects the efficiency of down-stream operations, such as filtration and washing. Semi-batchcrystallizers are heavily used in industry, and the majority ofthese crystallizers are seeded. It is well known that control ofthe supersaturation has a strong influence on the CSD and crys-tallization time (Chung et al., 1999). Recent improvement oftechnology for on-line measurement of concentration and sizedistribution have allowed for the control and optimization ofcrystallization processes. Recently, Zhou et al. (2006) and Yuet al. (2006) have proposed the feedback control strategy forcontrolling the supersaturation by manipulating the anti-solventaddition rate.
∗ Corresponding author.E-mail address: [email protected] (S. Rohani).
0009-2509/$ - see front matter � 2007 Elsevier Ltd. All rights reserved.doi:10.1016/j.ces.2007.10.024
Fuzzy set theory has been used successfully in all the techni-cal fields, including controls, modeling, image/signal process-ing and expert systems. The most successful and active field,however, is fuzzy control. The primary thrust of this controlscheme is to utilize the human operator’s knowledge and ex-perience to emulate human controller behavior. The importantadvantage of fuzzy controllers is that a mathematical model ofthe system to be controlled is not required, and a satisfactorynonlinear controller can often be developed empirically with-out complicated mathematics (Ying, 2000). Another advantageof fuzzy logic control (FLC) is an easy implementation andability to control several controlled variables by less number ofmanipulated variables. This is extremely beneficial in processeswhere huge interaction between parameters exists.
This study is the first comprehensive investigation of theuse of a single input/multi output FLC of a semi-batch seededcrystallizer. The performance of the FLC was compared witha rigid logic controller (RLC), using a look-up table. Thesystem considered was the anti-solvent (water) crystallizationof paracetamol in isopropanol and water mixture at 20 ◦C.
992 M. Sheikhzadeh et al. / Chemical Engineering Science 63 (2008) 991–1002
The main aim of this work was to check the use of fuzzy logic tocontrol the supersaturation and stabilize the number of particlesin a specific size range, which were considered as direct ob-jectives. The indirect objectives were improving the batch timeand CSD.
The FLC and RLC methods were used in the feedback controlloop, which kept the controlled variables in their preset ranges.Due to the high effect of these variables on batch time and CSD,the controllers’ performances were reflected on achieving theindirect objectives as well.
2. Theory
2.1. Fuzzy controller theory
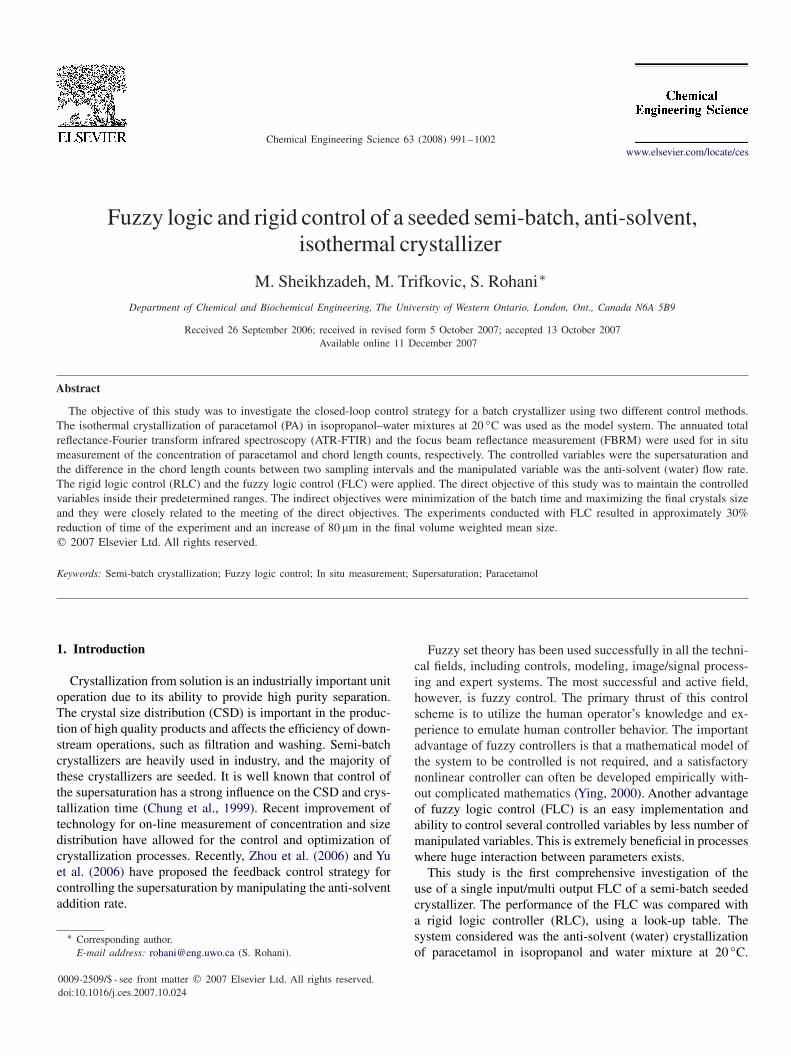
FLC was initially conceptualized and implemented by Mam-dani (Gupta and Qi, 1991) in a successful attempt to control aboiler steam engine. FLC can be viewed as a dynamic expertsystem involving a fuzzy rule base (FRB). The associated fuzzyinference engine (FIE) depicted in Fig. 1 is the tool for per-forming fuzzy inferences. Information from the system leads tofuzzy decision-making via the firing of rules in the FRB throughthe application of fuzzy set calculations. The decisions of thefuzzy expert system are then translated into control actions atthe actuator level. A brief background to the fuzzy set theoryand fuzzy calculus that forms the framework for the design andformulation of the fuzzy logic controller is presented below.
2.1.1. Fuzzy sets and operationsFuzzy controllers perform fuzzy-set operations. If we assume
that U denotes the universe of discourse, the fuzzy set in U is
Fig. 1. Block diagram of the experimental setup and the fuzzy logic controller.
defined as A. This fuzzy set is characterized by a membershipfunction (�A) that maps A to a finite closed interval [0,1]. Thiscorrelation can be described by the following notation:
�A : A → [0, 1]. (1)
Unlike the binary AND and OR operators whose operationsare uniquely defined, the fuzzy counterparts are non-unique. Toa large extent, the Zadeh fuzzy AND and OR operators havebeen found to be most useful for fuzzy control (Takagi andSugeno, 1985). Their definitions are as follows:
AND : �A∩B(x) = min(�A(x), �B(x)),
OR : �A∪B(x) = max(�A(x), �B(x)), (2)
where A and B are fuzzy sets and �A and �B their membershipfunctions.
2.1.2. FuzzificationFuzzy control and modeling always involve a process called
fuzzification at every sampling time. Fuzzification is a math-ematical procedure for converting an element of U into themembership value of a fuzzy set. The result of fuzzification ofx ∈ A is represented by �A(x).
2.1.3. Fuzzy rulesA fuzzy controller uses fuzzy rules, which are linguistic
IF–THEN statements. Fuzzy rules link the input variablesof fuzzy controllers to output variables. Based on Mamdani(Takagi and Sugeno, 1985), the IF–THEN fuzzy rule can bedescribed as follows:
IF (x1 is Ai) AND (x2 is Bi) THEN (u1 is Ci), (3)
M. Sheikhzadeh et al. / Chemical Engineering Science 63 (2008) 991–1002 993
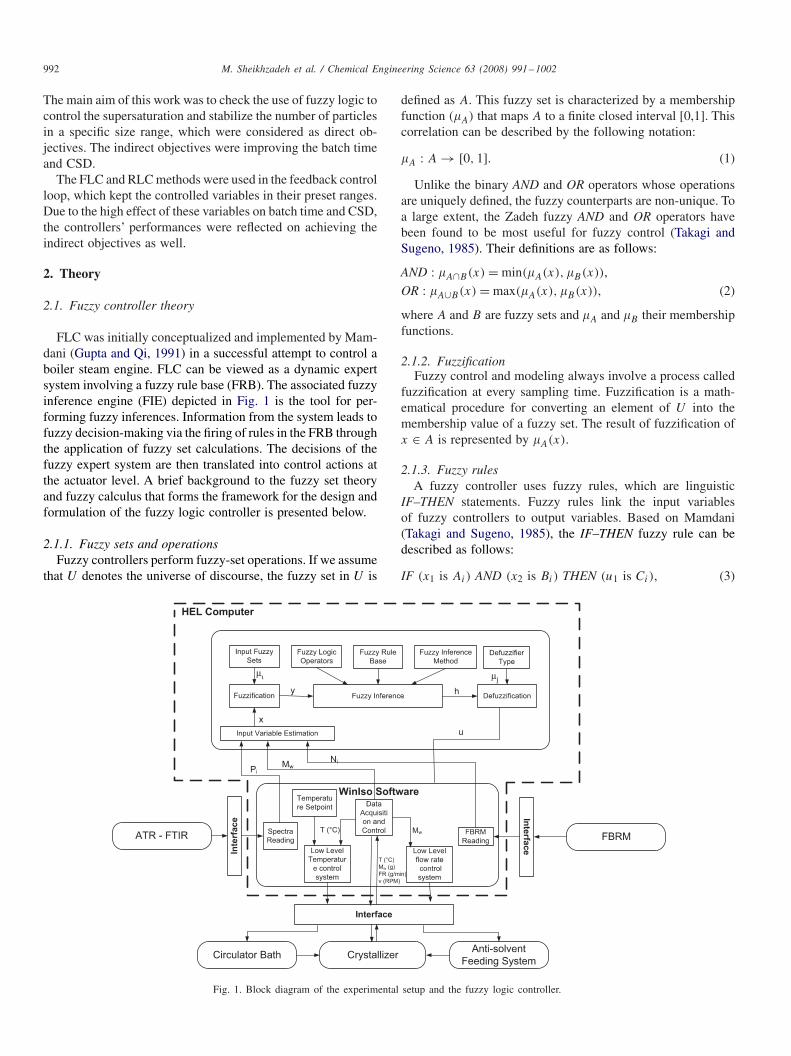
Fig. 2. Experimental setup.
where x1 and x2 are fuzzy input variables and u1 is fuzzy outputvariable. Ai , Bi and Ci are fuzzy subsets and AND is a fuzzylogic operator.
2.1.4. Fuzzy inferenceTo define the relationship between fuzzy sets of inputs and
outputs, fuzzy inference should be established. In Eq. (3), cal-culating the response to the IF clause is referred to as fuzzyinference. A number of fuzzy inference methods can be usedto accomplish this task but only some of them are very popu-lar in fuzzy control. A popular fuzzy inference method is theMamdani minimum inference method. Eq. (3), in general, canbe written:
IF x1 is S1 AND . . . AND xM is SM THEN u1 is W1, . . . , zp is Wp, (4)
where xi (i = 1, . . . , M) is the vector of fuzzy input variables(process outputs) and uj (j = 1, . . . , P ) is the fuzzy outputvariables (process inputs). Si is the input fuzzy set and Wj isthe output fuzzy set. Then, the Mamdani inference rule will beexpressed as follows:
RM = min(�s , �W(u)) for all u, (5)
where RM denotes the Mamdani minimum inference methodand � is the final membership yielded by fuzzy logic ANDoperator in the rule antecedent.
2.1.5. DefuzzificationDefuzzification is a mathematical process used to convert
a fuzzy set or fuzzy sets to a real number. It is a necessarystep in the implementation of a fuzzy controller. Perhaps themost popular defuzzification method is the centroid calculation,which returns the center of the area under a curve. Assume thatthe output variable of a fuzzy controller is u, and that evaluatingN fuzzy rules using some fuzzy inference method produces Nmembership values, �1, . . . , �N , for N single output fuzzy sets.If these fuzzy sets are nonzero only at u = �1, . . . , �N , thegeneralized defuzzifier produces the following defuzzificationresult (Sarma, 2001):
u =∑N
k=1��k · �k∑N
k=1��k
, (6)
where � is a design parameter that can vary in the interval0���∞. When� = 1, the centroid defuzzifier is obtained.Before using defuzzifier, the resulting membership function ofthe output (�W) has to be calculated in terms of aggregationoperator MAX and implication operator MIN (Carvalho andDurao, 2002).
994 M. Sheikhzadeh et al. / Chemical Engineering Science 63 (2008) 991–1002
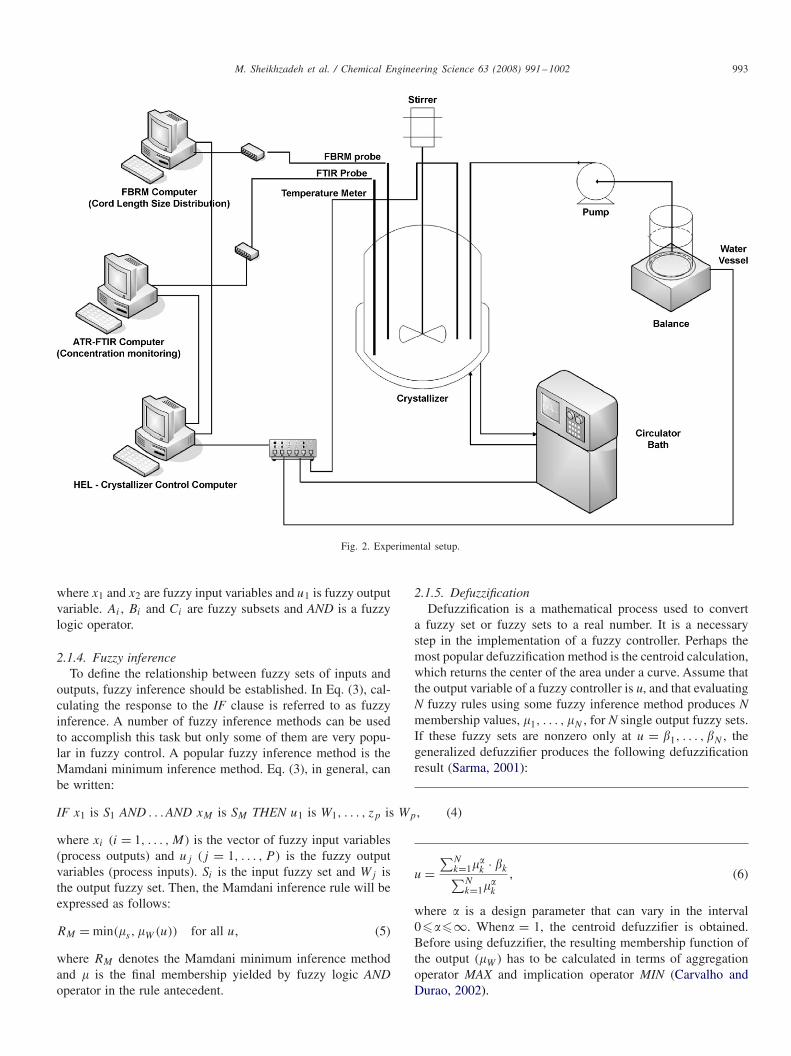
Fig. 3. FTIR spectra for seeded semi-batch crystallization: (a) during the entire crystallization experiment, (b) at one sampling time.
2.2. The rigid controller theory
Sometimes, rigid information for process variables, con-straints and operation conditions exist and can be used todevelop a controller.
By dividing the input and output values to logic sets, constantvalue of outputs can be obtained for each logic set of inputs.IF . . . THEN . . . structure can be applied for each logic sets ofinputs. Eq. (7) shows the two possible logic structures used inthis study
⎧⎪⎨⎪⎩
IF x1 is E1 AND . . . AND xM is EM1 THEN u1 = K,
IF x1 is E2 AND . . . AND xM is EM2 THEN
u1 = f (x1, . . . , xM)
(7)
where x1 → xM are the inputs, E1 → EM1, E2 → EM2 arethe input conditions and u1 is the output which can be assignedeither a constant value C, or be expressed as a function of inputsf (x1, . . . , xM).
3. Experimental setup
The experiments were performed in a 1-L glass jacketed ves-sel (Simular, Automated Chemical Reactors and Calorimeters;HEL Ltd., Vinelean, NJ). A Huber bath circulator was usedfor keeping the temperature inside the vessel constant through-out the crystallization process. This was performed by a twolevel cascade control system. A Teflon-coated thermocouplewas used for reading the temperature in the flasks. A meteringpump (Gala 1602) was used for pumping water, which was usedas an anti-solvent in the crystallization process. The solutionwas stirred by a four-bladed propeller. An electronic balance(Oxford, B41002) was used for recording the amount of theanti-solvent added to the solution. The in situ focus beam re-flectance measurement (FBRM) probe (Metler Toledo, Red-mond, WA) was used to measure the chord length counts of thecrystals during the process. An in situ annuated total reflectance-Fourier transform infrared spectroscopy (ATR-FTIR) (Hamil-ton Sundstrand, CA and DMD-270 diamond ATR immersionprobe) was used for on-line measurement of the solute con-centration in the solution. The probes also served as baffles in

M. Sheikhzadeh et al. / Chemical Engineering Science 63 (2008) 991–1002 995
Table 1The rigid logic control look-up decision table
SS (gsolute/gsolvent) �N1.50 FR (g/min)
�0.002 N/A 30.002–0.0025 −10 <�N1.50 < 10 3
< − 10 3> 10 2.8
0.0025–0.003 > 10 2.6< − 10 2.1−10 <�N1.50 < 10 2.8
0.003–0.005 −10 <�N1-50 < 10 −562.5 SS + 4.1> 10 −562.5 SS + 3.9< − 10 −562.5 SS + 4.3
0.005–0.0055 −10 <�N1.50 < 10 0.9< − 10 1.1> 10 0.95
0.0055–0.006 −10 <�N1.50 < 10 0.2< − 10 0.4> 10 0.2
> 0.006 N/A 0.2
Scheme 1. Paracetamol chemical structure.
the system. The experimental setup is shown in Fig. 2. CSD ofthe final product was measured by Malvern 2000 SCIRRCCO(Malvern Instruments Ltd., UK).
3.1. Materials
Paracetamol (acetaminophen or 4-acetamidophenol) 98%was purchased from Aldrich Chemical Company Inc. (MO,USA). HPLC grade isopropanol was purchased from EMDChemical Inc. (NJ, USA). Form 1 of paracetamol was usedand no transformation to other forms was observed duringthe experiments. The final product was checked by XRPD toconfirm the polymorphic composition.
3.2. Concentration measurement
The ATR-FTIR was used to identify the presence of cer-tain functional groups in paracetamol and isopropanol. Distinctchanges in the spectra due to paracetamol crystallization canbe observed in Fig. 3(a). Fig. 3(b) shows single spectra at onesampling time.
The quantification of the ATR-FTIR spectra for paraceta-mol was based on the analysis of the height of four differ-ent peaks at 1030, 1245.8, 1515.8 and 1710 cm−1. Scheme 1depicts the chemical structure of paracetamol. The strongestband in the spectra was due to C&O stretching vibration at
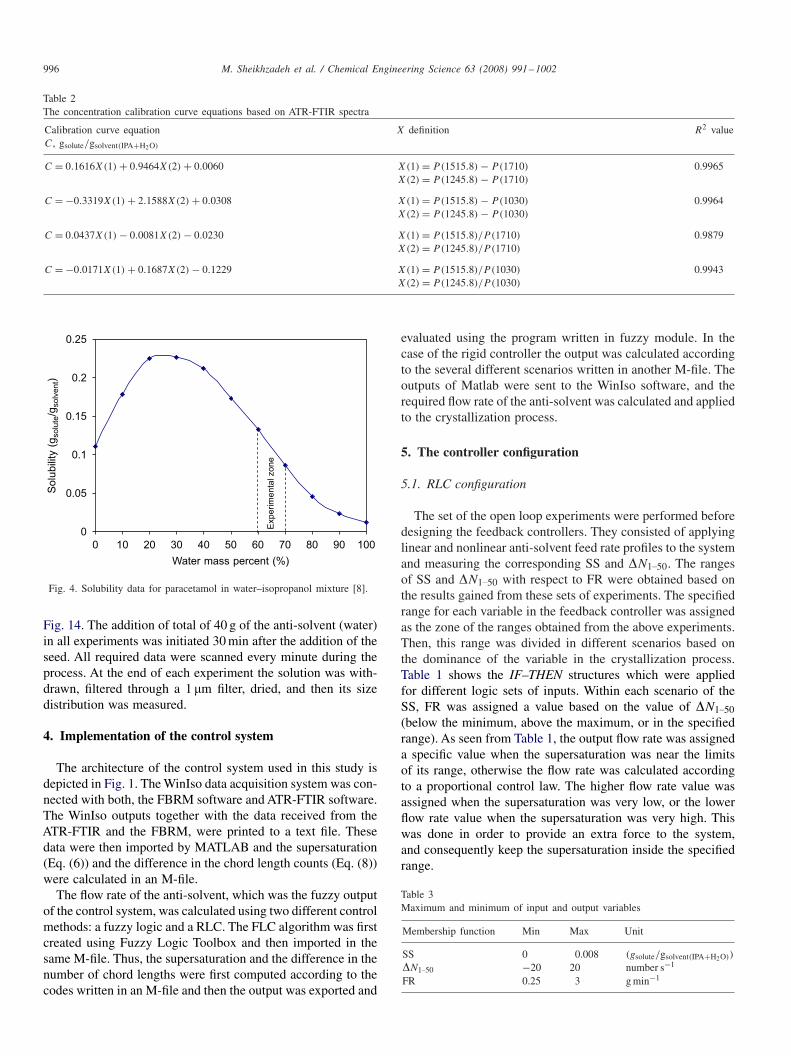
1245.8 cm−1. The band associated with O.H stretching vibra-tion was found at 1030 cm−1. The band due to C–H stretchingvibration was present at 1515.8 cm−1. Table 2 shows variouscalibration curves obtained from correlating the heights of thepeaks to the concentration of paracetamol. Although the firsttwo multiple linear regression equations shown in Table 2 pro-duced practically the same deviation from the experimentalvalue, the second equation had better reproducibility. This re-sult agreed with the calibration curve reported by Hojjati et al.(2007). The supersaturation was defined by:
SS = C − C∗, (8)
where C is the measured concentration based on Table 2 andC∗ is the solubility concentration, which was a function of themass fraction of water in the water–isopropanol mixture at eachtemperature. For example at 20 ◦C, C∗ is shown in Fig. 4 andgiven by Hojjati and Rohani (2006):
C∗ = 2.3058m3w − 4.5757m2
w + 2.5514mw − 0.2496, (9)
where mw is the mass fraction of water and C∗ is ingsolute/gsolvent(IPA+H2O).
3.3. Size measurement
The FBRM DL600 was used in the present study for insitu measurement of the chord length distribution (CLD). Thechord length, or the distance between two edges in a particle,is obtained as the product of the beam speed and the time ofthe corresponding backscattered signal. The chord lengths ac-quired every 5 s were organized in 90 channels over the entirerange between 1 and 1000 �m. The average of 12 consecutivesamples using a moving average (MA) was used as in the con-trol algorithm. Therefore, the sampling interval of the controlsystem was �t = 1 min.
Chord lengths counts in the 1.20 �m range were defined toindicate the nucleation event. The difference between the chordlength counts of two consecutive sampling intervals in the range1.50 �m was used as the second controlled variable.
�N1.50(t) = N1.50(t) − N1.50(t − �t). (10)
3.4. Experimental procedure
Before running the experiments, the ATR-FTIR chamber waspurged for 12 h using filtered air (CO2 and H2O free) to stabi-lize the background. The FTIR chamber was filled with liquidnitrogen as inert gas. The solution of 160 g of IPA and 240 gof water saturated with paracetamol at 20 ◦C was added in thejacketed vessel. Stirrer speed was maintained at 200 rpm at thebeginning of the crystallization process and then gradually in-creased to 300 rpm in order to keep the solids in suspension.This provided good mixing while avoiding excessive splashing.The clear solution was initially kept above the saturation tem-perature at 24 ◦C. The temperature was then lowered to 20 ◦C tostart the experiment. At the onset of experiment, FBRM countsshowed a nil value. Pre-weighed seeds were added to the crys-tallizer. The particle size distribution of the seed is shown in
996 M. Sheikhzadeh et al. / Chemical Engineering Science 63 (2008) 991–1002
Table 2The concentration calibration curve equations based on ATR-FTIR spectra
Calibration curve equation X definition R2 valueC, gsolute/gsolvent(IPA+H2O)
C = 0.1616X(1) + 0.9464X(2) + 0.0060 X(1) = P(1515.8) − P(1710) 0.9965X(2) = P(1245.8) − P(1710)
C = −0.3319X(1) + 2.1588X(2) + 0.0308 X(1) = P(1515.8) − P(1030) 0.9964X(2) = P(1245.8) − P(1030)
C = 0.0437X(1) − 0.0081X(2) − 0.0230 X(1) = P(1515.8)/P (1710) 0.9879X(2) = P(1245.8)/P (1710)
C = −0.0171X(1) + 0.1687X(2) − 0.1229 X(1) = P(1515.8)/P (1030) 0.9943X(2) = P(1245.8)/P (1030)
0
0.05
0.1
0.15
0.2
0.25
0 10 20 30 40 50 60 70 80 90 100
Water mass percent (%)
Solu
bili
ty (
gso
lute
/gso
lve
nt)
Exp
erim
en
tal zo
ne
Fig. 4. Solubility data for paracetamol in water–isopropanol mixture [8].
Fig. 14. The addition of total of 40 g of the anti-solvent (water)in all experiments was initiated 30 min after the addition of theseed. All required data were scanned every minute during theprocess. At the end of each experiment the solution was with-drawn, filtered through a 1 �m filter, dried, and then its sizedistribution was measured.
4. Implementation of the control system
The architecture of the control system used in this study isdepicted in Fig. 1. The WinIso data acquisition system was con-nected with both, the FBRM software and ATR-FTIR software.The WinIso outputs together with the data received from theATR-FTIR and the FBRM, were printed to a text file. Thesedata were then imported by MATLAB and the supersaturation(Eq. (6)) and the difference in the chord length counts (Eq. (8))were calculated in an M-file.
The flow rate of the anti-solvent, which was the fuzzy outputof the control system, was calculated using two different controlmethods: a fuzzy logic and a RLC. The FLC algorithm was firstcreated using Fuzzy Logic Toolbox and then imported in thesame M-file. Thus, the supersaturation and the difference in thenumber of chord lengths were first computed according to thecodes written in an M-file and then the output was exported and
evaluated using the program written in fuzzy module. In thecase of the rigid controller the output was calculated accordingto the several different scenarios written in another M-file. Theoutputs of Matlab were sent to the WinIso software, and therequired flow rate of the anti-solvent was calculated and appliedto the crystallization process.
5. The controller configuration
5.1. RLC configuration
The set of the open loop experiments were performed beforedesigning the feedback controllers. They consisted of applyinglinear and nonlinear anti-solvent feed rate profiles to the systemand measuring the corresponding SS and �N1.50. The rangesof SS and �N1.50 with respect to FR were obtained based onthe results gained from these sets of experiments. The specifiedrange for each variable in the feedback controller was assignedas the zone of the ranges obtained from the above experiments.Then, this range was divided in different scenarios based onthe dominance of the variable in the crystallization process.Table 1 shows the IF–THEN structures which were appliedfor different logic sets of inputs. Within each scenario of theSS, FR was assigned a value based on the value of �N1.50(below the minimum, above the maximum, or in the specifiedrange). As seen from Table 1, the output flow rate was assigneda specific value when the supersaturation was near the limitsof its range, otherwise the flow rate was calculated accordingto a proportional control law. The higher flow rate value wasassigned when the supersaturation was very low, or the lowerflow rate value when the supersaturation was very high. Thiswas done in order to provide an extra force to the system,and consequently keep the supersaturation inside the specifiedrange.
Table 3Maximum and minimum of input and output variables
Membership function Min Max Unit
SS 0 0.008 (gsolute/gsolvent(IPA+H2O))
�N1.50 −20 20 number s−1
FR 0.25 3 g min−1
M. Sheikhzadeh et al. / Chemical Engineering Science 63 (2008) 991–1002 997
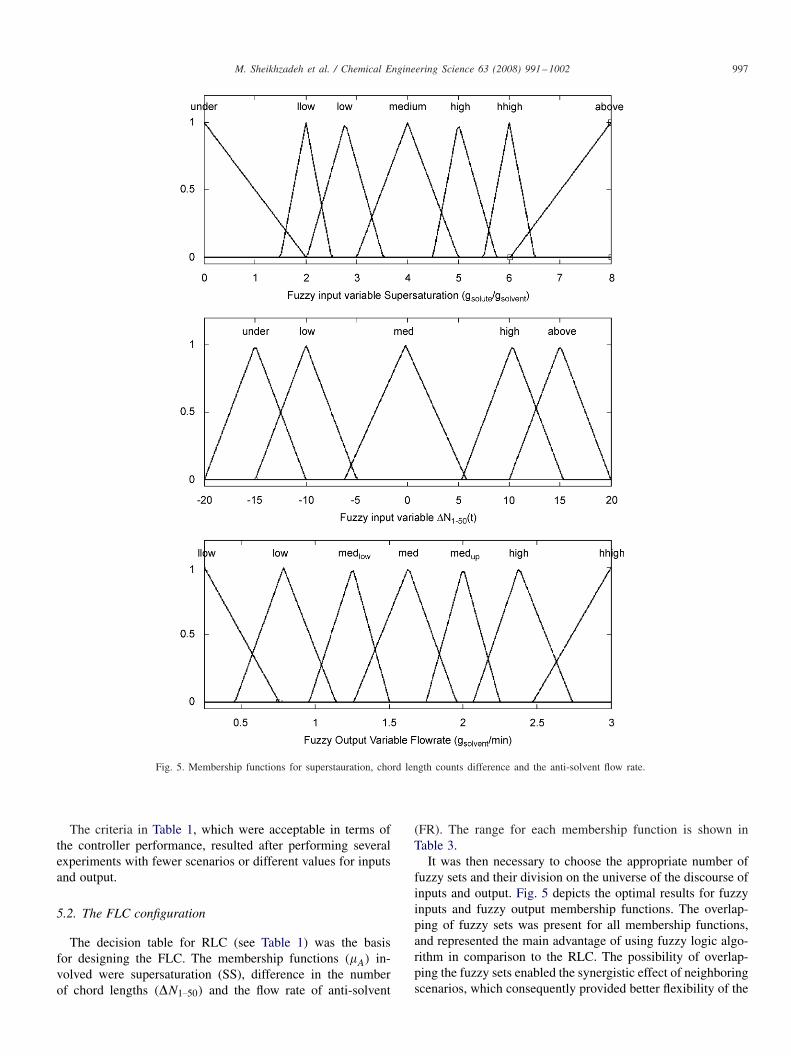
Fig. 5. Membership functions for superstauration, chord length counts difference and the anti-solvent flow rate.
The criteria in Table 1, which were acceptable in terms ofthe controller performance, resulted after performing severalexperiments with fewer scenarios or different values for inputsand output.
5.2. The FLC configuration
The decision table for RLC (see Table 1) was the basisfor designing the FLC. The membership functions (�A) in-volved were supersaturation (SS), difference in the numberof chord lengths (�N1.50) and the flow rate of anti-solvent
(FR). The range for each membership function is shown inTable 3.
It was then necessary to choose the appropriate number offuzzy sets and their division on the universe of the discourse ofinputs and output. Fig. 5 depicts the optimal results for fuzzyinputs and fuzzy output membership functions. The overlap-ping of fuzzy sets was present for all membership functions,and represented the main advantage of using fuzzy logic algo-rithm in comparison to the RLC. The possibility of overlap-ping the fuzzy sets enabled the synergistic effect of neighboringscenarios, which consequently provided better flexibility of the
998 M. Sheikhzadeh et al. / Chemical Engineering Science 63 (2008) 991–1002
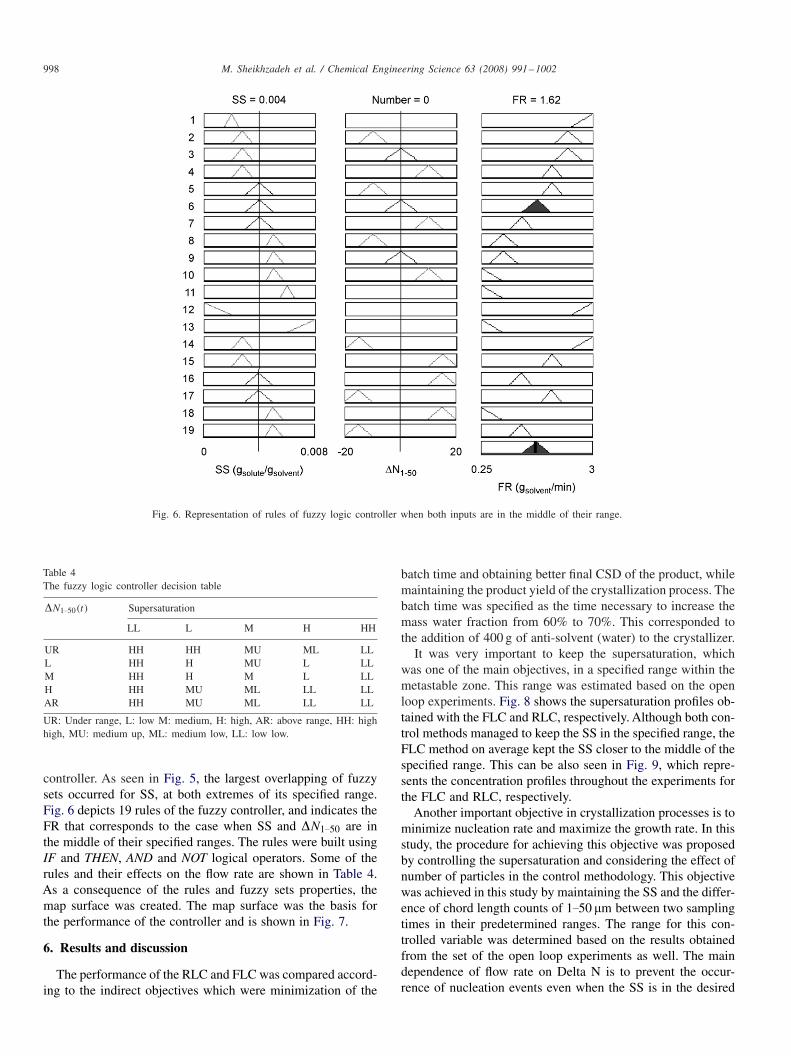
Fig. 6. Representation of rules of fuzzy logic controller when both inputs are in the middle of their range.
Table 4The fuzzy logic controller decision table
�N1.50(t) Supersaturation
LL L M H HH
UR HH HH MU ML LLL HH H MU L LLM HH H M L LLH HH MU ML LL LLAR HH MU ML LL LL
UR: Under range, L: low M: medium, H: high, AR: above range, HH: highhigh, MU: medium up, ML: medium low, LL: low low.
controller. As seen in Fig. 5, the largest overlapping of fuzzysets occurred for SS, at both extremes of its specified range.Fig. 6 depicts 19 rules of the fuzzy controller, and indicates theFR that corresponds to the case when SS and �N1.50 are inthe middle of their specified ranges. The rules were built usingIF and THEN, AND and NOT logical operators. Some of therules and their effects on the flow rate are shown in Table 4.As a consequence of the rules and fuzzy sets properties, themap surface was created. The map surface was the basis forthe performance of the controller and is shown in Fig. 7.
6. Results and discussion
The performance of the RLC and FLC was compared accord-ing to the indirect objectives which were minimization of the
batch time and obtaining better final CSD of the product, whilemaintaining the product yield of the crystallization process. Thebatch time was specified as the time necessary to increase themass water fraction from 60% to 70%. This corresponded tothe addition of 400 g of anti-solvent (water) to the crystallizer.
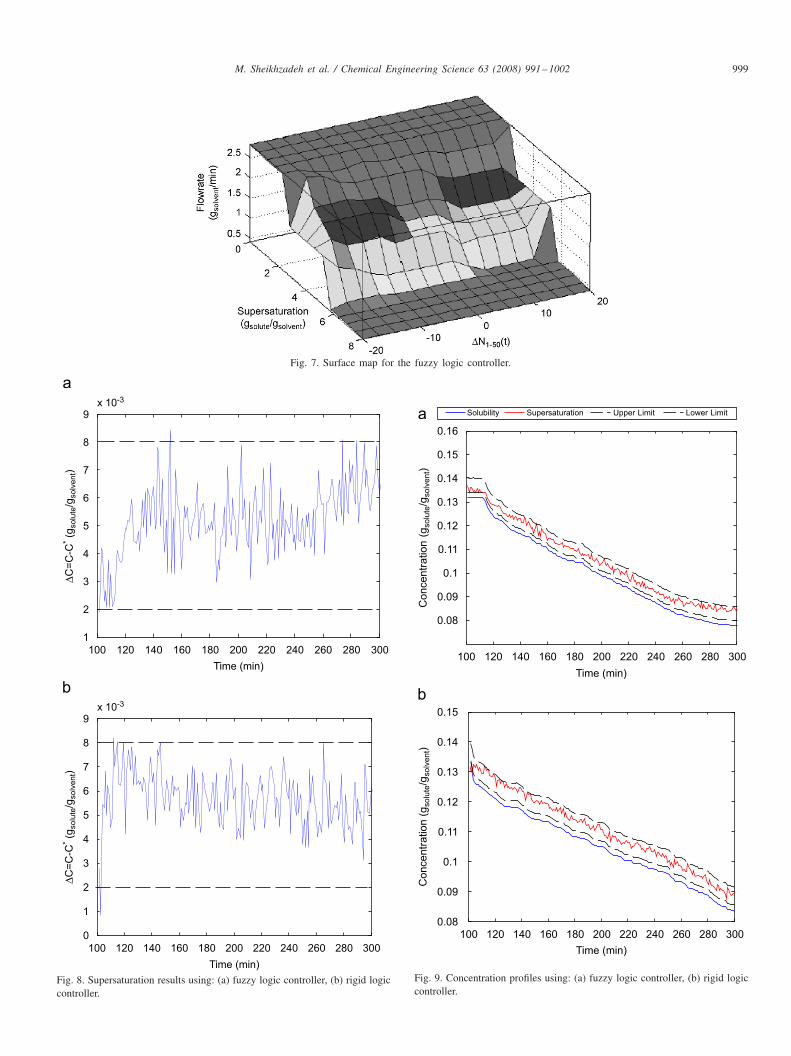
It was very important to keep the supersaturation, whichwas one of the main objectives, in a specified range within themetastable zone. This range was estimated based on the openloop experiments. Fig. 8 shows the supersaturation profiles ob-tained with the FLC and RLC, respectively. Although both con-trol methods managed to keep the SS in the specified range, theFLC method on average kept the SS closer to the middle of thespecified range. This can be also seen in Fig. 9, which repre-sents the concentration profiles throughout the experiments forthe FLC and RLC, respectively.
Another important objective in crystallization processes is tominimize nucleation rate and maximize the growth rate. In thisstudy, the procedure for achieving this objective was proposedby controlling the supersaturation and considering the effect ofnumber of particles in the control methodology. This objectivewas achieved in this study by maintaining the SS and the differ-ence of chord length counts of 1.50 �m between two samplingtimes in their predetermined ranges. The range for this con-trolled variable was determined based on the results obtainedfrom the set of the open loop experiments as well. The maindependence of flow rate on Delta N is to prevent the occur-rence of nucleation events even when the SS is in the desired
M. Sheikhzadeh et al. / Chemical Engineering Science 63 (2008) 991–1002 999
Fig. 7. Surface map for the fuzzy logic controller.
100 120 140 160 180 200 220 240 260 280 300
1
2
3
4
5
6
7
8
9x 10⁻³
Time (min)
ΔC=
C-C
* (g
so
lute
/gso
lve
nt)
100 120 140 160 180 200 220 240 260 280 300
0
1
2
3
4
5
6
7
8
9x 10⁻³
Time (min)
ΔC=
C-C
* (g
so
lute
/gso
lve
nt)
Fig. 8. Supersaturation results using: (a) fuzzy logic controller, (b) rigid logiccontroller.
100 120 140 160 180 200 220 240 260 280 300
0.08
0.09
0.1
0.11
0.12
0.13
0.14
0.15
0.16
Time (min)
Co
nce
ntr
atio
n (
gsolu
te/g
solv
ent)
Solubility Supersaturation Upper Limit Lower Limit
100 120 140 160 180 200 220 240 260 280 3000.08
0.09
0.1
0.11
0.12
0.13
0.14
0.15
Time (min)
Co
nce
ntr
atio
n (
gsolu
te/g
solv
ent)
Fig. 9. Concentration profiles using: (a) fuzzy logic controller, (b) rigid logiccontroller.
1000 M. Sheikhzadeh et al. / Chemical Engineering Science 63 (2008) 991–1002
100 120 140 160 180 200 220 240 260 280 3000
100
200
300
400
500
600
700
Time (min)
Nu
mb
er
of
pa
rtic
les (
Nu
mb
er
/ s)
1-50 µm
100-251 µm
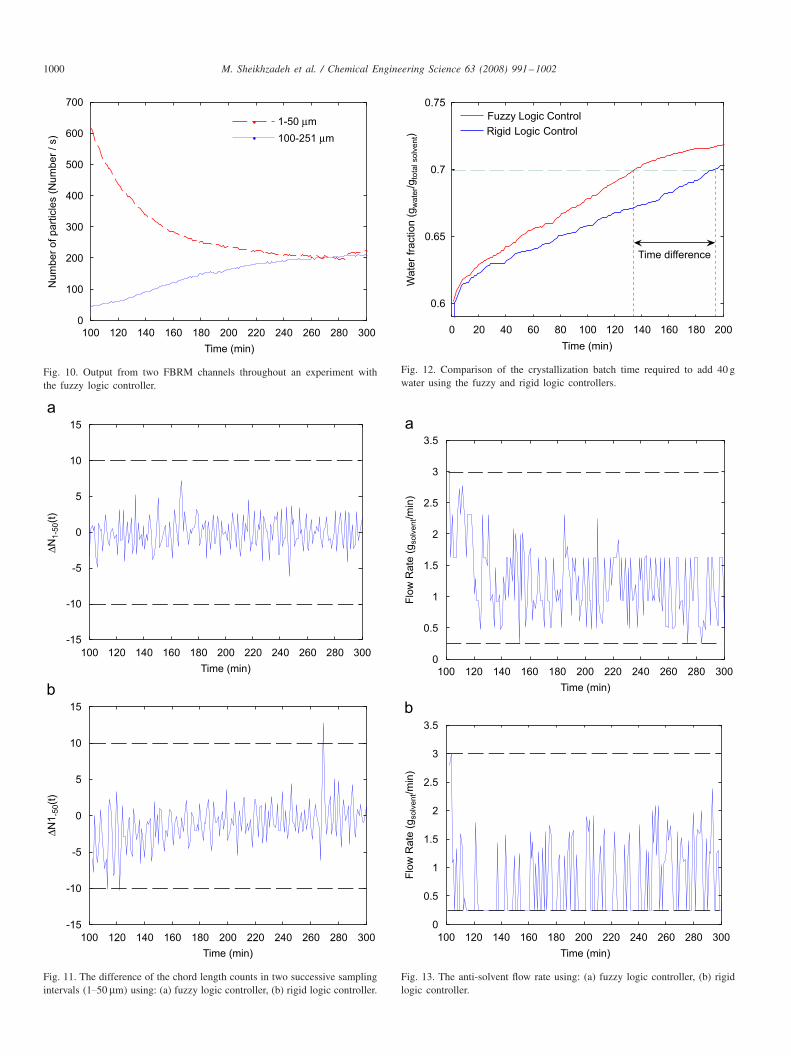
Fig. 10. Output from two FBRM channels throughout an experiment withthe fuzzy logic controller.
100 120 140 160 180 200 220 240 260 280 300
-15
-10
-5
0
5
10
15
Time (min)
ΔN1-5
0(t
)
100 120 140 160 180 200 220 240 260 280 300
-15
-10
-5
0
5
10
15
Time (min)
ΔN1
-50(t
)
Fig. 11. The difference of the chord length counts in two successive samplingintervals (1.50 �m) using: (a) fuzzy logic controller, (b) rigid logic controller.
0 20 40 60 80 100 120 140 160 180 200
0.6
0.65
0.7
0.75
Time (min)
Wate
r fr
action (
gw
ate
r/g
tota
l solv
ent)
Fuzzy Logic Control
Rigid Logic Control
Time difference
Fig. 12. Comparison of the crystallization batch time required to add 40 gwater using the fuzzy and rigid logic controllers.
100 120 140 160 180 200 220 240 260 280 3000
0.5
1
1.5
2
2.5
3
3.5
Time (min)
Flo
w R
ate
(g
solv
ent/m
in)
100 120 140 160 180 200 220 240 260 280 300
0
0.5
1
1.5
2
2.5
3
3.5
Time (min)
Flo
w R
ate
(g
solv
ent/m
in)
Fig. 13. The anti-solvent flow rate using: (a) fuzzy logic controller, (b) rigidlogic controller.
M. Sheikhzadeh et al. / Chemical Engineering Science 63 (2008) 991–1002 1001
range. Thus, if the number of particles starts increasing in thespecific range, before the SS reaches the limits of the predeter-mined range, the FR is changed in order to keep it within thedesired limits. Fig. 10 shows the output from two FBRM chan-nels throughout the experiment with the FLC. As seen from thefigure, the number of small crystals decreased and the numberof larger crystals increased throughout the experiment.
The difference in the number of chord length counts obtainedby the FLC and RLC methods is shown in Figs. 11(a) and (b),respectively. Both controllers kept the number of particles inthe desired range, although the FLC performed slightly better,since the FLC controller did not saturate at its limits.
0 200 400 600 800 1000 12000
1
2
3
4
5
6
7
8
Size (μm)
Vo
lum
e %
SeedRLC
FLC (run2)FLC (run1)
Fig. 14. Comparison of seed and final size distributions obtained by the rigidlogic and fuzzy logic controllers.
Table 5Batch times for RLC and FLC controlled methods
Experiment Batch time RLC Batch time FLC
1 195 1352 200 1383 204 1404 197 1505 211 143
Mean 201.4 141.2
Table 6ANOVA table for comparison of batch times means
Source of SS (sum of d.f. MS = SS/d.f. F F > Probvariation squares) mean square
Treatment (or 9.0601e + 003 1 9.0601e + 003 248.2219 2.6318e−007between twocontrolledmethods)Error (or within 292.0000 8 36.5000 – –each controlledmethod)
Total 9.3521e + 003 9 – – –
d.f. is degrees of freedom.
Fig. 12 depicts the time required for the two controllers toreach 70% water mass fraction. The FLC needed significantlyshorter time (an hour) to reach the specified final mass waterfraction while maintaining the product yield. This correspondedto approximately 30% reduction of time in comparison withthe RLC. The seed loading expressed as ratio of seed masswith respect to the final product mass was equal to 0.11 andthe yield of the process was approximately 51%. The result foryield would be improved if the operation was carried out in thewider solubility range.
The flow rate of the anti-solvent (water) was the only inputto the process. As shown in Fig. 13, the FLC resulted in smallervariations in the anti-solvent flow rate (FR) without reachingthe saturation point. The higher average flow rate of the anti-solvent for the FLC explains the shorter required crystallizationtime. This can be explained by the fact that FLC is based onthe surface map as oppose to the rigid values for RLC, whichin turn provides more flexibility of the controller over the pre-specified range for FR.
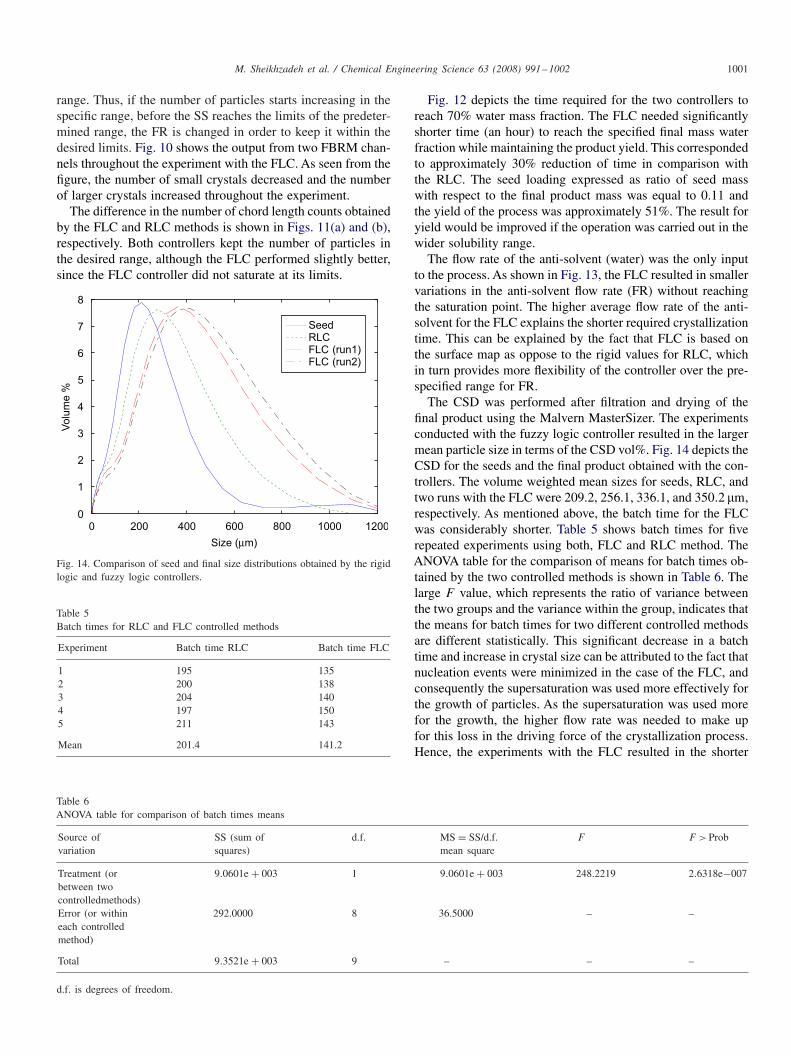
The CSD was performed after filtration and drying of thefinal product using the Malvern MasterSizer. The experimentsconducted with the fuzzy logic controller resulted in the largermean particle size in terms of the CSD vol%. Fig. 14 depicts theCSD for the seeds and the final product obtained with the con-trollers. The volume weighted mean sizes for seeds, RLC, andtwo runs with the FLC were 209.2, 256.1, 336.1, and 350.2 �m,respectively. As mentioned above, the batch time for the FLCwas considerably shorter. Table 5 shows batch times for fiverepeated experiments using both, FLC and RLC method. TheANOVA table for the comparison of means for batch times ob-tained by the two controlled methods is shown in Table 6. Thelarge F value, which represents the ratio of variance betweenthe two groups and the variance within the group, indicates thatthe means for batch times for two different controlled methodsare different statistically. This significant decrease in a batchtime and increase in crystal size can be attributed to the fact thatnucleation events were minimized in the case of the FLC, andconsequently the supersaturation was used more effectively forthe growth of particles. As the supersaturation was used morefor the growth, the higher flow rate was needed to make upfor this loss in the driving force of the crystallization process.Hence, the experiments with the FLC resulted in the shorter
1002 M. Sheikhzadeh et al. / Chemical Engineering Science 63 (2008) 991–1002
batch time and larger particles. This also explains the increasein the volume weighted mean size of CSD for the FLC cases.The FLC method had slightly wider CSD and larger mean par-ticle size in comparison with the RLC method. However, bothFLC and RLC experiments result in different shape of CSDin comparison to one for the seeds, which indicates that somenucleation or agglomeration occurred during both experiments.
7. Conclusions
This paper describes a real time control system of a semi-batch crystallization process for the paracetamol–isopropanol–water system. The two controlled variables were thesupersaturation and the difference in the chord length countsbetween two sampling intervals. The manipulated variable wasthe flow rate of the anti-solvent (water). A fuzzy logic and arigid logic controller were used. The fuzzy logic controllershowed better performance in terms of a shorter batch timeand larger mean particle size of the final product.
Notation
A, B, C, S, W fuzzy subsetsC actual solution concentration, gsolute/gsolventC∗ saturated solution, concentration or solubility,
gsolute/gsolventFR flow rate, gwater/ minK constantmw water mass fraction (solute free)Mw total water mass, g�N1.50 the difference in chord length countsR real numberSS supersaturation, gsolute/gsolvent
T temperature, ◦Cu fuzzy outputU universe of discoursex fuzzy input
Greek letter
� membership function
References
Carvalho, M.T., Durao, F., 2002. Control of a floatation column using fuzzylogic inference. Fuzzy Sets and Systems 125, 121–133.
Chung, S.H., Ma, D.L., Braatz, R.D., 1999. Optimal seeding in batchcrystallization. The Canadian Journal of Chemical Engineering 77.
Gupta, M.M., Qi, J., 1991. Theory of T-norms and fuzzy inference methods.Fuzzy sets and systems 40, 431–450.
Hojjati, H., Rohani, S., 2006. Measurement and prediction of solubility ofparacetamol in water–isopropanol mixture. Part 1: measurement. OrganicProcess Research and Development 10 (6), 1101–1109.
Hojjati, H., Sheikhzadeh, M., Rohani, S., 2007. Control of supersaturationin a semi-batch antisolvent crystallization process using a fuzzy logiccontroller. Industrial and Engineering Chemistry Research 46 (4),1232–1240.
Sarma, P., 2001. Multivariable gain-scheduled fuzzy logic control of anexothermic reactor. Engineering Applications of Artificial Intelligence 14,457–471.
Takagi, T., Sugeno, M., 1985. Fuzzy identification of systems and itsapplications to modeling and control. IEEE Transactions on Systems, Manand Cybernetics 15, 116–132.
Ying, H., 2000. Fuzzy Control and Modeling. IEEE Press Series, New York.Yu, Z.Q., Chow, P.S., Tan, R.B.H., 2006. Application of attenuated
total reflectance-Fourier transform infrared (ATR-FTIR) technique inthe monitoring and control of antisolvent crystallization. Industrial &Engineering Chemistry Research 45, 438–444.
Zhou, G.X., Fujiwara, M., Woo, X.Y., Rusli, E., Tung, H., Starbuck, C.,Davidson, O., Ge, Z., Braatz, R.D., 2006. Direct design of pharmaceuticalantisolvent crystallization through concentration control. Crystal Growthand Design 6 (4), 892–898.