Fuzzy-C-Means-Based Classification of Thermodynamic-Property Data: A Critical Assessment
17
FUZZY-C-MEANS-BASED CLASSIFICATION OF THERMODYNAMIC-PROPERTY DATA: A CRITICAL ASSESSMENT Gabriela Avila 1 and Arturo Pacheco-Vega 2 1 CIEP-Facultad de Ciencias Quı ´micas, Universidad Auto ´ noma de San Luis Potosı ´, San Luis Potosı ´, Me ´xico 2 Department of Mechanical Engineering, California State University- Los Angeles, Los Angeles, California, USA We consider the problem of accuracy in the algorithmic classification of thermodynamic properties of fluids from a fuzzy C-means (FCM) clustering methodology. The analysis emphasizes on the way the algorithm is affected by factors such as the natural scale of the data, and the following strategies chosen for the classification: (1) data normalization, (2) trans- formation, (3) sample size of furnished data, and (4) the value of the fuzzy parameter. Experimental data corresponding to pressure, volume, and temperature of water are taken from the literature and used to show that the natural scaling of the data, the normalization and transformation strategies, as well as the values chosen for the fuzzy parameter are all important factors in the classification. Also, a decrease in the number of data used during the process degrades the quality of the solution. A complete consideration of the issues exam- ined here are undoubtedly beneficial every time a FCM classification is tried on a new problem. 1. INTRODUCTION Thermodynamic properties of pure fluids are important in the design and operation of engineering equipment commonly used in physical and chemical processes. Examples include heating, ventilating and air conditioning (HVAC), irri- gation, sewer- and city-water, power generation, or refrigeration systems, where the working fluid may be either atmospheric air, water, oil, or some type of refrigerant. For each of these processes, it is necessary to know the relationships between funda- mental properties, e.g., pressure, volume, and temperature, from which values of other quantities, like enthalpy, internal energy, specific heat, viscosity or thermal dif- fusivity, could be determined to build predictive models of the system performance. These relationships are commonly defined in terms of equations, or described in the form of tables or graphs, all of which are built from a priori classification of the experimental data into the appropriate conditions. Received 29 September 2008; accepted 20 October 2009. G.A. was the recipient of a PROMEP scholarship from Me ´xico (PROMEP=PTC-68), for which we are grateful. This project has been partially supported by an NSF-funded CREST center (HRD- 0932421), and the CSULA-RSCA program fund. Address correspondence to Arturo Pacheco-Vega, Department of Mechanical Engineering, California State University-Los Angeles, Los Angeles, CA 90032, USA. E-mail: [email protected] Numerical Heat Transfer, Part A, 56: 880–896, 2009 Copyright # Taylor & Francis Group, LLC ISSN: 1040-7782 print=1521-0634 online DOI: 10.1080/10407780903466444 880 Downloaded By: [Pacheco-Vega, Arturo] At: 21:06 21 December 2009
-
Upload
independent -
Category
Documents
-
view
1 -
download
0
Transcript of Fuzzy-C-Means-Based Classification of Thermodynamic-Property Data: A Critical Assessment
FUZZY-C-MEANS-BASED CLASSIFICATION OFTHERMODYNAMIC-PROPERTY DATA: A CRITICALASSESSMENT
Gabriela Avila1 and Arturo Pacheco-Vega21CIEP-Facultad de Ciencias Quımicas, Universidad Autonoma de San LuisPotosı, San Luis Potosı, Mexico2Department of Mechanical Engineering, California State University-Los Angeles, Los Angeles, California, USA
We consider the problem of accuracy in the algorithmic classification of thermodynamic
properties of fluids from a fuzzy C-means (FCM) clustering methodology. The analysis
emphasizes on the way the algorithm is affected by factors such as the natural scale of the data,
and the following strategies chosen for the classification: (1) data normalization, (2) trans-
formation, (3) sample size of furnished data, and (4) the value of the fuzzy parameter.
Experimental data corresponding to pressure, volume, and temperature of water are taken
from the literature and used to show that the natural scaling of the data, the normalization
and transformation strategies, as well as the values chosen for the fuzzy parameter are all
important factors in the classification. Also, a decrease in the number of data used during
the process degrades the quality of the solution. A complete consideration of the issues exam-
ined here are undoubtedly beneficial every time a FCM classification is tried on a new problem.
1. INTRODUCTION
Thermodynamic properties of pure fluids are important in the design andoperation of engineering equipment commonly used in physical and chemicalprocesses. Examples include heating, ventilating and air conditioning (HVAC), irri-gation, sewer- and city-water, power generation, or refrigeration systems, where theworking fluid may be either atmospheric air, water, oil, or some type of refrigerant.For each of these processes, it is necessary to know the relationships between funda-mental properties, e.g., pressure, volume, and temperature, from which values ofother quantities, like enthalpy, internal energy, specific heat, viscosity or thermal dif-fusivity, could be determined to build predictive models of the system performance.These relationships are commonly defined in terms of equations, or described inthe form of tables or graphs, all of which are built from a priori classification ofthe experimental data into the appropriate conditions.
Received 29 September 2008; accepted 20 October 2009.
G.A. was the recipient of a PROMEP scholarship from Mexico (PROMEP=PTC-68), for which
we are grateful. This project has been partially supported by an NSF-funded CREST center (HRD-
0932421), and the CSULA-RSCA program fund.
Address correspondence to Arturo Pacheco-Vega, Department of Mechanical Engineering,
California State University-Los Angeles, Los Angeles, CA 90032, USA. E-mail: [email protected]
Numerical Heat Transfer, Part A, 56: 880–896, 2009
Copyright # Taylor & Francis Group, LLC
ISSN: 1040-7782 print=1521-0634 online
DOI: 10.1080/10407780903466444
880
Downloaded By: [Pacheco-Vega, Arturo] At: 21:06 21 December 2009
In the conventional practice, the classification methodology involves a visualcomponent, which is necessary to both identify the patterns inherent in the phenom-enon and associate them to the data [1–3]. Despite the fact that these visual-basedtechniques provide useful information to the design engineer, as the complexity ofthe problem increases (e.g., when the phenomenon involves phase changes or differ-ent flow regimes), the correct identification process by visual observation becomesmore difficult to achieve, hence increasing its uncertainty and decreasing the accu-racy of the predictive models that are derived from it. An alternative approach,whose application has increased substantially in recent years, is to identify andclassify the characteristic information of the system directly (i.e., algorithmically)from the experimental measurements.
Soft computing (SC) technologies, of which neural networks (ANNs), geneticalgorithms (GAs), fuzzy logic (FL), and cluster analysis (CA) are elements, havereceived much attention as feasible alternatives to conventional techniques for deal-ing with practical problems. Their ability to handle imprecise and=or noisy datafrom experimental measurements has been a key factor for their increasing demand.From the set of SC methodologies, the application of cluster analysis has grownsubstantially in recent years in disciplines like biology [4], marketing [5], medicine[6], manufacturing [7], image processing [8], and astronomy [9], among others, wherethe common thread is some kind of classification or feature extraction fromexperimental data [10].
In CA, a given set of data is separated into groups (or clusters) such thatelements drawn from the same group are as similar to each other as possible, whilethose assigned to different groups are dissimilar. The underlying hypothesis in themethodology is that the data set being analyzed contains enough informationinherent to the phenomenon of interest, such that the parameters that characterizeit can be established. Also known as vector quantization, clustering is oftendescribed as unsupervised classification of patterns as the clusters are obtained solely
NOMENCLATURE
ci ith cluster centroid in
q-dimensional space
C vector of cluster centroids
C number of cluster centroids
ES classification error
ES averaged classification error
Jm fuzzy objective function
m fuzziness index
MI, MII, MIII number of data points in
clusters I, II, and III
N total number of data points
NS number of sample data
p pressure, kPa
PS fraction of data sets considered
T temperature, K
uij elements of fuzzy partition
matrix
U fuzzy partition matrix
v specific volume, m3=kg
x quality of mixture
xj jth data set in q-dimensional
space
X vector of data sets
rS standard deviation
Subscripts and Superscripts
cr critical point
G gas
L liquid
LV liquid-vapor
M maximum
r reduced
SV superheated vapor
FUZZY-C-MEANS-BASED PROPERTY DATA 881
Downloaded By: [Pacheco-Vega, Arturo] At: 21:06 21 December 2009
from the data. From the multitude of algorithms developed and used in differentdisciplines, the fuzzy C-means (FCM) technique is one of the most popular [10].Easiness in its mathematical background and efficient implementation are amongthe advantages. However, some drawbacks that often lead to misclassification ofthe data include the convergence of the squared error criterion towards local minimaand the ad hoc choice of its parameters [10, 11], among others. Although the FCMtechnique has been used in many fields, its application to thermal and fluids engin-eering is scarce; the classification of heat exchanger data [12], turbulent patterns [13],and geophysical data [14], are among the very few investigations.
In the present work, we are interested in assessing the applicability of the FCMtechnique to classify thermodynamic property data necessary for the design, selec-tion and control of thermal systems that employ working fluids for their operation.The focus is on common factors that influence the accuracy of the FCM classi-fication. To this end, a brief description of the FCM algorithm is provided first,followed by details of the experimental data used for the cluster analysis. A seriesof numerical tests for classifying the data are then carried out with special emphasisset on the effect that the natural scaling, normalization and transformation strate-gies, and sample size of the data have on the quality of the classification. Finally,the influence of the fuzzy partition exponent on the accuracy of the FCM techniqueis explored as part of this investigation.
2. FUZZY C-MEANS CLUSTERING ALGORITHM
2.1. Description
The fuzzy C-means (FCM) algorithm, introduced by Dunn [15] to solve theinherent problem of conventional clustering schemes (e.g., the well-known K-meanstechnique [16]), on the basis fuzzy-sets theory [17], is by far the most widely usedfuzzy clustering algorithm in practice [18, 19]. Its application areas include: imagesegmentation [20], flow physics classification [21], chemistry [22, 23], signal proces-sing [24], medical diagnosis [25], and geophysics [14], among others. FCM is dis-cussed in detail (along with its most comprehensive references, its relatives andderivatives) in the books of Hoppner et al. [26] and Bezdek et al. [27]. Thus, onlya brief description of the scheme is provided here.
Given a set of N data points in a q-dimensional space, i.e., X ¼ fx1; x2;� � � ; xNg � Rq, the objective of the FCM algorithm is to assign the data into anumber of C specific groups (or clusters), i.e., C ¼ fc1; c2; � � � ; cCg � Rq. The group-ing is achieved through values of membership functions when minimizing the fuzzyobjective function
JmðU;CÞ ¼XCi¼1
XNj¼1
ðuijÞmkxj � cik2 ð1Þ
In Eq. (1), Jm is a weighted measure of the differences between the data analyzed X,and the cluster centers C; N is the total number of feature vectors in the given dataset, and C is the number of clusters. Also, U with elements uij and size C�N, is a
882 G. AVILA AND A. PACHECO-VEGA
Downloaded By: [Pacheco-Vega, Arturo] At: 21:06 21 December 2009
fuzzy partition matrix that weights Jm, the exponent m is a fuzziness index [28], andk�k is the usual Euclidean norm.
The cluster centroids are determined from
ci ¼PN
j¼1ðuijÞmxjPN
j¼1ðuijÞm i ¼ 1; 2; � � � ;C ð2Þ
whereas the elements uij, which provide the membership degree of data point xj to thefuzzy cluster i, can be computed from
uij ¼PC
k¼1kxj�cikkxj�ckk
� �2=ðm�1Þ� ��1
xj 6¼ ci
1 xj ¼ ci
8<: ð3Þ
for i ¼ 1; 2; � � � ;C, and j ¼ 1; 2; � � � ;N. Also note that uij satisfies
uij 2 ½0; 1� andXCi¼1
uij ¼ 1 ð4Þ
The fuzziness index m (or fuzzy partition exponent) appearing in Eqs. (1)–(3),can acquire values in the range 1<m<1 . The larger the value of m, the less crispthe data partition into the specified groups [28]; a value m¼ 1 corresponds to afully-crisp partition. It is important to mention that a major issue with the use ofthe FCM technique is that values for both the number of clusters C and the fuzzinessindex m must be chosen a priori. This validity problem [29–31] is still under activeresearch, and section 4.4. presents our findings about the influence of m on the accu-racy of the FCM classification for the data considered.
2.2. Procedure
The steps of the FCM clustering procedure are as follows.
1. Selection of number of clusters. The number of groups C, into which the data willbe classified, is selected a priori based on knowledge about the problem.
2. Initialization of membership matrix. The initial values of the elements of matrix U(i.e., the initial classification), are randomly generated subject to satisfying con-ditions given by Eq. (4).
3. Calculation of centroids. For each of the C fuzzy-clusters, the centers C aredetermined using Eq. (2).
4. Update of membership matrix. Once the centroids are known, Eq. (3) is employedto update the partition matrix U.
5. Evaluation of objective function. The updated values of U are then used in Eq. (1)to compute the value of the fuzzy criterion function Jm.
Steps 3–5 are repeated until some criterion based on convergence, or maximumnumber of iterations is achieved; the idea being to re-assign the data points (feature
FUZZY-C-MEANS-BASED PROPERTY DATA 883
Downloaded By: [Pacheco-Vega, Arturo] At: 21:06 21 December 2009
vectors) to the corresponding groups in order to reduce the value of Jm as much aspossible. The criterion based on convergence implies that the algorithm is stoppedeither when the values of U do not change significantly when going from one iter-ation to the next, or when the function Jm is below a certain tolerance. The finalmembership matrix is then used to partition the data into the C-clusters; each featurevector is classified to the cluster in which it has the highest membership value.
3. CHARACTERISTICS OF PHYSICAL DATA
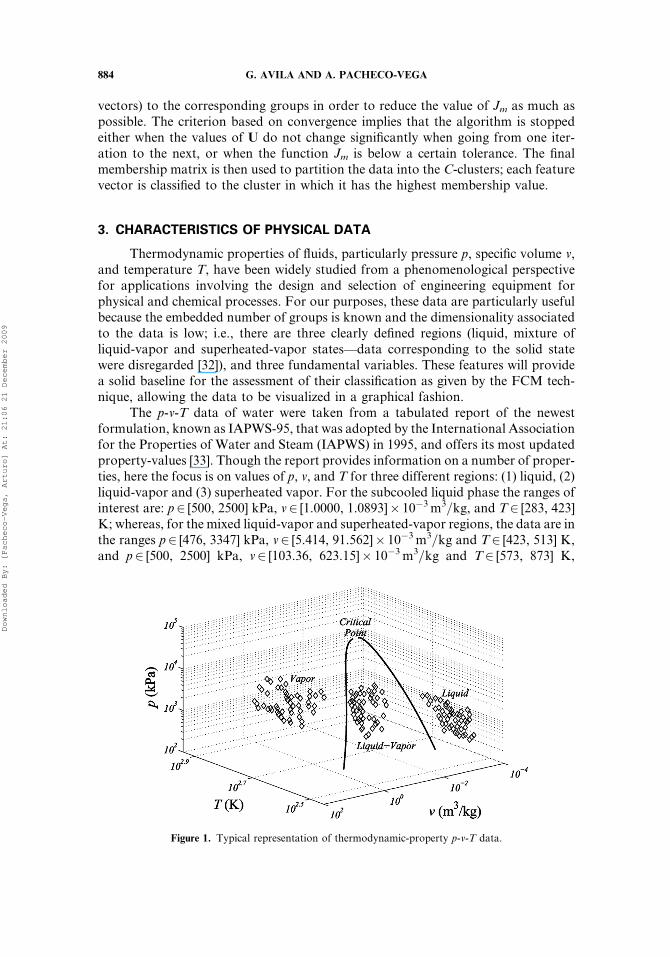
Thermodynamic properties of fluids, particularly pressure p, specific volume v,and temperature T, have been widely studied from a phenomenological perspectivefor applications involving the design and selection of engineering equipment forphysical and chemical processes. For our purposes, these data are particularly usefulbecause the embedded number of groups is known and the dimensionality associatedto the data is low; i.e., there are three clearly defined regions (liquid, mixture ofliquid-vapor and superheated-vapor states—data corresponding to the solid statewere disregarded [32]), and three fundamental variables. These features will providea solid baseline for the assessment of their classification as given by the FCM tech-nique, allowing the data to be visualized in a graphical fashion.
The p-v-T data of water were taken from a tabulated report of the newestformulation, known as IAPWS-95, that was adopted by the International Associationfor the Properties of Water and Steam (IAPWS) in 1995, and offers its most updatedproperty-values [33]. Though the report provides information on a number of proper-ties, here the focus is on values of p, v, and T for three different regions: (1) liquid, (2)liquid-vapor and (3) superheated vapor. For the subcooled liquid phase the ranges ofinterest are: p2 [500, 2500] kPa, v2 [1.0000, 1.0893]� 10�3m3=kg, and T2 [283, 423]K; whereas, for the mixed liquid-vapor and superheated-vapor regions, the data are inthe ranges p2 [476, 3347] kPa, v2 [5.414, 91.562]� 10�3m3=kg and T2 [423, 513] K,and p2 [500, 2500] kPa, v2 [103.36, 623.15]� 10�3m3=kg and T2 [573, 873] K,
Figure 1. Typical representation of thermodynamic-property p-v-T data.
884 G. AVILA AND A. PACHECO-VEGA
Downloaded By: [Pacheco-Vega, Arturo] At: 21:06 21 December 2009
respectively. It is to be noted that in the mixed liquid-vapor region, the volume wasdetermined from its corresponding liquid- and gas-values, vL and vG, respectively,at specific points (p, T) using the quality x, as v¼ (1� x)vLþ xvG. A typical represen-tation of the data using a logarithmic scale (their portrait in natural scale does notallow a clear visualization) is provided in Figure 1, where the different states canbe easily noticed as they are separated by the saturation line.
4. CLASSIFICATION EXPERIMENTS
In order to assess the correct classification of FCM clustering methodology onthe p-v-T data, several experimental tests are carried out next. In these, the focus ison how the natural scales, normalization, transformation, and sample size of thedata affect the accuracy of the algorithm during the classification process. Withexception of the experiments reported in section 4.4., all other results have beenobtained with a value of the fuzzy parameter m¼ 2, which is the most widely-usedvalue [34], and very close to the optimum found here.
4.1. Scaling
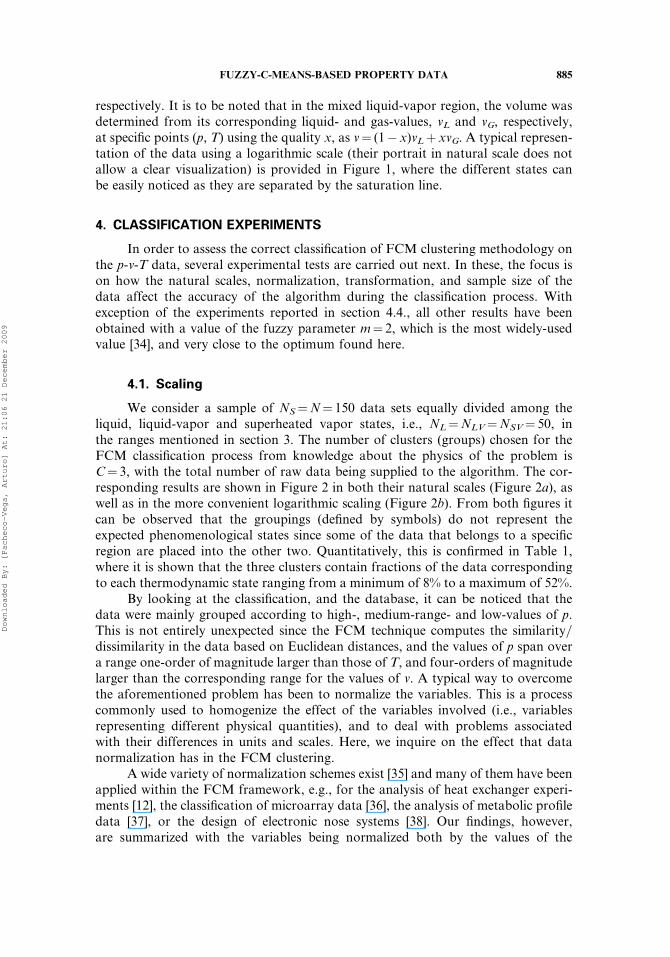
We consider a sample of NS¼N¼ 150 data sets equally divided among theliquid, liquid-vapor and superheated vapor states, i.e., NL¼NLV¼NSV¼ 50, inthe ranges mentioned in section 3. The number of clusters (groups) chosen for theFCM classification process from knowledge about the physics of the problem isC¼ 3, with the total number of raw data being supplied to the algorithm. The cor-responding results are shown in Figure 2 in both their natural scales (Figure 2a), aswell as in the more convenient logarithmic scaling (Figure 2b). From both figures itcan be observed that the groupings (defined by symbols) do not represent theexpected phenomenological states since some of the data that belongs to a specificregion are placed into the other two. Quantitatively, this is confirmed in Table 1,where it is shown that the three clusters contain fractions of the data correspondingto each thermodynamic state ranging from a minimum of 8% to a maximum of 52%.
By looking at the classification, and the database, it can be noticed that thedata were mainly grouped according to high-, medium-range- and low-values of p.This is not entirely unexpected since the FCM technique computes the similarity=dissimilarity in the data based on Euclidean distances, and the values of p span overa range one-order of magnitude larger than those of T, and four-orders of magnitudelarger than the corresponding range for the values of v. A typical way to overcomethe aforementioned problem has been to normalize the variables. This is a processcommonly used to homogenize the effect of the variables involved (i.e., variablesrepresenting different physical quantities), and to deal with problems associatedwith their differences in units and scales. Here, we inquire on the effect that datanormalization has in the FCM clustering.
A wide variety of normalization schemes exist [35] and many of them have beenapplied within the FCM framework, e.g., for the analysis of heat exchanger experi-ments [12], the classification of microarray data [36], the analysis of metabolic profiledata [37], or the design of electronic nose systems [38]. Our findings, however,are summarized with the variables being normalized both by the values of the
FUZZY-C-MEANS-BASED PROPERTY DATA 885
Downloaded By: [Pacheco-Vega, Arturo] At: 21:06 21 December 2009
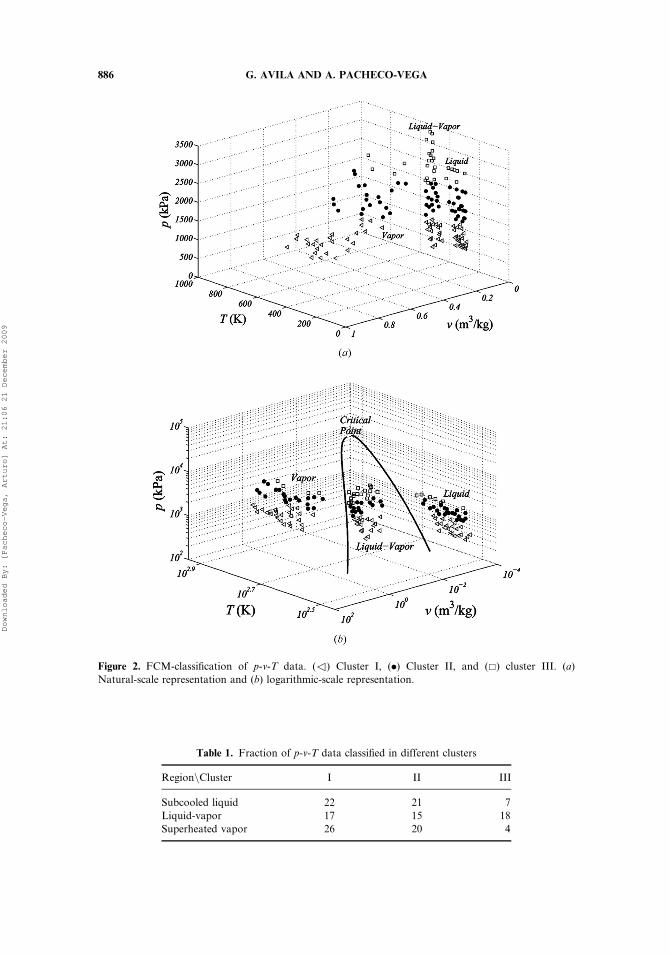
Table 1. Fraction of p-v-T data classified in different clusters
RegionnCluster I II III
Subcooled liquid 22 21 7
Liquid-vapor 17 15 18
Superheated vapor 26 20 4
Figure 2. FCM-classification of p-v-T data. (3) Cluster I, (.) Cluster II, and (&) cluster III. (a)
Natural-scale representation and (b) logarithmic-scale representation.
886 G. AVILA AND A. PACHECO-VEGA
Downloaded By: [Pacheco-Vega, Arturo] At: 21:06 21 December 2009
thermodynamic quantities at the critical point, and by their corresponding maximumvalues. Though these relative scalings seem to be equivalent, from a physical perspec-tive scaling with the critical values is more thermodynamically relevant since data ofdifferent fluids are placed under the same baseline by the principle of correspondingstates. Moreover, as it is shown next, these two scalings provide different classi-fication results.
Mathematically, the corresponding scalings for p, v, and T are given as
pri ¼pipcr
vri ¼vivcr
Tri ¼
Ti
Tcrð5Þ
pMi ¼ pipmax
vMi ¼ vivmax
TMi ¼ Ti
Tmaxð6Þ
where i ¼ 1; � � � ;N, cr refers to the values at the critical point, r indicates reducedthermodynamic quantities (i.e., r-normalization), and M is the normalization bythe maximum values (i.e., M-normalization).
Figure 3. Effect of r-normalization on p-v-T data. (3) Cluster I, (.) cluster II, and (&) cluster III.
(a) FCM-classification of pr-vr-Tr data, (b) Tr-pr-plane, (c) vr-pr-plane, and (d) Tr-vr-plane.
FUZZY-C-MEANS-BASED PROPERTY DATA 887
Downloaded By: [Pacheco-Vega, Arturo] At: 21:06 21 December 2009
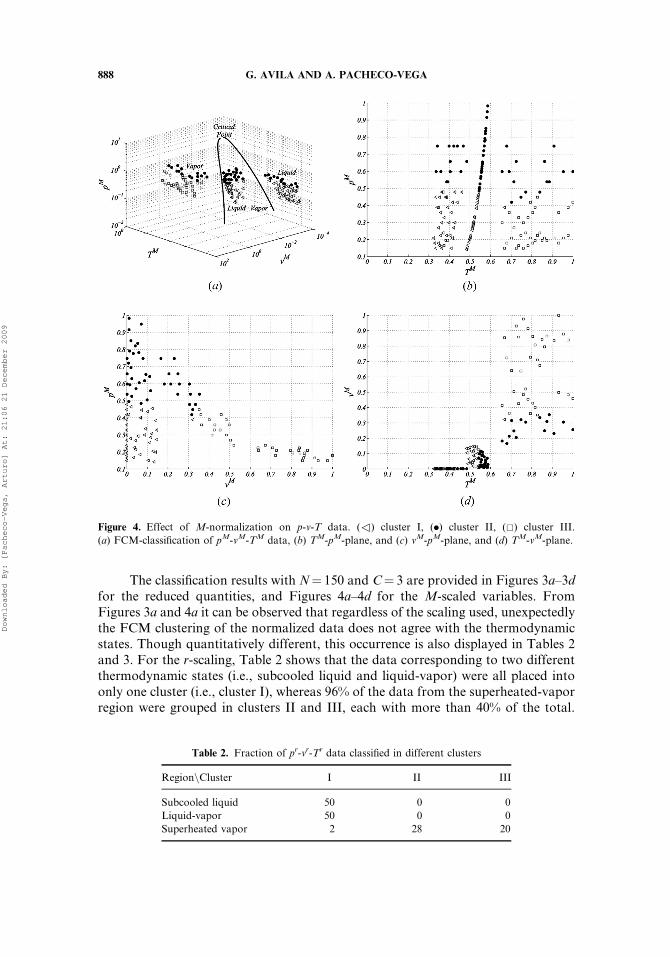
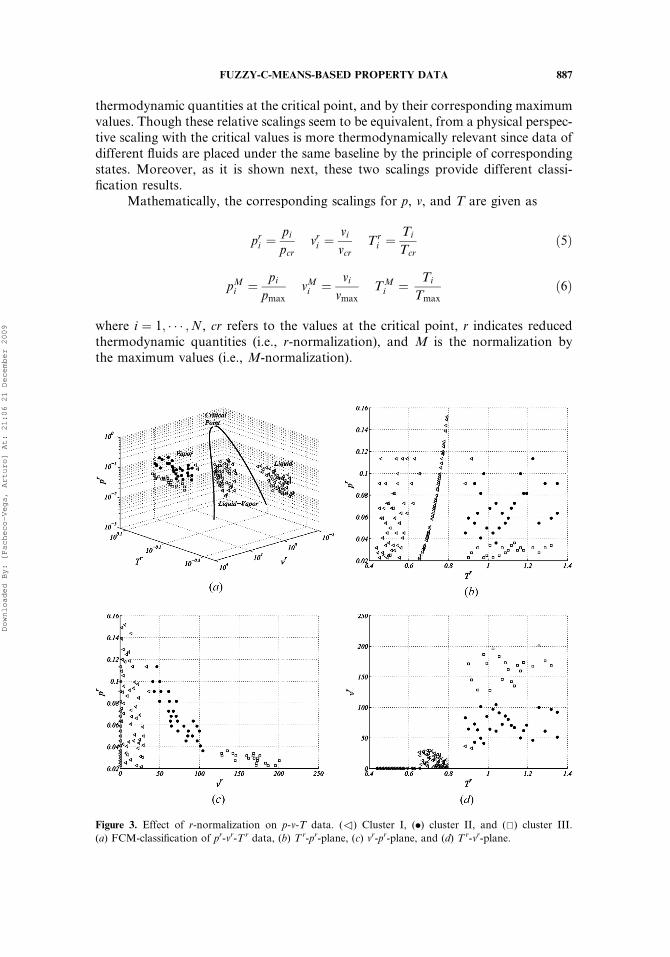
The classification results with N¼ 150 and C¼ 3 are provided in Figures 3a–3dfor the reduced quantities, and Figures 4a–4d for the M-scaled variables. FromFigures 3a and 4a it can be observed that regardless of the scaling used, unexpectedlythe FCM clustering of the normalized data does not agree with the thermodynamicstates. Though quantitatively different, this occurrence is also displayed in Tables 2and 3. For the r-scaling, Table 2 shows that the data corresponding to two differentthermodynamic states (i.e., subcooled liquid and liquid-vapor) were all placed intoonly one cluster (i.e., cluster I), whereas 96% of the data from the superheated-vaporregion were grouped in clusters II and III, each with more than 40% of the total.
Figure 4. Effect of M-normalization on p-v-T data. (3) cluster I, (.) cluster II, (&) cluster III.
(a) FCM-classification of pM-vM-TM data, (b) TM-pM-plane, and (c) vM-pM-plane, and (d) TM-vM-plane.
Table 2. Fraction of pr-vr-Tr data classified in different clusters
RegionnCluster I II III
Subcooled liquid 50 0 0
Liquid-vapor 50 0 0
Superheated vapor 2 28 20
888 G. AVILA AND A. PACHECO-VEGA
Downloaded By: [Pacheco-Vega, Arturo] At: 21:06 21 December 2009
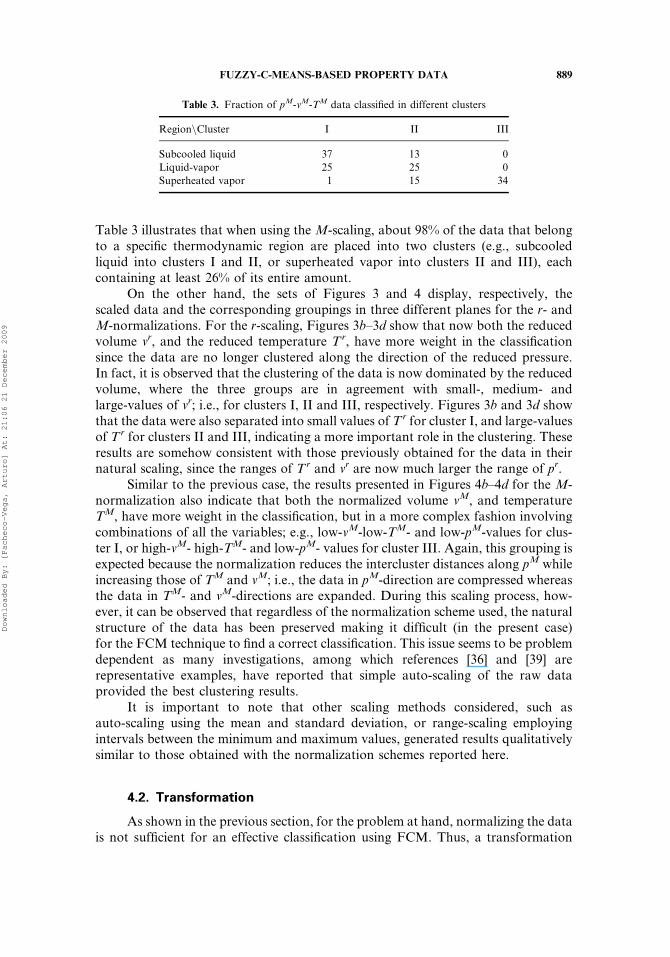
Table 3 illustrates that when using the M-scaling, about 98% of the data that belongto a specific thermodynamic region are placed into two clusters (e.g., subcooledliquid into clusters I and II, or superheated vapor into clusters II and III), eachcontaining at least 26% of its entire amount.
On the other hand, the sets of Figures 3 and 4 display, respectively, thescaled data and the corresponding groupings in three different planes for the r- andM-normalizations. For the r-scaling, Figures 3b–3d show that now both the reducedvolume vr, and the reduced temperature Tr, have more weight in the classificationsince the data are no longer clustered along the direction of the reduced pressure.In fact, it is observed that the clustering of the data is now dominated by the reducedvolume, where the three groups are in agreement with small-, medium- andlarge-values of vr; i.e., for clusters I, II and III, respectively. Figures 3b and 3d showthat the data were also separated into small values of Tr for cluster I, and large-valuesof Tr for clusters II and III, indicating a more important role in the clustering. Theseresults are somehow consistent with those previously obtained for the data in theirnatural scaling, since the ranges of Tr and vr are now much larger the range of pr.
Similar to the previous case, the results presented in Figures 4b–4d for the M-normalization also indicate that both the normalized volume vM, and temperatureTM, have more weight in the classification, but in a more complex fashion involvingcombinations of all the variables; e.g., low-vM-low-TM- and low-pM-values for clus-ter I, or high-vM- high-TM- and low-pM- values for cluster III. Again, this grouping isexpected because the normalization reduces the intercluster distances along pM whileincreasing those of TM and vM; i.e., the data in pM-direction are compressed whereasthe data in TM- and vM-directions are expanded. During this scaling process, how-ever, it can be observed that regardless of the normalization scheme used, the naturalstructure of the data has been preserved making it difficult (in the present case)for the FCM technique to find a correct classification. This issue seems to be problemdependent as many investigations, among which references [36] and [39] arerepresentative examples, have reported that simple auto-scaling of the raw dataprovided the best clustering results.
It is important to note that other scaling methods considered, such asauto-scaling using the mean and standard deviation, or range-scaling employingintervals between the minimum and maximum values, generated results qualitativelysimilar to those obtained with the normalization schemes reported here.
4.2. Transformation
As shown in the previous section, for the problem at hand, normalizing the datais not sufficient for an effective classification using FCM. Thus, a transformation
Table 3. Fraction of pM-vM-TM data classified in different clusters
RegionnCluster I II III
Subcooled liquid 37 13 0
Liquid-vapor 25 25 0
Superheated vapor 1 15 34
FUZZY-C-MEANS-BASED PROPERTY DATA 889
Downloaded By: [Pacheco-Vega, Arturo] At: 21:06 21 December 2009
technique that provides a sharper separation among the different data structures isnecessary. After a trial and error process, the best function found is a logarithmictransformation (cf. Figures 1, 3a, and 4a). We thus take logarithms to the scaled dataand provide them to the FCM code, with N¼ 150 and C¼ 3. The correspondingresults for the r-scaling, which coincide qualitatively and quantitatively with thoseof the M-normalization, are shown in the set of Figures 5a–5d, where it is now clearthat a correct classification has been achieved with only one datum being misplacedfrom the liquid-vapor state into the subcooled liquid region, and two data points fromthe superheated and into the liquid-vapor state. Quantitatively, 100% of theliquid-state data are grouped into the appropriate cluster I; whereas, 98% of theliquid-vapor data are placed in cluster II and 96% of the superheated vapor data incluster III; i.e., MI¼ 51, MII¼ 51 and MIII¼ 48, as shown in Table 4.
Figures 5b–5d, which can be directly compared to Figures 3b–3d and 4b–4d,illustrate the influence of the logarithmic transformation on the data, where it isclearly seen that now the structures in all three planes are very well defined. Although
Figure 5. Effect of logarithmic transformation on pr-vr-Tr data. (3) Cluster I, (.) cluster II, and (&)
cluster III. (a) FCM-classification of log10 pr-log10v
r-log10Tr data, (b) log10 Tr-log10 p
r-plane, (c) log10vr-
log10 pr-plane, and (d) log10 T
r-log10 vr-plane.
890 G. AVILA AND A. PACHECO-VEGA
Downloaded By: [Pacheco-Vega, Arturo] At: 21:06 21 December 2009
from the figures it is seen that the data-structures in the log10Tr–log10 p
r plane remainwithout change, in the log10v
r–log10 pr and log10Tr–log10v
r planes, the data havenow been separated into three clear groups thus allowing the FCM to find a correctclassification.
This is a confirmation of the influence that scaling and transformation of thevariables have on the accuracy of the FCM grouping. In the present case, transform-ation seems to be the key operation to achieve high accuracy in the thermodynamic-data classification. Therefore, preconditioning the data in some way is important inthe FCM clustering process.
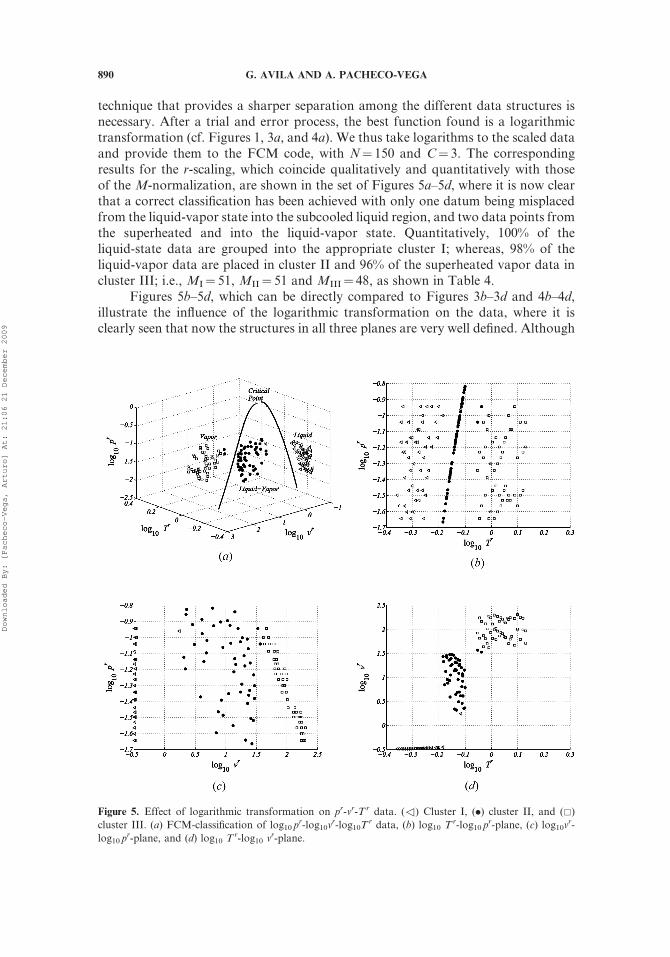
4.3. Sample Size
The effect of sample size on the clustering is investigated next using the pr-vr-Tr
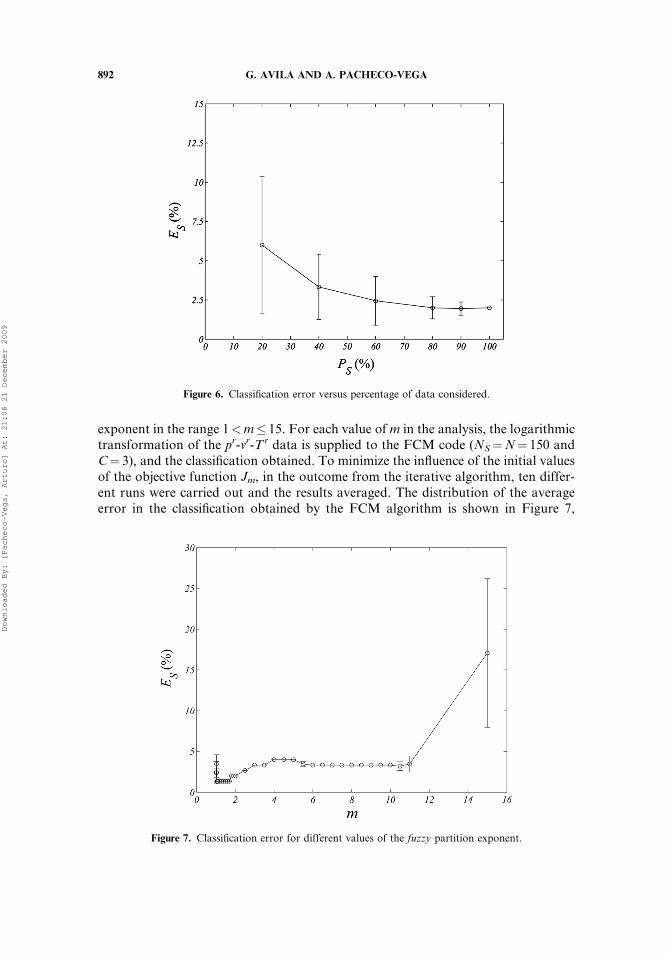
data set along with the logarithmic transformation of the previous section (equiva-lent results were also obtained with the corresponding transformation of the pM-vM-TM data set). The procedure for the analysis is as follows. From the total amountof N¼ 150 data, a fraction PS of these are first randomly chosen, and later providedto the FCM code for classification. Here PS¼NS=N and NS are the sample dataselected for examination. As before, the number of clusters is C¼ 3. The percentagedifference between the number of data correctly classified and the total number ofdata used, ES, is then calculated. To avoid any bias in the analysis, for each valueof PS, i.e., PS¼ 20%, 40%, 60%, 80%, 90%, and 100%, this procedure is repeated10 times and the results averaged.
The global characteristics of the error, ES, are shown in Figure 6. The errorbars indicate the standard deviations rS that resulted from the ten different curveswith reference to the averaged value ES. From the figure, it can be observed thatas PS increases, the averaged error in the classification (ES) decreases to an asymp-totic value (�2%), which is of the same order of magnitude than that obtained in theprevious section. Small values of PS give larger error values due to an increase in theintracluster distances of the data. As NS increases, these distances decrease providingbetter results. Beyond PS¼ 80% the classification errors (ES) reach the lower-boundvalue. The same trend is observed for rS which become smaller as PS! 100%, indi-cating that the classification is somewhat insensitive to both the initial values of theparameters in the FCM algorithm and the random selection of the data.
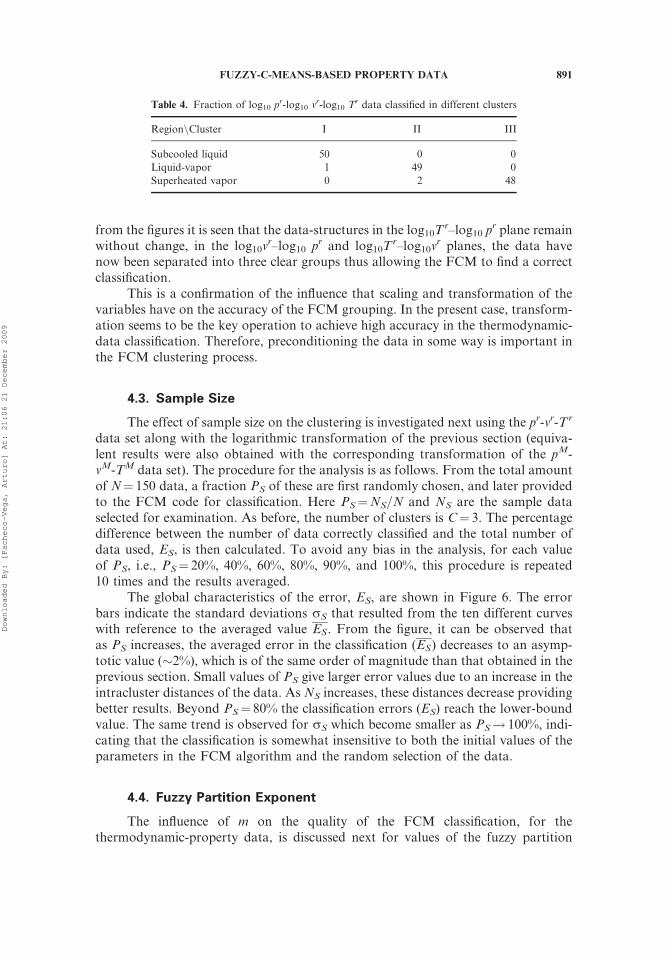
4.4. Fuzzy Partition Exponent
The influence of m on the quality of the FCM classification, for thethermodynamic-property data, is discussed next for values of the fuzzy partition
Table 4. Fraction of log10 pr-log10 v
r-log10 Tr data classified in different clusters
RegionnCluster I II III
Subcooled liquid 50 0 0
Liquid-vapor 1 49 0
Superheated vapor 0 2 48
FUZZY-C-MEANS-BASED PROPERTY DATA 891
Downloaded By: [Pacheco-Vega, Arturo] At: 21:06 21 December 2009
exponent in the range 1<m� 15. For each value of m in the analysis, the logarithmictransformation of the pr-vr-Tr data is supplied to the FCM code (NS¼N¼ 150 andC¼ 3), and the classification obtained. To minimize the influence of the initial valuesof the objective function Jm, in the outcome from the iterative algorithm, ten differ-ent runs were carried out and the results averaged. The distribution of the averageerror in the classification obtained by the FCM algorithm is shown in Figure 7,
Figure 6. Classification error versus percentage of data considered.
Figure 7. Classification error for different values of the fuzzy partition exponent.
892 G. AVILA AND A. PACHECO-VEGA
Downloaded By: [Pacheco-Vega, Arturo] At: 21:06 21 December 2009
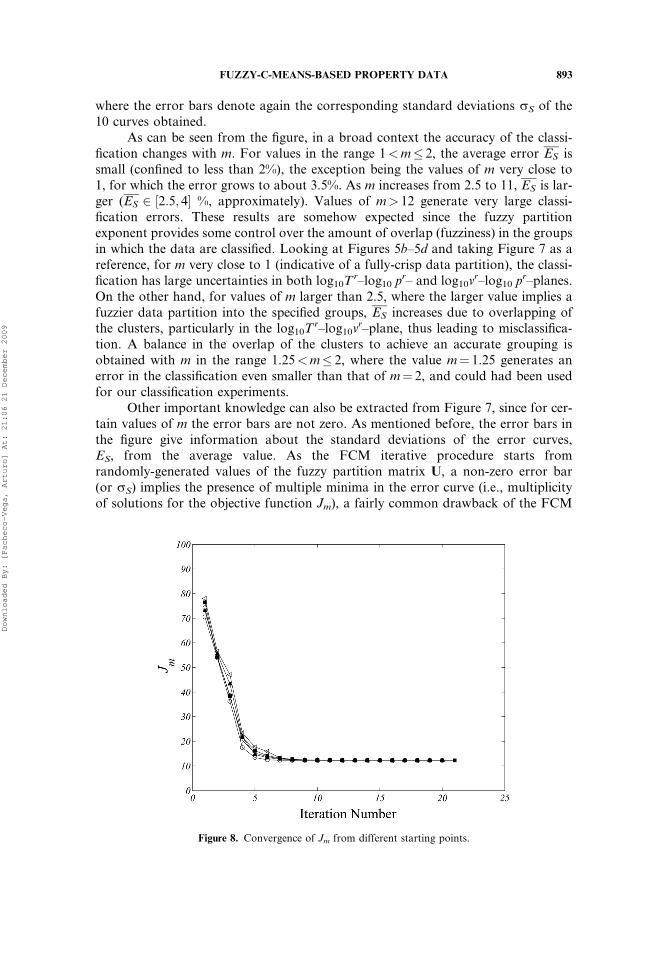
where the error bars denote again the corresponding standard deviations rS of the10 curves obtained.
As can be seen from the figure, in a broad context the accuracy of the classi-fication changes with m. For values in the range 1<m� 2, the average error ES issmall (confined to less than 2%), the exception being the values of m very close to1, for which the error grows to about 3.5%. As m increases from 2.5 to 11, ES is lar-ger (ES 2 ½2:5; 4� %, approximately). Values of m> 12 generate very large classi-fication errors. These results are somehow expected since the fuzzy partitionexponent provides some control over the amount of overlap (fuzziness) in the groupsin which the data are classified. Looking at Figures 5b–5d and taking Figure 7 as areference, for m very close to 1 (indicative of a fully-crisp data partition), the classi-fication has large uncertainties in both log10T
r–log10 pr– and log10v
r–log10 pr–planes.
On the other hand, for values of m larger than 2.5, where the larger value implies afuzzier data partition into the specified groups, ES increases due to overlapping ofthe clusters, particularly in the log10T
r–log10vr–plane, thus leading to misclassifica-
tion. A balance in the overlap of the clusters to achieve an accurate grouping isobtained with m in the range 1.25<m� 2, where the value m¼ 1.25 generates anerror in the classification even smaller than that of m¼ 2, and could had been usedfor our classification experiments.
Other important knowledge can also be extracted from Figure 7, since for cer-tain values of m the error bars are not zero. As mentioned before, the error bars inthe figure give information about the standard deviations of the error curves,ES, from the average value. As the FCM iterative procedure starts fromrandomly-generated values of the fuzzy partition matrix U, a non-zero error bar(or rS) implies the presence of multiple minima in the error curve (i.e., multiplicityof solutions for the objective function Jm), a fairly common drawback of the FCM
Figure 8. Convergence of Jm from different starting points.
FUZZY-C-MEANS-BASED PROPERTY DATA 893
Downloaded By: [Pacheco-Vega, Arturo] At: 21:06 21 December 2009
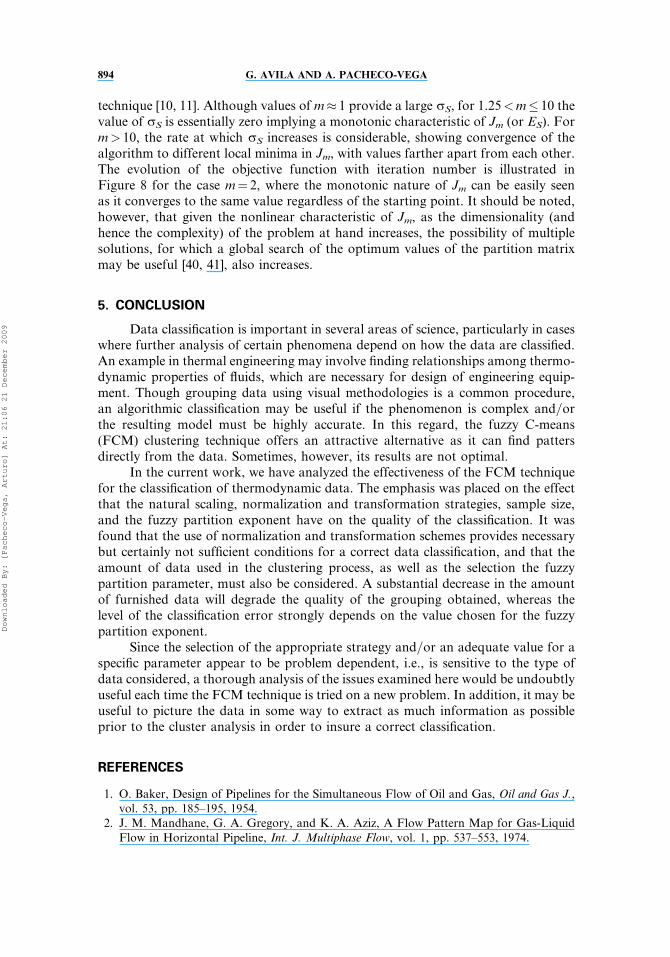
technique [10, 11]. Although values of m� 1 provide a large rS, for 1.25<m� 10 thevalue of rS is essentially zero implying a monotonic characteristic of Jm (or ES). Form> 10, the rate at which rS increases is considerable, showing convergence of thealgorithm to different local minima in Jm, with values farther apart from each other.The evolution of the objective function with iteration number is illustrated inFigure 8 for the case m¼ 2, where the monotonic nature of Jm can be easily seenas it converges to the same value regardless of the starting point. It should be noted,however, that given the nonlinear characteristic of Jm, as the dimensionality (andhence the complexity) of the problem at hand increases, the possibility of multiplesolutions, for which a global search of the optimum values of the partition matrixmay be useful [40, 41], also increases.
5. CONCLUSION
Data classification is important in several areas of science, particularly in caseswhere further analysis of certain phenomena depend on how the data are classified.An example in thermal engineering may involve finding relationships among thermo-dynamic properties of fluids, which are necessary for design of engineering equip-ment. Though grouping data using visual methodologies is a common procedure,an algorithmic classification may be useful if the phenomenon is complex and=orthe resulting model must be highly accurate. In this regard, the fuzzy C-means(FCM) clustering technique offers an attractive alternative as it can find pattersdirectly from the data. Sometimes, however, its results are not optimal.
In the current work, we have analyzed the effectiveness of the FCM techniquefor the classification of thermodynamic data. The emphasis was placed on the effectthat the natural scaling, normalization and transformation strategies, sample size,and the fuzzy partition exponent have on the quality of the classification. It wasfound that the use of normalization and transformation schemes provides necessarybut certainly not sufficient conditions for a correct data classification, and that theamount of data used in the clustering process, as well as the selection the fuzzypartition parameter, must also be considered. A substantial decrease in the amountof furnished data will degrade the quality of the grouping obtained, whereas thelevel of the classification error strongly depends on the value chosen for the fuzzypartition exponent.
Since the selection of the appropriate strategy and=or an adequate value for aspecific parameter appear to be problem dependent, i.e., is sensitive to the type ofdata considered, a thorough analysis of the issues examined here would be undoubtlyuseful each time the FCM technique is tried on a new problem. In addition, it may beuseful to picture the data in some way to extract as much information as possibleprior to the cluster analysis in order to insure a correct classification.
REFERENCES
1. O. Baker, Design of Pipelines for the Simultaneous Flow of Oil and Gas, Oil and Gas J.,vol. 53, pp. 185–195, 1954.
2. J. M. Mandhane, G. A. Gregory, and K. A. Aziz, A Flow Pattern Map for Gas-LiquidFlow in Horizontal Pipeline, Int. J. Multiphase Flow, vol. 1, pp. 537–553, 1974.
894 G. AVILA AND A. PACHECO-VEGA
Downloaded By: [Pacheco-Vega, Arturo] At: 21:06 21 December 2009
3. S. Wongwises, T. Wongchang, J. Kaewon, and C. C. Wang, A Visual Study of Two-PhaseFlow Patterns of HFC-134a and Lubricant Oil Mixtures, Heat Transfer Eng., vol. 23,pp. 13–22, 2002.
4. K. de Queiroz and D. A. Good, Phenetic Clustering in Biology: A Critique, Quarterly Rev.of Biology, vol. 72, no. 1, pp. 3–30, 1997.
5. P. E. Green, R. E. Frank, and P. J. Robinson, Cluster Analysis in Test Market Selection,Management Sci., vol. 13, pp. B387–B400, 1967.
6. W. J. Chen, M. L. Giger, U. Bick, and G. M. Newstead, Automatic Identification andClassification of Characteristic Kinetic Curves of Breast Lesions on DCE-MRI, Med.Physi., vol. 33, no. 8, pp. 2878–2887, 2006.
7. K. W. Johnson, P. M. Langdon, and M. F. Ashby, Grouping Materials and Processesfor the Designer: An Application of Cluster Analysis, Materi. and Des., vol. 23, no. 1,pp. 1–10, 2002.
8. D. Guo, A. Weeks, and H. Klee, Robust Approach for Suburban Road Segmentation inHigh-Resolution Aerial Images, Inter. J. of Remote Sensing, vol. 28, no. 1–2, pp. 307–318,2007.
9. M. Faundez-Abans, M. I. Ormeno, and M. de Oliveira-Abans, Classification of PlanetaryNebulae by Cluster Analysis and Artificial Neural Networks, Astronomy AstrophysicsSupplement Series, vol. 116, no. 2, pp. 395–402, 1996.
10. A. K. Jain, M. N. Murty, and P. J. Flynn, Data Clustering: A Review, ACM ComputingSurveys, vol. 31, no. 3, pp. 264–323, 1999.
11. X. Gao and W. Xie, Advances in Theory and Aplications of Fuzzy Clustering, ChineseSci. Bull., vol. 45, no. 11, pp. 961–970, 2000.
12. A. Pacheco-Vega, G. Dıaz, M. Sen, K. T. Yang, and R. L. McClain, Heat Rate Predic-tions in Humid Air-Water Heat Exchangers using Correlations and Neural Networks,ASME J. Heat Transfer, vol. 123, no. 2, pp. 348–354, 2001.
13. A. Vernet and G. A. Kopp, Classification of Turbulent Flow Patterns with FuzzyClustering, Eng. Appl. of Artificial Intelligence, vol. 15, no. 3–4, pp. 315–326, 2002.
14. H. Paasche and J. Tronicke, Cooperative Inversion of 2D Geophysical Data Sets: AZonal Approach Based on Fuzzy C-Means Cluster Analysis, Geophysics, vol. 72, no. 3,pp. A35–A39, 2007.
15. J. C. Dunn, A Fuzzy Relative of the ISODATA Process and Its use in Detecting CompactWell-Separated Clusters, Cybernetics and Systems: An Inter. J., vol. 3, no. 3, pp. 32–57,1973.
16. R. Duda and P. Hart, Pattern Classification and Scene Analysis, Wiley Interscience,New York, 1973.
17. L.A. Zadeh, Fuzzy Sets, Information & Control, vol. 8, pp. 338–353, 1965.18. A. Baraldi and P. Blonda, A Survey of Fuzzy Clustering Algorithms for Pattern
Recognition-Part I, IEEE Trans. Sys., Man, Cyber.-Part B: Cybernetics, vol. 9, no. 6,pp. 778–785, 1999.
19. A. Baraldi and P. Blonda, A Survey of Fuzzy Clustering Algorithms for PatternRecognition-Part II, IEEE Trans. Sys., Man, Cyber.-Part B: Cybernetics, vol. 9, no. 6,pp. 786–801, 1999.
20. K. S. Chuang, H. L. Tzeng, S. Chen, J. Wu, and T. J. Chen, Fuzzy C-Means Clusteringwith Spatial Information for Image Segmentation, Computerized Medical Imaging andGraphics, vol. 30, no. 1, pp. 9–15, 2006.
21. G. Usera, A. Vernet, J. Pallares, and J. A. Ferre, A Conditional Sampling Method Basedon Fuzzy Clustering for the Analysis of Large-Scale Dynamics in Turbulent Flows, Euro.J. of Mech. B: Fluids, vol. 25, no. 2, pp. 172–191, 2006.
22. P. Willett, J. M. Barnard, and G. M. Downs, Chemical Similarity Searching, J. Chem. Inf.Comput. Sci., vol. 38, no. 6, pp. 983–996, 1998.
FUZZY-C-MEANS-BASED PROPERTY DATA 895
Downloaded By: [Pacheco-Vega, Arturo] At: 21:06 21 December 2009
23. J. D. Holliday, S. L. Rodgers, P. Willett, M. Y. Chen, M. Mahfouf, K. Lawson, andG. Mullier, Clustering Files of Chemical Structures using the Fuzzy K-Means ClusteringMethod, J. Chem. Inf. Comput. Sci., vol. 44, no. 3, pp. 894–902, 2004.
24. P. D’urso, Fuzzy C-Means Clustering Models for Multivariate Time-Varying Data:Different Approaches, Int. J. Uncertainty Fuzziness Knowledge-Based Sys., vol. 12, no. 3,pp. 287–326, 2004.
25. S. Kobashi, Y. Hata, Y. T. Kitamura, T. Hayakata, and T. Yanagida, Brain StateRecognition using Fuzzy C-Means (FCM) Clustering with Near Infrared Spectroscopy(NIRS), Lecture Notes in Comp. Sci., vol. 2206, pp. 124–136, 2001.
26. F. Hoppner, F. Klawonn, R. Kruse, and T. Runkler, Fuzzy Cluster Analysis: Methodsfor Classification, Data Analysis and Image Recognition, Wiley and Sons, Baffins Lane,
Chichester, 1999.27. J. C. Bezdek, J. M. Keller, R. Krishnapuram, and N. R. Pal, Fuzzy Models and Algorithms
for Pattern Recognition and Image Processing, Springer, New York, 2005.28. J. C. Bezdek, Pattern Recognition with Fuzzy Objetive Function Algorithms, Plenum Press,
New York, 1981.29. X. L. L. Xie and G. A. Beni, A Validity Measure for Fuzzy Clustering, IEEE Trans. on
Pattern Analysis and Machine Intelligence, vol. 13, no. 8, pp. 841–847, 1991.30. M. Bouguessa, S. R. Wang, and H. J. Sun, An Objective Approach to Cluster Validation,
Pattern Recognition Letters, vol. 27, no. 13, pp. 1419–1430, 2006.31. F. Okeke and A. Karnieli, Linear Mixture Model Approach for Selecting Fuzzy Exponent
Value in Fuzzy C-Means Algorithm, Ecological Informatics, vol. 1, no. 1, pp. 117–124,2006.
32. R. E. Sonntag and G. Van Wylen, Introduction to Thermodynamics: Classical and Statisti-cal, Wiley and Sons, New York, 1982.
33. W. Wagner and A. Pruß, The IAPWS Formulation 1995 for the Thermodynamic Proper-ties of Ordinary Water Substance for General and Scientific Use, J. Physical and ChemicalReference Data, vol. 31, no. 2, pp. 387–535, 2002.
34. B. S. Everitt, S. Landau, and L. Morven, Cluster Analysis, 4th ed., Arnold, New York,2001.
35. J. Han and M. Kamber, Data Mining: Concepts and Techniques, Morgan Kaufmann
Publishers, San Francisco, CA, 2006.36. S. Y. Kim, J. W. Lee, and J. S. Bae, Effect of Data Normalization on Fuzzy Clustering of
DNA Microarray Data, BMC Bioinformatics, 7(Article number 134), 2006.
37. X. Li, X. Lu, J. Tian, P. Gao, H. Kong, and G. Xu, Application of Fuzzy C-MeansClustering in Data Analysis of Metabolomics, Analytical Chem., vol. 81, no. 11,pp. 4468–4475, 2009.
38. S. M. Scott, D. James, and Z. Ali, Data Analysis for Electronic Nose Systems,Microchimica Acta, vol. 156, no. 3–4, pp. 183–207, 2006.
39. R. Aruga, P. Mirti, and V. Zelano, Influence of Transformation and Scaling of Archaeo-metric Data on Clustering and Visual-Display, Analusis, vol. 18, no. 10, pp. 597–598,1990.
40. A. Pacheco-Vega, M. Sen, K. T. Yang, and R. L. McClain, Genetic-Algorithm-Based-Predictions of Fin-Tube Heat Exchanger Performance, in J. S. Lee, (ed.), Proceedingsof the Eleventh International Heat Transfer Conference, vol. 6, pp. 137–142, New York,August 1998, Taylor & Francis.
41. A. Pacheco-Vega, M. Sen, and K. T. Yang, Simultaneous Determination of In- andOver-Tube Heat Transfer Correlations in Heat Exchangers by Global Regression, Int.J. Heat Mass Transfer, vol. 46, no. 6, pp. 1029–1040, 2003.
896 G. AVILA AND A. PACHECO-VEGA
Downloaded By: [Pacheco-Vega, Arturo] At: 21:06 21 December 2009