FUSION TECHNOLOGY - International Nuclear Information ...
432
-
Upload
khangminh22 -
Category
Documents
-
view
0 -
download
0
Transcript of FUSION TECHNOLOGY - International Nuclear Information ...


FUSION TECHNOLOGY
Annual Report of the Association EURATOM-CEA
2005
(full report)
Compiled by : Th. SALMON and F. LE VAGUERES
ASSOCIATION EURATOM-CEA DSM/DRFC
CEA CADARACHE 13108 Saint-Paul-lez-Durance (France)
Tel. : 33 - 4 42 25 46 59 Fax : 33 - 4 42 25 64 21 e-mail : [email protected] Web : http://www-fusion-magnetique.cea.fr
This report is also available on-line at : http://www-fusion-magnetique.cea.fr
Cover: Most of the ITER diagnostics system are to be integrated in port plugs, which are water-cooled stainless steel structures inserted into the vacuum-vessel ports. The port plug must perform basic functions such as providing neutron and gamma shielding, supporting the first wall armour and shielding blanket material, closing the vacuum vessel ports, supporting the diagnostic equipment. CEA has contributed to the engineering activities (including CAD effort, structural and thermal analyses) on the port plugs and has more particularly focused on the design and diagnostic integration in the representative equatorial port plug EQ01.


- I -
CONTENTS
INTRODUCTION ................................................................................................................................ 1
EFDA TECHNOLOGY PROGRAMME ........................................................................ 3
Physics Integration
Heating and Current Drive CEFDA01-645 TW2-TPHN-NBDES1: Support to neutral beam physics and testing 1 ................ 5 CEFDA03-1129 TW3-TPHI-ICRDES1: ITER ICRF antenna and matching system design ........... 9 CEFDA05-1271 TW5-TPHI-ITERDES3: Design of the ITER ICRF antenna for the Internal and external matching concepts .................................................... 13 TW5-TPHI-ICRFDEV Development of high performance capacitors for the ITER Ion Cyclotron array .......................................................................... 17
Diagnostics CEFDA02-1003 TW2-TPDS-DIASUP4: Support to ITER diagnostic design Polarimetry, motional stark effect, bolometry, thermography ............................... 21 CEFDA03-1111 TW3-TPDS-DIASUP1: Support to the ITER diagnostic system: Bolometer, wide-angle viewing, calorimetry, q-profile determination, reflectometry and polarimetry ............................................................................... 25 CEFDA04-1206PI TW4-TPDS-DIASUP1: Diagnostic design for ITER: Port Integration ................. 27 CEFDA04-1206MD TW4-TPDS-DIASUP1: Diagnostic design for ITER: Magnetic Diagnostics ....... 31 TW5-TPDC-IRRCER-D03 Assessment of IR fibres for thermography applications, Initial gamma induced effects, then neutron irradiations Fibre selection and provision, diagnostic preparation and measurements ............. 37
Vessel-In Vessel
Vessel-Blanket and Materials CEFDA04-1202 TW5-TVV-RFUT: Cooperation with Russian Federation in UT systems assessment ..................................................................................... 39 CEFDA05-1226 TW5-TVM-LIP: Rules for design, fabrication and inspection Modification of ITER materials documents, assessment of materials data and maintenance of a database ............................................................................... 43 TW2-TVV-ROBOT Dynamic test rig for Intersector Welding Robot (IWR) for VV sector field joining ..................................................................................... 49 TW3-TVM-JOINT Characterisation of the CuCrZr/SS joint strength for different blanket manufacturing conditions ..................................................... 51

- II -
TW4-TVV-Hybrid Further development of the hybrid MIG/Laser welding technique for VV sector field joining ..................................................................................... 55 TW4-TVV-OSWELD Simulation of phased array techniques for qualification UT methods for one sided welds during VV manufacture ......................................................... 59 TW5-TVM-Braze Manufacture and characterization of silver free braze material ............................. 63 TW5-TVM-COMADA Investigations of the effect of creep-fatigue interaction on the mechanical performance and lifetime of CuCrZr ....................................... 67 TW5-TVV-MPUT Qualification of UT methods for one sided welds during VV manufacture Weld structure ........................................................................................................ 71
Plasma Facing Components CEFDA02-583 TW1-TVV-DES: Destructive examination of primary first wall panels and mock-ups ............................................................ 75 CEFDA03-1029 TW3-TVB-JOINOP: Optimization of Be/Cu alloy joints for primary first wall panels .................................................................................. 79 CEFDA04-1138 TW4-TVB-HFCSMU: High heat flux testing of optimised CuCrZr/SS mock-ups - 200 kW electron beam gun test ................... 85 CEFDA04-1218 TW5-TVD-HHFT: Monitoring and analysis of divertor components tested in FE200 - 200 kW electron beam gun test ................................................. 89 CEFDA05-1243 TW5-TVD-NDTEST: Upgrade of the SATIR test bed for infrared thermographic inspections .................................................................. 93 CEFDA05-1248 TW5-TVD-ACCEPT: Influence of carbon erosion on the acceptance criteria of the ITER divertor : ANSYS model for erosion ................................................. 99 CEFDA05-1257 TW5-TVB-JOINOP: Optimization of Be/CuCrZr HIP joining for FW panels ..... 101 TW1-TVP-CFC1 Neutron effects on dimensional stability and thermal properties of CFCs ............ 103 TW5-TVD-CUCFC Development of alternative CFC/Cu joining techniques ....................................... 107
Remote Handling TW5-TVR-AIA Articulated Inspection Arm (AIA) ......................................................................... 111 TW4-TVR-RADTOL Radiation tolerance assessment of standard electronic components TW5-TVR-RADTOL for Remote Handling .............................................................................................. 113 TW4-TVR-WHMAN Development of a water hydraulic manipulator ..................................................... 117 TW5-TVR-WHMAN
Magnet Structure CEFDA03-1015 TW2-TMSM-COOLIN: Mock-ups for the TF and CS terminal regions and cooling inlets ................................................................................................... 121 CEFDA03-1120 TW3-TMSC-ASTEST: Tests of advanced Nb3Sn strands Extensive characterization of industrial advanced Nb3Sn strands developed for ITER TF coils system ..................................................................... 127 CEFDA04-1127 TW4-TMSC-SAMAN1: Manufacture of subsize samples .................................... 131

- III -
CEFDA04-1134 TW4-TMSC-BARBEN: Effect of bending strain on Nb3Sn strands Study of bending strain effect on critical properties of Nb3Sn strands jacketed with stainless steel for various bending amplitudes and temperatures .... 135 CEFDA04-1170 TW4-TMSC-RESDEV: Development and testing on new resin solution ............. 139 CEFDA04-1201 TW5-TMS-EDDES: European dipole design - accelerator type magnet ............... 141 CEFDA04-1215 TW4-TMSC-CRYOLA: Cryogenic tests on ITER magnet structural materials ... 145 CEFDA04-1219 TW4-TMSC-SAMFSS: Manufacture of two full size samples of Nb3Sn strands .................................................................................................... 147 TW1-TMS-PFCITE Poloidal Field Conductor Insert (PFCI) ................................................................. 151 TW5-TMSF-HTSMAG Scoping studies of HTS fusion magnets ................................................................ 155 TW5-TMSF-HTSPER HTS materials for fusion magnets ......................................................................... 159
Tritium Breeding and Materials
Breeding Blanket Helium Cooled Pebble Bed (HCPB) blanket TW2-TTBB-002b-D01 Blanket manufacturing techniques - First wall HIPing with open channels .......... 161 TW5-TTBB-006-D04 HCPB Breeder and Neutron Multiplier Materials Procurement and characterization of Li2TiO3 pebbles with improved geometrical characteristics ............................................................ 165 Helium Cooled Lithium Lead (HCLL) blanket TW2-TTBC-001-D01 TBM design, integration and analysis Blanket system design and analysis - Integration and testing in ITER .................. 167 TW2-TTBC-002-D01 Blanket manufacturing technologies Fabrication processes for HCLL and HCPB TBMs ............................................... 171 TW2-TTBC-002-D02 Blanket manufacturing technologies Manufacturing and testing of mock-ups Qualification samples for HCLL and HCPB TBMs .............................................. 175 TW2-TTBC-002-D03 Testing of small-scale mocks-ups to qualify manufacturing technologies ............ 179 TW2-TTBC-003-D05 Blanket manufacturing technologies - Coating qualification ................................. 181 TW2-TTBC-005-D01 Safety and licensing Test Blanket Module (TBM) accidental safety study ............................................ 185 TW2-TTBC-005-D02 TBM system detailed safety and licensing ............................................................ 191 TW4-TTBC-001-D01 TBM design, integration and analysis - Testing programme and engineering design of the first TBM for ITER H-H phase .............................. 195 TW5-TTBC-001-D01 TBM design, integration and analysis Design and analyses of the HCLL TBM including design of supporting system and instrumentation integration ........................................... 197 TW5-TTBC-001-D02 TBM design, integration and analysis - Finalization of the conceptual design of the prototypical HCLL TBM mock-up .............................................................. 203

- IV -
TW5-TTBC-001-D03 TBM design, integration and analysis PIE and hot cell requirements for the HCLL TBM ............................................... 207 TW5-TTBC-001-D06 Further thermal-hydraulics and design study related to the choice of reference He cooling scheme for the HCLL TBM ............................................ 209 TW5-TTBC-001-D07 TBM design, integration and analysis Detailed TBM development workplan up to EM-TBM installation in ITER ........ 213 TW5-TTBC-002-D01 TBM manufacturing R&D Diademo mock-up ................................................................................................. 215 TW5-TTBC-005-D01 TBM design, integration and analysis TBM HCLL instrumentation definition ................................................................. 219
Structural materials development Reduced Activation Ferritic Martensitic (RAFM) steels TW2-TTMS-001b-D02 Irradiation performance - Neutron irradiation to 70 dpa at 325°C and PIE ........... 221 TW2-TTMS-004b-D01 Qualification of fabrication processes Tubing process qualification: advanced process development and testing for the production of TBM’s cooling channels .................................... 225 TW4-TTMS-006-D03 ODS RAFM improvement Elaboration of Eurofer ODS steels by internal oxidation ...................................... 229 TW4-TTMS-007-D02 Modelisation of irradiation effects Ab-initio defect energy calculations in the Fe-He and Fe-He-C systems .............. 233 TW5-TTMS-004-D02 Qualification of fabrication processes Microstructural analysis and qualification of joints and welds from TBM mock-up fabrication ............................................................................ 237 TW5-TTMS-004-D04 Qualification of fabrication processes Characterization of welding distorsion of simplified welded mock-ups ................ 239 TW5-TTMS-004-D06 Qualification of fabrication processes Weldability of dissimilar tubes (Eurofer/SS316) by fusion butt welding with YAG laser ................................................................. 241 TW5-TTMS-004-D07 Qualification of fabrication processes Weldability of homogeneous plates ....................................................................... 243 TW5-TTMS-005-D01 Rules for design, fabrication, inspection Update Data Base and Appendix A of DEMO-SDC ............................................. 247 TW5-TTMS-006-D01 Structural materials - High performance steels - Improvement of fabrication process for ODS-EUROFER - Refinement of chemical composition and thermomechanical treatments with emphasis on the fabrication issues of larger batches ............................................................. 249 TW5-TTMS-007-D04 Modelisation of irradiation effect - Event-based Monte Carlo simulations of defect microstructure evolution of Iron containing C during resistivity recovery experiments ................................................................. 251 TW5-TTMS-007-D21 Structutal materials - Modelisation of irradiation effects Fusion-Relevant Materials Irradiation in Jannus for Multi-Scale Modelling Experimental Validation ............................................. 253

- V -
Advanced materials TW3-TTMA-001-D04 SiC/SiC ceramic composites and divertor and plasma facing materials ................ 257 TW3-TTMA-002-D04 TW5-TTMA-001-D08 Modelling of the mechanical behaviour of advanced 3D SiCf/SiC composite ...... 259
Safety and Environment TW3-TSS-LT4 Analysis of two dominant accidental sequences of the PPCS model D Main physical phenomena and first assessment .................................................... 263 TW4-TSW-002 Study on possible concrete detritiation .................................................................. 267 TW5-TSS-SEA3.5 In-vessel safety - Mitigation of hydrogen and dust explosions .............................. 273 TW5-TSS-SEA5.3 Cryogenic experiments on the CEA EVITA facility ............................................. 275 TW5-TSS-SEA5.5 PAXITR validation effort on EVITA tests ............................................................ 279 TW5-TSS-SEA5.6 Enhancement of the Pactiter computer code and related fusion specific experiments ................................................................. 281
System Studies
Power Plant Conceptual Studies (PPCS) CEFDA05-1285 TW5-TRP-003: Segmentation and maintenance Assessment and comparison of concepts ............................................................... 285 TW4-TRP-002-D02b Conceptual design of a HCLL Reactor Tritium control & management analysis Thermo-hydraulic and thermo-mechanical analyses ............................................. 289 TW5-TRP-002-D03a Analysis of current profile control in tokamak reactor scenarios .......................... 293
ITER Site Preparation
European ITER site Studies (EISS) CEFDA04-1161 European ITER Site Studies 4 - Cadarache TW4-TES-COLABA Cadarache site for ITER - Collaboration with Local Authorities .......................... 297
Design Support and Procurement CEFDA03-1098 TW3-TDS-MAG: Detailed engineering and manufacturing studies of the ITER magnet system: Poloidal Field (PF) coil windings and cold test assessment ......... 301 CEFDA04-1177 TW5-TDS-QA: EFDA quality assurance system for ITER relevant activities ...... 305
JET Technology
Physics Integration Heating Systems CEFDA04-1146 JW4-EP-ICRH: Contribution to ICRH component monitoring and management ................................................................................. 307

- VI -
Diagnostics CEFDA03-1044 JW3-EP-IRV and JW4-EP-IRV: Diagnostic enhancement CEFDA04-1180 Development, follow-up of the procurement and performance of acceptance test ....................................................................... 309 "
Vessel-In Vessel Plasma Facing Components CEFDA05-1261 JW5-BEP-CEA-28: ITER wall materials in JET Support of the operator in designing JET PFC Development of W coatings on CFC substrate ...................................................... 311 JW5-AEP-CEA-26 R&D on W coating on CFC and bulk W tiles development in support of the ITER-like first wall experiment project ...................................... 313
Safety and Environment JW5-FT-3.2 Design and construction of the system for laser detritiation of JET co-deposited layers ..................................................................................... 317 JW5-FT-3.2RHpart Design and construction of the system for laser detritiation of JET co-deposited layers Remote handling expertise for laser detritiation .................................................... 321
Heating Systems Technology Project CEFDA04-1140 TW4-THHN-ADSD2: Development of the negative ion source (arc driven) for the ITER neutral beam injectors for long pulse operation ............................... 323 CEFDA04-1182 TW4-THHN-IITF2: First ITER NBI and the ITER NB test facility Progress in the design ............................................................................................ 327 CEFDA04-1182RHpart TW4-THHN-IITF2: First ITER NBI and the ITER NB test facility RH design feasibility analysis of NBI inspection .................................................. 331
UNDERLYING TECHNOLOGY PROGRAMME ................................................ 335
Vessel-In Vessel
Vessel-Blanket and Materials UT-VIV/VV-Hybrid-Modeli Optimization of hybrid welding for VV manufacturing Weldability of Eurofer homogeneous plates .......................................................... 337
Plasma Facing Components UT-VIV/PFC-Damage Study of damage mechanisms in PFC ................................................................... 339 UT-VIV/PFC-HIP Improvement of the reliability, performance and industrial relevancy of HIP processes for PFC components .................................................................. 343 UT-VIV/PFC-NanoSic Nano crystalline silicon carbide (SiC) Mechanical properties of nanocrystalline SiC ....................................................... 347 UT-VIV/PFC-Pyro Application of a tricolour pyroreflectometer to plasma facing components in-situ infrared monitoring ..................................... 351

- VII -
Remote Handling UT-VIV/AM-AIA Technologies for vacuum and temperature conditions for remote handling systems Articulated Inspection Arm (AIA) ......................................................................... 357 UT-VIV/AM-ECIr Radiation effects on electronic components .......................................................... 359 UT-VIV/AM-Hydro Technologies and control for remote handling systems ......................................... 363
Tritium Breeding and Materials
Breeding Blanket UT-TBM/BB-He Helium components technology Problems and outlines of solutions ........................................................................ 367
Materials Development Structural Materials UT-TBM/MAT-LAM/Opti Development of novel reduced activation martensitic steels with improved creep properties ............................................................................. 371 UT-TBM/MAT-Micro Microstructural evolution of Fe-C model alloy and Eurofer under 1 MeV electron irradiation with and without He pre-implantation .............. 375 UT-TBM/MAT-Modpulse Pulsed irradiation of the martensitic alloy Eurofer ................................................ 377
Safety and Environment UT-S&E-LASER/DEC Laser heating of complex graphite surfaces by high repetition rate nanosecond pulses ............................................................. 381 UT-S&E-LiPbwater Analysis of the consequences of a common failure of the Test Blanket Module and water blanket in ITER ........................................ 385 UT-S&E-Tritium-Impact Impact of contamination with tritium at cell level ................................................. 389
APPENDIX 1 : Directions contribution to the fusion programme ........................ 395
APPENDIX 2 : Allocations of tasks .......................................................................................... 399
APPENDIX 3 : Reports and publications .............................................................................. 407
APPENDIX 4 : CEA tasks in alphabetical order .............................................................. 415
APPENDIX 5 : CEA sites ................................................................................................................. 421

- VIII -

- 1 -
INTRODUCTION
European research on controlled thermonuclear fusion is carried out in an integrated programme with the objective to develop a safe, clean and economically viable energy source. Part of this programme is under the responsibility of the European Fusion Development Agreement (EFDA) which provides a framework covering the activities in the field of technology (both Next Step and Reactor) and the collective use of the Joint European Torus (JET). This annual report summarizes activities performed by the Euratom-CEA Association in 2005 within the frame of the European Technology Programme (both “EFDA” activities and “Underlying Technology” programme). It does not include keep-in touch activities in the frame of Inertial Confinement Energy, reported in a specific issue performed by the European Commission. This full report is also available on line at “ http://www-fusion-magnetique.cea.fr “. In each section, the tasks are sorted out according to the EFDA main fields : Physics (TP) , Vessel/In-Vessel (TV), Magnets (TM), Tritium Breeding and Materials (TT), Safety and Environment (TS), System Studies (TR), JET technology activities (TJ),… The Euratom-CEA Association is involved in all these topics (figure 1). Euratom-CEA activities carried out in the field “Physics Integration” are mainly linked to the Ion Cyclotron Range of
Frequencies (ICRF) Antenna developments and to the development of diagnostic components. In particular, concerning diagnostic design for ITER port integration has been studied (see cover).
Plasma Facing Component (PFC) developments, Vacuum Vessel/Blanket activities and Remote handling studies are carried
out inside the field “Vessel/In-Vessel”. The Vacuum Vessel (VV) studies have mainly focused at welding techniques (hybrid MIG/Laser), and at qualification of inspection methods along the Vacuum Vessel intersector weld. On the PFC side, investigations have been performed on material knowledge (CuCrZr creep-fatigue studies, neutron effects on material properties of CFC), development and optimisation of Be/CuCrZr joining techniques (HIP), and studies dedicated to the divertor (Carbon Erosion Modelling, Test of Divertor components in FE200). The Euratom-CEA Association has also pursued its R&D program to demonstrate the feasibility of close inspection of the ITER Divertor cassettes and Vacuum Vessel First Wall. The work performed in Remote Handling has been dedicated to improvement of our knowledge on radiation tolerance of electronic components for RH, and to the program called Articulated Inspection Arm (AIA). In 2005 this program included improvement of the knowledge of the single module of the AIA built in 2004, and start of manufacturing of the other modules of the whole arm.
In the field “Magnets”, Euratom-CEA Association has devoted a major part of its effort to the studies of advanced Nb3Sn
strands for the Toroidal Field (TF) coils, and the first full size conductor sample was manufactured. The Euratom-CEA Association has also been involved in cryogenic tests on ITER magnet structural metals where, in collaboration with FZK, thermal test bench and measurement procedures at 4K, 77K and room temperature have been upgraded and improved. On a long term approach, the Euratom-CEA Association has also launched investigations on the possible use of High Temperature Superconductor (HTS) for the future fusion reactors.
The Field “Tritium Breeding and Materials” includes for a large part reactor relevant activities. Within the frame of Test
Blanket Module (TBM), activities mainly concerned the improvement and completion of the TBM engineering design. After a first design step in which the main structure, its functional features, its mounting sequence and manufacturing characteristics were defined, the second step, relied on the optimization of the design and manufacturing of the module as well as its integration to the supporting frame. A planning and list of test requirements for the qualification of the HCLL TBM was defined. A preliminary testing programme for the HCLL TBMs in ITER has been proposed on the basis of the foreseen ITER scenario and of the TBM testing strategy and mock-ups test objectives. Manufacturing of relevant mock-ups are still under progress. Within the frame of the Helium Cooled Pebble Bed (HCPB) concept programmes, studies about the development of Li 2TiO3 pebbles are on going. The main objective of 2005 which was to improve the shape of the Li2TiO3 pebbles has been successfully achieved. For this, several batches of 100 grams of Li2TiO3 pebbles with the size distribution in the range 0.6 to 0.8 mm have been produced and a revision of the formulation of the extrusion paste (binder and plasticizer content) has been necessary. Euratom-CEA maintained significant involvement in the development of structural materials for a fusion reactor, mainly focused at EUROFER in Europe, a reduced activation martensitic steel, from elaboration (internal oxidation method has been investigated), to irradiation effects (Neutron irradiation to 70 dpa at 325°C conducted in the BOR60 reactor of the Russian Research Institute of Atomic Reactors), to modelling of irradiation effect (using Ab-initio defect energy calculations or multi-scale modelling experimental validation by comparison with experimental irradiation in Jannus), without forgetting qualification of fabrication process (tubing process qualification, as well as weldability of homogeneous plate or dissimilar tubes with YAG laser).

- 2 -
“Safety and Environment” studies realized by Euratom-CEA cover different parts of this topic such as investigation on
possible concrete detritition methods, cryogenic experiment on the CEA EVITA facility (in the case of an accidental sequence of coolant ingress into the cryostat), code development and validation : on safety studies on hydrogen mitigation and dust explosion in the vaccum vessel or on prediction of activated corrosion products activities : PACTITER Code, for which validation efforts have been carried on.
Activities in the field “System studies” are dedicated to the Power Plant Conceptual Studies (PPCS). In 2005, activities
were dedicated to the reactor model AB, based on a Helium-Cooled Lithium-Lead (HCLL) blanket, especially on the subject of tritium control and management analysis, and on comparison of concepts from the point of view of segmentation and maintenance.
Activities carried out in the Field “JET
technology” are devoted to the study of different processes which can be used for tritium removal from carbon materials (a strong effort has been made on a program of laser detritiation associated to remote handling), “Housekeeping” materials, vacuum oil and organic liquids. 2005 activities have also been devoted to the plasma facing component thermo-mechanical modelling, and to the JET diagnostics and divertor enhancement.
Three specific operational divisions of the CEA, located on four sites (see appendix 5), are involved in the Euratom-CEA fusion activities:
the Nuclear Energy Division (DEN) , for In-vessel component design (first wall, divertor, blanket, …), neutronics, structural materials and safety activities,
the Technology Research Division (DRT), for activities dedicated to materials (elaboration, breeding materials) and robotics,
the Material Sciences Division (DSM), which includes the Controlled Fusion Research Department (DRFC) operating Tore Supra and responsible for plasma physics, cryoplant and magnet and plasma facing component activities.
The Euratom-CEA programme in Technology is also completed by specific R&D collaborations with industry in the fields of safety (Technicatome) and with the French National Centre for Scientific Research (CNRS) in the Plasma Facing Component activities. Progress in fusion technology is constant over the years and this report once again highlights a number of important steps that have been accomplished in this domain. Euratom-CEA, together with other European Institutions is on the forefront of technological advances which are of prime importance for the success of the ITER construction. On the longer term, progress in technology will improve the vision of an electricity producing reactor and will increase the credibility of fusion energy as a genuine energy for the future. The authors and the editors should be commended for their dedicated contribution in making this report available.
M. CHATELIER
TP TV TM TT TS TR TE TD TJ TH
UT
EFDA
TP : Physics TV : Vessel/In-Vessel TM : Magnets TT : Tritium Breeding and Materials TS : Safety and Environment TR : System studies
TE : ITER Site Preparation and activities devoted to ITER future construction in Cadarache TD : Design Support and Procurement TJ : JET Technology TH : Heating Systems Technology Project
EFDA : European Fusion Development Agreement program UT : Underlying Technology program
Figure 1 : breakdown of the work carried out by Field

- 3 -
EUROPEAN FUSION DEVELOPMENT AGREEMENT TECHNOLOGY PROGRAMME
Underlying Technology
1 - Physics - Heating systems - Diagnostics
2- Vessel/In Vessel - Vessel-Blanket&Materials - Plasma Facing Components - Assembly and Maintenance
4 - Tritium Breeding and Materials - Breeding blankets - Materials development
8 - Design Support & Procurement
6 - System Studies - Power Plant
3 - Magnet structure 7 - ITER Site Preparation - EISS
9 - JET technology
10 - Heating Systems Technology Project
5 - Safety & Environment

- 4 -

- 5 - EFDA Technology / Physics Integration / Heating and Current Drive
CEFDA01-645
Task Title: TW2-TPHN-NBDES1: SUPPORT TO NEUTRAL BEAM PHYSICS AND TESTING 1
INTRODUCTION
The European concept for a 1 MeV, 40 A negative ion based accelerator for the neutral beam system on ITER, the SINgle GAP, SINGle APerture (SINGAP), is an attractive alternative to the ITER reference design, the so-called MAMuG (Multi-Aperture, Multi-Grid) accelerator. A prototype SINGAP accelerator has been used for several years and produced D- beams of 910 keV, 30 A/m2 [1]. The measured beam profiles on the target agreed well with those predicted by calculations. However certain design features of the prototype accelerator prevented the production of beams with the optical quality required for ITER [2], i.e. a beamlet divergence of ≤ 7 mrad and beamlet aiming within ±2 mrad of that specified. Therefore a new “ITER-like” accelerator has been designed and built in order to demonstrate that the beam optics required for ITER can be achieved with a SINGAP accelerator. 2005 ACTIVITIES
VOLTAGE HOLDING 940 kV were obtained without any breakdowns over a main acceleration gap of 350 mm. Gas was added to the vacuum tank in order to suppress the dark current [3]. The pressure needed was 0.07 Pa. This is higher than the predicted pressure of 0.03 Pa for ITER [4]. Higher voltages were not attempted in order to minimize the risk of breakdowns at higher voltages damaging the 1 MV power supply. MODELING Particle trajectories for the SINGAP ITER Neutral Beam System have been calculated and the overall conclusion is that it will be feasible to use SINGAP in ITER. One of the main advantages of using SINGAP is the possibility to perform on-axis and off-axis heating of ITER by simply displacing the grounded grid. A sensitivity scan on the ITER SINGAP system was performed for different values of beam current, extraction voltage, pre-acceleration voltage and post acceleration voltage. The beam transmission was found to be relatively insensitive to changes of extraction voltage or pre-acceleration voltage. A small variation of the post acceleration voltage (≤ 5 %) is also found not to change the transmission considerably. However a change of 10 % of the current density gives a change in the transmission of 7 %.
This is due to the relatively large change in space charge that goes with the change in current density. Because the kerb remains fixed, the beamlet divergence goes off. It is the beamlet steering and not the divergence of the individual beamlets that cause the transmitted power to drop rather rapidly. The calculations were validated with dedicated experiments and were in general found to be correct. However two important issues that were found by experiments and that did not show up in any calculation were the flipping mode where the beam profile could easily change from a peaked profile to a hollow by simply change some parameters with a small amount and the relatively large halo. EXPERIMENTS The experimental campaign was performed initially with 3 apertures in the plasma grid. We quickly found a relatively low transmission of only 50-60 %. With the current limit of 100 mA from the MV power supply we had to reduce the number of apertures to 1 in order to have the possibility to perform high current density shots. Most experiments were therefore done in this configuration with a single aperture. The low transmission was traced down to be caused mainly by stripping losses and ionization of background gas. The maximum transmission achieved was 80 % but only with a low pressure in the accelerator and therefore a relatively low main acceleration voltage due to that the dark current cannot be suppressed at low gas pressures (figure 1).
Figure 1: Electrical drain current and calorimetrically
measured current vs. background D2 pressure. The calorimetric current decreases with pressure
and the drain current increases with pressure. The post-acceleration voltage was 225 kV and the
magnetic suppression filter was present inside the anode
Thermal and Electrical HV currentsShots 8891 - 8902
0
0,5
1
1,5
2
2,5
3
3,5
4
0 0,02 0,04 0,06 0,08 0,1 0,12
Deuterium Tank pressure [Pa]
Cu
rren
t (m
A)
Calorimetrically measured current on the target
Electrical Drain Current from the MV power supply

- 6 - EFDA Technology / Physics Integration / Heating and Current Drive
A measurement of the electron leakage through the extraction grid was performed using argon in the discharge instead of the usual deuterium. In this way no negative ions were produced but plenty of electrons. We found that for an extraction voltage of 1.6 kV only 1.7 ±0.4 % of the electrons leaked through the extraction grid. This corresponds well with calculations. Originally a 3 mm extraction gap (distance between plasma grid and extraction grid) was chosen. With this gap, in the accelerator, we found two interesting features. Firstly we discovered that the beamlets have a bi-Gaussian power density distribution (70 % with a divergence of ≈4-5 mrad and 30 % with a halo) as opposed to the single Gaussian with 2.5 mrad divergence of the simulation. The fraction of the total power that is seen as a halo varies between 15 % while operating at low current densities without Cs to 30 % during caesiated high current density operation. Secondly we saw that the beamlet could flip between a peaked power density profile and a hollow density profile. The onset of the “flip-mode” could happen when small (≈10 %) changes in various parameters such as extraction voltage, bias and arc power were done. The reason for this is not fully understood (figure 2).
Figure 2: The thermal images of the target for two almost identical pulses. A small change in the extraction voltage
V2 triggered a large change in the beamlet optics. The beam shifts from being peaked in shot 8566 to hollow
in shot 856. The only difference between the two shots is the small increase of the extraction grid votage(V2)
in shot 8567 After extending the extraction gap to 6 mm we discovered that the “flip-mode” disappeared, even when varying the extraction voltage, bias or the arc power within a relatively large range. However the fraction of the total power seen as a halo, did not change when the extraction gap was increased and the remained at 30 %. The best performance that was obtained with the ITER-like accelerator was achieved with the extraction gap extended to 6 mm. It yielded in all respects very similar beam optics as with the 3 mm gap. The most important feature though was that it was now possible to increase the current density to 167 A/m2 with deuterium. This is 67 % higher than previously achieved with any SINGAP configuration. This was done at 700 kV. The best performance ITER-relevant shot was pulse 9886 which had the following parameters:
- 727 keV, 120 A/m2 D- =18.5 mA for one beamlet. - 3.9 mrad horizontal divergence, 5.5 mrad vertical
divergence - 31 % halo Attempts to run at higher voltages failed due to breakdowns in the main acceleration gap. Only very limited experimental time has so far been done with the 6 mm extraction gap. CONCLUSIONS
HV conditioning pulses have demonstrated that the “ITER-like” accelerator can hold 940 kV without breakdowns. D- beams have been produced with caesium at 580 keV with a current density of 150 A/m2. The best ITER-relevant shot displayed good beam optics (3.9 mrad divergence horizontally, 5.5 mrad vertically) and was performed at 727 keV, 120 A/m2 D- = 18.5 mA for one beamlet. This new record was achieved after the gap between the plasma grid and the extraction grid was increased from 3 mm to 6 mm. The quoted current densities are derived from the calorimetrically measured power on the graphite target with an infrared camera. The experiments have so far confirmed some aspects of the design of the new “ITER-like” accelerator, but not all. In particular the experimental data show that the beamlets have a bi-Gaussian power density distribution (70% of the power can be described by a beamlet divergence of ≈4-5 mrad and 30% is in a halo) as opposed to the single Gaussian with 2.5 mrad divergence of the simulation. The fraction of the total power that is seen as a halo varies between 15% while operating at low current densities without Cs to 30% during caesiated high current density operation. REFERENCES
[1] L. Svensson, D. Boilson, H. P. L. de Esch,
R. S. Hemsworth, A. Krylov and P. Massmann, “Latest results from the Cadarache 1 MV SINGAP experiment”, Fusion Engineering and Design 66-68 (2003) 627-631
[2] H. P. L. de Esch, R. S. Hemsworth and P. Massmann,
“Updated physics design ITER-SINGAP accelerator”, submitted to Fusion Engineering and Design (Publisher Elsevier B.V.).
[3] P. Massmann, D. Boilson, H. P. L. de Esch,
R. S. Hemsworth and L. Svensson, “Voltage holding and dark currents in the Cadarache 1 MV ion beam facility”, 20th ISDEIV, Tours, 2002
[4] A. Krylov, R. S. Hemsworth, “Gas flow and related
beam losses in the ITER NBI”, submitted to Fusion Engineering and Design (Publisher Elsevier B.V.).

- 7 - EFDA Technology / Physics Integration / Heating and Current Drive
REPORTS AND PUBLICATIONS
Lennart Svensson, Bert de Esch, Ronald S. Hemsworth and Peter Massmann Final Report on EFDA Contract 01-645 “Support to Neutral Beam Physics Design and Testing 1” L. Svensson, D. Boilson, H. P. L. de Esch, R. S. Hemsworth, and A. Krylov, “Experimental results from the Cadarache 1 MV test bed with SINGAP accelerators”, Nuclear Fusion H. P. L. de Esch, R. S. Hemsworth and P. Massmann, “Updated physics design ITER-SINGAP accelerator”, submitted to Fusion Engineering and Design (Publisher Elsevier B.V.). A. Krylov, R. S. Hemsworth, “Gas flow and related beam losses in the ITER NBI”, submitted to Fusion Engineering and Design (Publisher Elsevier B.V.).
TASK LEADER
Lennart SVENSSON DSM/DRFC/SCCP/GIDEA CEA-Cadarache F-13108 Saint-Paul-lez-Durance Cedex Tel : 33 4 42 25 61 69 Fax : 33 4 42 25 62 33 e-mail : [email protected]

- 8 - EFDA Technology / Physics Integration / Heating and Current Drive

- 9 - EFDA Technology / Physics Integration / Heating and Current Drive
CEFDA03-1129
Task Title: TW3-TPHI-ICRDES1: ITER ICRF ANTENNA AND MATCHING SYSTEM DESIGN
INTRODUCTION
The objective of the activity was to propose an update of the ITER ICRH system Reference Design. As part of this task [2] conduct on the electrical design of an ICH launcher based on an in-vessel tuning system, were completed by studies on matching control algorithm suitable for a fully automatic operation of the system, matching procedure, and systems regarding arc protection. After a description of the general ITER-like structure scheme and its properties, this paper focuses on the description of the proposed upgrade and the consequences on the overall performance of the system, followed by briefs comments other topics such as the automatic array control strategy, matching procedure, arc detection and array protection, which are important aspect, part of in the design studies. 2005 ACTIVITIES
ITER-LIKE STRUCTURE (ILS) LAYOUT Most of the Ion Cyclotron (IC) launchers currently used are simple toroidal arrays of two or four elements, powered and phased to determine a desired radiation pattern. In many systems, however, in the attempt of reducing the strap maximum voltage, the array elements are themselves binary poloidal arrays, with the two radiating elements (referred as straps) conductively connected by a simple T-junction and strip line connections. This type of layout tends to increase the overall inductance of the array elements and is strongly affected by changes in both bulk plasma loading and local conductivity between current and ground potential. This layout tends also to increase the overall inductance of the array elements, and does not allow a full vectorial control of the RF currents actually coupled to the plasma, which is affected by changes in both bulk plasma loading and local conductivity between current and ground potential. In the Resonant Double Loop (RDL) structure [1] tuning elements are connected in series with the straps, the power division is resonantly obtained without artificially increasing the inductance of the system. This scheme presents the advantage to allow the vectorial control of the load currents. For this reason the RDL circuit was selected as basic array structure for the ITER IC array. In the ITER IC system design, the original RDL structure was modified as shown in figure 1, in order to achieve in addition, a significant resilience to fast resistive load variations, such as those due to ELMs [3]. In this electric scheme referred to as ITER-like structure (ILS), unlike in the original one, the input Voltage Standing Wave Ratio (VSWR) can be limited
below a specific value, independent of resistive load variations, which depends on the circuit input resistance.
V V VI I I
Untuned binary array Tuned binary array (RDL) ILS
Figure 1: Types of array elements used in current IC H&CD systems
ARRAY LAYOUT The array design update proposed are a simplification and an upgrade of the reference design keeping unchanged the general ILS scheme but with layout modifications allowing significant improvement of efficiency and reliability. The main objectives of the modification were to upgrade the array performance by improving the dielectric strength in most part of the array. These great simplifications of the array layout were also conducted with the idea to make the maintenance easier (in Hot cell and possibly in situ), and to reduce cost and all aspect related to waste management. The first modification proposed is the increase of the poloidal order from eight to twelve ILS. This change was possible thanks to the modification of the geometry of the tuning system and Vacuum Transmission Line (VTL) and to the change the strap layout and position of the short circuit of the mid plane ILS. The new strap layout with the short circuit in the mid-plan on the ILS has some potential advantage compared with the geometry of the RD. This configuration allows a more compact layout for the antenna housing, an improved symmetry in the strap loops, independent of the first wall profile, and shorter strap feeder. 3D FEM modelling also suggest that the toroidal components of the currents in the plasma facing components of the array at ground potential are also reduced. This feature is in general beneficial in order to minimize sheaths potentials [4]. In the FDR design, the tuning elements considered consist of a short-circuited (SC) stub tuner, which poses a number of unresolved issues related to its dimensions, actuation and voltage stand off. The replacement of this long short circuited structure using high current, sliding contacts operating in severe environment by a tuning component consisting on a compact variable Open Circuit (OC)

- 10 - EFDA Technology / Physics Integration / Heating and Current Drive
transmission line is proposed. On figure 2b, the layout of the tuning network for one IL structure, as proposed in the FDR, with tuning stubs and coaxial chokes is sketched. These chokes can be eliminated if the tuning stubs are accommodated in re-entrant cavities in the VTL (as shown in figure 2a), now providing itself the necessary decoupling of the tuning stubs from ground potential and leading to a significant reduction of the space requirements. The VTL features now an elongated cross section: as in both designs the VTL is the first stage of a multi sections, λ/4 transformer, it can be reduced to a standard circular cross section in one stage transition.
Figure 2: Proposed updates:
a) updated design
b) reference design The OC stub would be submitted to the same voltage distribution along its length as the SC stub reaching a maximum value at the open circuit. In order to further improve the overall dielectric strength in the tuning system, the basic idea is to isolate from the torus vacuum the volume within the port plug where the voltages are the highest. The use of dielectric enclosures consisting in ceramic septa (figure 3) appears to be viable way to proceed. These dielectric septa should however be sufficiently shielded from neutron flux so that mechanical and dielectric degradation of the ceramic material minimized. In this localised private vacuum, additional pumping will allow to strongly improve the dielectric strength with comparison to the unpredictable torus vacuum. This vacuum barrier close to the first wall also permits maintenance of equipment physically located in the port plug, during machine shutdown periods, without the need of venting the torus. However in any case these ceramic components have neither tritium containment nor machine safety functions, which are assigned to other dielectrics components of the same type, positioned in locations within the port plug, where the neutron flux and fluence are reduced to a negligible value. Based on the above changes, a simpler, more compact modular tuning system can be designed, completely enclosed in the port plug, without modifying any interface with vacuum vessel, blanket or other ITER subsystems and vacuum/tritium boundaries.
Figure 3: Sketch of a tuned ILS according to the proposed changes
AUTOMATIC ARRAY CONTROL STRATEGY, MATCHING PROCEDURE, ARC DETECTION AND ARRAY PROTECTION The studies highlight the fact that automatic control of the array is a crucial question to be addressed in the design studies. The match conditions in the relatively complex poloidal/toroidal array such as the ITER IC launcher are affected by inter element coupling and asymmetries. A tight control of the array current pattern is an essential requisite for controlling the power flow in an array of inductively coupled elements fed by multiple sources. A detailed matching procedure is also an important issue to consider. Therefore a strategy to electrically characterize the array elements on a reproducible load (air and/or vacuum), prior to plasma operation was studied. The low losses under this loading condition ensure all control loops to operate at their maximum gain and possible servo instabilities can be readily detected. This electrical characterization aims at establishing reproducible initial condition for the control loops. As important as the matching procedure and the array control, the arc detection and array protection is an essential control function, especially in ITER, where: breakdown damage in the plasma facing components may result in leaks of coolant, repairs of breakdown damage in such components would require in any case the replacement of the whole array or array module. In any case the consequences will remain severe and may lead to long shut down implying venting of the torus. It is therefore essential for any RF arc, consequent to a voltage breakdown, to be rapidly identified against fast load variations, detected and extinguished before leading to non negligible damage. The method used in current system is unsuitable for reliably discriminating arcs from fast load variations. The result is that these protection systems have in general an over concerned response (in particular when plasma coupling is low) and cut the RF power when they should not. As ITER operation is fully driven by the auxiliary H&CD systems, an unforeseen an abrupt lack of auxiliary power in a high β operation would have a major disruption as likely consequence. This would obviously be acceptable only if a fault condition in one of the auxiliary heating subsystems would cause a more severe damage. Preliminary studies of a system based on vectorial monitoring of RF current and voltage and closed-loop control of current in all array

- 11 - EFDA Technology / Physics Integration / Heating and Current Drive
elements were made, offering promise for an efficient, load independent breakdown control. A more detailed analysis of arc detection with this method is ongoing and will be reported in a future study. CONCLUSIONS
Numbers of changes in the ITER FDR ICH design are proposed, to simplify the system and to improve its reliability keeping unchanged the design concept and interfaces. Issues not sufficiently covered in the FD report were also addressed. At present stage this design has to be refined from an engineering point of view. This task implying a more detailed mechanical description of the array including support and cooling, completed by a more accurate EM analysis and a detail thermal analysis will be pursued in the coming year. In the meantime the development of ad-hoc components is pursue. The main element to develop is the compact tuning system, it is planned within two years to design, built and experimentally demonstrate the performances of this component. REFERENCES
[1] T.L.Owens et al., AIP Conf. Proc.129, 195 (1985) D. J. Hoffman et al., AIP Conf Proc 159, 302 (1987)
REPORTS AND PUBLICATIONS
[2] G. Bosia, S. Bremond, K. Vulliez,
EFDA/04-1129 Task final Report
[3] G. Bosia, Fusion Science & Technology, 43 pp. 153-159 (2003)
[4] L. Colas et al., invited paper to the 16th RF Topical Conference, Park City (2005)
TASK LEADER
Giuseppe BOSIA / Karl VULLIEZ DSM/DRFC/SCCP/GCHF CEA-Cadarache F-13108 Saint-Paul-lez-Durance Cedex Tel. : 33 4 42 25 73 19 Fax : 33 4 42 25 62 33 e-mail : [email protected]

- 12 - EFDA Technology / Physics Integration / Heating and Current Drive

- 13 - EFDA Technology / Physics Integration / Heating and Current Drive
CEFDA05-1271
Task Title: TW5-TPHI-ITERDES3: DESIGN OF THE ITER ICRF ANTENNA FOR THE INTERNAL AND EXTERNAL MATCHING CONCEPTS
INTRODUCTION
The ITER Ion Cyclotron Heating and Current Drive (ICH&CD) system is designed to couple 20 MW of power from a single antenna (equivalent to a power density of ~9.3 MW/m2 at the antenna) in the frequency range 40-55 MHz for a variety of ITER plasma scenarios. This requirement, together with the need to provide robust coupling in the presence of ELMs, has focused attention on the development of an integrated design for the antenna and matching system which will satisfy the ITER performance requirements [1] while operating reliably within the burning plasma environment. The reference design for the ITER ICRF system [2] developed as a result of studies performed during the ITER EDA Extension Phase has established a reference antenna design which is based on the Resonant Double Loop (RDL) concept with “conjugate T matching” for ELM-resilience. The matching system is internal to the antenna port plug and uses variable capacitive elements. This design concept provides the basis for the ITER-like ICRF antenna now being developed within the JET-EP project and which will be tested in JET beginning in 2006. In the “reference” design of the JET-EP ITER-like antenna the internal tuning elements are capacitors. 2005 ACTIVITIES
STATUS OF THE DESIGN ACTIVITY AND BACKGROUND During the ITER CTA, further design work was carried out for the development of the ITER ICRF system conceptual design, using both the reference approach of internal matching, with capacitors as tuning components [3], and an “external” matching concept with tuning components located adjacent to the ITER ICRF port [4]. Subsequent studies [5], [6], [7], [8] have addressed further issues concerning the design and electrical performance of the ITER antenna for both design concepts. Reliable coupling at high power density, particularly in the presence of rapid changes in loading resistance, such as produced by ELMs, is regarded as the critical issue for the performance of the ITER ICH&CD system. Asymmetries and direct coupling between straps can significantly degrade the resilience to load variations and the acquisition of the match, in particular in a compact array such as the ITER IC array. The activities conducted under EFDA contracts in 2004 addressed the electrical performance of the ITER antenna for both internal and external matching concepts [5], [6]. The issues addressed were the dependence of the antenna coupling on poloidal phasing and current amplitude imbalance (in particular associated with the resonant pair matching), the evaluation of ELM resilience, and the study
of matching control algorithms in the presence of inter-strap coupling and load asymmetries. These studies have highlighted further issues concerning the development of a matching scheme and matching control algorithms. Although these more specific issues will be addressed by a separate task, such task will be connected, both in scope and time-scale, to the Contract described here. The matching studies conducted in 2004 also resulted in changes in both internal and external matching design, as summarized below: - For the external matching design, the optimization of
load resilience in the presence of mutual coupling indicates the need of an additional impedance transformer between the conjugate-T connection and the main transmission line. This removes the need for Klopfenstein tapers and requires the insertion of an additional line stretcher and of an adjustable stub for each of the four conjugate-Ts circuits. Additional modifications include smaller changes in the 4-port junction and feeder plate design.
- For the internal matching design more substantial
modifications are proposed. These modifications include an increase of the poloidal order of the array from four to six straps to reduce strap voltage and void volumes, an increase that was already included in the analysis of [5]. They also include a change in the design of the tuning components and in the lay out of the VTL, with the introduction fixed and movable sections. All the components that might require more frequent maintenance are positioned in the movable section, which could be serviced without breaking the torus vacuum. With the new design the capacitors are in a region of reduced neutron flux compared to the old design, and their design is modified. The dielectric strength of the high E-field volume is increased by creating a high local vacuum around the capacitor, isolated from the torus neutral pressure via dielectric enclosure. The tuning circuit includes a pre-tuner located at the antenna end and a trimmer located at the generator end.
The detailed analysis of the two designs, of the changes proposed and a further development of both designs towards meeting all the ITER requirements is the subject of the activity described in this task. This work is the continuation of the task TW3-TPHI-ICRDES3 which produced a conceptual design study of the 2 options. TASK OBJECTIVES The scope of this task is to carry out more detailed design work on both internal and external matching concepts to bring them to a level of detail that ensures that both designs can be made compatible with the ITER design constrains, in particular:

- 14 - EFDA Technology / Physics Integration / Heating and Current Drive
- To provide coordination of the design effort subject
matter of this Contract for the progress of the internal matching design and of the external matching design, including liaising with the ITER IT. Some direct interaction with the US PT might also be necessary.
- To work in collaboration with the ITER IT Task
Officers and the ITER-Garching Drawing Office in order to refine, detail and modify the designs according to problems and solutions identified in the process of integration of both design in the ITER environment.
The objectives of the task are: - To demonstrate that the designs can be made compatible
with the design constraints for installing in a mid-plane port and that the designs respond to the functional requirements for ITER.
- To progress towards the full integration of the designs in
the ITER system in preparation for choosing which of the two concepts shall be used for the ICRF antenna final design. This decision is anticipated in early 2007, after the results of the JET-EP antenna will be available.
TASK ORGANIZATION The Task requires the coordination of the entire design effort as well as the liaising with the EFDA responsible officer and with the ITER IT. This coordination work is required as a specific deliverable. To ensure a coherent development of the design studies, a regular exchange of information will be promoted through a series of Technical Progress Meetings. Typically progress meetings will be held approximately every 3 months. These meetings will be also aimed at reporting progresses on the IT Task to the ITER IT, and shall be attended by at least one representative of all the EU Association involved in the activity. The first (“Kick-off Meeting”) to be held at the start of the contractual period to agree: - The initial organization of the work and the initial time-
schedule of the interaction with the ITER IT Task Officer and ITER Garching Drawing Office (in particular relating to activities which require work in Garching with the ITER Drawing office)
- The time-schedule of subsequent meetings. - The procedures and modalities for the exchange of
information between the parties involved: EFDA, ITER-IT, ITER Garching Drawing Office and EU Associations.
A final closeout meeting will be held at the end of the activity, as specified in the IT Task DESCRIPTION The Task requires the person responsible for the coordination deliverable to work in Garching with the ITER
Drawing Office for the length of time require by the activity, with a minimum period of presence in Garching of two weeks as required by IT Task Description. Some of the activities of this Task require the ITER IT to provide EFDA CSU Garching and the EU Associations with input information, deriving from other IT Tasks with the US PT, indispensable for implementing the activities. It is responsibility of the ITER IT to timely provide those in formations and to maintain coordination among the IT Tasks. TASK DESCRIPTION CEA is in specially in charge of the development of the design for the internal matching concept will include the following activities: a) CEA will take responsibility for the coordination and
leadership of the design effort of this subtask: - CEA will make a proposal regarding the time schedule
and modality of the collaboration with ENEA-Frascati and ENEA-Consorzio RFX described in activities 5.2.1 to 5.2.6. This proposal will be discussed at the kick-off meeting, and an agreement will be reached among all parties (ITER, EFDA, CEA and ENEA). The agreed proposal will be documented in the minutes of the meeting. Time schedule and modality of the collaboration could be revised, if necessary and if agreed by all parties, in subsequent meetings.
- CEA will be responsible to ensure that all the relevant
information is passed to ENEA Frascati and Consorzio RFX.
- ENEA (Frascati and Consorzio RFX) will be, on the
other hand, responsible to provide results and information to CEA within the commonly agreed time schedule.
- CEA will provide, as part of the intermediate and final
report, an executive summary of the overall results and integration of the activities described in 5.2.1 to 5.2.6
b) i) On the basis of the technical input from CEA on the
internal matching concept design, ENEA-Frascati will produce a detailed electromechanical design: ENEA-Frascati will analyze, using the codes ANSYS Multiphysics, HFSS wave propagation and TOPICA, the E-field and current maps in all array components. This analysis will be performed both in condition of free radiation and for one plasma loading (agreed with the IT) in the frequency range of 40-55 MHz. They will evaluate performances and operational limits of the design in the two cases, based on operational limits agreed with the ITER IT
ii) On the basis of the technical input from ENEA
Frascati, CEA will describe in detail critical elements of the present design, including:
- The vacuum seal between the private vacuum and
the torus vacuum. - The construction of the capacitor elements,
including alignment accuracy needed.

- 15 - EFDA Technology / Physics Integration / Heating and Current Drive
- The Safety related components (such as vacuum
barriers, rupture disks, etc) - The RF monitoring probes - Other elements within the scope of the work which
are identified as critical iii) CEA will provide the required input for the thermal
analysis c) On the basis of the technical input from CEA, ENEA—
Consorzio RFX will evaluate support and cooling methods. Based on the results of this evaluation, CEA will revise cooling and supporting elements of the design:
i) ENEA-Consorzio RFX (in collaboration with CEA)
will Calculate weight of straps, center conductors, capacitor elements, vacuum transmission line, etc. that are “hot” to rf voltages. They will provide a preliminary study of methods for cooling and supporting these elements [details of cooling passages are not required at this stage, but general routes of coolant into and out of “hot” components are to be devised; likewise, dielectric supports (if needed) are to be designed].
ii) After the implementation of activities 5.2.5 and 5.2.6,
and based on the results of analysis done as part of these activities, ENEA-Consorzio RFX will implement numerical models to verify the cooling efficiency and induced thermo mechanical stresses as well as the stresses in the cooling element support.
iii) Based on the analysis performed by ENEA-
Consorzio RFX as part of activities 5.2.5 and 5.2.6, CEA will revise cooling and supporting elements of the design.
d) CEA will work with IT and Garching Design Office:
Representatives of CEA will visit IT-Garching to incorporate the antenna concept design into a midplane port, so that it satisfies the constraints of the current ITER port designs and other related constraints. PT members will supply the expertise on their design, and the Garching Drawing Office will make a CATIA model of the concept that meets the requirements. This will be carried out at a mutually-agreed date among the IT TO, the Garching Drawing Office, and the PT.
e) CEA will revise the design based on results of 5.2.3 and
radiation/shielding analysis. The ITER IT (based on results from a US PT task, ref. ITA 51-04) will provide a preliminary evaluation of the radiation shielding capability of the design based on the CATIA model that is the output of 5.2.3. Based on this analysis and any problems discovered while integrating the design into the ITER midplane port, revise the design to ameliorate any mechanical, electrical, or shielding problems. CEA will continue to work with the ITER-Garching Drawing Office and US neutronics analysts as needed, since more than one iteration might be needed
f) On the basis of technical input from CEA, ENEA-Consorzio RFX will perform thermal analysis. They will carry out thermal analysis of the antenna structure (excluding the Faraday shield), including calculations of heat loads from rf losses, direct heat flux from the plasma, and volumetric heating of components from neutron and gamma radiation. Volumetric heating (power deposition) of antenna components from neutron and gamma radiation will be supplied by the IT (based on results from a US PT task, ref. ITA 51-04) for this analysis. ENEA-Consorzio RFX will perform finite element analysis, will evaluate the implications of the results for the specification of the in-vessel components and will made recommendations in order to obtain an efficient cooling system with acceptable temperatures in all parts of the antenna structure.
g) On the basis of technical input from CEA, ENEA-
Consorzio RFX will evaluate mechanical response of antenna “hot” components to disruptions. A self- consistent approach to the analysis of disruption forces for the ITER antenna “hot “components”, based on the results found in EFDA contracts 03-1131 and 03-1132, will be developed by ENEA RFX and ….
This self consistent approach will be applied to both
system designs (Internal and external matching concept design). Based on this self-consistent approach, ENEA-Consorzio RFX will perform a 3D electro-mechanical analysis in order to calculate the mechanical response of antenna components to a disruption, and to provide the necessary engineering analysis and design support. ENEA-RFX will evaluate the implications of the results for the specifications of in-vessel components, and will make recommendations in order to obtain a feasible design with acceptable stresses and displacements.,
STATUS REPORT
The contract was officially signed on the 28th of november, 2005. The coordination meeting n°1 took place in Cadarache on the 16th of january 2006 with representatives from all associations involved in the task. All documents are available on the task ft site ftp://ftp.cea.fr/incoming2/y2k01/ITERDES/. During this meeting, detailed execution organisation and associated planning have been reviewed. The work is progressing on the mechanical structure analysis, and a design review is schedules at the end of march in Garching, together with 3D model integration of the antenna in the ITER model, with the help of the ITER drawing Office. Note that the new task sharing of the ICRH package procurement is perturbing the work organisation, since some tasks originally devoted to USPT will not be performed and have to be redistributed in Europe. Specifically, the neutron shielding analysis, which outcome is of importance for the structural analysis, may suffer some delay.

- 16 - EFDA Technology / Physics Integration / Heating and Current Drive
REFERENCES
[1] Technical Basis for the ITER Final Design Report (in
partic, PDD Section 2.5, Additional Heating and Current Drive), july 2001.
[2] ITER Design Description Document 5.1, Ion Cyclotron
Heating and Current Drive System, july 2001. [3] Final Report on EFDA Contract 02/676, “ICRF
Antenna and System Design (Internal Matching)”, august 2003.
[4] Final Report on EFDA Contract 02/675, “ICRF
Antenna and System Design (External Matching)”, june 2003.
[5] Intermediate Report on EFDA Contract 04/1129,
”ITER ICRF antenna and Matching system design (internal matching)”, september 2004
[6] Intermediate Report on EFDA Contract 04/1130, “ITER ICRF antenna and Matching system design
(external matching)”, october 2004 [7] Intermediate Report on EFDA Contract 03/1132,
”ITER ICRF antenna and Matching system design (external matching)”, january 2004
[8] Final Report on EFDA Contract UKAEA 03/1131,
”ITER ICRF antenna and Matching system design (external matching)”, april 2004
TASK LEADER
Bertrand BEAUMONT DSM/DRFC/SCCP/GCHF CEA-Cadarache F-13108 Saint-Paul-lez-Durance Cedex Tel. : 33 4 42 25 61 32 Fax : 33 4 42 25 62 33 e-mail : [email protected]

- 17 - EFDA Technology / Physics Integration / Heating and Current Drive
TW5-TPHI-ICRFDEV
Task Title: DEVELOPMENT OF HIGH PERFORMANCE CAPACITORS FOR THE ITER ION CYCLOTRON ARRAY
INTRODUCTION
The objective of the activity to be covered during the next two years is to design, build and test a Compact Vacuum Tuner (CVT) compatible for an integration in the ITER Ion Cyclotron Heating and Current Drive launcher. This high power tuning device is designed to fulfill ITER in-vessel EM, mechanical, thermal, nuclear and Remote Handling specifications (RH). In the ITER array two CVTs would be combined in a two-straps “ITER-like structure” (ILS) which is the basic element of the ITER Ion Cycloton array and features a significant resilience to load variations, such as those due to ELMs. The device, however, can be used for general high power cw impedance matching applications. 2005 ACTIVITIES
PRINCIPLES OF OPERATION The CVT operates on the principle of a capacitively loaded transmission line, as sketched in figure 1. The combination of the three sections of the circuit is electrically equivalent to a high power factor series resonant circuit, with capacitive or inductive response depending on the component values and frequency. Large variations of the input reactance Xin can be obtained for small displacements of the electrodes of load capacitor, which can be accommodated by the flexible length of the short-circuited section. As consequence, the device needs no sliding contacts. In ITER applications, a capacitive input reactance is required for matching, and it is of interest to minimize the RF electric field in the section 1 (cf. figure 1) of the device, since in this section the dielectric is the torus “vacuum”, whose dielectric rigidity is difficult to predict. The highest electric field in the system occurs in sections 2 and 3, and, in order to extend the power performances of the device, an improved vacuum is maintained in this volume isolated from the torus vacuum by a dielectric septum. The movable electrode assembly, including cooling, actuation and provision for pumping in the private volume, is separable from the fixed electrode and can be removed from the rear for repairs and/or maintenance by simple, manually assisted, or by RH operations, without affecting the torus vacuum, which is isolated by the dielectric septum.
Figure 1: Equivalent circuit of the CVT
CVT OUTLINE SPECIFICATIONS Mechanical The CVT is an adjustable two port coaxial device, with different input and output characteristic impedances, featuring an outer diameter not exceeding 250 mm and a length not exceeding 0.5 m. These dimensions are fully compatible with the ITER IC array layout proposed in [1]. The layout of the tuner is sketched in figure 2.
Figure 2: Sketch of the CVT
The CVT is mechanically split in a front and a rear sections, connected by a sealed junction. The outer conductor of the front section, including only fixed components, is joined and electrically connected to the in-vessel Vacuum Transmission Line (VTL) body. The central conductor is joined to the strap feeder. The removable section is mechanically assembled with a ceramic, and is connected to the fixed section by a “leaky” vacuum-sealed junction. The seal to be completely vacuum tight, but simply to maintain a low conductance toward the torus “vacuum” in the fixed section, since the vacuum in the removable section is dynamically maintained by a getter pump. Coaxial coolant channels coming from the strap feeder and from the actuating shaft cool the fixed and movable electrodes respectively. The tuner is water-cooled and operates under high vacuum, using the same type of technology of commercial vacuum coaxial capacitors. This, together with the reduced dimensions, permitted by the enhanced internal dielectric strength and water cooling, allows a compact design of the overall tuning system, which can be housed in the one ITER main equatorial port, still maintaining space for maintenance operations and even for the in-situ replacement of faulty components. The device is designed to be connected, in series/parallel combination with one or more similar structures, to a single incoming transmission line, thus providing power division and impedance matching of an even number of radiating elements, and still maintaining the capability of an independent control of the currents in each matched load. In ITER in-vessel applications, it is of interest to provide an adequate nuclear shielding to the input ceramic septum and therefore the CVT will be located in a recessed

- 18 - EFDA Technology / Physics Integration / Heating and Current Drive
position with respect to the tokamak first wall, and connected to the strap by a section of coax line. In this section, relying on the torus “vacuum” as dielectric medium, the VTL is exposed to a TEM field increasing from the strap input to the CVT output where it reaches its maximum value. As the torus “vacuum” dielectric rigidity is difficult to predict, it is important to minimize the E-field value with a suitable choice of the feeder geometry and characteristic impedance. It is also important to minimize the electric field in the region of the ceramic septum so as to ensure low dielectric losses. The highest electric field in the system occurs in the private vacuum region, in which an ion pump maintains a high dielectric strength. The CVT output may include a short section of coaxial line (CVT inductive extension), which serves to different purposes, depending on the application. For ITER in-vessel use the coax is used to connect the CVT to the current straps input and retracts the ceramic components included in the CVT from the first wall so that they are sufficiently shielded from neutron flux. In other applications, such as in a trimmer structure, the section is used to transform the output reactance of the CVT from capacitive to inductive. The input assembly of the CVT, including movable components, cooling, actuation and ion pump is separable from the output section and can be removed from the rear for repairs and/or maintenance by simple operations, without any effect on the dielectric properties of the medium outside the CVT output. This can be used to replace CVT components in case of fault without damaging the torus vacuum. Cooling All components of the CVT are designed to be water-cooled. Typical inlet coolant temperature for ex-vessel operation is 40°C at a pressure below 0.3 MPa. However, the CVT version designed for ITER in-vessel is designed to be cooled at the temperatures and pressures of the ITER Blanket (CVT output) and Vacuum vessel (CVT Input). In the ITER in-vessel applications, the CVT output section is connected to the cooling loop of the blanket (150°C, 30 bar). The CVT input section, which contains flexible components, is cooled at lower pressure by a dedicated coolant loop at the Vacuum Vessel coolant loop temperature and pressure (100°C, 8 bar). In the event of a leak through a fault in the flexible component, the coolant is contained within the output dielectric septum and rapidly de-pressurized by a rupture disk exiting the coolant at the input section end and preventing any pressure build-up on the output ceramic septum (figure 2). Electrical The CVT is designed to provide at its input terminals a capacitive reactance range Xin = 13 – 25 Ω, with an accuracy of 0.02 Ω over the whole specified dynamic range. The dynamic range covers current estimates for matching the ITER array structures over frequency and load ranges. The accuracy is adequate for matching the ILS in vacuum and on plasma. The CVT is designed to fulfill the (recently reduced) maximum RF electric field specifications in ITER “vacuum” (1500 V/mm parallel to B0 and 3000 V perpendicular to B0). The design in fact
aims to significantly lower values (1000 V/mm parallel to B0 and 2000 V perpendicular to B0). The maximum electric field limit in the private vacuum is consistent with the above values. Vacuum boundaries and safety The ceramic septum in the CVT has no function of vacuum/tritium containment and has safety relevance during ITER operation. These functions are performed by other system components according to ITER specific requirements. The failure mode analysis of the CVT and its safety assessment, according to ITER rules will be performed as part of the detailed design. Interfaces with the torus and Remote Maintenance The CVT interfaces with the ITER IC plug in (and not directly with the ITER vacuum vessel) for auxiliaries and services will be studied. The on-site and/or hot cell installation and removal of CVT pairs may be agreed with the ITER International Team. The design of the CVT that will be produced (prototype & series) might present some difference compared with the one integrated on the ITER IC launcher. Indeed, the object to be manufactured will present an interface compatible for an assembly on a test facility. Such interface might not be suitable for integration on ITER, and shall not constraint the ITER IC launcher design. For example, as it can be seen on the conceptual drawing below (figure 3), the second ceramic use on this assembly as a support will not be of no use in the IC ITER antenna.
Figure 3: Conceptual design of a CVT suitable for an integration on a test rig
Neutron shielding The neutron shielding requirements of the CVT, and the assessment of the operational lifetime estimate for the ceramic material included in the device will be performed as part of the detailed design, using as basis material irradiation studies performed under ITER task(s) during EDA. Actuation More than one option is investigated for the actuation of the CVT. Actuation by a stepper motor via a pinion and screw transmission (figure 4) is the simplest solution for ex-vessel application. This solution has also been adopted

- 19 - EFDA Technology / Physics Integration / Heating and Current Drive
for in-vessel in the Tore Supra ITER prototype and has demonstrated reliability an adequate accuracy in positioning. Actuation of the capacitor bellows by means of the cooling fluid is a simpler and more elegant solution for in-vessel application and its feasibility is currently being studied.
Figure 4: Provisions for cooling, vacuum and actuation CONCLUSIONS
This R&D task will validate the principle and technological option on a crucial component for the ITER ICRH launcher in the internal matching concept promoted by CEA. The call for tender and the collaboration that will follow with the industrial company in charge of the manufacturing of the prototype and serials components will also be of great interest to acknowledge the industrial potential for the realization of complex RF component fulfilling ITER requirements.
REFERENCES
[1] G. Bosia, S.Bremond, K.Vulliez CEFDA04-1129 Contract Final report (2005) TASK LEADER
Karl VULLIEZ DSM/DRFC/SCCP/GCHF CEA-Cadarache F-13108 Saint-Paul-lez-Durance Cedex Tel. : 33 4 42 25 73 19 Fax : 33 4 42 25 62 33 e-mail : [email protected]

- 20 - EFDA Technology / Physics Integration / Heating and Current Drive

- 21 - EFDA Technology / Physics Integration / Diagnostics
CEFDA02-1003
Task Title: TW2-TPDS-DIASUP4: SUPPORT TO ITER DIAGNOSTIC DESIGN: POLARIMETRY, MOTIONAL STARK EFFECT, BOLOMETRY, THERMOGRAPHY
INTRODUCTION
This contract covers four independent topics: Bolometry –– to agree a generic design of the bolometer camera head with a schematic drawing of the ITER reference bolometer module and cameras and to make a thermal analysis of the ITER reference bolometer including substrate effects at four sensor locations. Thermography –– to develop the concept of a spectrally-resolving divertor thermography diagnostic based on the use of optical fibres, to analyse the radiation environment and radiation hardness of fibres with detailed treatment of the main elements of the diagnostic chain (optical study of front end optics and its integration into the divertor cassette, performance analysis of optical design, evaluation of the suitability of different fibre types, consideration of detection system). Polarimetry –– to characterize the change of optical performance of a corner cube reflector exposed to plasma and to interpret the observed changes in the optical performance in terms of plasma processes occurring at the reflecting surfaces. Motional Stark Effect –– to perform an initial feasibility study of diagnosing the current density profile in ITER by means of the MSE diagnostic and to coordinate the European tasks with FOM, UKAEA, and VR. The main components of this feasibility study were: to show that the MSE measurement is feasible at much higher Lorentz electric field, to find a position around the machine satisfying the spatial resolution requirements, to show that the beam penetration and emissivity are high enough to compensate for the high Bremsstrahlung signal considered as the major source of noise for the measurement, to calculate the beam emitted spectrum, to evaluate the influence of the radial electric field on the measurement, and to compare the performance of MSE using both heating and diagnostic neutral beams and recommend the preferred approach. 2005 ACTIVITIES
All activities were completed by the beginning of 2005, and this last year was dedicated to organize the independent reports in its final form.
CONCLUSIONS
BOLOMETRY The 0D thermal model, which has been verified against measurements on existing bolometers, can be used to design ITER metal resistor bolometers. The 0D model has also been verified with 3D thermal calculations. The proposed bolometer camera design has a very low thermal resistance. These cameras, if fixed to an actively cooled support, will work at a steady-state temperature lower than 160°C with cooling time constant of the order of 100 s. Suggestions are made to improve the reference design for better thermal contacts. In the divertor cassette, an actively cooled support is not available. An inertial rise of the sensor temperature is found. For a radiative liner at 350°C, the temperature rise is found to be 0.22°C/s. Cumulative temperature rises from shot-to-shot have to be expected. The front plate and camera design will have to be optimised for thermal path and minimum heat load; proposals for design changes are made. It seems feasible that appropriately designed bolometers can operate successfully in ITER with the level of cooling currently foreseen (except in the divertor, where more cooling would be preferable), provided new electronics is developed that simultaneously measures the output voltage and current in order to monitor the temperature-dependent changes taking place in the bolometer foil. To achieve a reasonable signal-to-noise ratio in ITER, it will be important to improve the sensitivity with respect to that achieved for present-day resistive bolometers. Mechanical stresses induced in the camera housing during disruption have been calculated and found to be acceptable at dBz/dt~70 T/s; no design modifications are required. Recommendations. Because large thermal drifts can be anticipated for some mini cameras in ITER, it could be advantageous to check on JET the proposed method for measuring the temperature rise of the foil.To get a better prediction of the bolometer sensitivity the thermal properties of the mica foils should be accurately measured. The measurement of the TCR of thin deposited platinum resistors is also needed. A better diagnostic integration in the divertor cassette should be done. The operational conditions of the divertor should be better defined.

- 22 - EFDA Technology / Physics Integration / Diagnostics
THERMOGRAPHY Throughout the execution of this contract there have been extensive consultations with the ITER IT. To facilitate the updating of ITER documentation this report and relevant drawings will be provided to the ITER IT. Rough estimates of the cost of various options of the ITER divertor thermography diagnostic based on optical fibres are described in the report; these are based on the cost of the Tore Supra thermography diagnostic. Based on Tore Supra’s experience and the relatively good usability of silica fibres in the near IR range in a reactor environment, a diagnostic concept has been developed that uses optical fibres as transport medium and a spectrally resolving spectroscopy approach to fulfil ITER’s thermography needs in the divertor region. An optical front end design using a few mirrors with a high throughput (N.A. = 0.22) has been found that looks at the outer and the inner divertor target. To accommodate the mirrors in the divertor cassette two of the liner-bars of the cassette have to be removed or modified. The arrangement of the measurement points on the target is either such that one fibre is pointed to each centre of a carbon tile of the divertor where the clearest measurements are expected which corresponds to a poloidal resolution of about 20 mm or the measurement points are close packed yielding a poloidal resolution in the 3 mm range. The design actually proposed can either provide the spatial resolution demanded by ITER (3 mm) or a reduced resolution (20 mm). In the (unavoidable) presence of deposits in the tile gaps, which heat up more than the bulk tile material without posing a danger, the lower spatial resolution provides about the same amount of useful information as the higher resolution and may therefore be more efficient. The difference in need of fibres between the two versions is 100 or 500 fibres. The spectral resolution of the measurement may allow discrimination of the parasitic light contribution stemming from hotspots even of microscopic sizes. The other performance criteria, on temperature range and accuracy, can also be fulfilled, provided that the optical front end and the fibres are cooled. Bremsstrahlung is limiting the possibility to measure low target temperatures in high electron density and low electron temperature conditions. Sufficient irradiation data is only available for silica fibres to make a detailed assessment of their adequacy for ITER divertor thermography. In their case the scatter on the available data allows different interpretations of how close fibres can be brought to the divertor cassette. In the most optimistic interpretation they can go all the way from the bioshield to the external border of the divertor cassette and remain there for the lifetime of ITER. In less optimistic interpretations mirror relay optics of either 1.6 or 4.6 m length are needed. The optical layout of such relay optics still has to be found. If realised, the concept may become also interesting for imaging applications and visible light spectroscopy in that environment. The most interesting spectral range is from 2-6 µm which makes ZrF4, and hollow waveguide fibres (mainly made from silica capillaries) very interesting candidates. One fibre that might be worth to be fully developed in collaboration with the corresponding industries in this respect is a so-called Thermography Optimised Hollow Waveguide (TOHW) fibre, which is coaxial combination of a hollow waveguide and a conventional fibre. The
radiation hardness knowledge on these fibres is still rudimentary in the spectral range of interest (except for silica fibres) but a program in collaboration with SCK⋅CEN Mol, Belgium, may be developed further which might improve the situation. At the outboard edge of the cassette a retractable, replaceable multifibre connector is foreseen linking the fibres to the mirror front-end optics. A detection system similar to the Tore Supra solution is proposed with one or more prism spectrometers and 2 D detector arrays. The procurement cost of such a diagnostic has been estimated by extrapolating from Tore Supra’s working example but without taking into account further research and development costs. These costs are expected to be in the range 1-7 M€ (depending on the optical resolution required and the fibre type used) if only one cassette shall be equipped. The implantation envelope in the divertor, the optical design and the integration into the divertor cassette are available in electronic form. The latter has been provided to ITER-IT as CATIA4 model. POLARIMETRY The main changes observed in the reflector following exposure to plasma during one year were (1) a material deposit (composition is not yet analysed) in the inner half of the reflector and (2) evidence of erosion in the outer region that does not follow the magnetic lines. The reflectivity measured at 118 microns shows a slight decrease, at most 10% for the corner cube mirror and no measurable decrease for plane mirrors exposed at the same time. The study of the semi reflective plates induces the conclusion that the angle of the plates must be as small as possible to minimize the errors between the perpendicular and parallel polarisation reflectivity. MOTIONAL STARK EFFECT on heating neutral beams The MSE measurement at high Lorentz electric field is possible using the polarimetry or ratiometric method (CEA). The spatial resolutions were calculated for all the configurations of the diagnostic around the machine, and since the beam adjacent port was not available, our recommendation was to install the MSE diagnostic in e-port 2 (central MSE) and e-port 3 (edge MSE) both viewing HNB5. The compromise with the other diagnostics requirements proposed by ITER team was to install the central MSE diagnostic in e-port 1 viewing HNB4. This solution is equivalent from the spatial resolution point of view but a measurement over the entire profile needs the two heating beams. The spatial resolution is better than 15 cm almost everywhere, and better than a/40 around rho = 0.2 and 0.65). (CEA/UKAEA/ITER) The high energy of the neutral beam allows a good plasma penetration, and the signal to noise estimations compared with TFTR and JET indicates that a time resolution of a few tens of ms can be envisaged (CEA/UKAEA) The calculation of the expected MSE spectrum for 5.3 T indicates a clear separation between the σ and π components. This will allow MSE measurements with a high polarisation fraction as well as the possibility of measurements at lower toroidal field (<1T). (CEA)

- 23 - EFDA Technology / Physics Integration / Diagnostics
The vertical large size of the beam could induce additional difficulties of measurement if the beam vertical power density profile is not constant during the discharge (UKAEA). The influence of the radial electric field seems negligible for most scenarios. The important consequence is that the diagnostic is independent and does not need to be Er corrected. On the other hand, it does not seem possible to deduce Er directly from MSE measurements as it is done on some of the present machines (CEA). A laboratory demonstration of an accurate MSE measurement using 4 mirrors was performed, in parallel with a modelling of the mirror properties and resulting signal (UKAEA/VR). The possible modification of the initial polarisation due to the first mirror coating has been calculated and measured experimentally on plasma-exposed mirrors (IT Garching/VR) To cope with polarization effects in contaminated mirrors, in-situ calibrations will be essential and will have to be integrated in the design. In parallel, simultaneous measurement of σ and π lines is proposed to control the reliability of the measurements and deduce information on the mirrors properties (CEA/UKAEA/VR). A design of the diagnostic in port 1 and 3 compatible with a low escaping neutron flux was performed. A ray tracing allowed the positioning of the main optical elements (IT Garching). Comparison between MSE on diagnostic neutral beam and on heating neutral beams The feasibility of a MSE diagnostic on the Diagnostic beam in complement to the CXS diagnostic was demonstrated (FOM). The combination of two observation ports allows MSE measurements with a spatial resolution satisfying ITPA requirements. The sensitivity of the measurement on the σ/π ratio and thus to q profile is very good from these two ports. Multi-mirror and coating effects are also in this case a major source of concern. Calibration methods based on atomic modelling of line emissions and on the use of the plasma itself are proposed. The lacks of heating beams for some scenarios as well as the additional difficulties due to the mirror coatings indicate that the two MSE diagnostics (on HNB and DNB) are necessary on ITER. Cross checking of the measurements will then be done when possible, so as to validate each method.
REPORTS AND PUBLICATIONS
DIAG/NTT-2004.027: Thermal analysis of the ITER reference bolometers (J.C. Vallet and C. Portafaix) DIAG/NTT-2004.029: Design analysis of Motional Stark Effect diagnostic for ITER (P. Lotte and R. Giannella) DIAG/NTT-2005.003#1: Polarimetry, Experimental study of plasma exposure of a corner cube reflector (C. Gil) DIAG/NTT-2005.019: Final report for the contrat EFDA 02-1003 D2.3 Thermography (R. Reichle, S. Henry, J. Miggozzi, E. Thomas, C. Walker) DIAG/NTT-2005.018#1: Final report of the contract EFDA 02-1003 (Executive Summary) Support to the ITER diagnostic design (P.E. Stott, C. Laviron, J.C. Vallet, R. Reichle, C. Gil and P. Lotte) TASK LEADER
Clément LAVIRON (originally Peter STOTT) DSM/DRFC/SCCP CEA-Cadarache F-13108 Saint-Paul-lez-Durance Cedex Tel. : 33 4 42 25 61 34 Fax : 33 4 42 25 62 33 e-mail : [email protected]

- 24 - EFDA Technology / Physics Integration / Diagnostics

- 25 - EFDA Technology / Physics Integration / Diagnostics
CEFDA03-1111
Task Title: TW3-TPDS-DIASUP1: SUPPORT TO THE ITER DIAGNOSTIC SYSTEM: BOLOMETER, WIDE-ANGLE VIEWING, CALORIMETRY,
q-PROFILE DETERMINATION, REFLECTOMETRY AND POLARIMETRY
INTRODUCTION
The overall objective of this task is to advance the design of several ITER diagnostic systems for which the EU has developed conceptual designs, to re-evaluate their performance for the most recent analysis of plasma conditions, and to provide support to the ITER International Team (IT) in the preparation of the relevant ITER documentation. This contract, initially consisting of six independent tasks related to six diagnostics, has been amended following an EFDA proposal to take into account the provisional diagnostic distribution between the ITER parties at that time. Five tasks remained in the amended contract: - Detailed design analysis of bolometer cameras on the
basis of the reference resistive bolometer sensor - Design analysis of wide-angle viewing/thermography
system - Feasibility study of calorimetric measurements on ITER - Evaluation of MSE measurements in the assessment of
q-profile determination in ITER - Contribution to the design analysis of the ITER plasma-
position reflectometry system 2005 ACTIVITIES
Detailed design analysis of bolometer cameras Studies have been mainly focused on the bolometers resistance to the severe ITER operating conditions within a harsh environment. Particularly during disruptions, plasma will release a very important radiated energy as well as induced electric currents within bolometer components which will have to stand strong thermal and mechanical constraints. Nevertheless, it is shown that the most fragile components, such as the absorber and the mica sheet, should resist to these constraints with a large enough security factor. To filter the bolometers from ECE waves, a multiple slits system should be considered. Unfortunately, such a system induces a loss of the radiated flux toward the absorber. This loss will have to be quantified and eventually optimised on a case to case basis. Design analysis of wide-angle viewing/thermography system The wide-angle viewing systems are planned in the equatorial and upper ports of ITER for real time survey
during plasma operation. The system should have a high reliability and be able to show rapidly to the operator plasma wall contact and hot spots. Up to now, the main mission for this diagnostic is to provide good measurements of the surface temperature in the range of 200-2500°C with an accuracy of ±10°C with a large field of view (for safety and operation consideration) and with the required spatial and time resolution (~ 10 ms). This is very challenging. A secondary function is also for machine safety, but in the visible range (UFOs, initial wall-damage assessment). This diagnostic can alternatively be used to study runaway electrons, visible spectroscopy or/and track pellet. According to the provided data (surface temperature and Hα light emission), this diagnostic can ultimately be used for other physic purposes as heat flux density and energy calculation or dust and layer localization. In his present requested form, this diagnostic doesn’t resolve transient events such ELM and disruption. The study has been conducted to get a full review of the diagnostic within the ITER environment. It has shown that it is possible to have 4 equatorial port endoscopes looking at the vacuum vessel and divertor plasma facing actively cooled components with a ~ 70% coverage. At each port plug 3 lines of sight are presents, one to look on the left of vacuum vessel, one to look on the right side and finally one to look at the divertor located at the bottom of the machine. A generic optical line has been defined and can be used for all lines. Performances have been evaluated. They are within the required specifications. Nevertheless, a number of remaining topics to be addressed have been pointed out to permit to make the final choices and to improve significantly the design and overall performances. Feasibility study of calorimetric measurements Thermal analysis of the coolant of the blanket modules has been done and the feasibility of a calorimetric diagnostic to provide an estimate of the total neutron power has been demonstrated. A time resolution of typically 10 seconds can be expected. The required techniques for processing the temperature measurements have been developed and exemplified with the calorimetric data recorded on Tore Supra. Provided that an initial tabulation of the flow-rate in the blanket module be done during the commissioning phase, as should be done anyway, it is shown that the required instrumentation for calorimetry could be restricted to thermometers only. Typically 200 embedded thermometers are needed to reconstruct the total neutron power. It is not necessary that these thermometers be intrusive in the pipes. Pipe surface temperatures could be used. The technology of these thermometers is still open to discussion. A conventional approach would suggest using Pt100 sensors with the main disadvantage that it would

- 26 - EFDA Technology / Physics Integration / Diagnostics
require 600 wires. Provided an improvement of their sensitivity and may be also of their neutron hardening, an interesting alternative could be the use of multiplexed fibre Bragg gratings as temperature sensor. Up to 8 thermometers have already been implemented in one optical fibre. In this study we have restricted the demonstration of the powerfulness of the calorimetric diagnostic to the estimation of the total neutron and total radiated powers. We believe that it could also be interesting to use such instrumentation in the divertor cassettes to be able to separate the radiative and the convective fluxes falling on the target plates and on the dome. Evaluation of MSE measurements in the assessment of q-profile determination Calculations show that for the proposed MSE diagnostic on the Heating Beams, the ITER requirement (10% accuracy for i =1/q) is satisfied everywhere at the 1σ rms error. So as to satisfy the conditions used in these calculations, we recommend that the error on the measurement of the MSE angle should not exceed +/- 0.2°. Concerning the temporary conclusions on spatial resolution, since this problem is important for the accurateness of the diagnostic, we encourage to perform new calculations with more appropriate coordinates. We nevertheless already recommend to install MSE channels in the regions of bad spatial resolution as well, in case one of the beam is off. For ITER plasma scenarios, we recommend that if only one beam is used, to operate preferentially HNB4 to have central MSE measurements. Two interesting questions need to be answered in future calculations: can a high density of channels compensate the bad spatial resolution? and evaluate the q-profile reconstruction with the central MSE only. Contribution to the design analysis of the ITER plasma-position reflectometry system Reflectometry is a radar technique operating in the microwave range and is extensively used in most fusion devices to performed electron density measurements. It is a well-established technique, which provides an excellent radial localization of measurement. Since this technique is inexpensive, provides rapid measurements (in the microsecond range), and requires very low access to the machine, it is a strong candidate to provide plasma position and plasma shape measurements on ITER. However, long waveguide chains travelling all around the ITER vacuum chamber through complex way will be required to bring the wave from the diagnostic itself to the plasma and great care must be taken to preserve the amplitude signal from waveguide loss processes. In this task, waveguide transmission has been studied showing losses lower than 0.1 dB/m for F>25 GHz. Due to thermal dilatation, the length of the transmission line will evolve during a shot, and it is shown that a reference to know precisely the phase dispersion due to transmission is required. As this technique is sensitive to plasma density fluctuations and naturally suffers from parasitic reflections, 2D code has been used to analyze it. Multi-reflections are barely distinguishable from the main
reflection and to separate signals, simulations have been achieved by moving the plasma 40 cm away from the blankets. Concerning fluctuations, the broadening of the reflected signal have not been conclusive. However, present simulations in 2D exhibit an amplitude signal very low (< 50 dBc) which is suspected to be too low and due to the 3D nature of this problem a simulation should be done in 3D taking into account the vicinity of the blanket. Direct experimental measurements should be envisaged. The thermal constrains that many ITER diagnostic performing in situ measurements has to face are calculated. The maximum temperature reaches 471°C in the copper in front of the plasma. This temperature is near the limit for CuCrZr. The most important load is the nuclear heating, the assumptions used in the calculations have to be carefully checked and in particularly the peaking factor due to the gap between the block shields. The time constant of the maximum temperature is about 200 s. REPORTS AND PUBLICATIONS
- Intermediate report: ITER wide-angle viewing
thermographic and visible system (Y.Corre, A.Géraud, D.Guilhem, D.Hernandez, J.B. Migozzi, J.J. Serra, E. Thomas, G.Vayakis, C. Walker)
- CEA international report DIAG/NTT-2004.032:
Calorimetric Analysis of the ITER Blanket Modules.(J.C. Vallet)
- CEA international report DIAG/NTT-2005.013: q-
profile determination in ITER from MSE measurements (P. Lotte)
- CEA international report DIAG/NTT-2005.025: EFDA
report on ITER position reflectometry (F. Clairet and R. Sabot)
TASK LEADER
Clément LAVIRON (originally Peter STOTT) DSM/DRFC/SCCP CEA-Cadarache F-13108 Saint-Paul-lez-Durance Cedex Tel. : 33 4 42 25 61 34 Fax : 33 4 42 25 62 33 e-mail : [email protected]

- 27 - EFDA Technology / Physics Integration / Diagnostics
CEFDA04-1206PI
Task Title: TW4-TPDS-DIASUP1: DIAGNOSTIC DESIGN FOR ITER: PORT INTEGRATION
INTRODUCTION
ITER requires an extensive set of diagnostic systems to provide several key functions such as protection of the device, input to plasma control systems and evaluation of the plasma performance. These diagnostics system are to be integrated inside the vacuum vessel of ITER by means of water cooled stainless steel structure (60 t, 2m x 2m x 4 m) named port plug structure. The port plug structure must perform basic functions such as providing neutron and gamma shielding, supporting the first wall armour and shielding blanket material, closing the vacuum vessel ports, supporting the diagnostic equipment (see figure 1). Although the required analyses were associated with those port plugs (EQ01,UP01, UP14 and L16) where Europe and more particularly CEA may have a certain responsibility in term of diagnostics, CEA has focused on the design and diagnostic integration in the generic equatorial port plug EQ01. The specific CEA contributions were to perform, associated to this port, general engineering (including CAD effort), structural and thermal analysis [1].
Figure 1: ITER vertical section
2005 ACTIVITIES DIAGNOSTIC PORT INTEGRATION According to the specifications of the contract EFDA 04-1206 D1.2, CEA contributed to a part of the design study of the ITER port integration. It considered:
(a) CAD models review and integration on port plug generic EQ01,
(b) Structural assessment of the ITER equatorial port plug EQ01,
(c) Thermal assessment of the ITER equatorial port plug EQ01,
(d) Dynamic transient and seismic response of the ITER equatorial port plug EQ01.
In complement to this contract, synthesis of guidelines used in EFDA studies done by CEA on ITER diagnostics and diagnostic port plug variant analysis (EQ01,UP01, UP14 and L16) have also been carried out.
(a) CAD models review and integration on port plug generic EQ01 To perform the CAD model review of the equatorial port plug EQ01 several requests to the ITER design office have been done for the CATIA CAD models recovery and the comprehension of those models. Then some actions have been performed in order to carry out this task: CATIA transfer V4 V5, reconstitution of the assemblies, checking of the interfaces, finding inconsistencies, adding missing features (see figure 2).
Figure 2: 3D view of the equatorial port plug EQ01
Eventually, the result of our work has been integrated in the ITER DO data base via the passive mode of the Virtual Product Management system ENOVIA. (b) Structural assessment of the ITER equatorial port plug EQ01 For this static mechanical assessment five models of the equatorial port plug have been produced in CATIA V5: a very simplified model named beta model, a model without top beam, a model with top beam welded and two models with top beam bolted (see figure 3 for terminology).

- 28 - EFDA Technology / Physics Integration / Diagnostics
Figure 3: 3D exploded view of the equatorial port plug
The beta model enabled us to understand the structural behaviour of the port plug, to check the stresses and displacements order of magnitude, and to check that the analysis module of CATIA V5 is well mastered. Self weight and three kind of disruption conditions have been taken into account (CD27ms, fu-VDE, fd-VDE). Those cases of loads have been applied to each of the five models. The CD27ms case of loads is the worst one for the structure and only the model with the top beam welded seems to have characteristics to resist to it. Concerning this model, the maximal Von Mises stresses reach 173 MPa (no safety margin towards the yield stress), this stress is localised at the level of the BSM attachment system. The maximal displacement (see figure 4) of the structure reaches 2.23 mm (8.97 of safety margin toward the minimal gap with the Tokamak).
Figure 4: Displacements of the equatorial port (disruption)
Concerning the design of the port plug, top beams are very important for the rigidity of the whole structure. If the top beams remain to be bolted, the bolting attachment system needs to be reviewed. Moreover because of the high level of stress in localised area, deeper analyses are required for attachments of the port plug to the vacuum vessel and the BSM attachment system.
(c) Thermal assessment of the ITER equatorial port plug EQ01 In this assessment, the thermal behaviour of the port plug structure in regard to the neutronic loads has been estimated. For this first estimation, four different studies have been carried out: i) the study of the side and base plates, ii) the study of the shield modules, iii) the study of the front plate and flange iv) the study of the window tube plate. For these studies a 60°C water temperature increasing and 350°C of maximal SS temperature have been considered as specification according the CEA’s experience in inner vessel actively cooled components. For each element, the models take into account the initial CATIA V5 design and all the thermal calculations, in steady state conditions, have been performed with the finite element calculation code ANSYS. For each model, the initial concept of cooling system is analysed and some ameliorations are proposed. i) The side plates and the base plate have got an efficient
cooling system, the maximal SS temperature reaches 117°C and the number of cooling channels can be reduced from 27 to 13 (see figure 5).
Figure 5: Side and base plate temperature map ii) Concerning the shield module 1 which is the most
thermal loaded shield module, a proposition (peripherical groove and 5 pipes) of cooling circuit is proposed and the maximal SS temperature reaches 581°C. This proposition could be updated with a new diagnostic implementation in order to reach the specifications. The shield module 2 has been calculated with a peripherical groove and 2 pipes of cooling (Tmaxi=361°C). For the shield module 3 a peripherical cooling groove will be enough for cooling.
iii) Concerning the front plate and flange, in spite of the
three cooling grooves, the maximal temperature reaches 830°C. This element needs to be reviewed in term of cooling.
iv) The window tube plate doesn’t need to be cooled, the
welded contact with the flange is enough for its thermalisation.

- 29 - EFDA Technology / Physics Integration / Diagnostics
(d) Dynamic transient and seismic response of the ITER equatorial port plug EQ01 Dealing with the transient calculations, the radial moment is the most stressing load, as it entails 95.7% of the deviational effects, but the dynamic behaviour of the model is far from plasticity. In addition, it investigates the shear stiffness of the port-plug. Any way, dynamic effects are very limited. But the specifications are not met in term of stress: - The maximum displacements are very low and do not
exceed 3 millimeters even in a case of resonance (see figure 6).
- The maximum stress is more than twice the yield strength.
- The maxima occur at some sensible locations, that is to say the embedding locus and the BSM attachments. That was predictable, and an effort has to be done on the design of the attachments and on the cuttings of the top-beam on the in future improvements of the port plug.
Figure 6: Forced resonance phenomenon of the port plug
The process of the dynamic modal and transient analysis of equatorial plug is well mastered, and can be performed on a much more realistic model. At this stage, a lot of improvements have to be done, to better fit the up-to-date design of the port plug, and the reality of the different applied loads. To be discussed is the interest of a homogenization method in order to consider water cooling into a fictive equivalent material behaviour. For instance, it will permit to light the model, compared to modeling every cooling structure that will implies meshing singularities. Further investigations could also lead to consider the shield modules by implementing the model with them. In fact dynamic effects could be increased a lot with this surplus mass, even if the calculation of the critical mass before resonance seems to be a pledge of confidence. For the seismic calculations, the ASME Design Response Spectrum and the ground spectra and soil conditions in the CEA-Cadarache site with low-frequency horizontal seismic isolation spectrum have been considered. The resulting displacement values at the level of the port plug are very low in the order of magnitude of 10-4m (see figure 7) and can be neglected. The first assumption of inputting a constant spectrum was enough to give an accurate idea of the port plug behaviour. It is validated by the fact that harmonic responses of the Port-Duct do not present any
peak, and the natural frequencies of the Vacuum Vessel spreading between 0.5 and 7 Hz.
Figure 7: Mode combined displacement for a Cadarache vertical seismic excitation (in meters).
This dynamic assessment permits to know with reliability that the Equatorial Port-Plug meets the specifications for both the disruption and the seismic case, at the current stage of its design, and according to all the assumptions and hypothesis that have been taken. CONCLUSIONS Concerning the diagnostic port integration task, the design review and the performed analysis enable us to understand the mechanical and thermal behaviour of the port plug under several case of load. The design with top beam welded appears to be consistent in term mechanics, nevertheless local calculations at the level of the attachment devices remain to be done. Concerning thermal, the far forward shield module and the front plate and flange reach a very high level of temperature, their water-cooling circuit remains to be optimized. REPORTS AND PUBLICATIONS [1] ‘Final report on diagnostic design for ITER port
integration’, PEFC/NTT-2005.014 Rev. 0 September 2005.
TASK LEADER
Louis DOCEUL DSM/DRFC/SIPP/GIPM CEA-Cadarache F-13108 Saint-Paul-lez-Durance Cedex Tel. : 33 4 42 25 61 65 Fax : 33 4 42 25 49 90 e-mail : [email protected]

- 30 - EFDA Technology / Physics Integration / Diagnostics

- 31 - EFDA Technology / Physics Integration / Diagnostics
CEFDA04-1206MD
Task Title: TW4-TPDS-DIASUP1: DIAGNOSTIC DESIGN FOR ITER: MAGNETIC DIAGNOSTICS
INTRODUCTION
The EU will supply the magnetic diagnostics for ITER. Past EFDA contracts [1-3] have mainly considered and optimized position and coil performance. Many outstanding technical issues are still to be analyzed and developed to fully implement the magnetic diagnostic. While the magnetic diagnostic includes a wide diversity of sensors in interaction with the ITER vacuum vessel and located in various places, the task involves 4 partners: EPFL-CRPP which ensures the task coordination, ENEA-RFX, CEA and CIEMAT. It is also conducted in very close interaction with the ITER International Team (IT). The objective of the 2005 CEA activity deals with the analysis of the general design of the magnetic diagnostic focusing on the outer vessel tangential and normal coils (A.01), the external continuous poloidal Rogowski loops (A.04) and the inner vessel partial and continuous flux loops (A.02). The addressed overall activities are: (a) The review of the implementation of the magnetics
diagnostic systems. (b) The beginning of the outline design of specific types
of sensors (c) The planning of the full development of the ITER
magnetics diagnostic (d) The definition of the future design, R&D and
performance analysis (e) The analysis of the needs for electronics (mainly the
integrators) (f) The assessment of the existing documentation and the
support of the ITER IT in the writing of procurement specifications for the magnetics diagnostic
During this task, a special care was devoted to the improvement of the design, the material choice and the construction technique of the ex-vessel coils and external Rogowski. The sources of measurement errors have been investigated as well. 2005 ACTIVITIES
OUTER VESSEL TANGENTIAL AND NORMAL COILS (A.01)
The outer radial and tangential field coils set-up is a supplementary set used to measure the plasma current, the plasma equilibrium and the plasma low frequency MHD activity. The available space for their installation implicates that the coils have a very small radial dimension to avoid clash with the vacuum vessel thermal shield during assembly and operation. The winding case is 7x57x250 mm3 in the areas where the radius of curvature of the vacuum vessel is big and 7x57x125 mm3 in the areas where the radius of curvature of the vacuum vessel is smaller. In these winding cases, the effective area of the ex-vessel coils must be respectively 2 m2 and 1 m2. The outer vessel coils will be mounted on the outer surface of the vacuum vessel (figure 1). On the basis of [4], the number of sensor is set to 60 tangential field sensors plus 60 radial field sensors which appear acceptable with respect to the plasma reconstruction error.
0 2 4 6 8 10 12-8
-6
-4
-2
0
2
4
6
8PF1
PF2
PF
3P
F4
PF5
PF6
CS
3UC
S2U
CS
1UC
S1L
CS
2LC
S3L
Inner skin vessel meas.
Outer skin vessel meas.
Divertor meas.
R (m)
Z (
m)
Figure 1: Location of ex-vessel tangential and normal coils
The present design uses enamelled copper wire on a ceramic bobbin. In order to reach the ITER specifications and make easier the manufacture of the coils, several shapes of mandrel have been designed and studied (figure 2). The coil of shape (a) reaches the objectives in terms of available space and effective area but it is extremely hard to wind. The coil shape (b) have too big radial dimension (2 mm in excess) but they are easier to wind because of their elliptic shape and smaller number of layers. Finally, the coils with shape (c) are no longer considered because they are very hard to wind (mandrel diameter = 2 mm and mandrel length = 250 mm) and the winding case is much bigger than allowed.

- 32 - EFDA Technology / Physics Integration / Diagnostics
79
50535759
30 (φ=1.5)
Shape a : Flat cross section
1012
545759
30 (φ=1.5)
Shape b : elliptic cross section
86
φ=2φ=7
84
79
12 coils
Shape c : several coils
Figure 2: Cross section of the coils that have been studied as radial and tangential coils
Table 1: Characteristics of the coil
Shape a Shape a Shape b Shape c (12 coils)
Coil Outer Dimension 7x57x250 mm 7x57x125 mm 10x57x250 mm3 10x84x250 mm3
Number of layer 8 8 6 10
Coil effective area 2.122 m2 1.061 m2 2.182 m2 2.061 m2
Cable length 907 m 455 m 674 m 1668 m
Coil resistance at 293K 873 Ω 437 Ω 650 Ω 1606 Ω
Coil inductance 270 mH 135 mH 270 mH -
Cut-off frequency 515 Hz 515 Hz 384 Hz -
Enlarging the radial coil dimension is not possible because the “official” clearance between the inner part of the vacuum vessel and the thermal shield is set to 11 mm. Of this, a margin of 1 mm has been taken. Of the remaining 10 mm, 7 mm have been allocated to the winding, 2 mm to the casing and 1 mm for packing material. Therefore, with such a margin and avoiding machining of the vessel, the available space cannot be enlarged up to 7 mm. Using shape (a) elongated coils the winding issues are: a) The winding length is rather big (250 mm / 980 turns). Therefore each layer is already hard to do. In fact, each turn must join the previous one in order to fill totally the layer, then, this work must be performed on 8 layers without leaving gap. b) Coils using a flat part on the former are difficult to wind, in particular, because it is essential to keep the contact between the cable and the coil former at any time which is impossible to achieve with a flat part on the former. Some freedom is left to the cable with respect to the coil former. This defect allows the cable to move more or less freely preventing the winding of the next layer. One solution could be the use of heat sealing cable. After a layer is wound, the coil is heated to fix the layer. c) This coil needs 8 layers to get an effective area of 2 m2. This is already a great number of layers with such elongated coil. d) Because the cable is not in contact with the coil former, the radial coil OD may be bigger than the theoretical value. e) The cable OD is 0.25 mm which is relatively small. The cable is probably fragile and need special attention. An alternative solution to the expected winding problems could be the use of kapton foil where copper track are
designed inside in the same way than a printed circuit. Adjusting the track design and the connexion between the layers, a 2 m2 coil seems to be achievable. The copper track in the insulating foil could be straight lines with electrical connexions on both ends. The electrical connexion must be “oriented” in one direction at the beginning of a wire and in the opposite side at the end of the cable. Using an insulating foil of 50 µm thickness and a copper cable of rectangular cross-section (25 x 150 µm) the resistance of the coil will be at least 4 times bigger. In order to keep enough space for the electrical connexions, only 490 turns per layers (490 turns / 245 mm) have been considered. In that case, the connexions wideness could be 250 µm and 12 layers are necessary to get a 2 m2 coil with a flat coil former of dimensions 50x5.8x245 mm3 which is more comfortable. In return, ensuring good electrical connexions between the layers is an important issue and needs R&D. Concerning the ex-vessel coils operation, one must address the issue of the vacuum vessel thermal expansion. This effect may change the coils orientation and make them sensitive to stray field. More, during the vessel expansion and extra field could be integrated by the coils. EXTERNAL CONTINUOUS POLOIDAL ROGOWSKI LOOP (A.04) The external continuous Rogowski is a separate backup facility measuring the plasma current. It can also procure information to calculate the plasma shape and position. This system is sensitive to the total vessel current. However, it suffers less from the effects of integrator drift. Therefore, the external Rogowski provides a potentially valuable backup in case of drift of the in/ex-vessel systems for long pulse operation. The external Rogowski is located in grooves into the TF coil casing on a poloidal contour (figure 4). The groove diameter is big enough (typ. 14.5 mm) to accommodate a 12 mm OD coil and it should be set in a poloidal plane to

- 33 - EFDA Technology / Physics Integration / Diagnostics
simplify the path and avoid magnetic pick-up. In this space it is possible to make a Rogowski having 2 layers. The Rogowski should survive for the lifetime of the TF coil. The coil expands and contracts during the cool-down / warm-up cycles (a few cycles 4K-300K) and also expands and twists during each pulse (~ 10 mm, a few 104
cycles). In some places, the Rogowski former must be bended with a radius of curvature of 100 mm in order to bypass elements.
ContinuousRogowski
Figure 4: View of the Rogowski route on the TFC casing
The electrical parameters of the designed Rogowski are: Coil Outer Dim 12 mm Cable diameter 1 mm (conductor 0.75 mm) # layers 2 (φ1=9.0 mm et φ2=11.0 mm) # turn per layer 13600 (length = 34m pitch = 2.5 mm) Cable length 860 m Coil mutual inductance 80 mV.s/MA Coil resistance @ 4K 331 mΩ (33 Ω @ 293K ) Coil inductance 4.0 mH Coil capacitance 213 pF Cut-off frequency >1.5 kHz (on 50Ω) Using a Rogowski coil, it is important to ensure that the winding is as uniform as possible. A non-uniform winding makes the coil susceptible to magnetic pickup from adjacent conductors or other sources of magnetic fields. This could be ensured by making two helicoidal grooves in the former of the Rogowski; one having a positive pitch, the other one with a negative pitch (figure 5). A model has been made to point out the main issues in the coil manufacture (figure 6). First, making two grooves on the mandrel requires a pitch bigger than 2.5*φcable (=2.5 mm) between each turn to still have matter for the second layer. The groove depth is also an important parameter and must be just bigger than the cable OD. The bending hasn’t been tested
pitch Cable OD Windingdirection
WindingdirectionRogowski former
Groovedepth
Rogowskidiameter
Figure 5: Example of grooves in a Rogowski for uniform winding.
Figure 6: Photos of the Rogowski model made at CEA
(cable is blue)
A thermal analysis has also been performed in order to ensure that the stress on the cable is low enough during the TF coil cooling down. In particular, the stress on the cable has been calculated to be much smaller than the Copper Young modulus. INNER VESSEL PARTIAL AND CONTINUOUS FLUX LOOPS (A.02) The flux loops, together with the Equilibrium coils and divertor coils are used to measure the plasma equilibrium and vertical speed. The continuous flux loops are also used to define the loop voltage and acts as a supplementary measurement to get the plasma current. The partial flux loops procure a supplementary set of measurements to define the plasma MHD activity. The inner vessel equilibrium partial and continuous flux loops are already well defined in [5], [6]. This set-up is composed of 4 independent continuous flux loops and 6 sets of 20 saddle loops (partial loops) (figure 7). The continuous flux loops are attached to the vessel thermally and mechanically with frequent spot welded stainless steel clips. The loops have 9 special welded and re-weldable joints (figure 7) at each sector which allows removing the joint and re-instating it by remote handling techniques in case of sector repair or replacement. The loops are simply made from 2 mm diameter MI cable (conductor diameter=1.5 mm). Their simplicity make this set-up extremely reliable and robust therefore, no maintenance is anticipated. The radial dimension of the continuous flux loops is inhomogeneous: R=3.573 m; R=5.755 m; R=7.276 m; and R=6.768 m.

- 34 - EFDA Technology / Physics Integration / Diagnostics
Figure 7: Inner vessel equilibrium flux loops implementation (blue=continuous flux loops, green=saddle loops). On the left, a schematic view of the Continuous flux loops joint
Table 2: Associated electrical parameters:
R=3.573m R=5.755m R=7.276m R=6.768m
Cable length (m)
22.45 36.16 45.72 42.52
Loop resistance at 300K
(mΩ)
220 350 440 410
Loop inductance (µH)
39.5 67.1 86.9 80.3
Cut-Off frequency (Hz)
890 830 810 815
CONCLUSIONS
Three kinds of ITER magnetic sensors have been reviewed. Manufacturing procedure and recommendations have been made. In particular, the ex-vessel tangential coils exhibit the more severe constraints: the available radial dimension is very small (7 mm), the requested area is rather big (2 m²) and there exist a big discrepancy in their dimensions. Other solutions have been suggested but R&D is required and models must be performed to ensure that such coils are feasible. On the other hand, a radial coil in the same winding pack is easier to produce. The design of the external Rogowski coil has been refined. In particular, a former on which grooves making a double screw is proposed to ensure a regular winding. A model has been produced at CEA. The path in the TFC casing has also been defined in collaboration with the ITER IT. The inner vessel tangential and partial flux loops set-up is very simple, because it is made of MI cable arranged around the torus or making saddle loops. We highlighted the special attention that must be devoted to the mounting, because they have big radial dimensions and they must define a horizontal plane in order to measure only the vertical flux. During the plasma, the vessel thermal expansion could damage the loop. Therefore it is recommended to leave an extra length of cable at some places. In general, the vessel thermal expansion effects have been highlighted as a potential source of error. A model of the
vacuum vessel representing its thermal behaviour must be developed. In the same way, the eddy current in the structure must be modelled in a future work. REFERENCES
[1] Assessment of the conceptual design for in-vessel
magnetics E. Coccorese et al. (ENEA-CREATE, Italy), Final Report of EFDA Contract 00-571, 2001
[2] Failure mode analysis of the ITER magnetics
diagnostic system, carried out under EFDA Contract 02-1001 (ENEA-CREATE, Italy)
[3] Re-evaluate and optimize the sub-system for measuring
halo currents, carried out under EFDA Contract 02-1000 (ENEA-RFX Padova, Italy)
[4] Failure mode analysis of the ITER magnetics
diagnostic system, carried out under EFDA Contract 02-1001 (ENEA-CREATE, Italy)
[5] ITER Design Description Document 5.5, Diagnostics,
July 2001 [6] ITER Design Description Documents: Appendix 1 to
Overview ITER Diagnostics System (DDD55): ITER Magnetic Diagnostic Design Status, July 2004
REPORTS AND PUBLICATIONS
Final Report Contract EFDA 04-1206 D6.3 Part I
ITER magnetics diagnostic design study : Outer vessel tang and normal coils DIAG/NTT-2005.035
Final Report Contract EFDA 04-1206 D6.3 Part II
ITER magnetics diagnostic design study : External continuous Rogowski, DIAG/NTT-2005.036
Final Report Contract EFDA 04-1206 D6.3 Part III.
ITER mag. diagnostic design study : Inner vessel partial and continuous flux loops DIAG/NTT-2005.037

- 35 - EFDA Technology / Physics Integration / Diagnostics
TASK LEADER
Philippe MOREAU DSM/DRFC/STEP CEA-Cadarache F-13108 Saint-Paul-lez-Durance Cedex Tel. : 33 4 42 25 36 39 Fax : 33 4 42 25 26 61 e-mail : [email protected]

- 36 - EFDA Technology / Physics Integration / Diagnostics

- 37 - EFDA Technology / Physics Integration / Diagnostics
TW5-TPDC-IRRCER-D03
Task Title: ASSESSMENT OF IR FIBRES FOR THERMOGRAPHY APPLICATIONS, INITIAL GAMMA INDUCED EFFECTS,
THEN NEUTRON IRRADIATIONS FIBRE SELECTION AND PROVISION, DIAGNOSTIC
PREPARATION AND MEASUREMENTS
INTRODUCTION
Fibres can play a useful role for ITER e.g. for spectrally resolving thermography in particular when operational in the IR (Infra Red) range [1]. The fibres will be subjected to neutron and γ doses depending on the proximity to the core of the tokamak. Relevant and reliable radiation hardness data are only available for silica fibres and generally only up to a wavelength of 1.7 µm. Tore Supra has successfully used ZrF4 fibres transparent up to 4.5 µm in the recent past [2]. These fibres have a spectral band-width, transparency, working temperature and mechanical flexibility adequate for ITER thermography applications, but little is known about their radiation hardness. Presently there are two main manufacturers known to us of that type of fibre: Reflex Analytical and Le Verre Fluoré. With the conclusion of the EFDA contract TW5-TPDC-IRRCER-D03 a formalisation of the already existing collaboration with the SCK⋅CEN Mol was achieved, which permits the CEA to use SCK⋅CEN facilities to irradiate IR fibres. The preparation of a spectrometer and its ancillary parts for autonomous IR measurements of fibres under irradiation was the first step of this task and the main achievement of 2005. This preparation permits now to envisage the second step, which is a first campaign of automated measurements in march 2006 at the γ irradiation facility RITA of the SCK⋅CEN Mol. 2005 ACTIVITIES
PREPARATION FOR AUTONOMOUS IR MEASUREMENTS The most interesting radiation effect measurements are made on-line with equipment installed next to the irradiation source. The standard equipment that is available at SCK⋅CEN Mol is limited at 1.7 µm maximum wavelength. Our main interest is beyond that wavelength, with a particular interest in the range around 3-5 µm, but eventually also up to 10 µm. With financial support from the region PACA (Provence Alpes Côtes d’Azur) we have acquired a spectrometer set-up that was programmed at the CEA to do such measurements in an autonomous way and which will be at the SCK⋅CEN Mol for the duration of the irradiation measurements. Figure 1 shows the main elements of the spectrometer set-up for transmission measurements of a fibre, which is the primary use of this set-up. In this condition a light source is used to provide broadband spectral illumination. This
light is passed through a filter-wheel, chopped, spectrally selected by the TRIAX spectrometer, then passed either through a fibre to be measured or directly onto a detector and finally synchronously analysed.
Filterwheel
Fibre to bemeasured fortransmission
TRIAX 320
Figure1: Set-up for automatic transmission measurements
The light source is a Globar type light source operating at 1450°K which provides a continuous illumination with useful intensity in the spectral range of 800 nm to 10 µm. The filter-wheel is equipped with 5 high-pass filters with cut-on wavelengths at 600 nm, 1030 nm, 1970 nm, 3620 nm, and 6000 nm. This allows to avoid the superposition of different spectral orders of the light diffracted off the gratings of the spectrometer. The chopper is used at 345 Hz. The TRIAX 320 spectrometer is equipped with 3 gratings (table 1). The choice of the grating, the wavelength, the width of the slits and the position of an internal mobile mirror are remotely controlled. The mobile mirror allows to send the spectrally selected light either through the fibre to be measured to detector D1 at the far end of the fibre or directly to the reference detector D2. As detectors we use – depending on the wavelength range of interest - Peltier-cooled PbSe (< 4.8 µm) or HgCdTe (< 10 µm) single channel devices at –30°C or –40°C respectively. A switch that is synchronised with the mirror position connects the detector that receives light with the lock-in amplifier SR 830. All these elements are controlled via an IEEE interface from a PC running a custom made Labview application. The same Labview application controls also the power of the Globar light source (and other components) to prolong its lifetime during irradiation exposure campaigns of a duration of weeks or months

- 38 - EFDA Technology / Physics Integration / Diagnostics
which are expected to be necessary for interesting fibres. The program that operates the set-up requires as input spectral range and resolution for the spectrometer and sensitivity and filtering time constant for the detection. It selects grating and filter, switches from reference to measurement and does such runs at pre- programmed intervals.
Table 1: Gratings of the TRIAX 320 spectrometer
Number of
grating
Blaze wavelength
(nm)
Lines per mm Optimum spectral range (nm)
1 1000 300 800 - 1350 2 2000 300 1350 - 2900 3 5000 150 2900 - 10000
In another configuration, the same elements of the spectrometer set-up can be used to measure radio-luminesence or Cherenkov radiation in the fibre, effects that appear at relatively high dose rates. One possibility to do so, is to replace the light source by the fibre which is irradiated and use detector D2 for measurements. RESULT OF PRELIMINARY IRRADIATION EXPERIMENT
Figure 2: Attenuation measurement of exposed and unexposed ZrF4 fibres (Reflex Analytical).
A preliminary experiment with γ irradiation of a ZrF4 fibre (Reflex Analytical) from Tore Supra [2] has been performed in the beginning of 2005 by Benoit Brichard (SCK⋅CEN) in an informal collaboration between CEA-Cadarache and SCK⋅CEN Mol in Belgium. The results (after 30 minutes of gamma exposure) were significantly (4-5 orders of magnitude) worse than the best silica results in the NIR (Near Infra Red) range at 1.5 µm. The described set-up (figure 1) has been used to measure the attenuation of light up to 4.5 µm in the exposed ZrF4 fibre as well as in un-exposed reference ZrF4 fibres (figure 2). In the IR range above 3.5 µm the additional attenuation in the exposed fibre was relatively small – which is encouraging.
CHOICE OF FIBRES FOR FIRST IRRADIATION CAMPAIGN IN MARCH 2006 For the irradiation campaign in March 2006 we dispose of 2 types of ZrF4 fibres from Le Verre Fluoré of 2 m length, further ZrF4 fibres from Reflex Analytical (3.3 m) and hollow fibres (polymicro) of the internal diameter of 750 µm and 500 µm. The hollow fibres have spectral transmission up to 10 µm and no darkening fibre core, which makes them potentially interesting, despite their relatively low basic transmission. Standard silica fibres will also be irradiated to study their behaviour in the wavelength range 1.7-2.3 µm. To be able to measure online effects we use long patch-cords fibres of 11 m length made of ZrF4. OUTLOOK A sapphire fibre will soon become available for tests. Other candidates that are under discussion are chalcogenide and holey (Bandgap) fibres. REFERENCES
[2] R. Reichle, et al., J. Nucl. Mater. 313-316, (2003) 711 REPORTS AND PUBLICATIONS
[1] R. Reichle et al., “Concept for spectrally resolved
ITER divertor thermography with fibres”, proc. 32th EPS Contr. Fusion and Plasma Physics, Tarragona, Spain, 27 June-1 July 2005, ECA 29A, P4.083 (2005).
TASK LEADER
Roger REICHLE DSM/DRFC/SIPP/GID CEA-Cadarache F-13108 Saint-Paul-lez-Durance Cedex Tel. : 33 4 42 25 63 76 Fax : 33 4 42 25 49 90 e-mail : [email protected] In collaboration with SEK.CEN Mol facilities and personnel.

- 39 - EFDA Technology / Vessel-In Vessel / Vessel-Blanket and Materials
CEFDA04-1202
Task Title: TW5-TVV-RFUT: COOPERATION WITH RUSSIAN FEDERATION IN SYSTEMS ASSESSMENT
INTRODUCTION
In the framework of the ITER vacuum vessel (VV) inspection, studies were performed by CEA to investigate ultrasonic techniques which are relevant for this inspection [1], [2], [3] and [4]. In the present work, the goal is to assess three UT methods developed by PHOENIX(UK), SINTEZ/ECHO (Russian Federation) and CEA (Saclay) for acceptance by the RCC–MR manufacturing code and the French Certification Authorities so that they may be used successfully during the ITER vacuum vessel manufacture. OBJECTIVES The main objectives of this project are the following: - To optimize of present ultrasonic inspection systems of
SINTEZ-ECHO/PHOENIX and CEA - To analyse both the range of inspection and sensitivity
of the three independent systems for VV inspection - To assess and compare three U.T methods for ITER VV
butt welds The work to be carried out by CEA includes: - The management of the global RFUT project - The preparation of specifications and drawings of
mock-ups to be manufactures - The technical task development related to ultrasonic
techniques for ITER VV inspection 2005 ACTIVITIES
This project officially started in september 2005 and the main activities during 2005 were the following:
- The description of technical specifications tasks for partners SINTEZ-ECHO/PHOENIX and including tasks for CEA
- The preparation and placement of the contract with
SINTEZ. - The description of the technical specifications for
mock-ups preparation
- The preparation of the kick-off meeting which was
held in Saclay on february 2006
TECHNICAL SPECIFICATION TASKS The work must be selected in order to organise the optimization of UT techniques, the round robin trials and the assessment of results. Actions for optimization, this is related to the tests that be conducted on the mock-ups using different UT techniques Actions for round robin trials, it concerns with the exchange of mock-ups between partners to carry out inspection using the different UT technologies. Action for assessment, it is related to task to evaluate results and to compare methodologies. TASKS FOR ECHO Task 1 – Optimization of the Echo system : The task been selected on the basis that the Echo system has experienced few trials on automatic narrow gap welds and will therefore need some preparation before comparative tests can be conducted on several specimens. The Echo system would be optimized for performance on the narrow gap weld specimens using the existing transducer system Task 2 – Description of SINTEZ/ECHO system: This task has been selected in order to facilitate the information exchange between partners thus, the functionality of the SINTEZ/ECHO system must be adequately described. Task 3 – Round robin trials and inspection: The object of this task is to carry out four mock-ups inspection of which two must be supplied by PHOENIX and two by the CEA. The inspection of the 4 mock-ups will be carried out by ECHO in Russian Federation. The other partners, PHOENIX and CEA will sent out their mock-ups and the corresponding results of inspection to SINTEZ/ECHO. After the inspection, SINTEZ/ECHO must return the mock-ups inspected to PHOENIX and CEA. Task 4 – Assessment of results: The objective of this task is to synthesize the inspection results obtained on the 4 mock-ups. All of the results obtained must be clearly analysed, explained and presented in appropriate report which must be sent to the CEA in Saclay.

- 40 - EFDA Technology / Vessel-In Vessel / Vessel-Blanket and Materials
TASKS FOR PHOENIX Task 1 – Description of Phoenix system used for NDT inspection: this task is selected on the basis that the CEA must evaluate the system of three partners. To facilitate this, the functionality of the system of Phoenix must be adequately described. Task 2 – Fabrication of two mock-ups In order to assess the ultrasonic inspection systems for narrow gap welds four mock-ups will be prepared and in particular two of four mock-ups will be paid for by PHOENIX. Task 3 – Round robin trials and test: the inspection will be carried out by PHOENIX in United Kingdom of four mock-ups. Task 4 – Assessment of results: after series of inspections, PHOENIX must describe his measurement in a report to be sent to partners. In order to exchange the information in suitable manner a guideline will be used to present results. This guideline will be prepared by the CEA TASKS FOR CEA The CEA is not only the coordinator of this project but must place the necessary contract with SINTEZ/ECHO and to carry out test and evaluation of the whole UT inspection, of partners. Regarding the technical task for CEA related to UT inspection they are the same as described above for Phoenix and Echo. In particular the CEA must optimise his system and to design two mock-ups and to pay for. Furthermore, the CEA must assess the three UT methods. A report will be prepared describing the functionality of the UT system, the evaluation of results and commenting on the suitability of these three systems. Taks 1 – Description of tasks specification for inspection
(SINTEZ/PHOENIX and CEA) Task 2 – Placement of the contract with SINTEZ-ECHO Task 3 – Optimisation of the CEA's system Task 4 – Description of CEA’s system Task 5 – Fabrication of two mock-ups Task 6 – Round robin trials and test Task 7 – Assessment of results Task 8 – Assessment and comparison of three methods PLACEMENT OF CONTRACT WITH SINTEZ In terms of the present contract CEA- EFDA 04/1202 is specified that the CEA must place a contract with SINTEZ to carry out all of the tasks defined above. Thus, a contract was prepared and sent to SINTEZ for agreement. This contract will be in operation in short time. MOCK-UP SPECIFICATIONS In order to obtain realistic samples which will be used to carry out round robin trail test four mock-ups will be prepared.
These mock-ups include:
- Prepared weld root runs with defects to test the capability of all systems to detect defects immediately after production of root
- Samples with small mid-wall and root defects to
test both systems near the limits of detectability
- Inclusion of large mid-wall lack fusion to compare abilities of systems to detect vertical planar reflectors.
Figure 1: TIG narrow gap welded sample in which several breaking surfaces and embedded flaws will be included
Figure 2: Schematic mock-up with an angle of 10°, which is a situation in actual vacuum vessel design
Figure 3: Mock-up partial welded. This sample will be used to inspect representatives defects
in the root are of weld
60 m
TIG weld
≈250 mm
≈250
60 m
≈250 mm
10°
TIG weld
60 mm
500 mm
30 mm
100 mm

- 41 - EFDA Technology / Vessel-In Vessel / Vessel-Blanket and Materials
Figure 4: Scheme of the T-joint mock-up. This is the T-shape adaptor of the poloidal rib with one
joint of weld PREPARATION OF THE KICK-OFF MEETING The kick-off meeting was prepared in 2005 which was held in Saclay on february 2 and 3. The objective of this meeting was to exchange point of view between partners and to complete the definition of mock-up preparation and the technical specification for action to be carried out. REPORTS AND PUBLICATIONS [1] Development of ultrasonic non destructive testing
method for the vessel inter-sector weld of ITER: development of dynamic phased array techniques», SISC/03-RT0096/Rev. 0, september 2003.
[2] Development of ultrasonic non destructive testing
method for the vessel inter-sector weld of ITER: simulation of welding process», DECS/SISC/LMUS/02-RT0052, july 2002.
[3] Development of phased array techniques for the
inspection of one sided welds in ITER vacuum vessel», SYSSC/04-RT0143/Rev. 0, september 2004.
[4] Simulation of phased array technique for qualification
of UT methods for one sided welds during VV manufacture. SYSSC/05 RT0167/Rév.0, october 2005
TASK LEADER Jorge TIRIRA DRT/DETECS/SYSSC/LMC CEA-Saclay F-91191 Gif-sur-Yvette Cedex Tel. : 33 1 69 08 40 02 Fax : 33 1 69 08 75 97 e-mail : [email protected]
60 TIG weld
≈250
190
1

- 42 - EFDA Technology / Vessel-In Vessel / Vessel-Blanket and Materials

- 43 - EFDA Technology / Vessel-In Vessel / Vessel-Blanket and Materials
CEFDA05-1226
Task Title: TW5-TVM-LIP: RULES FOR DESIGN, FABRICAT ION AND INSPECTION MODIFICATION OF ITER MATERIALS DOCUMENTS, ASSESSMENT OF MATERIALS DATA AND MAINTENANCE OF A DATABASE
INTRODUCTION
The properties of materials used in fusion components need to be known in detail by designers, by licensing authorities and the materials specialists. ITER Materials Properties Handbook (MPH) is a document that provides such information in an internationally accepted format. CEA’s contribution to MPH, in addition to supporting ITER IT, EFDA CSU, and ITER database groups, is to provide MPH files for Type 316L(N) steel weld metals and joints. In 2005, the work was focussed on low temperature (316L) and high temperature (19-12-2, OKR3U) weld metals. In 2006 work will be extended to 16-8-2 weld metal. 2005 ACTIVITIES
Only the work related to weld metal MPH files will be reported here as the support provided to ITER IT, EFDA CSO and ITER database is similar to the those reported in 2004. For more information the reader is referred to ITER MPH files. MATERIALS Section IV - Welding of the RCC-MR and its Appendices [1] provide guidelines for selection and utilization of filler metals for welding of austenitic stainless steels, including the Z2 CND 17-12 with controlled nitrogen addition, the steel equivalent to the ITER 316L(N). ASME code sections on welds [2] also provide guidelines for selection of weld metals and welding the austenitic steels that can be used for ITER vessel and in-vessel design. However, since Type 316L (N) is a grade qualified only in the RCC-MR, here, preference will be given to the latter. The differences between the two codes, with regard to the austenitic stainless steels are, however, minimal and can be in most cases ignored. RCC-MR allows for applications at temperatures not exceeding 375°C, where high temperature strength is not required, or the degradation of properties due to long time ageing is negligible, use of the low carbon grades, 316L (19-12-2L). Specifications for these metals are given in the section IV / RS 2900 and are summarized below.
RS 2915: wire for TIG welding, ER 316 L (Z2 CND 19-13)1,2,3
RS 2925: covered electrode for manual arc welding, E 316 L (Z 19-12-3 L)1,3
RS 2945: Flux wire couple for automatic welding, 316 L (SA 19-12-2 L)1,3
1= Strength and buttering, 2= TIG root support and seal, 3= Cladding At temperatures greater than 375 °C, RCC-MR specifies the higher strength grades: 19-12-2 (OKR3U) and 16-8-2. These grades also have a lower delta ferrite content and are more resistant to degradation of properties due to long-term ageing or radiation embrittlement. The data sheets for 19-12-2 and 16-8-2 grades are given in Section IV/RS 9000 of RCC-MR:
RS 9513.1: 19-12-2 covered electrode for manual metal arc (111) welding
RS 9513.2: 16-8-2 covered electrode for manual arc (111) welding
RS 9523.1: 19-12-2 wire for TIG (141) welding RS 9523.2: 16-8-2 wire for TIG (141) welding RS 9543.1: 19-12-2 wire associated with a flux
for submerged arc (121) welding RS 9543.2: 16-8-2 wire associated with a flux for
submerged arc (121) welding CODE PROCEDURES RCC-MR [1], ASME [2] and ISDC [3] organize welds into different "Weld Categories" (A, B, C, D, and E) based on their intended use. While the joints are organized into different "Weld Types" (I, II, III, IV, V, VI, VII) based on the configuration of the weld. ISDC [3], which is compatible with all ITER partner codes, specifies that all welded joints for assemblies directly related to the mechanical function of the structure should be categorized as A or B and should be butt welded joints obtained by full penetration welding, with or without back welding, and without the use of permanent backing plates. Assemblies connecting flanges, internal support shells, tube plates, etc. to the main shell should be categorized as C, and assemblies connecting nozzles to the main shell should be categorized as D. Categories C and D welds may be full penetration fillet or T joints without permanent backing plate (type III.1). However, the backside being inaccessible for type III.2 joint, it is not permitted for category C but is permitted for category D welded joints. For code-stamped pressure vessels, there are specific additional requirements concerning which weld types can be used to make welds in the different use categories.

- 44 - EFDA Technology / Vessel-In Vessel / Vessel-Blanket and Materials
The procedure for calculating the strength or the fatigue life of weld joints of different weld types is based on "knock down" factors applied to the base material properties. The allowable stresses for a weld (the knock down factors) are intimately related both to the qualification of the process and the inspection of the weld after fabrication. MPH PROCEDURES ITER MPH recommends the code data, whenever available, for ITER Structural Design Criteria. In fact, in each materials properties file a clear distinction is made between code recommendations and additional recommendations made as a result of the present work. The number and type of property sheets used in MPH files vary according to the type of material examined. In general they cover all specifications for products, compositions, mechanical properties and physical properties. In each property file, first code recommendations, if available, are presented. Then the available materials properties are collected and analysed, including the effects of exposures to high temperatures and neutron irradiation. Finally, the results obtained are compared with code recommendations to see if the safety margins recommended in the code are maintained under ITER service conditions. For welded joints, special attention is also paid to welding conditions, welding positions, weld sections, etc. An Example of MPH files codes for 19-12-2 weld metal is given below. Several figures and tables have been removed to reduce the length of the paper. FILE CODE: ITER-AA08-2101 TENSILE STRENGTH CODE RECOMMENDATIONS The 316L and 19-12-2 weld metals given in File Code ITER-AA08-1100 are RCC-MR Code qualified materials [1]. The low temperature grades (316L) are also RCC-M [4] and ASME code qualified materials [3]. For the low temperature grades (316L), the specified Su at room temperature (RS 2915, RS 2925, RS 2945) is in the range of 520 to 670 MPa. For the high temperature grades (19-12-2), the specified values according to RS 9513.1 (covered electrode) are:
Su (RT) ≥ 550 MPa Su (550 °C) ≥ 380 MPa
The section on RS 9523.1 (wire for TIG welding) is not yet available in RCC-MR. Chapter 3 of the data sheet 9513.1 “Test on qualification coupons (RS 3334)” also gives a series of Su (Rm) specified values for qualification test coupons. Position 1G (flat):
Su (RT) ≥550 MPa in L direction Su (RT) ≥ 525 MPa in as welded and T direction
Su (550 °C) ≥ 380 MPa in as welded and T direction
For flux covered automatic welding (RS 9543.1) these values are slightly lower: Su (RT) ≥ 540 MPa Su (450 °C) ≥ 400 MPa Su (550 °C) ≥ 380 MPa Chapter 3 of the data sheet 9543.1 “Test on qualification coupons (RS 3334)” also gives a series of Su (Rm) specified values for qualification test coupons. Position 1G (flat): Su (RT) ≥ 540 MPa in L direction Su (RT) ≥ 525 MPa as welded in T direction Su (450 °C) ≥ 400 as welded in T direction ADDITIONAL ANALYSES General Codebooks such as RCC-MR do not give materials properties data that are at the origin of their recommendations. These are usually available in the supporting documents, such as the Appendix A (see e.g. Appendix A for 316L(N)-IG, ref. 5). In the additional analysis that follows, we will compare the materials properties data available for 19-12-2 weld metal with the tabulated values given in RCC-MR. The main purpose of this comparison is to verify whether the safety margins incorporated in the code recommendations are still valid when these materials are used under ITER and its anticipated future conditions. Recommendations for low temperature weld metals are relatively simple and do not require additional analyses. The additional analyses are, therefore, performed only on high temperature grade: the 19-12-2 grade also known as OKR3U. Experimental data used in this file are taken mainly from the CEC Study contracts such as CT-92-0211-F (6) and selected ITER partner reports (5, 7-15). Mechanical Properties Experimental data reported for tensile strength of 19.12.2 (OKR3U) weld metal are shown in figure 1.
0
100
200
300
400
500
600
700
800
0 200 400 600 800
OKR3U Weld Metal
Average Tensile Strength, MPaAverage Tensile Strength, MPaMinimum Tensile Strength, MPaMinimum Tensile Strength, MPaRm (L), MPaRm (T), MPaRm (CEC), MPa
Ten
sile
Str
engt
h, M
Pa
Temperature, °C
Su (ave)
Su (min)
RCC-MR (RT)
RCC-MR (450 C)RCC-MR (550 C)
Figure 1: Evolutions of Su average and minimum versus temperature for 19-12-2 weld metal. (experimental data:
triangles = L and circles= T orientations).
Equation fitted to the data in the temperature range of 20 through 700 °C is:

- 45 - EFDA Technology / Vessel-In Vessel / Vessel-Blanket and Materials
Su(ave)=606.83 - 0.99319 θ + 0.002925 θ2 - 3.1479x10⁻⁶θ3
(eq. 1) Since the scatter in experimental data at higher temperatures is not uniform, the room temperature data are used to derive the minimum curve. The average Su at RT is 588 MPa and the min value specified in RCC-MR is 550 MPa. The average curve is hence shifted 38 MPa down. Su(min)=568.83 - 0.99319 θ + 0.002925 θ2 - 3.1479x10⁻⁶θ3
(eq. 2) Figure 1 shows that the minimum curve obtained in this way is also above the specified values at 450 and 550°C. A few data at RT that fall below the minimum curve are from the T direction that correspond to RCC-MR specified min value of 525 MPa. The usual code practice is to multiply the average values at temperature by the ratio of specified value at RT over the average value at RT. Even here, the simple shift approach is not suitable for extrapolation to temperatures higher than 700°C. Since the extent of the data available at temperatures above 700 is limited, tentative extrapolations of average and minimum curves from 700°C to 900°C are shown in figure 1 and described by the equations 3 and 4. Su average in the temperature range of 700 to 900 °C: Su(ave)=10047-34.277 θ + 0.040204 θ2 - 1.6x10⁻⁵ θ3(eq. 3) Su min in the temperature range of 700 to 900 °C: Su(min)=10009-34.277 θ + 0.040204 θ2 - 1.6x10⁻⁵θ3(eq.4) Effect of Weld Thickness and Welding Position Codes such as RCC-MR [1] contain comprehensive guidelines and recommendations for different types of welds, sizes, forms, etc. Here, two aspects that may not appear clearly in codes are analysed: namely weld thickness and welding position. Most of the weld data shown in figure 1 come from tests performed on specimens taken from small and large weld deposits (molds). Such data are useful for characterization of bulk weld metal but may not fully reflect variations of the properties in the welded assemblies. Figure 2 shows the results obtained from tests performed on welded joints with joint thicknesses of 15 to 126 mm. It can be seen that despite the large variations in size, the joint strength in all three welding positions has a limited scatter. Figure 3 extends the above observation to the evolution of the tensile strength versus the test temperature for different welding positions. Here, the results from the flat welds are situated in the lower part of the dispersion band, but again the scatter is small.
0
100
200
300
400
500
600
700
800
0 20 40 60 80 100 120 140
OKR3UWeld Thickness
Rm (vertical)Rm (flat)Rm (overhead)
Ten
sile
Str
engt
h, M
Pa
e, mm Figure 2: Effect of joint thickness on room temperature
tensile strength of OKR3U welds in three different orientations.
0
100
200
300
400
500
600
700
800
0 100 200 300 400 500 600 700
OKR3UWelding Position
Rm (vertical)Rm (flat)Rm (overhead)
Ten
sile
Str
engt
h, M
Pa
Test Temperature, °C
overhead
vertical
horizotalflat
Figure 3: OKR3U tensile strength versus temperature in
three different welding positions Structural Stability Tests Two types of tests are performed for verification of structural stability of the weld materials. One is part of the acceptance tests and consists of U-notch Charpy impact tests in T direction after short time exposure of weld metal to a high temperature. Another one is the long time ageing of weld metals at various temperatures. The latter is part of the high temperature service qualification and is not needed for service at low temperatures. A third type of tests may be needed for fusion components that have to be subjected to HIPing after welding. a) Initially for the high temperature welds, the accelerated ageing tests were: 15 h of exposure at 850 °C. Later, however, this temperature was considered excessive and the tests were done for 100 h at 750 °C.

- 46 - EFDA Technology / Vessel-In Vessel / Vessel-Blanket and Materials
The results of tension tests performed on OKR3U weldments after 100 h exposures at 750 °C are all situated above the minimum curve shown earlier in figure 1. b) Figure 4 shows the effect of ageing at different temperatures on the tensile strength of OKR3U. The tensile strength of the weld metal remains stable at ageing temperatures up to 750 °C and only at higher temperatures there is a significant drop in strength. This does not mean that some microstructural transformations do not occur in the weld metal at lower temperatures. It simply means that the effects of such transformations on Su are negligible. c) Some ITER welded joints may go through the HIPing treatments along with the parts that are HIPed. Tension test results obtained after exposure of OKR3U weld metal to 1050 °C followed by cooling at a rate of 100 °C / h show that the strength of the weld is reduced to about that of the base metal.
0
200
400
600
800
1000
10-6
10-4
10-2
100
102
104
Effect of AgeingOKR3U
Rm (Initial)Rm (300 °C)Rm (350 °C)Rm (400 °C)Rm (450 °C)Rm (500 °C)Rm (550 °C)Rm (575 °C)Rm (600 °C)Rm (650 °C)Rm (750 °C)Rm (800 °C)
Roo
m T
empe
ratu
re Y
ield
Str
engt
h, M
Pa
Ageing Time, h
Initial
Figure 4: Effects of ageing on tensile strength of OKR3U
weld metal. Effect of Irradiation During the initial phase of ITER operation the effect of irradiation on vessel and in-vessel components is kept low (< 3 dpa) to guard against irradiation embrittlement and the amount of helium generated (< 1 appm) for reweldability. However, even at such dose levels there are changes in the mechanical properties and in any case for future phases the effects of higher doses need to be investigated. As shown in figure 5 the effect of irradiation on tensile properties of the weld metal is similar to that of the base metal, although the variations are less pronounced (weld metal has a higher strength and a lower ductility to start with). At irradiation temperatures below about 400 °C, there is a hardening effect, i.e. an increase in tensile strength associated with a decrease in ductility. Saturation in hardening and reduction in ductility is observed with increasing dose level. When the test temperature is increased to above about 500 °C, the hardening effect is
reduced and eventually becomes negligible at higher test temperatures. The reduction in ductility, however, persists at higher test temperatures due to the presence of helium at grain boundaries, as reported for the base metal [5].
100
200
300
400
500
600
700
800
0
10
20
30
40
50
60
0 5 10 15 20
Weld Metal (19-12-2)Irr and test - 400°C
Elo
ngat
ion,
%
Dose, dpa
U.T.S
Y.S.
T.E.
U.E.
Figure 5: Effect of irradiation at about 400 °C on tensile properties of OKR3U weld metal.
Design Allowables Comparison of Sm values derived from the base metal properties data with those derived from weld metal data show that the latter are bound the former. CONCLUSIONS
The above analyses show that both the low temperature and high temperature grades of 316 / 19-12-2 weld metals satisfy the existing code requirements. The evolution of tensile strength of weld metal under ITER initial conditions is moderate and covered by the safety margins already included in the code. REFERENCES
[1] Design and Construction Rules for Power
Generating Stations, Design and Construction Rules for Mechanical Components of the FBR Nuclear Islands, RCC-MR, Section IV Welding, AFCEN, Edition 2002.
[2] ASME “Boiler and Pressure Vessel Code”, Code
Cases, Nuclear Components N-47-24, Class 1 Components in Elevated Temperature Service, Section III Div. 1, 1986.
[3] ITER Interim Structural Design Criteria (ISDC), S
74 RE 2 97-02-30 W 1.2, IRB/Welds/Revision 3. [4] Design and Construction Rules for Mechanical
Components of the LWR Nuclear Islands, RCC-M, AFCEN, Edition 2002.

- 47 - EFDA Technology / Vessel-In Vessel / Vessel-Blanket and Materials
[5] A. A. Tavassoli, “Assessment of Austenitic Stainless Steels”, Fusion Engineering and Design 29 (1995) 371-390. See also Appendix A of ISDC for 316L(N)-IG
[6] T. Forgeron (Fr), A. A. Tavassoli (Fr), J. Wareing
(UK), D. Lehmann (Fr), C. Escaravage (Fr), B. Breitling (D), et C. Picker (UK) “Effect Of Thermal Ageing on Mechanical Properties of Type 316L(N) Base and Weld Metals”, CEC Study Contract CT-92-0211-F, CEA Report 94.
[7] J.L. Puzzolante, M. Scibetta, R. Chaouadi, W.
Vandermeulen, “Tensile and Low Cycle Fatigue Properties of Solution annealed Type 316L SS Plate and TIG Weld Exposed to 5 dpa at Low Temperature (42°C)”, BLG-821, SCK.CEN, Sept. 1999, (ITER Library Number - SS39, SS50)
[8] J.W. Rensman, J.Boskeljon, M.G.Horsten, M.I.De
Vries, ”Irradiation Testing of Stainless Steel Plate Material and Weldments, Tensile Properties After 0.5 and 5 dpa at 350K and 500K”, report ECN-C-97-088, Oct. 97, (ITER Library Number - SS17).
[9] G.L. Tjoa, J Boskeljon, D.S. D'Hulst, M.I.de Vries,
”Results of Tensile tests on Type 304 and 316 Stainless Steel Plate and Welded joints”, Report ECN-I-94-007, Feb. 1994, (ITER Library Number - SS100).
[10] H.Yamada, H.Kawamura, ”Qualification of
structural materials and joints”, Final report on ITER task T427 JA, Task No G 16 TT fr 97 FJ, May 2001, (ITER Library Number - SSCuJ19).
[11] W. Vandermeulen, W. Hendrix, V. Massaut, J. Van
de Velde, and Ch. Raedt, “FAFUMA 1 test results”, FT/MOL/90-01, WV/MJW-V, Mol, February 1990, (ITER Library Number - SS87, SS1).
[12] Källstrom R., Josefsson B., Haag Y., “Results from
Tensile Testing of 316L Plate and Weld Material”, Studsvik Nuclear - Report No. Studsvik/M-93/45, April 1993, (ITER Library Number - SS7).
[13] Horsten M.G., Van Hoepen J., de Vries M.I.,
“Tensile Tests on Plate and Electron-Beam Welded Type 316L(N) Material”, ECN, Petten, NL Report No. ECN-CX-93-112, November 1993, (ITER Library Number - SS9).
[14] A.Rowcliffe, “Irradiation testing of stainless steel
and Inconel including welding and rewelding of irradiated materials”, Final report on ITER task T214 US Task No G 16 TT fr 75 95-07-04 FU, March 1998, (ITER Library Number - SS29).
[15] H.Sagawa, “Irradiation testing of stainless steel and
Inconel including welding and rewelding of irradiated materials”, Final report on ITER task T214 JA, Task No G 16 TT fr 73 95-07-04 FJ, June 1998, (ITER Library Number - SS30)
TASK LEADER
Farhad TAVASSOLI DEN/DMN CEA-Saclay F-91191 Gif-sur-Yvette Cedex Tel. : 33 1 69 08 60 21 Fax : 33 1 69 08 80 70 e-mail : [email protected]

- 48 - EFDA Technology / Vessel-In Vessel / Vessel-Blanket and Materials

- 49 - EFDA Technology / Vessel-In Vessel / Vessel-Blanket and Materials
TW2-TVV-ROBOT
Task Title: DYNAMIC TEST RIG FOR INTERSECTOR WELDIN G ROBOT
(IWR) FOR VV SECTOR FIELD JOINING
INTRODUCTION
The building-up and repair of ITER vacuum vessel will require the machining of 60 mm thickness steel walls by a cutter saw. The slicing machining system will be coupled with the IWR robot, moving inside the vacuum vessel on dedicated rails. To operate cutting process, a mechanical system has been designed and built, able to reach a 360 mm.s-1 machining speed while cutting a 10 cm thickness of stainless steel, leading to 6 passes for cutting the 60 mm required. 2005 ACTIVITIES
The design of the cutting tool takes into account ITER vacuum vessel requirements and IWR robot specifications.
Figure 1: Vacuum vessel overall view, the IWR robot on its rails.
A distance of 1100 mm between the two 60 mm thickness skins of ITER vacuum vessel has been taken into account. This leads to design a strong tool to avoid distortions on the saw and vibrations, as described in figure 2.
Figure 2: CAD views of the IWR and the cutting systemin the vacuum vessel
CALCULATION The cutting strength is given by the following formulae:
P = K.l.A.F.Z.Vc.103/π.D, Where:
P = power in W, K = coefficient depending of the used material (0.07 for stainless steel), l = width of the saw in mm (for us: l.5 mm), A = depth in mm (10), F = advance per tooth, 0.15 for stainless steel and this kind of saw, Z = number of teeth (160), Vc = cutting speed in m.mn-1 (15 m.mn-1 for stainless steel), D = diameter of the saw in mm (300).
These values give a power of 670 W for the motor. Transmission efforts by chains conduct to a choice of 1.5 kW motor. The total deformation at full machining power is in the range of 0.08 mm. EFFORTS ON THE INTERFACE WITH THE ROBOT The cutting system weights 178 kg. The gravity centre is located at 370 mm from the centre M of the plate to be fixed on the robot. The extremity of the saw (working point) is at 1120 mm from the M point. The reduced efforts at this point have for components:
- a vertical force F = P + Fc = 178 x 9.81 + 2674 = 4420 N, - a torque with an horizontal axis C = 370.10-3 x P + 1120.10-3 x Fc = 3611 N.m.
Figure 3: Design of machining tool

- 50 - EFDA Technology / Vessel-In Vessel / Vessel-Blanket and Materials
Figure 4: Machining tool in testing
Figure 5: Saw
Figure 6: Protection device of machining tool The cutting system has been tested with a 20 mm thickness stainless-steel piece. Cutting trials in 2 passages have been successfully performed. The next step of the work will be achieved in Finland, in VTT Laapenranta plant. The system has been shipped by july 2005 in Finland.
REPORTS AND PUBLICATIONS
Final report: Dynamic test rig for intersector welding robot
(IWR) for VV sector field joining – Technical report – July 2005 – CEA/DRT/LITEN/DTEN/DL/2005/034
TASK LEADER
Philippe AUBERT DRT/DTH CEA-Saclay F-91191 Gif-sur-Yvette Cedex Tel. : 33 1 69 08 17 67 Mobile : 33 6 09 53 36 41 Fax : 33 1 69 08 90 23 e-mail : [email protected]:

- 51 - EFDA Technology / Vessel-In Vessel / Vessel-Blanket and Materials
TW3-TVM-JOINT
Task Title: CHARACTERIZATION OF THE CuCrZr/SS JOINT STRENGTH FOR DIFFERENT BLANKET MANUFACTURING CONDITIONS
INTRODUCTION
The TW3-TVM-JOINT aims at improving knowledge on the strength of CuCrZr/SS junctions after different manufacturing conditions foreseen for the manufacturing of first wall panels and at defining an acceptance criterion for the assembly. In the meantime, investigation on the properties of the CuCrZr itself after the different manufacturing conditions was also intended. Various mechanical tests have been chosen to evaluate the strength of the junction as well as the mechanical properties of the CuCrZr after the HIP bonding treatment. Different temperatures, cooling rates and duration of temperature step are possible and their effects have been investigated. The routes for manufacturing blocks in which testing specimens have been machined are exposed in table 1. The 1040°C temperature has been chosen in case blankets are manufactured in a single step (SS/SS/CuCrZr). The 980°C temperature relates to a two steps manufacturing (SS/SS first then SS/CuCrZr). The solutionning temperature is always 980°C, but the cooling rate is varied to estimate its influence on properties. Two ageing temperatures are considered. A reference case at 480°C and a 560°C temperature leading to a slightly over-aged material simulating the bonding of Be tiles. Each route has provided specimens for tensile tests (20°C, 200°C, 300°C and 350°C), impact toughness tests at room temperature, low cycle fatigue tests at 300°C and fracture toughness measurements at 20°C. The end of the task comprised the fabrication of two primary first wall mock-ups with two different manufacturing conditions chosen among the manufacturing conditions tested in the TW3-TVM-JOINT task. Route B1 and B3 have been chosen.
2005 ACTIVITIES
ACCEPTANCE CRITERION FOR THE JOINTS All things considered, it has been concluded that the most selective test for assessing the strength of a CuCrZr/SS junction is the CT test which provides a kind of ordering in between the manufacturing conditions as illustrated on figure 1. D1 route is definitely not reliable. According to this graph, the acceptance criterion has been chosen to be around J0.2=180 kJ/m2. This result must be taken with care when applied to other types of test specimen or real mock-up design rules as the CT test performed does not fully comply to any known standard, mainly because the specimens are not symmetrical (bi-material) and plasticity is not confined during the test. This is illustrated on figure 2.
0
50
100
150
200
250
300
350
400
450
500
-1 0 1 2 3 4 5 6
J (k
J/m
2)
∆∆∆∆a (mm)
D2B2D1B1
Figure 1: Result on CT bi-metallic samples at room temperature
Table 1: Different manufacturing routes explored (no bi-material samples made from route C1, C2, C3 and B3).
Route HIP Solutionning Ageing
B1 1040°C-2 h-140 MPa-HIP 980°C-30 mn-(cooling "MCR" GQ=70-80°C/min) 560°C-2 h
B2 1040°C-2 h-140 MPa-HIP 980°C-30 mn-(cooling "AFAP" GQ=150-160°C/min) 560°C-2 h
B3 1040°C-2 h-140 MPa-HIP 1040°C-30 mn-(cooling "MCF" GQ=70-80°C/min) 560°C-2 h
C1 1017°C-2 h-WQ 480°C-2 h
C2 980°C-2 h-WQ 560°C-2 h
C3 980°C-2 h-WQ 480°C-2 h
D1 980°C-2 h-140 MPa-HIP 980°C-30 mn-(cooling GQ=MCR GQ=70-80°C/min) 480°C-2 h
D2 980°C-2 h-140 MPa-HIP 980°C-30 mn-(cooling GQ=MCR GQ=70-80°C/min) 560°C-2 h

- 52 - EFDA Technology / Vessel-In Vessel / Vessel-Blanket and Materials
Figure 2: Un-symmetrical deformation of bi-material CT
specimen at incipient propagation MOCK-UPS FABRICATION The mock-ups are an assembly of stainless steel tubes inserted between two CuCrZr plates on a thick stainless steel plate (see figure 3). The Hot Isostatic Pressing heat treatment bonds the part together and the following heat treatments ensure higher strength to CuCrZr. The ageing is in fact an over-ageing compared to the classical temperature used for CuCrZr (460-480°C). The 580°C temperature has been chosen to simulate the HIP bonding of Be tiles of foreseen ITER primary first wall panel. Nota: compared to TW3-TVM-JOINT initial treatment matrix, the ageing temperature is 580°C instead of 560°C because of the modification of the specification in the interim of the TW3-TVM-JOINT task. The PH/S-8F (route B1) and PH/S-9F (route B3) mock-ups have been fabricated successfully within specifications. Mock-ups are shown on figure 4. The examination of spare blocks extracted from mock-ups 8F and 9F do not reveal any defects (figure 5). Micro-hardness examination shows a slightly higher hardness of bulk CuCrZr than expected, compared to the results obtained on heat treated blocks made for extracting mechanical specimens. This is surprising since the over-ageing temperature is a bit higher. We relate this to the different copper batch used to make the mock-ups, this new copper batch has a higher Cr and Zr content. We have observed as well that the CuCrZr has a small difference of hardness behaviour near – in a 200 µm layer – the 316LN/CuCrZr plane junction between route B1 and B3. The mock-ups will be submitted to US examination at VTT (Finland) before high temperature flux cyclic fatigue at Framatome ANP (Le Creusot) until failure. They will be examined again after failure at VTT.
Figure 3: Mock-up before canister welding
Figure 4: Mock-ups PH/S-8F and PH/S-9F after HIP, before decanning
Figure 5: Example of the visualisation of the CuCrZr/CuCrZr joint beside a 316L tube
(cut n°2 of 9F mock-up)
plastic strain
3%
0%
route B1
316LN
CuCrZr
PH/S-8F PH/S-9F
spare block for post-hip examination

- 53 - EFDA Technology / Vessel-In Vessel / Vessel-Blanket and Materials
CONCLUSIONS
The 2005 activities have led to a classification in manufacturing routes with a selective mechanical test being fracture toughness on CT20 specimen. An acceptance criterion has been set around J0.2=180 kJ/m2 for a precise CT20 specimen and test protocol. Two mock-ups have been manufactured with route B1 (PH/S-8F) and B3 (PH/S-9F). Some examinations have been carried out on a spare block extracted from the manufactured assembly. They show satisfactory results. The mock-ups have thus successfully been manufactured and have been sent to VTT (Finland) for ultrasonic examination. Next, they will be submitted to high heat flux cycling up to failure. REPORTS AND PUBLICATIONS
O. Gillia, I. Chu, P. Lemoine, "Characterization of the CuCrZr/SS junction strength for different blanket manufacturing conditions – Final report", CEA report: Rapport technique DTEN/DL/2005/027 O. Gillia, I. Chu, J.-M. Leibold, P. Lemoine, F. Vidotto, "Fabrication of mocks-ups PH/S-8F & PH/S-9F", CEA report: Rapport technique DTH/DR/2006/06.
TASK LEADER
Olivier GILLIA DRT/DTH/LTH CEA-Grenoble 17, rue des Martyrs F-38054 GRENOBLE Cedex 9 Tel. : 33 4 38 78 62 07 Fax : 33 4 38 78 58 91 e-mail : [email protected]

- 54 - EFDA Technology / Vessel-In Vessel / Vessel-Blanket and Materials

- 55 - EFDA Technology / Vessel-In Vessel / Vessel-Blanket and Materials
TW4-TVV-Hybrid
Task Title: FURTHER DEVELOPMENT OF THE HYBRID MIG/L ASER WELDING TECHNIQUE FOR VV SECTOR FIELD JOINING
INTRODUCTION
This task deals with the development of the Hybrid YAG + MIG welding process, to weld structures in wall thickness 20 mm and over (till 60 mm). Our main objective is to provide a welding process with a much better productivity and stiffness than the Narrow Gap TIG Welding process. The application is the welding of the ITER Vacuum Vessel. The work carried out in 2005 is the filling of austenitic narrow grooves in depth 20, 35, 50 mm (to achieve the wall thickness of the vacuum vessel). 2005 ACTIVITIES
HYBRID WELDING INSTALLATION The welding installation has the following components (figure 1):
- A Nd:YAG continuous laser TRUMPF HL4006D ; - A 30 m long and 600 µm diameter optical fiber ; - A laser welding head built with a 200 mm collimation
lens and a 300 mm focalisation lens; - A MIG/MAG welder unit DALEX VARIOMIG 250; - A water cooled MIG/MAG torch ; - An interface to fix and adjust the positioning of the
torch in relation to the laser head ; - A “cross-jet” system (protection to prevent from
pollution of the lens) ; - A 6 axes Staübli RX170 robot on which is fixed the
hybrid system ; - A positioning tool for the rotation of work pieces.
Figure 1: Hybrid welding installation
The MAG welding torch is composed of a contact tube (inside the groove) which drives the welding wire. This nozzle brings the current to the welding wire. Generally these nozzles (Cu or Cu Cr Zr) are 15 mm long and have a 6 to 8 mm extern diameter: the welding arc is set between the extremity of this nozzle and the parts to weld. The distance between these two parts is maintained between 15 and 25 mm. For this study and to weld 50 mm deep narrow chamfer, we have developed our own contact tubes. Preliminary tests: melt runs on sheets First, we carried out our development tests with the MAG power alone. On these tests, we determine the MAG welding parameters to apply, to obtain welds without visual defects. We characterized, on each test, the width, the damping and the protection of the weld. In the second hand, we carried out these same tests with the laser beam (figure 2).
Figure 2: Hybrid welding tool
The fixed parameters were defined through earlier tasks in 2003 and 2004. These welds carried out on sheets, point out the following conclusions: - The most important penetration is obtained in the pull
direction (MAG wire in front); - Larger beads are obtained in the push direction (laser in
front). It should be noted that the push direction appears easier to manage because in this configuration, the wire goes directly into the melting pool created by the laser beam while in the pull direction, the wire creates the bath. For distances between the MAG torch and the laser beam less than 1.5 mm, we observe disturbances of the welding

- 56 - EFDA Technology / Vessel-In Vessel / Vessel-Blanket and Materials
pool. For a distance of 6 mm, we note that the interaction between the laser beam and the MAG wire is not significant: in this case, two distinct melting pools are observed. Concerning the MAG torch angle, the choice of 30° was conducted following the tests carried out in 2003 and 2004. In the 2003 and 2004 welding tests, the torch angle was 45°: in this configuration, we observed many spatters during welding. With an angle of 30°, these spatters disappear. Filling of 20 mm deep chamfers (figure 3)
Figure 3: Design of the 20 mm deep chamfers These welding tests are carried out in the flat welding position, with a single welding pass per layer. The welding parameters applied lead to a bead with no visual defects. We observe in the first tests carried out a longitudinal solidification crack. By modifying the welding speed and thus the melting pool’s volume, this crack disappears. The filling rate is 4.5 kg/h ; each pass has a height ranging between 2 and 3 mm. The first two grooves in depth 20 mm were used to develop the welding parameters. Only the last groove was filled completely on a half of the tube circumference; the other half was used for a partial filling in order to measure the melted zone by each welding pass (included side penetration). On these grooves, we carried out two transverse sections (3 µm polishing then an electrolytic attack with oxalic acid 10 % during one minute). Macrographs are showed on figure 4. We obtain a good welded geometry and no defects such as lack of fusion, fissure or porosity are revealed. We also observe a good reproducibility of each deposit pass: this reproducibility is characterized by the regularity in stacking the welding passes. Each welding pass height is about 2.5 mm and the side penetration approximately 300 µm. We note however that the geometry of each deposit looks like a nail: it is necessary to optimise the heat input to have a more “rounded” shape.
Figure 4: Deposits in 20 mm deep grooves Filling of 35 mm deep chamfers These welding tests are carried out in the flat welding position, with a single welding pass per layer, with 0,8 m/min welding speed. For the complete filling of the groove, 16 filling passes and 1 cosmetic pass are required. The pass thickness is about 2.5 mm as shown on figure 5. The welding arc is very stable and welds are very regular. Welds performed are sound, regular, without any lack of fusion or porosity.
Figure 5: Deposits in 35 mm deep grooves The complete filling of the 35 mm grooves assess the feasibility of hybrid welding on such grooves. For the demonstration of the laser energy contribution, we have performed filling tests with the MAG source alone (with the same MAG parameters than in hybrid YAG + MAG). From the third pass level, we have great difficulties to stabilize the welding arc. We observe that the welding arc wets in an irregular way the two edges of the chamfer (at the opposite to hybrid welding where the wetting of the pool is regular on each edge of the chamfer).

- 57 - EFDA Technology / Vessel-In Vessel / Vessel-Blanket and Materials
Due to operating difficulties, the filling has been stopped after ten welding passes. Cross sections are presented in figure 6: lack of fusion and porosities defects in the weld are observed. Mag process cannot achieve the quality in the filling passes of the hybrid process.
Figure 6: Deposits welds in 35 mm deep grooves in Narrow Gap MAG process
Filling of 50 mm deep chamfers Depth 50 mm, with one laser spot Welding tests in the 50 mm depth grooves are carried out on 316 L stainless steel tubes (figure 7). Lack of fusion defects are observed where unstable arc has been observed (related to bad gas protection). As for the grooves in 35 mm depth, the molten zone is regular. The feasibility of the filling of 50 mm depth grooves is thus demonstrated. Depth 50 mm, with two laser spots Measured weld penetration on each groove’s side in former tests is in the range of 300 to 400 µm. It is at least 2 times lower than those obtained in Narrow Gap TIG Welding (0.5 to 1 mm). To improve the weld side penetration, we carried out filling tests using a bispot 0.6/100 laser input (figure 8).
Figure 8: Hybrid deposits with 2 laser spots
Figure 7: Deposits in 50 mm deep grooves

- 58 - EFDA Technology / Vessel-In Vessel / Vessel-Blanket and Materials
More laser energy distribution is provided on the edges in the chamfer. The Nd YAG laser beam is divided into two spots, with a specific focusing optic of 300 mm focal length. In order to keep the same laser power density as in single spot welding stage, the bispot beam has been adapted: +15 mm instead of +20 mm for the single spot configuration. Thus, we obtain a 2.5 mm distance between the two spots. The MAG wire is set 2 to 3 mm behind the laser spots. All the other welding parameters are the same as those performed in single spot laser welding process. We carry out partial filling as well as complete filling passes. During welding, welding arc seems to be more stable than in a single spot. The melting pool wets quite well the chamfer’s edges. On cross sections, no welding defects are detected. The measured side penetration is quite not improved with this 0.6/100 bispot configuration (approximately 350 µm). This last point must be implemented. CONCLUSIONS
Welding tests performed concern hybrid YAG + MIG / MAG welding process to fill 20, 35 and 50 mm depth and 5.5 mm width grooves. Filling demonstration has been assessed for such grooves with the hybrid process, in the flat welding position. Sound welds have been realized with no welding defects. The deposit rate reached is about 4.5 kg/h. These results have been obtained by optimising the welding torch (contact tubes with a geometry adapted to the grooves and a ceramic protection) and in developing new gas protection devices (to fill in the groove). The measured side wall penetration is about 350 µm, less than the 0.5 to 1 mm for the Narrow Gap TIG Welding process. But the robustness and stiffness achieved make this process usefull to industrial applications. For hybrid YAG + MIG/MAG welding process certification for a potential application to ITER vacuum vessel welding, it is pointed out the following qualification route: - To optimise the laser energy input into the chamfer for
increasing side penetration a special video device will be installed to observe the molten pool during welding. These experiments can lead to on-line control process, available for ITER manufacturing.
- Gas protection system must be optimised to ITER vacuum vessel joint design.
- Any welding position (upward, downward and overhead directions) must be investigated.
- ITER maximum thickness (70 mm) welding must be achieved.
- Development of the root pass welding procedure will be achieved by adjustment of the filling pass process.
- Characterization of distortions induced by welding must be analysed.
- Characterization of welds with degradations of the nominal welding procedure (for example, errors in the positioning of the welding tool) must be performed ;
- Welded samples must be elaborated for NDT and destructive tests (tensile, impact tests, hardness characterization …).
REPORTS AND PUBLICATIONS
Technical report DTEN/UTIAC/2005/058. Further development of the hybrid MIG/laser welding technique for VV sector field joining – G. de Dinechin, F.Janin. TASK LEADER
Philippe AUBERT DRT/DTH CEA-Saclay F-91191 Gif-sur-Yvette Cedex Tel. : 33 1 69 08 17 87 Mobile : 33 6 08 53 36 41 Fax : 33 1 69 08 90 23 e-mail : [email protected]

- 59 - EFDA Technology / Vessel-In Vessel / Vessel-Blanket and Materials
TW4-TVV-OSWELD
Task Title: SIMULATION OF PHASED ARRAY TECHNIQUES FOR QUALIFICATION UT METHODS FOR ONE SIDED WELDS DURING VV MANUFACTURE
INTRODUCTION
In the framework of the ITER vacuum vessel inspection, studies were performed to investigate ultrasonic techniques which are relevant for this inspection [1]. New improved techniques were needed to enhance the whole inspection of the weld thickness in particular the recent tasks were related to the design of phased array probes using simulation and the experimental arrangement for most relevant configurations of the phased array probes. Techniques evaluated in these works show a great interest particularly for TIG weld inspection [2]. The techniques used consist in dynamical inspection methods based on angular scanning associated with beam focusing [3]. In the present work, the main goal is to evaluate the influence of the main parameters entering in the phased array method for the TIG weld inspection [4]. In particular, a parametric analysis is carried out using ultrasonic simulation software. This is achieved using the CIVA software for the simulation and experimental ultrasonic arrangement. 2005 ACTIVITIES
The main activity of this task during 2005 was the complementary validation of the simulation tools related to the experimental inspection [3] In particular, a parametric study using CIVA software was carried out of the main parameters concerning the phased array arrangement. PARAMETRIC STUDY Experimental tests presented in reference [3] show that phased array method is able to identify accurately and size defects contained in the TIG narrow gap samples. The parametric study aims to consider a large range of defects that may be expected in such a kind of welds, in particular, defects with different type of size, orientation and location are considered [4]. The parametric study is achieved using simulation by means of CIVA software. CIVA is software for NDT expertise, which is developed by the CEA. This software gathers simulation, processing and imaging tools in order to compare experimental and simulated data. In order to validate simulated results, the parameters related to the defects included in the mock-up (size, location, orientation) were configured and used in the software and results obtained are compared with experimental data [3] and [4] for inner surface breaking notches and embedded
defects. It should be noted that the structure of the weld was not simulated in the present approach. Parametric study
Inner surface breaking notches detection
The breaking surface flaws are inspected using the phased array technique in order to evaluate the sizing capabilities of this method. Simulations are carried out using the experimental configuration for one TIG mock-up in which flaws of 1, 2, 4 and 10 mm height are included. In this part, we are focusing on the comparison between experimental and simulated results, in particular regarding the capabilities of the method. Figure 1 show the simulation for 10 mm height inner surface breaking notch and it is compared with the experimental results.
Figure 1: Angular B-scans for a 10 mm high inner surface
breaking notch a) Experimental, (b) Simulated For all experimental and simulated ultrasonic amplitudes, the reference amplitude is that obtained from a reference bloc with a side-drilled hole of Ø2 mm and located at 56 mm depth using L45° longitudinal waves. Noise and echoes coming from the weld structure are not taken into account on the simulated configurations. Thus, the simulated B-scans present only partial U.T signals than those found in the actual experimental acquisitions. Echoes amplitude extracted from experimental and simulated angular B-scan for 10, 4 and 2 mm and 1mm surface breaking defects are hereafter presented in the table 1.
a b
25°
60°
TIG weld
Height of the defect
25°
60°
TIG weld
Height of the defect
10Corner echo
AngularBscan
60°
25°
Top diffraction
10Corner echo
AngularBscan
60°
25°
Top diffraction
Corner echo
Top diffraction
Mirror effect
AngularBscan
25°
60°
10Corner echo
Top diffraction
Mirror effect
AngularBscan
25°
60°
Corner echo
Top diffraction
Mirror effect
AngularBscan
25°
60°
1010Corner echo
AngularBscan
60°
25°
Top diffraction
10Corner echo
AngularBscan
60°
25°
Top diffraction
Corner echo
Top diffraction
Mirror effect
AngularBscan
25°
60°10Corner echo
Top diffraction
Mirror effect
AngularBscan
25°
60°
Corner echo
Top diffraction
Mirror effect
AngularBscan
25°
60°10

- 60 - EFDA Technology / Vessel-In Vessel / Vessel-Blanket and Materials
Table 1: Comparison between experimental and simulated amplitudes for breaking surface defects before the weld
Simulations confirm that the highest notches (10 mm, and 4 mm) are detected with amplitudes closed to experimental results. However, we note a difference of about 5dB in the case of the 2 mm high notch. It is partially due to the false calls of the mock-up, in particular the corner echo experimentally measured is surprisingly high. Concerning defects up to 2 mm high, results are relatively closed. However, corner echoes and tip diffraction can not be detected separately, in both cases the tip diffraction is not detected apart and a global signal is considered. Regarding the amplitude variation, we note that the corner echo amplitude decreases of about 6 dB when the defect size decreases from 1 to 10 mm
Inner surface breaking notches depth sizing
The aim of this paragraph is to analyse the accuracy of the method for flaw depth sizing. In fact, the inner surface breaking notches are sized by measuring the distance between the corner echo and the tip diffraction echo considering the maximum amplitude of the signal on the angular B-scans. Note that the accuracy in sizing defects depends on: 1.) The capability of this experimental arrangement to improve the signal noise rate; 2) the ability of the U.T technique to detect apart both signals (corner echo and tip diffraction) and 3) the waves length of the acoustic signal. Results of depth sizing defects extracted from experimental and simulated angular B-scan are presented in the table 2. Simulations confirm that only inner surface breaking notches greater than 1 mm can be sized. The accuracy of sizing defects according to the probe frequency could be estimated to ± 1.5 mm.
Table 2: Comparison between experimental and simulated depth sizing defects
Flaws location
Embedded notches detection
This part concerns the ability to detect embedded notches in the TIG weld mock-up. Experimentally, two embedded notches with 10 mm and 4 mm high were studied. One example of experimental and simulated results is presented in figure 2. It concerns one mid-wall flaw of 10 mm high embedded of 22 mm from the surface of the mock-up.
Figure 2: Angular B scans for a 10 mm high embedded notch (a) Experimental, (b) Simulated
The comparison between experimental and simulated results shows a good agreement. However, the experimental data shows additional echoes coming from the structure of the weld in the mock-ups. These additional signals are not present in simulated signal because the weld structure is not considered. The table 3 shows the comparison between experimental and simulated data for two mid-wall notches of 4 mm and 10 mm high.
Table 3: Comparison between experimental and simulated amplitudes for embedded defects
Experimental rate data
Simulated rate data
Notch Embedded
depth (mm)
Highest amplitude
/ Ø2 SDH (dB)
Highest amplitude
/ Ø2 SDH (dB) 22 mm -14 -17 10 mm
high 32mm -11 -16 4 mm high
38 mm -14 -16
The comparison between experimental and simulated data shows a good agreement acceptable with the experimental precision. For a more detailed analysis, figure 3 presents the variation of the amplitude for a 10 mm high embedded notch in function of the embedded depth. In particular, it is noted from this figure that the corner echoes is the main signal into the first 5 mm of the embedded depth. The tip
Experimental rate values
Simulation rate data
Inner surface breaking notches
Highest amplitude / Ø2 SDH (dB)
Highest amplitude / Ø2 SDH (dB)
10 mm high -3 -4 4 mm high -4 -6 2 mm high -2 -7 1 mm high -9 -8
Inner surface
breaking notches Experimental
Measured height (mm)
Simulated Measured height
(mm)
10 mm high 11 10 4 mm high 5 4 2 mm high 3 3
1 mm high - -
a b
25°
60°
TIG weld
Height of the defect
25°
60°
TIG weld
Height of the defect
10
AngularBscan
25°
60°bottomdiffraction
top diffraction
mirroreffect
Conversion mode on notch
2210
AngularBscanAngularBscan
25°
60°bottomdiffraction
top diffraction
mirroreffect
Conversion mode on notch
22
1022
AngularBscan
25°
60°
bottomdiffraction
top diffraction
Root weld echo
Bottomdiffraction
mirror effect
1022
AngularBscan
25°
60°
bottomdiffraction
top diffraction
Root weld echo
Bottomdiffraction
mirror effectAngularBscan
25°
60°
bottomdiffraction
top diffraction
Root weld echo
Bottomdiffraction
mirror effect

- 61 - EFDA Technology / Vessel-In Vessel / Vessel-Blanket and Materials
diffraction is the only contribution for highest values and it is almost constant. This is physical expected result taking into account the interaction between the acoustic waves and the embedded defects. Furthermore, taking into account that the structure of the weld is not considered in this simulation, the difference of both signals, called before and through the weld in figure 3, is due to the difference of beam angle. The flaw called before the weld is detected with 32°L-waves and the through the weld is detected with 45°.
Highest amplitude vs Embedded depth
-20
-18
-16
-14
-12
-10
-8
-6
-4
-2
0252729313335373941434547
Embedded depth (mm)
Am
ax (
dB)
Figure 3: Variation of highest amplitude in function of the embedded depth for a 10 high notch. The inner surface
breaking is located at 47 mm in this mock-up. Defect orientation effects This part deals with the influence of the defects orientation related to the sensitivity to detect them. Two types of angle were taken into account in the simulation: 1) the tilt angle varying between -10° to +10 related to the weld axis and 2) the skew angle which is varying between 0 to +10 related to the plane of joint. Tilt angle variation Detection results are indicated in the table 4. The measured amplitude represents the maximum of the corner echoes. The results show the trend of this variation for the angles varying between -10° and 10°.
Table 4: Simulated results for different tilt angles from -10° to 10° for a 10 mm high surface breaking notch
Highest
amplitude /Ø2 SDH (dB)
Highest amplitude /
Ø2 SDH (dB)
Tilt angle variation for a 10mm high surface breaking notch (°)
Before the weld
Through the weld
-10 -4 -3 -8 -4 -2 -6 -3 -2
-4 -3 -2 -2 -3 -2 0 -4 -2
2 -4 -3 4 -4 -4 6 -5 -5 8 -6 -6 10 -7 -8
Skew angle variation Effects of skew angle when it is varying between 0° and 10° (around the plan of the fusion line) have been evaluated. The table 5 presents the corner echo amplitude for both signals before and through the weld.
Table 5: Results of simulation for different skew angles from 0° to 10° for a 10 mm high surface
Highest
amplitude / Ø2 SDH (dB)
Highest amplitude /
Ø2 SDH (dB)
Skew angle variation for a 10mm high
surface breaking notch (°)
Before the weld Through the weld
0 -4
-3
2 -6 -4
4 -8 -7
6 -12 -12
8 -16 -19
10 -20 -22
CONCLUSIONS
Previous experimental had shown that phased array technique allows detecting and sizing embedded and surface breaking notches in TIG narrow gap welds. In order to evaluate the parameters such as sensitivity, range and limits of detection for phased array method used for welds inspection, parametric study is carried out using CIVA tool. In this approach the structure of the weld is not taking into account. The sensitivity and limits of the inspection using a phased array method is analysed by a parametric study. Thus, considering a range of defects varying in terms of location, size and orientation, several observations could be made: - The location and size of the notch has an important
influence on the detection amplitude. Nevertheless, both location and sizing is possible with a good accuracy for defects greater than 1mm in all of the area analysed.
- Apart from the improved flexibility and adaptability to
perform different UT techniques, phased arrays method with continuous scanning angles provides a way to overcome limited access such as 80 mm between joints welds thanks to beam-steering.
- The detection amplitude is very sensible to the skew
angle variation. A variation of 15 dB between 0° and 10° is indeed noted in case of a 10 mm high inner surface breaking notch.
- The actual experimental configuration where the
scanning angle is varying between 25° and 60° is able to inspect the depth weld beyond 20 mm. The angular
25°
60°
TIG weld
Embedded depth
10mm
Zone 1
25°
60°
TIG weld
Embedded depth
10mm
Zone 1
Before the weld
Through the weld

- 62 - EFDA Technology / Vessel-In Vessel / Vessel-Blanket and Materials
scan was extended up to 70° in order to enhance the analysis in this area, however, some small changes in the wedge angle could be adapted to analyse the first 20 mm in depth.
REPORTS AND PUBLICATIONS
[1] Development of ultrasonic non destructive testing
method for the vessel inter-sector weld of ITER: development of dynamic phased array techniques», SISC/03-RT0096/Rev. 0, september 2003.
[2] Development of ultrasonic non destructive testing
method for the vessel inter-sector weld of ITER: simulation of welding process», DECS/SISC/LMUS/02-RT0052, july 2002.
[3] Development of phased array techniques for the
inspection of one sided welds in ITER vacuum vessel», SYSSC/04-RT0143/Rev. 0, september 2004.
[4] Simulation of phased array technique for qualification
of UT methods for one sided welds during VV manufacture. SYSSC/05 RT0167/Rev. 0, october 2005
TASK LEADER
Jorge TIRIRA DRT/DETECS/SYSSC/LMC CEA-Saclay F-91191 Gif-sur-Yvette Cedex Tel. : 33 1 69 08 40 02 Fax : 33 1 69 08 75 97 e-mail : [email protected]

- 63 - EFDA Technology / Vessel-In Vessel / Vessel-Blanket and Materials
TW5-TVM-BRAZE
Task Title: MANUFACTURE AND CHARACTERIZATION OF SILVER FREE BRAZE MATERIAL
INTRODUCTION
The objectives of this task in 2005 were to manufacture and characterize Cu-based braze alloys foils suitable for Be/CuCrZr induction brazing. The idea was to try to avoid the problems encountered with STEMET 1108 ribbons from MIFI-AMETO and identified by EFDA, such as variations of compositions among supplied batches, ageing and too high liquidus temperature. For this purpose, CEA proposed to work in collaboration with CNRS-CRETA to elaborate and characterize two existing compositions, Cu-13wt.%Sn-2wt.%Ni-6wt.%In (=STEMET 1108) and Cu-30wt.%Sn-9wt.%Mn-1 wt.%Ti (proposed by Peacock and al. [1]). The specifications for the new alloys were the following: forbidden elements are Ag, Au, B, Cd, Hg, Pb, Zn; brazing temperature should be close to 700°C; solidus not too far from 700°C; (Tliq-Tsol) as small as possible; ribbons should be 25mm wide and 50µm +/-5 thick; they should contain no holes and no cracks; they should be amorphous or micro-crystallized. And finally, they should be easy to manipulate and as ductile as possible. 2005 ACTIVITIES
CHARACTERIZATION OF STEMET 1108 RIBBONS Several batches of STEMET 1108 ribbons from MIFI-AMETO were available for characterization: three available at CEA (n°1, n°2 and n°3290) and six supplied by FRAMATOME (n°3287, n°3288, n°3289, n°3294, n°3297 and ATM). Characterizations performed at CRETA were: - X-ray diffraction analysis at Cu wavelength (λ=1.5418Å): the first objective was to determine whether the ribbons were amorphous or micro-crystallized.
All the results were analysed with the EVA software and SOCABIM database which group the ICSD and ICDD bases. Results of researches are given in table 1. Detected phases are not pure Cu or Cu4Sn but derive from these phases. - Differential Scanning Calorimetry (DSC): analyses were performed on a Netzsch DSC 404S device under argon sweeping after an initial primary vacuum. Samples were placed in alumina crucibles. All analyses were performed between 25°C and 800°C with a heating rate of 10°C/min. Data were analysed with ANALYSE software from Netzsch. Transformation temperatures, giving information on melting range, crystallisation peaks, solidus and liquidus temperatures, both during heating and cooling of the alloy, are reported in table 1. - Scanning Electron Microscopy (SEM) using Energy Dispersive X-ray (EDX) analysis: compositions of all the samples were measured using standards, which leads to results reliable at 1% for the main elements and at 0.5% for elements in small amount. All the results are given in table 1. The following characterizations were performed at CEA on several of these alloys: - Verification of announced compositions through chemical analyses by Induction Coupled Plasma-Atomic Emission Spectroscopy (ICP-AES), - Visual observations (width, thickness, colour, roughness, oxidation, holes, ductile/brittle), - X-ray Photoelectron Spectroscopy (XPS) analysis to evaluate species present on surface of ribbons, - Vickers hardness, - Optical Microscopy (OM): shape of ribbon, thickness, - Field Emission Gun (FEG)-SEM: microstructures, crystallite sizes. All STEMET 1108 alloys are micro-crystallized; the main phase is cubic derived from copper. Other phases are Cu10Sn3 et Cu4Sn (minor) (figure 1 and table 1). No evidence of amorphisation could be detected.
Table 1: Characterization of STEMET 1108 alloys performed at CRETA
X-Ray: detected phases DSC analyses SEM (mean wt.%) Brittleness
Cu Cu4Sn Cu10Sn3
Transformations T(°C) upon heating
Transformations T(°C) upon cooling Cu Sn In Ni P
ATM * * 535 612 683 728 506 600 659 725 78,79 11,1 7,73 1,98 0,39 No
N°3287 * * 532 599 720 504 591 645 721 No
N°3288 * * 539 627 736 508 606 669 720 80,33 11,0 7 5,86 2,31 0,41 No
N°3289 * * 538 605 679 725 No
N°3294 * * No
N°3297 * * 535 607 681 718 505 596 658 724 79,46 1 1,98 6,26 1,71 0,7 No
N°1 * * 533 651 701 740 504 642 683 739 No

- 64 - EFDA Technology / Vessel-In Vessel / Vessel-Blanket and Materials
Stemet 1- côté mat
0
5000
10000
15000
20000
25000
20 25 30 35 40 45 50 55 60 65 70 75 80
Angle
Cou
ps
Cu10Sn3
Cu (Sn,In)
Figure 1: X-ray diffraction diagram of STEMET 1108 n°1
alloy On DSC curve (figure 2), first transformation (endothermic peak of fusion) is on average located between 525 and 540°C, and last one between 718 and 740°C upon heating (table 1). During cooling, first transformation is on average located between 500 and 508°C, and last one between 715 and 739°C. First transformations are generally irreversible as transformations observed during cooling are different. On the other hand, a second heating gives transformations at constant temperatures. Thus, several of these transformations correspond to metastable phases. Among the nine alloys tested, only STEMET1108 n°1 possesses transformation temperatures upon heating close to the one indicate in [2].According to chemical analysis, all the samples contain at least 78 to 80 wt.% Cu.
Stemet 1108 n°1
0,00E+00
2,00E-02
4,00E-02
6,00E-02
8,00E-02
1,00E-01
1,20E-01
1,40E-01
1,60E-01
1,80E-01
2,00E-01
0 100 200 300 400 500 600 700 800 900
Temp /°C
DS
C /u
V/m
g
533
651
701 740
504642
683
739
Figure 2: DSC curve of STEMET 1108 n°1 alloy
MAIN CONCLUSIONS ON STEMET 1108 RIBBONS ARE THE FOLLOWING: - Compositions of three batches were chemically analysed; differences with theoretical compositions are within 0.5 wt%; 200 ppm Cr and 130 ppm Fe were found on batch N°3290. Oxygen content is lower than 50 ppm. - Mean thicknesses of ribbons, measured using a Palmer calliper, are between 45 and 80 µm.
- Visual observations indicate that ribbons are smooth on wheel face and rough on exterior face. Batch N°3288 looks oxidized. The number of holes varies from one batch to the other. Batch N°3297 is highly ductile. Ribbons width is between 17 and 20 mm. - According to X-ray analyses, all alloys are micro-crystallized; two different series can be distinguished: batches N°3288 and 3290 are similar and do not contain Cu10Sn3; batches N°1, 2, 3287, 3289, 3294, 3297 and ATM are similar. - DSC analyses indicate four crystallisation peaks for all batches; first transformation temperature (called TS) and liquidus (called TL) are similar, respectively, around 504-508°C and 715-739°C. - Vickers hardness varies from 238 HV (batch N°3297) to 304 HV (batch ATM). - Optical microscopy observations indicate that shape of ribbon is not regular; thickness varies both along its width and its length. - FEG-SEM: microstructures differences were noticed on the same ribbon depending on its thickness and whether the observed area was in contact with the wheel or not (solidification effect due to different thermal gradients); crystallite sizes are lower than 1µm. - XPS analyses, performed on surfaces of two batches, indicate an oxide layer, which thickness is lower than 5 nm. Before abrasion, CuO, Cu2O and In2O3 are detected among others species. In2O3 is even detected after a 120Å abrasion. This oxide possesses a very high melting point (1910°C) according to thermodynamic data [3]. Looking at STEMET ATM, 3287, 3289 & 3294 ribbons (compositions very close, same X-Ray spectra, very close TS and TL), we notice that they are very different (some present holes, others no; one is partially oxidized). It is clear that their quenching conditions were different. OTHER ALLOYS AS AN ALTERNATIVE TO STEMET 1108 Elaboration All the alloys were produced by melt-spinning using a copper wheel of 200 mm in diameter. Ejection pressure was kept constant at 300 mbar (=30 kPa) during the ejection; argon (H2O < 3 ppm; O2 < 2 ppm) was used for ejection. Nozzle made of cordierite has a slot of 0,4x7 mm². System studied was Cu-Sn-In-Ni-Mn; the different alloys produced, called BRAMn, are given in table 2. Copper amount is between 60 and 80 wt%., tin is between 6 and 30 wt% and manganese between 2 and 9 wt%. Titanium addition is quite impossible (BRAMn 1_2) due either to excessive oxidation or reaction with ejection nozzle. Ribbons thicknesses are between 60 and 90 µm.

- 65 - EFDA Technology / Vessel-In Vessel / Vessel-Blanket and Materials
Table 2: Characterization of BRAMn alloys performed at CRETA
CHARACTERIZATIONS All the BRAMn alloys are microcrystallized. X-ray analyses show that copper is not always the main phase ; manganese based compounds are present, and, in this case, first transformations temperatures are lower, between 475°C and 520°C (table 2). Those phases are also metastable and transformation temperatures upon cooling are different. Depending on the alloys, first transformation temperatures are observed at very low temperatures (244-315°C). Nevertheless, transformation temperatures after heating stay between 467°C and 559°C for the lowest, and between 714 and 788°C for the highest. Addition of Ni and In and reduction of Mn content allow to obtain good ribbons; however, liquidus temperature is around 780°C (BRAMn3 and BRAMn4). An increase of % Sn and % In to BRAMn3 allows to decrease liquidus from 780°C to 714°C (BRAMn 7) or 750°C (BRAMn8); however, those alloys become brittle. From a mechanical point of view, only the phases which contain more than 70 wt% of copper can be easy manipulated; the other ones are brittle. Among the elaborated alloys, BRAMn 15_3 and BRAMn16 are the most interesting to move to an elaboration of wider ribbons, because they can be easily manipulated and their last transformation temperature is close to 700°C (747°C and 734°C respectively).
CONCLUSIONS
STEMET 1108 ribbons were characterized using optical microscopy, X-ray analyses, FEG-SEM and DSC: ribbons thicknesses are not very regular; they are not amorphous but micro-crystallized; two different phases are observed but are too small to be precisely analyzed by EDX. Liquidus-solidus interval is between 500 and 735°C. In the CuSnMn system, BRAMn15_3 and BRAMn16 are “ductile” ribbons having liquidus temperatures as low as 735-745°C. In 2006, these alloys are planned to be tested in Be/CuCrZr brazing configuration. REFERENCES
[1] A.T. Peacock and al. – Development of silver-free
bonding techniques and an investigation of the effect of cadmium in brazed joints made with silver based brazing alloys – Fusion Technology, p.415-418 – 1996
[2] B.A. Kalin and al. - Application of amorphous and
microcrystalline filler metals for brazing of beryllium with metals – J. Nuclear Materials 233-237, p.945-948 – 1996
[3] T.B. Massalski – Binary Alloy Phase Diagrams, Vol.
3, ASM International, Second Edition – 1990
Preparation X-Ray phases DSC analyses SEM (mean wt.%) Initial Formula (wt.%) Sample name Speed
(rev/min) Dist. (mm)
Th. (µm)
Cu Mn(Cu) Cu4Sn Sn InMn3 Cu3Ge Transformations
T(°C) upon heating Transformations
T(°C) upon cooling Cu Sn In Ni Mn Ti Ge Cu Sn In Ni Mn Ti Ge
Brittleness
BRAMn1_2 1800 0,8 30 * * 255 525 742 576 725 61,69 29,82 8,31 0,18 60 30 9 1 Yes
BRAMn2 1800 0,8 35 * * * 244 525 574 726 61,68 30,26 8,06 61 30 9 Yes
BRAMn3 1800 0,8 88 * 472 639 791 525 782 75,85 17,08 3,39 1,02 2,66 75 18 3 1 3 No
BRAMn4 1800 0,8 50 * * * 313 712 782 528 779 73,93 15,19 5,33 1,08 4,47 73 16 5 1 5 No
BRAMN5 1800 0,8 67 * * * 454 543 740 519 728 800 69,26 23,56 1,42 2,54 3,23 70 23 1 3 3 No
BRAMN62 1800 0,8 58 * * 465 548 768 521 774 63,91 28,98 1,33 2,56 3,22 65 28 1 3 3 Yes
BRAMN7 1800 0,8 - * 529 578 720 518 542 714 58,12 16,73 21,35 0,58 3,22 60 16 20 1 3 Yes
BRAMN8 1800 0,8 64 * * * 499 553 730 528 750 63,58 16,47 16,32 0,51 3,12 65 16 15 1 3 Yes
BRAMN9 1800 0,8 52 * * * 542 718 559 587 715 58,53 25,29 13 3,19 60 25 12 3 Yes
BRAMN10 1800 0,8 45 * * * 522 558 717 510 547 566 714 56,73 21,25 18,97 3,05 60 20 17 3 Yes
BRAMN11 1800 0,8 58 * * 485 630 785 515 788 69,92 21,66 3,81 1,32 3,3 70 23 3 1 3 No
BRAMN12 1800 0,8 50 * * * 483 542 575 766 489 752 64,67 26,96 4,01 1,28 3,09 65 28 3 1 3 Yes
BRAMN13 1800 0,8 95 * 764 544 764 81,74 9,58 3,77 2,01 2,9 80 11 4 2 3 No
BRAMN14 1800 0,8 drop 80 8 7 2 3
BRAMN15_3 1800 0,8 75 * * * 519 607 635 757 467 747 76,83 9,89 8,25 2,03 3,01 76 11 8 2 3 No
BRAMN16 1800 0,8 60 * * * 508 622 742 734 76,37 7,27 11,66 1,82 2,88 76 8 11 2 3 No
BRAMN17 1800 0,8 85 * * * * 502 620 765 533 612 762 77,14 8,53 6 1,63 6,71 76 10 6 2 6 Yes
BRAMN18 1800 0,8 100 * * * * 474 615 738 77,25 4,74 9,39 1,67 6,95 76 6 10 2 6 Yes

- 66 - EFDA Technology / Vessel-In Vessel / Vessel-Blanket and Materials
REPORTS AND PUBLICATIONS
‘TW5-TVM-BRAZE: Manufacture and characterization of silver free braze material’, Interim Report, Technical Report DTEN/DR/2005/073, January 2006. TASK LEADER
Thierry BAFFIE DRT/DTH/LTH CEA-Grenoble 17, rue des Martyrs F-38054 Grenoble Cedex 9 Tel. : 33 4 38 78 93 79 Fax : 33 4 38 78 54 79 e-mail : [email protected]

- 67 - EFDA Technology / Vessel-In Vessel / Vessel-Blanket and Materials
TW5-TVM-COMADA
Task Title: INVESTIGATION OF THE EFFECT OF CREEP-FA TIGUE INTERACTION ON THE MECHANICAL PERFORMANCE AND LIFETIME OF CuCrZr
INTRODUCTION
The task deals with creep-fatigue behaviour of CuCrZr. Some data from the literature show that the linear damage cumulative law is not respected at all for CuCrZr material. This task will lead to an analysis on how fatigue and creep damage combine in terms of cycle to failure for the un-irradiated CuCrZr under manufacturing conditions of first wall panels, i.e. with large grain size and over-ageing. In the meantime, as another novel batch of CuCrZr is used in this study, it will be re-qualified by tensile tests and CuCrZr/316LN junctions will be fabricated in order to be tested by CT experiments. This will permit as well to investigate the possible novel B3 route used to manufacture first wall panels. We recall the different manufacturing routes: Route B1 consists in: - a HIP cycle at 1040°C during 2 hours - a solutionning heat cycle at 980°C with a controlled cooling rate around 60°C/min - an ageing heat cycle at 580°C during 2 hours Route B2 consists in: - a HIP cycle at 1040°C during 2 hours - a solutionning heat cycle at 980°C with a controlled
cooling rate around 60°C/min - an ageing heat cycle at 460°C during 2 hours Route B3 consists in: - a HIP cycle at 1040°C during 2 hours - a solutionning heat cycle at 1040°C with a controlled
cooling rate around 60°C/min - an ageing heat cycle at 580°C during 2 hours To achieve the goals of this task, five different tests procedures are necessary: 1) Isothermal strain controlled fatigue R= -1 2) Relaxation tests 3) Isothermal Creep-fatigue tests 4) Constant load creep tests 5) Constant stress creep tests In this report, the first results on LCF experiments on CuCrZr fabricated with route B1 and B2 are presented. The
LCF results on CuCrZr/316LN junctions made with the same fabrication route are also shown. Finally, the CT results from samples extracted from blocks made concomitantly to mock-ups PH/S-8F (route B1) and PH/S-9F (route B3) are given. 2005 ACTIVITIES
FRACTURE TOUGHNESS RESULTS Compact test experiments have been done to test CuCrZr/316LN junctions made following manufacturing routes B1 and B3. The fracture toughness tests on CT samples were done according to the ASTM standard E1820 as far as possible. In fact, none of ASTM standard applies to bi-material samples. Moreover, the confined plasticity hypothesis is far from being fulfilled, thus the measure of J is affected. Sample width is W=20 mm. The pre-crack target was a=4 mm, i.e. 24 mm from load line displacement, it is done at 30 Hz with R=0.1 aiming at 17 MPa.m0.5. Once pre-cracks were done, side grooves were machined to ensure a nice straight crack front. For bi-material samples, it helps as well in keeping the crack near the joint. During propagation test, the ligament size was measured by the compliance method, with 25% loading unloading every 0.2 mm of load line displacement with a crack propagation hold time of 15 s at 400 N/s rate. Displacement rate was 0.15 mm/min. All tests were conducted at 20°C. The Crack Opening Displacement (COD) was measured by an extensometer on the load line. All the crack fronts were quite straight (valid in terms of ASTM or French standard). For measuring the crack propagation ∆a, the compliance method has been used, but the formulae has been established on mono-material samples. In our bi-material sample case, we use the average Young modulus of the two materials. It has been checked that the calculated propagation ∆a is in acceptable agreement with the directly measured ∆a. At first sight, the aspects of the fracture surfaces are roughly the same between B1 and B3. As already observed, the fatigue-crack propagates towards CuCrZr for route B1, but for route B3, the fatigue pre-crack propagates very close to the joint. A scheme of this is presented on figure 1. Then, when loading to perform the fracture toughness test, for route B1, the crack tip starts to blunt and then it propagates, forming a blunting riff (figure 1). Apparently, when the crack propagates, it gets closer to the joint, but for some samples large pieces of copper remained on 316LN for route B1. For route B3, the blunting riff does not appear, after pre-crack, the

- 68 - EFDA Technology / Vessel-In Vessel / Vessel-Blanket and Materials
propagation is immediately following the joint. There seems to be more copper left on 316LN than during the pre-cracking step. For some of the propagated surfaces, the 316LN is fairly visible for both B1 and B3 routes. This was not observed to that extend previously. Figure 2 shows the load-displacement curves of the 5 CT samples for each route B1 and B3. This graph corresponds to a normalized force (P.W/(Bn(W-a0)2)) versus normalized COD (COD/W) where a0 is the initial notch length measured from load line, W is the width of the sample measured from load line, Bn is net thickness taking account the side grooves. The force level reached by the two set of samples from route B1 and B3 is the same, but the COD at failure for route B3 is quite lower than for route B1. Figure 3 shows the J-∆a curves. This confirms that B3 route gives lower properties in terms of fracture toughness. The critical J value is quite lower for route B3, around 110 kJ/m², but it is difficult to give a clear value of a critical J for route B1.
blunting riff
316LN
B1
fatig
ue p
recr
ack
test
cra
ck
final
ope
ning
316LN
B3
fatig
ue p
recr
ack
test
cra
ck
final
ope
ning
Figure 1: Schematic failure mode during fracture
toughness on bi-material CuCrZr/316LN samples. The profile of 316LN side of the CT sample is drawn.
40
50
60
70
80
90
100
110
120
130
140
150
0 0.05 0.1 0.15 0.2 0.25
Nor
mal
ized
For
ce
Normalized COD
B31040°C solutionning
B1980°C solutionning
Figure 2: CT load curves
0
100
200
300
400
500
600
700
-0.5 0 0.5 1 1.5 2 2.5 3 3.5 4 4.5 5
J (k
J/m
2)
delta_a (mm)
B31040°C solutionning
B1980°C solutionning
Figure 3: CT J-∆a curves
LCF RESULTS Some of the low cycle fatigue tests of the test matrix have been performed. The tests are carried out at 300°C under vacuum. The results given here are coming from samples fabricated following routes B1 and B2. Let note that there is an experimental difficulty with bi-material samples for controlling the deformation with the extensometer. The extensometer was adjusted symmetrically on both sides of the joint, so the measured strain is the sum of the strain in 316LN and in CuCrZr. It is thus very difficult to know precisely how much the CuCrZr and the 316LN deform; this depends on the strength of the material and how much the hardening is. We will present the results on the same graph as for mono-material with corresponding ∆ε for this report, but in the future, we will try to propose a more meaningful method, taking into account the material behaviour.

- 69 - EFDA Technology / Vessel-In Vessel / Vessel-Blanket and Materials
CYCLE TO FAILURE ANALYSIS
Figure 4 shows the results in a ∆ε-N graph where N is the number of cycles at failure. When observing this graph, it is quite difficult to conclude, knowing the discrepancy of the results. At least we can try to draw some conclusions:
- there is no differences between B1 and B2 routes
- there is practically no differences between mono-material samples and bi-material samples, although, for low ∆ε=±0,2%, it seems that bi-material samples have a shorter life, but let recall that the measure of ∆ε for bi-materials is not correct.
FAILURE LOCATION FOR BI-MATERIAL SAMPLES
Generally, for both mono-material and bi-material samples, the rupture occurred through one main crack. It is interesting to note that the bi-material samples have broken from the triple point of the joint (where the joint comes at the surface of the sample), which is quite comprehensible (see figure 5). Then, the crack goes through the CuCrZr bulk material through what seems to be intra and inter granular failure.
0
0,1
0,2
0,3
0,4
0,5
0,6
1 000 10 000 100 000 1 000 000
N
1/2
∆ε
∆ε
∆ε∆ε
(%)
mono B1
mono B2
bi mat B1
bi mat B2
Figure 4: Cycles to rupture of LCF experiments on CuCrZr
and CuCrZr/316LN junctions at 300°C
Figure 5: Failure location on LCF bi-material samples
CONCLUSIONS This study will continue during year 2006. The first results have shown that: 1/ CT experiments have revealed that the toughness of junctions made from route B1 (solutionning at 980°C) seems higher than that of junctions made from route B3 (solutionning at 1040°C). The explanation may come from the fact that for route B3, the Precipitate Free Layer near the joint seems larger than for route B1. This should be confirmed by a more thorough investigation of the surroundings of the joints. 2/ Cycles to failure for LCF tests on mono-materials and bi-materials samples (with CuCrZr/316LN junctions) are the same. We have not detected a particular decrease in life-time. REPORTS AND PUBLICATIONS O. Gillia, I. Chu, J.-M. Leibold, P. Lemoine, F. Vidotto, Intermediate Report, Rapport Technique DTH/DL/2006/019, march 2006 TASK LEADER Olivier Gillia DRT/DTH/LTH CEA-Grenoble 17, rue des Martyrs F-38054 Grenoble Cedex 9 Tel. : 33 4 38 78 62 07 Fax : 33 4 38 78 58 91 e-mail : [email protected]

- 70 - EFDA Technology / Vessel-In Vessel / Vessel-Blanket and Materials

- 71 - EFDA Technology / Vessel-In Vessel / Vessel-Blanket and Materials
TW5-TVV-MPUT
Task Title: QUALIFICATION OF UT METHODS FOR ONE SI DED WELDS DURING VV MANUFACTURE – WELD STRUCTURE
INTRODUCTION
In the context of the ITER vacuum vessel inspection, studies were performed to investigate ultrasonic techniques which are relevant for this inspection [1]. New improved techniques were required to get better the whole inspection of the weld thickness. In particular, the recent tasks were related to the design of phased array probes using simulation and the experimental arrangement for most relevant configurations of the phased array probes. Techniques evaluated in these works show a great applicability particularly for TIG joint weld inspection [2]. The techniques used consist in dynamical inspection methods based on angular scanning associated with beam focusing [3] and [4]. The objective of this task is to analyse the effect of the TIG joint weld structure related to the UT inspection using phased array techniques. Special effort is paid to analyse the role of both the root joint weld geometry and the signal sound attenuation through the weld when flaws are inspected. 2005 ACTIVITIES
The main activities during 2005 were the following: - The mock-ups design and inspection in order to
optimize UT phased array technique taking into account the structure of the weld.
- The simulation of effects related to the structure of the weld.
MOCK-UP PREPARATION In order to have a better analysis of the UT technique performances taking into account the weld structure of the joint new developments must be carried out. In particular, it is important to evaluate the influence of the weld parameters entering in the phased array method for TIG weld inspection. Thus, the objective is to perform experimental test on appropriate mock-ups to evaluate the attenuation and the level of noise that characterize the weld. In this context, two mock-ups are used, 1) one existing TIG mock-up [3] in which is included the new flaws and 2) a new mock-up was designed to study the geometry of the bead joint of weld. Figure 1 presents the TIG narrow gap mock-up witch was already described in reference [3]. In particular, this mock-up has both the breaking surfaces defects and the embedded flaws.
Figure 1: Mock-up including flaws to analyse the weld structure
In this mock-up are included for the present study two new flaws which are used to perform test related to the weld structure. These two breaking surface (10 mm high and 20 mm wide) flaws are included outside of the joint weld. Figure 2 presents a picture of the mock-up which was prepared to analyse the role of the weld root geometry in the UT inspection performance. In this new mock-ups was included a manufactured bead to simulate the longitudinal deposit of weld metal produced by a fusion-welding process and two breaking surface defects of 3 mm high and 20 mm wide.
Figure 2: Manufactured mock-up for analysing the influence of the root weld geometry
TIG Weld inspection Recall of description of the inspection technique [1], [2], [3]. The inspection technique consists in an angular scan associated with a focusing along a constant radius of curvature. Two linear phased arrays are configured as a
+ 3
218 10
15
Three new flaws
515
500 217
10 15
80
2580
80
28A
B
I
D C
3 mm 5 mm 5 mm
Breaking surface flaw Simulated bead of the root weld geometry

- 72 - EFDA Technology / Vessel-In Vessel / Vessel-Blanket and Materials
dual-element transducer. Delay laws are calculated to generate longitudinal waves from 25° to 60° focused along a 75 mm radius of curvature. Low signal to noise ratio obtained with previous transducers (2 MHz in pulse echo mode) lead to define a specific transducer for the TIG weld inspection. This probe is composed of two linear arrays of 32 elements (1.2x20 mm² for each element) with a 2 MHz frequency. Dual element configuration is efficient to reduce back-scattering noise in coarse-grained material as in TIG weld. The probe wedge allows to naturally generate 45° longitudinal waves focused at 60 mm depth.
Figure 3: Illustration of the TIG weld inspection CIVA Simulation - Attenuation of sound by the weld structure The attenuation is essentially due to the dispersion of the sound by the grain structure of the matter. In the present study the goal is not to analyse the crystallographic grain distribution of the weld structure since each welded mock-up could be structured different and further the final welding process for ITER is not completely defined. Nevertheless our objective is to analyse in global terms the role of the weld structure in the inspection of flaws. In this context, in a first approach for the simulation is carried out for a homogenous and isotropic joint weld and considering only one attenuation coefficient (α) for the whole weld joint. This means that for the simulation an average orientation of grains in the structure of the weld is considered. In order to show the ability of CIVA software to simulate the attenuation of the sound, the simulation is carried out in order to calculate the α attenuation coefficient for a sound attenuation of 3 dB. Figure 4 presents the simulation taking into account the attenuation of sound trough the weld. In particular, for a coefficient α=0.08dB/mm the simulation shows an attenuation of 3 dB.
α1=0 dB/mm
Aα1/Aα2=3 dB
α2=0.08dB/mm
58 mm
47mmTip diffraction
Through the weld
Corner Echo
UT beam
40 mm
Corner Echo
α1=0 dB/mm
Aα1/Aα2=3 dB
α2=0.08dB/mm
58 mm
47mmTip diffraction
Through the weld
Corner Echo
UT beam
40 mm
Corner Echo
Figure 4: Inner breaking notch inspection before the weld taking into account the attenuation of sound
a) α=0 without attennation b) α=0.08 dB/mm
Experimental Results The weld structure is analysed in terms of the dispersion of both the sound through the weld area and the role of the geometry in the area of the root weld. Attenuation of the sound due to the weld structure Experimental results In order to analyse the signal noise ratio due to the dispersion of the sound through the weld an inner breaking surface notch 10 mm high is inspected as shown in figure 5.
Figure 5: Inner breaking notch experimental inspection before the weld and through the weld
For all experimental and simulated ultrasonic amplitudes, the reference amplitude is that obtained from a reference bloc with a side-drilled hole of Ø2 mm and located at 56 mm depth using L45° longitudinal waves. Table 1 presents the amplitude ratio for the notch inspection considering the sound before and through the weld. In particular, the amplitude of the corner echo
25°
60°
Focal points
wedge
TIG weld
40 mm
47mm
58mm
60°
Tip diffraction
77 mm
Through the weldBefore the weld
25°
Corner echo
58 mm
Tip diffraction
Corner echo
40 mm
47mm
58mm
60°
Tip diffraction
77 mm
Through the weldBefore the weld
25°
Corner echo
58 mm
Tip diffractionTip diffraction
Corner echo
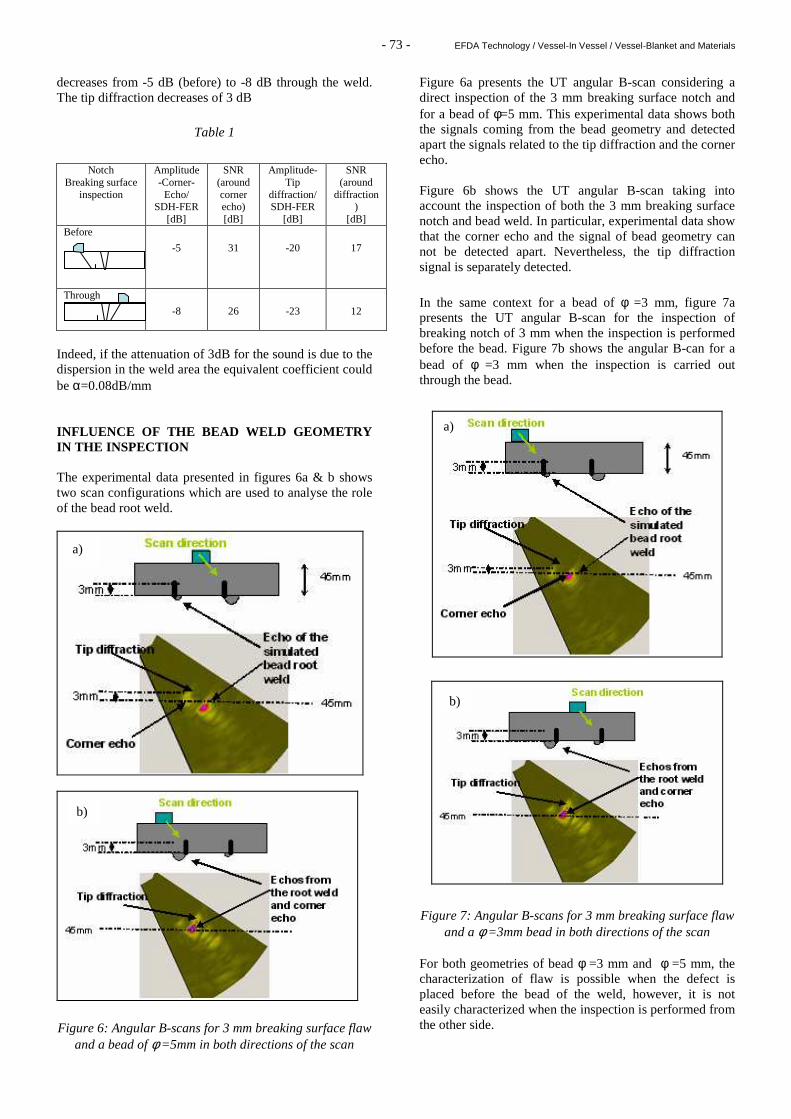
- 73 - EFDA Technology / Vessel-In Vessel / Vessel-Blanket and Materials
decreases from -5 dB (before) to -8 dB through the weld. The tip diffraction decreases of 3 dB
Table 1
Indeed, if the attenuation of 3dB for the sound is due to the dispersion in the weld area the equivalent coefficient could be α=0.08dB/mm INFLUENCE OF THE BEAD WELD GEOMETRY IN THE INSPECTION The experimental data presented in figures 6a & b shows two scan configurations which are used to analyse the role of the bead root weld.
Figure 6: Angular B-scans for 3 mm breaking surface flaw and a bead of φ =5mm in both directions of the scan
Figure 6a presents the UT angular B-scan considering a direct inspection of the 3 mm breaking surface notch and for a bead of φ=5 mm. This experimental data shows both the signals coming from the bead geometry and detected apart the signals related to the tip diffraction and the corner echo. Figure 6b shows the UT angular B-scan taking into account the inspection of both the 3 mm breaking surface notch and bead weld. In particular, experimental data show that the corner echo and the signal of bead geometry can not be detected apart. Nevertheless, the tip diffraction signal is separately detected.
In the same context for a bead of φ =3 mm, figure 7a presents the UT angular B-scan for the inspection of breaking notch of 3 mm when the inspection is performed before the bead. Figure 7b shows the angular B-can for a bead of φ =3 mm when the inspection is carried out through the bead.
Figure 7: Angular B-scans for 3 mm breaking surface flaw and a φ =3mm bead in both directions of the scan
For both geometries of bead φ =3 mm and φ =5 mm, the characterization of flaw is possible when the defect is placed before the bead of the weld, however, it is not easily characterized when the inspection is performed from the other side.
Notch Breaking surface
inspection
Amplitude-Corner-Echo/
SDH-FER [dB]
SNR (around corner echo) [dB]
Amplitude-Tip
diffraction/ SDH-FER
[dB]
SNR (around
diffraction)
[dB] Before -5 31 -20 17
Through
-8 26 -23 12
a)
b)
a))
b)

- 74 - EFDA Technology / Vessel-In Vessel / Vessel-Blanket and Materials
This experimental UT acquisition will be continued in order to analyse the influence of bead root weld when the joint of weld is inspected. The main objective is to detect apart signal coming from the flaw and those related to the weld structure. CONCLUSIONS
Previous experimental data had shown that phased array technique allows detecting and sizing embedded and surface breaking notches in TIG narrow gap welds. However, in order to complete the analysis the role of the geometry of bead and the structure of the weld need to be taken into account. The results presented in this report show that, in particular, CIVA software is able to simulate the effects of the attenuation of the sound passing through the weld. Regarding the effects of the geometry, the first results show that it is possible to characterize flaws of 3mm high and for and bead of weld of φ =3 mm and 5mm but it depends on the side of the inspection. Furthermore, the simulation tools allow us the possibility to evaluate the performance of the inspection taking into account the role of the different parameters. REPORTS AND PUBLICATIONS
[1] Development of ultrasonic non destructive testing
method for the vessel inter-sector weld of ITER: development of dynamic phased array techniques», SISC/03-RT0096/Rev. 0, september 2003.
[2] Development of ultrasonic non destructive testing
method for the vessel inter-sector weld of ITER: simulation of welding process», DECS/SISC/LMUS/02-RT0052, july 2002.
[3] Development of phased array techniques for the
inspection of one sided welds in ITER vacuum vessel», SYSSC/04-RT0143/Rev. 0, september 2004.
[4] Simulation of phased array technique for qualification
of UT methods for one sided welds during VV manufacture. SYSSC/05 RT0167/Rev. 0, october 2005
TASK LEADER
Jorge TIRIRA DRT/DETECS/SYSSC/LMC CEA-Saclay F-91191 Gif-sur-Yvette Cedex Tel. : 33 1 69 08 40 02 Fax : 33 1 69 08 75 97 e-mail : [email protected]

- 75 - EFDA Technology / Vessel-In Vessel / Plasma Facing Components
CEFDA02-583
Task Title: TW1-TVV-DES: DESTRUCTIVE EXAMINATION OF PRIMARY FIRST WALL PANELS AND MOCK-UPS
INTRODUCTION
A proposed route to a valid conception of first wall mock-ups implies diffusion welding of Be tiles onto a Cu alloy. It is difficult to easily apply traditional analysis techniques to Be tracking because 1) of its toxicity and 2) of its low atomic number Z. IBA1 have thus been considered, and in particular, NRA2 and PIXE3 techniques. The objective of the following work is to demonstrate how such techniques can bring valuable information in such investigations, and describe the Be//Cu junction related to manufacturing parameters of reference mock-ups. NRA/PIXE analyses presented below have been performed in Laboratoire Pierre Süe, in the C.E.A. Research Center, located in Saclay, France. Test & Validation laboratory (LEV) wishes to thank Laboratoire P. Süe (LPS) for the access to IBA facilities, and particularly to H. Khodja for the provided help in using the facilities and data processing. 2005 ACTIVITIES
DESCRIPTION OF THE TECHNIQUE A Van de Graaf high energy accelerator is used to beam a focussed stream of incident particles onto the samples. The best possible focussing is dia. ~1 µm, which is necessary in this study, due to the small size of the junction (optical microscopy shows 5-50 µm thickness depending on the samples). Depending on the analysed material, a choice of different particles is proposed: 1H+, 2H+, 3He+ or 4He+. Their energy can also be chosen, up to 3.75 MeV. EXPERIMENTAL CONDITIONS Sample preparation 1 cm2, ~2 mm thickness samples have been extracted from the mock-ups and prepared by a company allowed to machine Be. They have been polished, then a varnish-based protection layer has been applied on the surface, in order to protect the surface from oxidation. This layer can be easily removed with acetone. Analysis conditions The analysed areas have been chosen 100x100, 30x200, 50x200, 60x200, 400x30, 300x30, 150x50 µm, depending on the junction appearance near the analysis spot. The area
1 IBA: Ion Beam Analysis 2 NRA: Nuclear Reaction Analysis 3 PIXE: Particle Induced X-ray Emission
analysis has been chosen to be lower than 15000 µm2 to minimize acquisition time, and larger than 5000 µm2, to get enough signal for later quantitative processing. The area has always been centered on the Be//Cu junction. For our study, 3 MeV 3He+ ions have been used. They induce two kinds of interactions: - electronic interaction, which leads to X-ray emission,
i.e. PIXE interaction. This is particularly important for heavier elements (Z>22),
- nuclear interaction between 3He+ ions and Be atoms. The nuclear reaction involved is the following: 9Be(3He+,p)11B.
Quantification processing is based on a selection of a specific area in each of the images presented below. Estimation of error on quantitative data is ~10 %. Compositions of the analysed mock-ups have been summarized in table 1.
Table 1: Description of the analysed mock-ups
Mock-up HIP Cycle Be//Cu junction type DS-06J 825°C/2 h Be//Ti-GlidCop®Al25 Maq-cis-A 580°C/2 h Be//Ti-OF Cu Maq-cis-E 580°C/2 h Be//OF Cu Maq-cis-G 580°C/2 h Be//OF Cu Maq-cis-J 580°C/2 h Be//Cr-OF Cu Maq-cis-M 580°C/2 h Be//Cr-Ti-OF Cu Maq-cis-P 580°C/2 h Be//Al-OF Cu PH/S-24IR 580°C/2 h Be//OF Cu PH/S-25IR 560°C/2 h Be//OF Cu DS-09J 845°C/2 h Be//Ti-GlidCop®Al25
EXPERIMENTAL RESULTS In the following sections, have been summarized the qualitative and quantitative results obtained for all the analysed mock-ups. Results are presented as colourful images standing for element concentrations, all built on the following color scale (figure 1). [Low conc] [Higher conc]
Figure 1: Concentration color scale for imaging concentrations
Experimental procedure The location of the analysed zone is being done with an optic telescope. Then the sample is beamed during a sufficient time to get valuable data for later quantification process. As described upper, X-ray photons as well as He particles are being emitted and are analysed with appropriate detection systems, specific to both radiations. Typical resulting raw spectra are shown on figures 2 and 3,

- 76 - EFDA Technology / Vessel-In Vessel / Plasma Facing Components
respectively for X-ray radiation, and Be//3H+ nuclear interaction.
Figure 2: DS-06J spectrum4 for X-ray interaction
Figure 3: DS-06J spectrum5 for Be//3H+ nuclear interaction
Resulting data are then processed using a specific software developed in LPS laboratory. Qualitative results are obtained, as images based on element concentrations, but resulting data can then be further processed with a licensed X-ray simulation software. By applying some reasonable hypotheses on the junction composition it is then possible to calculate and estimate the composition values of the elements detected in the junction. Finally, the confrontation of calculated composition results with phase diagrams allows to conclude about the phase which may be present in the junction. Inspection of direct Be//Cu junctions: Maq-cis-G, PH/S-24IR and PH/S-25IR Mock-ups Maq-cis-G, PH/S-24IR and PH/S-25IR are free from any interlayer. The study shows how Be and Cu interact directly together. Resulting concentration images for Maq-cis-G are given in figure 4a) and 4b). Similar results have been obtained with the two other mock-ups. High Cu concentrations are represented by yellow color. Quantitative results are given in table 2 for all considered mock-ups.
Table 2: Junction composition for interlayer-free mock-ups
Mock-up Junction composition (at %)
Be Cu Maq-cis-G 52 48 PH/S-24IR 53 47 PH/S-25IR 52 48
4 y-coordinates are given in counts, abscissa are given in keV. 5 y-coordinates are given in counts, x-coordinates are given in
arbitrary units.
Figure 4a): Cu concentration imaging in Maq-cis-G Be//Cu junction
Figure 4b): Be concentration imaging in Maq-cis-G Be//Cu junction
From the list of probable intermetallic alloys that may appear, BeCu definite compound is shown to be the resulting definite compound that appeared during the HIP process. The region where the definite compound appears is about 10 µm thick. Inspection of Cr interlayer-based junction: Maq-cis-J Be//Cu junction of Maq-cis-J has been manufactured with a Cr interlayer. More precisely, Cr interlayer has been deposited by Plasma Vapor Deposition (PVD) on the Cu alloy before hipping. Results are shown on figures 5a), 5b) and 5c).
Figure 5a): Cu concentration imaging in Maq-cis-J Be//Cu junction
Figure 5b): Cr concentration imaging in Maq-cis-J Be//Cu junction
Figure 5c): Be concentration imaging in Maq-cis-J Be//Cu junction
No noticeable diffusion occurs through the Cr interlayer. It seems that small amounts of Be may have diffused in the Cr layer but calculations profiles do not allow to get precise concentration data. Cr seems to behave globally as a diffusion barrier for Cu as well as Be. One question remains though. Since Cr has been deposited on Cu before the hipping process, and substrate surface is reduced by
4a) 4b)
5b)
5a)
5c)

- 77 - EFDA Technology / Vessel-In Vessel / Plasma Facing Components
ion etching before the deposition step, it may be possible that a Be oxide layer has been trapped between Cu and the Be tiles, acting as a diffusion barrier, whatever the presence or nature of the Cr layer. It will thus be of great interest to compare the results obtained with a Cr layer deposited on Be substrate, before hipping. Inspection of Ti interlayer-based junctions: Maq-cis-A From the analysed mock-ups, four of them were hipped with a Ti interlayer, but we will present below only the results for Maq-cis-A mock-up. Maq-cis-M, DS-06J and DS-09J mock-ups will be presented in the next two paragraphs. Images are reported on figures 6a), 6b) and 6c). Ti layer seems to behave as Cr layer of preceding mock-ups; however, a precise analysis of the spectrum data as well as the quantification data, show that the Ti layer “pumped” some Cu atoms, as can be seen in table 3. Concentration levels indicate (from Cu-Ti phase diagram) that Cu atoms may have been incorporated to form a mix of Ti with a CuTi2 compound.
Figure 6a): Be concentration imaging in Maq-cis-A Be//Cu junction
Figure 6b): Cu concentration imaging in Maq-cis-A Be//Cu junction
Figure 6c): Ti concentration imaging in Maq-cis-A Be//Cu junction
Table 3: Ti layer composition for Maq-cis-A mock-up
Mock-up Junction composition (at%) Ti Cu Maq-cis-A 86 14
Inspection of a Ti-Cr interlayer-based junction: Maq-cis-M This mock-up was the only one from the series of studied mock-ups for which the interlayer is based on combined Cr-Ti PVD deposits. Concentration images are reported on figures 7a), 7b), 7c) and 7d). Imaging results show that small amounts of Cu and Cr diffused in the Ti layer (low diffuse blue zone on 7a) and 7c) images). Quantification data (figure 8) also show that Cr layer incorporated amounts of Ti and Be. From concentration values it seems that Cr may have formed Cr2Ti definite compound, with Be as solid solution (7 at%).
Figure 7a): Cu concentration imaging in Maq-cis-M Be//Cu junction
Figure 7b): Ti concentration imaging in Maq-cis-M Be//Cu junction
Figure 7c): Cr concentration imaging in Maq-cis-M Be//Cu junction
Figure 7d): Be concentration imaging in Maq-cis-M Be//Cu junction
0
20
40
60
80
100
120
0 20 40 60 80 100
Thickness (µm)
Con
c (a
t %)
Cu
Ti
Cr
Be
Figure 8: Element concentration profiles in Maq-cis-M Be//Cu junction
6a)
6b)
6c)
7a)
7b)
7c)
7d)

- 78 - EFDA Technology / Vessel-In Vessel / Plasma Facing Components
Inspection of Al interlayer-based junction: Maq-cis-P A detection problem has been revealed with this mock-up, since Al is not easily detected with this technique. The absence of Al peak on the PIXE spectrum may be due to real absence of Al in the analysed zone, as well as concentration values below detection limits (some decades of ppm). However, some information can be extracted from the resulting data. As seen on figure 9a) and 9b), the thickness of the intermediary layer is more important in that case (~20 µm versus ~10 µm for the DS-06J/Maq-cis-G group). Quantitative results are given in table 4. However, concentration values may be incorrect because calculation lies on an Al absence hypothesis. Al interlayer may explain why this junction is thicker, though the mock-up has been hipped at a rather low temperature (580°C, see table 1). Further work is necessary there.
Figure 9a): Be concentration imaging in Maq-cis-P Be//Cu junction
Figure 9b): Cu concentration imaging in Maq-cis-P Be//Cu junction
Table 4: Junction composition for Maq-cis-P mock-up
Mock-up Junction composition (at %)
Be Cu Maq-cis-A 12 88
Mock-ups DS-09J, DS-06J and Maq-cis-E Since the last mock-ups considered in this section are subject to anomalies or artefacts with respect to their supposed composition, no results will be given here.
CONCLUSIONS
Up to now, 10 Be/Cu junctions have been analysed using NRA/PIXE analyses. The results presented above show that these techniques are nicely adapted to this study. However, other specific techniques should be available in 2006 for this study. In particular, field emission gun-equipped scanning electron microscope, coupled with the EBSD6 technique, should allow to select the most complex cases for the heavier IBA techniques, complete the IBA results, and finally allow a precise determination of the composition of the Be//Cu junctions. REPORTS AND PUBLICATIONS
[1] ‘Destructive examination of first wall mock-ups’, E. De Vito, DTH/DR/2006/13 (2006) TASK LEADER
Eric De VITO DRT/DTH/LEV CEA-Grenoble 17, rue des Martyrs F-38054 Grenoble Cedex 9 Tel. : 33 4 38 78 28 87 Fax : 33 4 38 78 58 91 e-mail : [email protected]
6 EBSD: Electron Back-Scattered Diffraction
9a)
9b)

- 79 - EFDA Technology / Vessel-In Vessel / Plasma Facing Components
CEFDA03-1029
Task Title: TW3-TVB-JOINOP : OPTIMIZATION OF BE/Cu ALLOY JOINTS FOR PRIMARY FIRST WALL PANELS
INTRODUCTION
The task is part of a work technology programme aiming at demonstrating the applicability of the Hot Isostatic Pressing (HIP) technologies for manufacturing Primary First Wall panels made from a combination of copper alloy (as heat sink material) a stainless steel (as structural material) and beryllium tiles (as an armour material). Up to now, several mock-ups and panels were fabricated and thermal fatigue tested. The Be armour material was joined onto the Copper heat sink material by hipping or brazing. The objective of this task is to perform a development work programme to optimize the Be/CuCrZr alloy HIP joining conditions and to manufacture FW mock-ups for high heat flux and thermal fatigue testing. In 2004 we worked mainly on the manufacturing of the mock-ups and in 2005 we have completed the development work to further improve the Be/CuCrZr HIP joint performance. 2005 ACTIVITIES
MECHANICAL TESTING PERFORMED ONTO THE CANISTER SHEETS To manufacture the canister required for diffusion welding Be tiles onto CuCrZr, two kinds of materials were studied: a stainless steel (304L) and a soft steel (DC01). As joining is performed at low temperature (580°C) to avoid a too important decrease of the mechanical properties of CuCrZr, the choice of a material having low mechanical properties at low temperature was suggested. For this reason we have performed on these two materials tensile tests from room temperature to 600°C. The geometry of the tensile specimen is given on figure 1.
Figure 1: Geometry of the tensile specimen
Results are given in figures 2 and 3. Both materials have similar yield strengths. The ductility of 304L is higher, but that of DC01 is high enough compared to expected deformations during HIP. Since the hardening of DC01 is much smaller than that of 304L, it is believed that DC01 is more prone to transmit the pressure meanwhile being less
constraining for Be. For these reasons, we have chosen DC01 sheet to manufacture canisters.
0
100
200
300
400
500
600
700
800
900
0 100 200 300 400 500 600 700
Temperature (°C)
YS
& U
T (
Mpa
)
DC01 : UTS
DC01 : YS
304L : UTS
304L : YS
Figure 2: YS and UTS Comparison between 304L and DC01
0
10
20
30
40
50
60
70
80
90
0 100 200 300 400 500 600 700
Temperature (°C)
UE
& T
E (
A%
)
DC01 : TE
DC01 : UE
304L : TE
304L : UE
Figure 3: UE and TE Comparison between 304L and DC01
DEGASSING In order to improve the thermo-mechanical behaviour of the Be/CuCrZr junctions, experiments have been carried out to quantify the influence of the cleaning treatments, the temperature and the diameter of the evacuation pipe on the residual concentrations of chemical species degassed by the surface of the materials. Their concentration is measured after several hours of evacuation at ambient or at HIP temperature by a quadrupole mass spectrometer. The experimental set-up is shown on figure 4.

- 80 - EFDA Technology / Vessel-In Vessel / Plasma Facing Components
Figure 4: experimental set-up for degassing studies
Our experiments have allowed us to investigate the elements degassed by several metallic materials for different surface treatments and temperatures (up to 580°C). These materials are copper, 316L stainless steel, graphite, cogemicanite (mica) and also 304L stainless steel (canister walls). At ambient temperature, the results show that the main elements detected by the gas analysis sensor are H2O, N2 plus CO, OH (hydroxide water), H2, O2, H, CO2 and CH4. H2O is the element that exhibits the highest concentration. At high temperature (580°C), similar elements are detected but most of their concentrations have been reduced. The reduction is about 65% for H2O, 85% for O2 and close to 55% for CO2. Only H2 concentration presents a strong increase of about 75%. The use of graphite and cogemicanite leads to a strong increase of the CxHy concentrations. This increase is about 75% for CH4 at 580°C. Experiments done at ambient temperature with a small diameter evacuation pipe reveal no influence of the cleaning treatments on the final concentration of the degassed elements. As concerns the influence of the evacuation pipe diameter, the experiments show that the conductance of the evacuation network has a strong influence on the final concentration of the main elements detected at ambient temperature. The use of a dia. 20 mm evacuation pipe instead of the usual ∅ 4 mm one, leads to a reduction of about 20% for H2O and 60% for O2. The reduction is smaller for the other elements. The use of a dia. 10 mm evacuation pipe shows a less marked influence on the final concentration of the main chemical species. Conductance has also an influence on the sensitivity of the measurements because CxHy elements at m/z ratio from 39 to 45 are better observed with a 20 mm inner diameter than with a 4 mm inner diameter. These results have to be confirmed by other experiments.
INTERLAYERS To determine the influence of the machining processes (roughness) and the interlayers used to perform the junction between beryllium tiles and CuCrZr, 18 small mock-ups were manufactured to perform shear testing. These mock-ups were manufactured as defined on figure 5.
Figure 5: Geometry of the mock-ups
The HIP cycle applied to the joining between the beryllium tiles and the 316/CuCrZr base is the following one: 580°C/140 MPa step 2 hours. To perform joining between beryllium tiles and CuCrZr, a copper interlayer was introduced at the interface. The plate used in this study has a thickness of 1 mm. It is coated with nickel on the CuCrZr side. For some mock-ups, the Be side of the copper plate was coated with Aluminium, Titanium or Chromium deposited by Physical Vapour Deposition (PVD). The main differences between the mock-ups for shear testing are summarized in table 1.
Pressure gauge N°2 Pressure gauge N°1
Gas analysis system Transpector2 H100M
Turbo pump
Zeolite Filter Canister
Thermocouple 1 (TC1)
Thermocouple 2 (TC2)
Evacuation pipe
Primary pump
Elastomer silicon tube
CuCrZr block
DC01 Canister
Be tile
Anti diffusion material

- 81 - EFDA Technology / Vessel-In Vessel / Plasma Facing Components
Table 1: Main differences between the mock-ups for the beryllium tiles assembly
Mock-up Materials Maq-cis A,B,C CuCrZr / ⇔ / Ni /Cu-OF / Ti ⇔ / Be tile
Maq-cis D,E,F,G,H,I CuCrZr / ⇔ / Ni / Cu-OF ⇔ / Be tile Maq-cis J,K,L CuCrZr / ⇔ / Ni / Cu-OF / Cr ⇔ / Be tile
Maq-cis M,N,O CuCrZr / ⇔ / Ni / Cu-OF / Cr / Ti ⇔ / Be tile Maq-cis P,Q,R CuCrZr / ⇔ / Ni / Cu-OF / Al ⇔ / Be tile
⇔ means bonded interface by HIP process
Table 2: Ultimate shear strengths for the mock-ups with different interlayers
Mock-up Shear strength MPa
Comments
Maq-cis A 86 Rupture at the interface Be/Cu-OF Maq-cis B 79 Rupture at the interface Be/Cu-OF Maq-cis C 86 Rupture at the interface Be/Cu-OF Maq-cis D 165 No rupture, important deformation of the sample Maq-cis E 165 No rupture, important deformation of the sample Maq-cis F 144 Rupture at the interface Be/Cu-OF Maq-cis G 163 No rupture, important deformation of the sample Maq-cis H 169 Rupture at the interface Be/Cu-OF Maq-cis I 163 Rupture at the interface Be/Cu-OF Maq-cis J 88 Rupture at the interface Be/Cu-OF Maq-cis K 88 Rupture at the interface Be/Cu-OF Maq-cis L 81 Rupture at the interface Be/Cu-OF Maq-cis M 91 Rupture at the interface Be/Cu-OF Maq-cis N 104 Rupture at the interface Be/Cu-OF Maq-cis O 93 Rupture at the interface Be/Cu-OF Maq-cis P 147 No rupture, important deformation of the sample Maq-cis Q 159 No rupture, important deformation of the sample Maq-cis R 169 No rupture, important deformation of the sample
25x25 mm² shear samples were cut from the mock-ups and shear tests were performed at 20°C. Ultimate shear strengths are given in table 2.
On the figure 6 we can see a specimen after testing on the shear test apparatus. As can be noted no rupture occurs on the specimen maq-cis R. The various observations carried out show that the qualities of the joints are good.
Specimen on the apparatus Specimen maq-cis R after testing
Figure 6: Specimen after testing on the apparatus

- 82 - EFDA Technology / Vessel-In Vessel / Plasma Facing Components
LEAK DETECTION METHOD The success of parts manufactured by HIP is not at this date easily measurable or quantifiable. Indeed, during the HIP cycle, a leak can occur on one of the welds performed to close the canister, which can prevents the joining of the surfaces or the densification of the powder. In this study we have developed a method that makes it possible to determine if the HIP cycle proceeded on a part was performed without troubles. This method is based on the measurement of the argon concentration in materials (in case of leak during HIP, argon enters the canister). To check if this method is efficient, eight parts as defined on figure 7 were manufactured with different leak rates.
Figure 7: Schematic view of the parts before the HIP cycle The HIP cycle applied on these parts is the following one: 1040°C/140 MPa step 2 hours. Two samples were cut in each part, one in the middle and the other one in the periphery. These samples were introduced into a combustion chamber heated at 1080°C under vacuum. During the rise in temperature, the argon and the other elements contained in the analyzed samples escape and the combustion gases are sequestered on various reagents or filters. Argon can then be quantified by mass spectroscopy. Results given in table 3 indicate an average value of the argon content. No argon was detected on the samples taken in the middle or peripheral zone of the parts number 7 and 8. On these parts, no leak was detected during the helium test. On the opposite, argon is detected in parts 1-6, which were not leak tight. It is worth noting that part number 3 looked fully dense after HIP, based on pure visual criteria (deformations of the outgassing tube and canister). These results show that it is important to measure argon content trapped in a part manufacturing by HIPing. It is however impossible to quantify a leakage rate according to the percentage of detected argon. It must be noted also that during the outgassing of the parts, the vacuum level measured on the pumping installation was the same for all
the parts. It is thus essential to carry out relevant helium test in order to be sure of the tightness of the welds. COMPUTER MODELING The modeling study performed in this work concerns (i) the simulation of the cooling during the HIP cycle in order to know what is happening in the part and in the joint in terms of mechanical stresses (ii) the simulation of the Beryllium/CuCrZr junction with a pure copper interlayer. The simulation of the cooling step after HIP of a Be tile on a CuCrZr substrate shows practically no plasticity. Only a very tiny zone near the triple point on Be side exhibits some plastic strain (figure 8). We have also noted that the maximum stress appears around 200°C, approximately when the thermal mismatch between thermal strains is higher.
-15
-10
-5
0
5
10
15
20
25
0100200300400500600
Température (°C)
σσ σσzz
(M
Pa)
Point in Be near joint, case 1
Point in CuCrZr near joint, case 1
Point in Be near joint, case 2
Point un CuCrZr near joint, case 2
T1
T2
Figure 8: Evolution of the tensile stress at points on the free surface near the joint
The adjunction of a pure Cu layer decreases a lot the stress in the assembly. Two plastic strain concentrations appear in the Cu layer very close to singular triple points. When Cu thickness increases, the plastic strain increasingly localises on upper triple point (Cu/Be interface). It appears as well that there is a minimum value around 1.5 mm Cu thickness.
Table 3: Argon content measured into the samples
Samples 1 2 3 4 5 6 7 8
Peripheral zone µg/g 27 23 21 25 25 26 <0.05 <0.05
Middle zone µg/g 29 29 27 31 26 28 <0.05 <0.05
Helium leak rate mbar l / s
6.6x10⁻⁷ 5.3x10⁻⁷ 4.3x10⁻⁷ 4.5x10⁻⁴ 3.5x10⁻⁴ 5.4x10⁻⁴ <1x10⁻⁹ <1x10⁻⁹
Porous 316L filter
Tight welding
SS powder

- 83 - EFDA Technology / Vessel-In Vessel / Plasma Facing Components
CONCLUSIONS
The main conclusions of this study are the following: - soft steel is proposed as canister material. - outgassing studies showed that the outgassing tube diameter should be 10 mm minimum. - as far as interlayers are concerned, best shear strength has been achieved without interlayer and with an aluminium coating (HIP at 580°C), lower strengths are achieved with Ti and/or Cr. - it has been demonstrated that the measurement of the argon content in the HIPed materials brings valuable information concerning the absence of leak of the canister upon HIP. - finite element modelling work showed that the Be/CuCrZr interface exhibits very little strain during cooling. The use of a copper interlayer reduces the stress by localised plastification providing its thickness is at least 1.5 mm. Many results have been achieved in this task, but yet further investigations are necessary for a full optimization of CuCrZr/Be joints.
REPORTS AND PUBLICATIONS
P. Bucci, P.E. Frayssines, O. Gillia, J.M. Leibold, B. Ricetti, F. Vidotto, “EFDA/03-1029 - TW3- TVB-JOINOP Optimization of Be/Cu alloy joints for primary first wall panels.” Rapport technique DTH/DR/2006/021, march 2006. TASK LEADER
Philippe BUCCI DRT/DTH/LTH CEA-Grenoble 17, rue des Martyrs F-38054 Grenoble Cedex 9 Tel : 33 4 38 78 38 39 Fax : 33 4 38 78 54 79 e-mail : [email protected]

- 84 - EFDA Technology / Vessel-In Vessel / Plasma Facing Components

- 85 - EFDA Technology / Vessel-In Vessel / Plasma Facing Components
PH/S-8F
PH/S-9F
HPPP
LP
CEFDA04-1138
Task Title: TW4-TVB-HFCSMU: HIGH HEAT FLUX TESTING OF OPTIMISED CuCrZr/SS MOCK-UPS
200 KW ELECTRON BEAM GUN TEST
INTRODUCTION
Thermomechanical fatigue is one of the most important damaging mechanisms for the plasma facing components (PFC) of the ITER machine due to the high number of operating cycles (several thousands) and to the expected surface heat loads. Therefore an assessment of the behaviour of PFC under cycling heat loads is essential to demonstrate the fitness for purpose f the selected design solutions. This contract concerns the monitoring and analysis of thermal fatigue testing of PFC to be performed in the frame of the European R&D programme for ITER. In the frame of this, three mock-ups were thermal fatigue tested at FE200 [1] in 2005: - CuCrZr/SS first wall mock-ups (mock-up FW8) - W armoured monoblocks (mock-up VTFS) - CFC armoured monoblocks (mock-up Baffle B,C) The activities planned in the frame of this contract are now completed. 2005 ACTIVITIES
MAIN RESULTS CuCrZr/SS first wall mock-ups (mock-up FW8) A manufacturing route for the production of Primary First Wall Panels (PFW) involves a high temperature HIPing at 1040°C for joining the CuCrZr alloy heat sink materials to the 316L Stainless Steel (SS) back plate. Beryllium (Be) armour is then joined by HIPing at a temperature range of 560-580°C. In order to allow the retention of sufficient mechanical strength with the CuCrZr, two alternative routes are being considered: high temperature HIP quenching, i.e. HIP cycle with fast cooling within the HIP furnace, followed by an ageing heat treatment or a high temperature HIP cycle with a subsequent solution annealing heat treatment with fast cooling also followed by an ageing heat treatment. In comparison with the prime aged heat treatment, all the above heat treatment cycle slightly degrade the tensile strength of the CuCrZr alloy. Two elements without beryllium were manufactured following the above alternative routes (PH/S-8F and PH/S-9F) and tested at FE200 to compare their fatigue behaviour. These two elements are made of a 20 mm thick CuCrZr heat sink HIPed onto a 30 mm thick Stainless Steel back plate; 4 Stainless Steel cooling tubes of outer diameter 12 mm, thickness 1 mm, are inserted in between the two CuCrZr half-shells. The cooling tubes are welded to inlet and outlet manifolds for connection to water
supply system, allowing the parallel flowing of the 2 elements. Dimensions of each element are 250 mm x 88 mm x 50 mm (figure 1). a) b)
Figure 1: a) View of the mock-up FW8 = PH/S-8F + PH/S-9F, b) the CuCrZr was sandblasted before testing to
increase infra-red emissivity The cooling water conditions for the tests were selected at inlet temperature 100°C, flow rate 3 kg/s (i.e. 4.8 m/s), inlet pressure 3.3 MPa (ITER first wall relevant conditions), dimensions of the heated area 160 mm x 88 mm. Both of the elements resisted successfully a first step of fatigue 1000 cycles at 5 MW/m² 15 sec. ON / 15 sec. OFF: no obvious observation of surface temperature was observed during this step.

- 86 - EFDA Technology / Vessel-In Vessel / Plasma Facing Components
During the second step of fatigue at 7 MW/m², a defect propagation was detected onto the element PH/S 9F after 143 cycles, the fatigue step was interrupted on this mock-up and continued on PH/S-8F up to the 267th cycles when indication of defect propagation was also detected (figure 2). a)
b) c)
Figure 2: Infrared detection of defect propagation a) Standard infrared pattern
b) Defect propagation on PH/S-9F after 143 cycles c) Defect propagation on PH/S 8F after 267 cycles
Figure 3: Zoom on PH/S-9F surface with clear correlation between CuCrZr surface state (intergranular cracks at the burned boundary grains Copper) and infrared temperature
evaluation (~1000°C) Conclusion on FW8 Testing: Post-testing metallographic analysis will be performed by the manufacturer to optimize allow the manufacturing route. Warmoured monoblocks (mock-up VTFS) The Vertical Target Full Scale mock-up manufactured by PLANSEE was already extensively tested in the frame of the contract CEFDA 01-585: successful fatigue steps of 1000 cycles at 20 and 23 MW/m² absorbed confirmed the
robustness of the CFC monoblock whereas a limit at 10 MW/m² was found for the W monoblocks with systematic occurrence of water leaks during fatigue cycling [2]. A third and last testing campaign was performed at FE200 in 2005 in the frame of this task. Transversal castellations were machined every 20 mm on the W armoured monoblocks in order to decrease the thermomechanical stress due to thermal expansion during the cycling into the block and at the interfaces W/pure Copper/CuCrZr. A successful cycling step of 1000 cycles at 20 MW/m² absorbed was performed without degradation of the W monoblocks on a area which was not fatigued before the machining of castellation (figure 4).
Figure 4: Main results on W monoblocks of the mock-up VTFS
Conclusion on VTFS Testing: The transversal castellation of W monoblocks is mandatory and will be required in all future components for the ITER Divertor designed to endure more than 10 MW/m². CFC armoured monoblocks (mock-up Baffle B, C) The Baffle B, C mock-up manufactured by FRAMATOME in Partnership with PLANSEE was already tested in the frame of the contract CEFDA01-585 [3]: 2 kinds of geometries were manufactured (figure 5) and successfully fatigue tested during steps of 1000 cycles at 10 MW/m². Note that due to the curvature radius of the baffle, the axial dimension of a monoblock is reduced down to 4 mm instead of standard 20 mm in case of Divertor straight targets application.
Figure 5: Panel B with slot-cut attachment and Panel C with dove-tail attachment
HHF loading of VTFS – W part
20 MW/m2 x 1000 cycles
HHF loading of VTFS – W part
20 MW/m2 x 1000 cycles ~10th cycle
~1000th cycle
After 1000 th cycle
(blocks 50-51)
B 800mmBaffle Panel B
Monoblock: rear slot-cut
B 800mmBaffle Panel B
Monoblock: rear slot-cut
C Baffle Panel C
Monoblock: dove-tail
C Baffle Panel C
Monoblock: dove-tail

- 87 - EFDA Technology / Vessel-In Vessel / Plasma Facing Components
A second and last testing campaign was performed at FE200 in 2005 in the frame of this task. It was decided to fatigue the CFC monoblocks with a heat flux of 16 MW/m² being a compromise between the nominal value (20 MW/m²) and the operational values at FE200 (Tsurf <
2000°C, no swirl = risk of Critical heat Flux)
Figure 6: Observation of damage propagation
Cycling at 16 MW/m² on the slot-cut geometry was not possible due to the presence of micro water leaks (vacuum degradation from 10-4 to 10-3-10-2 mb) probably due to the presence of fatigue cracks into the CuCrZr tube appeared during the cycling at 10 MW/m², a future metallographic examination would confirm this assumption. On the dove-tail geometry, 4 zones of 140 x 50 mm, which means 280 blocks, were cycled. No perturbation was observed on zoes 1; 2 and 3 and one damage propagation after 500 cycles was clearly observed on zone 4. Figure 6: Observation of damage propagation A study on SATIR non-destructive examination and first screening at FE200 allows the initial dimensions of the defect to be determined: location at 45° from the top of the tube, extension 140°. The final screening at FE200 shows an axial propagation (from 1 block to 4 blocks) and also a circumferential propagation > 140° (figure 7).
Figure 7: Evaluation of damage propagation CONCLUSIONS
SLOT-CUT GEOMETRY The fact that the sliding due to the thermal expansion of CFC under heat flux is not allowed by the rear slot -cut technology seems to be a weak point during thermal cycling. This geometry is not relevant for a PFC designed for 20 MW/m². DOVE-TAIL GEOMETRY 280 blocks with dove-tail geometry sustained 1000 cycles at 16 MW/m², however a defect propagation was observed and assessed, a future metallographic examination would confirm this evaluation.
REFERENCES
[1] Fus. Eng. Des. 75-79 (2005) 357-363, I. Bobin-
Vastra, F.Escourbiac, M.Merola et al. [2] Fus. Eng. Des. 75-79 (2005) 435-440,
M.Missirlian, F.Escourbiac, M.Merola et al. [3] Contract EFDA 01/585 - Final Report, CFP/NTT-
2005.008, F.Escourbiac, 2005 TASK LEADER
Frédéric ESCOURBIAC DSM/DRFC/SIPP CEA-Cadarache F-13108 Saint-Paul-lez-Durance Cedex Tel. : 33 4 42 25 44 00 Fax. : 33 4 42 25 49 90 e-mail : [email protected]
Final screening on Baffle C dove tail
FE200
zone 4
Tsurf_max on top face (FE200)Panel C / defect in CFC
0
200
400
600
800
1000
1200
1400
45 90 135 180
Extension of the defect (°)
Tsu
rf_m
ax (
°C)
0°
45°
90°
135°
180°
Without defect
Tmax > 900°C
Flaw :θ, ∆θ
(45°, >140°)
5 MW/m²
Propagation of > 40°+ axial propagation ( 1 to 4 blocks)
Tsurf_max on top face (FE200)Panel C / defect in CFC
0
200
400
600
800
1000
1200
1400
45 90 135 180
Extension of the defect (°)
Tsu
rf_m
ax (
°C)
0°
45°
90°
135°
180°
Without defect
Initial screening on Baffle C dove tail
FE200
zone 4
Tmax ~650°C
Flaw :θ, ∆θ
(45°, 100°)
5 MW/m²
(limited longitudinal extension to one block)
Results on Baffle C : dove-tail
16 MW/m² on C dove-tail (zone 4)
Damage propagation
~10th cycle
~500th cycle
After 500 th cycle
Results on Baffle C : dove-tail
16 MW/m² on C dove-tail (zone 4)
Damage propagation
~10th cycle
~500th cycle
After 500 th cycle
(35 bar, 70°C, 12 m/s, 10 sec. ON, 10 sec. OFF)

- 88 - EFDA Technology / Vessel-In Vessel / Plasma Facing Components

- 89 - EFDA Technology / Vessel-In Vessel / Plasma Facing Components
CEFDA04-1218
Task Title: TW5-TVD-HHFT: MONITORING AND ANALYSIS OF DIVERTOR COMPONENTS TESTED IN FE200
200 KW ELECTRON BEAM GUN TEST
INTRODUCTION
Thermal fatigue is one of the most important damaging mechanisms for the Plasma Facing Components (PFCs) of the ITER machine due to its high number of operating cycles (several thousands) and to the expected surface heat loads. Therefore an assessment of the behaviour of PFCs under cycling heat loads is essential to demonstrate the fitness for purpose of the selected design solutions. This Task concerns the thermal fatigue testing of plasma facing components to be performed in the frame of the European R&D programme for ITER. The thermal fatigue testing forming the subject matter of the present activities are performed in FE200 electron beam facility at Le Creusot, France. This facility has been designed and built to properly simulate the high heat fluxes expected on the PFCs and it has performed tests for NET/EFDA since 1989 [1]. 2005 ACTIVITIES
Two baffle full-scale panels manufactured by Framatome ANP in partnership with PLANSEE GmbH LECHBRUCK [2] were tested at FE200 in the frame of this task during the year 2005. DESCRIPTION OF THE MOCK-UP Each panel has two cooling channels, a typical length of about 800 mm and a width of 44 mm (cf. figures.1, 2 and 3) assembled on a Stainless steel support.
Figure 1: Transversal Figure 2: Transversal view of Baffle A-CFC view of Baffle A-W panel panel The heat sink is made of DS-Copper (CuAl25) including two 0.5mm thick stainless steel tubes. The S.S. support/CuAl25/S.S tube/CuAl25 assembly was realised
by HIPing. The GBaffle A-CFC panel is armoured with 5 mm thick CFC NS31 tiles by AMC and Electron beam processes. The tiles dimensions are 19.2 mm long x 44 mm wide. On the flat part, there is a 1 mm gap between each of the 34 tiles. The Baffle A-W is armoured with a 3 mm thick (down to 0.1 mm on the lateral parts) Tungsten plasma-sprayed coating. The two panels were equipped with 8 thermocouples and mounted on a cooled supporting system for connection to the FE200 pressurized water loop (figure 3), a dedicated Copper shield was sandwiched between the two panels, this mock-up was called “Baffles A-CFC/W”.
Figure 3: Mock-up “Baffles A-CFC/W”, view from the gun in the vacuum chamber at FE200High heat flux testing
HIGH HEAT FLUX TESTING - Objective: In order to check a capability for such technologies to withstand a few MW/m², the following test plan was performed [3]:
Table 1: Test plan at FE200
Heat flux absorbed (MW/m²)
CFC panel W panel
Screening 2.5 1.5
100 cycles at 2.5 1.5
1000 cycles at 3-3.5 2-2.5
1000 cycles at 5 3 The cooling water conditions at the inlet were 3.5 MPa, 10 m/s, 100°C, there is no twisted tape into the cooling channel, the duration of cycles is 10 sec. ON, 10 sec. OFF.
Baffle A-
Baffle A-W
HP
LP
1 34
Copper

- 90 - EFDA Technology / Vessel-In Vessel / Plasma Facing Components
Figure 4: Definition of the heated zones
- Results [4]: The following zones were defined for the tests: The screening of the Baffle A-W panel was performed at an absorbed heat flux of 2.5 MW/m², discrepancies of evaluated surface temperature by the infrared devices are linked both to the coating thickness and emissivity (figure 5). In comparison, the infrared picture of the CFC is remarkably homogeneous at 300°C except some stable hot spots (figure 6). After increasing of the absorbed power, a study on the measured surface temperature showed that on the CFC armour, the measurements were consistent with Finite Element analysis and that on the W coating, the thermal conductivity was 15% of the bulk conductivity (a previous study in 2001 has shown 10% [5]), cf. figure 5.
Figure 5: Surface temperature vs Absorbed Heat Flux
Figures 7 and 8: No evolution of surface temperature during cycling step: no degradation of the joint
No clear evolution of surface temperature was observed during the steps of cycling. The two steps of 1000 cycles are reported figures 7 and 8.
Figure 6: Infra red pictures of the screening After the screening, the Zone 3 was identified for cycling steps.
Figure.9: After 10 and 1000 cycles at 5 MW/m² absorbed on Baffle A-CFC – Red circle is for pyrometer position
Figure.10: After 10 and 1000 cycles at 3 MW/m² absorbed on Baffle A-W
0 100 200 300 400 500 600 700 800 900
0 1 2 3 4 5 AHF (MW/M²)
Tsurf(°C)
CF
W W_2001

- 91 - EFDA Technology / Vessel-In Vessel / Plasma Facing Components
CONCLUSIONS
The stainless steel tubes embedded inside the 2 half blocks of Copper offer an efficient protection against water leaks even if the HIPed interface debonds, on another hand, the global heat transfer capability of the component is lowered by the presence of stainless steel, consequently, these baffles are not designed to withstand the divertor loads (up to 20 MW/m²) but can be foreseen in those plasma facing areas where a heat flux higher than that typical of the first wall panels is expected, say 3-5 MW/m² for respectively W and CFC armour (start-up limiter ?). The activity will continue with 3 high heat flux campaigns on technologies for ITER divertor vertical target REFERENCES
[1] Fus. Eng. Des. 75-79 (2005) 357-363, I. Bobin-
Vastra, F.Escourbiac, M.Merola, P.Lorenzetto [2] FRAMATOME-ANP report TFCW R 02. 883 A - –
I.Bobin-Vastra, 09/12/02 [3] Spécifications techniques pour la maquette baffles
A-CFC/W à tester au FE200 - CFP/NTT-2005.027 – F.Escourbiac, 2005
[4] AREVA report R-05.915A - NFTF - CEA87 –
EFDA/93-851JN – I.Bobin-Vastra, 20/12/05 [5] Review of mock-up “Curved-WPS” FE200 testing -
CFP/NTT-2001.028 – F.Escourbiac, 2001
TASK LEADER
Frédéric ESCOURBIAC DSM/DRFC/SIPP CEA-Cadarache F-13108 Saint-Paul-lez-Durance Cedex Tel. : 33 4 42 25 44 00 Fax : 33 4 42 25 49 90 e-mail : [email protected]

- 92 - EFDA Technology / Vessel-In Vessel / Plasma Facing Components

- 93 - EFDA Technology / Vessel-In Vessel / Plasma Facing Components
CEFDA05-1243
Task Title: TW5-TVD-NDTEST: UPGRADE OF THE SATIR TE ST BED FOR INFRARED THERMOGRAPHIC INSPECTIONS
INTRODUCTION
Among all Non-Destructive Examinations, active infrared thermography by internal thermal excitation is becoming recognised as a technique available today for improving quality control of many materials and structures involved in heat transfer. The infrared thermography allows to characterize the brazing bond between two materials with different thermal physical properties. An infrared thermography test bed named SATIR (Station Acquisition Traitement InfraRouge) has been developed by CEA in order to evaluate the manufacturing process quality of actively water-cooled high heat flux components (PFC’s) before their installation in Tore Supra. In order to increase the defect detection limit of the SATIR test bed, several possibilities have been assessed (CEFDA00-565). The installation in 2003 of a digital infrared camera and the improvement of the thermal signal processing, has led to a considerable increase of performances. BACKGROUND In 2001 the main conclusion of the following EFDA contract [1] named “Improvement evaluation for infrared detection of PFC flaws” showed that: - The increasing of range temperature (up to 200°C) would involve complete pressurization of test bed. Finite element calculations showed that this solution allows a significant improvement of sensitivity (by factor 2) but it not retained because SATIR becomes less flexible in its use (Pressure Safety Standard). - The implementation in 2003 of a cooled digital IR camera using wavelengths range 3-5µm instead of a scanning infrared camera allowed to develop a new data processing, which led to a significant improvement of performances. - The increase of water velocity inside the tested component involves an increasing of the heat transfer convective coefficient, which improves in a significant way the sensitivity of SATIR diagnostic. TEST BED DESCRIPTION The principle of SATIR test (photo 1) is to generate successively a hot and a cold-water front in the cooling channel of the elements, in order to measure the surface temperature evolution.
Photo 1: View of SATIR test bed A cooled infrared digital camera is used to detect zones where heat exhaust is not sufficient. Defects like braze voids are detected by a slower temperature response on the surface during the transient. The geometry tolerances and the material property variations play a major role in the determination of acceptance criteria. In case of serie control, two components are tested in parallel to a reference. A DTref criterion is defined with respect to the reference. The detailed principle of SATIR facility and DTref Criterion were the subject of several publications [2]. JUSTIFICATION Within the on-going work on acceptance criteria task, which is being carried out by EU and the ITER International team, SATIR inspection has been identified as the basis test to decide upon the final acceptance of the Divertor PFC’s. However, the ITER Divertor PFC’s pose new challenges for the following reasons: - The CFC thickness is 2-3 times higher (18-20 mm) than any existing component manufactured or being manufactured so far either within the ITER project or within domestic projects. Therefore, the sensitivity of the technique, which depends on the armour thickness, is lowered. - The number of units to be tested is 2-3 times higher (more than 2000) than on any existing or under construction fusion machine. Therefore, the total time required to test all the units increases accordingly. This involves, as a consequence, the following needs: i) To increase the water velocity ii) To minimize the test time needed to check each
component.

- 94 - EFDA Technology / Vessel-In Vessel / Plasma Facing Components
2005 ACTIVITIES
INCREASING OF WATER VELOCITY (I) A simulation of SATIR experiment by finite element calculations (CAST3M, figure 1) has been carried out on ITER monobloc CFC following the conditions below:
• 2D modelling
• 2 testing lines in parallel (test and ref.)
• CFC_NB31 with thickness 5mm
• No linear model
• Cooling phase only
• Radiation exchange of the flaw
• Surface natural convection
• 3 flaw positions θ (0°, 45°, 90°) and 1 flaw
extension ∆θ (60°)
Figure 1: FE calculation θ=0°; ∆θ=60°
The figure 2 illustrates the improvement of the DTref value versus the evolution of the SATIR water flow rate. One can expect a significant increase of performances with a water flow enhancement:
- 55% for a flow rate of 10 m3/h (12 m/s each elem.)
- 37% for a flow rate of 8 m3/h (10 m/s each elem.)
Figure 2: Flow rate effect on DTref This assessment allowed to design an upgraded SATIR test bed taking into account the technical requirements of ITER mock-ups (table1). The new cold pump and the buffer tank will be implemented in 2006.
Table 1: Flow rate and pressure
MINIMISE THE TEST TIME REQUIRED (ii) The SATIR process will be significantly simplified using only two pulses. The envisaged solution will take into account only the cooling cycle instead of the two cycles usually used (figure 3).
Mocks-up
parameters
ITER maximum
requirements 2 // IVT
Q m3/h 10 (12 m/s)
P bar 5
95°C
5°
-7.1
-6.2
-5.3
-4.4
-3.5
-2.6
-1.8
-0.86
2.55E-02
0.91
1.8
2.7
3.6
4.5
5.4
6.2
7.1
8.0
8.9
9.8
11.
12.
DTref (°C)
DTref at t ~ 3s
IR_
Late
ral m
easu
rem
ent
dire
ctio
n
Position = 0° Extension = 60°
0° 45°
0°
90°
Figure 3: Solution! Only the cold water cycle
95°C
5°5°
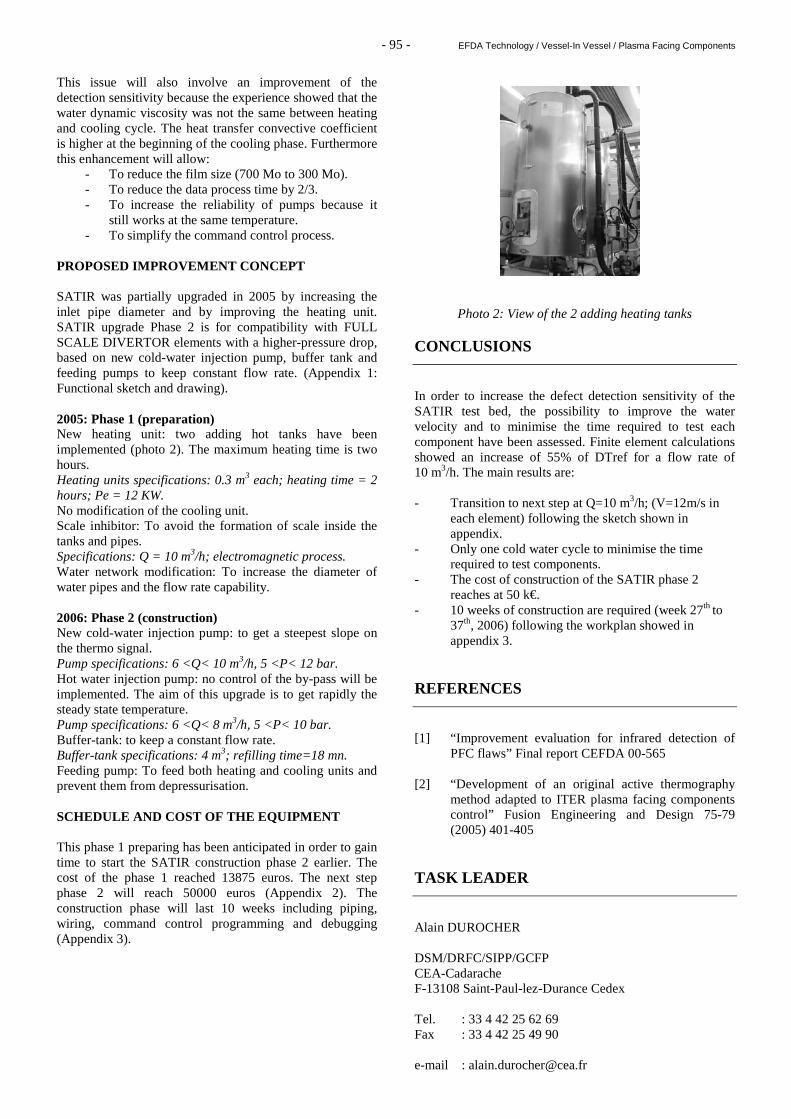
- 95 - EFDA Technology / Vessel-In Vessel / Plasma Facing Components
This issue will also involve an improvement of the detection sensitivity because the experience showed that the water dynamic viscosity was not the same between heating and cooling cycle. The heat transfer convective coefficient is higher at the beginning of the cooling phase. Furthermore this enhancement will allow:
- To reduce the film size (700 Mo to 300 Mo). - To reduce the data process time by 2/3. - To increase the reliability of pumps because it
still works at the same temperature. - To simplify the command control process.
PROPOSED IMPROVEMENT CONCEPT SATIR was partially upgraded in 2005 by increasing the inlet pipe diameter and by improving the heating unit. SATIR upgrade Phase 2 is for compatibility with FULL SCALE DIVERTOR elements with a higher-pressure drop, based on new cold-water injection pump, buffer tank and feeding pumps to keep constant flow rate. (Appendix 1: Functional sketch and drawing). 2005: Phase 1 (preparation) New heating unit: two adding hot tanks have been implemented (photo 2). The maximum heating time is two hours. Heating units specifications: 0.3 m3 each; heating time = 2 hours; Pe = 12 KW. No modification of the cooling unit. Scale inhibitor: To avoid the formation of scale inside the tanks and pipes. Specifications: Q = 10 m3/h; electromagnetic process. Water network modification: To increase the diameter of water pipes and the flow rate capability. 2006: Phase 2 (construction) New cold-water injection pump: to get a steepest slope on the thermo signal. Pump specifications: 6 <Q< 10 m3/h, 5 <P< 12 bar. Hot water injection pump: no control of the by-pass will be implemented. The aim of this upgrade is to get rapidly the steady state temperature. Pump specifications: 6 <Q< 8 m3/h, 5 <P< 10 bar. Buffer-tank: to keep a constant flow rate. Buffer-tank specifications: 4 m3; refilling time=18 mn. Feeding pump: To feed both heating and cooling units and prevent them from depressurisation. SCHEDULE AND COST OF THE EQUIPMENT This phase 1 preparing has been anticipated in order to gain time to start the SATIR construction phase 2 earlier. The cost of the phase 1 reached 13875 euros. The next step phase 2 will reach 50000 euros (Appendix 2). The construction phase will last 10 weeks including piping, wiring, command control programming and debugging (Appendix 3).
Photo 2: View of the 2 adding heating tanks CONCLUSIONS
In order to increase the defect detection sensitivity of the SATIR test bed, the possibility to improve the water velocity and to minimise the time required to test each component have been assessed. Finite element calculations showed an increase of 55% of DTref for a flow rate of 10 m3/h. The main results are: - Transition to next step at Q=10 m3/h; (V=12m/s in
each element) following the sketch shown in appendix.
- Only one cold water cycle to minimise the time required to test components.
- The cost of construction of the SATIR phase 2 reaches at 50 k€.
- 10 weeks of construction are required (week 27th to 37th, 2006) following the workplan showed in appendix 3.
REFERENCES
[1] “Improvement evaluation for infrared detection of
PFC flaws” Final report CEFDA 00-565 [2] “Development of an original active thermography
method adapted to ITER plasma facing components control” Fusion Engineering and Design 75-79 (2005) 401-405
TASK LEADER
Alain DUROCHER DSM/DRFC/SIPP/GCFP CEA-Cadarache F-13108 Saint-Paul-lez-Durance Cedex Tel. : 33 4 42 25 62 69 Fax : 33 4 42 25 49 90 e-mail : [email protected]

- 96 - EFDA Technology / Vessel-In Vessel / Plasma Facing Components
APPENDIX 1 FUNCTIONAL SKETCH
DRAWING
Wate r heate rs
Cold compressor
Fee dingpump
Wate rtank
Fee ding pipe
Sca le inhibitor
Control box
levelrégulation
PC
Hot injec tion stage95°C
Cold injectionstage 5°C
ITER
MOCKS-UP

- 97 - EFDA Technology / Vessel-In Vessel / Plasma Facing Components
APPENDIX 2 COST OF EQUIPMENT
APPENDIX 3 SCHEDULE
Natu re of invest ment s 2 0 05 2 0 06
Hyd raulic tasks :-Water supply p iping-New water hea ters piping,Electric tasks:-Electrical powe r distribution
25709157
2148
total : 13875
Hyd raulic tasks :-High p ressure stages + Feeding pu mp-hydrau lic items-Cons truction o f the w ater buf fer tank
28004556500
total : 9755
Hyd raulic items :-Valves , HP pu mp, feeding pu mp, water leve l regu lation 17000
total : 17000
Electric tasks :-Command control box w iring-Electrical powe r distribution-Technical assistance for startup + settings-Data acqu isition wiring
190004246
total : 23246
TOTA L 13875 Euros 50000 Euros

- 98 - EFDA Technology / Vessel-In Vessel / Plasma Facing Components

- 99 - EFDA Technology / Vessel-In Vessel / Plasma Facing Components
CEFDA05-1248
Task Title: TW5-TVD-ACCEPT: INFLUENCE OF CARBON ERO SION ON THE ACCEPTANCE CRITERIA OF THE ITER DIVERTOR
ANSYS MODEL FOR EROSION
INTRODUCTION
The whole study consists in modelling the geometrical evolution of the eroded carbon monoblocks of the ITER Divertor during normal and off-normal operations, taking into account the distribution of their properties. The related acceptance criteria for SATIR tests should be determined to ensure the lifetime of the components, given a statistical variation of material properties. The 2005 activity consists in the analysis of the erosion model developed by ITER, which calculates the heating and the erosion of sets of carbon monoblocks subject to plasma heat flux at low angles. For the detached plasmas, the ion temperature is generally below the physical sputtering threshold for carbon, and one is left only with chemical sputtering and thermal sublimation. Above the threshold the situation is complicated by radiation enhanced sublimation and carbon self-sputtering with radiation-enhanced sublimation. Whichever case is assumed a feature of the temperature dependence is a peak of the erosion at around 900 K (see figure 1).
Figure 1: Gross erosion flux as function of surface
temperature for detached plasma case. The arrows show a bifurcated temperature steady state
solution. The dominant sputtering processes of graphite under hydrogen ion irradiation for different temperature ranges are summarized in table 1 (cf. [1], [2]).
Table 1: Theoretical main sputtering processes for graphite under hydrogen ion irradiation.
Physical sputtering occurs for all materials, independently of the chemical nature of the projectile and target atoms and of temperature. The surface atoms are ejected if they have received a sufficient kinetic energy from the incident ions to overcome the surface binding energy of the solid Es. This leads to mono-atomic carbon (C1) emission. A non-perpendicular angle of incidence enhances the sputtering yield [1]. Chemical sputtering is due to the chemical affinity between the implanted particles and the target materials. The ions penetrate at a depth of about a few hundred nanometres, diffuse in the bulk material and get trapped. Finally the hydrogen will react with carbon atoms or recombine with other implanted ions. These complex reactions lead to the emission of hydrocarbons (such as CH4, C2Hx, CH3 radicals and heavier hydrocarbons) and H2 molecules [3]. Radiation enhanced sublimation (RES) is specific to carbon-based materials having a graphitic structure. The incident ions create interstitial carbon atoms with a large mobility throughout the basal plane of the graphitic structure. Those may either recombine, agglomerate to form clusters or migrate then diffuse towards the surface and finally escape very easily (Van der Waals forces) from the material. This leads to the emission of mono-atomic carbon (C1) with an isotropic angular distribution [1]. Thermal sublimation consists essentially of the release of C1, C2 and C3 species [1]. As a phase transition it is characterized by a sudden change in physical properties, in particular the heat capacity, but a small change in a thermodynamic variable such as the temperature. When the ambient pressure equals the vapour pressure of the solid, the solid and vapour are in equilibrium. This is the equilibrium vapour pressure or saturation vapour pressure of the substance at the considered temperature. If the temperature decreases, vapour will condensate to solid; if the temperature increases, solid will turn to vapour to establish a new equilibrium condition. When the ambient pressure is ~0 Pa (in high vacuum), and kept at ~0 Pa (by pumping out the carbon ions), an equilibrium temperature is achieved, as a function of the thermal load applied onto the tile (the surface temperature is the main parameter that governs the “expulsion” of the ions from the heated surface). Brittle destruction occurs under thermal stress. Cracks propagate and cause holes in the exposed surface with emission of debris. This 2D ANSYS model was developed by the ITER International Team [4] with the purpose of calculate the heating and the erosion of sets of carbon monoblocks (CFC
Temperature range (K) Main sputtering process
0 – 500 and 900 - 1300 Physical sputtering
500 - 900 Chemical sputtering
1100 - 2000 Radiation enhanced sublimation
> 2000 Thermal sublimation

- 100 - EFDA Technology / Vessel-In Vessel / Plasma Facing Components
armour with a CuCrZr cooling tube and a pure copper compliance layer) subject to plasma heat flux at low angles (3°). As shown on figure 2, the geometry consists in a central monoblock surrounded by two halves of one monoblock (with cyclic conditions: the temperature at the left node is coupled with the temperature at the right node). It is possible to consider the presence of a CFC/Cu bonding defect within the central monoblock. To simulate the erosion progress, a refined mesh (100 µm × 9 µm) has been used up to 2 mm under the top surface of the components. Once the input data (material properties, monoblock dimension, type of thermal analysis, heat load, thermo-hydraulic conditions, mesh size, CFC/Cu defect characteristics…) have been provided to the code (through an interactive mode or within specific files), it calculates, for each element and time step, the integral on the time of the sublimated material. If the eroded thickness is above the thickness of the element, it is killed at the next time step; the heat load is applied to the new profile and the code goes this way until the end of the simulation.
Figure 2: 2D modelling of neighbouring carbon monoblocks
CONCLUSIONS
The ANSYS 2D model for the simulation of carbon monoblocks erosion is currently developed by the ITER International Team CEA provided experimental data from the literature for a better understanding of the involved phenomena and also from ITER technology development for the forthcoming validation of the model. So far the erosion due to the thermal sublimation has been taken into account. The chemical and physical erosion, and the possible radiation enhanced sublimation still have to be implemented. It worth being noticed that the shielding effect decreases considerably the erosion, by a factor of about 1000 for CFC; this may have to be included in the model. Enhancement of erosion by brittle destruction may be considered in case of thermal fatigue cycling.
FUTURE WORK The model shall be achieved by implementing the various phenomena and validated on the basis of the few available experimental data. Then the study will consist in running the model for various material properties and plasma conditions reflecting those expected for ITER, in order to determine the acceptable range of thermal properties of the carbon monoblocks from the point of view of excessive erosion, the related acceptance criteria for the SATIR tests and/or optimization of the starting thickness of carbon. REFERENCES
[1] T. Paulmier et al., Physico-chemical behaviour of
carbon materials under high temperature and ion irradiation, Applied Surface Science, 180 (2001), 227-245
[3] J. Roth, Chemical erosion of carbon based materials in
fusion devices, Journal of Nuclear Materials, 266-269 (1999), 51-57
[4] E. D'Agata, S. Grigoriev, G. Federici, C. Ibbott, A.
Makhankov, V. Tanchuk and R. Tivey, Behaviour of the PFC tiles on the ITER divertor under critical loading conditions Fusion Engineering and Design, 66-68 (2003), 329-334
REPORTS AND PUBLICATIONS
[2] CFP/NTT-2005.013, Influence of the carbon erosion
on the acceptance criteria of the ITER divertor EFDA CONTRACT N°05-1248 INTERMEDIATE REPORT 1: ANSYS model for erosion simulation
TASK LEADER
Jacques SCHLOSSER DSM/DRFC/SIPP/GCFP CEA-Cadarache F-13108 Saint-Paul-lez-Durance Cedex Tel. : 33 4 42 25 25 44 Fax : 33 4 42 25 49 90 e-mail : [email protected]

- 101 - EFDA Technology / Vessel-In Vessel / Plasma Facing Components
CEFDA05-1257
Task Title: TW5-TVB-JOINOP: OPTIMIZATION OF Be/CuCr Zr HIP JOINING FOR FW PANELS
INTRODUCTION
In International Thermonuclear Experimental Reactor (ITER), the first wall panel is nearest the plasma. Thus it will be submitted to high heat flux, neutron bombardment and electromagnetic forces. To resist to all these extreme conditions, the first wall is composed with several materials which are beryllium armor tiles, copper alloy (CuCrZr) with embedded stainless steel (SS) cooling pipes as the heat sink and stainless steel baking plate. All these materials must be metallurgically bonded by Hot Isostatic Pressing (HIP) to remove the heat with high efficiency. As concerns bonding between CuCrZr and stainless steel, the manufacture of several mock-ups have successfully demonstrated the quality of the CuCrZr/SS junctions. Now we focus our attention on Be/CuCrZr bonding. 2005 ACTIVITIES
In 2005, a program to investigate experimentally the influence of several solutions to improve the Be/CuCrZr bonding by HIP has been established. INTERLAYERS To manufacture a Primary First Wall (PFW) panel, the junction between beryllium tiles, CuCrZr heat sink and stainless steel is done is two steps. Firstly, CuCrZr/SS junction is performed by HIP processing at 1040°C, followed by a HIP quench. Secondly, the beryllium tiles are bonded on the CuCrZr plate by a second HIP processing at 580°C. This last HIP process age-hardens the CuCrZr and gives it good mechanical properties. At this temperature, beryllium reacts with copper to form brittle compounds at the interface which can reduce the mechanical properties of the Be/CuCrZr junction. To prevent the formation or to limit the thickness of these brittle compounds and to favor the diffusion bonding, we investigate the influence of some interlayers at the Be/CuCrZr interface [1],[2]. These interlayers are aluminum, titanium, chromium, silicon and nickel. These interlayers are deposited by Physical Deposition Process (PVD) on the bonding surface of the beryllium and their thickness is about 3 µm. These thin layers have been realized on february at Framatome ANP (see figure 1). CLEANLINESS As the mechanical performance of a junction depends on the cleanliness of the bonding surface, we investigate two ways to remove pollution on the CuCrZr metallic surface. The first industrial way allows the investigation of solvent and/or detergents products to eliminate organic pollution. These products will be tested on both stainless steel and
CuCrZr blocks in order to manufacture CuCrZr/CuCrZr and CuCrZr/SS joints. Their mechanical strength will be compared to previous experimental tests. The second way investigates the influence of a post-discharge plasma.
Figure 1: 3 µm aluminum and titanium layers deposited by PVD on a 38 x 38 x 9 mm beryllium tiles.
This method, tested on small specimens at “CNRS-Laboratoire de Science et de Genie des Surfaces” uses two types of plasmas to clean the metallic surfaces. Organic pollution is primary eliminated by using an Ar-N2-O2 discharge. Then, the oxide layer is eliminated by using Ar-N2-H2 plasma. This method has given great results on laboratory’s specimens [3] and it will be adapted to clean CuCrZr and SS blocks with larger dimensions. These blocks will be used to manufacture CuCrZr/SS junctions that will be compared mechanically to CuCrZr/SS reference junction. Residual pollution on the metallic surface will be also analyzed by XPS to correlate the pollution level of the material to the mechanical strength of the junction.
Al
Ti
CuCrZr
CuCrZr

- 102 - EFDA Technology / Vessel-In Vessel / Plasma Facing Components
ANTI-DIFFUSION BARRIER To avoid any diffusion between the stainless canister wall and the beryllium tiles during the HIP process, anti-diffusion materials are investigated. These materials should prevent any pollution of the beryllium surface which will be in contact with the ITER’s plasma and thus, reduce the machining cost of the PFW panels. Materials investigated are mainly oxides (TiO2, SiO2, Al2O3, MgO, ZrO2). Si3N4 and BN are also good challengers. Scale model to test these materials under HIP conditions at 580°C is presented on figure 2. At the moment, experiments are in progress to analyze the influence of ZrO2 thickness coating on the performance of anti-diffusion barrier.
Figure 2: photograph of a CuCrZr/Ni/CuCrZr junction with
two lateral CuCrZr blocks coated by a thin layer of anti-diffusion material to test their performance
(HIP processing at 580°C) INSERTS BETWEEN BERYLLIUM TILES To separate the beryllium tiles one from each other during HIP processing, inserts are used. Up to this moment, graphite is retained. However this material contains a lot of pollution that may diffuse up to the Be/CuCrZr interface and then reduce its mechanical strength. New materials are investigated in our program. These materials have very different hardness in order to analyze their influence on the residual stress at the beryllium CuCrZr interface after the HIP process. HIGH FLUX AND THERMAL FATIGUE TESTS Experimental conditions presented above will be tested under high flux and thermal fatigue. Mock-ups to performthese tests are under fabrication (figure 3).
Figure 3: Mock-ups to test under high flux and thermal fatigue the experimental optimization of the Be/CuCrZr
junctions.
CONCLUSIONS
To optimize the mechanical behaviour of Be/CuCrZr joints, a list of experiments have been proposed. The experiments will allow to test the influence of interlayers, anti-diffusion barrier and cleanliness of the CuCrZr material on the mechanical strength of the Be/CuCrZr joints. At the moment, the main mechanical pieces are machined and the experiments have started (interlayers and anti-diffusion barrier experiments). First results will be obtained in may 2006. REFERENCES
[1] “Application of a diffusion bonding methodology to
develop a Be/Cu HIP bond suitable for the ITER blanket”, P. Sherlock, A. Erskine, P. Lorenzetto, A.T. Peacock, Fusion Engineering and Design, 66-68 (2003) pp. 425-429.
[2] “HIP bonding of beryllium and ph-copper (CuCrZr)”,
M. Uda, T. Hatano, T. Iwadachi and Y.Ito, IEA International workshop on beryllium technology for fusion, Moscow (Russian Federation), 10-12 Oct 2001, pp33-39
[3] “Préparation de surfaces industrielles par plasma
froids. Contribution à l’étude des mécanismes élémentaires d’interaction entre une post-décharge N2-O2 et l’hexatriacontane”, V. Hody, Thèse de doctorat, Institut National Polytechnique de Lorraine, 2004.
TASK LEADER
Pierre Eric FRAYSSINES DRT/DTH/LTH CEA-Grenoble 17, rue des Martyrs F-38054 Grenoble Cedex 9 Tel : 33 4 38 78 28 59 Fax : 33 4 38 78 54 79 e-mail : [email protected]
Anti-diffusion surface coating
CuCrZr/Ni/CuCrZr

- 103 - EFDA Technology / Vessel-In Vessel / Plasma Facing Components
TW1-TVP-CFC1
Task Title: NEUTRON EFFECTS ON DIMENSIONAL STABILIT Y AND THERMAL PROPERTIES OF CFCs
INTRODUCTION
Carbon Fiber Composites (CFCs) are considered as an attractive choice for high heat flux components in existing and forthcoming tokamaks such as ITER. Two CFCs are particularly interesting for fusion devices: NB31 from SNECMA which is a 3D CFC constituted by a NOVOLTEX preform, with P55 ex-pitch fibers in the high thermal conductivity direction and NS31 which is a Si doped 3D N31 CFC [1]. In one hand, the aim of this task is to study density, specific heat capacity and thermal conductivity changes of NB31 and NS31 irradiated in the PARIDE (PlAsma facing mateRIals for ITER and DEMO) 3 and 4 irradiations, performed in HFR/Petten at 250/260°C with two damage levels (0.24 and 0.83 dpa.g) [2]. Moreover the activity of the different radionuclides contained in these two CFCs has been measured. In the other hand, the study of the dimensional, density and thermal conductivity changes of the same CFCs grades irradiated in the RBT-6 nuclear reactor (Dimitrovgrad, Russia) at 90°C with damage levels ranging from 0.002 to 0.13 dpa.g has been carried out. 2005 ACTIVITIES
In 2005, NB31 and NS31 dimensional, density and thermal conductivity measurements after irradiation in the RBT-6 reactor have been carried out [3]. Moreover, quantitative γ spectrometry results of irradiated NB31 and NS31 CFCs carried out in july 2003 are reported in order to check semi–quantitative γ spectrometry results carried out in january 2003 and reported previously [2]. The NB31 and NS31 samples were irradiated in the RBT-6 reactor at 90 ± 10°C. The fast neutron flux in the active zone is 4.1 – 6.7 1013 n.cm-2.s-1 (E > 0.1 MeV). The samples have been irradiated at five different fluences (table 1).
Table 1: Fluences and neutron damages received by the irradiated samples
Fluence
1019 n.cm-2 (E > 0.1 MeV)
Damage
(dpa.g)
0.28 0.0021
1.85 0.014
3.31 0.025
8.86 0.067
17.2 0.13
DIMENSIONAL CHANGES NB31 and NS31 dimensional changes have been measured in the three directions: X direction (ex-pitch fibers direction), Y direction (ex-PAN direction) and Z direction (needling direction). For NB31, there is no significant dimensional change up to 0.067 dpa.g (figure 1); at higher neutron damage (0.13 dpa.g), there is a slight shrinkage (-0.8 %) in the ex-pitch fibers direction, a slight swelling (0.9 %) in the ex-PAN fibers direction and a swelling (3.2 %) in the needling direction. This anisotropic dimensional behaviour is expected after irradiation at so low temperature and has already been reported for a 2D Russian CFC irradiated in the same conditions [4].
Figure 1: NB31 dimensional changes after irradiation at 90°C
For NS31, there is no significant dimensional change in the X direction up to 0.13 dpa.g. In the Y and Z directions significant dimensional changes appear beyond 0.067 dpa.g, that means, shrinkage in the ex-PAN fibers direction and swelling in the needling direction (figure 2).
Figure 2: NS31 dimensional changes after irradiation at 90°C
NB31 DIMENSIONAL CHANGES
-2
-1
0
1
2
3
4
0,001 0,01 0,1 1
X directionY directionZ direction
damage (dpa.g)
€€€€L/L (%)∆∆∆∆
NS31 DIMENSIONAL CHANGES
-3
-2
-1
0
1
2
3
4
5
0,001 0,01 0,1 1
X directionY direction
Z direction
ξξξξ L/L (%)
damage (dpa.g)
∆∆∆∆

- 104 - EFDA Technology / Vessel-In Vessel / Plasma Facing Components
DENSITY CHANGES Up to 0.067 dpa.g, there is no significant densification (0.3 % to 1 %) of NB31, then a density loss occurs at higher damages (- 3.8 % at 0.13 dpa.g), mainly due to the swelling in the needling direction (figure 3). For NS31, there is no significant density change (-0.7 % to 0.7%) up to 0.13 dpa.g.
Figure 3: NB31 mass, volume and density changes after irradiation at 90°C
HEAT CAPACITY AND STORED ENERGY The heat capacity of these CFCs has been measured before irradiation (table 2) [5]. The heat capacity values of the irradiated CFCs used for the thermal conductivity calculations are those measured in the PARIDE 3 and PARIDE 4 irradiations [2]. Table 2: NB31 and NS31 heat capacity before irradiation
Measurement
temperature (K)
NB31 Cp0
(J.kg-1. K-1)
NS31 Cp0
(J.kg-1. K-1)
298 723 710
323 778 766
373 918 898
Stored energy often referred as Wigner energy, occurs in neutron irradiated graphite because carbon atoms are displaced by fast neutrons from their initial lattice positions into configurations of higher potential energy. During irradiation, simultaneous thermal and irradiation annealing takes place, but there is a net energy gain which depends on both neutron fluence and irradiation temperature. For graphite irradiation temperatures higher than 350°C the accumulation of stored energy is negligible. Below 350°C significant amount of Wigner energy can be accumulated, moreover at irradiation temperatures below 150°C, the amount of energy is larger and may be released at lower temperature. Graphite thermal instability due to Wigner energy occurs if the two following conditions are fulfilled:
- Irradiation temperature < 115°C - Neutron fluence > 1.54 1020 n.cm-2 (E > 0.1 MeV)
In practice, for graphite irradiated between 30°C et 120°C, most of the stored energy is concentrated in a « peak » located around 200°C. The height of this « peak » decreases when the irradiation temperature increases.
CFCs, such as NB31, are constituted of graphitic structures; therefore Wigner energy is stored in such materials when they are irradiated at low temperature. It is possible to get a stored energy evaluation in NB31, using a comparison with graphite irradiated in G1 French gas cooled reactor at a temperature leading to the same damage level, due to neutron flux effects. Due to the difference of neutron flux in G1 (0.2 1013 n.cm-2.s-1) and in the RBT-6 reactor (5.4 1013 n.cm-2.s-1); an irradiation temperature of 90°C in the RBT-6 is equivalent to an irradiation temperature of 61°C in G1. The enthalpy H(θ)400 obtained by integration between 20°C and 400°C of the energy spectrum measured by differential thermal analysis, with samples irradiated in G1 at 60 °C and 1.66 1020 n.cm-2 (E > 0.1 MeV) corresponding to 0.125 dpa.g, is 326 J/g [6]. So, we can assume that the enthalpy H(θ)400 of NB31 irradiated at 0.13 dpa.g, is about 326 J/g.
THERMAL CONDUCTIVITY CHANGES The NB31 thermal conductivity at 100°C before irradiation is 328 W.m-1.K-1. After irradiation at 90°C, it dramatically drops to 80 W.m-1.K-1 when the neutron damage is 0.0021 dpa.g and to 5.3 W.m-1.K-1 when the neutron damage is 0.13 dpa.g (figure 4). The NS31 thermal conductivity shows exactly the same behaviour after irradiation in the same conditions. These results are in very good agreement with those provided by Barabash et. al [7].
NB31 THERMAL CONDUCTIVITY
1
10
100
1000
0 10 20 30 40 50 60 70 80 90 100
Measurement temperature (°C)
Unirradiated Irradiated at 0,0021 dpa.gIrradiated at 0,014 dpa.g Irradiated at 0,025 dpa.gIrradiated at 0,067 dpa.g Irradiated at 0,13 dpa.gK (W.m -1.K -1)
Irradiation temperature: 90°C
Figure 4: NB31 thermal conductivity as a function of the measurement temperature for different neutron damages
Generally, CFC normalized thermal conductivity at the irradiation temperature (Ki/K0)Tirr decreases with increasing neutron damage for irradiation temperature between 400°C and 1200°C. This decrease is a logarithmic function of neutron damage from 10−3 to 2 dpa.g. However this is not the case for NB31 and NS31 (Ki/K0)Tirr after irradiation at 90°C. This ratio strongly decreases at the lower neutron damage, then this decrease becomes smaller and smaller as the neutron damage increases, to finally reach a saturation level (figure 5). The irradiation temperature is the main parameter in the thermal conductivity changes. After irradiation at very low damage (∼ 0.1 dpa.g), CFCs (Ki/K0)Tirr ratio increases of a factor 8 when the irradiation temperature increases from 90°C to 150°C, and of a factor 21 when it increases from 90°C to 400°C.
NB31 MASS, VOLUME AND DENSITY CHANGES
-8
-6
-4
-2
0
2
4
6
8
0,001 0,01 0,1 1
Mass change
Volume change
Density change
damage (dpa.g)
(%)

- 105 - EFDA Technology / Vessel-In Vessel / Plasma Facing Components
NB31 NORMALIZED THERMAL CONDUCTIVITY
0,00
0,05
0,10
0,15
0,20
0,25
0,30
0,001 0,01 0,1 1
Neutron damage (dpa.g)
Ki/K0 at 25°C
Ki/K0 at the irradiation temperature
K I/K0X direction
Irradiation temperature: 90°C
Figure 5: NB31 thermal conductivities as a function of neutron damage after irradiation at 90°C
γγγγ SPECROMETRY OF CARBON FIBER COMPOSITES IRRADIATED IN PARIDE 3 AND 4 IRRADIATIONS In july 2003, quantitative γ spectrometry measurements have been carried out on NB31 (tables 3 and 4) and NS31 (table 5) samples irradiated in PARIDE 3 and PARIDE 4 irradiations (HFR/Petten), in order to check the activity values of semi-quantitative measurements performed in December 2002 on the same NB31 (tables 6 and 7) and NS31 (table 8 ) samples.
Table 3: γ activity in december 2002 (Bq/g), measured in july 2003, of NB31 irradiated at 260°C/0.24 dpa.g
Isotope γ activity (Bq/g)
Distribution of the γ activity (%)
Total 2460 100 60Co 1150 46.7 152Eu 840 34.1 154Eu 290 11.8 155Eu 90 3.7 46Sc 20 0.8
54Mn 60 2.4 65Zn 10 0.4
Table 4: γ activity in december 2002 (Bq/g), measured in july 2003, of NB31 irradiated at 250°C/0.83 dpa.g
Isotope γ activity (Bq/g)
Distribution of the γ activity (%)
Total 6330 100 60Co 3430 54.2 152Eu 520 8.2 154Eu 1580 25 155Eu 630 10 46Sc 30 0.5
54Mn 120 1.9 65Zn 20 0.3
Table 5: γ activity in december 2002 (Bq/g), measured in july 2003, of NS31 irradiated at 250°C/0.83 dpa.g
Isotope γ activity (Bq/g)
Distribution of the γ activity (%)
Total 155260 100 60Co 131260 83.9 152Eu 2420 1.5 154Eu 2770 1.7 155Eu 1040 0.5 46Sc 440 0.1
54Mn 16020 11.7 65Zn 1310 0.6
Table 6: γ activity in december 2002 (Bq/g), measured in december 2002, of NB31 irradiated at 260°C/0.24 dpa.g
Isotope γ activity (Bq/g)
Distribution of the γ activity (%)
Total 4250 100 60Co 2000 47.1 152Eu 1400 32.9 154Eu 510 12 155Eu 170 4 46Sc 40 0.9
54Mn 100 2.4 65Zn 30 0.7
Table 7: γ activity in december 2002 (Bq/g), measured in december 2002, of NB31 irradiated at 250°C/0.83 dpa.g
Isotope γ activity (Bq/g)
Distribution of the γ activity (%)
Total 11350 100 60Co 5970 52.6 152Eu 910 8 154Eu 2720 24 155Eu 1400 12.3 46Sc 60 0.5
54Mn 220 1.9 65Zn 70 0.6
Table 8: γ activity in december 2002 (Bq/g), measured in december 2002, of NS31 irradiated at 250°C/0.83 dpa.g
Isotope γ activity (Bq/g)
Distribution of the γ activity (%)
Total 276000 100 60Co 231520 83.9 152Eu 4100 1.5 154Eu 4770 1.7 155Eu 1480 0.5 46Sc 250 0.1
54Mn 32250 11.7 65Zn 1630 0.6

- 106 - EFDA Technology / Vessel-In Vessel / Plasma Facing Components
The γ activities as given by quantitative γ spectrometry measurements are 43 % lower than those as given by the semi-quantitative method. For NB31, the ratio of the activity after irradiation at 0.83 dpa.g on that after irradiation at 0.24 dpa.g, is in good agreement with the ratio of the fluences. Half of the irradiated NB31 total γ activity is provided by 60Co. In the same irradiation conditions, the NS31 total γ activity is 24 times larger than that of NB31. More than 80 % of the NS31 total activity is due to 60Co, mainly produced by the reaction 59Co (n,γ) 60Co. This means that NS31 contains a larger cobalt impurity amount than NB31. CONCLUSIONS
The main conclusions which can be drawn from these irradiation experiments are the following:
- For NB31 and NS31, significant dimensional changes appear beyond 0.067 dpa.g. For NB31, there is a slight shrinkage in the ex-pitch fibers direction, a slight swelling in the ex-PAN fibers direction and a larger swelling in the needling direction. For NS31, there is a shrinkage in the ex-PAN fibers direction and a swelling in the needling direction.
- NB31 shows a density loss at 0.13 dpa.g, mainly due to
the swelling in the needling direction. For NS31, there is no significant density change.
- During irradiation at 350°C, significant amount of
Wigner energy can be stored in CFCs. Using a comparison with graphite irradiated in G1 reactor, we have made the assumption that the H(θ)400 of NB31 irradiated at 90°C/0.13 dpa.g is about 326 J/g.
- After irradiation at 90°C, the NB31 and NS31 thermal
conductivity dramatically drops even at neutron damage as low as 0.13 dpa.g.
- Generally, CFC normalized thermal conductivity
(K i/K0)Tirr shows a decrease with increasing neutron damage from 10−3 to 2 dpa.g, for irradiation temperature ranging from 400°C to 1200°C. However this is not the case for NB31 and NS31 (Ki/K0)Tirr after irradiation at 90°C.
- The irradiation temperature is the main parameter in
the thermal conductivity changes. After irradiation at 0.1 dpa.g, CFCs (Ki/K0)Tirr ratio increases of a factor 8 when the irradiation temperature increases from 90°C to 150°C.
- The γ activities as given by quantitative γ spectrometry
measurements are 43 % lower than those as given by the semi-quantitative method. Half of the NB31 and 80 % of the NS31 total γ activities are provided by 60Co. In the same irradiation conditions, the NS31 total γ activity is 24 times larger than that of NB31.
REFERENCES
[1] Simulation experimental investigation of plasma off-normal events on advanced silicon doped CFC-NS31 - J.P. BONAL, C.H. WU, D. GOSSET Journal of Nuclear Materials 307-311 (2002) p. 100-105.
[4] Post-irradiation strength of carbon candidate constructional materials for fusion reactors" O.I. BUZHINSKIJ, YU.S. VIRGILIEV , E.I. KUROLENKIN Journal of Nuclear Materials 185 (1991) 78-86
[6] Energie emmagasinée par le graphite irradié. Effet
de la température d’irradiation" - J. RAPPENEAU Journal of Nuclear Materials 6, N°1 (1962), p 107-118
[7] The effect of low temperature neutron irradiation
and annealing on the thermal conductivity of advanced carbon-based materials V. BARABASH, I. MAZUL, R. LATYPOV, A. POKROVSKY, C.H. WU Journal of Nuclear Materials 307-311 (2002) 1300-1304
REPORTS AND PUBLICATIONS
[2] Thermal properties changes of carbon fiber
composites irradiated at low temperature. PARIDE 3/4 experiment - J.P. BONAL Rapport DMN/SEMI/LM2E/RT/03-009/A
[3] Neutron irradiation effects on NB31 and NS31 carbon fiber composites irradiated at low temperature. - J.P. BONAL Document technique DMN/SEMI/LM2E/RT/03-009/A
[5] Thermal properties of carbon fiber composites
before irradiation in PARIDE 3/4 experiment" J.P. BONAL Rapport DMT SEMI/LM2E/RT2004, janvier 2000
TASK LEADER Jean-Pierre BONAL DEN/DMN/SEMI/LM2E CEA-Saclay F-91191 Gif-sur-Yvette Cedex Tel. : 33 1 69 08 50 58 Fax : 33 1 69 08 90 73 e-mail : [email protected]

- 107 - EFDA Technology / Vessel-In Vessel / Plasma Facing Components
TW5-TVD-CUCFC
Task Title: DEVELOPMENT OF ALTERNATIVE CFC/Cu JOINI NG TECHNIQUES
INTRODUCTION
The objective of the activity is to develop a new process for joining CFC (carbon fibre reinforced carbon composite) to the Cu compliant layer in view of the fabrication of divertor components. This technology has to be different from the available industrial process [1]. After an analysis of the state of the art, CEA started to evaluate a new solution for CFC / Cu joining that includes the following steps: - the first step of the process is the definition of an adequate surface preparation of the CFC in order to allow a sufficient anchoring of the copper into the CFC. It includes engraving of the surface by mechanical means, metallization and infiltration of the CFC with alloys able to wet the CFC. - the second step of the process is the selection of a joining system. It includes the choice of the surface treatment, of the braze and of the thermal treatment. Only vacuum brazing experiments have been carried out in this second step. 2005 ACTIVITIES
STATE OF THE ART The most relevant patents for joining metal / carbon based materials are US 5533258, US 64443354, US 5740955. Patents US 5160090, US 5340658, US 6316048 B1 are relevant for surface treatment in order to increase adhesion between metal and CFC. The analysis of these documents by CEA is detailed in an interim report.
SURFACE PREPARATION OF THE CFC Metallisation and infiltration of CFC with BraSiC ® alloys CEA has studied the wetting of the CFC NB31 (without Si-doping) and its metallisation by BraSiC alloys. Two alloys named BraSiCC1 and BraSiCC2 have been defined in order to allow a good wetting of the CFC and thus a metallisation of the CFC’s surface. These two alloys are constituted of the same elements but with different compositions. They have been elaborated by melting the pure chemical elements. These alloys are referenced 4872-Sc (BraSiCC1) and 4888-Sc (BraSiCC2). The wetting and metallisation experiments have been performed under vacuum in a graphite furnace. The results are summarized in table 1. The sizes of the CFC to be treated are: 20x15x8 mm3. The CFC is referenced by EFDA 2369559 batch 43. Samples 4887-Sc, 4887B-Sc, 4890-Sc, 4891-Sc, 4892-Sc are not well wetted by the BraSiC alloys (see table 1, figure 1). The form of the BraSiC alloy has an impact on the wetting mechanisms since alloy C1 in the form of powder gives a contact angle of about 0° at 1250°C / 20 minutes (sample 4904-Sc) whereas a contact angle of 180° is observed in the bulk form (sample 4887B-Sc – see table 1 and figure 1) at the same temperature and time. The temperature is a relevant parameter in the control of the wetting. Indeed, at 1000°C, the contact angle is still high (180°). Thus, experiments have been carried out at 1250°C /20 minutes with the BraSiC alloys in the form of powder. In order to optimize the quality of the coating with these alloys, the mass of BraSiC alloy has to be controlled (see table 1). Sample 4919-Sc (figure 2) has been successfully coated with the alloy C2. The parameters (temperature, time, mass of alloy) have still to be optimized in the range between 1000°C and 1250°C.
Table 1: Samples for wetting and coating experiments
Sample CEA reference
BraSiC alloys Mass of alloy (mg)
Temperature / time Result
4887-Sc C1 bulk 920°C / 5 min Contact angle: 180° 4887B-Sc C1 bulk 1250°C / 20 min Contact angle: 180° 4890-Sc C1 bulk 1000°C / 60 min Contact angle: 180° 4891-Sc C1 powder 335 1000°C / 60 min Contact angle: 180° 4892-Sc C2 powder 290 1000°C / 60 min Contact angle: 180° 4893-Sc C2 powder 1044 1400°C / 5 min Evaporation of the alloy C2 4904-Sc C1 powder 303 1250°C / 20 min Contact angle ~ 0° 4905-Sc C2 powder 302 1250°C / 20 min Partial metallisation 4918-Sc C2 powder 394 1250°C / 20 min Partial metallisation 4919-Sc C2 powder 891 1250°C / 20 min Good metallisation of all the CFC 4920-Sc C1 powder 419 1250°C / 20 min Bad metallisation
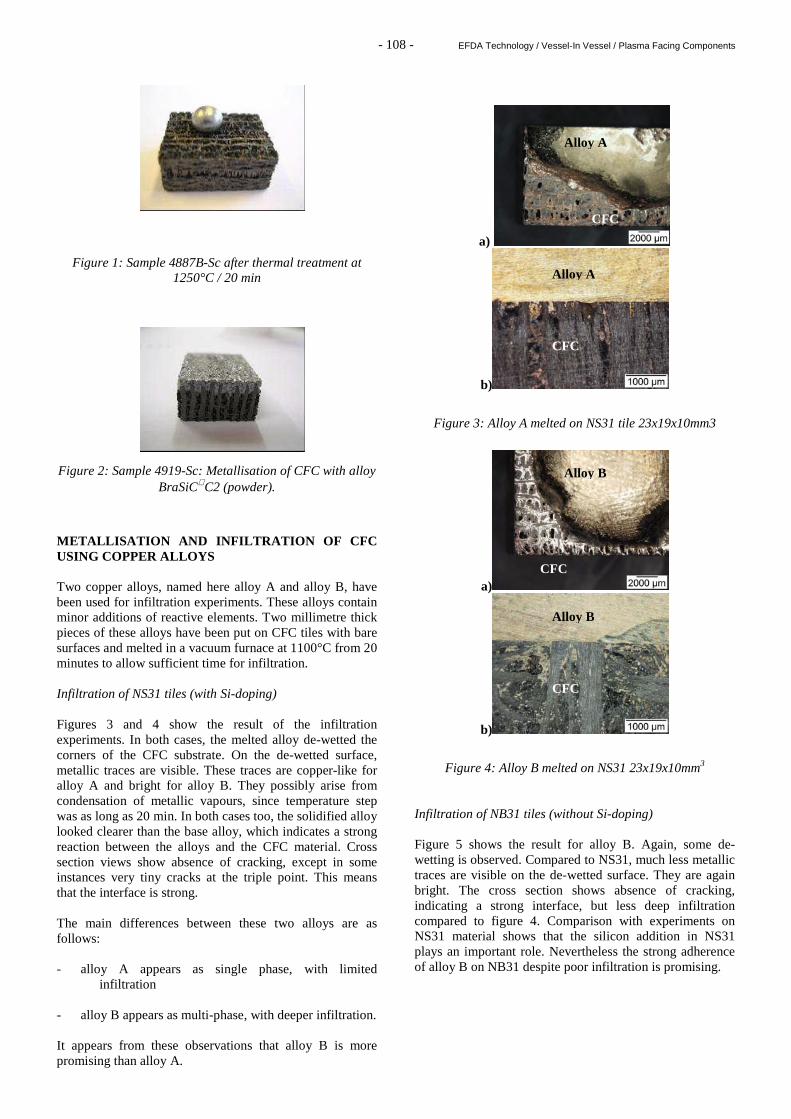
- 108 - EFDA Technology / Vessel-In Vessel / Plasma Facing Components
Figure 1: Sample 4887B-Sc after thermal treatment at 1250°C / 20 min
Figure 2: Sample 4919-Sc: Metallisation of CFC with alloy BraSiCC2 (powder).
METALLISATION AND INFILTRATION OF CFC USING COPPER ALLOYS Two copper alloys, named here alloy A and alloy B, have been used for infiltration experiments. These alloys contain minor additions of reactive elements. Two millimetre thick pieces of these alloys have been put on CFC tiles with bare surfaces and melted in a vacuum furnace at 1100°C from 20 minutes to allow sufficient time for infiltration. Infiltration of NS31 tiles (with Si-doping) Figures 3 and 4 show the result of the infiltration experiments. In both cases, the melted alloy de-wetted the corners of the CFC substrate. On the de-wetted surface, metallic traces are visible. These traces are copper-like for alloy A and bright for alloy B. They possibly arise from condensation of metallic vapours, since temperature step was as long as 20 min. In both cases too, the solidified alloy looked clearer than the base alloy, which indicates a strong reaction between the alloys and the CFC material. Cross section views show absence of cracking, except in some instances very tiny cracks at the triple point. This means that the interface is strong. The main differences between these two alloys are as follows: - alloy A appears as single phase, with limited
infiltration
- alloy B appears as multi-phase, with deeper infiltration. It appears from these observations that alloy B is more promising than alloy A.
a)
b)
Figure 3: Alloy A melted on NS31 tile 23x19x10mm3
a)
b)
Figure 4: Alloy B melted on NS31 23x19x10mm3 Infiltration of NB31 tiles (without Si-doping) Figure 5 shows the result for alloy B. Again, some de-wetting is observed. Compared to NS31, much less metallic traces are visible on the de-wetted surface. They are again bright. The cross section shows absence of cracking, indicating a strong interface, but less deep infiltration compared to figure 4. Comparison with experiments on NS31 material shows that the silicon addition in NS31 plays an important role. Nevertheless the strong adherence of alloy B on NB31 despite poor infiltration is promising.
Alloy B
Alloy A
Alloy B
CFC
CFC
CFC
Alloy A
CFC

- 109 - EFDA Technology / Vessel-In Vessel / Plasma Facing Components
Figure 5: Alloy B melted on NB31 20x15x8.5 mm3.
The tile was with a bare surface.
SURFACE MACHINING BY MICRO ELECTRO-EROSION CEA has defined a surface structuration with the following properties: - depth of the holes: strictly between 2 mm and 3 mm. - diameter ~ 0,3 mm ± 0,1 mm - space between 2 holes ~ 0,3 mm ± 0,1 mm. The effect of this treatment will be evaluated associated with the brazing step. It means the selected brazing process will be tested on such a structured CFC. According to the results, the parameters of the structuration will be modified. BRAZING CFC WITH COPPER Brazing copper with CFC metallised by BraSiC® alloy CEA used metallised CFCs for joining with pure copper. First brazing experiments have been carried out in a graphite furnace under vacuum. Samples 4918-Sc and 4919-Sc have been simply covered with copper (20x15x2 mm3) and placed in the furnace to be submitted to the following thermal treatment: 900°C / 15 minutes. After this cycle, 4919-Sc was apparently well brazed (figure 6). On the contrary, sample 4918-Sc was not brazed. This is certainly due to the fact that the mass of alloy C2 used for
its metallization is lower than that applied on 4919-Sc (394 mg for 4918-Sc and 891 mg for 4919-Sc). Most of the alloy has infiltrated the CFC and, as a consequence, not enough alloy was available for coating the CFC’s surface that led to a partial metallisation.
Figure 6: Sample 4919B-Sc brazed Sample 4919B-Sc has been characterized by scanning electron microscopy. Alloy C2 has infiltrated about 2 mm of the CFC essentially during the metallisation step. The infiltrated zones of the CFC have been characterized and exhibit a very good wetting of the CFC by the alloy C2. Very small precipitates are observed at the interface between the carbon fibre of the CFC and the BraSiC® alloy (size ≤ 1 µm). The reaction associated to the formation of these precipitates is certainly related to the wetting of the carbon fibre by the alloy C2. Brazing CFC with copper using commercial filler alloys Three experiments have been made using brazing alloys, pure oxygen free copper (Cu-OF) and NB31 tiles with a bare surface. They are described in table 2. The same vacuum furnace as above was used. These experiments have shown that, within the experimental range studied here, it is not possible to achieve simultaneously a deep infiltration and a fine microstructure (i.e. a thin reaction layer and intermetallic-free copper). Nevertheless, the most promising result is obtained with copper ABA.
Figure 7: OF-Cu brazed on NB31 with 0.5 mm copper ABA.
Table 2: Cu / NB31 brazing experiments conditions.
Braze Copper ABA (92.75Cu-2.25Ti-2Al-3Si, Tliq=1024°C), 0.5 mm
TiCuNi70 (70Ti-15Cu-15Ni Tliq=960°C), 0.45 mm
Ti (Tliq=875°C for Cu-Ti eutectic), 0.2 mm
Cycle 1060°C, 20 min 1000°C, 20 min 1000°C, 20 min
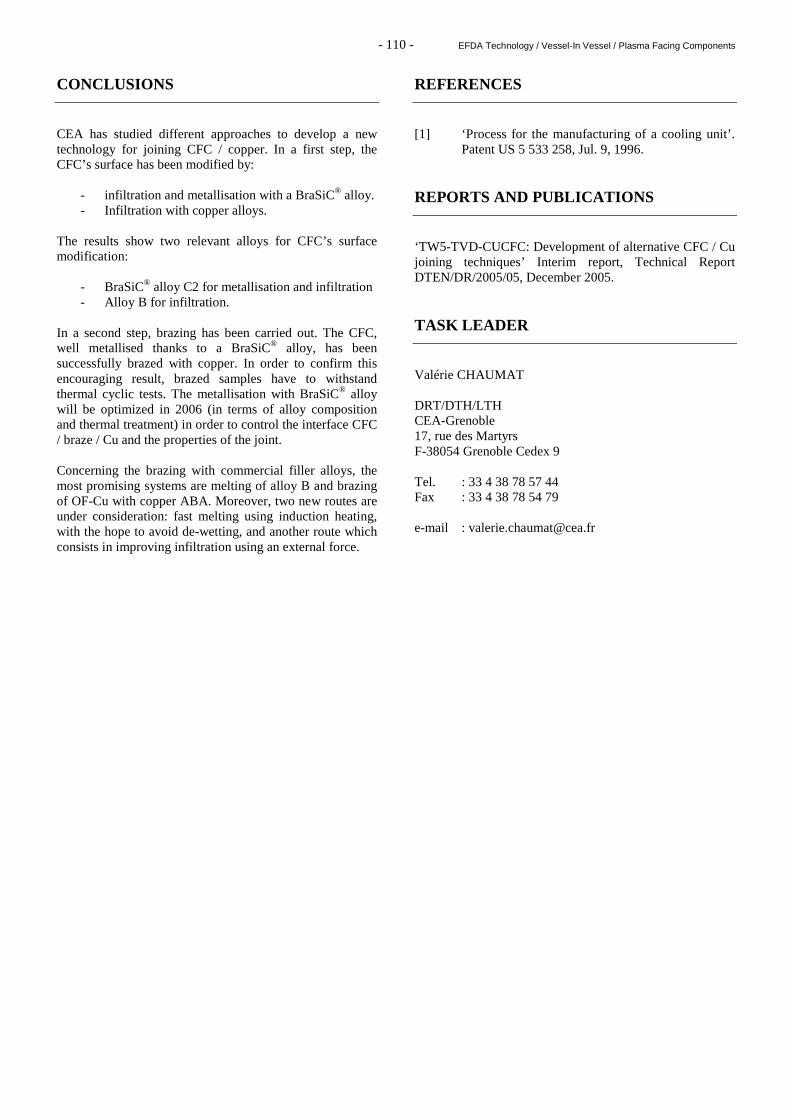
- 110 - EFDA Technology / Vessel-In Vessel / Plasma Facing Components
CONCLUSIONS
CEA has studied different approaches to develop a new technology for joining CFC / copper. In a first step, the CFC’s surface has been modified by:
- infiltration and metallisation with a BraSiC® alloy. - Infiltration with copper alloys.
The results show two relevant alloys for CFC’s surface modification:
- BraSiC® alloy C2 for metallisation and infiltration - Alloy B for infiltration.
In a second step, brazing has been carried out. The CFC, well metallised thanks to a BraSiC® alloy, has been successfully brazed with copper. In order to confirm this encouraging result, brazed samples have to withstand thermal cyclic tests. The metallisation with BraSiC® alloy will be optimized in 2006 (in terms of alloy composition and thermal treatment) in order to control the interface CFC / braze / Cu and the properties of the joint. Concerning the brazing with commercial filler alloys, the most promising systems are melting of alloy B and brazing of OF-Cu with copper ABA. Moreover, two new routes are under consideration: fast melting using induction heating, with the hope to avoid de-wetting, and another route which consists in improving infiltration using an external force.
REFERENCES
[1] ‘Process for the manufacturing of a cooling unit’.
Patent US 5 533 258, Jul. 9, 1996. REPORTS AND PUBLICATIONS
‘TW5-TVD-CUCFC: Development of alternative CFC / Cu joining techniques’ Interim report, Technical Report DTEN/DR/2005/05, December 2005. TASK LEADER
Valérie CHAUMAT DRT/DTH/LTH CEA-Grenoble 17, rue des Martyrs F-38054 Grenoble Cedex 9 Tel. : 33 4 38 78 57 44 Fax : 33 4 38 78 54 79 e-mail : [email protected]

- 111 - EFDA Technology / Vessel-In Vessel / Remote Handling
TW5-TVR-AIA
Task Title: ARTICULATED INSPECTION ARM (AIA)
INTRODUCTION
This project takes place in the Remote Handling (RH) activities for the next step of the fusion reactor ITER. The aim of the R&D program is to demonstrate the feasibility of close inspection of the Divertor cassettes and the Vacuum Vessel first wall of ITER. We assumed that a long reach and limited payload carrier penetrates the first wall using the 6 penetrations evenly distributed around the machine and foreseen for the In-Vessel Viewing System (IVVS). The need to access closer than the IVVS to the Vacuum Vessel first wall and the Divertor cassettes had been identified. This is required when considering inspection with other processes as camera or leak detection. The work performed under the EFDA-CSU Workprogramme includes the design, manufacture and testing of an articulated device demonstrator called Articulated Inspection Arm (AIA). The AIA has to fulfil the following specifications: - Elevation: +/- 45 ° range, - Rotation: +/- 90 ° range, - Robot total length: 7.4 meters, - Admissible payload: 10 kg, - Temperature: 200 °C during baking – 120 °C under
working, - Pressure: 9.7 10-6 Pa – Ultra high vacuum. Therefore a scale one full module with 2 degrees of freedom was manufactured and tested under Tore Supra (TS) requirements (temperature and pressure). 2005 ACTIVITIES
PROTOTYPE MODULE ACTIVITIES SUMMARY Manufacture of a vacuum and temperature module demonstrator was tested in a representative module of TS called ME60, under temperature and pressure constraints. Promising results were obtained in term of structural resistance of the system. The past year was dedicated to the segment upgrade and to cycling test campaign to validate all the robot components. The successful results enable to start the whole robot manufacture and procurement. UPGRADE Following the ME60 test campaign, upgrade of the module was performed in order to improve its maintainability and to enhance its performances.
The main modifications are located on the rotation actuator box: - Thickness increase, to allow leak detection and a
better stiffness, - Neurobot board integration with gold coating, - Sealing is provided owing to aluminium joint whether
welding.
Figure 1: Rotation actuator box
Figure 2: New elevation jack
A motor cooler was added to improve heat conduction. New rods are made in stainless steel plains bars.
Figure 3: New rods and motor cooler
A pumping tube, for the tightness tests, was added on the positions sensors. A new locking key system was integrated to the module aiming to reduce the full torsion angle of the tube

- 112 - EFDA Technology / Vessel-In Vessel / Remote Handling
MANUFACTURE The manufacture of the final robot is under progress. The assembly is planned for the end of 2006. The AIA storage cask, the deployer and the electronic external bay will be delivered during 2006. The integration of the whole robot on Tore Supra is foreseen for 2007.
Figure 4: AIA, deployer and storage cask on Tore Supra CONCLUSIONS
Integration and tests of the deployer and storage cask are planned in the course of 2006, in CEA-Fontenay-aux Roses facilities. Demonstration of the AIA intervention feasibility in real temperature and vacuum Tokamak environment is planned on Tore Supra for the next years. REFERENCES
- European Fusion Technology Programme - Task
TW0-DTP/01.2, Task TW0-DTP/01.4, Task TW1-TVA/IVP, Task TW2-TVA/IVP, Task TW3-TVR/IVV, Task TW4-TVR/AIA.
REPORTS AND PUBLICATIONS
CEA/DTSI/SCRI/LPR/ 5RT.068-Issue 0 Articulated Inspection Arm, Prototype module upgrade manufacture. V. BRUNO. TASK LEADER
Jean Pierre FRICONNEAU DRT/DTSI/SRI CEA-Fontenay-aux-Roses 18, route du Panorama- BP 6 F-92265 Fontenay-aux-Roses Cedex Tel. : 33 1 46 54 89 66 Fax : 33 1 46 54 75 80 e-mail : [email protected]

- 113 - EFDA Technology / Vessel-In Vessel / Remote Handling
TW4-TVR-RADTOL TW5-TVR-RADTOL
Task Title: RADIATION TOLERANCE ASSESSMENT OF STAND ARD ELECTRONIC COMPONENTS FOR REMOTE HANDLING
INTRODUCTION
The work engaged during the years 2004-2005 was a good synthesis to determine the availability of hardened electronic systems under severe environment. Two prototypes needed to digitalize the sensors analog measurements of sensors such resolvers and LVDT modules were developed and realized based on numerous results obtained from past years studies. The irradiation campaigns done along 2005 led to partial significant results which up to now could not be enough to fully validate the conversions modules. 2005 ACTIVITIES
The functional block summarizes the added or redesigned developments all along 2005 (see figure 1).
IN/OUTIN/OUT
BUFFERING
BUFFERING
FRAMING
LVDTLVDT
Resolver“ φφφφ”
Resolver“ φφφφ”
Amplitude and sensemeasurement
Amplitude and sensemeasurement A/D C A/D C CountCount
Electro/Optical
Amplification
Line drivers
Sinusoidalfunction
Sinusoidalfunction
Phase measurement by conversion to duration
Phase measurement by conversion to duration
Extendedcount
Extendedcount
Reset functionReset function
IN/OUTIN/OUT
BUFFERING
BUFFERING
FRAMING
LVDTLVDTLVDTLVDT
Resolver“ φφφφ”
Resolver“ φφφφ”
Resolver“ φφφφ”
Resolver“ φφφφ”
Amplitude and sensemeasurement
Amplitude and sensemeasurement A/D C A/D C CountCount
Electro/Optical
Amplification
Line drivers
Sinusoidalfunction
Sinusoidalfunction
Phase measurement by conversion to duration
Phase measurement by conversion to duration
Extendedcount
Extendedcount
Reset functionReset function
Figure 1: Synoptic diagram of the electronic functions available on 2004
Resolver BRT or resolver “φφφφ”: The only resolver retained for the future multiplexor needs
( )tA ωsin and ( )tA ωcos as inputs and delivers a
( )φω −+ /sin tA as output.
The design of electronic functions and the global positive results of radiation campaigns of the mock-ups were detailed on previous reports [1], [2]. To increase the precision of the analog measurement of the rotation angle, the conversion was done by a clearable 12 bits high speed counter (20 MHz). Recent enhanced AUC components allowed such developments [3]. Other functions as AGC oscillators and framers were added to limit numbers of wires. Digital data was sent
simultaneously to a bifilar twisted wires using LVDS line drivers protocol and to an optical driver to be converted into light (optical link). An early irradiation campaign was realized at IRMA, IRSN facility at Saclay, commonly with SCK team, to validate the mock-up of the resolver multiplexor. The mean received dose by this important test-bed was close to 4.5 MGy. The very short time dedicated to the adaptation of our modules to the test-bed did not enable easy pre-irradiation and later on-line controls of our boards.
Figure 2: Mechanical test-bed used for full validation
of the multiplexer Some failures occurred during the campaign mainly for the intermediate state of the printed board and the association of different modules coming from previous experiments. Most of them were compensated by direct investigations, voltage adjustments and easy recovery. The recorded frames of figure 3 taken during a break inside the cell on test points were obtained after at least 3 MGy. They gave good signals which at least validate the principle of high speed clocks.
Figure 3: Inside cell measurements
20 MHz clock signal
Resolver frame signal

- 114 - EFDA Technology / Vessel-In Vessel / Remote Handling
Some post-irradiation controls after about 4.5 MGy of cumulated dose and shown on figure 4 confirm the operational state of most of the elements of the mock-up.
Figure 4: Effective signals after radiations The critical parameters as sinusoidal oscillators, 10 MHz clock generator were always available that confirms the tolerance of the selected components under radiation.
Figure 5: Phase detection after irradiation After up-grating the electronic schema of the resolver multiplexor, it was decided to perform developments with the design of a fully printed card prototype. Unfortunately, the printed card manufactured outside our lab was not significantly usable. In order to keep in time radiation investigation (scheduled on mid-december 2005), we spent time to debug the module with very limited success. Some functions were recovered. Nevertheless, card was submitted to about 2 MGy, total dose. Due to the very limited possibility of the card, the data were only reported to the control room and recorded (see. figure 6).
Figure 6: Resolver card during december 2005 experiment
Figure 7: Some measurements during december 2005 experiments
Once again, most of the critical modules kept their functionalities.
Figure 8: Clock frame and frame signals during december experiment
To conclude resolver experiment during end of year 2004 and year 2005, most of the results shown by all the recorded data validate the multiplexer principle with its main critical modules. To assume the final representative experiment in order to determine the accuracy of the resolver measure (stability for a define position of the angle, repetitively measurements, answer to a step variation), the prototype will be rebuilt with new design rules. LVDT developments The integration of a floating ground supply as well as an useful anolog to digital converter based on track loop control were used to designed a first prototype [2]. The interesting results obtained during first experiment in SCK facility at MOL and reported on [3] allowed a new design with an inside sinusoidal oscillator with the same principle of the one of resolver multiplexor. Frame transfer is scheduled by period of ADC conversion which allows a low rate exchange but enough for such measurements. The supply module, which can be used for both LDVT and resolver modules, was designed as a separate module and easy added as a mezzanine card (see figure 10). The availability of this new design was validated in room conditions previously to any irradiation campains.. No damage in the order of those of resolver card was observed. A simple test bed was defined to receive all the frames
Angle “Φ” duration
Duration converted to number of clock pulses
Frame
Sinusoidal oscillator
Phase detection
20MHz clock
Sinusoidal oscillator
Clock frame signal
Frame signal
Recovered card with added corrective
modules

- 115 - EFDA Technology / Vessel-In Vessel / Remote Handling
coming from the LVDT drivers for both bifilar and optical link (a card containing SiGe driver was added as first stage of optical link). The LVDT sensor was positioned inside the cell but protected against radiation (see figures 9 and 11). The prototype was irradiated up to 2 MGy at IRMA facility.
Figure 9: LVDT prototype under radiation
Figure 10: New prototype of LVDT multiplexor
Figure 11: Test bed for LVDT measurements The frame signal corresponding to the position of the LVDT sensor was continuously reported on the oscilloscopes. No evolution was related at the end of the irradiation. Corresponding frames on the chronograms of figure 12 for both LDVS and SiGe drivers, shown a regular signal. No lost of bit conversion were visible on the analog ramp used for ADC conversion (see figure 13) while high and low state of LVDT signal for the position were always efficient (see figure 14).
Figure 12: Frame delivered by both LVDS and SIGe drivers
Figure 13: Digital ramp used to ADC conversion
Figure 14: High and low state of LVDT signal The accuracy of the LVDT converted signal was yet not done. CONCLUSIONS
Works done from end of 2004 to end of 2005 led us to unexpected results. Most of the modules designed and realized as part of functional blocks of figure 1 gave partial interesting results. Moreover, we expected from industrial printed cards enough quality from signals to validate with a good accuracy the conversion of measures coming from both resolver and LVDT sensors. Unforeseen events during the manufacturing affected the normal use of the cards. Debugging and recovering of the main functions and radiation scheduling became no so easy to drive. A new resolver card, now realized and validated, is ready for further experiment. The final testbed has also to be
LVDS drivers
Digital inputs
LVDT measures
Connector for mezzanine supply card
Prototype card
LVDT resolver
Frame detector
Frame recording Frame visualisation
SiGe drivers
LVDT frame signal
SiGe drivers signal
ADC converter ramp realised by an infinite
logic 8 bits counter
High state output signal of the LVDT sensor
Low state output signal of the LVDT sensor

- 116 - EFDA Technology / Vessel-In Vessel / Remote Handling
realized in order to give some accuracy to the converted resolver measures. LVDT experiments could be extended with accuracy determination. REPORTS AND PUBLICATIONS
[1] TW3-TVR-RADTOL june report
DRT/LIST/DTSI/SARC/03-813/AG [2] TW3-TVR-RADTOL december report
DRT/LIST/DTSI/SARC/04-042/AG [3] Fusion Technology Annual Report 2004
EURATOM TW4-TVR-RADTOL TASK LEADER
Alain GIRAUD DRT/DTSI/SARC/LCSD CEA-Saclay F-91191 Gif-sur-Yvette Cedex Tel. : 33 1 69 08 64 30 Fax : 33 1 69 08 20 82 e-mail : [email protected]

- 117 - EFDA Technology / Vessel-In Vessel / Remote Handling
TW4-TVR-WHMAN TW5-TVR-WHMAN
Task Title: DEVELOPMENT OF A WATER HYDRAULIC MANIPU LATOR
INTRODUCTION
Hydraulic technology can provide powerful actuators in small volumes. For that reason hydraulics becomes an interesting technology to build heavy duty manipulators for maintenance operations in space constrained areas. Due to potential leaks, oil hydraulic can not be used for maintenance operations in ITER. Pure water hydraulics proposes a good alternative to oil and today’s developments are focusing on that direction. Previous work focused on the test preparation of a SAMM oil hydraulic vane actuator that was adapted to operate with water. Materials were changed and new coatings were used to check their compatibility with water. A test rig was designed and built and performances of the joint were assessed. Analyses of the test results and actuator’s mechanical state were made. TEST RIG The test rig (see figure 1) is composed of an actuator mounted on a manifold providing pressurized water through a D633 direct drive valve manufactured by Moog.
Figure 1: Test rig
Pressure is measured with EPXT pressure sensors of the manufacturer Entran. These are the pressure sensors used in the Maestro. 3 of them are used to measure: - The supply pressure - Pressure at outlets 1 & 2 of the Direct Drive Valve. Position is measured with a resolver Litton SSH 30B4. Fluid power is supplied by a Danfoss Nessie power unit. Maximum supply pressure is 210 bar with a maximal flow of 45 l/min. PRELIMINARY TESTS Qualification tests of the direct drive valve were made in order to assess its performances. Tests made on close ports show that: - Pressure raises until 210 bar on both outlets when full
power is provided to the direct drive valve - Internal leakage of the direct drive valve is close to
0.2 l/min at full power. Preliminary tests on position control loop were performed. Position of the joint was set on a reference triangular signal with amplitude of 1.5 rad and a frequency of 0.1 Hz. Zero position of the joint was defined when the load bar is vertical. We see on figure 2 that without any compensation the position error remains acceptable. When the position goes from -1.6 towards 1.6 rad displacement of the joint is obtained when a torque step is reached (see figure 2). This is in agreement with friction behaviour and the slope following the step is due to the inertia of the arm. The error signal is repeatable. It means that compensation of friction and inertia would increase the accuracy.
500 510 520 530 540 550-1.6
-1.2
-0.8
-0.4
0
0.4
0.8
1.2
1.6
Time (s)
Pos
ition
(ra
d)
current position Postionning error
Figure 2: Position and positioning error
Loading zone
Resolver
Actuator
Direct drive valve
Pressure sensors

- 118 - EFDA Technology / Vessel-In Vessel / Remote Handling
Compared to similar oil hydraulic vane actuator like Maestro, the friction torque is very high (three times higher).
Figure 3: Estimation of the dry friction torque
According to the set signal (triangular shape) variations of the torque at stabilized speed (see figure 3) should remain in the range of the gravity torque applied on the joint by all elements of the actuator in movement. This gravity torque is less or equal to 34 N.m according to the own weights of all elements. And we see that for 0.6 rad/s speed the torque range is close to 500 N.m. For speeds between 0 and 0.6 rad/s the torque is approximately constant and equal to the dry friction torque. This figure shows that energy has to be supplied to something that has nothing to deal with the movement. Internal leak rates of 10 liters/min were observed during the tests. It was identified as the origin of the torque excess of figure 3. Seal shape, material and arrangement were modified to reduce these leaks without success. Bad manufacturing quality seems to be the main reason of these leaks. Leak modeling according to Poiseuille’s law show that 2.5 1/100th of a millimeter in the region of the vane are enough to produce a 10 liters/min leak. JOINT MECHANICAL EVALUATION Several corrosion spots were noticed (see figure 4) during first disassemblies of the vane actuator. The nickel coating used for the screws of both vanes of the actuator proved to be inefficient. Replacement of all screws by APX4 stainless steel screws and replacement of all centering pins solved the problem.
Figure 4: Corrosion spots CONCLUSIONS
Due to significant internal leaks in the actuator, performance evaluation was difficult. Dry friction torque was found very high compared to oil actuators of the Maestro arm but results on position control loop showed little and stable error. Real improvements could be expected with a friction and inertia compensation model implemented in the control loop. Unfortunately the internal leaks were too high to perform the same test with significant payload and for the same reason it was not possible to try force control modes. New seal designs and arrangements were tested to limit the amount of leaks. No significant improvements were noticed during the trials. Leak estimations with help of Poiseuille’s law and dimensions measurements of the main parts of the actuator pointed out the poor manufacturing quality as the responsible of these leaks. Although clearances in the SAMM vane actuator would have been correct for oil, the 30 times factor between viscosity of water and oil severely affected the water tests. Although performances didn’t give the expected results and leaks were high, no real corrosion problems were noticed, meaning that the material choice was correct at least for simple testing. Wear analysis after endurance test would be necessary to confirm the option of all selected coatings during the design phase. It seems difficult to define the exact values of the clearances required in the joint to reach the expected performances. Today (cost problem excepted) among other vane actuators, the Maestro joint seems to be in best position to reach ITER’s requirements. Next test phase will therefore concentrate on a performance analysis of a reconditioned Maestro joint to define a start point without making any modifications of the existing design. In a second phase, an analysis of the results and proposals to modify the design will be made.
Corrosion
Corrosion

- 119 - EFDA Technology / Vessel-In Vessel / Remote Handling
REPORTS AND PUBLICATIONS
- DTSI/SCRI/LPR/05RT006 Water hydraulic manipulator. Definition of a single axis water hydraulic mock-up. - DTSI/SRI/LTC/06RT006 Water hydraulic manipulator. Preliminary tests on a water hydraulic manipulator.doc TASK LEADER
Jean Pierre FRICONNEAU DRT/DTSI/SRI CEA-Fontenay-aux-Roses 18, rue du Panorama - BP 6 F-92265 Fontenay-aux-Roses Cedex Tel. : 33 1 46 54 89 66 Fax : 33 1 46 54 75 80 e-mail : [email protected]

- 120 - EFDA Technology / Vessel-In Vessel / Remote Handling

- 121 - EFDA Technology / Magnet Structure
CEFDA03-1015
Task Title: TW2-TMSM-COOLIN: MOCK-UPS FOR THE TF AND CS TERMINAL REGIONS AND COOLING INLETS
INTRODUCTION
The CEA Cadarache Magnet Group is requested through the contract EFDA 03-1015 to assist the EFDA Close Support Unit Garching and the Superconducting Coils and Structures Division of the ITER International Team in the detailed design and manufacture of relevant mock-ups for some critical areas of the Toroidal Field (TF), Central Solenoid (CS) and Poloidal Field (PF) coil windings. Mechanical testing at cryogenic temperatures of the mock-ups under relevant loads and number of cycles will be carried out at FZK Karlsruhe (TW3-TMSM-CRYTEST) and ENEA Brasimone (TW1-TMS-SHKEYS). CEA is requested to design the mock-ups in close collaboration with these two Groups and EFDA/ITER, coordinate the testing activity and report on the final test results. CEA is responsible for the definition of the testing conditions (loads, number of cycles, temperature, etc.) under review and approval of EFDA/ITER. The work includes three main activities: - Design, manufacture and assistance to testing of
mock-ups and samples of the Toroidal Field (TF) coil helium inlet;
- Design, manufacture and assistance to testing of
mock-ups and samples of the Central Solenoid (CS) helium inlet;
- Design, manufacture and assistance to testing of
mock-ups and samples of the bonded tails at the extremity of the windings of the Poloidal Field (PF) coils.
2005 ACTIVITIES
DEVELOPMENT OF THE TF COIL HELIUM INLET Design The TF coil conductor consists of a circular Nb3Sn cable-in-conduit with a central cooling channel cooled by supercritical helium. The material used for the conductor jacket is stainless steel. The jacket inner diameter is 40.2 mm and the jacket wall thickness is 1.6 mm. The winding uses a one-in-hand conductor (about 800 m long) in a double pancake configuration inserted into a radial plate. The cooling inlets are located at the two innermost turns of each double pancake into the joggle region where the conductor from the first pancake come out of his radial plate groove to go into the groove of the
second pancake. The total length of the inlet region is 700 mm. The design of the ITER TF helium inlet was developed on the basis of ITER drawings which defines the space allowed for the inlet region. The helium pipe connected to the inlet has to fit into the double pancake thickness without interference with the coil case. Taken into account these space limitations, a design for the inlet was proposed and accepted by IT and EFDA (figure 1).
Figure 1: TF inlet design proposal (One half distribution grid and one half mechanical shell
are shifted for better understanding) Analysis A 3D straight F.E.M. model was built for global analysis and a 2D local model was built for analysis of the weld between the shells and the jacket. After optimization of the geometry, the maximum stress around the elliptic helium hole remains to be lower than 700 MPa when a peak value at the shells weld location of 858 MPa appears on the jacket. These values have been considered to be acceptable by EFDA. Mock-ups manufacture The components for the manufacture of five mechanical and hydraulic mock-ups were fabricated in 2004. Two mock-ups TF-IN1 and 2 were used for determination of the welding parameters. An assembly procedure was issued which allows to perform the inlet manufacture without overheating of the conductor and with respect to foreseen final layout. TF-IN3 and 4 were manufactured according to the determined procedure and were equipped with specific attachment ends in order to be tested for fatigue life qualification in the FZK test facility (figure 2.). A last mock-up, TF-IN5, was built at the middle of a straight available TFMC conductor for hydraulic qualification. An intermediate report was issued at this step [1].
Figure 2: One mock-up for fatigue life qualification

- 122 - EFDA Technology / Magnet Structure
Fatigue life qualification The strain experienced by the TF coils at helium inlets during operation is ε ~ (11 ± 3)×10-4, where 11.10-4 is the essentially static strain due to the toroidal field alone and ± 3.10-4 is the cyclic out-of-plane strain. Translated into stress, this gives a stress of σ ~ 220 ± 60 MPa and a corresponding load F = 43.5 ± 11.8 kN. The fatigue life qualification has to be performed with a number of cycles of 600 000 which is a factor 20 of the ITER TF number of cycles. All the tests were performed under load control since it was not possible to control the strain with acceptable cycling frequency. The qualification was performed on TF-IN3 and 4 in the FZK 500 kN cycling test facility at 4 K. TF-IN3 was used first for calibration of the machine and to determine the maximum reachable cycling frequency in order to minimize the test duration. Two sets of local double extensometer were used to check the regular jacket as well as the orbital weld area strain. At the end, the mock-up was submitted to 100 000 cycles under a maximum loading of 38 kN ± 30 kN at a 4 Hz frequency. The orbital weld strain was observed to have the same behaviour than the regular jacket one. A final loading at twice the nominal value was performed to test the attachment system and has shown some slipping which was identified to come from a bad attachment installation at one end of the mock-up. A final helium test of the mock-up did not show any leak. The final fatigue test was performed on TF-IN4 mock-up. On this mock-up, a new double extensometer set was used in order to check the global strain of the inlet. The strain of (11 ± 3)×10-4 was applied by the way of a loading of 45 ± 17 kN at a 7 Hz frequency. Unfortunately, the mock-up broke after 476 117 cycles instead of the 600 000 required. The breakage was located in the jacket near one of the orbital welds in the heat affected zone (figure 3).
Figure 3: Detail of the broken area on TF-IN4 after tests Hydraulic qualification The hydraulic qualification was performed on TF-IN5 in the OTHELLO test facility using GN2 at room temperature under relevant Reynolds conditions.
The ITER TF operating point is Qc = 8 g/s, P = 0.5 MPa, T = 5 K in supercritical helium. Using a Reynolds analogy, the corresponding operating point with nitrogen in our facility was determined to be Qc = 41.7 g/s, P = 0.5 MPa, T = 300 K The hydraulic path was symmetric as it is on the TF coils with temperature, pressure and flow rate sensors as shown in figure 4. Due to symmetry, the conductor flow rate was recorded at one side only. A specific preparation of each conductor end allows to separate each petal flow rate and to record it using a movable flow-meter. With this facility layout, pressure drop as well as flow repartition among the petals were recorded. Three tests were performed: the first one with a 2 m conductor length at each inlet side, this length was then reduced to 1 m and finally 0.5 m. With this process, the evolution of the flow rate distribution was checked at different distances from the inlet. The inlet pressure drop as well as the flow rate distribution was compared to reference pressure drop and flow rate distribution gained on a 4 m long TFMC conductor with a gas inlet at one end. The pressure drop of the inlet was found to be quasi-linear with the conductor flow rate. It was interesting to compare the inlet pressure drop coefficient to the one of the unit length of conductor. However, in ITER type conductors, the hydraulics uses a dual channel with a high Reynolds inside central channel and a low Reynolds in the petals area. Then the conductor characterization is not easy. For simplification, in the particular TFMC conductor geometry, a reduced pressure drop coefficient and a reduced Reynolds number independents of the wetted area Ac and hydraulic diameter Dh can be defined with respect to the global conductor mass flow rate Qc and the measured pressure drop ∆P as follows:
2*
Qc
PK
∆= ρ µ
Qc=*Re with 22
*Ac
KK =
and Dh
AcRe*Re =
(ρ, ∆P, Qc, µ, Ac, Dh) in (Kg/m3, MPa, Kg/s, Pa.s, m2, m) The reduced inlet pressure drop coefficient K* was found to have a very low dependency on the reduced Reynolds number Re* in a same way that for the regular conductor but its value was 7.3 times higher than the unit length conductor one (figure 5). The flow rate distribution among petals was recorded at 2 m, 1 m and 0.5 m from the inlet and compared to the one gained on our reference 4 m long straight conductor. The results at the TF operating point are summarised in table 1. These results show clearly that with this design of helium inlet, the petals helium supply is increased when the distance with the inlet decreases. A maximum flow rate ratio of 14 % was recorded on petal n° 1 which was the one in regard of the helium hole of the distribution grid.

- 123 - EFDA Technology / Magnet Structure
Figure 4: Hydraulic path of the OTHELLO test facility for inlet qualification
Figure 5: Flow rate ratios for the different studied configurations
Table 1: Flow rate ratios for the different studied configurations
DEVELOPMENT OF THE CS COIL HELIUM INLET Design and analysis The CS conductor consists of a Nb3Sn cable-in-conduit with a central cooling channel, cooled by supercritical helium. The material used for the conductor jacket is stainless steel. The jacket inner diameter is 33.2 mm and the jacket outer square section is 49.9 mm×49.9 mm. The CS modules are wound as hexa-pancakes (6 pancakes with a single conductor length) and quad-pancakes (4 pancakes with a single conductor length). Helium inlets are at the crossover regions on the inner bore between each double pancake and outlets are at the crossover regions and joints on the outside. The high field region is therefore cooled by the coldest helium. There are three helium inlets for each hexa-pancake and two for each quad-pancake. The inlets are located at the CS inner diameter, where cyclic tensile stresses are highest. In the CS jacket, the maximum stress occurs at initial magnetization and reaches 470 MPa in the vertical sidewalls of the jacket. The helium inlet region requires, therefore, a local reinforcement to allow the opening in the conductor jacket without excessive stress intensification. The inlet must also provide a good distribution of helium in the six sub-cables of the conductor. A design of this inlet was suggested by IT to achieve these requirements. A model of the inlet was built and a F.E.M. analysis has led to a design optimization. In addition, a manufacturing mock-up allowed to validate the feasibility of this kind of inlet which is characterised by a narrow groove of one cable twist pitch long. All this work was performed during year 2004.
Petal
1
Petal
2
Petal
3
Petal
4
Petal
5
Petal
6
Annular
At 4 m of direct inlet
5.5 %
5.5 %
5.5 %
5.5 %
5.5 %
5.5 %
33 %
At 2 m of TF inlet
8.5 %
8.5 %
8.5 %
8.5 %
8.5 %
8.5 %
51 %
At 1 m of TF inlet
8.7 %
9.4 %
8.3 %
9.3 %
9.1 %
8.1 %
52.9 %
At 0.5 m of TF inlet
14 %
10.9 %
10 %
11.5 %
10.8 %
10.3 %
67.5 %
0
200
400
600
800
1000
1200
1400
1600
1800
2000
0 500 1000 1500 2000 2500 3000 3500 4000 4500 5000
Re* (m)
K*
(m-4
)
ITER TFoperating point
TF inlet
Conductor unit length

- 124 - EFDA Technology / Magnet Structure
Figure 6: Overall view of the mock-up design
Mock-ups manufacture Unfortunately, due to development problems, no relevant material for the conductor jacket manufacture was available. It was decided in agreement with EFDA and IT to cancel the mechanical qualification part of the contract. An hydraulic mock-up only was built using a dummy TFMC cable which was jacketed with a square Valinox tube. A final length of 4 m of conductor was produced by ENEA. The helium inlet mock-up called CS-IN5 was manufactured in the middle of this conductor length and will be tested in the beginning of year 2006. DEVELOPMENT OF THE BONDED TAILS OF THE PF COIL WINDINGS Design The ITER PF coils design consists of a stack of double pancakes of cable cable-in in-conduit conductor with a square section jacket and, wound as ‘two in hand’. At each joint and terminals of a double-pancake a structural element is required to transfer the hoop force on from the outmost, most external conductor, to the bulk of the winding winding-pack. The present design envisages a ‘tail’ welded to the terminal conductor jacket, and bonded to the adjacent turns, transferring this force by shear though the interposed insulation. A preliminary design was developed in the framework of contract CEFDA00-541, using as reference PF5 where, in the reference scenario, the highest hoop loads develops with a tensile stress of 150 MPa. The scope of the present contract is to develop the manufacturing and assembly of the ‘PF coil tails’ to the level of an industrial process, and ultimately, to build a mock-up, representing the main features of the coil tail and to subjected at fatigue test at LN2 temperature at ENEA laboratory (Brasimone, Italy). Manufacturing of mock-up and tests structure In early 2005 the manufacturing of the coil tails parts and the adjacent steel plates were completed, including the terminal parts with a threaded hole for the bolted connection. The assembly and impregnation of the mock-up was performed successfully by the company Alstom under CEA specifications. The insulation wrapping, according to the ITER design, was made of various layer of glass-fibre coupled to Kapton, half overlapped. Particular attention was paid to the the filler parts which were machined from special high glass density G10 material (Micam®) to limit thermal induced stresses at cool-down. Following the impregnation, performed in auto-clave, the end faces of the mock-up were machined to provide the suitably smooth surface to assemble the bolted flanges for anchoring the mock-up to the test
structure. Finally dieletric high voltage tests at 4.5 kV were performed to confirm the integrity of the insulation. In parallel the special bolts M30, in Inconel 717 for anchoring the mock-up to the test structure were procured from the company PS-Superbolt. These were required to overcome the strict space limitations and apply sufficient pre-load (400 kN per bolt). Also the test structure, required to reverse the compressive force of the test machine into a traction force on the mock-up was manufactured. This consists of two, inner and outer, coaxial tubes and the two end flanges, 100 mm thick, where the mock-up end faces are bolted. The Flanges are made of 5% Ni steel to match the thermal contraction of the Inconel bolts during cool-down.
Figure 8: PF tail mock-up after impregnation and end face maching
PF coil tail Conductor terminal bend
Figure 7: Coil-tail first insulation wrapping
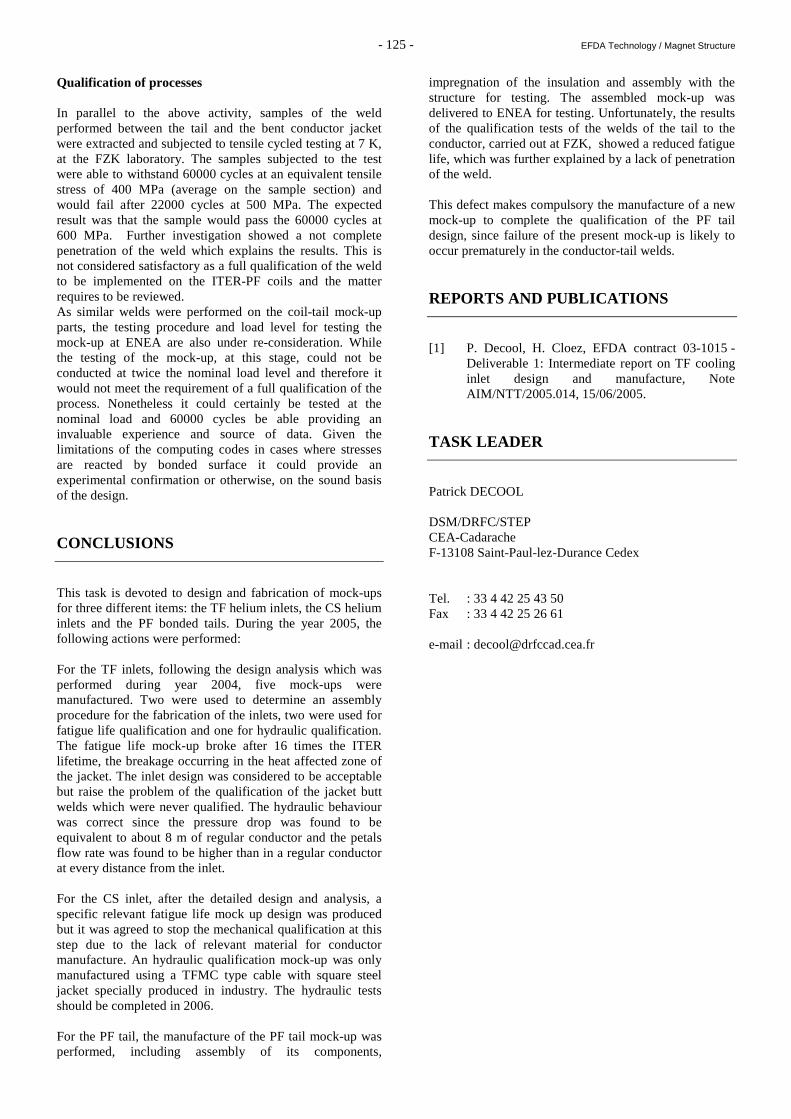
- 125 - EFDA Technology / Magnet Structure
Qualification of processes In parallel to the above activity, samples of the weld performed between the tail and the bent conductor jacket were extracted and subjected to tensile cycled testing at 7 K, at the FZK laboratory. The samples subjected to the test were able to withstand 60000 cycles at an equivalent tensile stress of 400 MPa (average on the sample section) and would fail after 22000 cycles at 500 MPa. The expected result was that the sample would pass the 60000 cycles at 600 MPa. Further investigation showed a not complete penetration of the weld which explains the results. This is not considered satisfactory as a full qualification of the weld to be implemented on the ITER-PF coils and the matter requires to be reviewed. As similar welds were performed on the coil-tail mock-up parts, the testing procedure and load level for testing the mock-up at ENEA are also under re-consideration. While the testing of the mock-up, at this stage, could not be conducted at twice the nominal load level and therefore it would not meet the requirement of a full qualification of the process. Nonetheless it could certainly be tested at the nominal load and 60000 cycles be able providing an invaluable experience and source of data. Given the limitations of the computing codes in cases where stresses are reacted by bonded surface it could provide an experimental confirmation or otherwise, on the sound basis of the design. CONCLUSIONS
This task is devoted to design and fabrication of mock-ups for three different items: the TF helium inlets, the CS helium inlets and the PF bonded tails. During the year 2005, the following actions were performed: For the TF inlets, following the design analysis which was performed during year 2004, five mock-ups were manufactured. Two were used to determine an assembly procedure for the fabrication of the inlets, two were used for fatigue life qualification and one for hydraulic qualification. The fatigue life mock-up broke after 16 times the ITER lifetime, the breakage occurring in the heat affected zone of the jacket. The inlet design was considered to be acceptable but raise the problem of the qualification of the jacket butt welds which were never qualified. The hydraulic behaviour was correct since the pressure drop was found to be equivalent to about 8 m of regular conductor and the petals flow rate was found to be higher than in a regular conductor at every distance from the inlet. For the CS inlet, after the detailed design and analysis, a specific relevant fatigue life mock up design was produced but it was agreed to stop the mechanical qualification at this step due to the lack of relevant material for conductor manufacture. An hydraulic qualification mock-up was only manufactured using a TFMC type cable with square steel jacket specially produced in industry. The hydraulic tests should be completed in 2006. For the PF tail, the manufacture of the PF tail mock-up was performed, including assembly of its components,
impregnation of the insulation and assembly with the structure for testing. The assembled mock-up was delivered to ENEA for testing. Unfortunately, the results of the qualification tests of the welds of the tail to the conductor, carried out at FZK, showed a reduced fatigue life, which was further explained by a lack of penetration of the weld. This defect makes compulsory the manufacture of a new mock-up to complete the qualification of the PF tail design, since failure of the present mock-up is likely to occur prematurely in the conductor-tail welds. REPORTS AND PUBLICATIONS
[1] P. Decool, H. Cloez, EFDA contract 03-1015 -
Deliverable 1: Intermediate report on TF cooling inlet design and manufacture, Note AIM/NTT/2005.014, 15/06/2005.
TASK LEADER
Patrick DECOOL DSM/DRFC/STEP CEA-Cadarache F-13108 Saint-Paul-lez-Durance Cedex Tel. : 33 4 42 25 43 50 Fax : 33 4 42 25 26 61 e-mail : [email protected]

- 126 - EFDA Technology / Magnet Structure

- 127 - EFDA Technology / Magnet Structure
CEFDA03-1120
TASK TITLE: TW3-TMSC-ASTEST: TESTS OF ADVANCED Nb3Sn STRANDS EXTENSIVE CHARACTERIZATION OF INDUSTRIAL
ADVANCED Nb3Sn STRANDS DEVELOPED FOR ITER TF COILS SYSTEM
INTRODUCTION
This action is part of a global R&D program devoted to the development of Nb3Sn conductors which will be used in the ITER TF and CS Coils. The models built in the framework of the ITER EDA phase (CSMC, CSIC, TFMC, TFCI) have shown reduced performances compared to those expected, which led to a revision of the conductor design relying on the use of advanced Nb3Sn strands. Consequently a specific EU R&D action was launched to procure from industrial companies advanced Nb3Sn strands meeting specifications adapted to the ITER TF Coils system, i.e. for the most important ones: - IC(4.2 K, 12 T) > 200 A with a target value of 280 A. - Qhyst < 500 mJ.cm-3 (overall strand volume). Six companies were concerned: Alstom (F), Outokumpu Italy (I), Outokumpu Finland (FIN), EAS (D), SMI (NL), Oxford Instruments (GB). In the framework of the ASTEST task, six European laboratories have to perform crossed measurements of the properties of these advanced strands, procured from the European companies. CEA was asked to test three strands, produced respectively by Oxford Instruments (OST), Outokumpu Finland (OKSC) and Outokumpu Italy (OCSI). The tests involve: 1- geometrical measurements with diameter, filament twist pitch and Cu/nonCu ratio 2- electrical measurements with IC(4.2 K, 10-14 T) and Resistance Residual Ratio (RRR) 3- magnetic measurements with Qhyst(+/- 3 T) In 2004, the benchmarking step and a partial characterization of the strand provided by Oxford Instruments (OST) were performed (see 2004 activities report). In 2005, the remaining parts of the program were completed, which are namely: - geometrical, AC magnetic losses and RRR characterizations of OST strand - a complete characterization of strands fabricated by Outokumpu Finland (OKSC) and Outokumpu Italy (OCSI). Finally all experimental results were compared to the initial specifications provided by EFDA and the agreement of each strand commented.
2005 ACTIVITIES
OST STRAND Geometrical tests All studies were achieved in collaboration with the DTN/STPA service at CEA-Cadarache. The characterizations were performed through an image analysis obtained with BEM facility. A strand cross section is visible in figure 1.
Figure 1: Micrographic view of the SMI strand cross-section.
The Cu/nonCu ratio was evaluated by image analysis and checked by weighting method. The experimental values are found in good agreement and the ratio retained is 1 ±0.08. The overall strand diameter is also measured with a three-points method, and found as high as 815 ±5 µm. The Cr plating thickness is 2 ±0.5 µm. All those values are in good agreement with EFDA specifications. The filamentary twist pitch (TP) is also measured by imaging, using an innovative preparation method based on a 0.5 mm lamination of strand and an acid etching of the flat surface supposed to enable the vision of filaments trajectory despite of the Ta barrier. The resulting image is shown in figure 2. As a result, a value of 14.7± 1 mm is found, satisfactorily cross-checked with longitudinal sections views. This value is close to the manufacturer specifications (15 mm).

- 128 - EFDA Technology / Magnet Structure
Figure 2: OST strand longitudinal external view after
preparation for TP evaluation. Magnetic AC losses The hysteresis losses Qhyst are extracted from a signal generated in a two pick-up compensated system, which is used in the SUSI facility at CEA-Cadarache. Dedicated geometrical coefficients are applied in order to deduce the absolute value of the energy density dissipated through hysteresis magnetic losses. The experimental curve relevant to AC losses evaluation is given in figure 3. The coupling losses were also given even if not specified in the EFDA contract. The values of Qhyst and nτ found are respectively of 448 mJ.cm-3 (overall strand volume) and 7.1 ms. The value of OST strand Qhyst is found below the previously mentioned EFDA specification of 500 mJ.cm-3.
Figure 3: OST strand magnetic energy density variation with B ramp rate.
RRR The RRR found is 118±10, which is in agreement with ITER requirements (>100).
OKSC strand Geometrical tests A similar method was applied to the OKSC strand for geometrical characterization, resulting in the following experimental values:
- strand diameter: 815 ±3 µm. - Cu/nonCu ratio: 1.02 ±0.05 - filament TP: 13.9± 1 mm
finally all OKSC strand geometrical parameters were found to meet the EFDA specifications. Electrical tests the IC was evaluated in the CETACES facility located at DAPNIA/SACM service in CEA-Saclay. The results are illustrated in figure 4.
Figure 4: OKSC strand critical current variations with magnetic field (3 samples tested).
As a result, the IC(4.2 K, 12 T) value of 230 A is found, in-between the minimum value and the target value. Besides, n-value is found around 18, slightly lower than the specified limit of 20. A value of RRR of 130±3 is found, meeting the EFDA requirements. Magnetic AC losses Here we obtained Qhyst=630 mJ.cm-3, that overcomes by nearly 20% the EFDA specification. This significant deviation from requirements is thought to be due to anomalies that occurred in the heat treatment (HT) sequence, leading to an unexpected increasing of the filaments effective diameter. This point is supported by the IC values, found 10 to 20% lower than in other EU laboratories. The checking of this point is in progress in the CRPP (CH) laboratory.
y = 67.8 x + 897.0
800
850
900
950
1000
1050
1100
0 0.2 0.4 0.6 0.8 1 1.2 1.4 1.6
dB/dt (T/s)
Ec
ycl
(m
J/cm
3)
150
200
250
300
350
10 11 12 13 14B(T)
I C(A
)PORI'S#1
PORI'S#2
PORI'S#3target value
minimum value
T=4.2K
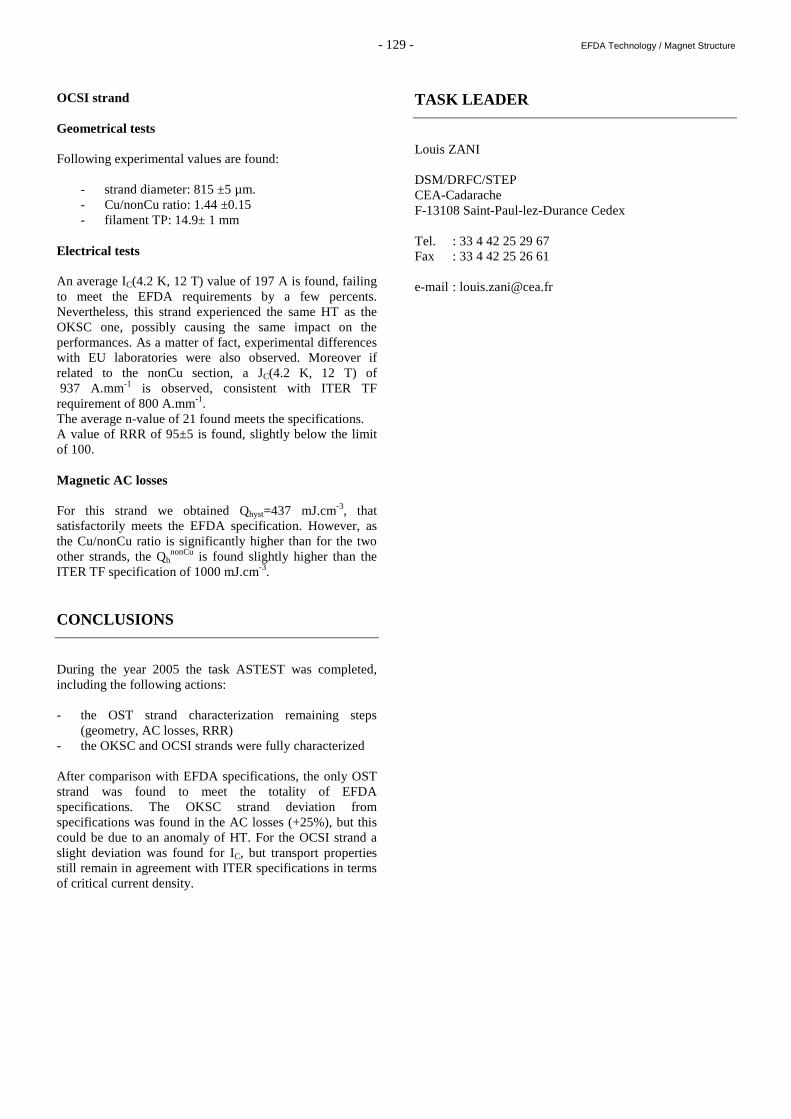
- 129 - EFDA Technology / Magnet Structure
OCSI strand Geometrical tests Following experimental values are found:
- strand diameter: 815 ±5 µm. - Cu/nonCu ratio: 1.44 ±0.15 - filament TP: 14.9± 1 mm
Electrical tests An average IC(4.2 K, 12 T) value of 197 A is found, failing to meet the EFDA requirements by a few percents. Nevertheless, this strand experienced the same HT as the OKSC one, possibly causing the same impact on the performances. As a matter of fact, experimental differences with EU laboratories were also observed. Moreover if related to the nonCu section, a JC(4.2 K, 12 T) of 937 A.mm-1 is observed, consistent with ITER TF requirement of 800 A.mm-1. The average n-value of 21 found meets the specifications. A value of RRR of 95±5 is found, slightly below the limit of 100. Magnetic AC losses For this strand we obtained Qhyst=437 mJ.cm-3, that satisfactorily meets the EFDA specification. However, as the Cu/nonCu ratio is significantly higher than for the two other strands, the Qh
nonCu is found slightly higher than the ITER TF specification of 1000 mJ.cm-3. CONCLUSIONS
During the year 2005 the task ASTEST was completed, including the following actions: - the OST strand characterization remaining steps
(geometry, AC losses, RRR) - the OKSC and OCSI strands were fully characterized After comparison with EFDA specifications, the only OST strand was found to meet the totality of EFDA specifications. The OKSC strand deviation from specifications was found in the AC losses (+25%), but this could be due to an anomaly of HT. For the OCSI strand a slight deviation was found for IC, but transport properties still remain in agreement with ITER specifications in terms of critical current density.
TASK LEADER
Louis ZANI DSM/DRFC/STEP CEA-Cadarache F-13108 Saint-Paul-lez-Durance Cedex Tel. : 33 4 42 25 29 67 Fax : 33 4 42 25 26 61 e-mail : [email protected]

- 130 - EFDA Technology / Magnet Structure

- 131 - EFDA Technology / Magnet Structure
CEFDA04-1127
Task Title: TW4-TMSC-SAMAN1: MANUFACTURE OF SUBSIZE SAMPLES
INTRODUCTION
The tests of the ITER TF model coil in 2001 – 2002 have shown that the performance of the conductor was lower than expected. New high performance strands have been ordered by EFDA to industry. In the framework of the SAMAN task, CEA has to explore the sensitivity of these high performance Nb3Sn strands to stainless steel jacketing on subsize samples, regarding the critical properties. This will be done by ordering and manufacturing subsize samples in the industry and then by participating to the tests at FZK (Germany) in the FBI test facility. 2005 ACTIVITIES
DESIGN OF THE SUBSIZE SAMPLES As part of the EFDA contract TW4-TMSC-SAMAN1, CEA/DRFC is responsible for the production of about fifty sub-size Nb3Sn conductor samples. The samples are of three different sizes corresponding to various stages of the cabling pattern of a ITER TF conductor petal. In particular the samples to be produced, by increasing size are of the type (3x3), (3x3x5), (3x3x5x4). The contract is staged in two phases: (a) batch 1 samples where the parameters vary (void fraction, cabling pitch, ratio of superconductor strands relative to copper strands) in order to study the changes in performances, (b) batch 2 samples which are of the same type, but using superconducting strands produced by 5 different manufacturers, in order to compare them. All superconducting strands are delivered by EFDA and have a diameter of 0.81 mm. In February 2005, a contract for the cabling and jacketing of the samples has been awarded to the company Nexans. Prototypes were required to confirm the capability of NEXANS to produce samples according to the CEA specifications. Controls have been performed to confirm that the samples comply with the required specifications. CONTROLS BY THE CEA ON THREE PROTOTYPES The samples are made with strands coming from two OST billets: Billet #1 7878/1, Billet #2 7730/1. Before the series production, 3 prototypes corresponding respectively to sample (3x3), (3x3x5) and (3x3x5x4) have been manufactured and checked by CEA (see figures 1 and
Figure 1: Example of sample 3x3x5
Figure 2: Example of sample 3x3x5x4
During this characterization it was found that the chrome removal of the sample extremities, where electrical connections are made, was not satisfactory. The process by brushing was changed and replaced by a chemical process by chrome etching with acid for the series production. Dimensional checks have also been performed by CEA and independently by the manufacturing company (Nexans). In table 1, a summary and comparison of measurements performed by CEA-DRFC and Nexans is presented.
2). A detailed description of the controls made by CEA can be found in [1].

- 132 - EFDA Technology / Magnet Structure
Table 1: Dimensional controls performed by Nexans and CEA-DRFC: comparison and summary
Apart the sequence of the twist pitches for the 3x3x5x4 which was difficult to control exactly during the production, the controls proved that the specifications of the samples were fulfilled. It can be considered that the quality of the production is acceptable for the scientific program. STATUS OF THE SAMPLES PRODUCTION All the subsize samples corresponding to phase (a) have now been manufactured by Nexans, which represents a total of 28 samples for batch 1. CEA is in charge of the heat treatment of the samples and of the equipment with copper grips and force grips in the extremities.
The two samples (3x3x5 A2) and (3x3) A3 have been heat treated on the 21/06/05 and sent to FZK, without the results of inspection on the two prototypes, to accelerate the testing process. According to the delivery from Nexans, all the samples have then been treated in two batches: First batch on the 10/10/05, second batch on the 14/11/05. They have been partially sent to FZK for being tested. The detailed status of the samples production in January 2006 is presented in table 2. Up to now 3 samples have been tested at FZK, but sample #2, the first sample to be tested was unfortunately destroyed by an undetected quench before the stretching of the sample. The analysis of the first experimental results is in progress.
CABLING JACKETING
Stage 1
mm (1)
Stage 2
mm (1)
Stage3
mm (1)
Stage 4
mm (1)
cosθ
(2)
Dint
mm
Dext
mm
Wall Thickness
mm
Void fraction
(3)
Specification (mm)
45±5 85±5 125±5 160±5 NA NA NA NA 32%
Nexans measures
prototype 3X3
43
before jacketing
87
before jacketing
NA NA Estimated
0.995
2.95 3.39 0.22
31.84%
CEA measures
Prototype 3X3
45
after jacketing
87.2 after
jacketing
NA
NA
Measured
0.998
3.01 3.41
0.2 poor
accuracy
32.1%
Nexans measures Prototype 3X3X5
43
before jacketing
87
before jacketing
122
before jacketing
Estimated
0.987
7.58
6.65
0.465
32.4%
CEA measures Prototype 3X3X5
44
after jacketing
88
after jacketing
133 after
jacketing
NA
Measured
0.988
7.61
6.66
0.475
32.7%
Nexans measures Prototype 3X3X5X4
45
before jacketing
86
before jacketing
123
before jacketing
155
before jacketing
Estimated
0.977
13.25
14.88
0.815
31.10 %
CEA measures Prototype 3X3X5X4
47.5 after
jacketing
100 after
jacketing
150 after
jacketing
165 after
jacketing
Measured
0.978
13.2
14.88
0.84
30.7 %
(1) Note that the twist pitch measurements were performed by Nexans on the cable prior the jacketing and
by CEA after jacketing, destroying the jacket in the process to expose the cable (2) Overall equivalent cosθ were estimated prior fabrication and the estimate used by Nexans for the void
fraction estimate; the actual cosθ value was measured by CEA and used for the void fraction estimation (3) CEA Void fraction estimate are based on strand diameter Ø 0,81 and the most reliable/accurate
measurement of jacket external diameter and jacket thickness

- 133 - EFDA Technology / Magnet Structure
Table 2: Status of batch 1 sample production in January 2006
As far as phase (b) is concerned, Nexans has delivered 8 samples of batch 2: 4 samples using EAS strands and 4 samples using OCSI strands. The manufacture of the other subsize samples is delayed due to unavailability of the strands. CONCLUSIONS
The manufacture of samples corresponding to phase (a) is now completed. The manufacture of samples corresponding to phase (b) has been delayed due to late delivery of the strands from the different companies. The unit lengths from different strands are expected to be delivered at Nexans end of march 2006. REPORTS AND PUBLICATIONS
[1] J.L. Duchateau, N. Dolgetta “EFDA contract TW4-
TMSC-SAMAN1: First intermediate report on subsize sample manufacture” October 2005 internal report AIM/NTT-2005.026
TASK LEADER
Jean Luc DUCHATEAU DSM/DRFC/STEP CEA-Cadarache F-13108 Saint-Paul-lez-Durance Cedex Tel. : 33 4 42 25 49 67 Fax : 33 4 42 25 26 61 e-mail : [email protected]
Triplet / n. Acronym Cabling Billet Delivery by Nexans
Heat Treatment
Sent to FZK Test FZK Measurements Return by FZK to CEA
Remarks
3 Sc n.1 A3 3x3 #2 16/06/05 21/06/05 20/07/05 Report 25/11/05 To repeat with n.9 05/01/2006 no sufficient chrome removaln.9 B3 3x3 #1 05/10/05 10/10/05 07/11/2005 no holes - 1140mm long
n.11 A3 3x3x5 #1 05/10/05 14/11/05 kept as back-up no holesn.10 B3 3x3x5 #1 05/10/05 10/10/05 07/11/2005 no holes
1 Cu +2 Scn.2 Prototype 3x3 #2 16/06/05 verified OK held by CEA no sufficient chrome removal
n.12 A2 3x3 #1 05/10/05 14/11/05 To be sent no holesn.13 B2 3x3 #1 05/10/05 10/10/05 kept as back-up no holes
N.3 Prototype 3x3x5 #2 16/06/05 verified OK held by CEA no sufficient chrome removal
n.4 A2 3x3x5 #2 16/06/05 21/06/05 20/07/05 Report13/09/05 Destroied - repeat with n.14
05/01/2006 no sufficient chrome removal
n.14 B2 3x3x5 #1 05/10/05 10/10/05 07/11/2005 Report 09/12/05 no holes
n.5 A225 3x3x5 #2 26/10/05 14/11/05 09/12/2005n.15 B225 3x3x5 #1 26/10/05 14/11/05 kept as back-upn.6 A245 3x3x5 #2 26/10/05 14/11/05 09/12/2005
n.16 B245 3x3x5 #1 26/10/05 14/11/05 kept as back-upn.25 AS 3x3x5 #1 05/10/05 14/11/05 kept as back-up no holes - special twist pitch
n.24 BS 3x3x5 #1 05/10/05 10/10/05 07/11/2005 no holes - special twist pitch
n.17 A2 3x3x5x4 #1 26/10/05 14/11/05 09/12/2005n.18 B2 3x3x5x4 #1 26/10/05 14/11/05 kept as back-up
2 Cu+1Scn.20 A1 3x3 #1 05/10/05 14/11/05 09/12/2005 no holesn.19 B1 3x3 #1 05/10/05 10/10/05 kept as back-up no holesn.22 A1 3x3x5 #1 05/10/05 14/11/05 09/12/2005 no holesn.21 B1 3x3x5 #1 05/10/05 10/10/05 kept as back-up no holesn.7 Prototype 3x3x5x4 #2 10/07/05 verified OK held by CEA void fract. between 30.7 and
31.1 % chrome removal OKn.8 A1 3x3x5x4 #1 26/10/05 14/11/05 09/12/2005
n.23 B1 3x3x5x4 #1 26/10/05 14/11/05 kept as back-up

- 134 - EFDA Technology / Magnet Structure

- 135 - EFDA Technology / Magnet Structure
CEFDA04-1134
Task Title: TW4-TMSC-BARBEN: EFFECT OF BENDING STRAIN ON Nb3Sn STRANDS
STUDY OF BENDING STRAIN EFFECT ON CRITICAL PROPERTIES OF Nb3Sn STRANDS JACKETED WITH STAINLESS STEEL FOR VARIOUS BENDING AMPLITUDES AND TEMPERATURES
INTRODUCTION
This action is part of a global R&D program extension devoted to the Nb3Sn material. This task aims at investigating a possible influence of bending strain on strand performances. In order to perform tests on strands in relevant conditions to that occurring in a cable-in-conduit conductor, the tested samples are jacketed single strands. For this, 316 L stainless steel (SS) tubes are used for the jacket. The pure bending strain is imposed by changing curvature radius of the jacketed strand after heat treatment (HT), by transfer on adapted measuring mandrels. In the task action program, various steps were included: 1- the validation of a newly developed method for applying a pure controlled bending strain on a SS- jacketed Nb3Sn strand. This was performed through a dedicated test program with a 0.5% maximum bending strain. 2- the application of this method to the same strand but with a lower bending strain (0.25%). 3- an extra cross-checking of SS-jacketed strand IC variations with temperature. This action involved the Variable Temperature Cryostat (VTC) recently improved at CEA-Cadarache. Practically the parts 1 and 2 of this work have been performed in collaboration with ENEA Frascati (Italy) for jacketed strands IC tests at T=4.2 K and B=12 T that are measured in a dedicated local facility. Besides, the experimental data were interpreted with both a classical electromechanical model and a newly developed one, that cold be considered as a possible generalization of the latter. 2005 ACTIVITIES
BENDING APPLICATION METHOD (BEAM) DEVELOPMENT AND VALIDATION Supports and tools description Basically the BEAM includes the samples preparation and positioning on the HT mandrel and the strand transfer onto
the measuring mandrel after HT. The main tool used is a home-made one, shown in figure 1. This tool is used tomaintain the strand during the transfer and soldering stages, requiring a specific caution.
Figure 1: Mechanical tool used in BEAM (COBALT for Controlled Bending Application Loading Table).
Detailed descriptions of the development actions are available in [1]. Tests for BEAM validation Finally four BEAM candidate methods were defined, each being a unique combination of processes including strand transfer with radius increasing (RI) or decreasing (RD) and ends connections by unjacketting before HT (UB) or after HT (UA). All those were applied to 18 samples (including the unbent ones for reference) with a maximum bending strain of 0.5%. The final method choice is performed through a dedicated comparison campaign. For that 3 samples of each method are tested and comparisons were correlated with a hierarchic list of criteria. The experimental results were considered in terms of IC
degradation with )(UNBENTC
BENTC
UNBENTC
CI
III
−=∆ 100 .
They are illustrated in figure 2. Finally, the most reliable method chosen was the one implying a radius increase and the unjacketting occurring before HT (RI-UB). The strand (from Oxford Instruments) involved in this validation stage is candidate for ITER TF Coils and consequently can also be considered as tested in relevant conditions to ITER TF operation. For this particular strand, a moderate degradation in IC due to bending of 5% to 10% is observed.

- 136 - EFDA Technology / Magnet Structure
Figure 2: IC degradation curve for B from 10 T to 14 T for the four candidate methods in BEAM choice.
BEAM APPLICATION: TESTS ANALYSIS AND MODELLING Tests at low bending A maximum bending strain of 0.25% is applied on a new samples batch with same strands. Although some inaccuracies, the results were found in good consistency with the latter ones at 0.5% bending strain. This point also supports the validity of the chosen method for BEAM. Electromechanical modelling In first approach a classical model [2] was applied to fit the experimental data, in which roughly two extreme electrical configurations are considered in terms of interfilamentary current redistribution (ICR) capacity. Significant deviations were observed, leading to the development of an alternative possible model, called the Weighted Distribution Model (WDM). In this model we consider all intermediate ICR by mean of a dedicated function H with a parameter λ (see figure 3 for a general presentation). As a result a better fitting can be observed, compared to the classical model (figure 4). Nevertheless room for improvement still remain for the WDM to be fully relevant to the experimental data obtained. As a matter of fact, parameters such as filamentary matrix magnetoresistance or neutral axis shift could be investigated deeper.
Figure 3: Basic principles of the WDM.
Left: strain variation over the strand cross-section Right: different H weighting functions for various λ values.
Figure 4: tentative fitting with both classical (long TP and short TP) and WDM (with λ value) models.
TESTS AT VARIABLE TEMPERATURE The critical properties of the SS-jacketed strand were evaluated using the VTC facility. The experimental value were collected in GHMFL (CNRS, Grenoble) and correlated to the usual fitting for this type of strand. The parameters were found consistent except for the longitudinal intrinsic strain, typically 0.1% higher than expected. This could be due to the preparation conditions. CONCLUSIONS
During the year 2005 this task BARBEN was completed, including the following actions: - Definition of the four candidate methods for BEAM
and validation of the final choice process for the most reliable one. Here the RI-UB option was chosen in a test with 0.5% maximum bending strain.
- Application of this method in lower bending strain
range (0.25% maximum). - Development of an original electromechanical model
(WDM) to analyze the experimental data, provided that the classical one show some deviations. However WDM improvements are in progress.
- Check of the SS-jacketed strand IC variations with
temperature, found globally consistent with expectations.
REFERENCES
[2] J W. Ekin, Filamentary A15 Superconductors Ed.
New-York Plenum press (1980).
-10
-5
0
5
10
15
20
25
30
35
10 11 12 13 14 15
B(T)
∆∆ ∆∆IC (
%)
RI-UB #1008RI-UB #1006RI-UB #1001RI-UB averageRI-UA #1007RI-UA #1002RI-UA #1005RI-UA averageRD-UB #1413RD-UB #1416RD-UB averageRD-UA #1417RD-UA #1418RD-UA #1415RD-UA average
r
O
θ x
εεεεb(x)
AB
0-π π
JC(θθθθ)
A
BB
H(θθθθ)a) λλλλ <<1
c) λλλλ >>1 b) λλλλ ~ 1
θ
ΓΓΓΓ
-10
0
10
20
30
40
50
60
70
10 11 12 13 14
B(T)
I Cd
egra
dati
on (
%) #1008
#1006#1001average exp. datalong TP ε=-0.65%short TP ε =-0.65%λ=4 ε =-0.65
-10
0
10
20
30
40
50
60
70
10 11 12 13 14
B(T)
I Cd
egra
dati
on (
%) #1008
#1006#1001average exp. datalong TP ε=-0.65%short TP ε =-0.65%λ=4 ε =-0.65

- 137 - EFDA Technology / Magnet Structure
REPORTS AND PUBLICATIONS
[1] Zani L, Cloez H, Tena M, Della Corte A, Muzzi L and Di Zenobio A, Development of a controlled bending application method for investigating Nb3Sn jacketed strands, Supercond. Sci. Technol. 18 S390–S395 (2005) TASK LEADER
Louis ZANI DSM/DRFC/STEP CEA-Cadarache F-13108 Saint-Paul-lez-Durance Cedex Tel. : 33 4 42 25 29 67 Fax : 33 4 42 25 26 61 e-mail : [email protected]

- 138 - EFDA Technology / Magnet Structure

- 139 - EFDA Technology / Magnet Structure
CEFDA04-1170
Task Title: TW4-TMSC-RESDEV: DEVELOPMENT AND TESTING ON NEW RESIN SOLUTION
INTRODUCTION
New advanced cyanate ester-based resin materials have been tested and found to have significantly improved radiation resistance as compared to currently used resins. Therefore, it is necessary to stimulate the activity within Europe to gain experience with these new resin systems in close collaboration between the associations and the European companies. The primary objective of this task is to industrialise the vacuum impregnation technique of new advanced resins with optimized catalyst contents, resin temperatures and times for large magnet systems. To qualify the process, a mock-up with about 50 kg of resin will be manufactured. 2005 ACTIVITIES
The first step was to verify the capability of the resin proposed for the mock-up realization to be used in the industrial process of the coils manufacture. The cyanate ester/epoxy resin blend (PY 306 : 60 ppw; AroCy 10-L : 40 ppw; Mn-acetyl-acetonate in nonyl-phenole : 1.5 ppw), proposed by Hunstman and tested by ATI appears to be very interesting because of its good mechanical properties after irradiation. But, after discussions with potential coils manufacturers (Garching - March 05), we have had the confirmation that some properties of this resin (pot life, curing temperature, toxicity) were really not compatible with the vacuum impregnation process of the ITER TF coils in an industrial context. The conclusion was that the resin has to fulfil the following requirements: - According to the dimensions of the coils to be impregnated, a pot life of at least 24 hours is required at the impregnation temperature (between 40°C and 70°C): viscosity initially <100 mPa.s and the increase should not exceed a factor of 2 during the life time. - The safety aspect is important: it could be very difficult, even impossible, to use carcinogenic elements in an industrial context. - Because of the constitutive elements of the coil, the curing temperature cannot exceed 150 °C. - The system has to support 3 or 4 curing cycles.
According to this fact, it was decided that the test on the mock-up should be done with the relevant resin and that the next step will be to find a resin which matches the manufacture requirements for the ITER TF coils. The test has been postponed until the new resin is available. A meeting has been organised the 26th of april by CEA-Saclay in the Hunstman company at Basel (participants: Alstom - Ansaldo – CEA-Saclay –Hunstman - Supratec) to see how the company can adjust the resin composition [1]. Hunstman is working on new formulations and the progresses were regularly followed by mails and phone calls. Several catalyst components have been tested and some encouraging results have been obtained with the cyanate-ester alone. The required viscosity profile has been obtained using a catalyst based on Cobalt (III) acethylacetonate: the resin presents a pot life of 24 h at 70°C, the viscosity increasing from 50 mPas to about 200 mPas, which is suitable for an impregnation. At this time, Hunstman begins the tests with the epoxy/cyanate-ester blend (60% epoxy, 40% CE), which has been defined as the baseline. Before the new formulation will be approved, samples will be tested under irradiations by ATI at Vienna (this step will take about 3 or 4 months). The delay to obtain the 50 kg of resin needed for the mock-up is about 3 months. REPORTS AND PUBLICATIONS
Report on the meeting by Huntsman (26/04/2005) ref: RESDEV-R-005-05. TASK LEADER
Françoise RONDEAUX DSM/DAPNIA/SACM/LEAS CEA-Saclay F-91191 Gif-sur-Yvette Cedex Tel. : 33 1 69 08 64 49 Fax : 33 1 69 08 69 29 e-mail : [email protected]

- 140 - EFDA Technology / Magnet Structure

- 141 - EFDA Technology / Magnet Structure
CEFDA04-1201
Task Title: TW5-TMS-EDDES: EUROPEAN DIPOLE DESIGN ACCELERATOR TYPE MAGNET
INTRODUCTION
Within the framework of the European Fusion Programme a design activity has been started late 2004 by the EFDA Close Support Unit at Garching (FRG) to design a 12.5 T superconducting dipole magnet. This new magnet shall be hosted in one of the existing cryogenic laboratories in the EU to test, in particular, the full size conductor samples that shall be produced during the ITER magnets procurement. The objective of the 2005 activity, which covers the full task activity (all the work has been done in 2005), deals with the studies carried out on one of the possible designs: The cos θ coil configuration (saddle coil) commonly used for accelerator magnets. This coil configuration, based on the use of Rutherford-type cables, could lead to less voluminous and less expensive solution compared to that using cable-in-conduit conductor. 2005 ACTIVITIES
After having finalized the requirements for the magnet and the design criteria, two possible magnetic configurations have been determined, using two superconducting cables made of strands which should be available in 2005. For each of these two magnetic configurations, the following aspects have been studied: - Dynamic losses (when the magnet is pulsed) - Magnet protection - Mechanics - Rough cost estimate REQUIREMENTS AND DESIGN CRITERIA: The requirements are as follow: - Bore field: Use 12.5 T as minimum guaranteed + 10%
as target - Clear cold bore diameter : 130 mm - Current density in superconducting material: use Nb3Sn
strands available in 2005 (i.e. with a current density in non copper @ 4.2 K @ 12 T of about 2000 A/mm2 ) Magnetic field homogeneity : 1% at 20 mm from the free cold wall ( i.e. ∅ 90 mm)
- Magnet length: such that B >= 12.5 T over 1500 mm Magnet cycling: +/- 0.5 T at 4 or 10 T with dB/dt = 0.01 T/s (meeting at CERN) or 0.18 T/s (annex of contract)
And the design criteria are: - Mechanics: As Nb3Sn superconducting strands show
significant degradation (current density) when submitted to stress higher than 150 MPa, this value must not be
exceeded, especially if the margin on the load line is low.
- Protection: Two aspects have to be considered:
o Maximum temperature in case of quench: It is commonly admitted that this temperature should not exceed the room temperature, 300 K.
o Voltage: The electrical installation has to be tested to verify that it can resist to the voltage induced by a quench. The rules to determine the voltage tests are 2U+1000 or U+2000. A voltage in case of quench of 750 volts can then be admitted, even if we consider that 500 volts would be better.
SUPERCONDUCTING STRANDS After having chosen the coil inner diameter (145 mm), two strand with slightly different characteristics where chosen:
Characteristics of the 2 strands:
OST Strand
Alstom Strand
JcnonCu (12T, 4.2K) (A/mm2) 2167* 2000 JcnonCu (14T, 4.2K) (A/mm2) 1289* Strand diameter (mm) 0.7 0.825 Cu/nonCu ratio 1 1
* measured on non cabled strand [2] All calculations have been carried out with the two strands, but we will report here only with the one which gives the best results MAGNETIC STRUCTURE: The classical cos θ structure is shown in figure 1
Figure 1: ¼ of the magnetic structure

- 142 - EFDA Technology / Magnet Structure
Main characteristics
LOSSES DURING MAGNET CYCLING Two cycles have been considered: +/- 1 T around 4.5 T and +/- 1 T around 10.5 T. For each of these two cases, 2 ramp rate have been studied: 0.01 T/ s and 0.18 T/s Results are as follow:
This table shows that the losses due to the magnetization of the filaments are predominant. More generally, the level of the losses in the conductors should be manageable at a ramp rate of 0.01 T/s but it becomes problematic at a ramp rate of 0.18 T/s. MAGNET PROTECTION This study has shown that the protection of the magnet is a critical issue: quench heaters are needed on each coil layer and even with these heaters, the temperature and the voltage stay at the limit of what is acceptable:
Figure 2: Voltage at the terminals of each layer vs delay time with quench heaters on the external and second layers
10 1000
50
100
150
200
250
300
350
400
Tem
pera
ture
(K
)
time delay (ms)
TmaxC1 TmaxC2 TmaxC3 TmaxC4
Temperature of the hot point of each layer vs delay time with quench heaters on the external and second layers
MECHANICS This study has shown that mechanics is the main issue: The mechanical stress reaches 231 MPa in the coils during magnet energization. This value is well above the limit of 150 MPa. This shoes that magnets with such high magnetic field and large aperture will require new mechanical structure, demanding for long studies, before to be useable for either particle accelerators or other applications
ROUGH COST ESTIMATE The total estimated cost for this magnet is about 2 100 k€ for the dipole magnet and 21 full time equivalent for human resources.
Without
yoke With yoke
Current in each block (A) 9472 7590 Peak field (T) 13.69 13.41 L (mH/m) 87.2 114.8 E (kJ/m) 3912 3309 Quench margin (%) 3.3 7.4 Temperature margin (K) - 2.3
Cycle 3.5 T->4.5 T->3.5 T
9.5 T->10.5 T->9.5 T
Ramp rate 0.01 T/s
0.18 T/s
0.01 T/s
0.18 T/s
Pc (Rc =10-4 Ohms)
0.06 19.26 0.05 17.23
Pa (Ra=10-6 Ohms)
0.08 24.27 0.07 21.74
Pif 0.03 9.37 0.03 9.09 Physt 19.98 359.64 6.34 114.12
Welding + Cool down
Energization
Coils Stress (MPa) σθ σr σθ σr Average over coil -157 -52 -160 -78 Average over midplane -142 -178 Average over pole plane -177 -112 Minimum over pole plane
-23 -10
Point A -182 -231 Point B -75 -103 Point C -188 -35 Point D -23 -10 Displacement (mm) ∆θ ∆r ∆θ ∆r Average over midplane
-
0.696
-0.582
Average over pole plane -0.144
-0.77
5 -0.190 -0.779
Collars Peak Von Mises stress 1292 1236
10 1000
200
400
600
800
Vol
tage
(V
)
delay time (ms)
VC1 VC2 VC3 VC4

- 143 - EFDA Technology / Magnet Structure
A B
D
C
Pole plane
Midplane
Figure 4
CONCLUSIONS
The purpose of our study was to verify that a dipole magnet for the ITER test facility can be an “accelerator type” magnet and to give the basic parameters of such a magnet for a future possible detailed study. It appears that on several aspects, such a magnet is near or beyond the limits for a safe design: - The needed field quality doesn’t allow a design where
the peak field in coils is fully optimized. In other words, the margin on the load line could be increased up to 10%, (which is still a rather low value) but only if the needed field quality is relaxed.
- The magnetic design of the magnet can be achieved with two different superconducting strands but the criterion for voltage has to be increased from 500 to 750 Volts.
- On the mechanical part, we have shown that the maximum stress in the coils is higher than 200 MPa, well beyond the one judged to be acceptable (150 MPa). Mechanics appears to be the most critical aspect of this design.
- During magnet cycling, losses are acceptable. This aspect is not a big issue.
This magnet would be built using the usual technology of Nb3Sn “cos θ” magnets working in a 4.2 K helium bath. The structure of the cryostat could then be rather simple. The price of such a magnet is rather low with respect to the price of a “Cable In Conduit” design. We estimate the material to cost about 2.1 MEuros, and the manpower needed to build it to about 21 FTE. However, a lot of R&D has to be made and such a magnet could probably not be realized in less than 4 years from now. In summary, our study shows that, for a free cold area of 130 mm in diameter and 12.5 T, the “cos θ” design is above the norm in terms of the mechanical behaviours (B2R, which is representative of mechanical stress, should be decreased by about 35% to stay in the norms). A safer design of such a magnet, with an alternative mechanical structure would demand for time consuming developments, especially for the mechanical aspect.
REFERENCES
A. Devred at al., “Status of the Next European Dipole (NED) Activity of the Collaborated Research in Europe (CARE) Project”, Proc. of ASC 2004 conference Private communication (Dan Dietderich, Lawrence Berkeley National Laboratory) R. Scanlan, “The USA experience on Nb3Sn and Bi-based superconductors and future plans”. HEHIHB-AMT WAMS (Workshop on Accelerator Magnet Superconductors), 22-24 March 2004, Archamps, France S. Russenschuck, “ROXIE: Routine for the optimization of magnet X-sections, inverse field calculation and coil end design”. Proceedings of the first international Roxie users meeting and workshop, 16-18 March 1998, CERN, Switzerland A. P. Verweij, “Electrodynamics of superconducting cables in accelerator magnets”. PHD Thesis, Twente University, The Nederlands, 1995 L.T. Summers et al., “A model of prediction of Nb3Sn critical current as a function of field, temperature, strain and radiation damage”, IEEE Trans. Mag., Vol. 27 N°2, pp2041-20044, 1991 D. Leroy and O. Vincent-Viry,” Preliminary Magnetic Designs for Large - Bore and High - Field Dipole Magnets”, Report CERN/EDMS Nr 555826 December 2004. J. E. Kaugerts et al., « Design of a 6T, 1T/s Fast-Ramping Synchrotron Magnet for GSI’s planned SIS 300 Accelerator », proceedings of ASC 2004. R. Otmani, “Etude de câbles Nb3Sn pour quadrupôles supraconducteurs”, PHD Thesis, CEA/DAPNIA/STCM 99-1001, 1999 (in French). P. Verpeaux, T. Charras et A. Millard, “CASTEM 2000 une approche moderne du calcul des structures, Calcul des structures et intelligence artificielle”, Pluralis, 1988, p. 261-271. P. Vedrine et al., “Measurement of the thermo-Mechanical Properties of NbTi Windings for Accelerator Magnets”, IEEE Trans. Appl. Supercond., Vol. 9, No. 2, pp. 336-239, 1999. M. Durante, “Essais de compression sur empilements droits et autres échantillons”, Rapport technique interne n°5-2650N--2300 004 00, 2000. M. Durante, “Mesure de retreint thermique d'empilements droits et d'autres échantillons”, Rapport technique interne n°5-2650N--2300 005 00, 2000. M. N. Wilson, “Superconducting Magnets”, Oxford Science Publication

- 144 - EFDA Technology / Magnet Structure
REPORTS AND PUBLICATIONS
H. Félice, P. Fazilleau, A. Payn, J.M. Rifflet, L. Quettier, M. Segreti, “EFDA Dipole conceptual Design; Accelerator type magnet; EFDA contract CEFDA01-1201”, Final report for this task A. Portone, E. Salpietro, L. Bottura, P. Bruzzone, W. Fietz, R. Heller, J-M. Rifflet, J. Lucas, F. Toral, S. Raff, P. Testoni, “Conceptuel Design of the 12.5 T Superconducting EFDA Dipole, Magnet Technology Conference 19, Genoa, September 2005 TASK LEADER
Jean-Michel RIFFLET DSM/DAPNIA/SACM/LEAS CEA-Saclay F-91191 Gif-sur-Yvette Cedex Tel. : 33 1 69 08 49 16 Fax : 33 1 69 08 69 29 e mail : [email protected]
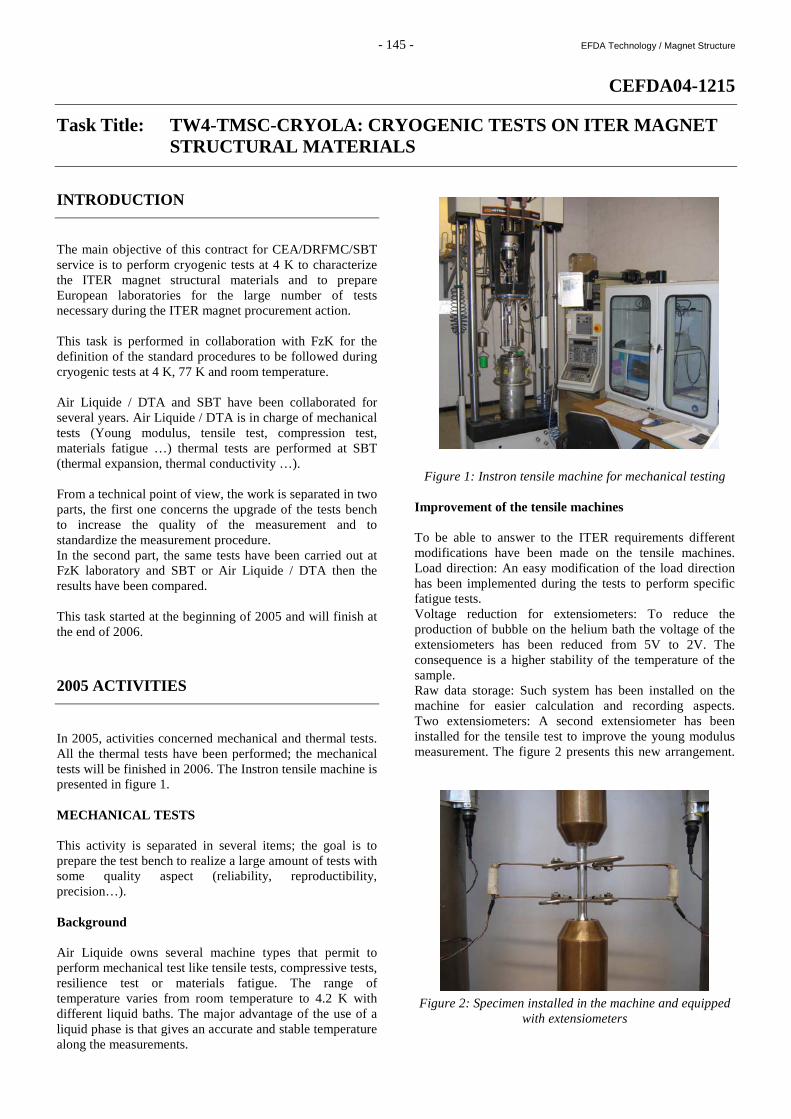
- 145 - EFDA Technology / Magnet Structure
CEFDA04-1215
Task Title: TW4-TMSC-CRYOLA: CRYOGENIC TESTS ON ITER MAGNET STRUCTURAL MATERIALS
INTRODUCTION
The main objective of this contract for CEA/DRFMC/SBT service is to perform cryogenic tests at 4 K to characterize the ITER magnet structural materials and to prepare European laboratories for the large number of tests necessary during the ITER magnet procurement action. This task is performed in collaboration with FzK for the definition of the standard procedures to be followed during cryogenic tests at 4 K, 77 K and room temperature. Air Liquide / DTA and SBT have been collaborated for several years. Air Liquide / DTA is in charge of mechanical tests (Young modulus, tensile test, compression test, materials fatigue …) thermal tests are performed at SBT (thermal expansion, thermal conductivity …). From a technical point of view, the work is separated in two parts, the first one concerns the upgrade of the tests bench to increase the quality of the measurement and to standardize the measurement procedure. In the second part, the same tests have been carried out at FzK laboratory and SBT or Air Liquide / DTA then the results have been compared. This task started at the beginning of 2005 and will finish at the end of 2006. 2005 ACTIVITIES
In 2005, activities concerned mechanical and thermal tests. All the thermal tests have been performed; the mechanical tests will be finished in 2006. The Instron tensile machine is presented in figure 1. MECHANICAL TESTS This activity is separated in several items; the goal is to prepare the test bench to realize a large amount of tests with some quality aspect (reliability, reproductibility, precision…). Background Air Liquide owns several machine types that permit to perform mechanical test like tensile tests, compressive tests, resilience test or materials fatigue. The range of temperature varies from room temperature to 4.2 K with different liquid baths. The major advantage of the use of a liquid phase is that gives an accurate and stable temperature along the measurements.
Figure 1: Instron tensile machine for mechanical testing
Improvement of the tensile machines To be able to answer to the ITER requirements different modifications have been made on the tensile machines. Load direction: An easy modification of the load direction has been implemented during the tests to perform specific fatigue tests. Voltage reduction for extensiometers: To reduce the production of bubble on the helium bath the voltage of the extensiometers has been reduced from 5V to 2V. The consequence is a higher stability of the temperature of the sample. Raw data storage: Such system has been installed on the machine for easier calculation and recording aspects. Two extensiometers: A second extensiometer has been installed for the tensile test to improve the young modulus measurement. The figure 2 presents this new arrangement.
Figure 2: Specimen installed in the machine and equipped with extensiometers

- 146 - EFDA Technology / Magnet Structure
Characterization of the machine After improvement of the machine, different sensors (load cell, extensiometer) were characterized and calibrated so that their noise at room temperature (RT) and 4 K was estimated. The following table indicates the results. Sensors Temperature Noise (% of full range) Load cell RT 0.3 Extensiometer RT 0.2 Extensiometer 4 K 0.25
These values are lower than the ITER requirement (0.5 % of the full range) which validate the test facility. Mechanical tests After the characterization of the test bench, some tests have been carried out with different samples and at different temperatures. The figure 3 shows the results for a stainless steel specimen (304 L) at 4 K.
Tensile test of 304 at room temperature
0
200
400
600
800
0 0,1 0,2 0,3 0,4
Strain (mm)
Str
ess
(MP
a)
Figure 3: results of tensile test for 304 L 55 steel at 4 K THERMAL TESTS Two types of thermal tests are carried out in this contract: thermal expansion and thermal conductivity. These tests are performed from room temperature to 4 K. They are done twice: SBT lab and FzK. The purpose is to qualify CEA lab for these types of tests for the ITER project. After the measurements, results are compared; a good agreement between the two labs has been obtained. figure 4 and figure 5 present the conductivity cell and a measurement result.
Figure 4: View of the thermal conductivity measurement cell
Figure 5: Thermal conductivity measurement of the stainless steel (316 LN) between 4 K and room temperature
at CEA CONCLUSIONS
CEA / SBT and Air Liquide / DTA have a long experience on thermal and mechanical tests on materials for a range of temperature between 4 K and room temperature. An agreement exists between these two entities: CEA / SBT is in charge of the thermal tests and Air Liquide / DTA is in charge of the mechanical ones. Due to the large amount of tests to be done for ITER and due to new mechanical tests requests for the project some improvements were necessary and have been completed in 2005. Concerning the thermal measurements, all the specified tests have been achieved (thermal conductivity and thermal expansion at 4 K and room temperature). In 2006, two subtasks will remain: the end of the mechanical measurements and new modification proposal for the test bench in order to improve productivity. TASK LEADER
Alain GIRARD DSM/DRFMC/SBT CEA-Grenoble 17, rue des Martyrs F-38054 Grenoble Cedex 9 Tel. : 33 4 38 78 43 65 Fax : 33 4 38 78 51 71 e-mail : [email protected]
Stainless steel (316LN)Sample N°1
0,1
1
10
100
1 10 100 1000Temperature (K)
The
rmal
con
duct
ivity
(W
/m/K
)

- 147 - EFDA Technology / Magnet Structure
CEFDA04-1219
Task title: TW4-TMSC-SAMFSS: MANUFACTURE OF TWO FULL SIZE SAMPLES OF Nb3Sn STRANDS
INTRODUCTION
Following the revision of the design of the ITER TF conductor in 2003, relying on the use of advanced Nb3Sn strands, EFDA launched an R&D programme in 2004 to procure advanced strands from industry. The final advanced Nb3Sn strand qualification will be done by the testing of two full size conductor samples. This task covers the manufacturing of the samples according to the requirements of the SULTAN facility. The work includes the joint fabrication, sample assembly and instrumentation. The manufacture of the conductor lengths is performed by ENEA and the heat treatment is performed at CRPP. The zero field joint resistance will be less than 2 nΩ, in order not to interfere with the conductor measurements. The same applies to the upper terminations, which will meet the SULTAN requirements. The two full-size samples (corresponding to four legs) will be made using different types of advanced strand. 2005 ACTIVITIES
SAMPLE DESIGN The main guideline for the design of the two full size samples was to test the candidate of advanced strands produced by industry in a real conductor configuration. In order to be able to check the performance upgrade due to the strand itself, it was proposed to use a cable layout identical as the one of the previous TFMC Full Size Joint Sample (FSJS) which was the conductor used in the TF Model Coil. A conceptual design of the full size sample was produced on the basis of the use of a TFMC type conductor with thin circular steel jacket and with a joint using the twin box concept previously developed by CEA. The main basis was the PF-FSJS design drawings which were adapted to the use of a circular conductor. The sample is 3.50 m long hair pin type constituted by two parallel conductors joined at the bottom by a joint and connected at the top by the way of two upper terminations to the test facility busbars (figure 1). The sample is devoted to be tested in the CRPP SULTAN test facility for conductor test which means that the transverse high field will be applied on a reduced length (i.e. 450 mm) of the conductor only. The cooling of the sample is insured by circulation of supercritical helium from the top to the bottom in parallel for each of the two legs. In order not to heat the flow through the upper joints, an intermediate inlet piece is inserted at the bottom of the upper terminations to inject helium from this point through the circumferential cable area. In this way, a thermal gradient is produced between the upper joints and the inlet. A sample ohmic heater is installed below the inlet on each
leg to control the temperature inside the conductor at the high field region. The instrumentation was defined in order to carry the critical current and current sharing temperature measurements with voltage taps and temperature sensors. Additional instrumentation was implemented in order to investigate the current repartition among sub-cables with hall probes as well as to study the thermo hydraulics with temperature sensors along the sample legs. A complete conceptual drawing set including an instrumentation drawing was produced using CATIA v5. A technical specification document was issued and used for a call for tender [1]. The manufacturer was chosen to be Ansaldo Superconduttori in Genoa (Italy).
Figure 1: Sketch of a Full Size Sample CONDUCTORS Four conductor lengths were used for the manufacture of the two full size samples. Each leg of each sample being manufactured using one candidate advanced strand for TF coils. In this way, four different conductors will be tested separately. The layout of all these conductors is the same as the TFMC conductors. Table 1 summarises the main characteristics of each of these conductors. The first two conductors using EAS and OST strands were delivered by ENEA to A.S. on may 2005. They were used for the manufacture of the first sample called EU-TFAS1. The second conductor pair using OKCS and OCSI strands were delivered in september 2005.

- 148 - EFDA Technology / Magnet Structure
Table 1: Main characteristics of the four conductors
Conducto rName EAS OST OKSC OCSI
Jacket AISI 316 LN, o.d. 40.4 mm, 1.6 mm thick
Cabling layout 3x3x4x5x6 (1080 strands)
Central spiral 10 x 12 mm
Number of s.c. strands 1080 720 720 1080
Number of Cu strands 0 360 360 0
Strand diameter 0.81 mm
Manufacture way Bronze route Internal tin Internal tin Internal tin
Cu/ non Cu ratio 0.92 1 1 1.4
Manufacturer European
Advanced
Superconductors
Oxford
Instruments
Outokumpu Finland Outokumpu Italy
EU-TFAS1 MANUFACTURE The manufacture of the first sample started in may 2005. The conceptual drawings produced by CEA were converted in manufacture drawings by A.S. after agreement on the manufacture techniques. The samples joint using the twin box concept, the remaining part of the copper-steel plate bonded by explosion used for the PF-FSJS manufacture was delivered by ENEA to A.S. After machining of the main components as the termination boxes and associated covers, the two legs were prepared for terminations assembly according the following way: The jacket was removed at each conductor end, the cable wrapping was removed, the central spiral was locally cut and replaced by a 3 mm thick plain tube. After re-forming of the cable twist pitch, the sub-cables wraps were locally cut and the strands chrome plating was removed by mechanical brushing. The cable was then inserted into the termination box and was compacted through the cover down to a 25 % void fraction. A force of about 2 MN was needed for each of these compactions. The termination was completed by TIG welding of the cover on to the box and of the termination on to the jacket with respect to the alignment. Note that despite the new terminations design with a lateral and smaller weld between cover and box, a banana effect of about 2 mm was observed on all the terminations. This unexpected deformation which was higher than in the previous PF-FSJS manufactured by Alstom was probably due to the use by A.S. of the manufacturing process of the TFMC terminations for which this problem was already raised. After completion of each leg in the same way, an helium test was performed to check the tightness. The legs were then sent to CRPP in august 2005 in order to perform the heat treatment for Nb3Sn reaction. After heat treatment, the legs were sent back to A.S. in september. The lower terminations were machined to recover the copper soles flatness and to allow joint clamping. The joint was then soldered using the soldering procedure previously used for TFMC inner joints. The joint quality was checked by gamma ray inspection.
Voltage taps were then installed along the joint on the copper sole as well as on the cover in order to check the contact resistance between the strands and the copper sole. The corresponding wiring was connected since no access to this part will be possible after joint clamping. The steel clamping was the TIG welded on the joint to ensure its mechanical stiffness. The conductor insulation was then performed by bonding of several turns of 0.5 mm epoxy tape on the conductor jacket at the clamps locations in order to reach the target insulation thickness of 2 mm. After final assembly of the clamps, the upper terminations were machined to recover the flatness of the copper soles needed for connection to the test facility current leads. The final operations were the piping installation, final tightness check and installation of the instrumentation as voltage taps, temperature sensors and ohmic heaters along the conductors. A specific epoxy support including a set of 4 Hall probes was installed on each conductor just after the high field region, before the joint. The corresponding instrumentation wiring was connected to the sensors and equipped with the required connectors. A protection epoxy nose at the bottom of the sample and four epoxy corners surrounding the sample were installed and a final geometrical check has allowed to control the sample geometry to fit into the SULTAN specifications. The sample was sent to CRPP on november 17th 2005 (figure 2). EU-TFAS2 MANUFACTURE The manufacture of the sample started in september 2005, this sample uses the OKSC and OCSI conductors. The preparation of the two legs was done in the same way as described for the first sample. After completion of the legs manufacture, the terminations deformations were in the same range as previously observed on the first sample legs. This result was foreseeable since no modification of the welding procedures was done by A.S. The two legs were sent for heat treatment to CRPP in november 2005 and sent back to A.S. in december 2005 for final sample assembly.

- 149 - EFDA Technology / Magnet Structure
Figure 2: EU-TFAS1 ready to be sent for test at CRPP CONCLUSIONS
This task is devoted to the manufacture of two full size samples to be tested in the CRPP test facility. These samples were designed with a TFMC type conductor using circular steel jacket. Each sample uses two conductor lengths each of them using one candidate advanced strand proposed by the industry. Four different strands will then be tested in the same cable configuration and the results will be compared to the previous results gained on the TFMC full size joint sample. After production of conceptual drawings, the manufacture was performed by Ansaldo Superconduttori (Italy) and started in may 2005. The first sample was manufactured with EAS and OST strands. After the heat treatment at CRPP in august, the assembly including instrumentation was completed during summer. The sample was finally delivered to CRPP for test in november 2005. In the same time, the second sample manufacture was started after delivery of the conductors using OCSI and OKSC strands in september. After preparation of the two sample legs, the heat treatment was performed by CRPP in december 2005 and the legs sent back to A. S. in december 2005 for final assembly. REFERENCES
[1] N. Dolgetta, Specifications for the manufacturing of two TF full size conductor test samples, Note AIM/CCH-2005.003, 07/02/2005.
TASK LEADER
Patrick DECOOL DSM/DRFC/STEP CEA-Cadarache F-13108 Saint-Paul-lez-Durance Cedex Tel. : 33 4 42 25 43 50 Fax : 33 4 42 25 26 61 e-mail : [email protected]

- 150 - EFDA Technology / Magnet Structure

- 151 - EFDA Technology / Magnet Structure
TW1-TMS-PFCITE
Task Title: POLOIDAL FIELD CONDUCTOR INSERT (PFCI)
INTRODUCTION
Within the framework of the ITER project, the EU Project Team has been asked to manufacture a model coil, called Poloidal Field Conductor Insert (PFCI), to be tested in the JAERI test facility in Naka, Japan. The development, manufacture and testing of the PFCI coil shall support the design of the ITER PF conductors and coils. The main objective of the model coil tests is to get a complete knowledge and understanding of the behaviour of high current NbTi cable-in-conduit conductors and related joints under operating conditions as foreseen for the ITER Poloidal Field (PF1 & PF6) coils. A conductor representative of the ITER PF1 & PF6 coils shall be wound in a single layer coil and equipped with a numerous instrumentation composed of inductive heaters, voltage taps, temperature and pressure sensors, strain gauges, etc. The coil shall be inserted inside the bore of the ITER CS Model Coil (CSMC) at the JAERI test facility in Naka (Japan) and tested in 2006. The coil winding features a square conductor with a NbTi superconducting cable inserted in a thick wall, stainless steel jacket. Superconducting joints are required to connect the coil to the current leads. Another joint is located at an intermediate location in the winding to test an ITER-relevant joint under magnetic field operating conditions similar to the ones foreseen in the ITER PF coils. The upper and lower terminations shall connect the winding to the existing CSMC Insert busbar system of the Naka facility, as well as to the cryogen supplies. The work of CEA within task PFCITE covers the following items: - Participation to definition and review of the test procedure - Participation to operational campaigns of the PFCI and reporting of the results - Analysis of the results, including thermo-hydraulic, electro-magnetic, and structural simulations of the real operating conditions of the coil - Analysis of impact of results on ITER PF coils design. The NbTi cable for the PFCI was delivered to Ansaldo Superconduttori in august 2002 from the Russian Federation, the jacketing was completed at Ansaldo Superconduttori in june 2003. Fabrication of the coil is running at Tesla (UK) under monitoring by EFDA/CSU Garching. Unfortunately, the PFCI secondary impregnation in december 2005 failed partially. In order to correct the situation an additional impregnation needs to be carried out. Tesla informed EFDA/CSU about the new revised schedule, which indicates one month delay compared to the latest schedule, i.e. the revised shipping date is expected to be at the end of march 2006.
2005 ACTIVITIES
For 2005, our activities were reduced because of the delay taken in the fabrication of the PFCI at Tesla (UK). An action was launched in order to build a model of the PFCI with the Vincenta code. Vincenta is a thermohydraulic code developed by the Efremov Institute, in St Petersburg (Russian Federation), dedicated to cryogenic calculations, specially for CICC and associated loops. A first work was to get some experience with Vincenta and to prepare models for the future analysis of PFCI experiments at JAERI. This work was performed in three steps: first pressure drop calculations, second steady state simulation and comparison with results given by other models, last a pulsed current scenario simulation. PRESSURE DROP CALCULATIONS In order to perform any thermohydraulic analysis on a CICC, it is essential to calculate with a good accuracy the pressure drop as well as the mass flow repartition between annular (bundle) and central (hole) channels. Thus, pressure drop and mass flow repartition in the PFCI winding circuit (~ 43 m long) have been computed with Vincenta, and then compared on the one hand to analytical results, and on the other hand to simulations with Gandalf (Gandalf is another cryogenic code dedicated to CICC calculations, developed by L. Bottura and diffused by Cryosoft). Results obtained with these three tools (at T = 4.5 K) show very good agreement as illustrated in figure 1 and figure 2.
0
50
100
150
200
250
0 5 10 15 20Mass flow rate (g/s)
Pre
ssur
e dr
op
(hP
a)
Analytical
Vincenta
Gandalf
Figure 1: Pressure drop vs. mass flow rate in PFCI conductor.

- 152 - EFDA Technology / Magnet Structure
0
0.1
0.2
0.3
0.4
0 5 10 15 20
Mass flow rate (g/s)
alfa
= Q
bund
le /
Qto
t
Analytical
Vincenta
Gandalf
Figure 2: Mass flow rate in bundle channel vs. mass flow
rate in PFCI conductor. STEADY STATE HEATING CALCULATIONS In order to run Vincenta under steady state conditions, it has been decided to simulate the permanent heating of the PF-FSJS (Poloidal Field Full Size Joint Sample). As a matter of a fact, experimental data have been obtained when testing the PF-FSJS in the Sultan test facility at CRPP (Villigen, Switzerland), and in a previous work, Gandalf simulations as well as a dedicated analytical model have shown good agreement with experimental results. Thus, Vincenta results under steady state conditions can be validated by comparison with those given by Gandalf and by the analytical model. Only one leg of the PF-FSJS has been modeled. This leg is a 2.2 m long CICC, submitted to a permanent heating of 30 W/m applied over 0.4 m on the jacket, at the entrance of the sample. Inlet conditions are a 8 g/s flow rate of supercritical helium at 4.5 K and a pressure of 1.02 MPa. Vincenta calculations have shown important sensitivity to mesh size and to a numerical parameter called AH. This parameter, adjustable by the user, is applied to the energy balance in the code, in order to improve the calculation stability. To get a correct enthalpy balance with Vincenta (30 W/m × 0.4 m = 12 W to the helium flow), one must check that both mesh size and AH values are well adapted to the conditions of calculation. Then, using the same heat exchange correlation in all the tools, Vincenta results are close to those obtained with Gandalf and the analytical model, as shown on the annular (bundle) and central (hole) temperature profiles given in figure 3. Note that the central channel is at a lower temperature since only the annular channel is first heated through the conductor jacket. PULSED SCENARIO SIMULATION The PFCI will be tested inside the CSMC at JAERI where both coils will be able to operate in pulse mode (pulsed currents). It has been decided to simulate a scenario of simultaneous current ramp up and ramp down in PFCI and CSMC. Coil currents vs. time are given in figure 4.
Figure 3: Temperature profiles along PF-FSJS (heating over the first 0.4 m).
After calculations of the heat load in the PFCI, in space and in time, it has been necessary to develop a tool to check the energy balance in Vincenta, in order to choose correct values for both the numerical parameter AH and the mesh size. This tool checks the energy balance in the PFCI between two time steps (PFCI is here an open system under transient conditions). Then, Vincenta calculation has been performed, as well as Gandalf calculation, with of course the same heat loads. Results obtained with both codes are very close, as shown in figure 5 on PFCI winding outlet temperature vs. time (figure 5).
0
10
20
30
40
50
60
70
0 50 100 150 200 250 300
Time (s)
Cu
rren
t (kA
)
I pfci
I csmc
Figure 4: CSMC and PFCI currents vs. time
4.55
4.65
4.75
4.85
4.95
0 200 400 600 800 1000
Time (s)
Ou
tlet t
emp
erat
ure
(K)
Thole Vincenta
Tbundle Vincenta
Thole Gandalf
Tbundle Gandalf
Figure 5: PFCI winding outlet temperature in hole and bundle vs. time

- 153 - EFDA Technology / Magnet Structure
Figure 5 shows negligible temperature difference between annular (bundle) and central (hole) channels. This was expected, since these temperatures are computed at the end of the winding (more precisely at the intermediate joint outlet) so at helium outlet. For easier calculations, joints (lower terminal and intermediate) have been replaced by regular conductor lengths. Finally, we can consider that Vincenta models (permanent and transient) are reliable, as in good agreement with analytical and Gandalf models. Besides, in the future, it will be useful to precise a methodology to choose mesh size and/or AH value adapted to each calculation. CONCLUSIONS
The Poloidal Field Conductor Insert is under fabrication in industry and should be tested in the CSMC facility (Naka, Japan) by the end of 2006. CEA is participating in the definitions of both the PFCI instrumentation and the testing programme. In order to model the thermohydraulic behaviour of PFCI, an action has been developed to build a model using the Vincenta code. A first step was to validate this code against analytical model and the Gandalf code under steady state and transient operating conditions.
TASK LEADER
Daniel CIAZYNSKI DSM/DRFC/STEP CEA-Cadarache F-13108 Saint-Paul-lez-Durance Cedex Tel. : 33 4 42 25 42 18 Fax : 33 4 42 25 26 61 e-mail : [email protected]

- 154 - EFDA Technology / Magnet Structure

- 155 - EFDA Technology / Magnet Structure
TW5-TMSF-HTSMAG
Task Title: SCOPING STUDIES OF HTS FUSION MAGNETS
INTRODUCTION
The construction of DEMO, a demonstration fusion reactor, is scheduled to start twenty years hence. Will the superconducting system of DEMO be simply an extrapolation of the superconducting system of ITER, or is it necessary to prepare for a complete technology mutation? This has to be considered as a function of the objectives of DEMO which are up to now not completely defined. This mutation could deal with the superconducting material if A15 materials cannot sustain the magnetic field of DEMO. But even if A15 materials are still on the stage, it is not sure that the major components or choices of ITER should be adequate for DEMO as well: plates, conductor shape, mode of cooling etc... The final report (september 2004) of the Power Plant Conceptual Study (PPCS), an important study carried out in Europe to prepare for the future, did not dedicate much to the magnet system. Precious indications are however given in the PPCS report on the magnetic field level which is considered. These indications can usefully guide our approach, it is however important that future activity in this field to be carried out in tight connection with the community of the magnet system. The HTSMAG task is dedicated to the investigation of the possible use of HTS superconductors in the future fusion reactors. 2005 ACTIVITIES
INFLUENCE OF THE MAGNETIC TOROIDAL FIELD ON THE DESIGN OF MAGNET SYSTEMS FOR FUTURE FUSION REACTORS [1] Regarding DEMO, our investigation has been carried out using the design of the European Power Plant Conceptual Study (EPPCS) model C. It is a tokamak the major radius of which is 7.5 m, compared to the ITER major radius of 6.2 m and a toroidal field of 6.5 T compared to the ITER toroidal field of 5.3 T. In figure 1 is presented a scheme of the radial stack which governs the tokamak main dimensions: - plasma minor radius - a distance ∆int integrating the first wall, blanket, neutron shield and TF thermal shield - the TF radial extension - the CS radial extension
Figure 1: Composition of the tokamak major radius
It is possible to estimate the TF radial extension as a function of the superconducting strand performances. The mechanical properties of the structures are assumed to be the same as in ITER. The maximum magnetic field Bmax on the conductor is in the range of 13.6 T. From figure 2, it is confirmed that above a non copper current density in the range of 150 A/mm2, the TF inner leg radial extension is not substantially affected, which means that 150 A/mm2 is sufficient. Both the Sumitomo Nb3Al strand and the Oxford Nb3Sn strand developed in the framework of ITER program, meet this objective but they are at the limit of their capability.
Figure 2: Influence of non copper current density on radial extension in DEMO TF inner leg
In conclusion, for the TF systems of future fusion reactors, the average current density is in the range of 10 A/mm2
and is driven by the large amount of structures necessary to resist the Lorentz forces. Thereby it is possible to accept superconducting strands with low non copper current density down to 150 A/mm2, without substantially affecting the TF radial extension of the system. Due to the combined effect of differential thermal contraction and transverse forces arising in large fusion conductors, Nb3Sn strands developed in the framework of ITER program or Nb3Al strands are at the limit of their capability at 13.6 T, the envisaged maximum field on the conductor. The conductor concept can certainly be improved to mitigate
1
1.2
1.4
1.6
1.8
2
2.2
100 150 200 250
Jnoncu (A/mm2)
TF
ra
dia
l e
xte
nsi
on
(m
)
5
6
7
8
9
10
11
Jco
nd
(A
/mm
2)
TF radial extension
Jcond
acceptable zone for Jnoncu
non acceptable zone for Jnoncu
Plasma minor radius
Plasma center
TF radial extension
CS radial extension
Tokamak central axis
∆int
Major Tokamak radius R

- 156 - EFDA Technology / Magnet Structure
the effect of the transverse magnetic field on the conductor degradation and even allow higher magnetic field for a demonstration reactor if needed. The improvement in Jnoncu will be beneficial to the cost by allowing a decrease of the total weight of the superconducting material. Other solutions (Bi-2212 or Nb3Sn at 1.8 K) can be envisaged but have still to prove their economical profitability. ESTIMATION OF RECYCLED POWER ASSOCIATED WITH CRYOGENIC REFRIGERATION POWER OF A FUSION REACTOR BASED ON TORE SUPRA EXPERIMENT AND ITER DESIGN [2] Estimation of power at 4.5 K The different sources of heat loads are presented in table 1 for both ITER and a steady state fusion reactor. It is assumed that an extrapolation from ITER to the fusion reactor can be done with some confidence if extrapolation rules exist and are sufficiently clear. It can be considered that Pst (steady state losses), for a given plasma elongation, is proportional to the surface of the torus plasma and therefore proportional to Rr, R being the major plasma radius and r the minor plasma radius. Pst mainly takes place in the TF system. The thermal radiation component is associated with the surface extension of the TF system. Thermal conduction is associated with the weight of the TF system which is a hollow object, the weight is also related to the surface.
Rr = 12.4 for ITER Rr=24.65 model B of EPPCS
Pcirc (due to helium circulating pumps) is proportional to Pst
in a fusion reactor, which translates that the circulating power is linked to the cryogenic power to be removed by helium circulation. In ITER Pcirc is proportional to (Pst+Ppl) (Pl pulsed load). By chance, this term in ITER has the same order of magnitude as the steady state cryogenic power in a fusion reactor. This is the reason why the circulating power will be taken in the fusion reactor at approximately the same level as for ITER. The heat load on the cold compressors Pcc is assumed not to exist in the fusion reactor, supposing that the progress in low Tc superconductors is sufficient to operate the magnets using a liquid He bath at 4.5 K and not at 4.3 K as in ITER. The power associated with cryopumps dedicated to torus and neutral beam injection (NBI) will be considered in a first approach as proportional to the plasma volume and therefore proportional to Rr2. As this part is substantial in the 4.5 K balance, it means that for the reactor, more economical means of pumping have to be developed. In ITER the liquefaction power associated for this part has been estimated, taking into account the usual refrigeration capacity of 100 W for 1 g/s liquid. Rr2 = 24.8 for ITER Rr2 =70.7 model B of EPPCS A 70 kA high temperature superconductor current lead demonstrator for the ITER magnet system has been recently tested. According to the experimental results it is possible to estimate the reduction of the refrigerator power consumption brought by this technology in different
operating conditions. In the case of permanent current in the leads which is representative of a fusion reactor and should certainly be available, the reduction factor is 3.7.
Table 1: Steady state 4.5 K heat load compared between ITER and a fusion reactor
ITER Extrapolated to
fusion reactor 1. Pulsed loads Ppl 10.7 kW ≈0 2. Steady state heat
load Pst 11.9 kW 25 kW
3. Heat load of the He circulating
pumps Pcirc
11.4 kW 15 kW
4. Heat load of the cold compressors
Pcc
4.5 kW 0
5. Torus and neutral beam
injection cryopumps Pcp
5.5 kW + 30 g/s (equiv. To 3
kW) total: 8.5 kW
30 kW
6. Liquefaction to cool the current
leads Pcl
130 g/s equiv. To 13 kW
4 kW
Total 60 kW 74 kW Estimation of power at 80 K: PN2
The cold power at this level is estimated to 1000 kW in ITER with about 2/3 for thermal shields and 1/3 for the precooling of the LHe plant. It is assumed that most of the power associated with the thermal shields is dominated by the thermal radiation power, neglecting the conduction through the supports. Both ITER thermal shield systems, the vacuum vessel thermal shield and the cryostat thermal shield, fit the TF system shape. The thermal radiation surface is proportional, at given plasma elongation, to Rr. Therefore 700 kW is linked to the plasma surface and has to be linearly extrapolated with Rr. Consistently with the following section and the 4.5 K factor of merit, only this part will be taken into account for fusion reactor extrapolation, which gives PN2 =1400 kW. Electrical power for cryogenic refrigeration Pst, Pcirc ,Pcc ,Pcp ,Pcl and PN2 will require a large electrical power at the level of the warm compressor station. This electrical power can be classically evaluated from the cold power using the factor of merit based on an efficiency factor and depending of course of the temperature value at which the cold power is dissipated. For a cold temperature T2 and a warm temperature T1, the Carnot efficiency is:
η= T2/(T1-T2) In a first approximation the refrigerator global efficiency r is linked to the Carnot efficiency by:
r= fη with f≈0.25. A value r=1/250 for the 4.5 K cold power and r=1/10 for the 80 K cold power is assumed based on recent construction of large cryoplants of comparable size.

- 157 - EFDA Technology / Magnet Structure
The resulting electrical power is presented in table 2.
Table 2: From cryogenic power to electrical power in a fusion reactor
Temperature level for cryogenic heat load
4.5 K 80 K
Cold Power 74 kW 1400 kW Electrical power 19 MW 14 MW
This gives an estimation of 33 MW for the electrical power needed for the refrigerator of a fusion reactor. CONCLUSIONS [3]
HTS materials can be considered with regard to their higher current density potentiality, which can induce a gain through a decrease of the total weight of the superconducting material. They can be also considered in case the magnetic value of DEMO goes above 14 T. By extrapolation from ITER cryoplant, a first estimation of the cryogenic power required at 4.5 K for the superconducting system of a steady state fusion reactor is 11 MW, a low value which does not substantially affect the efficiency of the reactor. Investigations will continue during the second year of activity to estimate the economical impact of a cryoplant operating at a higher temperature than 4.5 K. The operating temperature will be chosen as a function of the HTS (Bi 2212) critical properties in field a temperature. Design criteria for HTS fusion conductor dimensioning will be explored with a preliminary concept for the conductor. REPORTS AND PUBLICATIONS
[1] J.L Duchateau, J.Y. Journeaux, F. Millet “Estimation of recycled power associated with cryogenic refrigeration power of a fusion reactor based on TORE SUPRA experiment and ITER design” Nucl. Fusion 46 (2006) S94-S99. [2] J.L Duchateau “Influence of the toroidal magnetic field on the design of magnet systems for future fusion reactors” Presented at the 15 th International Toki Conference (december 2005, Toki, Japan) To be published in Fusion Engineering and design. [3] J.L Duchateau et al. January 2006 “task TW5-TMS-HTSMAG first intermediate report Internal report” AIM/NTT-2006.004
TASK LEADER
Jean Luc DUCHATEAU DSM/DRFC/STEP CEA-Cadarache F-13108 Saint-Paul-lez-Durance Cedex Tel. : 33 4 42 25 49 67 Fax : 33 4 42 25 26 61 e-mail : [email protected] In close collaboration with DAPNIA and DRFCM departments.

- 158 - EFDA Technology / Magnet Structure

- 159 - EFDA Technology / Magnet Structure
TW5-TMSF-HTSPER
Task Title: HTS MATERIALS FOR FUSION MAGNETS
INTRODUCTION
High Tc superconductors are just coming out of the R&D stage. Long term work will be needed until the availability of such conductors for fusion plant. Among the potential superconducting HTS materials Bi2212 seems the most advanced in term of industrial production as well as suitability for large superconducting magnets. This high Tc superconducting material will be studied in order to identify its engineering performance and the parameters limiting its use. Emphasis will be given in electrical properties with the aim to provide data for the TMSF-HTSMAG program. The first part of the work will be devoted to the manufacturing of a cryostat insert allowing the critical current to be measured up to 40K. This device will then be used to measure samples having different winding geometries and at different temperatures. The study will be done in tight coordination with the supplier of superconducting material to optimize the reaction cycle of the superconducting phase to produce high magnetic field. 2005 ACTIVITIES
STATE OF THE ART IN Bi2212 SUPERCONDUCTOR PRODUCTION We have decided to focus our study on the Bi2212 material (Bi2Sr2CaCu2O8-x) as it actually provides higher performances than Bi 2223 (Bi2Sr2Ca2Cu3O10-x) under high magnetic field. The most advanced development in high magnetic field using Bi2212 superconductors has been made between the National High Magnetic Field Laboratory (NHMFL, Florida, USA) and Oxford Superconducting Technology. They have realised a 4 T insert in Bi2212 placed in a compound resistive/Nb3Sn magnet producing 21.1 T. The conductor used is a round wire. Altogether 2.4 km of wire have been produced. The production has been made in 51 batches of wire, the critical current of which varies from 340 A to 870 A. This shows that the drawing process still needs to be optimized to gain in reliability to produce high performance products. It should be noted that the Oxford Superconducting Technology Company uses Nexans precursors for his production. The Nexans Company has been working since several years on a 800 kJ SMES (Superconducting Magnetic Energy Storage) operating at 20 K and with a local maximum field of 7 T. The conductor produced by Nexans in length up to 1000 m and contains 85 superconducting filaments in a silver matrix. The outer shell of this matrix is made of AgMg alloy as a strengthening element. The section of this conductor is 4 x 0.25 mm². Its current transport property reaches up to 500 A/mm² at 4.2 K and 20 T as maximum
value but the mean value is between 100 and 150 A/mm² at 4.2 K and 20 T. This is the conductor we will test in our test station once it will be upgraded to allow critical current measurement between 4.2 K and 60 K. Hundred meters of this conductor were delivered free of charge to us by the Nexans company for this purpose. TEST STATION UPGRADE The CétacéS test station is dedicated to critical current measurement under high field. Samples of superconducting wires can be tested up to 3000 A in a magnetic field up to 16 T. A thermal regulation allowing measurements between 1.8 and 4.2 K has already been developed. Tested samples are usually Nb3Sn wires used in VAMAS samples. A new sample holder has been developed allowing critical current measurement in the 5 K to 60 K range. This special insert is based on a helium gas thermal regulation. Special attention has been paid to limit the thermal gradient in the sample area. The sample temperature is regulated by the mean of two independent systems. The first is a phase separator used to eliminate the liquid helium and adjust roughly the temperature of the gaseous helium. The helium gas is then injected in the sample holder of the test station where it flows trough a heat exchanger for fine temperature adjustment. To limit the thermal losses in the sample area the 500 A current feed trough are made of superconducting ribbons. Extensive simulations have been required to make a satisfactory design and limit the thermal gradient around the sample. The design study and orders of these equipments have been made in 2005 and will be delivered in 2006. They will be assembled and instrumented in may 2006 and tested in june 2006. TEST SAMPLE DEVELOPMENT In parallel to the development of the test station, new types of samples have been designed. A VAMAS like sample holder will be used to measure the critical current of the HTc ribbons. In order to study the influence of residual stresses in the superconducting material these VAMAS like sample holder will be realised in different materials: titanium alloy, aluminium alloy, stainless steel, glass fibre epoxy composite and natural ceramic. A natural ceramic has been selected, called STUMATITE, and preliminary tests took place in order to check that it can be used in a wind and react process. The tests were positive and the ceramic withstand the heat treatment in pure oxygen and does not affect the superconducting material. A second type of sample has been developed to increase the magnetic field. It is a small double pancake having the same external diameter as the VAMAS. It may produce around 0.25 T and will need to use react and wind technique using ceramic mandrels.

- 160 - EFDA Technology / Magnet Structure
CONCLUSIONS
The main technological developments associated with the task have started and are progressing well. Scientific activities and measurements will start in 2006.
TASK LEADER
Jean-Michel REY DSM/DAPNIA/SACM/LEAS CEA-Saclay F-91191 Gif-sur-Yvette Cedex Tel. : 33 1 69 08 66 85 Fax : 33 1 69 08 69 29 e-mail : [email protected] In collaboration with DRFCM departments.

- 161 - EFDA Technology / Tritium Breeding and Materials / Breeding Blanket / HCPB blanket
TW2-TTBB-002b-D01
Task Title: BLANKET MANUFACTURING TECHNIQUES FIRST WALL HIPING WITH OPEN CHANNELS
INTRODUCTION
One of the manufacturing options for the first wall of the Test Blanket Modules is the joining of rectangular tubes and smooth plates by Hot Isostatic Pressing (figure 1). One interesting advantage of this option is that the tubes and the plates can, in principle, be bent before HIP. The subject of this study concerns the achievement of close dimensional tolerances and high joint properties. This must be demonstrated thanks to the fabrication of a U shape HCPB-like Eurofer mock-up.
Figure 1: Scheme of the rectangular tube process for first wall fabrication
2005 ACTIVITIES
The bending process for square tubes has been assessed in 2003. A set of dummy mock-ups was manufactured with bent tubes. Their dimensional accuracy was too low and it was decided to manufacture the final mock-up using laser welded channels. MANUFACTURING OF CHANNELS In 2004, rectangular straight tubes and bends were machined and laser welded. figure 2 shows that pores are present in the welds. It was verified that these pores do not get connected on HIPing in such a way that the channels leaks. On the opposite, the pores tend to disappear during the HIP cycle (figure 3).
Figure 2: Cross section of a laser weld showing porosity
Figure 3: Inner surface of a welded tube after HIP, showing evidence of pore collapse (craters)
Then, channels were achieved by butt welding 15 straight tubes and 10 bents (figure 4) using a specific clamping tool. After welding, the dimensional accuracy of the channels was not very good. Alignment defects such high as 0.8 mm were observed. Next, all channels were machined in order to remove the surface oxidation and to reduce the thickness to 3 mm. Care was put on keeping the concentricity of the channels during machining, doing so the alignment defects were not reduced (figure 5).
Figure 4: Set of straight tubes and bents before and after butt welding
Plasma side cover sheet
Breeder side cover sheet
Stack of rectangular tubes

- 162 - EFDA Technology / Tritium Breeding and Materials / Breeding Blanket / HCPB blanket
Figure 5: Stack of 5 channels after machining, showing alignment defects
MANUFACTURING OF THE MOCK UP Pieces of 5 mm thick Eurofer plates were cut by sawing and soft annealed (950°C, 1 h, controlled cooling at 10°C/h to 600°C) in order to facilitate bending. Both surfaces were then machined to get a surface prone to diffusion welding, the final thickness was 4 mm. Bending trials were made with carbon steel plates (soft annealed Eurofer and carbon steel have rather close mechanical properties), with the objective to achieve dimensions as close as possible to those of the channels stack. Then the Eurofer plates were bent to dimensions and machined. Figure 6 shows the stack. The channels and the cover plates were strongly clamped in order to TIG weld the periphery of the mock-up. After TIG welding the stack was helium leak tested. Many leaks were found, and the mock-up was disassembled. All leaks were located in the butt welds, as shown on figure 7. All cracks were sealed by TIG welding and the stack was assembled again using a new pair of cover plates. Again, one channel presented a leak, which indicates that cracking probably arises from clamping. The defectuous tube was removed, repaired and the stack was TIG welded once again. Despite leak testing indicated that the tightness of the stack was not yet perfect, the mock-up was HIPed. The HIP cycle involved heating and pressurising in 3 h at 1100°C, 1200 bar followed by a 3 h step and fast cooling. As could be expected HIP was unable to diffusion weld the parts, as evidenced by the non- flattened outgassing tube (figure 8).
Figure 6: Stack of channels and bent cover plates before HIP
Figure 7: Evidence of cracking in butt welds
Figure 8: Mock-up after HIP REFERENCES
Upon EFDA’s request, a short reference sample using available extra straight tubes was manufactured (figure 9). The HIP parameters were 1100°C, 1200 bar, 2 h, fast cooling. Despite pores in the welds, the HIP was successful. A post HIP heat treatment was applied to the sample (austenitisation under argon at 980°C, 2 h to restore a fine grain size, gas quenching and tempering at 750°C for 2 h). Metallographic examination revealed that the laser weld

- 163 - EFDA Technology / Tritium Breeding and Materials / Breeding Blanket / HCPB blanket
microstructure got fully recovered by the HIP and the post treatments. The joints were decorated by some inclusions, probably due to a slight oxidation of the surfaces during TIG seal welding. Accordingly, the impact toughness of the joints is less than that of the base material (5.3±0.9J versus 9 to 9.5 J), (see figure 10).
Figure 9: Reference sample before and after HIP
Figure 10: Joint impact toughness: load displacement curves (3x4x27mm, 1mm notch specimens)
CONCLUSIONS
During this work, the feasibility of the manufacturing of blanket first wall using rectangular tubes was assessed. In a first step, a route consisting in bending tubes was tried. It appeared that it is not possible to recover the bending deformation upon HIP. Then, an alternative route was studied which consists in building the channels by welding pieces. The laser welding process was used though it was never tried before on Eurofer. Straight parts and bents were welded successfully. The quality of the welds was sufficient for HIP: a short straight mock-up was manufactured successfully. On the opposite, butt welds were very brittle and their tightness could not be maintained during the fabrication of a U-shape mock-up. The manufacturing of this mock-up aborted after two tentative repairs. Since the bending route is not satisfactory, the limiting factor as regards the development of the rectangular tube process is the manufacturing of the tubes. Laser welding appeared to be the best solution, but more work is required to develop this process which is not yet mature enough for this application. The joint quality and the dimensional
accuracy of the welded channels must be significantly improved. REPORTS AND PUBLICATIONS
E Rigal et al., “First wall HIPing with open channels, EFDA task TW2-TTBB-002b-deliverable 1” final report, Rapport technique DTH/DL/2006/20, in printing. TASK LEADER
Emmanuel RIGAL DRT/DTH/LTH CEA-Grenoble 17, rue des martyrs F-38054 Grenoble Cedex 9 Tel. : 33 4 38 78 97 22 Fax : 33 4 38 78 54 79 e-mail : [email protected]

- 164 - EFDA Technology / Tritium Breeding and Materials / Breeding Blanket / HCPB blanket

- 165 - EFDA Technology / Tritium Breeding and Materials / Breeding Blanket / HCPB blanket
TW5-TTBB-006-D04
Task Title: HCPB BREEDER AND NEUTRON MULTIPLIER MATERIALS PROCUREMENT AND CHARACTERIZATION OF Li2TiO3
PEBBLES WITH IMPROVED GEOMETRICAL CHARACTERISTICS
INTRODUCTION
Li 2TiO3 pebbles are developed at CEA as candidate ceramic breeder option for the Helium-Cooled-Pebble-Bed (HCPB) blanket investigated in Europe. The extrusion-spheronisation-sintering process was selected in 1996 in order to produce Li2TiO3 pebbles fulfilling the HCPB blanket requirements, and was developed with the collaboration of the industrial firm Céramiques Techniques et Industrielles (CTI). The CEA activity in 2005 concerns essentially the production and the characterization of Li2TiO3 pebbles with improved geometrical characteristics. Although there is no experimental evidence that perfect sphericity of the pebbles constituting the pebble bed is a must, the shape of Li2TiO3 pebbles could be still improved. An optimization of the process parameters is required to achieve only spherical pebbles. 2005 ACTIVITIES
PRODUCTION OF A NEW BATCH OF Li2TiO3 PEBBLES A batch of one kilogram of pebbles with the size distribution in the range 0.6 to 0.8 mm was produced in 2004. The characteristics of Li2TiO3 pebbles are in agreement with the specifications, but their shape should be still improved. The shape is not exactly spherical and one can observe some granules and some fractured pebbles. An optimization of the process parameters is still necessary to achieve a better sphericity of the pebbles. For this, a sufficient batch of Li2TiO3 powder was produced by CTI in order to prepare the new fabrication of Li2TiO3 green pebbles. A specific surface area of 4 m2/g was measured on the Li2TiO3 powder. This value is in agreement with the specification for the Li2TiO3 powder defined in 2002. A revision of the formulation of the extrusion paste such as the nature and the proportion of Li2TiO3 powder/binder/plasticizer/water has been made. Several trials were performed in order to obtain a suitable formulation of the paste for extrusion. The amount of binder/plasticizer is twice higher than the current extrusion paste. A first batch of Li2TiO3 green pebbles was produced in june 2005 by the extrusion-spheronisation process at CTI. Two others batches were produced in september 2005 in order to reproduce the first batch and in order to confirm the reproducibility of the optimized parameters. The same
extrusion machine and cutting system as for the preparation of the current pebbles were used for theses trials. The Li2TiO3 green pebbles were sintered and characterized at CEA. The sintering heat treatment was performed at 1100°C under air. CHARACTERIZATION OF SINTERED Li2TiO3
PEBBLES The size, the shape and the microstructure of the Li2TiO3 pebbles were observed using optical microscopy and scanning electron microscopy. Relevant characteristics, i.e., pebble bed density, grain size and average crush load of the three batches are reported in table 1. Bed densities in the range 1.85 g/cm3 to 1.93 g/cm3 were measured on Li2TiO3 pebbles. These values of pebbles bed density are in agreement with the specification for the Li2TiO3 pebbles (recall of target > 1.8 g/cm3). The overall characteristics of pebbles are satisfactory. As shown in figure 1, the shape is close to spherical, and the pebble size distribution is 0.6 to 0.8 mm. This picture confirms that the geometrical characteristics of Li2TiO3 pebbles can be improved by adjusting the formulation of the extrusion paste. Table 1: Characteristics of the Li2TiO3 pebbles produced in
2005
Figure 1: Optical micrograph showing the shape and size of Li2TiO3 pebbles produced in 2005
Reference of batch
Pebble size
(mm)
Closed porosity
(%)
Bed density
(g/cm3)
Grain size (µm)
Average crush load
(N)
CTI 1445 0.6 - 0.8 4.6 1.93 1 - 3 31
[21 - 43]
CTI 1445 - 1
0.6 - 0.8 6.2 1.86 1 - 3 30
[21 - 37]
CTI 1445 - 2
0.6 - 0.8 6.3 1.85 1 - 3 27
[20 - 33]

- 166 - EFDA Technology / Tritium Breeding and Materials / Breeding Blanket / HCPB blanket
It will be difficult to obtain better sphericicity of pebbles using the extrusion-spheronisation-sintering process, because at this stage, the process is finalised at the semi-industrial scale for the production of Li2TiO3 pebbles. It remains to be seen if the perfect sphericity of the pebbles constituting the pebble bed is of interest for our application. CONCLUSIONS
The CEA activity in 2005 regarding procurement and quality control of Li2TiO3 pebbles was achieved successfully and in accordance with the foreseen time schedule. The main results are: - Several batches of pebbles with the size distribution in
the range 0.6 to 0.8 mm were produced in 2005. The characteristics of Li2TiO3 pebbles are in agreement with the specifications.
- The feasibility to produce Li2TiO3 pebbles with
improved geometrical characteristics was shown in this study. Therefore process parameters had to be adjusted: a revision of the formulation of the extrusion paste has been made.
The current facility at CTI allows the production of 150 kg/year of Li2TiO3 pebbles which is sufficient for the present needs. The process can be easily extrapolated to industrial scale as it makes use of conventional techniques of the ceramic industry. Owing to its great flexibility, the process is very suitable to tailor the pebbles properties and the pebble beds behaviour, as the functional tests have shown in the European blanket program. In conclusion, the overall results indicate both excellent prospects for the fabrication of Li2TiO3 pebbles and the attractiveness of their properties. REPORTS AND PUBLICATIONS
J.D. Lulewicz, S. Drolon. Final report on sub-task TW5-TTBB-006-D4: Procurement and characterization of Li 2TiO3 pebbles with improved geometrical characteristics. Internal report CEA/DTEN/DL/2005/048. November 2005. A. Ying, M. Akiba, L.V. Boccaccini, S. Casadio, G. Dell’Orco, M. Enoeda, J.B. Hegeman, R. Knitter, J.D. Lulewicz, J. van der Laan, Z.Y. Wen. Status and perspective of the R&D on Ceramic Breeder Materials for testing in ITER TBMs. Presented at ICFRM-12, Santa Barbara (USA), December 2005. A. J. Magielsen, H. Hegeman, J. G. van der Laan, M. J. M. Peeters, J.D. Lulewicz, and M. P. Stijkel. In-pile behaviour of lithium meta-titanate in EXOTIC-9. Proceedings of CBBI-13, Santa Barbara (USA), December 2005.
TASK LEADER
Jean-Daniel LULEWICZ DRT/LITEN/DTNM/LTMEX CEA-Saclay F-91191 Gif-sur-Yvette Cedex Tel. : 33 1 69 08 48 24 Fax : 33 1 69 08 82 52 e-mail : [email protected]

- 167 - EFDA Technology / Tritium Breeding and Materials / Breeding Blanket / HCLL blanket
TW2-TTBC-001-D01
Task Title: TBM DESIGN, INTEGRATION AND ANALYSIS BLANKET SYSTEM DESIGN AND ANALYSIS - INTEGRATION
AND TESTING IN ITER
INTRODUCTION
In 2002, EU has endorsed the decision to concentrate the work on blanket modules for testing in ITER on a single coolant, Helium. Up to that time, two different coolants were envisaged for the EU Breeding Blankets: i) pressurized water for the Water Cooled Lithium Lead (WCLL) concept and ii) pressurized He for the HCPB concept (Helium-Cooled pebble-Bed). In this frame, the general objective of the Task TW2-TTBC-001-D01 is to develop and optimize (with regard to tritium breeding, heat removal and shielding capability) a Helium Cooled Lithium Lead (HCLL) breeding blanket concept for DEMO and its corresponding Test Blanket Module (TBM) to be tested in ITER. 2005 ACTIVITIES
2005 activities mainly concerned the redaction of the final report of the task [1] and a conceptual design of a Prototypical Mock-Up (PMU) to be tested out of pile in the European Breeding Blanket Testing Facility (EBBTF). PROTOTYPICAL MOCK-UP Basically, the mock-up (figure 1) looks alike the In-TBM [1] scaled to ¼ because the EBBTF facility is able to recover 350 kW which is around a quarter of the power which is deposited on the TBM. It features 3 (toroidal) × 2 (poloidal) radial cells, in which are inserted 6 Breeder Units (BU). As in the TBM, each BU is constituted by 5 Cooling Plates (CP) (figure 2), however, the possibility of reducing their number is not precluded. This could be needed for placing the breeder zone (BZ) heating elements, which will simulate the TBM-In nuclear power.
506
626
506
626 Figure 1: Rear view of the PMU
Figure 2: 3D rear view of the Bus
To be representative in terms of thermal and thermomechanical behaviour, the mock-up segment box will have the same geometry as the TBM one. Moreover, in order to preserve the Reynolds and Nusselt numbers, the FW of the PMU should be cooled by 4 passes channels with the same TBM cross section. While Stiffening plates (SPs) could be full (lower thickness should be however envisaged to simulate their reduced mechanical resistance due to the presence of the channels), the Cooling Plates (CPs) will feature cooling channels in order to evaluate the tritium permeation towards the He. The main geometrical characteristics are presented in the table 1:
Table 1: Main geometrical characteristics of the PMU FW
FW channels number 5 FW channel legs 22
Nb of passes 4 Channel cross section 15 x 14 mm²
FW thickness 25 mm The volumes and masses of the PMU materials are summarized in the table 2:
Table 2: Volume and mass inventories in the PMU
Volume
(m3) Masse (kg)
Steel 0.0614 480 He 0.0385 0.250
PbLi 0.0785 770 Total 0.178 1250

- 168 - EFDA Technology / Tritium Breeding and Materials / Breeding Blanket / HCLL blanket
Table 3: Main thermal results of the PMU
Mass flow (kg s-1) T inlet (°C) T outlet (°C) Heat transfer coefficient (W.m-².K-1) ∆P (bar) FW 0.34 300 402.4 5563 1.9 SP 0.07 402.4 457.9 652 0.009 CP 0.14 402.4 501.5 648 0.009
He flow and PbLi flow are basically the same as in the TBM. He first cools the FW and then, in parallel, a part of He cools the SPs and the CPs. Main results of the thermal-hydraulics analyse of the He circuit are presented in table 3. The liquid metal enters in a BU and exits from the one below, feeding in this way the BU in parallel (by couple). These data permit to evaluate the PbLi mass flow versus number of circulation per day. CONCLUSIONS [1]
This document constitutes the final report on the sub-deliverables 1d, 1e, 1g and 1h of the TW2-TTBC-001-D01 task. The HCLL testing strategy proposed is to test four different test mock-ups or modules in a way that they will provide a progressive qualification of the HCLL blanket line up to an integral demonstration in the final Integral TBM (In-TBM). The different TBM are: - EM-TBM: Electromagnetic TBM (plasma H-H); - NT-TBM: Neutronic TBM (plasma D-D and first
period of the D-T low cycle phase); - TT-TBM: Thermo-mechanic & Tritium Control TBM
(last period of the D-T low cycle and first period of the D-T high duty cycle phase);
- IN-TBM: Integral TBM (last period of the high duty
cycle D-T phase). The In-TBM looks alike a generic HCLL breeder blanket module for DEMO. It features 3 (toroïdal) × 8 (poloidal) radial cells, in which are inserted 24 Breeder Units (BU). An improved liquid metal flow path has been envisaged which allows higher re-circulation rates avoiding excessive LiPb velocities; parallel loops have been chosen rather than a meandering circulation on the whole module height. The liquid metal enters from the external collector and then it is distributed in some intermediate vertical distributing boxes located behind the BU. It enters in a BU and exits from the one below, feeding in this way the BU in parallel (by couple). Assuming 10 re-circulations/day, the PbLi mass flow rate will amount to 0.33 kg/s. With this figure, the liquid metal velocity will be ~6 mm/s in the feeding pipes and in the distribution box, ~0.08 mm/s in the BU current section and will increase to ~2.8 mm/s in the front opening between the SP and the FW. A Pb-Li draining is realized from the TBM bottom, to allow a passive draining.
The volumes and masses of the TBM materials for the whole module have been calculated. Eurofer mass is around 1640 kg and the volume of PbLi is around 0.290 m3. It exceeds, with a frame thickness of 114 mm, by 0.09 m3 the limit calculated on the base of the maximum allowed H release in the VV. The surplus being quite small, it could be assumed as acceptable under the hypothesis that in any case some countermeasures could intervene before that all the TBM will drain. Mechanical attachments of the same type as those used for the ITER outboard shielding modules are foreseen for the connection of the TBM to the frame, consisting of: - A flexible fixation (flexible cartridges) on 4 points to
recover the radial mechanical loads while authorizing the thermal expansion in the poloidal and toroidal directions;
- A gliding shear keys system along a cross-shaped key
way on the external back plate, to lock up the module displacements in poloidal and toroidal directions during the disruption loads, the thermal expansion in these directions being free; it also contributes to bear the weight of the module.
Thermal and mechanical analyses are carried out to design the IN-TBM preserving the relevancy to DEMO. The He cooling circuit is able to recover a heat flux of 0.5 MW/m² and a NWL of 0.78 MW/m². Two He flow schemes have been studied (one with a by pass after the FW). Both schemes cool first the FW and then, in parallel the SPs and the CPs. The total mass flow and the FW channels cross section have been optimized, aiming to minimize the pumping power, without exceeding the FW temperature limit (550°C). The He total mass flow is 1.5 kg.s-1 or 1.3 kg.s-1 according to the presence of a by pass or not. Currently, the design is not chosen, in attempt to the TW5-TTBC-001-D06 results. A transient analysis modelling a pulse of ITER shows that the characteristic time of the module is around 60 s. Finally, based on the IN-TBM results, a prototypical mock-up has been roughly designed. It features 3 (toroïdal) × 2 (poloidal) radial cells, in which are inserted 6 Breeder Units (BU). This mock-up should be tested in the EEBTF. REPORTS AND PUBLICATIONS
[1] A. Li Puma, T. Meynaud, Y Poitevin, G. Rampal,
J.F. Salavy, F. Gabriel., “HCLL TBM for ITER – Engineering design, analyses and test programme & needs”, CEA report SERMA/RT/05-3568/A, 12/2005.

- 169 - EFDA Technology / Tritium Breeding and Materials / Breeding Blanket / HCLL blanket
TASK LEADER
Franck GABRIEL DEN/DM2S/SERMA CEA-Saclay F-91191 Gif-sur-Yvette Cedex Tel. : 33 1 69 08 79 76 Fax : 33 1 69 08 99 35 e-mail : [email protected]

- 170 - EFDA Technology / Tritium Breeding and Materials / Breeding Blanket / HCLL blanket

- 171 - EFDA Technology / Tritium Breeding and Materials / Breeding Blanket / HCLL blanket
TW2-TTBC-002-D01
Task Title: BLANKET MANUFACTURING TECHNOLOGIES FABRICATION PROCESSES FOR HCLL AND HCPB TBMs
INTRODUCTION
The subject of this study is the development of fabrication processes for test blanket modules (TBMs) subcomponents. The TBMs are composed of the following subcomponents: first wall, stiffening plates, caps and breeder units. All these components are cooled with helium thanks to embedded channels. The structural material is a reduced activation ferritic martensitic steel (Eurofer). The complexity of the cooling scheme and the small channel dimensions result in manufacturing difficulties. However several processes are envisaged. The objective of the study is to select and to validate suitable processes. 2005 ACTIVITIES
Potentially applicable processes for the manufacturing of TBM subcomponents have been identified and investigated in 2004. In 2005, this investigation was completed and recommendations were made. TWO STEPS HIP PROCESS Two grooved plates (or one grooved and one plain plate) are first sealed by Hot Isostatic Pressing (HIP) diffusion welding under low pressure. At this stage, grooves (channels) are encapsulated. Then the channels are open by drilling and the component is HIPed at high pressure (figure 1). Results achieved with T91 steel samples showed that the joint impact toughness is very low due to the presence of Si, Al, V and O-rich inclusions at the joints (figure 2). The outgassing procedure was then improved and a significant progress was made: the joint impact toughness was 50% higher than that of the base material thanks to a decrease of the joint inclusion density.
Figure 2: T91 joint achieved with the two steps HIP process (vertical), showing oxide inclusions.
Moving to Eurofer, which contains much less Si than T91, was expected to lead to even better results. This was not the case: joint impact toughness energies were 4.2±0.9 J compared to 9 to 9.5 J for the base material when the middle of the sample was concerned and 2.5±0.2 J when the edge of the sample was concerned. Clearly, there is an effect of the specimen location due to the oxidation of the faying surfaces upon TIG welding of the plates (performed under air). This means, on one hand, that the improvement of the outgassing procedure alone is not sufficient and, on the other hand, that the results are size dependent. TIG welding under a neutral atmosphere is now recommended.
Figure 1: Scheme of the two steps HIP process
Vac. Vac. Vac.
high T, low P
TIG weld
1st step
high P
high T, high P
high P
high P
2nd step
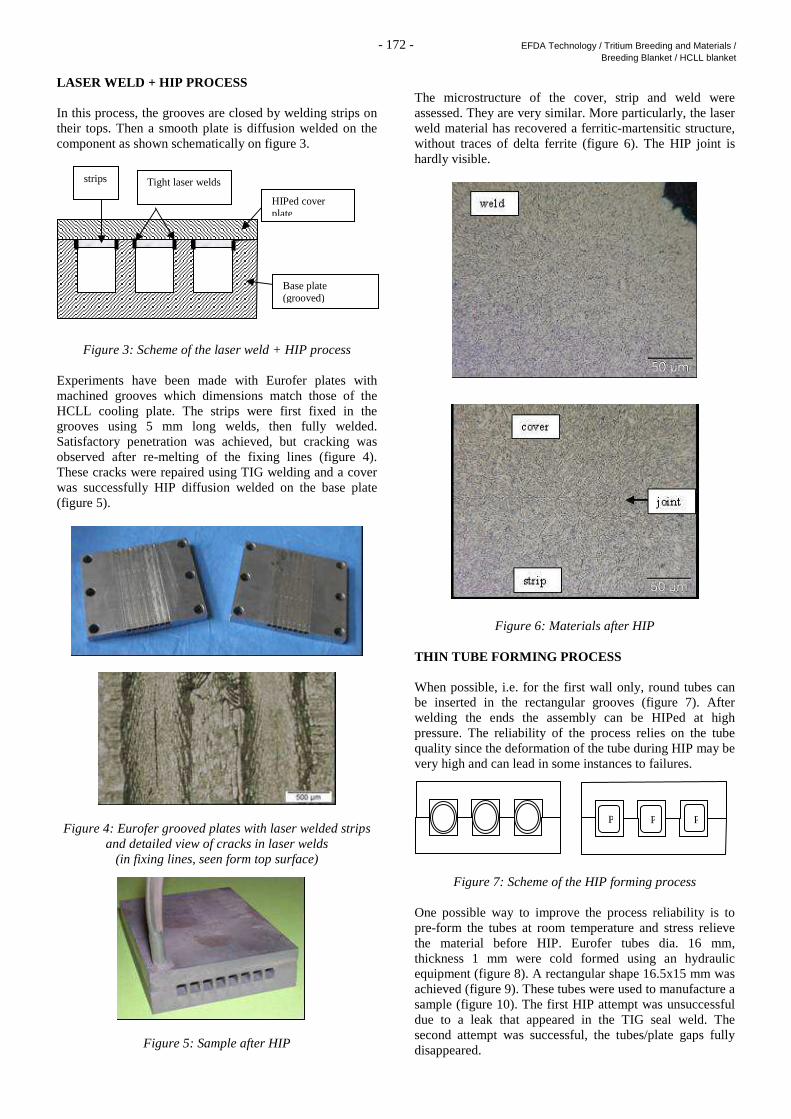
- 172 - EFDA Technology / Tritium Breeding and Materials / Breeding Blanket / HCLL blanket
LASER WELD + HIP PROCESS In this process, the grooves are closed by welding strips on their tops. Then a smooth plate is diffusion welded on the component as shown schematically on figure 3.
Figure 3: Scheme of the laser weld + HIP process Experiments have been made with Eurofer plates with machined grooves which dimensions match those of the HCLL cooling plate. The strips were first fixed in the grooves using 5 mm long welds, then fully welded. Satisfactory penetration was achieved, but cracking was observed after re-melting of the fixing lines (figure 4). These cracks were repaired using TIG welding and a cover was successfully HIP diffusion welded on the base plate (figure 5).
Figure 4: Eurofer grooved plates with laser welded strips
and detailed view of cracks in laser welds (in fixing lines, seen form top surface)
Figure 5: Sample after HIP
The microstructure of the cover, strip and weld were assessed. They are very similar. More particularly, the laser weld material has recovered a ferritic-martensitic structure, without traces of delta ferrite (figure 6). The HIP joint is hardly visible.
Figure 6: Materials after HIP THIN TUBE FORMING PROCESS When possible, i.e. for the first wall only, round tubes can be inserted in the rectangular grooves (figure 7). After welding the ends the assembly can be HIPed at high pressure. The reliability of the process relies on the tube quality since the deformation of the tube during HIP may be very high and can lead in some instances to failures.
Figure 7: Scheme of the HIP forming process One possible way to improve the process reliability is to pre-form the tubes at room temperature and stress relieve the material before HIP. Eurofer tubes dia. 16 mm, thickness 1 mm were cold formed using an hydraulic equipment (figure 8). A rectangular shape 16.5x15 mm was achieved (figure 9). These tubes were used to manufacture a sample (figure 10). The first HIP attempt was unsuccessful due to a leak that appeared in the TIG seal weld. The second attempt was successful, the tubes/plate gaps fully disappeared.
strips
Base plate (grooved)
Tight laser welds
HIPed cover plate
P P P P P

- 173 - EFDA Technology / Tritium Breeding and Materials / Breeding Blanket / HCLL blanket
Figure 8: Cold formed Eurofer tubes
Figure 9: Cross section of cold formed Eurofer tubes
Figure 10: Grooved plates and cold formed tubes before and after HIP
Table 1: Recommendations for the choice of fabrication processes
Subcomponent Preferred process Issues to be assessed Back up solution
HCLL FW bending + HIP
Cold forming + HIP Definition of tube dimensions. Forming of bends.
Laser weld + HIP
HCPB FW bending + HIP
Cold forming + HIP Same as above + feasibility of “very” rectangular channels
Laser weld + HIP
HCPB FW HIP + bending
Rectangular tube Bending of large structures, acceptability of cross section reduction in the bends.
Two steps HIP
Caps Two steps HIP Joint properties to be improved. Laser weld + HIP
Stiffeners Laser weld + HIP Reliability improvement. Feasibility of curved channels.
Two steps HIP
HCLL cooling plates Laser weld + HIP Reliability improvement. Feasibility of curved channels.
None
CONCLUSIONS
The work done in this study leads to the following conclusions: - Several processes emerge as promising routes for the
fabrication of TBM subcomponents. - The most difficult subcomponent to manufacture is
the HCLL cooling plate. - The improved two-steps HIP process is applicable to
the HCPB FW (HIP + bending) and caps. Its application to the HCLL FW (bending + HIP), the SP and the HCLL CP is problematic. This process leads
for the moment to unsatisfactory results in terms of joint impact toughness, but there is reasonable hope that better results are achievable.
- The laser weld + HIP process is the most versatile but
the less mature process. Its applicability to the HCLL CP has been partly demonstrated (straight channels were used). Further development is necessary (application to curved channels).
- The HIP forming process is very interesting for the
HCLL FW. It requires further development in its cold forming + HIP version. In particular, the optimum tube dimensions regarding a given FW channel section must be determined and the issues linked to cold forming of bent tubes must be assessed.
-10
-8
-6
-4
-2
0
2
4
6
8
10
-10 -5 0 5 10

- 174 - EFDA Technology / Tritium Breeding and Materials / Breeding Blanket / HCLL blanket
Apart from the processes investigated within this study, a process involving the stacking of rectangular thick tubes is under assessment in the frame of subtask TW2-TTBB-002-D01. This ‘rectangular tube’ process is potentially applicable to both HCLL and HCPB first walls. Recommendations are summarized in table 1. REPORTS AND PUBLICATIONS
E Rigal et al., “Fabrication processes for HCLL and HCPB TBMs; EFDA task TW2-TTBC-002-deliverable 1” final report, Rapport technique DTEN/DL/2005/041, 27/10/2005 TASK LEADER
Emmanuel RIGAL DRT/DTH/LTH CEA-Grenoble 17, rue des Martyrs F-38054 Grenoble Cedex 9 Tel. : 33 4 38 78 97 22 Fax : 33 4 38 78 54 79 e-mail : [email protected]

- 175 - EFDA Technology / Tritium Breeding and Materials / Breeding Blanket / HCLL blanket
TW2-TTBC-002-D02
Task Title: BLANKET MANUFACTURING TECHNOLOGIES MANUFACTURING AND TESTING OF MOCK-UPS
QUALIFICATION SAMPLES FOR HCLL AND HCPB TBMs
INTRODUCTION
This task deals with joining technology development, fabrication and testing of mock-ups to qualify manufacturing technologies for TBM assembly. The demonstration of the integration of manufacturing technologies will be assessed through the fabrication of a TBM demonstrator. Examination and characterization of the demonstrator to validate manufacturing sequence of a prototypical mock-up. NDE procedure will be defined to be applied during and after manufacturing of a prototypical mock-up (6 cells mock-up). This task is the first stage of TBM prototypical mock-up manufacturing for HCLL. This task has been revised in august 2005 in accordance with EFDA, and launched in september 2005. 2005 ACTIVITIES
OBJECTIVES For TBM manufacturing, three stages must be developed: - Stiffening joining - Stiffening / First Wall joining - Stiffening and First Wall / Cap joining Stiffening grid Stiffening grid + first wall (Stiffening grid,first wall) + caps
Figure 1: TBM module(HCLL concept) Up to date, the definition of the final mock-up is shown in figure 2 below: 6 cells (stiffening grid with channels) 3 horizontal slabs withcontinuous welds to FW Lateral slabs: 25 mm (no batch 40 mm in Eurofer)
Figure 2 TRANSVERSE WORK IN THE TASK - Development route for all joining configurations has
been established in close relation with TW5-TTMS- 004 tasks, which support the manufacturing development of the TBM.
CLAMPING DEVICE SETTINGS Several mock-ups will prepare the final one. Distortion mastering, due to welding effect, will drive the complex clamping devices for each development step. Clamping principles have been established: modular, flexible and scalable systems are in designing stage. Welding tool trajectories have been overviewed to analyse possible interactions with the virtual design. This will specify geometrical requirements for the welding tools. STIFFENING GRID Eurofer batch plates machining has been launched. In HCLL design, plate thickness is fixed to 8 mm, and 10 mm for HCPB. Welding development strategy is the same for both concepts, small adjustments must be performed. For performing these joints, two main welding processes are foreseen: TIG and continuous Nd YAG Laser welding. Due to limitation in welding penetration depth to procure sound welds, a limitation of 5.5 mm has been fixed. This requires welds from each side of plates to achieve 8 and 10 mm thickness. YAG laser welding trials have started to define parametric process window. Cross sections (figure 3) illustrate welds aspects. External aspect of welds are quite good. Few pores are observed and no troubles in the overlapping of the two welds have been detected (figure 3). First analysis show clearly the necessity of a seam tracking system to maintain the welding centreline to the joint. Distortions seem to be acceptable. X rays and standard NDT examinations have been performed.

- 176 - EFDA Technology / Tritium Breeding and Materials / Breeding Blanket / HCLL blanket
Figure 3: Welds cross section
Figure 4: Welds longitudinal section With these NDT testing, no defects have been detected. However, fine analysis of 10 joints welded in same conditions shows hot cracking apparition on one sample (starting phase in the first 50 mm of the joint), as shown in figure 4, below.
Figure 4: Hot cracking in fusion zone This phenomenom has been predicted in a 2005 CEA report, written by G. de Dinechin and Ph. Aubert for a review status on low activation martensitic steels welding, in the TTMS-004 field. Process developments are running out to solve this problem. In parallel, code analysis is launched to determine key actions to be performed for a future certification of welding process involved in TBM manufacturing, especially in NDT processing, and control field.
Welding tool development In parallel to metallurgical weldability, process development is running out, such laser tool dedicated to cell stiffening welding. Standard optics cannot be used, and adaptation of specific laser welding tool, developed further by CEA, must be realized, as shown in figure 5:
Figure 5: Adaptation of specific laser welding tool : design stage is in progress.
STIFFENING GRID/FIRST WALL/CAPS JOINING 3 processes are evaluated: EB, NGTIG, NG Laser hybrid for 40 mm Eurofer thickness welding. Preparation level is running. This work will be performed in 2006.
05P017-5
Standard laser Optics
Specific TBM tool

- 177 - EFDA Technology / Tritium Breeding and Materials / Breeding Blanket / HCLL blanket
CONCLUSIONS
This task has been launched in september 2005 after a new definition of the objectives, in accordance with EFDA. First laser welding results in real joint configuration show a laser hot cracking sensitivity in partial penetration depth, observed on other welding processes, such as TIG and Electron Beam, but not in full penetration depth. So the first 2006 trimester will be dedicated to solve this problem. Several potential solutions let think positive technical possibilities. REPORTS AND PUBLICATIONS
Intermediate report is expected for july 2006.
TASK LEADER
Philippe AUBERT DRT/DTH CEA-Saclay F-91191 Gif-sur-Yvette Cedex Tel. : 33 1 69 08 17 67 Mobile : 33 6 08 53 36 41 Fax : 33 1 69 08 90 23 e-mail : [email protected]:

- 178 - EFDA Technology / Tritium Breeding and Materials / Breeding Blanket / HCLL blanket

- 179 - EFDA Technology / Tritium Breeding and Materials / Breeding Blanket / HCLL blanket
TW2-TTBC-002-D03
Task Title: TESTING OF SMALL-SCALE MOCK-UPS TO QUA LIFY MANUFACTURING TECHNOLOGIES
INTRODUCTION
The aim of this study is to validate the manufacturing process of HCLL blanket mock-up by means of thermomechanical tests in representative operating conditions of the breeder blanket module.
Figure 1: Composition of HCLL module – DIADEMO CP Mock-up
This manufacturing validation program will begin by the manufacturing process of the Cooling Plates (CP). For that a mock-up is manufactured in the task TW2-TTBC-002-D01. This mock-up manufacturing is relevant of the CP manufacturing, but its geometry is simplified (figure.1): - 8 straight channels of 4x4.5 mm² with 360 mm length, - 1 U turn in a distribution box, - the width the 2x 8 channels is 94.5 mm, - The cooling plate, the He feeding and collector are
made of EUROFER.
The principal program steps are: - Design of the He cooling loop of DIADEMO, - Design of the PbLi test section - Manufacturing, - Thermomechanical tests, - Endurance tests,
2005 ACTIVITIES
After the design of the helium loop during 2003, the manufacturing has been launched and it was completed at the beginning of 2005. In the same time, the conceptual design of the PbLi test section has been carried out and the manufacturing launched by mid 2005. RECALL OF DESIGN DATA: The conceptual design of the PbLi test section is based on the following specifications: - Object tested: 1 Cooling Plate of typical TBM
dimensions and operating conditions. - CP orientation: horizontal. - PbLi container: in order to limit the PbLi inventory in
the test section, it is accepted to use a rectangular steel container. The upper and lower plates of this container shall be at a distance of the CP of the same order of magnitude of the pitch between two cooling plates.
- Possibility to test several cooling plates: Even if only CP is tested here, it is recommended to design an external vessel compatible with the test of at least a group of 3 CPs separated by the reference pitch.
- Heat loading: A relevant power deposition on the CP (via PbLi by conduction) is expected.
- Instrumentation: thermocouples shall be instrumented on the plate external surface to follow the temperature evolution along tests; Tin/out He and Q He shall be measured.
- CP fixing: the CP shall be fixed on the container box in the same way as in the TBM.
PbLi TEST SECTION The PbLi test section is mainly composed by 2 pressure vessels (figure 2): - The PbLi storage vessel, - The test section vessel, where the cooling plate is
located. During the test, the CP is immerged in the liquid PbLi at 550°C and cooled by an internal He flow up to 500°C under 7 Mpa. To limit the PbLi inventory in the test section, a rectangular steel container is put in the test section. The level of PbLi is controlled by means of differential pressure regulation between storage and test section. The fixation of CP has been designed in the same way than
HCLL
Module
Stiffening Plates
Breeder
Unit
Cooling Plate
DIADEMO CP Mock up
First wall

- 180 - EFDA Technology / Tritium Breeding and Materials / Breeding Blanket / HCLL blanket
TBM fixations. A relevant power deposition on the CP is made by means of electrical heaters how it is shown in figure 3.
Figure 2: PbLi test section.
Figure 3: Illustration of the CP heaters
CONCLUSIONS
After this manufacturing phase, the test section is now available. Taking in account a CP mock-up delivery in april.2006 (TW2-TTBC-002-D01), the experimental program will begin in september 2006 up to the end of 2006. TASK LEADER
Lionel CACHON DEN/DTN/STPA/LTCG CEA-Cadarache F-13108 Saint-Paul-lez-Durance Cedex Tel. : 33 4 42 25 74 25 Fax : 33 4 42 25 66 38 e-mail : [email protected]
Test section
He loop connexion 1 CP
CP heaters
PbLi rectangular box
PbLi storage
Test section vessel
PbLi storage
He Circulator

- 181 - EFDA Technology / Tritium Breeding and Materials / Breeding Blanket / HCLL blanket
TW2-TTBC-003-D05
Task Title: BLANKET MANUFACTURING TECHNOLOGIES COATING QUALIFICATION
INTRODUCTION
For some applications in fusion reactors, parts of Eurofer97 steel should be protected by anti-corrosion coatings. On one hand the coating material has to meet the selection criteria for materials used in radioactive environments. On the other hand the coating has to satisfy high quality standards concerning density and adhesion on the substrate surface. During the present study, several materials and coating technologies have been investigated, to find an appropriate coating solution. 2005 ACTIVITIES
LIQUID METAL CORROSION The TBM are made of Eurofer97 steel and will be exposed to liquid Pb-Li metal in the breeding environment of the reactor. Liquid Pb-Li metal is assumed to be corrosive to Eurofer97-steel, basically in terms of embrittlement. Especially for temperature ranges above 450°C the corrosive behaviour seams to increase. As the operating temperature of Pb-Li liquid metal in a fusion reactor can easily reach 500°C and more, steel corrosion issue will be met. COATING TECHNOLOGIES The coating material should be introduced in form of powder, which will be thrown on the substrate surface by means of heat and gas flow. Different spraying technologies, like Atmospheric Plasma Spraying (APS), Laser cladding/Laser alloying, Laser Assisted Atmospheric Plasma Spraying and High Velocity Oxygen Fuel spraying have been considered to find a process which is compatible for realizing tungsten coatings in the required quality range. Atmospheric Plasma Spraying (APS) During the APS process, metal powder is fed into a plasma jet, which is directed to the substrate surface. One main advantage of the APS process is the high temperature of the plasma jet (up to ~30000°C), which allows to melt even refractory material like ceramics or metallic tungsten. Another advantage is its high powder feed rate which can reach 2 kg/h. This results in high process speed of 20 m/min or even up to 30-60 m/min for certain applications. In spite of the high plasma temperature the substrate surface remains relatively at low temperatures, below 200°C. This enhances rapid solidification of the coated surface, resulting in residual porosity. The latter can be desired to obtain low thermal conductivity, in thermal barriers, e.g., but is absolutely intolerable in terms of corrosion protection.
Surface pre-treating of the substrate is required to obtain good adhesion of the coating
Figure 1: AlSi30 coating deposited using the APS process Figure 1 shows an APS-coating. This coating exhibits high density as well as high homogeneity, but its bonding to the substrate surface is mainly of mechanical nature. However, in the specific environment of fusion reactors maximum adhesion is required. Therefore metallurgical bonding is preferable to mechanical bonding. Laser cladding / Laser alloying Laser cladding and Laser alloying do not require surface treatment before their application. The incident laser beam penetrates deeper into the substrate as the plasma jet. Therefore it is able to melt a larger amount of substrate material than APS, which is known to avoid fusion of the substrate. Laser cladding (laser alloying respectively) has some advantages compared to the plasma spraying process, which mainly consists in higher density of the coating, high precision coatings and metallurgical bonding to the surface. Main drawbacks are its low process speed (0.5 m/min for laser cladding, up to 2.2 m/min for laser alloying), as well as required post-treatment in order to obtain homogeneous coating structures. Laser Assisted Atmospheric Plasma Spraying (LAAPS) To combine the advantages of the APS and Laser cladding processes, a laser-plasma-hybrid-spraying technology, the so-called Laser Assisted Atmospheric Plasma Spraying (LAAPS) has been developed by Fraunhofer IWS (located at Dresden, Germany). In fact this technology combines a high power laser head with a customized plasma spray nozzle in one coating device.

- 182 - EFDA Technology / Tritium Breeding and Materials / Breeding Blanket / HCLL blanket
There are three different options of treating substrate surfaces with LAAPS, depending on the application. The incident laser beam can either directly interact with the plasma jet on the substrate, or it can serve to pre – or post treat the surface ahead or after the plasma jet. If the plasma jet follows the laser beam, the latter can be used to melt the substrate surface before the droplets of coating material impinge in the molten pool of substrate material. A laser beam following the plasma jet is used to post treat the coating directly after its deposition. No further preparation of the substrate surface is necessary using the LAAPS process. Due to the strong interaction of the incident laser beam with the substrate a metallurgical bonding forms between the coating and the surface, which is one of the main advantages of LAAPS. Another advantage compared to APS is the higher density of coatings deposited by LAAPS (see figure 2). In comparison to figure 1, one can observe a far less number of pores in the coating represented in figure 2, taking into account the different scales of the two micrographs. In contrast to the coating represented in figure 1, there are no porosities visible at the direct interface between the coating and the substrate.
Figure 2: AlSi30 coating deposited by the LAAPS process. Nevertheless, for applying LAAPS, the spray parameters have to be carefully chosen to obtain good coating quality and good adhesion. Excessive laser power can result in high coating porosity, and power shortage results in low bond strength. As spraying of pure tungsten has never been done by LAAPS before, Fraunhofer IWS will investigate the required spray parameters from december 2005. The different coefficients of thermal expansion as well as the difference in terms of fusion points of Eurofer steel and pure tungsten could become restrictive for the realization of the coating. In this case, it might be helpful to consider the application of an intermediate bond coat.
This coat could either consists of a mixture of Eurofer and tungsten powders or another material, which is commonly used for thermal spraying, as WC-Co, e.g. As long as there is a dense structure of pure tungsten on the upper surface of the coating, the amount of Co in the bond coat is less important. Though, if the application of a bond coat is necessary, it will be difficult to meet the required thickness of the coating that is 100 µm. HIGH VELOCITY OXYGEN FUEL SPRAYING (HVOF) The principle of the HVOF process is different from the principle of other spraying technologies. During this process some combustible (kerosene, acetylene, propylene or hydrogen e.g.) is introduced together with oxygen in a combustion chamber. There it burns under high pressure and it is forced through a narrow spray nozzle which enhances further acceleration of the high-pressure flame. Compared to the plasma-temperature reached during APS, the flame temperature of HVOF is rather low (2300-3000°C), which can actually be a limitation for the use of ceramics. Especially in terms of density, coatings proceeded by HVOF easily outreach coatings proceeded by APS. Figure 3 represents SEM micrographs of such coatings. The surface roughness of the HVOF coating in figure 3 is obviously smoother than the one of the plasma sprayed coating. Furthermore, the plasma sprayed coating shows more pores and larger structures as the HVOF coating. The measured values for surface roughness and porosity coincide with the result visible on the micrographs. In fact, porosity produced by HVOF seems to be of a different nature than porosity due to Plasma spraying. As during HVOF the particles hit the substrate with large kinetic energy, upon impact they are deformed into flat splats. This causes a lamellar structure of the coating.
Figure 3: SEM images of polished (a and b) and fractured
(c and d) cross-sections of HVOF deposited and plasma sprayed alumina coatings.
The scale bars represent 45 µm and 1 µm.

- 183 - EFDA Technology / Tritium Breeding and Materials / Breeding Blanket / HCLL blanket
CONCLUSIONS
Taking into account the characteristics of all thermal spraying technologies (APS, Laser cladding, LAAPS, HVOF), LAAPS seems to be the most promising process to realize anti-corrosion tungsten coatings within the quality specifications. Coatings produced using the LAAPS technology exhibit the best adhesion on the surface, as the coating is metallurgically bonded to the substrate. Besides pure laser cladding, no other thermal spraying technology offers this advantage. Furthermore, LAAPS coatings combine the advantage of high coating density with high plasma temperature. The latter might be necessary to heat the tungsten powder above its fusion point. Another coating process, which might be interesting, is HVOF. It is already used for tungsten ceramics, WC-Co in particular. Both coating process trials are yet in progress. Final report is expected for end of april 2006. If, due to specific material characteristics of tungsten and Eurofer steel, a direct coating of the substrate with pure tungsten is not possible, the application of an intermediate bond layer might be considered.
REPORTS AND PUBLICATIONS
Intermediate report: Design of anti–corrosion coatings for the application in the environment of fusion reactors, TASK TW2-TTBC-003-D05 - Philippe Aubert - Technical report DTH/2006/02 – 10 january 2006. TASK LEADER
Philippe AUBERT DRT/DTH CEA-Saclay F-91191 Gif-sur-Yvette Cedex Tel. : 33 1 69 08 17 67 Mobile : 33 6 08 53 36 41 Fax : 33 1 69 08 90 23 e-mail : [email protected]:

- 184 - EFDA Technology / Tritium Breeding and Materials / Breeding Blanket / HCLL blanket
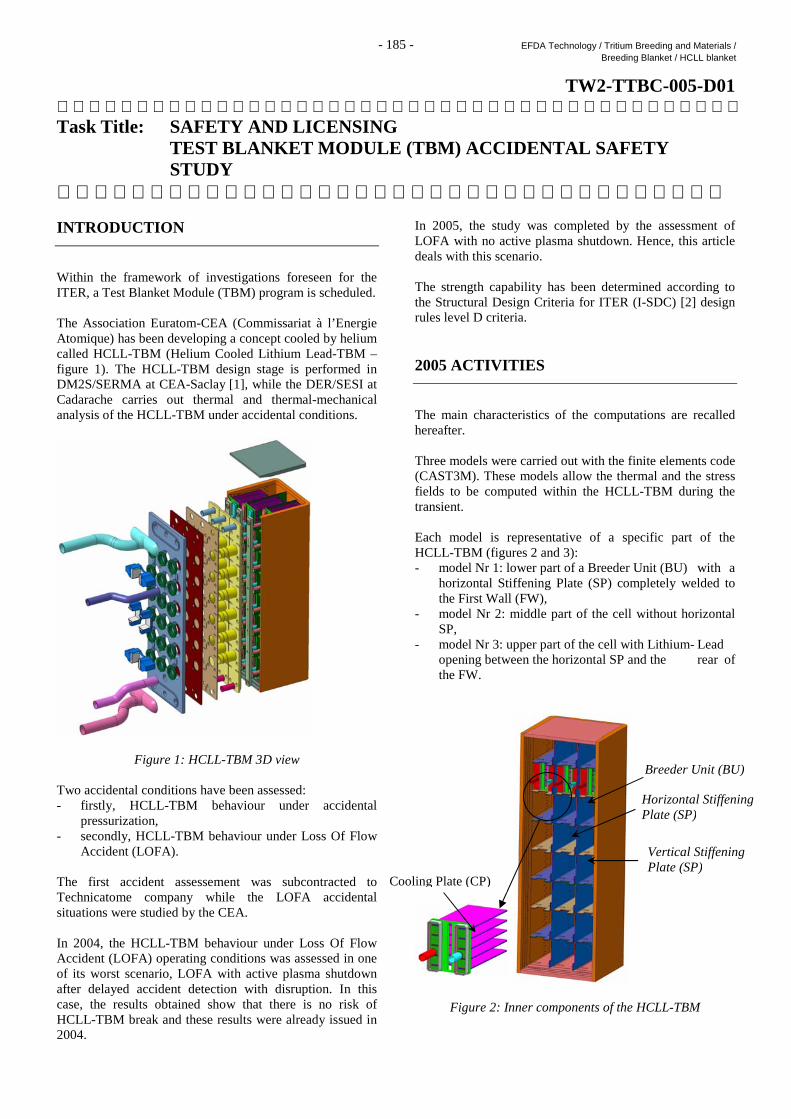
- 185 - EFDA Technology / Tritium Breeding and Materials / Breeding Blanket / HCLL blanket
TW2-TTBC-005-D01 Task Title: SAFETY AND LICENSING TEST BLANKET MODULE (TBM) ACCIDENTAL SAFETY
STUDY INTRODUCTION
Within the framework of investigations foreseen for the ITER, a Test Blanket Module (TBM) program is scheduled. The Association Euratom-CEA (Commissariat à l’Energie Atomique) has been developing a concept cooled by helium called HCLL-TBM (Helium Cooled Lithium Lead-TBM – figure 1). The HCLL-TBM design stage is performed in DM2S/SERMA at CEA-Saclay [1], while the DER/SESI at Cadarache carries out thermal and thermal-mechanical analysis of the HCLL-TBM under accidental conditions.
Figure 1: HCLL-TBM 3D view Two accidental conditions have been assessed: - firstly, HCLL-TBM behaviour under accidental pressurization, - secondly, HCLL-TBM behaviour under Loss Of Flow Accident (LOFA). The first accident assessement was subcontracted to Technicatome company while the LOFA accidental situations were studied by the CEA. In 2004, the HCLL-TBM behaviour under Loss Of Flow Accident (LOFA) operating conditions was assessed in one of its worst scenario, LOFA with active plasma shutdown after delayed accident detection with disruption. In this case, the results obtained show that there is no risk of HCLL-TBM break and these results were already issued in 2004.
In 2005, the study was completed by the assessment of LOFA with no active plasma shutdown. Hence, this article deals with this scenario. The strength capability has been determined according to the Structural Design Criteria for ITER (I-SDC) [2] design rules level D criteria. 2005 ACTIVITIES
The main characteristics of the computations are recalled hereafter. Three models were carried out with the finite elements code (CAST3M). These models allow the thermal and the stress fields to be computed within the HCLL-TBM during the transient. Each model is representative of a specific part of the HCLL-TBM (figures 2 and 3): - model Nr 1: lower part of a Breeder Unit (BU) with a
horizontal Stiffening Plate (SP) completely welded to the First Wall (FW),
- model Nr 2: middle part of the cell without horizontal SP,
- model Nr 3: upper part of the cell with Lithium- Lead opening between the horizontal SP and the rear of the FW.
Figure 2: Inner components of the HCLL-TBM
Breeder Unit (BU)
Horizontal Stiffening Plate (SP)
Cooling Plate (CP)
Vertical Stiffening Plate (SP)

- 186 - EFDA Technology / Tritium Breeding and Materials / Breeding Blanket / HCLL blanket
Figure 3: Positioning of the three models into a BU – FW
meshing of Nr 1, 2 and 3 models respectively The 2004’s work having shown that the maximum temperature was reached in the middle part of the BU (model Nr 2) this model was only studied in 2005. The complete meshing of the model Nr 2 is given in figure 4 to figure 7.
Figure 4: Model Nr 2 - Middle part of the BU without horizontal SP
Figure 5: Representation of steel structures (EUROFER)
Figure 6: Representation of the coolant (Lithium-Lead)
Figure 7: Representation of the FW The thermal-hydraulic features taken into account are summarized in figure 8.
The= 300°CFirst Wall
Vhelium = 66 m.s -1 The= 413°C
Stiffening PlatesVhelium = 37 m.s -1
Cooling PlatesVhelium = 6 m.s -1 The= 500°C
The= 456°C
The= 300°CFirst Wall
Vhelium = 66 m.s -1 The= 413°C
Stiffening PlatesVhelium = 37 m.s -1
Cooling PlatesVhelium = 6 m.s -1 The= 500°C
The= 456°C
Figure 8: Helium flow scheme The thermal loads considered in this study are: - Heat Flux (HF) on the FW of 0.5 MW.m-2
- Power density distribution related to a Neutron Wall Loading (NWL) of 0.78 MW.m-2.
The simulation establishes, first, the permanent thermal field under normal operating conditions, and then assesses the accidental transient. The transient consists in the total loss of helium flow after one second. This event occurs everywhere in the helium channels of the HCLL-TBM. The no active plasma shut-down case assumes that the accident remains undetected and the plasma continues to burn with a peak surface heat flux of 0.5 MW.m-2, until the FW reaches a temperature of 1100°C. At this temperature, the beryllium layer starts to sublimate into the plasma and stops it so that the surface heat flux drops to zero. The calculations performed indicate that the FW temperature reaches 1100 °C some 35 seconds after the beginning of the accident.
Lithium-Lead
First Wall
Cooling
Vertical Stiffening Plate
10.5 mm
15 mm
Model Nr 3
Model Nr 1
Model Nr 2

- 187 - EFDA Technology / Tritium Breeding and Materials / Breeding Blanket / HCLL blanket
Figure 9: FW temperature evolution – Model Nr 2 – Middle part of BU complete loss of helium flow
with non active plasma shut-down The detailed thermal results are given in figure 10 to figure 13 when the temperature is maximum (t = 35 s). The FW temperature is high in front of the plasma. The temperature rise concerns the overall thickness of helium channel. The FW rear zone remains relatively cold at 550°C.
Figure 10: FW temperature field
Model Nr 2 – t = 35 sec
Figure 11: Vertical SP temperature field
Model Nr 2 – t = 35. sec.
Figure 12: Lithium-Lead temperature field Model Nr 2 – t = 35 sec.
Figure 13: CP temperature field
Model Nr 2 – t = 35 sec. Concerning the mechanical loads, the internal pressure of 8.0 MPa is applied to the FW helium channel (figure 14). The mechanical analysis is carried out at 35 seconds.
Figure 14: Model Nr2 – Mechanical loads including end effect (yellow arrows)
The equivalent primary stresses (Von Misès) are computed and displayed in the FW meshing (figure 15).
Automatic shutdown t = 35 sec. – T max. = 1100°C
End of simulation t = 135 sec. – T max. = 692 °C
Beginning of LOFA t = 0 sec. – T max. = 559 °C
555 °C ≤ T ≤ 1100 °C
473 °C ≤ T ≤ 560 °C
472 °C ≤ T ≤ 607 °C
472 °C ≤ T ≤ 599 °C
1.3 MPa ≤ σ ≤ 64.2 MPa
Plasma side
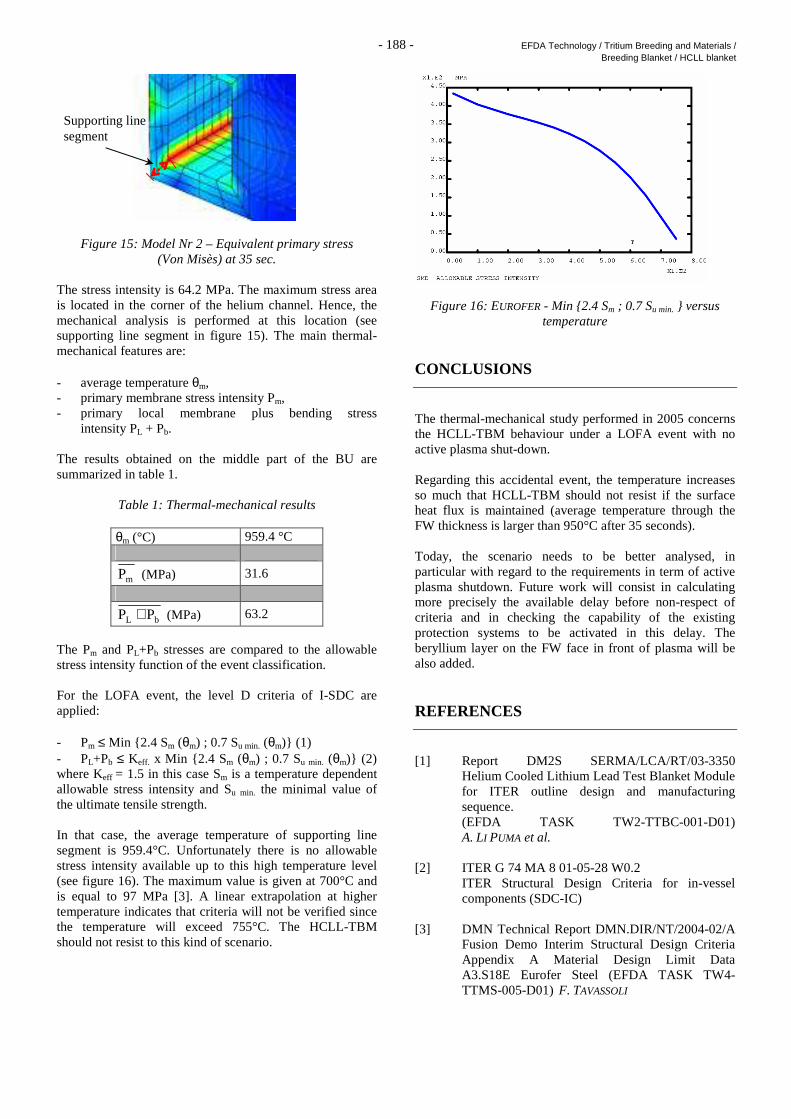
- 188 - EFDA Technology / Tritium Breeding and Materials / Breeding Blanket / HCLL blanket
Figure 15: Model Nr 2 – Equivalent primary stress (Von Misès) at 35 sec.
The stress intensity is 64.2 MPa. The maximum stress area is located in the corner of the helium channel. Hence, the mechanical analysis is performed at this location (see supporting line segment in figure 15). The main thermal-mechanical features are: - average temperature θm, - primary membrane stress intensity Pm, - primary local membrane plus bending stress intensity PL + Pb. The results obtained on the middle part of the BU are summarized in table 1.
Table 1: Thermal-mechanical results
θm (°C) 959.4 °C
mP (MPa) 31.6
bL PP + (MPa) 63.2
The Pm and PL+Pb stresses are compared to the allowable stress intensity function of the event classification. For the LOFA event, the level D criteria of I-SDC are applied: - Pm ≤ Min 2.4 Sm (θm) ; 0.7 Su min. (θm) (1) - PL+Pb ≤ Keff. x Min 2.4 Sm (θm) ; 0.7 Su min. (θm) (2) where Keff = 1.5 in this case Sm is a temperature dependent allowable stress intensity and Su min. the minimal value of the ultimate tensile strength. In that case, the average temperature of supporting line segment is 959.4°C. Unfortunately there is no allowable stress intensity available up to this high temperature level (see figure 16). The maximum value is given at 700°C and is equal to 97 MPa [3]. A linear extrapolation at higher temperature indicates that criteria will not be verified since the temperature will exceed 755°C. The HCLL-TBM should not resist to this kind of scenario.
Figure 16: EUROFER - Min 2.4 Sm ; 0.7 Su min. versus temperature
CONCLUSIONS
The thermal-mechanical study performed in 2005 concerns the HCLL-TBM behaviour under a LOFA event with no active plasma shut-down. Regarding this accidental event, the temperature increases so much that HCLL-TBM should not resist if the surface heat flux is maintained (average temperature through the FW thickness is larger than 950°C after 35 seconds). Today, the scenario needs to be better analysed, in particular with regard to the requirements in term of active plasma shutdown. Future work will consist in calculating more precisely the available delay before non-respect of criteria and in checking the capability of the existing protection systems to be activated in this delay. The beryllium layer on the FW face in front of plasma will be also added. REFERENCES
[1] Report DM2S SERMA/LCA/RT/03-3350 Helium Cooled Lithium Lead Test Blanket Module for ITER outline design and manufacturing sequence. (EFDA TASK TW2-TTBC-001-D01) A. LI PUMA et al. [2] ITER G 74 MA 8 01-05-28 W0.2 ITER Structural Design Criteria for in-vessel components (SDC-IC) [3] DMN Technical Report DMN.DIR/NT/2004-02/A Fusion Demo Interim Structural Design Criteria Appendix A Material Design Limit Data A3.S18E Eurofer Steel (EFDA TASK TW4- TTMS-005-D01) F. TAVASSOLI
Supporting line segment

- 189 - EFDA Technology / Tritium Breeding and Materials / Breeding Blanket / HCLL blanket
REPORTS AND PUBLICATIONS
N. SCHMIDT, ITER – Outlines of the TBM for ITER calculations; CEA/DEN/CAD/DER/SESI/LESA/NT D0 14 N. SCHMIDT, ITER – Evaluation of HCLL-TBM thermal-mechanical behaviour in case of LOCA CEA/DEN/CAD/DER/SESI/LESA/NT DO 9 24/08/05 TASK LEADER
Nicolas SCHMIDT DEN/DER/SESI CEA-Cadarache F-13108 Saint-Paul-lez-Durance Cedex Tel. : 33 4 42 25 38 31 Fax : 33 4 42 25 36 35 e-mail : [email protected] In close collaboration with Technicatome.

- 190 - EFDA Technology / Tritium Breeding and Materials / Breeding Blanket / HCLL blanket

- 191 - EFDA Technology / Tritium Breeding and Materials / Breeding Blanket / HCLL blanket
TW2-TTBC-005-D02
Task Title: TBM SYSTEM DETAILED SAFETY AND LICENSIN G
INTRODUCTION
In view of preparing the licensing of the HCLL TBM for ITER, the objective of the task is to assess the impact of the TBM on its environment from a safety viewpoint during the different phases of its lifespan (operation, maintenance, disposal, accident). The analysis and resulting documents will serve as a basis for the preliminary HCLL TBM safety assessment report to be produced and finalised at a later stage. The present task was divided into four different phases: - M1 - Review of TBM lifespan phases and potential
accidental situations: Based on the analysis of the HCLL concept design and ITER safety standards, this phase involved reviewing potential accident sequences with the aim of identifying envelope scenarios. The milestone M1 has already been reached. The final report written by Dr. P. Lo PINTO was submitted in 02/2004, entitled “Safety analysis of He-cooled lithium-lead test blanket module for ITER”.
- M2 - Release in normal and accidental situations: This phase involves studying the inventory of volatile radionuclides released under normal operating conditions. A study on the most penalising incidental situations developed from work carried out by the SERI laboratory will also make it possible to determine and estimate releases in such situations. It is question of estimating the source term, not the transfer of such releases into the surrounding environment.
- M3 - Occupational exposure: The contribution of the TBM to occupational exposure during operation, maintenance and accidental situations will be studied taking into account the ALARA principle, with the objective of minimising such exposure.
- M4 - Waste characterization and management: It will be verified that waste produced by the TBM can be integrated into the ITER global waste management strategy.
2005 ACTIVITIES
RELEASE IN NORMAL AND ACCIDENTAL SITUATIONS Under normal operating conditions, two sources of releases have been identified. The first source corresponds to the
indirect release related to the study of TBMs: destructive testing, etc. The second source corresponds to the transfer of tritium by permeation into the different systems. Within the scope of this study, it is difficult to determine the quantity of tritium to be taken into account during these two processes. In the first case, it is necessary to perform realistic estimates based on transfer calculations for materials under transient conditions. In the first case, it is necessary to evaluate an initial tritium inventory, a maintenance and analysis programme including the frequencies and types of operations to be carried out. A specific task is launched to meet this need in 2006. This task will make it possible to evaluate the potential tritiated releases due to transfers. Three accidental scenarios including one scenario with an aggravated variation can be identified
1- Break in the LOCA in-vessel
2- Break in the LOCA ex-vessel
3 - Break in the LOCA TBM The third scenario is the most penalising of all three accident scenarios. The resulting activity in the gaseous phase therefore reaches a maximum of 7.1.104 Bq, which is very low and insignificant in relation to the release estimates performed for other machine components. In terms of other gaseous products, tritium largely contributes to the total activity SPECIFIC ACTIVITY CLASSIFICATION Pb-Li The total activity at shutdown is assessed to be about 1.64.1013 Bq/kg, equivalent to about 50 106 GBq in the Pb-Li. Most of this activity (more of 80%) is due to the following nuclides: 3H and 203Pb. After a few days, most of this activity is due to H3. The dose rate observed in the Pb-Li loop is mainly caused by the 207 mPb nuclide with a level incomparable to any other nuclide and amounting to 2100 Sv/h for the whole coolant, whereas all other nuclides contribute at least 55 Sv/h. This nuclide disappears in less than an hour, as it has a half-life of only 0.8 seconds. 207 mPb is therefore not important, except in terms of designing the biological shielding. After 12 days, the main nuclides responsible of 99 % for the total dose rate (about 10 Sv/h) are 182Ta, 203Pb, 22Na. These nuclides will probably be responsible for the integrated dose during component handling and repairs owing to their significant half-life (> few days)

- 192 - EFDA Technology / Tritium Breeding and Materials / Breeding Blanket / HCLL blanket
Eurofer Upon reactor shutdown, the total Eurofer activity for front and rear locations is respectively about 1.90 1013 and 3.32 1011 Bq/kg. The main isotope expected is 56Mn. This nuclide disappears in less than a day, as its half-life is only 2.58 hours. After 12 days, most of this activity (more of 97 %) is due to the activation of the corrosion products, listed in decreasing order: 55Fe, 51Cr and 54Mn. Carbon-14 only becomes the main element after 100 years of decay. The dose rate observed in Eurofer is mainly caused by the 56Mn nuclide at a level that is incomparable to any other nuclide, amounting to 3940 Sv/h for the front Eurofer (in comparison to 250 Sv/h for the others) and 61 Sv/h, for the rear Eurofer (in comparison to 5 Sv/h for the others). After 12 days, the main nuclides responsible for more than 90% of the total dose rate are 54Mn, 182Ta and 51Cr for the front Eurofer and 52V, 54Mn and 51Cr for the rear Eurofer. For the same reasons in the Pb-Li, these nuclides will probably be responsible for the integrated dose during component handling and repairs. Gaseous products Radiological and isotopic inventories for the Pb-Li coolant were carried out. However, in order to evaluate the radiological impact in the case of an incident, it is necessary to assess the volatile products. The volatile radionuclides that may have an impact on the environment in the event of containment loss are H, He, Ne and F. These radionuclides can migrate from the cover gas and deposit in the cold zones or flow through the purification system. This evaluation reveals the fact that tritium is the main radioelement. The total activity can be considered as envelope seeing that it takes into account all the activity of the Pb-Li coolant that may be released during an incident. If a break appears in the Pb-Li system, only a part of this activity will be released, with the Pb-Li having been recovered in the leak tank and collectors. DOSE RATE ESTIMATION The radiological inventory lists the different radionuclides produced during the nuclear reaction (Pb-Li activation products, Eurofer structural activation products, etc.) Radioelements emitting gamma radiation produce a dose rate. The dose rate of a source emitting gamma radiation at a distance ‘d’ can be calculated based on an empirical formula or a computer code such as the FISPACT or microshield codes. An available equivalent code, microshield, was chosen by our laboratory. This code is designed to calculate dose rates for an object defined at a given distance with the possibility of including various attenuating materials. Calculations were performed at a distance of 104 mm for the TBM. These calculations do not take into account the contribution of Pb-Li contained in the TBM as it is assumed that the Pb-Li coolant has been drained from the TBM during maintenance. The parameters used to calculate the Pb-Li loop dose rate concern the pipes: a wall thickness of 0.5 cm, a diameter of 5 cm, contained in a 10 cm thick Eurofer container, with a
distance of 115.5 cm between the Pb-Li loop and the potential operator. TBM estimated dose rate Dose rate calculations for the Pb-Li coolant are low because the Pb-Li system represents one of the first barriers against the dose rate resulting from the activation of the Pb-Li coolant. For Eurofer, when we take into account attenuation factors as the shields (bioshield plug, time and distance) the dose rate absorbed by the operators is significantly reduced and becomes insignificant. Auxiliary loop estimated dose rate The Pb-17Li loop is a closed loop involving the forced circulation of Pb-17Li. A main storage tank is used to feed the TBM with Pb-17Li eutectic by means of a specific pump. The main components of the Pb-Li loop are the TBM and the feeding tank. WASTE CHARACTERIZATION AND MANAGEMENT Generated waste The operation and decommissioning of fusion reactors generate radioactive waste. This active waste is produced by the activation of the Pb-Li coolant and Eurofer materials owing to both the fusion reaction and the contamination generated by the activated materials. Such waste is essentially found in a metallic form, resulting from both component replacement (TBM, etc.) and technological waste (vacuum pump oils, colt trap…). This waste will be both activated and tritiated. Waste classification All waste produced inside a contaminating zone will be considered as nuclear waste. This waste is classified depending on the nuclide specific activity, half-life and radiotoxicity. The strategy developed in international documents is based on three possible solutions for such materials: - Recycling: reusing the material in the nuclear industry, - Clearance: releasing the materials from regulatory
control, - Disposal – as radioactive waste – of the waste fraction
that cannot be recycled or cleared. The concept of clearance is not acceptable in France. Waste classification is managed by the French Agency for Radioactive Waste Management (ANDRA). Four categories of waste currently exist in France, depending on the mean activity and half-life of the nuclides: - Very Low Level Waste (VLLW),

- 193 - EFDA Technology / Tritium Breeding and Materials / Breeding Blanket / HCLL blanket
- Low Level Waste (LLW) corresponding to low or
medium activity with a short life (< 30 years). The repository type currently used for such waste is final surface disposal at the Centre de Stockage de l’Aube,
- Intermediate Level Waste (ILW) corresponding to
medium activity with a long life (> 30 years), - High Level Waste (HLW) corresponding to high
activity with a long life and thermal effects. Based on the French criteria, a method of classification has been established. After 10 years of decay, the Eurofer front part is classified as ILW. This classification is due to the activity of two radionuclides, tritium and Nb-94. Downgrading to LLW seems possible for tritiated waste by means of a detritiation process. However, this process only concerns tritium-related ILW, with 94Nb-related waste remaining “as is”. Seeing that activities are only slightly higher than those stipulated in specifications, it is worth performing more precise estimates by reducing uncertainties to avoid over-classification. Furthermore, it seems perfectly reasonable to cut out parts with higher 94Nb specific activities, which would make it possible to downgrade most of the Eurofer waste. Combined with a detritiation process, the quantity of ILW should remain low. The Eurofer rear part is classified as LLW from the very first year. The mass of waste produced by the structure is about 1520 kg per TBM, which represents a very small fraction of the overall waste. Pb-Li is classified as ILW. This classification is due to the considerable activity of tritium. However, this tritium activity is calculated disregarding the tritium extraction process used on the Pb-Li coolant. To correctly estimate the tritium activity at a given moment in the Pb-Li, it is necessary to complete the study on tritium inventories. CONCLUSIONS
This study aims at evaluating the impact of HCLL TBMs upon several aspects: releases, dose rates and waste. Based on activation calculations and envisaged accident scenarios, several points are worth underlining: In terms of releases, during an in-TBM accident as described in the document, tritium represents most of the activity. However, resulting releases remain below thresholds set by guidelines (accidental and incidental). In terms of dose rates, a preliminary estimate was provided, making it possible to check that shielding is perfectly suitable to limit the received integrated dose. Waste resulting from the HCLL TBM represents a small fraction of the waste totality generated by ITER. The Eurofer front part represents ILW whereas the rear part represents LLW. Specific treatment such as detritiation and
removal of the areas most exposed to the neutron flux should make it possible to downgrade some of this waste (Eurofer TBM front). Consideration of such waste does not modify the overall waste management strategy. The Pb-Li waste is considered as ILW mainly owing to tritium activity. However, tritium activity is calculated disregarding the tritium extraction process and can therefore be said to be clearly over-evaluated. Additional study should make it possible to significantly lower the estimates provided in this document. The tritiated releases during normal operation could not be integrated owing to the fact that this requires a specific study and dedicated simulation model designed to evaluate transfers by permeation and dynamic extraction. This study was launched in 2006 as part of an EFDA task. REPORTS AND PUBLICATIONS
[1] TBM system detailed safety and licensing DTN/STPA/LPC/2005/05, 17/01/2006 C.LACRESSONNIERE, O. GASTALDI TASK LEADER
Christelle LACRESSONNIERE DTN/STPA/LPC CEA-Cadarache F-13108 Saint-Paul-lez-Durance Cedex Tel. : 33 4 42 25 35 50 Fax : 33 4 42 25 72 87 e-mail : [email protected]

- 194 - EFDA Technology / Tritium Breeding and Materials / Breeding Blanket / HCLL blanket

- 195 - EFDA Technology / Tritium Breeding and Materials / Breeding Blanket / HCLL blanket
TW4-TTBC-001-D01
Task Title: TBM DESIGN, INTEGRATION AND ANALYSIS TESTING PROGRAMME AND ENGINEERING DESIGN OF THE
FIRST TBM FOR ITER H-H PHASE
INTRODUCTION
The objective of this activity is the development of the design and testing programme of the first TBM (Test Blanket Module) to be inserted in ITER during the H-H plasma phase. Is it focused on the TBM itself and therefore the design of the associated systems and components is only very preliminary. In fact, the main part of the TBM design activities have been performed under subtask TW2-TTBC-001-D01, published in [1], and are oriented towards the definition of a TBM design directly derived from the corresponding DEMO modules. These activities will permit to define the design of the TBM required for a fully integrated test program under D-T plasma after several years of operation (the so-called Integral TBM”, IN-TBM). In parallel to this activity, it is essential to define the design and the testing program of the first TBM to be inserted in ITER during H-H plasma (from the first day of ITER operation). The objective of the present subtask is to define a testing program and to develop a design, including instrumentation, for the first TBM able to take advantage of the ITER H-H phase to progressively qualify and optimize the TBM behaviour before D-D and D-T plasma operations. This TBM is often called “Electro-Magnetic TBM” (EM-TBM). 2005 ACTIVITIES
The activities for this subtask have been completed. Proposal for a testing programme during H-H plasma have been published [1]. Design and specific features of the EM-TBM have been described in [2], distributed in the Test Blanket Working Group (TBWG) framework. The finalisation of the subtask, consisting in the edition of the task final report, is expected in 2006. TBM DESIGN The basic features of the EM-TBM which will be used during the H-H phase of ITER operation and which is expected to be installed in ITER for day 1 are mainly the same as the ones described in [3] for the In-TBM. However, due to the different testing conditions in particular in the field of T management, special features will be necessary to cope with the EM-TBM specific objectives. In the HH-phase, it is envisaged to assess the tritium diffusion in the PbLi and permeation into the He coolant.
The tritium will be simulated using H/D diluted in the PbLi circuit which should be tested up to relevant DEMO temperatures. Tests at lower temperatures will allow in any case code validation because of the known relation between T solubility and temperature in the liquid metal. Preliminary estimations have shown that even if the PbLi is saturated, the amount of permeated H/D in the He cooling circuit will be small, in a range difficult to measure with classical instrumentation (mass spectrometers for example). In order to reach measurable quantities of permeated H/D, 2 central BU will not be fed with the nominal He cooling flow but with a reduced He "purge" flow coming by dedicated feeding tubes. This system is shown on figures 1 and 2. If the pertinence of such a system is confirmed, it will necessitate a specific circuit located in the port cell.
Figure 1: View of the HCLL EM-TBM with dedicated He feeding tubes
Figure 2: View of the HCLL EM-TBM with dedicated He feeding tubes (detail)

- 196 - EFDA Technology / Tritium Breeding and Materials / Breeding Blanket / HCLL blanket
The by-pass tube collecting part of the He flow after the cooling of the first wall has been added in the EM-TBM design and is shown on figure 3.
Figure 3: View of the HCLL EM-TBM with cut
in the by-pass exit tube plane REPORTS AND PUBLICATIONS
[1] A. Li Puma et al., The Helium Cooled Lithium
Lead blanket test proposal in ITER and requirements on Test Blanket Modules instrumentation, Fusion Engineering and Design 75-79 (2005) 951-955
[2] J-F. Salavy et al., European Helium Cooled
Lithium Lead (HCLL) Test Blanket Module (TBM) Detailed Description Document (DDD), Draft 2, november 2005.
[3] A. Li Puma, T. Meynaud, Y Poitevin, G. Rampal,
J.F. Salavy, F. Gabriel., “HCLL TBM for ITER – Engineering design, analyses and test programme & needs”, CEA report SERMA/RT/05-3568/A, 12/2005.
TASK LEADER
Jean-François SALAVY DEN/DM2S/SERMA CEA-Saclay F-91191 Gif-sur-Yvette CEDEX Tel. : 33 1 69 08 71 79 Fax : 33 1 69 08 99 35 e-mail : [email protected]

- 197 - EFDA Technology / Tritium Breeding and Materials / Breeding Blanket / HCLL blanket
TW5-TTBC-001-D01
Task Title: TBM DESIGN, INTEGRATION AND ANALYSIS DESIGN AND ANALYSES OF THE HCLL TBM INCLUDING
DESIGN OF SUPPORTING SYSTEM AND INSTRUMENTATION INTEGRATION
INTRODUCTION
The TW5-TTBC-001-D01 deliverable was aimed at completing the design and analyses for the HCLL Test Blanket Module, and for the EM-TBM (first TBM inserted in ITER) and the In-TBM (last and most complete TBM) versions. Based on an existing preliminary concept, various improvements were done in order to fix fabrication issues, to introduce a possible access to instrumentation, and the attachment system. The specific features of the EM-TBM were also designed. Various analyses were performed aiming at demonstrating the withstanding of the structure under the main mechanical loads it is submitted to. 2005 ACTIVITIES
DESIGN EVOLUTIONS OF THE TBM The last modifications on the In-TBM design were shared with the work done within the frame of the TW2-TTBC-001-D01 deliverable, and are reported in ref. [2], with the corresponding drawings. They have mainly consisted in improvements linked with fabrication issues, instrumentation access, and with implementation of the attachment system. The mounting sequence has been updated and all the welds configurations were listed to provide useful information (local geometry characteristics, available spaces) for welding developments. The other modifications have consisted in a new optimised Helium flow scheme aiming at minimizing the pumping power and introducing a by-pass to adjust the cooling needs according to the power deposition repartition.
EM-TBM DESIGN FOR THE H-H PLASMA PHASE The main test objectives of the first TBM to be tested in ITER device were defined: - Environmental measurement of EM fields, eddy
currents in blanket structure and mechanical effect during EM transients.
- Effect of ferromagnetic material inside the vacuum vessel.
- Evaluation of MHD effects on Pb-17Li flow. - Demonstration of the TBM box integrity under heat
flux and major plasma disruption (safety test for subsequent phase with T).
- Possible preliminary simulation of T-permeation test (H, D).
The EM-TBM will share the same materials, fabrication technology, box design, and attachment system as the following TBM. Its main specific features will be: - A PbLi heating possibly performed outside the TBM
(PbLi heater located in the pit) and/or by the He. Heaters could replace some cooling plates in the breeder units;
- FW cooled first (channels optimized dimensions: 14x15 mm2), and use of a by-pass, which advantages are;
- less pumping power; - better control on the flow rate needed for the first wall; - without neutronic heating of the BZ, evacuation of the
cooling power; - In order to measure low permeation of H (or D)
towards He, and to maximize the concentrations, chosen specific BU are fed with slower He flow by an independent He circuit (Ø2 mm pipes).
Figure 1: Optimized coolant flow scheme of the In-TBM
300°C 1.5 kg/s 80 bar
FW 1.5 kg/s -1.5 bar
402°C
78.5 bar
SP 0.21 kg/s -0.05 bar
CP 0.58 kg/s
>-0.05 bar
By-pass 0.71 kg/s
? bar
402°C ? bar
500°C 78.45 bar
500°C ? bar
454°C 78.45 bar
Ext. loop 1.5 kg/s -1.1 bar
454°C 1.5 kg/s 77.1 bar

- 198 - EFDA Technology / Tritium Breeding and Materials / Breeding Blanket / HCLL blanket
MECHANICAL ANALYSES In order to validate the last improvements made to the design, several FEM analyses have been performed on relevant portions of the TBM geometry. These analyses share the following common characteristics: - The basis for the geometry is the In-TBM; - The computations are performed with CAST3M code; - The FEM models rely on; - Parabolic tetrahedrons elements; - Linear analyses according to SDC-IC criteria
verifications assuming 500°C as structure temperature;
- The applied loads are primary loads, such as pressure
(in normal or accidental situations) and electro-magnetic forces (under disruption, considered as a normal situation). The secondary loads, such as those due to thermal expansions weren’t considered: the complexity of the structure and of the thermal exchanges lead to specific models developments that will be performed in a next step. Moreover, the secondary stresses are not a major concern at this step of the design, and have no criteria in accidental cases.
HORIZONTAL SLICE In order to validate the mechanical behaviour of the main design choices of the box structure, a model relying on a relevant “horizontal” slice of the TBM has been established. Two horizontal lines of breeding cells are represented, and considered as a periodic pattern in the vertical direction. The vertical mid-plane of the TBM is considered as symmetry plane to reduce the model. Periodicity conditions are applied on the boundary horizontal planes. The stiffening plates are homogenized by using orthotropic properties equivalent to the real plates with internal channels.
Table 1: Horizontal slice model stresses analysis (MPa)
Normal pressure Accidental
pressurization Segment Memb. Memb.+bend. Memb. Memb.+bend.
1 46 63 40 87 2 15 73 30 159 3 11 65 22 79 4 149 235 5 201 422 6 253 289
Criteria 132 198 278 417
The main results are summarized in table 1, and show a correct and admissible behaviour of this part of the structure regarding to the loads and criteria. The figure 2 shows the model, the locations of the analysis segment lines, and, as an example, the Von Mises stresses under accidental conditions.
Figure 2: Von Mises stresses field under accidental pressure and analysis segment lines
TOP CAP In order to complete the global analysis of the TBM under pressure loads, an analysis of the top cap has also been performed, based on a model similar to the horizontal slice one. The horizontal cutting plane used as boundary for the model is considered as a symmetry plane; this assumption being approximate, results in the plane vicinity are ignored. The main results are summarized in table 2, and show a correct and admissible behaviour of this part of the structure regarding to the loads and criteria. The figure 3 shows the model, the locations of the analysis segment lines, and, as an example, the Von Mises stresses under accidental conditions. The lower stress level on local zones comparable with the horizontal slice model shows the stiffening role of the cap.
Table 2: Top cap model stresses analysis (MPa)
Normal pressure Accidental
pressurization Segment Memb. Memb.+bend. Memb. Memb.+bend.
1 26 43 103 164 2 12 147 14 179 3 57 89 56 126 4 74 265 5 123 286 6 7
183 233
364 275
Criteria 132 198 278 417
Segment 4
Segment 6
Segment 5
Segment 2
Segment 1
Segment 3

- 199 - EFDA Technology / Tritium Breeding and Materials / Breeding Blanket / HCLL blanket
Figure 3: Von Mises stresses field under accidental pressure and analysis segment lines
STIFFENING GRID In complement to the previous global calculations, a local model of the stiffening grid has been studied, in order to evaluate the local stresses due to the presence of the internal channels in the stiffening plates, under the dimensioning load case. The stiffening grid main role is actually to avoid excessive bending of the box walls in case of accidental internal pressurization. This model makes large use of the symmetries in the geometry and represents the cross-shaped junction with the first wall were the horizontal stiffening plates are incompletely welded to the first wall (openings of the PbLi flow path). The figure 4 shows the model and the Von Mises stresses under accidental conditions. These stresses were not analysed according to the SDC-IC guidelines, but only compared to the allowable limit of 278 MPa for membrane primary stress at 500°C under accidental load, excluding the peak values. This criterion is fulfilled in the stiffening plates, but the margins are low in the vicinity of the first wall junctions. ATTACHMENT SYSTEM The last design step was used to implement an attachment and supporting system of the TBM able to withstand the disruption loads and TBM weight, while allowing thermal expansions of the box. In order to verify and validate the behaviour of this system, a local model of the flexible cartridge and a global model of the back plates and shear keys were established. Figure 5 gives a description of the attachment system and of situation taken into account for the load cases. FLEXIBLE CARTRIDGE LOCAL MODEL It is used to compute the stiffness properties of an equivalent beam model to be introduced in the global model. The stresses under the primary load (reactions forces computed with the global model) and secondary load (thermal expansion of the module) were also evaluated, showing large margins to the criteria in normal situations. Figure 6 shows the Von Mises stresses under the total load.
Figure 4: Von Mises stresses under accidental pressure (Red: over 400 MPa)
Figure 5: Description of the TBM attachment system
Allowed thermal expansion
Applied disruption forces and torques
Flexible attachments
Y X
Z
Segment 1
Segment 6
Segment 4
Segment 5
Segment 7
Segment 3
Segment 2

- 200 - EFDA Technology / Tritium Breeding and Materials / Breeding Blanket / HCLL blanket
Figure 6: Von Mises stresses under primary + secondary load
BACK PLATES GLOBAL MODEL The global model represents the back manifold (back plates and stiffening rods), the shear keys, and, by the way of beam models, the flexible cartridges. A study of the electro-magnetic loads in various cases of disruption ref. [1] was previously performed, giving the variations in time of the components of a torque given at the central point of the last back plate. The static load applied to the model corresponds to a torque which components are the maximum values of the components of the worst disruption event. The TBM weight was also calculated to the same point. These loads are synthesised in table 3. In order to apply the loads, an equivalent nodal force field was applied to the whole structure. Rigid body conditions were applied to the backplates boundaries, simulating the junction to the rest of the box. Gliding unilateral displacement conditions were applied to simulate the contacts between shear keys and key ways.
Table 3: Dimensioning loads (forces in MN, torques in MN.m) for the attachment system
MD18msECQ TBM weight FX 0,050 0,000 FY 0,003 0,000 FZ 0,002 -0,047 MX -0,450 0,000 MY 0,003 -0,013 MZ -0,028 0,000 Fmod 0,050 0,047 Mmod 0,451 0,013
The Von Mises stresses analyses (figure 7) show near 50 % margins to the criteria on the most loaded back plate. The shear keys show peak values at strong discontinuities that could easily be relaxed with appropriate fillets. Out from these peaks, the values are acceptable.
Figure 7: Von Mises Stresses analyses HE LOOP ANALYSIS An analysis of the helium loop has been performed in order to assess the possibility of reducing the size of the main components of the Helium Coolant System, the required space to install the components exceeding the space which is provided inside the vault. It was found that: - Heat exchangers (cooler and recuperator) could be
reduced by using plate type Heatric heat exchanger. Effectiveness and pressure droop loss are close to the baseline. Size is approximately half of the reference one.
- A better compactness is practicable, but maintenance will be more difficult.
CONCLUSIONS
Various studies have been performed to modify, optimize, and validate the design of the HCLL Test Blanket Module, focusing on the last version (last ITER operating phase), and detailing specific features of the first version (first ITER operating phase). Future studies will consist in the development of new thermal models in order to give most comprehensive information on the TBM thermal performances and precise temperature fields necessary for the mechanical analyses: they will be performed with the help of new correlation models and homogenisation of breeder unit cells allowing the handling of larger models. Future improvements on the design will focus on the TBM integration in its Port Cell and on the design of mock-ups. REFERENCES
[1] M. Roccella, “Electromagnetic analyses of TBM
HCLL and evaluation of main structural loads on the component”, draft report on the TW2-TTBC-001-D03 deliverable, november 2005
[2] A. Li Puma et al., “Helium Cooled Lithium Lead Test
Blanket Module for ITER: engineering design, analyses and test programme and R&D needs”, final report on TW2-TTBC-001-D01 deliverable, SERMA/LCA/RT/05-3568/A, december 2005

- 201 - EFDA Technology / Tritium Breeding and Materials / Breeding Blanket / HCLL blanket
REPORTS AND PUBLICATIONS
[1] G. Rampal, Design and analyses of the HCLL TBM
including design of supporting system and instrumentation integration CEA report SEMT/BCCR/RT/06-004/A.
TASK LEADER
Gilles RAMPAL DEN/DM2S/SEMT CEA-Saclay F-91191 Gif-sur-Yvette Cedex Tel. : 33 1 69 08 41 44 Fax : 33 1 69 08 94 26 e-mail : [email protected]

- 202 - EFDA Technology / Tritium Breeding and Materials / Breeding Blanket / HCLL blanket

- 203 - EFDA Technology / Tritium Breeding and Materials / Breeding Blanket / HCLL blanket
TW5-TTBC-001-D02
Task Title: TBM DESIGN, INTEGRATION AND ANALYSIS FINALIZATION OF THE CONCEPTUAL DESIGN OF THE
PROTOTYPICAL HCLL TBM MOCK-UP
INTRODUCTION
Within the framework of the development of Test Blanket Modules (TBM) for ITER, out of pile test campaigns are foreseen to qualify components, functionalities, and systems to guarantee that insertion of TBM in ITER will not affect its safety. This qualification program prior to ITER is foreseen in dedicated facilities and includes: - the testing of the sub-components design and fabrication technology (First Wall, Breeder Units, Back Manifolds) from small to 1/1 mock-ups - in scale functional tests 1/4 TBM (PbLi loop with and without TBM, TBM structure, TBM structure and Breeder Units) - 1/1 TBM mock-up tests - Electro Magnetic TBM (EM-TBM, for ITER H-H phase) acceptance tests In particular, a relevant medium-scale (1/4) prototypical mock-up (PMU) is foreseen and will be tested in the European Breeding Blanket Testing Facility (EBBTF) in Brasimone, Italy. The objective of the deliverable TW5-TTBC-001-D02 is to finalize the conceptual design of this prototypical mock-up (preliminary design studied in the TW4 work program, task TW4-TTBC-001-D01) including the definition of operating parameters for test relevancy and instrumentation. 2005 ACTIVITIES
TEST OBJECTIVES The out of pile testing of a HCLL TBM prototypical mock-up in the EBBTF facility has two main objectives: - to operate the mock-up with the main ancillary circuit under real conditions; - to validate the TBM design and manufacturing before 1/1 TBM prototype fabrication. The functional tests foreseen in the EBBTF facility are the following: - Testing of heat removal from First Wall and Breeding Zone: the 0.5 MW/m2 plasma thermal radiation on the First Wall will be simulated by
external heaters (CC resistors); the internal deposited power will be simulated by heater plates inside the Breeding Zone. - Testing of thermo-mechanical withstanding by simulating nominal and accidental (Loss Of Flow Accident, Loss Of Coolant Accident…) conditions - Testing of H (or D?) control (saturated at PbLi inlet):
permeation towards the coolant, measurement of H concentration in the circuit
- Testing of instrumentation and validation of test procedures for ITER - Testing under real operative conditions and validation of ancillary circuit components (Coolant Purification System, Tritium Extraction System, …) MOCK-UP DESIGN The design of the mock-up is based on: - The relevancy with the first TBM for ITER (ref. [1]
and [2]): similar velocities and flow path for helium and PbLi, similar heat levels (First Wall, Cooling Plates), similar mechanical behaviour with regard to the pressure loads, similar manufacturing / manufacturing sequence…
- The power managed by the EBBTF facility - Simplification of the TBM features out of testing
purposes
Figure 1: Conceptual design view of the TBM Prototypical
Mock-Up

- 204 - EFDA Technology / Tritium Breeding and Materials / Breeding Blanket / HCLL blanket
Table 1: Main data on the PMU design
Based on these assumptions, the conceptual design of the mock-up presents the following characteristics (figure 1): - The power managed by the EBBTF facility is 350
kW: the mock-up will represent a quarter of TBM (the total power deposited in TBM is 1200 kW).
- To keep a similar geometry, the mock-up will represent a 6-cells portion of the TBM (3 horizontal cells x 2 vertical cells), insuring the consistency of the dimensional parameters. - In order to reach the same He velocity, the FW prototypical mock-up will have to be cooled, as the TBM, by 4 passes channels.
- The simplifications that are envisaged with regard
to the TBM features include: - Full Stiffening Plates with reduced thickness to
get the equivalent cross-section of a TBM Stiffening Plate with internal channels.
- Simplification of the Cooling Plates channels compared to the TBM, keeping the objective of evaluating the H permeation towards the He.
- Heaters in the PbLi bed, simulating the heat power deposition due to the neutron flux are necessary to allow permeation tests at relevant temperatures. Various calculations have been performed to determine the Helium flow scheme parameters and data, leading to the scheme presented in figure 2. The main design characteristics are synthesized in table 1. SIMULATION OF THE HEAT INTERNAL DEPOSITION Heater plates have been designed in order to simulate the deposited power, with a variable profile, in the PbLi. They will be constituted with a resistive cable (Ø2.5 mm) with steel sheath and fixed on a steel frame with a variable pitch to reproduce the power profile (see figure 3). Each heater plates will be equipped with 2x2 kW electric power heater elements, supplied with 220 V. The main issues are related to the sheath corrosion in PbLi: the stainless steel is not suitable because of its high corrosion rate in PbLi. The envisaged solutions, to be experimentally validated (in DIADEMO facility?), are the following: - rotection of stainless steel sheath heaters, with a ferritic cover sheath, or aluminized coating; - ferritic steel sheath; - tight ferritic box enclosing the stainless steel sheath
heaters. One other important issue resides in the big diameter of the heater plates connectors, which could take a lot of the available space in the back face.
Figure 2: PMU Helium flow scheme
Box structure FW thickness 25 mm Steel mass 480 kg Total mass 1250 kg FW max. temperature (°C) 533
Helium scheme FW channels dimensions 14 x 15 mm2 He mass flow 0.34 kg/s He inlet T 300°C He outlet T #459°C Total pressure drop (bar) 1.97 FW He velocity (min., ave., max. - m/s)
61,30 64,75 73,69
SP He velocity (min., ave., max. - m/s)
3,46 3,61 3,78
CP He velocity (min., ave., max. - m/s)
3,59 3,79 4,11
PbLi scheme PbLi number of recirculation per day
10 70
PbLi mass flow (kg/s) 0.089 0.623 Mock-up 0.0327 0.229 Volumetric
flow (m3/h) Cells column 0.0109 0.0763 Mock-up feeding pipe
5.7 40
BU cross section
0.09 0.65 PbLi velocity (mm/s)
FW opening 3 21
300°C 0.34 kg/s 80 bar
MM aanniiffoolldd ssttaaggee ##11 00..3344 kkgg//ss --00..0011 bbaarr
300°C 0.34 kg/s 79.96 bar
FFWW 00..3344 kkgg//ss --11..9933 bbaarr
402.4°C
78.03 bar
SSPP ++ MM aanniiffoolldd ssttaaggee ##22 00..0077 kkgg//ss
--00..000099 bbaarr
CCPP ++ CCooll lleeccttoorr ss 00..1144 kkgg//ss
--00..000099 bbaarr
CCoovveerr ss 00..0011 kkgg//ss
?? bbaarr
BByy--ppaassss 00..1111 kkgg//ss
?? bbaarr
402.45°C
? bar
457.89°C
78.03 bar
501.52°C
78.03 bar
489.39°C
? bar
459.18°C 0.34 kg/s 78.03 bar

- 205 - EFDA Technology / Tritium Breeding and Materials / Breeding Blanket / HCLL blanket
Figure 3: Conceptual design of the heater plates frame
CONCLUSIONS
The main functional data for the design of a HCLL TBM Prototypical Mock-Up have been identified, and conceptual drawings have been produced. The next steps of the design are identified under the deliverable TW5-TTBC-001-D05, in which final drawings of the mock-up have to be produced, and internal and external heating devices have to be defined. This work will require some information exchange with EBBTF facility management: He and PbLi circuits constraints (mass flow range, temperatures range, connexions, overall dimensions) and test constraints (application of boundary conditions in normal and accidental simulations, measurability of H or D in the He coolant, instrumentation). Comments on fabrication constraints will come from TTBC-002 experts.
REFERENCES
[1] A. Li Puma et al, “Helium Cooled Lithium Lead Test
Blanket Module for ITER: engineering design, analyses and test programme and R&D needs”, final report on TW2-TTBC-001-D01 deliverable, SERMA/LCA/RT/05-3568/A, december 2005
[2] G. Rampal et al, “Design and analyses of the HCLL
TBM including design of supporting system/connections and instrumentation integration”, final report on TW5-TTBC-001-D01 deliverable, to be issued
TASK LEADER
Jean-François SALAVY DEN/DM2S/SERMA CEA-Saclay F-91191 Gif-sur-Yvette Cedex Tel. : 33 1 69 08 71 79 Fax : 33 1 69 08 99 35 e-mail : [email protected]

- 206 - EFDA Technology / Tritium Breeding and Materials / Breeding Blanket / HCLL blanket
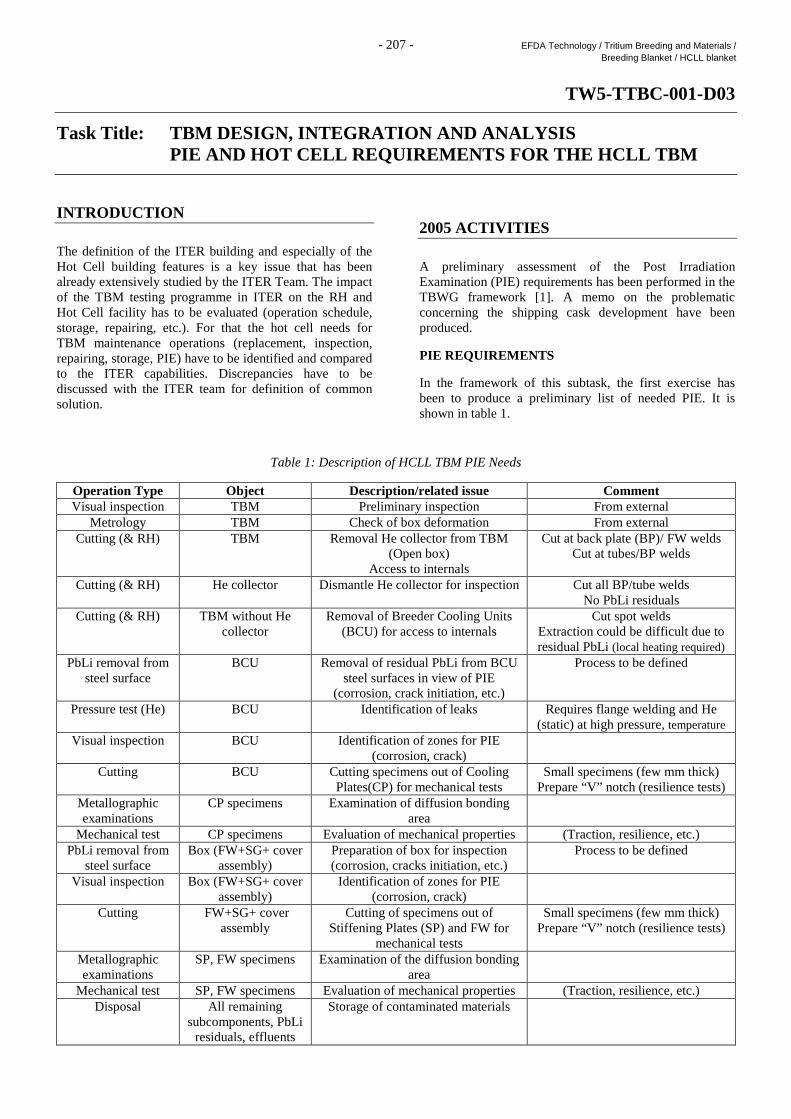
- 207 - EFDA Technology / Tritium Breeding and Materials / Breeding Blanket / HCLL blanket
TW5-TTBC-001-D03
Task Title: TBM DESIGN, INTEGRATION AND ANALYSIS PIE AND HOT CELL REQUIREMENTS FOR THE HCLL TBM
INTRODUCTION The definition of the ITER building and especially of the Hot Cell building features is a key issue that has been already extensively studied by the ITER Team. The impact of the TBM testing programme in ITER on the RH and Hot Cell facility has to be evaluated (operation schedule, storage, repairing, etc.). For that the hot cell needs for TBM maintenance operations (replacement, inspection, repairing, storage, PIE) have to be identified and compared to the ITER capabilities. Discrepancies have to be discussed with the ITER team for definition of common solution.
2005 ACTIVITIES
A preliminary assessment of the Post Irradiation Examination (PIE) requirements has been performed in the TBWG framework [1]. A memo on the problematic concerning the shipping cask development have been produced. PIE REQUIREMENTS In the framework of this subtask, the first exercise has been to produce a preliminary list of needed PIE. It is shown in table 1.
Table 1: Description of HCLL TBM PIE Needs
Operation Type Object Description/related issue Comment Visual inspection TBM Preliminary inspection From external
Metrology TBM Check of box deformation From external Cutting (& RH) TBM Removal He collector from TBM
(Open box) Access to internals
Cut at back plate (BP)/ FW welds Cut at tubes/BP welds
Cutting (& RH) He collector Dismantle He collector for inspection Cut all BP/tube welds No PbLi residuals
Cutting (& RH) TBM without He collector
Removal of Breeder Cooling Units (BCU) for access to internals
Cut spot welds Extraction could be difficult due to residual PbLi (local heating required)
PbLi removal from steel surface
BCU Removal of residual PbLi from BCU steel surfaces in view of PIE
(corrosion, crack initiation, etc.)
Process to be defined
Pressure test (He) BCU Identification of leaks Requires flange welding and He (static) at high pressure, temperature
Visual inspection BCU Identification of zones for PIE (corrosion, crack)
Cutting BCU Cutting specimens out of Cooling Plates(CP) for mechanical tests
Small specimens (few mm thick) Prepare “V” notch (resilience tests)
Metallographic examinations
CP specimens Examination of diffusion bonding area
Mechanical test CP specimens Evaluation of mechanical properties (Traction, resilience, etc.) PbLi removal from
steel surface Box (FW+SG+ cover
assembly) Preparation of box for inspection (corrosion, cracks initiation, etc.)
Process to be defined
Visual inspection Box (FW+SG+ cover assembly)
Identification of zones for PIE (corrosion, crack)
Cutting FW+SG+ cover assembly
Cutting of specimens out of Stiffening Plates (SP) and FW for
mechanical tests
Small specimens (few mm thick) Prepare “V” notch (resilience tests)
Metallographic examinations
SP, FW specimens Examination of the diffusion bonding area
Mechanical test SP, FW specimens Evaluation of mechanical properties (Traction, resilience, etc.) Disposal All remaining
subcomponents, PbLi residuals, effluents
Storage of contaminated materials

- 208 - EFDA Technology / Tritium Breeding and Materials / Breeding Blanket / HCLL blanket
Given to the TBWG, this list has permitted to progress in the discussions between parties concerning the PIE availability in ITER and several scenarios have been examined. Due to the late availability of the activation analysis results, the deliver of the subtask aiming to determine the waste level has been delayed. As a consequence, the second part of the PIE analysis, concerning the precise description of what can be practically envisaged in terms of PIE in existent hot cells has not been yet performed. The TBWG thoughts about the global strategy on PIE, which aim to propose a common understanding of the situation and discuss it with the ITER project to see if the needs can cope with the available space in the buildings, have led to 4 possible scenarios:
1. TBM shipped back to the country of origin or partner party after testing in ITER
2. Specimen Preparation + PIE
3. Specimen Preparation Only (PIE done at the host
country)
4. Specimen Preparation + limited PIE at ITER site (i.e., ceramic breeder pebble bed integrity)
To contribute to these discussions, a memo concerning the problematic of development of a shipping cask able to transport a TBM to the host country has been produced [2].
REFERENCES
[1] A. Ying & al., chapter 7 (RH&HC) of the “Report from the re-established Test Blanket Working Group (TBWG) for the period of the ITER Transitional Arrangements (ITA)”, september 2005. [2] D. Hyvert, J-F. Salavy, CEA/DEN/DM2S Memo on shipping casks, december 2005
TASK LEADER
Jean-François SALAVY DEN/DM2S/SERMA CEA-Saclay F-91191 Gif-sur-Yvette Cedex Tel. : 33 1 69 08 71 79 Fax : 33 1 69 08 99 35 e-mail : [email protected]

- 209 - EFDA Technology / Tritium Breeding and Materials / Breeding Blanket / HCLL blanket
TW5-TTBC-001-D06
Task Title: FURTHER THERMAL-HYDRAULICS AND DESIGN S TUDY RELATED TO THE CHOICE OF REFERENCE He COOLING SCHEME FOR THE HCLL TBM
INTRODUCTION
In the current HCLL DEMO Blanket design, helium scheme is such as the First Wall (FW) and the Stiffening Plates (SPs) are cooled in parallel at first, then the He passes in the Cooling Plates (CPs). This schema allows cooling with "cold He" components having a structural functions, while guaranteeing an He outlet temperature of 500 °C, as suitable to obtain interesting thermodynamic efficiency. Thanks to the fact that only one portion of the He mass flow circulates in the stiffening plates allows, furthermore, to reduce the SPs channels cross section and then the SPs thickness so increasing the breeder material (LiPb) content in the breeder zone. The He mass flow distribution, i.e. the balance of the pressure drops between the FW and in the SPs, on the other hand, relies on the use of appropriate flow limiters in the SPs. The scope of this task is to assess alternative He flow schemes avoiding any external control of the He mass flow and to define a reference He scheme for the HCLL DEMO blanket to be applied on the HCLL TBM for ITER. The impact on the module design will also be assessed taking into account the need of sharing as much as possible the fabrication technology with the Helium Cooled Pebble Bed (HCPB) TBM. It is noted that such a selection can be only performed by comparing all aspects of DEMO operation and requirements. Having to be DEMO-relevant, HCLL TBMs design will have to be in conformity with the reference choice made for the DEMO HCLL blanket.
2005 ACTIVITIES
2005 activities are dedicated to DEMO hydraulic analysis. In the current HCLL DEMO blanket module design [1] the 80% of the He mass flow circulates in the FW and the 20% in the SPs (figure 1). The needed mass flow distribution will rely on the use of appropriate diaphragms aiming to equalize the pressure drops in these components. The dimensioning of these diaphragms, as well their manufacturing tolerance could affect in a significant way the cooling efficiency. However, in the HCPB design, the different elements are cooled in series, leading to different geometrical characteristics for the FW and the SP design. In the present study, 3 different configurations have been analysed in terms of thermal hydraulic performance. This means that, the criteria to satisfy are expressed in terms of temperature and the ratio between the pumping power and the fusion thermal power.
- Tmax < 550°C - temperature interface Eurofer / Lithium Lead < 500°C - power ratio = Pumping power / fusion thermal power < 10%
Figure 1: Helium flow scheme
In former analysis, the Dittus-Bolter correlation was used in the thermal design. However, intrinsically, this correlation can not be applied to helium first due to its Prandtl number but also due to its Reynolds range. Therefore, bibliographic analyses of Nusselt correlation that can be used for helium have been performed. Three different correlations have been found, a gas correlation [3], the Mac Eligot [4] correlation and the Gnielinski correlation [5]. The figure 2 plotted the ratio of this new Nusselt correlation to the Dittus-Bolter correlation. It appears that the Dittus-Bolter correlation over estimate the Nusselt coefficient at least by 1.15 times. This over estimation is very pronounced for low Reynolds number.
Figure 2: Nusselt ratio
103
104
105
106
0.6
0.65
0.7
0.75
0.8
0.85
0.9
0.95
1Nusselt divided by Nusselt Dittus Bolter correlation
reynolds
Nu
/ N
uDB
TI / DB Mac Eligot / DBGnielinski / DB

- 210 - EFDA Technology / Tritium Breeding and Materials / Breeding Blanket / HCLL blanket
The following design used the Gnielinski correlation which covers the range of validity 2300 < Reynolds < 10+6 and 0.5 < Prandtl < 10+5, which is, according to Bejan [6], accurate within ± 10 %. HCPB GEOMETRICAL DIMENSIONS OF FIRST WALL AND STIFFENING GRID Dimensions have been found in the HCPB TBM design [2]. They are presented in table 1.
Table 1: Main HCPB dimensions in mm
thickness channels FW 30 (5 – 16 – 9) 16 x 12.5 SG 11 (2.5 – 6 – 2.5) 6 x 10
MAIN GEOMETRICAL ASSUMPTIONS One module contains 9 toroidal by 8 poloidal breeder units. The lithium lead in the breeder volume is a constant so that the radial (800 mm), toroidal (208 mm), poloidal (208 mm) are preserved. The first wall thickness and cooling plate thickness are preserved. First wall: single pass, counter flow or parallel flow. Stiffening plates: Four passes, 3 U turns. Cooling plates: Four passes, 3 U turns. MAIN ASSUMPTIONS FOR THE THERMAL STUDY Helium at 8 MPa pressure and 300-500°C inlet and outlet temperatures is used as coolant. Helium is supposed to be a compressible gas under low Mach number assumption [4]. Surface heat flux on FW is 0.5 MW.m-2. Neutron Wall Loading is 2.4 MW.m-2. The pumping power is calculated according to the following formulae:
T
p
p mW
ρη∆∆ =
&
Where ∆p is the pressure drops in the module, Tm& is the
mass flow in the module, ρ the density at the pump inlet admission and ηp, the pumping efficiency (0.87). Nusselt number is estimated using the Gnielinski correlation. Heat from lithium lead is recovered by FW, SP, and CP using a global transfer coefficient, ratio of the product of the global heat transfer coefficient by the wetted surface to the sum of global transfer coefficient.
ig i
i FW SP CPg FW g SP g CP
h S
h S h S h Sα =
+ +
Pressure drops are computed by integrating the conservation of momentum for a compressible ideal gas element, using the low Mach approximation. The total pressure drops is the sum of the friction loss, the compressible loss and the singularity loss. This leads to the following expression:
2
1
11 1 1 1
1 ( )2
Nf N n
T f c s nn
P L T TRT m Tp p p p f T
p A A T T Tς
=
∆ = ∆ + ∆ + ∆ = + − +
∑&
Where T is the temperature in Kelvin degree, p is the pressure, f is the fanning friction factor, Pf is the wetted perimeter, A the wetted surface, L the channel length, ζ the singularity pressure drop coefficient. DESCRIPTION OF THE STUDIED CONFIGURATIONS Three configurations have been analysed. The main geometrical characteristics of the module components, FW, SP and CP are presented in table 2. He enters from the rear through two inlet tubes of 140 mm internal diameter. It is spread out in the first chamber (between BP1 and BP2) to feed the FW channels. After cooling this component, He exits in the 2nd chamber, between the BP2 and the BP3, cooled the SP and the covers and exit in the 3rd chamber.
Table 2: Studied configurations presentation
configuration Thickness decomposition channels pitch decomposition inlets Parallel 25 4 + 14 + 7 14 x 15.6 21.6 15.6 + 6 82 Series 1 25 3 + 15 + 7 15 x 16 21.9 16 + 5.9 82 First Wall Series 2 25 3 + 15 + 7 15 x 16 21.9 16 + 5.9 82 Parallel 8 2.5 + 3 + 2.5 3 x 10 11.125 9 + 2.125 4 Series 1 11 2.5 + 6 + 2.5 6 x 12 14.83 12 + 2.83 3 Stiffening Plates Series 2 11 2.5 + 6 + 2.5 6 x 9 11.125 9 + 2.125 4 Parallel 6.5 1 + 4.5 + 1 4.5 x 4.5 6.4 4.5 + 1.9 8 Series 1 6.5 1 + 4.5 + 1 4.5 x 4 6.4 4 + 2.2 8 Cooling plates Series 2 6.5 1 + 4.5 + 1 4.5 x 4 6.4 4 + 2.2 8

- 211 - EFDA Technology / Tritium Breeding and Materials / Breeding Blanket / HCLL blanket
Table 3: Dimensions, deposited power and total mass flow for the studied configuration
Configuration Dimensions (r x t x p) in m Deposited power MW Total mass flow kg s-1 Pressure drop (MPa) Power ratio
Parallel 0.8 x 1.996 x 1.79 10.32 9.95 0.192 3.3 % Series 1 0.8 x 2.02 x 1.811 10.50 10.125 0.347 6.1 % Series 2 0.8 x 2.02 x 1.811 10.56 10.175 0.380 6.7 %
HYDRAULIC RESULTS
Table 4: Presents the main hydraulic results for the 3 configurations
Configuration Deposited
Power (MW)
Recovered power (MW)
Total mass flow
(kg s-1)
Channel mass flow (g s-1)
Pressure drops (MPa)
Tin °C
Tout °C
He average heat transfer coefficient W m-2 K-1
He average velocity
m s-1 Parallel 2.78 3.13 7.96 97.0 0.123 300 375.8 5344.3 71.7 Series 1 2.79 2.91 10.125 123.5 0.163 300 355.4 5921.4 81.6 FW Series 2 2.79 2.90 10.175 124 0.164 300 354.9 5944.3 82.0 Parallel 0.22 1.26 1.99 3.4 0.123 300 422.6 2383.5 19.1 Series 1 0.26 2.45 10.125 23.3 0.114 355.4 402.0 4773.2 55.5 SP Series 2 0.26 2.33 10.175 17.5 0.124 354.9 399.1 4895.2 55.7 Parallel 0.36 5.93 9.95 3.4 0.064 385.1 500 3230.5 32.1 Series 1 0.49 5.15 10.125 3.5 0.069 402.0 500 3282.8 33.1 CP Series 2 0.54 5.32 10.175 3.5 0.091 399.1 500 3670.2 37.3
Then He passes in the BU inlet collectors, circulates in the BUs CPs and it is routed out, through the BUs outlet collectors and the BUs outlet tubes, to the 4rd chamber between the BP4 and the BP5. It leaves the module through 6 outlet pipes of 94 mm diameter. This description highlights the need for an additional chamber, increasing the He inventory but also the shielding effect. According to the prescribed assumptions, the module dimensions, the deposited power and the mass flows are presented in table 3. CONCLUSIONS
Hydraulic and engineering thermal analyses have been carried out. First results are encouraging to consider a series solution. REFERENCES
[1] A Li Puma & al, Helium Cooled Lithium Lead Blanket Module for DEMO – Designs and Analysis, CEA report, DM2/SERMA/LCA/03- 3297. [2] R. Meyder & al, Report on conceptual design of the four TBM’s and related performance analysis, FZK report, FU-TF1.2-03/005/01-R.
[3] J. Huetz and J.P Petit, Notions de transfert thermique par convection, Techniques de l’Ingénieur, A 1540. [4] G. Melese and R. Katz, Thermal and Flow Design of Helium-Cooled Reactors, American Nuclear Society, 1984. [5] V. Gnielinski, New equations for heat and mass transfer in turbulent pipe and channel flow, International Chemical Engineering, vol 16, n°2, pp 359-368, 1976. [6] A. Bejan, Convection Heat Transfer, 2nd Edition, John Wiley and Sons, 1994. TASK LEADER
Franck GABRIEL DEN/DM2S/SERMA CEA-Saclay F-91191 Gif-sur-Yvette Cedex Tel. : 33 1 69 08 79 76 Fax : 33 1 69 08 99 35 e-mail : [email protected]

- 212 - EFDA Technology / Tritium Breeding and Materials / Breeding Blanket / HCLL blanket

- 213 - EFDA Technology / Tritium Breeding and Materials / Breeding Blanket / HCLL blanket
TW5-TTBC-001-D07
Task Title: TBM DESIGN, INTEGRATION AND ANALYSIS DETAILED TBM DEVELOPMENT WORKPLAN UP TO EM-TBM
INSTALLATION IN ITER
INTRODUCTION
In order to be able to install a HCLL Test Blanket Module (TBM) in day 1 of ITER operation (~2015), as envisaged up to now in the testing strategy for EU concepts of breeding blankets, it is necessary to establish both a detailed HCLL TBM development workplan up to EM-TBM fabrication and installation in ITER and a Project technical specification document. These documents will be a basis to identify the activities (on R&D, analyses, needs of out of pile test, supplies and fabrication,…) to be launched, and will help to follow the project taking care of the critical path. The objectives of the deliverable are: i) to produce a detailed HCLL TBM development workplan (MS-Project), and ii) to produce a first version of a Project technical specification document.
2005 ACTIVITIES
The list of all the needed activities (R&D and mock-ups/prototype/TBM production) to be performed before the installation of a HCLL TBM in ITER has been preliminarily established. A provisional time schedule has then be associated to each activity in a first version of a MS-Project development workplan sequencing all foreseen activities. This first workplan has been crossed with the one produced by the HCPB team (FZK), discussed with EFDA, and a common European Work Breakdown Structure (WBS) has been presented to the European TBM ad'hoc group. MS-PROJECT DEVELOPMENT WORKPLAN The first version of the MS-Project development workplan has detailed about 300 elementary tasks. The synthesis in terms of recapitulative tasks is shown on figure 1.
Figure 1: HCLL TBM detailed workplan (synthesis of the recapitulative tasks)

- 214 - EFDA Technology / Tritium Breeding and Materials / Breeding Blanket / HCLL blanket
Figure 2: Possible European TBM project Work Breakdown Structure
EUROPEAN TBM PROJECT WBS Several meetings have been held between TBM project leaders (CEA for HCLL and FZK for HCPB) and EFDA to converge towards a European common position on a possible WBS. This WBS has been presented to the European TBM ad'hoc group, will be discussed during the TBWG meeting, and will be a basic of the risks, planning, costs and resources estimations. View of this WBS up to level 3 is shown on figure 2.
REPORTS AND PUBLICATIONS
[1] J-F. Salavy, Detailed TBM development workplan up
to EM-TBM installation in ITER, CEA report SERMA/RT/06-3816/A, to be issued (2006)
TASK LEADER
Jean-François SALAVY DEN/DM2S/SERMA CEA-Saclay F-91191 Gif-sur-Yvette Cedex Tel. : 33 1 69 08 71 79 Fax : 33 1 69 08 99 35 e-mail : [email protected]
1.EU TBMs Project
1.EU TBMs Project
1.1Test Blanket
Modules
1.1Test Blanket
Modules
1.2Test & Ancillary
Systems
1.2Test & Ancillary
Systems
1.3Predictive tools &
performances validation in ITER
1.3Predictive tools &
performances validation in ITER
1.4Safety &
Licensing
1.4Safety &
Licensing
1.5TBM systems
integration & tests
1.5TBM systems
integration & tests
1.6Project
management & tech. coordination
1.6Project
management & tech. coordination
1.1.1HCLL/HCPBTBMs design
1.1.1HCLL/HCPBTBMs design
1.1.2HCLL/HCPB MU design
1.1.2HCLL/HCPB MU design
1.1.3HCLL/HCPB
TBMs materials
1.1.3HCLL/HCPB
TBMs materials
1.1.4TBMs
fabrication
1.1.4TBMs
fabrication
1.2.1Test facilities manuf../upgr.
1.2.1Test facilities manuf../upgr.
1.2.2HCLL/HCPB
Helium Cooling Systems
1.2.2HCLL/HCPB
Helium Cooling Systems
1.2.3HCLL/HCPB
Tritium Extraction Syst.
1.2.3HCLL/HCPB
Tritium Extraction Syst.
1.2.4HCLL PbLi loop
1.2.4HCLL PbLi loop
1.2.6HCLL/HCPB
Port Cell integration
1.2.6HCLL/HCPB
Port Cell integration
1.3.1HCLL/HCPB EM
1.3.1HCLL/HCPB EM
1.3.2HCLL/HCPB
Thermal-hydrau/mecha
1.3.2HCLL/HCPB
Thermal-hydrau/mecha
1.3.3HCLL/HCPB Neutronics
1.3.3HCLL/HCPB Neutronics
1.3.4HCLL/HCPB Tritium cycle
1.3.4HCLL/HCPB Tritium cycle
1.3.5HCLL MHD
1.3.5HCLL MHD
1.3.6HCPB Pebble
bed mecha
1.3.6HCPB Pebble
bed mecha
1.4.1HCLL/HCPB
Safety analyses
1.4.1HCLL/HCPB
Safety analyses
1.4.2HCLL/HCPB Licensing
1.4.2HCLL/HCPB Licensing
1.5.1HCLL/HCPB
DDDs
1.5.1HCLL/HCPB
DDDs
1.5.2HCLL/HCPB
CAD
1.5.2HCLL/HCPB
CAD
1.5.3HCLL/HCPB Mock-ups
systems tests
1.5.3HCLL/HCPB Mock-ups
systems tests
1.5.4HCLL/HCPB TBM tests
1.5.4HCLL/HCPB TBM tests
1.6.1Project
management
1.6.1Project
management
1.6.2Project tech. coordination
1.6.2Project tech. coordination
CommonCommon
HCLLHCLL
HCPBHCPB
1.4.3HCLL/HCPB
Codes & Standards
1.4.3HCLL/HCPB
Codes & Standards
1.EU TBMs Project
1.EU TBMs Project
1.1Test Blanket
Modules
1.1Test Blanket
Modules
1.2Test & Ancillary
Systems
1.2Test & Ancillary
Systems
1.3Predictive tools &
performances validation in ITER
1.3Predictive tools &
performances validation in ITER
1.4Safety &
Licensing
1.4Safety &
Licensing
1.5TBM systems
integration & tests
1.5TBM systems
integration & tests
1.6Project
management & tech. coordination
1.6Project
management & tech. coordination
1.1.1HCLL/HCPBTBMs design
1.1.1HCLL/HCPBTBMs design
1.1.2HCLL/HCPB MU design
1.1.2HCLL/HCPB MU design
1.1.3HCLL/HCPB
TBMs materials
1.1.3HCLL/HCPB
TBMs materials
1.1.4TBMs
fabrication
1.1.4TBMs
fabrication
1.2.1Test facilities manuf../upgr.
1.2.1Test facilities manuf../upgr.
1.2.2HCLL/HCPB
Helium Cooling Systems
1.2.2HCLL/HCPB
Helium Cooling Systems
1.2.3HCLL/HCPB
Tritium Extraction Syst.
1.2.3HCLL/HCPB
Tritium Extraction Syst.
1.2.4HCLL PbLi loop
1.2.4HCLL PbLi loop
1.2.6HCLL/HCPB
Port Cell integration
1.2.6HCLL/HCPB
Port Cell integration
1.3.1HCLL/HCPB EM
1.3.1HCLL/HCPB EM
1.3.2HCLL/HCPB
Thermal-hydrau/mecha
1.3.2HCLL/HCPB
Thermal-hydrau/mecha
1.3.3HCLL/HCPB Neutronics
1.3.3HCLL/HCPB Neutronics
1.3.4HCLL/HCPB Tritium cycle
1.3.4HCLL/HCPB Tritium cycle
1.3.5HCLL MHD
1.3.5HCLL MHD
1.3.6HCPB Pebble
bed mecha
1.3.6HCPB Pebble
bed mecha
1.4.1HCLL/HCPB
Safety analyses
1.4.1HCLL/HCPB
Safety analyses
1.4.2HCLL/HCPB Licensing
1.4.2HCLL/HCPB Licensing
1.5.1HCLL/HCPB
DDDs
1.5.1HCLL/HCPB
DDDs
1.5.2HCLL/HCPB
CAD
1.5.2HCLL/HCPB
CAD
1.5.3HCLL/HCPB Mock-ups
systems tests
1.5.3HCLL/HCPB Mock-ups
systems tests
1.5.4HCLL/HCPB TBM tests
1.5.4HCLL/HCPB TBM tests
1.6.1Project
management
1.6.1Project
management
1.6.2Project tech. coordination
1.6.2Project tech. coordination
CommonCommon
HCLLHCLL
HCPBHCPB
1.4.3HCLL/HCPB
Codes & Standards
1.4.3HCLL/HCPB
Codes & Standards

- 215 - EFDA Technology / Tritium Breeding and Materials / Breeding Blanket / HCLL blanket
TW5-TTBC-002-D01 Task Title: TBM MANUFACTURING R&D - DIADEMO MOCK-UP INTRODUCTION The objective of this task is to produce an HCLL Cooling Plate mock-up using the laser + HIP fabrication process. This mock-up is intended for testing in DIADEMO testing facilities in the frame of the already committed TW2-TTBC-002-D02 deliverable. The laser + fabrication process allows to perform very small cooling channels (4 x 4.5 mm², with a 1.5 mm rib) without having the welds facing the Li-Pb bath. In a first step, very thin strips are laser welded on the top of grooves; then a second supplementary plate is HIP welded on the strips. First laser welds were carried out in 2004 (with 100 mm long channels). In 2005, it is engaged the fabrication of a more than 400 mm long mock-up (the HCLL mock-up for DIADEMO), in order to assess, in an experimental loop, the thermo-mechanical under DEMO relevant operation conditions. 2005 ACTIVITIES The mock-up to fabricate is shown in figure 1. The length of the mock-up is 444 mm. There is just one He loop through the plate. This mock-up is built with the EUROFER steel. Figure 1: The (laser+HIP) HCLL mock-up for DIADEMO
There are 16 straight cooling channels: 8 cooling channels are bringing He toward the end of the extremity of the mock – up (end cap); the other channels are bringing back the warmed He. This mock-up can be divided into three main parts: the manifold cap, the plate with channels and the end cap. The plate with channels is built with the laser +
HIP process; the manifold and end caps are bolted to the plate with channels, with a TIG weld for tightness.
Figure 2: Longitudinal cross section of the (laser + HIP) mock-up for DIADEMO
FABRICATION ROUTE To fabricate this mock-up, we have to go onto the following steps: - optimisation of the welding sequence : this step is to
fix the welding parameters in order to get sound welds without welding defects (cracks) and in order to minimize the welding distortions;
- machining of the plate with channels, laser welding of a thin plate on each cooling channel, visual, dimensional and tightness controls;
- HIP welding on the laser welds, dimensional control and machining;
- Manifold and end caps machining; - Inlet and outlet tubes machining; - TIG welding of the inlet and outlet tubes on the
manifold cap; - TIG welding, for tightness, of the manifold and end
caps on the plate with channels; - Non destructive tests (radiography, tightness); - Test with pressure in the mock-up before a final
tightness test. STEP 1: LASER WELDING SEQUENCE OPTIMISATION To get the cooling channels with the laser welding process, we have to (figure 3): - machine a thick plate (1); - machine thin plates (2);

- 216 - EFDA Technology / Tritium Breeding and Materials / Breeding Blanket / HCLL blanket
- bring the thin plates into the thick plates; - carry out a tack welding sequence; - weld the thin plates.
Figure 3: Fabrication of the cooling channels in welding thin plates on a machined back plate
The first welding tests without an adapted clamping device lead to: - small cracks on the tack welds (figure 4); - a 0.4 mm deformation of the 100 x 120 mm² welded
samples.
Figure 4: First welding tests – cracks on the tacks welds To avoid the cracks, we changed the laser welding parameters. In increasing the time to get the maximum laser
power (at the beginning and the end of the tack welds), we avoid the cracking. To reduce the welding distortions, we weld with an adapted clamping device: we bolt the welding samples on a thick plate (20 mm wall thickness). We have welded two 100 x 120 mm² samples (figure 5). No cracks are found at the visual inspection with the binocular magnifying glass. The welding distortion of these samples is less than 0.1 mm.
Figure 5: Optimisation of the welding sequence - view of the top of a welded sample
STEP 2: MACHINING AND LASER WELDING OF THE MOCK-UP FOR DIADEMO The mock-up to weld for DIADEMO is shown in figure 6. A specific clamping device is machined with the mock-up.
Figure 6: Mock-up to weld for DIADEMO Before welding, all the parts to weld are cleaned with alcohol. Then the thin plates are put into the base plate (the wall thickness of these plates is 0.8 mm). The tacking sequence begins at one mock-up’s extremity. Tacking is
Laser weld
(1)
(2)
crack
384 mm
Heat Exchanger for ITER

- 217 - EFDA Technology / Tritium Breeding and Materials / Breeding Blanket / HCLL blanket
carried out on each thin plate: the length of these welds is about 5 mm. We weld with a 4006 HL TRUMPF cw-YAG laser. The laser power applied for the tack welds is 900 W at the welding speed of 3 m/min, with a 200 mm collimating lens and 150 mm focusing lens. 12 X 32 tacks are welded (figure 7).
Figure 7: Tacking on the mock-up for DIADEMO After tacking, the mock-up is laser welded. The laser head is aligned on each joint. After each welding pass, the weld is observed: if no defect is seen, the welding of the mock-up goes on (figure 8). The laser power applied to weld the mock-up is 2400 W; the welding speed 6 m/min.
Figure 8: The mock-up for DIADEMO after laser welding. After welding, the mock-up is prepared to undergo the HIP welding step. To perform this step, we need to machine the top of the mock-up (that’s why we need to have the minimum of welding distortions). After removing the mock up from the clamping tool, the distortion was about 0.5mm. It has been reduced to 0.2mm by stress relieving at 750°C.
STEP 3: HIP WELDING OF THE COVER PLATE First, the surface of the strips are machined in order to remove the surface oxidation due to welding and to decrease the thickness of the strips down to 0.5 mm. Then, the fixing holes are machined. Figure 9 shows the base plate after machining. The HIP step consists in joining a plain cover on the top on the base plate surface. This step is in progress.
Figure 9: Base plate with welded strips after machining
CONCLUSIONS Experiments made with reduced size plates have allowed the definition of adequate welding parameters and sequence. Then, the diademo mock-up base plate has been laser welded, stress relieved and machined in view of HIP diffusion welding. TASK LEADER Guillaume DE DINECHIN DRT/DTH/UTIAC CEA-Saclay F-91191 Gif-sur-Yvette Cedex Tel. : 33 1 69 08 17 87 Fax : 33 1 69 08 90 23 e-mail : [email protected]

- 218 - EFDA Technology / Tritium Breeding and Materials / Breeding Blanket / HCLL blanket

- 219 - EFDA Technology / Tritium Breeding and Materials / Breeding Blanket / HCLL blanket
TW5-TTBC-005-D01
Task Title: TBM DESIGN, INTEGRATION AND ANALYSIS TBM HCLL INSTRUMENTATION DEFINITION
INTRODUCTION
The TW5-TTBC-005-D01 deliverable was aimed at identifying and analysing the sensors to be installed in the HCLL TBM (Helium Cooled Lithium Lead Test Blanket Module) during ITER operational phases, in order to validate the mechanical behaviour and monitoring the main parameters. In particular, the objectives were: - To define, on the test objectives basis, the measurements
to perform. - To identify, on the geometry design basis, the
localisation of the sensors and the environmental conditions.
- To evaluate the feasibility of the measurements chains to
collect data necessary for codes validations. - To identify the needed developments and specific
environmental testing. - To define a list of potential sensors and the associated
monitoring and electronic devices. 2005 ACTIVITIES
TEST CAMPAIGNS OBJECTIVES AND REQUESTED DATA MEASUREMENT ASSOCIATED Requested data measurement associated to the expected test campaigns objectives are related to structural resistance, operational capabilities, helium thermal-hydraulics, Lithium/Lead magneto-hydro-dynamics, Tritium transport and permeation, Tritium production during D-T phase and Corrosion by LiPb. A distinction has to be made between the sensors needed for TBM monitoring (the requested typical data being structure temperature, He pressure, displacements/accelerations of the structure) and the sensors related to the experiments foreseen within the TBM that have to be identified in relation with the test programs. ENVIRONMENTAL CONDITIONS TO BE WITHSTOOD BY SENSORS The list of environmental conditions has been established. It includes: magnetic field, high electromagnetic fields, gamma and neutron radiation from plasma, shocks during disruptions, high temperature, high Helium pressure, high Helium speed, corrosion by the PbLi, very limited
available room inside the TBM, and activation by neutrons. LIST OF AVAILABLE SENSORS AND IDENTIFICATION OF REQUESTED QUALIFICATION/DEVELOPMENT The temperature sensors have been evaluated first. - Optical fibre technology (FiberBragGrating / Fabry
Perrot) could be used at the beginning of the test but needs improvements to perform under gamma-neutron radiation and high temperature. Exposing optical fibres to ionizing radiation result in a wavelength-dependent attenuation increase. Even if published data on radiation effects on optical fibres show that SI fibres with nominally pure-silica cores are good radiation resistant, Ge-doped silica-core fibres have been shown to be inferior to pure-silica core fibres when irradiated. They are so strictly limited to grating area. Nevertheless, tests performed in BR2 MTR reactor show a bad behaviour if temperature exceeds 100°C. In our range of temperature interest, FBR are specially fabricated with metallic coated (no magnetic).
They need a coupling fluid in order to limit contact and deformations. Because of their miniaturization and large capabilities, they could be used at the beginning in parallel with thermocouples in order to monitor deviation. - Even with grounding and cladding (wires arranged in
twisted pairs and inserted in a metal tube) data from classical thermocouple are difficult to process during HF heating. Nevertheless, concluding experiments are related for the divertor of the JET. They should be used as a baseline for temperature monitoring. Accuracy: some degrees.
For thermocouples, the best way will be to fix them directly to the thimbles. The following figures show examples of temperature measurements performed in the JET fusion device.
Figure 1: From EFDA-JET Bulletin Autumn 2000

- 220 - EFDA Technology / Tritium Breeding and Materials / Breeding Blanket / HCLL blanket
Figure 2: Detail of a T measurement during HF Heating (JET) showing a good behavior
Heating begins at time 40. From 30 to 40, deviation is related to magnetization.
- Integration in TBM via Thimbles have been
considered first. They act as a low frequency filter (one second with He as coupling gas during a disruption). This is the baseline for FBG. Pressure compensation has to be done.
Figure 3: He temperature in thimbles after a disruption
CONCLUSIONS
Because of their large capabilities and reports on their good behaviour under both gamma/neutron radiations, FBG have been evaluated with confidence. It was found that this good behaviour can’t be achieved with temperatures higher than 90°C under irradiation. They also need to be thermally coupled (with a gas for example) and so compensated in pressure because of their sensitivity to stress. Even if they need some (lot of) cares, thermocouples are related to work well in JET divertor. Our recommendation is to use thermocouples as a baseline for temperature measurement and FBG as strain gages during commissioning. REPORTS AND PUBLICATIONS
[1] F. Witters, “ITER TBM instrumentation”, technical
note DTN/STPA/LTCG/2005-077, to be issued TASK LEADER
Gilles RAMPAL DEN/DM2S/SEMT CEA-Saclay F-91191 Gif-sur-Yvette Cedex Tel. : 33 1 69 08 41 44 Fax : 33 1 69 08 94 26 e-mail : [email protected]

- 221 - EFDA Technology / Tritium Breeding and Materials/ Structural Materials Development / RAFM steels
TW2-TTMS-001b-D02
Task Title: IRRADIATION PERFORMANCE NEUTRON IRRADIATION TO 70 dpa AT 325°C AND PIE
INTRODUCTION
The main objective of this experiment is to study the irradiation behaviour of Reduced Activation Ferritic/Martensitic (RAFM) steels, in particular the European reference Eurofer 97, at high doses and for irradiation temperatures lower than 400°C, where materials are susceptible to reach a high level of hardening and embrittlement.
For this purpose, irradiations experiments were conducted in the BOR60 reactor of the Research Institute of Atomic Reactors (RIAR, Dimitrovgrad, Russia) at 325°C.
This task includes two items:
a) The Post Irradiation Examinations (PIE) corresponding to specimens irradiated up to 42 dpa in “ALTAIR” experiment (1st phase) that finished in 2002.
b) A 2nd phase of irradiation named “ARBOR 2” (FZK-CEA joint experiment) performed in the same reactor for 40 dpa at the same temperature.
2005 ACTIVITIES
Specimens included in ALTAIR irradiation experiment have reached a dose ranging from 32 dpa up to 42 dpa. The corresponding PIE was conducted in the hot cells of RIAR. The profilometry of pressurized tubes, to determine the irradiation creep modulus, was presented in the Annual Report of the Association EURATOM-CEA 2004. Tensile and Charpy tests as well as fractographic examinations were completed in the first half 2005. On the other hand, ARBOR 2 experiment, started in january 2003 and finished on may 2005 according to the initial schedule. The doses reached ranged from 30 to 41 dpa, giving a total dose of 65-80 dpa in samples previously irradiated in ALTAIR experiment.
PIE OF SPECIMENS IRRADIATED IN ALTAIR EXPERIMENT
The irradiation in the BOR60 reactor was performed at 325±5°C for doses ranging from 32.5 to 42.3 dpa. The following materials were irradiated as specimens for mechanical tests: RAFM steels EUROFER (9Cr-1W-0.18V-0.15Ta) and 9Cr2WTaV (9Cr-2W-0.24V-0.08Ta), the advanced alloy ODS-MA957 (Fe-14Cr-1Ti-0.3Mo-0.25Y2O3), and conventional martensitic steels, 9Cr-1Mo and 9Cr-1MoVNb. Tensile tests were performed at 20 and 325°C using a strain-rate of 1.4x10-3.s-1 on specimens of 2 mm diameter and 12 mm gauge length. Impact properties were determined with Charpy-V subsize specimens of
3x4x27 mm3 with T-L orientation. Details are given in ref. [1], [2].
TENSILE TESTS Irradiated specimens were tested at 20°C and at the irradiation temperature (325°C). Tests were also performed on control (unirradiated) samples for comparison. The tensile curves of RAFM steels and ODS alloys are compared to those of commercial martensitic steels, standard 9Cr1Mo (EM10) and modified 9Cr1MoVNb (T91), irradiated in the same conditions as shown in figure 1.
Figure 1: Stress-strain curves of 9Cr-martensitic steels irradiated up to 42 dpa at 325°C in BOR60 reactor
compared to the unirradiated condition All materials display irradiation-induced hardening, determined by the increase of the yield stress, but the magnitude depends on the material. The increase of tensile strength is associated to a reduction of the ductility also depending on the material. The highest hardening-level at 40-42 dpa was reached for 9Cr1MoVNb and 9Cr1Mo conventional steels, whereas RAFM-steels, EUROFER and 9Cr2WTaV, exhibited lower hardening. These 9%Cr-martensitic materials presented quite similar tensile properties before irradiation, but they evolved in a different manner during irradiation. The comparison of data from BOR60 and irradiation experiments performed in OSIRIS (CEA) and SM2 (RIAR) reactors allows evaluating the effects of dose on the evolution of the tensile properties up to 42 dpa. The dose dependence of irradiation-induced hardening, measured by the increase of the yield-stress, is shown in figure 2. A very rapid increase of hardening is observed for all materials up to about 10 dpa with a continuous decrease of the hardening-rate; beyond this value there could be a tendency to saturation in the case of 9Cr1Mo steel. Data obtained at high dose (32.5-42.3 dpa) for EUROFER and
0
200
400
600
800
1000
1200
1400
1600
0 2 4 6 8 10 12 14 16 18 20Strain (%)
Stre
ss (M
Pa)
Unirradiated
9Cr1Mo
EUROFER
9Cr1MoVNb
9Cr1Mo
EUROFER
9Cr2WTaV
Irradiated at 325°C
32 - 42 dpa
TENSILE CURVES DETERMINED AT 20°C

- 222 - EFDA Technology / Tritium Breeding and Materials/ Structural Materials Development / RAFM steels
9Cr2WTaV seem to follow the same trend of F82H and JLF-1 at low dose (<15 dpa). Therefore, the behaviour of all RAFM steels is represented by a unique curve.
0
100
200
300
400
500
600
700
800
0 10 20 30 40 50
9Cr1Mo
9Cr1MoVNb
F82H
JLF-1
EUROFER
9Cr2WTaV
ODS-MA957
Incr
ease
of Y
ield
Str
ess
(MP
a)
Dose (dpa)
9Cr1MoVNb
9Cr1Mo
RAFM steels
ODS-MA957
Ttest
= Tirrad = 300-325°C
Figure 2: Evolution of the irradiation-induced hardening at 300-325°C, measured by the increase of the yield stress, as
a function of the dose. Data obtained from experiments performed in OSIRIS (1 - 9 dpa), SM2 (8 – 14 dpa) and
BOR60 (32 – 42 dpa) reactors. The increase of tensile strength is associated with a ductility drop given by the decrease of total and uniform elongation as well as the reduction-in-area values. As shown in figure 3, the total elongation of RAFM steels for low doses decreases much faster than that of the 9Cr1Mo standard. Above 15 dpa the ductility loss of RAFM steels seems to be stabilized whereas the total elongation of 9Cr1Mo continues to decrease to reach very poor values (<2%), especially for tests performed at 20°C. However, a nearly saturated hardening is detected for 9Cr1Mo by 10 dpa. Regarding the uniform elongation, very low levels in the range 0.3-0.5% were obtained at both test temperatures for RAFM and 9Cr1MoVNb steels since 2 dpa, but 9Cr1Mo preserves higher values of uniform elongation up to 10 dpa. It is worthwhile to notice the interesting behaviour of the ODS-Fe14%Cr ferritic alloy. This material exhibited the lowest hardening (430 MPa) and the highest values of total and uniform elongation at 42 dpa confirming the trend previously observed at lower doses in OSIRIS experiments.
0
5
10
15
20
25
0 10 20 30 40 50
9Cr1Mo F82H
JLF-1
EUROFER
9Cr2WTaVODS-MA957
9Cr1MoVNb
Tot
al e
long
atio
n (%
)
Dose (dpa)
Ttest
= 20°C
(Tirrad
= 300-325°C )
RAFM steels
Figure 3: Dependence of the total elongation with the dose.
Data, obtained at room temperature, from experiments performed in OSIRIS (1 - 9 dpa), SM2 (8 – 14 dpa) and
BOR60 (32 – 42 dpa) reactors.
IMPACT PROPERTIES OF 9Cr MARTENSITIC STEELS The irradiation-effects on impact properties were investigated on EUROFER, 9Cr2WTaV and 9Cr1Mo irradiated in BOR60. Energy transition curves, determined from Charpy tests, are shown in figure 4 for irradiated and unirradiated conditions. Before irradiation, the Ductile-Brittle Transition Temperature (DBTT) was about -100°C/-80°C for these materials. After irradiation at 325°C, an important degradation of impact properties, i.e., an increase of the DBTT associated with a significant decrease of the Upper Shelf Energy (USE) values, is observed for all materials. The DBTT-shift is about 150°C for 9Cr2WTaV (32.5dpa), 200°C for EUROFER (42 dpa), about 250°C for 9Cr1Mo (40 dpa). The last material also exhibits a huge degradation of the USE. Similar behaviour was found for 9Cr1MoVNb steel. RAFM steels present a lower degree of irradiation-induced embrittlement compared to 9Cr1Mo-type conventional steels in agreement with the behaviour of tensile properties.
0
2
4
6
8
10
12
-200 -100 0 100 200 300 400 500
EUROFER 9Cr2WTaV 9Cr1Mo
Ene
rgy
( J)
Temperature (°C)
IRRADIATED
UNIRRADIATED
Figure 4: Comparison of impact properties of EUROFER, 9Cr2WTaV and 9Cr1Mo steels in the unirradiated
condition and after irradiation in BOR60 reactor at 325°C for 32-42 dpa.
On the other hand, the present results illustrate the important effect of irradiation-temperature on the irradiation behaviour of materials. Figure 5 shows the dependence of DBTT values with the irradiation temperature determined for different ferritic-martensitic steels from experiments performed in PHENIX reactor at high doses (70-100 dpa). In particular, 9Cr1Mo-(EM10) conventional steel exhibited very stable mechanical properties in the range 380-550°C, where the DBTT values were lower than room temperature after irradiation. This behaviour is in contrast with that observed below 380°C, where the magnitude of hardening and embrittlement strongly increases with the decreasing irradiation temperature. Consequently, these results put forward the dominant effect of the irradiation-temperature on materials behaviour and show the important degree of induced-hardening and embrittlement that could be expected for temperatures lower than 400°C. This fact is an important concern for applications of 9Cr-martensitic steels in this range of temperatures.

- 223 - EFDA Technology / Tritium Breeding and Materials/ Structural Materials Development / RAFM steels
-100
0
100
200
300
300 350 400 450 500 550 600
DB
TT
(°C
)
IRRADIATION TEMPERATURE (°C)
17%Cr
12%Cr
9%Cr1Mo
Unirradiated
BOR60
9Cr1Mo(40 dpa)
EUROFER(42 dpa)
Phenix : 70 - 110 dpa
Figure 5: Dependence of DBTT values with the irradiation temperature. Comparison of data obtained from Phenix
experiments (J.L. Séran et al. , JNM 212-215 (1994) 588) and the present work.
CONCLUSIONS
The irradiation behaviour of EUROFER-9Cr1WTaV, other RAFM martensitic steels, 9Cr1Mo conventional steels and ODS-Fe-14%Cr was studied after neutron irradiations performed at 325°C in BOR60 fast-reactor for high doses (32-42 dpa). The main conclusions are: - Significant irradiation-induced hardening was obtained
for all materials after irradiation at 325°C up to 42 dpa, the highest level was reached for 9Cr1Mo-type steels.
- At high dose, EUROFER and 9Cr2WTaV RAFM-
steels preserved a significant total elongation level. But, a continuous ductility loss with the dose was observed for 9Cr1Mo steels.
- Irradiation at 32-42 dpa induced a very important
DBTT-shift for all materials, 150-200°C for RAFM steels, 250°C for 9Cr1Mo alloys, associated with a decrease of USE-level.
- In general, a better behavior was found for RAFM-
9CrWTaV martensitic steels, which displayed lower level of hardening and embrittlement compared to conventional steels.
- EUROFER, 9Cr2WTaV and 9Cr1Mo martensitic steels
presented a very low irradiation-creep deformation (less than 1%) after irradiation for 63 dpa at 325°C.
- For temperatures lower than 400°C, the hardening and
embrittlement of 9Cr-steels are strongly determined by the irradiation-temperature. However, their magnitude seems to depend also on the chemistry and the metallurgical condition of steels.
- In spite of its high-Cr content, ODS-Fe14%Cr
presented the lowest hardening-level and high residual ductility after irradiation at 42 dpa.
REPORTS AND PUBLICATIONS
[1] A. Alamo, P. Wident, V. Shamardin, “Post-
irradiation examinations of materials irradiated in BOR 60 reactor at 325°C up to 42 dpa. Final Report TW2-TTMS-001b-D02, CEA report DMN/SRMA/N.T. SRMA 2006-, march 2006.
[2] A. Alamo, J.L. Bertin, P. Wident, V. Shamardin,
“Mechanical properties of 9Cr martensitic steels and ODS-FeCr alloys after neutron irradiation at 325°C up to 42 dpa”, oral communication ICFRM-12, Santa Barbara, US, Dec.4-9 2005, to be published in J. of Nuclear Materials.
TASK LEADER
Ana ALAMO DEN/DMN/SRMA CEA-Saclay F-91191 Gif sur Yvette Cedex Tel. : 33 1 69 08 67 26 Fax : 33 1 69 08 71 67 e-mail : [email protected]

- 224 - EFDA Technology / Tritium Breeding and Materials/ Structural Materials Development / RAFM steels

- 225 - EFDA Technology / Tritium Breeding and Materials/ Structural Materials Development / RAFM steels
TW2-TTMS-004b-D01
Task Title: QUALIFICATION OF FABRICATION PROCESSES TUBING PROCESS QUALIFICATION: ADVANCED PROCESS
DEVELOPMENT AND TESTING FOR THE PRODUCTION OF TBM’S COOLING CHANNELS
INTRODUCTION
Fusion reactor blankets are structures cooled by internal channels. The preferred fabrication process is Hot Isostatic Pressing – Diffusion Welding. Reduced activation ferritic-martensitic steel plates and tubes are used as starting material. The objective of this study is to define and qualify suitable process for the fabrication of the tubes, with a particular emphasis on rectangular tubes that might be used for the fabrication of the first wall of the modules. 2005 ACTIVITIES
At the beginning of the study, rectangular tubes made of T91 steel were manufactured by hot extrusion and expertised. It was shown that tubes had a poor dimensional accuracy, but both the material microstructure and its mechanical properties were satisfactory, despite a rather large grain size. Cold drawing extruded tubes appeared a promising solution in terms of dimensional accuracy improvement and grain refining. This solution was tried in 2005. FABRICATION OF TUBES The fabrication was subcontracted to Cefival. Cefival was asked to manufacture 3 mm thick tubes made of T91 steel with inner dimensions 12.5x20 mm, short inner and outer radii, as low as possible eccentricity, bow and twist. The delivery condition should correspond to austenitisation 1040-1090°C under controlled atmosphere, air cooling, tempering under controlled atmosphere at 730-780°C for 2 h minimum. Tolerances announced by Cefival were ±0.1 mm for outer dimensions, ±0.15 mm for the thickness and ±0.25 mm for the inner dimensions. As a first step, eight 6 m-long round tubes were extruded by Cefival starting from a T91 grade dia. 140 mm bar. The nominal dimensions of the tubes were dia. 38 mm, thickness 3.8 mm. After extrusion, the tubes were straightened to a bow less than 3 mm/m. They were pickled inside and outside and the outer surface was shot blasted. The as-extruded tubes were not heat treated in order to avoid excessive oxidation (Cefival does not own protective atmosphere furnaces). Cold drawing was subcontracted to Trafiltubi. First, Trafiltubi applied a tempering heat treatment to the tubes (780°C, 1 h). Then, the tubes were cold drawn in three steps using plugs. Intermediate heat treatments were used (again 780°C, 1 h). Finally, the following final heat treatment was applied: austenitisation 1040°C under protective atmosphere, air cooling, followed by tempering 740°C under protective
atmosphere, 30 min, air cooling. Final straightening to less than 1 mm/m was made by Cefival. Four 3 m long tubes are shown on figure 1.
Figure 1: Extruded and cold drawn T91 steel tubes DIMENSIONAL CONTROL The dimensional accuracy of the tubes was measured. The twist defect ranged from 0.6 to 1.1 deg/m and the bow from 0.25 to 0.93 mm/m. These values are not very large, but they are not lower than those measured on as-extruded tubes. A more efficient straightening process is necessary in view of achieving tubes suitable for first wall manufacturing. Three cross section examinations were made on one of the four tubes, which gave the results shown in table 1. The tube thickness is somewhat lower than expected, but its mean value (2.89 mm) lies in the manufacturer’s tolerances. The eccentricity is low. The inner dimensions are about 0.1 mm larger than expected. The accuracy of outer dimensions is very good as far as the large side is concerned, while the short side is about 0.1 to 0.15 mm less than expected. The inner radius is less than 3 mm, as specified, but the outer radius is significantly higher.

- 226 - EFDA Technology / Tritium Breeding and Materials/ Structural Materials Development / RAFM steels
Table 1: Dimensional characteristics of the cross section of the extruded + cold drawn tubes
Tube section 1 2 3 Inner dimensions 12.63 x 20.13 mm 12.64 x 20.13 mm 12.67 x 20.12 mm
Short side thickness 2.96 mm 2.88 mm 2.94 mm 2.89 mm 2.89 mm 2.92 mm large side thickness 2.78 mm 2.99 mm 2.95 mm 2.82 mm 2.90 mm 2.77 mm Outer dimensions 18.40 x 25.97 mm 18.41 x 25.96 mm 18.34 x 25.92 mm
Eccentricity 0.22 mm 0.13 mm 0.11 mm Outer radius (mm) 4.55 4.54 4.57 4.57 4.59 4.58 4.58 4.55 4.55 4.56 4.57 4.56 Inner radius (mm) 1.74 1.61 1.56 1.51 1.51 1.58 1.55 1.77 1.45 1.74 1.56 1.64
MICROSTRUCTURE The surface of the tubes was significantly oxidized, which is not surprising owing to the fact that cooling upon austenitisation and tempering was made under air. More important, two tubes over 5 presented surface cracks (figure 2). They form sets distributed along the tube axis. Sets are separated by 150 to 250 mm-long crack-free zones. More cracks are visible on the large side than on the small side. The crack orientation is more or less longitudinal as far as the longest cracks are concerned. Shorter cracks are oriented at about 45° from the tube axis. Cracked zones turn around the tube axis as shown on figure 3. Despite cracks are easily visible by eye, dye penetrant indications are not very intense. The depth of two among the largest cracks was measured. They were 690 and 540 µm respectively. The most probable explanation is that the damage appeared during straightening of the round as-extruded tubes. This operation involves pushing the tubes between double-cone tools. Some of the tubes were probably less straight than others and the deformation imposed during straightening led to cracking. Cracking would probably have been avoided if the tubes had been tempered before straightening.
Figure 2: Example of surface cracks
Figure 3: Dye penetrant testing of a 200 mm long tube piece showing crack location on the four sides
The microstructure of the material was examined in various locations, both in transverse and longitudinal directions. Except the surface cracks, the material is free from microstructural defects. Despite the surfaces of the tubes are oxidized, there is no evidence of decarburised layer. In the longitudinal direction white bands are sometimes visible. They are probably issued from incomplete homogenisation of δ-ferrite. A much finer microstructure than that of as-extruded material is achieved (figure 4). The grain size of as extruded material was evaluated to be 40-50 µm against 10-15 µm for the extruded and cold drawn material.
Figure 4: Tube microstructure (longitudinal direction) MECHANICAL PROPERTIES The hardness of the material is 273.7±2.2 HV1 in the transverse direction and 274.7±2.1 HV1 in the longitudinal direction. Tensile properties at room temperature and at 550°C were determined using 2 mm thick flat specimens oriented along the tube axis. Despite specimens were machined from a cracked tube, no premature rupture was noticed, probably because the cracks were removed during machining. No significant difference can be noticed between, from one hand, specimens machined from the short and large side of the tubes and, from the other hand, specimens machined from the beginning (B), middle (M) and end (E) of the tube. The standard specifications are fulfilled in all cases (tables 2 and 3) except the room temperature total elongation that, even converted to L0=5.65√S0, is slightly lower than 19% for all the specimens. This was already noticed for as-extruded tubes and was attributed to a possible grain size effect. In the case of extruded + cold drawn tubes, the low ductility is due to inadequate tempering conditions, as can be seen from the results achieved with specimens further tempered at 790°C for 2 h.

- 227 - EFDA Technology / Tritium Breeding and Materials/ Structural Materials Development / RAFM steels
Table 2: Tensile properties of extruded and cold drawn T91 tubes at room temperature. (1) L0=9.7√S0 (2) specimens further tempered at 790°C for 2 h.
B= beginning of extrusion, M=middle, E=end of extrusion.
Side Zone T
(°C) σy
(MPa) σy 0.2% (MPa)
Rm (MPa)
UE (%)
TE1 (%)
TE converted for L0=5.65√S0
RA (%)
B 443 593 774 6.9 14.5 17.8 65 M 554 648 770 6.5 14 17.2 63 Short E 587 660 777 6.1 13.5 16.9 64 B 541 647 775 6.2 14 17.2 64 M 562 644 767 6.5 14.5 17.8 64 Large E
RT
585 655 774 6 14.5 17.8 64 Average values 545±53 641±25 773±4 6.4±0.3 14.2±0.3 17.5±0.4 64±0.5
Standard 20 no spec. >450 630-830 no spec. - 19 no spec. Short2 n/a RT 432 479 643 12.5 22.7 27.9 71 Large2 n/a RT 427 476 639 11.8 22.6 27.8 75
Table 3: Tensile properties of extruded and cold drawn T91 tubes at 550°C. (1) L0=9.7√S0 (2) specimens further tempered at 790°C for 2 h
B= beginning of extrusion, M=middle, E=end of extrusion.
B 394 453 479 1.1 12 14.5 80
M 401 461 483 1.2 12.5 15.4 79 Short
E 410 472 495 1.4 13 16.2 82
B 413 475 498 1.4 11 13.8 80
M 404 465 492 1.5 13 16 81 Large
E
550°C
403 465 488 1.2 12.5 15.6 81
Average values 404±7 465±8 489±8 1.3±0.2 12.4±0.8 15.3±1 80±1.2
Standard 550 no spec. >270 no spec. no spec. - no spec. no spec.
Short2 n/a 550°C 301 337 363 2 15.6 19.2 83
Large2 n/a 550°C 301 337 366 2.5 16.5 20.3 82 CONCLUSIONS
The combination of hot extrusion and cold drawing is a promising way to achieve rectangular tubes suitable for the manufacturing of first wall channels. The microstructure and the mechanical properties of the material are satisfactory. Nevertheless, process improvements are required as regards to the surface condition, the dimensional accuracy and the corner radius. There are indeed some possibilities for improvement, such like the use of a tensile pulling to get rid of twist and bow defects, the use of neutral atmosphere for heat treatment and basic precautions to avoid cracking. REPORTS AND PUBLICATIONS
E Rigal, “Tubing process qualification: advanced process development and testing for the production of TBM’s cooling channels; EFDA task TW2-TTMS-004b-deliverable 1” Final report, Note technique DTEN/DL/2005/042, 18/11/2005.
TASK LEADER
Emmanuel RIGAL DRT/DTH/LTH CEA-Grenoble 17, rue des Martyrs F-38054 Grenoble Cedex 9 Tel. : 33 4 38 78 97 22 Fax : 33 4 38 78 54 79 e-mail : [email protected]

- 228 - EFDA Technology / Tritium Breeding and Materials/ Structural Materials Development / RAFM steels

- 229 - EFDA Technology / Tritium Breeding and Materials/ Structural Materials Development / RAFM steels
TW4-TTMS-006-D03
Task Title: ODS RAFM IMPROVEMENT ELABORATION OF EUROFER ODS STEELS BY INTERNAL
OXIDATION
INTRODUCTION
Previous studies have shown that the milling step under argon for the elaboration of the ODS steel reduces the toughness of these materials. The carbides alignments created by the milling are probably one of the reasons of such embrittlement. The impact properties of the milled & HIPed ODS steels can be improved if thermomechanical treatments are applied [1], but these ones are not always compatible for near-net shaped applications. In order to solve the toughness problem, one could perform mechanical alloying under high purity controlled atmosphere (H2). Hydrogen would reduce both the oxide and carbide formation at the surfaces of the milled powders. However, this solution requires heavy equipment (for safety reasons). Another and more radical solution is to completely avoid the mechanical alloying step. This solution would also make the elaboration process simpler. The aim of the present work is to try to elaborate an ODS steel directly by internal oxidation without milling. 2005 ACTIVITIES
WHY INTERNAL OXIDATION SHOULD BE POSSIBLE We recall that the Eurofer powders are usually milled only in the aim to mix them with the Y2O3 particles. However, Japanese works [1] and our last TEM study [3] have shown that in the Y2O3 ODS steels elaborated by milling + HIP, the Y2O3 are dissolved during the milling step and reprecipitate during the HIP step. In a certain way, the steel is "internally oxidized" during the HIP consolidation. Therefore, it appears possible to internally oxidize Y, if Y can be put in solid solution inside a Eurofer powder. Moreover, many studies report the very good improvements of steels when yttrium is added. For example, in the Fecralloy steel (ferritic steels with Cr, Al and Y) it is well known that the addition of yttrium is the key point to its high temperature performance, excellent oxidation resistance and increased ductility. In Fecralloy steel the solubility of Y is very low (around 0.03%) so that large volume fractions of yttrium containing phase are present in steels containing relatively small amounts of yttrium. These phases are in general YFeq and Y2O3. It is important to note that most commercial Fecralloy wire material contains significant amounts of Y2O3 formed by internal oxidation during pre-oxidation heat treatment process [4]. Moreover, internal oxidation is already known for TiAl-based intermetallics elaborated by elemental powder metallurgy (EPM). This elaboration technique consists in mixing elemental powders (of Ti, Al, Mn etc. with mean size ranging from 7 µm to 74 µm), compact
them in a can and hot-extrude the can at 1250°C with a ratio of 10:1. After removing the can by machining, the material is heat-treated at 1400°C [5]. Due to the high affinity between Y and O and to the limited solubility of these two elements in the matrix, the Y2O3 readily form by internal oxidation during the consolidation process. All these points make us think that an internal oxidation of the Eurofer is also possible, although such an idea has never been tested before to our knowledge. FEASIBILITY PROPOSITION A feasibility program was proposed to elaborate a new 0.3% Y2O3 ODS steel. It relies on the possibility to put Y in solid solution in the Eurofer powders and then oxidize it. The elaboration was thought to be performed in several steps: (1) Three atomisations of Eurofer + Y (+ Fe2O3 + Ti) were realised: A. Eurofer + Y + Fe2O3: 5 kg Eurofer + 15 g Y + 14 g Fe2O3
B. Eurofer + Y + Fe2O3 + Ti: 5 kg Eurofer + 15 g Y + 14 g Fe2O3 + 13 g Ti C. Eurofer + Y + Ti: 10 kg Eurofer + 30 g Y + 26 g Ti
The role of the Fe2O3 oxides in powders A and B was to bring oxygen to the steel to allow a direct internal oxidation without further oxidation heat treatments. In case B, Ti was added to make the nucleation of the Y2O3 oxides finer during the internal oxidation (this positive effect is well known in the classical ODS steels). We recall that Eurofer melts at 1530°C, Y at 1500°C, Fe2O3 at 1560°C and Ti at 1680°C. (2) Sieving of the powders to keep the smallest ones (< 50
µm in case A and B and < 20 µm in case C). Indeed, the probability to maintain Y inside the Eurofer is higher for the smaller Eurofer powders due to their higher cooling rates.
(3) Different oxidation treatments on the powder C to
make oxygen diffuse inside the powders. Since oxygen is supposed to be present in powders A and B, no heat treatments were required for these two powders.
(4) Consolidation by HIP of the Y-supersaturated Eurofer
powders A, B and C, with a HIP temperature of 1150°C with or without a step at 1000°C (to favour an homogeneous nucleation of Y2O3).
(5) Heat-treatments (water quenching at 950°C and
tempering at 750°C).

- 230 - EFDA Technology / Tritium Breeding and Materials/ Structural Materials Development / RAFM steels
Unfortunately, we will see that such a program was impeded by the important reactivity of Y with its environment. In all cases, A, B and C, yttrium could not be maintained in the steel. The powders were nearly free of Y. DETAILS ON THE ATOMIZATION In order to maintain Y in the form of a supersaturated solid solution in the atomized powders, very high cooling rates are required. It is well known that the smaller the powders, the higher the cooling rates. Moreover, small Y-supersaturated powders would also allow better and more homogeneous oxygen diffusion and then a finer and more homogeneous Y2O3 precipitation. Therefore, we have chosen the gas atomizer of the LERMPS-UTBM in Belfort (France) designed by Nanoval [6] and presented in figure 1. The LERMPS equipment allows the production of powder from 1 to 100 kg with very low impurity and atomization rates of 10-100 kg/h. The powder size is generally between 5 and 100 µm, and the distribution of powders trapped in the cyclone is narrow and centred in 10-30 µm.
Figure 1: Schematic representation of the atomisation of the Eurofer bars with Y particles in the LERMPS
equipment (the proportions are not correct).
During the atomization of the batches A, B and C, a problem has been encountered: the nozzle clogged after 1 min of atomization. In the case of atomization A, sufficient quantity of powder could be however atomiszed (1.85 kg centred at 10 µm and 1.8 kg at 20µm, after sieving), but in the cases B and C, the quantity was too low. In the case B, it was decided to re-atomize the solid part that remained in the crucible, and then, no clogging occurred and very fine powders could be obtained with a high atomization rate. Moreover, during the atomization of the powders containing Fe2O3 particles (atomizations A and B), high gaseous oxygen content was measured inside the autoclave. CHEMICAL ANALYSIS OF THE POWDERS AFTER ATOMIZATION The size distribution of powders A were checked to be centred at 10 µm and 20 µm. Chemical analyses proved
that there is no contamination of the melt by Al or Zr that could come from the Al2O3 stopper bar, from the Al2O3 protective part of the thermocouple, or from the ZrO2 crucible. The powders are slightly oxidised, but the oxide layer is thinner than for the powders atomised by Studsvik (the O content of the Studsvik powders was 0.032% for powders <45 µm). The carbon content is the same than in a Eurofer steel for the powders centred at 20 µm, but oddly very low for powders centred at 10 µm (0.01%). Anyway, the most important result is the complete absence of Y inside the powders. To understand where Y was "gone", the solidified parts remaining in the crucible after the atomisation runs were analysed by SEM. REACTIVITY OF YTTRIUM DURING THE ATOMIZATION SEM and EDS observations showed that inside the agglomerates at the stopper bar surface (figure 2) Y and Si formed mixed oxides and that Y could also segregate at the surface without apparently forming any new phase.
Figure 2: Formation of an agglomerate during the atomization
Similar analyses on the solidified remaining bath detached from the crucible proved that the melt has reacted with the crucible forming layers of probably mixed oxides of Y2O3 / ZrO2 and Y2O3 / ZrO2 / MgAl2O4 (figure 3). The top surface of the bath was also analysed (figure 4): a Y2O3 layer of a few microns covers the surface of the bath, and Eurofer is enriched with Y below this layer. This means probably that the solid yttria layer had formed in liquid bath and came at the surface of the melt due its low density (in comparison with the steel density).
Figure 3: Reaction layers at the crucible surface (the solidified bath was detached from the crucible).

- 231 - EFDA Technology / Tritium Breeding and Materials/ Structural Materials Development / RAFM steels
Figure 4: Y2O3 at the top surface of the bath. One way to solve these problems of segregation and reactivity could be to directly stabilise the Y atoms with O. Indeed, if the steel contains Y-O nano-clusters, one could expect that the O atoms would stabilise the Y atoms and the Y-O clusters would be sufficiently small to be maintained in the melt by the thermal movements generated by the magnetic stirring of the coils. We have tried this solution by elaborating an Y2O3 Eurofer ODS steel by the classical way (milling and HIP at 1100°C and reducing the HIP time to avoid the formation of large Y2O3). This ODS steel (called D) was then supposed to be constituted only of Y-O nano-clusters. It has been atomized at the LERMPS at 1750°C under Ar gas (same conditions than for the previous atomizations). Unfortunately, here again, no Y could be detected inside the atomized powders. Indeed, Y-O nano-clusters have formed coarse Y2O3 particles by diffusion that have migrated to the surface of the bath, and the remaining Y has segregated at the interface of the crucible and has also formed Y2O3. CONCLUSIONS
The initial aim of this study could not be reached because of an intrinsic and unexpected problem at the first step. Indeed, we thought that Y could be maintained in solid solution in the Eurofer powders by melting and atomizing some Eurofer bars with Y particles. However, this study proved that during the melting in the atomizer crucible, Y segregates due to its great affinity with the ZrO2 crucible, the Al2O3 stopper bar and the Al2O3 protective part of the thermocouple. Y also reacts with the oxygen of the steel and form coarse Y2O3 particles that go at the surface of the bath. Finally, the atomized Eurofer powders were free of Y, and nearly all the Y was found in the Y2O3 solid layer around the crucible or in the Y enriched bath remaining at the bottom of the crucible due to its high viscosity. From the experience acquired during this study, we conclude that two points are important to produce Y-supersaturated Eurofer powders which could be used to elaborate ODS steel by internal oxidation: (1) one has to use only yttrium, without any oxygen addition (neither Fe2O3, nor Y-O nano-clusters), because Y and O would form an Y2O3 skin at the surface of the melt, and (2) the ZrO2 and Al2O3 parts of the equipments (like the crucible, the stopper bar and the thermocouple) should be protected,
because Y would react with them. One solution could be to apply a Y2O3 protective layer to these parts that could be deposed by Chemical Vapor Deposition (CVD), by slurry coating or by plasma spraying. REFERENCES
[1] R. Lindau et al., Fusion Engineering and Design 75- 79 (2005) 989-996. [2] T. Okuda and M. Fujiwara, J. Mater. Sci. Lett. 14 (1995) 1600. [3] C. Cayron, E. Rath, I. Chu and S. Launois. J. Nucl. Mater. 335 (2004) 83. [4] S. R. Keown, Inst. Metals (1988), 345-356. [5] Y. Wu and S.K. Hwang, Acta Mater. 50 (2002) 1479. [6] G. Schulz, Metal Powder Report 51 (1996) 30. REPORTS AND PUBLICATIONS
C. Cayron “Elaboration of Eurofer ODS steels by internal oxidation (feasibility study)”, rapport technique DTEN/DL/2005/049, 25.11.2005 TASK LEADER
Cyril CAYRON DRT/DTH/LEV CEA-Grenoble 17, rue des martyrs F-38054 Grenoble Cedex 9 Tel. : 33 4 38 78 93 29 Fax : 33 4 38 78 58 91 e-mail : [email protected]
top bath surface
Y2O3 layer Eurofer matrix + Y
cruc
ible
sid
e

- 232 - EFDA Technology / Tritium Breeding and Materials/ Structural Materials Development / RAFM steels

- 233 - EFDA Technology / Tritium Breeding and Materials/ Structural Materials Development / RAFM steels
TW4-TTMS-007-D02
Task Title: MODELISATION OF IRRADIATION EFFECTS AB-INITIO DEFECT ENERGY CALCULATIONS IN THE Fe-He
AND Fe-He-C SYSTEMS
INTRODUCTION
Ferritic steels are proposed as structural material in fusion reactors. When subject to 14 MeV neutron irradiation, large amounts of helium and hydrogen are produced from transmutation in addition to self-defects. High He concentrations in metals are known to induce microstructural changes such as bubble formation and void swelling. The objective of this subtask is to contribute to the modeling of such phenomena by providing a database at the ab-initio level, i.e. in the framework of the Density Functional Theory (DFT), of energies and structures for a set of characteristic atomic configurations involving helium atoms, carbon, vacancies and self-interstitials in the α-Fe lattice. The present calculations are based on a fast DFT-code, namely SIESTA (Spanish Initiative for Electronic Simulations with Thousands of Atoms: http://www.uam.es/siesta) [1], [2]. This methodology was set up and validated in 2003 by comparison with reference calculations based on plane-wave basis sets [3]. It has been applied in 2004 to predict the migration of interstitial and substitutional He atoms in pure α-Fe, and their interaction with other He atoms and with vacancies. In 2005, this approach has been extended to the interaction between self-interstitials and He, and to the effect of carbon on the energetics of helium-vacancy clusters. 2005 ACTIVITIES
The results presented below are obtained at constant pressure, on 128 atom supercells, using 3x3x3 k-point grids for the Brillouin zone integration. All calculations are performed in the spin polarized Generalized Gradient Approximation (GGA).
INTERACTION BETWEEN HELIUM AND SELF-INTERSTITIALS
Interaction between interstitial He and self-interstitials
Helium atoms produced by irradiation are initially in interstitial sites of the iron matrix. According to ab-initio results an interstitial helium (Heint) prefers to be in tetrahedral rather than octahedral site and it migrates almost athermally with an activation energy of 0.06 eV [3]. It can then be obviously deeply trapped by a vacancy and become a substitutional impurity. However we have considered here the alternative where the interstitial helium atom finds a self interstitial atom before it is trapped by a vacancy. We have therefore calculated the interaction energies between a tetrahedral interstitial He and a <110> dumbbell - the most stable mono-interstitial
configuration - for various relative positions of the two defects. We find that several of them are attractive; three of them are shown in figure 1. The most favorable situation found is when the He atom resides in a third nearest tetrahedral site of the dumbbell (figure 1 (a)). The corresponding binding energy is 0.26 eV and the dissociation energy - obtained by adding the migration energy of interstitial He - is 0.32 eV. However self-interstitial atoms can act as efficient traps only at temperatures where they are weakly mobile since their migration energy is ~0.3 eV. This will be the case only at relatively low temperatures.
Figure 1: Schematic representations of (meta)-stable configurations containing a <110>dumbbell and an
interstitial He at various tetrahedral positions. The black, gray and white spheres symbolize the He atom, the Fe
lattice atoms, and the <110> Fe dumbbell respectively. The atoms are at their relaxed positions.
Interaction between substitutional He and self-interstitials
When a self-interstitial atom (I) approaches a substitutional He (Hesub) a spontaneous recombination-replacement (kick-out) reaction is expected to occur. We confirm here that the Hesub + I → Heint reaction implies a large energy gain, namely 3.6 eV. In other words the energy gained by recombining a Frenkel pair (5.9 eV) largely overcomes the energy lost by putting a helium atom from a substitutional to a tetrahedral site leaving an empty vacancy behind (2.30 eV). What happens before this reaction actually occurs - i.e. when the two defects are close to each other without the self-interstitial atoms spontaneously kicking the helium atom out of the vacancy - may also be important. We have therefore investigated such configurations by considering first the interaction between a Hesub and a <110> dumbbell. The kick-out reaction occurs spontaneously when a Hesub is at the nearest neighbour site within a (110) plan containing the dumbbell (figure 2 (a)), but when the Hesub is out of the plan (figure 2 (d)) a non negligible energy barrier prevents the spontaneous recombination. In this configuration a binding energy of 0.24 eV is found. From such a

- 234 - EFDA Technology / Tritium Breeding and Materials/ Structural Materials Development / RAFM steels
metastable configuration the <110> dumbbell may perform usual translation-rotation jumps [2]. We have investigated one of them by considering the final configuration where the Hesub and the dumbbell are third neighbours (figure 2 (e)) which has a binding energy of 0.16 eV. The corresponding migration energy is 0.4 eV, i.e., slightly larger than the migration energy of an isolated <110> dumbbell (0.34 eV). Jumps similar to this one, i.e. between this type of metastable configurations, are likely to occur only if none of the migration barriers leading to kick-out processes are significantly lower, which remains to be investigated. These preliminary results show that one cannot exclude that a <110> dumbbell is temporally trapped by a substitutional He before the kick-out reaction occurs. The situation may be similar in the di-interstitial case (two parallel <110> dumbbells). The most stable complex formed by the reaction of a di-interstitial with a substitutional He has an energy lower by 3.1 eV than that of the two isolated defects. As in the single interstitial case, we have found a metastable configuration with the two defects close to each other but without spontaneous recombination (figure 2 (f)), the corresponding binding energy is 0.52 eV. The <111> dumbbell is 0.7 eV higher in energy than the <110> dumbbell according to ab-initio calculations [R2]. However this relative stability may change in presence of helium. We have therefore performed calculations with a <111> dumbbell close to a Hesub. We find that a recombination-replacement reaction occurs spontaneously for the two closest configurations (figure 2 (b) and (c)).
Figure 2: Schematic representations of systems containing a substitutional He and a mono- or a di-interstitial:
configurations (a), (b), and (c) are unstable against a kick-out reaction while (d), (e) and (f) are local minima. (d)
and (e) represent the initial and final positions of a <110> dumbbell performing a translation-rotation jump in the
neighbourhood of a substitutional He.
EFFECT OF CARBON ON THE ENERGETICS OF HELIUM-VACANCY CLUSTERS
Effect of carbon on the binding energy of helium-vacancy clusters
Although carbon is present only in very small quantities in steels, it is expected to have a crucial effect on defects. Carbon indeed interacts strongly with vacancies in iron, as attested by the radical change on the apparent vacancy
migration energy between ultra-pure iron, and carbon containing 10 appm of carbon or more. For this reason we have investigated the effect of carbon on the energetics of HenVm helium-vacancy clusters. The reactions selected as representative of these effects are summarized in table 1. The comparison between reactions (1) and (1’) shows that a single carbon atom has a relatively weak effect on the binding energy between a vacancy and Heint, the binding energy of Heint with a carbon vacancy complex and and Heint being only 0.21 eV lower than that with a pure vacancy. The formation of HeV2 cluster shows an example with a lower n/m ratio. The effect of carbon is very large with a decrease of more than 1 eV of the binding energy (reactions (2) and (2’)). In the same way when the n/m is decreased, the effect of carbon becomes weaker (reactions (3) and (3’)). The general conclusion is therefore that the larger the n/m ratio, the weaker the effect of carbon. On the other hand, the binding energy drops by more than one eV when a second carbon atom is added to the complex (see reaction (1”)). We have also investigated the effect of a second carbon atom in the cluster. This effect is large when comparing the binding of Heint to VC with that to VC2.(reactions (1’) and (1”) respectively). The decrease by more than 1 eV of the binding energy may be attributed to the breaking of the C-C bond by the He atom. Adding a second He atom to these clusters gives approximately the same binding energy independently of the number of C atoms (reactions (3), (3’), and 3”)). No C-C bonds are formed in this case.
Table 1: Summary of the main reactions investigated between helium (He), vacancies (V), and carbon (C). Heint and Cint denote interstitial helium and interstitial carbon,
which are respectively on octahedral and tetrahedral sites. The energy balances of these reactions, i.e. the binding
energies between the initial species are given in eV.
Reaction Binding Energy
(eV) (1) V + Heint → HeV (1’) VC + Heint → HeVC (1“) VC2 + Heint → HeVC2 (2) V2 + Heint → HeV2 (2’) V2C + Heint → HeV2C (3) HeV + Heint → He2V (3’) HeVC + Heint → He2VC (3”) HeVC2 + Heint →→→→ He2VC2
(4) He2V + Cint →→→→ He2VC (4’) He2VC + Cint →→→→ He2VC2 (5) HeV + Cint →→→→ HeVC (6) HeV + V →→→→ HeV2 (7) HeVC + V →→→→ HeV2C (8) HeV2 + Cint →→→→ V2HeC
2.30 2.09 0.94
3.33 2.25
1.84 1.73 1.94
0.02 -0.18
0.14 0.78 0.58 0.00

- 235 - EFDA Technology / Tritium Breeding and Materials/ Structural Materials Development / RAFM steels
Effect of carbon on the migration of substitutional helium by the vacancy mechanism
The dominant mechanism for the diffusion of substitutional He, i.e. the HeV complex, in the regime of excess of vacancies is the vacancy mechanism, which requires an incoming vacancy. We tried to estimate how the migration energy of this complex determined in 2004 to be 1.1 eV could be affected by the presence of carbon. According to binding energies associated with reactions (5-8) the carbon atom will most likely weakly affect the vacancy migration mechanism, since the binding of carbon to HeV and HeV2 is quite weak. The emission of carbon from the cluster is indeed more favorable than that of its migration (without carbon), with respective energies of 0.87 eV and 1.1 eV. So even if the HeV2C complex cannot migrate without dissociating, the presence of carbon is expected to only slightly delay the migration of the cluster. Kinetic simulations are required to give a more quatitative answer. CONCLUSIONS
The following conclusions can be drawn from the present ab-initio calculations on the interaction of helium with self-interstitials in pure α-Fe and on the effect of carbon on helium-vacancy clusters:
- We have evidenced configurations with an attractive interaction between an interstitial He and a self-interstitial, with binding energies up to 0.3 eV.
- Substitutional He and self interstitial have a very strong
tendency to form an interstitial He (the so-called kick-out mechanism which releases ~3.6 eV), but metastable configurations of close pairs of these defects have also been evidenced.
- Carbon has been shown to have the following effect on
the binding of interstitial He with HenVm clusters: a rather weak effect for n=0 and m=1, but this effect strongly increases with decreasing n/m ratio. The effect of a second carbon atom depends strongly on the possibility to form C-C bonds.
- The effect of carbon on the migration mechanism of
substitutional He by the vacancy mechanism is estimated to be rather weak, in view of the small value of the binding energy of C with HeV and HeV2 complexes.
REFERENCES
[1] J.M. Soler, E. Artacho, J.D. Gale, A. Garcia, J.
Junquera, P.Ordejon and D. Sanchez- Portal, J. Phys. Cond. Matter 14, 2745 (2002).
[2] C.C. Fu, F. Willaime and P. Ordejon, Phy. Rev.
Lett. 92, 195503 (2004).
REPORTS AND PUBLICATIONS
[1] C. C. Fu and F. Willaime, Ab-initio study of helium in
α-Fe: dissolution, migration and clustering with vacancies, Phys. Rev. B 72, 064117 (2005).
[2] C. C. Fu and F. Willaime, Interaction between helium
and self-defects in iron from first principles, submitted for publication.
TASK LEADER
François WILLAIME DEN/DMN/SRMP CEA-Saclay F-91191 Gif-sur-Yvette Cedex Tel. : 33 1 69 08 43 49 Fax : 33 1 69 08 68 67 e-mail : [email protected]

- 236 - EFDA Technology / Tritium Breeding and Materials/ Structural Materials Development / RAFM steels

- 237 - EFDA Technology / Tritium Breeding and Materials/ Structural Materials Development / RAFM steels
TW5-TTMS-004-D02
Task Title: QUALIFICATION OF FABRICATION PROCESSES MICROSTRUCTURAL ANALYSIS AND QUALIFICATION OF
JOINTS AND WELDS FROM TBM MOCK-UP FABRICATION
INTRODUCTION
This task deals with micro-structural analysis and qualification of joints and welds from mock-up fabrication. The aim of this task is to set-up the real microstructure of real representative welds performed on the first instrumented material mock-ups performed in the task TW2-TTBC-002-D02. Eurofer weldability will be verified on welds with a geometry quite similar to the one present in the TBM. Expertise of samples machined on mock-ups will feed an important metallurgical database to assess the knowledge for defining the final TBM concept design and predict the metallurgical status, heat treatments, and welds performance to be integrated in the design. 2005 ACTIVITIES
METALLURGICAL ASSESSMENT In a first step, stiffened grid simplified samples in stiffening grid configuration have been laser welded. TIG process will be run out at the beginning of 2006. Cross sections have been realized on samples welded with optimized parameters to manufacture TBM structure. Results are presented in figure 1.
Figure 1: Welds cross section Transverse sections show no real defect (figure 2). First results show clearly the following defects to be managed (figure 3): - porosity level to decrease - minimum penetration depth for each welding pass to
warranty
- joint seam tracking to provide for welding centreline on the joint
- hot cracking phenomena in fusion zone to eliminate
Figure 2: Welds longitudinal section
Figure 3: Defects to solve
The use of samples coming from other tasks for metallurgical characterization and metallurgical analysis will give future trends for further efficient pre and/or post-weld heat-treatments strategy. TASK LEADER
Guillaume DE DINECHIN DRT/DTH/UTIAC CEA-Saclay F-91191 Gif-sur-Yvette Cedex Tel. : 33 1 69 08 17 87 Fax : 33 1 69 08 90 23 e-mail : [email protected]
Molten Zone
Heat Affected
Base Material
Hardness profile
Porosities
Lack of penetration
Hot cracking
Seam tracking defect
05P017-5

- 238 - EFDA Technology / Tritium Breeding and Materials/ Structural Materials Development / RAFM steels

- 239 - EFDA Technology / Tritium Breeding and Materials/ Structural Materials Development / RAFM steels
TW5-TTMS-004-D04
Task Title: QUALIFICATION OF FABRICATION PROCESSES CHARACTERIZATION OF WELDING DISTORSION OF
SIMPLIFIED WELDED MOCK-UP
INTRODUCTION
This work is part of developments aiming to process high quality welds according to Helium-Cooled Lithium-Lead (HCLL) DEMO Blanket Module design. Several parts of the test blanket module are planned to be joined by welding process. This task started in october 2005, following the development of task TW2-TTMS-004-D02 and is in close relation with the task TW2-TTBC-002-D02. The main task objective is to produce simplified virtual mock-up of the TBM’s stiffening grid assembly in order to analyze the distortions induced by the welding process. The experimental trials will be compared to numerical simulations carried out with the finite element code SYSWELD®. 2005 ACTIVITIES
MOCK-UP DESIGN Two mock-ups have been designed, a basic one and a more complex one. The plate’s dimensions are about 100 x 100 x 8 mm3 which design are very close to the stiffening grid. Those mock-ups will be instrumented with thermocouples and displacements gauges in order to assess distortions.
Figure 1: First and second mock-ups
NUMERICAL SIMULATION
The “Local-Global approach” The objective is to simulate the distortions of the whole structure (stiffening grid) which will occur during the welding process. The main interest of assembly simulations is to evaluate the influence of the welding sequence and the effects of clamping tools, on the global distortions. But the whole structure model is too big for the classical welding simulation method. A simplified method, called “The Local-Global approach” (proposed by the finite element code SYSWELD®) can overcome this limitation and provide a solution to simulate such parts. Benefits: - The size of the model has no limitation - Several welding sequences and clamping conditions
may be experimented to minimize distortions The main idea is to create a local model (basic element, fine mesh) that represents only a part of the weld with its results (constraints and strains). This model is then projected on the global model (whole structure, coarser mesh) depending on the trajectories (paths) of the various welds. The input data is then completed by the order in which the welds are carried out and by the clamping conditions of the structure. Local Model simulation This preliminary simulation has been achieved before mock-ups design definition. So the real design and dimensions are considered in this simulation. Then plate’s dimensions are 384 x 188 x 8 mm3. A 3D thermal-metallurgical mechanical simulation of welding distortions is achieved with the finite element code SYSWELD. The considered material is Eurofer’97 and the welding process is the Laser process. The several models (heat source, metallurgical transformations laws and mechanical behaviour laws) developed and validated during task TW2-TTMS-004-D02 have been employed. According to the size of the model, two meshes are used. First one (fine mesh with 70000 nodes) is for thermal-metallurgical calculation and second one for the mechanical field (coarser mesh 30000 nodes). With this model simplification the calculation time needed is reduced to only two weeks.

- 240 - EFDA Technology / Tritium Breeding and Materials/ Structural Materials Development / RAFM steels
Figure 2: Part of the stiffening grid considered for the local model and different views of the mesh
According to previous experiments, only one pass with a penetration depth of 4 mm is simulated. The thermal field obtained is presented in figure 3.
Figure 3: Thermal field
The distortions type is mainly angular (figure 4) and a maximum of 4 mm is obtained at the side border of the plate
Figure 4: Distortions after welding (front and rear views)
TASK LEADER
Guillaume DE DINECHIN DRT/DTH/UTIAC CEA-Saclay F-91191 Gif-sur-Yvette Cedex Tel. : 33 1 69 08 17 67 Fax : 33 1 69 08 90 23 e-mail : [email protected]

- 241 - EFDA Technology / Tritium Breeding and Materials/ Structural Materials Development / RAFM steels
TW5-TTMS-004-D06
Task Title: QUALIFICATION OF FABRICATION PROCESSES WELDABILITY OF DISSIMILAR TUBES (EUROFER/SS316) BY FUSION BUTT WELDING WITH YAG LASER
INTRODUCTION
Dissimilar welds development for joining TBM Eurofer tubes with external branch pipes in SS316 steel (cooling channels, Pb-Li loop) are required. The aim of this subtask is to characterize laser welding joints of TBM tubes in butt joint design. Laser process will be operated by internal welding with the CEA technology. CEA laser welding tool will be modified to take into account the TBM tubes geometry. Overheating effect of circular welding will be managed by the welding sequence. Mechanical and metallurgical expertise will be operated, including leak tests. 2005 ACTIVITIES
The TBM modules need to be joined to secondary systems: 316L austenitic stainless steel tubes. This requires Eurofer / SS316L dissimilar butt joints operated by YAG laser welding. The TBM design and service operation of TBM modules drive internal welding of these pipes. The design of the modifications of miniaturized tools (cutting and welding) will be performed through CEA experience on ITER Module branch pipes tubes welding and low size CEA laser welding tool (figure 1). So, industrial solutions will be selected for the manufacturing improvement of the tool for TBM design. Process and laser requirements will be taken into account to reach the objectives described above. The laser tool will be adapted to the application, respecting the welding requirements.
Figure 1: Low size CEA laser welding tool CAD design of TBM tubes and CEA tools are running out to simulate welding sequence (figure 2). Design
modifications of the laser tool will allow to process TBM tube welding. Final version and clamping devices are expected for may 2006.
Figure 2: Tubes to be welded Eurofer tubes are in machining stage. Stainless steel tubes have been provided. So, the operating conditions will be optimized in the stationary stage to process sound weldments. Then the operating conditions will be ranged in order to compensate the overheating effect. The test of the laser tool will be carried out on a CNC machine. The demonstration on the tube welding mock-up will allow to qualify welding process: 5 dissimilar welded tubes will be provided to expertise stage. Investigations (radiographic, leak test) will be performed on the welds to verify their integrity. The final report describing design and procurement of equipment and tools, experimental set-up and results of the experimental work will conclude this work, including enhanced metallurgical examinations, in case of hot cracks apparition. TASK LEADER
Guillaume DE DINECHIN DRT/DTH/UTIAC CEA-Saclay F-91191 Gif-sur-Yvette Cedex Tel. : 33 1 69 08 17 67 Fax : 33 1 69 08 90 23 e-mail : [email protected]

- 242 - EFDA Technology / Tritium Breeding and Materials/ Structural Materials Development / RAFM steels

- 243 - EFDA Technology / Tritium Breeding and Materials/ Structural Materials Development / RAFM steels
TW5-TTMS-004-D07
Task Title: QUALIFICATION OF FABRICATION PROCESSES WELDABILITY OF EUROFER HOMOGENEOUS PLATES
INTRODUCTION
The aim of this subtask is to assess the feasibility of Eurofer welding, with the required welding processes for TBM manufacturing in welding situations close to real joints design. Electron beam, TIG and laser processes will be applied on samples coming from the second batch of Eurofer. Laser welds have been processed on butt joints flat samples. However, hot cracks observed in fusion zone imply laser welding developments to avoid these phenomena. 2005 ACTIVITIES
LASER WELDS METALLURGICAL ASSESSMENT Simplified samples in stiffening grid configuration (8 mm thickness) have been laser welded. Cross sections have been realized with optimized parameters to manufacture TBM structure. Results are presented in figure 1.
Figure 1: Welds cross section Transverse sections show no real defects on such welds (figure 2).
Figure 2: Welds longitudinal section
External aspect of welds is quite good. Only few pores are observed as well as no trouble in the overlapping of the two welds, as shown in figure 3. No defects have been detected by NDT and X rays testing. However, fine analysis of 10 joints welded in same conditions show hot cracking apparition on one of the samples (starting phase in the first 50 mm of the joint), as shown in figure 3.
Figure 3: Hot cracking in fusion zone This phenomenon has been predicted in a 2005 CEA report, written par G. de Dinechin and Ph. Aubert for a review status on low activation martensitic steels weldability, in the TTMS 004 field. Process development are running out to solve this problem. In parallel, code analysis (RCCMR) is launched to determine key actions for a potential certification of welding process involved in TBM manufacturing, especially in NDT processing, and control approach. METALLURGICAL SETTINGS Several characterizations of welds structure have started in mid november 2005. Following figures illustrate the very fine structures observed even in base material and fusion zone:
Figure 4: Base material
05P017-5

- 244 - EFDA Technology / Tritium Breeding and Materials/ Structural Materials Development / RAFM steels
Martensite total decomposition is observed with carbide ferritic matrix. Former austenite grain size is estimated to 6 - 8 µm.
Figure 5: Fusion zone
Martensite laths are observed with former austenite grain size in range 20 to 30 µm
Figure 6: Heat Affected zone
Martensite partial decomposition combined with carbide coalescence and former austenite grain size in range 10 to
15 µm
100
200
300
400
500
600
-6,0 -4,0 -2,0 0,0 2,0 4,0 6,0
Ecart à l'axe (mm)
Dur
eté
(HV
0.5
)
ZAT ZAT
MBMB
Figure 7: Hardness profile in Vickers
The hardness profile shown in figure 7 has been obtained on welds without post welding annealing treatment. This explains the 600 Hv hardness observed in fusion zone. A very interesting result is located in the heat affected zone, where no decreasing of hardness is seen.
For Japanese steels JLF1 and F82H, a strong decreasing was observed, explained by carbide precipitation in HAZ. For Eurofer steels, stronger welds can be expected.
Figure 8: Welds observations
(1)
(1)
(2)
(3)
(4)
Weld end Weld start
- 6 mm + 6 mm 100HV

- 245 - EFDA Technology / Tritium Breeding and Materials/ Structural Materials Development / RAFM steels
Cross sections of figure 8 show no defect, with correct welds overlapping. Among the 10 samples laser welded with the same welding parameters, only one sample exhibits a crack in fusion zone (figure 9). EDS (Energy Dispensive Spectrometry) and SIMS (Secondary Ion Mars Spectrometry) analyses are in progress.
Figure 9: Observation of sample N° 5 Apparition of hot crack in fusion zone where cooling rate
is higher Sensitivity of Eurofer to hot cracking effect due to too high cooling solidification rate of Eurofer in fusion zone is once more demonstrated. Welder tricks will be applied to solve this trouble, such as: - decreasing solidication rate by reducing laser welding
travel speed - increasing laser energy per mm by increasing laser spot
size - laser welding travel speed = TIG welding travel speed - pre and post heating - filler wire narrow gap welding in multi-pass
configuration - filler wire chemical composition adjustment - both side laser welding in same time - TIG welding These solutions will be investigated in 2006.
ELECTRON BEAM AND TIG WELDS FOR STIFFENING GRID-FIRST WALL TO CAP JOINING 3 processes will be evaluated: Electron Beam, Narrow Gap TIG, and Narrow Gap Laser hybrid for 40 mm Eurofer thickness welding. Preparation level is in running. This work will be performed in 2006. CONCLUSIONS
This task has been launched in september 2005. First laser welding analysis in real joint configuration point out a laser hot cracking sensitivity in partial penetration depth, observed sometimes on other welding process, such TIG and Electron Beam, but not in full penetration depth. So the first 2006 trimester will be dedicated to solve this problem and to set up the basic understanding of this phenomena. TASK LEADER
Philippe AUBERT DRT/DTH CEA-Saclay F-91191 Gif-sur-Yvette Cedex Tel. : 33 1 69 08 17 67 Mobile : 33 6 08 53 36 41 Fax : 33 1 69 08 90 23 e-mail : [email protected]

- 246 - EFDA Technology / Tritium Breeding and Materials/ Structural Materials Development / RAFM steels

- 247 - EFDA Technology / Tritium Breeding and Materials/ Structural Materials Development / RAFM steels
TW5-TTMS-005-D01
Task Title: RULES FOR DESIGN, FABRICATION, INSPECTI ON UPDATE DATA BASE AND APPENDIX A OF DEMO-SDC
INTRODUCTION
Eurofer is a reduced activation ferritic / martensitic steel that has been selected as the European reference structural material for ITER Test Blanket Modules and DEMO reactor. Several industrial heats of this steel have been produced and tested under EFDA’s Tritium breeding and materials field / materials development tasks. The ultimate goal of these tasks is to propose materials properties allowable for design and licensing of components that will be fabricated with the Eurofer steel. This report presents a summary of the work done during the year 2005 at CEA for the TW5-TTMS-005-D01. The work done is also part of an international collaboration, coordinated under the fusion materials implementing agreement of the International Energy Agency (IEA). The main objective of the TW5-TTMS-005-D01 is to collect, validate and harmonize the results of Eurofer steel, in continuation of the earlier work done on the conventional 9Cr-1Mo steel and the RAFM steel grade produced in Japan (F82H), and propose materials properties allowable through an Eurofer steel dedicated Appendix A. 2005 ACTIVITIES
All actions and deliverables foreseen under the terms of TW5-TTMS-005-D01 have been fulfilled in time. In 2005, the database of Eurofer steel was updated, particularly with the RAFM data and analysis resulting from the work done at CEA and NRG. With the addition of the new Eurofer steel data in 2005, the collection of relational databases for RAFM steels contains: - Products database: 571 records including 118 on
Eurofer - Compositions database: 475 records including 26 on
Eurofer - Tensile database: 1185 records including 258 on
Eurofer - Impact database: 1710 records including 467 on
Eurofer - Impact plots: 161 records including 45 on Eurofer - Creep database: 205 records including 81 on Eurofer - Fatigue database: 232 records including 70 on Eurofer - Fracture toughness database: 261 records, mostly for
Eurofer steel, including 8 Master Curves. - A few fatigue crack propagation test results - Summary records for all databases Runtime CD-Rom version 5, linking all above databases and Appendix A reports, is also issued.
The content of the Appendix A is now well enriched with data on EB, TIG and diffusion bonded joints allowing a comprehensive evaluation of these joints along with the base metal (see e.g. figure 1). Also with the availability of high dose irradiation results precision of extrapolation of mechanical properties to higher doses is increased (see e.g. figure 2).
Figure 1: Effect of irradiation (2-3 dpa at 300°C in HFR, SUMO-03) on tensile yield and UTS of Eurofer weld
metals, PWHT 1 h at 720° C (NRG data)
Figure 2: Effect of irradiation at 300 °C on yield stress of Eurofer steel tested at 300 °C (∆Sy versus dose in dpa,
including CEA high dose data)
400
500
600
700
800
900
0 100 200 300 400 500
Eurofer Weld2-3 dpa at 300 °C
Sy (MPa)- EBSu (MPa)- EBSy (MPa)- TIGSu (MPa)- TIGSy (MPa)- EB (Irr)Su (MPa)- EB (Irr)Sy (MPa)- TIG (Irr)Su (MPa)- TIG (Irr)
Str
ess,
MP
a
Temperature, °C
UnIrrSy
Su
Irr
0
100
200
300
400
500
600
5 10 15 20 25 30 35 40 45
Sy
(Irr
) -
Sy
(UnI
rr),
MP
a
Dose, dpa
∆Sy = 500 (1 - exp(- φ/7.3252))^0.5Irradiation & Test at 300 °C
(Sy UnIrr= 474 MPa)

- 248 - EFDA Technology / Tritium Breeding and Materials/ Structural Materials Development / RAFM steels
CONCLUSIONS
Appendix A for Eurofer steel and its various types of joints is now well established. It will be further improved in 2006 with data from even higher doses. For 2006 and beyond a report on ODS version of this steel is proposed. REPORTS AND PUBLICATIONS
F. Tavassoli, “Fusion Interim Structural Design Criteria (DISDC), Appendix A Material Design Limit Data: A3.S18E Eurofer Steel”, TW5-TTMS-005-D01, CEA/DMN/Dir/2005-01/A, to be issued Dec. 2005.
TASK LEADER
Farhad TAVASSOLI DEN/DMN CEA-Saclay F-91191 Gif-sur-Yvette Cedex Tel. : 33 1 69 08 60 21 Fax : 33 1 69 08 80 70 e-mail : [email protected]

- 249 - EFDA Technology / Tritium Breeding and Materials/ Structural Materials Development / RAFM steels
TW5-TTMS-006-D01
Task Title: STRUCTURAL MATERIALS - HIGH PERFORMANC E STEELS IMPROVEMENT OF FABRICATION PROCESS FOR ODS-
EUROFER - REFINEMENT OF CHEMICAL COMPOSITION AND THERMOMECHANICAL TREATMENTS WITH EMPHASIS ON THE FABRICATION ISSUES OF LARGER BATCHES
INTRODUCTION
Compared to HIP, hot-extrusion process presents the advantage to induce a more homogeneous and finer microstructure without porosity, favourable features to optimize the material’s performance and in particular to decrease DBTT values. The main objectives of this task are to assess the process of hot-extrusion to obtain ODS-EUROFER with improved DBTT and to compare the effect of the yttria content (0.3 and 0.5%) on the tensile and impact properties of hot-extruded ODS-EUROFER alloys. 2005 ACTIVITIES
The compaction by hot-extrusion was applied to mechanically alloyed powders of EUROFER with yttrium oxide contents of 0.3 and 0.5 wt % (supplied by FZK), which have been extruded at 1100°C as rod bars of 13 mm in diameter and rectangular bars of 7.7 mm thickness and 24 mm width. A homogenisation treatment at 1050°C during 15 min followed by a slow cooling has been applied to the rod bars. Rectangular bars have been cold rolled to 30% reduction in thickness then heat treated with the same conditions of time and temperature than the rod bars. Tensile cylindrical specimens of 2 mm in diameter and 12 mm of gauge length and Charpy V-notch subsize specimens were machined in the longitudinal direction of the bars. Mechanical tests are in progress. First results on impact properties of ODS-0.3% Y2O3 were obtained by Charpy tests performed over the range temperature –100 to +320°C to produce the full energy transition curve (figure 1). The Ductile-Brittle Transition Temperature (DBTT) evaluated by means of the hyperbolic tangent method is about –40°C.
CONCLUSIONS
The first results of Charpy impact tests performed on extruded material containing 0.3% Yttria confirm the better value of DBTT (-40°C) and the higher level of the upper shelf energy (about 8.6 J) compared to the same material obtained after consolidation by HIP. TASK LEADER
Annick BOUGAULT DEN/DMN/SRMA/LA2M CEA-Saclay F-91191 Gif-sur-Yvette Cedex Tel. : 33 1 69 08 54 45 Fax : 33 1 69 08 71 30 e-mail : [email protected]
ODS-Eurofer 0.3Y2O3 extruded
0
1
2
3
4
5
6
7
8
9
10
-150 -100 -50 0 50 100 150 200 250 300 350
Temperature (°C)
En
erg
y (J
)DBTT (°C) USE (J)
-38.5 8.6
Figure 1: Evolution of absorbed energy as a function of

- 250 - EFDA Technology / Tritium Breeding and Materials/ Structural Materials Development / RAFM steels

- 251 - EFDA Technology / Tritium Breeding and Materials/ Structural Materials Development / RAFM steels
TW5-TTMS-007-D04
Task Title: MODELISATION OF IRRADIATION EFFECT EVENT-BASED MONTE CARLO SIMULATIONS OF DEFECT
MICROSTRUCTURE EVOLUTION OF IRON CONTAINING C DURING RESISTIVITY RECOVERY EXPERIMENTS
INTRODUCTION
The objective of the work is to study the defect accumulation and microstructure evolution in Fe containing carbon (C). The latter is known to strongly affect the mobility of defects created during irradiation (interstitials and vacancies) and has therefore a direct consequence on the material microstructure evolution. Resistivity recovery experiments conducted with carefully controlled C contents were performed by Takaki as soon as 1983 [1]. To explain the various recovery stages, he invoked the intervention of individual point defects, defect clusters and solute+defect clusters having that very migration (or binding) energy to promote the corresponding resistivity recovery at the temperature under examination. The resistivity technique being macroscopic in essence, it could yield only a complicated average of a large number of elementary processes; but there was at that time no tractable tool to control the conclusions. These proposals were, at that time, the most reasonable ones, taking due account of the rather crude state of the art concerning the calculation of defect energetics. The point of view changed in the last decade since the onset of ab-initio methods which provide us today with confident (if not perfect) values of the energies of elementary events made up by the formation, the migration, the association and dissociation of defects. In pure BCC iron, the following energies were found [2]: the migration energy of the single vacancy (V) is 0.67 eV, while the binding energies of di-vacancies V2 , tri-vacancies V3 are 0.3 eV and 0.37 eV and their migration energies are 0.63 eV and 0.35 eV respectively. The migration energy of self interstial (I) amounts to 0.34 eV while the binding energies of I2 , I3 are 0.80 eV and 1.4 eV and their migration energies are 0.42 eV and 0.43 eV respectively. On the other hand Monte Carlo simulations are currently reaching that state where the simulated volume of matter approaches the experimental one and where the time scale which can be probed, although still limited, becomes closer and closer to the one probed under the experimental conditions. The kinetic Monte Carlo method Jerk, developed in Saclay presents unique capabilities: it rests upon a detailed knowledge of elementary atomistic mechanisms and takes advantage of rate theory, it can handle rare events which play a key role in the nucleation process of complex clusters [3]. Using the small number of ab-initio data quoted above as input parameters, it was successfully used to explain the resistivity recovery changes of pure iron under electron irradiation [2].
The challenge is now to extend this approach to the case of iron containing carbon. At the start of this work, three main deliverables were planned as follows: * M1: parametrization of carbon doped iron (interactions of C with self defects and defect clusters) * M2: application to resistivity recovery of carbon doped iron after a low temperature e- irradiation (influence of dose and carbon content) + parallelization of Jerk * M3: final report The death of the principal investigator at the beginning of 2005 slowed the work, which was restarted in december 2005. Point 1 is the principal result obtained in 2005; points 2 and 3 will thus be the output for 2006. RESULTS OF STEP M1 The first step was done in relationship with task TW4-TTMS-007-D02: ab-initio calculations are required for the migration and stability of the defects which are used as input data in the Monte Carlo simulations. New parameters relevant to carbon doped iron were calculated with the Siesta code (DFT + GGA approximation; spin polarized calculation; pseudo-potentials, pseudo atomic orbitals). The calculations were conducted on supercells containing 128 atoms (relaxation of force and stress tensor, migration path investigated with the drag method). The main results can be summarized as follows: - C atom resides in octahedral interstitial sites; the energy barrier for migrating from an octahedral site to a neighboring one is 0.87 eV, in excellent agreement with experiments (and similar evaluations performed with other ab-initio codes). - C attracts vacancies and promotes the formation of complexes VC, VC2, V2C, V2C2; with positive binding energies (0.41 eV, 1.18 eV, 0.83 eV, 1.40 eV respectively). At larger sizes, the effect of carbon seems to be less favourable. As a consequence only these complexes will be considered in the simulations. All of them are assumed immobile, but they can emit mobile species. The difficult point is the multiplicity of possible decomposition paths for each of them. Denoting each possible reaction followed by the dissociation barrier to be overcome yields:

- 252 - EFDA Technology / Tritium Breeding and Materials/ Structural Materials Development / RAFM steels
VC --> V + C 0.41 + Em(V) V2C --> VC + V 0.42 + Em(V) V2C --> V2 + C 0.53 + Em(V2) VC2 --> VC + C 0.77 + Em(C) VC2 --> C2 + V 1.18 + Em(V) V2 C2 --> VC2 + V 0.22 + Em(V) V2 C2 --> V2C + C 0.57 + Em(C)
Where Em(d) is the migration energy of defect ‘d’. For obvious energetic reasons, the path which is favoured is the one involving the lowest activation barrier. - C attracts interstitials and promotes mainly the
formation of immobile complexes I C, I2C and I3C (binding energies euqal to 0.12 eV, 0.87 eV, 1.52 eV respectively). The binding energy increases with the size but some assumption must still be made for including the asymptotic behaviour at larger sizes. Only the following reactions are considered:
IC --> I + C 0.12 + Em(I) I2C --> I2 + C 0.19 + Em(I2) I2C --> IC + I 0.87 + Em(I) I3C --> I2C + I 0.53 + Em(I) I3C --> IC + I2 0.60 + Em(I2) I3C --> C + I3 0.22 + Em(I3)
Where the migration energies of interstitials were quoted above. - C-C interaction is slightly repulsive at first and second neighbour distances. But knowing that the presence of
carbon promotes the formation of cementite Fe3C or ε -carbide, some attraction at a larger distance must be invoked. This point is delicate and has very important consequences on the formation of C clusters in the C doped iron samples: the path for nucleating larger C clusters will not be the same if C2 can be considered as a possible nucleus for cementite or if other reactions must be invoked. RESULTS OF STEP M2 As a first pre-requisite, we had to parallelize the code cut down the computer time. This has been performed efficiently by distributing on several CPU’s the most time consuming step in the calculation, namely the building and book-keeping of the table sorting the events (encounters of mobile partners, dissociation events ...etc) in the order of increasing delays of occurrence. The obtained speed up is reasonable but depends noticeably on the temperature (higher at lower T) because of a different balance between the number of reaction events to be considered and the latency attached to the sending of messages: - at the higher temperatures (350 K and above) the number of reacting defects is small: the time spent in the subroutine calculating the delays is not large enough when compared to the time spent in message passing. The speed up amounts to 10 with 8 processors (over speed up due to data entirely contained in the cache size) and only to 12 for 16 processors. As a consequence, the number of 10 processors seems optimal.
- at lower temperatures (100 K and below), the number of defects and the number of reaction events to be considered is much larger than before, but many of them do not happen and can be rapidly cancelled out because of the low mobilities. The longer time spent in the calculation of delays is not too much altered by the time spent in message passing, and a speed up of 22 was obtained with 30 processors. Some more gain can be expected with more than 30 processors.
The second step consisted in implementing in the code all the new mechanisms listed above and in studying their influence on the resistivity recovery curves. Only preliminary results are available today but they look encouraging: - new peaks are obtained which correspond to the migration or dissociation of new entities in agreement with experiments (carbon migration above 350 K, dissociation of VC and VC2 complexes above 570 K) [1]. - the interpretation of irradiation dose effect is more complicated than for the case of pure iron, where a larger dose implied shorter distances between reaction partners and thus a simple shift of the recovery peaks at lower temperatures. Conversely, for carbon doped samples, the positions of these new recovery peaks depend now on two independent parameters, the irradiation dose and the initial C content: indeed, these new peaks are monitored by the relative amounts of C atoms and individual defects which have survived. Their concentrations are ruled by many more reactions than without carbon. - at last the approximation used-up to now for calculating the resistivity must be revised. For pure iron, the resistivity of a cluster containing n defects was evaluated as the sum of the resistivities due to each defect. For carbon doped iron, this linear rule had to be modified by assuming that the resistivity of the cluster containing p defects CIn CVn CnIm and Cn varies as p 2/3 to get reasonable amplitudes for the recovery peaks. REFERENCES
[1] S. Takaki et al. , Rad. Effects 79 (1983) 87. [2] C.C. Fu et al. Nature Mat. 4 (2005) 68. [3] J. Dalla Torre et al., Phil. Mag. 85 (2005) 549. TASK LEADER
Jean-Louis BOCQUET and L. JOLY DEN/DMN/SRMP CEA-Saclay F-91191 Gif-sur-Yvette Cedex Tel. : 33 1 69 08 54 62 Fax : 33 1 69 08 68 67 e-mail : [email protected]

- 253 - EFDA Technology / Tritium Breeding and Materials/ Structural Materials Development / RAFM steels
TW5-TTMS-007-D21
Task Title: STRUCTURAL MATERIALS - MODELISATION OF IRRADIATION EFFECTS
FUSION-RELEVANT MATERIALS IRRADIATION IN JANNUS FOR MULTI-SCALE MODELLING EXPERIMENTAL VALIDATION
INTRODUCTION
The progress made in the understanding of the radiation damage physics and the increase of the computing capabilities has allowed for developing multi-scale computer tools to predict the radiation damage in pure metals and dilute alloys. These tools have been considered to be matured enough to attempt to extend them to more complex industrial materials [1]. On this basis a modelling activity is supported by EFDA with the main following objectives reprinted from reference [1]: “To study the radiation effects in the EUROFER reduced activation ferritic-martensitic steel under fusion relevant conditions in the range of temperatures from RT to 550°C in the presence of high concentrations of nuclear derived impurities (i.e. H, He). For such purpose, the tools and database to correlate results from fission reactor - spallation source – fusion neutron source should be developed as well as the extrapolation to high fluence. Of particular interest are the effects of: - Chemical composition and the role of different alloying
elements as well as that of the impurities produced through nuclear reactions such as H and He.
- Microstructure, particularly in terms of the different
boundaries present. - Mechanical properties: role of irradiation and
impurities on hardening, embrittlement, and fracture. It should be emphasized that the models and the tools derived from them should be validated experimentally”. Ion irradiation has been proven for the past thirty years to be particularly effective and flexible in studying irradiation effects in well controlled irradiation conditions at low cost and with rapid feedback. The volumes of radiation-induced microstructure accessible to multi-scale modelling are presently comparable to those that can be irradiated via ion beams and physically-chemically characterized by the different available techniques (TEM, FEGSTEM, IBA, AP-FIM, Synchrotron light). In addition, recent progresses in miniaturized specimens for mechanical testing, including post-mortem nano-indentation and in-situ TEM testing will make possible to get the relevant data for the dislocation dynamics in microstructure induced via ion irradiation.
Therefore the coupling of multi-scale modelling, ion-irradiation and characterization will provide an effective way in defining, carrying out and interpreting the critical experiments required to develop and validate the modelling tools that are necessary to interpolate the data obtained with various neutrons sources, to optimize the future irradiation programme in IFMIF and extrapolate all these data to the varied operating conditions of the in-vessel components of a Fusion reactor. In the next two sections we describe the general objectives and strategy of the experimental program in Jannus. Detailed explanations of the different tasks that should be pursued in the experimental program coupled with simulations to elucidate specific phenomena, such as configuration, (i) migration, clustering of point defects and He, (ii) kinetic pathway for high dose and high concentration of He and H and (ii) mechanical behaviour are not given here. They are too long to be presented here. They constitute sections 4 to 7 of the full 22 pages report available on demand. OBJECTIVE The purpose of this task is the redaction of a document describing the experimental strategy for the validation and verification of the multi-scale modelling approach using the multi-beam ion facilities JANNUS that will be operative at Saclay and Orsay in 2007. The strategy includes proposals by CEA, EPFL, UKAEA, Oxford and Alicante university. Have participated to the redaction: R. Schaeublin (EPFL), M. J. Caturla (UAAP), A. Barbu (CEA), S. Dudarev (UKAEA), P. Vladimirov(CEA) and J.L. Boutard (CEA) 2005 ACTIVITIES
EXPERIMENTAL STRATEGY Objectives of the experimental programme in Jannus The objective of Jannus is to provide the test–bed for modelling oriented experiments to build and validate the multi-scale modelling of the microstructure kinetic evolution and the associated dynamics of dislocations. The experimental programme will address for the selected reference materials:
- the point defect behaviour and their diffusion

- 254 - EFDA Technology / Tritium Breeding and Materials/ Structural Materials Development / RAFM steels
- the primary irradiation damage essentially the cascade development and recovery
- the kinetic pathway of microstructure evolution to high
dose: point defect clusters, precipitates, segregation, void swelling
- the consequences of the microstructure on the in-
service properties: mechanical properties (plasticity and visco-plasticity).
The reference materials are for DEMO the following ones: Eurofer & ODS ferritic/martensitic steels for the structural materials, and, tungsten for the armour materials, with the first priority given to Eurofer in agreement with the modelling programme. The document will present first elements of strategy followed to build the experimental programme. Then the description of the programme will be organized as followed: - Point defect behaviour: configuration, - migration, clustering - Kinetic pathway of the microstructure to high dose - Under irradiation phase stability - Dynamic of dislocations in radiation induced
microstructure - In-beam creep
Table I gives, reprinted from [1], the modelling tools with a short description and the deliverables expected from the modelling programme. Strategy for modelling-oriented experiments The strategy depends on the response of the considered material to irradiation, and, the maturity and the reliability of the modelling prediction. Eurofer martensitic steel: Point defects, microstructure at high dose high He and H concentrations Eurofer is a martensitic steel with ~9% Cr the radiation induced microstructure of which is determined by the clustering of point defects and He&H produced by the neutron irradiation. The recent multi-scale prediction of electron damage recovery in ultra-pure α-Fe based on ab-initio calculations of the formation and migration energies of point defect clusters [2] as well as the progress made in the ab initio prediction of the cohesive and kinetic parameters governing the behaviour of He in presence of point defects [3] make the objective of an ab initio based multi-scale modelling of the radiation induced microstructure most probably achievable in the next five years within the Fusion Material Modelling Programme for dilute alloys such as αFe-C-He.
Table 1
Method Description Deliverable Object Ab-initio Potential Bcc Fe potential Ab-initio Calculation of binding
energies & jump frequencies He-vacancy binding energy
MD Displacement cascades Type of defect resulting from cascade Evolution of cascade in the presence of He
MD (and statics) Evaluation of the dislocation -defect interactions
Dislocation-defect interaction at the atomistic level as input for DD calculations
MD Interaction of cascades and defects with grain boundaries
Effect of GB on cascade evolution. Evaluation of sink strength
Lattice KMC Cohesion & diffusion model Phase stability kMC, OKMC, EKMC (Jerk) Early stages of defect
(and solutes) evolution Early stages of microstructure evolution
Analytical modelling (Rate Theory)
Later stages of defect (and solutes) evolution
“Steady State“ time-temperature microstructure evolution
DD Calculation of the interaction between defects and a distribution of dislocations
Initial hardening, strain localization
DD + FEM Calculation of the interaction between defects and a distribution of dislocations
Evolution of the deformation microstructure: work hardening
DD + FEM Stress-strain singularities and crack propagation
Fracture properties

- 255 - EFDA Technology / Tritium Breeding and Materials/ Structural Materials Development / RAFM steels
Conversely it is well known that the initial microstructure and chemical composition control in a complex manner the radiation effects in industrial materials so that it is most probably out of reach within the five forthcoming years to multi-scale model such materials without some adjustable parameters, tuned as much as possible on dedicated experiments and on the knowledge gained from experiments and physical modelling on simpler systems. Therefore the strategy for the Jannus experimental programme in support to the multi-scale modelling of radiation induced microstructure for Eurofer will be to select a few relevant chemical compositions of increasing complexity with the following rationale: - Study a few simple model alloys: Ultra-High Purity
(UHP) α-Fe and UHP α-Fe doped with C for which the radiation damage, point defect and He accumulation, can be modelled from well-defined physical data obtained from ab initio and assessed via the experiments dedicated to point defect behaviour, i.e. without tuneable parameters. These materials should be well annealed to have the simplest initial microstructure.
- Study a few model alloys such as UHP α-Fe-Cr, UHP
α-Fe-C-Cr, α-Fe-C-Cr-W. The chemical composition is complex enough so that some parameters of the previously well-established models are to be tuned using the knowledge gained on the simple model alloys and the knowledge gained with Jannus on the point defect behaviour. The materials are also in annealed condition.
- Study the industrial material the chemical composition
and the microstructure of which are more complex, and, rely on the documented method described above to propose the best set of parameters.
Eurofer ferritic/martensitic steels: from microstru cture to mechanical properties The yield properties of the non-irradiated 9 Cr martensitic steels of Eurofer type depend on the chemical composition, the martensitic lath dimension and dislocation density. This type of material has to be used in operating conditions that allow for the stability of carbides and martensitic lath structure. The radiation-induced clustering of point defects within the laths will strongly affect the plastic behaviour of Eurofer: - For T<0.45Tm, the hardening will be due to the
obstacle forces against the dislocation motion. In addition, the localisation of the plastic deformation (T<0.3 Tm), the so-called channelling, has to be understood as it leads to premature failure.
- For T>0.45Tm, the issue is the effect of the radiation-
induced microstructure on the creep strength. - Under irradiation, irradiation creep mechanisms are
operating the main issue is how they are affected by the microstructure and chemical composition.
The dynamics of dislocations that will control these phenomena depends very much on the chemical composition as well as the nature, size and density of the obstacles. The various α-Fe-based model alloys should offer a large range for these parameters. Therefore, as for microstructure, the strategy of model alloys is proposed to be used with three objectives: - determine the obstacle forces of the obstacles via in
situ TEM testing - determine the collective behaviour of dislocations and
occurrence of channelling via nano-indentation or mechanical testing of miniaturized specimens
- assess the irradiation creep via in-beam tests It should be noted that the prediction of obstacle forces or reactions between dislocations and point defect clusters requires the simulation of millions of atoms, which are out of reach of ab-initio calculation. They are performed via Molecular Dynamics based on empirical inter-atomic potentials the predictability of which has to be carefully assessed. Progress is being carried out for more reliable potential in α-Fe and possibly for α-Fe-C in various laboratories and within the PERFECT project. As well Discrete Dislocations Dynamics codes are being developed for α-Fe in the thermally activated and athermal regime. All these efforts associated with the one within the fusion-material modelling programme should contribute to a reliable DDD modelling of materials irradiated in fusion condition, and, give the physical basis for crystalline plasticity and continuum mechanics for the macroscopic plastic behaviour. ODS ferritic steels: Microstructure and mechanical properties
The ODS ferritic steels have been developed to have higher heat resistance because of (i) a dispersion of fine oxide particles for high strength and creep resistance at high temperatures and (ii) higher chromium content, typically ~14 % Cr, so that they do not suffer α>α’ transformation. The price to pay is nevertheless the α/α’ unmixing in two ferritic phases due to the phase gap in the Fe-Cr diagram. The major issues are therefore, in addition to the point defect & He clustering like in Eurofer martensitic steels, the stability of the oxide particles under irradiation and He production, and, the evolution and characterization of the overall microstructure induced by the α/α’ unmixing. The study of the α/α’ unmixing may be performed on model alloys with varying the Cr content. The study of stability of the oxide particles and of the overall radiation induced microstructure, however, requires considering the industrial material in its complexity, initial chemical composition and microstructure with the various interfaces and sinks. The consequences of the radiation-induced microstructure evolution on the mechanical properties, for example:

- 256 - EFDA Technology / Tritium Breeding and Materials/ Structural Materials Development / RAFM steels
Table 2
Tasks 2006 2007 2008 TotalPoint Defects: configuration, migration, clustering4.1 Modelling of SIA defects and clusters in a-Fe and a-Fe-Cr 1 1 24.2 Essessment of experimental techniques to characterise SIA clusters 1,5 1,5 1,5 4,54.3 Identification of SIA configurations, transitions and mobility in a-Fe 0,5 2 2 4,54.4 Identification of SIA defects in bcc non-magnetic transition metal: the case of W 0,5 2 2 4,54.5 Identification of He mechanisms in α-Fe 2 2 2 64.6 Effect of composition on irradiation induced defects in ferritic alloys 0,5 1 1 2,5Sub Total 6 9,5 8,5 24Kinetic Pathway of the microstructure to high dose and He & H contents 05.1.2 High dose microstructure of UHP α-Fe and α-Fe+C under dual beam 2 2 1 55.2.1 High dose microstructure of α-Fe-Cr-C-W model alloys and Eurofer under dual beam 2 2 1 55.2.2 High dose microstructure of Eurofer under triple beam 1 1 0,5 2,5Sub-Total 5 5 2,5 12,5Under Irradiation Phase Stability 06.1 Phase separationin Fe-9Cr, Fe-12Cr, Fe-14Cr and EUROFER 0,5 1 1 2,56.2 Phase stability of ODS ferritic steels 0 2 2 46.3 W alloys 0 0 0 0Sub-Total 0,5 3 3 6,5Mechanical Properties 07.1 Microscale Technology (MST) applied to ion implanted ferrous alloys 0 0,5 0,5 17.2 In-situ tensile testing of ion implanted ferritic alloys 0,5 0,5 0,5 1,57.3 Dislocation-defect interaction in pure α-Fe and Fe-Cr alloys 0,5 0,5 0,5 1,5Sub total 1 1,5 1,5 4TOTAL 12,5 19 15,5 47
- For T<0.45Tm, will an ODS steel with a matrix
demixed into α/α’ suffer from channelling when yielded at low temperature (T<0.3 Tm)?
- For T>0.45Tm, will the radiation modified particles
still be strong obstacle to dislocation in the creep range?
- Under irradiation will the ODS still be effective in
reducing creep straining controlled by irradiation creep mechanisms?
are questions that are not understood enough to be studied step-wise on model materials and need to be studied on the actual materials. CONCLUSIONS
Table 2 summarizes the task and associated manpower. The time-schedule of the manpower is not optimized but the total is relevant. REFERENCES
[1] M. Victoria, G. Martin and B. Singh, The Role of the
Modeling of Irradiation Effects in metals in the European Fusion Materials Long Term Program.
[2] C. C. Fu, J. Dalla Torre, F. Willaime, J-L. Bocquet
and A. Barbu, Nature Materials, vol. 4, p. 6 (2005), [3] C. C. Fu and F. Willaime, Ab-initio study of Helium
in a-Fe: dissolution, migration and interaction with vacancies.
Report DMN/SRMP/NT/2005-002/A. Task TW4-TTMS-007. TASK LEADER
Alain BARBU DEN/DMN/SRMP CEA-Saclay F-91191 Gif-sur-Yvette Cedex Tel. : 33 1 69 08 43 49 Fax : 33 1 69 08 68 67 e-mail : [email protected]

- 257 - EFDA Technology / Tritium Breeding and Materials / Structural Materials Development / Advanced Materials
TW3-TTMA-001-D04 TW3-TTMA-002-D04
Task Title SiC/SiC CERAMIC COMPOSITES AND DIVERTOR AND PLASMA FACING MATERIALS
INTRODUCTION
The objective of these tasks is to irradiate in a common rig SiC/SiC ceramic composites and tungsten alloys samples at two temperatures, i.e., 1000°C and a lower temperature approximately of 600-650°C. The dose foreseen is about fluence of 5.101 n.cm-2.5 dpa equivalent Fe. This irradiation experiment will be performed in the OSIRIS reactor at CEA-Saclay. The first step of this work consists on the design of the corresponding irradiation capsule based on the requirements defined by EFDA for this irradiation experiment, i.e., fluence level, temperature distribution, environment, materials, type, number and dimensions of specimens. As said before, two families of materials are planned to be irradiated in this experiment, that is, several types of SiCf/SiC ceramic composites and refractory tungsten-based alloys, all of them supplied by EFDA. 2005 ACTIVITIES
EFDA delivered the samples of W-alloys and SiC/SiC composite for this experiment, named “FURIOSO” (FUsion RIg OSiris irradiatiOn), during june-july 2005.
Materials were delivered as machined specimens ready for irradiation. All specimens were identified by laser engraving; also the dimensions of each individual sample were determined to proceed to the final distribution of specimens in different baskets. The final design of the irradiation capsule was adjusted to the actual dimensions of each sample. The design of furnaces and gas circuit systems was finished and the fabrication of them as well as the irradiation capsule was launched in the 2nd half 2005. LOADING PLAN Table 1 presents the loading plan, which summarises the materials and the characteristics of specimens (type, dimensions and number) that will be irradiated in this experiment. Different nuances of SiC-SiC ceramic composites are considered for irradiation: 2D and 3D-composites supplied by EFDA and manufactured in Europe by MAN Technology (Germany); 2D-NITE material from Japan and two types of composites supplied by ORNL (U.S.). These materials are included as specimens for mechanical tests (tensile and bending tests) and as samples for measurements of thermal diffusivity. Concerning tungsten, two types of alloys will be included in the rig, one containing lanthanum oxide (W-1%La2O3) and other with potassium addition (W-K). These materials will be irradiated as plate tensile specimens and Charpy V subsize (KLST) samples destined to bending tests.
Table 1: Loading plan: distribution of different materials and specimens in the rig
Temp. (°C) Basket # EU-3D EU-2D J-NITE US W1 W2
TOP 1 5Ch+3T192 5Ch+3T19
34Bend+
5T45 5T454 4Bend 6Bend5 8T40 8T406 5D10 5D10 5D6 5D6
7 5D10 5D10 5D6 5D68 8T40 8T40
1000°C 9 4Bend 6Bend
104Bend+
5T45 5T4511 6Ch+3T19
BOTTOM 12 6Ch+3T19
T40 : Tensile 4x2x40 16 16T45 : Tensile 4x2x45 10 10Bend : 4x3.5x45 16 12D6 : Diffusivity 0 6x2.5 thick 10 10D10 : Diffusivity 0 10x2.5 thick 10 10Ch : Charpy KLST 11 11T19 : Tensile 5x1x19 6 6(dimensions in mm)
Isolating region
Total number of specimens
Composites SiC / SiC W- alloys
600°C

- 258 - EFDA Technology / Tritium Breeding and Materials / Structural Materials Development / Advanced Materials
IRRADIATION RIG The irradiation rig will be constituted of two capsules, one that will work at 1000°C and the other at 600°C. Figure 1 shows a scheme of one irradiation temperature section of the sample holder. Each section is constituted of six baskets to locate the samples. SiC/SiC composite specimens occupy four baskets and W- samples are distributed in the two others.
Figure 1: Scheme of one irradiation temperature section constituted by six baskets for the distribution of different
types of specimens.
The same distribution and number of samples is considered for each irradiation temperature. Figure 2 presents the details of the six baskets constituting one irradiation-temperature capsule. A mock-up of the assembly (baskets and holders), shown in figure 1, was manufactured to check the fitting of different components. The main concern in the design was related to the temperature distribution in the device because the materials behaviour is strongly dependent on the irradiation temperature. This parameter depends on the rig’s position in the reactor core (gamma heating), the geometry of the sample holders, dimensions and shape of specimens. A powerful furnace was designed, and the fabrication is in progress, to guarantee the regulation and control of specimen’s temperature during irradiation. Besides the heating system, the temperature will be also regulated, using a flowing mixture of inert gas (helium-neon), inside and outside the sample holder that allows a better control and regulation of temperature.
6
3
6
3
4
10
10
16
10
10
N.
4*3*27
5*1*27
4*3*27
5*1*27
4*3.5*45
4*2*45
4*3.5*45
4*2*40
∅6*2.5
∅10*2.5
Geometry
1020-1070°CW12
1050-1100°CW11
960-1015°CSiC10
950-1010°CSiC9
950-1020°CSiC
8
Disposition ofsamples
1000-1030°CSiC7
Range oftemperature
Kindof sample
N°
6
3
6
3
4
10
10
16
10
10
N.
4*3*27
5*1*27
4*3*27
5*1*27
4*3.5*45
4*2*45
4*3.5*45
4*2*40
∅6*2.5
∅10*2.5
Geometry
1020-1070°CW12
1050-1100°CW11
960-1015°CSiC10
950-1010°CSiC9
950-1020°CSiC
8
Disposition ofsamples
1000-1030°CSiC7
Range oftemperature
Kindof sample
N°
Figure 2: Geometry, dimensions and number of samples distributed in the capsule that will be irradiated at 1000°C. The same distribution is considered for the
section at 600°C. Consequently, inside the capsule, samples will be in contact with a circulating gas mixture of helium and neon. The dimensions of all specimens were checked to adjust the foreseen distribution of samples and finalise the design of each sample-holder aiming to control the contribution of the gas gap responsible to the irradiation temperature. The monitoring of temperature will be performed with thermocouples located in the sample holder. FUTURE WORK
The fabrication of the irradiation capsule, the furnaces and the gas circuit systems were launched during 2005. Their delivery is expected in the 1st half 2006 and the start of the irradiation just after. TASK LEADER
Ana ALAMO DEN/DMN/SRMA CEA-Saclay F-91191 Gif-sur-Yvette Cedex Tel. : 33 1 69 08 67 26 Fax : 33 1 69 08 71 67 e-mail : [email protected]

- 259 - EFDA Technology / Tritium Breeding and Materials / Structural Materials Development / Advanced Materials
TW5-TTMA-001-D08
Task Title: MODELLING OF THE MECHANICAL BEHAVIOUR OF ADVANCED 3D SiCf/SiC COMPOSITE
INTRODUCTION
The work performed in 2005 consists in the implementation in CAST3M of two new constitutive laws adapted to SiCf/SiC composite. These laws were developed at ONERA (French National Office for Aerospace Research). These new models, with convenient material parameters, obtained from 0° and 45° traction compression tests on woven SiCf/SiC, allow to reproduce the experimental macroscopic behaviour of this composite. Comparison of CAST3M and ZeBuLoN (ONERA finite element code) results were performed.
2005 ACTIVITIES
SCALAR AND PSEUDO-TENSORIAL MODEL (CONSTITUTIVE LAWS) Models developed at the ONERA allow taking into account various phenomena observed during ceramic matrix composite testing.
Figure 1: Different damage variables and main phenomena taken into account in the scalar and pseudo-tensorial models. Fibres are along directions 1 and 2
Active damage
2 internal variables for each mechanism: d i : density η i : deactivation index
Scalar model Pseudo-tensorial model 3 damage variables (d1, d2, d3) 5 damage variables (d1, d2, d3, d-45, d+45)
Passive damage
d1 d3
d2
d1 d3
d2 1
3
2
Formulation with storage
d+45
d-45
Progressive closing
Residual strain

260 EFDA Technology / Tritium Breeding and Materials / Structural Materials Development / Advanced Materials
These models include: i) the initial and damage induced anisotropy (with the eventual lost of orthotropy), ii) damage kinetics for the different cracking modes (different cracks families defined by their orientations), iii) damage deactivation and progressive cracks closure, iv) residual strains induced by damage and residual fabrication stresses. The damage variables can be defined as scalar, vector or tensors. In the case of ceramic matrix composites, the cracks directions depend on the material structure but also on the loading directions. For these composites, ONERA developed a model called pseudo-tensorial which allows to take into account several orientations of cracks but remains easy to implement and to interpret contrary to tensorial model. The scalar and pseudo-tensorial models differ only by the cracks families taken into account (see figure 1). For the scalar model, three damage variables associated with the principal axes of the material are defined. In the pseudo-tensorial model two additional damage variables are considered respectively in the directions +45° and -45° with respect to the orthotropy directions. The pseudo-tensorial model allows to take into account the loss of orthotropy in out-of-axis tests. COMPARISON WITH EXPERIMENTS The general characteristics of the experimental and calculated traction compression curves show good agreement for both in-axes and out-of-axes tests (CAST3M calculations were performed in this case on a single 8 nods cubic element). In the case of 45° (angle
between the tensile direction and the first fibre direction) traction compression test, the pseudo-tensorial model that allows 2 additional cracking directions compared to the scalar one reproduces better the out-of-axes behaviour (see figure 2.1 and 2.2). During recompression, while the scalar model shows a decrease of the Young modulus (not observed experimentally), the pseudo-tensorial model reproduces better the experimental curves. COMPARISON CAST3M AND ZeBuLoN IN THE CASE OF A NOTCHED PLATE In order to verify the good implementation of the models in CAST3M, results obtained in the case of a notched plate submitted to traction in the direction (0/90°) with respect to the fibres directions were compared with ZeBuLoN results. Despite to the fact they do not correspond to the same view point, it can be seen from figures 3 and 4 that the damage calculated from the two codes agree as well as for their localisation and their intensity. The damage d1
corresponding to cracks planes perpendicular to the fibre direction named 1 (see figure 1 for damage variables definition) is displayed in figure 3. It develops mainly perpendicular to the tensile direction. Figures 4.1 and 4.2 indicate that the damages corresponding to cracks plane perpendicular to the direction at 45° and – 45° from the first fibre direction, this is to say d+45 and d-45 develop mainly respectively orientated at -45° and 45° with respect to the tensile direction. There is no damage in the plane perpendicular to the second fibre direction (itself perpendicular to the tensile direction) so that variable d2 is identically equal to zero.
-2,5E+08
-2,0E+08
-1,5E+08
-1,0E+08
-5,0E+07
0,0E+00
5,0E+07
1,0E+08
1,5E+08
2,0E+08
2,5E+08
-1,0E-03 -5,0E-04 0,0E+00 5,0E-04 1,0E-03 1,5E-03 2,0E-03 2,5E-03 3,0E-03 3,5E-03 4,0E-03
Strain
σ (
Pa)
epsilon L pseudo-tensorialepsilon L scalar
epsilon T pseudo-tensorialepsilon T scalar
Figure 2.1: 45° tension/compression test
Experimental results on a woven SiCf /SiC [1]. εL: longitudinal strain, εT: transversal strain.
Figure 2.2: 45° traction-compression test. Pseudo-tensorial and scalar model results.
Longitudinal strain, εL, transversal strain, εT.

- 261 - EFDA Technology / Tritium Breeding and Materials / Structural Materials Development / Advanced Materials
0 0.99 2.33
Figure 3.1:Damage variable d1 , ZeBuLoN
Figure 3.2: Damage variable d1, CAST3M
0. 0.67 1.34
Figure 4.1: Damage variables d+45 (left) and d-45 (right), ZeBuLoN.
Figure 4.2: Damage variables d+45 (left) and d-45 (right), CAST3M.
CONCLUSIONS
The new models for SiCf/SiC thermo-mechanical modelling were successfully implemented in CAST3M. They were used to model a divertor using the same mesh and loading as those described in the previous work of A. Li puma et al. [2]. The results reported in [8] indicate, as for elastic calculations and those performed with the previously developed model [3], that the Tauro criteria is exceeded on the inner wall (inner surface) but with a less important extent. Due to the additional damage directions taken into account, damage distribution is more physical using the pseudo-tensorial model. The new laws could also be used in the future to model the lower scales of SiCf/SiC such as plies, fibres or matrix. The materials parameters in the lower scales could be identified by the inverse method. In the next years, implementation in CAST3M of multiscale modelling adapted to SiCf/SiC will be continued.
REFERENCES
[1] P. Ladevèze, A. Grasser and O. Allix, Journal of
Engineering Materials and Technology, 116 (1994) 331-336.
[2] A. Li Puma, L. Giancarli, Y. Poitevin, J. Szczepanski,
Rapport DM2S/SERMA/LCA/RT/02-3189/A.
[3] G. Aiello, Utilisation des composites à matrice céramique SiCf/SiC comme matériau de structure de composant interne du tore d’un réacteur à fusion, Thèse de Doctorat, Université d’Evry Val d’Essonne, Thesis (2001), EVRY0002.

- 262 - EFDA Technology / Tritium Breeding and Materials / Structural Materials Development / Advanced Materials
REPORTS AND PUBLICATIONS
[4] C. Guerin, ‘Multi-scale modelling for SiCf /SiC composites, Preliminary considerations to an implementation in CAST3M’. DM2S/SEMT/LM2S/RT/04-001/A, january 2004.
[5] J. F. Maire and N. Carrère, ‘Modélisation multi-échelles des composites SiCf /SiC. Définition des potentiels thermodynamiques et de dissipation pour les différents constituants du composites SiCf /SiC. ONERA Report RT 1/09795/DMSE – mars 2005.
[6] N. Carrère and J. F. Maire, ‘Modélisation multi-
échelles des composites SiCf /SiC. Fourniture des éléments nécessaires à l’implémentation d’une méthode de changement d’échelle pour les passages micro-méso et méso-macro adaptée au SiCf /SiC’ ONERA Report RT 2/09795/DMSE – mars 2005.
[7] C. Rospars, N. Carrere, J. F. Maire and C. Guerin,
‘Multi-scale modelling of the thermo-mechanical behaviour of SiCf /SiC advanced composite. Definition of the constitutive laws and gathering of the data necessary for the implementation in CAST3M’. DM2S/SEMT/LM2S/RT/05-016/A.
[8] N. Carrère, J. F. Maire and F. Laurin ,
‘Modélisation multi-échelles des composites SiCf /SiC. Fourniture des éléments nécessaires à l’implémentation d’une méthode de changement d’échelle pour les passages micro-méso et méso-macro adaptée au SiCf /SiC’ ONERA Report RT 2/09795/DMSE – décembre 2005.
[9] N. Carrère, J. F. Maire, F. Laurin, O. Fandeur and
C. Guerin, ‘Implementation in CAST3M of new models developed at ONERA for SiCf/SiC composite. Comparison of CAST3M and Zebulon Results. Tests and application to the case of a divertor’. Report DM2S/SEMT/RT/05-034.
TASK LEADER
Caroline GUERIN DEN/DM2S/SEMT/LM2S CEA-Saclay F-91191 Gif-sur-Yvette Cedex Tel. : 33 1 69 08 53 52 Fax : 33 1 69 08 86 84 e-mail : [email protected]

- 263 - EFDA Technology / Safety and Environment
TW3-TSS-LT4
Task Title: ANALYSIS OF TWO DOMINANT ACCIDENTAL SEQUENCES OF THE PPCS MODEL D: MAIN PHYSICAL PHENOMENA AND FIRST ASSESSMENT
INTRODUCTION
In the scope of the safety study of the various models of fusion reactors defined in the Power Plant Conceptual Study launched by EFDA (PPCS model A, B C, D & AB), assessment elements – and among them, first order calculations - of the dominant accident sequences of the PPCS model D (see [1]) are summarized hereafter. Based on the results of previous studies that have given some characteristics of PPCS model D such as the potential activation and decay heat [2] and the temperature transient in a Loss of Coolant Accident (LOCA) [3], safety performance of the model D has been first assessed [4] on qualitative grounds, the conclusion being that this performance “would be at least as good as those of Models A and B”. Otherwise, the complementary study [5] based on a Functional Failure Mode and Effect Analysis (FFMEA) has allowed to identify the accident sequences representative for Model D as possible objects of ulterior deterministic assessment. The present work, fully described in [6], aims to quantify the conclusion of [4] by simple parametrical computations
detailing the possible evolution of two dominant accident sequences. PRELIMINARY REMARKS ABOUT PHENOMENOLOGY The Pb-Li mass entering the VV will not undergo any major change of state. Due to the cryo-pumps, a Pb-Li cold plug in the divertor zone will keep all the Pb-Li mass inside the VV. The hot Pb-Li jet onto the VV walls will induce very high stresses in the VV walls and a subsequent loss of confinement may reasonably be postulated. IN-VESSEL LOCA Description (see figure A) An in-vessel break of a blanket module is postulated, inducing a Pb-Li ingress inside the VV. After Pb-Li has flown into the VV, an ex-vessel break of the same primary loop generates a consequential air ingress inside the VV. The heating-up of the air inside the VV will then induce the release of the VV radioactive contamination. Detailed values of each parametric study may be found in [1] with the general hypothesis taken into account.
= Lost
Internal HX break
Expansion volume
In-VV LOCA
Loss of VV confinement (delayed)
Figure A: Major Accidental Sequences

- 264 - EFDA Technology / Safety and Environment
Three successive main steps are observed: 1- Pb-Li flows out the primary loop by gravity The emptying process takes less than 125 s.
Figure 1: Pb-Li emptying the primary loop VV 2- Following a postulated loss of VV-confinement, air
enters the VV Air pressurizes the VV it up-to 1 bar in less of 12 s.
Figure 2: VV pressurization by air
3- A long term process of heat and air exchanges begins. The parametric study shows that the VV air renewal is of about 2 (± 1.2) VV/h in any case (1 or 2 breaches located at the bottom or at the top of the VV).
Figure 3: Renewal rates in case of one or two VV-wall
breaches
IN-VESSEL LOCA WITH INTERNAL HX BREAK Description (see figure A) An in-vessel break with multiple HX pipe ruptures is postulated at the same moment. In this case, emptying of the primary loop is speeded up by high pressurized He and VV undergoes a quicker Pb-Li ingress followed by a He ingress that may actuate the expansion volume. A loss of VV confinement is then postulated. Four successive main steps are observed: 1- Pb-Li flows out the primary loop under He pressure
The emptying process takes less than 55 s.
Figure 1: Pb-Li emptying the primary loop VV
2- He fills the VV volume
The VV pressurization may reach up to 3.6 MPa without actuation of the expansion volume (a 68000 m3 one, similar to the PPCS model B, would reduce the final pressure down to 0.14 MPa, well under the VV operational value). 3- The loss of VV confinement induces He goes out and air
entering
The VV pressure becomes atmospheric in less of 6 s.
Figure 2: VV depressurization
4- A long term process of heat & mass transfers occurs
between the VV and the hall
The heat & mass transfers between the VV and the hall deal with an always-lower He mass as time goes on. After no He is left, the VV air renewal is similar to the one of the first LOCA.
0
20
40
60
80
100
120
140
160
180
0 20 40 60 80 100 120 140
Time (s)
V (m3)
0
0,2
0,4
0,6
0,8
1
1,2
0 2 4 6 8 10 12 14
Time (s)
Rel
ativ
e P
ress
ure
P/Pext
VV Renewal Rates (VVvol/h)
0
0,5
1
1,5
2
2,5
3
3,5
0 20 40 60 80 100 120
Internal convection as parameter
-20
0
20
40
60
80
100
120
140
160
180
0 10 20 30 40 50 60
V (m3)
0,00
0,20
0,40
0,60
0,80
1,00
0 2 4 6 8
Time ( s)

- 265 - EFDA Technology / Safety and Environment
CONCLUSIONS
The parametric calculations done in the scope of the present first quantitative assessment of major accidental sequences (see [6]) deal with a succession of distinct steps: emptying of the coolant loops, VV pressure returning to atmosphere, heat & mass transfer between the VV and the hall with contamination transfer. The two first steps evolve very quickly (about seconds or minutes) and the last one is a long-term process with an air renewal of about 2 volVV/h. These first order results show a rather simple accidental evolution and a need of complementary assessment, in particular about the contamination; the thermo-mechanical behaviour of the VV walls submitted to a hot Pb-Li jet should also be addressed. REFERENCES
[1] L.GIANCARLI and al., “Conceptual Design of Model
D-Reactor based on self-cooled Lithium-Lead (SCLL) Blanket using SiCf /SiC Structures” Rapport CPT/RT/03-01
[2] R.PAMPIN-GARCIA and M.J.LOUGHLIN,
“Neutronic and Activation Calculations for PPCS Plant Models C and D”, PPCS/UKAEA/PPCS14D3-1, january 2003.
[3] R.PAMPIN-GARCIA, “Heat Transfer Analysis of the
Bounding Accident for PPCS Plant Models C and D”, PPCS/UKEAEA/PPCS14D3-2, may 2003.
[4] N.P.TAYLOR “Assessment of Performance of Plant
Models C and D in Bounding Accident Scenarios” PPCS/UKAEA/PPCS14D5.
[5] T.PINNA, R.CAPORALI, “Identification of Accident
Sequences for the Power Plant Conceptual Study Models C & D” FUS-TN-SA-SE-R-103. EFDA Task TW1-TRP-PPCS14-D02.
REPORTS AND PUBLICATIONS
[6] S.RABOIN ‘Analysis of two dominant accident
sequences of the PPCS model D: main physical phenomena and first assessment CEA/DEN/CAD/DER/SESI/LESA/NT DO 19 13 october 05.
TASK LEADER
Serge RABOIN DEN/DER/SESI/LESA CEA-Saclay F-91191 Gif-sur-Yvette Cedex Tel. : 33 1 69 08 34 68 Fax : 33 1 69 08 75 97 e-mail : [email protected]

- 266 - EFDA Technology / Safety and Environment

- 267 - EFDA Technology / Safety and Environment
TW4-TSW-002
Task Title: STUDY ON POSSIBLE CONCRETE DETRITIATION
INTRODUCTION
Tritium can migrate deep into concrete. From waste management point of view, it is of great importance to develop decontamination methods for concrete. The main objective of this task is to perform a measurement of tritium content in concrete sample and to test decontamination procedures with a minimum of concrete damage. The final goal remains the recycling or disposal of concrete. The report hereafter presents the studies performed by LPC laboratory of CEA-Cadarache. Samples received from JET have been measured, but too weak tritium content did not permit a fruitful study. To proceed on concrete, LPC took the decision to use concrete samples from a University reactor to be dismantled. Several tests have been performed, leaching, steam cleaning and thermal detritiation. At least, the goal of the detritiation processes is to reach the lowest category of waste for final disposal. Then, detritiation factors are one of the major parameters. The adopted strategy is to transfer the tritium contained in the tritiated waste to water. These processes allow the production of one effluent type (tritiated water) that can be treated in a specific detritiation facility or recycled in a water detritiation system. However it is important to reach a compromise between the waste final activities, the volume of the produced effluents and industrial feasibility (point not studied in the present work). Before testing different detritiation processes, a bibliography review has been done to answer two questions: - How tritium is inserted in the concrete, - What are the most promising decontamination
treatments. Then some experimental tests were performed to determine tritium content and evaluate efficiency of detritiation processes. This document summarizes the different obtained results and proposes some processes that seem to be the most effective. 2005 ACTIVITIES
LITTERATURE REVIEW In the scientist literature, there is little information on the tritium decontamination of concrete. But there is the description of a lot of concrete decontamination techniques. Here is a short presentation of concrete treatments.
Prior to this, it is interesting to understand the tritium insertion mechanisms in the concrete matrix and to know the various forms under which it could be founded. Most interesting and promising ones will be determined. Then among many concrete decontamination processes, a choice has been done [1]. Concrete structure Concrete is porous, its structure is hydrated and its specific surface area is very high. It is formed with the following chemical groups: CaO, Al2O3, SiO2, H2O and various oxide impurities. Water chemistry inside the concrete Water chemistry of concrete is fairly complicated. Concrete hydration is high and involves a number of reactions that results in a variety of hybrids and hydroxides as well as some free water of crystallization. In addition, the reactions of blending agents, such as fly ash, slag or silica fume, with Ca(OH)2 result in secondary reactions leading to various hydroxides and hydrosulfides. Tritium behaviour inside the concrete Assuming that the source of tritium is tritiated water form, HTO, one can postulate several pathways: - Movement of pore water through cracks and pores in
concrete, - Tritium exchange with hydrogen in the hydrated cement
components, - Gaseous species movement as HT through open pores
or cracks, - Diffusion of dissociated H+ ions or HT molecules
through the concrete crystal structure, - A combination of pore movement and diffusion of HTO
through pore-boundary materials under barometric or hydrostatic pressures.
To be efficient, detritiation processes must act at least on one of these mechanisms. Decontamination processes described in scientist literature Decontamination processes could be classified in 5 families: mechanical, chemical electrochemical, thermal and microbiological processes. The following processes are not specially dedicated to tritium decontamination, and their interest for this application will be discussed. Mechanical and physical processes Mechanical and physical processes are partly used inside detritiation scope and could be adapted to every type of surface: metallic, concrete... The goal is to remove the most contaminated layer of the concrete to decrease the waste volume. This technique increases the contamination of the waste, and thus the detritiation factor. Many techniques could be founded: sweeping, brushing, graving, grinding, polishing, scabbing, shaving and flatting.

- 268 - EFDA Technology / Safety and Environment
Chemical processes Chemical processes consist in a contact of the contaminated concrete with a solvent, an oxidizing or a chelating agent. The extracted agent separates the pollutant of the concrete waste. In our case, tritium should be eliminated. In the scientist literature, many solvents are used: H2O2, ammonium sulfate, O3… The extraction is realized with solvent vapor form. Oxidation with ozone [6] The principle of this process is the oxidation of tritium by ozone. Tritium is trapped as HTO. H2 + O3 H2O + O2 O2 + 2H2 2 H2O - This process seems to be not adapted to the treatment of concrete, because ozone premises to oxide organic molecules. So this process could be used to decontaminate organic waste (liquids, housekeeping…) Oxidation with H2O2 [6] The principle of this process is the oxidation of the tritium by H2O2 (hydrogen peroxide). Tritium will be trapped as HTO f. H2O2 H2O + ½ O2 H2 + ½ O2 H2O - According [6] Detritiation is very good for treatment of metallic surfaces and ceramics, but for concrete, experimentations should be made. Treatment with ammonia vapors or steam Ammonia is very aggressive with concrete. Concrete may be leached with ammonia (gaseous form). The same procedure could be realized with steam. For both processes, tritium is be flushed with the gaseous phase. HTO form is trapped in water and HT is oxidized to HTO, then trapped. - These processes are interesting and seem to be efficient. Ammonia treatment seems to be too aggressive and concrete may be damaged. HYTEC gas treatment The HYTEC gas (95% Ar; 5% H2) may enhance isotopic exchange. It has been used in other detritiation conditions like steel treatment [3]. - This isotopic exchange seems to be very adapted for the detritiation of porous materials, like concrete. It will be interesting to test it. Detergent, Surfactant washing [5] Detergents and surfactants are cheap, safe and can be used to increase the effect of water, - Mechanical stirring increases the effectiveness of detergents and surfactants. Their disadvantages include limited effectiveness for many surfaces and contaminants, possible foaming or ammonia release in waste treatment systems and difficulty in subsequent dewatering to concentrate removed contamination.
Electrochemical processes It is a potential difference applied to the concrete. The contaminated ions are moved inside the porosity of the concrete. Radioelement transfer is realized with a leaching solution. - This process is valid only for ionic and mobile radioelements. It is not the case of tritium. This process cannot be used. Thermal processes This process generates irreversible damages to the materials. They are generally used for deep contaminations and produced a lot of suspension particles, which would be treated. But detritiation results are encouraging and lead to low contamination residues. The tritium can be trapped in water. - In spite of the irreversible damages caused by the treatment, thermal detritiation will be an interesting way to process the waste before disposal. It is a surface treatment. Classical thermal processes This treatment uses various tooling: - Blowlamp - Electro-burner - Arc xenon lamp - Furnace (some tests are realized to the laboratory and
results are encouraging) Laser treatment [8] Laser either caused an ablation or a heating then damage to the hydraulic binders. In heating case, high power CO2 laser are used. With laser, concrete melting is reached. - There is no HTO production and the process is efficient. But the processing seems to be difficult and expensive when applied to large surface. Micro-waves treatment [4] The principle is to point the microwaves toward the concrete. The waves penetrate the concrete in the first centimeter and excite the water molecule. So water goes as steam and induces internal overpressures, which achieve local and superficial breaking in the concrete. But this technique is difficult to be set up and rather inefficient (burnt concrete in the middle of the spot, no effect on the contour). - This technique is not well adapted. Drying process [9] It is a controlled thermal treatment. It is used for rubbish solids and moist powdery waste. The treatment is realized on a vibrant-fluidized thermal bed. Radioactive contamination contained in water is extracted by evaporation. - This process may be adapted to tritium contaminated waste.
Balance: 3H2 + O3 3H2O
Balance: H2O2 + H2 2 H2O

- 269 - EFDA Technology / Safety and Environment
Micro-biological processes [4] This process allows the destruction of hydraulic binders of concrete. Micro-organisms (bacteria, fungus…) produce acids (nitric, sulfuric, organic…), which damage the concrete. - This technology type has an advantage; it produces a small volume of waste. But long treatment duration is necessary to obtain degradation: for about one centimeter one year is necessary. It is only a surface attack. CONCLUSIONS
From the waste management point of view, two ways are proposed: recycling or disposal: - In the case of a recycling way, the treatment could be
done in-situ or ex-situ:
- For an in-situ way, the most interesting treatments are high-pressure water washing, chemical treatments with ammoniac or water vapors or isotopic exchange.
- For an ex-situ way, the most interesting processes are chemical treatments with ammoniac or water vapors, isotopic exchange or drying process.
- In the case of a disposal way, it seems to be more
advisable to combine two treatment techniques in particular, when the concrete treatment is realized ex-site:
- A first mechanical step (by cutting for
example) allows decreasing the volume of the most contaminated waste (in the first centimeters).
- This part could be treated by chemical or thermal techniques before the disposal and the less contaminated part could be managed as a TFA waste and stored by ANDRA. Different techniques could be used like chemical treatments with ammoniac or water vapors, isotopic exchange or drying process
EXPERIMENTAL MEASUREMENT MEASUREMENT FOR TRITIUM CONTENT Samples have been analyzed for the evaluation of tritium level in the bulk. To reach a full detritiation 2 ways have been chosen: - Thermal detritiation until 1050°C. This technique
allows the release of tritium (it was certificated with a chemical mineralization done on the residue coming from the furnace).
- Full chemical dissolution of concrete.
The first attempt was thermal detritiation with 2 steps: 3 hours at 450 °C and 1 hour at 1050°C. The procedure is described in [3]: a tight hastelloy device containing the sample, put in an oven, flushed by a gas to evacuate tritium compounds and heated at selected temperature. Gas exhaust is collected in bubblers, tritiated water is trapped first then other tritium compounds are converted as HTO and collected Sample weights were about 100 g for each concrete piece, it may be noticed that exhausted tritium is mainly water. This means that tritium is combined in concrete as, hydroxide. CHEMICAL DECONTAMINATION Leaching It may be noticed that extracted tritium from concrete is mainly as tritiated water HTO.
Tests on concrete from University reactor: One of the ways to detritiation consists in a leaching of concrete with different solutions, this operation remains easy to set and economically interesting. The samples the LPC worked on, were not really defined for the geometry, this means that no information was provided to identify: the face exposed to tritium , the thickness…So the study consisted to evaluate the tritium content in the bulk and not in thin layers. Leaching studies were performed with 3 different reagents: - Hydrogen peroxide at low concentration at steam
temperature - Gaseous ammonia - Hot water Procedure The experiment device has been set to extract tritium species and recover the species in MARC 7000® apparatus and counted by liquid scintillation on a PACKARD®. Because of the heterogeneity of concrete, the whole sample was fully detritiated at 1050°C, after each leaching procedure; to get the tritium content in sample enabling the determination of decontamination factor (DF). Results are listed in table hereunder:
Leaching Procedure
Sample Weight
(g)
Tritium extracted (kBq/g)
Total tritium Content (kBq/g)
DF ER
H2O2 17.9 0.10 9.32 1.01 ~1%
NH3 22.8 0.06 0.24 1.33 ~26 %
Hot H2O 28.9 0.56 1.07 2.10 ~53 %
Results obtained for different leaching experimentations. ER = Extraction Rate
DF = Detritiation Factor

- 270 - EFDA Technology / Safety and Environment
Discussion Leaching studies were operated at temperature of about 100°C, to enhance the detritiation mechanism. The selection of hydrogen peroxide at low concentration of 3 % (for safety consideration) has been decided to add an oxidizing reagent to water. Despite this, the decontamination factor remains poor and not satisfactory. The choice of ammonia was considered regarding the chemical composition of concrete that is mainly basic with calcium hydroxide matrix, this allowing an isotope exchange with hydrogen without strong matrix destruction. The DF is better but not yet satisfactory. Finally hot water has been tested, because of its easy use and safety, surprisingly this is the best leaching reagent, however far from the hope of a high decontamination factor of, at least 90%. - Due to a low efficiency of these methods, it seems interesting to value thermal detritiation methods efficiencies. THERMAL DECONTAMINATION Study of the kinetics for concrete detritiation A furnace is used to study the detritiation kinetics of concrete sample; about 100 g is sampled. Figure 1 shows the evolution of extracted tritium from sample according to the temperature. Most of the tritium is extracted at 500°C. This may come from the inertia of the furnace thus the temperature could be slightly lower.
Evolution of the detritiation according to the temp erature
0
10
20
30
40
50
60
70
80
0 100 200 300 400 500 600 700 800 900 1000 1100 1200
Temperature (°C)
Ext
ract
ed a
ctiv
ity (
kBq)
Figure 1
DETRITIATION OF CONCRETE AT LOWER TEMPERATURES It was checked whether detritiation could be efficient at lower temperatures. About 60% of tritium is extracted during 300°C and 400°C steps. The hypothesis of the delay is confirmed. To realize the tritium balance, a chemical mineralization is done on the sample.
Other experimentations should be done to optimize the sample decontamination.
Figure 2 CONCLUSIONS
Leaching studies were operated at temperature of about 100°C, to enhance the detritiation mechanism. Chemical detritiation has been studied with hydrogen peroxide at low concentration, ammonia and water as gaseous form. The obtained decontamination factors remain poor and not very satisfactory. Because of the low efficiency of these low damages methods, it was interesting to value the thermal detritiation methods efficiencies. Detritiation in a furnace is efficient and the study shows that detritiation at temperatures less than 500°C is possible on small parts of concrete (gravels), in particular in the case of ex-situ treatment of concrete. To complete this study it would be interesting to make experiments of detritiation efficiency with other techniques, in particular water washing, blasting, drying process and isotopic exchange with HYTEC gas. The efficiency of leaching with hot water is not as efficient as annealing but this last method causes damages on the concrete structure. Depending on the goal to reach and constraints, both methods could be foreseen. The efficiency is better with the second one, but damages are higher. For annealing treatment, an optimization of the better couple of parameters (temperature and duration) could be done. REFERENCES
[1] G. G. Eichholz. W. J. Park and C. A. Hazin.
"Tritium penetration through concrete". Waste management. Vol. 9. pp. 27-36 (1989).
[2] O. GASTALDI ”Description of the handling of
mixed waste packages from ITER foreseen depositories”. Technical document DTN/STPA/LPC 2005/016 (EISS document SL42-DEL-0001)
Evolution of tritium activity during the experiment ation
0
20
40
60
80
100
120
Rise to300°C
Step to300°C
Rise to400°C
Step to400°C
Rise to500°C
Step to500°C
Rise to600°C
Step to600°C
Chemmin
Activ
ité (k
Bq)

- 271 - EFDA Technology / Safety and Environment
[3] O. GASTALDI, A.M. BRASS, J. CHENE, P. TRABUC “Waste management - Study of tritium behaviour in steel: surface activity and desorption kinetics reduction and detritiation. Role of microstructure (EFDA task TW1-TSW002)”. Technique document DTN/STPA/LPC 2005/005
[4] A. Jestin "Définition d'un procédé de bio-
décontamination des liants hydrauliques des infrastructures nucléaires".
[5] Market assessment decontamination of radiologically
contaminated concrete. U.S. Department of Energy. prepared by Global Environment and Technology Foundation. Annandale. VA 22003. December 1996.
[6] Princeton Plasma Physics Laboratory. Présentation
PowerPoint. "comparison and evaluation of various tritium decontamination techniques and processes".
[7] Techniques de l’ingénieur B3930 "Déclassement et
démantèlement des installations nucléaires". [8] B. Tirumala Rao. Harish Kumar. A.K. Nath.
"Processing of concretes with a high power CO2 laser". Optics and Laser Technology. volume 37. pp. 348-356 (2005).
[9] http://www.stmi.fr
TASK LEADER
Christian POLETIKO DEN/DTN/STPA/LPC CEA-Cadarache F-13108 Saint-Paul-lez-Durance Cedex Tel. : 33 4 42 25 64 93 Fax : 33 4 42 25 72 87 e-mail : [email protected]

- 272 - EFDA Technology / Safety and Environment

- 273 - EFDA Technology / Safety and Environment
TW5-TSS-SEA3.5
Task Title: IN-VESSEL SAFETY: MITIGATION OF HYDROGEN AND DUST EXPLOSIONS
INTRODUCTION
In 2002-2004, the Heat Transfer and Fluid Mechanics (LTMF) laboratory of CEA Nuclear Energy Division in Saclay performed H2 risk related studies for the ITER vacuum vessel. Numerical simulations were performed with the CAST3M code and code to code comparisons were made with the GASFLOW and COM3D/DET3D codes of FZK. In 2005, no new numerical simulations were performed but instead, a synthesis of the performed numerical work was made, focussing on the development and validation needs for the CAST3M code, with respect to hydrogen distribution and combustion, dust mobilization and explosions. A long-term R&D programme proposal was also made and submitted to EFDA. Finally, with the realisation that unmitigated accidents pose unacceptable risks, a thorough bibliographic review of inerting mitigation techniques was made, together with a proposal for performing experiments in the MISTRA facility of CEA Saclay to evaluate the effectiveness of the method to inert hydrogen clouds, as well as to prevent dust explosions. 2005 ACTIVITIES
Three deliverables were produced in 2005. A proposal of a detailed R&D programme to be carried out in CEA in the areas of hydrogen and dust explosions – and associated mitigation, was made. It consists of a code development and validation programme, together with an experimental programme mainly dedicated to the study of mitigation by inerting (see [1]). A very thorough bibliographic review of inerting strategies for the mitigation of hydrogen and dust explosions was performed.
Some interesting results coming from the non-nuclear industry were highlighted, such as the comparative properties of different inerting gases for different thermodynamic conditions. In terms of mitigation strategy, emphasis is placed on the control of oxygen concentrations rather than hydrogen or dust particle concentrations. In this report, a test programme in CEA’s MISTRA facility is also proposed to evaluate the efficiency of different inerting strategies (see [2]).
Figure 1: MISTRA facility at CEA Saclay: 100 m3 vessel with annular compartment and various gas injection
locations, and well-instrumented for gas concentration measurements suitable for CFD code validation.
Finally, the status of CEA’s CAST3M code development and validation with respect to hydrogen and dust mobilization and explosions was made. Flow models developed for hydrogen risk in fission reactors as well as the associated validation efforts were described. A synthesis of the simulation work performed for ITER accident scenarios was also made, identifying the specific development and validation needs that are required, for both hydrogen distribution and combustion, as well as dust mobilization and explosion (see [3]).
Figures 2: 3D Mesh and CFD calculations of H2 distribution in the ITER vacuum vessel, performed in 2002-2004 with the CAST3M code

- 274 - EFDA Technology / Safety and Environment
FUTURE WORK In 2006, modelling work in the area of dust mobilization will be performed, with the development of a two-fluid (gas and dust particles) model, and validation on appropriate experiments such as FZK’s dust tube and ENEA’s STARDUST experiments. This work will be performed in close collaboration with FZK. Depending on call for proposals, an experimental programme in MISTRA to investigate different inerting strategies might be initiated, following the desk study made in D2. REPORTS AND PUBLICATIONS
[1] Detailed proposal of a CEA R&D programme for
2005-2008 to deal with H2 and dust explosions issues and associated mitigation strategies. H. Paillère, (Report sent to EFDA.february 2005)
[2] Desk study on available methods and strategies for
mitigation of H2/dust explosions. I. Tkatschenko, Technical Report CEA SFME/LTMF/RT/05-059/A. january 2006.
[3] Status and future needs of development and
validation of CAST3M code. H. Paillère et al. Technical Report SFME/LTMF/RT/06-004/A. january 2006.
TASK LEADER:
Henri PAILLERE DEN/DM2S/SFME/LTMF CEA-Saclay F-91191 Gif-sur-Yvette Cedex Tel. : 33 1 69 08 84 09 Fax : 33 1 69 08 82 29 e-mail : [email protected]

- 275 - EFDA Technology / Safety and Environment
Pressurizer
Vacuum vessel
Phase separator
Water line
Steam line
Deflector plate
Cryogenic plate
Figure 1: View of the EVITA facility
ate
TW5-TSS-SEA5.3
Task Title: CRYOGENIC EXPERIMENTS ON THE CEA EVITA FACILITY
INTRODUCTION
The computer codes which are used for the analysis of the accidental sequences in ITER should have good quality assurance level. The EVITA facility (figure 1) has been designed for the simulation of the physical phenomena occurring during a coolant ingress into the cryostat of ITER reactor, which is one of the identified accidental sequence in the ITER safety report. Studied physical phenomena are namely ice formation on a cryogenic structure, heat transfer coefficient between walls and fluid, flashing, two-phase critical flow. The comparison between calculations and experiments allows the ability of the computer codes to treat the relevant physical phenomena to be assessed. The EVITA programme is supported by the EFDA and it is also an item of an implementing agreement under the auspices of the International Energy Agency. The main experimental results are the pressure evolution in the vacuum vessel, the different heat exchanges and the ice formation on the cryogenic surface. 2005 ACTIVITIES
EXPERIMENTS The 2005 test matrix (10 tests) was defined [2] with the EFDA participants agreement. The main objective of this third series, denoted 7.xx, was to perform a selection of complementary tests, in order to complete the experimental program by putting the emphasis on the ice
formation kinetics on the cryogenic plate and on the vacuum vessel pressure which occurs during water /steam leakage with and without simultaneous non-condensable gas flow rate. MAIN RESULTS ICE MASS KINETICS The ice mass kinetics (with and without non condensable gas) are reported on figure 2 and 3. In both cases, the ice layer grows swiftly during the first seconds (300 s) or water injection and 120 s for steam injection) and then increases very slowly in an asymptotic way until the end of the experiment. The ice mass is calculated by using the mass of steam still in the vacuum vessel at the end of the steam/water injection. The mass of steam is estimated using the steam density at the final vacuum vessel pressure. VACUUM VESSEL PRESSURIZATION Case of water injection The evolution of the internal pressure of the vacuum vessel during the tests is reported on the figure 4. It must be pointed out that during experiments performed without non condensable gas injection, the internal pressure increase more swiftly after condensed water has appeared in the vessel (see figure 4 tests 7.7 & 7.8). Comparing tests performed during 2004 and 2005 and the previous test denoted 5.4 x, the final pressure is respectively lower for the former than the latter one. This phenomenon has not been explained yet.

276 EFDA Technology / Safety and Environment
Figure 2: Case of steam injection with and without non condensable gas:
kinetics of the ice layer formation on the cryogenic plate.
Figure 3: Case of water injection with and without non condensable gas:
kinetics of the ice layer formation on the cryogenic plate
Case of steam injection The evolution of the internal pressure of the vacuum vessel is presented in figure 5. One can notice that the curves are quite different even for experiments whose incoming flowrates are almost the same. The examination of the measurements of the pressurizer parameters has shown that the main difference noticed between the whole tests performed without non condensable gas seems to be the duration of the flushing operation of the injection line performed before the beginning of the injection of steam into the vessel.
No evidence has been found to demonstrate the dependence of the initial experimental conditions on the efficiency of the cold trap. A plausible explanation of this phenomenon is to assume that, in some cases, droplets of water can be carried away and directed to the cold part of the experimental device by means of injected steam flow. These tiny droplets then may directly be turned into a thin frozen layer which is an impediment to the trapping of the remaining steam. This may imply a swift rise of the pressure during the earliest seconds of the injection phase because of the reduction of the efficiency of the cryogenic plate to trap and turn into ice the water contained in the steam.

- 277 - EFDA Technology / Safety and Environment
Figure 4: Comparison of the pressure evolutions in the vacuum vessel in the case of pressurized water injection
with and without non condensable gas.
Figure 5: Comparison of the pressure evolutions in the vacuum vessel in the case of steam injection
with and without non condensable gas
CONCLUSIONS
To achieve the experimental program, ten tests have been scheduled on the EVITA facility this year. The results of these complementary tests have improved the knowledge of the formation of ice layers and the condensation of water during injections of steam or pressurized water. The ice layer formation times are about 120 seconds in cases of steam injections and about 300 seconds in cases of the water injections. Some discrepancies noticed between the vacuum vessel pressurization kinetics of the tests denoted 5.xx, 6.xx and
7.xx have shown that the conservative case of pressurization of the vessel doesn’t match to the pure steam injection case. The assumed presence of tiny water droplets in the injected flow may be out of importance in the rise of pressure in the very early stages of the injection phases and on the final look and quality of the formed ice layers. Upgrading the heating device of the injection line should improve the abilities of the apparatus and should provide keys to a better knowledge of several not yet properly explained points like the condensation phenomenon, the kinetics of pressurization and the variability of the ice density.
Vacuum vessel pressurizationCase of water injection with and without non conden sable gas
0
0,2
0,4
0,6
0,8
1
1,2
1,4
1,6
1,8
2
0 100 200 300 400 500 600 700 800 900 1000
Duration of water injection (s)
VV
-pre
ssur
e (b
ar)
VV-pressure(bar) - 7,8
VV-pressure(bar) - 7,7
VV-pressure(bar) - 7.6
VV-pressure(bar) - 7.5
VV-pressure(bar) - 7,10
VV-pressure(bar)-6.3
VV-pressure-5,41
Vacuum vesselpressure 5,4
Case of steam injection (165°C;7 bar)Comparison of the pressures in the vacuum vessel du ring the tests
0
1
2
3
0 100 200 300 400 500 600 700 800 900 1000
Duration of injection (s)
VV
-pre
ssur
e (b
ar)-
Ste
am F
R (
g/s)
5.53_VV-pressure
7.3_VV-pressure
6.22_VV-pressure
7.4_VV-pressure
7,9 - VV -pressure
5.52-VV-pressure
7,2 - VV -pressure
6.2_VV-pressure
7,1 - VV -pressure

- 278 - EFDA Technology / Safety and Environment
REPORTS AND PUBLICATIONS
[1] L.AYRAULT, “Evita: RESULTS OF THE
CRYOGENIC TESTS 7.xx – Kinetics of the ice layer formation”, Technical note, DTN/STPA/LTCG NT 05-037, 11/2005, CEA, France.
[2] L.AYRAULT, F.CHALLET, “EVITA- INTERME-
DIATE REPORT ON TEST MATRIX PLANNED FOR 2005”, Technical note, DTN/STPA/LTCG NT 05-007, 01/2005, CEA, France.
TASK LEADER
Laurent AYRAULT DEN/DTN/STPA/LTCG CEA-Cadarache F-13108 Saint-Paul-lez-Durance Cedex Tel. : 33 4 42 25 44 72 Fax : 33 4 42 25 66 38 e-mail : [email protected]

- 279 - EFDA Technology / Safety and Environment
TW5-TSS-SEA5.5
Task Title: PAXITR VALIDATION EFFORT ON EVITA TESTS
INTRODUCTION
This task concerns the cryogenic calculations that have been performed by TECHNICATOME on the EVITA experimental facility in the frame of the validation and qualification of the PAXITR 2 code used in fusion safety assessment. PAXITR2 is a spot calculation computer code used to evaluate the pressurization or the depressurization of containment. 2005 ACTIVITIES
The fifth set of calculation on the EVITA facility has been realized in order to better characterize the ice layer formation kinetic, the pressure evolution and the other physical phenomena which occur in the vacuum vessel, at different step of duration (condensation of water at the bottom of the vacuum vessel and end of formation of the ice layer). The tests analysed are those with a steam injection (tests 7.2, 7.3, 7.4, 7.9) and also the series 5.5 and 6.22 which were performed during the previous sets of calculation. MODELLING The EVITA facility modelling consists in two different containments: the pressurizer and the vacuum vessel (cf. figure 1). The injected flow rate and energy of the steam and of the non-condensable gas are imposed.
Figure 1: EVITA facility modeling with PAXITR 2 Concerning the calculation, the cryogenic plate is modelled as a heat sink absorbing all the fluid energy in the containment (see figure 2). As PAXITR is a spot calculation computer code, an efficiency of the cryogenic plate is added to take into account its space position in the containment. It means that only a part of the injected mass and energy will be in contact with the cryogenic plate.
-196°C
hext
hint
Ice Copper plate
NITROGEN TEST CHAMBER
7 mm
Figure 2: Cryogenic plate modelling MAIN RESULTS With a greater number of available tests, physical phenomena and PAX limitations have been better understood. Some improvements have been made on the PAX modelling: - a fourth structure has been added to model a heat sink
due to the nitrogen feeding pipes located at the bottom of the vessel,
- the efficiency factor can be modified during the
transient, - a thermal resistance between the ice and the cryogenic
plate has been added, which, in conjunction with a lower external heat transfert coefficient, give a cryogenic structure temperature close to the experimental measurements,
- the external heat transfert coefficient is more precisely
calculated, deducted from WN2. With these improvements, steam injections are globally well simulated during the first part of the transient. For the tests with steam injection only (5.5, 7.3, 7.4 and 7.9), PAXITR calculations show that the efficiency of the cryogenic plate is very high: k≅0.9. For the non condensable gas injection tests (6.22 and 7.2), the PAXITR calculations show that the efficiency of the cryogenic plate is very low during the nitrogen injection (k=0.35), then when this phase ends, the efficiency increases (k=0.5). The table 1 gives the main results of the calculations comparing to the experimental measurements.
TEST CHAMBER

- 280 - EFDA Technology / Safety and Environment
Table 1: Comparison between the experimental results and the PAXITR calculations
VV pressures
0
0.1
0.2
0.3
0.4
0.5
0.6
0.7
0.8
0.9
1
1.1
1.2
1.3
1.4
1.5
1.6
0 20 40 60 80 100 120 140 160 180 200 220 240 260 280 300
t (s)
P (b
ar)
P(5.51)
P(5.52)
P(5.53)
P(7.3)
P(7.4)
P(7.41)
Figure 3: Experimental VV pressures
CONCLUSIONS
In order to achieve better results, the cryogenic structure modelling should be improved: - when the ice reaches the critical thickness the VV
pressure calculated increases whereas the experimental pressure is stable (see test 6.22).
- liquid injections transients cannot be well simulated, because the PAXITR cryogenic structure does not take into account the liquid flowrate (droplets condensed on the plate for example).
Due to inherent PAXITR limitations (spot calculation, steam and water in thermal equilibrium), non-equilibrium phenomena (P>Psat(Tm)) cannot be calculated. Moreover, the experimental vacuum vessel pressure evolutions are different even if the incoming flowrates are almost the same. The tests analysis has shown that this could be due to some liquid droplets mixed with the steam injection. This phenomenon cannot, of course, be simulated with PAXITR code. The tests are supposed to be performed in the same conditions but the figure 3 shows that the reproductibility seems to be difficult to obtain. The test analysis should go further to identify the tests to be performed again. The actual tests are still not sufficient to qualify a computer code on this kind of transients. REPORTS AND PUBLICATIONS
[1] L. LO-RE, “EVITA PAXITR 2: Fifth set of
calculations on the EVITA facility”, Technical note, TA410161 ind A, 12/2005, Technicatome, France.
TASK LEADER
Laurent AYRAULT DEN/DTN/STPA/LTCG CEA-Cadarache F-13108 Saint-Paul-lez-Durance Cedex Tel. : 33 4 42 25 44 72 Fax : 33 4 42 25 66 38 e-mail : [email protected]
Test Ice final mass (g)
Liquid mass at the
end of injection
(g)
Mean power removed by
Nitrogen (W)
Experiment 184±11 1350±2.9 4450/4250 5.5
Calculation 151 1376 5870 Experiment 175±11 30±2.9 4861
7.3 Calculation 173 22 5004 Experiment 126±11 310±2.9 4045
7.4 Calculation 288 155 5349 Experiment 205±11 1050±2.9 4493
7.9 Calculation 197 1015 5388 Experiment 229±11 1370±2.9 5029
6.22 Calculation 479 964 4040 Experiment 111±11 33±2.9 3300
7.2 Calculation 101 32.5 6420 Experiment 175±11 30±2.9 4861
7.3 Calculation 173 22 5004 Experiment 126±11 310±2.9 4045
7.4 Calculation 288 155 5349 Experiment 205±11 1050±2.9 4493
7.9 Calculation 197 1015 5388 Experiment 229±11 1370±2.9 5029
6.22 Calculation 479 964 4040 Experiment 111±11 33±2.9 3300
7.2 Calculation 101 32.5 6420

- 281 - EFDA Technology / Safety and Environment
TW5-TSS-SEA-5.6
Task Title: ENHANCEMENT OF THE PACTITER COMPUTER CODE AND RELATED FUSION SPECIFIC EXPERIMENTS
INTRODUCTION
In fusion devices such as the International Thermonuclear Experimental Reactor, ITER, neutron activation would also produce Activated Corrosion Products in the divertor, blanket and vacuum-vessel cooling loops, as well as in any other auxiliary cooling systems. These corrosion products are basically released from Cu-alloy (as CuCrZr) constituting part of the piping under flux in the divertor (ranging between 5 and 30 MW/m²) and from SS 316L (N) IG1 constituting the first wall/shield blanket. These ACP could be responsible for a large percentage of the Occupational Radiation Exposure (ORE) of personnel during the reactor operation, inspection and maintenance[1]. By consequences, the precise determination of ACP inventories and the estimation of the resulting doses to personnel is thus an important safety task. The computer code PACTITER has been used for the calculation of generation and transport of ACP in the various Primary Heat Transfer System (PHTS) or Tokamak Water Cooling System (TWCS). In the last version, PACTITER V3, the release rates of the different materials in contact with the cooling water are input data of the code. Thus they have to be accurately determined in various representative ITER operating conditions prior to any calculation. CORELE loop devoted to the measurement of the release of industrial tube belongs to the test facilities used to validate PACTITER code. For that reason, tests campaign was performed into CORELE Test facility to determine the SS 316L (N) IG stainless steel mass release rates under similar operating conditions of the TCWS [3]. On another hand a feasibility study has been launched in order to assess the capability of the CORELE loop to measure the Cu release rate [2]. 2005 ACTIVITIES
STAINLESS STEEL RELEASE RATE EVALUATION IN THE CORELE TEST FACILITY Release rates measurement methodology The tube mock-up were supplied by Sandvik company and cut from seamless stainless steel hot finished pipes. From the same fabrication a batch of witness washers was also
1 IG: Iter Grade
supplied to provide the necessary measurement of the specific activities. The composition of the alloy of these tubes is given in table 1.
Table 1: Chemical composition of the 4 tubes
Element Fe Ni Co Cr Mn Mo Cu S C N Si P
67.4 11.2 0.093 16.77 1.640 2.06 0.29 0.0070.012 0.07 0.440 0.031
Four tubes made of the above stainless steel (SE1 to SE4) have been activated in the OSIRIS reactor are and then connected to the main circuit of the CORELE loop. The specific activity of each irradiated tube (measured from witness washers) is given in table 2 at the date of the irradiation (26/03/2004).
Table 2: Specific activities of the tubes after irradiation Co-60 Co-58 Mn-54 Fe-59 Cr-51 Half-life (days) 1925 71 313 45 28
SE1-SE3 87 92 13 115 5410 Measurement (Bq/mg of tube) SE2-SE4 91 97 14 120 5620 The primary coolant circulating through the tubes section is continuously purified by mixed beds of ion-exchange resins (figure 1). Filters (1 µm) placed at the mixed-beds inlet trap possible particles. These filters are measured by gamma spectrometry at the end of the experiment to check the presence of particles. After the test, the resins are removed from the water loop and the radionuclides trapped in the resin are measured by gamma spectrometry in a detected low gamma background device. For each chemical species the release rate R (mg/dm²/month) is calculated using the following formula:
TSA
wAR
w ⋅⋅⋅=
where: - A: Activity of radionuclide in measurement resin at time t0 (Bq) corresponding to the beginning of the experiment i.e. when the temperature in CORELE is reached and the coolant begins to flow through the tests sections. This activity is actually measured at the end of the experiment (Aend) and has to be corrected from the radioactive decay of the considered radionuclide (half-life λ) corresponding to the duration T (month) of the experiment - w: weight % of the element in the tube (mg/mg tube section) - Aw: Mass activity of tracing radionuclide in the tube at time t0 (Bq/mg of tube section) - S: Exchange surface of tube with primary coolant (dm²) - T: Duration of the test (month)

- 282 - EFDA Technology / Safety and Environment
Table 3: CORELE Tests matrix
ITER 2004- 01 ITER 2004-02 ITER 2004-03 ITER 2005-01 SE1 SE2 SE1 SE2 SE3 SE4 SE3 SE4 insert No insert insert No insertinsert No insertinsert No insert
Operating conditions 150 °C / 150bar 100 °C / 150bar 100 °C / 120bar 200 °C / 120bar
Velocity V (m/s) 4.12 1.02 3.96 0.95 3.82 1.01 4.10 1.03
Duration (days) 14 14 14 14
O2 (vppm) 4.15 < O2< 22.5 9 < O2< 24 3 < O2< 4 1 < O2< 18
H2 (cm3/kg) 23.7< H2 < 26 23.5< H2 < 25.5 23.5< H2 < 25 27.5< H2 < 22
Li (ppm) 0.21 0.195 0.23 0.21
PH25°C measured 6.6 6.85 6.6 7.2
PH test temperature (estimation)
7.0 7.2 6.8
Experimental tests matrix For TWCS operating conditions, wall temperature range between 100°C and 150°C and coolant velocity from 0.04 m/s to 11 m/s. It appears that the water chemistry of ITER is closer to the BWR water chemistry [4], than originally specified. Thus water chemistry could be monitored through its conductivity instead of its pH which requires more specific attention due to the very high purity of ITER water. The neutrality of the pH at ambient temperature has been done by adding 0.2 vppm of Li (LiOH form) in order to counterbalance the slight acidity of the CORELE feed water. To ensure their stability versus lithium during operation, the mixed beds of ion-exchange resins have been first equilibrated. The CORELE tests matrix proposed 4 tests devoted to study of the influence of the both temperature and flow rate corresponding to the ITER TCWS specifications (see table 3) This complete tests campaign, was performed in three stages in 2001, 2004 and last one in 2005. The two first tests 2004-01 and 2004-02 were performed with the same pair of tubes (SE1 and SE2) although the last one 2004-03 and the test of year 2005 (2005-01) were performed with new irradiated pair of tubes (SE3 and SE4) Results The total release rate is the sum of the different release rates relative to each radionuclide measured in the resins. For Test 2005-01 realized at 200°C the total release rate is mainly due to the Fe release (through the 54Mn assumed to be representative of Fe). The Ni activity is lower than the detection limit of the measurement technique (through the 58Co assumed to be representative of Ni). This behaviour is due to the fact that the half-life period of 54Mn (313 days) is far longer than the one corresponding to 58Co (71 days). Thus in order to properly compare all results, only 54Mn release rates has to be considered. Test 2004-01 indicates that Fe release rate (54Mn or 59Fe) represents about 75% of the total release rate. The total release rate of Test 2005-01 has then been estimated using this ratio. Table 4 summarizes the results of the tests campaign 2004-2005.
Table 4: Stainless Steel Release Rate
Total release rate
Test Temperature
°C Velocity
m /s mg/dm2/month
4.12 22 ± 3 ITER
2004- 01 150
1.02 35 ± 5
3.96 <L.D. ITER 2004- 02
100 0.95 2.6 ± 1.3 3.82 0.8 ± 0.3 ITER
2004-03 100
1.01 2.8 ± 1.5
4.10 16 *± 3 ITER 2005-01
200 1.03 14* ± 3
The release rate uncertainty as reported in table 4 is due to the uncertainties of the measurement resins activities, adding to the specific activity of the tube. Figure 1 is an illustration of the Fe (54Mn) release rate as a function of the temperature for the 1 m/s fluid velocity.
54Mn -1m/s
0,1
1
10
100
1
mg/
dm²/
moi
s
ITER-100°C
ITER -150°C
ITER -200°C
Figure 1: Fe release rates for the 1 m/s coolant velocity

- 283 - EFDA Technology / Safety and Environment
Interpretation Finally the whole tests campaign sustains the following interpretation: At 100°C the O2 solid diffusion (corrosion) in the chromite layer is strongly limited, which explains the lack of release, At 150°C the O2 solid diffusion and elementary (including H2O) diffusion in the oxide layer are enhanced. On another hand the equilibrated concentrations of the different corrosion products (as ions) are still sufficiently low to maximize the total release flux. For such conditions, the release is sensitive to the hydrodynamic diffusion at the interface fluid/solid, At 200°C, the thermodynamic equilibrium is far more favored than at 150°C since the apparent diffusion of the elements seems to take place in the porosity of the oxide layer (aqueous phase) rather than in solid phase. However the thermodynamically equilibrated concentration of Fe in the coolant is higher than at 150°C thus reducing its release flux as well as the total release rate in a 75% extent. For such conditions the release is not influenced by the hydrodynamic diffusion. CONCLUSIONS
This tests campaign has underlined an important temperature effect: the total release rate is higher at 150°C than at 200°C and negligible at 100°C. Last test 2005–01 has pointed out the major role of the first days (< 300 hours) on the release rate process. These effects have been interpreted as the result of the competition between thermodynamics (chemistry coolant, pressure, temperature, material composition) and elementary diffusion (including H2O and/or O2). Depending on the magnitude of the thermodynamically equilibrated concentration of the released element in the bulk of fluid, the coolant velocity (and the hydrodynamic diffusion) may play a role in the release rate. However such experiments have been conducted for a water chemistry, which could not match the final ITER specifications. In that aim it could be interesting to specify the release rates values using perfectly deionized water. REPORTS AND PUBLICATIONS
[1] S. Nisan, L. Di Pace, J-C. Robin Evaluation of the Activated Corrosion Product Source Term for ITER Heat Transfer Systems SOFT 96 [2] P.Schindler, V. Blet On the feasibility of Cu release rate measurement in the CORELE Loop CEA Technical Report DTN/STRI/LTCD 06-02, 2006/01
[3] P. Schindler- V. Blet- L. Di Pace EUROCORR 2005 Lisbonne 4-8 september 2005 [4] V. Massaut On the erosion-corrosion in ITER, water chemistry and the PACTITER code development Short memo–EFDA-CSU garching-Field Safety and Environment-07/12/2005 TASK LEADER
Patricia SCHINDLER DEN/DTN/STRI/LTCD CEA-Cadarache F-13108 Saint-Paul-lez-Durance Cedex Tel. : 33 4 42 25 73 62 Fax : 33 4 42 25 47 77 e-mail : [email protected]

- 284 - EFDA Technology / Safety and Environment

- 285 - EFDA Technology / System Studies / Power Plant Conceptual Studies
CEFDA05-1285
Task Title: TW5-TRP-003: SEGMENTATION AND MAINTENAN CE ASSESSMENT AND COMPARISON OF CONCEPTS
INTRODUCTION
In the roadmap of the development of fusion energy, ITER is the following major step. The main objective of ITER is to demonstrate prolonged fusion power production in deuterium-tritium plasma. Half way through the scientific exploitation of ITER, it is planned to begin the design of the demonstration fusion reactor, DEMO. Construction of DEMO should start when ITER is fully exploited. The development of the technologies which will be required for this demonstrator have already started in the aim of testing some DEMO-relevant components inside ITER. The breeding and high-grade energy extraction blanket modules are some of these elements. Indeed, these components facing plasma are exposed to very high thermal loads, so it’s necessary to replace them at given periods. Due to the radiation level, it is necessary to make the operations fully by Remote Handling. This critical maintenance needs to be done in acceptable times in regard to the availability of the reactor. This task focuses on the aspects concerning the Remote Handling of the blanket elements during the maintenance phases. As it is impossible to refurbish the worn blanket inside the torus, it is necessary to carry it fully to the hot cells. This operation implies that the first wall is segmented in smaller parts called blanket modules. Each module needs to be connected to the coolant circuit, so, without considering the efficiency of the heat extraction, the units size have an effect on the number of modules, the number of manifolds and connections, the size of the ports of the reactor, the masses to be carried out, the size of the transfer casks… This is the reason why, the maintenance operations are very closely linked with the choice of the segmentation of the blanket. The objectives of this task started in october 2005 are to review the different possible segmentations to allow the selection of a reference concept for the forthcoming DEMO conceptual design for three reference design: - Large modules - Banana segments - Multi-module-segments (MMS) 2005 ACTIVITIES CONCEPTS DESCRIPTION Large modules (figure 1)
The goal is to limit the total number of blanket modules in order to reduce the replacement time and to maximize the plant availability. The maximum size of the modules is limited by the opening of the equatorial ports. The size of
the port is itself limited by the TF and PF magnets arrangement. Only basic concepts for the handling devices have been developed during the PPCS Study and there are limited details on the hydraulic and mechanical connections of the modules.
Figure 1: Illustration of the Large Modules concept proposed by FZK
Vertical segments (“bananas”)
The “banana” segments were extensively analysed in the NET design and in the ITER CDA design. The width of the vertical port is limited by the TF coils and its radial dimension by the upper PF coils. One of the main features of this segmentation is the location of all hydraulic connections in a secondary vacuum enclosure accessible from the top of the machine. Detailed design of blanket handling devices were developed, but the complete logistics implications were not fully assessed.
Multi-module-segments (MMS)-(figure 2)
The MMS concept consists in a banana back-plate supporting a number of smaller modules. It can be handled through the vertical ports as a banana segment whilst individual modules could be replaced through the equatorial port like in ITER.
This concept has never been analysed in detail.
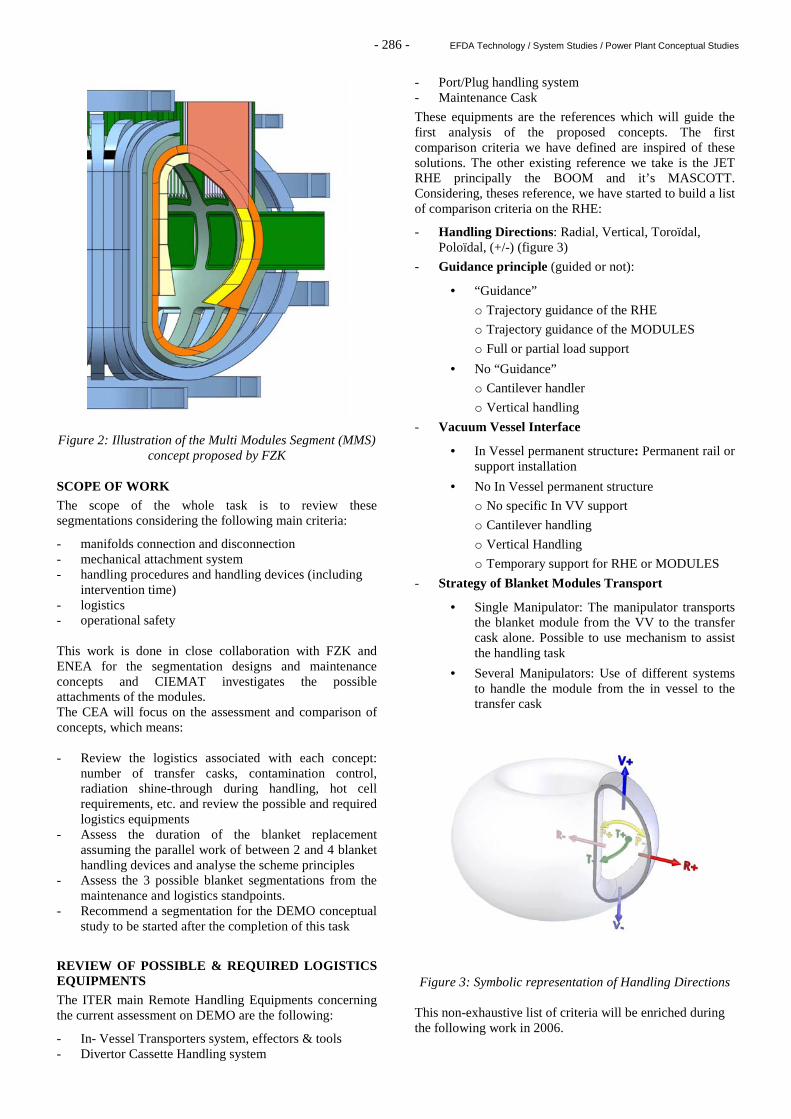
- 286 - EFDA Technology / System Studies / Power Plant Conceptual Studies
Figure 2: Illustration of the Multi Modules Segment (MMS)
concept proposed by FZK SCOPE OF WORK
The scope of the whole task is to review these segmentations considering the following main criteria:
- manifolds connection and disconnection - mechanical attachment system - handling procedures and handling devices (including
intervention time) - logistics - operational safety This work is done in close collaboration with FZK and ENEA for the segmentation designs and maintenance concepts and CIEMAT investigates the possible attachments of the modules. The CEA will focus on the assessment and comparison of concepts, which means: - Review the logistics associated with each concept:
number of transfer casks, contamination control, radiation shine-through during handling, hot cell requirements, etc. and review the possible and required logistics equipments
- Assess the duration of the blanket replacement assuming the parallel work of between 2 and 4 blanket handling devices and analyse the scheme principles
- Assess the 3 possible blanket segmentations from the maintenance and logistics standpoints.
- Recommend a segmentation for the DEMO conceptual study to be started after the completion of this task
REVIEW OF POSSIBLE & REQUIRED LOGISTICS EQUIPMENTS The ITER main Remote Handling Equipments concerning the current assessment on DEMO are the following:
- In- Vessel Transporters system, effectors & tools - Divertor Cassette Handling system
- Port/Plug handling system - Maintenance Cask
These equipments are the references which will guide the first analysis of the proposed concepts. The first comparison criteria we have defined are inspired of these solutions. The other existing reference we take is the JET RHE principally the BOOM and it’s MASCOTT. Considering, theses reference, we have started to build a list of comparison criteria on the RHE:
- Handling Directions: Radial, Vertical, Toroïdal, Poloïdal, (+/-) (figure 3)
- Guidance principle (guided or not):
• “Guidance”
o Trajectory guidance of the RHE
o Trajectory guidance of the MODULES
o Full or partial load support
• No “Guidance”
o Cantilever handler
o Vertical handling
- Vacuum Vessel Interface
• In Vessel permanent structure: Permanent rail or support installation
• No In Vessel permanent structure
o No specific In VV support
o Cantilever handling
o Vertical Handling
o Temporary support for RHE or MODULES
- Strategy of Blanket Modules Transport
• Single Manipulator: The manipulator transports the blanket module from the VV to the transfer cask alone. Possible to use mechanism to assist the handling task
• Several Manipulators: Use of different systems to handle the module from the in vessel to the transfer cask
Figure 3: Symbolic representation of Handling Directions This non-exhaustive list of criteria will be enriched during the following work in 2006.

- 287 - EFDA Technology / System Studies / Power Plant Conceptual Studies
PRÉLIMINARY ANALYSIS ON FZK LARGE MODULES RHE FZK started to work on the Remote Handling for the Large Modules Concept (figure 4), and this is the only entry we have yet. This solution is an In-Vessel Transporter-like machine.
Figure 4: RHE design for Large Modules concept (FZK)
For this design, the first analysis we can make is that this system will benefit of the advantages of the ITER blanket RHE concept:
- Limited interface with Vacuum Vessel - No specific In-VV support - Able to remove any single blanket And we can notice that the payload has been increased to 10 T (4 T for the ITER’s IVT). The mass of the whole system is near 200 tons, and the ratio between the payload on the mass of the manipulators is about 2.5 which is very a very advanced value compared to industrials robots. So it seems that this kind of system won’t be stiff enough to ensure the accuracy needed. And it will probably be difficult to handle 4 modules at the same time because of the disturbances due to the deformations of the beam which supports the vehicules. That makes the work in parallel quite impossible in this concept.
INFLUENCE OF BLANKET SEGMENTATION ON RHE One of the important parameters to study is how the segmentation of the blanket influences the design of the RHE. The start of the analysis begins by the criteria given in the table below:
Number of modules → Number of manipulations
Geometrical disparity of the modules →
Complexity of the handling devices
Mass of the modules → Difficulty to afford gravity load
Number of equipments on each modules → Simplicity of the handler
Size of each modules → Accuracy of the position
These simple elements must be guidelines for all choices of strategy for designing the associated RHE to the associated segmentation. CONCLUSIONS In the first phase of the work, we have reviewed the different Remote Handling Equipments usable in the fusion context. The main bases are the studies made for ITER and the solutions used in JET. One of the goals is to perform a complete maintenance of the blanket modules at given periods in DEMO (1 time per 5 full power years), and it is not the case of the ITER reactor. Replacement of shield blanket modules is likely to be required a few times during the lifetime of the ITER machine due to the following normal operation and fault conditions. It means that ITER-relevant RHE for the blanket modules are not obligatorily good solutions for DEMO. However, for ITER, it is needed to proceed the full replacement of the cassette modules at least 4 times. These conditions are nearer the need for DEMO-relevant RHE design. REFERENCES [1] Presentations of FZK, ENEA, CIEMAT and EFDA
during Kick Off Meeting and Progress Meetings [2] A CONCEPTUAL STUDY OF COMMERCIAL
FUSION POWER PLANTS, Final Report of the European Fusion - April 13th, 2005 - EFDA-RP-RE-5.0
[3] DESIGN DESCRIPTION DOCUMENT, Remote
Handling Equipment (DDD 23), july 2004 TASK LEADER Jean Pierre FRICONNEAU DRT/DTSI/SRI CEA-Fontenay-aux-Roses 18, route du Panorama - BP 6 F-92265 Fontenay-aux-Roses Cedex Tel. : 33 1 46 54 89 66 Fax : 33 1 46 54 75 80 e-mail : [email protected]

- 288 - EFDA Technology / System Studies / Power Plant Conceptual Studies

- 289 - EFDA Technology / System Studies / Power Plant Conceptual Studies
TW4-TRP-002-D02b
Task Title: CONCEPTUAL DESIGN OF A HCLL REACTOR TRITIUM CONTROL & MANAGEMENT ANALYSIS, THERMO-
HYDRAULIC AND THERMO-MECHANICAL ANALYSES
INTRODUCTION
Within the framework of the European Power Plant Conceptual Studies (PPCS), one of the reactor models, the model AB, is based on a Helium-Cooled Lithium-Lead (HCLL) blanket [1]. A view of the corresponding blanket module and of the detail of a Breeder Unit (BU) is shown in figure. 1. The integration and the design of the HCLL blanket and associated circuits and components within the model AB reactor plant has been addressed and performed in another parallel subtask [2], [3]. The mechanical, thermo-mechanical and thermo-hydraulic analyses for the HCLL have been based on the similar analyses performed for the HCLL DEMO blanket modules [4] taking into account the larger size of the PPCS reactor. The objective of this task was to check validity of the analyses performed for DEMO when extrapolated to the PPCS specifications and to assess the T-management and control in the HCLL blanket and associated systems. The maximum authorized T-release to the environment is assumed to be 27 Curies/day, equivalent to 1 g/year. However, this allowance will be for the whole plant, including other sources of tritium like reactor refuelling, divertor pumping etc. Even taking the whole allowance for the breeding blanket system, the tritium isolation ratio J1/J5 is to be as high as 200 000, with the assumption of a reactor availability of 82 % (300 operating days per year).
2005 ACTIVITIES
The 2005 performed activities focused on the importance of taking into account the T transport in the Pb-17Li. In fact, the preliminary tritium management assessment [5], based on an analytic model, evaluated the tritium permeation rat for different Permeation Reduction Factor and different re-circulation rates. It is recalled that, for 10 re-circulations per day, a lithium lead extractor efficiency of 0.8 and a PRF=50, the computed tritium mean concentration is Cm = 0.065 g.m-3, and consequently for the 585 m3 of Pb-17Li present in the HCLL blanket the tritium inventory is 38.1 g (not taking into account the Pb-17Li outside the module: e.g. pipes, pumps, de-tritiation units). With a tritium partial pressure in helium of
2
-3T -HeP =5.47×10 Pa (that is maximum allowable
pressure when considering the T-permeation through conventional Incalloy-pipes in SG [6]), the tritium mass fraction is 1.03 10-9. Considering the whole He inventory equal to 12 400 kg, the mass of tritium present in helium is only 0.013 g. Conversely, if T-permeation in the steam generator could be reduced to zero, the acceptable tritium partial pressure taking into account only the helium leakage would be:
2T -HeP =11.1 Pa. That leads to a tritium inventory in
helium of 25.8 g.
Figure 1: Detailed views of a HCLL blanket module and of a Breeding Unit

- 290 - EFDA Technology / System Studies / Power Plant Conceptual Studies
These results highlight that in order to have a He-purification plant of a reasonable size, the tritium permeation in the steam generator has to be drastically reduced. However, the analytical computations described above make the assumption that all the produced tritium inside the LiPb bulk is immediately available for permeation through the Eurofer walls. We can suppose that not taking into account T transport in the LiPb leads to a very pessimistic result (nearly all the produced T escapes into the He coolant, if no permeation barriers are used). Actually, the tritium has to cross the LiPb bulk before reaching the walls and permeating across them. Moreover, the T transport through the LiPb is not only due to diffusion, but also to the advective movement of the LiPb itself. This movement is the result of the LiPb imposed circulation (to ensure a given recycling rate) and to the buoyancy forces due to thermal gradient and concentration gradient. Furthermore, the velocity field is complex since MHD effects are significant in an electrical conductive material submitted to high magnetic field. In order to study these effects, we have developed a FEM using the CEA code Cast3M, using a simplified 2D representation of the BU [6]. The tritium concentration c in the LiPb is driven by the mass equation:
ScDcVt
cLiPb =∇−∇⋅+
∂∂ 2
where V is the LiPb velocity (m.s-1)
- DLiPb : the T diffusivity in LiPb (m2.s-1) - S: the source term (mol m-3.s-1)
The source term S is function of the distance r from the first wall, its expression derived using a neutronic Monte-Carlo simulation shows that the tritium production is mainly localised very close to the FW. The boudary condition at the LiPb / Wall interface expresses that T flows are equal in both side of the interface, meanwhile the T concentration at the Wall / He interface is imposed to be zero (negligible T-partial pressure in the He coolant). Velocity profiles are imposed according to various assumptions in order to test the sensitivity of the results to the flow profile. We have tested various assumptions, all with velocity oriented along r axis (no turbulence): - parabolic velocity profile as it would be obtained if no
MHD effects were not involved (hydrodynamic profile)
- flat velocity profile with very thin Hartmann layer as it
would be obtained on Hartmann wall in MHD flow. The main restriction of that 2D laminar velocity profiles is that they do not take into account the possible mixing of tritium concentration due to transverse velocity. These non-laminar velocity profiles will occur during expansion and contraction of the LiPb flow, or will be generated by thermally induced rolls or turbulence close to the walls. However, considering the contracted flow across the thin slot close to the FW that ensures the communication between BUs, we can make the assumption that, at this level, a very efficient LiPb mixing occurs. Consequently, the model in composed of two LiPb branches, the input concentration of the backward branch being the mean output concentration of the forward branch.
Figure 2: Scheme of the main tritium-related system and corresponding Tritium flow in a HCLL fusion reactor
Tritium extraction from LiPb
JFW J3
J5
He purification
GHe
ηηηηLiPb
ηηηηHe
mHe
GPbLi
J1
J2
J4
Blower
Steam generator
Secondary circuit
HCLL Blanket modules
LiPb purification
Pump
air purification
QHe
mLiPb

- 291 - EFDA Technology / System Studies / Power Plant Conceptual Studies
To take into consideration the efficiency (ηLiPb) of the LiPb detritiation unit, the input concentration of the forward branch is made equal to (1 - (ηLiPb) times the output concentration of the backward branch. The interest of FEM comes when we observe the T-concentration stratification in the LiPb bulk and the tritium depleted layer close to the permeating walls that leads to a reduced permeation rate vs. the above results. We can see (figure 3.) that in the middle of the LiPb flow, the T concentration is lower than on the sides, due to a faster velocity. However, even closer to the walls, the concentration falls down due to the permeation. For a flat velocity profile (MHD type), the T concentration increase on the side is no more present, but the tritium depletion close to the walls remains. The permeation rate vs. the number of recycling per day (figure 4) shows a dramatic reduction of permeation due to the LiPb stratification that can be compared to the benefit of a permeation barrier with a PRF equal to 50 when the LiPb recycling rate is around 10 The sensitivity to velocity profile is here damped due to the concentration mixing between the forward and backward branches. When this mixing is not applied, flat velocity profile experiences lower permeation than parabolic one. The model seems to be more sensitive to the flow rate than to the velocity profile
Figure 3: Tritium concentration profiles at outputs across
Pb-17Li flow for a parabolic and flat velocity profiles.
Figure 4: Permeation vs Pb-17Li recycling rate for parabolic (Poiseuille) and flat velocity profiles.
REFERENCES
[1] A. Li Puma et al., Breeding Blanket Design and
Systems Integration for a Helium-Cooled Lithium-Lead Fusion Power Plant, Fus. Eng. & Design, vol 81, 2006, pp 469-476.
[2] Progress Report 2004 for the subtask TW4-TRP-002-
D04. [3] A. Li Puma, L. Giancarli, Helium-Cooled Lithium-
Lead Fusion Power Plant (PPCS model AB) Design and integration of in-vessel components and associated systems Task EFDA TW4-TRP-002-D04, CEA Report, SERMA/LCA/RT/04-3543/A, february 2005.
[4] A. Li Puma, Y. Poitevin, L. Giancarli, W. Farabolini,
G. Rampal, J.-F. Salavy, J. Szczepanski, U. Fischer, P. Pereslavtsev, Helium Cooled Lithium Lead blanket module for DEMO: designs and analyses, CEA Report, DM2S/SERMA, september 2003.
PUBLICATIONS AND REPORTS
[5] W. Farabolini et al., Tritium Control Modeling in a
Helium-Cooled Lithium-Lead Blanket for a Fusion Power Reactor, rapport technofusion 2004.
[6] W. Farabolini et al., Tritium Control Modeling in a
Helium-Cooled Lithium-Lead Blanket for a Fusion Power Reactor, Fus. Eng. & Design, vol 81, 2006, pp.753-762.
[7] W. Farabolini et al., Assesment of tritium control in
PPCS AB blanket system, CEA Report, DM2S/SERMA/LCA/RT/05-3614.
TASK LEADER
Franck GABRIEL DEN/DM2S/SERMA CEA-Saclay F-91191 Gif-sur-Yvette Cedex Tel. : 33 1 69 08 79 76 Fax : 33 1 69 08 99 35 e-mail : [email protected]

- 292 - EFDA Technology / System Studies / Power Plant Conceptual Studies

- 293 - EFDA Technology / System Studies / Power Plant Conceptual Studies
TW5-TRP-002-D03a
Task Title: ANALYSIS OF CURRENT PROFILE CONTROL IN TOKAMAK REACTOR SCENARIOS
INTRODUCTION
On the path to the development of the first commercial fusion reactor, DEMO will be the next step after ITER, with the aim of testing the main technology options at a somewhat reduced electrical power with respect to the commercial reactor (1 GW vs 1.5 GW). The DEMO reactor should work in steady-state, therefore, one of the main physics challenges will be the establishement and the control of an non-inductively driven current density profile. This task is a first attempt to analyse this problem by means of the integrated modelling code CRONOS. CRONOS is a suite of numerical codes for the predictive/interpretative simulation of a full tokamak discharge. It integrates, in a modular structure, a 1-D transport solver with general 2-D magnetic equilibria, several heat, particle and impurities transport models, as well as heat, particle, current and momentum sources. The deliverable of this task is a CRONOS simulation of a DEMO steady-state discharge, in which the various current sources combine to yield an MHD-stable current density profile. 2005 ACTIVITIES
D calculations In parallel to the detailed 1D simulations for DEMO and in order to cross-check the results obtained in the frame of the PPCS study with the PROCESS code, we have used a simple modeling for a commercial power plant design. The model, implemented in the HELIOS code, includes the plasma core, the scrape-off layer and divertor and the power plant energy balance. - The plasma core is described using a 0D model
including the effect of the density and temperature profiles (generalized parabolic profiles
2( (1 ) XX αρ ρ) ∝ − ). The transport losses are described by a global energy confinement time normalized to the IPB98(y,2) scaling law (with an HH factor). The non-bootstrap part of the plasma current is supposed to be entirely driven by the neutral beam
injected power with an efficiency 19
CD 0.35 10 eTγ = × . The bootstrap fraction is supposed to be given by the Hoang fit and the synchrotron radiation losses by the Fidone-Meyer fit with a reflection coefficient of 0.7. The fast alpha pressure is calculated using the Uckan et al formulation. The conducted power Pnet and the power Psep crossing the separatrix are calculated and compared to the two different ITER scalings for the L-
H transition power ((1) (2)
L-H L-H and P P ).
- The Helium ash content is calculated supposing
He
E5τ
τ∗
= where Heτ ∗
is the apparent helium confinement time.
- The total line radiation in the plasma mantle and
divertor is supposed to be given by the Matthews law. The repartition of the line radiation power between the plasma mantle and the divertor is taken from JET discharges with high triangularity, high density, good confinement and high fractional line radiation, i.e. 61 % in the plasma mantle and 39 % in the divertor. The part of the power crossing the separatrix which is not radiated in the divertor contributes to the time averaged peak thermal load on the divertor plates according to the Pacher et al fit. This fit is calibrated in order to get the results of a B2-Eirene simulation for ITER with injected Argon.
- The electrical power going to the network is calculated from the exact power plant energy balance. In the special case of the choice of the model C technology, the following parameters are taken:
MB = 1.17, ηth = 42.6 %, ƒaux = 5.13 %, ηinj = 70 %
where MB is the blanket amplification factor, ηth is the efficiency of the power plant thermal cycle, faux is the fraction of the gross electrical power which is used for auxiliary devices (pumps and cryogeny), and ηinj is the plug efficiency of the neutral beam injector.
The above model has been first tested by applying it to ITER. Then, the model was applied to PPCS-A, PPCS-C and DEMO-C assuming only He (ashes) and Ar (injected) impurities. Discrepancies with respect to the results of the PROCESS code have been analysed in detail. Considering our model to be a good preliminary tool for the design of a reactor, taking the assumption of only He and Ar impurities, and taking the power plant efficiencies of the model C technology, we have performed two 1000 MWe DEMO designs. The first one supposes H mode operation with parameters taken from the JET high triangularity discharges described above (this regime will be referred to as JET-like H mode). The second one supposes Advance mode operation with parameters taken from the reference ITER Advanced scenario (this regime will be referred to as ITER-like Advanced mode). For each of the above physical mode of operation, we consider two different values of the maximum magnetic field in the superconductor: Btmax = 13.6 T which is the value taken presently for PPCS model C and Btmax = 16 T which we consider to be accessible in the future, either with new generation Nb3Sn at 1.8 K or with HTc superconductors at 4.2 K. The inner separation between the

294 EFDA Technology / System Studies / Power Plant Conceptual Studies
plasma and the external part of the superconductor is taken to the constant value ∆int = 1.669 m. It was first shown that, in a tokamak with given A, R,
density and temperature profiles (αn and αT), He Eτ τ∗, HH,
Gen n , qpeak, the amplification factor Q as well as the electrical power Pen are decreasing functions of q95. This means that, with these constraints, the best thermonuclear performances in a tokamak are obtained for the maximum allowed plasma current for the regime considered. As a consequence, a q95 = 3 safety factor will be chosen for H mode operation reactor design. For the H mode DEMO, we take the following design assumptions:
A = 3, q95 = 3, HH = 1, η e
ηG = 1, αn = 0.01, αT = 1.5, qpeak = 10 MW/m2
For each value of the major radius R, the operating point corresponding to the above boundary conditions can be calculated, resulting in a given value of the electrical power Pen delivered to the network. Pen = 1000 MW is obtained for R ≅ 8.15 m in the case Btmax = 13.6 T and for R ≅ 6.92 m in the case Btmax = 16 T. The corresponding thermonuclear plasmas exhibit relatively low values of the amplification factor Q (Q = 10.6 for both cases). The
corresponding power plant efficiency PP en nuclP Pη = is strongly affected by the required circulated power corresponding to these values of Q; we get ηPP ≅ 31.9 % to be compared with ηth = 42.6 %. As an illustration, the mains parameters of the 13.6 T, 8.15 m JET-like H mode DEMO are given in the following table:
For the Advanced mode DEMO, we take the following design assumptions: A = 3, q95 = 4,5, HH = 1.57, αn = 0.1, αT = 1.5, qpeak = 10 MW/m2 It can be shown that, for a given Btmax, the Pen(R) curve has a maximum. This phenomenon is due to the strong enhancement of the apparent Helium confinement time when R is increased, leading to very large values of the He
fraction and consequent dilution. For G 0.85en n = the maximum is below 1 000 MW for all Btmax. This means than there is no ITER-like Advanced mode DEMO with 1 000 MWe for such a fractional Greenwald density.
For G 0.95en n = , the problem has a solution. We get R = 8.78 m for Btmax = 13.6 T and R = 7.33 m for Btmax = 16 T. The corresponding amplification factor is 20.8 and 21.8 respectively, giving reasonable values of the power plant efficiency, 36.1 % and 36.3 % respectively. The mains parameters of the 16 T, 7.33 m ITER-like Advanced DEMO are given in the following table: In conclusion, within the frame of our model, a purely non inductive 1 000 MWe DEMO with C technology may be designed, as well in JET-like H mode as in ITER-like Advanced mode. In H-mode, the power plant efficiency is marginally acceptable (Q ~ 11) whereas it is correct in Advanced mode (Q ~ 22).
Table 1:
R (m) / A 8.15 / 3 fHe (%) 6.90 V (m3) 2 000 Pfus (MW) 2 760
S (m2) / L (m) 1 220 / 24.7 Padd (MW) 260 Ip (MA) 25.1 Q 10.6 Bt (T) 6.28 fBS (%) 28.1 (αj = 0.5)
κ95 / δ95 1.7 / 0.33 βN (βNth) 2.67 (2.35) q95 (fit) 3 PB / PS (MW) 181 / 102
αn 0.01 Pnet / Psep (MW) 535 / 286 αT 1.5 (1) (2)
L-H L-H / (MW)P P 80.3 / 147
Gen n 1 Pline (MW) 408
en⟨ ⟩ (1020 m-3) 1.08 Pline/Pnet (%) 76.3
He Eτ τ∗ 5 Pnon-rad (MW) 127
fAr (%) 0.870 qpeak (MW/m2) 10 Zeff 3.80 Pen (MW) 1 000
eT⟨ ⟩ (keV) 17.5 ηPP (%) 31.9

- 295 - EFDA Technology / System Studies / Power Plant Conceptual Studies
Table 2:
R (m) / A 7.33 / 3 fHe (%) 13.9 V (m3) 1 660 Pfus (MW) 2 430
S (m2) / L (m) 1 080 / 24.8 Padd (MW) 111 Ip (MA) 21.5 Q 21.8 Bt (T) 7.03 fBS (%) 49.6 (αj = 0.5)
κ95 / δ95 1.87 / 0.47 βN (βNth) 3.13 (2.78) q95 (fit) 4.5 PB / PS (MW) 112 / 188
αn 0.1 Pnet / Psep (MW) 303 / 182 αT 1.5 (1) (2)
L-H L-H / (MW)P P 80.2 / 142
Gen n 0.95 Pline (MW) 199
en⟨ ⟩ (1020 m-3) 1.05 Pline/Pnet (%) 65.5
He Eτ τ∗ 5 Pnon-rad (MW) 104
fAr (%) 0.404 qpeak (MW/m2) 10 Zeff 2.51 Pen (MW) 1 000
eT⟨ ⟩ (keV) 21.4 ηPP (%) 36.3
D calculations Predictive simulations of DEMO scenarios by means of the CRONOS code have been prepared by the development of a new module for the computation of the synchrotron radiation loss profile, an essential ingredient for the physics of a high-temperature fusion reactor. This work has been done in collaboration with the Polytechnic University of Barcelona (Spain), where the EXATEC module has been developed. This module has now fully coupled to CRONOS and yields the detailed radial profile of the loss term associated with synchrotron radiation. A second preparatory study consists in the calculation of the fraction of Lower-Hybrid power absorbed by alpha particle in a typical (advanced) DEMO scenario, in which LH waves are expected to be one of the main tools to generate a transport barrier.
This is important for the choice of the wave frequency to be used. The calculation has been done by CRONOS, with a DEMO 2-D equilibrium computed by the magnetic equilibrium code Helena, an alpha particle distribution function computed by the Monte Carlo code SPOT, and LH wave propagation computed by the ray-tracing code Delphine. It has been found that for the same frequency chosen for ITER (5 GHz), the alpha particle absorption is less than 1%, which implies that a very similar technology can be employed in ITER and DEMO. The ray trajectories and the profiles of alpha distribution and electron absorption are shown in the following figure.

- 296 - EFDA Technology / System Studies / Power Plant Conceptual Studies
CONCLUSIONS
The preliminary part of this task, consisting of the 0-D design and the development of important modules of the CRONOS suite of codes, has been completed in 2005. The code is now ready to be exploited to find a viable scenario of steady-state operation for DEMO. It should be stressed that the existence of such a scenario is not a priori guaranteed. Therefore, the 1-D modelling is an essential step for the first design phase of DEMO and of course also of the following commercial reactor. TASK LEADER
Gerardo GIRUZZI DSM/DRFC/SCCP/GSEM CEA-Cadarache F-13108 Saint-Paul-lez-Durance Cedex Tel. : 33 4 42 25 73.44 Fax : 33 4 42 25 62 33 e-mail : [email protected]

- 297 - EFDA Technology / ITER Site Preparation / European ITER Site Studies
CEFDA04-1161 TW4-TES-COLABA
Task Title: EUROPEAN ITER SITE STUDIES 4 - CADARACHE CADARACHE SITE FOR ITER - COLLABORATION WITH
LOCAL AUTHORITIES
INTRODUCTION
The most important fact in 2005 was the announcement, the 28th of june in Moscow, by the ITER Project’s partners of the decision to build ITER in Cadarache. During the second semester of 2005, the President of the French Republic Mr Jacques Chirac, the European Commissioner for Science and Research Mr Janez Potocnik and the Director General of the future ITER Organisation Mr Kaname Ikeda visited Cadarache (see photographs).
EISS activities have their own steering process with regular meetings and exchange of information with EFDA and the Commission. The EISS4 contract covers the period from 1st
january 2004 to 31st december 2005. A final deliverable (ref. GA41-DEL-2004-0008) refers to 41 specific deliverables covering all the topics of the EISS4 contract. The reader who would wish extensive information is requested to ask for these documents. The following pages are given for reminder and are covering only the main aspects of the contracts. The EISS project (and its corresponding tasks) is, as for previous years, structured to progress on all items on the critical path, with an emphasis on the licensing schedule. On the 14th of september 2005, after taking note of the report of the ITER International Team Leader on the licensing process, the ITER Preparatory Committee mandated the CEA: - to act as designated legal entity in order to represent
and act on behalf of the International Team in front of the competent authorities regarding the licensing process and pending establishment of the ITER Organisation. To ensure consistency and continuity all submitted documents will need to be formally undersigned by the ITER International Team Leader. During meetings the ITER International Team will be appropriately represented.
- to represent and act on behalf of the International Team regarding the public debate. Written documents will be jointly signed and, during public meetings, both CEA and the ITER International Team will jointly participate.

- 298 - EFDA Technology / ITER Site Preparation / European ITER Site Studies
The CEA was requested to keep all Parties fully informed on the activities undertaken under the Committee’s mandate. 2005 ACTIVITIES
SAFETY & LICENSING As it was the case in previous years, the writing of the first version of the main technical document in support of the Safety Authority’s instruction, the “Rapport Préliminaire de Sûreté” (RPrS) was followed. The writing of this document by EFET is supported by many studies, performed at European level in parallel. All chapters have been finalised and the RPrS needs to be reviewed in 2006, following a wider project review. The R&D to be launch within the framework of EISS5 will also allow to complete and detail the writing of several chapters. The risk analysis studies and the DAC and DARPE specification have been continued. According to the French regulation and the 10th of august 1984’s Order, the Safety and Licensing process concerns these 3 main documents RPrS, DAC and DARPE (figure 1).
Figure 1 Several studies were performed to support these Safety and Licensing area, for example the aspects concerning an ITER waste management strategy, in particular for tritiated waste. PUBLIC DEBATE
Figure 2
The relevant authorities, the “Commission Particulière du Débat Public” (CPDP) was put on hold in 2004, until a decision on the site choice. The CPDP has been reactivated in july 2005. The final version of the file of the Public Debate (figure 2) has been completed and sent to the “Commission Nationale du Débat Public” (CNDP). The Public Debate will take place during the first semester of 2006, in particular the CPDP will organise about sixteen public meetings in all the Provence region. Different media, prepared for the Public Debate (e.g. multimedia interactive terminal, different types of models) with the financial help of the local authorities completed by EFDA within framework of the TWA-TES-COLABA task, were completed. http://debatpublic-iter.org (in French) IN-FENCE STUDIES The site drawings were updated, taking into account the interfaces with the ITER International Team. A survey of the hydrogeology is performed, with a synthesis report every year. This survey will be used to design the draining system. A new interactive model of the ITER site was also realised (figure 3).
Figure 3 The technical specification for the “First office building”, for the arrival of the International ITER Team has been completed and a call for tender was launched, in order to build this 100 offices building during the first semester of 2006. This building will have around 100 offices, several meeting rooms and will host the ITER International Team before the construction of the main office building on ITER site. OUT-FENCE STUDIES (TRANSPORT OF THE HEAVY COMPONENTS) The five diagnostic studies concerning the transport of the ITER components (Initial status of the environment, Characterisation of bridges, Detailed maps and longitudinal profiles, Construction of an unloading dock and Feasibility of a localised dredging) were finalised within the framework of the Regional Steering Committee. All the files were transmitted to the “Direction Régionale et Départementale de l’Equipement” (DRDE) in charge of the

- 299 - EFDA Technology / ITER Site Preparation / European ITER Site Studies
realisation of the improvements of the itinerary: a call for tender was launched by theses State Services to choose a “maître d’oeuvre” to study in detail all the modifications needed. SOCIOECONOMIC ASPECTS Just after the decision, the implementation of a “Welcome Office” was launched at “La Bergerie”, an ancient building
close to the “Château de Cadarache”. This “Welcome Office” is composed of 7 offices and a meeting room. It has been presented to the Negotiators the 12th of september during the N10 Meeting (figure 4). Within the framework of the TWA-TES-COLABA task, the aspects concerning education were followed. It has been decided that the International School will be implemented at Manosque and fully paid by the Region.
Figure 4 REPORTS AND PUBLICATIONS
EISS2 final report delivered in march 2004 EISS3 stage 1+2 report delivered in june 2004 EISS4 M1 report delivered in january 2005 EISS4 M2 report delivered in march 2005 EISS4 final report delivered in march 2006 Contract n° FU06-CT-2004-00120 (RPrS written by EFET)
TASK LEADER
Pascal GARIN EISS Project Leader CEA-Cadarache F-13108 Saint-Paul-lez-Durance Cedex Tel. : 33 4 42 25 45 43 Fax : 33 4 42 25 63 75 e-mail : [email protected]

- 300 - EFDA Technology / ITER Site Preparation / European ITER Site Studies

- 301 - EFDA Technology / Design Support and Procurement / Design Support
CEFDA03-1098
Task Title: TW3-TDS-MAG: DETAILED ENGINEERING AND MANUFACTURING STUDIES OF THE ITER MAGNET SYSTEM: POLOIDAL FIELD (PF) COIL WINDINGS AND COLD TEST ASSESSMENT
INTRODUCTION
The purpose of this task, started in 2004, is to review the engineering design of critical areas, assess the manufacturing procedures and techniques, layout of the manufacturing facilities and test options, review the fabrication schedule for the production of the ITER coils and their support structures. In particular, the subject of this study contract refers to: 1) Engineering and manufacturing studies of the
Poloidal Field (PF) coil winding packs ;
2) Assessment of the cold test options for the Toroidal Field (TF) coils.
CEA is requested to perform this work with industrial participation to assist EFDA and the ITER International Team in the review of some of the critical features of the design, study the manufacturing procedures and tooling required for winding and impregnation of the PF coils, establish the detailed layout of the manufacturing facilities and schedule, and make an assessment of the need for cold testing of the TF coils. In order to get industrial support for the engineering and manufacturing studies of the PF coils, CEA has placed a contract with the Alstom company in Belfort (France). The assessment of the cold test options for the TF coils involves participation of the DAPNIA department at CEA-Saclay and of the DRFMC department at CEA-Grenoble, and is carried out in close cooperation with FZK at Karlsruhe (Germany). 2005 ACTIVITIES
DETAILED ENGINEERING STUDIES OF PF WINDINGS Following the delivery of the draft report by the Alstom company in december 2004, CEA made comments and Alstom delivered a final report in march 2005 [1]. Outline design of the manufacturing line Alstom studied the possibility to implement a manufacturing line inside the cryogenic buildings. The layout of the buildings showed that an implementation of the different working stations was possible as shown in figure 1. Some areas are available for storage of components or sub-assemblies manufacturing and if needed for handling purposes of the double pancakes.
The design also takes into account surfaces for: - loading-unloading, which has to be under the crane and
isolated from the rest of the building by a wall to prevent from turbulences (when door is open), which could affect the dimensional measurements of the coil.
- warehouse (stock) - areas for professional support (foremen, quality
control, logistics, technical office, …) - meeting rooms - social premises (sanitary blocks, locker rooms, eating
rooms, …), which are legally required These areas are located outside the buildings, along one of the long sides, to avoid handling of the double pancakes over them. The areas dedicated to impregnation shall be separated by a partition wall, in order to be thermally insulated from the rest of the building. For this reason, impregnation stations for double pancakes and for final impregnation are located close to each other. The assembly and winding-pack impregnation station are put at one end of the building, in order to allow moving out the coils without the need of a heavy crane. The lifting capacity of the cranes shall be such to avoid handling the double pancakes with their toolings. A particular attention has been given to temperature control. The area where it should be the narrowest is the winding area, the winding table being manufactured using black steel whereas the conductor jacket will be made of stainless steel. It is proposed to control the temperature in the range ± 5°C, which should allow to limit the error on the largest diameter (24 m for PF3) within ± 0.3 mm. Another possibility would be to manufacture the winding table with stainless steel to avoid temperature control inside the buildings. The proposals are the following: - no direct sunshine, neither on coils nor winding
equipments - control of temperature at 20°C ± 5°C in the winding
areas - no temperature control in the other areas - impregnation and curing separated from the rest of the
building
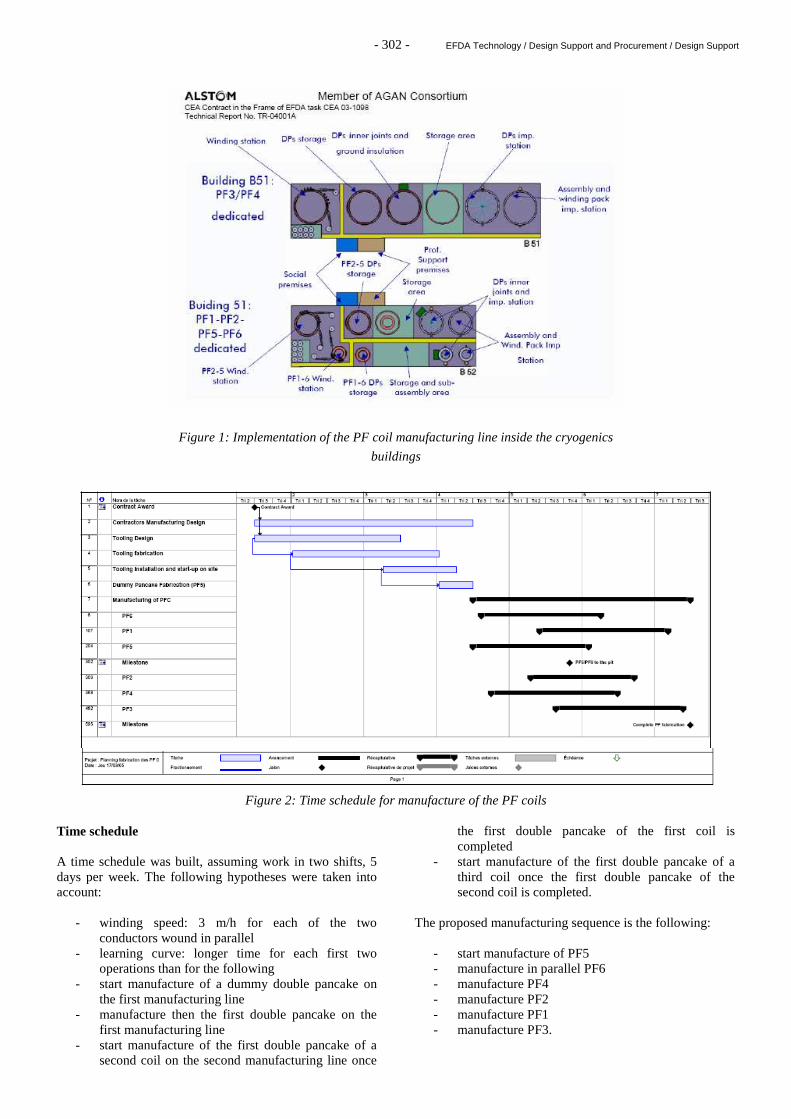
- 302 - EFDA Technology / Design Support and Procurement / Design Support
Figure 1: Implementation of the PF coil manufacturing line inside the cryogenics
buildings
Figure 2: Time schedule for manufacture of the PF coils
Time schedule A time schedule was built, assuming work in two shifts, 5 days per week. The following hypotheses were taken into account:
- winding speed: 3 m/h for each of the two conductors wound in parallel
- learning curve: longer time for each first two operations than for the following
- start manufacture of a dummy double pancake on the first manufacturing line
- manufacture then the first double pancake on the first manufacturing line
- start manufacture of the first double pancake of a second coil on the second manufacturing line once
the first double pancake of the first coil is completed
- start manufacture of the first double pancake of a third coil once the first double pancake of the second coil is completed.
The proposed manufacturing sequence is the following:
- start manufacture of PF5 - manufacture in parallel PF6 - manufacture PF4 - manufacture PF2 - manufacture PF1 - manufacture PF3.

- 303 - EFDA Technology / Design Support and Procurement / Design Support
The corresponding time schedule (figure 2) fits within 42 months, including manufacture of a dummy double pancake, which was requested to meet the ITER schedule. ASSESSMENT OF COLD TEST OPTIONS FOR TF COILS This work has been reported in an oral presentation at Magnet Technology Conference (MT19) in Genoa [2]. Test objectives The main aim of cold tests is the reception of the coils before their assembly to form the TF magnet. An extensive set of controls will be performed at different steps of the manufacturing process to check the quality of the manufacture. Nevertheless, the finally achieved properties of the coils can only be derived from tests performed in conditions relevant to operation at 4.5 K. A failure of a coil during operation would cause a major breakdown in the experimental programme and lead to costly repair resulting from a complicated disassembly and reassembly process. It is therefore of prime importance to carefully check all the properties which can be addressed in a component test. The main items to check are:
- the leak tightness of the He circuits - the electrical insulation of the coils - the electrical resistance of joints.
Other items are secondary goals of the cold tests:
- electrical properties of the conductor - mechanical behaviour of the coil - hydraulic resistance of the conductor - thermal behaviour of the coil - instrumentation behaviour - operation of safety system
Test configuration
Two options can be considered: the test of each coil separately or the tests of coils by pairs. Except the prototype, which should be tested alone, the advantage of testing coils by pair is that it allows time saving on the overall tests and investigation of mechanical behaviour in out-of-plane loading. It is paid by the need of a slightly larger cryostat and of an additional current lead to allow separate coil charging. When testing coils by pair they would be connected adjacent to each other as assembled in the torus. Testing sequence A detailed testing sequence has been established in both considered cases: tests of single coils or tests of pairs of coils. The times needed to perform the tests are respectively 58 days for a single coil, 77 days for two coils and less than 3 years for all coils. It is then possible to test all TF coils within 3 years (figure 3). Testing programme For each test of a pair of coils, the following tests would be performed:
- room temperature checks (leak checks, high voltage tests, Paschen minimum)
- cooldown - tests of both coils without current (leak checks,
high voltage tests, hydraulic resistance) - tests of the first coil with current (joint resistance
measurements, thermal behaviour, safety system operation, critical properties, mechanical behaviour)
- tests of the second coil with current - tests of both coils with current (mechanical
behaviour) - warm-up - final checks at room temperature.
Figure 3: TF coil testing sequence

304 EFDA Technology / Design Support and Procurement / Design Support
Outline design of a test facility An outline design of the test facility has been sketched (figure 4) so as to evaluate the space required and the overall cost. The main components are detailed hereafter. Cryostat Housing two TF coils requires a large cryostat. In order to ease the handling of the assembled coils, the proposed design, derived from that of other large existing vessels in Europe, is a parallelepipedic cryostat with a sliding door. This allows installation of the coils on the supporting frame to be performed in an area close to the cryostat and translation of the two-coil assembly into the cryostat by sliding on rails. Easy accessibility to the coils is so provided for the major part of the test preparation and only the final connections to the electrical, hydraulic and instrumentation circuits have to be performed inside the cryostat. No vertical movement is necessary, which simplifies the handling equipment. To meet the working regulations, a maximum magnetic field of 50 mT should be reached in the personal working area, which calls for providing enough distance between the cryostat and the working area so as to limit the need for shielding. Power supply and dump resistance Operation at nominal current (68 kA) requires a bipolar 70 kA, ± 15 V power supply with a switching unit similar to the fast discharge unit developed for the ITER magnets operation. Discharge in 11 s is achieved by a dump resistor of 32 mΩ in a single coil test and 88 mΩ in a two-coil test at half current. Cryogenic refrigerator A supercritical He cooling circuit will be used for circulating the high mass flow rate with cold circulation pumps. Separate loops are planned for winding and case of the TF coil. A 3 kW (1.6 kW for single coil) refrigerator is needed.
Figure 4: TF coil cold test facility
Construction and cost Starting in 2008, the construction would be completed in 2010. An estimation of the total construction cost of the test facility gives a capital cost about 25 M€. Operating costs are in the range of 22 M€ for testing all TF coils. CONCLUSIONS
The engineering study of the PF coils has been completed and Alstom has delivered their final report. An implementation of the manufacturing line inside the cryogenics buildings has been proposed and a time schedule established, which fits with the ITER requirements. A test of all TF coils by pairs at 4 K has been proposed and a testing sequence established. The test of all coils could be performed within 3 years and fit with the ITER time schedule. The work carried out in the framework of the task is completed. REFERENCES
[1] Report on Detailed Engineering studies of PF
windings, Task CEA 03-1098, Subtask MAGCEA1, ALSTOM Magnets and Superconductors, TR-041001A, 17/03/05
[2] P. Libeyre et al., Proposals for Cold Testing of the
ITER TF coils, Magnet Technology Conference 19, Genoa, 18, 23/09/05
TASK LEADER
Paul LIBEYRE DSM/DRFC/STEP CEA-Cadarache F-13108 Saint-Paul-lez-Durance Cedex Tel. : 33 4 42 25 46 03 Fax : 33 4 42 25 26 61 e-mail : [email protected]
- 305 - EFDA Technology / Design Support and Procurement / Design Support
CEFDA04-1177
Task Title: TW5-TDS-QA: EFDA QUALITY ASSURANCE SYSTEM FOR ITER RELEVANT ACTIVITIES
INTRODUCTION
The objective of the 2005 activity is to issue documents describing EFDA Quality Assurance System in order to allow EFDA to act as an ITER project main contractor with respect to French Nuclear Regulation. 2005 ACTIVITIES
The mission of EFDA, with respect to ITER, is to implement all the technical and scientific activities that are part of the European contribution to the design and construction of ITER reactor. This mission can be subdivided as follows:
- Responding to the direct specific requests of ITER, by providing products and services according to ITER specifications. This mission is formalized through ITER task agreements. The specification of such activities is agreed with ITER and the outcome of the activities is transmitted, reviewed and approved by ITER.
- Performing background activities, of general and
strategic nature, that enable EFDA to be timely ready for the specific requests of ITER. The specification of these activities is developed internally by EFDA and approved by the EFDA Associate Leader for Technology (EALT). These activities are periodically reviewed with ITER. The outcome of the activities is approved by the EALT and documented and access to the relevant information is granted to ITER in the forms agreed.
In regards with the French Nuclear Regulation, EFDA will act as one of the main suppliers of ITER. The objective of the quality management system developed for EFDA is to ensure ITER that the delivered items fulfil the ITER requirements in the agreed time, by:
- Controlling the EFDA internal activities - Controlling the supplier’s activities.
The control of the EFDA internal activities is made through a set of quality documents based on IAEA Safety series 50-C/SG-Q and compatible with ISO 9001 (2000). A quality manual describes the quality policy and objectives of the EFDA in regards with its mission. Dedicated documents describe the provisions to implement in order to fulfil the IAEA Safety series 50-C/SG-Q:
- Organization and responsibilities. This document describes the organizational structure, functional
responsibilities, levels of authority and interfaces for
- managing, performing and assessing the work
related to ITER.
- Information, documents and records control. This document describes the rules for identification, preparation, verification, registration, release, archiving, review and approval of documents and records related to ITER.
- Non-conformances Management, corrective and
preventive actions. This document describes the provisions for the management of the non-conformance control system.
- Resources management. This document describes
the provisions implemented by EFDA to ensure to ensure a proper agreement between the work to be performed and the associated resources (both human and material).
- Audit and control. This documents describes the
process to evaluate and improve the EFDA Quality Management System.
- Configuration management and change control.
This document describes the provisions implemented to ensure that the outputs of design activities managed by EFDA related to the ITER project are properly controlled.
- Procurement management. This document
describes the provisions implemented to ensure that items or services procured by EFDA in support or on behalf of the ITER project are properly controlled so as to ensure they meet established requirements and perform as specified.
The control of the activities of EFDA suppliers is made through three contractual documents dedicated and tailored for each contract placed by EFDA to European industry or laboratories.
- The technical specification defines the object of the contract (the « as specified » configuration of the product)
- The management specification defines the quality
requirements to be met by the supplier.
- The contract defines the commercial and legal requirements and provisions that are applicable
These documents are issued by EFDA, reviewed and approved by ITER. They are tailored according to ITER requirements including quality classification.

- 306 - EFDA Technology / Design Support and Procurement / Design Support
In order to help European laboratories and industries to develop their own quality management system, some guidance notes have established according to the nature of the work to be performed.
- Quality management in Design contracts - Quality management in R and D contracts - Quality management in Manufacture contracts - Quality management in Integration contracts - Quality management in Test and Acceptance
contracts - Quality management in Construction contracts
These notes explain the quality provisions to implement in order to bid for ITER. CONCLUSIONS
The documents were sent to EFDA for approval at the end of november 2005. Minor comments and corrections will be included before April 2006 in order to close the contract. REPORTS AND PUBLICATIONS
Document Title Reference
Quality Manual EFDA/QA 001
Organization and Responsibilities EFDA/QA 002
Resources Management EFDA/QA 003
Internal Control and Audit EFDA/QA 004
Information, documents and records control
EFDA/QA 005
Configuration Management and Change Control
EFDA/QA 006
Procurement management EFDA/QA 007
Non Conformance management, Preventive and Corrective Actions
EFDA/QA 008
Quality Management in R&D Contracts
EFDA/QA 101
Quality Management in Design Contracts
EFDA/QA 102
Quality Management in Manufacture Contracts
EFDA/QA 103
Quality Management in Integration Contracts
EFDA/QA 104
Quality Management in Tests and Acceptance Contracts
EFDA/QA 105
Quality Management in Construction Contracts
EFDA/QA 106
TASK LEADER
René DUC DSM/DIR CEA-Saclay F-91191 Gif-sur-Yvette Cedex Tel. : 33 1 69 08 55 03 Fax : 33 1 69 08 38 16 e-mail : [email protected]

- 307 - EFDA Technology / JET Technology / Physics Integration / Heating Systems
CEFDA04-1146
Task Title: JW4-EP-ICRH: CONTRIBUTION TO ICRH COMPONENT MONITORING AND MANAGEMENT
INTRODUCTION
The new JET-EP ICRH antenna aims at coupling high RF power under ELMy H-mode in ITER-like plasma scenarios. CEA has contributed to the conceptual design of this antenna and was in charge of the design and manufacturing of the antenna limiters (JW3-EP-ICRH & JW4-EP-ICRH in previous report). The manufacturing of the main ICRH components was shared among various companies within Europe. The Inner VTL (inner vacuum wave guide) was attributed to the French company MECAGEST. Through previous industrial contract dealing with manufacturing of tokamak components CEA/DRFC has acquired an experience with a large number of French companies. Therefore CEA was given the responsibility to interface this contract between MECAGEST and the UKAEA
ICRH Antenna in position in the JET Vessel CONTEXT The MECAGEST contract was launched after a european tendering procedure in the previous years. The Scope was to complete detail drawing and then to manufacture the various IVTL components. The main relevant technologies were based on Inconel 625 machining and special welding, large vacuum bellow manufacturing, ceramic integration and vacuum leak testing. A very strict Quality Assurance procedure, following UKAEA requirements, was to be applied.
The manufacturing monitoring took place in two different plants located around Cherbourg; the vacuum leak testing of the full size components was carried out by the company NORDTEST, in the surrounding wall of a boiler making company TIC in Cadenet, close to Cadarache. 2005 ACTIVITIES
The 2005 activity from CEA was to give local support to UKAEA in the monitoring of the manufacturing activity with MECAGEST. The main responsibilities of the CEA were the following: to facilitate a good understanding between UKAEA and MECAGEST - to check the applicable documents and also the good
use of them - to verify that the procedures and the drawings revue are
up dated - to inform UKAEA of the progress or delays in any
parts - to anticipate the hold points and call experts - to help technically MECAGEST when possible with
contact from JET - to report frequently during fabrication The launching of this activity was done trough a work session in JET in December 2004. The monitoring of the MECAGEST activity done during long missions at the manufacturing plant. Each missions consisted on going trough the various Items under the CEA responsibility. Many mechanical difficulties were resolved by a close liaison between CEA and UKAEA Twelve detailed mission reports were completed and were the base for the industrial contract evaluation at JET.
Inner VTL wave-guide tube ready to be tested

- 308 - EFDA Technology / JET Technology / Physics Integration / Heating Systems
Final welding of the guides with all equipment assembly was achieved in september 2005 and checked by CEA and UKAEA. All the pieces were directly sent at COLLINI FLUHMANN for silver plating.
Vacuum bellows assemblies for IVTL matching equipment Eventually the components were shipped to the company NORDTEST for he leak testing. Before CEA had undertook the rehabilitation of the installation and the qualification of the equipments. Finally the leak tests ended on november 25th with no leak detected.
CONCLUSIONS
After a successful high temperature He leak testing all the IVTL components were delivered to JET. Therefore the CEA/DRFC contribution to the monitoring of this activity is now finished. The Draft final report on this activity has been completed [1] and has been sent to the CSU JET. REPORTS AND PUBLICATIONS
[1] ‘CEA DRFC report PEFC/CRM 2006/003
Contribution to the manufacturing monitoring of the ITER like inner VTL for the ICRH Antenna at MECAGEST
TASK LEADER
Philippe CHAPPUIS and Jean Marc VERGER DSM/DRFC/SIPP CEA-Cadarache F-13108 Saint-Paul-lez-Durance Cedex Tel. : 33 4 42 25 46 62 Fax : 33 4 42 25 49 90 e-mail : [email protected]

- 309 - EFDA Technology / Jet Technology / Physic Integration / Diagnostics
CEFDA03-1044 CEFDA03-1180
Task Title: JW3-EP-IRV AND JW4-EP-IRV: DIAGNOSTIC ENHANCEMENT: DEVELOPMENT, FOLLOW-UP OF THE PROCUREMENT AND PERFORMANCE OF ACCEPTANCE TEST
INTRODUCTION
In the framework of the JET-EP project, proposal sent by the Association Euratom-CEA to develop a new diagnostic for thermography analysis was approved by EFDA in 2002. This system will allow to see a large section of the internal components in the vessel such as divertor, main chamber, ICRH antenna etc, aiming at measuring the surface temperature during normal operation and off normal events such as ELMs and disruption. This diagnostic is ITER relevant both for the technology used and for the physic outputs. This system will allow to evaluate the power deposition in the main chamber during transient events and could be used, in the future with implementation of a feedback control, for real time machine protection. 2005 ACTIVITIES
The scope of the work in 2005 was the following-up of the two contracts with industry (under article 7) launched in 2003 for procurement of an infrared camera and an endoscope. The infrared camera has been delivered at CEA-Cadarache at the end of 2004 and the acquisition system was developed during first semester of 2005 at the Cedip premises. Then, intensive and comprehensive tests have been performed both at Cadarache and on JET site allowing to interface the IR diagnostic with the main acquisition system at JET. In july 2005, the reception tests of the IR camera and the acquisition system have been done and the contract with Cedip has been closed.
On the second industrial contract, several problems occurred during the manufacturing and the assembly
phases: First, manufacture of the aspheric mirrors, known as a very technical and delicate task, needed several
attempts before successful results. Each mirror of the Cassegrain telescope passed the acceptance tests only after the third manufactured mirror. These technical problems
induced a delay of about 2 months. Once the manufacturing phase has finished, the assembly phase started and was expected to last about few days. From the interferogram received from TNO, it has been pointed out that the Cassegrain telescope was not mounted according to the specifications. Assembly of the Cassegrain to the technical specifications (0.3 fringes) required 3 months of effort on optical tests and modifications of the mechanical support. Finally, the Cassegrain telescope was successfully assembled in july. Then, the endoscope has been delivered at the beginning of august 2005 and reception tests were conducted in the assembly hall at JET, as can be seen on the figure 1, and finished on 19th august. On 23rd august 2005, as planed more than one year before, the endoscope equipped with the IR camera was installed in the Lower limiter guide tube on octant 8 on JET. First infrared and visible images of the in-vessel components, taken during the installation, is shown on figure 2. Commissioning of the diagnostic started in october but due to the delay in the JET restart and the cancellation of the C15 campaign in november, the commissioning phase will be extended until the end of the restart. The diagnostic is operational for the beginning of the experimental campaign C15 which is now planned on 24th april 2006.
Figure 1: Acceptance tests in the Assembly Hall at JET

- 310 - EFDA Technology / Jet Technology / Physic Integration / Diagnostics
Figure 2: Infrared and visible images of the in-vessel components in JET. CONCLUSIONS
The assembly and integration phase of the project has been successfully performed although technical difficulties occurred. The JET-EP-IRV diagnostic has been installed during summer 2005, as expected, and the commissioning is under progress. The diagnostic is fully operational for the start of the C15 Campaign. REPORTS AND PUBLICATIONS
Minutes on meeting at CEDIP on 13th January 2005 DIAG/CRR-2005.004 (2005) E. Gauthier Minutes on meeting at TNO on 28th January 2005 DIAG/CRR-2005.006 (2005) E. Gauthier Report on the tests at JET with the JET EP IR camera on 21st -25th Feb 2005 DIAG/NTT-2005.009 (2005) E. Gauthier, H. Roche Review of the JET-EP IRV endoscope status on 3 June 2005 by TNO DIAG/PPT-2005.001 (2005) E. Gauthier Description of the acceptance tests of the IRV endoscope DIAG/NTT-2005.027 (2005) E. Gauthier
Report on CEDIP acceptance tests performed at JET from 7th to 13th July 2005 DIAG/NTT-2005.028 (2005) E. Gauthier, H. Roche Final report on 2003 activities on the JET-EP IRV project DIAG/NTT-2005.022 (2005) E. Gauthier Wide-angle infrared thermography for JET-EP 32nd EPS Conference on Controlled Fusion and Plasma Physics (2005) E. Gauthier, Ph. Chappuis, L. Doceul, D. Guilhem, M. Missirlian, H. Roche, E. Thomas, P. Andrew TASK LEADER
Eric GAUTHIER DSM/DRFC/SIPP/CEC CEA-Cadarache F-13108 Saint-Paul-lez-Durance Cedex Tel. : 33 4 42 25 42 04 Fax : 33 4 42 25 49 90 e-mail : [email protected]

- 311 - EFDA Technology / Jet Technology / Vessel-In Vessel / Plasma Facing Components
CEFDA05-1261
Task Title: JW5-BEP-CEA-28: ITER WALL MATERIALS IN JET: SUPPORT OF THE OPERATOR IN DESIGNING JET PFC DEVELOPMENT OF W COATINGS ON CFC SUBSTRATE INTRODUCTION
In the framework of the JET-EP2 project, ITER-like wall project is planed to be implemented on JET during a shutdown in 2008. The project foresees the use of beryllium on the first wall and tungsten in the divertor. For the latter R&D activities on W coating on CFC tiles has been launched in the Associations. Based on the knowledge obtained previously on tungsten coating by Plasma Spray [1], [2] and by CVD assisted by plasma [3], the Association Euratom-CEA proposed to develop thin tungsten coating by means of CVD techniques and thick tungsten coating by means of Plasma Spray techniques. 2005 ACTIVITIES
The scope of the work in 2005 was to develop and qualify processes for tungsten coating on CFC tiles aiming at a possible application at an industrial scale for the full divertor tiles of JET. It was also required to characterize the coating, in particular with respect to the thickness and impurity content. CFC substrates have been received from JET at the end of june and tungsten coated CFC tiles have been sent back to Garching in october 2005. The CFC material is bidirectional (fibres are in planes in x-y direction) and two types of tiles have been manufactured: Type-1 was large (80x80x40 mm3) with fibres perpendicular to the surface (good thermal conduction toward the back side of the tile) and type-2 was smaller (80x40x40 mm3) with fibres parallel to the surface (low thermal conduction toward the back side of the tile). The required thickness for the type-1 tiles was 4, 10 and 200 µm and 4 µm for the type-2 tiles.CVD deposition has been performed at WTCM in Belgium. The company is equipped with a large CVD reactor, which can handle large quantity of toxic gas such as tungsten hexafluoride used as tungsten vector. The reactor is pumped down to 90 mbar in order to reduce the oxygen contamination. The cracking temperature is set at 500°C. Additionally to WF6; argon and hydrogen gazes are introduced in the reactor. The figure 1 shows one CFC tile coated with 10 µm tungsten layer on all except bottom surfaces. A set of 4 type-1 tiles coated with 10 µm and a set of 4 type-1 and one type-2 tile coated with 4 µm have been sent to IPP Garching for thermal analysis. Plasma Spray deposition has been done at St Gobain in Avignon (France). The company is equipped with several plasma torch mounted on robot, one of them being installed in a large vacuum tank. Different parameters have
been tested (gas fluxes, pressure, powder, power) in order to minimize the lamellar effect and to increase the bonding of the layer to the substrate.
Figure 1: Type-1 CFC tile coated with 10 µm tungsten
by CVD To accommodate the large differential expansion coefficient between tungsten and carbon and to reduce the tungsten carbide formation, the JET specifications implied to use a sub-layer with a material, which had to be defined. rhenium has been chosen due to its compatibility with tungsten (similar mass, high thermal conductivity, high melting point, alloy formation with tungsten). The thickness of the rhenium layer has been set at 30 µm, leading with a 170 µm for the tungsten layer. During the R&D phase it has been observed that the best rhenium coating is achieved under a low pressure (~100 mbar) in argon while tungsten layer showed better metallographic structure at atmospheric pressure in argon. In both cases, temperature of the substrate is kept below 100°C in order to avoid stress formation in the layers. The figure 2 shows a type-1 tile coated with a 30 µm Re/170 µm W layer. A set of 4 type-1 tiles has been sent to Garching for thermal analysis. Preliminary analysis performed by means of Scanning Electron Microscopy (SEM) and X-Ray analysis (EDX) at Marseilles University shows that the thickness of the layers fitted within the requirements and that impurity content is very low in both CVD and PS tungsten coating.
(a)
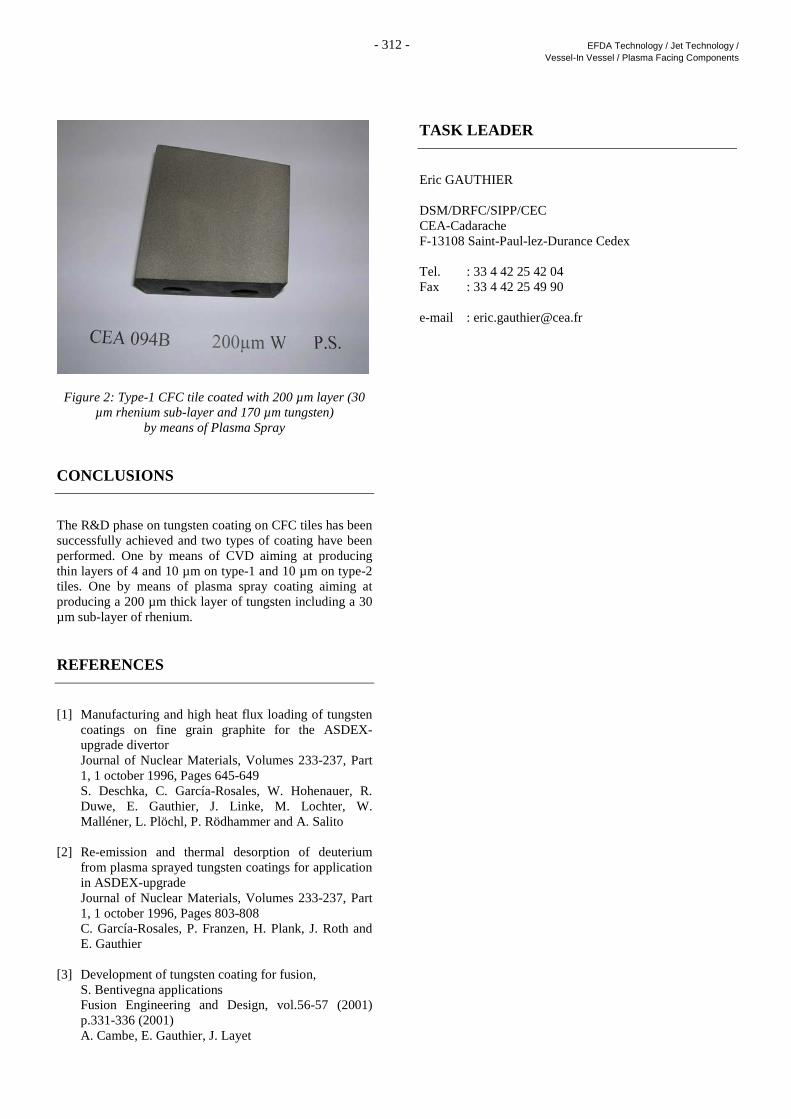
- 312 - EFDA Technology / Jet Technology / Vessel-In Vessel / Plasma Facing Components
Figure 2: Type-1 CFC tile coated with 200 µm layer (30 µm rhenium sub-layer and 170 µm tungsten)
by means of Plasma Spray CONCLUSIONS
The R&D phase on tungsten coating on CFC tiles has been successfully achieved and two types of coating have been performed. One by means of CVD aiming at producing thin layers of 4 and 10 µm on type-1 and 10 µm on type-2 tiles. One by means of plasma spray coating aiming at producing a 200 µm thick layer of tungsten including a 30 µm sub-layer of rhenium. REFERENCES
[1] Manufacturing and high heat flux loading of tungsten
coatings on fine grain graphite for the ASDEX-upgrade divertor
Journal of Nuclear Materials, Volumes 233-237, Part 1, 1 october 1996, Pages 645-649
S. Deschka, C. García-Rosales, W. Hohenauer, R. Duwe, E. Gauthier, J. Linke, M. Lochter, W. Malléner, L. Plöchl, P. Rödhammer and A. Salito
[2] Re-emission and thermal desorption of deuterium
from plasma sprayed tungsten coatings for application in ASDEX-upgrade
Journal of Nuclear Materials, Volumes 233-237, Part 1, 1 october 1996, Pages 803-808
C. García-Rosales, P. Franzen, H. Plank, J. Roth and E. Gauthier
[3] Development of tungsten coating for fusion, S. Bentivegna applications Fusion Engineering and Design, vol.56-57 (2001)
p.331-336 (2001) A. Cambe, E. Gauthier, J. Layet
TASK LEADER
Eric GAUTHIER DSM/DRFC/SIPP/CEC CEA-Cadarache F-13108 Saint-Paul-lez-Durance Cedex Tel. : 33 4 42 25 42 04 Fax : 33 4 42 25 49 90 e-mail : [email protected]

- 313 - EFDA Technology / Jet Technology / Vessel-In Vessel / Plasma Facing Components
JW5-AEP-CEA-26
Task Title: R&D ON W COATING ON CFC AND BULK W TILES DEVELOPMENT IN SUPPORT OF THE ITER-LIKE FIRST WALL EXPERIMENT PROJECT
INTRODUCTION
The JET project "ITER-like wall" is ongoing with the aim of replacing all due plasma facing components. The complete JET wall replacement is to take place in 2008. Element manufacture in industry is planned in 2006/2007. A R&D program for the fabrication of W-and Be-covered elements has been launched in 2005 to define and assess the technologies required by the project. The first option for the divertor tiles consists in W-coated CFC blocks. Different Associations and companies are carrying out technical developments. Among these associations, MEC (Romania) is a recent producer of tungsten coating has been judged useful to associate their task with a collaborative to fusion lab. The goal of this task is to support MEC in the R&D to identify and qualify technologies for the production of W coated CFC tiles to be installed in the JET divertor during the 2008 shutdown. MEC uses CMSII (Combined Magnetron Sputtering and Ion Implantation) and TVA (Thermoionic Vacuum Arc) techniques to produce tungsten coatings having thickness of 4 µm (3-6 µm) or 10 µm (9-12µm) on CFC substrate with samples and tiles provided by JET. MEC has the following testing capability: - metallographic examination - heat flux tests (hollow cathode) - adhesion tests The task was initiated in may 2005, and a close collaboration started effectively in July with the visit of R. Mitteau and X. Courtois to MEC. During this visit, the advantages and drawbacks of both coating techniques were discussed, along with various other points (samples testing including high heat flux tests, quality control, industrialisation). The contours of this task were also specified. It was decided that CEA should focus on the following points: - SEM examination, chemical analysis - Non-destructive examination through thermal lock-in
techniques - cross check of adhesion tests The TL (H. Maier) was kept informed of the talks. His visit to CEA lab in Cadarache was the opportunity to confirm the decision over the actions to be done by CEA lab.
The design morphology of the MEC samples is as follows
W - 10 µm
Mo - 10 µm
CFC
CMSII
W - 2 x 4 µm
Re2 µm
CFC
TVA
Figure 1: Sketch of the samples
CSMII-4, CF-stainless steel / W
TVA-3, CFC / Re / W / Re / W total coating thickness = 8 µm
Figure 2: Photos of 2 samples In july 2005, 6 samples were delivered to CEA for the investigations

- 314 - EFDA Technology / Jet Technology / Vessel-In Vessel / Plasma Facing Components
2005 ACTIVITIES
MORPHOLOGY Both processes produce uniform coatings (figures 3and 4).
Figure 31: Surface in an area with few grains (CMSII-4)
Figure 4: Typical TVA-3 surface Holes in the coating are apparent in some locations. The hole size is up to 400 µm wide. Carbon composite is not directly apparent at the bottom of the holes, so that the defect may be acceptable. A reason for the holes may be the inherent roughness of the carbon composite. Large holes (> 10 µm) are present at the surface of the carbon composite, and the thin coating has not the possibility to fill it. In order to reduce the occurrence of these holes, a possibility could be to control the roughness of the tile before coating. The coating surfaces are grainy, a common feature for tungsten coatings. Grains are typically 5-10 µm for CSM-II, somewhat smaller for TCA (2-5 µm). Wedges have been done in the coating, using a Focused Ion beam, in order to investigate the morphology of the coating. For CSM-II, the total thickness of the W layer is of the order of 10 µm. This value is within the specification (9-12 µm). Adhesion appears good (no crack between layers).
Figure 5: Ion beam wedge For the TVA sample, the thickness is not sufficient (2 µm). the very thin rhenium interlayer could be observed. Its thickness is evaluated to be 300nm at the location of the observation. COMPOSITION The composition is evaluated using energy dispersive X-ray microanalysis. Surface analysis shows a majority of tungsten, usually with carbon as impurity. The oxygen is at a level which is sometimes not noticeable with this technique (figure 6), and reaches 2% (weight %) at the highest.
Figure 6: Energy dispersive X-ray microanalysis for CMSII-4, on the coating
NON DESTRUCTIVE EXAMINATION A non destructive technique (NDT) is essential to control the coating quality after manufacture. Conventional NDT techniques such as Xrays are not usable, because the quantity of material to investigate is small compared to the substrate, so that the useful signal is usually very small and lost in the noise. CEA has developed an expertise in thermal NDT, which was essential during the reception of the high heat flux elements of TS limiter. Recently, a new NDT branch was investigated, based on modulated signal (lock-in techniques). A test bed has been set up. The applicability of such techniques to tungsten coating was studied.
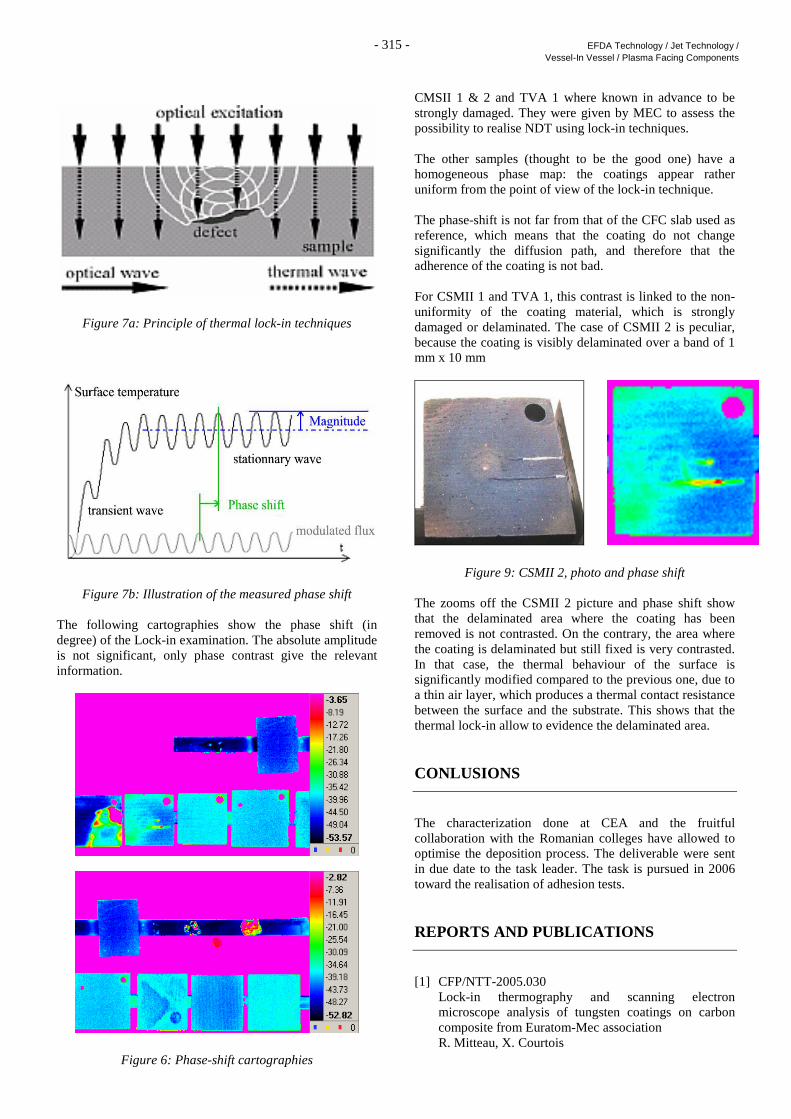
- 315 - EFDA Technology / Jet Technology / Vessel-In Vessel / Plasma Facing Components
Figure 7a: Principle of thermal lock-in techniques
Figure 7b: Illustration of the measured phase shift The following cartographies show the phase shift (in degree) of the Lock-in examination. The absolute amplitude is not significant, only phase contrast give the relevant information.
Figure 6: Phase-shift cartographies
CMSII 1 & 2 and TVA 1 where known in advance to be strongly damaged. They were given by MEC to assess the possibility to realise NDT using lock-in techniques. The other samples (thought to be the good one) have a homogeneous phase map: the coatings appear rather uniform from the point of view of the lock-in technique. The phase-shift is not far from that of the CFC slab used as reference, which means that the coating do not change significantly the diffusion path, and therefore that the adherence of the coating is not bad. For CSMII 1 and TVA 1, this contrast is linked to the non-uniformity of the coating material, which is strongly damaged or delaminated. The case of CSMII 2 is peculiar, because the coating is visibly delaminated over a band of 1 mm x 10 mm
Figure 9: CSMII 2, photo and phase shift The zooms off the CSMII 2 picture and phase shift show that the delaminated area where the coating has been removed is not contrasted. On the contrary, the area where the coating is delaminated but still fixed is very contrasted. In that case, the thermal behaviour of the surface is significantly modified compared to the previous one, due to a thin air layer, which produces a thermal contact resistance between the surface and the substrate. This shows that the thermal lock-in allow to evidence the delaminated area. CONLUSIONS
The characterization done at CEA and the fruitful collaboration with the Romanian colleges have allowed to optimise the deposition process. The deliverable were sent in due date to the task leader. The task is pursued in 2006 toward the realisation of adhesion tests. REPORTS AND PUBLICATIONS
[1] CFP/NTT-2005.030 Lock-in thermography and scanning electron
microscope analysis of tungsten coatings on carbon composite from Euratom-Mec association
R. Mitteau, X. Courtois

- 316 - EFDA Technology / Jet Technology / Vessel-In Vessel / Plasma Facing Components
[2] JET ITER-like wall
Lock-in thermography NDT on samples before HHF testing Enregistrement CFP/NTT-2006.004, X. Courtois
[3] Lock-in thermography NDT applied to W coated tiles:
Modelling with quadripoles method, CFP/NTT-2005.015 (2005), X. Courtois, R. Mitteau
[4] W coated JET tiles NDE Lock-In thermography
Industrialisation CFP/NTT-2005.025 (2005), X. Courtois
TASK LEADER
Raphaël MITTEAU DSM/DRFC/SIPP/GCFP CEA-Cadarache F-13108 Saint-Paul-lez-Durance Cedex Tel. : 33 4 42 25 43 72 Fax : 33 4 42 25 49 90 e-mail : [email protected]

- 317 - EFDA Technology / Jet Technology / Safety and Environment
JW5-FT-3.2
Task Title: DESIGN AND CONSTRUCTION OF THE SYSTEM FOR LASER DETRITIATION OF JET CO-DEPOSITED LAYERS
INTRODUCTION
ITER safety studies have shown that the maximum acceptable inventory of tritium in the vacuum chamber could be reached even with a few tens of plasma shots. Tritium is trapped both in plasma facing components (PFC) and cryogenic pumps. The studies on tritium trapping in PFC have shown that a large amount of tritium is retained in the co-deposited layer. Thus, detritiation of the vacuum chamber surfaces and tritium removal are indispensable for the future ITER installation. Detritiation methods by ablation of the co-deposited layer or H/D thermal desorption by laser heating have been under investigation in CEA-Saclay laboratories since 2002. In 2003 – 2004, the repetition rate lasers with 5-100 ns pulse duration were developed. The studies on laser heating and ablation were aimed to obtain performance optimisation of the methods for future in-situ PFC detritiation.
The decision was made to base the detritiation device on a fiber laser with galvano-plate scanning system. The choice was justified by a high quality of a fiber laser beam that can be focused onto the treated surface by a lens with a long focal length (420 mm in our case). Such a near-Gaussian laser beam (even focused onto the spot of 100-300 µm diameter) has a relatively small divergence in the beam waist. Thus, the accuracy of the laser device positioning with respect to the treated surface should not be regarded as a problem. Based on the experimental results of the laboratory tests on detritiation of a co-deposited layer [1, 2], an optimized system for surface detritiation by laser ablation was designed and constructed in 2005. The high repetition rate Nd-YAG fiber laser (20 W mean power) was equipped with a special optical system for the beam focusing and scanning (galvano plate X-Y Scanner).The proposed laser system was laboratory tested before in-situ experiments. The laboratory tests of the laser detritiation system were performed on the textor tiles with the relatively thick co-deposited layer. The laser system will be applied for detritiation tests (planned for may-june, 2006) at JET (Culham, UK) in the beryllium handling facility.
Figure 1: Laboratory laser installation in LILM, CEA-Saclay, France.

- 318 - EFDA Technology / Jet Technology / Safety and Environment
2005 ACTIVITIES
The developed principal scheme of the laser detritiation device was realised in the laboratory laser installation (figure 1). The collimated laser beam (yellow arrows) of 2w = 8 mm diameter (FW 1/e 2) from the laser exit is reduced to 2w = 3.5 mm beam diameter by the optical telescope with two lenses of 100 mm and 50 mm focal lengths. The CCD camera transmits the front view of the cleaned target to the monitor screen. Both the monitor and the laser control box can be displaced from the ablated zone to the distance defined by the electrical cable length. Thus, it is possible to avoid the risk of the personnel exposure from the effects of contaminated ablated matter. The nozzle is applied to aspirate the ablated matter (particles, gas) in the treated zone. Then, the ablated matter is collected on the filters of the aspirator system installed in the next room. The laser beam is focused onto the textor graphite tile by the focusing lens with the focal length F = 420 mm. For the given laser system with the pulse energy E = 1 mJ (20 W mean power at 20 kHz repetition rate) and laser spot diameter 2wo ≅ 230 µm, the laser fluence on the beam axis F0 can be determined as F0 ≅ 2E / π wo
2 ≅ 4.8 J/cm2. This fluence is of the order of the ablation threshold fluence for the graphite substrate [2] for 100 ns pulse duration. A thorough laboratory test on the device working parameters (repetition rate, power, scanning velocity,…) is required to ensure co-deposited layer detritiation in future BeHF experiments in a controlled optimal regime. Laser repetition rate and power were the first working parameters to be tested with the fiber laser. These parameters can be adjusted by a laser control box. Laser pulse duration increases with the decrease in the mean laser power. The laser beam intensity distribution was measured by SPIRICON CCD camera. The intensity distribution in the radial direction can be approximated by the Gaussian function with parameter M2=1.45. The ablation tests were made to determine the optimal regime of surface cleaning. As the laser intensity distribution is inhomogeneous (the Gaussian distribution), it was necessary to determine experimentally the optimal velocity of the beam scanning for homogeneous surface cleaning. A new textor tile sample with co-deposits of 20 µm maximal thickness was under ablation tests (figure 2) Laser cleaning was performed on 5mm × 5mm zones. The scanning velocities 0.5 m/s and 5 m/s were applied. High velocity corresponds to the surface ablation without spatial superposition of the consecutive pulses of 20 kHz repetition rate. Low velocity corresponds to the ten-fold superposition of the laser spots. The cleaned zones were measured by a mechanical profilometer. A multi-fold cleaning resulted in better cleaning effects even for the low velocity scanning. This may be attributed to insufficient laser spot superposition in the vertical direction and to a possible re-deposition of the ablated matter on the neighbour cleaned surface.
Four- or six-fold rapid scanning (craters 3 and 4 on figure 2) can be considered sufficient for cleaning 20 µm co-deposited layers on the textor graphite tile. The cleaning of 5mm ×5mm surface may be realised in 0.256-0.378 seconds with our laser device. Thus, the cleaning of 100mm ×100mm co-deposited layer of 20 µm thickness can be performed in about 2 minutes. The results of our previous experiments [2] demonstrated that the co-deposited layer of 50 µm thickness was almost completely removed after a single laser beam scanning of 10×10 mm2 surface in 2 seconds. Taking into account the different co-deposited layer thickness, it is possible to state that the new laser device demonstrated the same ablation efficiency that was observed in our previous experiments with the laser pulses of 120 ns duration (1059 nm) and 100 ns duration (532 nm). Laser ablation on the right part of the textor tile (craters A-L) was performed to test the absence of any damage on the graphite substrate surface. No substrate damage was detected by the mecanical profilometer measurements. Laser beam interaction with the surface resulted only in colour changes without surface ablation. Thus, one may conclude that it is possible to perform the homogeneous cleaning with inhomogeneous laser beam.
Figure 2: Zones (5mm × 5mm) on textor tile ablated with the new laser device. On the left – tile surface with a co-deposited layer. On the right – tile surface without a co-
deposited layer. A very promising result was obtained with sapphire window cleaning. The sapphire window was installed on the TORE SUPRA tokamak (DRFC, CEA, Cadarache, France) and its internal surface was soiled by the plasma sputtered matter (figure 3a). The result of the preliminary test on laser cleaning was very reassuring as it was possible to remove the deposited layer without sapphire surface damaging (figure. 3b, zones 1-10). Further thorough studies on optimisation and characterisation of the cleaning performances of the laser technique are required.

- 319 - EFDA Technology / Jet Technology / Safety and Environment
Figure 3: Sapphire window with the deposited layer before (a) and after (b) laser cleaning.
CONCLUSIONS
The report presents the results on the Laser Detritiation Device that was under development in DPC/SCP/LILM (CEA Saclay, France). The experimental studies on detailed laser beam characterisation and co-deposited layer cleaning by laser ablation were performed. The obtained cleaning performances of the new laser system were in accordance with the experimental results of our previous studies with another fiber laser system [2] and homogeneous laser beam transported by multimode optical fiber [1], [3]. The developed laser device was thoroughly characterised and tested with textor graphite tile. The sapphire window cleaning by laser technique was performed. The result of the window cleaning might be considered very promising as it was possible to remove the deposited layer without sapphire surface damaging. Thus, it offers a new potential laser application for optical surface cleaning. When the necessary contamination protection of the main equipment is ensured, the developed laser device might be considered prepared for demonstrator experiments on JET surfaces cleaning in JET BeHF in may-june, 2006. REPORTS AND PUBLICATIONS
[1] A. Semerok, J.-.M. Weulersse, F. Brygo, C.
Lascoutouna, C. Hubert, F. LeGuern, M. Tabarant, “Studies on graphite surfaces detritiation by pulsed repetition rate nanosecond lasers”, CEA report NT DPC/SCP/04-076-A, 2004, pp. 39.
[2] A. Semerok, J.M. Weulersse, F. Brygo, D. Farcage, C.
Hubert, C. Lascoutouna, M. Géléoc, P. Wodling, H. Long, F. Champonnois, G. Brunel, G. Vimond, E.
Lizon, V.Dauvois, V. Delanne, C. Grisolia, S. Fomichev, M. Hashida, “Studies on tokamak wall surfaces decontamination by pulsed repetition rate lasers”, CEA report NT DPC/SCP/05-111-A, 2005, pp. 50.
[3] A. Semerok, F. Brygo, S.V. Fomichev, F.
Champonnois, J.-M. Weulersse, P.-Y. Thro, P. Fichet, Ch. Grisolia, “Laser detritiation and co-deposited layer characterisation for future ITER installation”, ENC Proceedings, Versailles, France, 2005.
TASK LEADER
Alexandre SEMEROK DEN/DPC/SCP/LILM CEA-Saclay F-91191 Gif-sur-Yvette Cedex Tel. : 33 1 69 08 65 57 Fax : 33 1 69 08 78 84 e-mail : [email protected]
9
101
2
3
45
67 8
9
101
2
3
45
67 8
(a)
(b)
58 mm

- 320 - EFDA Technology / Jet Technology / Safety and Environmen
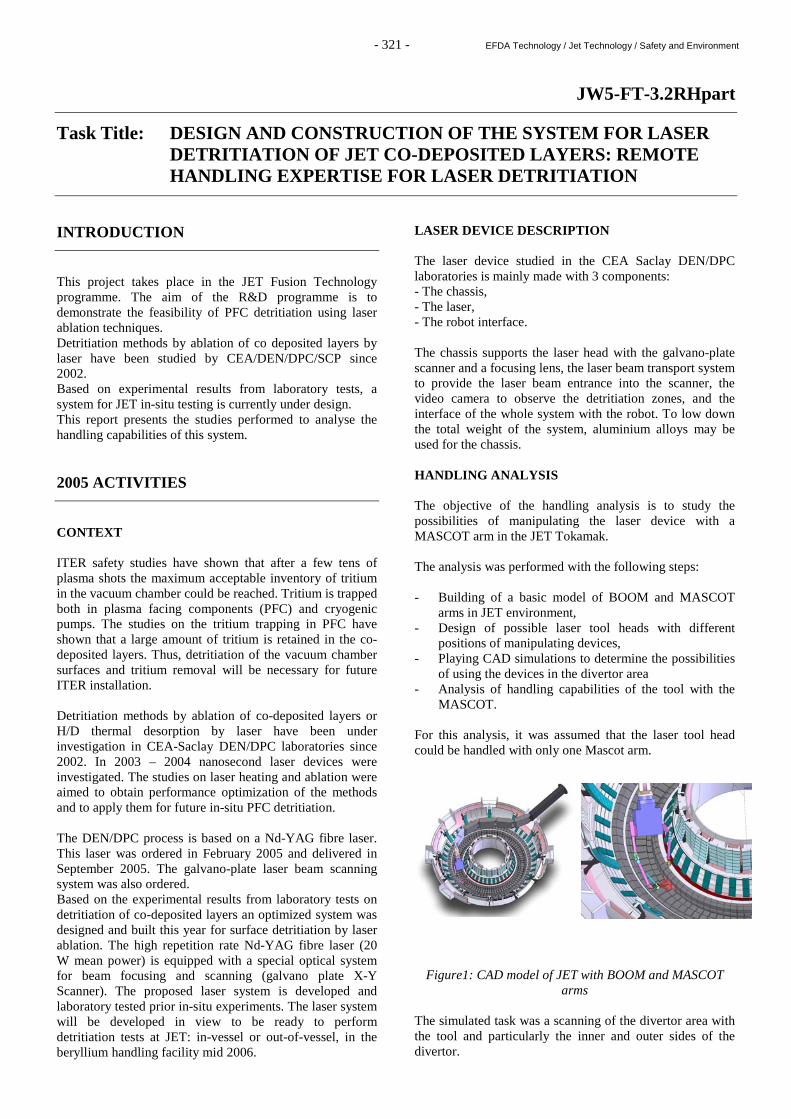
- 321 - EFDA Technology / Jet Technology / Safety and Environment
JW5-FT-3.2RHpart
Task Title: DESIGN AND CONSTRUCTION OF THE SYSTEM FOR LASER DETRITIATION OF JET CO-DEPOSITED LAYERS: REMOTE HANDLING EXPERTISE FOR LASER DETRITIATION
INTRODUCTION
This project takes place in the JET Fusion Technology programme. The aim of the R&D programme is to demonstrate the feasibility of PFC detritiation using laser ablation techniques. Detritiation methods by ablation of co deposited layers by laser have been studied by CEA/DEN/DPC/SCP since 2002. Based on experimental results from laboratory tests, a system for JET in-situ testing is currently under design. This report presents the studies performed to analyse the handling capabilities of this system. 2005 ACTIVITIES
CONTEXT ITER safety studies have shown that after a few tens of plasma shots the maximum acceptable inventory of tritium in the vacuum chamber could be reached. Tritium is trapped both in plasma facing components (PFC) and cryogenic pumps. The studies on the tritium trapping in PFC have shown that a large amount of tritium is retained in the co-deposited layers. Thus, detritiation of the vacuum chamber surfaces and tritium removal will be necessary for future ITER installation. Detritiation methods by ablation of co-deposited layers or H/D thermal desorption by laser have been under investigation in CEA-Saclay DEN/DPC laboratories since 2002. In 2003 – 2004 nanosecond laser devices were investigated. The studies on laser heating and ablation were aimed to obtain performance optimization of the methods and to apply them for future in-situ PFC detritiation. The DEN/DPC process is based on a Nd-YAG fibre laser. This laser was ordered in February 2005 and delivered in September 2005. The galvano-plate laser beam scanning system was also ordered. Based on the experimental results from laboratory tests on detritiation of co-deposited layers an optimized system was designed and built this year for surface detritiation by laser ablation. The high repetition rate Nd-YAG fibre laser (20 W mean power) is equipped with a special optical system for beam focusing and scanning (galvano plate X-Y Scanner). The proposed laser system is developed and laboratory tested prior in-situ experiments. The laser system will be developed in view to be ready to perform detritiation tests at JET: in-vessel or out-of-vessel, in the beryllium handling facility mid 2006.
LASER DEVICE DESCRIPTION The laser device studied in the CEA Saclay DEN/DPC laboratories is mainly made with 3 components: - The chassis, - The laser, - The robot interface. The chassis supports the laser head with the galvano-plate scanner and a focusing lens, the laser beam transport system to provide the laser beam entrance into the scanner, the video camera to observe the detritiation zones, and the interface of the whole system with the robot. To low down the total weight of the system, aluminium alloys may be used for the chassis. HANDLING ANALYSIS The objective of the handling analysis is to study the possibilities of manipulating the laser device with a MASCOT arm in the JET Tokamak. The analysis was performed with the following steps: - Building of a basic model of BOOM and MASCOT
arms in JET environment, - Design of possible laser tool heads with different
positions of manipulating devices, - Playing CAD simulations to determine the possibilities
of using the devices in the divertor area - Analysis of handling capabilities of the tool with the
MASCOT.
For this analysis, it was assumed that the laser tool head could be handled with only one Mascot arm.
Figure1: CAD model of JET with BOOM and MASCOT arms
The simulated task was a scanning of the divertor area with the tool and particularly the inner and outer sides of the divertor.

- 322 - EFDA Technology / Jet Technology / Safety and Environment
First simulations have shown many possible contacts and collisions between the robotic arm and the first wall of JET. These are not really suitable to operate the laser tool with a MASCOT. The next figure shows the area which can be scanned with the laser without moving the arm. This area is about one entire divertor tile.
Figure 2: Simulation views of divertor tiles scanning Following simulations with the tool head in configurations with the scan cube handled perpendicularly to the beam have shown the feasibility of the intervention with the laser tool and the mascot arm. These handling configurations are suitable to operate the laser tool with a MASCOT. During the simulations it appeared that a tool with a shorter focal length than the initial one could allow a perpendicular view of the outer and inner surfaces of the divertor. Simulations show that the best length could be around 350 mm instead of 420.
Figure 3: Simulation with a 350 mm focal length First simulations have also shown an interest for a design of a tool which can be handled by both MASCOT arms. The left arm is the best to operate in the outer side of divertor and the right one for the inner side. The next figures present simulation with a tool designed with 3 handles and an exchange of handling arm during operation.
Figure 4: Exchange of handling arm
CONCLUSIONS
The simulations have shown that the best design for a laser tool head to be manipulated with a MASCOT arm in JET divertor is a configuration using 3 handles. This allows carrying the tool with the both 2 arms. A focusing lens with a focal length of 350 mm allows being perpendicular to the inner and outer sides of divertor and then will be probably the most efficient. This study has demonstrated the possible intervention using the JET existing capabilities for PFC detritiation using laser ablation techniques. The feasibility of the laser tool design to be handled by the mean of a MASCOT arm and the full divertor area viewing with such a tool was demonstrated with simulations. REPORTS AND PUBLICATIONS
CEA/DTSI/SCRI/LPR/ 5RT.093-Issue 0 Remote Handling expertise for JET detritiation. 2005 report TASK LEADER
Yann PERROT DRT/DTSI/SRSI CEA-Fontenay-aux-Roses 18, route du Panorama – BP 6 F-92265 Fontenay-aux-Roses Cedex Tel. : 33 1 46 54 95 44 Fax : 33 1 46 54 75 80 e-mail : [email protected]

- 323 - EFDA Technology / Heating Systems Technology Project
CEFDA04-1140
Task Title: TW4-THHN-ADSD2: DEVELOPMENT OF THE NEGATIVE ION SOURCE (ARC DRIVEN) FOR THE ITER NEUTRAL BEAM INJECTORS FOR LONG PULSE OPERATION.
INTRODUCTION
In Cadarache development on negative ion sources is being carried out on the KAMABOKO III ion source on the MANTIS test bed. This is a model of the ion source designed for the neutral beam injectors of ITER. This ion source has been developed in collaboration with JAERI, Japan, who also designed and supplied the ion source. Its target performance is to accelerate a D- beam, with a current density of 200 A/m2 and <1 electron extracted per accelerated D- ion, at a source pressure of 0.3 Pa. For ITER a continuous ion beam must be assured for pulse lengths of 1000 s, but beams of up to 3,600 s are also envisaged. [1] The ion source is attached to a 3 grid 30 keV accelerator (also supplied by JAEA) and the accelerated negative ion current is determined from the energy deposited on a calorimeter located 1.6 m from the source. 2005 ACTIVITIES
During previous campaigns, continuous beam pulses of duration up to 1000 s have been demonstrated both in hydrogen and in deuterium, however the current density of both beams were found to be low in comparison to the specifications of 200 A/m2. The D- accelerated beam is collected on a calorimeter, made of water cooled copper, which is located at 1.6 m or 1.4 m downstream of the accelerator. A large discrepancy exists between measured accelerated currents and that which is transmitted to the calorimeter. The discrepancy in these values and the possibility that the accelerated current included electrons, either from extraction or stripping was investigated. The objective of experiments in 2005 was to investigate the loss of ≈50 % of the accelerated negative ion current between the the last grid of the accelerator and the calorimeter on MANTIS. Beam Transmission The negative ion current density extracted from a negative ion source is best derived from the beam energy and the power deposited on a remote target or targets. With the Kamaboko III ion source on MANTIS during long pulse operation the power arriving at the calorimeter is determined from the temperature rise of the cooling water and the measured flow rate. The current arriving at the target is typically only 45 – 60 % of the current taken from the high voltage acceleration power supply. “Bad” beam transmission has been previously measured and reported on the MANTIS test-bed. [2] Intensive investigation into the loss of 50 % of the accelerated current has been carried out
and a number of possibilities eliminated. These possibilities were as follows: - that the accelerated current included extracted
electrons. - Electrons created from stripping or back-streaming
ions were being included in the accelerated current measurement.
- That the space-charge of the accelerated ion beam was causing the beam to blow up and diverge.
- That the loss of beam is due to bad beam optics, i.e. that errors in extraction and acceleration gaps, grid misalignment and negative ion current density and magnetic field effects were causing the loss of beam.
Each of the above were individually examined and subsequently eliminated. [2] A partial explanation was thought to be power loading to the extraction or acceleration grids. A deterioration in the beam optics could occur during the long pulses if one, or both, grids were bowing under the thermal load, the beam optics would change until the grids reach thermal equilibrium. Results that indicate a substantial change in beam transmission with the pulse length seems to support this theory. Figure 1 shows the transmission as a function of the pulse length, for shorter pulse lengths the transmission is significantly higher that for long pulse operation.
Figure 1 On the MANTIS test-bed the accelerated ion beam propagates inside the walls of a drift duct, which fills the space between the accelerator and the calorimeter. A schematic of the MANTIS layout is shown in figure 2. If poor beam optics are the cause of the poor transmission, then the lost current would fall on the walls of the drift duct. To measure the current falling on the duct walls a new drift duct and calorimeter were constructed and installed.

- 324 - EFDA Technology / Heating Systems Technology Project
Figure 2 The square cross section duct is made up of 24 copper panels each 20 cm x 25 cm mounted on a stainless steel support frame, see figure 3, making a duct of 25 cm x 25 cm cross section, ≈1.2 m long. A new, un-cooled, calorimeter is installed at the downstream end of the duct.
Figure 3 The current intercepted on the target and on the drift duct is measured from the thermal data collected by thermocouples embedded into the copper. Also an infra red (IR) camera was set up to view, through a sapphire window, the rear of the beam target (the side not hit by the beam). Some of the target was partly hidden from the IR camera, so the camera is able to give information about the beam optics, but only an estimate of the power incident on the target. To obtain a measure of the beam divergence the difference between two profiles is obtained, the profile just before the beam pulse and the profile 10 s later. Lateral diffusion during 10 s is significant, therefore simulations which take account of this thermal diffusion have been performed for beams with various values of the beamlet divergence, and these are used to deduce the actual beamlet divergence from the measured profiles. An IR image collected by the IR camera located 3 m from the rear of the graphite painted copper target is shown in figure 4, the resulting Gaussian profiles in the horizontal and vertical are also shown for a typical beam profile on MANTIS.
Figure 4 Using the new duct and calorimeter, it was typically found that 64 % of the accelerated current arrives at the calorimeter and 30 % falls on the duct. Thus it can be concluded that >90 % of the current taken from the high voltage power supply, Idrain, is accelerated negative ions, but that ≈30 % of the accelerated beam is carried by a very divergent “halo”. Preliminary estimates suggest a halo divergence of ≈200 mrad. This is to be compared to the divergence of the central part of the beam, the “core” divergence, which has been measured to be <50 mrad [3]. To asses if the poor divergence is a characteristic of the accelerator, or particular to negative ion acceleration, the potentials on the accelerator were reversed and positive ions extracted and accelerated, from the same ion source, with the same magnetic fields etc., and the beams were analysed with the same diagnostics [3]. It is found that the transmission of positive ions to the calorimeter is ≈96 %, therefore it seems that the beam halo is particular to the negative ion acceleration. Now that the presence of a halo has been determined the question remains as to why these large halos exist. One hypothesis is that the beam halo is caused by the bad beam optics due to distortion of the grids with power loading. To this end a new accelerator grid and extraction grid have been designed, which are designed to accept the power load without thermo-mechanical distortion. They have recently been installed on the MANTIS test-bed, and experiments are due to start in march 2006. CONCLUSIONS
A low H- or D- current density measured at the calorimeter on the MANTIS test bed during long pulse operation cannot be explained by lost accelerated electrons arising from either extraction from the ion source or creation by stripping in the accelerator and is partially attributed to poor transmission due to thermal loading leading to distortion of the acceleration grid. A new drift duct and calorimeter were installed to investigate the lost current, It was found that 30% of all accelerated current was being intercepted by the drift duct in a halo. The power accountability was in excess of 90%.

- 325 - EFDA Technology / Heating Systems Technology Project
Using the same optics, and reversing the polarity of the power supplied, the MANTIS test bed was operated with positive ions. In this case >96% of the beam was intercepted on the target, and no halo seen. The presence of a beam halo is observed only in the negative ion beams, to determine whether the distortion in optics due to thermo-mechanical loading of the grids is causing this halo, a new accelerator has been designed and installed. REFERENCES
[1] Design of neutral beam system for ITER-FEAT T Inoue, E Di Pietro, M Hanada, R S Hemsworth, A
Krylov, V Kulygin, P Massmann, P L Mondino, Y Okumura, A Panasenkov, E Speth and K Watanabe Fus. Eng. and Des. 56 – 57, 2001, pp 517 – 521
[2] Some lessons from long pulse operation of negative ion
sources and accelerators R S Hemsworth, D Boilson, H P L de Esch1, A Krylov1, P Massmann and L Svensson. IAEA meeting for negative ions beams for NBI for ITER. Nuclear Fusion.
[3] Characterization of the ITER model negative ion
source during long pulse operation R S Hemsworth, D Boilson, B Crowley, D Homfray, H P L de Esch, A Krylov, and L Svensson. To be published in Rev. Sci. Inst., Vol. 77 (2005)
REPORTS AND PUBLICATIONS
[1] Some lessons from long pulse operation of
negative ion sources and accelerators R. S. Hemsworth, D. Boilson, H. P. L. de Esch, A. Krylov, P. Massmann and L. Svensson. IAEA meeting for negative ions beams for NBI for ITER. To be published in Nuclear Fusion.
[2] EFDA contract Final report CEFDA04-1140,
D.Boilson.IDN/NTT-2005.005 [3] Characterisation of the ITER model negative ion
source during long pulse operation R. S. Hemsworth, D. Boilson, B. Crowley, D. Homfray, H. P. L. de Esch, A. Krylov, and L. Svensson. To be published in Rev. Sci. Inst., Vol. 77 (2005)
TASK LEADER
Deirdre BOILSON DSM/DRFC/SCCP/GIDEA CEA-Cadarache F-13108 Saint-Paul-lez-Durance Cedex Tel. : 33 4 42 25 62.93 Fax : 33 4 42 25 62 33 e-mail : [email protected] in collaboration with R. Hemsworth, A. Krylov and C. Grand (MANTIS Team)

- 326 - EFDA Technology / Heating Systems Technology Project

- 327 - EFDA Technology / Heating Systems Technology Project
CEFDA04-1182
Task Title: TW4-THHN-IITF2: FIRST ITER NBI AND THE ITER NB TEST FACILITY: PROGRESS IN THE DESIGN
INTRODUCTION
The key conclusion of the final review meeting for the previous contract on this topic (TW3-THHN-IITF1), held in july 2004, was to bring the alternative SINGAP configuration for the accelerator and the negative ion source (RF or arc driven) to a level of design comparable to the reference design of the MAMuG accelerator and the arc driven source as in the ITER documentation. Therefore the objective of the 2005 activity was to make progress with the conceptual design of the first ITER NB injector in the SINGAP configuration. The Euratom-CEA association was involved in the conceptual design studies of both SINGAP ion source and SINGAP accelerator supporting systems. The second part of the task was aimed to the detailed design studies of the ITER Neutral Beam Test Facility (NBTF) with completing the design of the generic installation (i.e. beam line vessel, cryoplant, cooling system). The Euratom-CEA Association is involved in this EFDA workprogram in close collaboration with ENEA, FZK, IPP, CIEMAT and UKAEA European Associations. 2005 ACTIVITIES
POWER LOAD TO THE BEAMLINE FROM A SINGAP ACCELERATOR A study has been launched to examine the influence of the known physical parameters that affect the beam optics on the power and power density that will impinge on the beamline components.
The sensitivity of the beam optics to the parameters listed below has been studied:
- Manufacturing tolerances. - Voltage variations on the ion source and
accelerator. - Changes in manufacturing tolerances due to
operation, e.g. thermal expansion. - Differences due to idealised physics assumptions:
axial and radial gas pressure profiles, magnetic fields, ion temperature.
- Source uniformity. Conceptual design of the SINGAP NB Ion Source supporting system.
The next step in this work is to integrate the results of this study into a computer code that wile calculate the power and power density on selected components. ELECTRONS FROM SINGAP A disadvantage of the SINGAP accelerator is that electrons created by stripping in the main acceleration gap are accelerated from their birth position up to ground potential where they exit the accelerator through the large apertures in the grounded grid. The power carried by these electrons is calculated to be 2.7 MW, and their average energy is 720 keV. Without any modification to the system these electrons hit either the inside of the neutralizer channels or the leading edge elements of the neutralizer. The power density impinging on the leading edge elements is calculated to exceed the power density limit of the elements in the basic design, and no alternative has been found that can accept the power density and have an acceptable fatigue life.
Figure 1: To the left: deuterium (purple) and electron (blue) trajectories. The picture on the right gives the electron power density contours overlaid on a picture of the neutraliser. Contours are plotted at 10% (blue), 30% (green), 50% (yellow),
70 % (red) and 90% (purple) of the peak power density in the graph (1.97 kW/cm2)

- 328 - EFDA Technology / Heating Systems Technology Project
The solution proposed by the CEA is to add a horizontal field at the exit of the accelerator by placing columns of permanent magnets just downstream of the grounded grid that are placed either side of the beams from the apertures in the grounded grid. The additional magnetic field has a negligible on the D- beams, but deflects the electrons onto the floor of the neutraliser and a vertical dump placed below the neutraliser entrance. figure 1 shows the deflected beams and the calculated power density at the neutraliser entrance. The resulting power density is significantly reduced compared to the undeflected situation, but there are still some “hot spots” created by overlapping beamlets. It is proposed to ameliorate the situation by sweeping the electron beams in an oscillatory fashion on the vertical dump and neutraliser floor. A sweep of ±12 cm on the vertical dump and the neutraliser leading edge elements is achieved simply, and in a fail safe manner, by choosing a PG filter current power supply with ±10% ripple. ION SOURCE AND NEUTRALISER GAS SYSTEM The gas supply system for ion sources and the neutralisers on the NBTF and for the injectors on ITER have been designed by the Euratom-CEA-ssociation. The system that is proposed for the NBTF is slightly different from the one proposed for ITER since the flow rates need to be adjustable on the NBTF in order to optimize the ion source operation and the neutralization of the accelerated ions. In principle the flow rates can be fixed on ITER injectors although a small range of fine adjustments is foreseen. A particular difficulty is posed by the source gas system as the source will be at –1 MV. The design proposed takes account of this, it provides fine control of the gas flow (±5%) and the gas acountability that is necessary for the operation of the cryopumps (regeneration etc.). CONCEPTUAL DESIGN OF THE SINGAP NB ION SOURCE SUPPORTING SYSTEM The SINGAP ion source body and the plasma, extraction and pre-acceleration grids are designed by the ENEA Association.
Figure 2: Isometric view of the SINGAP source support
The arc driven/RF ion source and support has a dead weight of ≈15 tonne that is hung from the high voltage SINGAP bushing. The setting up and alignment of the source is made during the assembly phase. The conceptual design of the 1 MV source supporting system, and the structural analysis of the support, was carried out by the Euratom-CEA Association. This support fulfils both static and dynamic loading conditions.
Figure 3: The SINGAP source integrated in the ITER beam source vessel, hanging from the bushing
CONCEPTUAL DESIGN OF THE SINGAP ACCELERATOR SUPPORTING SYSTEM The SINGAP acceleration grid (or grounded grid) is designed by ENEA and is located 350 mm from the pre-acceleration grid. The conceptual design of the accelerator support system was studied by the Euratom-CEA Association. The proposed system can be adjusted in all directions and rotations towards the ion source and/or beam line components. The mechanism for moving the SINGAP electrode to provide the accurate lateral and vertical beam steering is considered in the design of the supporting system (see figure 2). The study included the structural analysis. The mechanism will operate under vacuum, using magnetic transmission drivers for both vertical and lateral motions. DETAILED DESIGN OF THE BEAM LINE VESSEL The current design of the beam line vessel (BLV) allows mixed vertical and horizontal access to the beam line components (BLCs). The detailed design of the BLV and associated large rectangular top flange was performed during 2005 by the Euratom-CEA Association. The upper large opening (9.50 m x 2.55 m) allows vertical maintenance as shown in the figure 5. The BLV is a cylindrical elliptic shape that allows the integration of two halves split cylindrical cryopumps designed on the basis of the ITER cryopump reference. The elliptic shape vessel is connected to the beam source vessel (BSV). The vessel global volume is almost 200 m3.
HV Bushing
Beam source vessel
Source support
Arc driven source

- 329 - EFDA Technology / Heating Systems Technology Project
Figure 4: Isometric view of the NBTF and injector components
DETAILED DESIGN OF THE CRYOLINES Detailed design of the cryogenic lines and interfaces with the cryopump inside the BLV are studied by CEA. The main specification of the cryolines is to feed the cryopanels with supercritical helium at 4.5 K and to feed the chevron baffles and thermal shields with helium gas at 80 K. The lines are composed of modules which are classified in 4 main categories: “T” section, “Elbow” section, “Straight” line and “Junction” section. The modular concept of the design is helpful for manufacture and assembly procedure. DETAILED DESIGN OF THE COOLING SYSTEM
Figure 5: Isometric view of the NBTF PHTS The cooling plant for the NBTF consists in a primary heat transfer system (PHTS) and a heat rejection system (HRS) that includes a 60 MW cooling tower. The full thermal power produced by the injector and the power supply system can be exhausted in a steady state regime. The detailed design of the PHTS was performed during 2005. It includes the low voltage loop (inlet temperature
80°C) that feeds the beam line components (BLCs) and the high voltage loop for the feeding of the 1MV ion source (inlet temp. 20°C) and associated pre-accelerator (inlet temp. 55°C). figures 5 and 6 illustrate the design of water manifolds and feeding pipes in the experiment building.
Figure 6: View of the BLCs feeding pipe TASK LEADER
Ronald HEMSWORTH DSM/DRFC/SCCP/GIDEA CEA-Cadarache F-13108 Saint-Paul-lez-Durance Cedex Tel. : 33 4 42 25 63 45 Fax : 33 4 42 25 62 33 e-mail : [email protected]
SINGAP source and electrode
neutraliser RID calorimeter
HV bushing
residual magnetic field coils
cryolines
BLV
Top flange

330 EFDA Technology / Heating Systems Technology Project

- 331 - EFDA Technology / Heating Systems Technology Project
CEFDA04-1182RHpart
Task Title: TW4-THHN-IITF2: FIRST ITER NBI AND THE ITER NB TEST FACILITY: RH DESIGN FEASIBILITY ANALYSIS OF NBI INSPECTION
INTRODUCTION
Recent developments of an inspection device able to operate under vacuum and temperature, the Articulated Inspection Arm (AIA), were made at CEA/LIST. The main interest of such devices is to avoid long lasting reconditioning periods when vacuum is broken. The AIA is made of five segments linked in a serial manner and each having two degrees of freedom. It will perform in the Tore Supra Tokamak some visual inspection, sampling and a set of other operations. Although the kinematics and architecture used to build that kind of robots was already known at CEA/LIST and developed for inspection of fuel reprocessing cells (PAC project), the new constraints induced by the operating conditions (ultrahigh vacuum, temperature) required the complete development of specific actuators. The feasibility of an inspection carrier for the Neutral Beam Test Facility (NBTF) was demonstrated in a very preliminary study after examination of the requirements and the inspection tasks. 2005 ACTIVITIES
INSPECTED ZONES Due to the thermal heat flux of the beam, some areas of the facility could be damaged during the lifetime of the project. It is therefore important to perform careful examination of the critical areas. The interfaces between the main elements are the critical zones of the facility (see figure 1).
Figure 1: NBTF vessel: inspected zones
The standard inspection tasks will therefore be carried out in these areas:
- interface between the source and the neutralizer - interface between the neutralizer and the RID - interface between the RID and the calorimeter - calorimeter zone (inside)
Although the cryopumps are not directly submitted to the heat flux of the beam, inspection of these elements will be necessary to check if they are not submitted to arcs. ROBOT ARCHITECTURE Previous work proposed an inspection robot concept based on articulated segments all with the same architecture and linked in a serial way to build a carrier. According to the size of each segment, the number of degrees of freedom and the strokes of each actuator, inspections can be carried out in all the operating area with help of a camera located at the end of the carrier. In a first stage, the study aimed to define the kinematics of a robot and its architecture considered as the minimum required to reach all important zones of the facility. Design of the carrier was made with the following requirements:
- Minimise the number of degrees of freedom, so that:
- Control is made easier - Breakdown probability increase with the number
of actuators - Cost is reduced - Stiffness is increased
- Minimise the number of segments - Minimise length - Dimension range should remain close to the
existing prototype: - Diameter 160 mm - Segment length close to 1.5 m
- Use the existing actuators without new R&D - Carrier will be inserted through the cover plate
along a vertical axis. The following assumption was taken: 2 degrees of freedom camera and turret designed for vacuum and temperature exists and will be used for the inspection. The payload of the carrier is 10 kg.
Main inspected areas

- 332 - EFDA Technology / Heating Systems Technology Project
Figure 2: Dimensions and strokes of the carrier
Simulations of inspections tasks in 3D CAD models identified the architecture of figure 2 as a good candidate for inspection in the NBTF vessel when two access ports are available. Attention was paid to locate the entry point apart the vertical symmetry plane in a location where deployment of the carrier is not affected by the position of the main components. Strokes and loads applied on all articulations are compatible with those already tested during R&D work of the AIA. Only minor adaptations without uncertainties should be needed to deal with these new requirements. Inspections carried out with a carrier from a single access port located in the middle of the cover plate were assessed with the assumptions that only the number and length of the segments were supposed to change. In this case 1400 mm is the maximal length of a segment (estimation made according to the existing performances of the AIA actuators). In that case, one carrier composed of three 1400 mm long segments and a 1520 mm end segment similar to the previous concept is feasible. In that case, design margins will be significantly reduced and a reduction of the 10 kg payload should be considered.
Figure 3: Steady state thermal calculations
Both steady state and transient thermal calculations were made to analyze heating of the carrier and its potential impact on the behaviour. Although temperature elevation in steady state of all scenarios stays below 35°C (meaning that thermal stresses in the carrier should remain at an
acceptable range) the evaluation of the benefit of a reflecting coating clearly shows an improvement compared to a version without any reflective layer. This could be a good answer to limit the clearances modifications in the assembly due to temperature elevation and to prevent any early wear of the mechanical components already running without any grease. ELECTRONICS Prototypes already developed (PAC, AIA) are all using integrated electronics to drive each segment of the robot. To reduce the volume of wiring a dedicated network was developed for these applications. Boards used for Cogema carrier are rad hardened to a cumulative dose of 10 kGy with a maximal 10 Gy/h radiation flux. Introduction of the electronic boards in boxes to cope with the vacuum environment of the NBTF vessel will probably lead to overheating of the components. Possible solution could be:
- To provide a cooling system - To use components of the military series but their
availability needs to be checked. CONTROL Control of the NBTF inspection device would be similar to that of AIA and its family and based on real-time dynamic simulations. A 3D CAD model of the facility is used to drive the robot in its environment. Virtual views can be provided to the operator in order to ease the task. A collision avoidance algorithm can also be run to avoid any undesired contact of the robot with its environment. Due to high flexibility, absolute precision of such robots is poor. On the other hand their repeatability is good. The use of a scale 1 training facility is therefore necessary if one wants to achieve thorough inspections of the different elements with accuracy. Teach files are then defined and played in the facility to improve safety margins regarding to the components of the vessel and defined the optimal trajectories. CONCLUSIONS
This feasibility study was based on all the latest results from the R&D work for the Articulated Inspection Arm (AIA) performed under the EFDA Remote Handling Activities. The proposed carrier for NBTF inspection is therefore made of a defined number of segments all linked in a serial manner. Articulations are driven with vacuum tight actuators developed to withstand high vacuum and high temperature conditions. This option has been chosen to base the study on existing results and minimize the risks of a brand new conception. Two intervention schemes have been assessed. First one where access to the Beam line components is provided through two ports on both sides of the baffle. For the second option access is provided from a central position that requires initial baffle removal. Although design margins are small in the study with two access ports, they

- 333 - EFDA Technology / Heating Systems Technology Project
could be easily increased with a reduction of the payload that will carry the inspection tool. During this NBI carrier conceptual design study, implantation of neighbor diagnostics was not defined and no attention was paid to avoid any interface issue with diagnostics in the vessel during deployment of the carrier. Space reservation for these elements may have a direct impact on the definition of the carrier and feasibility of the inspections. Duration of an inspection should not last more than a couple of hour (in case of a two access ports study) according to the performances of the existing actuators. For that reason thermal effects on the carrier should be limited during inspections. Rad-hardened electronics developed for inspection of fuel reprocessing hot cells would be preferable to that of AIA because thermal conditions are less stringent. A first generation of control system was already developed for the carrier navigating in fuel reprocessing hot cells. Adaptation of this control system to the new carrier is feasible. Both rough and fine control can be achieved with this system. But fine control of the system can only be achieved by means of teach and repeat procedures defined in scale 1 test facility. Design of a carrier that can inspect in an acceptable time all major NBTF components and operate under vacuum is feasible without any major R&D developments. Design margin of a solution with a central access with removing the baffle is close to the limits of the present performances and further investigations would be necessary to increase margins. Nevertheless, further conceptual then detailed design studies of the NBTF inspection robot should be launched when the final design of the beam line vessel and internal components will be frozen. The present feasibility study will have first to be revised. REPORTS AND PUBLICATIONS
Feasibility of an inspection device DTSI/SCRI/LPR/05RT.072
TASK LEADER
Jean Pierre FRICONNEAU DRT/DTSI/SRI CEA-Fontenay-aux-Roses 18, route du Panorama – BP 6 F-92265 Fontenay-aux-Roses Cedex Tel. : 33 1 46 54 89 66 Fax : 33 1 46 54 75 80 e-mail : [email protected]

- 334 - EFDA Technology / Heating Systems Technology Project

- 335 -
UNDERLYING TECHNOLOGY PROGRAMME
EFDA Technology
1- Vessel/In Vessel- Vessel-Blanket&Materials - Plasma Facing Components - Assembly and Maintenance
2 - Tritium Breeding and Materials - Breeding blankets - Materials development
3 - Safety & Environment

- 336 -

- 337 - Underlying Technology /Vessel-In Vessel / Vessel-Blanket and Materials
UT-VIV-VV-Hybrid Modeli
Task Title: OPTIMIZATION OF HYBRID WELDING FOR V V MANUFACTURING
WELDABILITY OF EUROFER HOMOGENEOUS PLATES
INTRODUCTION
Hybrid welding is expected to be a specially suitable process for manufacturing the vacuum vessel of the future reactor ITER. The hybrid process consists in combining both the MAG process and the laser process (LWP) with potentially high quality of welds at high productivity. Due to this combination, the hybrid process deals with several major operating parameters corresponding to the respective processes (power, welding speed, wire speed, focus) plus the location of each source relatively. In particular, the quality of the weld is highly sensitive to 8 of these parameters. Today the state of the art upon operational weldability needs suitable models to assess the influence of the various operating parameters with a view to optimise the process. The main objective of the task is to model the heat input due to the hybrid process as a function of the operating parameters. 2005 ACTIVITIES
During fusion welding, the thermal cycles produced by the moving heat sources (figure 1) produce physical state changes, transient thermal stresses and metal movement.
Figure 1: Hybrid process Laser process (figure 2) and Arc process (figure 3) have been modelled in an eulerian approach for heat transfer. The mathematical expression of the cylindrical-involution-normal heat source model in a frame tied to the laser source is :
k Kz QL -k(x²+y²) -Kz Z
Qc(x,y,z) = e [ 1-u(z-s)] -Kz S π (1-e )
Where QL is the laser energy of the laser process K is a factor designating the heat source concentration (m-
2) Kz is the involution factor of the heat source (m-1) S is the heat source penetration (m) u(z-s) is the Heaviside function
Figure 2: CIN distribution for laser process (Cylindrical Involution Normal distribution)
The heat input is distributed with a gaussian distribution in each direction of two semi-ellipsoïd, taking into account the deposit difference between the rear and the front of the source due to advective an Marangoni transport. In a frame tied to the GMAW source, the power density distributions in the front quadrant have the following form:
Figure 3: Goldak distribution for Arc process
RESULTS OF SIMULATION Thermal simulations of each process have been analysed. In order to estimate the influence of the distance on the weld pool dimensions, a parametric study of distance between the arc and laser has been performed. Numerical simulations are computed with the CEA Finite Elements Code CAST3M (http://www-cast3m.cea.fr). The welding parameters are the followings:
Front: 6√3 QG -3(xs/af) ² -3(ys/af) ² -3(zs/af) QGff (xs,ys,zs) = 3/2 e e e af bc π
Rear: 6√3 QG -3(xs/ar) ² -3(ys/ar) ² -3(zs/ar) QGfr(xs,ys,zs) = 3/2 e e e ar bc π

- 338 - Underlying Technology /Vessel-In Vessel / Vessel-Blanket and Materials
- Travel speed of the torchs: 1 meter per minute - Laser heat input: 4 Kw - GMAW heat input: 5,2 kW - Deposited metal by pass: 2 mm
The finite element mesh consists of 74 480 hexadron linear elements and 80 770 nodes. The mesh density is increased in the vicinity of the heat sources (figure 4).
Figure 4: Hybrid source
Figure 5: Hybrid temperature field
Figure 6: Hybrid heat source distribution for 2, 4, 6 mm
Figure 7: Weld bead dimensions The following results (figures 5, 6 and 7) from modelling are confirmed by experimental tests where optimum distance between the 2 heat source is 4 mm for the laser beam in front of the MAG wire has been determined in quite good relationship to simulation results.
CONCLUSIONS
In order to improve the weldability of narrow gap welding by hybrid process has been modelled by the addition of a CIN heat source, representing the laser process, and a GOLDAK heat source, representing the GMAW process. Thermal simulations has been carried out in an eulerian formulation, in quasi-stationary state, to spare computational time. In order to study the influence of the distance between the arc and the laser source (2, 4, 6 mm) on the weld pool dimensions, a parametric study has been performed. Results highlight that there is an optimal distance that widen the width bead. REPORTS AND PUBLICATIONS
Intermediate report: Technical report DTEN/DL/2005/039 - Frank Gabriel – Simulation of Hybrid process - November 2006. TASK LEADER
Franck GABRIEL (1) DRT/LITEN/DTEN/UTIAC CEA-Saclay F-91191 Gif-sur-Yvette Cedex (1) task leader has change of function in CEA in October 2005, so this summary has been summarized through the final report by Field coordinator : Philippe AUBERT Tel : 33 1 69 08 17 67 Fax : 33 1 69 08 90 23 e-mail : [email protected]

- 339 - Underlying Technology / Vessel-In Vessel / Plasma Facing Components
UT-VIV/PFC-Damage
TASK-TITLE: STUDY OF DAMAGE MECHANISMS IN PLASMA F ACING COMPONENTS
INTRODUCTION
Plasma facing components (PFC) for future fusion reactors have to withstand high heat fluxes. In case of TORE SUPRA, the developed components were made of a high thermal conductivity CFC material (a composite made with carbon matrix reinforced by carbon fibres) mechanically and thermally bonded to a copper heat sink and able to remove incident stationary heat flux of 10 MW/m2 [1]. In order to reach a value of 20 MW/m2 for the divertor component of the ITER machine, the lifetime of this assembly submitted to considerable thermal stresses must be increased. The objectives of this activity are: (i) to provide a study of damage mechanisms of the CFC bond, (ii) to propose an optimization of the bond and (iii) to develop a model for predicting the lifetime of the bond under operating conditions. 2005 ACTIVITIES
During this period, the actions foreseen were achieved: Realisation of mechanical tests on CFC samples in order to identify their constitutive law [2] Various mechanical tests are necessary in order to identify the damageable constitutive law of the CFC. During this period, a shear test procedure has been developed and validated in order to characterize the non linear shear behaviour of the CFC (figure 1).
Figure 1: Mechanical response of a HL1 carbon/carbon composite in shear
Observations of damaged tiles to locate damage mechanisms [3] Damaged tiles obtained from components tested under high heat flux were submitted to micrographic observations. Two damage modes of the interfacial zone were clearly evidenced (figure 2): debonding of the interface and failure of the copper spikes.
a)
b) Figure 2: The two different mechanisms of failure of the CFC/Cu interface of a PFC tested under high heat flux:
a) debonding of the copper spikes,
b) failure of the copper spikes Interfacial crack propagation modelling [4], [5] Numerical simulations were performed to analyse the initiation and the propagation of the interface failure (figure 3). An initiation criterion was used in order to predict the initiation of a crack at the edge of the component as a function of the interfacial properties (figure 4a). A damage model (cohesive zone model) of the interface was identified by comparing modelling results with experimental values obtained from tensile (figure 4b) and shear tests of the bond. 0
10
20
30
40
50
0 0.5 1 1.5 2
ST
RE
SS
(M
Pa)
STRAIN (%)

- 340 - Underlying Technology / Vessel-In Vessel / Plasma Facing Components
Figure 3: Modelling of the interface : Initiation and propagation of a crack at the CFC/Cu interface
20
40
60
80
100
120
140
0 100 200 300 400 500
INT
ER
FA
CIA
L S
TR
EN
GT
H (
MP
a)
INTERFACIAL TOUGHNESS (Jm -2)
INITIATION
NO INITIATION
a)
0
5
10
15
20
25
30
35
40
0 0.05 0.1 0.15
ST
RE
SS
(M
Pa)
STRAIN (%)
CZM
Tensile test
b)
Figure 4: Modelling of the interface a) Initiation domains as a function of the interfacial
strength and toughness b) Identification of a damage model of the interface with
the help of a tensile test on a CFC/Cu specimen
CONCLUSIONS
As detailled before, in 2005, the actions concerning: - Realisation of mechanical tests on CFC Samples in
order to identify their constitutive low; - Observation of damages tiles to locate damage
mechanisms; - Interfacial crack propagation modelling has been
successfully achieved. The work will continue in 2006 with (i) tests for thermal expansion measurements of the constituants of the component, (ii) mechanical tests on CFC samples, (iii) prediction of the life time of the bond under operating conditions. REFERENCES
[1] J. Schlosser, P. Chappuis, A. Durocher, L. Moncel,
P. Garin, Development of actively cooled components for the Tore Supra toroidal pump limiter, Physica Scripta, TIC 116, 1-4, 2001
REPORTS AND PUBLICATIONS
[2] G. Camus, Endommagement et rupture dans les
assemblages des composants face au plasma, Identification d’un modèle de comportement pour les matériaux 3D C/C: mise au point de l’essai de cisaillement plan , Rapport 1b, Projet P6, 01/12/05
[3] E. Martin, T. Marceau , D. Quesada, G. Delsouc,
Endommagement et rupture dans les assemblages des composants face au plasma, Analyse des mécanismes d’endommagement de l’assemblage à l’échelle microscopique: Observations des tuiles endommagées, Rapport 2b, Projet P6, 01/12/05
[4] C. Henninger, D. Leguillon, Endommagement et
rupture dans les assemblages des composants face au plasma, Analyse des mécanismes d’endommagement de l’assemblage à l’échelle macroscopique: Analyse des mécanismes d’amorçage, Rapport 3b, Projet P6, 01/12/05
[5] E. Martin, T. Marceau, D. Quesada,
Endommagement et rupture dans les assemblages des composants face au plasma, Analyse des mécanismes d’endommagement de l’assemblage à l’échelle macroscopique: Modélisation de la propagation interfaciale, Rapport 3c, Projet P6, 01/12/05

- 341 - Underlying Technology / Vessel-In Vessel / Plasma Facing Components
TASK LEADER
Eric MARTIN LCTS, UMR 5801 (CNRS-Snecma-CEA – UB1) Domaine Universitaire, 3 Allée de la Boetie, F-33600 Pessac Tel. : 33 5 56 84 47 00 Fax : 33 5 56 84 12 25 e-mail : [email protected]

- 342 - Underlying Technology / Vessel-In Vessel / Plasma Facing Components

- 343 - Underlying Technology / Vessel-In Vessel / Plasma Facing Components
UT-VIV/PFC-HIP
Task Title: IMPROVEMENT OF RELIABILITY, PERFORMANC E AND INDUSTRIAL RELEVANCY OF HIP PROCESSES FOR PFC COMPONENTS
INTRODUCTION
The fabrication of many fusion reactors components is based on the Hot Isostatic Pressing (HIP) technique. The use of HIP as a means for diffusion welding and complex components fabrication is not so frequent, and there is a need to improve the industrial relevancy of these processes. Four subjects have been identified: machining and cleaning of surfaces for diffusion welding, modeling for powder compaction, and, for both processes, outgassing and tool and anti-diffusion materials. Prospective routes have been studied in 2004 which needed further experiments to finalize all parameters influence. 2005 ACTIVITIES
PROPERTIES OF JOINTS Experimental work has been performed with 316L or 316LN forged material and 316LN powder. Influence of machining and HIP temperature Solid/solid joints In 2004, the influence of roughness on the impact toughness of solid joints was studied. The HIP temperature was 1040°C. Materials were cleaned following the reference laboratory route. The joint impact toughness (KCU) was 99, 96 and 83 J/cm² for joints made with blocks milled to Ra in the range of 0.8, 3 and 6 µm respectively. Surprisingly, the joint impact toughness was only 45 J/cm² for joints made with ground blocks (Ra~0.3 µm). In order to assess the effect of temperature similar samples were HIPed at 1100°C. A drastic improvement is noticed: the joint impact toughness increased up to 221 J/cm² for fine milled surfaces and 122 J/cm² for ground surfaces. Joint examination reveals that sets of inclusions are evenly spread along the joint in the “ground sample”, while no such feature can be observed in the “milled sample” (figure 1).
Figure 1: Microstructure of SS316L joints HIPed at 1100°C and associated KCU rupture surface fine milled
surfaces.
It is concluded from these results that the grinding process deteriorates the surfaces. It is known that grinding is a very energetic process that can led to overheating of the surfaces when materials with poor thermal properties are considered. Powder/solid joints Experiments achieved with solid/solid joints show that the 1100°C HIP cycle associated with the reference laboratory surface preparation and a fine milled surface condition gives the best results. However, in many instances the combination of machined blocks with powder has large advantages in terms of fabrication, such like for the ITER shield modules. Because the manufacturing costs of such a large component largely depend on machining, the question arises whether requirements as stringent as the ‘fine milled condition’ are necessary or not for solid/powder joints. Solid/powder joints were elaborated with forged blocks milled to various roughness values. Blocks were cleaned following the reference laboratory surface preparation route, cans were filled with powder and HIPed at 1100°C. Tensile tests were achieved on the joint elaborated with a block Ra=0.15-0.20 µm. Rupture occurred on the solid part of the specimens (figure 2). RCC-M requirements were fulfilled.
316LN forged
316LN powder
junction
Figure 2: Solid/powder joint tensile samples after testing. Joint location is indicated by small lines.
Impact toughness testing gave the following values: 191; 198, 200 and 196 J/cm² for surfaces machined to Ra=0.15-0.2, 0.8, 1.6 and 3.2 µm respectively (figure 3). It is concluded that the surface roughness is not very important for solid/powder joints. It seems that these joints do not require specific machining requirements.
0
50
100
150
200
250
KC
U (
J/cm
²)
Ra=0.15-0.20µm Ra=0.8µm Ra=1.6µm Ra=3.2µm Figure 3: Impact toughness of solid/powder joints HIPed at
1100°C depending on the surface roughness of the solid part.

- 344 - Underlying Technology / Vessel-In Vessel / Plasma Facing Components
Influence of cleaning process At the present time, a manual operation is carried out to clean the surface of the pieces at a laboratory scale. More industry-relevant solvent cleaning methods have been considered because they can be applied for a large variety of materials and component shapes. Perchloroethylene and hydrofluoroether tested in 2004 gave lower performance than our laboratory manual method, but the cleaning conditions were perfectible. A collaboration has been made in 2005 with an industrial partner proposing cleaning methods using particular solvent products in industrial equipment. A test program has been identified on the base of similar applications. Anti-diffusion materials Anti diffusion materials are used when the joining of two parts needs to be avoided. The two main questions to be assessed are the efficiency of the anti-diffusion materials and their influence on the joint performance. In 2004, various foils and felts have been tested as anti-diffusion materials. The cans comprised a joint and a tool. The tools were easily removed but the joint impact toughness was very low, less than 50J/cm². In 2005, experiments were made with oxide coatings (thick plasma sprayed alumina, thin PVD coatings of SiO2, Al2O3 and TiO2) which were thought to be less polluting. All cans were HIPed at 1040°C to enable comparison with preceding results. In all cases, the removal of the tool was possible, though more difficult than with foils and felts, but the joint impact toughness were again low. Then, nitride-base PVD coatings have been tested because of their stability in the tested temperature range. In this case, the tool could not be removed. A metallographic examination revealed a non-uniformity of the coating thickness with local lack of nitride layer where a welding between the disc and the tool occurred (figure 4).
Table 1: Effect of anti-diffusion materials on joint impact toughness.
Description Thickness KCU
(J/cm²) Plasma sprayed alumina 350 µm 60±6 Physical Vapour Deposited Silicon oxide
>3 µm 30±3.5
Physical Vapour Deposited Alumina
>3 µm 14±8
Physical Vapour Deposited Titanium oxide
>3 µm 29±5
Physical Vapour Deposited TiN ~ 3 µm - Physical Vapour Deposited TiN/TiAlN nanolayers
~ 3 µm -
Figure 4: Failure of anti diffusion coating in 316L/316L joint, leading to undesired local diffusion bonding
POWDER OUTGASSING Powder metallurgy is an attractive way to manufacture complex components at low cost with a good precision. However, consolidation of powder by HIP process depends strongly on the oxide layer at the powder particle surface. The presence of oxygen compounds inside the powder such as adsorbed water molecules can lead to the growth of the oxide layers during the HIP processing at high temperature and thus drastically reduce the mechanical strength of parts manufactured with HIPed powder. In our study we have investigated several experimental conditions to treat 316LN powder before HIP cycles. Two experimental routes have been studied. The first one enables to measure the influence of N2 flushing gas to treat 316LN powder confined inside a low conductance vessel where high vacuum is difficult to achieve. This configuration leads to small vacuum treatment and poor mechanical results. 316LN specimens manufactured with N2 flushing treated powder presents low impact KCU toughness (between 100 J/cm² and 120 J/cm² for powder HIPed at 1100°C, 140 MPa). The second experimental set-up enables the heat treatment of the powder under high vacuum level (under 10-5 mbar). At this pressure, the high temperature treatment of the powder (from 140°C to 200°C) gives good mechanical results. Impact KCU toughness higher than 160 J/cm² is obtained for all the samples manufactured with 316LN powder heat treated above 140°C. Best results (toughness of about 180J/cm²) are obtained for temperatures close to 200°C. MODELING Concerning simulation, we have adjusted a novel law for powder densification during HIP (ref. 316_POU9) based on in-situ dilatometry experiments. The novel law is an Abouaf law with addition of some isotropic hardening in the 316LN constitutive law. The identification has been done on in-situ dilatometry experiment results (figure 5) and on the deformation of a simple bi-material mock-up (figure 6) that exhibits some bending after HIP (figure 7). Physical thermo-mechanical coupling through the relative density and temperature has also been implemented: the thermal parameters depend upon the relative density according to a law adapted from the law proposed by Argento [1].

- 345 - Underlying Technology / Vessel-In Vessel / Plasma Facing Components
A parameterized study has also permitted to appreciate which parameter of the law is important with regard to the phenomenon to be modelled. This will help in designing and identifying the next generation of constitutive laws.
0.6
0.65
0.7
0.75
0.8
0.85
0.9
0.95
1
0 200 400 600 800 1000 1200
Rel
ativ
e de
nsity
Temperature (°C)
Simulation 316_POU9Experiment
Figure 5: Adjustment of the powder law on in-situ
dilatometry densification curve
304L canister
316LN powder
316LN solid
Figure 6: Mesh and deformed shape of the modelled quarter of the SEMU0.
Dimensions:200 x100 x (50 powder + 30 316LN) mm
-10
0
10
20
30
40
50
60
70
80
90
-20 0 20 40 60 80 100 120
experimentalSEMU0-14 : 316_POU9
SEMU0-7
X (mm)
Y (
mm
)
Figure 7: Shape of the SEMU0 on its symmetrical plane along its longer dimension. Comparison to simulation
obtained with 316_POU9 law is also shown
CONCLUSIONS
Specifications are now available for the elaboration of 316LN solid and solid to powder joints. Unfortunately, no efficient industrial surface preparation route has been found up to now. Experiments with anti diffusion materials are disappointing too. As far as powder HIP is concerned, the link between the outgassing procedure, the amount of oxygen in the powder material and its impact toughness has been established. The powder outgassing procedure is now improved. Finally, significant improvement in finite element modelling of powder HIP compaction has been made by adjusting calculation laws. REFERENCES
[1] C. Argento, "Modélisation du comportement
thermique et mécanique des poudres métalliques", Doctorat de l'Université Joseph Fourier, Grenoble I, 1994
REPORTS AND PUBLICATIONS
PE. Frayssines, E. Rigal, O. Gillia C. Chabrol, JM Leibold, B. Riccetti, F. Vidotto Improvement of the reliability, performance and relevancy of HIP processes for PFC components”, rapport technique DTH/DL/2006/022, march 2006. TASK LEADER
Claude CHABROL DRT/DTH/LEV CEA-Grenoble 17, rue des Martyrs F-38054 Grenoble Cedex 9 Tel. : 33 4 38 78 99 77 Fax : 33 4 38 78 58 91 e-mail : [email protected]

- 346 - Underlying Technology / Vessel-In Vessel / Plasma Facing Components

- 347 - Underlying Technology / Vessel-In Vessel / Plasma Facing Components
UT-VIV/PFC-NanoSic
Task Title: NANOCRYSTALLINE SILICON CARBIDE (SIC) MECHANICAL PROPERTIES OF NANOCRYSTALLINE SIC
INTRODUCTION
The task concerning nanocrystalline silicon carbide (SiC) is divided in two parts related respectively to the optimization of the preparation of dense nanocrystalline silicon carbide (SiC) by Hot Isostatic Pressing (HIP) and to the evaluation of the mechanical and thermal properties. The first part of the task has been completed in 2004 with the getting of densification rates of 95 % of the theoretical density (TD) for samples sintered without sintering additives and of 98 % for those sintered with additives. Grain sizes obtained for samples sintered without sintering additives were around 50 nm or below whereas for samples sintered with additives, grain sizes between 50 and 100 nm were observed. In 2005, mechanical properties were measured on the samples sintered during the first half of the task. The properties were measured on samples obtained after HIP or after HIP + Post-HIP thermal treatments. The Post-HIP treatments were performed with the aim to follow the evolution of some mechanical properties with the grain size in the materials. Hardness and fracture toughness were measured at room temperature and flexural strength and Young’s modulus were measured both at room and at high temperatures. 2005 ACTIVITIES
MECHANICAL PROPERTIES AT ROOM TEMPERATURE: HARDNESS, YOUNG’S MODULUS AND FRACTURE TOUGHNESS Vickers hardness The hardness has been measured by the indentation method. This method consists of indenting the tested materials with a diamond indenter, in the form of a right pyramid with a square base and angle of 136° between opposite faces subjected to a load of 1 to 100 kgf. The Vickers Hardness is calculated by measuring the two diagonals of the indentation left in the surface of a material after removal of the diamond indenter. The table 1 presents the results obtained for samples immediately after the sintering by HIP. The hardnesses of the samples sintered by HIP are in the range 15-18 GPa. These values are smaller than those reported in the literature [1], [2] for micro / sub micrometric SiC (20 to 25 GPa) but are in agreement with an inverse Hall-Petch effect (decrease in strength with a decrease of the grain size) which could come from relaxation processes taking place at the grain boundaries and resulting in a decrease of the strength below a critical grain size [3]. This inverse Hall-Petch effect has been reported in literature for
SiC with an optimum grain size for hardness of 100-200 nm [4]. In order to follow the evolution of the hardness with grain size, post-HIP thermal treatments were performed at 1650°C, 1750°C, 1800°C and 1850°C under argon during 1 hour. The figure 1 shows the effect of the temperature of the post-HIP treatment on the hardness. A strong increase (up to 28-29 GPa) is observed after a post-treatment at 1750 °C for XXIII 20 and XXIII 22. These values are higher than the best hardness known for polycrystalline microstructured SiC (25 GPa) and also higher than the best hardness reported in literature for nanocrystalline SiC sintered by HIP (27 GPa) [4]. It is expected that the post-treatments promote grain growth in the range 100-200 nm favorable to the getting of optimum values for hardness.
Table 1: Vickers Hardness (HV 2) for samples after sintering by HIP (1930°C – 190 MPa -1h30)
Sample Sintering aids (wt.
%)
Density (% TD)
Grain size (nm)
Vickers Hardness (GPa) - HV2
XXIII 19 XXIII 20 XXIII 21 XXIII 22 XXIII 23 XXIII 24
0 8 (YAG)
8 5 2 0
93 96 97 97 98 95
11 90 62 -
19 -
16 17 17 18 15 16
Figure 1: Evolution of the hardness as a function of the
Post-HIP temperature
In order to correlate post-HIP temperatures to grain sizes, a Hall –Williamson (HW) analysis was performed on the X-Ray diffraction patterns recorded on post-HIPed samples. The results are given in table 2 for the samples containing 8 wt. % of sintering additives (XXIII 20 and XXIII 21).
18
20
22
24
26
28
30
1630 1680 1730 1780 1830
Température (°C)
HV
2 (G
Pa)
XXIII 23
XXIII 19
XXIII 22
XXIII 21
XXIII 20
Micro. SiC
18
20
22
24
26
28
30
1630 1680 1730 1780 1830
Température (°C)
HV
2 (G
Pa)
XXIII 23
XXIII 19
XXIII 22
XXIII 21
XXIII 20
Micro. SiC

- 348 - Underlying Technology / Vessel-In Vessel / Plasma Facing Components
The results confirm that after a post-HIP thermal treatment at 1750°C, the grain sizes of the samples are in the range 100 - 200 nm where maximum values of hardness are observed (see figure 1). Furthermore, the results of grain size determination reveal that it is possible to change at will the mean single crystal size in the sintered samples in the nanometric / sub-micrometric domains and consequently the mechanical properties.
Table 2: Single crystal sizes estimated in post-HIPed samples from X-Ray diffraction patterns
Young’s modulus The measurements of Young’s modulus were performed by the “impulse excitation technique” on a GrindoSonic equipment. The results of Young’s modulus are presented in table 3. Measurements were performed on HIPed samples and on few ones post-HIPed. Globally, the values are located between 235 and 322 GPa and they are smaller than those reported in literature for microstructured SiC sintered with 2 wt. % of alumina and yttria additives by hot pressing (414 – 445 GPa) [1]. An explanation could be the high proportion of the grain boundaries phases (amorphous glassy phases with quite lower Young’s modulus) in our samples coming from the high proportion of silica [5] (silica has a Young’s modulus of only 73 GPa). Fracture toughness The facture toughness has been estimated from hardness and Young’s modulus measurements by measuring size of the cracks generated at the extremities of the diagonal of the Vickers imprint. The fracture toughness of the samples is reported in table 3. The values of fracture toughness are lower than those of classical SiC (around 4.5 MPa m1/2) [1] excepted for the sample XXIII 20 (composition of the YAG phase at grain boundaries) for which fracture toughness is 5.9 MPa m1/2 after a post treatment at 1750°C. This result is in agreement with previous work [6] reporting high fracture toughness for samples sintered with a mixture of sintering aids (Al2O3 and Y2O3) in proportions favorable to the formation of the YAG phase at grain boundaries after sintering.
Table 3: Young’s modulus (E in GPa) and fracture toughness (K1C in MPa m1/2) for HIPed and few post-
HIPed samples.
HIP HIP +
1650°C HIP +
1750°C HIP +
1850°C Sample E K1C E K1C E K1C E K1C
XXIII 19 XXIII 20 XXIII 21 XXIII 22 XXIII 23
235 322 303 300 252
1.9 4.2 2.5 2.2 3.7
- - -
300 -
- - -
2.1 -
- 260
- 245
-
- 5.9 -
2.2 -
- - -
300 -
- - -
2.4 -
MECHANICAL PROPERTIES AT HIGH TEMPERATURE: YOUNG’S MODULUS AND FLEXURAL STRENGTH Young’s modulus up to 1000°C The measurements of Young’s modulus at high temperature were performed in a furnace under an argon atmosphere on a parallelepiped attached with a thread to alumina supports (figure 2). Excitation is performed with an alumina missile propelled by an argon jet.
Figure 2: Device for the measurement of Young’s
modulus at high temperature by the impulse excitation technique
Results of Young’s modulus measurements with temperature are presented on figure 3.
220
230
240
250
260
270
280
290
20 220 420 620 820 1020
T(°C)
E (
GP
a)
5 wt. % of sintering additives
without sintering additives
Figure 3: Evolution of the Young’s modulus with temperature for two samples.
Reference Post-HIP temperature (°C)
Density (% of TD)
Single crystal size (nm)
XXIII 20 (8 wt. %) YAG
1650°C – 1h – Ar 1750°C – 1h – Ar 1800°C – 1h – Ar
92 95 95
76 177 331
XXIII 21 (8 wt. %) Eutectic
1650°C – 1h – Ar 1750°C – 1h – Ar 1800°C – 1h – Ar 1850°C – 1h - Ar
93 96 96 95
79 136 270 283
System ofmeasurement
microphone
Wave guide
System ofbinding
thread
alumina supports
System ofexcitement
Alumina missile
THERMOCOUPLE System ofmeasurement
microphone
Wave guide
System ofbinding
thread
alumina supports
System ofexcitement
Alumina missile
THERMOCOUPLE

- 349 - Underlying Technology / Vessel-In Vessel / Plasma Facing Components
The measurements were performed on one sample sintered without sintering additives and on one sample sintered with 5 wt. % of sintering additives (Al2O3 and Y2O3) at the eutectic composition. At first, the comparison of the two samples reveals that the Young’s modulus values are higher for sample containing sintering additives than for sample sintered without additives. For the sample sintered without sintering additives, a very low decrease is observed up to 1000°C (- 1 %) whereas for the sample containing 5 % of sintering additives a more important continuous decrease is observed (- 4 %) at 800°C. The more important decrease observed for the sample sintered with additive could come from sintering additives which influences the behaviour at high temperature. Indeed, Young’s modulus measurements performed on pure Al2O3 and pure Y2O3 revealed a continuous decrease of the modulus of approximately 10 % at 1000°C [7], this behaviour being consistent with the decrease observed for the sample sintered with additives. Bending Strength up to 1200°C Four-point method has been applied to determine flexural strength at room and high temperature on 3 samples. The bend tests were performed at CEA – Grenoble. The results are plotted on figure 4 and compared to the results found in literature [8] for sub-micrometric SiC (> 540 nm) sintered by hot pressing with Al2O3 and Y2O3.
Figure 4: Evolution of the four-point bending strength of the samples with temperature. Results concerning sub-
micrometric SiC are also given [7] The bending strength values obtained for nanostructured SiC are smaller than those observed for sub-micrometric SiC [8] but the stability seems to be better especially after 800°C. The decrease with temperature observed beyond 1000°C for sub-micrometric SiC has been interpreted by Sciti et al. by the softening of the phase at grain boundaries. On the basis of this interpretation, a similar behaviour should be observed in our samples but the behaviour seems quite different. Until now, this result is not well understood and additional experiments are needed to confirm these preliminaries observations.
CONCLUSIONS
In conclusion, the activity performed in 2005 revealed the possibility to adjust at will the grain size in HIPed SiC nanoceramics in the nanometric/sub-micrometric ranges by performing post-HIP thermal treatments between 1650 and 1850°C. By doing so, an optimum value of 28-29 GPa for the hardness has been reached for grain sizes of 100 - 200 nm as expected from literature data. To our knowledge, these values are the highest never reported in literature for a monolithic SiC elaborated by powder metallurgy. The maximum value of hardness corresponds also to the maximum value for fracture toughness (5.9 MPa m1/2). At high temperature, a good stability of the Young’s modulus and of the bending strength seems to occur, especially for the samples sintered without sintering additives but additional experiments are needed to confirm the preliminaries observations. In 2006, the investigation of the mechanical and thermal properties at high temperature will be continued (Young’s modulus, thermal conductivity). Creep tests will be performed and the effect of cyclic and/or long thermal treatments on the nanostructure will be investigated. The Thermal shock resistance could be measured on some samples. REFERENCES
[1] Ceramics and glasses, vol. 4: engineered materials
handbook, ed. by ASM international (1991) [2] R. Vaben et al., J. of the Am. Ceram. Soc., 82 [10],
p2585-93 (1999) [3] C. Suryanarayana, Intern. Mater. Rev., 40 [2], p41-
64 (1995) [4] R. Vaben et al., J. of Mat. Science, 31, p3623-3637
(1996) [5] F. Ténégal, « Densification of SiC nanometric
powders: 2004 final report », DTEN/DL/2004/44 (2004)
[6] J.Y. Kim et al., J of the Am. Ceram. Soc., 82 [2],
p441-444 (1999) [7] R. Lafargue, “Mesures de propriétés élastiques par
fréquence de résonance à haute température”, rapport de stage de technicien supérieur (2003)
[8] D. Sciti, S. Guicciardi, A. Bellosi, J. of Eur.
Ceram. Soc., 21, p621-632 (2001)
XXIII 23 (2 wt. %)
XXIII 24 XXIII 21 (8 wt. %)
Sub-micrometric SiC (10 wt. %) [9]
Sub-micrometric SiC (6% wt %) [9]
0
200
400
600
800
0 200 400 600 800 1000 1200 1400
T°C
Con
train
te à
la r
uptu
re (
MP
a)σσσσr(MPa)
XXIII 23 (2 wt. %)
XXIII 24 XXIII 21 (8 wt. %)
Sub-micrometric SiC (10 wt. %) [9]
Sub-micrometric SiC (6% wt %) [9]
0
200
400
600
800
0 200 400 600 800 1000 1200 1400
T°C
Con
train
te à
la r
uptu
re (
MP
a)σσσσr(MPa)
XXIII 23 (2 wt. %)
XXIII 24 XXIII 21 (8 wt. %)
Sub-micrometric SiC (10 wt. %) [9]
Sub-micrometric SiC (6% wt %) [9]
0
200
400
600
800
0 200 400 600 800 1000 1200 1400
T°C
Con
train
te à
la r
uptu
re (
MP
a)σσσσr(MPa)

- 350 - Underlying Technology / Vessel-In Vessel / Plasma Facing Components
REPORTS AND PUBLICATIONS
- F. Ténégal, “Nanocrystalline silicon carbide (SiC): 2005
interim report”, CEA report, DTEN/DL/2005/030 (2005) - F. Ténégal, “Nanocrystalline silicon carbide (SiC):
Mechanical properties at high temperature”, CEA report, DTEN/DL/2005/65 (2005)
- F. Ténégal, B. Guizard, C. Mengeot, L. Boulanger, F.
Schuster, “Pilote nanopoudres par pyrolyse laser: vers une production de masse à très grande échelle”, Colloque SF2M poudres et matéraixu frittés 2005, Cherbourg (2005)
- C. Mengeot, F. Ténégal, S. Poissonnet, L. Boulanger, M.
Dormeval, “Elaboration de céramiques nanostructurées en SiC pour les applications nucléaires”, Colloque SF2M poudres et matériaux frittés 2005, Cherbourg (2005)
- C. Mengeot, F. Ténégal, S. Poissonnet, L. Boulanger, M. Dormeval, “ Elaboration of nanostructured ceramics in silicon carbide for nuclear applications”, ECERS 2005, Portoroz, Slovenia (2005)
AKNOWLEDGMENTS
- C. Mengeot for the management of all the experiments. - G. Dellete and H. Giraud for bending strength
measurements - G. Loupias, G. Vaux and J. Canel for post-HIP
treatments and Young’s modulus measurements - M. Dormeval for grain size determination from X-Ray
diffraction patterns
TASK LEADER
François TENEGAL DRT/DTNM/LTMEx CEA-Saclay F-91191 Gif-sur-Yvette Cedex Tel. : 33 1 69 08 31 38 Fax : 33 1 69 08 82 52 e-mail : [email protected]
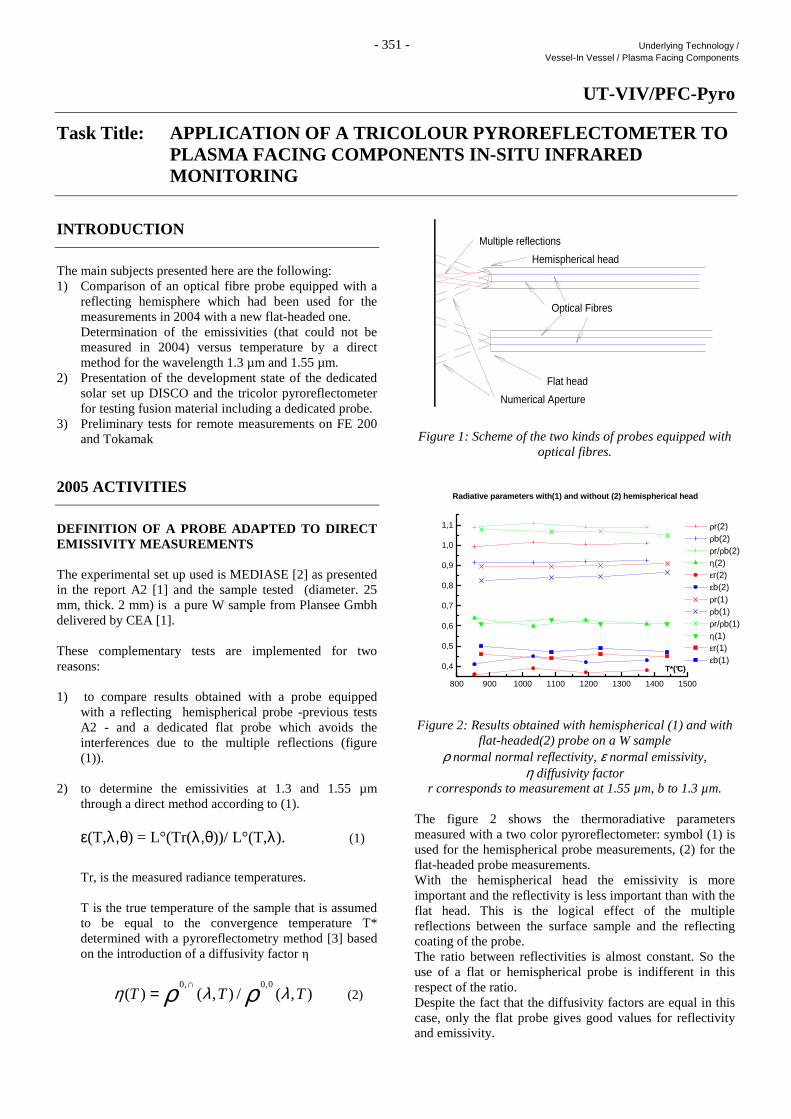
- 351 - Underlying Technology / Vessel-In Vessel / Plasma Facing Components
UT-VIV/PFC-Pyro
Task Title: APPLICATION OF A TRICOLOUR PYROREFLECTO METER TO PLASMA FACING COMPONENTS IN-SITU INFRARED MONITORING
INTRODUCTION
The main subjects presented here are the following: 1) Comparison of an optical fibre probe equipped with a
reflecting hemisphere which had been used for the measurements in 2004 with a new flat-headed one.
Determination of the emissivities (that could not be measured in 2004) versus temperature by a direct method for the wavelength 1.3 µm and 1.55 µm.
2) Presentation of the development state of the dedicated solar set up DISCO and the tricolor pyroreflectometer for testing fusion material including a dedicated probe.
3) Preliminary tests for remote measurements on FE 200 and Tokamak
2005 ACTIVITIES
DEFINITION OF A PROBE ADAPTED TO DIRECT EMISSIVITY MEASUREMENTS The experimental set up used is MEDIASE [2] as presented in the report A2 [1] and the sample tested (diameter. 25 mm, thick. 2 mm) is a pure W sample from Plansee Gmbh delivered by CEA [1]. These complementary tests are implemented for two reasons: 1) to compare results obtained with a probe equipped
with a reflecting hemispherical probe -previous tests A2 - and a dedicated flat probe which avoids the interferences due to the multiple reflections (figure (1)).
2) to determine the emissivities at 1.3 and 1.55 µm
through a direct method according to (1).
ε(T,λ,θ) = L°(Tr(λ,θ))/ L°(T,λ). (1)
Tr, is the measured radiance temperatures. T is the true temperature of the sample that is assumed
to be equal to the convergence temperature T* determined with a pyroreflectometry method [3] based on the introduction of a diffusivity factor η
),(/),()(0,0,0
TTT λλη ρρ ∩= (2)
Numerical Aperture
Flat head
Multiple reflections
Hemispherical head
Optical Fibres
Figure 1: Scheme of the two kinds of probes equipped with optical fibres.
800 900 1000 1100 1200 1300 1400 1500
0,4
0,5
0,6
0,7
0,8
0,9
1,0
1,1
Radiative parameters with(1) and without (2) hemisp herical head
T*(°C)
ρr(2) ρb(2) ρr/ρb(2) η(2) εr(2) εb(2) ρr(1) ρb(1) ρr/ρb(1) η(1) εr(1) εb(1)
Figure 2: Results obtained with hemispherical (1) and with flat-headed(2) probe on a W sample
ρ normal normal reflectivity, ε normal emissivity, η diffusivity factor
r corresponds to measurement at 1.55 µm, b to 1.3 µm. The figure 2 shows the thermoradiative parameters measured with a two color pyroreflectometer: symbol (1) is used for the hemispherical probe measurements, (2) for the flat-headed probe measurements. With the hemispherical head the emissivity is more important and the reflectivity is less important than with the flat head. This is the logical effect of the multiple reflections between the surface sample and the reflecting coating of the probe. The ratio between reflectivities is almost constant. So the use of a flat or hemispherical probe is indifferent in this respect of the ratio. Despite the fact that the diffusivity factors are equal in this case, only the flat probe gives good values for reflectivity and emissivity.

352 Underlying Technology / Vessel-In Vessel / Plasma Facing Components
Table 1: Flat probe results on W during a thermal cycle
T* °C Trr °C Trb °C ρρρρr ρρρρb εεεεr εεεεb ηηηη ρρρρr/ ρ ρ ρ ρb
871 737 767 1.475 1.36 0.34 0.39 0.45 1.08
868 738 768 1.48 1.355 0.35 0.41 0.44 1.09
1050 883 921 1.48 1.355 0.37 0.42 0.43 1.09
1189 992 1036 1.495 1.37 0.37 0.43 0.42 1.09
1370 1120 1171 1.49 1.385 0.37 0.41 0.43 1.08
1625 1298 1357 1.565 1.48 0.36 0.4 0.41 1.06
1016 842 878 1.61 1.505 0.33 0.37 0.42 1.07
The table 1 summarises the results obtained with the flat probe configuration on the same sample as used for the measurements shown in figure 2 during one thermal cycle inside the solar furnace of the MEDIASE device. Since W has specular reflection properties the normal reflectivities are larger than the value one. The normal emissivities are in accordance with literature results [4]. DEDICATED APPARATUS DEVELOPMENT STATE Two specific pieces of equipment have been developed in the frame of this task a tricolor pyroreflectometer and a dedicated vacuum vessel, the solar device DISCO. The tricolor pyroreflectometer: Components needed for the pyroreflectometer have been collected with difficulties and only now the realization of the apparatus is in the last phase with a large delay. Fortunately, the two color technique is enough to validate the method. The dedicated solar device:DISCO (DIspositif Solaire de Caractérisation Optique i.e. Solar facility for Optical Characterization) The specific vessel DISCO is finished and the photos of the figure 3 illustrate the set up. The left one presents a detail with a water cooled probe – originally designed for the FE 200 test device, before it became obvious that another approach is needed (see section IV) - in front of a W sample back-face and next to it a reflectance reference for comparison measurements. The photo (a) shows the vessel at the focus of a solar installation with a front window and a front-face of the sample.
a)
b)
Figure 3: Photos of the dedicated vacuum vessel DISCO Until now DISCO has been used for two kind of characterizations: - to validate the measurement of the convergence
temperature T* from an angular position different to the normal one.
- to measure the Bidirectionnal Reflection Distribution
Function (BRDF) with a normal incident illumination.
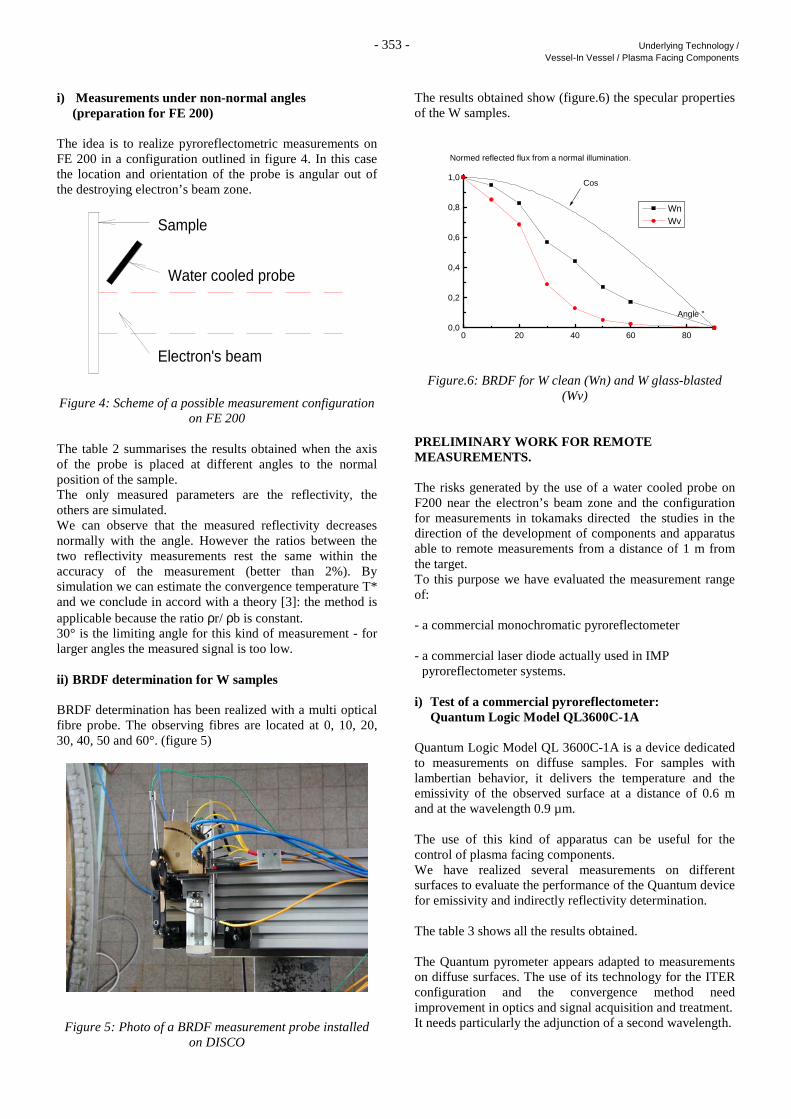
- 353 - Underlying Technology / Vessel-In Vessel / Plasma Facing Components
i) Measurements under non-normal angles (preparation for FE 200) The idea is to realize pyroreflectometric measurements on FE 200 in a configuration outlined in figure 4. In this case the location and orientation of the probe is angular out of the destroying electron’s beam zone.
Electron's beam
Water cooled probe
Sample
Figure 4: Scheme of a possible measurement configuration on FE 200
The table 2 summarises the results obtained when the axis of the probe is placed at different angles to the normal position of the sample. The only measured parameters are the reflectivity, the others are simulated. We can observe that the measured reflectivity decreases normally with the angle. However the ratios between the two reflectivity measurements rest the same within the accuracy of the measurement (better than 2%). By simulation we can estimate the convergence temperature T* and we conclude in accord with a theory [3]: the method is applicable because the ratio ρr/ ρb is constant. 30° is the limiting angle for this kind of measurement - for larger angles the measured signal is too low. ii) BRDF determination for W samples BRDF determination has been realized with a multi optical fibre probe. The observing fibres are located at 0, 10, 20, 30, 40, 50 and 60°. (figure 5)
Figure 5: Photo of a BRDF measurement probe installed on DISCO
The results obtained show (figure.6) the specular properties of the W samples.
0 20 40 60 800,0
0,2
0,4
0,6
0,8
1,0
Normed reflected flux from a normal illumination.
Cos
Angle °
Wn Wv
Figure.6: BRDF for W clean (Wn) and W glass-blasted (Wv)
PRELIMINARY WORK FOR REMOTE MEASUREMENTS. The risks generated by the use of a water cooled probe on F200 near the electron’s beam zone and the configuration for measurements in tokamaks directed the studies in the direction of the development of components and apparatus able to remote measurements from a distance of 1 m from the target. To this purpose we have evaluated the measurement range of: - a commercial monochromatic pyroreflectometer - a commercial laser diode actually used in IMP pyroreflectometer systems. i) Test of a commercial pyroreflectometer: Quantum Logic Model QL3600C-1A Quantum Logic Model QL 3600C-1A is a device dedicated to measurements on diffuse samples. For samples with lambertian behavior, it delivers the temperature and the emissivity of the observed surface at a distance of 0.6 m and at the wavelength 0.9 µm. The use of this kind of apparatus can be useful for the control of plasma facing components. We have realized several measurements on different surfaces to evaluate the performance of the Quantum device for emissivity and indirectly reflectivity determination. The table 3 shows all the results obtained. The Quantum pyrometer appears adapted to measurements on diffuse surfaces. The use of its technology for the ITER configuration and the convergence method need improvement in optics and signal acquisition and treatment. It needs particularly the adjunction of a second wavelength.

- 354 - Underlying Technology / Vessel-In Vessel / Plasma Facing Components
Table 2: R esults for different angular measurements on W
Angle° ρr ρb ρr/ ρb εr εb η T* °C
0 1.51 1.41 1.07 0.32 0.37 0.45 1000
15 1.15 1.08 1.06 0.31 0.35 0.60 1006
30 0.22 0.20 1.1 0.36 0.42 2.91 980
Table 3: Results obtained with Quantum pyroreflectometer
(Diffuse samples are lambertian reflection standards with reflectivity values as indicated)
Sample Diffuse
98
Diffuse
75
Diffuse
50
Diffuse
20
Diffuse
10
Cu blasted
Cu
polished
W
clean
W
oxidized
ε(0.9 µm) 0.5 0.27 0.52 0.80 0.89 0.20 0.33 Out of scale
0.50
ii) Distance with a commercial laser diode A laser diode (characteristics: λ =0.830µm and power =1 W) has been tested without focalisation optic in the actual IMP configuration probe. The reflected signal obtained at 0.60 m is about 80 mv and about 40 mV at 1 m. The laser diodes of the present version of pyroreflectometer used at Odeillo (λ 1.3 µm and 1.55 µm) have a power of less than 100 mW. Consequently the improvement of the tricolor pyroreflectomer to extend its distance of observation needs the development of a dedicated optic and some preliminary measurement tests. CONCLUSIONS
Pyroreflectometry method, probe and apparatus were tested on PROMES facilities to be improved for measurements on CEA reactors and facilities as FE200 or Tokamaks: - A probe with a ‘flat head’ has been compared to an
‘hemispherical head’. Only the flat probe has allowed to determine correctly the emissivities at 1.3 µm and 1.55 µm for W sample delivered by CEA.
- The device DISCO has been used to validate
pyroreflectrometric measurements with an orientation of the probe in a direction different than the normal (to the surface) position.
- This configuration can be applicable to FE 200 but
unfortunately the risks of damage from the electron’s beam impedes real tests. Complementary measurements have been realized to determine the B.R.D.F. of W samples.
- Preliminary tests have been conducted for remote
measurements. Two technical solutions appear:
- An improvement of a commercial solution. - A design and a realization of an optical head adapted to
the IMP fibre optical pyroreflectometer.
The second solution offers the advantage to continue with the same architecture and to benefit of the laboratory developed software and methods. If the power of the presently used laser diode should not be enough, it may become necessary to change the used wavelength. All these technologic improvements and tests are the challenge for 2006.
REFERENCES
[2] M. Balat-Pichelin, D. Hernandez ‘Concentrated Solar
Energy as a diagnostic tool to study materials under extreme conditions’ Journal of Solar Energy Engineering Vol. 124 pp 215-222 august 2002
[4] Y. S. Touloukian, ‘Thermophysical properties of
matter’, IFI/PLENUM, Vol. 7, 1972 REPORTS AND PUBLICATIONS
[1] D. Hernandez J.L. Sans ‘Application of a tricolor
pyroreflectometer to plasma facing components’, Report A2, october 2004.
[3] D. Hernandez ‘A new concept to determine the
true temperature of opaque materials using a tricolor pyroreflectometer’, Review of Scientific Instruments, Vol 76, 024904, pp1-7, 2005

- 355 - Underlying Technology / Vessel-In Vessel / Plasma Facing Components
TASK LEADER
Daniel HERNANDEZ CNRS/PROMES Laboratoire Procédés Matériaux et Energie Solaire F-66125 Odeillo-Font Romeu Tel. : 33 4 68 30 77 19 Fax : 33 4 68 30 29 40 e-mail : [email protected]

- 356 - Underlying Technology / Vessel-In Vessel / Plasma Facing Components

- 357 - Underlying Technology / Vessel-In Vessel / Remote Handling
UT-VIV/AM-AIA
Task Title: TECHNOLOGIES FOR VACUUM AND TEMPERATURE CONDITIONS FOR REMOTE HANDLING SYSTEMS ARTICULATED INSPECTION ARM (AIA)
INTRODUCTION
This project takes place in the future generic plants (like ITER), Underlying Technologies (UT) in Remote Handling (RH) activities. The aim of the R&D program is to demonstrate the feasibility of close inspection of the Divertor cassettes and the Vacuum Vessel first wall. We assumed that a long reach and limited payload carrier penetrates the first wall using the 6 penetrations evenly distributed around the machine and foreseen for the In-Vessel Viewing System (IVVS). The need to access closer than the IVVS to the Vacuum Vessel first wall and the Divertor cassettes had been identified. This is required when considering inspection with other processes as camera or leak detection. The work performed under the EFDA-CSU Workprogramme includes the design, manufacture and testing of an articulated device demonstrator called Articulated Inspection Arm (AIA). The AIA has to fulfil the following specifications:
• Elevation: + - 45 ° range, • Rotation: + - 90 ° range, • Robot total length: 7.4 meters, • Admissible payload: 10 Kg, • Temperature: 200 °C during baking – 120 °C
under working, • Pressure: 9.7 10-6 Pa – Ultra high vacuum.
The manufacture and procurement activities of the AIA robot are performed in the TW5-TVR-AIA Task. 2005 ACTIVITIES
PROTOTYPE MODULE ACTIVITIES SUMMARY A vacuum and temperature module demonstrator was tested in a representative module of CEA-Cadarache mock up called ME60, under realistic operating conditions. Promising results were obtained in term of structural resistance of the system. The past year was dedicated to cycling test campaign to validate all the robot components. TESTS CAMPAIGN Cycling test campaign was carried on with the upgraded module manufactured in 2005 in task TW5-TVR-AIA. It enables to evaluate performances of the AIA system and to identify the weakest components.
Cycle is composed of elevation and rotation combinations:
Table 1: Cycle test description
Points Elevation (°) Rotation (°) Waiting time (s)
1 0 34 60 2 17 0 60 3 0 -34 60 4 -12 -40 60 5 0 -34 60 6 28 0 60
More than 600 cycles were completed with a complete AIA representative payload. Constraints computations introduced a safety factor: payload*1.2. Additional static tests enabled to verify this hypothesis.
Figure 1: AIA module during nominal load tests Baking tests were also performed on the electronic components. A heating insulation and cables were added to the module to cope with the AIA nominal functioning conditions. The tests performed with the upgraded prototype module have shown the benefits of the improvements, good performances of the new rotation actuator and generally a better behaviour of the module. Some endurance tests under temperature have still to be done in Cadarache facilities and are planned in early 2006.
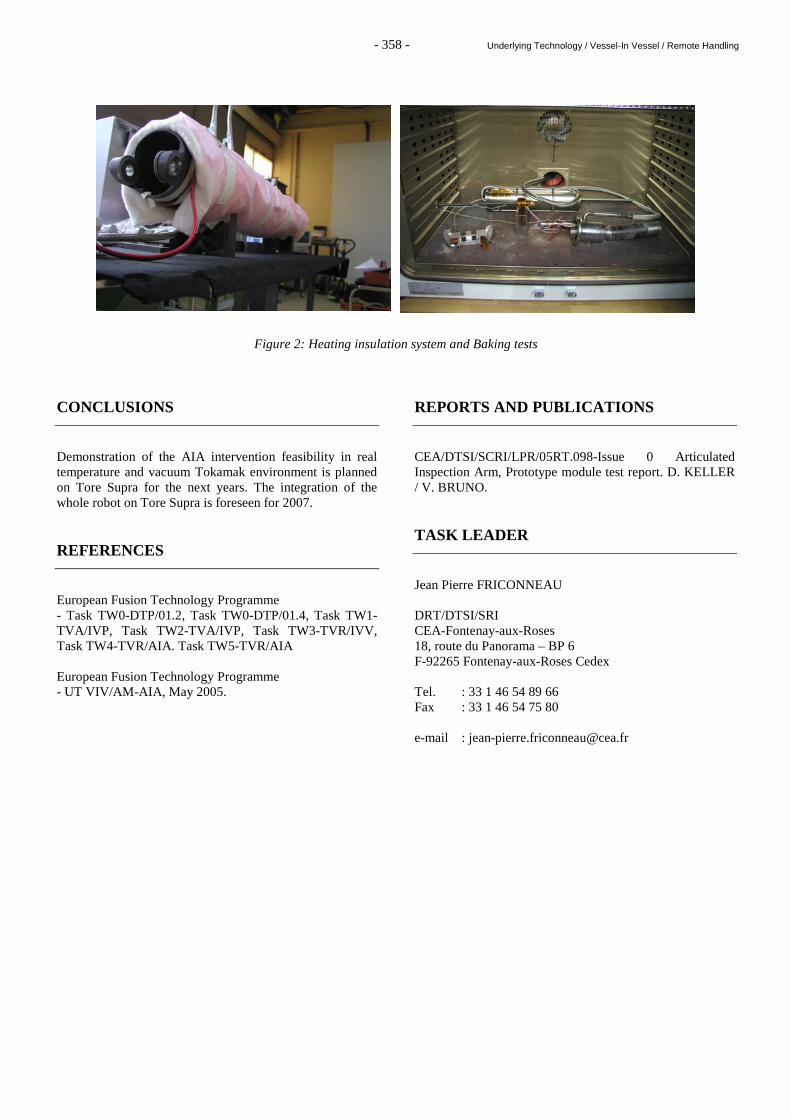
- 358 - Underlying Technology / Vessel-In Vessel / Remote Handling
Figure 2: Heating insulation system and Baking tests
CONCLUSIONS
Demonstration of the AIA intervention feasibility in real temperature and vacuum Tokamak environment is planned on Tore Supra for the next years. The integration of the whole robot on Tore Supra is foreseen for 2007. REFERENCES
European Fusion Technology Programme - Task TW0-DTP/01.2, Task TW0-DTP/01.4, Task TW1-TVA/IVP, Task TW2-TVA/IVP, Task TW3-TVR/IVV, Task TW4-TVR/AIA. Task TW5-TVR/AIA European Fusion Technology Programme - UT VIV/AM-AIA, May 2005.
REPORTS AND PUBLICATIONS
CEA/DTSI/SCRI/LPR/05RT.098-Issue 0 Articulated Inspection Arm, Prototype module test report. D. KELLER / V. BRUNO. TASK LEADER
Jean Pierre FRICONNEAU DRT/DTSI/SRI CEA-Fontenay-aux-Roses 18, route du Panorama – BP 6 F-92265 Fontenay-aux-Roses Cedex Tel. : 33 1 46 54 89 66 Fax : 33 1 46 54 75 80 e-mail : [email protected]

- 359 - Underlying Technology / Vessel-In Vessel / Remote Handling
UT-VIV/AM-ECIr
Task Title: RADIATION EFFECTS ON ELECTRONIC COMPONE NTS
INTRODUCTION
The well-known method commonly named “carrier current principle”, often implemented on consumer applications (home control instrumentation using electrical nets, data transfer using phone nets) has also proven its capacity for data exchange in severe environments and wires number limitation protocols. Works done during years 2004 and 2005 focus on the availability to apply these realizations to a more complex situation such as remote control of maintenance tools of ITER and high level of temperature and radiation. The mock-up was presented on the last 2004 report [1] while this document describes the validation of the prototype built under mock-up requirements. An embedded floating ground supply was integrated in the prototype. 2005 ACTIVITIES
Brief review of the engaged developments The development of a full carrier current link with both data and supply, available under high temperature and dose environments, were previously initiated for the command of an embedded camera, using FSK protocols associated with PWM modulation to transfer data. Some of the results coming from fusion tasks [2] [3] were also used to realise a mock-up to transfer low time evolution as those given by LVDT sensors. Even if limitations were introduced by some components (mainly operational amplifiers used for 2nd order pass band adaptation), reasonable FSK frequencies signals of 250 kHz (logic “1” level) and 125 kHz (logic “0” level) were initiated on the mock-up. The full FSK signals is shown on figure 1.
Figure 1: FSK modulation and data signals An embedded floating ground supply was added to the mock-up and coupled to the FSK modulated signals in
order to limit links between sensors and control room to a single wire. The bloc-diagram schema of figure 2 shows the main principles of the full experimental board.
Figure 2: Floating ground and carrier current association A ten meters 15 V supply line drives both supply and data, with appropriate filter cells on each side to separate the signals.
Figure 3: Chronograms of FSK signals
As shown on the chronograms of figure 3, the data clock signal was modulated with FSK protocols and added to the supply line. The demodulation chronogram does not showr significant degradations. The final modulation of high level clock signal to convert logic “0” and “1” data signals allows a very simple and useful way to mix clock and data digital signals and, one more time, to avoid any need of additional clock wire (see the resulting chronograms on figure 4).
Figure 4: PWM and FSK modulation
Floating ground supply
Control desk
Embedded sensor
FSK signal on the line
Demodulated FSK signal
Data signal
Clock base
PWM frame « 101 » coding
FSK + PWM frame « 101 » coding

- 360 - Underlying Technology / Vessel-In Vessel / Remote Handling
Temperature validation The full mock-up was submitted to thermal tests up to 150°C during long term periods with short stresses. On-line controls on main signals and supply values did not reveal major incidents or failures. Current delivered by the 15V external supply (16.9 V to take into account lost induced by the 10 meters cable) did not exceed 34mA independently of temperature level. Internal floating supplies were stabilised to +7.5 V and -7.5 V which was a good result. The three steps of the demodulation process controlled during thermal tests and represented on figure 5shown that modulation protocol kept its integrity. Demodulation was completed without lost of converted bits “101”.
Figure 5: Demodulation process during thermal tests Delay between emitted and received signals as reported on figure 6 was mainly introduced by line or filtered cells and triggered logic components. It should be possible to optimize the demodulation. But, in any case, because clock was carried out by data signals, this delay did not affect frame interpretation.
Figure 6: Full carrier current data link transmission Prototype manufacturing To avoid any side effects of radiation, a printed prototype was defined and realised in early 2005, based on the modules previously validated. The prototype shown on figure 8 was then verified to room conditions. Data signal was simplified and identified to the clock signal at 3.9 kHz and the chronograms of the different signals were reported on figure 7.
Figure 7: Room conditions measures
The full mock-up was validated up to 150°C with on-line control during long term periods and short stresses without any major incidents or failures. The signals showed a regular stability as can be seen on figure 6.
Figure 8: Prototype of a full carrier current link Irradiation experiment The irradiation took place from june 13th to july 28th 2005. Dose rate was about 5 kGy/h. A test bed was realised. Some wires are added to report internal signal drifts. But, only one of them is needed for supply and data, a second is used for extern ground line.
Figure 9: Prototype during irradiation process
Nominal « 101 » data
Received « 101 » data
Demodulated « 101 » data
Filtered « 101 » data
Digitalised « 101 » data
Clock
PWM modulation
FSK modulation
Full demodulation
Test bed
Prototype

- 361 - Underlying Technology / Vessel-In Vessel / Remote Handling
Up to less than 2 MGy, no drifts occur on floating supplies measures. As shown on figure 10, external Vsupply and Vcc which is really applied to the prototype (after the 10 meters cable) have a very limited decrease often observed after significant total dose integration. Floating ground Vpol and Vnum used to supply logic components seem stable. External current delivered to the prototype start at 20 mA to finish at 10 mA with precision limited by the internal measurement of the supply.
Evolution of internal parameters
0
2
4
6
8
10
12
14
16
18
0,0 250,0 500,0 750,0 1000,0 1250,0 1500,0
Total dose (kGy)
0
0,005
0,01
0,015
0,02
0,025
0,03
V supplyV fl.groundVccVnumI_lim
Cu
rrent (A
)
Vo
lts
(V)
Figure 10: Evolution of internal parameters up to 2 MGy Nevertheless, it clearly appears that chronograms of figure 11 give enough information to confirm that OPA affected to FSK 250 kHz line did not support such level of radiation, even with those with larger bandwidth.
Figure 11: Lost of one of the FSK signals A quick change of default components was enough to recover all the functionality. The chronogram of figure 12 represented the full behaviour of the experiment. The continuous drifts on OPA characteristics affect at about 2 MGy the working state of floating ground and logic supply mechanisms. The recovery at about 2.5 MGy after withdraw and change of faulty components lets the experiment run up to 4 MGy, end of the irradiation campaign.
Evolution of internal parameters
0
4
8
12
16
0 500 1000 1500 1998 2498 3003 3503 4003
Total dose (kGy)
0
0,01
0,02
0,03
V supplyV fl.groundVccVnumI_lim
Cu
rrent (A
)Vo
lts
(V)
Figure 12: Full behaviour under radiation of intern parameters
Once again, at about 3 MGy, the drifts on OPA used for FSK modulations lead the experiment to unexploitable modulation signals (see chrnograms on figure 13). In order to avoid a new shut down of Gamma sources, no change was done.
Figure 13: Lost of full FSK signals
The last recording chronogram of figure 14 confirms the complete lost of modulation while all the logic mechanisms necessary to create digital signals to be modulated leave in operational state.
Figure 14: Logic signals at end of irradiation campaign
FSK 125kHz FSK 250kHz
Logic signals before modulation
FSK modulation
Logic signals before modulation
FSK modulation

- 362 - Underlying Technology / Vessel-In Vessel / Remote Handling
CONCLUSIONS
The volontaire approach to integrate a very common transmission protocol as PWM signals and FSK modulation on a single supply cable gives real opportunity for high temperature and high dose rate irradiation. The 2 MGy-2,5 MGy step seems to be difficult to manage because at that level OPA components have reached their extreme characteristics. Some of them were resolved by use of pseudo-darlington transistors in order to limit effect of load (as rules induced by previous experiments in the case of TW3/4/5-TVR-RADTOL tasks). Others have to be investigated. In any case, as results of underline technologies, these useful prototypes could be a significant start for other carrier current applications in civilian nuclear activities. REPORTS AND PUBLICATIONS
[1] Annual Report of the Association Euratom-CEA
2004. [2] Annual Report of the Association Euratom-CEA
2003 (p 113-117). [3] Annual Report of the Association Euratom-CEA
2002.
TASK LEADER
Alain GIRAUD DRT/DTSI/SARC/LFSE CEA-Saclay F-91191 Gif-sur-Yvette Cedex Tel. : 33 1 69 08 64 30 Fax : 33 1 69 08 20 82 e-mail : [email protected]

- 363 - Underlying Technology / Vessel-In Vessel / Remote Handling
UT-VIV/AM-Hydro
Task Title: TECHNOLOGIES AND CONTROL FOR REMOTE HAN DLING SYSTEMS
INTRODUCTION
CEA in collaboration with CYBERNETIX and IFREMER has developed the advanced hydraulic robot MAESTRO. Control laws developed in the TAO 2000 controller made possible the use of the MAESTRO in a force reflective master-slave configuration. Development around the actuating technology of the MAESTRO’s hydraulic arm successfully proved on servo-valves prototypes the interest to use pressure control servo-valve instead of flow control servo-valve. The control is directly made on the pressure, i.e. the force which makes real improvement during force control modes which are extensively used in remote handling techniques. In-LHC (French servo-valve manufacturer), developed a pressure servo-valve prototype that fits the MAESTRO’s space constraints. Operating in a fusion reactor requires a cleanliness level that oil hydraulic cannot ensure. Pure water hydraulics therefore proposes a good alternative and developments are today focusing in that direction. Feasibility of a pressure control valve running with water was proven and two prototypes were manufactured. Preliminary performance analysis was started to characterize the servovalve. 2005 ACTIVITIES
SERVOVALVE’S SPECIFICATIONS Two prototypes were manufactured during year 2005. Design assumptions were defined to reach the following requirements: - Operating pressure 210 bar - Minimum flow rate 6 liters/min - Bandwidth > 20 Hz on half the volume of an “elbow
axis” Maestro vane actuator - Driving current +/- 10 mA - Leak rate minimum (aiming at < 1liter/min) - Integrated dose rate 10 kGy
Figure 1: First two prototypes
TEST RESULTS WITH OIL Initial settings from the manufacturer were carried out with oil. Pressure vs. current characterization curves for the two prototypes show differences in the behavior. Linearity error is usually close to 3 bars and for high pressure values (>190 bars) a saturation is observed. The mean value of the hysteresis is close to 4 bars (2% of the full scale). Better adjustments of the two nozzles of the valves should provide better control of the spool position reduce the error and improve symmetry. Internal leak rates of both valves are close to 0.95 liter per minute. TEST RESULTS WITH WATER Test rig description The test rig is composed of a drilled block supporting the servovalve and all 4 pressure sensors.
Figure 2: Test rig for water tests Static response of the servovalves Servovalve offset:
Prototype #001 +6.5 bar Prototype #002 -11.6 bar
Maximal pressure difference:
Prototype #001 +125 bars; -130 bars Prototype #002 +125 bars; -130 bars
Low-pass filtering of all pressures was made to reduce effect of noise on the pressure sensors. Significant difference can be observed with the expected gain but these curves also clearly show that the same component with two distinct tuning parameters behaves differently.
Pressure sensors
Servovalve From power supply
Closed outlet
To tank

- 364 - Underlying Technology / Vessel-In Vessel / Remote Handling
-10 -8 -6 -4 -2 0 2 4 6 8 10-200
-150
-100
-50
0
50
100
150
200
commande en courant (mA)
Eca
rt d
e pr
essi
on f
iltré
(ba
r)
-10 -8 -6 -4 -2 0 2 4 6 8 10-200
-150
-100
-50
0
50
100
150
200
commande en courant (mA)
Eca
rt d
e pr
essi
on f
iltré
(ba
r)
Figure 3: Static gain P=f(i) for proto #001 and 002. Current i in mA. Pressure P in bars.
0 10 20 30 40 50 600
40
80
120
160
200
240
Temps en secondes
Pre
ssio
ns e
n ba
rs
Palim PretourPu1 Pu2
Figure 4: Time response to a 10mA periodic step signal
Further test carried out with periodic step signal (figure 4) show that the maximal pressure on the outlets is close to the supply pressure. It means that low gains of the servovalves are not due to internal leakage of the valve that could have been too high but are more likely due to bad settings adjustments. Improvements can therefore be expected in a next stage. Dynamic response
101
102
103
65
70
75
80
85
90
95
Frequency (Hz)
Mag
nitu
de (
dB)
101
102
103
-300
-200
-100
0
Frequency (Hz)
Pha
se (
°)
Figure 5: Gain and Phase response of the servovalve #002
Cut-off frequency at -3 dB is close to 450 Hz. This value is very high compared to the one expected according to numerical modelling which was 16 Hz. Flow rates On close ports both flow rates were below 1.2 liters per minute. On open ports, flow rate higher than 20 liters per minutes were observed. CONCLUSIONS
Pressure control water servovalve prototypes were tested with closed apertures for qualification and characterization with water. Factory settings were adjusted with oil. Linearity excepted, the performances of the valve with oil were close to those issued with numerical models in the design phase. Although the maximal pressure difference between the two ports is lower than expected during water tests on both prototypes, the other requirements are better or close to the expected values. Taking into account that these tests are the first ones on the first prototype generation, these results are encouraging. Performances upgrade is expected with small modifications of the valve settings and change of an internal component. The gain of the valve will therefore raise and reach the required values. Unfortunately internal leak rate of the valve will probably become higher. Further testing of the valve will focus on the definition of a model. Evaluation of its performances, both static and dynamic, will be carried out on operating conditions representative of those observed during real tests with robots. REPORTS AND PUBLICATIONS
DTSI/SCRI/LPR/05RT080 Progress report DTSI/SRI/LTC/06RT006 Characterization of water hydraulics pressure servovalve prototypes
Expected gain
Proto #001 Proto #002

- 365 - Underlying Technology / Vessel-In Vessel / Remote Handling
TASK LEADER
Jean Pierre FRICONNEAU DRT/DTSI/SRI CEA-Fontenay-aux-Roses 18, route du Panorama – BP 6 F-92265 Fontenay-aux-Roses Cedex Tel. : 33 1 46 54 89 66 Fax : 33 1 46 54 75 80 e-mail : [email protected]

- 366 - Underlying Technology / Vessel-In Vessel / Remote Handling

- 367 - Underlying Technology / Tritium Breeding and Materials Breeding Blankets
UT-TBM/BB-He
Task Title: HELIUM COMPONENTS TECHNOLOGY PROBLEMS AND OUTLINES OF SOLUTIONS
INTRODUCTION
For fusion reactors with Helium Cooled Lithium Lead blankets (HCLL concept), helium technology problems have been identified in 2003. Experiments have been proposed in the same fields as those undertaken for fission reactors. In a first step, the fields explored are tribology, thermal insulation, and leak tightness. Also, the circulator technology is experimentally addressed. The tribometer was the first experimental device designed and started. So some interesting results had already been obtained and described previously in 2004. The new 2005 results are reported. The thermal barrier experiment called HETHIMO (Helium THermal Insulation Mock-up) and the leak tightness experiment called HETIQ (Helium Tightness Qualification) were built during the first semester of 2004. After technical troubles, the tests have been postponed due to safety problems, which have been solved during 2005. The experiments will start in the beginning of 2006. A side channel compressor is in operation, and tests, since the end of 2005. 2005 ACTIVITIES
TRIBOLOGY The “CEA – He tribometer” is a “pins on rail alternative sliding tribometer”.
Figure 1: CEA tribometer
Figure 2: Set of bare specimen The major characteristics of the He tribometer are: - Plane/plane contact (0,5 cm²),
- Alternative motion, - Load: 0 – 20 MPa, - Amplitude: up to 20 mm, Frequency: up to 6 Hz. - Environment Parameters: temperature (up to
1000°C), steam, impurities The main objectives of the CEA experimental program on tribology deal with the study of tribological situations in helium at high temperature (in the range of 500°C - 1000°C). The table 1 reports the new results (in red), and results of former years, for comparison. We will only comment the 2005 results. For the 75% (ZrO2-Y2O3) + 25% CaF2 / NiCrAlY coating (Classic plasma spraying): the tests were performed at 900°C and 5 MPa of contact pressure. The wear and the coefficient of friction (µ = 0.3) were low, but thermal dilatation between the coating and the substrate induced delamination of the coating. The CERMET (Cr3C2 – NiCr) test is the only test in which the 5000 required cycles were performed. The tribological behaviour is very good, with a wear rate of 0.008 µm/cycle and a coefficient of friction lower than 0.3. The SiC coating is too thin and too brittle, and the substrate too soft at 900°C to support the load of 5 MPa. This induced the failure of the coating.

- 368 - Underlying Technology / Tritium Breeding and Materials Breeding Blankets
Table 1: Synthesis of the main results obtained during the CEA tribological program
Material Temperature (°C)
Contact pressure (MPa)
Coefficient of friction
Nb of cycles
Wear
HR 230
450
5
0,4
2600
-
800 5 0,6 1500 -
800 2 0,55 5000 +
ZrO2-Y2O3
1000 2 0,6 1000 - -
ZrO2-Y2O3+
25% CAF2
900 5 0.27 1000 +
800 2 0,7 1000
500 5 0,5 1000
LUBODRY
800 0,5 0,5 1000
- - -
Cermet
Cr3C2-NiCr
700 5 0.28 5000 ++
SiC 900 5 0.28 1000 - - -
- -: total wear of coating, - -: high wear, -: significative wear, 0: mean wear, +: low wear, results of the year LEAKTIGHTNESS The objective of the program on static seals is to deal with two problems: fatigue and creep. Fatigue tests simulate the effect of normal or incidental transients inducing structure temperature variations. They consist in thermally cycling the elements of the connection, either in phase, or out of phase, to take into account the individual thermal response of the elements, due to their time constants. The greatest effects might be found in flange connections between a valve and a pipe. Creep tests consist in stabilizing the experimental conditions during a long time, and monitoring the leak rate. Two tests sections have been built.
Cycling Creep
Figure 3: Leak tightness experimental devices
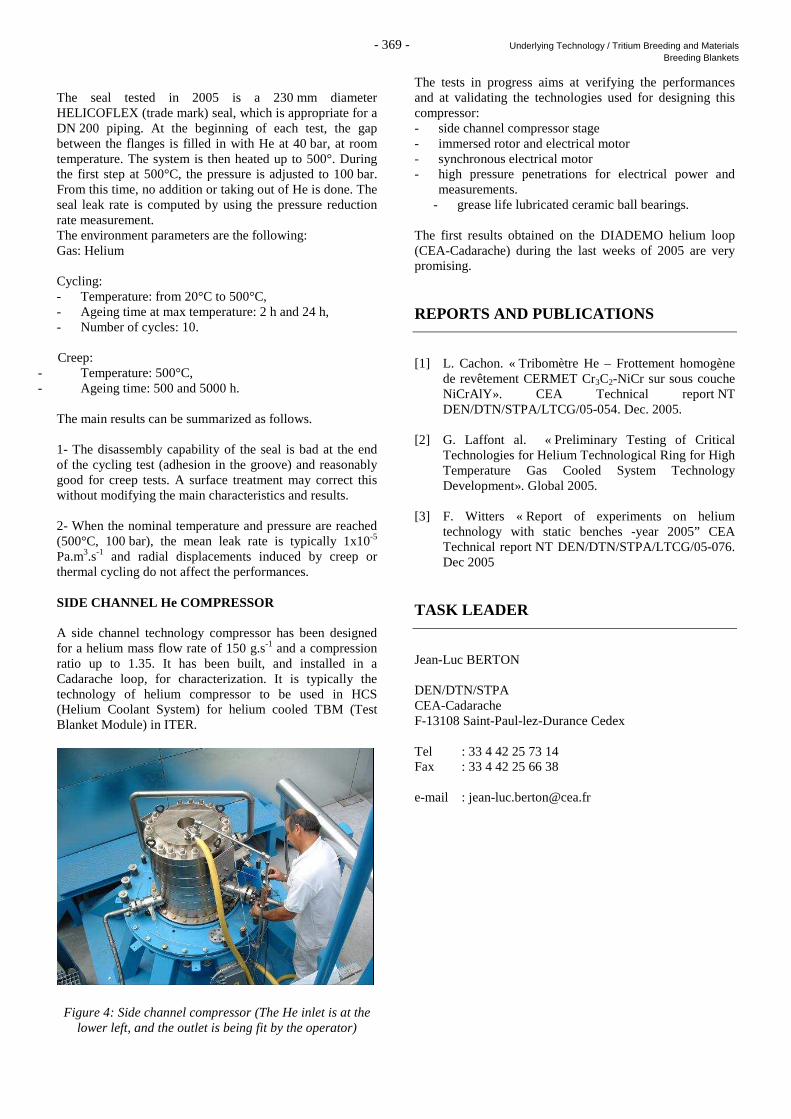
- 369 - Underlying Technology / Tritium Breeding and Materials Breeding Blankets
The seal tested in 2005 is a 230 mm diameter HELICOFLEX (trade mark) seal, which is appropriate for a DN 200 piping. At the beginning of each test, the gap between the flanges is filled in with He at 40 bar, at room temperature. The system is then heated up to 500°. During the first step at 500°C, the pressure is adjusted to 100 bar. From this time, no addition or taking out of He is done. The seal leak rate is computed by using the pressure reduction rate measurement. The environment parameters are the following: Gas: Helium Cycling: - Temperature: from 20°C to 500°C, - Ageing time at max temperature: 2 h and 24 h, - Number of cycles: 10. Creep:
- Temperature: 500°C, - Ageing time: 500 and 5000 h.
The main results can be summarized as follows. 1- The disassembly capability of the seal is bad at the end of the cycling test (adhesion in the groove) and reasonably good for creep tests. A surface treatment may correct this without modifying the main characteristics and results. 2- When the nominal temperature and pressure are reached (500°C, 100 bar), the mean leak rate is typically 1x10⁻⁵ Pa.m3.s-1 and radial displacements induced by creep or thermal cycling do not affect the performances. SIDE CHANNEL He COMPRESSOR A side channel technology compressor has been designed for a helium mass flow rate of 150 g.s-1 and a compression ratio up to 1.35. It has been built, and installed in a Cadarache loop, for characterization. It is typically the technology of helium compressor to be used in HCS (Helium Coolant System) for helium cooled TBM (Test Blanket Module) in ITER.
Figure 4: Side channel compressor (The He inlet is at the lower left, and the outlet is being fit by the operator)
The tests in progress aims at verifying the performances and at validating the technologies used for designing this compressor: - side channel compressor stage - immersed rotor and electrical motor - synchronous electrical motor - high pressure penetrations for electrical power and
measurements. - grease life lubricated ceramic ball bearings.
The first results obtained on the DIADEMO helium loop (CEA-Cadarache) during the last weeks of 2005 are very promising. REPORTS AND PUBLICATIONS
[1] L. Cachon. « Tribomètre He – Frottement homogène
de revêtement CERMET Cr3C2-NiCr sur sous couche NiCrAlY». CEA Technical report NT DEN/DTN/STPA/LTCG/05-054. Dec. 2005.
[2] G. Laffont al. « Preliminary Testing of Critical
Technologies for Helium Technological Ring for High Temperature Gas Cooled System Technology Development». Global 2005.
[3] F. Witters « Report of experiments on helium
technology with static benches -year 2005” CEA Technical report NT DEN/DTN/STPA/LTCG/05-076. Dec 2005
TASK LEADER
Jean-Luc BERTON DEN/DTN/STPA CEA-Cadarache F-13108 Saint-Paul-lez-Durance Cedex Tel : 33 4 42 25 73 14 Fax : 33 4 42 25 66 38 e-mail : [email protected]

- 370 - Underlying Technology / Tritium Breeding and Materials Breeding Blankets
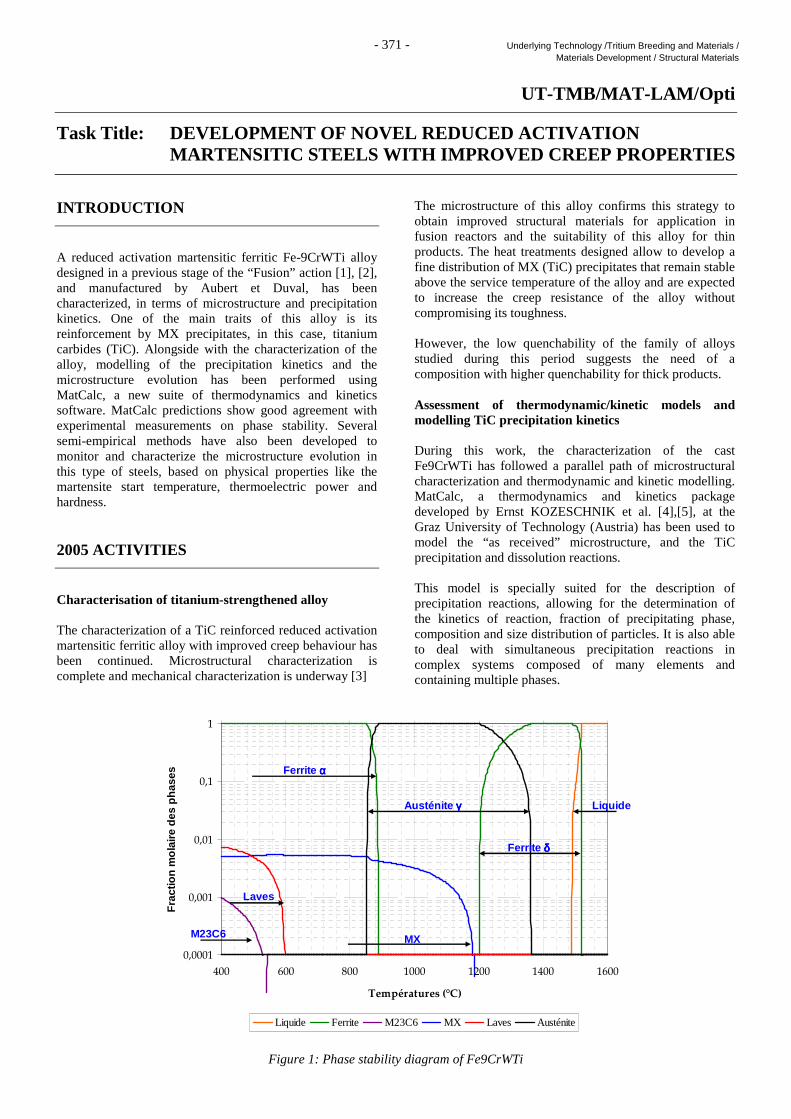
- 371 - Underlying Technology /Tritium Breeding and Materials / Materials Development / Structural Materials
UT-TMB/MAT-LAM/Opti
Task Title: DEVELOPMENT OF NOVEL REDUCED ACTIVATION MARTENSITIC STEELS W ITH IMPROVED CREEP PROPERTIES
INTRODUCTION
A reduced activation martensitic ferritic Fe-9CrWTi alloy designed in a previous stage of the “Fusion” action [1], [2], and manufactured by Aubert et Duval, has been characterized, in terms of microstructure and precipitation kinetics. One of the main traits of this alloy is its reinforcement by MX precipitates, in this case, titanium carbides (TiC). Alongside with the characterization of the alloy, modelling of the precipitation kinetics and the microstructure evolution has been performed using MatCalc, a new suite of thermodynamics and kinetics software. MatCalc predictions show good agreement with experimental measurements on phase stability. Several semi-empirical methods have also been developed to monitor and characterize the microstructure evolution in this type of steels, based on physical properties like the martensite start temperature, thermoelectric power and hardness. 2005 ACTIVITIES
Characterisation of titanium-strengthened alloy The characterization of a TiC reinforced reduced activation martensitic ferritic alloy with improved creep behaviour has been continued. Microstructural characterization is complete and mechanical characterization is underway [3]
The microstructure of this alloy confirms this strategy to obtain improved structural materials for application in fusion reactors and the suitability of this alloy for thin products. The heat treatments designed allow to develop a fine distribution of MX (TiC) precipitates that remain stable above the service temperature of the alloy and are expected to increase the creep resistance of the alloy without compromising its toughness. However, the low quenchability of the family of alloys studied during this period suggests the need of a composition with higher quenchability for thick products. Assessment of thermodynamic/kinetic models and modelling TiC precipitation kinetics During this work, the characterization of the cast Fe9CrWTi has followed a parallel path of microstructural characterization and thermodynamic and kinetic modelling. MatCalc, a thermodynamics and kinetics package developed by Ernst KOZESCHNIK et al. [4],[5], at the Graz University of Technology (Austria) has been used to model the “as received” microstructure, and the TiC precipitation and dissolution reactions. This model is specially suited for the description of precipitation reactions, allowing for the determination of the kinetics of reaction, fraction of precipitating phase, composition and size distribution of particles. It is also able to deal with simultaneous precipitation reactions in complex systems composed of many elements and containing multiple phases.
0,0001
0,001
0,01
0,1
1
400 600 800 1000 1200 1400 1600
Températures (°C)
Fra
ctio
n m
olai
re d
es p
hase
s
Liquide Ferrite M23C6 MX Laves Austénite
Ferrite αααα
Austénite γγγγ
Ferrite δδδδ
Liquide
MX
Laves
M23C6
Figure 1: Phase stability diagram of Fe9CrWTi

- 372 - Underlying Technology /Tritium Breeding and Materials / Materials Development / Structural Materials
The phase stability diagram for alloys of a standard Fe9CrWTi alloy has been calculated using MatCalc. Using this diagram, it is possible to design a heat treatment that will produce a microstructure with a fine and homogeneous dispersion of TiC precipitates this heat treatment includes austenitisation annealing at 1200°C during 30 minutes. During this annealing previous MX precipitates dissolve into the austenitic matrix. The solubilisation annealing is followed by a quench in oil ( )sCT /4°−≈& to create a
martensitic structure. Finally, and in order to precipitate a very fine and homogeneous distribution of TiC, the alloy is tempered at 720°C for 10h. This tempering treatment leaves the martensitic structure basically unchanged, while it introduces the distribution of precipitates that will increase its stability. This temperature is also safely higher than the service temperature of the alloy (~650°C), and therefore it renders the alloy completely stable in service conditions. To follow the nomenclature used at SMRA (CEA-Saclay), this heat treatment will be referred to as “AThR720”. A cast of an alloy Fe9CrWTi has been produced by the company Aubert & Duval, and provided in this condition. The alloy that has undergone such heat treatment is also referred to as “as received” material.
Figure 2: Schematic of the heat treatment AThR720 The simulation of the “as received” state of alloy Fe9CrWTi has allowed us to verify our expectations about its microstructure and evolution during successive heat treatments. It has been possible to predict that after the annealing at 1300°C for 30 minutes all carbides existing from the “as received” condition will have been dissolved. The simulations also allow studying the complete dissolution of carbon and titanium during annealing at high temperature, and that the severity of the quench in oil is sufficient to keep most of those elements in solution. During such quench, some TiC si formed, but of extremely fine size and in negligible mol fraction. During tempering at 720°C the precipitation of TiC reaches the equilibrium mole fraction, and the average since predicted is in good agreement with experimental measurements performed by small angle neutron scattering. Finally, of all possible precipitation reactions expected for this system, TiC is the most stable, in front of metastable cementite or M23C6. To summarise, the simulation of heat treatments allows describing the transformation and precipitation reactions occurring during diverse heat treatments. By using a software package like MatCalc, it is possible to determine the mole fraction of precipitate phases, their number density, composition and size distribution.
Figure 3: Phase stability diagram determined using MatCalc. The red dotted line describes the solubility of
titanium carbides determined experimentally using indirect measurement techniques.
Development of indirect methods to monitor precipitation reactions The experimental and modelling study of the characterisation of the TiC solubilisation and precipitation processes in alloy Fe9CrWTi have shown that it is possible to describe and predict the microstructure obtained after a given heat treatment. However, it would also be of much value to be able to monitor the progress of such processes directly from the material properties, and ideally without the need of complex and time-consuming sample preparation. In order to do that, the effect of precipitation (or degree of solubilisation) in the matrix have studied related to several different properties that could fit the requirements abovementioned. The temperature at which martensite transformation starts (MS), Hardness Vickers (HV) and Thermo-Electric Power measurements (TEP) are all parameters that are directly related to the composition of the matrix, and are simple to measure. During the preliminary stages of this study hardness measurements have been ruled out due to the variability involved and their dependence on both the matrix composition and the morphology and distribution of precipitates. The relationships obtained are more elaborate versions of the ones obtained in Brachet [6]. The fact that we can consider the composition in carbon and titanium to vary hand in hand according to a close to stoechiemetric ratio allows us to make the development described below. This development is shown for MS but an analogous development can be followed for TEP.
[ ] [ ][ ] [ ]
∆⋅+∆⋅=−=∆
∆⋅+∆⋅=−=∆
wtTiPTEwt
CPTE
refMAX
wtTiMswt
CMs
refSS
MAXS
TiKCKPTEPTEPTE
TiKCKMMM
%%
%%
The fit between MS and the annealing temperature is: MS(°C) = -0.2984.T(°C) + 795.87. We can assume that all titanium carbides are dissolved after annealing at 1200°C and that all carbon and titanium are in solid solution in the matrix at this temperature.
Austenitisation 1200°C, 30 min
Oil quench ~ -4°Cs-1
Tempering 720°C, 10 h

- 373 - Underlying Technology /Tritium Breeding and Materials / Materials Development / Structural Materials
On the other hand, the maximum fraction of precipitation (determined from the equilibrium phase diagram calculated with MatCalc) occurs between 720 and 860°C. The carbon and titanium contents of the matrix at those temperatures are negligible compared to the total content of each element in the alloy.
y = -0,2984x + 795,87
420430
440450
460470
480490
500510
520
900 1000 1100 1200 1300 1400
T (°C)
Ms
(°C)
Figure 4: Fit of Ms temperature and annealing temperature.
Then, from the expression:
[ ] [ ] wtTiMswt
CMs
MAXS TiKCKM %% ∆⋅+∆⋅=∆
and using the coefficient for carbon determined by Brachet [5] (KC MS = -600°C/wt%), we arrive to the result that the coefficient for titanium is KTi MS = -277.5°C/wt%. This equation allows therefore relating the matrix composition (and therefore the progress of precipitation) to a physical parameter easy to measure like MS. A similar development can be preformed with the thermo-electric power. CONCLUSIONS
A new family of reduced activation Fe9-12CrWTi martensitic alloys for fusion reactors has been developed and characterised. This type of alloys benefits on the reinforcing properties of a fine distribution of MX precipitates, in addition to M23C6 carbides used traditionally. This type of precipitates are more stable that M23C6 carbides used in alloys of the type EUROFER and others, and therefore the resulting alloy could have improved creep and toughness properties and to be able to work at higher service temperatures than the alloys used presently, up to 650°C for 10,000h. During the development and characterisation of alloys Fe9CrWTi, substantial know-how in modelling of the microstructure using advanced thermodynamic, kinetic and statistic models has been developed, as well as semi-empirical models to monitoring its evolution. In the next stages of this project, the approach of using a nanometric MX precipitates as additional reinforcing phase will be taken further in a new set of compositions that will lead to higher quenchability of the alloy and a more complex range of precipitating MX phases.
The line of compositions in which the main MX precipitate is a vanadium carbonitride will be prioritised over the alloys with TiC reinforcement phase. REFERENCES
[1] Y. DE CARLAN, “Conception de nouveaux
alliages ferritiques-martensitiques à activation réduite optimisés pour la résistance au fluage” Final Report UT-TBM/MAT-LAM/DES,
CEA report, NT SRMA 03-2526, february 2003 [4] E. KOZESCHNIK et al. “Modelling of kinetics in
multi-component multi-phase systems with spherical precipitates. Part 1: Theory” & Part 2: Numerical solution and application” Materials science and engineering A, 385 (2004)
[5] E. KOZESCHNIK et al. Modified evolution
equations for the precipitation kinetics of complex phases in multi-component systems Computer coupling of phase diagrams and thermochemistry, 28 (2004)
[6] J.C. BRACHET, "Correlation between
thermoelectric power (TEP) and martensite start temperature (Ms) measurements of 9Cr-W-V-(Ta) martensitic steels",
Journal de Physique IV, supplément au Journal de Physique III, Volume 5 (1995).
REPORTS AND PUBLICATIONS
[2] V. A. YARDLEY, ‘Progress in Fabrication of
Experimental 9Cr Steel Compositions Optimised for Creep Resistance, Proposed Solutions’ CEA report, DMN/SRMA/LA2M/NT/04-2642/A
[3] D. GAUDE-FUGAROLAS, et Y. DE CARLAN,
‘Intermediate report on the development of novel reduced activation martensitic steels with improved creep properties for fusion reactors’ CEA report, DMN/SRMA/LA2M/NT/05-2751
V. A. YARDLEY, Y. DE CARLAN, ‘Design
Criteria for High-Temperature Steels Strengthened with Vanadium Nitride’, accepted for publication in special issue ‘User Aspects of Phase Diagrams’ of Journal of Phase Equilibria and Diffusion

- 374 - Underlying Technology /Tritium Breeding and Materials / Materials Development / Structural Materials
TASK LEADER
Yann de CARLAN DEN/DMN/SRMA CEA-Saclay F-91191 Gif-sur-Yvette Cedex Tel. : 33 1 69 08 61 75 Fax : 33 1 69 08 71 30 e-mail : [email protected]
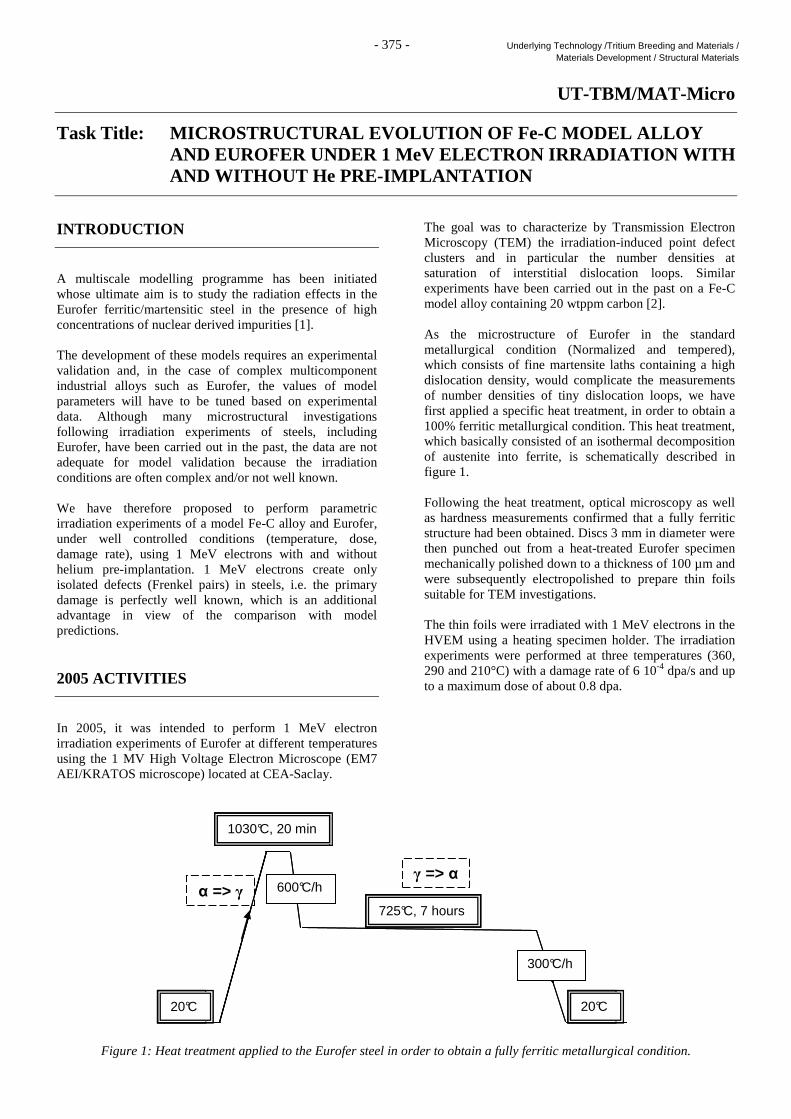
- 375 - Underlying Technology /Tritium Breeding and Materials / Materials Development / Structural Materials
UT-TBM/MAT-Micro
Task Title: MICROSTRUCTURAL EVOLUTION OF Fe-C MODEL ALLOY AND EUROFER UNDER 1 MeV ELECTRON IRRADIATION WITH AND WITHOUT He PRE-IMPLANTATION
INTRODUCTION
A multiscale modelling programme has been initiated whose ultimate aim is to study the radiation effects in the Eurofer ferritic/martensitic steel in the presence of high concentrations of nuclear derived impurities [1]. The development of these models requires an experimental validation and, in the case of complex multicomponent industrial alloys such as Eurofer, the values of model parameters will have to be tuned based on experimental data. Although many microstructural investigations following irradiation experiments of steels, including Eurofer, have been carried out in the past, the data are not adequate for model validation because the irradiation conditions are often complex and/or not well known. We have therefore proposed to perform parametric irradiation experiments of a model Fe-C alloy and Eurofer, under well controlled conditions (temperature, dose, damage rate), using 1 MeV electrons with and without helium pre-implantation. 1 MeV electrons create only isolated defects (Frenkel pairs) in steels, i.e. the primary damage is perfectly well known, which is an additional advantage in view of the comparison with model predictions. 2005 ACTIVITIES
In 2005, it was intended to perform 1 MeV electron irradiation experiments of Eurofer at different temperatures using the 1 MV High Voltage Electron Microscope (EM7 AEI/KRATOS microscope) located at CEA-Saclay.
The goal was to characterize by Transmission Electron Microscopy (TEM) the irradiation-induced point defect clusters and in particular the number densities at saturation of interstitial dislocation loops. Similar experiments have been carried out in the past on a Fe-C model alloy containing 20 wtppm carbon [2]. As the microstructure of Eurofer in the standard metallurgical condition (Normalized and tempered), which consists of fine martensite laths containing a high dislocation density, would complicate the measurements of number densities of tiny dislocation loops, we have first applied a specific heat treatment, in order to obtain a 100% ferritic metallurgical condition. This heat treatment, which basically consisted of an isothermal decomposition of austenite into ferrite, is schematically described in figure 1. Following the heat treatment, optical microscopy as well as hardness measurements confirmed that a fully ferritic structure had been obtained. Discs 3 mm in diameter were then punched out from a heat-treated Eurofer specimen mechanically polished down to a thickness of 100 µm and were subsequently electropolished to prepare thin foils suitable for TEM investigations. The thin foils were irradiated with 1 MeV electrons in the HVEM using a heating specimen holder. The irradiation experiments were performed at three temperatures (360, 290 and 210°C) with a damage rate of 6 10-4 dpa/s and up to a maximum dose of about 0.8 dpa.
Figure 1: Heat treatment applied to the Eurofer steel in order to obtain a fully ferritic metallurgical condition.
1030°C, 20 m
725°C, 7 hees
600°C
300°C/
20° 20°
1030°C, 20 min
725°C, 7 hours
600°C/h
300°C/h
20°C 20°C
α => γ γ => α

- 376 - Underlying Technology /Tritium Breeding and Materials / Materials Development / Structural Materials
Following the irradiation experiments, the specimens were characterized in a conventional TEM operated at 200kV. A representative micrograph of the microstructure induced by irradiation at 210°C is shown in figure 2.
Figure 2: Microstructure of ferritic Eurofer steel irradiated with 1 MeV electrons at 210°C (0.8 dpa). Kinematical
bright field imaging conditions with g =110. This microstructure consists of a high density of small dislocation loops. Unfortunately, during the experiments, the vacuum in the vicinity of the specimen could not be kept at a suitable value, presumably due to a microleak. As a result, oxidation/contamination of the samples occurred, as evidenced for instance by the numerous moiré fringes which can be seen on the TEM micrograph (figure 2). This phenomenon was even more pronounced at the higher irradiation temperatures. It is therefore not possible to use the presently irradiated specimens to obtain reliable quantitative data on the microstructural evolution of Eurofer under electron irradiation. Work is in progress to localize and suppress the microleak presumably causing the oxidation, so that a new series of experiments can be carried out.
CONCLUSIONS
Following a specific heat treatment performed in order to obtain a fully ferritic condition, Eurofer specimens were irradiated in the Saclay HVEM with 1 MeV electrons at different temperatures. However, the subsequent characterization in a 200 kV TEM showed that the irradiated samples were significantly oxidized due to a vacuum problem in the HVEM. A new irradiation campaign will be carried out once this problem is solved. Thereafter, room temperature implantations to a low helium concentration of Eurofer and Fe-C samples will be performed, followed by electron irradiations in order to assess the effect of helium on point defect clustering in both materials. REFERENCES
[1] M. Victoria, G. Martin, B. Singh, The role of the
modelling of irradiation effects in metals in the European Fusion Materials Long Term Program.
[2] A. Hardouin Duparc, C. Moingeon, N.
Smetniansky-de-Grande, A. Barbu, J. Nucl. Mater. 302 (2002) 143
TASK LEADER
Jean HENRY DEN/DMN/SRAM/LA2M CEA-Saclay F-91191 Gif-sur-Yvette Cedex Tel. : 33 1 69 08 85 08 Fax : 33 1 69 08 71 30 e-mail : [email protected]

- 377 - Underlying Technology /Tritium Breeding and Materials / Materials Development / Structural Materials
UT-TBM/MAT-Modpulse
Task Title: PULSED IRRADIATION OF THE MARTENSITIC ALLOY EUROFER
INTRODUCTION
In the framework of the study of irradiation microstructures in ferritic stainless steel, the purpose is to investigate the secondary defects distribution to test the influence of the irradiation mode. Three modes are experimented at the same damage (3 dpa). Two modes are long time irradiations: cyclic (pulsed), and continuous. The third is a short time irradiation reported last year. The results in Eurofer are compared to irradiations in a model alloy. 2005 ACTIVITIES
MATERIAL AND IRRADIATION CONDITIONS The Eurofer97 (table 1) is delivered by SRMA (A. Alamo), [1]. The model ferritic alloy (Fe/9% w. Cr) is elaborated at the SRMP by high frequency heating of high purity Fe (99.999%) and Cr (99.99%). In the Eurofer, the microstructure is very similar from one foil to the other. It consists in laths containing a high density of dislocations. The model alloy is fully ferritic and only scarce dislocation lines are visible at the microscope scale. This year, long time irradiations at the same aimed fluence have been performed in the Van de Graaff accelerator of the SRMP (table 2).The samples are irradiated as disks for transmission electron microscope holders (diameter: 3 mm) extracted from the foil by punching. Then, they are thinned in a double jet device (Tenupol 2 from STRUERS).
IRRADIATION MICROSTRUCTURE Irradiation at 350°C Inside the lath microstructure of Eurofer, dislocation loops are observed as large defects (max 22 nm) and black dots. Due to the bending of the foils, the observation is limited to a small region close to the extinction fringes and the better images are given by bright field conditions (figure 1). A histogram of the sizes distribution has been obtained, which shows two populations of loops (figure 3). One peaks around 7 nm and the second around 19 nm. In the model alloy, a similar microstructure is present (figure 2). Again, loops are present with a bi-modal distribution (figure 4) but the density is larger with a factor about 1.5. The high density of loops impedes a safe loop size histogram. Some loops are very large (> 30 nm) and some dislocation lines are present.
Figure 1: Eurofer irradiated at 350°C
Table 1: Chemical composition of Eurofer97
element C Cr W Ta V Mn Si Ni N Nb weight percent 0.12 8.96 1.04 0.15 0.18 0.48 0.03 0.06 0.022 <0.002
Table 2: Irradiation conditions aimed
ion Energy Damage Fluence Time dpa/s
Kr++ 700 keV 3 dpa 9.64.1014 ions.cm-2 6 h 2.8.10-3

- 378 - Underlying Technology /Tritium Breeding and Materials / Materials Development / Structural Materials
Figure.2: Model alloy irradiated at 350°C
5
5
10
10
15
15
0 0
5 5
10 10
15 15
20 20
Diameter
Number of loops
Figure 3: Eurofer, distribution of the loops size after
irradiation at 350°C
5
5
10
10
15
15
0 0
10 10
20 20
30 30
Diameter
Number of loops
Figure 4: Model alloy, distribution of the loops size after irradiation at 350°C
Discrepancies at 350°C with short time irradiations One major difference is the lack of clusters in the Eurofer after short time relatively to the presence of clusters after long time (table 3). This absence has been analysed by heating the sample at higher temperature: 550°C. The formation of defects has been observed, meaning that the clusters were too small to be observed at that fluence.
The larger fluence of the long time irradiation is the main argument to explain the formation of loops in the Eurofer. The population of loops present a bi-modal distribution with two peaks at 7 and 19 nm. In the model alloy, as compared to short time irradiations, the loop size increases and again a bi-modal distribution is present. Irradiation at 550°C At this temperature, both oxidation and dense microstructure make the observation inside the laths more difficult. Only a few regions are available to give good images (figure 5). In this case, large defects located in 100 are present as dislocation loops (> 80 nm). The model alloy shows less deformation of the grains, which allows the realization of better pictures than in the Eurofer. It presents a homogeneous distribution of loops with a density of 1-2.1020 m-3. figure 6 presents these loops when they are seen edge on. Their density forbids observations of other defects. These loops are shown for the best when they are seen edge on. They are mainly located in 100 planes but some of them are shown in planes closed to ~120. The diameter of these loops reaches the large value of 400 nm with a mean value around 200 nm.
Figure 5: Eurofer irradiated at 550°C : loops edge on inside a martensitic lath

- 379 - Underlying Technology /Tritium Breeding and Materials / Materials Development / Structural Materials
Table 3: Microstructure at 350°C after short and long time irradiation
Eurofer Model alloy
Loops density no observable defects uni-modal distribution : ~5.1021 m-3
Short time Loops size - small loops : < 5 nm
Loops density about twice than in the model alloy~3.1021 m-3 bi-modal distribution: ~5.1021 m-3
Long time Loops size two sizes : 7 and 19 nm larger loops, two sizes : 7 and 28 nm
Table 4: Microstructure at 550°C after short and long time irradiation
Eurofer Model alloy
Loops density heterogeneous, <107.m-1, < 1020 m-3
Short time Loops size max 150 nm max 150 nm
Loops density at least twice larger than after short time 1-2.1020 m-3
Long time Loops size max 300 nm max 400 nm Discrepancies at 550°C with short time irradiations The same type of larges loops are present after short and long time irradiation in the two alloys (table 4). After long time irradiation, the clusters are very much larger with a higher density. Too much defects are present to give a good observation.
Figure 6: Model alloy iradiated at 550°C : loops in 100 and ~120 planes
The original dislocation network is still visible between loops after short time irradiation in Eurofer. It is no more possible to observe it after the long time irradiation. CONCLUSIONS
At 350°C, in Eurofer and the model alloy, the loops are very much smaller relatively to the ones present after
irradiation at 550°C. In the two materials a bi-modal distribution is present. This difference with fcc metals needs to be cleared [2]. The lack of defects, at 350°C, in Eurofer, after short time irradiation is attributed to a realized fluence lower than after long time irradiation. At 550°C, long time, the loops are very much larger than after short time. Again, the obtained fluence was too high. Nevertheless the size of loops at 550°C is too large, meaning that a lower damage may be sufficient. There is no loops free zone (LFZ) close to the laths interfaces and in thin region the LFZ is limited. As a comparison with short time irradiations, the larger densities and sizes of loops that are present after long time irradiation are attributed to an unexpected higher damage. For future irradiations, a more controlled fluence is wished. It is unlikely that a flux effect would give a such tendency. In the two alloys, the microstructure is similar. Consequently, the martensitic structure as well as the minors alloy elements does not influence the loop microstructure in the Eurofer. REFERENCES
[1] Metallurgical characterization of as-received
Eurofer97 products, C. A. Danon, S. Urvoy, A. Alamo CEA report, NT SRMA 01-2418, march 2001.
[2] Interstitial loops configurations after two modes of
pulsed and monotonous irradiation at 600, 370 and 200°C, comparison with high flux continuous irradiation. Origin of the erratic formation of scarce voids. L. Boulanger and Y. Serruys, CEA report, NT DEN/SAC/DMN/SRMP 2003-01

- 380 - Underlying Technology /Tritium Breeding and Materials / Materials Development / Structural Materials
REPORTS AND PUBLICATIONS
Preparation of Eurofer samples for pulsed irradiations, L. Boulanger and Y. Serruys, CEA report, NT DEN/SAC/DMN/SRMP 2004-01 Monotonous short time irradiation of Eurofer at 350 and 550°C, L. Boulanger and Y. Serruys, CEA report, NT DEN/SAC/DMN/SRMP 2004-012 Annealing of Eurofer irradiated at 350°C, L. Boulanger and Y. Serruys, CEA report, NT DEN/SAC/DMN/SRMP 2005-04 Annealing of Eurofer irradiated at 350°C, L. Boulanger and Y. Serruys, CEA report, NT DEN/SAC/DMN/SRMP 2005-20 TASK LEADER
Loic BOULANGER DEN/DMN/SRMP CEA-Saclay F-91191 Gif-sur-Yvette Cedex Tel. : 33 1 69 08 64 19 Fax : 33 1 69 08 68 67 e-mail : [email protected]

- 381 - Underlying Technology / Safety and Environment
UT-S&E-LASER/DEC
Task Title: LASER HEATING OF COMPLEX GRAPHITE SURFA CES BY HIGH REPETITION RATE NANOSECOND PULSES
INTRODUCTION
The excessive trapping of tritium in tokamak plasma-facing components is seen as a severe problem for the efficient operation of thermonuclear fusion reactors. A completely optical method of surface detritiation by laser ablation or laser heating can be offered for decontamination and internal surface cleaning of prospective International Thermonuclear Experimental Reactor (ITER). The commercially available powerful high repetition rate pulsed Nd-YAG lasers with laser radiation transported to the contaminated surface by the optical fiber are seen as good candidates for detritiation of all plasma-facing surfaces in tokamaks. The possibility to transport the laser beam to processed zone by the optical fiber allows to remove the laser system away from the contaminated zone and to carry out remote detritiation. The absence of the direct contact with the contaminated surfaces that ensures the personnel safety, the reduced waste volume, the accessibility of the laser beam to the shadowed areas, and a possible complete automation of the process are the most attractive features of laser decontamination. To characterize the properties of the co-deposited carbon layer and of the native surface of manufactured graphite tiles, the thorough laser heating measurements with the pyrometer were performed. A specially developed infra-red pyrometer system was used for the surface heating measurements to study high repetition rate laser heating. A theoretical model of laser heating of complex surfaces with the boundary layer by periodically repeating nanosecond laser pulses was developed. The model allows to make 3D simulations of laser heating on large scales both in time and space. To obtain the detailed comparison of the experimental and calculation results, the theoretical model was extended to the case of intermediate heat contact between the layer and the substrate.
2005 ACTIVITIES
The experiments on laser heating of graphite tiles with a co-deposited carbon layer were made for Tore Supra tile and Textor tile. In the latter case, the experiments were made in different places on the tile with apparent different co-deposited layer properties (friability, contact with the substrate). Some results of the pyrometer measurements are shown in figure 1(a − f). The temperature traces in panels (a) and (b) are quite similar. It testifies to the fact that the Tore Supra co-deposit is rather thin (similar to the case (b) of Textor tile) or even thinner (because the minimal temperature in figure 1a seems lower than the one on figure 1b). Both temperature traces show a slow increase in the minimal temperature, which, however, does not exceed the minimal threshold of the pyrometer (at least, during laser heating). This impedes an effective comparison of the results of these measurements with the calculations. The case of figure 1c is more informative, because minimal heating temperatures are above the minimal threshold temperature of the pyrometer and very stable from ~10th laser pulse. Such minimal temperature behavior indicates that ablation is already in progress. For this reason, the experimental results in panels (d), (e) and (f) seem the most suitable for the modelling. From figure 1d, these results look very reproducible where two different measurements with different heating time in the same place on the tile are superimposed. For the case of figure 1d, similar to the one of figure 1c, the ablation seems to be in progress beginning from ~30th laser pulse. This conclusion can be made on the basis of saturation of the minimal heating temperature in this time range. The cutting the experimental results for the heating temperature from the top corresponds to the maximal threshold of the pyrometer. Thus, further on, the main attention is paid to the modelling of the experimental results in panels (e) and (f). These results were obtained with laser heating of neighboring but different places on plasma-facing surface of Textor graphite tile with a thick co-deposited layer (10-50 µm) being weakly adhered to the substrate.

- 382 - Underlying Technology / Safety and Environment
Figure 1: Panels (a) − (f) present the results of the pyrometer measurements on laser heating of plasma-facing surface of graphite tiles from Tore Supra (a) and from Textor (b) – (f). In the latter case, the different panels correspond to different
places on the tile. The qualitatively indicated thickness of the co-deposited carbon layer was estimated only visually. Figures 2 and 3 present the modelling of experimental temperatures obtained with a pyrometer (figure 1e and 1f, respectively). Figure 2a shows the best fit for the experimental temperature trace presented in figure 1e. The four parameters of the fit are as follows: the layer porosity pL = 0.25, the layer thermoconductivity kL = 0.12 W/(m⋅K), the layer thickness d = 16 µm, and the heat transfer coefficient of the layer/substrate interface h = 2.5 ×10³ W/(m2⋅K). This set of the adjusting parameters seems unique (within both the fit and model accuracy). The curvature of the minimal temperatures profile is defined mainly by porosity pL of the layer. The slope of the relaxation curve tail (after the laser is switched off) is defined mainly by the heat transfer coefficient h. The heating temperature scale is defined by the layer thermoconductivity kL. The global profile of the temperature trace (the coupling of the heating and relaxation parts of the global profile) depends on the layer thickness d. The ablation seems to take place by the end of the heating. This conclusion can be made because the maximal calculated heating temperature reaches the sublimation temperature of graphite and it prevents to fit perfectly the final heating stage. Thus, the reliability of the adjusting parameters may be partially lost and, in particular, might be the reason that the calculated cooling curve does not perfectly correspond to the experimental one (figure 2b).
Figure 2: The modelling of the experimental temperature
trace presented in Fig. 1e (plasma-facing surface of Textor tile with a co-deposited layer). The layer parameters
resulting in the best fit are as follows: pL = 0.25, kL = 0.12 W/(m⋅K), h = 2.5×10³ W/(m2⋅K), d = 16 µm. Panel (a) presents the global temperature profile, and panel (b)
shows the cooling curve between two adjacent laser pulses.

- 383 - Underlying Technology / Safety and Environment
The similar situation takes place in the case of figure 3, where modelling of the experimental temperature profile presented in figure 1f is shown. The experimental results of figure 1e and 1f were obtained in different but neighboring places on plasma-facing surface of Textor tile. Thus, the layer thickness d was close to 15 µm for both cases. On the other hand, the porosities (or, equivalently, the densities) of the carbon layer in two places seem different. The best fit for the case of figure 3 corresponds to pL = 0. In other words, in the second case the layer is more compact than the manufactured porous graphite. In the second case, the heat transfer coefficient is significantly lower and is h = 0.9 ×10³ W/(m2⋅K). It means that in this case, the layer is poorly adhered to the substrate. And again, the ablation apparently takes place by the end of the heating, which may be even more effective if compared with the case of figure 2. This correlates with the lower heat transfer coefficient h. For both cases, thermoconductivity of the carbon layer is very low if compared with the thermoconductivity of graphite substrate. The explanation of this specific behavior can be the subject of a special study.
Figure 3: The modelling of the experimental temperature trace presented infigure 9f. The layer parameters resulting in the best fit are as follows: pL = 0, kL = 0.05 W/(m⋅K), h = 0.9×10³ W/(m2⋅K), d = 15 µm. Panel (a) presents the global temperature profile, and panel (b) shows the cooling curve
between two adjacent laser pulses.
CONCLUSIONS
The theoretical model of laser heating of complex surfaces (graphite or metal substrate with a co-deposited boundary layer intermediately adhered to the substrate) by repeating laser pulses is developed. The previousely developed laser heating model with only two limiting cases of adhesion (completely perfect and completely imperfect heat contact between the layer and the substrate) was extended to the case of intermediate adhesion. It was also used to interpret and simulate the experimental results obtained in CEA Saclay (LILM) on laser heating of the graphite surfaces without and with a co-deposit layer from different tokamaks, and also to adjust some optical and thermo-physical parameters of manufactured graphite. The main results are as follows: - 1. The characterization of the graphite parameters
was made. On the basis of the experimental ablation thresholds, the laser absorption coefficient of manufactured graphite was estimated surprisingly low as 3.75×10⁶ m-1.
- 2. The simulations of laser heating of both the
backside surface and the plasma-facing surface of graphite tiles from different tokamak installations were performed. The experimental results on laser heating of the backside surface of graphite tiles were simulated with a good agreement not only for the surface preprocessed by laser ablation, but also for the original (non-preprocessed) surface with unexpected boundary layer with the properties being different from those of the bulk. The specific unexpected features of laser heating of backside surface of Tore Supra graphite tiles were modeled and interpreted. The fit of laser heating experiments on TexTor tiles with a co-deposited layer is made with a rather good agreement.
- 3. It was ascertained that modelling of the
experimental temperature profiles obtained with pyrometer measurements can allow to adjust all the unknown parameters of the co-deposited layer. It was established that four adjusting parameters (h, d, pL, kL) can be determined, in principle, from the fit of the simulated results to the experimental ones, providing full characterization of the boundary (co-deposited) layer.
- 4. The laser heating model was also validated by
simulations of the laser heating of paint and cement. On the basis of the simulation results, new experiments can be proposed to obtain detailed characterization of both graphite and a co-deposited layer.

- 384 - Underlying Technology / Safety and Environment
REPORTS AND PUBLICATIONS
[1] A. Semerok, S.V. Fomichev, F. Brygo, J.M.
Weulersse, P.-Y. Thro, “Laser heating of complex graphite surface by high repetition rate nanosecond pulses”, CEA Report, DPC/SCP/LILM/2006/170-A, 36 pages.
[2] A. Semerok, S.V. Fomichev, F. Brygo, J.-M.
Weulersse, P.-Y. Thro, Ch. Grisolia, “Surface heating by pulsed repetition rate nanosecond lasers”, invited presentation on the LTL Conference, Plovdiv, Bulgaria, 2005, will be published in SPIE Proceedings 2006, 8 pages.
[3] A. Semerok, F. Brygo, S.V. Fomichev, F.
Champonnois, J.-M. Weulersse, P.-Y. Thro, P. Fichet, Ch. Grisolia, “Laser detritiation and co-deposited layer characterisation for future ITER installation”, ENC Proceedings, Versailles, France, 2005.
TASK LEADER
Alexandre SEMEROK DEN/DPC/SCP/LILM CEA-Saclay F-91191 Gif-sur-Yvette CEDEX Tel. : 33 1 69 08 65 57 Fax : 33 1 69 08 78 84 e-mail : [email protected]

- 385 - Underlying Technology / Safety and Environment
UT-S&E-LiPbwater
Task Title: ANALYSIS OF THE CONSEQUENCES OF A COMMO N FAILURE OF THE TEST BLANKET MODULE AND WATER BLANKET IN ITER
INTRODUCTION
Roughly, 500 water blankets are surrounding the vacuum vessel of the ITER reactor in order to remove the heat by a water circulation. The water temperature enters at a temperature of 100°C and is heated up to 150°C under a pressure of 30 bar. The water is in the liquid phase. Furthermore, a Test Blanket Module (TBM) is surrounding the vacuum vessel in order to allow the tritium production by a neutronic reaction with the metal liquid Pb/Li present in the TBM. This liquid occupies a volume of 0.324 m3, at a temperature of 550°C and a relatively low pressure comprised between 2 to 5 bar. The TBM is cooled down by a helium circulation, whose inlet temperature is 300°C and the outlet temperature 500°C under a pressure of 80 bar. The TBM total volume is 0.7 m3. In the framework of the safety analysis of ITER, the consequences of a common failure of the TBM and a few water blankets have to be investigated. It would result a hypothetical thermal interaction between the liquid metal Pb/Li and the liquid water in the vacuum vessel. The contact between these two liquids at relatively high temperature could yield a thermal interaction between them. The water will vaporize and thus pressurize the vacuum vessel, designed to withstand a maximum pressure of 2 bar. If such pressure were reached, the integrity of the vessel would be challenged. The purpose of the study is to investigate the phenomenology of this scenario. 2005 ACTIVITIES
The objective of the 2005 work was to analyze the consequences of such an interaction and to specify a method to calculate it. CHEMICAL REACTION It is useful to recall what will result from the contact between water and Pb/Li. The contact between water and Pb/Li at which temperature in a low-pressure vessel will make the water vaporize. Two types of accidents will also occur in the blanket module of a fusion reactor : a small leakage or a large leakage. In both cases, the chemical reaction that takes place is [1]: Reaction in the presence of excess water:
CatLikgMJHHLiOHOHLi °−−=∆+→+ 25/29222 22
Reaction in the presence of excess lithium: CatLikgMJHHOLiOHLi °−−=∆+→+ 25/222 222
These chemical reactions are exothermic, inducing an increase of the pressure in the module blanket and threatening its integrity. FIRST STUDY The first study consists in analyzing the consequences of a simultaneous failure in the TBM and a few blankets with an excess of Pb/Li or water. This could yield a strong interaction between Pb/Li and water in the vacuum vessel. The thermal effect will be studied, not the consequences of hydrogen formation, which takes place later. Excess of Pb/Li Assuming that a pre-existing pool of Pb/Li is already present in the vacuum vessel (the initial pressure being close to 0), the contact results in water vaporization, followed by the production of solid lithium oxide and hydrogen. The situation is plotted figure 1. The question is to determine the amount of water necessary to produce a resultant pressure of 2 bar due to the water vaporization. This preliminary work is based on a thermodynamic approach, namely a thermal equilibrium between water and Pb/Li.
Vacuum vessel3800 m3
Pb/Li0.324 m3, 550°C
Water100-150°C
30 bar
Figure 1: Vacuum vessel (excess Lithium)
Excess of water If a pre-existing pool of water is present in the vacuum vessel with a lithium leak in the pool, aqueous lithium hydroxide and hydrogen gas will be produced. This second case is represented figure 2.

- 386 - Underlying Technology / Safety and Environment
Vacuum vessel3800 m3
Water1 m3, 150°C
Pb/Li550°C5 bar
Figure 2: Vacuum vessel (excess water)
SECOND STUDY The second study is similar to the previous one, except that helium is taken into account. The impact on the water amount to reach the maximum allowable pressure is investigated in these conditions. The conditions are recalled figure 3.
Vacuum vessel3800 m3
Pb/Li0.324 m3, 550°C
Water100-150°C
30 bar
Helium0.3 m3, 500°C
80 bar
Figure 3: Vacuum vessel with helium 2006 FORESEEN STUDY These two studies were estimated on a thermodynamic viewpoint in 2005 in order to give a first evaluation on the consequences of the Pb/Li and water interaction. Only stationary conditions were studied. In 2006, it is proposed to follow this analysis by a refined modeling of the system with the SIMMER code [2]. The kinetics aspects of the mixing between the two liquids will be taken into account. The initial phase after the contact of the two liquids, which is subjected to the apparition of pressure peaks, will be investigated and the results will be compared to the present ones. These kinds of Interaction between Pb/Li and water have already been calculated with the SIMMER code in the past. In particular, the interpretation of the LIFUS program was performed with this code [3]. The 2006 work will be an adaptation of these previous studies.
2005 THERMODYNAMIC STUDY The main results of the 2005 work are presented hereafter. VESSEL PRESSURIZATION WITHOUT HELIUM The Pb/Li liquid metal is supposed to be initially under a pressure of 1 bar and a temperature of 550°C, the water being at 30 bar and 150°C. Previous study In the framework of the initial ITER project, the study was already performed with the two codes LINT and MELCOR [1] for similar conditions. At that time, water and not helium was chosen to cool down the TBM, so that the risk of a Pb/Li and water interaction was much higher. Furthermore, the vessel size was smaller; temperature and pressure were also different. In case of water excess in the vacuum vessel, a lithium leak with a 38 kg/s flowrate leads to a linear pressurization of the vessel up to the water boiling, obtained 125 seconds after onset. The design pressure of the vessel was reached in 50 s and the initial Pb/Li pressure of 5 bar was obtained after 125 s. In case of a Pb/Li excess, the vessel failure is also reached within a matter of minutes. According to the initial Pb/Li mass, the failure time can decrease from 900 s to 100 s. Considering these large flowrates, the vessel pressurization was extremely rapid. The present configuration is different since such large flowrates cannot be encountered. The water vaporization Considering the mixture of the two liquids, the possibility of complete water vaporization is checked with the present configuration. If a complete mixing of the two fluids at a constant pressure were assumed, taking into account the water vaporization, the final temperature would be given by the equality of the heat exchanges. The thermo-dynamical characteristics of water and Pb/Li and initial conditions are summarized Table 1.
Table 1: Properties of the two liquids/ initial conditions
Water Pb/Li Volume 1000 m3 0.324 m3
Density (standard P, T) 1000 kg/m3 9321 kg/m3
Initial temperature 150°C 550°C
Initial pressure 30 bar 2-5 bar
Cp liquid 4180 J/K/kg 190 J/K/kg
Vaporization (5 bar) 151.11°C 978°C Initial temperature 150°C 550°C Initial pressure 30 bar 2-5 bar Two cases mentioned above; are investigated.

- 387 - Underlying Technology / Safety and Environment
Water initially present in the vacuum vessel Initially, 1 m3 of water at a temperature of 150°C is present in the vacuum vessel. The Pb/Li liquid is injected at a temperature of 550°C. As the water volume is very limited, the only way to increase the pressure in the vessel is to completely vaporize the water, then increase the water vapor. Using the perfect gas law, the temperature necessary to pressurize
the vessel is of the order of KRn
VPT 6102⋅≈
⋅⋅= ,
which is unrealistic, since the Pb/Li temperature is 550°C. There is therefore no risk of vessel pressurization if the water volume is limited. Since the vapor vaporization is unlikely, the probability of some pressure peaks is also low. Therefore, this case will not be investigated by detailed calculations. Pb/Li initially present in the vacuum vessel In case of a water injection in the vacuum vessel, initially filled with a mass of 0.324 m3 of Pb/Li and a temperature of 550°C, the situation is different from the previous one. When water is injected in the vessel; the heat from Pb/Li will be transferred to the water. Initially the vessel is not pressurized, so that water will be totally vaporized until the saturation temperature that corresponds to a pressure of 2 bar, namely 120°C. Then, this vapor will be heated until 150°C. If the water vapor is assumed to remain at the saturation pressure, a pressure of 5 bar will be reached. The thermo-dynamical properties of water under 2 and 5 bar are given table 2.
Table 2: Water properties under 2 and 5 bar
Water 2 bar 5 bar Temperature (°C) 120 °C 150°C 120 °C 150°C Density (kg/m3) 1.1 1.02 944 918 Enthalpy (kJ/Kg) 2706 2770 505 633 The perfect gas law gives the amount of water necessary to reach the water saturation pressure at 150°C:
TRnVP ⋅⋅=⋅ Hence:
nPsat ⋅= 93.0 with n the number of H20 moles.
For this temperature of 150°C under the saturation pressure of 5 bar, the water mass that can be vaporized is therefore around 9700 kg. This calculated mass of 9700 kg corresponds to a volume of 10 m3 of water under a pressure of 30 bar and a temperature of 150°C. This value is coherent with the LINT and MELCOR calculations in the case of a water injection in the Pb/Li liquid [1, page 12]. The mass necessary to cause an initial pressurization was evaluated in this report to 8000 kg. In the present calculation, the vessel failure is not considered. Since the water will be pressurized as long as it is coming into the vessel, it means that the vessel could fail even without any lithium interaction [1, page 10]. The design pressure of 2 bar would be reached with the 2/5 of the 9700 kg water mass, namely 3880 kg.
Although this water amount is quite large, further investigation would be needed to study the transient effects that will develop during the process of water vaporization. Indeed, pressure peaks are expected to occur during the mixing phase that could damage the vessel structure. CONCLUSIONS
This specification report was aimed at presenting the question raised by a possible interaction between Pb/Li and water and recalling previous evaluations made in another context. Then, the water mass necessary to endanger to vacuum vessel integrity was estimated. Although this approach yields rapid results, it only corresponds to steady-state conditions that take into account -neither the transient mixture process -nor the system geometry where the mixture occurs. Consequently, it is proposed to pursue this study in 2006 by a complete modeling of the control volume of the vacuum vessel. The thermal interaction could be more precisely estimated and the pressures exercised on the vessel better calculated. REFERENCES
[1] Computer Modeling for Lithium Safety in Fusion
Systems: LINT and MELCOR, T.T Utschig and M.L Corradini (june 1999) - Fusion Technology Institute University of Wisconsin
[2] SIMMER-III : a computer code for LMFR core
disruptive accident analysis Version 2.H model summary and program description S. Kondo et al (november 2000) JNC TN9400 2001-002
REPORTS AND PUBLICATIONS
[3] “Recalculation of the LIFUS experiment with the
3D version of SIMMER” (interaction between lithium-lead and water) T. Cadiou (february 2005) CEA/DEN/CAD/DER/SESI/LCSI/NT DO1 14/01/05
TASK LEADER
Thierry CADIOU DEN/DER/SESI/LCSI CEA-Cadarache F-13108 Saint-Paul-lez-Durance Cedex Tel. : 33 1 42 25 66 17 Fax : 33 1 42 25 71 87 e-mail : [email protected]

- 388 - Underlying Technology / Safety and Environment

- 389 - Underlying Technology / Safety and Environment
UT-S&E-Tritium-Impact
Task Title: IMPACT OF CONTAMINATION WITH TRITIUM AT CELL LEVEL
INTRODUCTION
Ionizing radiation produces different kinds of damages on DNA among them oxidative stress and double strand breaks (DSB). DNA damages may lead to genetic alterations which could result in severe pathologies. DSB are the most toxic lesions, which can also be induced by DNA replication arrest. Accumulation of these lesions can trigger cell cycle checkpoints and programmed cell death but non-accurate repair of DSB can lead to genetic rearrangements. Homologous recombination (HR) and non-homologous end-joining (NHEJ) are the main processes for DSB repair. To produce DNA damages, external irradiation requires sufficient energy to reach the nucleus. In such conditions, tritium radiation cannot reach the DNA. However, organically bound (OBT) tritium can be incorporated into the cell resulting in an in situ chronic irradiation, which is now able to reach the biological target. Because of the low disintegration energy of Tritium, its biological effects cannot come from external exposure but from integration into tissue resulting in auto-irradiation. Consequently, the energy deposition is concentrated in the sub-cellular compartment, and may amplify the biological consequences. In this situation, the low penetration of the beam becomes an amplification factor: indeed, when tritium is incorporated into the nuclear DNA (with tritiated nucleotides), due to the short course of the rays, 70 % of the energy is deposited into the nucleus. The impact of Tritium on DNA integrity directly derives from the deposited energy and not from any chemical poisoning since tritium only generates water. However association with another contaminant, which affects cell response, can produce synergistic effects. Moreover, it is also possible that tritium incorporation engages cells in a response that could be inappropriate for a concomitant associated stress. Our project aimed to study the impact of contamination with tritium on cell survival, cell cycle, mutagenesis, HR and NHEJ. Moreover our project will study the impact of tritium contamination on the cell response to an additional independent and well controlled DSB. In 2005, we evaluate the impact of sub-lethal doses of contamination by 3H-thymidine on cell survival, cell cycle, DNA double-strand breaks (DSB), homologous recombination (HR) and mutagenesis, in hamster CHO cells.
2005 ACTIVITIES
Cells were cultured in the presence of different specific activities of labeled thymidine. After 20 hours, when incorporation reached a plateau and over 95% of cells contained labeled nucleotides, radioactivity incorporated into the DNA was counted in trichloroacetic acid (TCA) precipitates. In parallel cultures, cell cycle analysis, viability (cloning efficiency), γ-H2AX or Rad51 foci (immuno-fluorescence), mutagenesis and recombination frequency were measured (figure 1).
Figure 1 Contamination with 3H-nucleotides and measure of cell cycle, survival, mutagenesis and HR. Impact of mutation in DSB repair pathways. Measure of survival and HR Incorporation of 3H-thymidine did not significantly affect viability for doses lower than 105 dpm/106 cells. Higher incorporation resulted in a slight reduction of viability to 60 % (figure 2A). In previous studies, we and other have shown that ionizing radiation and DSBs stimulate HR in p53- cells (Lambert and Lopez, 2000; Liang et al., 1998; Saintigny et al., 1999; Wang et al., 1988) but at highly toxic doses (compare figures 3A and 3B). Indeed, γ-rays significantly induce HR but at doses leading 20 to 10% survival (figure 3B). In contrast, at poorly cytotoxic doses, strong HR induction was recorded for 3H-thymidine incorporation (figure 3C). Importantly, the HR plateau induction was reached for doses lower than 3.105 dpm/106 cells, i.e. for exposure allowing 80 % to 100 % survival (compare figures 3C and 2A). For doses allowing comparable levels of viability (80 to 100 %), no γ-rays-induced HR was recorded. Moreover, the maximum HR stimulation with highly cytotoxic γ-rays (6 Gy) was extremely low compared with the HR level induced by non-lethal contamination; such levels of HR induction cannot be reached with γ-rays since the extrapolated calculated doses would be too toxic (45 to 80 Gy).
Hot Thymidine (3H) Cold Thymidine
Incubation in culture medium (20h00)
Cells harvest and count
Incorporated activity in DNA (TCA)
Immunofluorescence (Rad51, γ-H2AX)
Homologous Recombination
Colony Forming Efficiency (survival )
Cell cycle analysis (FACS)
Mutagenesis

- 390 - Underlying Technology / Safety and Environment
Figure 2 Measure of cell cycle Cell cycle repartition was measured by classical methods. We showed that there is no effect on the cell cycle repartition of 3H-thymidine incorporation until 1.106 dpm/106 cells. From that dose and upper, we measured a G2/M phase arrest. The G2/M checkpoint is generally under control of ATM or ATR signaling pathways. Caffeine incubation is able to inhibited G2/M arrest induced by either ATR or ATM. The G2/M block induced by of 3H-thymidine incorporation was reversed by caffeine. Moreover, ATR signaling pathway inhibitor UCN-01 was able to inhibited G2/M arrest induced by 3H-thymidine. Theses results were also confirmed by using a ATM defective mutant cell line. Taken together, theses data show that the incorporation of high doses of 3H-thymidine (>1.106 dpm/106 cells) lead the cell to a G2/M arrest mediated by the ATR signaling pathway. Mutagenesis Mutagenesis was measured on two different loci: Na+/K+ pump ATPase, which monitors only point mutations, and HPRT which monitors both point mutations and long extent rearrangements. We measured a peak of point mutations for doses allowing 90 to 100 % of viability (≤ to 105 dpm/106 cells). Surprisingly, no mutations by long extent rearrangements were scored in our assay. Taken together, these results suggest that oxidative stress may be responsible for mutagenesis induced by low incorporation of 3H-thymidine. Impact of DSB repair mutants Since NHEJ mutants are highly sensitive to ionizing radiation, we measured the impact of labeled-thymidine
incorporation on viability of an NHEJ-defective cell line (XD17) mutated in the xrcc4 gene (figure 2B). Whereas the CHO-DRA10 and the X4V (XD17, complemented with the XRCC4 cDNA) exhibited similar viability, xrcc4- cells show significantly higher sensitivity to 3H-thymidine incorporation (figure 2B). At a dose of 2.105 dpm/106 cells, the viability of the xrcc4- cells was only 10 %, whereas it was 51 % and 82 % for XV4 and CHO-DRA10, respectively. The LD50 (Lethal Dose 50 %) dose was 7.104 dpm/106 cells for XD17 (xrcc4-) whereas it was 1.106 dpm/106 cells for XV4 or CHO-DRA10 (figure 2A and B). Thus xrcc4- cells are more than 14-fold more sensitive to the incorporation of 3H-thymidine, than control cells. Taken together, these data show that cells defective in DSB repair by NHEJ are more sensitive to labelled nucleotide incorporation. However, these results are highly consistent with the fact that 70 % of the tritium energy was deposited into the nucleus Effect of 3H-nucleotides contamination on gamma-H2Ax and Rad51 assembly (nuclear foci) γ-H2AX foci induction After radiation, histone H2AX is phosphorylated and assemble into nuclear foci at the DSB sites ((Aten et al., 2004) and for review (Redon et al., 2002)). The γ-H2AX foci formation may be monitored by immunological staining then scored. Since the results above suggested that 3H-thymidine induce DSBs, we thus analyzed the formation of γ-H2AX foci after incorporation of 3H-thymidine, at non-lethal doses (figure 4A). The percentage of cells with γ-H2AX foci increased as a function of incorporated 3H-thymidine but required more than 105 dpm/106 cells for detection (figure 4B). We then measured the mean number

- 391 - Underlying Technology / Safety and Environment
of γ-H2AX foci per cell, after 3H-thymidine contamination. Indeed, with γ-rays, a linear relationship exists between the number of γ-H2AX and the estimated number of DSBs (Rothkamm and Lobrich, 2003). This value will give us an extrapolated estimation of 3H-thymidine-induced DSBs.
In CHO-DRA10 cells line the mean number of foci/cell evolved from 5 to 12 for incorporated doses comprised between 1.104 to 5.105 dpm/106 cells (figure 4C).
Figure 3
Figure 4

- 392 - Underlying Technology / Safety and Environment
Figure 5 RAD51 foci induction After genotoxic stress, the pivotal HR protein Rad51 assembles into nuclear foci at DNA damage sites, associated with γ -H2AX irradiated chromosome domains, which are thus thought to represent recombination/repair centers (Haaf et al., 1995). Rad51 foci assembly seems to represent a pre-requisite since until now, no HR events are recorded when Rad51 assembly is impaired. We show here that 3H-thymidine contamination induced Rad51 foci assembly (figure 4). Rad51 foci began to be detectable at a dose of 3.104 dpm/106 cells, then reached a plateau with 50 % of cells containing Rad51 foci at 1.105 dpm/106. Importantly, the dose response of Rad51 foci assembly was highly consistent with those of HR induction (compare figure 4B and 2C). CONCLUSIONS
We have analyzed the impact of 3H-thymidine contamination at a molecular level. A precise subcellular compartment was targeted (the DNA molecule) and we identified some metabolic pathways responding to radioactive contamination, i.e. XRCC4 and RAD51 pathways. In addition, and very importantly, we show here that contamination by 3H-thymidine induced a tremendous stimulation of HR, even in the absence of cell mortality. Such a HR stimulation level cannot be reached with γ-rays, which mainly kill the cells. At the incorporated dose used here, strong genetic effects (mutagenesis or HR) were recorded but no toxicity was observed in CHO cells. The fact that NHEJ mutant cells show increased sensitivity and that HR is stimulated in CHO-DRA10 cells supports the result that incorporated 3H-thymidine produces DSB in the
DNA as scored by γ -H2AX foci induction. On the basis of these considerations, the results presented here show that cell contamination with non-toxic doses of tritium may be hazardous for genetic stability. Thus, the remarkable survival of these contaminated cells associated to genetics alterations may increase the risk of: 1 - transmission of genetic modifications to the next generation and 2 - increase the risk of cancer (cancer cell should accumulated mutations and be viable to generate a tumour). Our work emphasizes the strong differences between an external ionizing radiation exposure and an internal radioactive contamination on biological consequences. The concept of dose of internal contamination in radiation protection may be re-evaluted. REFERENCES
Aten, J. A., Stap, J., Krawczyk, P. M., van Oven, C. H., Hoebe, R. A., Essers, J., and Kanaar, R. (2004). Dynamics of DNA double-strand breaks revealed by clustering of damaged chromosome domains. Science 303, 92-95. Haaf, T., Golub, E. I., Reddy, G., Radding, C. M., and Ward, D. C. (1995). Nuclear foci of mammalian Rad51 recombination protein in somatic cells after DNA damage and its localization in synaptonemal complexes. Proc Natl Acad Sci U S A 92, 2298-2302. Lambert, S., and Lopez, B. S. (2000). Characterization of mammalian RAD51 double strand break repair using non lethal dominant negative forms. EMBO J 19, 3090-3099. Liang, F., Han, M., Romanienko, P. J., and Jasin, M. (1998). Homology-directed repair is a major double-strand break repair pathway in mammalian cells. Proc Natl Acad Sci U S A 95, 5172-5177.

- 393 - Underlying Technology / Safety and Environment
Redon, C., Pilch, D., Rogakou, E., Sedelnikova, O., Newrock, K., and Bonner, W. (2002). Histone H2A variants H2AX and H2AZ. Curr Opin Genet Dev 12, 162-169. Rothkamm, K., and Lobrich, M. (2003). Evidence for a lack of DNA double-strand break repair in human cells exposed to very low x-ray doses. Proc Natl Acad Sci U S A 100, 5057-5762. Saintigny, Y., Rouillard, D., Chaput, B., Soussi, T., and Lopez, B. S. (1999). Mutant p53 proteins stimulate spontaneous and radiation-induced intrachromosomal homologous recombination independently of the alteration of the transactivation activity and of the G1 checkpoint. Oncogene 18, 3553-3563. Wang, Y. Y., Maher, V. M., Liskay, R. M., and McCormick, J. J. (1988). Carcinogens can induce homologous recombination between duplicated chromosomal sequences in mouse L cells. Mol Cell Biol 8, 196-202. REPORTS AND PUBLICATIONS
Roche S., Saintigny Y., Meynard D. and Lopez B. S. Contamination with sub-lethal doses of labeled nucleotides (tritium or radiocarbone) induces double strand breaks and stimulates RAD51-dependant hyper-recombination in an inverse correlation with their energy. Paper to be submitted in 2006. Saintigny Y. Interaction du tritium sur la réponse aux stress génotoxiques et la stabilité du génome. 3ème séminaire annuel du programme de recherche pluridisciplinaire (programme national inter-organismes) en Toxicologie Nucléaire Environnementale (ToxNuc-E), December 2005. Campus Michel Ange du CNRS, Paris – France. Oral communication Saintigny Y., Roche S. and Lopez B. S. Impact d’une contamination au tritium sur la stabilité génétique. 6ème colloque des 3R, Réplication, Recombinaison et Réparation, June 2005. Giens – France.
TASK LEADER
Bernard S. LOPEZ DSV/DRR/SRMC/LMR CEA-Fontenay-aux-Roses 18, route du Panorama – BP 6 F-92265 Fontenay-aux-Roses Cedex Tel. : 33 1 46 54 88 35 Fax : 33 1 46 54 89 55 e-mail : [email protected]

- 394 - Underlying Technology / Safety and Environment

- 395 -
Task Area Site
CEFDA04-1177 Design Support & proc. Saclay
CEFDA01-645 Heating CadaracheCEFDA02-1003 Diagnostics CadaracheCEFDA03-1015 Magnets CadaracheCEFDA03-1044 Diagnostics CadaracheCEFDA03-1098 Design Support & proc. CadaracheCEFDA03-1111 Diagnostics CadaracheCEFDA03-1120 Magnets CadaracheCEFDA03-1129 Heating CadaracheCEFDA04-1127 Magnets CadaracheCEFDA04-1134 Magnets CadaracheCEFDA04-1138 PFC CadaracheCEFDA04-1140 Heating Project CadaracheCEFDA04-1146 Heating CadaracheCEFDA04-1161 EISS CadaracheCEFDA04-1180 Diagnostics CadaracheCEFDA04-1182 Heating Project CadaracheCEFDA04-1206PI Diagnostics CadaracheCEFDA04-1206MD Diagnostics CadaracheCEFDA04-1218 PFC CadaracheCEFDA04-1219 Magnets CadaracheCEFDA05-1243 PFC CadaracheCEFDA05-1248 PFC CadaracheCEFDA05-1261 PFC CadaracheCEFDA05-1271 Heating CadaracheJW5-AEP-CEA-26 PFC CadaracheTW1-TMS-PFCITE Magnets CadaracheTW4-TES-COLABA EISS CadaracheTW5-TMSF-HTSMAG Magnets CadaracheTW5-TPDC-IRRCER-D03 Diagnostics CadaracheTW5-TPHI-ICRFDEV Heating CadaracheTW5-TRP-002-D03a Reactor Study Cadarache
CEFDA04-1170 Magnets SaclayCEFDA04-1201 Magnets SaclayTW5-TMSF-HTSPER Magnets Saclay
CEFDA04-1215 Magnets Grenoble
TW2-TTBC-005-D01 Blanket/HCLL CadaracheTW3-TSS-LT4 Safety CadaracheUT-S&E-LiPbwater Safety Cadarache
CEADirection des Sciences de
la Matière
Département de Recherche sur la Fusion Contrôlée
Direction de l'Energie Nucléaire
Département d'Etude des Réacteurs
APPENDIX 1 : DIRECTIONS CONTRIBUTIONTO THE FUSION PROGRAMME
DRFC
DSM
Département d'Astrophysique,de Physique des Particules,
de Physique Nucléaireet de l'I nstrumentation
DAPNIA
DEN DER
DRFMCDépartement de Recherche
Fondamentale sur la Matière Condensée

- 396 -
TW2-TTBC-001-D01 Blanket/HCLL SaclayTW4-TRP-002-D02b Reactor Study SaclayTW4-TTBC-001-D01 Blanket/HCLL SaclayTW5-TSS-SEA3.5 Safety SaclayTW5-TTBC-001-D01 Blanket/HCLL SaclayTW5-TTBC-001-D02 Blanket/HCLL SaclayTW5-TTBC-001-D03 Blanket/HCLL SaclayTW5-TTBC-001-D06 Blanket/HCLL SaclayTW5-TTBC-001-D07 Blanket/HCLL SaclayTW5-TTBC-005-D01 Blanket/HCLL SaclayTW5-TTMA-001-D08 Material/SiC-SiC Saclay
CEFDA05-1226 Vessel SaclayTW1-TVP-CFC1 PFC SaclayTW2-TTMS-001b-D02 Material/RAFM SaclayTW3-TTMA-001-D04 Material/SiC-SiC SaclayTW3-TTMA-002-D04 Material/SiC-SiC SaclayTW4-TTMS-007-D02 Material/RAFM SaclayTW5-TTMS-005-D01 Material/RAFM SaclayTW5-TTMS-006-D01 Material/RAFM SaclayTW5-TTMS-007-D04 Material/RAFM SaclayTW5-TTMS-007-D21 Material/RAFM SaclayUT-TBM/MAT-LAM/Opti Material/RAFM SaclayUT-TBM/MAT-Micro Material/RAFM SaclayUT-TBM/MAT-Modpulse Material/RAFM Saclay
JW5-FT-3.2 Safety SaclayUT-S&E-LASER/DEC Safety Saclay
TW2-TTBC-002-D03 Blanket/HCLL CadaracheTW2-TTBC-005-D02 Blanket/HCLL CadaracheTW4-TSW-002 Safety CadaracheTW5-TSS-SEA5.3 Safety CadaracheTW5-TSS-SEA5.5 Safety CadaracheTW5-TSS-SEA5.6 Safety CadaracheUT-TBM/BB-He Blanket Cadarache
CEFDA04-1202 Vessel SaclayTW4-TVV-OSWELD Vessel SaclayTW5-TVV-MPUT Vessel Saclay
CEFDA02-583 PFC GrenobleCEFDA03-1029 PFC GrenobleCEFDA05-1257 PFC GrenobleTW2-TTBB-002b-D01 Blanket/HCPB GrenobleTW2-TTBC-002-D01 Blanket/HCLL GrenobleTW2-TTBC-002-D02 Blanket/HCLL SaclayTW2-TTBC-003-D05 Blanket/HCLL SaclayTW2-TTMS-004b-D01 Material/RAFM GrenobleTW2-TVV-ROBOT Vessel SaclayTW3-TVM-JOINT Vessel GrenobleTW4-TTMS-006-D03 Material/RAFM GrenobleTW4-TVV-Hybrid Vessel SaclayTW5-TTBC-002-D01 Blanket/HCLL SaclayTW5-TTMS-004-D02 Material/RAFM SaclayTW5-TTMS-004-D04 Material/RAFM SaclayTW5-TTMS-004-D06 Material/RAFM SaclayTW5-TTMS-004-D07 Material/RAFM SaclayTW5-TVD-CUCFC PFC GrenobleTW5-TVM-Braze Vessel GrenobleTW5-TVM-COMADA Vessel GrenobleUT-VIV/PFC-HIP PFC GrenobleUT-VIV/VV-Hybrid-Modeli Vessel Saclay
Direction de la Recherche Technologique
Département de Modélisationde Structures et Systèmes
Départementdes Technologiesde l'Hydrogène
DTA
DM2S
Département des Matériauxpour le Nucléaire
Départementde Physico-Chimie
DMN
DPC
DRT DETECSDépartement des
Technologies du Capteuret du Signal
DTH
Département des Technologies Nucléaires
DTN

- 397 -
TW5-TTBB-006-D04 Blanket/HCPB SaclayUT-VIV/PFC-NanoSic PFC Saclay
CEFDA04-1182RHpart Heating Project FontenayCEFDA05-1285 Reactor Study FontenayJW5-FT-3.2RHpart Safety FontenayTW4-TVR-RADTOL Remote Handling SaclayTW4-TVR-WHMAN Remote Handling FontenayTW5-TVR-AIA Remote Handling FontenayTW5-TVR-RADTOL Remote Handling SaclayTW5-TVR-WHMAN Remote Handling FontenayUT-VIV/AM-AIA Remote Handling FontenayUT-VIV/AM-ECIr Remote Handling SaclayUT-VIV/AM-Hydro Remote Handling Fontenay
UT-S&E-Tritium-Impact Safety Fontenay
UT-VIV/PFC-Damage PFC PessacUT-VIV/PFC-Pyro PFC Font romeu
TW5-TSS-SEA5.5 Safety Aix en Pce
EXTERNAL COLLABORATIONS
DTSIDépartement des
Technologies des Systèmes Intelligents
CNRS (French National Centre for Scientific Research)
Technicatome(Collaboration with CEA)
DTNM
Département des Technologies des NanoMatériaux
Direction desSciences du Vivant
DSV DRRDépartement de
Radiobiologie et de Radiopathologie

- 398 -

- 399 -
Unit Site Investigator
Physics Integration
Heating and Current Drive
CEFDA01-645 TW2-TPHN-NBDES1: Support to neutral beam physics and testing 1 DRFC Cadarache Svensson L.
CEFDA03-1129 TW3-TPHI-ICRDES1: ITER ICRF antenna and matching system design DRFC Cadarache Bosia G.
CEFDA05-1271 TW5-TPHI-ITERDES3 : Design of the ITER ICRF antenna for the Internal and external matching concepts
DRFC Cadarache Beaumont B.
TW5-TPHI-ICRFDEV Development of high performance capacitors for the ITER Ion Cyclotron array
DRFC Cadarache Vulliez K.
Diagnostics
CEFDA02-1003 TW2-TPDS-DIASUP4: Support to ITER diagnostic design: polarimetry, motional stark effect, bolometry, thermography
DRFC Cadarache Stott P.
CEFDA03-1111 TW3-TPDS-DIASUP1: Support to the ITER diagnostic system : bolometer, wide-angle viewing, calorimetry, q-profile determination, reflectometry and polarimetry
DRFC Cadarache Laviron C.
CEFDA04-1206PI TW4-TPDS-DIASUP1: Diagnostic design for ITER: Port Integration DRFC Cadarache Doceul L.
CEFDA04-1206MD TW4-TPDS-DIASUP1: Diagnostic design for ITER: Magnetic Diagnostics DRFC Cadarache Moreau Ph.
TW5-TPDC-IRRCER-D03 Assessment of IR fibres for thermography applications, initial gamma induced effects, then neutron irradiations - Fibre selection and provision, diagnostic preparation and measurements
DRFC Cadarache Reichle R.
Vessel-In Vessel
Vessel-Blanket and Materials
CEFDA04-1202 TW5-TVV-RFUT: Cooperation with Russian Federation in UT systems assessment
DETECS Saclay Tirira J.
CEFDA05-1226 TW5-TVM-LIP: Rules for design, fabrication and inspection - Modification of ITER materials documents, assessment of materials data and maintenance of a database
DMN Saclay Tavassoli F.
TW2-TVV-ROBOT Dynamic test rig for Intersector Welding Robot (IWR) for VV sector field joining
DTH Saclay Aubert P.
TW3-TVM-JOINT Characterisation of the CuCrZr/SS joint strength for different blanket manufacturing conditions
DTH Grenoble Gillia O.
TW4-TVV-Hybrid Further development of the hybrid MIG/Laser welding technique for VV sector field joining
DTH Saclay Aubert P.
TW4-TVV-OSWELD Simulation of phased array techniques for qualification UT methods for one sided welds during VV manufacture
DETECS Saclay Tirira J.
TW5-TVM-Braze Manufacture and characterization of silver free braze material DTH Grenoble Baffie T.
EFDA TECHNOLOGY PROGRAMME
APPENDIX 2 : ALLOCATIONS OF TASKS

- 400 -TW5-TVM-COMADA Investigations of the effect of creep-fatigue interaction on the mechanical
performance and lifetime of CuCrZrDTH Grenoble Gillia O.
TW5-TVV-MPUT Qualification of UT methods for one sided welds during VV manufacture - Weld structure
DETECS Saclay Tirira J.
Plasma Facing Components
CEFDA02-583 TW1-TVV-DES: Destructive examination of primary first wall panels and mock-ups
DTH Grenoble De Vito E.
CEFDA03-1029 TW3-TVB-JOINOP: Optimisation of Be/Cu alloy joints for primary first wall panels
DTH Grenoble Bucci P.
CEFDA04-1138 TW4-TVB-HFCSMU: High heat flux testing of optimised CuCrZr/SS mock-ups - 200 kW electron beam gun test
DRFC Cadarache Escourbiac F.
CEFDA04-1218 TW5-TVD-HHFT: Monitoring and analysis of divertor components tested in FE200 - 200 kW electron beam gun test
DRFC Cadarache Escourbiac F.
CEFDA05-1243 TW5-TVD-NDTEST: Upgrade of the SATIR test bed for infrared thermographic inspections
DRFC Cadarache Durocher A.
CEFDA05-1248 TW5-TVD-ACCEPT: Influence of carbon erosion on the acceptance criteria of the ITER divertor : ANSYS model for erosion
DRFC Cadarache Schlosser J.
CEFDA05-1257 TW5-TVB-JOINOP: Optimisation of Be/CuCrZr HIP joining for FW panels DTH Grenoble Frayssines P.E.
TW1-TVP-CFC1 Neutron effects on dimensional stability and thermal properties of CFCs DMN Saclay Bonal J.P.
TW5-TVD-CUCFC Development of alternative CFC/Cu joining techniques DTH Grenoble Chaumat V.
Remote Handling
TW5-TVR-AIA Articulated Inspection Arm (AIA) DTSI Fontenay Friconneau J.P.
TW4-TVR-RADTOL TW5-TVR-RADTOL
Radiation tolerance assessment of standard electronic components for Remote Handling
DTSI Saclay Giraud A.
TW4-TVR-WHMAN TW5-TVR-WHMAN
Developement of a water hydraulic manipulator DTSI Fontenay Friconneau J.P.
Magnet Structure & Integration
Magnet Structure
CEFDA03-1015 TW2-TMSM-COOLIN: Mock-ups for the TF and CS terminal regions and cooling inlets
DRFC Cadarache Decool P.
CEFDA03-1120 TW3-TMSC-ASTEST: Tests of advanced Nb3Sn strands: Extensive
characterization of industrial advanced Nb3Sn strands developed for ITER
TF coils system
DRFC Cadarache Zani L.
CEFDA04-1127 TW4-TMSC-SAMAN1: manufacture of subsize samples DRFC Cadarache Duchateau JL.
CEFDA04-1134 TW4-TMSC-BARBEN : Effect of bending strain on Nb3Sn strands - Study
of bending strain effect on critical properties of Nb3Sn strands jacketed with
stainless steel for various bending amplitudes and temperatures
DRFC Cadarache Zani L.
CEFDA04-1170 TW4-TMSC-RESDEV: Development and testing on new resin solution DAPNIA Saclay Rondeaux F.

- 401 -CEFDA04-1201 TW5-TMS-EDDES: European dipole design - accelerator type magnet DAPNIA Saclay Rifflet J.M.
CEFDA04-1215 TW4-TMSC-CRYOLA: Cryogenic tests on ITER magnet structural materials
DRFMC Grenoble Girard A.
CEFDA04-1219 TW4-TMSC-SAMFSS: Manufacture of two full size samples of Nb3Sn
strands
DRFC Cadarache Decool P.
TW1-TMS-PFCITE Poloidal Field Conductor Insert (PFCI) DRFC Cadarache Ciazynski D.
TW5-TMSF-HTSMAG Scoping studies of HTS fusion magnets DRFC Cadarache Duchateau J.L.
TW5-TMSF-HTSPER HTS materials for fusion magnets DAPNIA Saclay Rey J.M.
Tritium Breeding and Materials
Breeding Blanket
Helium Cooled Pebble Bed (HCPB) Blanket
TW2-TTBB-002b-D01 Blanket manufacturing techniques - First wall HIPping with open channels DTH Grenoble Rigal E.
TW5-TTBB-006-D04 HCPB Breeder and Neutrons Multiplier Materials - Procurement and characterization of Li2TiO3 pebbles with improved geometrical
characteristics
DTNM Saclay Lulewicz J.D.
Helium Cooled Lithium Lead (HCLL) Blanket
TW2-TTBC-001-D01 TBM design, integration and analysis - Blanket system design and analysis - Integration and testing in ITER
DM2S Saclay Gabriel F.
TW2-TTBC-002-D01 Blanket manufacturing technologies - Fabrication processes for HCLL and HCPB TBMs
DTH Grenoble Rigal E.
TW2-TTBC-002-D02 Blanket manufacturing technologies - Manufacturing and testing of mock-ups - Qualification samples for HCLL and HCPB TBMs
DTH Saclay Aubert P.
TW2-TTBC-002-D03 Testing of small-scale mocks-ups to qualify manufacturing technologies DTN Cadarache Cachon L.
TW2-TTBC-003-D05 Blanket manufacturing technologies - Coating qualification DTH Grenoble Aubert P.
TW2-TTBC-005-D01 Safety and licensing - Test Blanket Module (TBM) accidental safety study DER Cadarache Schmidt N.
TW2-TTBC-005-D02 TBM system detailed safety and licensing DTN Cadarache Lacressonnière C.
TW4-TTBC-001-D01 TBM design, integration and analysis - Testing programme and engineering design of the first TBM for ITER H-H phase
DM2S Saclay Salavy J.F.
TW5-TTBC-001-D01 TBM design, integration and analysis - Design and analyses of the HCLL TBM including design of supporting system and instrumentation integration
DM2S Saclay Rampal G.
TW5-TTBC-001-D02 TBM design, integration and analysisFinalization of the conceptual design of the prototypical HCLL TBM mock-up
DM2S Saclay Salavy J.F.
TW5-TTBC-001-D03 TBM design, integration and analysis - PIE and hot cell requirements for the HCLL TBM
DM2S Saclay Salavy J.F.
TW5-TTBC-001-D06 Further thermal-hydraulics and design study related to the choice of reference He cooling scheme for the HCLL TBM
DM2S Saclay Gabriel F.

- 402 -TW5-TTBC-001-D07 TBM design, integration and analysis
Detailed TBM development workplan up to EM-TBM installation in ITERDM2S Saclay Salavy J.F.
TW5-TTBC-002-D01 TBM manufacturing R&D - Diademo mock-up DTH Saclay De Dinechin G.
TW5-TTBC-005-D01 TBM design, integration and analysis - TBM HCLL instrumentation definition
DM2S Saclay Rampal G.
Structural Materials Development
Reduced Activation Ferritic Martensitic (RAFM) Steels
TW2-TTMS-001b-D02 Irradiation performance - Neutron irradiation to 70 dpa at 325°C and PIE DMN Saclay Alamo A.
TW2-TTMS-004b-D01 Qualification of fabrication processess - Tubing process qualification: advanced process development and testing for the production of TBM’s cooling channels
DTH Grenoble Rigal E.
TW4-TTMS-006-D03 ODS RAFM improvement - Elaboration of Eurofer ODS steels by internal oxidation
DTH Grenoble Cayron C.
TW4-TTMS-007-D02 Modelisation of irradiation effects - Ab-initio defect energy calculations in the Fe-He and Fe-He-C systems
DMN Saclay Willaime F.
TW5-TTMS-004-D02 Qualification of fabrication processes - Microstructural analysis and qualification of joints and welds from TBM mock-up fabrication
DTH Saclay De Dinechin G.
TW5-TTMS-004-D04 Qualification of fabrication processes - Characterization of welding distorsion of simplified welded mock-ups
DTH Saclay De Dinechin G.
TW5-TTMS-004-D06 Qualification of fabrication processes - Weldability of dissimilar tubes (Eurofer/SS316) by fusion butt welding with YAG laser
DTH Saclay De Dinechin G.
TW5-TTMS-004-D07 Qualification of fabrication processes - Weldability of homogeneous plates DTH Saclay Aubert P.
TW5-TTMS-005-D01 Rules for design, fabrication, inspection - Update Data Base and Appendix A of DEMO-SDC
DMN Saclay Tavassoli F.
TW5-TTMS-006-D01 Structural materials - High performance steels - improvement of fabrication process for ODS-EUROFER - Refinement of chemical composition and thermomechanical treatments with emphasis on the fabrication issues of larger batches
DMN Saclay Bougault A.
TW5-TTMS-007-D04 Modelisation of irradiation effect - Event-based Monte Carlo simulations of defect microstructure evolution of Iron containing C during resistivity recovery experiments
DMN Saclay Bocquet J.L.
TW5-TTMS-007-D21 Structutal materials - Modelisation of irradiation effects - Fusion-Relevant Materials Irradiation in Jannus for Multi-Scale Modelling Experimental Validation
DMN Saclay Barbu A.
Advanced Materials
TW3-TTMA-001-D04TW3-TTMA-002-D04
SiC/SiC ceramic composites and divertor and plasma facing materials DMN Saclay Alamo A.
TW5-TTMA-001-D08 Modelling of the mechanical behaviour of advanced 3D SiCf/SiC composite DM2S Saclay Guérin C.

- 403 -
Safety and Environment
TW3-TSS-LT4 Analysis of two dominant accidental sequences of the PPCS model D - Main physical phenomena and first assessment
DER Cadarache Raboin S.
TW4-TSW-002 Study on possible concrete detritiation DTN Cadarache Poletiko C.
TW5-TSS-SEA3.5 In-vessel safety - Mitigation of hydrogen and dust explosions DM2S Saclay Paillère H.
TW5-TSS-SEA5.3 Cryogenic experiments on the CEA EVITA facility DTN Cadarache Ayrault L.
TW5-TSS-SEA5.5 PAXITR validation effort on EVITA tests DTN + TA Cadarache + Aix en Pce
Ayrault L.
TW5-TSS-SEA5.6 Enhancement of the Pactiter computer code and related fusion specific experiments
DTN Cadarache Schindler P.
System studies
Power Plant Conceptual Studies (PPCS)
CEFDA05-1285 TW5-TRP-003: Segmentation and maintenance - Assessment and comparison of concepts
DTSI Fontenay Friconneau J.P.
TW4-TRP-002-D02b Conceptual design of a HCLL Reactor - Tritium control & management analysis, thermo-hydraulic and thermo-mechanical analyses
DM2S Saclay Gabriel F.
TW5-TRP-002-D03a Analysis of current profile control in tokamak reactor scenarios DRFC Cadarache Giruzzi G.
ITER Site Preparation
European ITER Site Studies
CEFDA04-1161TW4-TES-COLABA
European ITER Site Studies 4 - CadaracheCadarache site for ITER - Collaboration with Local Authorities
DRFC Cadarache Garin P.
Design Support and Procurement
CEFDA03-1098 TW3-TDS-MAG: Detailed engineering and manufacturing studies of the ITER magnet system: Poloidal Field (PF) coil windings and cold test assessment
DRFC Cadarache Libeyre P.
CEFDA04-1177 TW5-TDS-QA: EFDA quality assurance system for ITER relevant activities DSM Saclay Duc R.
JET
Physics Integration
Heating Systems
CEFDA04-1146 JW4-EP-ICRH: Contribution to ICRH component monitoring and management
DRFC Cadarache Chappuis P.Verger J. M.
Diagnostics
CEFDA03-1044CEFDA04-1180
JW3-EP-IRV and JW4-EP-IRV: Diagnostic enhancement - Development, follow-up of the procurement and performance of acceptance test
DRFC Cadarache Gauthier E.

- 404 -
Vessel/In-Vessel
Plasma Facing Components
CEFDA05-1261 JW5-BEP-CEA-28: ITER wall materials in JET - Support of the operator in designing JET PFC - Development of W coatings on CFC substrate
DRFC Cadarache Gauthier E.
JW5-AEP-CEA-26 R&D on W coating on CFC and bulk W tiles development in support of the ITER-like first wall experiment project
DRFC Cadarache Mitteau R.
Safety and Environment
JW5-FT-3.2 Design and construction of the system for laser detritiation of JET co-deposited layers
DPC Saclay Semerok A.
JW5-FT-3.2RHpart Design and construction of the system for laser detritiation of JET co-deposited layers - Remote handling expertise for laser detritiation
DTSI Fontenay Perrot Y.
Heating Systems Technology Project
CEFDA04-1140 TW4-THHN-ADSD2: Development of the negative ion source (arc driven) for the ITER neutral beam injectors for long pulse operation
DRFC Cadarache Boilson D.
CEFDA04-1182 TW4-THHN-IITF2: First ITER NBI and the ITER NB test facility - Progress in the design
DRFC Cadarache Hemsworth R.
CEFDA04-1182RHpart TW4-THHN-IITF2: First ITER NBI and the ITER NB test facility - RH design feasibility analysis of NBI inspection
DTSI Fontenay Friconneau J.P.
Vessel/In-Vessel
Vessel-Blanket and Materials
UT-VIV/VV-Hybrid-Modeli Optimisation of hybrid welding for VV manufacturing - Weldability of Eurofer homogeneous plates
DTH Saclay Aubert P.
Plasma Facing Components
UT-VIV/PFC-Damage Study of damage mechanisms in PFC CNRS-LCTS
Pessac Martin E.
UT-VIV/PFC-HIP Improvement of the reliability, performance and industrial relevancy of HIP processes for PFC components
DTH Grenoble Chabrol C.
UT-VIV/PFC-NanoSic Nano crystalline silicon carbide (SiC) - Mechanical properties of nanocrystalline SiC
DTNM Saclay Ténégal F.
UT-VIV/PFC-Pyro Application of a tricolour pyroreflectometer to plasma facing components in-situ infrared monitoring
CNRS-IMP Font Romeu Hernandez D.
Remote Handling
UT-VIV/AM-AIA Technologies for vacuum and temperature conditions for remote handling systems - Articulated Inspection Arm (AIA)
DTSI Fontenay Friconneau J.P.
UT-VIV/AM-ECIr Radiation effects on electronic components DTSI Fontenay Giraud A.
UT-VIV/AM-Hydro Technologies and control for remote handling systems DTSI Fontenay Friconneau J.P.
UNDERLYING TECHNOLOGY PROGRAMME

- 405 -
Tritium Breeding and Materials
Breeding Blanket
UT-TBM/BB-He Helium components technology - Problems and oulines of solutions DTN Cadarache Berton J.L.
Materials Development
Structural Materials
UT-TBM/MAT-LAM/Opti Development of novel reduced activation martensitic steels with improved creep properties
DMN Saclay De Carlan Y.
UT-TBM/MAT-Micro Microstructural evolution of Fe-C model alloy and Eurofer under 1 MeV electron irradiation with and without He pre-implantation
DMN Saclay Henry J.
UT-TBM/MAT-Modpulse Pulsed irradiation of the martensitic alloy Eurofer DMN Saclay Boulanger L.
Safety and Environment
UT-S&E-LASER/DEC Laser heating of complex graphite surfaces by high repetition rate nanosecond pulses
DPC Saclay Semerok A.
UT-S&E-LiPbwater Analysis of the consequences of a common failure of the Test Blanket Module and water blanket in ITER
DER Cadarache Cadiou T.
UT-S&E-Tritium-Impact Impact of contamination with tritium at cell level DRR Fontenay Lopez B.

- 406 -

- 407 -
EFDA TECHNOLOGY PROGRAMME
Physics Integration
Heating and Current DriveCEFDA01-645 Experimental results from the Cadarache 1 MV test bed with SINGAP
acceleratorsNuclear Fusion
L. Svensson, D. Boilson, H. P. L. de Esch, R. S. Hemsworth, A. Krylov
CEFDA01-645 Support to Neutral Beam Physics Design and Testing 1Final Report on EFDA Contract 01-645
L. Svensson, B. Esch, R.S. Hemsworth, P. Massmann
CEFDA03-1129 EFDA/03 –1129 Task final Report G. Bosia, S. Bremond, K. Vulliez
CEFDA03-1129 Invited paper to the 16th RF Topical Conference, Park City, (2005) L. Colas et al.
Diagnostics
CEFDA02-1003 Final report for the EFDA Contract 02-1003 Deliverable 2.3 ThermographyDIAG/NTT-2005.019
R. Reichle, S. Henry, J. Miggozzi, E. Thomas, C. Walker
CEFDA02-1003 Final report of the contract EFDA 02-1003 (Executive Summary)DIAG/NTT-2005.018#1
CEFDA02-1003 Polarimetry, Experimental study of plasma exposure of a corner cube reflectorDIAG/NTT-2005.003#1
C. Gil
CEFDA02-1003 Support to the ITER diagnostic design P.E. Stott, C. Laviron, J.C. Vallet, R. Reichle, C. Gil, P. Lotte
CEFDA03-1111 CEA internal intermediate report : ITER wide-angle viewing thermographic and visible system
Y. Corre, A. Geraud, D. Guilhem, D. Hernandez, J.B. Migozzi, J.J. Serra, E. Thomas, G. Vayakis, C. Walker
CEFDA03-1111 EFDA report on ITER position reflectometryDIAG/NTT-2005.025
F. Clairet, R. Sabot
CEFDA03-1111 q-profile determination in ITER from MSE measurementsDIAG/NTT-2005.013
P. Lotte
CEFDA04-1206MD Final Report Contract EFDA 04-1206 D6.3 Part I ITER magnetics diagnostic design study : Outer vessel tangential and normal coilsDIAG/NTT-2005.035
CEFDA04-1206MD Final Report Contract EFDA 04-1206 D6.3 Part II ITER magnetics diagnostic design study : External continuous RogowskiDIAG/NTT-2005.036
CEFDA04-1206MD Final Report Contract EFDA 04-1206 D6.3 Part III. ITER mag. diagnostic design study : Inner vessel partial and continuous flux loopsDIAG/NTT-2005.037
CEFDA04-1206PI Final report on diagnostic design for ITER port integrationPEFC/NTT-2005.014 Rev. 0 September 2005.
TW5-TPDC-IRRCER-D03 Concept for spectrally resolved ITER divertor thermography with fibresproc. 32th EPS Contr. Fusion and Plasma Physics, Tarragona, Spain, 27 June-1 July 2005, ECA 29A, P4.083 (2005).
R. Reichle et al.
APPENDIX 3 : REPORTS AND PUBLICATIONS

- 408 -
Vessel-In Vessel
Vessel-Blanket and Materials
CEFDA04-1202 Simulation of phased array technique for qualification of UT methods for one sided welds during VV manufactureSYSSC/05 RT0167/Rév. 0 October 2005
TW2-TVV-ROBOT Final report : Dynamic test rig for intersector welding robot (IWR) for VV sector field joining – Technical report – July 2005 - CEA/DRT/LITEN/DTEN/DL/2005/034
TW3-TVM-JOINT Characterization of the CuCrZr/SS junction strength for different blanket manufacturing conditions – Final reportCEA report : Rapport technique DTEN/DL/2005/027
O. Gillia, I. Chu, P. Lemoine
TW3-TVM-JOINT Fabrication of MOCK-UPS PH/S-8F & PH/S-9FCEA report : Rapport technique DTH/DR/2006/06
O. Gillia, I. Chu, J.-M. Leibold, P. Lemoine, F. Vidotto
TW4-TVV-HYBRID Further development of the hybrid MIG/laser welding technique for VV sector field joiningTechnical report DTEN/UTIAC/2005/058
G. de Dinechin, F. Janin
TW4-TVV-OSWELDTW5-TVV-MPUT
Simulation of phased array technique for qualification of UT methods for one sided welds during VV manufactureSYSSC/05 RT0167/Rév. 0 October 2005
TW5-TVM-Braze Manufacture and characterization of silver free braze material, Interim ReportTechnical Report DTEN/DR/2005/073, January 2006.
TW5-TVM-COMADA Intermediate ReportRapport Technique DTH/DL/2006/019, march 2006
O. Gillia, I. Chu, J.-M. Leibold, P. Lemoine, F. Vidotto
Plasma Facing Components
CEFDA02-583 Destructive examination of first wall mock-upsDTH/DR/2006/13 (2006)
E. De Vito
CEFDA03-1029 Optimisation of Be/Cu alloy joints for primary first wall panelsRapport technique DTH/DR/2006/021, march 2006.
P. Bucci, P.E. Frayssines, O. Gillia, J.M. Leibold, B. Ricetti, F. Vidotto
CEFDA05-1248 Experimental simulation of cascade failure effect on W and CFC flat tile armoured high heat flux componentsFusion Engineering and Design (2005)
F. Escourbiac et al.
CEFDA05-1248 Influence of the carbon erosion on the acceptance criteria of the iter divertor efda contract n°05-1248 intermediate report 1: ANSYS model for erosion simulationCFP/NTT-2005.013
TW5-TVD-CUCFC Development of alternative CFC / Cu joining techniques, Interim reportTechnical Report DTEN/DR/2005/065, December 2005.
Remote Handling
TW5-TVR-AIA Articulated Inspection Arm, Prototype module upgrade manufactureCEA/DTSI/SCRI/LPR/ 5RT.068-Issue 0
V. Bruno
TW4-TVR-WHMANTW5-TVR-WHMAN
Water hydraulic manipulator. Preliminary tests on a water hydraulic manipulatorDTSI/SRI/LTC/06RT005
O. David
Magnet StructureCEFDA03-1015 Deliverable 1: Intermediate report on TF cooling inlet design and
manufactureNote AIM/NTT/2005.014, 15/06/2005.
P. Decool, H. Cloez
CEFDA04-1127 EFDA contract TW4-TMSC-SAMAN1: First intermediate report on subsize sample manufactureOctober 2005 internal report AIM/NTT-2005.026
J.L. Duchateau, N. Dolgetta

- 409 -
CEFDA04-1134 Development of a controlled bending application method for investigating Nb3Sn jacketed strandSupercond. Sci. Technol. 18 S390–S395 (2005)
L. Zani, H. Cloez, M. Tena, A. Della Corte, L. Muzzi, A. Di Zenobio
CEFDA04-1201 Conceptuel Design of the 12.5 T Superconducting EFDA DipoleMagnet Technology Conference 19, Genoa, September 2005
A. Portone, E. Salpietro, L. Bottura, P. Bruzzone, W. Fietz, R. Heller, J-M. Rifflet, J. Lucas, F. Toral, S. Raff, P. Testoni
CEFDA04-1201 EFDA Dipole conceptual Design - Accelerator type magnetFinal report
H. Félice, P. Fazilleau, A. Payn, J.M. Rifflet, L. Quettier, M. Segreti
TW5-TMSF-HTSMAG Estimation of recycled power associated with cryogenic refrigeration power of a fusion reactor based on TORE SUPRA experiment and ITER designNucl. Fusion 46 (2006) S94-S99.
J.L Duchateau, J.Y. Journeaux, F. Millet
TW5-TMSF-HTSMAG First intermediate reportCEA Internal report AIM/NTT-2006.004 January 2006
J.L Duchateau et al.
Tritium Breeding and Materials
Breeding Blanket
Helium Cooled Pebble Bed (HCPB) Blanket
TW2-TTBB-002b-D01 First wall HIPing with open channels, final reportRapport technique DTH/DL/2006/20
E. Rigal et al.
TW5-TTBB-006-D04 In-pile behaviour of lithium meta-titanate in EXOTIC-9. Proceedings of CBBI-13, Santa Barbara (USA), December 2005 .
A. J. Magielsen, H. Hegeman, J. G. van der Laan, M. J. M. Peeters, J.D. Lulewicz, M. P. Stijkel
TW5-TTBB-006-D04 Procurement and characterization of Li2TiO3 pebbles with improved geometrical characteristics. Final report.Internal report CEA/DTEN/DL/2005/048. November 2005.
J.D. Lulewicz, S. Drolon
TW5-TTBB-006-D04 Status and perspective of the R&D on Ceramic Breeder Materials for testing in ITER TBMs.Presented at ICFRM-12, Santa Barbara (USA), December 2005.
A. Ying, M. Akiba, L.V. Boccaccini, S. Casadio, G. Dell’Orco, M. Enoeda, J.B. Hegeman, R. Knitter, J.D. Lulewicz, J. van der Laan, Z.Y. Wen
Helium Cooled Lithium Lead (HCLL) Blanket
TW2-TTBC-002-D01 Fabrication processes for HCLL and HCPB TBMs, final reportRapport technique DTEN/DL/2005/041, 27/10/2005
E. Rigal et al.
TW2-TTBC-003-D05 Design of anti–corrosion coatings for the application in the environment of fusion reactorsIntermediate Technical report DTH/2006/02, January 2006.
P. Aubert
TW2-TTBC-005-D01 ITER – Evaluation of HCLL-TBM thermal-mechanical behavior in case of LOCACEA/DEN/CAD/DER/SESI/LESA/NT DO 9 24/08/05
N. Schmidt
TW2-TTBC-005-D02 TBM system detailed safety and licensing DTN/STPA/LPC/2005/059, 17/01/2006
C. Lacressonnière, O. Gastaldi
TW4-TTBC-001-D01 European Helium Cooled Lithium Lead (HCLL) Test Blanket Module (TBM)Detailed Description Document (DDD), Draft 2, November 2005.
J-F. Salavy et al.
TW4-TTBC-001-D01 The Helium Cooled Lithium Lead blanket test proposal in ITER and requirements on Test Blanket Modules instrumentationFusion Engineering and Design 75-79 (2005) 951-955
A. Li Puma et al.
TW5-TTBC-001-D01 Design and analyses of the HCLL TBM including design of supporting system and instrumentation integrationCEA report SEMT/BCCR/RT/06-004/A
G. Rampal
TW5-TTBC-001-D07 Detailed TBM development workplan up to EM-TBM installation in ITERCEA report SERMA/RT/06-3816/A
J-F. Salavy
TW5-TTBC-005-D01 ITER TBM instrumentationtechnical note DTN/STPA/LTCG/2005-077
F. Witters

- 410 -
Structural Materials development
Reduced Activation Ferritic Martensitic (RAFM) Steels
TW2-TTMS-001b-D02 Mechanical properties of 9Cr martensitic steels and ODS-FeCr alloys after neutron irradiation at 325°C up to 42 dpaoral communication ICFRM-12, Santa Barbara, US, Dec.4-9 2005, to be published in J. of Nuclear Materials
A. Alamo, J.L. Bertin, P. Wident, V. Shamardin
TW2-TTMS-001b-D02 Post-irradiation examinations of materials irradiated in BOR 60 reactor at 325°C up to 42 dpa. Final Report TW2-TTMS-001b-D02CEA report DMN/SRMA/2005-2767/A, March 2006
A. Alamo, P. Wident, V. Shamardin
TW2-TTMS-004b-D01 Tubing process qualification: advanced process development and testing for the production of TBM’s cooling channels, Final reportNote technique DTEN/DL/2005/042, 18/11/2005
E. Rigal
TW4-TTMS-006-D03 Elaboration of Eurofer ODS steels by internal oxidation (feasibility study)rapport technique DTEN/DL/2005/049, 25.11.2005
C. Cayron
TW4-TTMS-007-D02 Ab initio study of helium in α-Fe: dissolution, migration and clustering with vacanciesPhys. Rev. B 72, 064117 (2005)
C. C. Fu and F. Willaime
Advanced materials
TW5-TTMA-001-D08 Implementation in CAST3M of new models developed at ONERA for SiCf/SiC composite. Comparison of CAST3M and Zebulon Results. Tests and application to the case of a divertorReport DM2S/SEMT/RT/05-034
N. Carrère, J. F. Maire, F. Laurin, O. Fandeur, C. Guerin
TW5-TTMA-001-D08 Modélisation multi-échelles des composites SiCf/SiC. Définition des potentiels thermodynamiques et de dissipation pour les différents constituants du composites SiCf/SiCONERA Report RT 1/09795/DMSE – Mars 2005.
J. F. Maire, N. Carrère
TW5-TTMA-001-D08 Modélisation multi-échelles des composites SiCf/SiC. Fourniture des éléments nécessaires à l’implémentation d’une méthode de changement d’échelle pour les passages micro-méso et méso-macro adaptée au SiCf/SiCONERA Report RT 2/09795/DMSE – Décembre 2005.
N. Carrère, J. F. Maire, F. Laurin
TW5-TTMA-001-D08 Multi-scale modelling of the thermo-mechanical behaviour of SiCf/SiC advanced composite. Definition of the constitutive laws and gathering of the data necessary for the implementation in CAST3MDM2S/SEMT/LM2S/RT/05-016/A.
C. Rospars, N. Carrere, J. F. Maire, C. Guerin
Safety and EnvironmentTW3-TSS-LT4 Analysis of two dominant accident sequences of the PPCS model D :
main physical phenomena and first assessmentCEA/DEN/CAD/DER/SESI/LESA/NT DO 19 13 October 2005
S. Raboin
TW5-TSS-SEA3.5 Desk study on available methods and strategies for mitigation of H2/dust explosionsTechnical Report CEA SFME/LTMF/RT/05-059/A. January 2006.
I. Tkatschenko
TW5-TSS-SEA3.5 Detailed proposal of a CEA R&D programme for 2005-2008 to deal with H2 and dust explosions issues and associated mitigation strategies,Report sent to EFDA in February 2005
H. Paillère
TW5-TSS-SEA3.5 Status and future needs of development and validation of CAST3M codeTechnical Report SFME/LTMF/RT/06-004/A. January 2006.
H. Paillère et al.
TW5-TSS-SEA5.3 EVITA - Intermediate report on test matrix planned for 2005Technical note, DTN/STPA/LTCG NT 05-007, 01/2005, CEA, France
L. Ayrault, F. Challet
TW5-TSS-SEA5.3 Evita - Results of the cryogenic tests 7.xx – Kinetics of the ice layer formationTechnical note, DTN/STPA/LTCG NT 05-037, 11/2005, CEA, France.
L. Ayrault

- 411 -
TW5-TSS-SEA5.5 Evita PAXITR 2: Fifth set of calculations on the EVITA facilityTechnical note, TA410161 ind A, 12/2005, Technicatome, France
L. Lo-Ré
TW5-TSS-SEA5.6 EUROCORR 2005 Lisbonne 4-8 September 2005 P. Schindler, V. Blet, L. Di Pace
TW5-TSS-SEA5.6 On the erosion-corrosion in ITER, water chemistry and the PACTITER code developmentShort memo–EFDA-CSU garching-Field Safety and Environment-07/12/2005
V. Massaut
TW5-TSS-SEA5.6 On the feasibility of Cu release rate measurement in the CORELE LoopCEATechnical Report DTN/STRI/LTCD 06-02, 2006/01
P.Schindler, V. Blet
System Studies
Power Plant Conceptual Studies (PPCS)
TW4-TRP-002-D02b Assesment of tritium control in PPCS AB blanket systemCEA Report, DM2S/SERMA/LCA/RT/05-3614.
W. Farabolini et al.
TW4-TRP-002-D02b Tritium Control Modeling in a Helium-Cooled Lithium-Lead Blanket for a Fusion PowerReactor, Fus. Eng. & Design, vol 81, 2006, pp.753-762.
W. Farabolini et al.
ITER Site Preparation
European ITER Site Studies
CEFDA04-1161TW4-TES-COLABA
EISS4 M1 report delivered in January 2005EISS4 M2 report delivered in March 2005EISS4 final report delivered in March 2006Contract n° FU06-CT-2004-00120 (RPrS written by EFET)
Design Support and ProcurementCEFDA03-1098 Report on Detailed Engineering studies of PF windings
Task CEA 03-1098, Subtask MAGCEA1, ALSTOM Magnets and Superconductors, TR-041001A, 17/03/05
CEFDA03-1098 Proposals for Cold Testing of the ITER TF coilsMagnet Technology Conference 19, Genoa, 18-23/09/05
P. Libeyre et al.
CEFDA04-1177 Configuration Management and Change ControlEFDA/QA 006
CEFDA04-1177 Information, documents and records controlEFDA/QA 005
CEFDA04-1177 Internal Control and AuditEFDA/QA 004
CEFDA04-1177 Non Conformance management, Preventive and Corrective ActionsEFDA/QA 008
CEFDA04-1177 Organization and ResponsibilitiesEFDA/QA 002
CEFDA04-1177 Procurement managementEFDA/QA 007
CEFDA04-1177 Quality Management in Construction ContractsEFDA/QA 106
CEFDA04-1177 Quality Management in Design ContractsEFDA/QA 102
CEFDA04-1177 Quality Management in Integration ContractsEFDA/QA 104
CEFDA04-1177 Quality Management in Manufacture ContractsEFDA/QA 103
CEFDA04-1177 Quality Management in R&D ContractsEFDA/QA 101
CEFDA04-1177 Quality Management in Tests and Acceptance ContractsEFDA/QA 105

- 412 -
CEFDA04-1177 Quality Manual EFDA/QA 001
CEFDA04-1177 Resources ManagementEFDA/QA 003
JET Technology
Physics Integration
Heating Systems
CEFDA04-1146 Contribution to the manufacturing monitoring of the ITER like inner VTL for the ICRH Antenna at MECAGESTCEA DRFC report PEFC/CRM 2006/003
Diagnostics
CEFDA03-1044CEFDA04-1180
description of the acceptance tests of the IRV endoscopeDIAG/NTT-2005.027 (2005)
E. Gauthier
CEFDA03-1044CEFDA04-1180
Minutes on meeting at CEDIP on 13th January 2005DIAG/CRR-2005.004 (2005)
E. Gauthier
CEFDA03-1044CEFDA04-1180
Minutes on meeting at TNO on 28th January 2005 DIAG/CRR-2005.006 (2005)
E. Gauthier
CEFDA03-1044CEFDA04-1180
Report on CEDIP acceptance tests performed at JET from 7th to 13th July 2005DIAG/NTT-2005.028 (2005)
E. Gauthier, H. Roche
CEFDA03-1044CEFDA04-1180
Report on the tests at JET with the JET EP IR camera on 21st -25th Feb 2005DIAG/NTT-2005.009 (2005)
E. Gauthier, H. Roche
CEFDA03-1044CEFDA04-1180
Review of the JET-EP IRV endoscope status on 3 June 2005 by TNODIAG/PPT-2005.001 (2005)
E. Gauthier
CEFDA03-1044CEFDA04-1180
Wide-angle infrared thermography for JET-EP32nd EPS Conference on Controlled Fusion and Plasma Physics (2005)
E. Gauthier, Ph. Chappuis, L. Doceul, D. Guilhem, M. Missirlian, H. Roche, E. Thomas, P. Andrew
Vessel-In Vessel
Plasma Facing Components
JW5-AEP-CEA-26 Lockin thermography and scanning electron microscope analysis of tungsten coatings on carbon composite from Euratom-Mec associationCFP/NTT-2005.030
R. Mitteau, X. Courtois
JW5-AEP-CEA-26 JET ITER-like wall Lock-in thermography NDT on samples before HHF testingCFP/NTT-2006.004
X. Courtois
JW5-AEP-CEA-26 Lock-in thermography NDT applied to W coated tiles: Modelling with quadripoles methodCFP/NTT-2005.015 (2005)
X. Courtois, R. Mitteau
JW5-AEP-CEA-26 W coated JET tiles NDE Lock-In thermography IndustrialisationCFP/NTT-2005.025 (2005)
X. Courtois
Safety and Environment
JW5-FT-3.2 Laser detritiation and co-deposited layer characterisation for future ITER installationENC Proceedings, Versailles, France, 2005.
A. Semerok, F. Brygo, S.V. Fomichev, F. Champonnois, J.-M. Weulersse, P.-Y. Thro, P. Fichet, Ch. Grisolia
JW5-FT-3.2RHpart Remote Handling expertise for JET detritiationCEA/DTSI/SCRI/LPR/ 5RT.093-Issue 0, 2005 report
Heating Systems Technology ProjectCEFDA04-1140 Characterisation of the ITER model negative ion source during long
pulse operation . To be published in Rev. Sci. Inst., Vol. 77 (2005)R. S. Hemsworth, D. Boilson, B. Crowley, D. Homfray, H. P. L. de Esch, A. Krylov, L. Svensson

- 413 -
CEFDA04-1140 EFDA contract Final report CEFDA04-1140CEA report IDN/NTT-2005.006
D. Boilson
CEFDA04-1182RHpart Feasibility of an inspection deviceDTSI/SCRI/LPR/05RT.072
UNDERLYING TECHNOLOGY PROGRAMME
Vessel-In Vessel
Vessel-Blanket and Materials
UT-VIV/VV-Hybrid-Modeli Intermediate report : Simulation of Hybrid processTechnical report DTEN/DL/2005/039 - November 2005
F. Gabriel
Plasma Facing Components
UT-VIV/PFC-Damage Endommagement et rupture dans les assemblages des composants face au plasma, Analyse des mécanismes d’endommagement de l’assemblage à l’échelle macroscopique : Analyse des mécanismes d’amorçage, Rapport 3b, Projet P6, 01/12/05
C. Henninger, D. Leguillon
UT-VIV/PFC-Damage Endommagement et rupture dans les assemblages des composants face au plasma, Analyse des mécanismes d’endommagement de l’assemblage à l’échelle macroscopique : Modélisation de la propagation interfaciale, Rapport 3c, Projet P6, 01/12/05
E. Martin, T. Marceau, D. Quesada
UT-VIV/PFC-Damage Endommagement et rupture dans les assemblages des composants face au plasma, Analyse des mécanismes d’endommagement de l’assemblage à l’échelle microscopique : Observations des tuiles endommagées, Rapport 2b, Projet P6, 01/12/05
E. Martin, T. Marceau , D. Quesada, G. Delsouc
UT-VIV/PFC-Damage Endommagement et rupture dans les assemblages des composants face au plasma, Identification d’un modèle de comportement pour les matériaux 3D C/C : mise au point de l’essai de cisaillement plan , Rapport 1b, Projet P6, 01/12/05
G. Camus
UT-VIV/PFC-HIP Improvement of the reliability, performance and relevancy of HIP processes for PFC componentsrapport technique DTH/DL/2006/022, march 2006.
PE Frayssines, E. Rigal, O. Gillia C. Chabrol, J.M. Leibold, B. Riccetti, F. Vidotto
UT-VIV/PFC-NanoSic Elaboration de céramiques nanostructurées en SiC pour les applications nucléairesColloque SF2M poudres et matériaux frittés 2005, Cherbourg (2005)
C. Mengeot, F. Ténégal, S. Poissonnet, L. Boulanger, M. Dormeval
UT-VIV/PFC-NanoSic Elaboration of nanostructured ceramics in silicon carbide for nuclear applicationsECERS 2005, Portoroz, Slovenia (2005)
C. Mengeot, F. Ténégal, S. Poissonnet, L. Boulanger, M. Dormeval
UT-VIV/PFC-NanoSic Nanocrystalline silicon carbide (SiC): 2005 interim reportCEA report, DTEN/DL/2005/030 (2005)
F. Ténégal
UT-VIV/PFC-NanoSic Nanocrystalline silicon carbide (SiC): Mechanical properties at high temperatureCEA report, DTEN/DL/2005/65 (2005)
F. Ténégal
UT-VIV/PFC-NanoSic Pilote nanopoudres par pyrolyse laser: vers une production de masse à très grande échelleColloque SF2M poudres et matériaux frittés 2005, Cherbourg (2005)
F. Ténégal, B. Guizard, C. Mengeot, L. Boulanger, F. Schuster
UT-VIV/PFC-Pyro A new concept to determine the true temperature of opaque materials using a tricolor pyroreflectometerReview of Scientific Instruments, Vol 76, 024904, pp1-7, 2005
D. Hernandez
Remote Handling
UT-VIV/AM-AIA Articulated Inspection Arm, Prototype module test reportCEA/DTSI/SCRI/LPR/05RT.098-Issue 0
D. Keller and V. Bruno
UT-VIV/AM-Hydro Characterization of water hydraulics pressure servovalve prototypesDTSI/SRI/LTC/06RT006
UT-VIV/AM-Hydro Progress report DTSI/SCRI/LPR/05RT080

- 414 -
Tritium Breeding and Materials
Breeding Blanket
UT-TBM/BB-He Preliminary Testing of Critical Technologies for Helium Technological Ring for High Temperature Gas Cooled System Technology DevelopmentGlobal 2005.
G. Laffont et al.
UT-TBM/BB-He Report of experiments on helium technology with static benches -year 2005CEA Technical report NT DEN/DTN/STPA/LTCG/05-076. Dec 2005
F. Witters
UT-TBM/BB-He Tribomètre He – Frottement homogène de revêtement CERMET Cr3C2-NiCr sur sous couche NiCrAlYCEA Technical report NT DEN/DTN/STPA/LTCG/05-054. Dec. 2005.
L. Cachon
Materials Development
Structural Materials
UT-TBM/MAT-LAM/OPTI Intermediate report on the development of novel reduced activation martensitic steels with improved creep properties for fusion reactorsCEA report, DMN/SRMA/LA2M/NT/05-2751
D. Gaude-Fugarolas, Y. De Carlan
UT-TBM/MAT-LAM/OPTI Progress in Fabrication of Experimental 9Cr Steel Compositions Optimised for Creep Resistance, Proposed SolutionsCEA report, DMN/SRMA/LA2M/NT/04-2642/A
V. A. Yardley
UT-TBM/MAT-Modpulse Annealing of Eurofer irradiated at 350°CCEA report, NT DEN/SAC/DMN/SRMP 2005-04
L. Boulanger and Y. Serruys
UT-TBM/MAT-Modpulse Monotonous long time irradiation of Eurofer at 350 and 550°CCEA report, NT DEN/SAC/DMN/SRMP 2005-20
L. Boulanger and Y. Serruys
Safety and EnvironmentUT-S&E-LASER/DEC Laser detritiation and co-deposited layer characterisation for future
ITER installationENC Proceedings, Versailles, France, 2005.
A. Semerok, F. Brygo, S.V. Fomichev, F. Champonnois, J.-M. Weulersse, P.-Y. Thro, P. Fichet, Ch. Grisolia
UT-S&E-LASER/DEC Laser heating of complex graphite surface by high repetition rate nanosecond pulsesCEA Report, DPC/SCP/LILM/2006/170-A, 36 pages.
A. Semerok, S.V. Fomichev, F. Brygo, J.M. Weulersse, P.-Y. Thro
UT-S&E-tritium-impact Impact d’une contamination au tritium sur la stabilité génétique6ème colloque des 3R, Réplication, Recombinaison et Réparation, June 2005. Giens – France
Y. Saintigny, S. Roche, B.S. Lopez
UT-S&E-tritium-impact Interaction du tritium sur la réponse aux stress génotoxiques et la stabilité du génome3ème séminaire annuel du programme de recherche pluridisciplinaire (programme national inter-organismes) en Toxicologie Nucléaire Environnementale (ToxNuc-E), December 2005. Campus Michel Ange du CNRS, Paris – France. Oral communication
Y. Saintigny

- 415 -
Task Title Prog. Field Area Unit Site Task Leader Page
CEFDA01-645 TW2-TPHN-NBDES1: Support to neutral beam physics and testing 1 EFDA PI Hea DRFC Cadarache Svensson L. 5
CEFDA02-1003TW2-TPDS-DIASUP4: Support to ITER diagnostic design: polarimetry, motional stark effect, bolometry, thermography
EFDA PI Diag DRFC Cadarache Stott P. 21
CEFDA02-583TW1-TVV-DES: Destructive examination of primary first wall panels and mock-ups
EFDA VIV PFC DTH Grenoble De Vito E. 75
CEFDA03-1015TW2-TMSM-COOLIN: Mock-ups for the TF and CS terminal regions and cooling inlets
EFDA MAG MAG DRFC Cadarache Decool P. 121
CEFDA03-1029TW3-TVB-JOINOP: Optimization of Be/Cu alloy joints for primary first wall panels
EFDA VIV PFC DTH Grenoble Bucci P. 79
CEFDA03-1044CEFDA04-1180
JW3-EP-IRV and JW4-EP-IRV: Diagnostic enhancement - Development, follow-up of the procurement and performance of acceptance test EFDA PI Diag DRFC Cadarache Gauthier E. 309
CEFDA03-1098TW3-TDS-MAG: Detailed engineering and manufacturing studies of the ITER magnet system: Poloidal Field (PF) coil windings and cold test assessment
EFDA DSP DSP DRFC Cadarache Libeyre P. 301
CEFDA03-1111TW3-TPDS-DIASUP1: Support to the ITER diagnostic system : bolometer, wide-angle viewing, calorimetry, q-profile determination, reflectometry and polarimetry
EFDA PI Diag DRFC Cadarache Laviron C. 25
CEFDA03-1120
TW3-TMSC-ASTEST: Tests of advanced Nb3Sn strands: Extensive
characterization of industrial advanced Nb3Sn strands developed for ITER
TF coils system
EFDA MAG MAG DRFC Cadarache Zani L. 127
CEFDA03-1129 TW3-TPHI-ICRDES1: ITER ICRF antenna and matching system design EFDA PI Hea DRFC Cadarache Bosia G. 9
CEFDA04-1127 TW4-TMSC-SAMAN1: manufacture of subsize samples EFDA MAG MAG DRFC Cadarache Duchateau JL. 131
CEFDA04-1134
TW4-TMSC-BARBEN : Effect of bending strain on Nb3Sn strands - Study
of bending strain effect on critical properties of Nb3Sn strands jacketed
with stainless steel for various bending amplitudes and temperatures
EFDA MAG MAG DRFC Cadarache Zani L. 135
CEFDA04-1138TW4-TVB-HFCSMU: High heat flux testing of optimised CuCrZr/SS mock-ups - 200 kW electron beam gun test
EFDA VIV PFC DRFC Cadarache Escourbiac F. 85
CEFDA04-1140TW4-THHN-ADSD2: Development of the negative ion source (arc driven) for the ITER neutral beam injectors for long pulse operation
EFDA HSTP HSTP DRFC Cadarache Boilson D. 323
CEFDA04-1146JW4-EP-ICRH: Contribution to ICRH component monitoring and management
EFDA PI HEA DRFC CadaracheChappuis P. and Verger J. M.
307
CEFDA04-1161TW4-TES-COLABA
European ITER Site Studies 4 - Cadarache - Cadarache site for ITER - Collaboration with Local Authorities
EFDA ISP EISS DRFC Cadarache Garin P. 297
CEFDA04-1170 TW4-TMSC-RESDEV: Development and testing on new resin solution EFDA MAG MAG DAPNIA Saclay Rondeaux F. 139
CEFDA04-1177TW5-TDS-QA: EFDA quality assurance system for ITER relevant activities
EFDA DSP DSP DSM Saclay Duc R. 305
CEFDA04-1182TW4-THHN-IITF2: First ITER NBI and the ITER NB test facility - Progress in the design
EFDA HSTP HSTP DRFC Cadarache Hemsworth R. 327
CEFDA04-1182RHpartTW4-THHN-IITF2: First ITER NBI and the ITER NB test facility - RH design feasibility analysis of NBI inspection
EFDA HSTP HSTP DTSI Fontenay Friconneau J.P. 331
CEFDA04-1201 TW5-TMS-EDDES: European dipole design - accelerator type magnet EFDA MAG MAG DAPNIA Saclay Rifflet J.M. 141
APPENDIX 4 : CEA TASKS IN ALPHABETICAL ORDER

- 416 -
Task Title Prog. Field Area Unit Site Task Leader Page
CEFDA04-1202TW5-TVV-RFUT: Cooperation with Russian Federation in UT systems assessment
EFDA VIV V/B DETECS Saclay Tirira J. 39
CEFDA04-1206MD TW4-TPDS-DIASUP1: Diagnostic design for ITER: Magnetic Diagnostics EFDA PI Diag DRFC Cadarache Moreau Ph. 31
CEFDA04-1206PI TW4-TPDS-DIASUP1: Diagnostic design for ITER: Port Integration EFDA PI Diag DRFC Cadarache Doceul L. 27
CEFDA04-1215TW4-TMSC-CRYOLA: Cryogenic tests on ITER magnet structural materials
EFDA MAG MAG DRFMC Grenoble Girard A. 145
CEFDA04-1218TW5-TVD-HHFT: Monitoring and analysis of divertor components tested in FE200 - 200 kW electron beam gun test
EFDA VIV PFC DRFC Cadarache Escourbiac F. 89
CEFDA04-1219TW4-TMSC-SAMFSS: Manufacture of two full size samples of Nb3Sn
strandsEFDA MAG MAG DRFC Cadarache Decool P. 147
CEFDA05-1226TW5-TVM-LIP: Rules for design, fabrication and inspection - Modification of ITER materials documents, assessment of materials data and maintenance of a database
EFDA VIV V/B DMN Saclay Tavassoli F. 43
CEFDA05-1243TW5-TVD-NDTEST: Upgrade of the SATIR test bed for infrared thermographic inspections
EFDA VIV PFC DRFC Cadarache Durocher A. 93
CEFDA05-1248TW5-TVD-ACCEPT: Influence of carbon erosion on the acceptance criteria of the ITER divertor : ANSYS model for erosion
EFDA VIV PFC DRFC Cadarache Schlosser J. 99
CEFDA05-1257TW5-TVB-JOINOP: Optimization of Be/CuCrZr HIP joining for FW panels
EFDA VIV PFC DTH Grenoble Frayssines P.E. 101
CEFDA05-1261JW5-BEP-CEA-28: ITER wall materials in JET - Support of the operator in designing JET PFC - Development of W coatings on CFC substrate
EFDA VIV PFC DRFC Cadarache Gauthier E. 311
CEFDA05-1271TW5-TPHI-ITERDES3 : Design of the ITER ICRF antenna for the Internal and external matching concepts
EFDA PI Hea DRFC Cadarache Beaumont B. 13
CEFDA05-1285TW5-TRP-003: Segmentation and maintenance - Assessment and comparison of concepts
EFDA SS PPCS DTSI Fontenay Friconneau J.P. 285
JW5-AEP-CEA-26R&D on W coating on CFC and bulk W tiles development in support of the ITER-like first wall experiment project
EFDA VIV PFC DRFC Cadarache Mitteau R. 313
JW5-FT-3.2Design and construction of the system for laser detritiation of JET co-deposited layers
EFDA S&E Safety DPC Saclay Semerok A. 317
JW5-FT-3.2RHpartDesign and construction of the system for laser detritiation of JET co-deposited layers - Remote handling expertise for laser detritiation
EFDA S&E Safety DTSI Fontenay Perrot Y. 321
TW1-TMS-PFCITE Poloidal Field Conductor Insert (PFCI) EFDA MAG MAG DRFC Cadarache Ciazynski D. 151
TW1-TVP-CFC1 Neutron effects on dimensional stability and thermal properties of CFCs EFDA VIV PFC DMN Saclay Bonal J.P. 103
TW2-TTBB-002b-D01 Blanket manufacturing techniques - First wall HIPing with open channels EFDA TBM HCPB DTH Grenoble Rigal E. 161
TW2-TTBC-001-D01TBM design, integration and analysis - Blanket system design and analysis - Integration and testing in ITER
EFDA TBM HCLL DM2S Saclay Gabriel F. 167
TW2-TTBC-002-D01Blanket manufacturing technologies - Fabrication processes for HCLL and HCPB TBMs
EFDA TBM HCLL DTH Grenoble Rigal E. 171
TW2-TTBC-002-D02Blanket manufacturing technologies - Manufacturing and testing of mock-ups - Qualification samples for HCLL and HCPB TBMs
EFDA TBM HCLL DTH Saclay Aubert P. 175
TW2-TTBC-002-D03 Testing of small-scale mocks-ups to qualify manufacturing technologies EFDA TBM HCLL DTN Cadarache Cachon L. 179
TW2-TTBC-003-D05 Blanket manufacturing technologies - Coating qualification EFDA TBM HCLL DTH Grenoble Aubert P. 181
TW2-TTBC-005-D01 Safety and licensing - Test Blanket Module (TBM) accidental safety study EFDA TBM HCLL DER Cadarache Schmidt N. 185
TW2-TTBC-005-D02 TBM system detailed safety and licensing EFDA TBM HCLL DTN CadaracheLacressonnière C.
191
TW2-TTMS-001b-D02 Irradiation performance - Neutron irradiation to 70 dpa at 325°C and PIE EFDA TBM RAFM DMN Saclay Alamo A. 221

- 417 -
Task Title Prog. Field Area Unit Site Task Leader Page
TW2-TTMS-004b-D01Qualification of fabrication processess - Tubing process qualification: advanced process development and testing for the production of TBM’s cooling channels
EFDA TBM RAFM DTH Grenoble Rigal E. 225
TW2-TVV-ROBOTDynamic test rig for Intersector Welding Robot (IWR) for VV sector field joining
EFDA VIV V/B DTH Saclay Aubert P. 49
TW3-TSS-LT4Analysis of two dominant accidental sequences of the PPCS model D - Main physical phenomena and first assessment
EFDA S&E Safety DER Cadarache Raboin S. 263
TW3-TTMA-001-D04TW3-TTMA-002-D04
SiC/SiC ceramic composites and divertor and plasma facing materials EFDA TBM ADV DMN Saclay Alamo A. 257
TW3-TVM-JOINTCharacterisation of the CuCrZr/SS joint strength for different blanket manufacturing conditions
EFDA VIV V/B DTH Grenoble Gillia O. 51
TW4-TRP-002-D02bConceptual design of a HCLL Reactor - Tritium control & management analysis, thermo-hydraulic and thermo-mechanical analyses
EFDA SS PPCS DM2S Saclay Gabriel F. 289
TW4-TSW-002 Study on possible concrete detritiation EFDA S&E Safety DTN Cadarache Poletiko C. 267
TW4-TTBC-001-D01TBM design, integration and analysis - Testing programme and engineering design of the first TBM for ITER H-H phase
EFDA TBM HCLL DM2S Saclay Salavy J.F. 195
TW4-TTMS-006-D03ODS RAFM improvement - Elaboration of Eurofer ODS steels by internal oxidation
EFDA TBM RAFM DTH Grenoble Cayron C. 229
TW4-TTMS-007-D02Modelisation of irradiation effects - Ab-initio defect energy calculations in the Fe-He and Fe-He-C systems
EFDA TBM RAFM DMN Saclay Willaime F. 233
TW4-TVR-RADTOLTW5-TVR-RADTOL
Radiation tolerance assessment of standard electronic components for Remote Handling
EFDA VIV RH DTSI Saclay Giraud A. 113
TW4-TVR-WHMANTW5-TVR-WHMAN
Developement of a water hydraulic manipulator EFDA VIV RH DTSI Fontenay Friconneau J.P. 117
TW4-TVV-HybridFurther development of the hybrid MIG/Laser welding technique for VV sector field joining
EFDA VIV V/B DTH Saclay Aubert P. 55
TW4-TVV-OSWELDSimulation of phased array techniques for qualification UT methods for one sided welds during VV manufacture
EFDA VIV V/B DETECS Saclay Tirira J. 59
TW5-TMSF-HTSMAG Scoping studies of HTS fusion magnets EFDA MAG MAG DRFC Cadarache Duchateau J.L. 155
TW5-TMSF-HTSPER HTS materials for fusion magnets EFDA MAG MAG DAPNIA Saclay Rey J.M. 159
TW5-TPDC-IRRCER-D03Assessment of IR fibres for thermography applications, initial gamma induced effects, then neutron irradiations - Fibre selection and provision, diagnostic preparation and measurements
EFDA PI Diag DRFC Cadarache Reichle R. 37
TW5-TPHI-ICRFDEVDevelopment of high performance capacitors for the ITER Ion Cyclotron array
EFDA PI Hea DRFC Cadarache Vulliez K. 17
TW5-TRP-002-D03a Analysis of current profile control in tokamak reactor scenarios EFDA SS PPCS DRFC Cadarache Giruzzi G. 293
TW5-TSS-SEA3.5 In-vessel safety - Mitigation of hydrogen and dust explosions EFDA S&E Safety DM2S Saclay Paillère H. 273
TW5-TSS-SEA5.3 Cryogenic experiments on the CEA EVITA facility EFDA S&E Safety DTN Cadarache Ayrault L. 275
TW5-TSS-SEA5.5 PAXITR validation effort on EVITA tests EFDA S&E Safety DTN + TACadarache +Aix en Pce
Ayrault L. 279
TW5-TSS-SEA5.6Enhancement of the Pactiter computer code and related fusion specific experiments
EFDA S&E Safety DTN Cadarache Schindler P. 281
TW5-TTBB-006-D04HCPB Breeder and Neutrons Multiplier Materials - Procurement and characterization of Li2TiO3 pebbles with improved geometrical
characteristicsEFDA TBM HCPB DTNM Saclay Lulewicz J.D. 165
TW5-TTBC-001-D01TBM design, integration and analysis - Design and analyses of the HCLL TBM including design of supporting system and instrumentation integration
EFDA TBM HCLL DM2S Saclay Rampal G. 197

- 418 -
Task Title Prog. Field Area Unit Site Task Leader Page
TW5-TTBC-001-D02TBM design, integration and analysisFinalization of the conceptual design of the prototypical HCLL TBM mock-up
EFDA TBM HCLL DM2S Saclay Salavy J.F. 203
TW5-TTBC-001-D03TBM design, integration and analysis - PIE and hot cell requirements for the HCLL TBM
EFDA TBM HCLL DM2S Saclay Salavy J.F. 207
TW5-TTBC-001-D06Further thermal-hydraulics and design study related to the choice of reference He cooling scheme for the HCLL TBM
EFDA TBM HCLL DM2S Saclay Gabriel F. 209
TW5-TTBC-001-D07TBM design, integration and analysisDetailed TBM development workplan up to EM-TBM installation in ITER
EFDA TBM HCLL DM2S Saclay Salavy J.F. 213
TW5-TTBC-002-D01 TBM manufacturing R&D - Diademo mock-up EFDA TBM HCLL DTH Saclay De Dinechin G. 215
TW5-TTBC-005-D01TBM design, integration and analysisTBM HCLL instrumentation definition
EFDA TBM HCLL DM2S Saclay Rampal G. 219
TW5-TTMA-001-D08Modelling of the mechanical behaviour of advanced 3D SiCf/SiC
compositeEFDA TBM ADV DM2S Saclay Guérin C. 259
TW5-TTMS-004-D02Qualification of fabrication processes - Microstructural analysis and qualification of joints and welds from TBM mock-up fabrication
EFDA TBM RAFM DTH Saclay De Dinechin G. 237
TW5-TTMS-004-D04Qualification of fabrication processes - Characterization of welding distorsion of simplified welded mock-ups
EFDA TBM RAFM DTH Saclay De Dinechin G. 239
TW5-TTMS-004-D06Qualification of fabrication processes - Weldability of dissimilar tubes (Eurofer/SS316) by fusion butt welding with YAG laser
EFDA TBM RAFM DTH Saclay De Dinechin G. 241
TW5-TTMS-004-D07 Qualification of fabrication processes - Weldability of homogeneous plates EFDA TBM RAFM DTH Saclay Aubert P. 243
TW5-TTMS-005-D01Rules for design, fabrication, inspection - Update Data Base and Appendix A of DEMO-SDC
EFDA TBM RAFM DMN Saclay Tavassoli F. 247
TW5-TTMS-006-D01
Structural materials - High performance steels - improvement of fabrication process for ODS-EUROFER - Refinement of chemical composition and thermomechanical treatments with emphasis on the fabrication issues of larger batches
EFDA TBM RAFM DMN Saclay Bougault A. 249
TW5-TTMS-007-D04Modelisation of irradiation effect - Event-based Monte Carlo simulations of defect microstructure evolution of Iron containing C during resistivity recovery experiments
EFDA TBM RAFM DMN Saclay Bocquet J.L. 251
TW5-TTMS-007-D21Structutal materials - Modelisation of irradiation effects - Fusion-Relevant Materials Irradiation in Jannus for Multi-Scale Modelling Experimental Validation
EFDA TBM RAFM DMN Saclay Barbu A. 253
TW5-TVD-CUCFC Development of alternative CFC/Cu joining techniques EFDA VIV PFC DTH Grenoble Chaumat V. 107
TW5-TVM-Braze Manufacture and characterization of silver free braze material EFDA VIV V/B DTH Grenoble Baffie T. 63
TW5-TVM-COMADAInvestigations of the effect of creep-fatigue interaction on the mechanical performance and lifetime of CuCrZr
EFDA VIV V/B DTH Grenoble Gillia O. 67
TW5-TVR-AIA Articulated Inspection Arm (AIA) EFDA VIV RH DTSI Fontenay Friconneau J.P. 111
TW5-TVV-MPUTQualification of UT methods for one sided welds during VV manufacture - Weld structure
EFDA VIV V/B DETECS Saclay Tirira J. 71
UT-S&E-LASER/DECLaser heating of complex graphite surfaces by high repetition rate nanosecond pulses
UT S&E Safety DPC Saclay Semerok A. 381
UT-S&E-LiPbwaterAnalysis of the consequences of a common failure of the Test Blanket Module and water blanket in ITER
UT S&E Safety DER Cadarache Cadiou T. 385
UT-S&E-Tritium-Impact Impact of contamination with tritium at cell level UT S&E Safety DRR Fontenay Lopez B. 389
UT-TBM/BB-He Helium components technology - Problems and oulines of solutions UT TBM BLK DTN Cadarache Berton J.L. 367
UT-TBM/MAT-LAM/OptiDevelopment of novel reduced activation martensitic steels with improved creep properties
UT TBM MAT DMN Saclay De Carlan Y. 371

- 419 -
Task Title Prog. Field Area Unit Site Task Leader Page
UT-TBM/MAT-MicroMicrostructural evolution of Fe-C model alloy and Eurofer under 1 MeV electron irradiation with and without He pre-implantation
UT TBM MAT DMN Saclay Henry J. 375
UT-TBM/MAT-Modpulse Pulsed irradiation of the martensitic alloy Eurofer UT TBM MAT DMN Saclay Boulanger L. 377
UT-VIV/AM-AIATechnologies for vacuum and temperature conditions for remote handling systems - Articulated Inspection Arm (AIA)
UT VIV RH DTSI Fontenay Friconneau J.P. 357
UT-VIV/AM-ECIr Radiation effects on electronic components UT VIV RH DTSI Fontenay Giraud A. 359
UT-VIV/AM-Hydro Technologies and control for remote handling systems UT VIV RH DTSI Fontenay Friconneau J.P. 363
UT-VIV/PFC-Damage Study of damage mechanisms in PFC UT VIV PFCCNRS-LCTS
Pessac Martin E. 339
UT-VIV/PFC-HIPImprovement of the reliability, performance and industrial relevancy of HIP processes for PFC components
UT VIV PFC DTH Grenoble Chabrol C. 343
UT-VIV/PFC-NanoSicNano crystalline silicon carbide (SiC) - Mechanical properties of nanocrystalline SiC
UT VIV PFC DTNM Saclay Ténégal F. 347
UT-VIV/PFC-PyroApplication of a tricolour pyroreflectometer to plasma facing components in-situ infrared monitoring
UT VIV PFC CNRS-IMP Font Romeu Hernandez D. 351
UT-VIV/VV-Hybrid-Modeli
Optimization of hybrid welding for VV manufacturing - Weldability of Eurofer homogeneous plates
UT VIV V/B DTH Saclay Aubert P. 337
Programme AreaEFDA = EFDA Technology Programme Hea = Heating and Current DriveUT = Underlying Technology Programme Diag = Diagnostics
V/B = Vessel/Blanket and MaterialsPFC = Plasma Facing Components
Field RH = Remote HandlingPI = Physic Integration MAG = MagnetsVIV = Vessel - In Vessel BLK = BlanketMAG = Magnets HCPB = Helium Cooled Pebble Bed BlanketTBM = Tritium Breeding & Materials HCLL = Helium Cooled Lithium Lead BlanketS&E = Safety & Environment MAT = MaterialsSS = System Studies RAFM = Reduced Activation Ferritic Martensitic steelsISP = ITER Site Preparation ADV = Advanced MaterialsDSP = Design Support and Procurement Safety = Safety and environmentHSTP = Heating Systems Technology Project PPCS = Power Plant Conceptual Studies
EISS = European ITER Site StudiesDSP = Design Support and ProcurementHSTP = Heating Systems Technology Project

- 420 -

- 421 -
APPENDIX 5 : CEA SITES
Cadarache
Grenoble
Fontenay
Saclay
CEA SITES
Sites with Fusion Tasks
Another Site