FUNDAÇÃO GETULIO VARGAS ESCOLA DE ADMINISTRAÇÃO DE ...
69
FUNDAÇÃO GETULIO VARGAS ESCOLA DE ADMINISTRAÇÃO DE EMPRESAS DE SÃO PAULO OLEGÁRIO DA CRUZ DE ARAÚJO IN-STORE ATTRACTIVENESS OF NATIONAL BRANDS AND PRIVATE LABELS IN AN EMERGING MARKET SÃO PAULO 2018
-
Upload
khangminh22 -
Category
Documents
-
view
3 -
download
0
Transcript of FUNDAÇÃO GETULIO VARGAS ESCOLA DE ADMINISTRAÇÃO DE ...

FUNDAÇÃO GETULIO VARGAS
ESCOLA DE ADMINISTRAÇÃO DE EMPRESAS DE SÃO PAULO
OLEGÁRIO DA CRUZ DE ARAÚJO
IN-STORE ATTRACTIVENESS OF NATIONAL BRANDS AND PRIVATE LABELS
IN AN EMERGING MARKET
SÃO PAULO
2018

OLEGÁRIO DA CRUZ DE ARAÚJO
IN-STORE ATTRACTIVENESS OF NATIONAL BRANDS AND PRIVATE LABELS
IN AN EMERGING MARKET
Dissertação apresentada à Escola de
Administração de Empresas de São Paulo da
Fundação Getúlio Vargas para obtenção do
título de Mestre em Administração de
Empresas.
Campo do conhecimento: Administração
Mercadológica
Orientador: Prof. Dr. Felipe Zambaldi
Coorientador: Prof. Dr. Leandro Guissoni
SÃO PAULO
2018

Araújo, Olegário da Cruz de.
In-store attractiveness of national brands and private labels in an emerging
market / Olegário da Cruz de Araújo. - 2018.
69 f.
Orientadores: Felipe Zambaldi, Leandro Angotti Guissoni.
Dissertação (mestrado) - Escola de Administração de Empresas de São Paulo.
1. Marca de produtos. 2. Mercadorias. 3. Vendas - Promoção. 4. Administração
de produtos. I. Zambaldi, Felipe. II. Guissoni, Leandro Angotti. III. Dissertação
(mestrado) - Escola de Administração de Empresas de São Paulo. IV. Título.
CDU 658.8
Ficha catalográfica elaborada por: Raphael Figueiredo Xavier CRB SP-009987/O
Biblioteca Karl A. Boedecker da Fundação Getúlio Vargas - SP

IN-STORE ATTRACTIVENESS OF NATIONAL BRANDS AND PRIVATE LABELS
IN AN EMERGING MARKET
Dissertação apresentada à Escola de
Administração de Empresas de São Paulo da
Fundação Getúlio Vargas para obtenção do
título de Mestre em Administração de
Empresas.
Campo do conhecimento: Administração
Mercadológica
Orientador: Prof. Dr. Felipe Zambaldi
Coorientador: Prof. Dr. Leandro Guissoni
Data de aprovação:
__/__/____
Banca examinadora:
Prof. Dr. (Orientador) Felipe Zambaldi
FGV-EAESP
Prof. Dr. (Coorientador) Leandro Guissoni
FGV-EAESP
Prof. Dr. Delane Botelho
FGV-EAESP
Prof. Dr. Eduardo Spers
ESPM

AGRADECIMENTOS
Eu tenho o hábito de agradecer diariamente todas as oportunidades que a vida me
proporciona. Agradeço os encontros que tenho para celebrar, brincar, beber, comer, rir, alertar
e despertar a consciência sobre o quanto preciso aprender, ter humildade de perguntar, ter
paciência para ouvir e saber me colocar no lugar do outro. Agradeço os estímulos diários que
recebo para levantar todos os dias e ir em frente. Agradeço a minha esposa Vânia Araújo e a
minha filha Nina Araújo, companheiras de jornada que se esforçam para me entender e que
me apoiam em todos os momentos. Sem os encontros, eu não teria sequer feito uma
faculdade. Quanto a minha decisão de fazer mestrado, além do incentivo de vários amigos
com os quais tive a grata oportunidade de interagir, agradeço ao Prof. Nelson Barrizzelli a
primeira orientação, em 2005. Depois do primeiro movimento, em 2014 o sonho renasce e
com ele surge a oportunidade de concretizá-lo na FGV, onde reencontrei a Profa. Eliane
Brito, os professores Juracy Parente e Mauricio Morgado e conheci novos professores,
igualmente incríveis. A recepção por todos de Mercadologia, incluindo o Luiz Macedo e o
Edson Máximo do FGVcev é algo inesquecível. Abertura para o diálogo, mas com o rigor
necessário na produção e geração de conhecimento. Um período desafiador e intenso,
principalmente porque “mudar de chip” não é algo simples nem rápido. O início da minha
jornada com a dissertação teve a importante contribuição da Profa. Tânia Veludo, que me
apresentou o Prof. Leandro Guissoni. Concluir esta parte só foi possível graças ao trio
formado pelos professores Felipe Zambaldi, Leandro Guissoni e Jonny Mateus Rodrigues.
Inspiração, conhecimento, paciência e apoio foram marcas registradas destes mestres.
Agradeço aos professores Eduardo Spers, Juracy Parente e Delane Botelho. As considerações
feitas por eles foram fundamentais para eu ampliar meu conhecimento, aprimorar o conteúdo
da dissertação e identificar áreas de oportunidade para estudo e desenvolvimento futuro.
Agradeço à equipe da Nielsen, empresa onde aprendi muito e me proporcionou encontros com
pessoas que são referência no varejo, algumas delas, amigas de longa data. Isso sem falar nas
informações fundamentais que tive acesso para desenvolver esta dissertação. Luis Arjona,
Alfredo Costa e Alexandre Nascimento viabilizaram a parceria entre a Nielsen e a FGV. Por
fim, minha gratidão aos colegas de turma. Amanda Veit, Webert Jannsen, Kirla Ferreira,
Cecilia Araújo, Adriana Schneider e Ulysses Pereira foram incríveis, me apoiaram e também
contribuíram para alguns momentos serem mais leves e assim fluírem melhor. Finalmente,
meus agradecimentos à família e os amigos mais próximos, dos quais estive distante durante
este período.

ABSTRACT
Emerging markets are considered relevant for international manufacturers and retailers to
grow their turnovers. In order to achieve their goals, manufacturers and retailers are executing
different initiatives to attract new customers such as in-store promotions. However, both in
the US and here in Brazil, the results of these actions are questioned. Retailers are also
investing in their Private Labels (PLs), which can alter the competitive dynamics within the
categories. In the United States and Europe, studies were conducted to assess in-store
promotions, impulses and responses in short-term and long-term sales for National Brands
(NBs) and also Private Labels (PLs). The research question of this study was to evaluate if in
Brazil, an emerging market, the attractiveness of Weighted Distribution, Price and Promotions
of National Brands and Private Labels provide similar responses to the impulses. In order to
evaluate if the impulses provide long-term residual effects for National Brands (NBs) and
Private Labels (PLs), Vectors of Auto Regression (VAR) model was used in a continuous
panel of self-service food stores in Greater São Paulo, which is the main metropolitan region
of Brazil. The databases by categories (powdered coffee, biscuit, and ready-to-serve fruit
juice) contained information of 25 months (November 2013 to November 2015) for each
variable (Weighted Distribution, Price and Promotions), by NBs and PLs. The result of this
study points out that there is a difference in responses to the impulses (distribution, price, and
promotions) between NBs and PLs. National Brands (NBs) showed a greater number of
situations with positive residual effects on long-term sales. However, the long-term response
on sales occurred only for less than the half of the total potential situations. In other words,
more than half of the total potential situations give an absence of statistical significance. The
study indicates that there are retailers developing differentiated actions with Private Labels
and obtaining, in their sales, positive long-term residual effects. Although modestly, this
study contributes to the retail literature by using an econometric model (VAR) to analyze the
impulse in some in-store attractiveness variables their long-term sales response to NBs and
PLs in an emerging market. In short, the main contribution from the observations of the
analyzed categories is that it is possible to Private Label compete without price sensibility and
also positioning PL above the average price of the category/segment. The results also suggest
that there is an opportunity to review the modus operandi of in-store promotion to get better
results.
Key Words: National Brand; Private Label; Weighted Distribution; In-store Promotion;
VAR.

RESUMO
Mercados emergentes são importantes para as receitas totais de fabricantes e varejistas
internacionais. Estudos de companhias globais de pesquisa, que atuam no Brasil, apontam que
os investimentos em ações promocionais no ponto-de-venda, pelas Marcas de Fabricantes,
aumentaram, mas há questionamentos quanto ao retorno destas iniciativas. Os varejistas
também têm investido em Marcas Próprias. Nos Estados Unidos e Europa há vários estudos
sobre o estímulos dentro do ponto-de-venda para as Marcas dos Fabricantes e Marcas
Próprias e o impacto nas vendas no curto e longo prazo. O objetivo central deste estudo é
avaliar se, em um mercado emergente, o nivel de atratividade das ações realizadas pelas
Marcas de Fabricantes e Marcas Próprias dentro das lojas proporcionam respostas similares
de curto e longo prazo aos impulsos realizados. Para analisar os efeitos destes impulsos foi
utilizado o modelo de Vetores de Auto Regressão (VAR) em um painel continuo de lojas de
autosserviço alimentar, na principal região metropolitana do Brasil, a Grande São Paulo. As
bases de dados por categoria (Café em Pó, Biscoito e Suco Pronto para Consumo), continham
informações de 25 meses (novembro de 2013 à novembro de 2015), com dados de
distribuição ponderada, preço e promoções, O resultado deste estudo aponta que há diferenças
entre Marcas de Fabricantes e Marcas Próprias nas respostas de longo prazo aos estímulos
promocionais. Embora as Marcas de Fabricantes tenham apresentado um maior número de
situações com efeitos residuais positivos nas vendas de longo prazo do que as Marcas
Próprias, apenas menos da metade das situações apresentaram resultados de longo prazo. O
estudo também sinaliza que há varejistas desenvolvendo ações diferenciadas com Marcas
Próprias e obtendo, em suas vendas, efeitos residuais positivos de longo prazo, na mesma
intensidade das Marcas de Fabricantes. Embora de forma modesta, esta pesquisa contribui
para a literatura ao utilizar um modelo econométrico (VAR) para analisar os impulsos
aplicados em distribuição, preço e promoção das Marcas dos Fabricantes e das Marcas
Próprias em um mercado emergente. A principal contribuição deste estudo, a partir das
categorias analisadas, é que a Marca Própria, não necessariamente, precisa atuar apenas com
um posicionamento de preço baixo e/ou reduzir preços para competir dentro da categoria ou
segmento no qual está inserida. Além disto, o estudo também sugere que as há espaço para
rever as práticas promocionais ou até operacionais, considerando o baixo retorno
proporcionado para Marcas de Fabricantes e Marcas Próprias.
Palavras-chave: Marca de Fabricante; Marca Própria; Distribuição; Preço; Promoção; VAR

LIST OF TABLES
Table 1 – A typology of retail brands ....................................................................................... 17
Table 2 – Four types of Private Labels ..................................................................................... 19
Table 3 – Studies that used time series and auto regressive models related to marketing mix 23
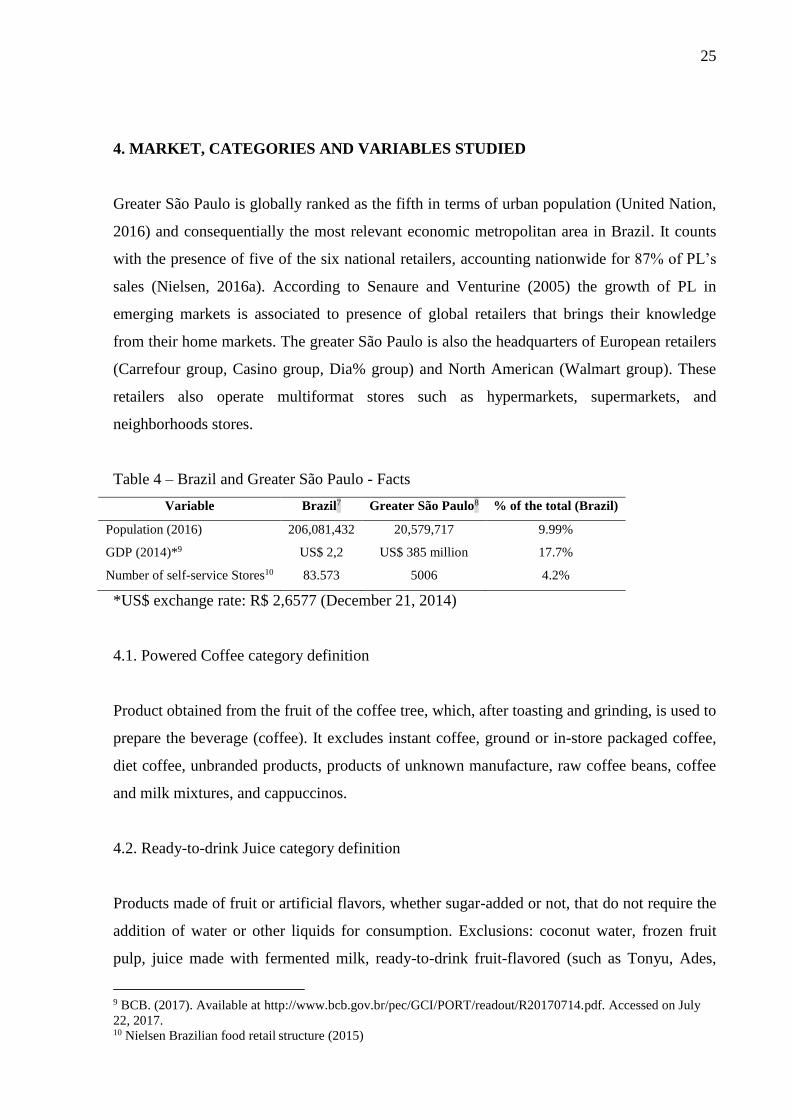
Table 4 – Brazil and Greater São Paulo - Facts ........................................................................ 25
Table 5 – 2014 Categories Key Facts – Greater São Paulo (GSP) ........................................... 26
Table 6 – Variables ................................................................................................................... 27
Table 7 – Research Project General Operationalization View ................................................. 28
Table 8 – Unit Root Test for National Brands.......................................................................... 31
Table 9 – Unit root test for Private Labels ............................................................................... 32
Table 10 – AIC and BIC criteria for National Brands .............................................................. 33
Table 11 – AIC and BIC criteria for Private Labels ................................................................. 33
Table 12 – Cointegration test for coffee National Brands ........................................................ 33
Table 13 – Cointegration test for biscuit/cookie National Brands ........................................... 34
Table 14 – Cointegration test for ready-to-serve fruit juice National Brands .......................... 34
Table 15 – Cointegration test for coffee powder Private Labels .............................................. 34
Table 16 – Cointegration test for biscuit/cookie Private Labels .............................................. 34
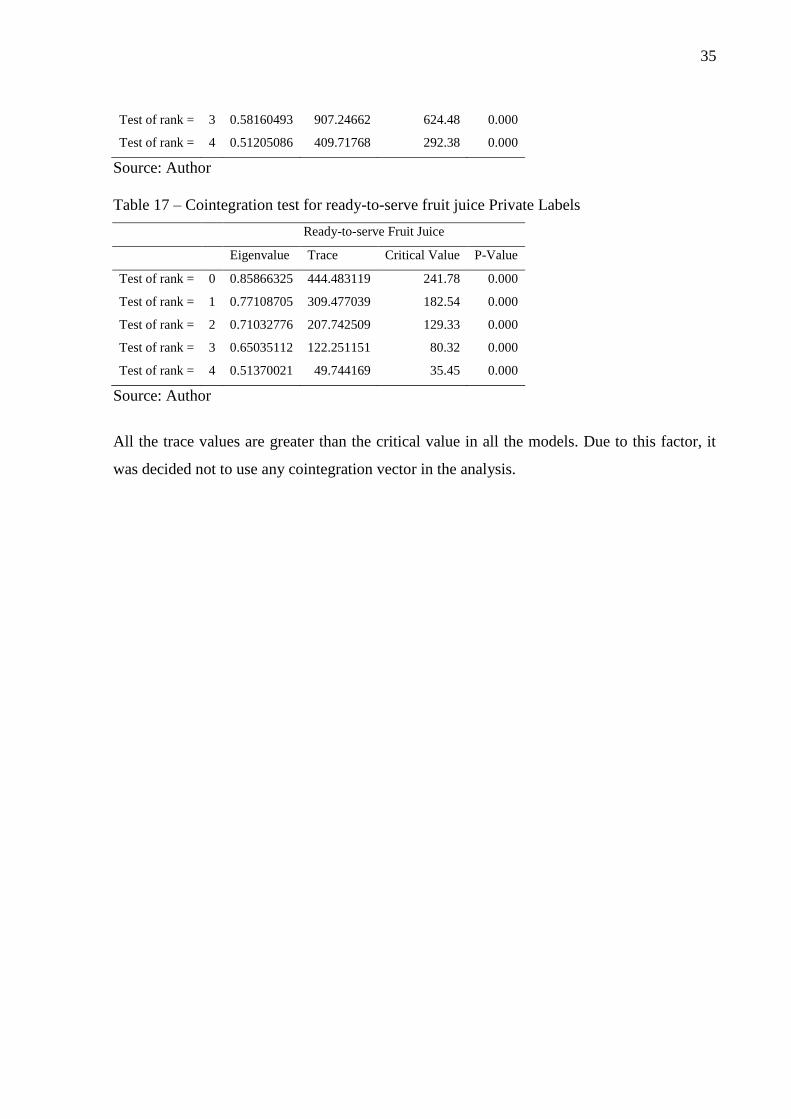
Table 17 – Cointegration test for ready-to-serve fruit juice Private Labels ............................. 35
Table 18 – Impulse response to NB and PL ............................................................................. 38

LIST OF FIGURES
Figure 1 - Summary of the literature review ............................................................................ 22
Figure 2 – Weighted Distribution, Price, In-store promotions and their residual effects on
sales .................................................................................................................................. 24
Figure 3 – Data Analysis Steps ................................................................................................ 30
Figure 4 – Persistent long-term residual effect of Special Offer/Discounts on PL sales ......... 36
Figure 5 – Persistent long-term residual effect of Price on PL sales ........................................ 36
Figure 6 – Persistent long-term residual effect of Price on PL sales ........................................ 37

SUMMARY
1. INTRODUCTION .............................................................................................................. 10
2. LITERATURE REVIEW .................................................................................................. 14
2.1. Private Label evolution ............................................................................................... 15
2.2 The impact of generic product and PL on NB ........................................................... 20
2.3. Marketing mix elements .............................................................................................. 21
3. THEORETICAL FRAMEWORK AND RESEARCH QUESTION ............................. 22
4. MARKET, CATEGORIES AND VARIABLES STUDIED ........................................... 25
4.1. Powered Coffee category definition .......................................................................... 25
4.2. Ready-to-drink Juice category definition .................................................................. 25
4.3. Biscuit/Cookie category definition ............................................................................ 26
5. METHODOLOGY ............................................................................................................. 28
5.1. Relative Price Index..................................................................................................... 28
5.2. Econometric models – VAR – Vectors of Auto Regression ..................................... 29
5.2.1. Tests to assure the validity of the model ................................................................ 30
5.2.2 Unit Root Test ......................................................................................................... 30
5.2.3. Lag Test .................................................................................................................. 32
5.2.4 Cointegration Test ................................................................................................... 33
6. RESULTS ............................................................................................................................ 36
7. CONCLUSIONS AND MANAGERIAL IMPLICATIONS ........................................... 39
7.1. Managerial implications ............................................................................................. 41
7.1.1. Implications to National Brand ............................................................................... 41
7.1.2. Implications to Private Label .................................................................................. 42
8. LIMITATIONS OF THE STUDY AND SOME SUGGESTIONS FOR FUTURE
STUDIES ................................................................................................................................. 43
REFERENCES ....................................................................................................................... 44

10
1. INTRODUCTION
Emerging markets are important destinations for companies (Venkatesan et al. 2015; Seth,
2011). The home-markets of international Retailers and manufacturers are mature and
saturated. On the other hand, emerging markets represent an opportunity to the growth of
global companies given they are under big pressure as result of changing in demographics,
consumer consumption habits and fragmentation (Mergermarket 2017). In 2012, Euromonitor
claimed “The global retailing industry was driven by Latin America, and the Middle East and
Africa, both of which saw 4% sales growth in constant terms”. The report provided by
Deloitte (Global Powers of Retailing 2018, p. 27) compares the retail revenue growth and net
profit margins among regions - The retail revenue growth in Latin America stood out, even in
a recession period in Brazil (Europe: 4.0%; North America: 4.4%, and Latin America:
9.86%), and net profit margin also calls for attention (Europe: 3.4%; North America: 3.3%
and Latin America: 5.0%). This information indicates that Latin America, including Brazil,
will continue to be relevant for retailers and manufacturers. The Investors financial reports1 of
Carrefour, Casino and Dia%, point out that Brazil represents, respectively, 35%, 29.8% and
19% of their global turnover. Emergent markets are also important to Manufacturers. Latin
American for instance, has its relevance in the global revenue of Nestle2 (31.8%), Coca-Cola3
(22.6%) and Mondelez4 (13%) according to their 2016 annual reports.
Retailers invest in Private Label (PL) for several reasons. Hyman et al. (2010, p. 370, 376 and
377) in their literature review, summarized the advantages as following: “Increase Overall
Profits in Product Category; Higher gross margin on Private Label (PL); Increase bargaining
1 Carrefour (2018). Q4 2017 Sales. Available at:
http://www.carrefour.com/sites/default/files/presentation_q4_2017_vdef_0.pdf. Accessed on February 21, 2018.
Casino (2017). 2016 Relatório anual de atividades e de sustentabilidade. Available at: https://www.groupe-
casino.fr/fr/wp-content/uploads/sites/5/2009/02/RA-2016-PORTUGAIS.pdf. Accessed on February 21, 2018.
Dia (2017). Q317 Results. Available at:
http://www.diacorporate.com/recursos/doc/corporativo/20130430/presentaciones/q3-results-presentation.pdf.
Accessed on February 21, 2018.
Walmart (2018). 2017 Annual Report. Available at:
http://s2.q4cdn.com/056532643/files/doc_financials/2017/Annual/WMT_2017_AR-(1).pdf. Accessed on
February 21, 2018. 2 Nestle (2016). Annual Review 2016. Available at:
https://www.nestle.com/asset-library/documents/library/documents/annual_reports/2016-annual-review-en.pdf.
Accessed on March 7, 2018. 3 The Coca-Cola Company (2016). FORM 10-K. Available at:
http://www.coca-colacompany.com/content/dam/journey/us/en/private/fileassets/pdf/investors/2016-AR-10-
K.pdf. Accessed on March 7, 2018. 4 Mondelez (2017). Mondelēz International Reports 2016 Results. Available at:
http://ir.mondelezinternational.com/releasedetail.cfm?releaseid=1010823. Accessed on March 7, 2018.

11
Power Relative to National Brands; Differentiate chain from competitors; Boost store loyalty;
Attract Price-sensitive and Deal-prone Consumers who Value Lower-cost National Brand
(NB) Substitute; Less Risky than Carrying Marginal National Brand (NB) on Deal”. Burt
(2000) raised some relevant points that contribute to the part of the channel power move from
Manufacturers to Retailers in the UK, as centralization of operation. This provides access to
information about consumers, more control over information in the supply chain and inside
the stores. PL also gives access to the category performance and, with the previous conditions,
enables retailers to gain scale and to increase their power in the relationship with industry,
which can be done either in a collaborative way or not.
The PL share varies within categories, regions of a country and within countries. According to
Nielsen (2016), the PL has a global average market share of 16.1% on the revenue of
categories, notably 4% in South Korea and 45% in Switzerland. In the United Kingdom and
Spain, the average share is 41%. In the United States, Canada, and South Africa this share is
18%. In Latin America, the average share is 7.9%. The highest share occurs in Colombia
(15%) and the lowest average share occurs in Brazil (5.2%).
These general views seem to be confirmed in Brazil, where international retailer groups that
run different store formats, such as Carrefour, Multivarejo (Casino), Walmart, Cencosud and
Dia%, which have been operating and leading Private Label initiatives in the grocery industry
and respond for 87% of PL total revenue (Nielsen, 2016). These global retailers are investing
in PL quality, new lines, and revamping PL5. Brazil is a continental and fragmented country,
where regional retailers are strong (Nielsen, 2014). Although local Brazilian retailers
represent 13% of total PL revenue, they are investing in PL and responded for 33% of PL
growth by the introduction of 51 out of 58 new PL in a one-year period (ending on August 14,
2016). The perception of quality is confirmed by a Nielsen study (2014) where seventy-five
percent of Brazilian Internet Users state that PL is a good alternative to name brands and, for
78% of them, PL has usually extremely good value for money.
Abril and Martos-Partal (2013) concluded in their research that, thanks to retailer’s
investments, the consumer’s perception of PL quality has improved through innovation and
5 Estadão (2015). Dia% diversifica lojas e investe em marca própria. Available at
http://economia.estadao.com.br/noticias/geral,dia-diversifica-lojas-e-investe-em-marca-propria-imp-
,1744528. Accessed on July 22, 2017.

12
quality. However, it is necessary to consider retailer’s strategy, PL positioning, consumer
target and its perception, and the stage of PL in the country inside the retail and category. It is
relevant because retailers are segmenting PL in the same category, even in the specific
segment of product category.
In December 2016, Nielsen (2016) released its Private Label Annual study based on its
Scantrack service, electronic data received from grocery chains that aggregate 148 categories
in the Consumer-Packaged Goods (CPG) industry in Brazil. In a one-year period (until
August 14, 2016), PL sales increased 13.3% and NB 9.6%. From another source of Nielsen
(household panel), the study also revealed that PL has increased its penetration in 4
percentage points and reached 64.9% of total Brazilian households, families that bought a PL
product at least once in a one-year period. Almost half of the PL sales growth was from new
buyers. PL price is 13% lower than the average price of all categories audited by Nielsen
(2016). The total revenue of PL in Brazil, considering the food self-service stores that provide
electronic data to Nielsen from their POS, and which are made available by the
Nielsen/Scantrack self-service food stores, based on 148 CPG categories surveyed within one-
year period until August 14, 2016 was US$1.25 billion (US$ tourism exchange rate on
08/15/2016 at R$3.36). It is worth noting that in a ten-year-period PL growth increased 213%.
Practically in the same period, the nominal growth of supermarket sales was 172.9%6.
Since the 1980s, an increased competition imposed by Private Labels (PLs) in developed
markets has caused a growing in-store competition with National Brands (Choi & Fred 2013;
Fornari et al. 2016; Cotterill et al. 2000). During the 1980s, quality and price gap between PL
and NB were reduced and sales of PL and generic products increased in this period as a
demonstration of the acceptance by customers (McGoldrick, 1984; de Chernatony, 1988;
Nandan & Dickinson, 1994; Hoch & Banerji, 1993). In this period, brand managers were
under great pressure to generate short-term cash flow, developing and justifying long-term
marketing strategies to add value to NB manufacturers in a context of changing the
relationship between retailers and manufacturers (Shocker et al, 1994). In general, to deal
with the PL and generic product competition, some NB manufacturers reduced their prices
(Harris & Strang, 1985; Nandan & Dickinson 1994; Sethuraman & Cole, 1999), reduced or
6 ABRAS. (2017). Brazilian Supermarket Association. Ranking ABRAS 2017. SuperHiper Magazine

13
eliminated advertising investments, or shifted them to trade promotion (Harris & Strang,
1985; Hoch et al., 2002).
In-store promotion and the nature of competition between NB and PL remain relevant.
Ailawadi and Keller (2004) in the Journal of Retailing point the growth of promotions and
Private Labels (PLs) as a crescent increase in the power of retailers. In 2005, trade Promotion
represented around 60% of the total marketing budget (Ailawadi et al., 2009). Nowadays, the
efficiency of promotions is being questioned. According to Nielsen (2015), the return on
investment in promotions in the USA is getting smaller and 67% of promotional actions do
not reach the break-even point, which means that only with 33% it is possible to make money
and it is possible to reduce 22% of the promotions and increase sales. In Brazil, by conducting
different studies in 2017, Nielsen and Kantar WorldPanel agree that the promotional activities
should be reviewed. According to a study carried out by Nielsen (2017), 52% of the
categories increased the promotional intensity in 2016 but only 27.4% of the sales promotions
generated a volume increase. Kantar WorldPanel (2017) demonstrated that Brazil is among
the countries with the highest promotional volume (Brazil 40.1%, Argentina 40%, and UK
38%) but the incremental volume generated in the categories is less than the global average.
The competition between NB and PL occurs around the world and promotion has an
important role to attract shoppers. International retailers and manufacturers are challenged by
pursuing integration among different countries but also by taking into consideration the need
to local adaptation. From the promotional perspective, according to Steenkamp and Geyskens
(2014), in-store promotion is among the greatest local of all instruments. This study focuses
on understanding the sales performance of weighted distribution, price and in-store
promotions by analyzing the impulse on these variables and the response on sales of NB and
PL in an emerging market.
The literature review will provide a general view about NB, PL and Generic Product
evolution, how marketing mix variables were influenced by the introduction of retailers’
products, the circumstances that were favorable to this development, and the current stage of
PL in the US, Europe, and Brazil. Then, based on the literature, weighted distribution, price
and in-store promotions are analyzed at the price tier level within the category taking into
consideration a cluster of NB and other of PL. This introduction is followed by the
methodology, results, conclusions, and managerial implications for NB and PL, limitations of

14
the study, and some suggestions for further studies. To scrutinize and answer the proposed
research question, three available categories were studied: 1) Powdered Coffee; 2)
Biscuit/Cookie, and 3) Ready-to-serve Fruit Juice. Powdered Coffee is considered a
commodity in terms of price and Biscuit/Cookies and Ready-to-serve Fruit Juice were chosen
because they are among the top 5 categories in terms of household PL penetration to at least
one among the top five Brazilian retailers7. For these three categories, the top 3 brands also
have distinct characteristics such as their sizes and the concentration level of market share
value. The research used Vectors of Auto Regression – VAR model to analyze the data to
understand sales residual effects in the short-term and long-term of each variable for NB and
PL.
2. LITERATURE REVIEW
Some researchers have defined NB as national brand manufacturer or manufacturers’ brand.
A National Brand (NB) is owned and sponsored by a manufacturer and it can be available
with national or regional distribution, at the same time, through different channels and store
formats (Abril & Sanchez, 2016; Rossi et al, 2015; Boyle & Lathrop, 2013; Dekimpe et al.,
2011: McEnally & Hawes, 1984; Rao, 1969). In this research project, NB is considered a
global, a regional or a local one. Morris (1979, p. 59) agreed with Economist Intelligence that
defines PL as “Own label products are defined as consumer products produced by, or on
behalf of distributors and sold under the distributor’s own name or trademark through the
distributor’s own outlet”. In this study, Nielsen’s definition (2016a) will be adopted, in which
the PL is characterized as a product sold exclusively by the retail organization that owns the
property (registration) of the brand. It can carry the name of the retailer or use another brand
not associated with the name of the organization.
In the literature, Private Label (PL) is named in different ways such as Own Brand, Store
Brand Label, Private Label Brand, Private Brand, Wholesaler or Distributor Brand, Own
Label, Retailer Own Label, House Brand, Retailer Brand, Supermarket Brand, and Retail
Brand (Abril & Rodriguez-Cánovas; 2016; Calvo-Porral & Levy-Mangin, 2014; Burt &
Davies, 2010; Mayer, 2009; Herstein & Gamliel, 2004; Collins-Dodd & Lindley, 2003).
Although researchers have been using different names to talk about PL, there is a change
7 Kantar WorldPanel 2017 – Marcas Próprias – Caminhos do Reaquecimento

15
going on that means thinking about retail and PL as a brand. Ailawadi and Keller (2004), in a
special issue of the Journal of Retailing, suggested research priorities to develop and apply the
traditional branding theory to retailer taking into consideration brand personality, experiential
marketing, and brand architecture. Burt and Davies (2010, p. 872) reinforced the “focus on a
holistic approach to retail branding because we feel it fits with the characteristics and
competitive pressures facing the industry today”.
Retailers invest on PL for several reasons. Hyman et al. (2010, p. 370, 376 and 377) in their
literature review, summarized the advantages as following: “Increase Overall Profits in
Product Category; Higher gross margin on PLB; Increase bargaining Power Relative to NB
Manufacturers; Help to differentiate chain from competitors; Boost store loyalty; Attract
Price-sensitive and Deal-prone Consumers who Value Lower-cost NB Substitute; Less Risky
than Carrying Marginal NB on Deal”. Burt (2000) raised some relevant points that contribute
to the part of the channel power move from Manufacturers to Retailers in the UK such as
centralization of operation. This provides access to information about consumers, more
control over information in the supply chain and inside the stores. PL also gives access to the
category performance and, with the previous conditions, enables retailers to gain scale and to
increase their power in the relationship with industry, which can be done either in a
collaborative way or not.
2.1. Private Label evolution
The PL was introduced in the US grocery store chains in the turn of the 19th to the 20th
century (Hoch & Banerji, 1993). There are some evidences that the first PL was sold in 1840
by Jacob Bunn and the first chain was A&P in 1860 (Herstein & Gamliel, 2004). Marks &
Spencer, an English retail company, had been working under their PL since 1884 in its Marks
& Spencer Penny Bazaar, including food items such as spices and confectionery. St. Michael,
a PL that belongs to Marks & Spencer, was introduced in the food segment in 19498. In
Brazil, the beginning of the PL occurred in 1960 with Grupo Sendas and, in 1971, Grupo Pão
de Açúcar started selling its PL (Brito et al., 2004). Oliveira (2008) corroborates the fact that
8 Marks & Spencer. (2017). From simple basics to making everyday delicious – how our food has developed
since 1884. Available at https://marksintime.marksandspencer.com/download?id=2848. Accessed on June 10,
2017

16
the 1960s marked the beginning of the PL in Brazil, adding the Paes Mendonça in the 60s,
and BomPreço, Carrefour and Makro in the 1970s.
Historically, there are three-time periods that contributed to the growth of PL. The first one is
associated with post World War II and the expansion of the concept of self-service food stores
in the 1950s. At that moment, the number of chains increased, and it created a better
economic scenario to produce PL by gaining scale. The second period is related to the end of
the Resale Price Maintenance in 1964 in European countries, which gave autonomy to
retailers to fix consumer prices for NB and PL. The third and more intense period is related to
the introduction of Generic Products and retailers improving PL quality in late 1970s and
through the 1980s. It is not a coincidence that this happened after the petroleum crises in the
1970s (Olbrich et al., 2016; Heirstein & Gamliel, 2004; Hughes, 1996; De Chernatony &
McWilliam, 1989).
PL is in different stages even in developed countries and retailers have different strategies.
Fernie and Pierrel (1996) compared the United Kingdom with France and concluded that the
evolution and development of the PL in the grocery store retail market in the United Kingdom
is much more advanced than in France. Hoch and Banerji (1993) also recognize that the PL in
Europe and Canada is qualitatively different from the United States, and they attribute these
differences to factors such as smaller domestic markets, which tend to favor strong national
competitors and retail concentration. Hughes (1996) also stated that there are differences
between the US and the UK and, at that time, PL was more developed in the UK than in the
US.
For Laaksonen and Reynolds (1994), PL could be understood in four generations. In each
generation, the products require technology, consumer’s motivation to buy, and different set
of objectives for each retailer group. The sophistication level of the products varies from
generation to generation. The evolution of the PL in the British grocery store started with the
offer of a low quality/low price product to consumers, and it evolved to a retail label that
offered an alternative of true value and reflected a clear marketing approach in the retail
environment (Burt, 2000). Burt and Sparks (2002) add a fifth generation to the definition of
Laaksonen and Reynolds (1994), which is the retailer’s corporate brand that generates a
strong, positive and practical identity, with tangible and intangible attributes related to both
consumers’ and stakeholders’ satisfaction.

17
Table 1 – A typology of retail brands
1st Generation 2st Generation 3st Generation 4st Generation 5st Generation
Branding form Generic; No
name; brand
free; Unbranded
Own label;
Unsupported own
brand
Supported own
brand
Extended retailer
brand, i.e.
segmented retail
brands
Corporate
brand
Strategy Generic Low price copy Me-too copy of
major brands
Value-added Corporate
positioning
Objective Increase
margins;
Provide choice
in pricing
Increase margins;
Reduce
manufacturers’
power by setting
the entry price;
Provide better-
value product
(quality/price)
Enhance
category
margins; Expand
product
assortment, i.e.
customer choice;
Build retailer’s
image among
consumers
Increase and
retain the
customer base;
Enhance
category
margins;
Improve image
further;
Differentiation
Produce strong
positive
identity and
practice; First
choice for
consumers;
Satisfy
stakeholders
Product Basic and
functional
products;
Commodities
Staple or basic
lines with a large
volume
Big category
products; Major
sale items
Image-forming
product groups;
Large number of
products with
small volume
(niche)
The
corporation
and its
tangible and
intangible
attributes
Technology Simple
production
process and
basic
technology
Technology
lagging behind
market leaders
Close to the
brand leader
Innovative
technology and
processes
Stakeholder
relationship
management
Quality/Image Lower quality
and inferior
image compared
with the
manufacturers’
brands
Medium quality
but still perceived
as lower than
leading
manufacturers’
brands;
Secondary brand
alongside the
leading
Comparable with
the brand leaders
Same or better
than brand
leader;
Innovative and
different
products from
brand leaders
Quality and
consistency
throughout the
organization
Price position 20% or more
below the brand
leader
10-20% below 5-10% below Equal or higher
than known
brand
Focus on
delivering
value
Consumers’
motivation to
buy
Price is the main
criterion for
buying
Price is still
important
Both quality and
price, i.e. value
for money
Better and
unique products
Trust
Supplier National, not
specialized
National, partly
specializing to
own label
manufacturing
National, mostly
specializing for
own label
manufacturing
International,
manufacturing
mostly own
brands
Innovative
partnerships
Source: Burt & Sparks (2002)
At a glance, a general vision of the PL throughout time may suggest that there is a pattern in
its evolution, but the PL is in different stages within countries and within the same country at

18
the same period, depending on the retail company that is being analyzed and its strategy.
Although the development of the PL presents different stages, PL evolution is not linear. It is
more related to a retailer’s strategy. The same retailer, in the same category, can introduce PL
in different tiers. All generations of different types of PL can take place within the same
category at the same time. Ailawadi and Keller (2004) comment that retailers are trying to
create a line of PL that performs in different price levels within the same category.
Kumar and Steenkamp (2007) point out that the PL had begun to change 10 years earlier,
notably in Europe, when retailers introduced the premium PL with the same quality (or even
superior quality) than the ones offered by the NB. The retailers also started managing their PL
more strategically through the introduction of price segmentation, offering consumers the
possibility to choose among lower price of PLs, standard products and premium-priced
products, and a careful management of their brand portfolio.
According to Kumar and Steenkamp (2007) there are four types of PL and named them as
generics, copycats, premium store brands, and value innovators. Each one has different
strategic and tactical aspects. A retailer can have brands in different positions inside the same
category to reach different consumer needs and targets (Keller et al., 2016; González-Benito
et al., 2015; Ter Braak, et al., 2013; Geyskens et al., 2010).
The distinction between PL and NB is getting less and less clear and retailers assume the
responsibility for the marketing functions, which were traditionally handled by the
manufacturers (Mayer, 2009). On the other hand, Herstein and Jaffe (2007) argue that
developed markets offer high-quality PL with the purpose to supply consumers’ demands.
Nevertheless, in emerging economy the PL tends to have an average quality, which limits its
attraction to clients not defined as price-sensitive.

19
Table 2 – Four types of Private Labels
Source: Kumar and Steenkamp, 2007
Four types of Private Labels
Generic private
labels
Copycat brands Premium store brands Value innovators
Examples No-name black-and-
white packages
marked soap,
shampoo, bread
• Walgreens
shampoo
• Osco
vitamins
• Quill office
products
• President’s Choice
• Body Shop
• Tesco Finest
• Aldi
• H&M
• IKEA
Strategy Cheapest-
undifferentiated
Me-too at a cheaper
price
Value added Best performance-
price ratio
Objectives • Provide
customer
with a low-
price
• Expand
customer
base
• Increase
negotiating
power
against
manufacturer
• Increase
retailer share
of category
profits
• Provide added-value
products
• Differentiate store
• Increase category
sales
• Enhance margins
• Provide the
best value
• Build
customer
loyalty to
store
• Generate
word of
mouth
Branding No brand name, or
identified as first
brand leader
Umbrella store brand
or category-specific
own labels
Store brand with subbrand or
own label
Meaningless own
labels to demonstrate
variety
Pricing Large discount, 20%-
50% below brand
leader
Moderate discount,
5%-25% below brand
leader
Close to or higher than brand
leader
Large discount, 20%-
50% below brand
leader
Category
coverage
Basic functional
product categories
Originates in large
categories with strong
brand leader
Image-forming categories,
often fresh products
All categories
Quality to
brand leader
Poor quality Quality close to
branded
manufacturers
Quality on par or better,
advertised as better
Functional quality on
par with brand leader
but with removal of
“non-value-adding”
product features and
imagery
Product
development
None; product put up
for contracts to
manufacturers with
lagging technology
Reverse engineered
using manufacturers
with similar
technology
Considerable effort to develop
best products with similar or
better technology
Considerable effort
and innovation in
terms of cost-benefit
analysis
Packaging Cheap and minimal As close to brand
leader as possible
Unique and source of
differentiation
Unique but cost-
efficient
Shelf
placement
Poor; less visible
shelves
Adjacent to brand
leader
Prominent eye-catching
positions
Normal as all over
store
Advertising/
promotion
None Frequent price
promotions
Featured in advertisements but
limited price promotions
Store not own-label
advertising, normal
promotion schedule
Customer
proposition
Sold as cheapest-
priced product
Sold as same quality
but lower price
Sold as best products on
market
Sold as best value-
price of generics but
objective quality on
par with brand leaders

20
2.2 The impact of generic product and PL on NB
Since the late 1970s, Generic Product and Private Label (PL) have been affecting intra-brand
competition, specially the secondary and tertiary National Brand (NB) by reducing their
market share (Moutinho, 1987; Hughes, 1996; Pauwels & Srinivasan, 2004; Hyman et al,
2010). “No-frill product” and “no-name product” are synonymous to Generic Product, which
has austere packing. It is owned and controlled by a retailer or distributor. The pack does not
show a name and contains only essential information about the product (Moutinho, 1987;
McEnally & Hawes, 1984; McGoldrick & Sheath, 1981). It is important to note that Generic
Product in this context is not related to generic drugs.
Retailers introduced generic products (no-frill products) in their assortment in the second half
of the 1970s. It started in France at Carrefour in 1976 and U.S. retailers in 1977. The Generic
Product proliferation reached many countries such as UK, Canada, Australia, Japan, Holland,
Germany, Sweden, Ireland, and Belgium (Crittenden & Hawes, 1979; McGoldrick & Sheath,
1981; Moutinho, 1987; Goormans, 1981; Nandan & Dickinson, 1994). During the 1980s the
quality and price gap between PL and NB were reduced and sales of PL and generic products
increased in this period as a demonstration of the acceptance by customers (McGoldrick,
1984; De Chernatony, 1988; Nandan & Dickinson, 1994; Hoch & Banerji, 1993).
In this period, brand managers were under great pressure to generate short-term cash flow,
developing and justifying long-term marketing strategies to add value to NB manufacturers in
a context of changing the relationship between retailers and manufacturers (Shocker et al,
1994). Two relevant questions have arisen: is cutting price the best answer to compete with
PL? How about implementing non-price strategies to increase the brand value? (Sethuraman
& Cole, 1999). An example of this critical moment occurs in 1993 when the price of
Marlboro was cut to compete with PL and “Wall Street analysts interpreted the price cut as
the death knell of brands; Philip Morris’s stock lost $14 billion of its value; and the stocks of
the top 25 consumer packaged-goods companies collectively lost $50 billion in value”
(Quelch & Harding, 1996, p. 100). It is also known as “Marlboro Friday” (Shocker et al,
1994). In general, to deal with the PL and generic product competition, some NB
manufacturers reduced their prices (Harris & Strang, 1985; Nandan & Dickinson 1994;

21
Sethuraman & Cole, 1999) and reduced or eliminated advertising investments or shifted them
to trade promotion (Harris & Strang, 1985; Hoch et al., 2002). The nature of competition
between NB and PL remains relevant. Ailawadi and Keller (2004) highlighted the expansion
of promotions and PL as a sign of retailer strength.
2.3. Marketing mix elements
The shift from a sales-oriented to a marketing-oriented approach led to the development of the
marketing mix theory (Zineldin & Philipson, 2007). The marketing mix concept was
elaborated in 1953 and it is attributed to Neil Borden (Van Waterschoot & Van den Bulte,
1992; Zineldin & Philipson, 2007). The Marketing Mix elements were: product scanning;
price policy; branding; distribution channels; personal sales; promotions; advertising,
packaging, display, services; physical handling; discovery of facts and analysis. Many
approaches were proposed, but only McCarthy’s prospered and became the dominant design,
which identified four classes: Product, Price, Place (Distribution), and Promotion. Promotion
was sub-divided in advertisement, personal sales, publicity, and sales promotion (Van
Waterschoot & Van den Bulte, 1992).
Marketing Mix elements such as Weighted Distribution, Price, Special Offers/Discounts, and
Feature/Display have become a regular instrument to NB, which have been measured in a
regular basis, and are available as syndicated data throughout the world by research
companies. It is the kind of information that marketing executives are familiarized with and
they have been using it to monitor a brand’s performance. Ataman et al. (2010) studied the
integrated role of the marketing mix (advertisement, price promotion, product, and
distribution) on the performance of consolidated brands in the short and long run. The main
conclusions from the research are that all elements of the marketing mix have a positive
impact in the short term but in the long term, sales are negatively affected by discounts.
Product line length and distribution positively stand out in the long run. Venkatesan et al.
(2015) analyzed the effects of marketing mix actions adopted by brands in Traditional Stores
(mom and pop stores) and Chain Self-Service Stores (supermarkets and hypermarkets) in an
emerging economy (Brazil). Some relevant conclusions must be mentioned: Product variety
of sizes, price and the fact that merchandising impacts sales more intensively on Chain Self-
Service Stores than in Traditional Stores; Promotion inside stores has relevant impact on sales

22
in Chain Self-Service Stores and CPG industries must to adapt their offers to each
channel/store format.
Figure 1 - Summary of the literature review
Source: Author
3. THEORETICAL FRAMEWORK AND RESEARCH QUESTION
The interest of academics and practitioners in measuring the impact of marketing investments
on NB's performance is growing. (Slotegraaf & Pauwels 2008). Vectors of Auto Regression
(VAR) have been used in the marketing field to understand the residual effect on sales
through the impulses/shocks in the elements of the marketing mix. In-store promotion is a
relevant topic given the amount of investment made by manufacturers of NB. Ailawadi et al.
(2009) pointed out the increase of in-store decisions by consumers, the strength of retailers in
the negotiation and more media alternatives to communicate with consumers/shoppers.
Researches conducted in mature economies show positive residual effects in the short term,
and negative or neutral in long term. The effects of promotional actions on revenue take place
during the period of accommodation of the promotional actions but they are not permanent.
After the promotional effect, the results, in general, go back to their previous trend because
they are more tactical than strategic actions (Pauwels & Srinivasan 2004). Ataman et al.
(2010), for instance, identified a positive effect of promotion in the short term but a negative

23
effect in the long term for part of the promotion under scrutiny. Dawes et al. (2013) argue that
frequent promotions may not contribute for NB to recover market share. On the other hand, a
studied conducted by Slotegraaf & Pauwels (2008) identified a positive effect of promotion in
the long run. In Brazil, an emerging market, distribution is the variable that allows long-term
results for more categories and price tiers segments, but price and promotion also deliver
long-run responses in a very similar intensity. However, it can vary by category and price tier
positioning
Table 3 – Studies that used time series and auto regressive models related to marketing mix
AUTHOR (S) TITLE OF THE
ARTICLE
FINDINGS
Bronnenberg
et al. (2000)
The Emergence of Market
Structure in New Repeat-
Purchase Categories
Brands in young categories have a temporary positive
relationship between market share and distribution. Over time,
this benefit decreases, and the share growth effects are only
temporary. In mature categories, distribution loses relevance and
price increases its relevance.
Pauwels et al
(2002)
The long-term effects of
price promotions on
category incidence, brand
choice, and purchase
quantity.
In mature markets, there is a balance between brand choices. The
price reduction only provides temporary benefits for the
established brands. Promotional effects last at most eight weeks.
The promotion with price can induce purchases of non-buyers.
Srinivasan et
al. (2004)
Do Promotions Benefit
Manufacturers, Retailers,
or Both?
The effects of promotional actions on revenue take place during
the accommodation period of the promotional actions but they
are not permanent. After the promotional effect, the results, in
general, go back to their previous trend because they are more
tactical than strategic actions.
Slotegraaf and
Pauwels (2008)
The impact of brand equity
and innovation on the long-
term effectiveness of
promotions
Promotional marketing actions can generate permanent sales
benefits for NB and brand equity plays an important role. The
introduction of new items, which has something new to
communicate to customers, can positively contribute to the
effectiveness of promotional marketing.
Ataman et al.
(2008)
Building Brands All elements of the marketing mix have a positive effect on
sales. Distribution is the main marketing mix element for success
in the market and can explain sales differences between regions.
Discount positively impacts sales in the short term but brings
negative results in long-term.
Ataman et al.
(2010)
The Long-Term Effect of
Marketing Strategy on
Brand Sales
The stimuli in the elements of marketing mix generate a positive
return in the short term. Product and distribution have a greater
effect in the long term. Sales boost sales in the short term, but
negative in the long term.
Venkatesan et
al. (2015)
Consumer Brand
Marketing through Full-
and Self-Service Channels
in an Emerging Economy
There are differences in the effectiveness of marketing mix
elements between channels. The effectiveness of Marketing mix
actions differs between developed and emerging countries.
Having product lines for each channel is an important aspect.
Analyses point out that increasing the space in the gondola does
not necessarily generate a positive result on sales.
Source: Author
This study aims to understand by means of descriptive statistics the residual effects on NB
and PL sales generated by the 1% impulses/shocks on independent variables as Weighted

24
Distribution, Price Index and in-store promotions. It is important to point out that, in this
study, two types of promotions were analyzed: Special Offers/Discounts (gifts, temporary
price reductions, coupons, extra-content, free sample), and Feature/Display (additional places
as end-shelf, island and display beyond its natural place as shelf) and time series comprises an
interval of 25 months (November 2013 to November 2015). This research analyzes and
compares the sales performance of NB and PL as a response of impulses on Weighted
Distribution, Price and In-store promotion. It is expected that the impulse-response is different
to NB and PL. The VAR model was used to analyze these sales residual effects on short term
(in this study, the following month) and long term (period of six months).
Based on the literature review, the following research question was elaborated: Do the
impulses in Weighted Distribution, Price and in-store promotion generate different responses
in sales for NB and PL in the long run?
Figure 2 – Weighted Distribution, Price, In-store promotions and their residual effects on
sales
Source: Author
25
4. MARKET, CATEGORIES AND VARIABLES STUDIED
Greater São Paulo is globally ranked as the fifth in terms of urban population (United Nation,
2016) and consequentially the most relevant economic metropolitan area in Brazil. It counts
with the presence of five of the six national retailers, accounting nationwide for 87% of PL’s
sales (Nielsen, 2016a). According to Senaure and Venturine (2005) the growth of PL in
emerging markets is associated to presence of global retailers that brings their knowledge
from their home markets. The greater São Paulo is also the headquarters of European retailers
(Carrefour group, Casino group, Dia% group) and North American (Walmart group). These
retailers also operate multiformat stores such as hypermarkets, supermarkets, and
neighborhoods stores.
Table 4 – Brazil and Greater São Paulo - Facts
Variable Brazil7 Greater São Paulo8 % of the total (Brazil)
Population (2016) 206,081,432 20,579,717 9.99%
GDP (2014)*9 US$ 2,2 US$ 385 million 17.7%
Number of self-service Stores10 83.573 5006 4.2%
*US$ exchange rate: R$ 2,6577 (December 21, 2014)
4.1. Powered Coffee category definition
Product obtained from the fruit of the coffee tree, which, after toasting and grinding, is used to
prepare the beverage (coffee). It excludes instant coffee, ground or in-store packaged coffee,
diet coffee, unbranded products, products of unknown manufacture, raw coffee beans, coffee
and milk mixtures, and cappuccinos.
4.2. Ready-to-drink Juice category definition
Products made of fruit or artificial flavors, whether sugar-added or not, that do not require the
addition of water or other liquids for consumption. Exclusions: coconut water, frozen fruit
pulp, juice made with fermented milk, ready-to-drink fruit-flavored (such as Tonyu, Ades,
9 BCB. (2017). Available at http://www.bcb.gov.br/pec/GCI/PORT/readout/R20170714.pdf. Accessed on July
22, 2017. 10 Nielsen Brazilian food retail structure (2015)

26
fruit syrups, fruit and soy-based products), children’s juice, carbonated juice, diet products
and juice sold in plastic cups.
4.3. Biscuit/Cookie category definition
Products made of milk, eggs, butter, flour, water, sugar or salt, used as a meal, snack,
appetizer and/or to be consumed with drinks, excluding biscuits made of rice, starch, corn
meal, in-store manufactures, diet biscuits, snacks, sandwich cookies in packages containing
up to 2 units, packages containing up to 9 units, ice cream cones, cream-filled wafer tubes,
cereal-based foods, toaster biscuits and breadsticks.
Although these categories are allocated in the food basket, their market structures are
different. Powdered Coffee is not present in all stores and stands out the fact that the top three
brands have the same market share in revenue in Brazil and in Greater São Paulo (46%).
Biscuit/Cookie is a very pulverized category with no relevant brand concentration, which
means that the top 3 brands hold only 2% of revenue market share. On the other hand, Ready-
to-Serve Fruit Juice has three brands that have expressive market share in Greater São Paulo
(59%).
Table 5 – 2014 Categories Key Facts – Greater São Paulo (GSP)
Variables Powdered Coffee Biscuit/Cookie Ready-to- serve Fruit
Juice
Region Brazil GSP Brazil GSP Brazil GSP
Total sales (US$ 1000) 2,156,614 211,348 4,156,462 378,238 2,015,368 298.274
Household penetration 95.0% 95.4% 99.9% 99.7% 81.4% 87.6%
Category Numeric Distribution
Self-Service Food Stores Above 95% Above 95% 100% 100% Above 95% 100%
Revenue Market Share of three
main NBs 46% 46% 7% 2% 47% 59%
Source: Nielsen Tendências 2015
These three categories are offered to end-consumers through different formats and sizes of
brick and mortar food stores between chain self-service and traditional full service. The data
was analyzed in the consolidated way, which means brick and mortar food stores with data
available by each National Brand. The data of PL is consolidated at level market (Greater São

27
Paulo). This database does not show information by individual retailer or PL, i.e., all the PL
data of Carrefour group, Casino group (GPA), Dia% group and Walmart group, among others
is analyzed together. In this study, the information on wholesale by self-service food stores
that belongs to these groups, such as the Atacadão, Assaí and Maxxi, the Brazilian hard
discount format will not be considered. Only the hypermarkets, supermarkets and
neighborhood stores of these companies will be analyzed.
The analysis relies on a longitudinal and integrated database of Brazilian retail sales to
consumers from November 2013 to November 2015 at market level product (i.e. all food self-
service stores). This database is from Nielsen, a renowned global research company. Nielsen
has released this data to protect recent marketing initiatives from Manufacturers and Retailers.
The following variables were available for this study:
Table 6 – Variables
Variables National Brand – market
level
Private Label – market level
Aggregated data of all retailers that
sell PL in the Greater São Paulo
Unit sales Kilos or Liters sold to
consumers Kilos or Liters sold to consumers
PRODUCT
Category structure National Brand
PL data from different retailers are
consolidated in one total as one PL
DISTRIBUTION NB weighted distribution
(%)
PL (all retailers)–weighted
distribution (%)
PRICE
Relative price index
Price elasticity
NB average weighted price
divided by category average
weighted price and
multiplied by 100
PL average weighted price divided by
category average weighted price and
multiplied by 100
IN-STORE PROMOTIONS
Special Offers /Discounts
Gifts, price reductions, coupons, extra-
content, free sample)
Feature/Display
Additional places as end-shelf, island
and display beyond its natural place
(shelf)
Weighted Distribution (%) indicates the importance of category
revenue in stores that have this kind of promotion.
Source: Author

28
5. METHODOLOGY
Seeking to address the research question and to contribute to the current literature on NB and
PL in an emerging market, this study intends to apply the quantitative approach to verify how
the variables obtained in retail can be integrated in an econometric model. This chapter
presents the method that was used to approach the research question. According to Gil (1999)
the method helps the researcher by providing guidance and techniques that allow the
development of the research, and more specifically, the method helps the processing of the
compiled data as well as the validation of the model and analyses. Thus, it is essential that the
methodology can expound the knowledge clearly and offer adequate means to achieve the
study results (Godoi & Balsini, 2006).
Table 7 – Research Project General Operationalization View
Step 1 Step 2 Step 3 Step 4
Creating
Relative
Price Index
Econometric tests (Unitary
Root test; Discrepancy test;
Co-integration test)
Applying VAR - vectors of
auto regression to analyze the
effects of marketing mix
elements on sales
Applying impulse response to
analyze the short and long
effects of marketing mix
elements on sales
Source: Author
Another aspect approached in this study is a descriptive research on the relation of the
marketing variables. According to Fávero et al. (2009), a descriptive research allows for a
better understanding of the data, identifying trends and atypical variations, through graphics
and tables. The long-term variations of the marketing variables can also be identified by
impulses in the variations of the other variables. Complementing the definition, Hair (2005)
describes a descriptive research as an analysis of the events developed from statistical
methods. Therefore, this dissertation can be defined as a quantitative descriptive study.
5.1. Relative Price Index
The compilation of the Price Index in this study had three stages. Firstly, by calculating the
category and segment average weighted price by dividing sales revenue per volume (Kilos or
Liters). Secondly, by dividing each NB weighted average price by category/segment weighted
average price at market level of greater São Paulo. Thirdly, by multiplying the result by 100

29
to get the Relative Price Index. Due to the fact that the data of PL is an aggregate of all
retailers at market level (Greater São Paulo), the Relative Price Index was calculated by
dividing the total PL average weighted price by the category/segment average weighted price
and finally multiplied by 100.
5.2. Econometric models – VAR – Vectors of Auto Regression
The econometric model chosen was used by Venkatesan et al. (2015) to estimate the effects of
the marketing strategies for different regions and channels in Brazil. The Vectors of Auto
Regression model (VAR) have become a dominant tool for studies of temporal series,
especially due to its characteristics of interconnecting variables to create a model
(Bruggermann, 2004; Vartanian, 2010). Other techniques can be used for multivariate
analyses such as the vector autoregressive with errors correction model (VECM) and dynamic
linear models.
[
𝑆𝑎𝑙𝑒𝑠𝑐𝑖𝑗𝑡
𝑃𝑟𝑖𝑐𝑒𝑖𝑛𝑑𝑒𝑥𝑐𝑖𝑡
𝑊𝑒𝑖𝑔ℎ𝑡𝑒𝑑𝐷𝑖𝑠𝑡.𝑐𝑖𝑡
𝑆𝑝𝑒𝑐𝑖𝑎𝑙 𝑜𝑓𝑓𝑒𝑟𝑠 𝑎𝑛𝑑 𝑑𝑖𝑠𝑐𝑜𝑢𝑛𝑡𝑠𝑐𝑖𝑡
𝐹𝑒𝑎𝑡𝑢𝑟𝑒/𝐷𝑖𝑠𝑝𝑙𝑎𝑦𝑐𝑖𝑡
]
= [
𝛼1𝑖𝛼2𝑖𝛼3𝑖𝛼4𝑖𝛼5𝑖
] + [
𝛾1𝑡𝛾2𝑡𝛾3𝑡𝛾4𝑡𝛾5𝑡
]
+ [
𝛽11𝑐… 𝛽15𝑐
⋮ ⋱ ⋮𝛽51𝑐
… 𝛽55𝑐
][
𝑆𝑎𝑙𝑒𝑠𝑐𝑖𝑡−1
𝑃𝑟𝑖𝑐𝑒𝑖𝑛𝑑𝑒𝑥𝑐𝑖𝑡−1
𝑊𝑒𝑖𝑔ℎ𝑡𝑒𝑑𝐷𝑖𝑠𝑡.𝑐𝑖𝑡−1
𝑆𝑝𝑒𝑐𝑖𝑎𝑙 𝑜𝑓𝑓𝑒𝑟𝑠 𝑎𝑛𝑑 𝑑𝑖𝑠𝑐𝑜𝑢𝑛𝑡𝑠𝑐𝑖𝑡−1
𝐹𝑒𝑎𝑡𝑢𝑟𝑒/𝐷𝑖𝑠𝑝𝑙𝑎𝑦𝑐𝑖𝑡−1
] + [
𝜀1𝑐𝑖𝑡𝜀2𝑐𝑖𝑡𝜀3𝑐𝑖𝑡𝜀4𝑐𝑖𝑡𝜀5𝑐𝑖𝑡
]
(1)
Where:
• 𝑆𝑎𝑙𝑒𝑠𝑐𝑖𝑗𝑡= sales in volume for SKUi, month t for category c;
• 𝑃𝑟𝑖𝑐𝑒𝑐𝑖𝑗𝑡= price for SKUi, month t for category c;
• 𝑊𝑒𝑖𝑔ℎ𝑡𝑒𝑑𝐷𝑖𝑠𝑡.𝑐𝑖𝑗𝑡= weighted distribution for SKUi, month t for category c;
• 𝑆𝑝𝑒𝑐𝑖𝑎𝑙 𝑜𝑓𝑓𝑒𝑟𝑠 /𝐷𝑖𝑠𝑐𝑜𝑢𝑛𝑡𝑠𝑐𝑖𝑗𝑡= exposition share for SKUi, month t for category c;

30
• 𝐹𝑒𝑎𝑡𝑢𝑟𝑒/𝐷𝑖𝑠𝑝𝑙𝑎𝑦𝑐𝑖𝑗𝑡= weighted distribution of promotions and displays for SKUi,
month t for category c;
• {𝛼1𝑖, 𝛼2𝑖
, … , 𝛼5𝑖}= SKU fixed effects;
• {𝛾1𝑡, 𝛾2𝑡
, … , 𝛾5𝑡}= time fixed effects;
• {𝜀1𝑐𝑖𝑗𝑡, 𝜀2𝑐𝑖𝑗𝑡
, … , 𝜀5𝑐𝑖𝑗𝑡} = random errors
5.2.1. Tests to assure the validity of the model
To achieve the objective of the analysis it is necessary to apply a few tests on the databank to
assure the validity of the model. Figure 3 presents the steps that will be taken for this
dissertation. Firstly, it will be required to assess if all series of data are stationary, i.e., it must
be verified that unitary roots in the series of data are absent (Ataman et. al., 2010). The second
step is to conduct the discrepancy test to verify which model best adapts vis-à-vis the number
of discrepancy periods needed for an analysis of autoregressive vectors (Pauwels et al., 2004).
The third step is to assess how the variables relate to themselves in the long run applying the
co-integration test (Hanssens et al., 2003). The interdependence of the autoregressions may
require the need to include additional equations to support the errors of the estimates (model
known as Vector Errors Correction – VEC).
Figure 3 – Data Analysis Steps
Source: Adapted from Pauwels (2004)
5.2.2 Unit Root Test
Unitary Root Test
•Verify if all series are stationary (absence of unitary root)
DiscrepancyTest
•Number of discrepancies needed for each series of data
Co-integrationTest
•Sum of autovalues must be greater than the critical value for all models
VAR Analysis
•Conduct the regressions for Sales

31
According to Makridakis, Wheelwright and Hyndman (1998), the use of unitary root analysis
allows to verify the stationary characteristics of the time series. For the regression analysis,
one of the hypotheses of the model is that the series are stationary, that is, they always vary
around the same mean.
In this way, shocks in marketing mix variables can suffer from unitary root effects when
looking at the long-term effects on the dependent variables. Then, it is advised that they are
initially identified and treated. (Hanssens, Parsons, & Schultz, 2003). The test used to verify
the existence of the unitary roots was the Dickey-Fuller test (ADF Test). The results can be
seen in Table 8 and Table 9 below:
Table 8 – Unit Root Test for National Brands
Constant Trend Critical Dickey-Fuller ADF
1% 5%
Coffee
Powder Biscuit/Cookie
Ready-to-
serve Fruit
Juice
Sales No No -2.58 -1.95
-3.99 -5.44 -0.85
Yes No -3.43 -2.86
-1.6 -3.35 -2.65
Yes Yes -3.96 -3.41
-1.55 -3.32 -2.67
Weighted distribution No No -2.58 -1.95
-4.26 -5.27 0
Yes No -3.43 -2.86
0.38 -1.3 -0.77
Yes Yes -3.96 -3.41
0.47 -1.36 -0.79
Special offers/
Discounts No No -2.58 -1.95
-23.34 -43.36 -18.25
Yes No -3.43 -2.86
-25.91 -47.56 -21.59
Yes Yes -3.96 -3.41
-25.94 -47.58 -21.64
Feature
/Display No No -2.58 -1.95
-15.47 -30.54 -11.04
Yes No -3.43 -2.86
-17.88 -34.03 -13.74
Yes Yes -3.96 -3.41
-18.04 -34.03 -13.76
Price Index No No -2.58 -1.95
-0.41 -3.45 -0.79
Yes No -3.43 -2.86
-6.71 -12.74 -3.76
Yes Yes -3.96 -3.41 -6.71 -12.73 -3.76
Source: The Author

32
Table 9 – Unit root test for Private Labels
Constant Trend Critical Dickey-Fuller ADF
1% 5% Coffee Powder Biscuit/Cookie
Ready-to-serve
Fruit Juice
Sales No No -2.58 -1.95
-0.1 -2.16 -0.6
Yes No -3.43 -2.86
-1.76 -1.99 -0.48
Yes Yes -3.96 -3.41
-1.75 -1.99 -0.5
Weighted
distribution No No -2.58 -1.95
-0.1 -2.2 -0.37
Yes No -3.43 -2.86
-2.5 -0.72 -0.46
Yes Yes -3.96 -3.41
-2.71 -0.84 -0.46
Special offers
/ Discounts No No -2.58 -1.95
-7.06 -13.96 -2.55
Yes No -3.43 -2.86
-8.13 -15.91 -2.72
Yes Yes -3.96 -3.41
-8.13 -15.9 -2.79
Feature/Displ
ay No No -2.58 -1.95
-6.38 -10.56 -1.41
Yes No -3.43 -2.86
-7.3 -12.03 -2.56
Yes Yes -3.96 -3.41
-7.33 -12.13 -2.55
Price Index No No -2.58 -1.95
-0.39 -1.4 0
Yes No -3.43 -2.86
-2.34 -3.61 -4.89
Yes Yes -3.96 -3.41 -2.37 -3.59 -4.93
Source: Author
5.2.3. Lag Test
Another criterion required for VAR analysis is to consider the number of lags that the model
will have, i.e. what is the number of previous periods that each endogenous variable must
include in the model so that it can explain itself and the other variables.
The criteria used to verify the lags were two: AIC (Akaike’s information criterion) and BIC
(Bayesian information criterion), which are widely used in the literature that uses VAR
modeling. As both criteria have distinct characteristics, it was found that applying these
techniques together was an appropriate way of reaching the level of lag (Burnham &
Anderson, 2004; Kuha, 2004).

33
Table 10 – AIC and BIC criteria for National Brands
Coffee Powder Biscuit/Cookie Ready-to-serve Fruit Juice
Lag MBIC MAIC MBIC MAIC MBIC MAIC
1 8.86E-31 8.86E-31 3.64E-30 3.64E-30 4.87E-29 4.87E-29
2 5.43E-29 5.43E-29 1.52E-29 1.52E-29 3.48E-28 3.48E-28
3 1.28E-28 1.28E-28 4.74E-29 4.74E-29 1.56E-28 1.56E-28
Source: Author
Table 11 – AIC and BIC criteria for Private Labels
Coffee Powder Biscuit/Cookie Ready-to-serve Fruit Juice
Lag MBIC MAIC MBIC MAIC MBIC MAIC
1 2.11E-30 2.11E-30 1.97E-30 1.97E-30 1.12E-30 1.12E-30
2 3.74E-28 3.74E-28 8.80E-30 8.80E-30 5.50E-30 5.50E-30
3 9.24E-27 9.24E-27 1.91E-29 1.91E-29 9.19E-30 9.19E-30
Source: Author
5.2.4 Cointegration Test
The cointegration test is used to verify the long-term equilibrium between the endogenous
variables (Pauwels, Hanssens, & Suddarth, 2002). Johansen (1991) presents a way to verify
the existence of cointegration by observing the eigenvalues of the coefficient matrix. The test
basically seeks a greater number of eigenvalues than the number of linear regressions.
If there is cointegration between the variables it is necessary to add vectors for the correction
of the error of the model, which is known as VECM (Srinivasan, Leszczyc, & Bass, 2000).
Table 12 – Cointegration test for coffee National Brands
Coffee Powder
Eigenvalue Trace Critical Value P-Value
Test of rank = 0 0.730 11657.46 6947.44 0.000
Test of rank = 1 0.725 8850.67 5382.06 0.000
Test of rank = 2 0.713 6079.30 3826.33 0.000
Test of rank = 3 0.641 3402.47 2297.15 0.000
Test of rank = 4 0.430 1206.21 922.61 0.000
Source: Author

34
Table 13 – Cointegration test for biscuit/cookie National Brands
Biscuit/Cookie
Eigenvalue Trace Critical Value P-Value
Test of rank = 0 0.704 36970.30 23053.37 0.000
Test of rank = 1 0.673 28017.06 17874.97 0.000
Test of rank = 2 0.647 19794.39 12924.02 0.000
Test of rank = 3 0.632 12126.37 8161.48 0.000
Test of rank = 4 0.478 4777.66 3514.02 0.000
Source: Author
Table 14 – Cointegration test for ready-to-serve fruit juice National Brands
Ready-to-serve Fruit Juice
Eigenvalue Trace Critical Value P-Value
Test of rank = 0 0.73237149 8005.985 4966.70 0.000
Test of rank = 1 0.72996286 5874.5277 3782.45 0.000
Test of rank = 2 0.59778859 3757.5582 2602.10 0.000
Test of rank = 3 0.5358543 2284.8311 1635.48 0.000
Test of rank = 4 0.47557322 1043.6918 769.00 0.000
Source: Author
Table 15 – Cointegration test for coffee powder Private Labels
Coffee Powder
Eigenvalue Trace Critical Value P-Value
Test of rank = 0 0.791 823.42 478.88 0.000
Test of rank = 1 0.738 601.24 366.58 0.000
Test of rank = 2 0.693 411.30 261.85 0.000
Test of rank = 3 0.596 243.84 163.52 0.000
Test of rank = 4 0.556 115.18 78.9 0.000
Source: Author
Table 16 – Cointegration test for biscuit/cookie Private Labels
Biscuit/Cookie
Eigenvalue Trace Critical Value P-Value
Test of rank = 0 0.75458816 3035.52307 1838.02 0.000
Test of rank = 1 0.71648504 2233.37228 1407.15 0.000
Test of rank = 2 0.65422651 1513.63227 998.04 0.000
35
Test of rank = 3 0.58160493 907.24662 624.48 0.000
Test of rank = 4 0.51205086 409.71768 292.38 0.000
Source: Author
Table 17 – Cointegration test for ready-to-serve fruit juice Private Labels
Ready-to-serve Fruit Juice
Eigenvalue Trace Critical Value P-Value
Test of rank = 0 0.85866325 444.483119 241.78 0.000
Test of rank = 1 0.77108705 309.477039 182.54 0.000
Test of rank = 2 0.71032776 207.742509 129.33 0.000
Test of rank = 3 0.65035112 122.251151 80.32 0.000
Test of rank = 4 0.51370021 49.744169 35.45 0.000
Source: Author
All the trace values are greater than the critical value in all the models. Due to this factor, it
was decided not to use any cointegration vector in the analysis.

36
6. RESULTS
A research conducted by Putsis (1997) concluded that understanding the competition between
NB and PL implies analyzing market share, local retail concentration, and trade promotion
aspects. The rival competition is not symmetric, not all the Marketing Mix actions require a
similar response and there is not a pattern of competition between the PL and the NB within
categories.
This study found long-term response of impulses on Weighted Distribution, Price and
Promotions. What stands out is the long-term results for both NB and PL, which means, for
instance, that an impulse of 1% on PL price or PL Special Offers/Discount increased sales in
the long term. Figures 4 to 6 provide a perspective of the residual effects on short term (an
immediate or contemporaneous response on the first month) and a long-term persistence
response (a response that is persistent for six-month). Although it is not possible to generalize,
these results give some “food for thought” about PL price sensibility which means there is
room to rethink PL positioning and price promotions because probably there are situations
that allow the improvement of gross margins.
Figure 4 – Persistent long-term residual effect of Special Offer/Discounts on PL sales
Source: Author
Figure 5 – Persistent long-term residual effect of Price on PL sales

37
Source: Author
Figure 6 – Persistent long-term residual effect of Price on PL sales
Source: Author
The results of the research demonstrate that the impulses in Weighted Distribution, Price and
in-store promotions provide more consistent results for NB than for PL regardless of the
category or price positioning. Potentially, there are 24 situations (3 categories × 2 tiers × 4
variables) that NBs can obtain residual effects on sales but in most of the situations (15 of 24),
there are no statistical significance. Powdered Coffee category stands out because only

38
Weighted Distribution variable generates short and long-term responses For PLs, the residual
effect of short and long term occurs for a much smaller number of situations (only 3 out of 24
possibilities).
Weighted Distribution is the variable that generates more long-term residual effects. Impulses
of 1% in Weighted Distribution contribute to the NB in the long term in the two price tiers
analyzed, which is observed for NB positioned in the High Price Tier (Powdered Coffee
0.196% and Biscuit/Cookie 0.283%) and Low-Price Tier (Powdered Coffee 0.178%,
Biscuit/Coffee 0.159%).
The analysis by tier brought different results for each promotional activity. For NB positioned
in the Low-Price Tier, the variable that generated long-turn residual effect was
Feature/Display (Ready-to-serve Fruit Juice 0.290% and Biscuit/Cookie 0.064%). For NB in
High Price Tier, the one that provided residual effect was Special Offers/Discounts (Ready-to-
serve Fruit Juice 0.114% and Biscuit/Cookie 0.038%). However, PL in Biscuit/Cookie
positioned in the Low-Price tier segment also presented a positive result on this variable,
showing that retailers also have an opportunity to increase sales with PL in the long run.
It is possible to observe that PL positioned in High Price Tier in Biscuit/Cookie category gets
positive long-term residual effects with the variable price (0.264%). In Ready-to-serve Fruit
Juice, the PL also stood out in Low Price tier also generating long-term residual effects on
Price (0.157%) and in Special Offers/discounts (0.135%). It confirms the consideration in the
begging of this study that retailers are investing and revamping PL in Brazil. The results also
confirm that it is possible for Retailers to get positive long-term responses on sales by
investing in PL. These examples corroborate the claim of Dhar and Hoch (1997) whose
analyses suggest that promotional support from the retailer can increase the performance of
PL.
Table 18 – Impulse response to NB and PL

39
Source: Author
7. CONCLUSIONS AND MANAGERIAL IMPLICATIONS
This study confirms that there are differences in the impulse-response between NBs and PLs
in an emerging market and among categories/price tiers. The result is also in line with Putsis
and Dhar (1998) and Dhar and Hoch (1997) that there are many factors that can influence NB
and PL sales performance at Point of Sale and they can vary by category and market
conditions. The categories analyzed in this study have different characteristics. In the
Powdered Coffee category, the first three brands hold 46% of market share revenue while in
Ready-to-serve Fruit Juice they hold 56%. Although the concentration in the top 3 brands is
high in both categories, the impulse response on the in-store promotion variables was not the
same. The long-term response to Powdered Coffee occurred only in Weighted Distribution for
NBs. There is no impulse response to PL. The impulse response to Ready-to-serve Fruit Juice
was also unique given the fact that an impulse in Weighted Distribution did not generate a
long-term response on sales but promotion did, including to PL Biscuit/Cookie category
presents the highest level of market share spreading. The top 3 brands hold only 2% of
revenue in the category and NB and PL sales respond positively to the impulses in all
marketing mix elements to NB. PL also showed long-term impulse response in Biscuit
Category in Special Offers/Discounts and Price.
This study confirms the positive impulse response of the elements of Weighted Distribution
Price and In-store promotions by the residual effects on sales in the long term and it is
Weighted Distribution Feature/Display Special Offers/Discounts Price Index
NB-Powdered Coffee | High Price Tier ST(0.042) LT(0.196) n.s. n.s. n.s.
NB-Powdered Coffee | Low Price Tier ST(0.038) LT(0.178) n.s. n.s. n.s.
NB-Ready-to-serve Fruit Juice | High Price Tier n.s. n.s. ST(0.027) LT(0.114) n.s.
NB-Ready-to-serve Fruit Juice | Low Price Tier n.s. ST(0.051) LT (0.290) n.s. n.s.
NB-Biscuit/Cookie | High Price Tier ST(0.049) LT(0.283) n.s. ST(0.010) LT(0.038) ST(0.025) LT(0.125)
NB-Biscuit/Cookie | Low Price Tier ST(0.033) LT(0.159) ST(0.015) LT (0.064) n.s. n.s.
PL-Powdered Coffee | High Price Tier n.s. n.s. n.s. n.s.
PL-Powdered Coffee | Low Price Tier n.s. n.s. n.s. n.s.
PL-Ready-to-serve Fruit Juice | High Price Tier n.s. n.s. n.s. n.s.
PL-Ready-to-serve Fruit Juice | Low Price Tier n.s. n.s. n.s. ST(0.034) LT(0.157)
PL-Biscuit/Cookie | High Price Tier n.s. n.s. n.s. ST(0.053) LT(0.264)
PL-Biscuit/Cookie | Low Price Tier n.s. n.s. ST(0.037) LT (0.135) n.s.
n.s. = not significant/90% of confidence interval
Short-Term (ST) and Long-Term (LT) ELASTICITY of residual effects on sales
NATIONAL BRAND
PRIVATE LABEL

40
partially aligned with Ataman et al. (2010) findings which means that Weighted Distribution
is the most relevant and consistent element of marketing mix for NB (sales impulse response).
The study took into consideration all NBs within each category in desegregated way.
Although there are differences with the study conducted by Slotegraaf and Pauwels (2008),
both presented a positive impulse response for promotion in the long term.
Although it is a weak signal, considering that in only three situations it was possible to see PL
benefiting from long-term impulse responses (Biscuit/Cookie in Price Index and Special
Offers/Discounts, Ready-to-serve Fruit Juice in Price Index), such result indicates that there
are retailers investing in a differentiated positioning for PL, including in a segment of higher
value added. The result suggests that, from the shopper’s perspective, PLs in Ready-to-serve
Fruit Juice and Biscuit/Cookie are perceived in a differentiated way and it is possible to obtain
long-term responses to the impulses made, which means a positive price elasticity during the
period analyzed.
This study did not analyze results from financial perspective but differently from mature
economies, it was possible to realize that, in terms of sales, the in-store promotions can
generate long-term results at least to the three categories that were analyzed in this study.
Srinivasan et al. (2001) concluded in their studies that promotion only allows tactical results
for Manufacturers and negative effects in retailer’s margins.
The analyses carried out in this study are in line with the general conclusions of international
studies. The study reinforces the findings of previous researches that the results of one or a
few categories cannot be generalized because there are differences between countries, regions
within the country, retailers and even within the same category. Social, economic, and cultural
aspects of society; demographic profile, structural characteristics of the category, consumer
habits, previous experiences of consumers with PL make each category unique.
Seth (2011) invited researchers of the marketing field to take a new look at emerging markets.
The expectation is that this research can make its modest contribution from an emerging
market perspective.

41
7.1. Managerial implications
From a practical point of view, there are six central messages in this study: 1) Impulses
applied to the variables analyzed and the responses obtained in a category/segment cannot be
generalized. What is true for a given category/segment in a given context will be no more than
an assumption for another category. Thus, it can not be accepted as a truth without due proof;
2) Weighed Distribution is the element that provided a more generalized, consistent result,
considering the categories studied; 3) Understanding the positioning of NB within the
category is a critical factor in making decisions about which stimuli to invest. This study has
provided suggestions that the impulses in Feature/Display and Special Offers/Discounts
generate different responses not only by category but also within the category itself,
depending on the positioning of the brand; 4) This study demonstrated that there are retailers
placing PL differently within the categories/segments and obtaining, in the long term, positive
responses to these impulses; 5) The study also creates the conditions to discuss paradigms
about the binomial quality/price, since there are retailers positioning PL above the average
price of the category and obtaining results in sales in the long term; 6) The price is the most
challenging variable and segmentation analysis has shown that there are initiatives from both
NB and PL so that this element of the marketing mix also provides long-term results. There is
not only one way to run NB or PL. It is necessary to learn from the global perspective and
take into consideration local market characteristics, especially in-store promotion (Steenkamp
& Geyskens 2014)
7.1.1. Implications to National Brand
Presence of NB in Point-of-Sale. Weighted Distribution showed up as the variable that
provides long-term residual effects for more segments. One of the challenges is to ensure this
presence in the Point-of-Sale and avoid Out-of-Stock (OOS), which may compromise the
potential residual effect on sales. According to a study conducted by Accera (2015), a
technological supply chain company, the out-of-stock is around 11% for big and medium
retailers are considered. It is a critical aspect that can impact negatively the potential results of
Weighted Distribution.

42
Promotion. There is a global issue associated with the effectiveness of in-store promotion,
which was confirmed in this study given fact that the significance of residual effects was
reached in less than half of the potential situations. According to a Nielsen Study (2017), 52%
of the categories increased the promotional intensity in 2016 but only 27.4% of the
promotional sales increased volume. Kantar WorldPanel (2017) demonstrated that Brazil is
among the countries with the highest promotional volume (Brazil 40.1%, Argentina 40%, and
UK 38%), but the incremental volume generated in the categories is less than the global
average. In sum, there is room to review the way that manufacturers and retailers are running
their promotions.
Based on the analysis performed, NB, which had a price position above the average of its
segment (High Price Tier), had significant residual effects with Special Offers and Discounts,
which may contribute to short and long-term results in an effective way. The challenge, once
again, is to monitor such initiatives in order not to gradually diminish the value of the brand
and to maintain the contribution of promotions to results without, in the long term,
compromising brand value. The result of this research, in Ready-to-serve Fruit Juice, seems to
confirm that consumers are more price-conscious (Steenkamp et al., 2010).
7.1.2. Implications to Private Label
Retail executives are, in essence, generalists because they manage a large number of
categories. Given the everyday challenges and the amount of short-term decisions, maybe
executives have to apply general assumptions and make quick decisions to run the business.
The analysis of the three categories suggests that general rules can lead to results below
expectations. Although changes are already observed, the mindset of retailers is the
distributor, i.e., to buy for the lowest price, to pay in the long term and to offer their target
customers the best price. However, to manage PL successfully, retailers will need to have a
team closer to the industry mindset and maximize the partnership with their PL suppliers.
Although this is the overall picture, the long-term impulse response on sales of PLs
Biscuit/Cookie and Ready-to-serve Fruit Juice suggests there is room for reaching better
results with PLs by positioning them differently inside the category and by using the correct
promotions tools.

43
Structure. The development and sustainability of PL depends on how retail acts. It is
necessary to have an alignment between strategy and structure. Paula et al. (2013) and
Oliveira (2016) point out the importance of having a dedicated structure/team for the PL,
responsible for its creation, development, and management. Paiva et al. (2006) suggest the
importance of having the different links in the chain aligned with quality and constancy by
their central role in the purchase propensity of consumers.
Product. Reducing the quality gap and investing in packing are vital to PL (Steenkamp &
Geyskens (2014). These initiatives will support retailers to stimulate shoppers to trial and
repeat the purchase by using comparison and experimentation, which can be done with
consumers at the point-of-sale but also with opinion formers on social networks.
8. LIMITATIONS OF THE STUDY AND SOME SUGGESTIONS FOR
FUTURE STUDIES
This study is characterized by bringing the dynamics of NB and PL from the perspective of
in-store promotions. However, it has two important limitations:
1) The information on PL is grouped at the market level, i.e., it is not open by a retailer, which
limits more assertive analysis within a specific retailer that has a differentiated strategy;
2) The NB was analyzed by Price Tier, but there are categories and NBs in different life cycles,
with low and high market share, which means that the study has showed the average pattern,
meaning an advance for Brazil and a good contribution but a room to enhance and
implementing new possibilities;
3) The data is about food self-service stores like supermarkets and the global retailers are also
investing in a Brazilian hard discount format;
4) Lack of financial information for cost evaluation.
These limitations actually create opportunities to broaden the understanding of the
relationships and effects of in store promotions:
1) To develop this study with information from a retailer that works with PL in different
categories, which would lead to more assertive analyses and a better understanding of
the interactions of the elements of the marketing mix with the market share and the
residual effects on the sales of both NB and PL;

44
2) Develop a study from the industry perspective to consider the investment in
advertising and the reflections in the POS, considering that there are industries that
regularly get information from stores;
3) The third opportunity would be to study how short-term actions of the elements of
marketing mix influence the value of the brand in the long term.
REFERENCES
Abril, C., & Martos-Partal, M. (2013). Is product innovation as effective for private labels as
it is for national brands? Innovation, 15(3), 337-349.
Abril, C., & Rodriguez-Cánovas, B. (2016). Marketing mix effects on private labels brand
equity. European Journal of Management and Business Economics, 25(3), 168-175.
Abril, C., & Sanchez, J. (2016). Will they return? Getting private label consumers to come
back: Price, promotion, and new product effects. Journal of Retailing and Consumer
Services, 31, 109-116.
Accera (2015). On-Shelf Availability. Brazil
Ailawadi, K. L., & Keller, K. L. (2004). Understanding retail branding: conceptual insights
and research priorities. Journal of retailing, 80(4), 331-342.
Ailawadi, K. L., Beauchamp, J. P., Donthu, N., Gauri, D. K., & Shankar, V. (2009).
Communication and promotion decisions in retailing: a review and directions for future
research. Journal of retailing, 85(1), 42-55.
Ataman, M. B., Mela, C. F., & Van Heerde, H. J. (2008). Building brands. Marketing
Science, 27(6), 1036-1054.
Ataman, M. B., Van Heerde, H. J., & Mela, C. F. (2010). The long-term effect of marketing
strategy on brand sales. Journal of Marketing Research, 47(5), 866-882.
Boyle, P. J., & Lathrop, E. S. (2013). The value of private label brands to US consumers: an
objective and subjective assessment. Journal of Retailing and Consumer
Services, 20(1), 80-86.
Brito, E. P. Z., Porto, É. C., Perrota, K., Brito, L. A. L., Neves, M., de Freitas Neto, R., ... &
Madazio, V. (2004). Marcas próprias no Brasil. Centro de Excelência do Varejo da
Escola de Empresas de São Paulo da Fundação Getúlio Vargas (FGV-EAESP).
Bronnemberg, B., Mahajan, V. & Vanhonacker, W. (2000). The Emergence of Market
Structure in New Repeat-Purchase Categories: The Interplay of Market share and
Retailer Distribution. Journal of Marketing Research, Vol. XXXVII (February 2000,
16-31
45
Brüggemann, R. (2004). Model reduction methods for vector autoregressive processes (Vol.
536). Springer Science & Business Media.
Burnham, K. P., & Anderson, D. R. (2004). Multimodel inference understanding AIC and
BIC in model selection. Sociological methods & research, 33(2), 261-304.
Burt, S. (2000). The strategic role of retail brands in British grocery retailing. European
Journal of marketing, 34(8), 875-890.
Burt, S. L., & Sparks, L. (2002). Branding experiences: corporate branding in
retail. Corporate Reputation Review, 5(2/3), 193-213.
Burt, S., & Davies, K. (2010). From the retail brand to the retailer as a brand: themes and
issues in retail branding research. International Journal of Retail & Distribution
Management, 38(11/12), 865-878.
Calvo-Porral, C., & Lévy-Mangin, J. P. (2014). Private label brands: major perspective of two
customer-based brand equity models. The International Review of Retail, Distribution
and Consumer Research, 24(4), 431-452.
Choi & Fredj. (2013). Price competition and store competition: Store brands vs. national
brand. European Journal of Operational Research 225 (2013) 166–178.
Collins-Dodd, C., & Lindley, T. (2003). Store brands and retail differentiation: the influence
of store image and store brand attitude on store own brand perceptions. Journal of
Retailing and Consumer Services, 10(6), 345-352.
Cotterill, R. W., & Putsis, W. P. (2000). Market share and price setting behavior for private
labels and national brands. Review of Industrial Organization, 17(1), 17-39.
Crittenden, W. F., & Hawes, J. M. (1979). Who Buys" No Frills" Grocery Products? Journal
of Food Distribution Research, 10(2).
Dawes, J., & Nenycz-Thiel, M. (2013). Analyzing the intensity of private label competition
across retailers. Journal of Business Research, 66(1), 60-66.
Dhar, S. K., & Hoch, S. J. (1997). Why store brand penetration varies by retailer. Marketing
Science, 16(3), 208-227.
Dekimpe, M. G., Gielens, K., Raju, J., & Thomas, J. S. (2011). Strategic assortment decisions
in information-intensive and turbulent environments. Journal of Retailing, 87, S17-S28.
De Chernatony, L. (1988). The fallacy of generics in the UK. Marketing Intelligence &
Planning, 6(2), 36-38.
De Chernatony, L., & McWilliam, G. (1989). The strategic implications of clarifying how
marketers interpret “brands”. Journal of Marketing Management, 5(2), 153-171.
Deloitte (2018). Global Powers of Retailing 2018.
46
Euromonitor. (2012). Global Retailing in 2012. Available at:
https://blog.euromonitor.com/2012/01/global-retailing-2012.html
Fávero, L. P., Belfiore, P., Silva, F. D., & Chan, B. L. (2009). Análise de dados: modelagem
multivariada para tomada de decisões.
Fernie, J., & Pierrel, F. R. (1996). Own branding in UK and French grocery markets. Journal
of Product & Brand Management, 5(3), 48-59.
Fornari, D., Fornari, E., Grandi, S., & Menegatti, M. (2016). Leading national brands facing
store brands competition: Is price competitiveness the only thing that matters? Journal
of Retailing and Consumer Services, 30, 234-241.
Geyskens, I., Gielens, K., & Gijsbrechts, E. (2010). Proliferating private-label portfolios: how
introducing economy and premium private labels influences brand choice. Journal of
Marketing Research, 47(5), 791-807.
Gil, C. A. (1999). Métodos e técnicas de pesquisa social. São Paulo: Atlas.
Godoi, C. K., & Balsini, C. P. (2006). A pesquisa qualitativa nos estudos organizacionais
brasileiros: uma análise bibliométrica. In: Godoi, C. K., Bandeira-De-Mello, R., &
Silva, A. D. (2006). Pesquisa qualitativa em estudos organizacionais: paradigmas,
estratégias e métodos. São Paulo: Saraiva, 2ª edição.
Gonzalez-Benito, O., Martos-Partal, M., & Fustinoni-Venturini, M. (2015). Brand equity and
store brand tiers An analysis based on an experimental design. International Journal of
Market Research, 57(1), 73-94.
Goormans, M. (1981). Generic Products in Belgium: Introduction and Conditions. European
Journal of Marketing, 15(1), 78-87.
Hair Jr, J. F., Anderson, R. E., Tatham, R. L., & Black, W. C. (2005). Análise Multivariada de
dados. Tradução: Adonai Schlup Sant ‘Anna e Anselmo Chaves Neto.
Hanssens, D. M., Parsons, L. J., & Schultz, R. L. (2003). Market response models:
Econometric and time series analysis (Vol. 12). Springer Science & Business Media.
Harris, B. F., & Strang, R. A. (1985). Marketing strategies in the age of generics. The Journal
of Marketing, 70-81.
Herstein, R., & Gamliel, E. (2004). An investigation of private branding as a global
phenomenon. Journal of Euromarketing, 13(4), 59-77.
Herstein, R., & Jaffe, E. D. (2007). Launching store brands in emerging markets: resistance
crumbles. Journal of Business Strategy, 28(5), 13-19.
Hoch, S. J., & Banerji, S. (1993). When do private labels succeed? Sloan management
review, 34(4), 57.

47
Hoch, S. J., Montgomery, A. L., & Park, Y. H. (2002). Why private labels show long-term
market share evolution.
Hughes, A. (1996). Retail restructuring and the strategic significance of food retailers' own-
labels: A UK—USA comparison. Environment and Planning A, 28(12), 2201-2226.
Hyman, M. R., Kopf, D. A., & Lee, D. (2010). Review of literature–Future research
suggestions: Private label brands: Benefits, success factors and future research. Journal
of Brand Management, 17(5), 368-389.
Johansen, S. (1991). Estimation and hypothesis testing of cointegration vectors in Gaussian
vector autoregressive models. Econometrica: Journal of the Econometric Society, 1551-
1580.
Kantar World Panel. (2017). Winning the Future special study. (Brazil)
Keller, K. O., Dekimpe, M. G., & Geyskens, I. (2016, July). Let your banner wave?
Antecedents and performance implications of retailers’ private-label branding strategies.
American Marketing Association.
Kumar, N., & Steenkamp, J. B. E. (2007). Brand versus brand. International Commerce
Review, 7(1), 46-53.
Kuha, J. (2004). AIC and BIC comparisons of assumptions and performance. Sociological
Methods & Research, 33(2), 188-229.
Laaksonen, H., & Reynolds, J. (1994). Own brands in food retailing across Europe. Oxford:
Oxford Institute of Retail Management.
Makridakis, S., Wheelwright, S., & Hyndman, R. (1998). Forecasting: Methods and
Applications. New York: John &Wiley Sons.
Mayer, J. M. (2009). Retailers and Private Label Brands: Current Knowledge and Directions
for Future Research.
McEnally, M. R., & Hawes, J. M. (1984). The market for generic brand grocery products: a
review and extension. The Journal of Marketing, 75-83.
McGoldrick, P. J., & Sheath, K. J. (1981). Generic products: their impact in the UK. Retail
and Distribution Management, 9(5), 10-14.
McGoldrick, P. J. (1984). Grocery generics—An extension of the private label
concept. European Journal of Marketing, 18(1), 5-24.
Mergermarket, trade reports, OC&C analysis. (2017). The FMCG Global 50 2017.
Morris, D. (1979). The strategy of own brands. European Journal of Marketing, 13(2), 59-78.
Moutinho, L. (1987). Generic products for retailers in a mature market. Marketing
Intelligence & Planning, 5(4), 9-22.

48
Nandan, S., & Dickinson, R. (1994). Private brands: major brand perspective. Journal of
Consumer Marketing, 11(4), 18-28.
Nielsen. (2014). The state of private label around the world, November 2014.
Nielsen. (2015). The path to efficient trade promotions (USA)
Nielsen. (2016) – Estudo de Marcas Próprias (Brazil Private Label Study) 2016.
Nielsen. (2017). 7 costly trade promotion mistakes to avoid
Oliveira, R. N. A. (2009). Gestão estratégica de marcas próprias. Brasport, Rio de Janeiro, 2ª
Edição,
Olbrich, R., Hundt, M., & Jansen, H. C. (2016). Proliferation of Private Labels in Food
Retailing: A Literature Overview. International Journal of Marketing Studies, 8(6), 63.
Paiva, E. L. et al. (2006). Implicações do comportamento do consumidor de marca própria
para as operações de varejo. ENANPAD 2006.
Paula, V. A. F. et al. Estratégia de marcas próprias ... entre Brasil e Inglaterra. Produção, v.
23, n. 1, p. 66-79, jan./mar. 2013
Pauwels, k., Risso, J. Srinivasan, S., Hanssens, D. (2003). The Long-Term Impact of New-
Product Introductions and Promotions On Financial Performance and Firm Value.
Pauwels, K. (2004). How dynamic consumer response, competitor response, company
support, and company inertia shape long-term marketing effectiveness. Marketing
Science, 23(4), 596-610.
Pauwels, K., & Srinivasan, S. (2004). Who benefits from store brand entry?. Marketing
Science, 23(3), 364-390.
Pauwels, K., & Srinivasan, S. (2004). Who benefits from store brand entry? Marketing
Science, 23(3), 364-390.
Pauwels, K., Hanssens, D. M., & Suddarth, S. (2002). The long-term effects of price
promotions on category incidence, brand choice, and purchase quantity. Journal of
marketing research, 39(4), 421-439.
Putsis, W. P. (1997). An empirical study of the effect of brand proliferation on private label–
national brand pricing behavior. Review of industrial Organization, 12(3), 355-371.
Putsis, W., & Dhar, R. (1998). The many faces of competition. Marketing Letters, 9(3), 269-
284.
Putsis Jr, W. P., & Cotterill, R. W. (1999). Share, price and category expenditure-geographic
market effects and private labels. Managerial and Decision Economics, 175-187.
Quelch, J. A., & Harding, D. (1996). Brands versus private labels: Fighting to win.

49
Rao, T. R. (1969). Are some consumers more prone to purchase private brands? Journal of
Marketing Research, 447-450.
Rossi, P., Borges, A., & Bakpayev, M. (2015). Private labels versus national brands: The
effects of branding on sensory perceptions and purchase intentions. Journal of Retailing
and Consumer Services, 27, 74-79.
Senaure & Venturini. (2005). The globalization of Food Systems: A conceptual Framework
and Empirical Patterns. The Food Industry Center.
Sethuraman, R., & Cole, C. (1999). Factors influencing the price premiums that consumers
pay for national brands over store brands. Journal of Product & Brand
Management, 8(4), 340-351.
Seth, Jagadish N. (2011). Impacting of Emerging Markets on Marketing: Rethinking Existing
Perspectives and Practices. Journal of Marketing, 75 (4).
Shocker, A. Srivastava, R.; Rueckert, R. (1994). Challenges and Opportunities Facing Brand
Management: An Introduction to the Special Issue Challenges and Opportunities Facing
Brand Management: An Introduction to the Special Issue. Journal of Marketing
Research Vol. XXXI (May 1994), 149-158.
Slotegraaf, R.; Pauwels, K. (2008). Journal of Marketing Research (JMR), Vol. 45 Issue 3,
p293-306
Srinivasan, S., Pauwels, K., Hanssens, D. M., & Dekimpe, M. G. (2001). Do promotions
benefit manufacturers, retailers, or both? Management Science, 50(5), 617-629.
Srinivasan, S., Leszczyc, P., Bass, F. (2000). Market share response and competitive
interaction: The impact of temporary, evolving and structural changes in prices. Intern.
J. of Research in Marketing 17 2000 281–305
Steenkamp, J. B. E., Van Heerde, H. J., & Geyskens, I. (2010). What makes consumers
willing to pay a price premium for national brands over private labels? Journal of
Marketing Research, 47(6), 1011-1024.
Steenkamp, J.B.E., Geyskens, I. M. (2014). Manufacturer and Retailer Strategies to Impact
Store Brand Share: Global Integration, Local Adaptation, and Worldwide Learning.
Marketing Science 33(1):6-26
Ter Braak, A., Dekimpe, M. G., & Geyskens, I. (2013). Retailer private-label margins: the
role of supplier and quality-tier differentiation. Journal of Marketing, 77(4), 86-103.
Van Waterschoot, W., & Van den Bulte, C. (1992). The 4P classification of the marketing
mix revisited. The Journal of Marketing, 83-93.

50
Vartanian, P. R. (2010). Choques monetários e cambiais sob regimes de câmbio flutuante nos
países membros do Mercosul: há indícios de convergência macroeconômica? Revista
Economia.
Venkatesan, R., Farris, P., Guissoni, L. A., & Neves, M. F. (2015). Consumer brand
marketing through full-and self-service channels in an emerging economy. Journal of
Retailing, 91(4), 644-659.
Zineldin, M., & Philipson, S. (2007). Kotler and Borden are not dead: myth of relationship
marketing and truth of the 4Ps. Journal of consumer marketing, 24(4), 229-241.

51
Appendices
Table A1.
Powder Coffee Cookies Ready-to-serve Fruit Juice
∆lshare Coef. s.d. t p>|t| Coef. s.d. t p>|t| Coef. s.d. t p>|t|
Interaction with…
Nacional Brands
Lagged ∆lshare -0.212 0.031 -6.92 0.000
-0.142 0.018 -7.86 0.000
-0.022 0.036 -0.61 0.544
∆l Weighted distribuition 0.939 0.093 10.13 0.000
0.834 0.046 18.03 0.000
0.651 0.113 5.74 0.000
∆l Special offers and discounts 0.023 0.007 3.27 0.001
0.015 0.004 3.45 0.001
0.029 0.008 3.64 0.000
∆l Feature/Display 0.021 0.009 2.22 0.027
0.020 0.004 4.86 0.000
0.024 0.013 1.80 0.072
∆l Relative Price Index -0.566 0.208 -2.72 0.007
-0.615 0.066 -9.30 0.000
-0.923 0.267 -3.45 0.001
Private Labels
Lagged ∆lshare -0.167 0.098 -1.70 0.090
-0.167 0.032 -5.24 0.000
-0.179 0.139 -1.28 0.200
∆l Weighted distribuition 0.578 0.344 1.68 0.093
0.932 0.156 5.99 0.000
-0.381 0.206 -1.85 0.065
∆l Special offers and discounts 0.028 0.022 1.28 0.200
0.020 0.023 0.84 0.400
-0.003 0.037 -0.09 0.925
∆l Feature/Display 0.004 0.072 0.05 0.958
0.008 0.011 0.73 0.463
-0.050 0.062 -0.81 0.419
∆l Relative Price Index -1.402 0.931 -1.51 0.132
-0.629 0.123 -5.12 0.000
0.096 0.714 0.13 0.893
Constant -0.030 0.002 -11.92 0.000
N. Obs 11901
d.f. 30
RMSE 0.29
Wald-Chi2 2220.46
R_squared 0.28
D-W 2.06
***Significant at p < 0.01; **Significant at p <0.05; * Significant at p<0.10
Source: The Author

52
Table A2. VAR analysis for national brand coffee
∆lsales Coef. Std. Err. z P>z
Lagged ∆lsales -0.227 0.060 -3.81 0.000
Lagged ∆lpriceindex 0.027 0.110 0.24 0.807
Lagged ∆lweighteddistribuition 0.289 0.095 3.04 0.002
Lagged ∆lpcvonpromo 0.003 0.008 0.4 0.692
Lagged ∆lfeatureddisplay 0.000 0.009 0.02 0.982
∆lpriceindex Coef. Std. Err. z P>z
Lagged ∆lsales 0.002 0.012 0.13 0.899
Lagged ∆lpriceindex -0.372 0.059 -6.27 0.000
Lagged ∆lweighteddistribuition 0.004 0.019 0.23 0.821
Lagged ∆lpcvonpromo -0.001 0.001 -1.11 0.266
Lagged ∆lfeatureddisplay 0.001 0.001 0.46 0.648
∆lweighteddistribuition Coef. Std. Err. z P>z
Lagged ∆lsales 0.014 0.029 0.48 0.630
Lagged ∆lpriceindex -0.012 0.057 -0.2 0.840
Lagged ∆lweighteddistribuition -0.081 0.056 -1.44 0.149
Lagged ∆lpcvonpromo 0.001 0.003 0.39 0.699
Lagged ∆lfeatureddisplay -0.002 0.004 -0.51 0.611
∆lpcvonpromo Coef. Std. Err. z P>z
Lagged ∆lsales 0.157 0.057 2.77 0.006
Lagged ∆lpriceindex 0.009 0.073 0.13 0.899
Lagged ∆lweighteddistribuition 0.026 0.088 0.29 0.771
Lagged ∆lpcvonpromo -0.388 0.028 -13.66 0.000
Lagged ∆lfeatureddisplay 0.026 0.028 0.93 0.355
∆lfeatureddisplay Coef. Std. Err. z P>z
Lagged ∆lsales 0.214 0.053 4.01 0.000
Lagged ∆lpriceindex -0.102 0.086 -1.19 0.235
Lagged ∆lweighteddistribuition 0.079 0.090 0.88 0.378
Lagged ∆lpcvonpromo 0.007 0.022 0.34 0.737
Lagged ∆lfeatureddisplay -0.397 0.029 -13.48 0.000
***Significant at p < 0.01; **Significant at p <0.05; * Significant at p<0.10
Source: The Author

53
Table A3. VAR analysis for national brand ready-to-serve juice fruit
∆lsales Coef. Std. Err. z P>z
Lagged ∆lsales 0.081 0.043 1.9 0.058
Lagged ∆lpriceindex 0.068 0.154 0.44 0.661
Lagged ∆lweighteddistribuition 0.045 0.066 0.68 0.498
Lagged ∆lpcvonpromo 0.023 0.008 3 0.003
Lagged ∆lfeatureddisplay 0.028 0.011 2.52 0.012
∆lpriceindex Coef. Std. Err. z P>z
Lagged ∆lsales -0.009 0.010 -0.86 0.392
Lagged ∆lpriceindex -0.146 0.061 -2.39 0.017
Lagged ∆lweighteddistribuition 0.034 0.017 2 0.045
Lagged ∆lpcvonpromo -0.003 0.002 -1.67 0.095
Lagged ∆lfeatureddisplay -0.005 0.003 -1.78 0.075
∆lweighteddistribuition Coef. Std. Err. z P>z
Lagged ∆lsales 0.044 0.023 1.93 0.053
Lagged ∆lpriceindex -0.115 0.091 -1.26 0.206
Lagged ∆lweighteddistribuition 0.003 0.053 0.05 0.958
Lagged ∆lpcvonpromo 0.002 0.004 0.55 0.584
Lagged ∆lfeatureddisplay 0.008 0.005 1.6 0.110
∆lpcvonpromo Coef. Std. Err. z P>z
Lagged ∆lsales -0.057 0.048 -1.19 0.234
Lagged ∆lpriceindex 0.005 0.149 0.03 0.975
Lagged ∆lweighteddistribuition 0.056 0.076 0.74 0.457
Lagged ∆lpcvonpromo -0.413 0.030 -13.92 0.000
Lagged ∆lfeatureddisplay -0.057 0.032 -1.79 0.074
∆lfeatureddisplay Coef. Std. Err. z P>z
Lagged ∆lsales 0.112 0.050 2.24 0.025
Lagged ∆lpriceindex 0.063 0.146 0.43 0.667
Lagged ∆lweighteddistribuition 0.071 0.072 0.98 0.325
Lagged ∆lpcvonpromo 0.053 0.023 2.35 0.019
Lagged ∆lfeatureddisplay -0.418 0.033 -12.73 0.000
***Significant at p < 0.01; **Significant at p <0.05; * Significant at p<0.10
Source: The Author
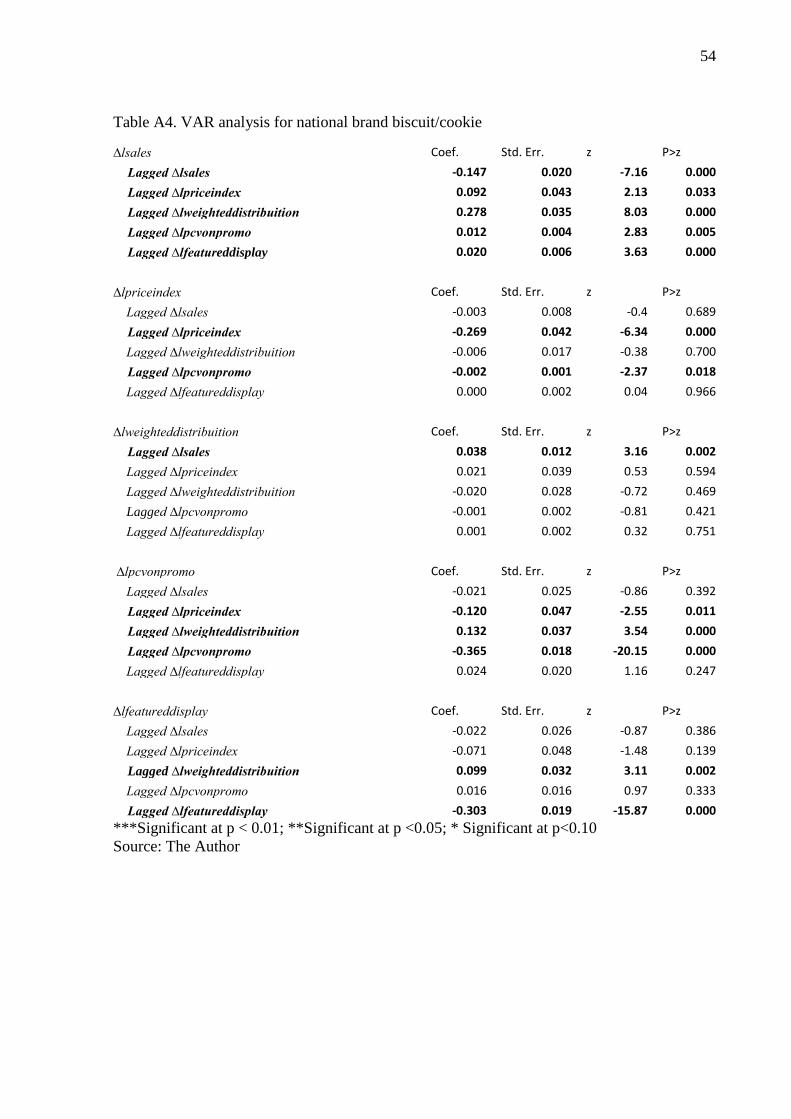
54
Table A4. VAR analysis for national brand biscuit/cookie
∆lsales Coef. Std. Err. z P>z
Lagged ∆lsales -0.147 0.020 -7.16 0.000
Lagged ∆lpriceindex 0.092 0.043 2.13 0.033
Lagged ∆lweighteddistribuition 0.278 0.035 8.03 0.000
Lagged ∆lpcvonpromo 0.012 0.004 2.83 0.005
Lagged ∆lfeatureddisplay 0.020 0.006 3.63 0.000
∆lpriceindex Coef. Std. Err. z P>z
Lagged ∆lsales -0.003 0.008 -0.4 0.689
Lagged ∆lpriceindex -0.269 0.042 -6.34 0.000
Lagged ∆lweighteddistribuition -0.006 0.017 -0.38 0.700
Lagged ∆lpcvonpromo -0.002 0.001 -2.37 0.018
Lagged ∆lfeatureddisplay 0.000 0.002 0.04 0.966
∆lweighteddistribuition Coef. Std. Err. z P>z
Lagged ∆lsales 0.038 0.012 3.16 0.002
Lagged ∆lpriceindex 0.021 0.039 0.53 0.594
Lagged ∆lweighteddistribuition -0.020 0.028 -0.72 0.469
Lagged ∆lpcvonpromo -0.001 0.002 -0.81 0.421
Lagged ∆lfeatureddisplay 0.001 0.002 0.32 0.751
∆lpcvonpromo Coef. Std. Err. z P>z
Lagged ∆lsales -0.021 0.025 -0.86 0.392
Lagged ∆lpriceindex -0.120 0.047 -2.55 0.011
Lagged ∆lweighteddistribuition 0.132 0.037 3.54 0.000
Lagged ∆lpcvonpromo -0.365 0.018 -20.15 0.000
Lagged ∆lfeatureddisplay 0.024 0.020 1.16 0.247
∆lfeatureddisplay Coef. Std. Err. z P>z
Lagged ∆lsales -0.022 0.026 -0.87 0.386
Lagged ∆lpriceindex -0.071 0.048 -1.48 0.139
Lagged ∆lweighteddistribuition 0.099 0.032 3.11 0.002
Lagged ∆lpcvonpromo 0.016 0.016 0.97 0.333
Lagged ∆lfeatureddisplay -0.303 0.019 -15.87 0.000
***Significant at p < 0.01; **Significant at p <0.05; * Significant at p<0.10
Source: The Author

55
Table A5. VAR analysis for private label coffee
∆lsales Coef. Std. Err. z P>z
Lagged ∆lsales -0.155 0.127 -1.22 0.221
Lagged ∆lpriceindex 0.161 0.178 0.91 0.365
Lagged ∆lweighteddistribuition 0.117 0.278 0.42 0.674
Lagged ∆lpcvonpromo 0.022 0.038 0.58 0.559
Lagged ∆lfeatureddisplay 0.000 0.041 0.01 0.992
∆lpriceindex Coef. Std. Err. z P>z
Lagged ∆lsales -0.006 0.052 -0.11 0.915
Lagged ∆lpriceindex -0.414 0.139 -2.97 0.003
Lagged ∆lweighteddistribuition -0.119 0.186 -0.64 0.522
Lagged ∆lpcvonpromo 0.002 0.008 0.28 0.783
Lagged ∆lfeatureddisplay -0.006 0.017 -0.32 0.746
∆lweighteddistribuition Coef. Std. Err. z P>z
Lagged ∆lsales 0.050 0.033 1.54 0.123
Lagged ∆lpriceindex 0.140 0.122 1.15 0.248
Lagged ∆lweighteddistribuition -0.127 0.082 -1.56 0.119
Lagged ∆lpcvonpromo -0.009 0.009 -0.94 0.348
Lagged ∆lfeatureddisplay 0.009 0.006 1.64 0.101
∆lpcvonpromo Coef. Std. Err. z P>z
Lagged ∆lsales -0.250 0.296 -0.85 0.398
Lagged ∆lpriceindex -0.184 0.439 -0.42 0.675
Lagged ∆lweighteddistribuition 0.358 0.434 0.82 0.410
Lagged ∆lpcvonpromo -0.357 0.107 -3.34 0.001
Lagged ∆lfeatureddisplay 0.126 0.166 0.76 0.446
∆lfeatureddisplay Coef. Std. Err. z P>z
Lagged ∆lsales 0.177 0.171 1.03 0.301
Lagged ∆lpriceindex 0.091 0.254 0.36 0.721
Lagged ∆lweighteddistribuition -0.328 0.277 -1.18 0.236
Lagged ∆lpcvonpromo 0.141 0.091 1.55 0.122
Lagged ∆lfeatureddisplay -0.219 0.110 -2 0.046
***Significant at p < 0.01; **Significant at p <0.05; * Significant at p<0.10
Source: The Author

56
Table A6. VAR analysis for private label Ready-to-serve juice fruit coffee
∆lsales Coef. Std. Err. z P>z
Lagged ∆lsales -0.013 0.133 -0.1 0.921
Lagged ∆lpriceindex 0.166 0.080 2.07 0.039
Lagged ∆lweighteddistribuition 0.149 0.111 1.34 0.179
Lagged ∆lpcvonpromo -0.040 0.028 -1.41 0.160
Lagged ∆lfeatureddisplay 0.033 0.023 1.43 0.154
∆lpriceindex Coef. Std. Err. z P>z
Lagged ∆lsales -0.020 0.122 -0.17 0.868
Lagged ∆lpriceindex -0.274 0.135 -2.04 0.042
Lagged ∆lweighteddistribuition 0.847 0.354 2.4 0.017
Lagged ∆lpcvonpromo 0.009 0.007 1.45 0.148
Lagged ∆lfeatureddisplay 0.011 0.010 1.17 0.243
∆lweighteddistribuition Coef. Std. Err. z P>z
Lagged ∆lsales -0.229 0.138 -1.66 0.096
Lagged ∆lpriceindex -0.058 0.049 -1.17 0.242
Lagged ∆lweighteddistribuition -0.600 0.137 -4.38 0.000
Lagged ∆lpcvonpromo 0.002 0.008 0.2 0.840
Lagged ∆lfeatureddisplay -0.004 0.010 -0.36 0.718
∆lpcvonpromo Coef. Std. Err. z P>z
Lagged ∆lsales -0.175 0.708 -0.25 0.804
Lagged ∆lpriceindex 0.036 0.071 0.51 0.613
Lagged ∆lweighteddistribuition -0.165 0.195 -0.84 0.399
Lagged ∆lpcvonpromo -0.447 0.134 -3.34 0.001
Lagged ∆lfeatureddisplay -0.148 0.130 -1.14 0.255
∆lfeatureddisplay Coef. Std. Err. z P>z
Lagged ∆lsales 0.245 0.460 0.53 0.595
Lagged ∆lpriceindex 0.054 0.099 0.55 0.583
Lagged ∆lweighteddistribuition 0.083 0.242 0.34 0.733
Lagged ∆lpcvonpromo 0.308 0.135 2.28 0.022
Lagged ∆lfeatureddisplay -0.391 0.178 -2.19 0.028
***Significant at p < 0.01; **Significant at p <0.05; * Significant at p<0.10
Source: The Author

57
Table A7. VAR analysis for private label biscuit/cookie
∆lsales Coef. Std. Err. z P>z
Lagged ∆lsales -0.169 0.086 -1.97 0.049
Lagged ∆lpriceindex 0.239 0.148 1.62 0.105
Lagged ∆lweighteddistribuition 0.120 0.154 0.78 0.434
Lagged ∆lpcvonpromo 0.024 0.018 1.35 0.178
Lagged ∆lfeatureddisplay -0.014 0.016 -0.86 0.390
∆lpriceindex Coef. Std. Err. z P>z
Lagged ∆lsales 0.026 0.026 1.01 0.315
Lagged ∆lpriceindex -0.268 0.084 -3.19 0.001
Lagged ∆lweighteddistribuition 0.031 0.054 0.58 0.562
Lagged ∆lpcvonpromo 0.007 0.008 0.89 0.374
Lagged ∆lfeatureddisplay -0.010 0.006 -1.72 0.086
∆lweighteddistribuition Coef. Std. Err. z P>z
Lagged ∆lsales 0.007 0.029 0.25 0.804
Lagged ∆lpriceindex 0.083 0.067 1.23 0.217
Lagged ∆lweighteddistribuition 0.056 0.114 0.49 0.623
Lagged ∆lpcvonpromo -0.003 0.005 -0.7 0.484
Lagged ∆lfeatureddisplay -0.019 0.010 -1.97 0.049
∆lpcvonpromo Coef. Std. Err. z P>z
Lagged ∆lsales -0.138 0.133 -1.04 0.300
Lagged ∆lpriceindex 0.137 0.254 0.54 0.588
Lagged ∆lweighteddistribuition -0.026 0.259 -0.1 0.919
Lagged ∆lpcvonpromo -0.469 0.062 -7.58 0.000
Lagged ∆lfeatureddisplay 0.101 0.063 1.6 0.110
∆lfeatureddisplay Coef. Std. Err. z P>z
Lagged ∆lsales 0.133 0.067 1.99 0.047
Lagged ∆lpriceindex 0.131 0.115 1.13 0.258
Lagged ∆lweighteddistribuition -0.350 0.193 -1.81 0.070
Lagged ∆lpcvonpromo -0.020 0.043 -0.46 0.644
Lagged ∆lfeatureddisplay -0.376 0.064 -5.91 0.000
***Significant at p < 0.01; **Significant at p <0.05; * Significant at p<0.10
Source: The Author

58
Table A8. VAR analysis for national brand coffee low tier price
∆lsales Coef. Std. Err. z P>z
Lagged ∆lsales -0.2084969 0.0880067 -2.37 0.018
Lagged ∆lpriceindex 0.2993546 0.2039946 1.47 0.142
Lagged ∆lweighteddistribuition 0.2634979 0.1058556 2.49 0.013
Lagged ∆lpcvonpromo 0.0049262 0.0124175 0.4 0.692
Lagged ∆lfeatureddisplay -0.008714 0.018649 -0.47 0.640
∆lpriceindex Coef. Std. Err. z P>z
Lagged ∆lsales -0.012317 0.0203603 -0.6 0.545
Lagged ∆lpriceindex -0.3362697 0.1232382 -2.73 0.006
Lagged ∆lweighteddistribuition 0.0072555 0.0256409 0.28 0.777
Lagged ∆lpcvonpromo -0.0025906 0.0018676 -1.39 0.165
Lagged ∆lfeatureddisplay 0.003131 0.0023984 1.31 0.192
∆lweighteddistribuition Coef. Std. Err. z P>z
Lagged ∆lsales -0.0230749 0.0333055 -0.69 0.488
Lagged ∆lpriceindex -0.0589131 0.113835 -0.52 0.605
Lagged ∆lweighteddistribuition -0.0906495 0.076721 -1.18 0.237
Lagged ∆lpcvonpromo -0.0005774 0.0047523 -0.12 0.903
Lagged ∆lfeatureddisplay -0.0048369 0.0077001 -0.63 0.530
∆lpcvonpromo Coef. Std. Err. z P>z
Lagged ∆lsales 0.203715 0.0788404 2.58 0.010
Lagged ∆lpriceindex 0.2200539 0.1942881 1.13 0.257
Lagged ∆lweighteddistribuition -0.0895173 0.1382988 -0.65 0.517
Lagged ∆lpcvonpromo -0.3722317 0.0412539 -9.02 0.000
Lagged ∆lfeatureddisplay 0.0807794 0.0500892 1.61 0.107
∆lfeatureddisplay Coef. Std. Err. z P>z
Lagged ∆lsales 0.2466652 0.0725378 3.4 0.001
Lagged ∆lpriceindex -0.1075041 0.1620316 -0.66 0.507
Lagged ∆lweighteddistribuition -0.0049629 0.1362163 -0.04 0.971
Lagged ∆lpcvonpromo 0.0289119 0.0356083 0.81 0.417
Lagged ∆lfeatureddisplay -0.3399931 0.0495153 -6.87 0.000
***Significant at p < 0.01; **Significant at p <0.05; * Significant at p<0.10
Source: The Author
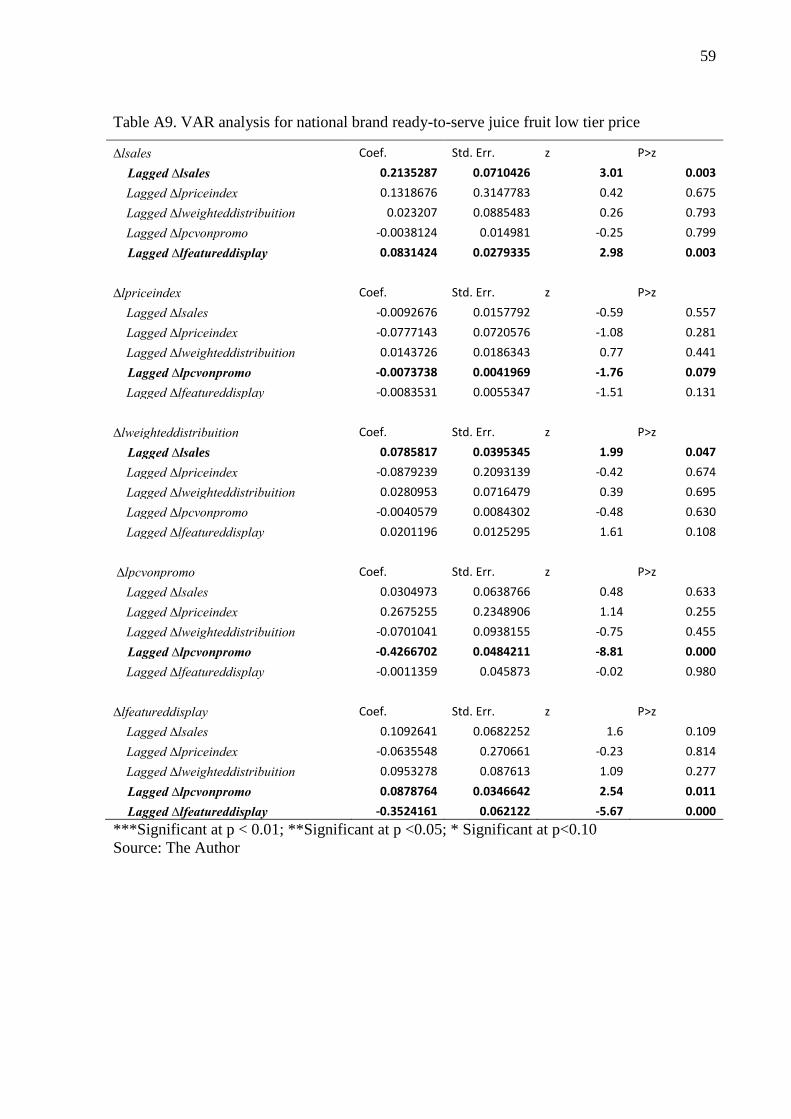
59
Table A9. VAR analysis for national brand ready-to-serve juice fruit low tier price
∆lsales Coef. Std. Err. z P>z
Lagged ∆lsales 0.2135287 0.0710426 3.01 0.003
Lagged ∆lpriceindex 0.1318676 0.3147783 0.42 0.675
Lagged ∆lweighteddistribuition 0.023207 0.0885483 0.26 0.793
Lagged ∆lpcvonpromo -0.0038124 0.014981 -0.25 0.799
Lagged ∆lfeatureddisplay 0.0831424 0.0279335 2.98 0.003
∆lpriceindex Coef. Std. Err. z P>z
Lagged ∆lsales -0.0092676 0.0157792 -0.59 0.557
Lagged ∆lpriceindex -0.0777143 0.0720576 -1.08 0.281
Lagged ∆lweighteddistribuition 0.0143726 0.0186343 0.77 0.441
Lagged ∆lpcvonpromo -0.0073738 0.0041969 -1.76 0.079
Lagged ∆lfeatureddisplay -0.0083531 0.0055347 -1.51 0.131
∆lweighteddistribuition Coef. Std. Err. z P>z
Lagged ∆lsales 0.0785817 0.0395345 1.99 0.047
Lagged ∆lpriceindex -0.0879239 0.2093139 -0.42 0.674
Lagged ∆lweighteddistribuition 0.0280953 0.0716479 0.39 0.695
Lagged ∆lpcvonpromo -0.0040579 0.0084302 -0.48 0.630
Lagged ∆lfeatureddisplay 0.0201196 0.0125295 1.61 0.108
∆lpcvonpromo Coef. Std. Err. z P>z
Lagged ∆lsales 0.0304973 0.0638766 0.48 0.633
Lagged ∆lpriceindex 0.2675255 0.2348906 1.14 0.255
Lagged ∆lweighteddistribuition -0.0701041 0.0938155 -0.75 0.455
Lagged ∆lpcvonpromo -0.4266702 0.0484211 -8.81 0.000
Lagged ∆lfeatureddisplay -0.0011359 0.045873 -0.02 0.980
∆lfeatureddisplay Coef. Std. Err. z P>z
Lagged ∆lsales 0.1092641 0.0682252 1.6 0.109
Lagged ∆lpriceindex -0.0635548 0.270661 -0.23 0.814
Lagged ∆lweighteddistribuition 0.0953278 0.087613 1.09 0.277
Lagged ∆lpcvonpromo 0.0878764 0.0346642 2.54 0.011
Lagged ∆lfeatureddisplay -0.3524161 0.062122 -5.67 0.000
***Significant at p < 0.01; **Significant at p <0.05; * Significant at p<0.10
Source: The Author

60
Table A10. VAR analysis for national brand biscuit/cookie low tier price
∆lsales Coef. Std. Err. z P>z
Lagged ∆lsales -0.1659657 0.0283871 -5.85 0
Lagged ∆lpriceindex 0.0079452 0.0568499 0.14 0.889
Lagged ∆lweighteddistribuition 0.2280342 0.0498925 4.57 0
Lagged ∆lpcvonpromo 0.0064184 0.00543 1.18 0.237
Lagged ∆lfeatureddisplay 0.0325178 0.0074332 4.37 0
∆lpriceindex Coef. Std. Err. z P>z
Lagged ∆lsales 0.00099 0.0110663 0.09 0.929
Lagged ∆lpriceindex -0.321956 0.0403231 -7.98 0
Lagged ∆lweighteddistribuition 0.0067129 0.0184363 0.36 0.716
Lagged ∆lpcvonpromo -0.0027936 0.0011496 -2.43 0.015
Lagged ∆lfeatureddisplay -0.0031224 0.0013466 -2.32 0.02
∆lweighteddistribuition Coef. Std. Err. z P>z
Lagged ∆lsales 0.0427816 0.0189924 2.25 0.024
Lagged ∆lpriceindex 0.0068043 0.0472843 0.14 0.886
Lagged ∆lweighteddistribuition -0.1150232 0.0416742 -2.76 0.006
Lagged ∆lpcvonpromo 0.0009186 0.0024344 0.38 0.706
Lagged ∆lfeatureddisplay 0.0020114 0.0035231 0.57 0.568
∆lpcvonpromo Coef. Std. Err. z P>z
Lagged ∆lsales 0.0063598 0.0319007 0.2 0.842
Lagged ∆lpriceindex -0.0499847 0.0305222 -1.64 0.101
Lagged ∆lweighteddistribuition 0.0500174 0.0313935 1.59 0.111
Lagged ∆lpcvonpromo -0.33297 0.0262196 -12.7 0
Lagged ∆lfeatureddisplay 0.0035394 0.0355016 0.1 0.921
∆lfeatureddisplay Coef. Std. Err. z P>z
Lagged ∆lsales -0.0545183 0.0254584 -2.14 0.032
Lagged ∆lpriceindex -0.0008831 0.0263555 -0.03 0.973
Lagged ∆lweighteddistribuition 0.0442394 0.0354918 1.25 0.213
Lagged ∆lpcvonpromo 0.0177703 0.0251793 0.71 0.48
Lagged ∆lfeatureddisplay -0.2944147 0.0300584 -9.79 0
***Significant at p < 0.01; **Significant at p <0.05; * Significant at p<0.10
Source: The Author

61
Table A11. VAR analysis for national brand coffee higher tier price
∆lsales Coef. Std. Err. z P>z
Lagged ∆lsales -0.242 0.077 -3.13 0.002
Lagged ∆lpriceindex -0.058 0.132 -0.44 0.662
Lagged ∆lweighteddistribuition 0.322 0.141 2.28 0.023
Lagged ∆lpcvonpromo 0.002 0.009 0.21 0.835
Lagged ∆lfeatureddisplay 0.005 0.010 0.5 0.615
∆lpriceindex Coef. Std. Err. z P>z
Lagged ∆lsales 0.011 0.016 0.68 0.494
Lagged ∆lpriceindex -0.381 0.067 -5.67 0
Lagged ∆lweighteddistribuition -0.001 0.026 -0.04 0.97
Lagged ∆lpcvonpromo 0.000 0.001 -0.25 0.8
Lagged ∆lfeatureddisplay 0.000 0.002 -0.11 0.914
∆lweighteddistribuition Coef. Std. Err. z P>z
Lagged ∆lsales 0.039 0.043 0.9 0.366
Lagged ∆lpriceindex 0.002 0.070 0.03 0.978
Lagged ∆lweighteddistribuition -0.088 0.080 -1.11 0.268
Lagged ∆lpcvonpromo 0.003 0.005 0.55 0.581
Lagged ∆lfeatureddisplay 0.000 0.005 0 0.997
∆lpcvonpromo Coef. Std. Err. z P>z
Lagged ∆lsales 0.099 0.077 1.28 0.199
Lagged ∆lpriceindex -0.071 0.079 -0.89 0.372
Lagged ∆lweighteddistribuition 0.143 0.114 1.26 0.208
Lagged ∆lpcvonpromo -0.402 0.039 -10.27 0
Lagged ∆lfeatureddisplay -0.004 0.033 -0.13 0.9
∆lfeatureddisplay Coef. Std. Err. z P>z
Lagged ∆lsales 0.170 0.074 2.3 0.021
Lagged ∆lpriceindex -0.113 0.103 -1.1 0.271
Lagged ∆lweighteddistribuition 0.163 0.121 1.35 0.176
Lagged ∆lpcvonpromo -0.011 0.027 -0.39 0.693
Lagged ∆lfeatureddisplay -0.427 0.036 -11.77 0
***Significant at p < 0.01; **Significant at p <0.05; * Significant at p<0.10
Source: The Author

62
Table A12. VAR analysis for national brand ready-to-serve juice fruit higher tier price
∆lsales Coef. Std. Err. z P>z
Lagged ∆lsales -0.055 0.046 -1.19 0.233
Lagged ∆lpriceindex 0.034 0.160 0.21 0.833
Lagged ∆lweighteddistribuition 0.026 0.081 0.32 0.748
Lagged ∆lpcvonpromo 0.035 0.009 3.84 0
Lagged ∆lfeatureddisplay 0.002 0.011 0.2 0.842
∆lpriceindex Coef. Std. Err. z P>z
Lagged ∆lsales -0.005 0.013 -0.39 0.694
Lagged ∆lpriceindex -0.191 0.085 -2.25 0.025
Lagged ∆lweighteddistribuition 0.065 0.030 2.16 0.031
Lagged ∆lpcvonpromo -0.001 0.002 -0.62 0.536
Lagged ∆lfeatureddisplay -0.003 0.003 -1.17 0.24
∆lweighteddistribuition Coef. Std. Err. z P>z
Lagged ∆lsales 0.011 0.021 0.5 0.619
Lagged ∆lpriceindex -0.122 0.081 -1.51 0.13
Lagged ∆lweighteddistribuition -0.049 0.075 -0.65 0.514
Lagged ∆lpcvonpromo 0.004 0.004 1.16 0.247
Lagged ∆lfeatureddisplay 0.002 0.004 0.46 0.643
∆lpcvonpromo Coef. Std. Err. z P>z
Lagged ∆lsales -0.147 0.071 -2.09 0.037
Lagged ∆lpriceindex -0.164 0.190 -0.86 0.388
Lagged ∆lweighteddistribuition 0.220 0.126 1.75 0.08
Lagged ∆lpcvonpromo -0.405 0.037 -10.93 0
Lagged ∆lfeatureddisplay -0.083 0.041 -2.01 0.044
∆lfeatureddisplay Coef. Std. Err. z P>z
Lagged ∆lsales 0.091 0.069 1.32 0.188
Lagged ∆lpriceindex 0.156 0.168 0.93 0.352
Lagged ∆lweighteddistribuition 0.027 0.112 0.24 0.809
Lagged ∆lpcvonpromo 0.041 0.028 1.45 0.148
Lagged ∆lfeatureddisplay -0.445 0.039 -11.54 0
***Significant at p < 0.01; **Significant at p <0.05; * Significant at p<0.10
Source: The Author

63
Table A13. VAR analysis for national brand biscuit/cookie higher tier price
∆lsales Coef. Std. Err. z P>z
Lagged ∆lsales -0.130 0.029 -4.43 0
Lagged ∆lpriceindex 0.163 0.063 2.58 0.01
Lagged ∆lweighteddistribuition 0.329 0.048 6.82 0
Lagged ∆lpcvonpromo 0.016 0.006 2.48 0.013
Lagged ∆lfeatureddisplay 0.010 0.008 1.32 0.185
∆lpriceindex Coef. Std. Err. z P>z
Lagged ∆lsales -0.006 0.012 -0.51 0.608
Lagged ∆lpriceindex -0.230 0.065 -3.51 0
Lagged ∆lweighteddistribuition -0.017 0.026 -0.65 0.518
Lagged ∆lpcvonpromo -0.002 0.002 -1.24 0.216
Lagged ∆lfeatureddisplay 0.003 0.003 0.92 0.358
∆lweighteddistribuition Coef. Std. Err. z P>z
Lagged ∆lsales 0.031 0.015 2.02 0.044
Lagged ∆lpriceindex 0.037 0.057 0.64 0.521
Lagged ∆lweighteddistribuition 0.074 0.035 2.11 0.035
Lagged ∆lpcvonpromo -0.004 0.003 -1.45 0.148
Lagged ∆lfeatureddisplay -0.002 0.003 -0.59 0.557
∆lpcvonpromo Coef. Std. Err. z P>z
Lagged ∆lsales -0.052 0.038 -1.39 0.164
Lagged ∆lpriceindex -0.173 0.077 -2.26 0.024
Lagged ∆lweighteddistribuition 0.213 0.065 3.26 0.001
Lagged ∆lpcvonpromo -0.391 0.025 -15.6 0
Lagged ∆lfeatureddisplay 0.035 0.024 1.46 0.144
∆lfeatureddisplay Coef. Std. Err. z P>z
Lagged ∆lsales 0.004 0.043 0.08 0.932
Lagged ∆lpriceindex -0.115 0.080 -1.43 0.152
Lagged ∆lweighteddistribuition 0.147 0.051 2.89 0.004
Lagged ∆lpcvonpromo 0.013 0.021 0.65 0.515
Lagged ∆lfeatureddisplay -0.311 0.025 -12.59 0
***Significant at p < 0.01; **Significant at p <0.05; * Significant at p<0.10
Source: The Author

64
Table A14. VAR analysis for private label coffee low tier price
∆lsales Coef. Std. Err. z P>z
Lagged ∆lsales -0.208 0.294 -0.71 0.479
Lagged ∆lpriceindex -0.183 0.973 -0.19 0.851
Lagged ∆lweighteddistribuition 0.155 0.972 0.16 0.873
Lagged ∆lpcvonpromo 0.053 0.039 1.37 0.171
Lagged ∆lfeatureddisplay -0.021 0.041 -0.5 0.614
∆lpriceindex Coef. Std. Err. z P>z
Lagged ∆lsales 0.021 0.019 1.12 0.261
Lagged ∆lpriceindex -0.083 0.093 -0.9 0.368
Lagged ∆lweighteddistribuition -0.021 0.065 -0.32 0.75
Lagged ∆lpcvonpromo -0.002 0.003 -0.52 0.605
Lagged ∆lfeatureddisplay 0.011 0.005 2.4 0.016
∆lweighteddistribuition Coef. Std. Err. z P>z
Lagged ∆lsales -0.049 0.048 -1.02 0.309
Lagged ∆lpriceindex -0.138 0.178 -0.77 0.438
Lagged ∆lweighteddistribuition 0.198 0.174 1.14 0.255
Lagged ∆lpcvonpromo 0.012 0.010 1.25 0.211
Lagged ∆lfeatureddisplay 0.009 0.008 1.18 0.236
∆lpcvonpromo Coef. Std. Err. z P>z
Lagged ∆lsales -0.262 0.746 -0.35 0.725
Lagged ∆lpriceindex 1.279 2.343 0.55 0.585
Lagged ∆lweighteddistribuition -0.045 2.259 -0.02 0.984
Lagged ∆lpcvonpromo -0.311 0.144 -2.17 0.03
Lagged ∆lfeatureddisplay 0.167 0.170 0.98 0.327
∆lfeatureddisplay Coef. Std. Err. z P>z
Lagged ∆lsales 1.202 0.401 3 0.003
Lagged ∆lpriceindex 6.763 3.273 2.07 0.039
Lagged ∆lweighteddistribuition -4.590 1.528 -3 0.003
Lagged ∆lpcvonpromo 0.088 0.124 0.71 0.476
Lagged ∆lfeatureddisplay -0.172 0.108 -1.59 0.113
***Significant at p < 0.01; **Significant at p <0.05; * Significant at p<0.10
Source: The Author

65
Table A15. VAR analysis for private label Ready-to-serve juice fruit coffee low tier price
∆lsales Coef. Std. Err. z P>z
Lagged ∆lsales -0.013 0.133 -0.1 0.921
Lagged ∆lpriceindex 0.166 0.080 2.07 0.039
Lagged ∆lweighteddistribuition 0.149 0.111 1.34 0.179
Lagged ∆lpcvonpromo -0.040 0.028 -1.41 0.16
Lagged ∆lfeatureddisplay 0.033 0.023 1.43 0.154
∆lpriceindex Coef. Std. Err. z P>z
Lagged ∆lsales -0.020 0.122 -0.17 0.868
Lagged ∆lpriceindex -0.274 0.135 -2.04 0.042
Lagged ∆lweighteddistribuition 0.847 0.354 2.4 0.017
Lagged ∆lpcvonpromo 0.009 0.007 1.45 0.148
Lagged ∆lfeatureddisplay 0.011 0.010 1.17 0.243
∆lweighteddistribuition Coef. Std. Err. z P>z
Lagged ∆lsales -0.229 0.138 -1.66 0.096
Lagged ∆lpriceindex -0.058 0.049 -1.17 0.242
Lagged ∆lweighteddistribuition -0.600 0.137 -4.38 0
Lagged ∆lpcvonpromo 0.002 0.008 0.2 0.84
Lagged ∆lfeatureddisplay -0.004 0.010 -0.36 0.718
∆lpcvonpromo Coef. Std. Err. z P>z
Lagged ∆lsales -0.175 0.708 -0.25 0.804
Lagged ∆lpriceindex 0.036 0.071 0.51 0.613
Lagged ∆lweighteddistribuition -0.165 0.195 -0.84 0.399
Lagged ∆lpcvonpromo -0.447 0.134 -3.34 0.001
Lagged ∆lfeatureddisplay -0.148 0.130 -1.14 0.255
∆lfeatureddisplay Coef. Std. Err. z P>z
Lagged ∆lsales 0.245 0.460 0.53 0.595
Lagged ∆lpriceindex 0.054 0.099 0.55 0.583
Lagged ∆lweighteddistribuition 0.083 0.242 0.34 0.733
Lagged ∆lpcvonpromo 0.308 0.135 2.28 0.022
Lagged ∆lfeatureddisplay -0.391 0.178 -2.19 0.028
***Significant at p < 0.01; **Significant at p <0.05; * Significant at p<0.10
Source: The Author

66
Table A16. VAR analysis for private label biscuit/cookie low tier price
∆lsales Coef. Std. Err. z P>z
Lagged ∆lsales -0.265 0.091 -2.9 0.004
Lagged ∆lpriceindex -0.045 0.331 -0.14 0.892
Lagged ∆lweighteddistribuition 0.012 0.179 0.07 0.945
Lagged ∆lpcvonpromo 0.049 0.020 2.43 0.015
Lagged ∆lfeatureddisplay -0.006 0.016 -0.35 0.723
∆lpriceindex Coef. Std. Err. z P>z
Lagged ∆lsales 0.019 0.025 0.76 0.448
Lagged ∆lpriceindex -0.266 0.077 -3.45 0.001
Lagged ∆lweighteddistribuition -0.001 0.045 -0.03 0.974
Lagged ∆lpcvonpromo -0.002 0.004 -0.61 0.544
Lagged ∆lfeatureddisplay -0.004 0.004 -1.02 0.308
∆lweighteddistribuition Coef. Std. Err. z P>z
Lagged ∆lsales -0.028 0.017 -1.63 0.103
Lagged ∆lpriceindex 0.123 0.118 1.05 0.296
Lagged ∆lweighteddistribuition -0.067 0.069 -0.97 0.333
Lagged ∆lpcvonpromo -0.001 0.004 -0.25 0.8
Lagged ∆lfeatureddisplay -0.013 0.009 -1.42 0.156
∆lpcvonpromo Coef. Std. Err. z P>z
Lagged ∆lsales -0.237 0.201 -1.18 0.239
Lagged ∆lpriceindex 1.055 0.859 1.23 0.219
Lagged ∆lweighteddistribuition 0.003 0.338 0.01 0.992
Lagged ∆lpcvonpromo -0.419 0.077 -5.41 0
Lagged ∆lfeatureddisplay 0.084 0.084 1.01 0.313
∆lfeatureddisplay Coef. Std. Err. z P>z
Lagged ∆lsales 0.031 0.083 0.37 0.714
Lagged ∆lpriceindex 0.262 0.377 0.7 0.487
Lagged ∆lweighteddistribuition -0.104 0.248 -0.42 0.673
Lagged ∆lpcvonpromo -0.051 0.058 -0.89 0.375
Lagged ∆lfeatureddisplay -0.397 0.084 -4.74 0
***Significant at p < 0.01; **Significant at p <0.05; * Significant at p<0.10
Source: The Author

67
Table A17. VAR analysis for private label coffee higher tier price
∆lsales Coef. Std. Err. z P>z
Lagged ∆lsales -0.204 0.066 -3.09 0.002
Lagged ∆lpriceindex 0.069 0.097 0.71 0.475
Lagged ∆lweighteddistribuition 0.281 0.126 2.23 0.026
Lagged ∆lpcvonpromo -0.006 0.009 -0.63 0.531
Lagged ∆lfeatureddisplay 0.003 0.010 0.29 0.775
∆lpriceindex Coef. Std. Err. z P>z
Lagged ∆lsales 0.013 0.016 0.8 0.422
Lagged ∆lpriceindex -0.351 0.052 -6.74 0
Lagged ∆lweighteddistribuition -0.005 0.029 -0.16 0.872
Lagged ∆lpcvonpromo 0.004 0.003 1.1 0.273
Lagged ∆lfeatureddisplay -0.003 0.003 -1.32 0.185
∆lweighteddistribuition Coef. Std. Err. z P>z
Lagged ∆lsales 0.041 0.035 1.17 0.242
Lagged ∆lpriceindex 0.044 0.049 0.91 0.365
Lagged ∆lweighteddistribuition -0.071 0.071 -1 0.315
Lagged ∆lpcvonpromo -0.001 0.004 -0.17 0.865
Lagged ∆lfeatureddisplay -0.003 0.005 -0.49 0.623
∆lpcvonpromo Coef. Std. Err. z P>z
Lagged ∆lsales 0.072 0.069 1.03 0.301
Lagged ∆lpriceindex 0.018 0.105 0.18 0.861
Lagged ∆lweighteddistribuition 0.132 0.107 1.23 0.217
Lagged ∆lpcvonpromo -0.426 0.036 -11.8 0
Lagged ∆lfeatureddisplay 0.008 0.030 0.28 0.782
∆lfeatureddisplay Coef. Std. Err. z P>z
Lagged ∆lsales 0.171 0.061 2.82 0.005
Lagged ∆lpriceindex -0.019 0.078 -0.25 0.803
Lagged ∆lweighteddistribuition 0.079 0.109 0.72 0.471
Lagged ∆lpcvonpromo 0.000 0.024 0.01 0.992
Lagged ∆lfeatureddisplay -0.418 0.034 -12.37 0
***Significant at p < 0.01; **Significant at p <0.05; * Significant at p<0.10
Source: The Author

68
Table A18. VAR analysis for private label biscuit/cookie higher tier price
∆lsales Coef. Std. Err. z P>z
Lagged ∆lsales -0.049 0.145 -0.34 0.734
Lagged ∆lpriceindex 0.312 0.165 1.89 0.059
Lagged ∆lweighteddistribuition 0.097 0.256 0.38 0.704
Lagged ∆lpcvonpromo -0.048 0.032 -1.51 0.131
Lagged ∆lfeatureddisplay -0.033 0.030 -1.09 0.274
∆lpriceindex Coef. Std. Err. z P>z
Lagged ∆lsales 0.020 0.048 0.42 0.674
Lagged ∆lpriceindex -0.263 0.095 -2.76 0.006
Lagged ∆lweighteddistribuition 0.066 0.095 0.7 0.486
Lagged ∆lpcvonpromo 0.029 0.026 1.14 0.256
Lagged ∆lfeatureddisplay -0.020 0.015 -1.27 0.203
∆lweighteddistribuition Coef. Std. Err. z P>z
Lagged ∆lsales 0.042 0.054 0.77 0.443
Lagged ∆lpriceindex 0.095 0.083 1.14 0.255
Lagged ∆lweighteddistribuition 0.110 0.184 0.6 0.551
Lagged ∆lpcvonpromo -0.011 0.013 -0.86 0.391
Lagged ∆lfeatureddisplay -0.030 0.022 -1.39 0.164
∆lpcvonpromo Coef. Std. Err. z P>z
Lagged ∆lsales 0.054 0.174 0.31 0.758
Lagged ∆lpriceindex 0.066 0.259 0.26 0.798
Lagged ∆lweighteddistribuition -0.288 0.399 -0.72 0.469
Lagged ∆lpcvonpromo -0.580 0.097 -5.97 0
Lagged ∆lfeatureddisplay 0.126 0.083 1.5 0.132
∆lfeatureddisplay Coef. Std. Err. z P>z
Lagged ∆lsales 0.217 0.107 2.03 0.043
Lagged ∆lpriceindex 0.175 0.140 1.25 0.212
Lagged ∆lweighteddistribuition -0.599 0.296 -2.02 0.043
Lagged ∆lpcvonpromo 0.047 0.059 0.79 0.428
Lagged ∆lfeatureddisplay -0.320 0.086 -3.71 0
***Significant at p < 0.01; **Significant at p <0.05; * Significant at p<0.10
Source: The Author