Functional Network softsensor for formation porosity and water saturation in oil wells
6
Functional Network Softsensor for formation porosity and water saturation in oil Wells Ahmed Adeniran, Moustafa Elshafei and Gharib Hamada King Fahd University of Petroleum and Minerals, Dhahran, Saudi Arabia Abstract— Formation porosity and water saturation play important role in evaluating potential oil reservoirs and for drafting development plans for new oil fields. This paper presents a novel method for estimating these two important parameters directly from conventional well measurements. The recently proposed Functional Networks technique is applied for rapid and accurate prediction of these parameters, using six and five basic well log measurements as data for estimating porosity and water saturation respectively. Functional network is a generalization of the conventional Feed Forward Neural Networks, which overcome many of the drawbacks of the conventional neural network techniques. The proposed functional network was trained using data gathered from two wells in the Middle East region. Results obtained from this case study using the proposed intelligent technique have shown to be fast and accurate. Keywords-component; functional networks; neural networks; porosity; water saturation; well log. I. INTRODUCTION The major objective of the petroleum industry is to obtain an accurate estimate of the hydrocarbon in place; this is required either at early stage of the well for exploitation or for developed reservoir management. An accurate determination of porosity and water saturation parameters is a must for evaluating any reservoir and drafting any development plan for developed reservoir. Porosity is described as the ratio of the aggregate volume of interstices in a rock to its total volume whereas water saturation is defined as the fraction of pore volume of formation rock which is filled with water only. The rest of the pore space is assumed to be filled with either oil or gas. Therefore, inaccurate determination of water saturation leads to either underestimation or overestimation of reserves. The most accurate method for determination of these important properties is mostly done by core analysis at expensive laboratory tests. However, the core data are not always available for most wells in a given field or at every depth levels either due to the borehole condition or the high cost of obtaining cores [1]. Hence, log measurements, which are usually available are utilized by correlating well logs with core data of the cored wells and subsequently using the correlation model to predict these properties at the uncored intervals and wells. Well logs approach can provide a continuous record over the entire well, and it is economical and quick to obtain. Many empirical equations are available to transform well log data to porosity and water saturation. For example, porosity has been related to sonic transit time and density logs. On the other hand, water saturation can also be determined from empirical formulas using resistivity, gamma ray logs and porosity estimates. Besides the fact that these empirical models are not sufficiently accurate, they are not universally applicable as they should be tuned to the area of work which requires the estimation of parameters in the laboratory, and some of these model parameters are not easily obtainable (Helle et al.[2] and Yan [3]). Parametric methods like statistical regression is another versatile approach used in estimation of these properties, where a functional relationship is developed between the core data and well log data [3]. This however requires the assumption and satisfaction of multi-normal behaviors and linearity [4]. Therefore, neural networks, or more specifically, multilayer perceptrons (MLP), have been increasingly applied to predict reservoir properties using well log data [4], [5], [6]. Neural networks are characterized as computational models with abilities to adapt, learn, generalize, recognize, and organize data. The advantages of neural networks include its high computational efficiency, adaptability, non-linear characteristics, generation properties, fault tolerance, freedom from a priori selection of mathematical models, and ease of working with high-dimensional data [7]. Neural networks have been demonstrated in several practical applications for estimation of porosity and water saturation from well logs (for example, see [2], [8], [9], [10]-[14]). Despite its wide applications, the MLP has some draw-back including; slow convergence on learning; complexity of design space; random initialization of weight and local minimal problem. Therefore, MLP are useful when the network architecture and parameters, which are often done by trial and error approach are chosen correctly. A common approach is to train as many networks as possible and select the one that yields the best generalization performance. Hence the solution may not be a unique solution. Recently, Castillo et al. [15]-[18], introduced functional network as a powerful extension and network-based alternative to the neural networks paradigm. In functional networks, neural functions are to be learned instead of weights. In addition, outputs coming from different neurons can be connected, that is, forced to output the same values. The topology and neuron functions of functional networks can be selected based on data, domain knowledge, or a combination of the two. This kind of networks exhibits more versatility than neural networks so they can be successfully applied to several problems. The objective of this study is to provide an improved intelligent approach via the use of functional networks to estimate porosity and water saturation from well log using real field data. The proposed methodology makes use of The authors would like to acknowledge the support of King Fahd University of Petroleum & Minerals I2MTC 2009 - International Instrumentation and Measurement Technology Conference Singapore, 5-7 May 2009 978-1-4244-3353-7/09/$25.00 ©2009 IEEE Authorized licensed use limited to: King Abdul Aziz City For Science & Technology. Downloaded on August 9, 2009 at 07:18 from IEEE Xplore. Restrictions apply.
-
Upload
independent -
Category
Documents
-
view
4 -
download
0
Transcript of Functional Network softsensor for formation porosity and water saturation in oil wells
Functional Network Softsensor for formation porosity and water saturation in oil Wells
Ahmed Adeniran, Moustafa Elshafei and Gharib Hamada King Fahd University of Petroleum and Minerals, Dhahran, Saudi Arabia
Abstract— Formation porosity and water saturation play important role in evaluating potential oil reservoirs and for drafting development plans for new oil fields. This paper presents a novel method for estimating these two important parameters directly from conventional well measurements. The recently proposed Functional Networks technique is applied for rapid and accurate prediction of these parameters, using six and five basic well log measurements as data for estimating porosity and water saturation respectively. Functional network is a generalization of the conventional Feed Forward Neural Networks, which overcome many of the drawbacks of the conventional neural network techniques. The proposed functional network was trained using data gathered from two wells in the Middle East region. Results obtained from this case study using the proposed intelligent technique have shown to be fast and accurate.
Keywords-component; functional networks; neural networks; porosity; water saturation; well log.
I. INTRODUCTION The major objective of the petroleum industry is to obtain
an accurate estimate of the hydrocarbon in place; this is required either at early stage of the well for exploitation or for developed reservoir management. An accurate determination of porosity and water saturation parameters is a must for evaluating any reservoir and drafting any development plan for developed reservoir. Porosity is described as the ratio of the aggregate volume of interstices in a rock to its total volume whereas water saturation is defined as the fraction of pore volume of formation rock which is filled with water only. The rest of the pore space is assumed to be filled with either oil or gas. Therefore, inaccurate determination of water saturation leads to either underestimation or overestimation of reserves.
The most accurate method for determination of these important properties is mostly done by core analysis at expensive laboratory tests. However, the core data are not always available for most wells in a given field or at every depth levels either due to the borehole condition or the high cost of obtaining cores [1]. Hence, log measurements, which are usually available are utilized by correlating well logs with core data of the cored wells and subsequently using the correlation model to predict these properties at the uncored intervals and wells. Well logs approach can provide a continuous record over the entire well, and it is economical and quick to obtain.
Many empirical equations are available to transform well log data to porosity and water saturation. For example, porosity has been related to sonic transit time and density logs. On the
other hand, water saturation can also be determined from empirical formulas using resistivity, gamma ray logs and porosity estimates. Besides the fact that these empirical models are not sufficiently accurate, they are not universally applicable as they should be tuned to the area of work which requires the estimation of parameters in the laboratory, and some of these model parameters are not easily obtainable (Helle et al.[2] and Yan [3]).
Parametric methods like statistical regression is another versatile approach used in estimation of these properties, where a functional relationship is developed between the core data and well log data [3]. This however requires the assumption and satisfaction of multi-normal behaviors and linearity [4]. Therefore, neural networks, or more specifically, multilayer perceptrons (MLP), have been increasingly applied to predict reservoir properties using well log data [4], [5], [6].
Neural networks are characterized as computational models with abilities to adapt, learn, generalize, recognize, and organize data. The advantages of neural networks include its high computational efficiency, adaptability, non-linear characteristics, generation properties, fault tolerance, freedom from a priori selection of mathematical models, and ease of working with high-dimensional data [7]. Neural networks have been demonstrated in several practical applications for estimation of porosity and water saturation from well logs (for example, see [2], [8], [9], [10]-[14]). Despite its wide applications, the MLP has some draw-back including; slow convergence on learning; complexity of design space; random initialization of weight and local minimal problem. Therefore, MLP are useful when the network architecture and parameters, which are often done by trial and error approach are chosen correctly. A common approach is to train as many networks as possible and select the one that yields the best generalization performance. Hence the solution may not be a unique solution.
Recently, Castillo et al. [15]-[18], introduced functional network as a powerful extension and network-based alternative to the neural networks paradigm. In functional networks, neural functions are to be learned instead of weights. In addition, outputs coming from different neurons can be connected, that is, forced to output the same values. The topology and neuron functions of functional networks can be selected based on data, domain knowledge, or a combination of the two. This kind of networks exhibits more versatility than neural networks so they can be successfully applied to several problems.
The objective of this study is to provide an improved intelligent approach via the use of functional networks to estimate porosity and water saturation from well log using real field data. The proposed methodology makes use of
The authors would like to acknowledge the support of King Fahd University of Petroleum & Minerals
I2MTC 2009 - International Instrumentation and Measurement Technology Conference Singapore, 5-7 May 2009
978-1-4244-3353-7/09/$25.00 ©2009 IEEE
Authorized licensed use limited to: King Abdul Aziz City For Science & Technology. Downloaded on August 9, 2009 at 07:18 from IEEE Xplore. Restrictions apply.
appropriate well logs and core measurements. A portion of the data available was retained for verification of the prediction results.
II. FUNCTIONAL NETWORKS
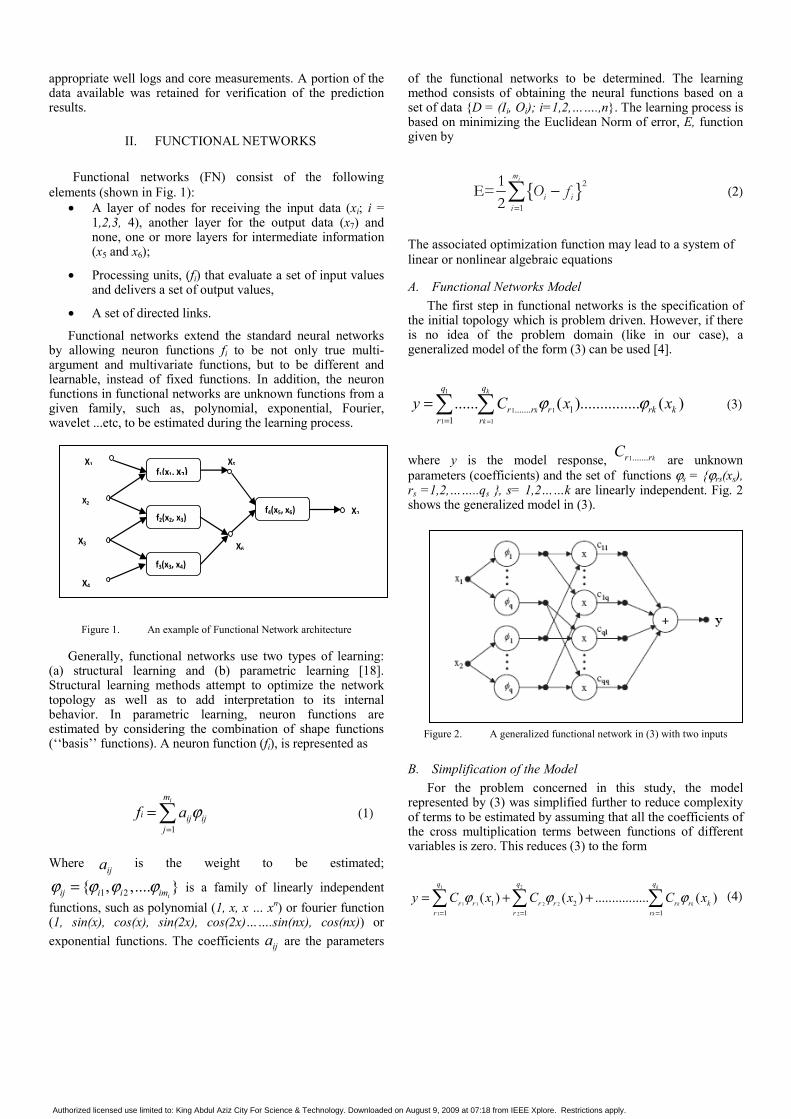
Functional networks (FN) consist of the following elements (shown in Fig. 1):
• A layer of nodes for receiving the input data (xi; i = 1,2,3, 4), another layer for the output data (x7) and none, one or more layers for intermediate information (x5 and x6);
• Processing units, (fi) that evaluate a set of input values and delivers a set of output values,
• A set of directed links.
Functional networks extend the standard neural networks by allowing neuron functions fi to be not only true multi-argument and multivariate functions, but to be different and learnable, instead of fixed functions. In addition, the neuron functions in functional networks are unknown functions from a given family, such as, polynomial, exponential, Fourier, wavelet ...etc, to be estimated during the learning process.
Figure 1. An example of Functional Network architecture
Generally, functional networks use two types of learning: (a) structural learning and (b) parametric learning [18]. Structural learning methods attempt to optimize the network topology as well as to add interpretation to its internal behavior. In parametric learning, neuron functions are estimated by considering the combination of shape functions (‘‘basis’’ functions). A neuron function (fi), is represented as
1
im
i ij ijj
f a ϕ=
=∑ (1)
Where ija is the weight to be estimated;
1 2{ , ,.... }ϕ ϕ ϕ ϕ=iij i i im is a family of linearly independent
functions, such as polynomial (1, x, x … xn) or fourier function (1, sin(x), cos(x), sin(2x), cos(2x)…….sin(nx), cos(nx)) or exponential functions. The coefficients ija are the parameters
of the functional networks to be determined. The learning method consists of obtaining the neural functions based on a set of data {D = (Ii, Oi); i=1,2,…….,n}. The learning process is based on minimizing the Euclidean Norm of error, E, function given by
{ }21
1E=2
im
i ii
O f=
−∑ (2)
The associated optimization function may lead to a system of linear or nonlinear algebraic equations
A. Functional Networks Model The first step in functional networks is the specification of
the initial topology which is problem driven. However, if there is no idea of the problem domain (like in our case), a generalized model of the form (3) can be used [4].
1
11
1 1
....... 11
...... ( )............... ( )k
kk
r r r rk kr r
y C x xϕ ϕ==
=∑ ∑ (3)
where y is the model response, 1....... kr rC are unknown parameters (coefficients) and the set of functions ϕs = {ϕrs(xs), rs =1,2,……..qs }, s= 1,2……k are linearly independent. Fig. 2 shows the generalized model in (3).
Figure 2. A generalized functional network in (3) with two inputs
B. Simplification of the Model For the problem concerned in this study, the model
represented by (3) was simplified further to reduce complexity of terms to be estimated by assuming that all the coefficients of the cross multiplication terms between functions of different variables is zero. This reduces (3) to the form
1 2
1 1 2 2
1 2
1 21 1 1
( ) ( ) ................ ( )k
k k
k
qq q
r r r r r r kr r r
y C x C x C xϕ ϕ ϕ= = =
= + +∑ ∑ ∑ (4)
X6
X5X1
X3
f1(x1, x2)
f2(x2, x3)
f3(x3, x4)
f4(x5, x6) X2
X4
X7
Authorized licensed use limited to: King Abdul Aziz City For Science & Technology. Downloaded on August 9, 2009 at 07:18 from IEEE Xplore. Restrictions apply.

11
( )kqs
kr kr kk r
y C xϕ==
=∑∑ (5)
This can be written as
1 1 2 2( ) ( ) ....... ( )k ky h x h x h x= + + (6)
Where, h(x) denotes the sum of the function basis for each predictor variable, with its coefficients to be learned. Fig. 3 shows the functional networks with two predictor variables for (4)-(6).
Figure 3. Simplified generalized model with k=2 and q1=q2=q
C. Learning the Model Let D = {yi, xi1, xi2,…….xik; i = 1,2, …..,n } denotes the
available data set, which consists of n observations of the response and k predictor variables. Then, for the ith observation in D, we have for the general case of the simplified model:
11
( ), 1,2,....kqs
i kr kr ikk r
y C x i nϕ==
= =∑∑ (7)
Since the linear combinations of linearly independent functions (ϕkr) are known, we only need to learn the coefficients Ckr Linearly independent functions used in this study include:
1). Polynomial family
ϕ= {1, x, x2,….., xq}
2). Exponential family
ϕ= {1, ex, e-x, e2x, e-2x,…..eqx, e-qx}
3). Fourier family
ϕ= {1, sin(x), cos(x), sin(2x), cos(2x),------sin(qx), cos(qx)}
4). Logarithms function
ϕ= {1, log(x+2), log(x+3), ……, log(x+q)}
Assuming that the model in (7) provides an acceptable approximation to the relation between the response and the predictor variables, then we can write (7) in matrix form as
Y W β= (8)
WhereY is the estimated response and β is the coefficient to learn. From the desired response,Y , the error (ε) can be obtain as
ˆY Y Y Wε β= − = − (9)
Using least square optimization technique, we can learn the coefficients by minimizing the error (ε) as follows:
( ) ( )t tL Y W Y Wε ε β β= = − − (10)
1( ) )t tW W W Yβ −= (11)
Solving (11) gives the solution to the unknown coefficients
III. CASE STUDY
A. Data Acquisition and Processing In this study, we used data set from the Middle Eastern
region cotaining well logs, core porosity and water saturation from two wells labeled, A and B of 206 and 211 observations respectively. The two wells were combined together and divided randomly into two sets, training and testing sets of 70% and 30% of data respectively. In order to make sure the predictors variables are independent from measurement units (since they are of different units), the predictor variables (inputs) were normalize between 0 and 1. The training set is then used to learn the coefficients in (13) for estimation of porosity and water saturation. Several basis functions basis such as polynomial, fourier, exponential, and logarithms were tried in order to select the one that will give best approximation for each function ( h1(x1), h2(x2),…). The coefficients of the network is optimized by backward-forward search method using Minimum description length (MDL) criteria to determine the best contributing coefficients to the network as well as best functional basis to use by choosing the one with lowest value of MDL as used in [18]. All experiments were performance on a fedora 9 Linux machine
Authorized licensed use limited to: King Abdul Aziz City For Science & Technology. Downloaded on August 9, 2009 at 07:18 from IEEE Xplore. Restrictions apply.
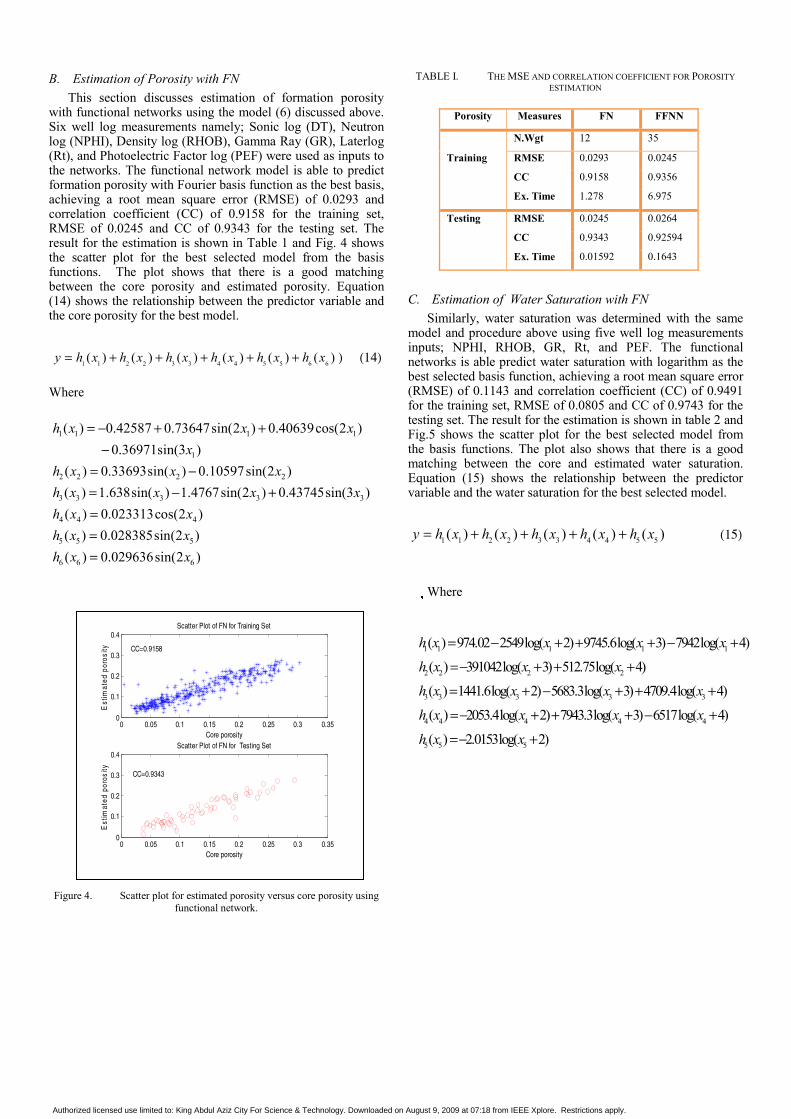
B. Estimation of Porosity with FN This section discusses estimation of formation porosity
with functional networks using the model (6) discussed above. Six well log measurements namely; Sonic log (DT), Neutron log (NPHI), Density log (RHOB), Gamma Ray (GR), Laterlog (Rt), and Photoelectric Factor log (PEF) were used as inputs to the networks. The functional network model is able to predict formation porosity with Fourier basis function as the best basis, achieving a root mean square error (RMSE) of 0.0293 and correlation coefficient (CC) of 0.9158 for the training set, RMSE of 0.0245 and CC of 0.9343 for the testing set. The result for the estimation is shown in Table 1 and Fig. 4 shows the scatter plot for the best selected model from the basis functions. The plot shows that there is a good matching between the core porosity and estimated porosity. Equation (14) shows the relationship between the predictor variable and the core porosity for the best model.
1 1 2 2 3 3 4 4 5 5 6 6( ) ( ) ( ) ( ) ( ) ( )y h x h x h x h x h x h x= + + + + + ) (14)
Where
Figure 4. Scatter plot for estimated porosity versus core porosity using functional network.
TABLE I. THE MSE AND CORRELATION COEFFICIENT FOR POROSITY ESTIMATION
C. Estimation of Water Saturation with FN Similarly, water saturation was determined with the same
model and procedure above using five well log measurements inputs; NPHI, RHOB, GR, Rt, and PEF. The functional networks is able predict water saturation with logarithm as the best selected basis function, achieving a root mean square error (RMSE) of 0.1143 and correlation coefficient (CC) of 0.9491 for the training set, RMSE of 0.0805 and CC of 0.9743 for the testing set. The result for the estimation is shown in table 2 and Fig.5 shows the scatter plot for the best selected model from the basis functions. The plot also shows that there is a good matching between the core and estimated water saturation. Equation (15) shows the relationship between the predictor variable and the water saturation for the best selected model.
1 1 2 2 3 3 4 4 5 5( ) ( ) ( ) ( ) ( )y h x h x h x h x h x= + + + + (15)
Where
Porosity Measures FN FFNN
N.Wgt 12 35
Training RMSE 0.0293 0.0245
CC 0.9158 0.9356
Ex. Time 1.278 6.975
Testing RMSE 0.0245 0.0264
CC 0.9343 0.92594
Ex. Time 0.01592 0.1643
1 1 1 1
1
2 2 2 2
3 3 3 3 3
4 4 4
5 5
( ) 0.42587 0.73647sin(2 ) 0.40639cos(2 ) 0.36971sin(3 )
( ) 0.33693sin( ) 0.10597sin(2 )( ) 1.638sin( ) 1.4767sin(2 ) 0.43745sin(3 )( ) 0.023313cos(2 )( ) 0.02838
h x x xx
h x x xh x x x xh x xh x
= − + +−
= −= − +== 5
6 6 6
5sin(2 )( ) 0.029636sin(2 )
xh x x=
1 1 1 1 1
2 2 2 2
3 3 3 3 3
4 4 4 4 4
( ) 974.02 2549log( 2) 9745.6log( 3) 7942log( 4)
( ) 391042log( 3) 512.75log( 4)
( ) 1441.6log( 2) 5683.3log( 3) 4709.4log( 4)
( ) 2053.4log( 2) 7943.3log( 3) 6517log(
h x x x xh x x xh x x x xh x x x x
= − + + + − +
=− + + +
= + − + + +
=− + + + −
5 5 5
4)
( ) 2.0153log( 2)h x x
+
=− +0 0.05 0.1 0.15 0.2 0.25 0.3 0.35
0
0.1
0.2
0.3
0.4
Est
imat
ed p
oros
ity
Core porosity
Scatter Plot of FN for Training Set
0 0.05 0.1 0.15 0.2 0.25 0.3 0.350
0.1
0.2
0.3
0.4
Est
imat
ed p
oros
ity
Core porosity
Scatter Plot of FN for Testing Set
CC=0.9158
CC=0.9343
Authorized licensed use limited to: King Abdul Aziz City For Science & Technology. Downloaded on August 9, 2009 at 07:18 from IEEE Xplore. Restrictions apply.
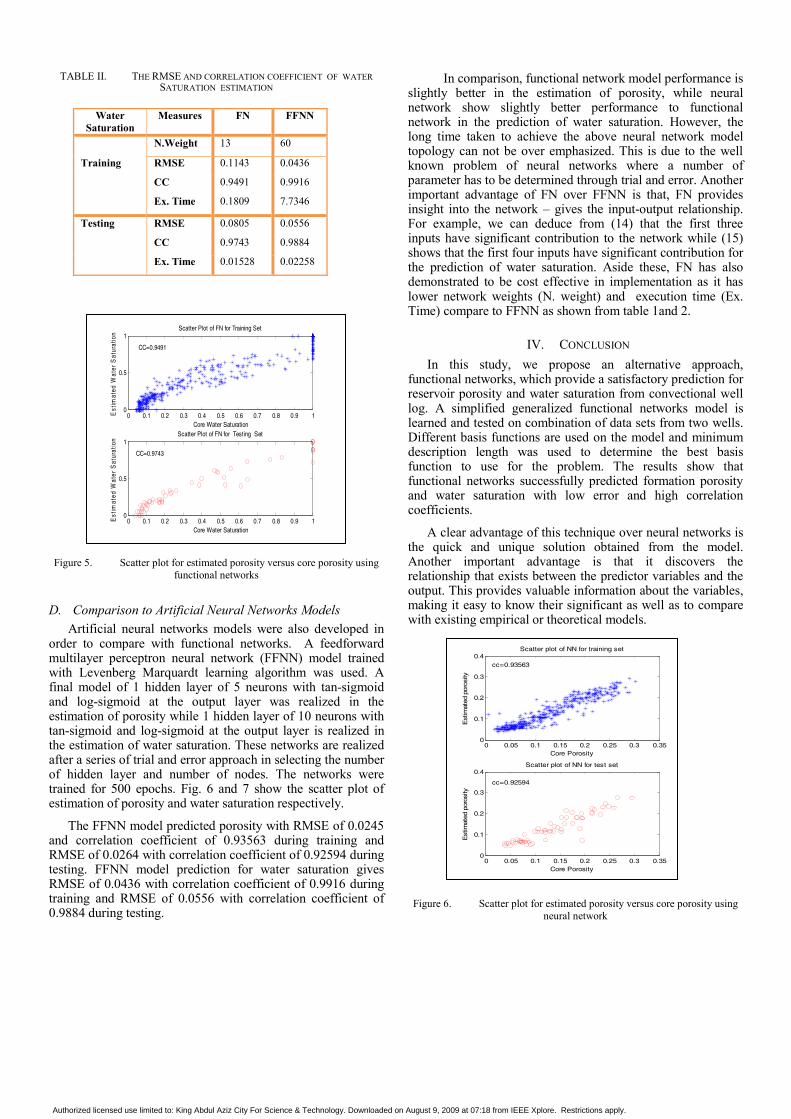
TABLE II. THE RMSE AND CORRELATION COEFFICIENT OF WATER SATURATION ESTIMATION
Figure 5. Scatter plot for estimated porosity versus core porosity using functional networks
D. Comparison to Artificial Neural Networks Models Artificial neural networks models were also developed in
order to compare with functional networks. A feedforward multilayer perceptron neural network (FFNN) model trained with Levenberg Marquardt learning algorithm was used. A final model of 1 hidden layer of 5 neurons with tan-sigmoid and log-sigmoid at the output layer was realized in the estimation of porosity while 1 hidden layer of 10 neurons with tan-sigmoid and log-sigmoid at the output layer is realized in the estimation of water saturation. These networks are realized after a series of trial and error approach in selecting the number of hidden layer and number of nodes. The networks were trained for 500 epochs. Fig. 6 and 7 show the scatter plot of estimation of porosity and water saturation respectively.
The FFNN model predicted porosity with RMSE of 0.0245 and correlation coefficient of 0.93563 during training and RMSE of 0.0264 with correlation coefficient of 0.92594 during testing. FFNN model prediction for water saturation gives RMSE of 0.0436 with correlation coefficient of 0.9916 during training and RMSE of 0.0556 with correlation coefficient of 0.9884 during testing.
In comparison, functional network model performance is slightly better in the estimation of porosity, while neural network show slightly better performance to functional network in the prediction of water saturation. However, the long time taken to achieve the above neural network model topology can not be over emphasized. This is due to the well known problem of neural networks where a number of parameter has to be determined through trial and error. Another important advantage of FN over FFNN is that, FN provides insight into the network – gives the input-output relationship. For example, we can deduce from (14) that the first three inputs have significant contribution to the network while (15) shows that the first four inputs have significant contribution for the prediction of water saturation. Aside these, FN has also demonstrated to be cost effective in implementation as it has lower network weights (N. weight) and execution time (Ex. Time) compare to FFNN as shown from table 1and 2.
IV. CONCLUSION In this study, we propose an alternative approach,
functional networks, which provide a satisfactory prediction for reservoir porosity and water saturation from convectional well log. A simplified generalized functional networks model is learned and tested on combination of data sets from two wells. Different basis functions are used on the model and minimum description length was used to determine the best basis function to use for the problem. The results show that functional networks successfully predicted formation porosity and water saturation with low error and high correlation coefficients.
A clear advantage of this technique over neural networks is the quick and unique solution obtained from the model. Another important advantage is that it discovers the relationship that exists between the predictor variables and the output. This provides valuable information about the variables, making it easy to know their significant as well as to compare with existing empirical or theoretical models.
Figure 6. Scatter plot for estimated porosity versus core porosity using neural network
Water Saturation
Measures FN FFNN
N.Weight 13 60
Training RMSE 0.1143 0.0436
CC 0.9491 0.9916
Ex. Time 0.1809 7.7346
Testing RMSE 0.0805 0.0556
CC 0.9743 0.9884
Ex. Time 0.01528 0.02258
0 0.05 0.1 0.15 0.2 0.25 0.3 0.350
0.1
0.2
0.3
0.4
Est
imat
ed p
oros
ity
Core Porosity
Scatter plot of NN for training set
0 0.05 0.1 0.15 0.2 0.25 0.3 0.350
0.1
0.2
0.3
0.4
Est
imat
ed p
oros
ity
Core Porosity
Scatter plot of NN for test set
cc=0.93563
cc=0.92594
0 0.1 0.2 0.3 0.4 0.5 0.6 0.7 0.8 0.9 10
0.5
1
Est
imat
ed W
ater
Sat
urat
ion
Core Water Saturation
Scatter Plot of FN for Training Set
0 0.1 0.2 0.3 0.4 0.5 0.6 0.7 0.8 0.9 10
0.5
1
Est
imat
ed W
ater
Sat
urat
ion
Core Water Saturation
Scatter Plot of FN for Testing Set
CC=0.9491
CC=0.9743
Authorized licensed use limited to: King Abdul Aziz City For Science & Technology. Downloaded on August 9, 2009 at 07:18 from IEEE Xplore. Restrictions apply.

Figure 7. Scatter plot for estimated water saturation versus core water saturation using neural network
REFERENCES
[1] Y. Zhang, H.A. Salisch, and C. Arns, “Permeability evaluation in a glauconite-rich formation in the Carnarvon Basin Western Australia. Geophysics VOL. 65, NO. 1 P.46-53 . January-February 2000.
[2] H.B. Helle, A. Bhatt and B. Ursin, “Porosity and permeability prediction from wireline logs using artificial neural networks: a north sea case study”. Geophysical Prospecting 49, 431-444. (Expanded abstract presented in EAGE 62nd conference and technical exhibitions-Helsinki, Finland, 2001).
[3] J. Yan, “Reservoir parameters estimation from well log and core data: a case study from the north sea” Petroleum Geoscience, Vol. 8 pp. 63–69, 2002.
[4] J. Lim and J. Kim, “Reservoir Porosity and permeability estimation from well log using fuzzy logic and neural network”. SPE 88476. SPE Asia Pacific Oil and Gas Conference and Exhibition held in Perth, Australia, 18–20 October 2004.
[5] H. Guo, Kejun Zhu, Deyun Wang, Jinjin Zhou Yue Li “Setting up Model of Forecasting Core Reservoir Parameters by Fusion of Soft Computing Methods” IEEE ICNC 2007
[6] B. Balan, S. Mohaghegh, S. Ameri, “State-of-the-art in permeability determination from well log data: part 1- A comparative study, model
Development” SPE 30978, SPE Eastern Regional Conference & Exhibition, Morgantown, West Virginia, U.S.A., 17-21 September, 1995.
[7] S. Haykin Neural networks: A comprehensive foundation. Macmillan International 1999.
[8] G. Hamada and M. Elshafei “Evaluation of petrophysical properties Of sandstone reservoirs using artificial neural network approach” Icmsa07, UAE, March 2007.
[9] Z. Huang, J. Shimeld, M. Williamson and J. Katsube, “Permeability prediction with artificial neural network modelling in the Venture gas field offshore eastern Canada,” Geophysics 61 422-436, 1996.
[10] N. Al-Bulushi, M. Araujo and M. Kraaijveld, “Predicting water saturation using artificial neural networks” Proceedings of the 25th IASTED International Multi-Conference Artificial Intelligence And Applications Feb 12-14, 2007 Innsbruck, Austria.
[11] R. Soto B., J.F. Ardilla, H. Ferneynes, and H. Bejarano, ”Neural Network To Predict the Permeability and Porosity of Zone “C” of The Cantagalo Feild in Colombia” SPE 38134. Petroleum Computer Conference , Dallas, Tx, USA, 8-11 June 1997.
[12] E. M. Shokir ” Prediction of hydrocarbon saturation in low resistivity formation via artificial neural network” SPE 87001. SPE Asia Pacific Conference on Integrated Modelling for Asset Management, Kuala, Lumpur, Malaysia, 29-30 March 2004.
[13] Y. Zhang, H. A. Salisch, and J. G.McPherson, “ Application of neural networks to identify lithofacies from well logs”. Exploration Geophysics 30, 45-49.
[14] T. Ahmed, K.W Porter, C. J. Wideman, P. Himmer, and J. Braun, “Application of neural network parameter prediction in reservoir characterization and simulation- a case history: the rabbit hills field.” SPE 38985. Fifth Latin American and Caribbean Petroleum Engineering Conference and Exhibition, Rio de Janeiro, Brazil, 30 August-3 September 1997
[15] E. Castillo, A. Cobo, J. M. Guteirrez, and E. Pruneda Functional Networks with application: A neural based paradigm. Boston, Kluwer Academic Publishers, 1999.
[16] E. Castillo, A. Cobo, J. M. Guteirrez, and E. Pruneda “Functional Networks: A New Network-Based Methodology” Computer-Aided Civil and Infrastructure Engineering, Volume 15 Issue 2 Page 90-106, March 2000.
[17] E. Castillo, A. Cobo, R. Gómez-Nesterkin and A. S. Hadi “A General Framework for Functional Networks” NETWORKS, Vol. 35(1), 70.82 2000.
[18] E. Castillo, J. M. Guteirrez, A. S. Hadi and B. Lacruz, “Some applications of functional networks in statistics and engineering” Technometrics,vol. 43, no. 1 Febuary 2001.
.
0 0.2 0.4 0.6 0.8 10
0.5
1scatter plot of NN for Training Set
Core water Saturation
Est
imat
ed W
ater
sat
urat
ion
0 0.2 0.4 0.6 0.8 10
0.5
1scatter plot of NN for Testing Set
Core Water Saturation
Est
imat
ed W
ater
Sat
urat
ion
cc=0.9884
cc=0.9916
Authorized licensed use limited to: King Abdul Aziz City For Science & Technology. Downloaded on August 9, 2009 at 07:18 from IEEE Xplore. Restrictions apply.