Bio Fireshield Cast-In-Place Bio Fireshield Pass-Thru Device
Upload
khangminh22Category
view
4download
0
Department of Chemical Engineering
Fuel Properties and Thermal Processing of Bio-oil and Its Derived
Fuel Mixtures
Wenran Gao
This thesis is presented for the Degree of
Doctor of Philosophy
of
Curtin University
November 2018
I
Declaration
To the best of my knowledge and belief this thesis contains no material previously
published by any other person except where due acknowledgment has been made.
This thesis contains no material which has been accepted for the award of any other
degree or diploma in any university.
Signature:
Date: November, 2018

II
Dedication
To my beloved family
and friends

III
Abstract
Fossil fuel resources are depleting in reserve and are largely responsible for the
environmental pollution due to carbon dioxide emission. Biomass, as a renewable
energy resource, have been attracting much attentions because biomass is
eco-friendly. However, biomass as a direct fuel suffers from low
volumetric-energy-density and poor grindability due to its bulky and fibrous nature.
Such fuel properties dictate that processes utilising biomass as a direct fuel must be
of small scale and distributed nature. For large-scale applications, necessary
pre-treatment is needed for achieving drastic volumetric energy densification of
biomass in order to enable the biomass-derived fuels be suitable for transport. Fast
pyrolysis is an attractive thermochemical technology to convert biomass into
high-energy-density biofuels, i.e. bio-oil and biochar. Meanwhile, as a by-product of
biodiesel industry, direct utilization of crude glycerol is also highly desired due to its
huge surplus. Therefore, it is of critical importance to develop an innovative strategy
for the co-utilization of fuel mixtures prepared from crude glycerol, bio-oil and/or
biochar. An important application is the thermochemical processing of these fuels in
fluidised-bed reactors (FBRs). As these fuel mixtures belong to a new class of fuels,
understanding the properties of these fuels and the underlying physical chemistry
during fuel processing in FBR becomes important. As pyrolysis is the first step of
any fuel thermochemical processing, this thesis has a particular focus on bed
agglomeration during the pyrolysis of these fuel mixtures in FBR.
The key objectives of this PhD thesis include 1) characterising the fuel properties and
ageing of slurry fuels prepared from glycerol or crude glycerol, bio-oil, methanol and
biochar; 2) experimentally determining the ignition temperatures of bio-oil and
various bio-oil based fuel blends and slurry fuels; 3) understanding the cold flow
behaviour of bio-oil and its derived fuel mixtures; and 4) investigating bed
agglomeration during bio-oil fast pyrolysis in FBR at a range of temperature. These
objectives have been successfully achieved, with the major research outcomes listed
below.
Firstly, this PhD study has characterised the fuel properties and ageing behaviour of
a series of bioslurry fuels prepared from glycerol/methanol/bio-oil (GMB) blend with
IV
different biochar loading level (up to 16.7 wt %). The GMB/biochar (GMBB)
bioslurry fuels generally exhibit non-Newtonian and thixotropic behaviour,
especially those at high biochar to GMB blend ratios (2:20–4:20). An increase in
biochar loading also increase the higher heating value (HHV), density and surface
tension of the GMBB bioslurry fuels. Compared to the bio-oil/biochar (BB) bioslurry
fuels at the same biochar loading level, the GMBB bioslurry fuels have much lower
viscosity, water content and total acids number (TAN). Both the GMBB and BB
bioslurry fuels have increasing viscosity, decreasing water content and TAN with
increasing biochar to liquid ratio. Ageing results in decreases in the TAN and
viscosity but an increase in water content of the GMBB slurry fuels. The leaching of
alkali and alkaline earth metallic (AAEM) species from biochar in the GMBB
bioslurry fuels increases with ageing. The presence of methanol and glycerol in the
GMBB slurry fuels slow down the ageing and also leads to less leaching of AAEM
species from biochar after accelerated ageing.
Secondly, this PhD thesis has investigated the rheological properties and ageing of
bioslurry fuels prepared from crude glycerol/methanol/bio-oil (FCGMB) blend and
biochar, benchmarking against the GMBB bioslurry for stationary combustion
applications. Both FCGMB/biochar (FCGMBB) bioslurry and GMBB bioslurry fuels
exhibit non-Newtonian and thixotropic behavior. The viscosities of FCGMBB
bioslurry fuels are 222–268 mP.s which are lower than that of GMBB bioslurry due
to the presence of water in formulated crude glycerol (FCG). Ageing leads to
decreases in the TAN and viscosity but an increase in water content of both
FCGMBB and GMBB bioslurry fuels due to various reactions. The changes of the
water content (4.4–4.8%) and viscosity (6.0–11.7%) of FCGMBB, and the TAN (2.6%
and 4.3%) of FCG1MBB/FCG3MBB bioslurry fuels before and after ageing are
lower than that of GMBB bioslurry. This is due to the presence of soap and NaOH in
FCGs. Overall, FCGMBB bioslurry fuels have better rheological property than
GMBB bioslurry, and the presence of crude glycerol (CG) in the FCGMBB slurry
fuels slows down the ageing.
Thirdly, this PhD study has determined the ignition temperatures of a series of
bio-oil based fuel blends or slurry fuels prepared from bio-oil, bio-oil water-soluble
fraction (WSF), CG and/or biochar via two different methods. One is
V
thermogravimetric analysis (TGA) method and the other is a modified method based
on ASTM standard. Bio-oil has an ignition temperature of 506 C while WSF has a
slightly higher ignition temperature (511 C) due to negative effect of water on
ignition. Fuels with CG have lower ignition temperatures due to the presence of
sodium salts in CGs. For example, the ignition temperatures of the
CG/methanol/bio-oil/biochar (CGMBB) slurry range from 445 to 470 C while that
of the GMBB slurry is 510 C. Although biochar has a lower ignition temperature
(375 C), slurry fuels have higher ignition temperatures than the respective blends.
This is attributed to the formation of less volatile and more carbonaceous solid by the
interactions between bio-oil components and biochar. The results show that the
ASTM-based method measures ignition temperatures with emphasis on ignition of
vapour phase but the TGA method provides that with emphasis on ignition of the
solid residue after evaporation.
Fourthly, this PhD study has deployed differential scanning calorimetry (DSC) for
investigating the cold flow behaviour of a series of fuel mixtures prepared from fast
pyrolysis bio-oil, CG, methanol and/or biochar. Bio-oil alone has a melting peak
temperature (TMP) of −21.9 C that may lead to difficulties in practical applications
under extreme cold weather conditions. Bio-oil WSF is even more problematic as its
TMP is −8.7 C. The results show that these problems can be alleviated or even
eliminated by mixing various FCGs with bio-oil or WSF. The TMP of FCGMB blends
significantly decreased from –21.9 to –38.1 C. Similar phenomena were also seen
for the FCG/WSF (FCGWSF) blends, with decreases in TMP from –8.7 to –32.0 C.
Water can worsen the cold flow properties of FCGMB and FCGWSF blends.
However, other components in FCGs can lower the TMP hence improve the cold flow
properties of these fuel mixtures (with the effectiveness in the order of NaCl >
NaOH > methanol > glycerol > soap due to solvation effect). The presence of
biochar has a limited effect on the cold flow property of the slurry fuels, leading to a
decrease of merely 4 C in the TMP at a 20% biochar loading level.
Fifthly, this PhD study has conducted a series of experiments to study bed
agglomeration during fast pyrolysis of bio-oil in a FBR at 500–800 C. The samples
used include bio-oil, bio-oil WSF, bio-oil water-insoluble fraction (WIF) and
VI
selected model compounds. Increasing pyrolysis temperature from 500 C to 800 C
decreases the agglomeration yield of bio-oil, WSF and WIF from 40% to 15%, 26.2%
to 11.6%, and 15.0% to 5.2% respectively. Investigation using model compounds
suggests that the interactions between lignin-derived oligomers and sugar is mainly
responsible for the high bed agglomeration yield of bio-oil and WSF, and such
interactions weaken as pyrolysis temperature increases. Water has insignificant effect
on bed agglomeration during bio-oil or WSF pyrolysis. The results also show that the
bed agglomeration yield and the formation of tar (and/or coke) are in broad linear
correlations, indicating that the tar (and/or coke) formed during fast pyrolysis
contribute to the bed agglomeration of bio-oil. The linear correlation from the data of
bio-oil has a steeper gradient compared to those of WSF and WIF, clearly indicating
the synergy taken place between the WSF and WIF during fast pyrolysis in
enhancing bed agglomeration.
VII
Acknowledgement
I gratefully acknowledge the Australian Research Council via its Discovery Projects
Scheme to partially support my PhD research project, and the Curtin Strategic
International Research Scholarship (CSIRS) and Curtin Competitive Completion
Scholarship (CCS) that have made my PhD study possible.
I express my deepest and sincerest gratitude to my supervisor, Professor Hongwei
Wu, for offering me this cherished and valuable opportunity of pursuing my study
under his supervision. He has always been very patient, so supportive and
understanding to me. Prof Wu has taught me a lot, not only in the aspect of doing
research but also in dealing with life. He has been a great mentor and what I have
learnt during my PhD study will tremendously benefit the rest of my lifetime. I
would also like to thank Dr. Mingming Zhang, my co-supervisor and best friend, for
all her guidance, help and accompany.
My gratitudes also go to our group members including Dr. Yun Yu, Dr. Suiboon
Liaw, Dr. Mansoor Hassani Ghezelchi, Dr. Alan Hamilton Burton, Dr. Syamsuddin
Yani, Dr. Matthew Witham, Dr. Mohammad Usman Rahim, Dr. Chao Feng, Mr Bing
Song, Mr Yu Long, Ms Yee Wen Chua, Mr Xujun Chen, Mr Mingyang Li, Ms
Jinxiu Cao, Mr Changya Deng and Ms Qiqing Shen, for their assistances in various
aspects.
I would also like to thank all Chemical Engineering Department lab technical staffs,
Mr Andrew Chan, Ms Melina Miralles, Ms Ann Carroll, Mr Xiao Hua, Dr. Roshanak
Doroushi, Dr. Guanliang Zhou, Mr Araya Abera, and Mr Jason Wright, for their
assistance and technical support in the lab. Moreover, I also thank the bio-oil
provider (who has chosen to remain anonymous) for supplying the fast pyrolysis
bio-oil samples and WA&J King Pty Ltd (Western Australia) for supplying the pine
wood sample.
I am truly indebted to my beloved family, my parents and my little sister, for their
continuous love and support which are my source of strength. I love you all forever.

VIII
Lastly, I would like to thank my late best friend, Ms Aijing Wang, who also wanted
to join our research group, for her accompany at the beginning of my study. I miss
you so much.
IX
List of Publications from My PhD Study
Papers published in refereed journals:
1. Gao, W.; Zhang, M.; Wu, H., Bed Agglomeration during Bio-oil Fast Pyrolysis
in a Fluidised-bed Reactor, Energy & Fuels, 2018, 32 (3), 3608-3613.
2. Gao, W.; Zhang, M.; Wu, H., Differential scanning calorimetry studies on the
cold flow properties of fuel mixtures from bio-oil, crude glycerol, methanol,
and/or biochar, Energy & Fuels, 2017, 31 (8), 8348-8355.
3. Gao, W.; Zhang, M.; Wu, H., Ignition temperatures of various bio-oil based fuel
blends and slurry fuels. Fuel, 2017, 207, 240-243.
4. Gao, W.; Zhang, M.; Wu, H., Fuel properties and ageing of bioslurry prepared
from glycerol/methanol/bio-oil blend and biochar. Fuel 2016, 176, 72-77.
Papers published in refereed conference proceedings:
1. Gao, W.; Zhang M., Wu, H., Rheological properties and ageing of bioslurry fuels
prepared from crude glycerol/methanol/bio-oil blend and biochar for stationary
combustion applications. The 11th Asia Pacific Conference on Combustion
(ASPACC-11), 10-14th, December 2017, Sydney, Australia.
2. Feng, C.; Gao, W.; Wu, H., Combustion of bioslurry and its fractions: different
contributions to PM10 emission. The 11th Asia Pacific Conference on
Combustion (ASPACC-11), 10-14th, December 2017, Sydney, Australia.
X
Table of Contents
Declaration……………………………………………………………………………………...I
Dedication……………………………………………………………………………………...II
Abstract....………………………………………………………………………………..........III
Acknowledgement .................................................................................................. VII
List of Publications from My PhD Study ............................................................... IX
Table of Contents .................................................................................................... X
List of Tables……………………………………………………………………..XVI
List of Figures………………………………………………………………….XVIII
Chapter 1 Introduction ......................................................................................... 1
1.1 Background and Motive ................................................................................... 1
1.2 Scope and Objectives ....................................................................................... 3
1.3 Thesis Outline .................................................................................................. 3
Chapter 2 Literature Review .............................................................................. 6
2.1 Introduction ...................................................................................................... 6
2.2 Biomass Fast Pyrolysis: Production of Bio-oil and Biochar ............................ 7
2.2.1 Advantages and disadvantages of biomass as a fuel ............................... 7
2.2.2 Biomass fast pyrolysis ............................................................................ 8
2.3 Application of Biochar from Biomass Fast Pyrolysis as a Fuel .................... 10
2.4 Characterization and Application of Bio-oil as a Fuel and Its Fractions ....... 12
2.4.1 Bio-oil as a fuel and its fuel properties ................................................. 13
2.4.1.1 Physico-chemical properties of bio-oil .................................... 13
2.4.1.2 Fuel properties of bio-oil ......................................................... 19
2.4.2 Bio-oil water-soluble fraction and water-insoluble fraction ................. 21

XI
2.4.2.1 Characterization and application of bio-oil water soluble
fraction as a fuel ...................................................................... 22
2.4.2.2 Characterization and application of bio-oil water insoluble
fraction ..................................................................................... 24
2.5 Ignition Behaviour and Cold Flow Behaviour of Bio-oil .............................. 25
2.5.1 Ignition behaviour of bio-oil ................................................................. 25
2.5.1.1 Flash point ............................................................................... 25
2.5.1.2 Ignition temperature ................................................................ 26
2.5.2 Cold flow behaviour of bio-oil .............................................................. 26
2.5.2.1 Pour point ................................................................................ 27
2.5.2.2 Cloud point .............................................................................. 27
2.5.2.3 Differential scanning calorimetry techniques to study cold flow
behaviour ................................................................................. 28
2.6 Bio-oil Upgrading Technologies .................................................................... 28
2.6.1 Physical upgrading of bio-oil ................................................................ 29
2.6.1.1 Filtration .................................................................................. 29
2.6.1.2 Solvent addition ....................................................................... 29
2.6.1.3 Emulsions/Emulsification ........................................................ 30
2.6.2 Catalytic upgrading of bio-oil ............................................................... 31
2.6.2.1 Catalytic cracking .................................................................... 31
2.6.2.2 Catalytic hydrogenation/Hydrotreating ................................... 31
2.6.3 Bio-oil upgrading by steam reforming .................................................. 32
2.7 Recent Advancement in Bio-oil Derived Fuel Mixtures Containing Crude
Glycerol and/or Biochar ................................................................................ 32
2.7.1 Characterization and application of crude glycerol as a fuel ................ 33
2.7.2 Bio-oil derived fuel blends and emulsion fuels contain crude glycerol 34
2.7.3 Bio-oil derived slurry fuels containing biochar .................................... 36
2.8 Thermal Processing of Bio-oil ....................................................................... 38
XII
2.8.1 Pyrolysis ................................................................................................ 38
2.8.2 Combustion ........................................................................................... 40
2.8.3 Gasification ........................................................................................... 41
2.8.4 Bed agglomeration in a fluidised-bed reactor ....................................... 41
2.9 Conclusion and Research Gaps ...................................................................... 43
2.10 Study Objectives of the Present Study ........................................................... 45
Chapter 3 Research Methodology and Analytical Techniques ..................... 47
3.1 Introduction .................................................................................................... 47
3.2 Methodology .................................................................................................. 47
3.2.1 Fuel properties and ageing of GMBB and CGMBB slurry fuels .......... 50
3.2.2 Ignition temperatures of various bio-oil based fuel blends and slurry
fuels ....................................................................................................... 50
3.2.3 Differential scanning calorimetry studies on the cold flow properties of
fuel mixtures from bio-oil, crude glycerol, methanol, and/or biochar .. 51
3.2.4 Bed agglomeration during bio-oil fast pyrolysis in a fluidised-bed
reactor .................................................................................................... 51
3.3 Experimental Section ..................................................................................... 52
3.3.1 Sample preparation................................................................................ 52
3.3.2 Accelerated ageing experiment ............................................................. 55
3.3.3 Characterization of ignition temperature .............................................. 55
3.3.4 Characterization of cold flow property ................................................. 56
3.3.5 Fast pyrolysis experiments .................................................................... 57
3.4 Instruments and Analytical Techniques ......................................................... 58
3.4.1 Ultimate and proximate analysis ........................................................... 58
3.4.2 Higher heating value ............................................................................. 59
3.4.3 Quantification of inorganic species ....................................................... 59
3.4.4 Rheological properties .......................................................................... 59
XIII
3.4.5 Water content, acidity, surface tension, density and Ohnesorge number
............................................................................................................... 60
3.4.6 Determination of particle size distribution (PSD), bed agglomeration
yield, tar yield and coke yield ............................................................... 61
3.4.7 Optical imaging ..................................................................................... 62
3.5 Summary ........................................................................................................ 62
Chapter 4 Fuel Properties and Ageing of Bioslurry Prepared from
Glycerol/Methanol/Bio-oil Blend and Biochar ............................. 63
4.1 Introduction .................................................................................................... 63
4.2 Rheological and Fuel Properties of GMBB Bioslurry Fuels ......................... 66
4.3 Ageing of GMBB Bioslurry ........................................................................... 70
4.4 Leaching Characteristics of AAEM Species in the GMBB Bioslurry System
....................................................................................................................... 75
4.5 Conclusions .................................................................................................... 76
Chapter 5 Rheological Properties and Ageing of Bioslurry Fuels Prepared
from Crude Glycerol/Methanol/Bio-oil Blend and Biochar for
Stationary Combustion Applications ............................................. 78
5.1 Introduction .................................................................................................... 78
5.2 Fuel and Rheological Properties of FCGMBB Bioslurry Fuels..................... 81
5.3 Ageing of FCGMBB Bioslurry Fuels ............................................................ 84
5.4 Conclusions .................................................................................................... 86
Chapter 6 Ignition Temperatures of Various Bio-oil Based Fuel Blends and
Slurry Fuels ...................................................................................... 88
6.1 Introduction .................................................................................................... 88
6.2 Ignition Temperatures of Biochar, Bio-oil and Bio-oil Based Fuel Blends and
Slurry Fuels Measured by TGA Method ....................................................... 89
XIV
6.3 Ignition Temperature of Selected Bio-oil Based Fuels Tested by ASTM-based
Method and TGA Method ............................................................................. 93
6.4 Conclusion ..................................................................................................... 95
Chapter 7 Differential Scanning Calorimetry Studies on the Cold Flow
Properties of Fuel Mixtures from Bio-oil, Crude Glycerol,
Methanol and/or Biochar ................................................................ 97
7.1 Introduction .................................................................................................... 97
7.2 Cold Flow Properties of Individual Components for Preparing Fuel Blends
..................................................................................................................... 100
7.3 Effects of Individual Components in FCG on Cold Flow Properties of Bio-oil
and WSF ...................................................................................................... 102
7.4 Cold Flow Properties of FCGMB Fuel Blends Prepared From FCG, Methanol
and Bio-oil ................................................................................................... 105
7.5 Cold Flow Properties of FCGWSF Fuel Blends Prepared from FCG and
Bio-oil WSF ................................................................................................. 107
7.6 Cold Flow Properties of FCGMB/Biochar (FCGMBB) and
FCGWSF/Biochar (FCGWSFB) Slurry Fuels ............................................ 112
7.7 Conclusion ................................................................................................... 113
Chapter 8 Bed Agglomeration during Bio-oil Fast Pyrolysis in a
Fluidised-Bed Reactor ................................................................... 114
8.1 Introduction .................................................................................................. 114
8.2 Evidence and Extent of Bed Agglomeration during Fast Pyrolysis of Bio-oil
in a Fluidised-Bed Reactor .......................................................................... 116
8.3 Bed Agglomeration during the Fast Pyrolysis of Bio-oil Fractions and Model
Compounds .................................................................................................. 119
8.4 Correlations between Bed Agglomeration and the Formation of Tar and Coke
in Bed Samples ............................................................................................ 124
XV
8.5 Conclusions .................................................................................................. 127
Chapter 9 Conclusions and Recommendations ............................................ 129
9.1 Introduction .................................................................................................. 129
9.2 Conclusions .................................................................................................. 129
9.2.1 Fuel properties and ageing of glycerol/methanol/bio-oil/biochar and
crude glycerol/methanol/bio-oil/biochar slurry fuels .......................... 130
9.2.2 Ignition temperatures of various bio-oil based fuel blends and slurry
fuels ..................................................................................................... 130
9.2.3 Differential scanning calorimetry studies on the cold flow properties of
fuel mixtures from bio-oil, crude glycerol, methanol and/or biochar . 131
9.2.4 Bed agglomeration during bio-oil fast pyrolysis in a fluidised-bed
reactor .................................................................................................. 132
9.3 Recommendations ........................................................................................ 133
References……………………………………………………………………………………134
APPENDIXⅠ: ATTRIBUTION TABLES ......................................................... 158
APPENDIXⅡ: COPYRIGHT PERMISSION STATEMENTS ....................... 162
XVI
List of Tables
Table 2-1 Typical properties of bio-oil from wood pyrolysis and heavy fuel oil.76
.. 10
Table 2-2 Chemical composition of a bio-oil prepared from pine pyrolysis, combined
results of solvent fraction and CG/MSD.109
............................................................... 14
Table 2-3 Important possible reactions within different compounds in bio-oil related
to ageing.15
................................................................................................................. 18
Table 2-4 Fuel properties of WSF prepared from pine wood bio-oil with water to
bio-oil ratio being 0.5:1 benchmarking against bio-oil.58
.......................................... 23
Table 3-1 Compositions of a series of model compounds prepared in this study (wt%,
MS: mixed solvent, WIF: water-insoluble fraction). ................................................. 53
Table 4-1 Fuel Properties of Bio-oil, Glycerol, Methanol and Biochar used in this
study. .......................................................................................................................... 65
Table 4-2 Fuel properties of glycerol/methanol/bio-oil (GMB) blend and
glycerol/methanol/bio-oil/biochar (GMBB) bioslurry fuels. ..................................... 68
Table 5-1 Compositions of different types of formulated crude glycerol (FCG)
samples in this study (wt %). ..................................................................................... 79
Table 5-2 Fuel properties of CGMB blend and CGMBB bioslurry fuels
benchmarking against the biochar, bio-oil, GMB blend, BB and GMBB bioslurry. . 80
Table 6-1 Compositions of different types of formulated crude glycerol samples for
use in this study (wt %). ............................................................................................. 89
Table 6-2 Fuel properties of bio-oil, bio-oil WSF and biochar used in this study. .... 90
Table 6-3 Ignition temperatures of biochar, bio-oil and bio-oil based fuel blends and
slurry fuels measured by TGA method. ..................................................................... 91

XVII
Table 7-1 Fuel compositions of different types of formulated crude glycerol used in
this study (wt %). ....................................................................................................... 98
Table 7-2 Fuel compositions of different types of formulated crude glycerol used in
this study (wt %). ....................................................................................................... 99
Table 8-1 Fuel properties of bio-oil, bio-oil WSF and WIF used in this study. ...... 115
XVIII
List of Figures
Figure 1-1 Thesis map .................................................................................................. 5
Figure 2-1 The biomass cycle.89
................................................................................... 7
Figure 2-2 Biomass thermochemical conversions and its corresponding products.7 ... 8
Figure 2-3 Bio-oil fractions and their main compositions.123, 124, 150
......................... 22
Figure 3-1 Research methodology ............................................................................. 49
Figure 3-2 Allocation of bio-oil and its derived fuel mixtures. ................................. 54
Figure 3-3 Schematic diagram of the fluidised-bed reactor system: 1, samples
feeding and spray system; 2, water cooling tube; 3, quartz reactor; 4, furnace. ........ 58
Figure 4-1 Viscosity of GMB blend and GMBB bioslurry fuels as a function of shear
rate (at 25 C). GMB blend stands for Glycerol/Methanol/Bio-oil blend; GMBB
bioslurry-x:20 (x can be 1 to 4) stands for bioslurry fuels prepared from GMB blend
and biochar at biochar to GMB blend ratio of x:20. .................................................. 66
Figure 4-2 Shear stress of GMB blend and GMBB bioslurry fuels as a function of
shear rate (at 25 C). GMB blend stands for Glycerol/Methanol/Bio-oil blend;
GMBB bioslurry-x:20 (x can be 1 to 4) stands for bioslurry fuels prepared from
GMB blend and biochar at biochar to GMB blend ratio of x:20. .............................. 67
Figure 4-3 Thixotropic behaviour of GMB blend and GMBB bioslurry fuels as a
function of shear rate (at 25 C). GMB blend stands for Glycerol/Methanol/Bio-oil
blend; GMBB bioslurry-x:20 (x can be 1 to 4) stands for bioslurry fuels prepared
from GMB blend and biochar at biochar to GMB blend ratio of x:20. ..................... 69
Figure 4-4 Water content of bioslurry samples before and after ageing as a function
of the biochar to liquid ratio (on the basis of weight). Ageing test was conducted at
XIX
80 C for 24 h. Biochar to liquid ratio of 0 represents the GMB blend or bio-oil blank.
GMB blend stands for Glycerol/Methanol/Bio-oil blend; GMBB bioslurry stands for
bioslurry fuels prepared from GMB blend and biochar at various biochar to GMB
blend ratios. BB bioslurry stands for bioslurry samples prepared from biochar and
bio-oil at the same solid to liquid ratios for comparison. ........................................... 70
Figure 4-5 TAN of bioslurry samples before and after ageing as a function of the
biochar to liquid ratio (on the basis of weight). Ageing test was conducted at 80 C
for 24 h. Biochar to liquid ratio of 0 represents the GMB blend or bio-oil blank.
GMB blend stands for Glycerol/Methanol/Bio-oil blend; GMBB bioslurry stands for
bioslurry fuels prepared from GMB blend and biochar at various biochar to GMB
blend ratios. BB bioslurry stands for bioslurry samples prepared from biochar and
bio-oil at the same solid to liquid ratios for comparison. ........................................... 71
Figure 4-6 Viscosity of bioslurry samples before and after ageing as a function of the
biochar to liquid ratio (on the basis of weight). Ageing test was conducted at 80 C
for 24 h. Biochar to liquid ratio of 0 represents the GMB blend or bio-oil blank.
GMB blend stands for Glycerol/Methanol/Bio-oil blend; GMBB bioslurry stands for
bioslurry fuels prepared from GMB blend and biochar at various biochar to GMB
blend ratios. BB bioslurry stands for bioslurry samples prepared from biochar and
bio-oil at the same solid to liquid ratios for comparison. ........................................... 73
Figure 4-7 Percentage of AAEM species leached from biochar to bio-oil phase of the
GMBB and BB bioslurry fuels with biochar to liquid ratio of 0.1 and 0.2 (on the
basis of weight). Ageing test was conducted at 80 C for 24 h. GMB blend stands for
Glycerol/Methanol/Bio-oil blend; GMBB bioslurry stands for bioslurry fuels
prepared from GMB blend and biochar at various biochar to GMB blend ratios and
stored at room temperature for 7 days before accelerated ageing at 80 C. BB
bioslurry stands for bioslurry samples prepared from biochar and bio-oil at the same
XX
solid to liquid ratios and also stored at room temperature for 7 days for comparison.
.................................................................................................................................... 74
Figure 5-1 Viscosity of FCGMBB bioslurry fuels benchmarking against GMBB
bioslurry as a function of shear rate (at 25 C). GMBB bioslurry stands for
glycerol/methanol/bio-oil/biochar bioslurry; FCG1–3MBB bioslurry stands for
FCG1–3/methanol/bio-oil/biochar bioslurry; FCG stands for formulated crude
glycerol. ...................................................................................................................... 79
Figure 5-2 Shear stress of FCGMBB bioslurry fuels benchmarking against GMBB
bioslurry as a function of shear rate (at 25 C). GMBB bioslurry stands for
glycerol/methanol/bio-oil/biochar bioslurry; FCG1–3MBB bioslurry stands for
FCG1–3/methanol/bio-oil/biochar bioslurry; FCG stands for formulated crude
glycerol. ...................................................................................................................... 82
Figure 5-3 Thixotropic behavior (c) of FCGMBB bioslurry fuels benchmarking
against GMBB bioslurry as a function of shear rate (at 25 C). GMBB bioslurry
stands for glycerol/methanol/bio-oil/biochar bioslurry; FCG1–3MBB bioslurry
stands for FCG1–3/methanol/bio-oil/biochar bioslurry; FCG stands for formulated
crude glycerol. ............................................................................................................ 83
Figure 5-4 Water content of FCGMBB bioslurry samples benchmarking against
GMBB bioslurry before and after ageing. GMBB bioslurry stands for
glycerol/methanol/bio-oil/biochar bioslurry; FCG1–3MBB bioslurry stands for
FCG1–3/methanol/bio-oil/biochar bioslurry; FCG stands for formulated crude
glycerol. ...................................................................................................................... 84
Figure 5-5 TAN of FCGMBB bioslurry samples benchmarking against GMBB
bioslurry before and after ageing. GMBB bioslurry stands for
glycerol/methanol/bio-oil/biochar bioslurry; FCG1–3MBB bioslurry stands for
XXI
FCG1–3/methanol/bio-oil/biochar bioslurry; FCG stands for formulated crude
glycerol. ...................................................................................................................... 85
Figure 5-6 Water content (a), TAN (b) and viscosity (c) of FCGMBB bioslurry
samples benchmarking against GMBB bioslurry before and after ageing. GMBB
bioslurry stands for glycerol/methanol/bio-oil/biochar bioslurry; FCG1–3MBB
bioslurry stands for FCG1–3/methanol/bio-oil/biochar bioslurry; FCG stands for
formulated crude glycerol. ......................................................................................... 86
Figure 6-1 Ignition temperature of selected bio-oil based fuels tested by
ASTM-based method and TGA method. TGA stands for thermogravimetric analysis;
GMB stands for glycerol/methanol/bio-oil blend; CG1MB stands for
CG1/methanol/bio-oil blend; CG1MBB stands for CG1/methanol/bio-oil/biochar
slurry; WSF stands for water soluble fraction; GWSF stands for glycerol/WSF blend;
CG4WSF stands for CG4/WSF blend; CG4WSFB stands for CG4/WSF/biochar
slurry; CG stands for crude glycerol. ......................................................................... 94
Figure 7-1 DSC curves of bio-oil. ............................................................................ 100
Figure 7-2 DSC curves of (a) WSF and (b) methanol. ............................................ 101
Figure 7-3 (a) DSC curves of BM blends with methanol mass ratio from 0% to 15%
in blends, (b) TMP of BM blends as a function of methanol mass ratio in BM blends,
TMP stands for the melting peak temperature; BM stands for bio-oil/methanol blend.
.................................................................................................................................. 102
Figure 7-4 (a) DSC curves of WSF and WSF with major impurities in crude glycerol
blends; and (b) TMP of WSF and WSF with major impurities in crude glycerol blends.
TMP stands for the melting peak temperature; WSF stands for water soluble fraction.
.................................................................................................................................. 103
XXII
Figure 7-5 DSC curves of selected (a) GMB blends, (b−d) FCG1–3MB blends
benchmarking against bio-oil, the concentration after hyphen represents the content
of G or FCG, M and B in the mixture before the hyphen. GMB blend stands for
glycerol/methanol/bio-oil blend; FCG1–3MB blend stands for
FCG1–3/methanol/bio-oil blend; G: glycerol; FCG: formulated crude glycerol; M:
methanol; B: bio-oil. ................................................................................................ 104
Figure 7-6 DSC curves of selected (a–d) BM5-G and BM5-FCG1–3 blends with
methanol content fixing at 5% in BM blend and G or FCG1–3 content being 1.5%
and 3% in the whole blend benchmarking against BM5 blend. BM5 stands for
bio-oil/methanol blend with methanol ratio of 5%; G: glycerol; FCG: formulated
crude glycerol; M: methanol; B: bio-oil. ................................................................. 106
Figure 7-7 TMP of BM blends as a function of G or FCG1–3 mass ratio in BM blends.
TMP stands for the melting peak temperature; BM blend stands for bio-oil/methanol
blend; BM5 stands for bio-oil/methanol blend with methanol ratio of 5%; G stands
for glycerol; FCG stands for formulated crude glycerol. ......................................... 107
Figure 7-8 DSC curves of (a–d) GWSF and (b–d) FCG4–6WSF blends with glycerol
or FCG4–6 ratio varying from 20% to 80%. GWSF stands for G/WSF blends;
FCG4–6WSF stands for FCG4–6WSF blends; G stands for glycerol; FCG stands for
formulated crude glycerol; WSF stands for water soluble fraction. ........................ 108
Figure 7-9 TMP of GWSF and FCG4–6WSF blends as a function of G or FCG4–6
mass ratio in blends. TMP stands for the melting peak temperature; GWSF stands for
G/WSF blends; FCG4–6WSF stands for FCG4–6WSF blends; G stands for glycerol;
FCG stands for formulated crude glycerol; WSF stands for water soluble fraction.109
Figure 7-10 DSC curves of (a) BB slurry fuels, (b) GMBB slurry fuels, (c–e)
FCG1–3MBB slurry fuels. BB, GMBB, FCGMBB, WSFB, GWSFB, FCGWSFB
slurry fuels were prepared from biochar (10% or 20%) and corresponding bio-oil,
XXIII
GMB and FCGMB fuel blends. GMB or FCGMB are blends prepared using 3.3%
glycerol (or FCG), 5% methanol and 91.7% bio-oil. BB stands for bio-oil/biochar
slurry; GMBB stands for glycerol/methanol/bio-oil/biochar slurry; FCGMBB stand
for crude glycerol/methanol/bio-oil/biochar slurry; FCG stands for formulated crude
glycerol. .................................................................................................................... 110
Figure 7-11 DSC curves of (a) WSFB slurry fuels, (b) GWSFB slurry fuels, and (c–e)
FCG4–6WSFB slurry fuels. BB, GMBB, FCGMBB, WSFB, GWSFB, FCGWSFB
slurry fuels were prepared from biochar (10% or 20%) and corresponding WSF,
GWSF and FCGWSF fuel blends. GWSF and FCGWSF are blends prepared using
40% glycerol (or FCG) and 60% WSF. WSFB stands for WSF/biochar slurry;
GWSFB stands for glycerol/WSF/biochar slurry; FCGWSFB stands for stands for
crude glycerol/WSF/biochar slurry; WSF stands for water soluble fraction; FCG
stands for formulated crude glycerol........................................................................ 111
Figure 8-1 Particle size distribution of the bed samples collected from the fast
pyrolysis of bio-oil in a fluidised-bed pyrolysis reactor at 500–800 C. ................. 116
Figure 8-2 Optical images of bed agglomerates (collected from bio-oil fast pyrolysis
at temperature of 500 C) in size fraction of (a) 250–355 µm, (b) 355–500 µm, (c)
0.5–1 mm and (d) > 1 mm. ....................................................................................... 117
Figure 8-3 Agglomeration yields during fast pyrolysis of bio-oil at 500–800 C. .. 118
Figure 8-4 Particle size distribution of the bed samples collected from the fast
pyrolysis of (a) WSF and (b) WIF which is dissolved in ethanol in a fluidised-bed
pyrolysis reactor at 500–800 C. WSF stands for water-soluble fraction; WIF stands
for water-insoluble fraction. ..................................................................................... 119
Figure 8-5 Agglomeration yields during fast pyrolysis of bio-oil fractions (WSF and
WIF) at 500–800 C. WSF stands for water-soluble fraction; WIF stands for
water-insoluble fraction. .......................................................................................... 120
XXIV
Figure 8-6 Agglomeration yields during fast pyrolysis of bio-oil model compounds at
500–800 C. WSF stands for water-soluble fraction; WIF stands for water-insoluble
fraction; MS stands for mixed solvent. .................................................................... 121
Figure 8-7 Correlation between (a) the reduction in the agglomeration yield due to
solvent washing and pyrolysis temperature, (b) the yield of tar and pyrolysis
temperature. WSF stands for water-soluble fraction; WIF stands for water-insoluble
fraction. .................................................................................................................... 124
Figure 8-8 Correlation between (a) the agglomeration yield after solvent washing and
pyrolysis temperature, (b) the yield of coke and pyrolysis temperature. WSF stands
for water-soluble fraction; WIF stands for water-insoluble fraction. ...................... 125
Figure 8-9 Correlation between (a) the reduction in the agglomeration yield due to
solvent washing and the yield of tar and (b) the agglomeration yield after solvent
washing and the yield of coke. WSF stands for water-soluble fraction; WIF stands
for water-insoluble fraction. ..................................................................................... 126
1
Chapter 1 Introduction
1.1 Background and Motive
The recent rapid growth in global economy has led to substantial increases in the
world’s energy consumption.1-3
Fossil fuels as the main primary energy sources are
finite and depleting.4 The utilisation of fossil fuels is also known to be a key
contributor to greenhouse gas emission that is responsible for global warming.5, 6
Therefore, it is urgent and of significant importance to utilise renewable energy
resources for future sustainable development.7-9
Biomass is considered to be a
promising alternative energy resource and is becoming increasingly important.1, 2, 9
However, biomass directly used as a fuel suffers from several undesired fuel
properties, including low energy densities, poor grindability and high transport
cost.10
Fast pyrolysis is a thermochemical process that converts low-energy-density
biomass to high-energy-density bio-oil and biochar.3, 11-15
However, biochar powders
are dusty and prone to spontaneous combustion.16-19
Bio-oil also has some
unfavourable properties including its acidity, instability and prone to ageing.20-22
Therefore, extensive research has been carried out for biochar and bio-oil utlisation.20,
21, 23-32 One strategy is to mix bio-oil with biochar, and also with the addition of other
fuels (e.g. crude glycerol from biodiesel production process, see below).17, 21
Such a
strategy is favourable and has the potential to largely address the problems associated
with biochar or bio-oil.16, 18, 19, 33-36
Biodiesel is another notable option for complementing petroleum diesel as it is
renewable, non-toxic and biodegradable.37-44
Crude glycerol is the major by-product
along with the production of biodiesel, at ~10% by weight of the raw materials.45-51
2
The blooming biodiesel industry leads to huge feedstock of crude glycerol.52-54
European Union, the biggest biodiesel producer in the world, generated 24.9 billion
litres of biodiesel in 2016 which resulted in about 2.8 billion litres of crude
glycerol.49
Utilization of such extensive surplus by-product is of importance to the
sustainable development of biodiesel industry.45
Crude glycerol contains various
impurities including water, methanol, soaps and salts while the purification of crude
glycerol is too costly and cumbersome.50
Therefore, it is essential to find utilization
strategy of crude glycerol such as used as a boiler fuel to offer process heating.55, 56
Unfortunately, direct combustion or gasification of crude glycerol in boilers is
limited by its high viscosity.55
This may be addressed by mixing crude glycerol with
other fuels such as bio-oil. Fuel blends prepared by mixing crude glycerol, methanol
and bio-oil or bio-oil water-soluble fraction (WSF) can significantly improve the fuel
properties.57-60
The fuel blends can further mixed with biochar to prepare slurry fuels.
However, there is little knowledge on the fuel properties of such slurry fuels,
especially the ignition behaviour and cold behaviour. Furthermore, how the biochar
and impurities in crude glycerol affect the fuel properties are also largely unknown.
For fuel thermal processing such as pyrolysis, combustion or gasification,
fluidised-bed reactors are extensively used due to its advantages in efficiency,
convenience and versatility.61-66
Bed agglomeration is a common but important
operating issue which may cause defluidization of a fluidised-bed reactor.67-71
There
has been extensive research carried on the mechanism of bed agglomeration during
combustion or gasification of biomass (driven by ash species).61, 63-66, 72, 73
However,
bed agglomeration during fuel pyrolysis in fluidised-bed is a new topic until recently
when the mechanism of bed agglomeration during biomass fast pyrolysis (driven by
organic matter which include all kinds of aromatic-ring system) were investigated.62,
69-71 However, there is no investigation on fundamental mechanisms governing bed
3
agglomeration during fast pyrolysis of bio-oil and its derived fuel mixtures in
fluidised-bed reactors.
1.2 Scope and Objectives
Therefore, this PhD thesis aims to carry out a systematic research on fuel properties
and thermal processing of bio-oil and various bio-oil derived fuel mixtures. The fuel
mixtures are prepared from bio-oil or its WSF, crude glycerol, and/or biochar. The
specific objectives of this thesis are to:
investigate fuel properties and ageing of slurry fuels prepared from glycerol
or crude glycerol, bio-oil, methanol and biochar;
carry out a systematic study into ignition behaviour of bio-oil based fuel
blends and slurry fuels by thermogravimetric analysis (TGA) method and
an ASTM-based method;
conduct investigation into cold flow properties of bio-oil derived fuel
mixtures via differential scanning calorimetry (DSC);
reveal the fundamental mechanism related to bed agglomeration during fast
pyrolysis of bio-oil under various temperatures in the fluidised-bed reactor.
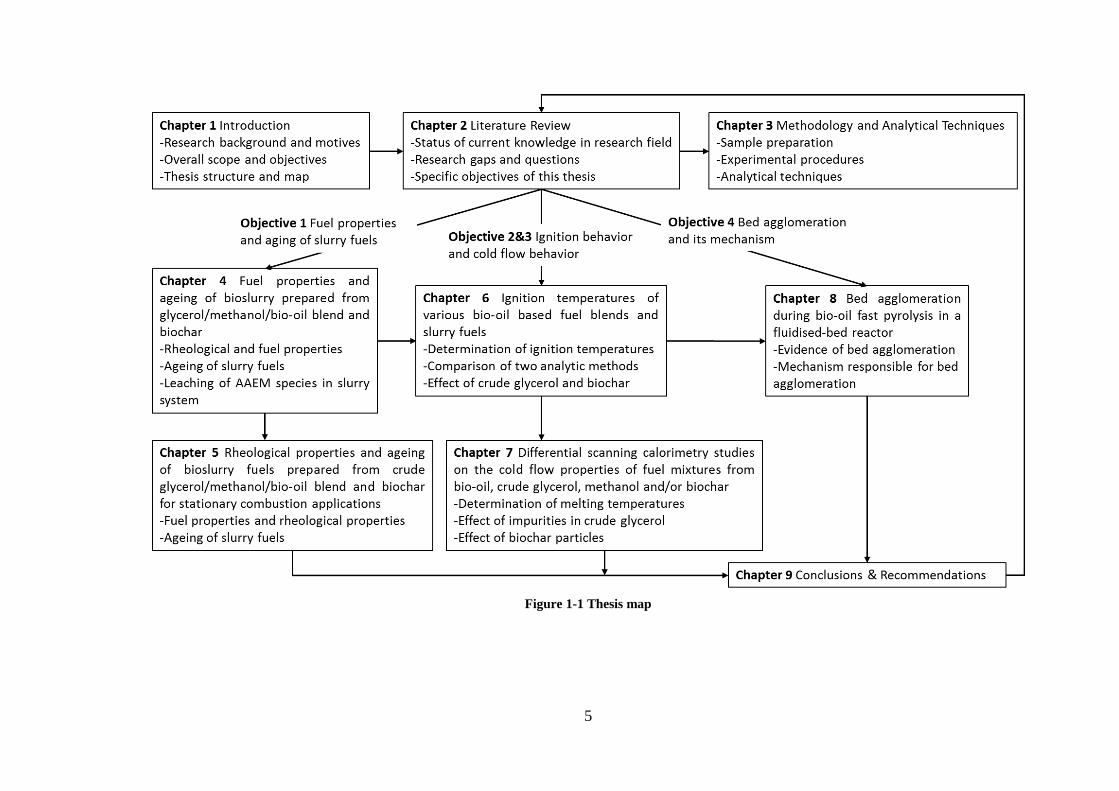
1.3 Thesis Outline
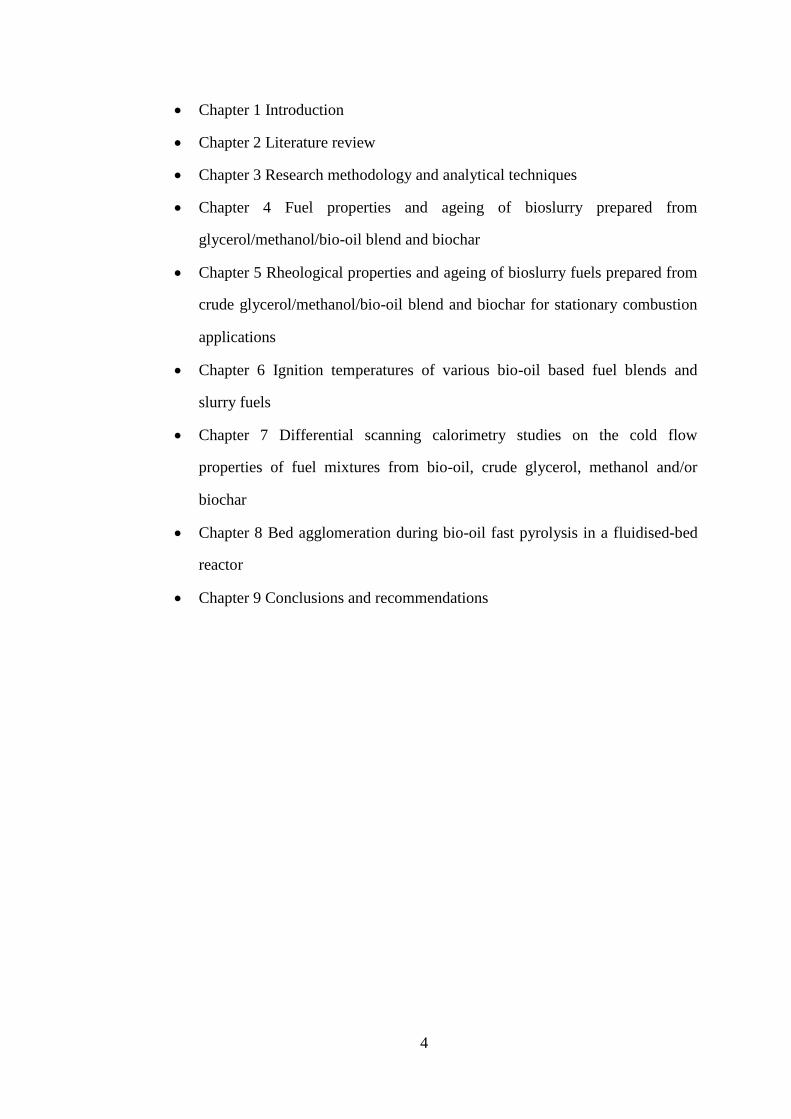
This thesis contents 9 chapters (this chapter included) which are listed below, with
the thesis map demonstrated in Figure 1-1.
4
Chapter 1 Introduction
Chapter 2 Literature review
Chapter 3 Research methodology and analytical techniques
Chapter 4 Fuel properties and ageing of bioslurry prepared from
glycerol/methanol/bio-oil blend and biochar
Chapter 5 Rheological properties and ageing of bioslurry fuels prepared from
crude glycerol/methanol/bio-oil blend and biochar for stationary combustion
applications
Chapter 6 Ignition temperatures of various bio-oil based fuel blends and
slurry fuels
Chapter 7 Differential scanning calorimetry studies on the cold flow
properties of fuel mixtures from bio-oil, crude glycerol, methanol and/or
biochar
Chapter 8 Bed agglomeration during bio-oil fast pyrolysis in a fluidised-bed
reactor
Chapter 9 Conclusions and recommendations
5
Figure 1-1 Thesis map

6
Chapter 2 Literature Review
2.1 Introduction
With the rapid growth of global population and economy, energy shortage and
environmental issues are becoming great challenges of our society.74, 75
As the
primary energy sources, the fossil fuels such as coal, oil and natural gas are expected
to play a continuously-important role in the global energy mix. The use of fossil fuels
are known to be major contributors to many environmental problems including
greenhouse gas emissions.9, 12, 76
Therefore, it is of critical importance to develop
clean and renewable energy sources.1, 7, 75
Recently, substantial research has been
carried out on biofuels derived from biomass, such as bio-oil (derived from biomass
pyrolysis)1, 7, 31, 32, 77, 78
and biodiesel (derived from vegetable oil or fat
transesterification)43, 44, 79-82
which are considered as promising liquid fuel to partial
substitute fossil fuel.10, 23, 26, 46
It is extremely significant to utilize the by-products
(biochar and crude glycerol) of bio-oil and biodiesel industry for their sustainable
development.3, 22, 52, 53, 83, 84
A prospective approach to utilize those by-products is to
prepare bio-oil derived fuel mixtures.
The target of this chapter is to review the characterization and application of bio-oil,
biochar and crude glycerol. The literature review begins with biomass fast pyrolysis
to prepare bio-oil and biochar, followed by discussions on characterization and
application of biochar and bio-oil as a fuel, especially cold flow behaviour and
ignition behaviour of bio-oil, then moves to characterization and application of crude
glycerol as a fuel. In addition, recent advancement in bio-oil derived fuel mixtures
which contain crude glycerol, and/or biochar is outlined. A short summary is also
given on thermal processing of bio-oil and its derived fuel mixtures. Finally, this
7
chapter concludes with identifying of research gaps and research objectives of this
PhD study.
2.2 Biomass Fast Pyrolysis: Production of Bio-oil and Biochar
2.2.1 Advantages and disadvantages of biomass as a fuel
As prime energy sources, fossil fuels like petrol, coal and natural gas are expected to
be depleted in the following 50 years.85
Moreover, the utilization of fossil fuels also
lead to environmental issues such as acid rain and global warming which are
attributed to polluted gas emission (i.e. CO2, CH4, N2O, and SO2).8, 74, 85-87
As a result,
renewable and clean energy sources are attracting growing interest to reduce
environmental pollution.74, 85
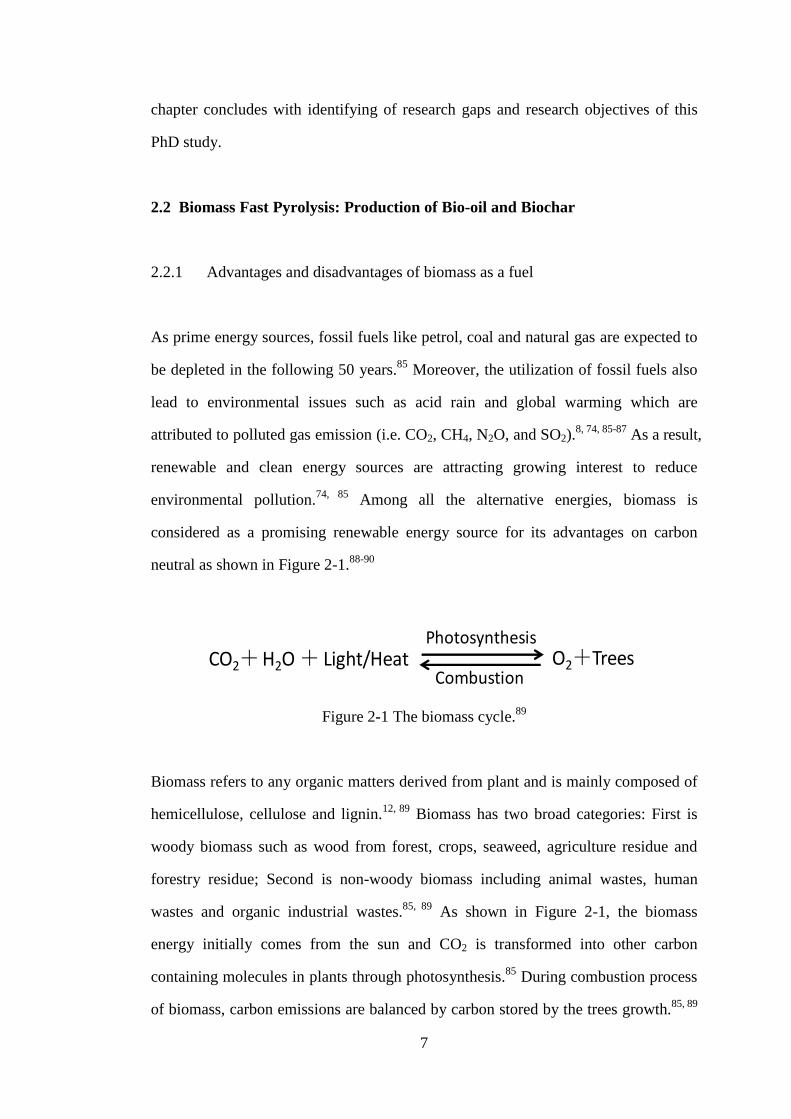
Among all the alternative energies, biomass is
considered as a promising renewable energy source for its advantages on carbon
neutral as shown in Figure 2-1.88-90
Figure 2-1 The biomass cycle.89
Biomass refers to any organic matters derived from plant and is mainly composed of
hemicellulose, cellulose and lignin.12, 89
Biomass has two broad categories: First is
woody biomass such as wood from forest, crops, seaweed, agriculture residue and
forestry residue; Second is non-woody biomass including animal wastes, human
wastes and organic industrial wastes.85, 89
As shown in Figure 2-1, the biomass
energy initially comes from the sun and CO2 is transformed into other carbon
containing molecules in plants through photosynthesis.85
During combustion process
of biomass, carbon emissions are balanced by carbon stored by the trees growth.85, 89
O2+TreesCO2+H2O + Light/HeatPhotosynthesis
Combustion
8
As a result, carbon neutral or zero carbon emission is achieved which is the
significant advantage of biomass as a fuel. Biomass as a fuel also has advantages in
being renewable and cheap price compared to fossil fuels.22
However, biomass application suffering from its undesirable properties. Compared
with fossil fuels, biomass has low energy density due to its inherent chemical
composition and high moisture content.22, 88
This means the value of the fuel can
rapidly outweighed by fuel collection and transportation costs.10
The bulky and
fibrous nature of biomass lead to a poor grindability, thereby increase the milling
cost as well as the difficulty of handling operations and feeding process.91
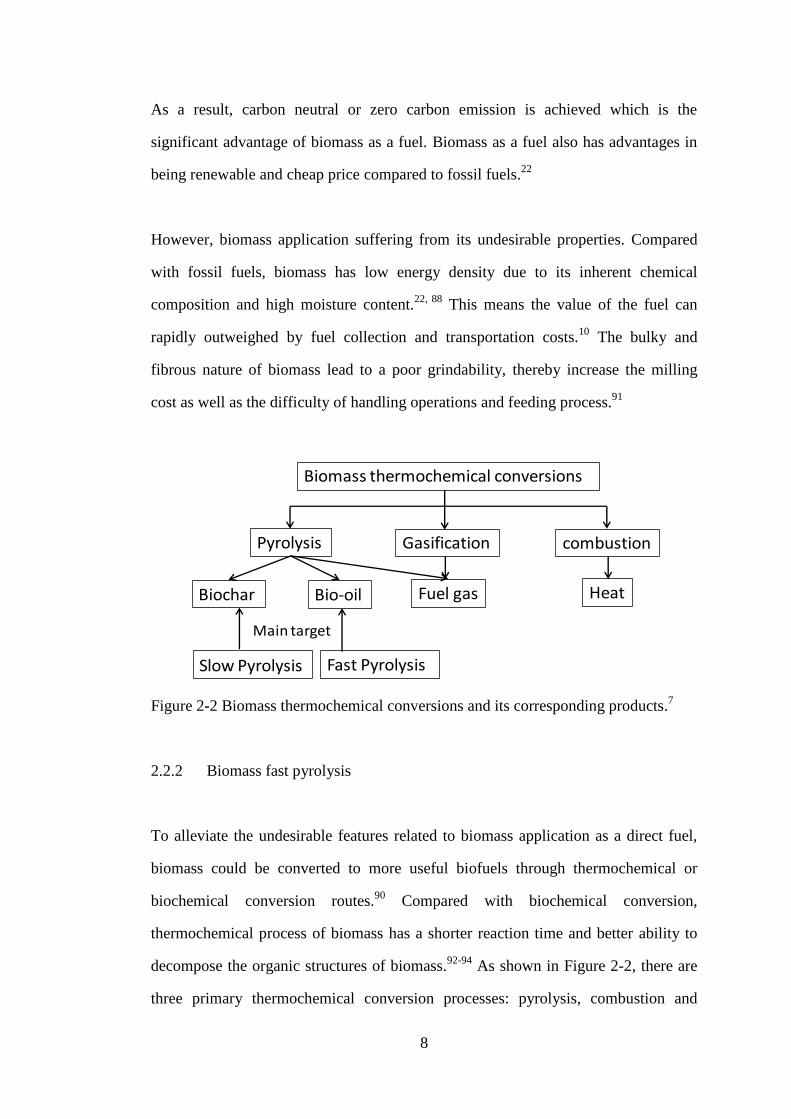
Figure 2-2 Biomass thermochemical conversions and its corresponding products.7
2.2.2 Biomass fast pyrolysis
To alleviate the undesirable features related to biomass application as a direct fuel,
biomass could be converted to more useful biofuels through thermochemical or
biochemical conversion routes.90
Compared with biochemical conversion,
thermochemical process of biomass has a shorter reaction time and better ability to
decompose the organic structures of biomass.92-94
As shown in Figure 2-2, there are
three primary thermochemical conversion processes: pyrolysis, combustion and
Biomass thermochemical conversions
Pyrolysis Gasification combustion
Fuel gas HeatBiochar Bio-oil
Slow Pyrolysis Fast Pyrolysis
Main target
9
gasification.7, 12, 95
Combustion process of biomass generally aims to provide heat,
while gasification process produces gaseous fuel for wide applications.92, 94
Pyrolysis
process can transform biomass to liquid (bio-oil), solid (biochar) and gaseous fuels
through heating biomass at about 500 C with the absence of oxygen, while slow
pyrolysis and fast pyrolysis mainly target for production of biochar and bio-oil
respectively.9, 22, 74, 90
Depending on biomass feedstocks, 60–75 wt% of liquid bio-oil, 15–20 wt% solid
biochar and 10–20 wt% of noncondensable gases can be yielded through fast
pyrolysis process.96
Fast pyrolysis has following key characteristics:
High heating rate and heat transfer rate at the interface of biomass particle.7, 26
To obtain this objective, small biomass particles are required (typically < 3 mm)
due to its low thermal conductivity.9
Restrained pyrolysis temperature. To optimize the bio-oil yield for most
biomass feedstock, the pyrolysis temperature generally being ~500 C.7, 26
Very short residence time for hot vapour. To reduce secondary reactions, the
residence time of hot vapour are usually controlled within 2 s.7, 12, 26
Rapid cooling of the pyrolysis vapours to get the condensed bio-oil.7, 26
Although any forms of biomass can be a candidate for fast pyrolysis, woody biomass
is mostly used fast pyrolysis feedstock for its low ash content, high quality bio-oil
produced, as well as its consistency and comparability between tests.7, 8
10
Reactor is the core for a fast pyrolysis process.7, 26
There are several representative
fast pyrolysis reactors such as fluidised-bed reactor, rotating cone reactor, ablative
reactor, fixed bed reactor, vacuum reactor, augur reactor, and etc.7, 26
The
fluidised-bed reactor is most commonly used because it is simple in construction and
easy in operation.26, 97
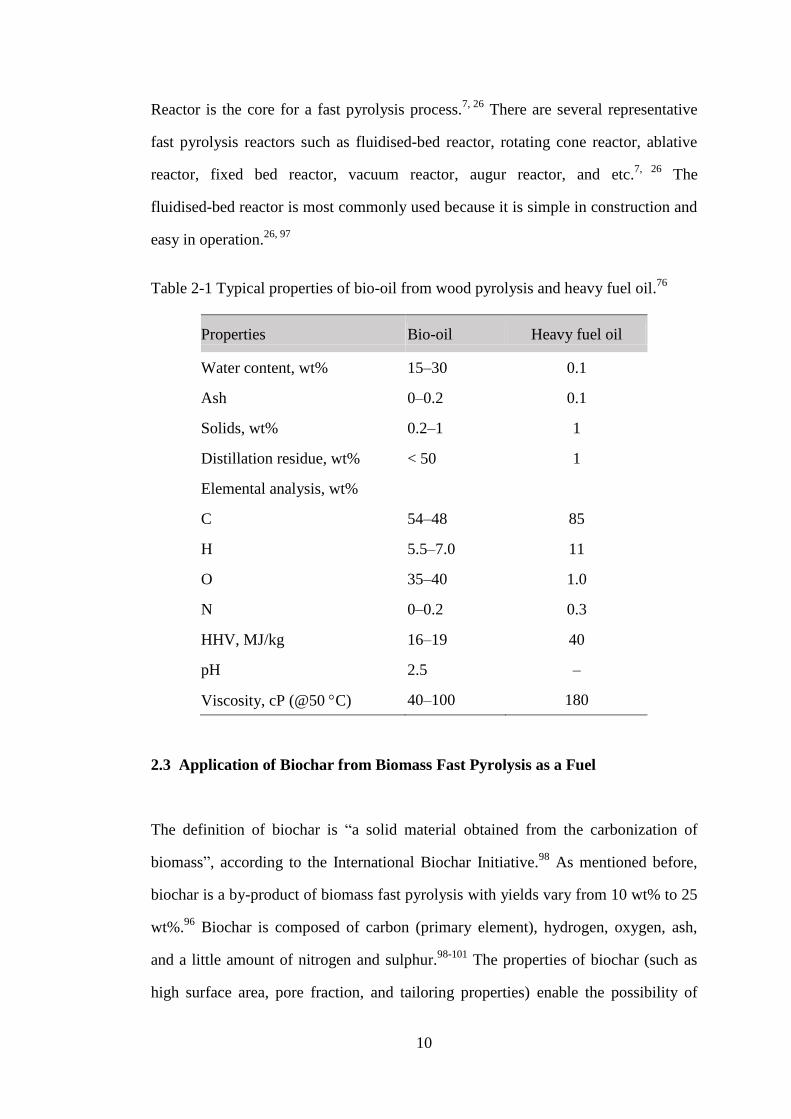
Table 2-1 Typical properties of bio-oil from wood pyrolysis and heavy fuel oil.76
Properties Bio-oil Heavy fuel oil
Water content, wt% 15–30 0.1
Ash 0–0.2 0.1
Solids, wt% 0.2–1 1
Distillation residue, wt% < 50 1
Elemental analysis, wt%
C 54–48 85
H 5.5–7.0 11
O 35–40 1.0
N 0–0.2 0.3
HHV, MJ/kg 16–19 40
pH 2.5 –
Viscosity, cP (@50 C) 40–100 180
2.3 Application of Biochar from Biomass Fast Pyrolysis as a Fuel
The definition of biochar is “a solid material obtained from the carbonization of
biomass”, according to the International Biochar Initiative.98
As mentioned before,
biochar is a by-product of biomass fast pyrolysis with yields vary from 10 wt% to 25
wt%.96
Biochar is composed of carbon (primary element), hydrogen, oxygen, ash,
and a little amount of nitrogen and sulphur.98-101
The properties of biochar (such as
high surface area, pore fraction, and tailoring properties) enable the possibility of
11
being used as efficient catalyst for pyrolysis and gasification of biomass, biodiesel
production, as well as bio-oil upgrading, or as adsorbent for water pollutants and air
pollutants.98, 100, 102, 103
It also has promising applications in environmental
remediation like soil amendment due to its high cation exchange capacity as well as
high surface area.99, 101, 104, 105
Beside these applications, biochar obtained from
biomass fast pyrolysis also can be utilized as a fuel for heat and power supplication
due to its remarkable grindability and high energy density (~18 MJ/Kg).106-108
This
section states the challenges in application of biochar, a by-product of biomass fast
pyrolysis, as a fuel.
The key challenge in biochar application as a fuel is related to the fine particle size
distribution since it may lead to safety hazard during storage/transportation.3, 19, 22, 106
Fine biochar powder is flammable which may cause spontaneous combustion when
exposed to moisture and oxygen during transportation/storage.3 High concentration
of biochar particles in an open area is at risk of explosive.3 In addition, surface
utilization of biochar particles may lead to extensive particulate emissions which
may bring undesired health risk for anyone who are exposed to biochar dust.3
Beside these safety and health issues, challenges in biochar utilized as a fuel also
contain reactivity and emission characteristic during biochar combustion and
gasification.22
Inorganic matters in biomass, especially alkali and alkaline earth
metallic (AAEM) species, are closely related to reactivity as well as ash-related
conundrums.106
Since biochar inherit most of the inorganic matters from biomass fast
pyrolysis, it has extremely large concentration of AAEM species (6–7 times of that
in biomass).109, 110
The inorganic matters in biochar can act as catalyst for various
reactions (i.e. pyrolysis, combustion and gasification).22
It is reported that the forms
of existence for inorganic matters (such as in organically bound structure and in salt
form) affect its catalytic effect.111, 112
The catalytic effect of K and Na species are

12
stronger than Ca species during biochar steam gasification.112
Moreover, during
pyrolysis, combustion and gasification, the inorganic matters in biochar may lead to
a variety of ash-related problems, such as ash deposition,113-115
particulate matter
emission of fine inorganic,116
fire-side corrosion,117, 118
and bed agglomeration during
operation of fluidised-bed. 119-122
To solve the problems associated with biochar storage/transportation which are
mentioned above, a promising approach is suspending biochar into bio-oil, WSF or
bio-oil derived fuel blends to prepare slurry fuels (detailed discussion see section 2.7).
This is also a scope of work in this thesis that studying the effect of biochar on fuel
properties of slurry fuels including ignition behaviour and cold flow behaviour.
2.4 Characterization and Application of Bio-oil as a Fuel and Its Fractions
Bio-oil (also referred to as pyrolysis liquid/oil and bio-crude), a thick dark-brown
and hydrogen-deficient liquid with a unique smoky odour, is usually produced from
biomass fast pyrolysis with yield up to 70–80 wt%.76, 123
It is a prospective substitute
of petroleum oil although it has different fuel properties and composition compared
to that of crude oil (see Table 2-1).22
Fuel properties of bio-oil are closely related to
its chemical composition,31
so this section discusses the chemical composition of
bio-oil and followed by its fuel properties. Although bio-oil can be utilized to recover
chemicals,13, 76
this section only focus on implications of bio-oil as a fuel to supply
power and heat in boilers, gas turbines, diesel and stirling engines, or as a
transportation fuel by upgrading.77
This section also reviews bio-oil fractions since
bio-oil can be separated to water-soluble fraction (WSF) and water-insoluble fraction
(WIF) when water content higher than 30 wt%,124, 125
and WSF also can be utilized
as a fuel.
13
2.4.1 Bio-oil as a fuel and its fuel properties
The fuel properties of bio-oil result from its chemical composition are highly rely on
biomass type (i.e. leaf, wood and bark) or composition (such as cellulose,
hemicellulose and lignin), biomass pre-treatment methods (i.e. particle size, moisture
and ash content), pyrolysis parameters (i.e. pyrolysis temperature, residence time and
heating rate), and post-treatment (i.e. condensation and filtration).2, 8, 15
2.4.1.1 Physico-chemical properties of bio-oil
Chemical composition
Bio-oil has a very complex chemical composition and mainly contains water, more
than 400 organics and a little ash.126
It is hard to analyse the chemical composition of
bio-oil only by classical methods such as gas chromatography/mass selective
detector (GC/MSD) and high performance liquid chromatography (HPLC), because
of its low volatility leaded by high polarity and high molecular mass of the organic
compounds in it.1, 109
By solvent extraction, bio-oil can be separated to different
fractions and this method can be combined with analytical techniques to analyse the
primary composition of bio-oil.13
Even though, there are still about 15%
non-detectable compounds with high molar mass in bio-oil.126
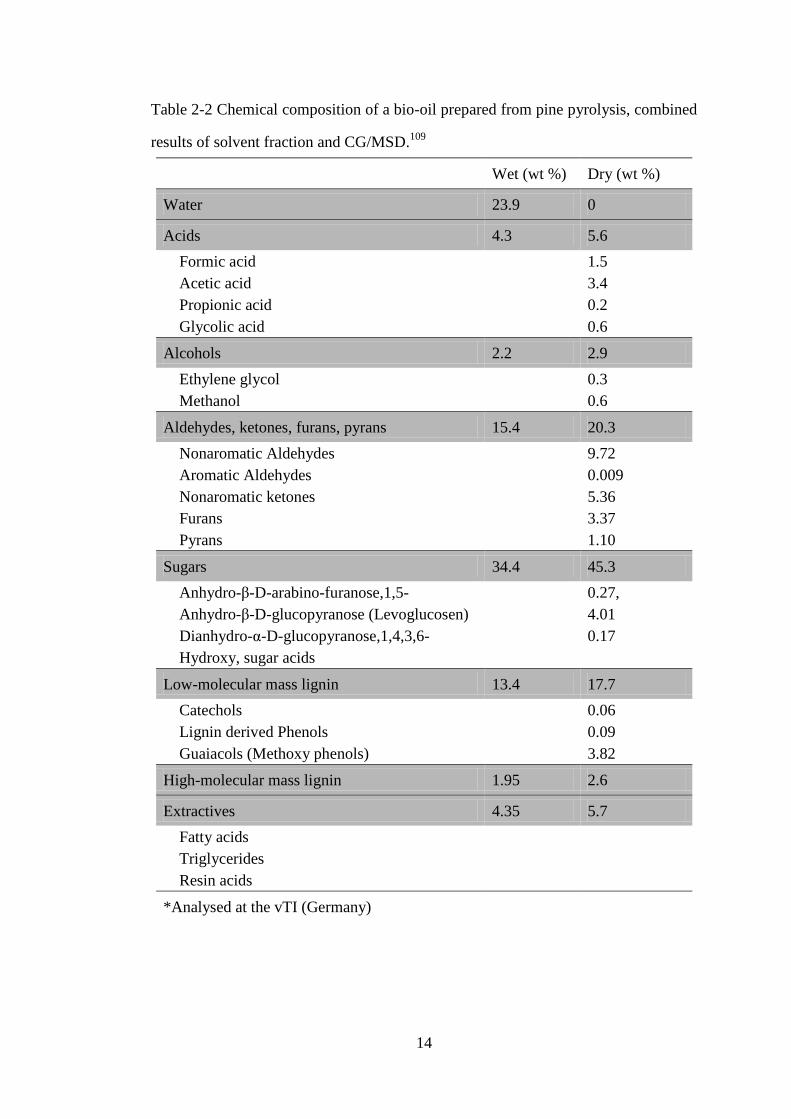
The chemical
composition of a bio-oil from pine pyrolysis resulted from combination of solvent
fraction and CG/MSD are shown in Table 2-2.
14
Table 2-2 Chemical composition of a bio-oil prepared from pine pyrolysis, combined
results of solvent fraction and CG/MSD.109
Wet (wt %) Dry (wt %)
Water 23.9 0
Acids 4.3 5.6
Formic acid
Acetic acid
Propionic acid
Glycolic acid
1.5
3.4
0.2
0.6
Alcohols 2.2 2.9
Ethylene glycol
Methanol
0.3
0.6
Aldehydes, ketones, furans, pyrans 15.4 20.3
Nonaromatic Aldehydes
Aromatic Aldehydes
Nonaromatic ketones
Furans
Pyrans
9.72
0.009
5.36
3.37
1.10
Sugars 34.4 45.3
Anhydro-β-D-arabino-furanose,1,5-
Anhydro-β-D-glucopyranose (Levoglucosen)
Dianhydro-α-D-glucopyranose,1,4,3,6-
Hydroxy, sugar acids
0.27,
4.01
0.17
Low-molecular mass lignin 13.4 17.7
Catechols
Lignin derived Phenols
Guaiacols (Methoxy phenols)
0.06
0.09
3.82
High-molecular mass lignin 1.95 2.6
Extractives 4.35 5.7
Fatty acids
Triglycerides
Resin acids
*Analysed at the vTI (Germany)
15
Ultimate analysis
Bio-oil mainly contains C, H and O, and a trace amount of N, S and other metallic
elements.109
The oxygen content of bio-oil is 35–40% on dry basis which is
embodied in variety of organic compounds and is considerably higher than that of
hydrocarbon fuels.109
The high oxygen content is considered as the main reason for
the issues related with both handling and applications of bio-oil, such as the
instability problem during storage which will be discussed next.109
The CHN content
of bio-oil can be determined via elemental analyser based on ASTM D 5291-92 and
the sulphur content can be analysed by inductively coupled plasma (ICP) or by
capillary electrophoresis technique based on ASTM D 4239.127
Then the oxygen
content (wet basis) could be estimated by difference according to equation.
Metals
Bio-oil has variety of inorganic elements (like Si, Al, Fe, Zn, Cu, Cr, Ni, Pb, N and
Co) especially AAEM species which mainly are Na, K, Mg and Ca. These metals can
cause unfavourable ash-related issues in thermochemical process108
and also can act
as catalysts for various reactions15
. Recently, Wu et al. developed an
evaporation-ashing-digestion-IC method to quantify the AAEM species in bio-oil
and bio-oil derived fuel samples.128
The new developed method has four steps:
evaporation (convert sample to a solid-like residue), ashing (further convert the
residue to ash), acid digestion (dissolve the ash into solution), and IC analysis to
quantify the AAEM species in the obtained solution.128
The evaporation process
contains multiple slow heating and holding segments at temperatures of the boiling
points of the main compounds in bio-oil to avoid the carry-over of biochar.128

16
Homogeneity
Bio-oil contains a huge range of chemical compounds with different chemical
functionalities.129
The homogeneity of bio-oil is related to the complex solubility and
reactivity of these compounds in it.129
Generally, bio-oil is considered as
homogenous single-phase liquid with a small amount of solids (e.g., char
particles).129, 130
Microscopically, however, bio-oil has more than one phase and can
be regarded as microemulsions.129, 130
The multiphase character of bio-oil is due to
the presence of char particles, waxy materials (such as fatty acids, fatty alcohols,
sterols and aliphatic hydrocarbons), aqueous droplets and micelles made of heavy
compounds.130
The char particles and some heavy compounds in bio-oil sediment
gradually on the bottom of containers during its storage because of density
difference.127, 129
As a result, homogenization of bio-oil is required before
utilization/sampling.127
The homogeneity of bio-oil can be detected by microscopic
examination.129
Solubility
The solubility of bio-oil in an organic solvent is connected with its degree of
polarity.129
For highly polar bio-oil samples (e.g., wood bio-oils), alcohols with low
molecular weight like methanol and ethanol are excellent solvents.127, 129
These
solvents can dissolve the whole bio-oil except char particles and some extractives.127,
129 Another excellent solvent for wood pyrolysis bio-oils is acetone.
127, 129 Wood
bio-oils cannot dissolved in hydrocarbons, such as hexane, diesel fuels and
polyalfaolefines.127, 129
17
Acidity and material corrosion
Generally, the pH and total acid number (TAN) of bio-oil are 2–3 and 36–70 mg
NaOH/g, respectively.76, 127
The acidity of bio-oil can be attributed to the presence of
volatile acids like acetic and formic acid.127, 129
Moreover, phenolic compounds also
contribute to the acidity of bio-oil.127
Therefore, bio-oil heavily corrode many
materials like aluminium, mild steel, copper and nickel, especially at high
temperatures or in high water content.131, 132
However, various plastics (such as
polytetrafluoroethylene and polypropylene) and stainless steel are resistant to the
corrosiveness of bio-oil that can be adopted to storage/handle bio-oil.127, 133
The TAN
of bio-oil can be determined by an acid-based titrator.
Stability
Chemically and thermally, bio-oil is less stable compares to fossil fuels which is
attribute to the large amount of reactive oxygen-containing compounds with varying
molecular weights.127
Bio-oil is not a thermodynamic equilibrium product.15, 134
Therefore, a wide range of chemical reactions may take place during long-term
storage of bio-oil to get thermodynamic equilibrium which is also regarded as bio-oil
“ageing”.15
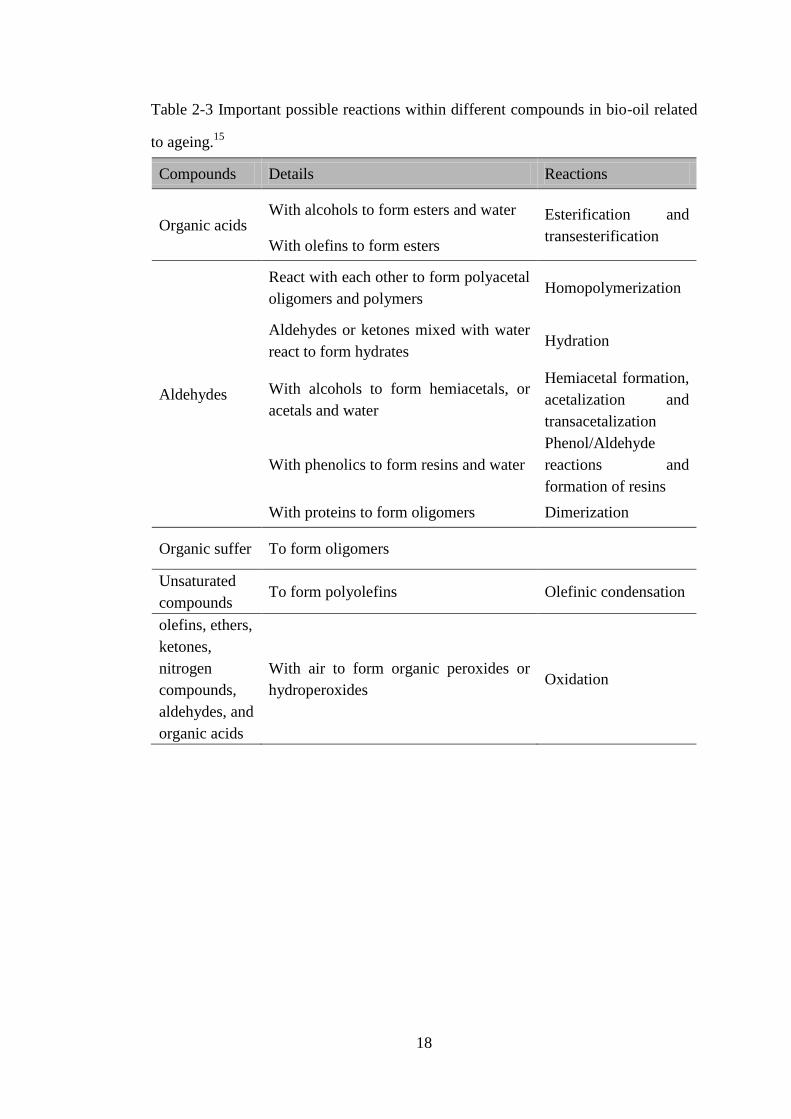
Important possible reactions within different compounds in bio-oil are
listed in Table 2-3.15
As a result, the average molecular-weight distribution, water
content and viscosity of bio-oil all increase.15, 127, 129
Furthermore, higher
temperatures promote the ageing effect.129
For instance, the increase in viscosity of a
bio-oil after being stored at 80 C for 24h is equivalent to that after being stored for
one year at room temperature.127
It is better to store bio-oil at low temperature in a
fridge. The presence of catalysts also elevate ageing effect15
and biochar contains
various inorganic species that can act as catalyst (see section 2.3). The influence of
biochar on the ageing of bio-oil is in the scope of this thesis.
18
Table 2-3 Important possible reactions within different compounds in bio-oil related
to ageing.15
Compounds Details Reactions
Organic acids With alcohols to form esters and water Esterification and
transesterification With olefins to form esters
Aldehydes
React with each other to form polyacetal
oligomers and polymers Homopolymerization
Aldehydes or ketones mixed with water
react to form hydrates Hydration
With alcohols to form hemiacetals, or
acetals and water
Hemiacetal formation,
acetalization and
transacetalization
With phenolics to form resins and water
Phenol/Aldehyde
reactions and
formation of resins
With proteins to form oligomers Dimerization
Organic suffer To form oligomers
Unsaturated
compounds To form polyolefins Olefinic condensation
olefins, ethers,
ketones,
nitrogen
compounds,
aldehydes, and
organic acids
With air to form organic peroxides or
hydroperoxides Oxidation
19
2.4.1.2 Fuel properties of bio-oil
Water content
Typically, bio-oil has a considerably high water content (15–30 wt%).28, 135
Water
exists as a microemulsion or is dissolved in bio-oil.127
Water is difficult to remove
from bio-oil, and physical methods (e.g., centrifugation) cannot remove it.129
Water
influences other physical properties of bio-oil. With increase of water content, a
decrease in the density, viscosity and heating value will be observed.127
The
increasing water content also promotes the stability of bio-oil until phase separation
occurs when water content is up to 30%.127
Phase separation of bio-oil due to water
addition will be discussed in section 2.4.2. Moreover, water has both positive and
negative effects on combustion applications of bio-oil.127
The high water content
leads to the low energy density of bio-oil and decreases both the local combustion
temperatures and combustion reaction rate.129
Besides, the high water content
contributes to ignition problems, improves the ignition delay time, and deteriorates
the cold flow behaviour of bio-oil.129
The effect of water on ignition behaviour and
cold flow behaviour is within the scope of this thesis. For the above reasons, the
water content of bio-oil needs to be regulated and it can determined using Karl
Fischer titration based on method ASTM E 203.127, 129
Typically, moisture content of
biomass is below 10% because it attributes to the water content of bio-oil.135
Solid content and ash content
In bio-oil collection process, cyclone systems are normally adopted to remove solids
from hot pyrolysis vapors.135
But bio-oil still contains a small amount of solids (< 0.5
wt %) with the average particle size being 5–10 µm due to the less efficiency of
cyclones on removing small particles.135
The solids in bio-oil mainly are char
20
particles and some other materials like fluidised-bed materials.135
They have negative
effects on fuel applications of bio-oil. Firstly, agglomeration and sedimentation of
particles can occur during storage and char particles may accelerate ageing of
bio-oil.109, 129
Secondly, they can corrode and block the fuel injection and combustion
devices such as pump and spray nozzles.129
In addition, they increase particular
emissions and ash content.129
Ash content is identified as the amount of residues after
bio-oil combustion at 775 C and can be analysed by thermogravimetric analyser
(TGA).135
It is known that ash contribute to various issues during thermochemmical
process, for example, corrosion and deposition.91, 136
As a result, the presence of
solids and ash are not desirable. Hot gas filtration and liquid filtration are possible
methods to decrease both the solid and ash contents of bio-oil.129
Density, viscosity, surface tension, and the Ohnesorge number
In combustion, density, viscosity and surface tension are significant parameters due
to they can influent the design of both the pump and pipeline.129
More importantly,
they can affect the atomization quality of the spray systems and then further affect
both the combustion efficiency and emission efficiency.129
To better evaluate the
spray/atomization quality, Ohnesorge number is calculated based on the values of the
three properties (detailed equation in section 3.4.5) to estimate the Sauter mean
diameter (SMD) of a spray droplet.137
A high Ohnesorge number of a fuel means
bigger SMD after spray and subsequently predicts worse spray quality.137-139
The densities of bio-oils are in the range of 1.2–1.3 Kg/dm3 which are higher than
that of fossil fuels (0.8–1.0 Kg/dm3) and they become higher with water content
decreases.127, 135
Viscosity of a bio-oil is a measure of its resistance to flow and can
be determined as dynamic viscosity or kinematic viscosity using different
viscometers.127, 135
Newtonian fluids have constant viscosity at different shear rate

21
while non-Newtonian fluids have varying viscosity.135
The majority of bio-oils are
Newtonian fluids at low temperatures (< 80 C).135
Some bio-oils contain rich
extractives may show non-Newtonian behaviour.135
Typically, viscosities of bio-oils
are 10–100 cP at 40 C.135
The surface tension of bio-oil is a measurement of its
resistance to external force and generally is in the range of 28–40 mN/m at 25 C.129,
135 It is higher than that of fossil fuels (72 mN/m at 25 C) which is attributed to the
strong hydrogen bonding in bio-oil.129
As the temperature increases, the surface
tension becomes lower for most bio-oil.135
Heating value
The combustion heat of a fuel is the total amount of heat generated during the fuel
completely combustion process.109
There are two methods to define heating value,
higher heating value (HHV, gross heat of combustion) and lower heating value (LHV,
net combustion heat).129
The difference between them is the water vaporisation heat
generated during fuel burning.129
The heating value of a bio-oil is related to its water
content.129
Typically, the LHV of bio-oils is 14–18 MJ/kg which is much less than
that of fossil fuels because of its high oxygen content and water content.135
However,
due to the high density of bio-oil, its heating value based on volumetric can reach
50–60% of that of fossil fuels.135
Commonly, bio-oils are measured for HHV.
2.4.2 Bio-oil water-soluble fraction and water-insoluble fraction
As mentioned before, phase separation of bio-oil occurs when water content reaches
30%.140
After phase separation, bio-oil is separated into two fractions: water soluble
fraction (WSF, top phase) and water insoluble fraction (WIF, bottom phase).123, 141-148
There are two operation methods to separate bio-oil with extra water addition: add
bio-oil to water and add water to bio-oil.140
The former method with high water to
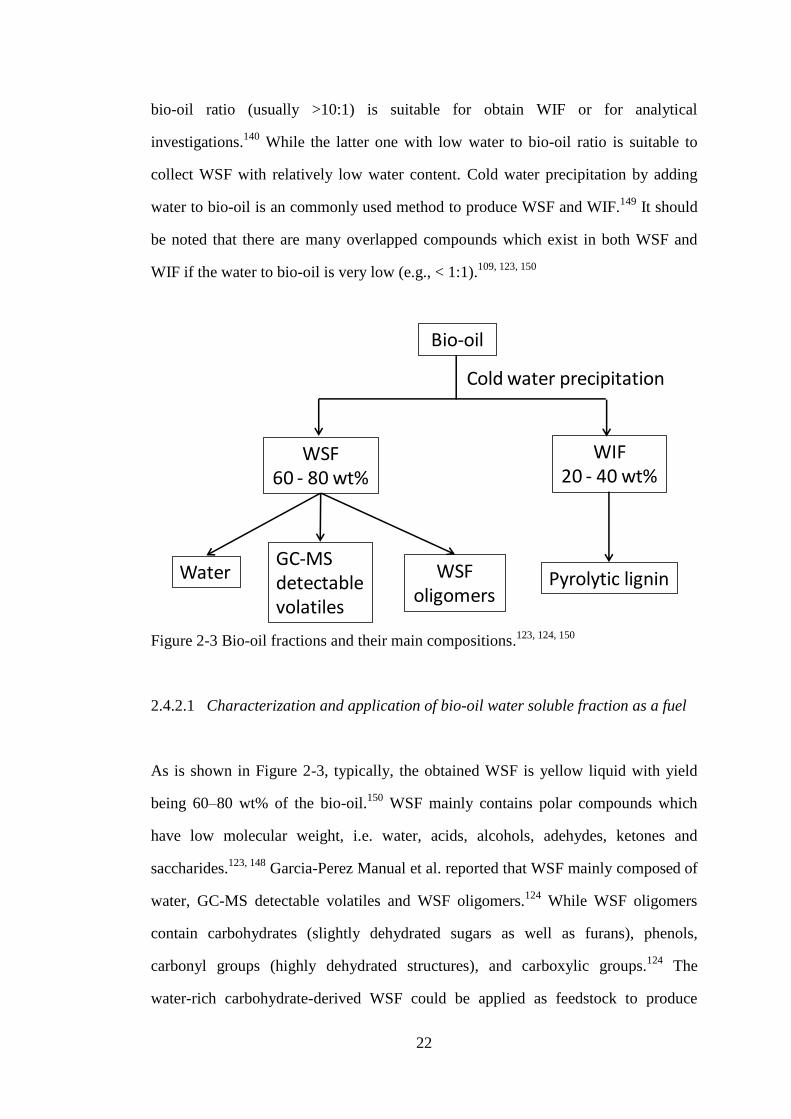
22
bio-oil ratio (usually >10:1) is suitable for obtain WIF or for analytical
investigations.140
While the latter one with low water to bio-oil ratio is suitable to
collect WSF with relatively low water content. Cold water precipitation by adding
water to bio-oil is an commonly used method to produce WSF and WIF.149
It should
be noted that there are many overlapped compounds which exist in both WSF and
WIF if the water to bio-oil is very low (e.g., < 1:1).109, 123, 150
Figure 2-3 Bio-oil fractions and their main compositions.123, 124, 150
2.4.2.1 Characterization and application of bio-oil water soluble fraction as a fuel
As is shown in Figure 2-3, typically, the obtained WSF is yellow liquid with yield
being 60–80 wt% of the bio-oil.150
WSF mainly contains polar compounds which
have low molecular weight, i.e. water, acids, alcohols, adehydes, ketones and
saccharides.123, 148
Garcia-Perez Manual et al. reported that WSF mainly composed of
water, GC-MS detectable volatiles and WSF oligomers.124
While WSF oligomers
contain carbohydrates (slightly dehydrated sugars as well as furans), phenols,
carbonyl groups (highly dehydrated structures), and carboxylic groups.124
The
water-rich carbohydrate-derived WSF could be applied as feedstock to produce
Bio-oil
WSF60 - 80 wt%
WIF20 - 40 wt%
WSF oligomers
Pyrolytic ligninWaterGC-MS detectable volatiles
Cold water precipitation

23
hydrogen by steam reforming.124, 151, 152
Due to WSF contains many chemicals, it can
be utilized to extract value-added chemicals by innovated separation and refining
technologies.28, 153, 154
Table 2-4 Fuel properties of WSF prepared from pine wood bio-oil with water to
bio-oil ratio being 0.5:1 benchmarking against bio-oil.58
Samples Bio-oil WSFa
Elemental Analysis (wt %)b
C 42.66 18.80
H 7.20 8.84
N 0.19 0.18
Oc 49.95 72.18
Water content (wt %) 23.7 61.2
Viscosity (25℃, mPa·s) 165.5 2.9
Surface tension
(25℃, mN/m) 35.50 41.32
Density (25℃, g/cm3)
1.21 1.07
HHV (MJ/Kg)d 18.65 13.03
TAN (mg NaOH/g)e 49.6 35.1
a WSF stands for bio-oil water soluble fraction obtained at a
water/bio-oil ratio of 0.5; b as-received basis;
c by difference;
d calculated high heating value;
e total acid number.
24
WSF also could be directly used as a fuel, especially when co-utilized with crude
glycerol which can solve fuel application issues such as high viscosity.58
Detailed
advantages on WSF based fuels will be discussed in section 2.7. To reduce the water
content in WSF, low water to bio-oil ratio (usually < 1:1) is adopted when preparing
WSF.58
Fuel properties of a WSF produced from pine wood bio-oil is shown in Table
2-4. Due to the addition of extra water during WSF preparation process, WSF has a
considerable high water content which leads to a high oxygen content. As a result,
WSF has a low HHV and viscosity compares to that of bio-oil. However, because of
the dilution effect, the acidity of WSF decreases.148
It is better to upgrade WSF such
as co-utilize it with crude and/or biochar to obtain better fuel properties (see section
2.7).
2.4.2.2 Characterization and application of bio-oil water insoluble fraction
After phase separation, the brown and high viscous lignin-derived WIF (also referred
to as pyrolytic lignin) containing high molecular compounds can be obtained with
yield being 20–40 wt%.150
Pyrolytic lignin significantly associated with the
instability/ageing and coke formation issues during thermochemical process of
bio-oil, particularly bio-oil ageing.149, 155, 156
Therefore, to better understand bio-oil
ageing, it is essential to investigate the composition and structure of WIF.140
The
WIF composition is associated with the feedstocks, pyrolysis conditions and
extraction methods.157
Typically, WIF mainly contains trimers and tetramers of
hydroxyphenyl, guaiacyl, and syringyl compounds.140, 157-160
The applications of WIF
are focus on extraction of value-added chemicals, for example, utilization as a
cost-effective phenol in phenol formaldehyde resins, and as an asphalt binder or
binder modifier.161-164
25
2.5 Ignition Behaviour and Cold Flow Behaviour of Bio-oil
Ignition behaviour and cold flow behaviour are two important considerations for the
handling, storage, transport and operation of a fuel.165-167
2.5.1 Ignition behaviour of bio-oil
Ignition behaviour is a significant parameter to safety handling, transportation and
operation, as well as combustion performance during utilization of a bio-oil.135
Bio-oils are difficult to ignite which is attributed to their chemical compositions
especially water (due to its high vaporization heat).135
Therefore, more energy is
needed to ignite bio-oils compare to fossil fuels.135
Unlike fossil fuels, bio-oils do not
ignite spontaneously in a classic compression ignition engine.127
So far, bio-oils are
commonly ignited with the adding of ignition improvers, or by preheating the
combustion chambers or air, or under assistance of pilot flames.135
Usually, ignition
behaviour of a bio-oil is described by flash point or ignition temperature.127, 129, 135
2.5.1.1 Flash point
The flash point of a fuel is described as the lowest temperature at which the vapour
on the top of the fuel liquid can be ignited when revealed to a flame.127, 135
It is the
highest temperature for safety handling consideration to avoid fire hazard.129
Despite
this safety consideration, it is not important for performance of a bio-oil in an
engine.127
The flash point of a bio-oil can be measured according to ASTM D 93 by a
close-cup tester with variation in the range of 40–70 C or above 100 C, which is
related to the content of light organic volatiles.127, 129, 135
However, it is hard to
determine the flash point at 70–100 C because the intense evaporation of water
26
inhibit the fuel vapour to ignite.127, 135
Typically, the flash point for hardwood (e.g.,
oak-maple wood), softwood (e.g., pine wood), and straw bio-oils are 50–66 C.127
2.5.1.2 Ignition temperature
The ignition temperature of a fuel can be described as the lowest temperature at
which ignition occurs with specified test conditions. Unlike fossil fuels, bio-oils are
non-flammable, non-distillable, have finite volatility, and only ignite at a relatively
high temperature.129
The poor ignition of bio-oils may attribute to the high water
content and oxygen content with abundant nonvolatiles.129
Generally, aromatic-rich
bio-oils have higher ignition temperatures compare to paraffin-based bio-oils.129
Classic test methods such as ASTM D 2699 to determine fossil fuels are not
available for bio-oils due to strict high fuel qualities are required.127
Therefore,
appropriate development or modification of the test methods is necessary. TGA is a
promising technique to study ignition temperatures of bio-oils. Thermogravimetry
(TG) and differential thermogravimetry (DTG) curves are often used to identify the
ignition temperature to provide fundamental understanding of ignition behaviour of
bio-oils.167-172
2.5.2 Cold flow behaviour of bio-oil
Under cold weather, solidification or partial solidification may occur during bio-oil
storage, transport and application which is an undesired issue.166
For instance, partial
solidification of a fuel may block the fuel injection systems and filters which further
lead to engine ignition issues.173
Generally, cold flow behaviour can be represented
by pour point, cloud point, cold filter plugging point, and low temperature flow test.
This section mainly focuses on pour point and cloud point. It also can be
27
characterized via differential scanning calorimetry (DSC) by determine melting
process, i.e. determination of melting point.
2.5.2.1 Pour point
As a parameter to explain the fluidity of a fuel at low temperature, the pour point of
fuels is defined as the lowest temperature at which the fuel can be pumped.127, 135
The
decrease of fluidity of a fuel mainly attributes to viscosity increase or crystallization
of waxy materials.135
The maximum limitation for pumpability is ~600 cSt.174
Pour
point can be measured based on ASTM D 97.175
In this method, fuel samples should
be preheated which aggravates fuel ageing and may leads to phase separation
problem.127
Typically, Wood pyrolysis bio-oils have a pour point of -12 – -33 C. A
bio-oil with low viscosity usually indicates it has a low pour point.127
The pour point
of other types of bio-oil may not in this range.135
2.5.2.2 Cloud point
Cloud point is another parameter to describe the cold flow behaviour of a fuel.135
At
low temperatures, paraffin compositions of mineral fuels may deposit as a wax which
forms a cloud in fuels.127
The cloud point is determined as the highest temperature at
which a cloud of wax crystals first becomes visible.127, 135
The cloud point of a fuel is
higher compare to the pour point176
and is associated with the feedstock, type, and
boiling range of bio-oil.127
Bio-oil containing more paraffin has a higher cloud point
and is less suitable for low temperature application.127
The method ASTM D 2500
can be used to determine the cloud point of fuels.127
However, it is not suitable for
bio-oils with dark colour due to the difficulty in observing the cloud.135
28
2.5.2.3 Differential scanning calorimetry techniques to study cold flow behaviour
The cold flow behaviour of a fuel also can be determined by DSC according to
ASTM D 4419 or other methods.175-183
Dunn et al. have proposed several empirical
correlations to determine the values of pour point, cloud point, cold filter plugging
point, and low temperature flow test from the characteristic temperatures obtained
from DSC.179, 181
In his work, DSC heating and cooling curves of methyl soyate,
methyl tallowate, methyl soyate/ methyl tallowate admixtures, and winterized methyl
soyate were analyzed.181
The results show that both the DSC cooling curve and
melting curve can be adopted to determine correlations with the cold flow behaviour
while the cooling curve is slightly better.181
Garcia-Perez et al. adopted DSC to
evaluate the impact of different bio-oil to bio-diesel ratios on the cold flow behaviour
of resulting bio-oil/biodiesel blends.179
The results prove that DSC is a promising
technique to quantify the effects of bio-oil derived molecules on cold flow behaviour
of biodiesel.179
DSC technique shows particular advantages for dark colour bio-oils
because they are difficult to investigate the cold flow properties via ASTM
methods.179
2.6 Bio-oil Upgrading Technologies
The undesired properties of bio-oils, such as high viscosity, high acidity, high water
and oxygen content, and instability, inhibit their fuel applications.20, 28, 31, 32, 184
As a
result, it is essential to upgrade bio-oils before applied as fuels to supply heat or
power.184
There are substantial investigations on bio-oil upgrading study and various
upgrading technologies, catalytically, chemically and physically, have been
developed.20, 21, 25, 28, 31, 184-189
This section will discusses several main upgrading
technologies with emphasis on physical upgrading methods.

29
2.6.1 Physical upgrading of bio-oil
Improving of important properties of a bio-oil (such as oxygen content, solid content,
viscosity and chemical instability) may positively affect their fuel performance.26
Physical upgrading technology is considered as a relatively simple way for adapting
bio-oil in diesel engines or turbines. There are three main physical upgrading
methods: filtration, solvent addition, and emulsions/emulsification which are
discussed below.
2.6.1.1 Filtration
The ash and alkali content of a bio-oil can be reduced by hot-vapour filtration to
below 0.01% and 10 ppm, respectively.26
The obtained bio-oils possess better quality
with lower biochar particles.26
However, catalytically active biochar particles may
crack the vapour which reduces the bio-oil yield to below 20%, decreases the
viscosity and the average molecular weight of bio-oil.26
Liquid filtration also
removes some big biochar particles. However, for the biochar particles below ~5 µm,
it is hard to remove because the physico-chemical nature of bio-oils and high
pressure drops and self-cleaning filters are needed.26
2.6.1.2 Solvent addition
Polar solvents, for example methanol, ethanol and furfural, are commonly used for
years to homogenize and reduce viscosity of bio-oils.26, 31
Decreasing of viscosity
and increasing of heating value are the direct effects of the addition of those polar
solvents.31
The latter effect is due to the higher heating value of the solvents which is
obvious.31
The mechanisms for the reduction of viscosity are: (1) physical dilution
which has no effect on chemical reaction rates; (2) decreasing the reaction rates via
30
molecular dilution or via changing the bio-oil microstructure; (3) preventing further
chain growth by chemical reactions between solvents and chemical components in
bio-oil.31, 109
Moreover, solvent (particularly methanol) addition significantly
improves the stability of bio-oils.26
2.6.1.3 Emulsions/Emulsification
Bio-oils are immiscible with hydrocarbon fuels, however, they can mix with other
fuels like diesel fuels to prepare emulsions with or even without the addition of
surfactants.20, 26
Compared with other methods, emulsification is an easy and rapid
method which can promote the heating value and stability while lower the viscosity
of bio-oils.20
There are two emulsification methods: stirring and ultrasonic
emulsification.20
The latter method can prepare emulsion droplets with super small
diameter and narrow distribution effectively.20
The prepared emulsion commonly
shows acceptable dispersion and satisfied stability.20
Span and Tween series are two
commonly used emulsifiers.20
Alcohols such as octanol may be used as the auxiliary
emulsifier.25
Many studies on emulsification of bio-oil and biodiesel or diesel were
carried out.25, 190-201
There are several parameters affect the stability of prepared
emulsions: the emulsifier amount, the volume ratio of bio-oil to biodiesel/diesel,
emulsifying temperature, and stirring intensity.25, 200
Ikura et al.202
have reported that
the emulsions exhibit several desirable properties like acidity, viscosity and water
content in comparison with unprocessed bio-oils. However, Chiaramonti et al.
reported that the corrosion effect is promoted which is a issue in the internal
combustion engine.203
31
2.6.2 Catalytic upgrading of bio-oil
Deoxygenation together with conventional refining are required to upgrade bio-oils
used as conventional transport fuels, which can be achieved via catalytic cracking or
hydrotreating.26
2.6.2.1 Catalytic cracking
Bio-oil upgrading by catalytic cracking is operated under normal pressure with
temperature being 350–500 C with utilization of catalysts.204, 205
Deoxygenation is
achieved by simultaneous reactions like dehydration, decarbonylation, and
decarboxylation with formation of hydrocarbons, organics, water, CO, CO2, and
coke.206
Zeolite catalysts with high acidity, high reactivity and regular porous
structure (e.g., ZSM-5 and HZSM-5) are commonly used.20
Although catalytic
cracking improves the yield and quality of bio-oils, it exhibits several drawbacks, for
instance, high coke yield, high water content, easy blockage of reactors, etc.
2.6.2.2 Catalytic hydrogenation/Hydrotreating
In the catalytic hydrogenation (also referred to as hydrotreating) process of bio-oils
in an autoclave, oxygenated compounds (e.g., organic acids and aldehydes) are
removed by hydrogen under high pressure to promote its stability and combustion
performance.20
This process usually carried out at mild temperatures (i.e. 300–600
C) in presence of catalysts such as sulfided CoMo or NiMo catalysts supported on
alumina.204, 205
Despite the requirement of huge amount of hydrogen and high
pressure, there are still several issues of hydrotreating upgrading of bio-oil, such as
high cost, demand for sophisticated equipments and superior techniques.28
32
2.6.3 Bio-oil upgrading by steam reforming
Steam reforming of bio-oils can generate hydrogen and synthesis gas in a sustainable
and environmental friendly manner.207, 208
Abundant studies have been performed on
hydrogen generation by steam reforming of whole bio-oil or bio-oil WSF.20
The
produced synthesis gas is feedstock for alcohol or conventional hydrocarbon fuels.31
While the produced hydrogen is commonly utilized as green energy source or as raw
material in chemical industry.20
Generally, steam reforming process of bio-oils is
performed at high temperature (i.e. 600–800 C) and uses noble metals and Nickel
catalysts as catalysts.31
Catalyst deactivation caused by coke formation is a main
issue that limits the application of steam reforming of bio-oils.31
2.7 Recent Advancement in Bio-oil Derived Fuel Mixtures Containing Crude
Glycerol and/or Biochar
As mentioned previously in section 2.6.1, utilizations of bio-oils in a diesel engine or
turbine can be accomplished through physical upgrading of bio-oil to bio-oil/solvent
fuel blends or emulsion fuels. It has been reported CG can be mixed with bio-oil
directly or with the help of appropriate surfactant to prepare emulsion fuels.209, 210
A
homogeneous bio-oil and CG fuel blends can be achieved by further adding
methanol.57, 60
Since CG is miscible with water, it can directly mix with WSF to
produce homogeneous fuel blends with a considerable high CG loading rate.58
Another promising upgrading strategy is suspending biochar particles into bio-oil to
prepare slurry fuels.16, 18, 19, 22, 34-36, 128, 211
Therefore, this section mainly discusses the
advancement in bio-oil derived fuel mixtures contain CG and/or biochar.
33
2.7.1 Characterization and application of crude glycerol as a fuel
Biodiesel is another potential alternative conventional transport fuel and CG is a
main by-product of biodiesel industry with yield being ~10 wt% of that of
biodiesel.40, 46-48, 50, 51, 54, 83
Recently, the booming growth of biodiesel industry leads
to a huge surplus of CG which arises the issue of its direct utilization due to
purification of CG is costly.54
Generally, CG contains less than 88 wt% of pure
glycerol and the rest are impurities which mainly are catalysts, salts, methanol, water,
methyl esters, soap, free fatty acids, and trace amount of ash.47, 53
The chemical
composition of CG commonly depends on the feedstock used to produce biodiesel,
the production process and recovery process of biodiesel.51
Using CG as an energy
source is a potential approach due to it can accommodate CG directly without
purification in a large scale.83, 212
By further combination with biodiesel production,
it may has further advancement in energy integration which reduces the
transportation cost and the dependence on fossil fuels.48
However, direct combustion of CG may be problematic because of its poor fuel
properties, for instance, high viscosity, high ignition temperature, and low heating
value (16–26 MJ/kg).55, 56
The inorganic species in CG may also lead to ash-related
problems.55
To address the above issues associated with direct combustion of CG,
other fuels are mixed with CG to produce fuel blends or emulsions, such as yellow
grease, gasoline bio-oil and bio-oil WSF.57, 58, 60, 209, 212, 213
Detailed description of
bio-oil derived fuel blends which contain CG are discussed in next section.
34
2.7.2 Bio-oil derived fuel blends and emulsion fuels contain crude glycerol
Recently, Wu et al. developed a fuel blend prepared from bio-oil and pure glycerol
with addition of methanol as an additive to homogenize the blend.60
Methanol also
is a main impurity of CG from biodiesel industry.51, 214
The prepared fuel blends
possess improved fuel properties compared to that of bio-oil or glycerol alone as a
fuel, for example, higher heating value, lower viscosity and surface tension, etc.60
Based on safety considerations of storage and handling of a fuel together with
potential glycerol to methanol ratio comes from biodiesel generation process,
possible feasible compositions of the glycerol/methanol/bio-oil (GMB) blends
(bio-oil ≥ 70 wt %, glycerol ≤ 20 wt %, and methanol ≤ 10 wt %) are
suggested.60
Like bio-oil, GMB fuel blends also suffering ageing problem during
long-term storage which leads to an increase in the water content while a decrease in
viscosity and acidity.60
Further investigations on how the major impurities in CG
affect the solubility and fuel properties of CG/methanol/bio-oil (CGMB) blends were
carried out.57
The results show that to some extent, all the studied impurities (i.e.
water, soap, NaCl, and NaOH) deteriorate the solubility of glycerol in bio-oil.57
However, fuel properties such as heating value, viscosity, surface tension, and
density of the CGMB blends are little affected by those impurities, except the TAN is
slightly decreased for fuel blends which contain NaOH.57
In addition, the impurities
in CG influence the ageing of CGMB fuel blends.57
For example, the presence of
NaOH and soap result in less changes in the fuel properties (i.e. viscosity, water
content and TAN) during ageing process. 57
Research on emulsifying bio-oil with CG to prepare emulsion fuels also have been
performed.209, 210
Wu et al.209
proved that the temperature and surfactant have more
significant effect on the stability of produced emulsions compare with stirring rate
and time. To obtain a stable emulsion fuel, temperature above 45 C and low Span
35
80 concentration (i.e. < 1%) is recommended.209
The high stirring rate (> 3000 rpm)
causes phase separation and is energy consuming, therefore is not preferred.209
Extended ageing of emulsion fuels leads to a longer stable time (> 12 h).209
Impurities in CG (except methanol) aggravate phase separation and drastic decrease
the stable time of the emulsions to less than one hour.209
With the content of
methanol in CG being 10% and the content of other impurities being low (e.g., 5%
for soap or water while 2% for NaCl or NaOH), stable time of 4–8 h for prepared
emulsions can be achieved.209
Wu et al.210
further developed an approach to directly
produce emulsions from bio-oil and CG without the introduction of surfactant via
ultrasound and/or mechanical agitation. A higher ultrasound amplitude and a longer
agitation time lead to improved stability of emulsions due to the increase in
temperature caused by ultrasound process.210
The maximum stable time of produced
emulsions is up to 15 h under a recommended emulsification approach (ultrasound at
40% for 4 min and then mechanical agitated for 2 min) with the soap content in
emulsion being ~1%.210
The advantage in combining ultrasound and mechanical
agitation is resulted from efficient droplet breakdown (by ultrasound agitation) and
reduction in the possibility of droplet recoalescence (by mechanical stirring).210
It has
been proven that the prepared emulsions have equal or even improved fuel properties
compared to bio-oil.210
Besides the whole bio-oil, bio-oil WSF also can be mixed with CG to prepare
homogeneous CG/WSF (CGWSF) fuel blends at a high CG loading rate (50–70
wt %) without any additives.58
The study shows that the WSF obtained from a water
to bio-oil ratio of 0.5 has relatively higher solubility of CG in WSF compared to
those obtained from water to bio-oil ratio of 0.2 and 0.4.58
The prepared CGWSF fuel
blends exhibit lower acidity and moisture while higher heating value and density
compared to the WSF alone as a fuel.58
Further adding biochar particles into CGWSF
blends can produce CGWSF/biochar (CGWSFB) slurry fuels which have equal
36
energy density and possess even better fuel properties in terms of viscosity,
Ohnesorge number and acidity.58
2.7.3 Bio-oil derived slurry fuels containing biochar
Through suspending biochar into bio-oil or WSF (as mentioned in section 2.7.2) to
prepare slurry fuels is also an attractive approach to upgrade bio-oil for its near-term
utilizations which also address the issues of biochar application (dusty or
spontaneous combustion).22
The concept of bio-oil/biochar (BB) slurry (also referred
to as bioslurry) was initially developed by commercial developers.215
Recently, Wu
et al. had performed systematically investigations on the feasibility and fuel
properties of BB slurry fuels.16, 18, 19, 33-36, 128, 216
Firstly, the economic feasibility of bioslurry-based supply chain for mallee biomass
in Western Australia consists of the costs for biomass transportation, the introduction
of distributed pyrolysers, and bioslurry transportation.19
The results suggest that the
bioenergy supply chain is economically feasible at large scales for dedicated
bioenergy plants located in biomass production area while is highly economically
competitive for coal-based power stations.19
Further study on life-cycle evaluation on
energy and carbon footprint of such a supply chain shows it has small energy and
carbon footprints, which are less than 4% and 3% of the overall energy and carbon
embedded in the delivered fuels.19
Following is the investigations on fuel and rheological properties of BB slurry fuels
prepared with different biochar loading rates. The results demonstrate that the BB
slurry fuels possess significant volumetric energy density (up to 23.2 GJ/m3) and
therefore are suitable for combustion and gasification utilizations.36
The slurry fuels
also possess low viscosity (< 453 mPa s) which indicates favourable pumpability,
37
and exhibit non-Newtonian with pseudo-plastic behaviour when biochar loading
rates are 10–20 wt %.36
Increase of biochar loading rate or decrease of temperature
can lead to an increase in viscosity of slurry fuels.36
Stability investigation of slurry
fuels during storage shows that ageing effect leads to an increase in water content
and reductions in acidity and viscosity.16
Increasing biochar loading rate aggravates
such ageing effect.16
It is also proved that AAEM species can be leached from
biochar into bio-oil phase due to the interactions between two phases which leads to
undesired redistribution of inorganic species.34
The leaching effect is mainly
attributes to WSF of bio-oil, particularly the organic acids and water.34
Further spray characterization of slurry fuels were carried out by two types of
atomizers: impact atomizer and twin-fluid atomizer.33
The results indicate that
increases in both viscosity and biochar loading rate can lead to an increase in droplet
size distribution for both atomizers.33
Compared to the impact atomizer, the
twin-fluid atomizer is more applicable when the fuel flow rate is low, and a higher
gas/fuel ratio resulted in a decrease in droplet sizes.33
In summary, slurry fuels show attractive economic feasibility, have small life-cycle
energy and carbon footprints, possess good fuel and spray properties. Therefore,
slurry fuels are suitable for stationary applications as substitution of fossil fuels.
However, so far, no data are available in the open literature on the cold flow
behaviour and ignition behaviour of bio-oil derived fuel mixtures. The fuel properties
of slurry fuels prepared from biochar and bio-oil derived fuel blends also remain
unknown. Such works are included in this PhD project.

38
2.8 Thermal Processing of Bio-oil
There are three types of main thermal processing for bio-oil: pyrolysis, combustion
and gasification, while combustion and gasification are conventional bio-oil
utilization technologies. This section mainly discusses the three types of thermal
process of bio-oil with emphases on bed agglomeration phenomenon in a
fluidised-bed reactor during pyrolysis or combustion process.
2.8.1 Pyrolysis
As aforementioned, pyrolysis is a significant process of biomass utilization
(especially to produce bio-oil and biochar).217
It is also the first step of subsequent
combustion and gasification applications for both biomass and bio-oil. Therefore, it
is important to investigate the pyrolysis process of bio-oil for fundamental
understanding the combustion or gasification process of bio-oil. Thus far, little
efforts have been put on bio-oil pyrolysis.
Recently, Li et al.75, 217-220
carried out systemically studies on transformation of
bio-oil during pyrolysis and reforming with emphases on formation of coke and
aromatic structures during bio-oil pyrolysis. Heating up is the first stage of bio-oil
chemical upgrading, combustion, or gasification/reforming.217
Various types of
reactions (e.g., thermal decomposition reactions) may undertaken when bio-oil is
heated up due to bio-oil is extremely reactive at high temperature, which may restrict
its utilization.76
The formation of variety of large/complex aromatic ring systems is
particularly significant. For instance, coke (solid carbonaceous materials) formation
is an extremely severe issue for the upgrading or thermal processing of bio-oil.221, 222
Because the formed coke may blocks the downstream equipment of gasification
39
systems or can deactivate the catalysts used in bio-oil upgrading.223
Tar formation is
a main issue in a gasifier for the utilization of gasification product gas.224, 225
Investigations on the evolution of aromatic ring structures during pyrolysis of bio-oil
at temperature range of 350–800 C were carried out. The results indicate that the tar
yield reduces when temperature becomes higher due to the intensified decomposition
of tar molecules at higher temperature.218
At low temperature (≤ 600 C), trace
amount of larger aromatic ring systems (with two or even more fused benzene rings
or equivalent) were formed in the tar.218
While at high temperatures (≥ 700 C),
high concentrations of radicals were produced by pyrolysis reactions (e.g.,
Diels-Alder-type reactions) which would form larger aromatic ring systems.218
To
further study the reactions responsible for the formation and evolution of aromatic
ring systems during bio-oil pyrolysis, lignin-derived oligomers and cellulose were
also pyrolyzed under same conditions. The results show that at low temperature
(around 350 C), the radical combination reactions (polymerization is included)
dominate upon the decomposition reactions while the latter reactions become more
important when temperature increases.218
As a result, a large amount of aromatic ring
systems in bio-oil could polymerize into solids (not soluble in CHCl3 + CH3OH, also
referred to as coke) during bio-oil pyrolysis at low temperatures.218
Cellulose-/hemicellulose-derived species in bio-oil can intensify this process.218
Further investigations on coke formation during bio-oil, WSF and WIF pyrolysis at
250–800 C in a two-stage fluidised-bed reactor were then carried out. The results
indicate both WSF and WIF can form coke even at a low temperature.217
The
interactions among different components in bio-oil (i.e. species derived from
cellulose/hemicellulose and lignin) are significant to coke formation. At low
temperatures (250–400 C), radical reactions between WSF and WIF are dominant
reactions and change with temperature.217
The recombination of produced radicals
40
leads to coke formation. However, at high temperature, thermal decompositions turn
to dominant reactions which leads to reduction of coke formation.217
2.8.2 Combustion
As bio-oil is commonly used as a fuel in a boiler directly, it is significant to
understand fundamentals of bio-oil combustion. Typically, the definition of
combustion is a complex sequence of chemical reactions where a fuel reacts with
oxygen at sufficiently high temperature, involving generation of heat and light.62, 226
Because of the complicated nature of bio-oil, the combustion of bio-oil is particularly
complex.227
Fundamental investigations on combustion of a bio-oil droplet found that it has
following steps.14, 129, 228
First is the evaporation of water, following is the heating of
light compounds, with selective vaporisation and liquid-phase pyrolysis of heavy
fractions.14
At this step, bio-oil exhibits distinctive behaviour (i.e. swelling, shrinking,
and microexplosions), with ejection of mass from bio-oil droplet.14
The flame is blue
then turns to yellow with increasing size.14
When the flame is extinguished, the last
step occurs which is the burnout of solid residue.14
For bio-oil combustion in
industrial scale, first step is the evaporation and combustion of light compounds
followed by combustion of heavy compounds which is second step.14
For stable
combustion purpose, two steps need to be combined into one flame during industrial
applications.14
Three main groups of burner technology are adopted for bio-oil combustion in a
boiler: high pressure atomization, dual-block burner systems (with a separate air
blower), and rotary cup atomization.14
As mentioned before, to improve the
atomization and combustion performance, moderate preheating of bio-oil and/or air
41
maybe needed.14
Another method is to blend it with additives such as methanol and
ethanol.14
It has been reported that due to the presence of fine char particles and
volatile species in bio-oil, bio-oil combustion has particulate matter emission issue
but considerably lower than that of fossil fuels.229, 230
2.8.3 Gasification
Gasification is defined as a thermol-chemical partial oxidation process.231
By
gasification, carbonaceous feedstock, such as biomass, coal and bio-oil, can be
converted into gas with the presence of a gasifying agent (e.g., air, steam, oxygen,
CO2, or a combination of them).231
Generally, the gasification process is performed
at high temperature (800–1000 C) and high pressure (up to 40 bar).232
The
fluidised-bed reactor and entrained-flow gasifier are commonly used for bio-oil
gasification with or without catalysts.233
The produced gas from bio-oil gasification
typically consists of H2, CO, CH4, CO2, and N2 which is very similar to that from
biomass gasification.231, 232
After cleaning and conditioning, the gas can then be
utilized to synthesize high-grade fuels (e.g., biohydrogen, methanol and dimethyl
ether) or chemicals.232-234
2.8.4 Bed agglomeration in a fluidised-bed reactor
Due to the advancements of low process temperatures, fuel flexibility, and isothermal
operation conditions, fluidised-bed reactors are widely used for combustion and
gasification of fuels, especially biomass.61, 63, 66
Bed agglomeration in a fluidised-bed
reactor is one major issue that limit the application of fluidised-bed reactor because it
reduces the fluidization quality and the heat-transfer in the bed.64-66, 72, 73, 122, 235-237
As
a result, the conversion efficiency becomes poor and the bed operational parameter
cannot be controlled.66
Most severely, bed agglomeration may lead to complete

42
defluidization resulting in suddenly plant shutdowns and high operational and
maintenance expenditures.61, 66
It has been proven by substantial investigations that during biomass combustion or
gasification, bed agglomeration is closely related to ash species.61, 63, 66, 72, 122
Recently, Wu et al.62, 67-71, 238
conducted systemically studies on bed agglomeration
during biomass fast pyrolysis which is totally different. The results show that there
exists two types of bed agglomerates, char-char and char-sand agglomerates, both of
them are related to carbon-enriched necks.71
The total agglomeration yield
significantly decreases with pyrolysis temperature increases.71
Holding time also
affects bed agglomeration yield.71
Two types of bed agglomeration were formed: one
is driven by solvent-soluble organic matter which is the dominant one at high
temperatures (> 450 C); the other one is driven by solvent-insoluble organic matter
which is the dominant one at low temperatures (< 400 C). Agglomeration is driven
by organic matter (contains various aromatic ring systems) acts as sticky agents
which is formed during biomass pyrolysis reactions.71
Further studies on bed agglomeration behaviour of different biomass components (i.e.
Mallee bark, leaf, and wood) suggest the ethanol-soluble extractive materials in
biomass significantly affect the bed agglomeration behaviour.69
By introducing sand
loading as a new diagnostic factor, it proves that bed agglomeration phenomenon is
not randomly but depends on biomass pyrolysis reactions taking place in the
pyrolyser.238
Bio-oil also can be processed in a fluidised-bed reactor for combustion,
gasification, or upgrading. However, bed agglomeration behaviour of bio-oil fast
pyrolysis in a fluidised-bed reactor is not investigated. Such work is included in this
thesis.
43
2.9 Conclusion and Research Gaps
Based on the above literature review, it could be summarized that:
1) Fast pyrolysis is a prospective approach to convert bulky biomass to liquid
bio-oil and solid biochar products with high energy density. However, bio-oil
and biochar have some undesired properties which impede the expansion of
their applications as a fuel.
2) Cold flow behaviour is a significant parameter for proper storage, transport
and operation of bio-oil under cold weather. DSC is a promising technique to
investigate cold flow properties of dark colour bio-oil as it is difficult to be
determined by ASTM methods.
3) Ignition behaviour is a key factor to safety handling, transportation, operation,
as well as combustion performance of bio-oil. It is difficult to ignite bio-oil
due to its chemical components especially water. Ignition behaviour of bio-oil
can be described by ignition temperature determined via TGA technology or
ASTM standard.
4) Among bio-oil upgrading technologies, physical upgrading techniques are
comparatively simple for applying bio-oil in a diesel engine or turbine. Three
major physical upgrading methods are discussed such as filtration, solvent
addition including methanol and ethanol addition, and emulsification of
bio-oil with biodiesel or diesel to produce emulsions.
5) Bio-oil derived fuel mixtures containing CG and/or biochar are promising
fuels as clean and sustainable energy sources that suitable for stationary
applications. They also are promising substitutions for coal or fossil fuels
44
because of their proved advancements including low carbon footprints, good
fuel properties adaptable to existing combustors.
6) Three types of thermal processing of bio-oil are reviewed including pyrolysis,
combustion and gasification. Bed agglomeration limits the application of
fluidised-bed reactor which is widely used for bio-oil combustion and
gasification. There exists good understanding of agglomeration that occurs
during biomass pyrolysis including the fundamental mechanism governing
bed agglomeration. However, it remains unknown if bed agglomeration
occurs during bio-oil pyrolysis and its mechanism is unclear.
Therefore, further research and development should be carried out in the above
research area, including:
1) Preparation and properties of slurry fuels produced from GMB or CGMB
blends and biochar. Such slurry fuels may possess better fuel properties than
that of the corresponding blend fuels and may suitable for stationary
applications. It is significant to perform subsequent research on the effect of
CG and methanol on fuel properties, ageing and redistribution of AAEM
species.
2) Studying on the cold flow properties of bio-oil and its derived fuel mixtures.
It is of great value to investigate how the impurities in CG and biochar affect
the cold flow properties of those fuel mixtures. The outcomes can provide
guidance for handling, transportation and operation of those fuel mixtures
under cold weather.
3) Studying on the ignition temperatures of bio-oil and its derived fuel mixtures.
Further understanding the influence of the impurities in CG and biochar on
45
ignition temperature of a fuel. Such data is significant to evaluate the
combustion performance of those fuel mixtures.
4) Understanding of the fundamental mechanism of bed agglomeration during
bio-oil fast pyrolysis in a fluidised-bed reactor. Further investigate bed
agglomeration of pyrolysis of bio-oil derived fuel mixtures to determine the
effect of the addition of CG and biochar on bed agglomeration.
5) Combustion/gasification of bio-oil derived fuel mixtures. Such research is of
great significance to understand the combustion or gasification behaviour of
those fuels in practice.
6) Preparation of bio-oil derived fuels containing industrial CG. The outcomes
can integrate production process of bio-oil derived fuels with biodiesel,
thereby improving the economic value chain of biodiesel industry.
2.10 Study Objectives of the Present Study
As identified by previous literature review and discussion, there are several research
gaps in the research field. However, it is unlikely to fulfil all the research gaps during
the limited time of this PhD study. Therefore, this research will mainly focuses on
the below objectives:
1) To prepare slurry fuels from glycerol/methanol/bio-oil (GMB) or crude
glycerol/methanol/bio-oil (CGMB) fuel blends and biochar, then further
investigate the fuel properties and ageing of slurry fuels benchmarking
against that of GMB or CGMB fuel blends as a fuel.
46
2) To investigate the ignition behaviour of bio-oil and various bio-oil derived
fuel mixtures by two methods: a TGA-based method and a modified method
based on ASTM standard.
3) To investigate the cold flow behaviour of bio-oil and various bio-oil derived
fuel mixtures by DSC (melting process), focusing on the influence of CG and
biochar.
4) To investigate bed agglomeration during fast pyrolysis of bio-oil in a
fluidised-bed reactor and explain the fundamental mechanisms responsible
for bed agglomeration.

47
Chapter 3 Research Methodology and Analytical Techniques
3.1 Introduction
This chapter presents the research methodologies applied for the study targeting at
the objectives outlined in Chapter 2. The experimental and analytical techniques are
detailed in the following sections.
3.2 Methodology
Considering the targets of this thesis, twelve fuel samples are involved to study the
fuel properties and thermal processing, including bio-oil and water soluble fraction
(WSF), and other ten bio-oil derived fuel mixtures, such as bio-oil/biochar fuel slurry,
WSF/biochar fuel slurry, glycerol/methanol/bio-oil fuel blend, crude
glycerol/methanol/bio-oil fuel blend, glycerol/WSF fuel blend, crude glycerol/WSF
fuel blend, glycerol/methanol/bio-oil/biochar slurry fuel, crude
glycerol/methanol/bio-oil/biochar slurry fuel, glycerol/WSF/biochar slurry fuel, and
crude glycerol/WSF/biochar slurry fuel, hereafter referred to as “BB”, “WSFB”,
“GMB”, “CGMB”, “GWSF”, “CGWSF”, “GMBB”, “CGMBB”, “GWSFB” and
“CGWSFB”, respectively (G and CG refers to glycerol and crude glycerol). A series
of systematic experiments were thus performed, including:
1) Biomass pyrolysis in a drop-tube/fixed-bed reactor to prepare biochar for the
preparation of slurry fuels while bio-oil was separated via cold-water
precipitation to obtain WSF.

48
2) Preparation of bio-oil derived fuel mixtures by adding G or CG, and/or
biochar to bio-oil or WSF with different compositions.
3) Fuel properties characterizations. Ageing experiments were conducted by
storing the fuel samples in an oven at 80 °C for 24 h. The fuel samples were
analysed by a series of instruments to acquire fuel properties, i.e., rheological
properties, water content, total acid number (TAN), density, Proximate and
Ultimate analysis, and surface tension, etc.
4) Ignition temperatures of bio-oil and its derived fuel mixtures were carried out
via thermogravimetric analysis (hereafter referred to as TGA) method and
modified ASTM method.
5) Cold flow properties of bio-oil and its derived fuel mixtures were performed
via differential scanning calorimetry (hereafter referred to as DSC).
6) Bio-oil fast pyrolysis was conducted in a fluidised-bed reactor to investigate
the bed agglomeration phenomenon.
All the experiments were conducted duplicate to make sure the reproducibility of the
experiment results. Figure 3-1 presents the overall research methodology with the
methodology description of each research objective detailed below.
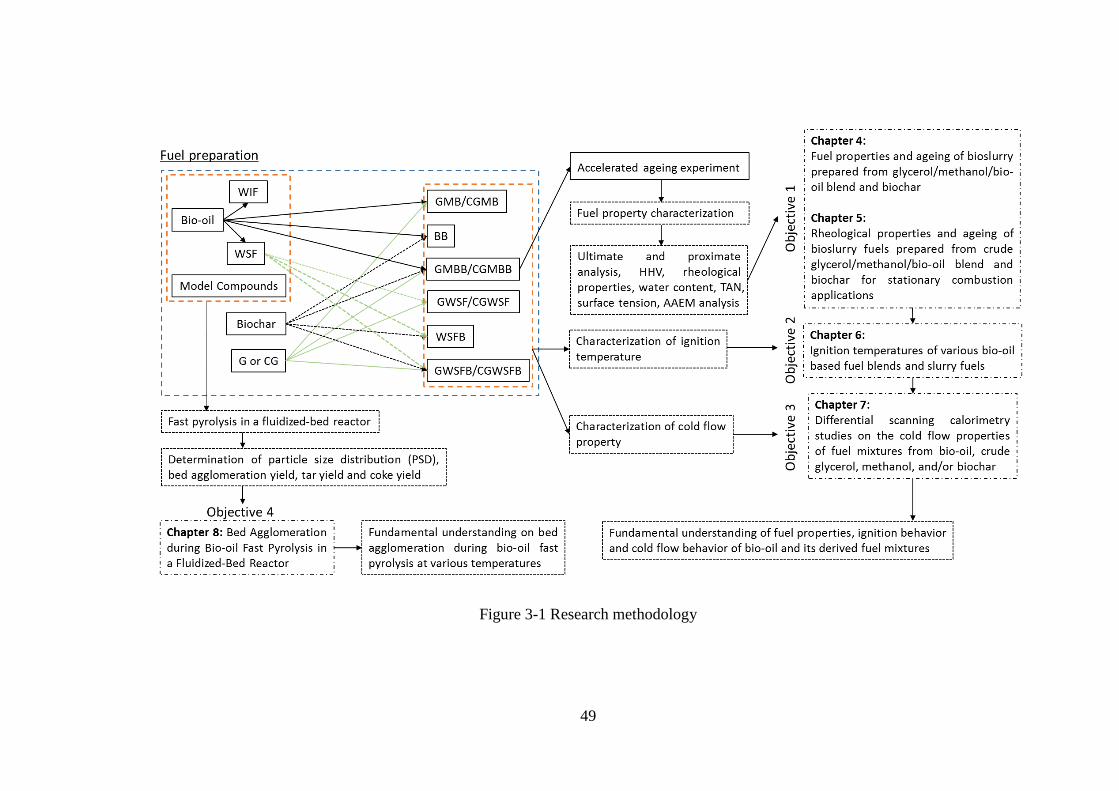
49
Figure 3-1 Research methodology
50
3.2.1 Fuel properties and ageing of GMBB and CGMBB slurry fuels
The biochar samples were prepared by pine wood fast pyrolysis at 500 °C in a
fluidised-bed reactor (see section 3.3.1). The GMB fuel blend was produced by
adding glycerol and methanol into bio-oil (see section 3.3.1). A range of BB, GMBB
and CGMBB slurry fuels with different biochar loading rate were prepared from
produced biochar and bio-oil (see section 3.3.1). Selected fuel samples were then
subjected to ageing followed a method detailed in section 3.3.2. The proximate and
ultimate analysis of bio-oil and biochar samples were carried out by methods
described elsewhere (see section 3.4.1). Fuel properties of all the fuel samples were
also analysed, such as rheology (section 3.4.4), total acid number (TAN), water
content and higher heating value (HHV) (section 3.4.2 and 3.4.5). The Alkali and
Alkaline Earth Metallic (AAEM) species in the fuel samples were quantified using
an evaporation−ashing−digestion−ion chromatography (IC) method (section 3.4.3).
The results and discussions of this work are detailed in chapter 4 and 5.
3.2.2 Ignition temperatures of various bio-oil based fuel blends and slurry fuels
The used bio-oil and biochar samples were produced accordingly (see section 3.3.1).
WSF was prepared by adding water into bio-oil (see section 3.3.1). A range of bio-oil
based fuel blends and slurry fuels were then prepared from bio-oil and WSF (see
section 3.3.1). It was reported that ignition behaviour plays an important role in the
storage and transport of a fuel. The ignition temperatures of those fuel samples were
then tested by two methods, a TGA method and a modified method based on ASTM
standard E659 (see section 3.3.3). Chapter 6 describes the results and discussions of
this work.
51
3.2.3 Differential scanning calorimetry studies on the cold flow properties of fuel
mixtures from bio-oil, crude glycerol, methanol, and/or biochar
The Bio-oil, biochar and WSF samples were produced respectively (see section
3.3.1). A set of fuel mixtures were prepared via mixing bio-oil or WSF, G or CG
and/or biochar using magnetic stirring at room temperature (see section 3.3.1). The
cold flow property of the fuel samples was investigated by determine the meting
peak temperatures. All the fuel samples were then introduced into DSC analysis to
achieve the melting peak temperature following a method reported elsewhere239
(see
section 3.3.4). Chapter 7 clarifies the results and discussions about this work.
3.2.4 Bed agglomeration during bio-oil fast pyrolysis in a fluidised-bed reactor
To investigate the bed agglomeration during fast pyrolysis of bio-oil in a
fluidised-bed reactor at temperatures of 500−800 °C, the bio-oil, WSF, WIF, and
selected model compounds were prepared and sent to the furnace for fast pyrolysis to
collect bed materials (see section 3.3.5). Via the comparison of the bed
agglomeration yields of bio-oil, bio-oil fractions (i.e. WSF and WIF) and model
compounds, the interactions between lignin-derived oligomers and sugar are revealed
to be responsible for bed agglomeration during fast pyrolysis of bio-oil. Tar yield and
coke yield also studied to investigate its correlations with bed agglomeration (see
section 3.4.6). The results and discussions about this work are presented in chapter 8.
52
3.3 Experimental Section
3.3.1 Sample preparation
Bio-oil (see Chapter 4-8). The bio-oil sample used in this thesis was provided by an
anonymous company and was produced by pine wood fast pyrolysis at 500 °C in a
fluidised-bed reactor. The obtained bio-oil sample was stored at ~4 °C before used
for experiment.
Biochar (see Chapter 4-7). The pine wood chips were received from WA&J King
Pty Ltd (Western Australia) and then dried in an oven. It was cut and sieved into size
fraction of 1–2 mm and then stored in a fridge at ~4 °C before usage. Biochar sample
was prepared from the fast pyrolysis of pine wood biomass at 500 °C in a
drop-tube/fixed-bed reactor according to a previous method.34
The collected biochar
was then ground (using a ball mill, Retsch MM400) for 8 min with frequency being
15 Hz and sieved to the size fraction of < 75 µm for subsequent slurry fuels
preparation.
WSF and WIF (see Chapter 6, 7 and 8). The bio-oil WSF and WIF samples were
achieved by cold-water precipitation method. In brief, cold water was added into
bio-oil with the mass ratio of water to bio-oil being 0.5:1, which is known to produce
optimal bio-oil WSF that is suitable for preparing stable fuel mixture with crude
glycerol and has a relatively low water content 58
. The WSF (the upper fraction, with
additional water) and WIF (the bottom fraction) were then produced after phase
separation. The achieved WSF was used without further retreatment, while the WIF
sample was dried at 35 °C in an oven and then redissolved in ethanol to the equal
percentage as it is in bio-oil. Excluding the extra water added, the yields of WSF and
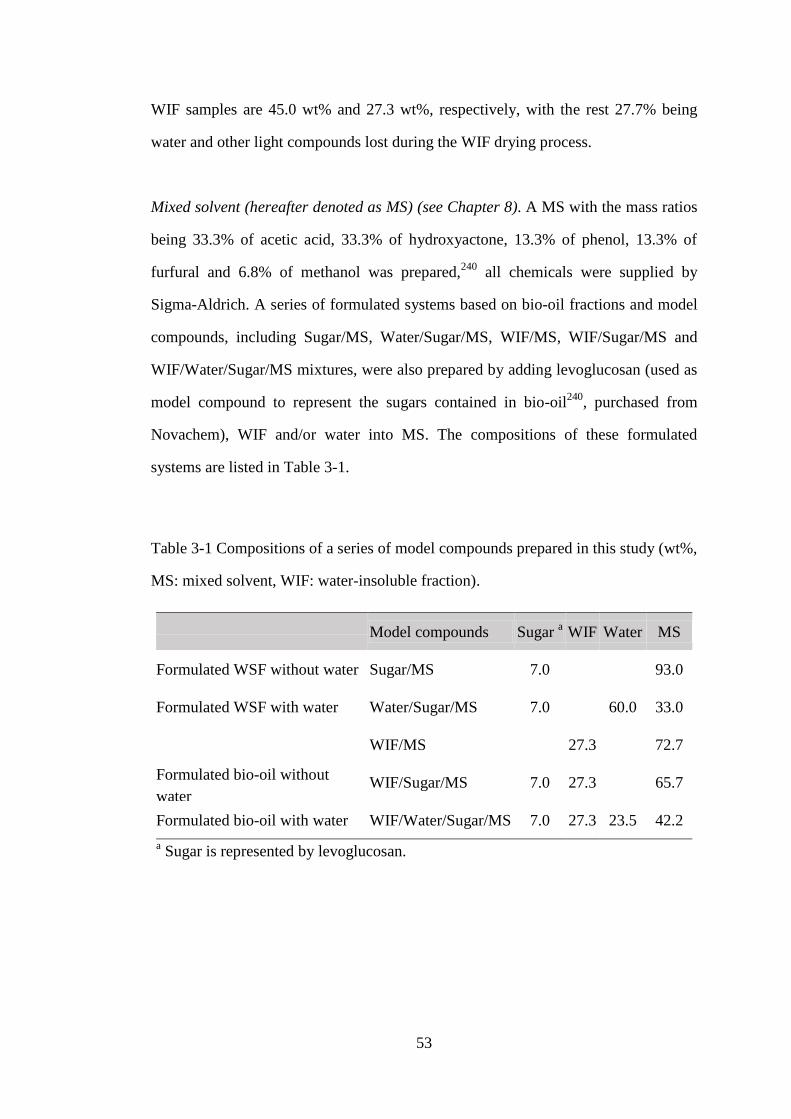
53
WIF samples are 45.0 wt% and 27.3 wt%, respectively, with the rest 27.7% being
water and other light compounds lost during the WIF drying process.
Mixed solvent (hereafter denoted as MS) (see Chapter 8). A MS with the mass ratios
being 33.3% of acetic acid, 33.3% of hydroxyactone, 13.3% of phenol, 13.3% of
furfural and 6.8% of methanol was prepared,240
all chemicals were supplied by
Sigma-Aldrich. A series of formulated systems based on bio-oil fractions and model
compounds, including Sugar/MS, Water/Sugar/MS, WIF/MS, WIF/Sugar/MS and
WIF/Water/Sugar/MS mixtures, were also prepared by adding levoglucosan (used as
model compound to represent the sugars contained in bio-oil240
, purchased from
Novachem), WIF and/or water into MS. The compositions of these formulated
systems are listed in Table 3-1.
Table 3-1 Compositions of a series of model compounds prepared in this study (wt%,
MS: mixed solvent, WIF: water-insoluble fraction).
Model compounds Sugar
a WIF Water MS
Formulated WSF without water Sugar/MS 7.0 93.0
Formulated WSF with water Water/Sugar/MS 7.0 60.0 33.0
WIF/MS 27.3 72.7
Formulated bio-oil without
water WIF/Sugar/MS 7.0 27.3 65.7
Formulated bio-oil with water WIF/Water/Sugar/MS 7.0 27.3 23.5 42.2
a Sugar is represented by levoglucosan.
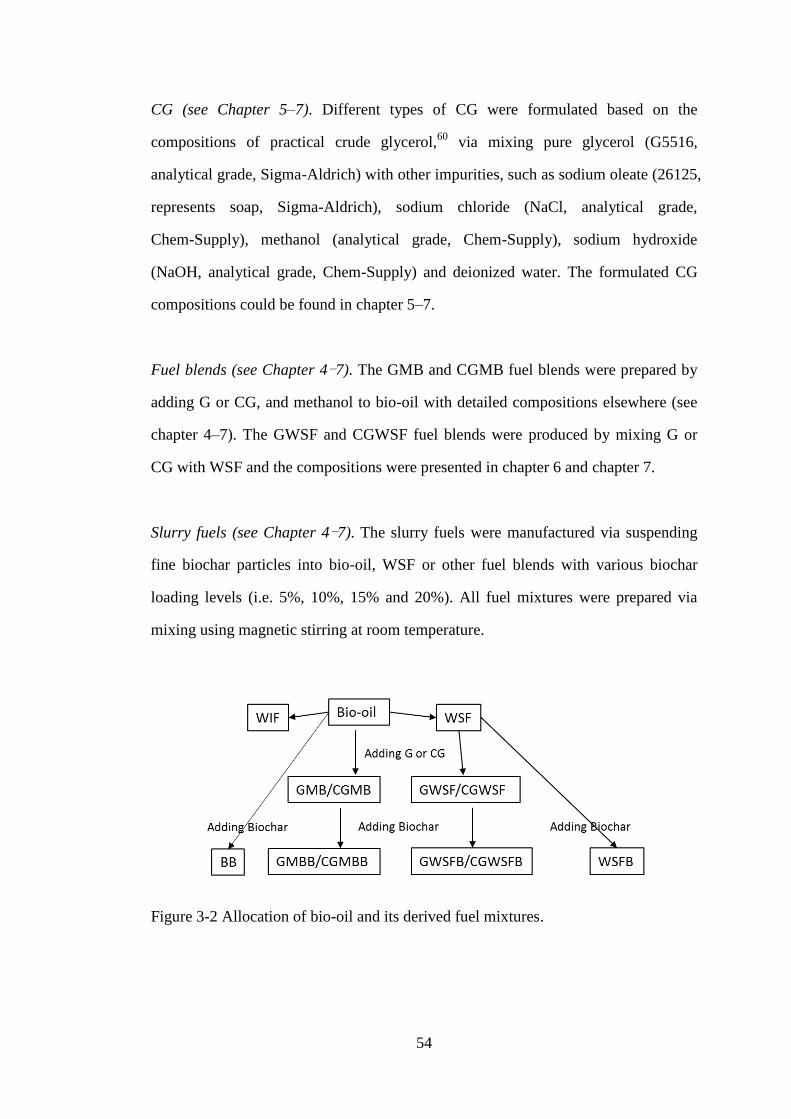
54
CG (see Chapter 5–7). Different types of CG were formulated based on the
compositions of practical crude glycerol,60
via mixing pure glycerol (G5516,
analytical grade, Sigma-Aldrich) with other impurities, such as sodium oleate (26125,
represents soap, Sigma-Aldrich), sodium chloride (NaCl, analytical grade,
Chem-Supply), methanol (analytical grade, Chem-Supply), sodium hydroxide
(NaOH, analytical grade, Chem-Supply) and deionized water. The formulated CG
compositions could be found in chapter 5–7.
Fuel blends (see Chapter 4-7). The GMB and CGMB fuel blends were prepared by
adding G or CG, and methanol to bio-oil with detailed compositions elsewhere (see
chapter 4–7). The GWSF and CGWSF fuel blends were produced by mixing G or
CG with WSF and the compositions were presented in chapter 6 and chapter 7.
Slurry fuels (see Chapter 4-7). The slurry fuels were manufactured via suspending
fine biochar particles into bio-oil, WSF or other fuel blends with various biochar
loading levels (i.e. 5%, 10%, 15% and 20%). All fuel mixtures were prepared via
mixing using magnetic stirring at room temperature.
Figure 3-2 Allocation of bio-oil and its derived fuel mixtures.

55
3.3.2 Accelerated ageing experiment
Ageing experiment of slurry fuels was conducted according to a procedure described
previously 241, 242
. Briefly, selected samples were sealed in a glass container and then
stored in an oven at 80 °C for 24h – a condition equivalent to ageing at room
temperature for a year 133
. Upon the completion of an ageing experiment, the samples
were cooled rapidly in an ice bath for collection. The weight of those fuel samples
before and after ageing were recorded to make sure insignificant volatile loss during
heating process. Both the aged samples and the corresponding control samples were
conducted to fuel analysis, such as viscosity, water content, density, surface tension,
and total acid number (TAN).
3.3.3 Characterization of ignition temperature
The ignition temperatures of bio-oil based fuel samples were determined using a
TGA (Mettler TGA/DSC 1 STAR). In each run, 15–20 mg of sample was put into a
platinum pan. Air was used as purge gas with a flow rate of 100 mL/min. In the TGA,
the sample was hated from 40 to 1000 C at 10 C/min. All experiments were carried
out at least in duplicate. The ignition temperature of fuel samples was defined
following an intersection method 170, 243
. Briefly, two points on a TGA curve are
firstly identified through DTG curve. One is the point at which a vertical line from
the first DTG peak after 200 °C (DTG peak before 200 °C is considered to be related
to the removal of water and some light volatiles 243-245
) crosses the TGA curve. The
other one is the point at which a vertical line from the beginning/onset of this DTG
peak crosses the TGA curve. Then two tangents at these two points on TGA curve
are drawn and the corresponding temperature of their intersection is identified as the
ignition temperature. The standard deviations of ignition temperatures determined by
the TGA method is within 3 °C. A modified test method based on ASTM standard
56
E659 (hereafter referred to as ASTM-based method) was also deployed. Briefly, a
portion of fuel sample is placed in a muffle furnace at known temperatures and
observed inside the furnace over a ten minute period to determine whether ignition
occurs. Auto ignition is evidenced by the sudden appearance of a flame inside the
vessel. If ignition is not observed, the temperature of furnace will be raised by a 20
C interval until ignition is observed. All tests were carried out at least in duplicates.
3.3.4 Characterization of cold flow property
The cold flow property of the fuel samples was studied using a DSC (Perkin Elmer
DSC 6000). Briefly, in an analysis, 10±0.5 mg of a fuel sample was loaded into a 40
μL sealed aluminium pan which is then subjected to DSC analysis with nitrogen as
the purge gas at 50 mL/min. The fuel sample was first cooled to −100 C and then
kept at the temperature 5 min. The system was then heated to 30 C at a heating rate
of 5 C /min, followed by cooled to −100 C again at a cooling rate of 5 C /min. For
methanol, it was holding at −150 C for 5 min firstly, then heated to 20 C at a
heating rate of 5 C /min, finally cooled to −150 C at same cooling rate. All
experiments were performed at least in duplicate. In this study, the melting peak
temperature (TMP) is used as melting point instead of the onset temperature to study
the cold flow property of fuel samples for several reasons. First, based on standard
method of ASTM-E794, TMP should be reported as the melting point of mixtures.
Bio-oil and bio-oil based fuels are known to be complex mixture of various chemical
compounds. Second, the onset temperature is known to have poor repeatability for
such mixtures.246
On the contrary, TMP has good repeatability for mixtures, with
standard deviations of TMP determined by DSC being < 1 °C in this study. For
methanol, the onset temperature based on the ending edge is taken as the melting
point.239
57
3.3.5 Fast pyrolysis experiments
Fast pyrolysis experiments were carried out in a laboratory-scale fluidised-bed quartz
reactor equipped with an atomization system (see Figure 3-3) at 500–800 C. Silica
sand (35 g, 125–250 μm) was loaded into the reactor as bed material with bed height
being ~4.2 cm. The reactor was housed in an electrically heated furnace and
preheated to the desired pyrolysis temperature, with 0.8–2.4 L/min argon gas as
fluidisation gas. An air-assist nozzle set (model: VLA-3, VLT-1 and VLB, Paasche
Airbrush) was used for atomization of bio-oil samples with argon gas (3 L/min) as
atomization gas. The nozzle set was under both water-cooled and gas-cooled (argon
gas, 1 L/min) conditions to maintain the temperature of the outlet of the nozzle below
70 C. The total gas flow rate was 4.8–6.4 L/min which adjusts the residence time to
be 2 s in all experiments at different temperatures. The bio-oil sample was fed by a
stainless steel syringe powered by a syringe pump (model: KDS LEGATO 210) at a
feeding rate of 0.12 g/min for 10 min. For the purpose of comparison, the amount of
bio-oil fraction (WIF or WSF) and model compounds fed into the reactor were kept
equivalent to the respective amount in 1.2 g bio-oil, by adjusting the feeding rate.
The reactor was further held for 15 min at desired pyrolysis temperature before it
was lifted out of furnace to cool down to below 50 C with argon gas continuously
flowing through the reactor. All samples in the bed were collected for further
analysis.

58
Figure 3-3 Schematic diagram of the fluidised-bed reactor system: 1, samples
feeding and spray system; 2, water cooling tube; 3, quartz reactor; 4, furnace.
3.4 Instruments and Analytical Techniques
3.4.1 Ultimate and proximate analysis
The biochar and bio-oil samples were subjected to ultimate analysis using an
elemental analyzer (Perkin-Elmer 2400 Series II model) based on AS 1038.6.1-1997
(R2013).247
The proximate analysis of biochar was also carried out via
thermogravimetric analysis (TGA; Mettler TGA/DSC 1 STAR model) according to
the procedure detailed in ASTM E870-82.
59
3.4.2 Higher heating value
The higher heating value (HHV) of the bio-oil and bio-oil derived fuel samples were
calculated following a method reported previously based on the elemental
composition 248
, in details:
HHV (MJ/kg) = –1.3675 + 0.3137C + 0.7009H + 0.0318O (3-1)
3.4.3 Quantification of inorganic species
The inorganic (mainly AAEM) species in biochar was quantified via a previous
method 112
, based on which a method was recently developed 128
for determining the
concentration of AAEM species in bio-oil, fuel blends and bioslurry samples. In this
study, the liquid phases of the GMBB and BB bioslurry samples were also obtained
via the filtration of the corresponding bioslurry samples using a 0.45 μm
polyvinylidene difluoride (PVDF) syringe filter and subjected to the analysis of
AAEM species via the same method. Briefly, a solid, liquid or slurry sample was
ashed using a carefully-devised temperature-time program (including an initial
evaporation step for liquid or slurry sample). The ash was then digested using a
mixture of nitric acid and hydrofluoric acid (1:1, v:v). The residues after excessive
acid evaporation were dissolved in 0.02 M methanesulfonic acid solution for analysis
by ion chromatography (IC, model DIONEX ICS-3000).
3.4.4 Rheological properties
The rheological properties of fuel samples were measured using a rheometer (model
Haake Mars II) equipped with a proper sensor system and a Thermocontroller
(Haake TC501). For bio-oil, WSF and other fuel blend samples, a cone-plate (C35/4

60
Ti) sensor system and a sample size of 0.8 mL were used. For slurry fuel samples, a
Z20 cylinder sensor system and a sample volume of 8.1 mL were used. Steady shear
tests were determined to study the flow behaviour and thixotropy behaviour of fuel
samples. In brief, the shear rate was increased to 1000 s-1
from 0 s-1
and then held for
30 s before decreasing to 0 s-1
. The viscosity of bio-oil and GMB blend were
obtained by averaging at least 50 data points from 100 s-1
to 1000 s-1
where the
samples show Newtonian behaviour, while for slurry samples, the viscosity at the
100 s-1
were used.
3.4.5 Water content, acidity, surface tension, density and Ohnesorge number
The water content and total acid number (TAN) of fuel samples were determined by
a Karl Fisher titrator (Metter V30) and an acid-base titrator (MEP Oil Titrino plus
848), respectively, according to the previous methods 16
. The surface tension of fuel
samples were measured following Wilhelmy method using a surface tensiometer
(KSV Sigma 701) with a round platinum rod (diameter of 1 mm). The fuel density
was determined by measuring the mass of the fuel at a constant volume using a 5 mL
volumetric flask. Both bulk density and surface tension were determined at room
temperature (about 25 °C). The standard deviations of density and surface tension are
less than 1% and 5%, respectively.
The Ohnesorge number of selected fuel samples were estimated by previous reported
method35, 137-139
based on viscosity, surface tension and density, via following
equation:
Ohnesorge number ≡ ηF / (σLρFDF)0.5
(3-2)
Where ηF, σL and ρF are the viscosity, surface tension and density of the fuel sample
respectively, and DF is the diameter of fuel passage.137, 139
61
3.4.6 Determination of particle size distribution (PSD), bed agglomeration yield,
tar yield and coke yield
The bed samples collected after pyrolysis experiments were sieved into a series of
size fractions (i.e. 125–250 µm, 250–355 µm, 355–500 µm, 0.5–1 mm, 1–2 mm, 2–3
mm and > 3 mm) using a vibratory sieve shaker (Retsch, AS 200 digit) sieving for 30
min with amplitude set to about 30%. The mass of each fraction was determined and
the data were used to calculate the PSD of the bed samples collected after the
pyrolysis of bio-oil, WSF, WIF or model compounds.
The bed agglomerates were also washed by a chloroform and methanol mixture (4:1
by volume) according to previous method71
for quantifying the yield of
solvent-soluble organic matter (termed as tar) and solvent-insoluble organic matter
(termed as coke) in bed agglomerates. In brief, a flask was used to put the bed
agglomerates, then twice the weight of a chloroform and methanol mixture was
added in, followed by manual shaking for about 30 min. After this, the solution and
the solids were separated via filtration. The collected solution was dried in an oven at
35 °C, and the yield of the solid residue after evaporation normalised to the total
mass of bio-oil fed into the fluidised-bed reactor is considered to be the tar yield. The
collected solids were first dried in an oven at 35 °C, then combusted in a quartz
reactor at 600 °C with air flow rate being 1 L/min for 30 min. The weight loss after
combustion normalised to the total mass of bio-oil fed into the fluidised-bed reactor
was considered to be the coke yield.
Because the bed material (i.e. silica sand) has a size of 125–250 μm, after pyrolysis
experiments any particles in the bed sample having sizes >250 µm are deemed to be
bed agglomerates. Therefore, this study uses a parameter called agglomeration yield,
calculated as the mass of the total particles with sizes >250 µm in the bed sample
62
divided by the total mass of bed sample collected after a pyrolysis experiment. Both
the agglomerate yield before and after solvent washing were determined accordingly.
3.4.7 Optical imaging
Optical images of selected bed materials were acquired using an optical microscope
(Olympus SL 60/61) connected with a camera.
3.5 Summary
Bio-oil and biochar are produced from pine wood biomass fast pyrolysis, while WSF
was obtained from bio-oil cold-water precipitation. Bio-oil derived fuel mixtures
were further prepared from bio-oil or WSF, G or CG, and/or biochar. Fuel properties
and ageing of GMBB and CGMBB slurry fuels were investigated according to the
analytical techniques presented in section 3.4, such as viscosity, TAN, water content,
surface tension and density etc. The AAEM species of those slurry fuels were also
quantified using method described in section 3.4.3. Moreover, the ignition
temperatures of bio-oil and a range of bio-oil based fuels were carried out via TGA
method and ASTM-based method to investigate their ignition behaviour. Melting
temperatures of bio-oil and its derived fuel mixtures were determined by DSC to
study their cold flow behaviour with emphasis on the effect of CG and biochar. In
addition, bed agglomerate during fast pyrolysis of bio-oil and its fractions (WSF and
WIF) were explored by determine the bed agglomeration yields. Fast pyrolysis of
selected model compounds were also performed to explain the fundamental
mechanisms relevant to bed agglomeration.
63
Chapter 4 Fuel Properties and Ageing of Bioslurry Prepared from
Glycerol/Methanol/Bio-oil Blend and Biochar
4.1 Introduction
Fast biomass pyrolysis, which is typically of small scales for distributed applications,
is a promising thermochemical technology for producing bio-oil that can be future
refined to liquid transport fuels and biochar as a high-energy-density solid
by-product 6, 12, 204, 249-251
. Applications of the fine and combustible biochar particles
may lead to potential environmental hazard during transportation (e.g., dusty 252
or
spontaneous combustion 19
). Therefore, bio-oil/biochar bioslurry (hereafter referred
to as “BB bioslurry”) via suspending fine biochar particles into bio-oil has been
considered as an important strategy for biomass-derived fuels penetrating into the
existing energy markets in the near term. Such concept was initially attempted by
commercial developers (e.g., Karlsruhe 253
) and also attracted systematic
investigations into its preparation, fuel properties, performance and applications 16, 17,
19, 254-257. It was demonstrated that bioslurry has suitable fuel and rheological
properties for combustion and gasification in stationary applications 254
. However,
during bioslurry storage, there is undesired migration of inorganic (especially alkali
and alkaline earth metallic, i.e. AAEM) species from biochar to bio-oil phase 16
.
Such migration of inorganic species is due to the acidic compounds and water in
bio-oil and may be hindered in presence of organic solvents such as methanol 255
.
On the other hand, the biodiesel industry produces a large quantity of surplus
glycerol as a by-product (~19 million in 2015) and also abundant low-grade
methanol 51, 258-260
. Glycerol is usually disposed of as waste stream which is neither
economically nor environmentally friendly and the recovery and purification of
64
low-grade methanol can also be energy intensive. Recent studies showed that
blending glycerol, methanol and bio-oil may produce glycerol/menthol/bio-oil fuel
blends that have synergistically improved the blended fuel properties in terms of
viscosity, water content, acid number and stability 57, 60
. Therefore, it is plausible to
further explore the production of bioslurry (hereafter referred to as “GMBB
bioslurry”) via suspending fine biochar particles into glycerol/methanol/bio-oil
blends (hereafter referred to as “GMB blends”) for stationary applications. The
production of GMBB slurry fuels may benefit both bio-oil and biodiesel industries as
it helps effective by-products (i.e. biochar and glycerol) utilisation. It addresses not
only the dust and spontaneous combustion issues associated with biochar but also
resolves the high-viscosity issue associated with glycerol when either biochar or
glycerol is utilized alone. Compared to BB bioslurry, GMBB bioslurry may also be
advantageous as it can potentially have better/synergistic rheological properties and
also dilute the inorganic species in the bioslurry fuel hence potentially reduce
particulate matter emission during bioslurry combustion/gasification.
Unfortunately, based on the knowledge of these authors, thus far, there have been no
investigations into GMBB bioslurry fuels in the literature. Therefore, the objective of
this study is to carry out a systematic study on fuel properties and ageing of GMBB
slurries prepared from biochar and GMB blends. A series of GMBB slurry samples
with different biochar loading levels were prepared for various characterization and
analysis, in comparison to the BB bioslurry samples prepared from the same biochar
and bio-oil.
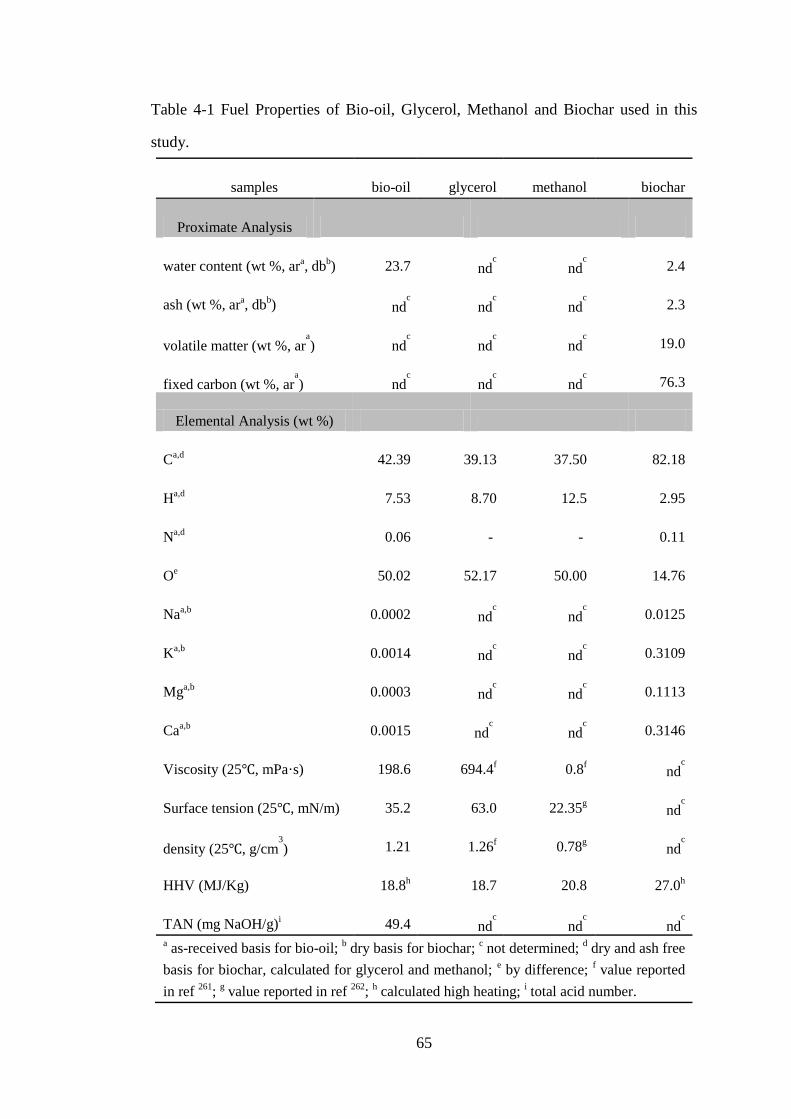
65
Table 4-1 Fuel Properties of Bio-oil, Glycerol, Methanol and Biochar used in this
study.
samples bio-oil glycerol methanol biochar
Proximate Analysis
water content (wt %, ara, db
b) 23.7 nd
c
ndc
2.4
ash (wt %, ara, db
b) nd
c
ndc
ndc
2.3
volatile matter (wt %, ara
) ndc
ndc
ndc
19.0
fixed carbon (wt %, ara
) ndc
ndc
ndc
76.3
Elemental Analysis (wt %)
Ca,d 42.39 39.13 37.50 82.18
Ha,d 7.53 8.70 12.5 2.95
Na,d 0.06 - - 0.11
Oe 50.02 52.17 50.00 14.76
Naa,b 0.0002 nd
c
ndc
0.0125
Ka,b 0.0014 nd
c
ndc
0.3109
Mga,b 0.0003 nd
c
ndc
0.1113
Caa,b 0.0015 nd
c
ndc
0.3146
Viscosity (25℃, mPa·s) 198.6 694.4f 0.8
f ndc
Surface tension (25℃, mN/m) 35.2 63.0 22.35g nd
c
density (25℃, g/cm3
) 1.21 1.26f 0.78
g ndc
HHV (MJ/Kg) 18.8h 18.7 20.8 27.0
h
TAN (mg NaOH/g)i 49.4 nd
c
ndc
ndc
a as-received basis for bio-oil;
b dry basis for biochar;
c not determined;
d dry and ash free
basis for biochar, calculated for glycerol and methanol; e by difference;
f value reported
in ref 261
; g value reported in ref
262;
h calculated high heating;
i total acid number.
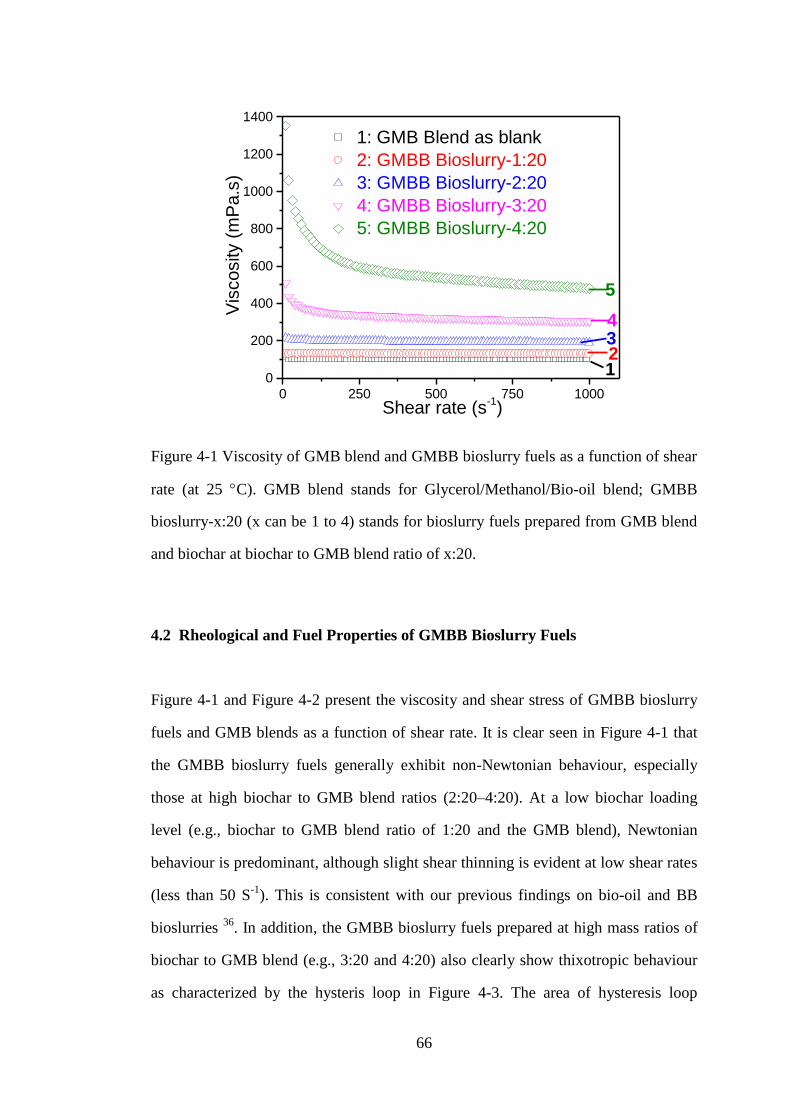
66
Figure 4-1 Viscosity of GMB blend and GMBB bioslurry fuels as a function of shear
rate (at 25 C). GMB blend stands for Glycerol/Methanol/Bio-oil blend; GMBB
bioslurry-x:20 (x can be 1 to 4) stands for bioslurry fuels prepared from GMB blend
and biochar at biochar to GMB blend ratio of x:20.
4.2 Rheological and Fuel Properties of GMBB Bioslurry Fuels
Figure 4-1 and Figure 4-2 present the viscosity and shear stress of GMBB bioslurry
fuels and GMB blends as a function of shear rate. It is clear seen in Figure 4-1 that
the GMBB bioslurry fuels generally exhibit non-Newtonian behaviour, especially
those at high biochar to GMB blend ratios (2:20–4:20). At a low biochar loading
level (e.g., biochar to GMB blend ratio of 1:20 and the GMB blend), Newtonian
behaviour is predominant, although slight shear thinning is evident at low shear rates
(less than 50 S-1
). This is consistent with our previous findings on bio-oil and BB
bioslurries 36
. In addition, the GMBB bioslurry fuels prepared at high mass ratios of
biochar to GMB blend (e.g., 3:20 and 4:20) also clearly show thixotropic behaviour
as characterized by the hysteris loop in Figure 4-3. The area of hysteresis loop
0 250 500 750 1000
0
200
400
600
800
1000
1200
1400
3
1: GMB Blend as blank
2: GMBB Bioslurry-1:20
3: GMBB Bioslurry-2:20
4: GMBB Bioslurry-3:20
5: GMBB Bioslurry-4:20V
iscosity (
mP
a.s
)
Shear rate (s-1)
5
4
21
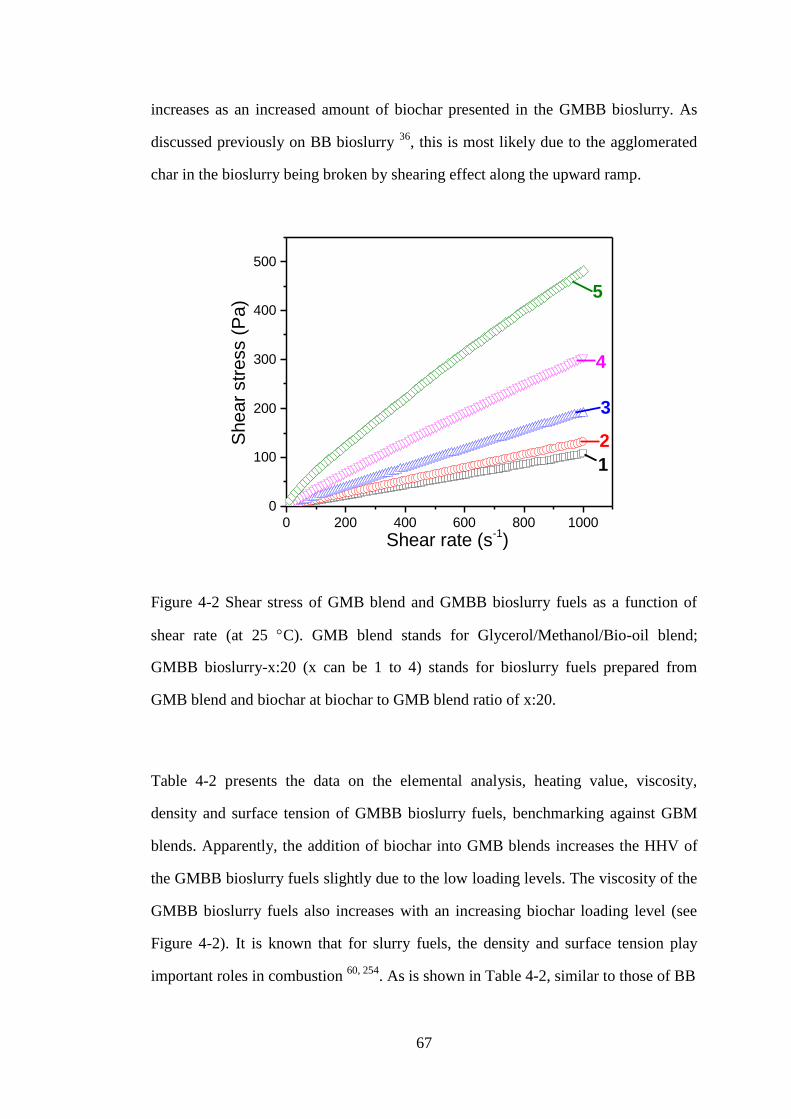
67
increases as an increased amount of biochar presented in the GMBB bioslurry. As
discussed previously on BB bioslurry 36
, this is most likely due to the agglomerated
char in the bioslurry being broken by shearing effect along the upward ramp.
Figure 4-2 Shear stress of GMB blend and GMBB bioslurry fuels as a function of
shear rate (at 25 C). GMB blend stands for Glycerol/Methanol/Bio-oil blend;
GMBB bioslurry-x:20 (x can be 1 to 4) stands for bioslurry fuels prepared from
GMB blend and biochar at biochar to GMB blend ratio of x:20.
Table 4-2 presents the data on the elemental analysis, heating value, viscosity,
density and surface tension of GMBB bioslurry fuels, benchmarking against GBM
blends. Apparently, the addition of biochar into GMB blends increases the HHV of
the GMBB bioslurry fuels slightly due to the low loading levels. The viscosity of the
GMBB bioslurry fuels also increases with an increasing biochar loading level (see
Figure 4-2). It is known that for slurry fuels, the density and surface tension play
important roles in combustion 60, 254
. As is shown in Table 4-2, similar to those of BB
0 200 400 600 800 1000
0
100
200
300
400
500
Shear
str
ess (
Pa)
Shear rate (s-1)
3
5
4
2
1
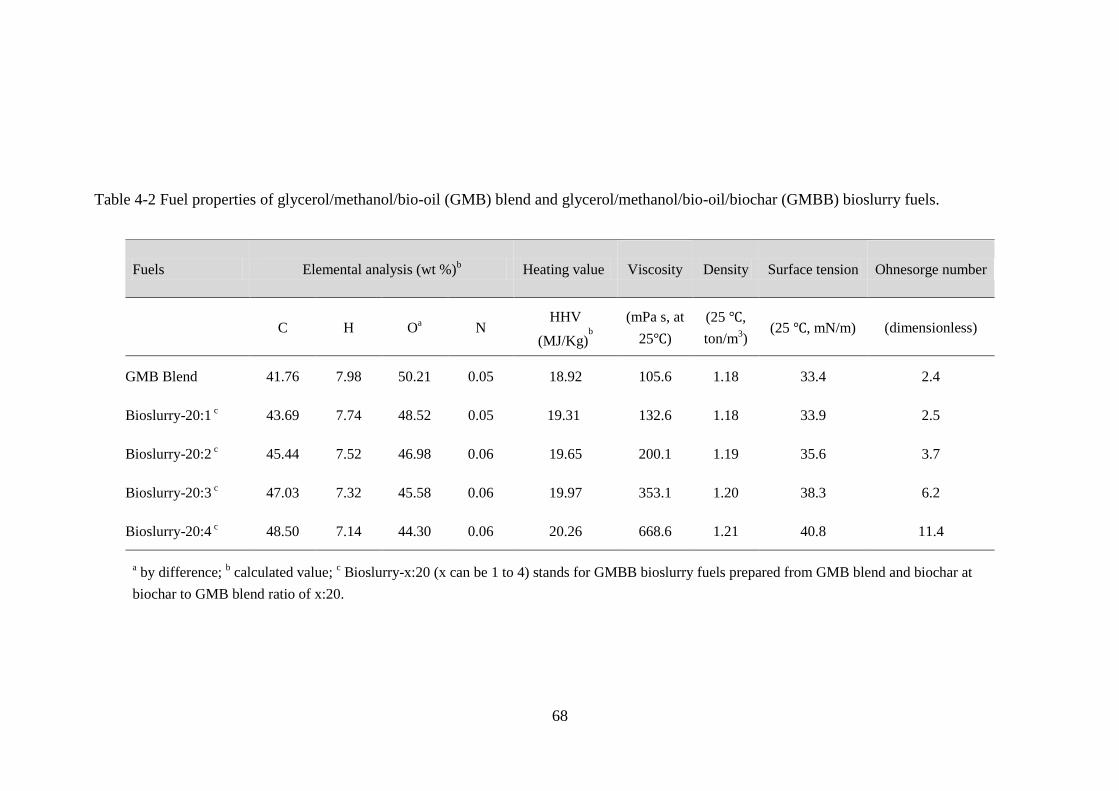
68
Table 4-2 Fuel properties of glycerol/methanol/bio-oil (GMB) blend and glycerol/methanol/bio-oil/biochar (GMBB) bioslurry fuels.
Fuels Elemental analysis (wt %)b Heating value Viscosity Density Surface tension Ohnesorge number
C H O
a N HHV
(MJ/Kg)b
(mPa s, at
25℃)
(25 ℃,
ton/m3)
(25 ℃, mN/m) (dimensionless)
GMB Blend 41.76 7.98 50.21 0.05 18.92 105.6 1.18 33.4 2.4
Bioslurry-20:1 c 43.69 7.74 48.52 0.05 19.31 132.6 1.18 33.9 2.5
Bioslurry-20:2 c 45.44 7.52 46.98 0.06 19.65 200.1 1.19 35.6 3.7
Bioslurry-20:3 c 47.03 7.32 45.58 0.06 19.97 353.1 1.20 38.3 6.2
Bioslurry-20:4 c 48.50 7.14 44.30 0.06 20.26 668.6 1.21 40.8 11.4
a by difference;
b calculated value;
c Bioslurry-x:20 (x can be 1 to 4) stands for GMBB bioslurry fuels prepared from GMB blend and biochar at
biochar to GMB blend ratio of x:20.
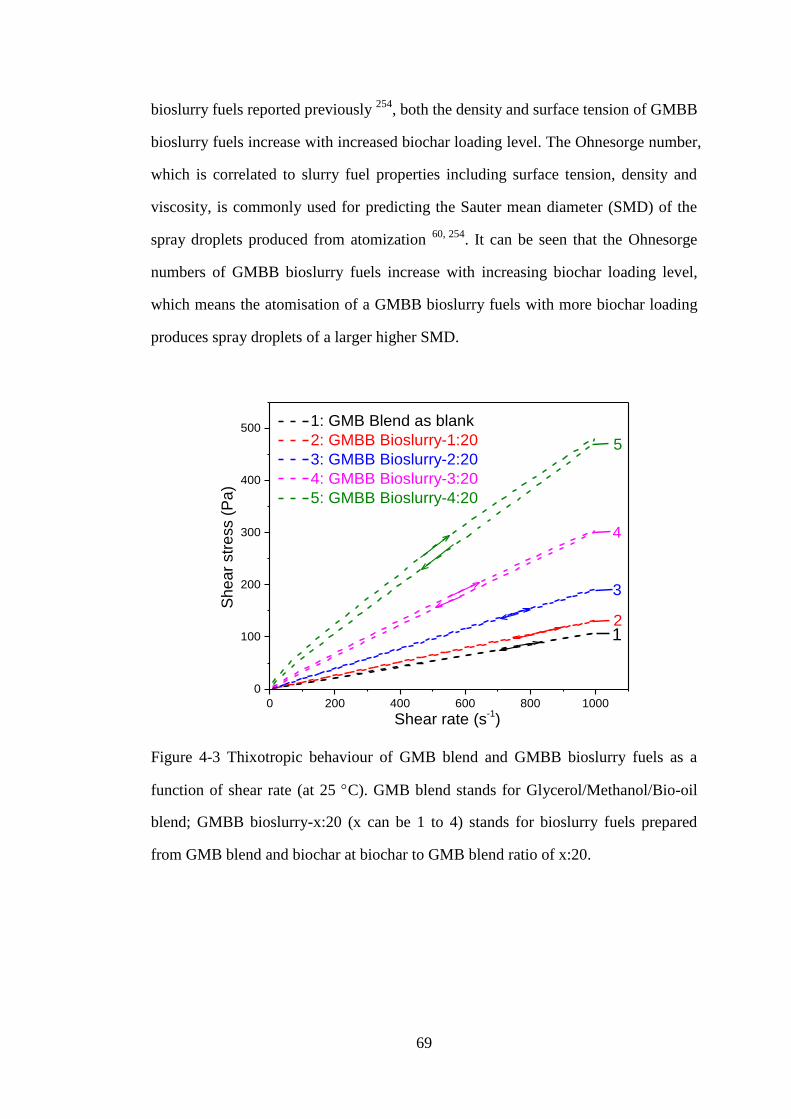
69
bioslurry fuels reported previously 254
, both the density and surface tension of GMBB
bioslurry fuels increase with increased biochar loading level. The Ohnesorge number,
which is correlated to slurry fuel properties including surface tension, density and
viscosity, is commonly used for predicting the Sauter mean diameter (SMD) of the
spray droplets produced from atomization 60, 254
. It can be seen that the Ohnesorge
numbers of GMBB bioslurry fuels increase with increasing biochar loading level,
which means the atomisation of a GMBB bioslurry fuels with more biochar loading
produces spray droplets of a larger higher SMD.
Figure 4-3 Thixotropic behaviour of GMB blend and GMBB bioslurry fuels as a
function of shear rate (at 25 C). GMB blend stands for Glycerol/Methanol/Bio-oil
blend; GMBB bioslurry-x:20 (x can be 1 to 4) stands for bioslurry fuels prepared
from GMB blend and biochar at biochar to GMB blend ratio of x:20.
0 200 400 600 800 1000
0
100
200
300
400
500
5
1: GMB Blend as blank
2: GMBB Bioslurry-1:20
3: GMBB Bioslurry-2:20
4: GMBB Bioslurry-3:20
5: GMBB Bioslurry-4:20
Sh
ea
r str
ess (
Pa
)
Shear rate (s-1)
4
3
21
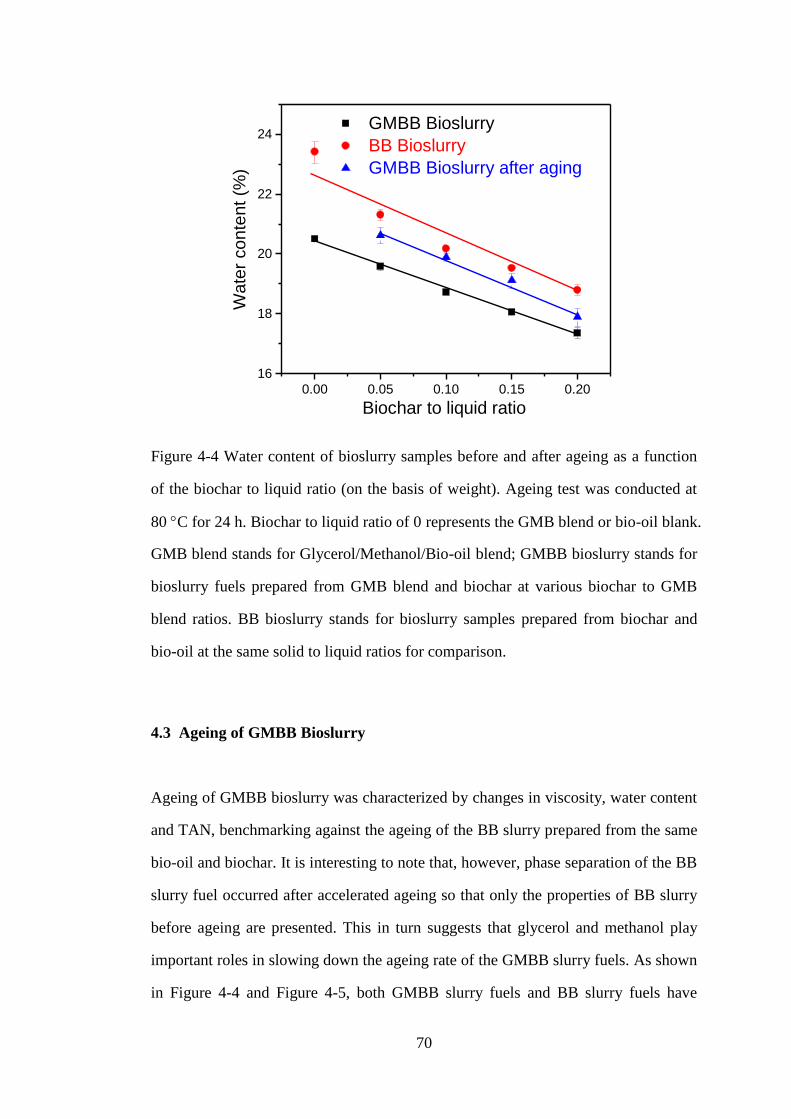
70
Figure 4-4 Water content of bioslurry samples before and after ageing as a function
of the biochar to liquid ratio (on the basis of weight). Ageing test was conducted at
80 C for 24 h. Biochar to liquid ratio of 0 represents the GMB blend or bio-oil blank.
GMB blend stands for Glycerol/Methanol/Bio-oil blend; GMBB bioslurry stands for
bioslurry fuels prepared from GMB blend and biochar at various biochar to GMB
blend ratios. BB bioslurry stands for bioslurry samples prepared from biochar and
bio-oil at the same solid to liquid ratios for comparison.
4.3 Ageing of GMBB Bioslurry
Ageing of GMBB bioslurry was characterized by changes in viscosity, water content
and TAN, benchmarking against the ageing of the BB slurry prepared from the same
bio-oil and biochar. It is interesting to note that, however, phase separation of the BB
slurry fuel occurred after accelerated ageing so that only the properties of BB slurry
before ageing are presented. This in turn suggests that glycerol and methanol play
important roles in slowing down the ageing rate of the GMBB slurry fuels. As shown
in Figure 4-4 and Figure 4-5, both GMBB slurry fuels and BB slurry fuels have
0.00 0.05 0.10 0.15 0.20
16
18
20
22
24
Biochar to liquid ratio
Wa
ter
co
nte
nt
(%)
GMBB Bioslurry
BB Bioslurry
GMBB Bioslurry after aging

71
decreasing water content and TAN with increasing biochar to liquid ratio. The water
content and TAN of the GMBB slurry fuels are much lower than those of the BB
slurry fuel. This is understandable as bio-oil is the main source of the water and acids
in the mixtures. As the biochar loading level increases, the fraction of bio-oil in the
mixture decreases, leading to the proportion of bio-oil in a GMBB slurry being lower
than that in a BB slurry at the same biochar to liquid ratio.
Figure 4-5 TAN of bioslurry samples before and after ageing as a function of the
biochar to liquid ratio (on the basis of weight). Ageing test was conducted at 80 C
for 24 h. Biochar to liquid ratio of 0 represents the GMB blend or bio-oil blank.
GMB blend stands for Glycerol/Methanol/Bio-oil blend; GMBB bioslurry stands for
bioslurry fuels prepared from GMB blend and biochar at various biochar to GMB
blend ratios. BB bioslurry stands for bioslurry samples prepared from biochar and
bio-oil at the same solid to liquid ratios for comparison.
0.00 0.05 0.10 0.15 0.20
25
30
35
40
45
50
Biochar to liquid ratio
TA
N (
mg N
aO
H/g
)
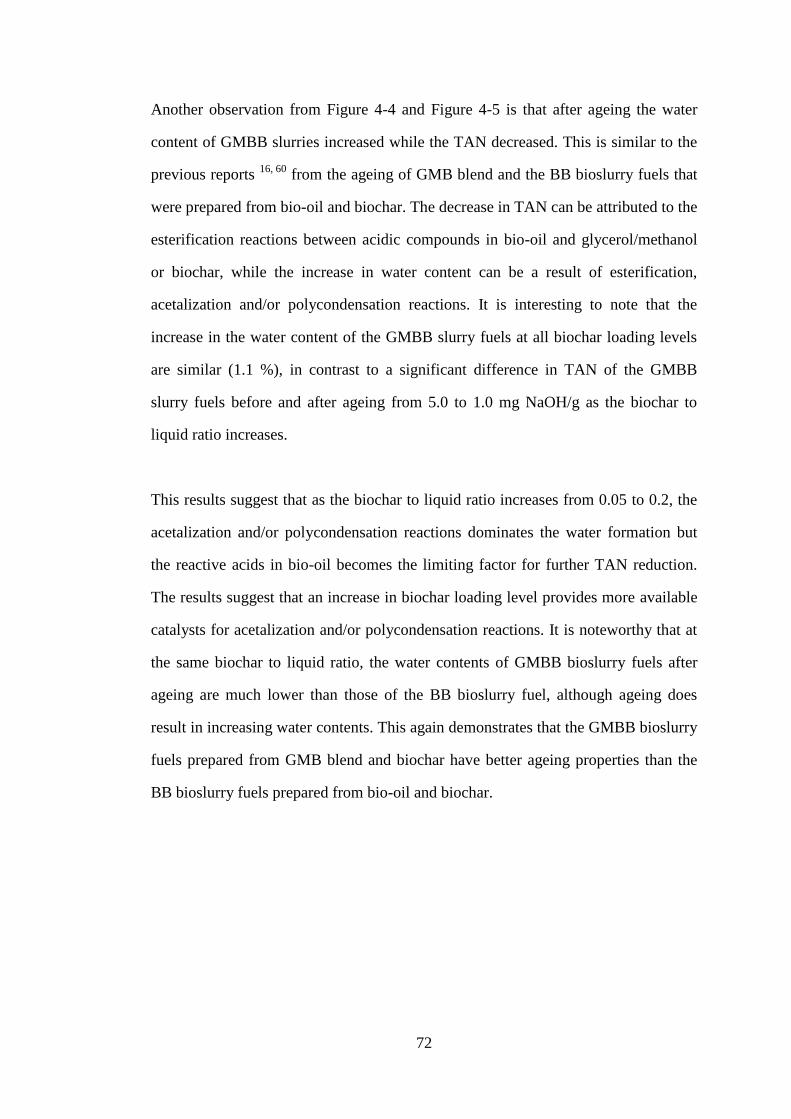
72
Another observation from Figure 4-4 and Figure 4-5 is that after ageing the water
content of GMBB slurries increased while the TAN decreased. This is similar to the
previous reports 16, 60
from the ageing of GMB blend and the BB bioslurry fuels that
were prepared from bio-oil and biochar. The decrease in TAN can be attributed to the
esterification reactions between acidic compounds in bio-oil and glycerol/methanol
or biochar, while the increase in water content can be a result of esterification,
acetalization and/or polycondensation reactions. It is interesting to note that the
increase in the water content of the GMBB slurry fuels at all biochar loading levels
are similar (1.1 %), in contrast to a significant difference in TAN of the GMBB
slurry fuels before and after ageing from 5.0 to 1.0 mg NaOH/g as the biochar to
liquid ratio increases.
This results suggest that as the biochar to liquid ratio increases from 0.05 to 0.2, the
acetalization and/or polycondensation reactions dominates the water formation but
the reactive acids in bio-oil becomes the limiting factor for further TAN reduction.
The results suggest that an increase in biochar loading level provides more available
catalysts for acetalization and/or polycondensation reactions. It is noteworthy that at
the same biochar to liquid ratio, the water contents of GMBB bioslurry fuels after
ageing are much lower than those of the BB bioslurry fuel, although ageing does
result in increasing water contents. This again demonstrates that the GMBB bioslurry
fuels prepared from GMB blend and biochar have better ageing properties than the
BB bioslurry fuels prepared from bio-oil and biochar.
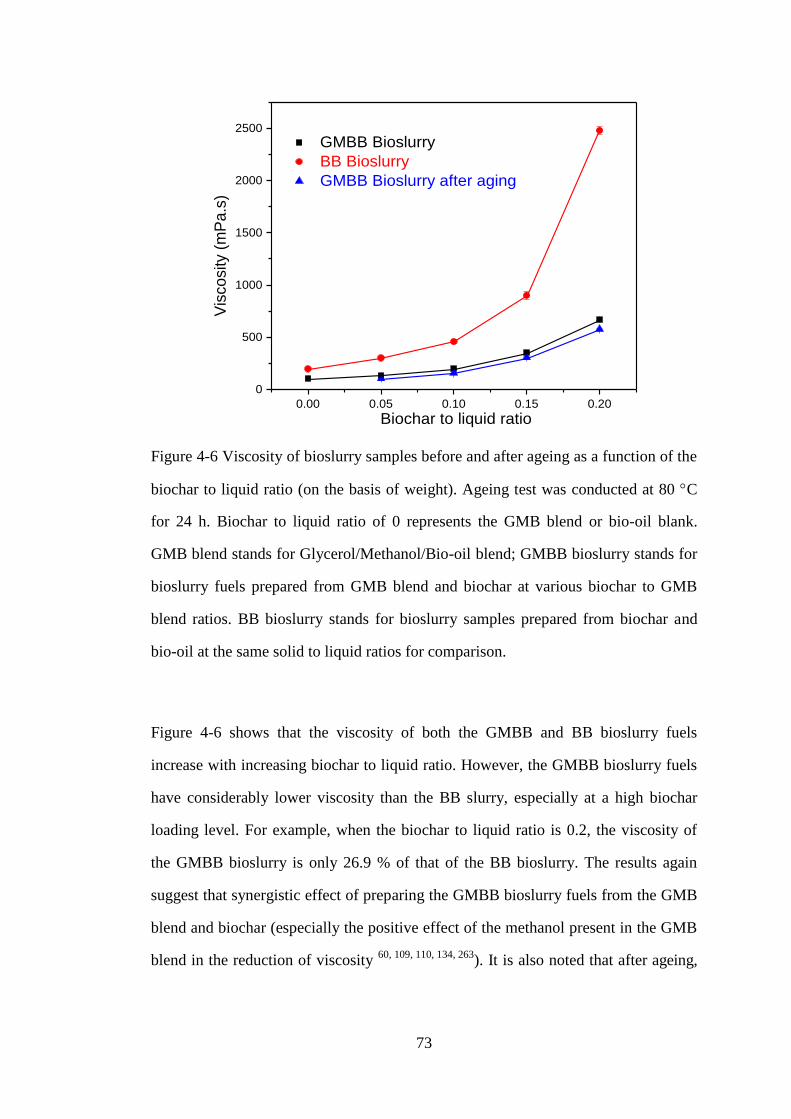
73
Figure 4-6 Viscosity of bioslurry samples before and after ageing as a function of the
biochar to liquid ratio (on the basis of weight). Ageing test was conducted at 80 C
for 24 h. Biochar to liquid ratio of 0 represents the GMB blend or bio-oil blank.
GMB blend stands for Glycerol/Methanol/Bio-oil blend; GMBB bioslurry stands for
bioslurry fuels prepared from GMB blend and biochar at various biochar to GMB
blend ratios. BB bioslurry stands for bioslurry samples prepared from biochar and
bio-oil at the same solid to liquid ratios for comparison.
Figure 4-6 shows that the viscosity of both the GMBB and BB bioslurry fuels
increase with increasing biochar to liquid ratio. However, the GMBB bioslurry fuels
have considerably lower viscosity than the BB slurry, especially at a high biochar
loading level. For example, when the biochar to liquid ratio is 0.2, the viscosity of
the GMBB bioslurry is only 26.9 % of that of the BB bioslurry. The results again
suggest that synergistic effect of preparing the GMBB bioslurry fuels from the GMB
blend and biochar (especially the positive effect of the methanol present in the GMB
blend in the reduction of viscosity 60, 109, 110, 134, 263
). It is also noted that after ageing,
0.00 0.05 0.10 0.15 0.20
0
500
1000
1500
2000
2500
GMBB Bioslurry
BB Bioslurry
GMBB Bioslurry after aging
Biochar to liquid ratio
Vis
co
sity (
mP
a.s
)
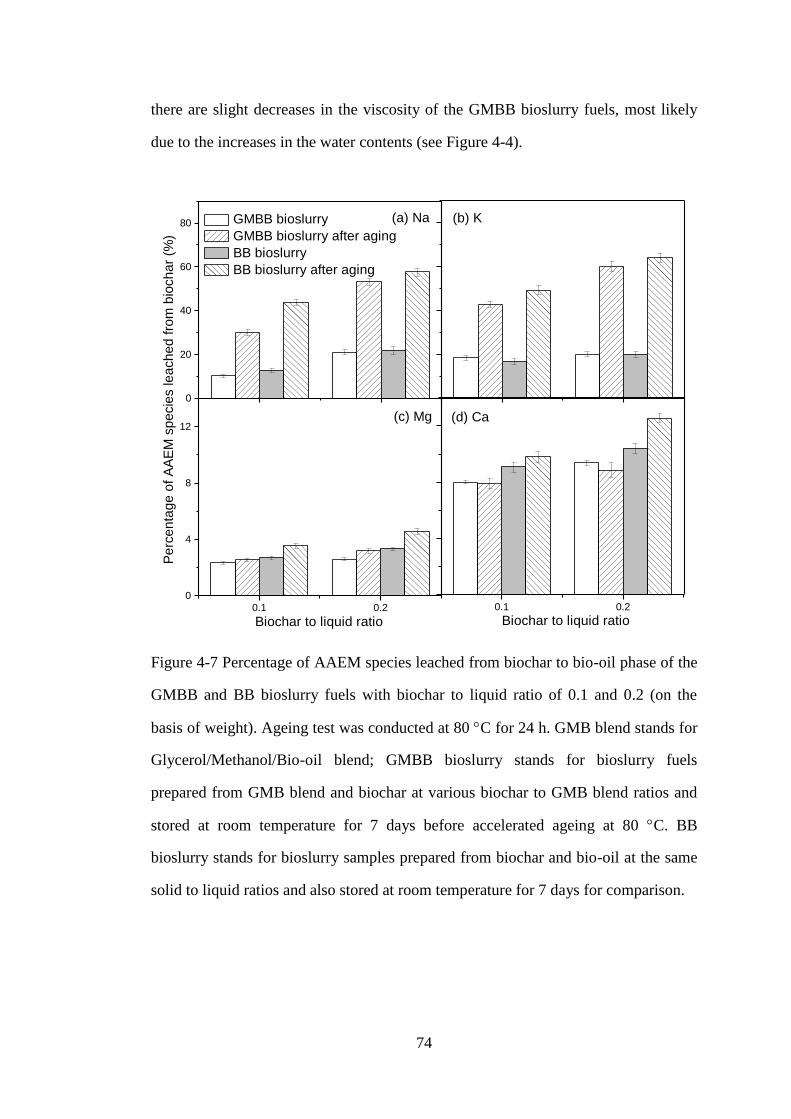
74
there are slight decreases in the viscosity of the GMBB bioslurry fuels, most likely
due to the increases in the water contents (see Figure 4-4).
Figure 4-7 Percentage of AAEM species leached from biochar to bio-oil phase of the
GMBB and BB bioslurry fuels with biochar to liquid ratio of 0.1 and 0.2 (on the
basis of weight). Ageing test was conducted at 80 C for 24 h. GMB blend stands for
Glycerol/Methanol/Bio-oil blend; GMBB bioslurry stands for bioslurry fuels
prepared from GMB blend and biochar at various biochar to GMB blend ratios and
stored at room temperature for 7 days before accelerated ageing at 80 C. BB
bioslurry stands for bioslurry samples prepared from biochar and bio-oil at the same
solid to liquid ratios and also stored at room temperature for 7 days for comparison.
0
20
40
60
80
(a) Na GMBB bioslurry
GMBB bioslurry after aging
BB bioslurry
BB bioslurry after aging
Pe
rce
nta
ge
of
AA
EM
sp
ecie
s le
ach
ed
fro
m b
ioch
ar
(%)
(b) K
0.1 0.2
0
4
8
12
(c) Mg
Biochar to liquid ratio
0.1 0.2
(d) Ca
Biochar to liquid ratio
75
4.4 Leaching Characteristics of AAEM Species in the GMBB Bioslurry System
It is known that a proportion of the AAEM species in biochar can be leached out by
the acidic bio-oil for the BB bioslurry fuels prepared from biochar and bio-oil 16
. The
key question is how the leaching of the AAEM species in biochar would be
influenced by the GMB blend for the GMBB bioslurry fuels. Figure 4-7 presents the
leaching characteristics of AAEM species in the GMBB bioslurry fuels at biochar to
liquid ratio of 0.1 and 0.2, benchmarking against that in the BB bioslurry fuels at the
same biochar to liquid ratios. The leaching of the AAEM species from the biochar
increases with increasing biochar to liquid ratio for both the GMBB and BB bioslurry
fuels. The effect of ageing on the leaching of AAEM species follows similar trends
for the GMBB bioslurry fuels at different biochar to liquid ratios.
Figure 4-7 shows that even after ageing for 7 days at room temperature, the leaching
of AAEM species from biochar continues to increase in both the GMBB and BB
slurry systems. It appears that the leaching of AAEM species from biochar into
liquid phase has not reached equilibrium after 7 days. While the increase in the
amount of Na and K species leached from biochar is more than doubled after ageing
for 7 days, which of Mg and Ca species is less than 35 %. It is known that Na and K
species in biochar are mainly present in ionic forms while Mg and Ca species are
more in organically-bound form 57
. The significant increase in the leaching of Na and
K after ageing indicates an increase in the dissolution of ionic compounds in the
liquid phase as a result of increased amount of water in the GMBB slurry samples
after ageing (see Section 4.3).
In addition, the amount of AAEM species leached by bio-oil in the BB bioslurry fuel
is only slightly higher than that by GMB blend in the GMBB bioslurry fuels after
ageing for 7 days at room temperature. However, after accelerated ageing at 80 °C
76
for 24h (equivalent to ageing at room temperature for a year 16, 133
), the difference in
the leaching of AAEM species from biochar in the BB bioslurry and GMBB
bioslurry systems became considerably larger. The results suggest that the ability of
the GMB blend in the GMBB bioslurry systems becomes the limiting factor in the
leaching process after long-term storage.
There are at least three possible reasons for the less capability of the GMB blend in
leaching the AAEM species from biochar, in comparison to that of bio-oil. First,
compared to on the same mass basis, bio-oil contains more water and acids (which
are known to be responsible for the leaching of AAEM species from biochar 60
) than
the GMB blend (23.5 % vs. 20.8 % for water content and 49.1 vs. 41.5 mg NaOH/g
for TAN). Second, methanol was reported to be ineffective for leaching the AAEM
species from biochar 57
. The leaching of AAEM species from biochar by glycerol is
also insignificant, with only 0.0, 2.4, 0.06 and 0.45% of Na, K, Mg and Ca being
leached from the biochar by glycerol. Third and the last, it was previously reported 57
that the presence of methanol reduces the leaching of AAEM species from biochar
by solvent–water/acid system because methanol decreases the solubility of ionic
compounds in the liquid phase. Therefore, the presence of methanol and/or glycerol
in the GMBB bioslurry fuels might reduce the leaching capability of water and/or
acidic compounds in the mixture.
4.5 Conclusions
This study reports the fuel properties (heating value, density, surface tension,
viscosity, water content, TAN, and etc.) of bioslurry fuels prepared from GMB blend
at different biochar loading levels. The results show that biochar loading level is an
important parameter in determining the fuel properties of both the GMBB and BB
bioslurry fuels. An increasing biochar loading level decreases the water content and

77
TAN but increases the viscosity of the bioslurry fuels. In presence of methanol and
glycerol, the GMBB bioslurry fuels have lower viscosity, water content and TAN
than the BB bioslurry prepared from biochar and bio-oil only. Ageing of the GMBB
and BB bioslurry fuels leads to reductions in the viscosity and TAN but an increase
in the water content of the bioslurry fuels. The addition of methanol and glycerol
slows down the ageing process hence reduce the leaching of the AAEM species in
biochar by the liquid phase in the GMBB bioslurry fuels.
78
Chapter 5 Rheological Properties and Ageing of Bioslurry Fuels Prepared
from Crude Glycerol/Methanol/Bio-oil Blend and Biochar for Stationary
Combustion Applications
5.1 Introduction
Crude glycerol is a major by-product of biodiesel industry and its utilization is of
great importance to both economic and environmental performance of a biodiesel
plant 51, 54, 57, 58, 214
. Direct utilization of crude glycerol is highly desired because of
the large amount of glycerol surplus and the high cost associated with crude glycerol
purification 54, 214, 260
. Recently, Wu et al. 264
developed a plausible way for crude
glycerol direct utilization via mixing formulated crude glycerol (FCG) with fast
pyrolysis bio-oil (with the addition of methanol) to produce FCG/methanol/bio-oil
(i.e. FCGMB) blend and also mixing the resultant FCGMB blend with biochar to
prepare FCGMB/biochar (FCGMBB) bioslurry fuels. Those blend and bioslurry
fuels meet the specifications for stationary combustion applications 264
. Such
strategies for producing FCGMBB bioslurry fuels not only help the effective
utilization of by-products (e.g., biochar from fast pyrolysis bio-oil production and
crude glycerol from biodiesel production) but also address issues associated with
those by-products (e.g., biochar being dusty and prone to spontaneous combustion
and crude glycerol being of high viscosity) 19, 265
. However, little is reported on the
rheological properties and ageing of FCGMBB bioslurry fuels in the open literature.
These are the objectives of this study, i.e. to determine the rheological properties and
ageing of FCGMBB bioslurry fuels.

79
Table 5-1 Compositions of different types of formulated crude glycerol (FCG)
samples in this study (wt %).
FCG Glycerol Soap Water NaOH NaCl
FCG1 83.3 10.4 4.2 2.1
FCG2 81.2 14.6 4.2
FCG3 66.7 10.4 20.8 2.1
Figure 5-1 Viscosity of FCGMBB bioslurry fuels benchmarking against GMBB
bioslurry as a function of shear rate (at 25 C). GMBB bioslurry stands for
glycerol/methanol/bio-oil/biochar bioslurry; FCG1–3MBB bioslurry stands for
FCG1–3/methanol/bio-oil/biochar bioslurry; FCG stands for formulated crude
glycerol.
0 200 400 600 800 1000150
200
250
300
350
400
450
Shear rate (s-1)
1
Vis
co
sity (
mP
a.s
)
1: GMBB bioslurry
2: FCG1MBB bioslurry
3: FCG2MBB bioslurry
4: FCG3MBB bioslurry
234
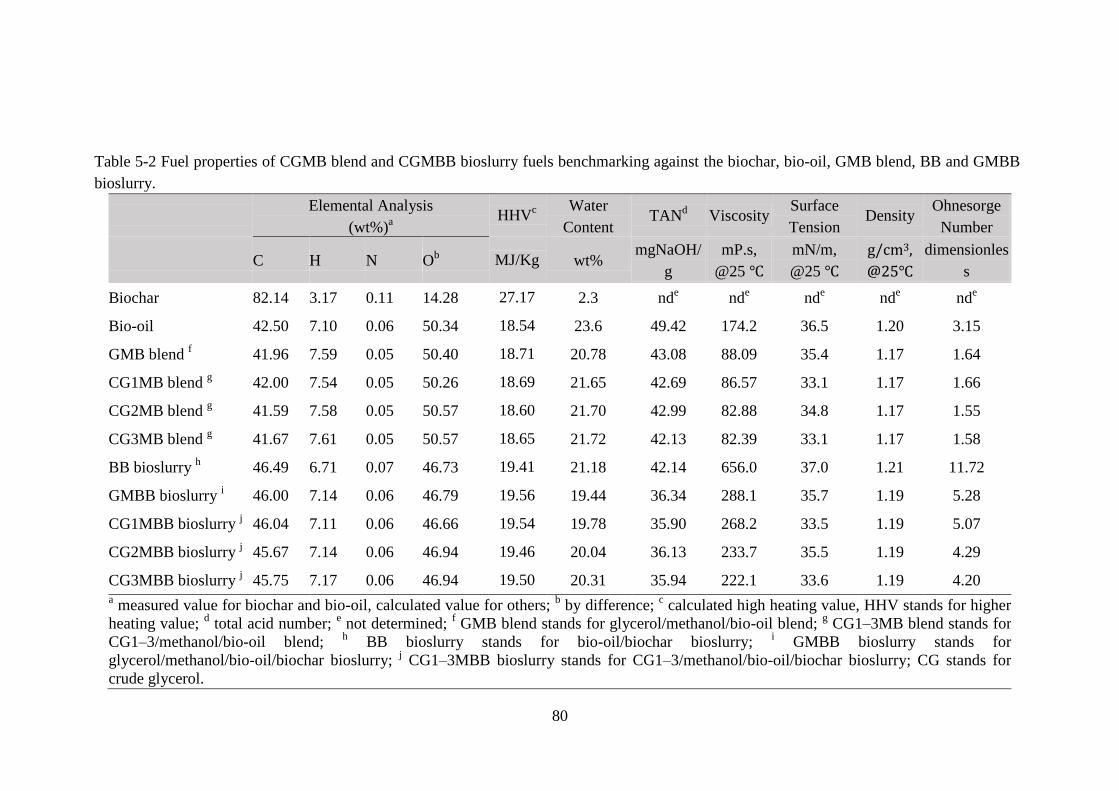
80
Table 5-2 Fuel properties of CGMB blend and CGMBB bioslurry fuels benchmarking against the biochar, bio-oil, GMB blend, BB and GMBB
bioslurry.
Elemental Analysis
(wt%)a
HHVc
Water
Content TAN
d Viscosity
Surface
Tension Density
Ohnesorge
Number
C H N Ob MJ/Kg wt%
mgNaOH/
g
mP.s,
@25 ℃
mN/m,
@25 ℃
g/cm3,
@25℃
dimensionles
s
Biochar 82.14 3.17 0.11 14.28 27.17 2.3 nde nd
e nd
e nd
e nd
e
Bio-oil 42.50 7.10 0.06 50.34 18.54 23.6 49.42 174.2 36.5 1.20 3.15
GMB blend f 41.96 7.59 0.05 50.40 18.71 20.78 43.08 88.09 35.4 1.17 1.64
CG1MB blend g 42.00 7.54 0.05 50.26 18.69 21.65 42.69 86.57 33.1 1.17 1.66
CG2MB blend g 41.59 7.58 0.05 50.57 18.60 21.70 42.99 82.88 34.8 1.17 1.55
CG3MB blend g 41.67 7.61 0.05 50.57 18.65 21.72 42.13 82.39 33.1 1.17 1.58
BB bioslurry h 46.49 6.71 0.07 46.73 19.41 21.18 42.14 656.0 37.0 1.21 11.72
GMBB bioslurry i 46.00 7.14 0.06 46.79 19.56 19.44 36.34 288.1 35.7 1.19 5.28
CG1MBB bioslurry j 46.04 7.11 0.06 46.66 19.54 19.78 35.90 268.2 33.5 1.19 5.07
CG2MBB bioslurry j 45.67 7.14 0.06 46.94 19.46 20.04 36.13 233.7 35.5 1.19 4.29
CG3MBB bioslurry j 45.75 7.17 0.06 46.94 19.50 20.31 35.94 222.1 33.6 1.19 4.20
a measured value for biochar and bio-oil, calculated value for others;
b by difference;
c calculated high heating value, HHV stands for higher
heating value; d total acid number;
e not determined;
f GMB blend stands for glycerol/methanol/bio-oil blend;
g CG1–3MB blend stands for
CG1–3/methanol/bio-oil blend; h BB bioslurry stands for bio-oil/biochar bioslurry;
i GMBB bioslurry stands for
glycerol/methanol/bio-oil/biochar bioslurry; j CG1–3MBB bioslurry stands for CG1–3/methanol/bio-oil/biochar bioslurry; CG stands for
crude glycerol.
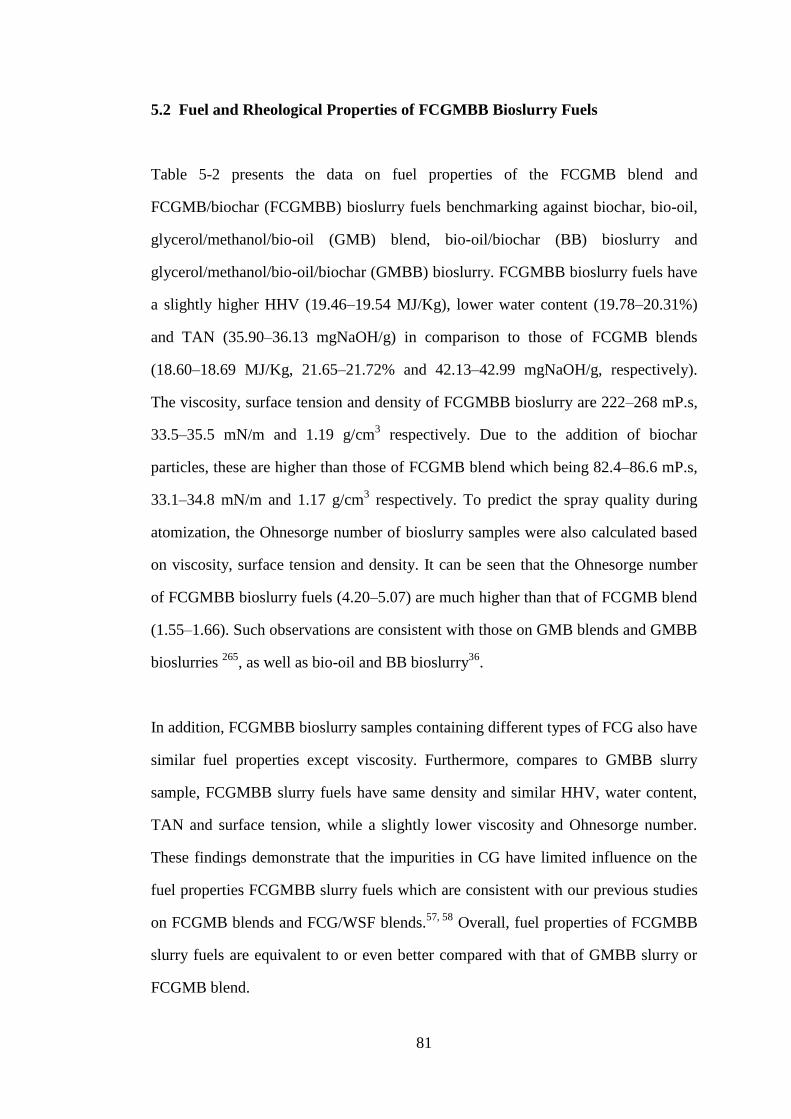
81
5.2 Fuel and Rheological Properties of FCGMBB Bioslurry Fuels
Table 5-2 presents the data on fuel properties of the FCGMB blend and
FCGMB/biochar (FCGMBB) bioslurry fuels benchmarking against biochar, bio-oil,
glycerol/methanol/bio-oil (GMB) blend, bio-oil/biochar (BB) bioslurry and
glycerol/methanol/bio-oil/biochar (GMBB) bioslurry. FCGMBB bioslurry fuels have
a slightly higher HHV (19.46–19.54 MJ/Kg), lower water content (19.78–20.31%)
and TAN (35.90–36.13 mgNaOH/g) in comparison to those of FCGMB blends
(18.60–18.69 MJ/Kg, 21.65–21.72% and 42.13–42.99 mgNaOH/g, respectively).
The viscosity, surface tension and density of FCGMBB bioslurry are 222–268 mP.s,
33.5–35.5 mN/m and 1.19 g/cm3 respectively. Due to the addition of biochar
particles, these are higher than those of FCGMB blend which being 82.4–86.6 mP.s,
33.1–34.8 mN/m and 1.17 g/cm3 respectively. To predict the spray quality during
atomization, the Ohnesorge number of bioslurry samples were also calculated based
on viscosity, surface tension and density. It can be seen that the Ohnesorge number
of FCGMBB bioslurry fuels (4.20–5.07) are much higher than that of FCGMB blend
(1.55–1.66). Such observations are consistent with those on GMB blends and GMBB
bioslurries 265
, as well as bio-oil and BB bioslurry36
.
In addition, FCGMBB bioslurry samples containing different types of FCG also have
similar fuel properties except viscosity. Furthermore, compares to GMBB slurry
sample, FCGMBB slurry fuels have same density and similar HHV, water content,
TAN and surface tension, while a slightly lower viscosity and Ohnesorge number.
These findings demonstrate that the impurities in CG have limited influence on the
fuel properties FCGMBB slurry fuels which are consistent with our previous studies
on FCGMB blends and FCG/WSF blends.57, 58
Overall, fuel properties of FCGMBB
slurry fuels are equivalent to or even better compared with that of GMBB slurry or
FCGMB blend.
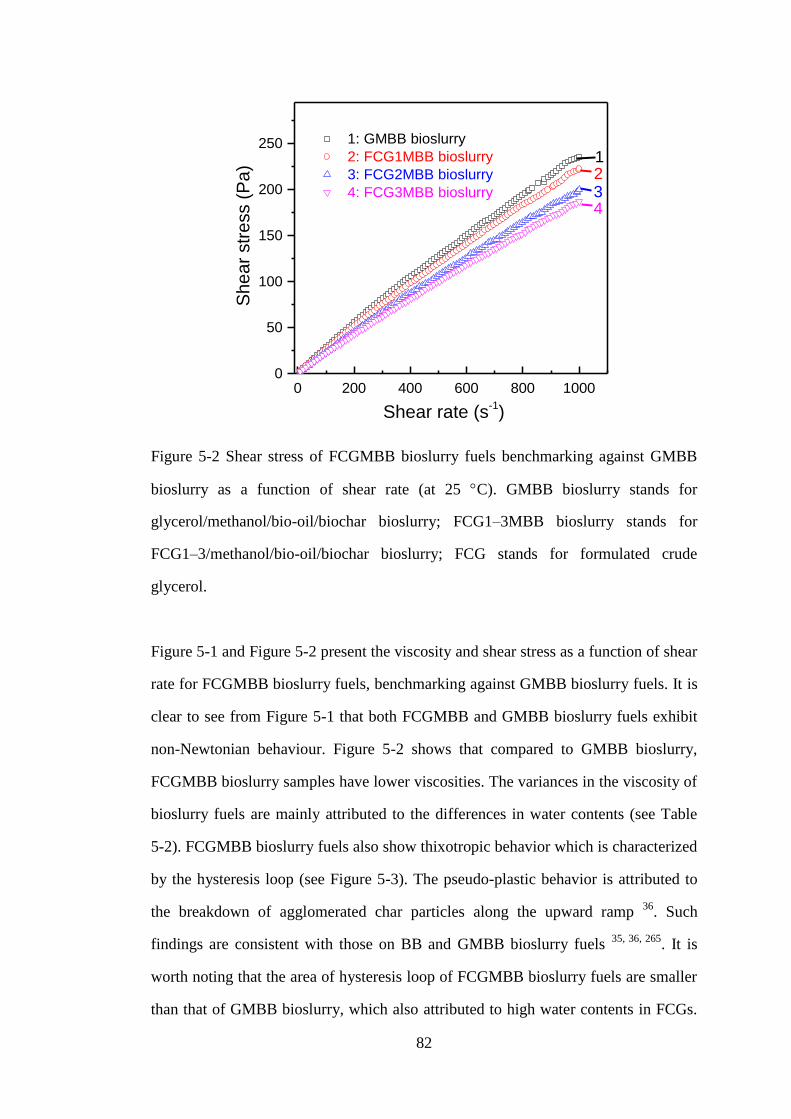
82
Figure 5-2 Shear stress of FCGMBB bioslurry fuels benchmarking against GMBB
bioslurry as a function of shear rate (at 25 C). GMBB bioslurry stands for
glycerol/methanol/bio-oil/biochar bioslurry; FCG1–3MBB bioslurry stands for
FCG1–3/methanol/bio-oil/biochar bioslurry; FCG stands for formulated crude
glycerol.
Figure 5-1 and Figure 5-2 present the viscosity and shear stress as a function of shear
rate for FCGMBB bioslurry fuels, benchmarking against GMBB bioslurry fuels. It is
clear to see from Figure 5-1 that both FCGMBB and GMBB bioslurry fuels exhibit
non-Newtonian behaviour. Figure 5-2 shows that compared to GMBB bioslurry,
FCGMBB bioslurry samples have lower viscosities. The variances in the viscosity of
bioslurry fuels are mainly attributed to the differences in water contents (see Table
5-2). FCGMBB bioslurry fuels also show thixotropic behavior which is characterized
by the hysteresis loop (see Figure 5-3). The pseudo-plastic behavior is attributed to
the breakdown of agglomerated char particles along the upward ramp 36
. Such
findings are consistent with those on BB and GMBB bioslurry fuels 35, 36, 265
. It is
worth noting that the area of hysteresis loop of FCGMBB bioslurry fuels are smaller
than that of GMBB bioslurry, which also attributed to high water contents in FCGs.
0 200 400 600 800 10000
50
100
150
200
250
Shear rate (s-1)
Sh
ea
r str
ess (
Pa
)
1: GMBB bioslurry
2: FCG1MBB bioslurry
3: FCG2MBB bioslurry
4: FCG3MBB bioslurry
1234
83
Overall, the FCGMBB bioslurry fuels have better rheological properties than the
GMBB bioslurry fuel.
Figure 5-3 Thixotropic behavior (c) of FCGMBB bioslurry fuels benchmarking
against GMBB bioslurry as a function of shear rate (at 25 C). GMBB bioslurry
stands for glycerol/methanol/bio-oil/biochar bioslurry; FCG1–3MBB bioslurry
stands for FCG1–3/methanol/bio-oil/biochar bioslurry; FCG stands for formulated
crude glycerol.
0 200 400 600 800 1000
0
50
100
150
200
250
Shear rate (s-1)
Sh
ea
r str
ess (
Pa
) 1: GMBB bioslurry
2: FCG1MBB bioslurry
3: FCG2MBB bioslurry
4: FCG3MBB bioslurry
1234
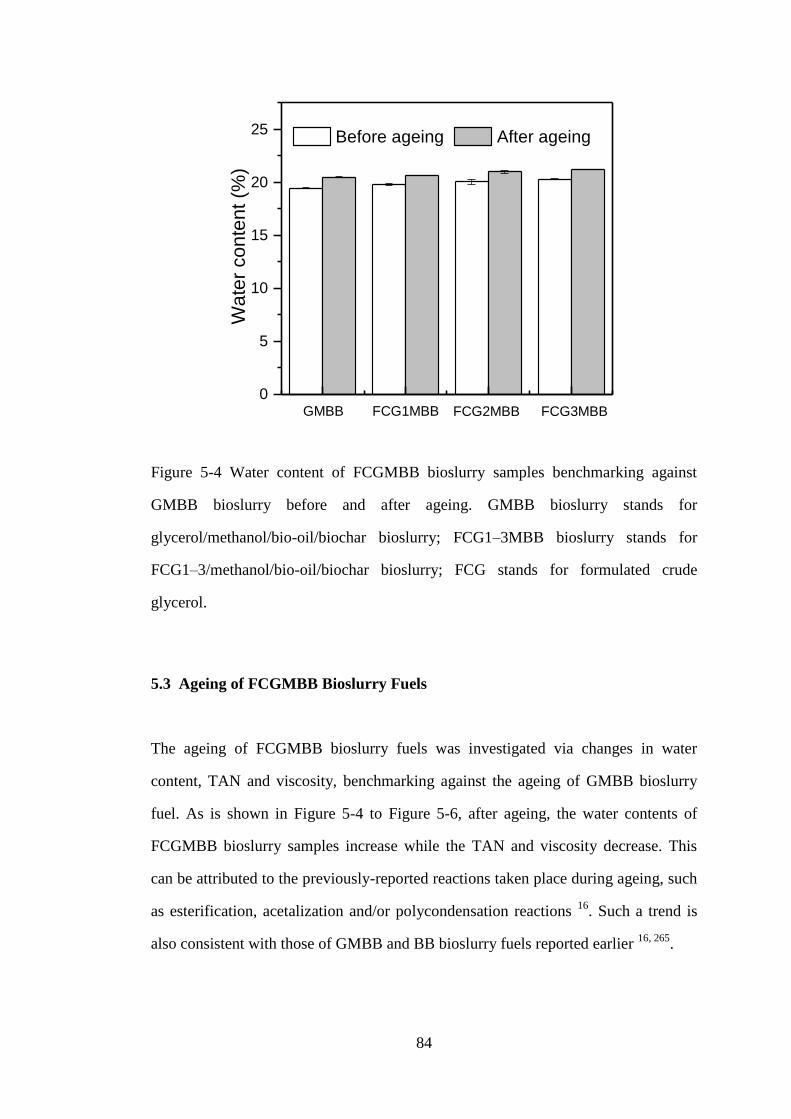
84
Figure 5-4 Water content of FCGMBB bioslurry samples benchmarking against
GMBB bioslurry before and after ageing. GMBB bioslurry stands for
glycerol/methanol/bio-oil/biochar bioslurry; FCG1–3MBB bioslurry stands for
FCG1–3/methanol/bio-oil/biochar bioslurry; FCG stands for formulated crude
glycerol.
5.3 Ageing of FCGMBB Bioslurry Fuels
The ageing of FCGMBB bioslurry fuels was investigated via changes in water
content, TAN and viscosity, benchmarking against the ageing of GMBB bioslurry
fuel. As is shown in Figure 5-4 to Figure 5-6, after ageing, the water contents of
FCGMBB bioslurry samples increase while the TAN and viscosity decrease. This
can be attributed to the previously-reported reactions taken place during ageing, such
as esterification, acetalization and/or polycondensation reactions 16
. Such a trend is
also consistent with those of GMBB and BB bioslurry fuels reported earlier 16, 265
.
0
5
10
15
20
25
Before ageing After ageing
Wa
ter
co
nte
nt (%
)
FCG2MBB FCG3MBBFCG1MBBGMBB
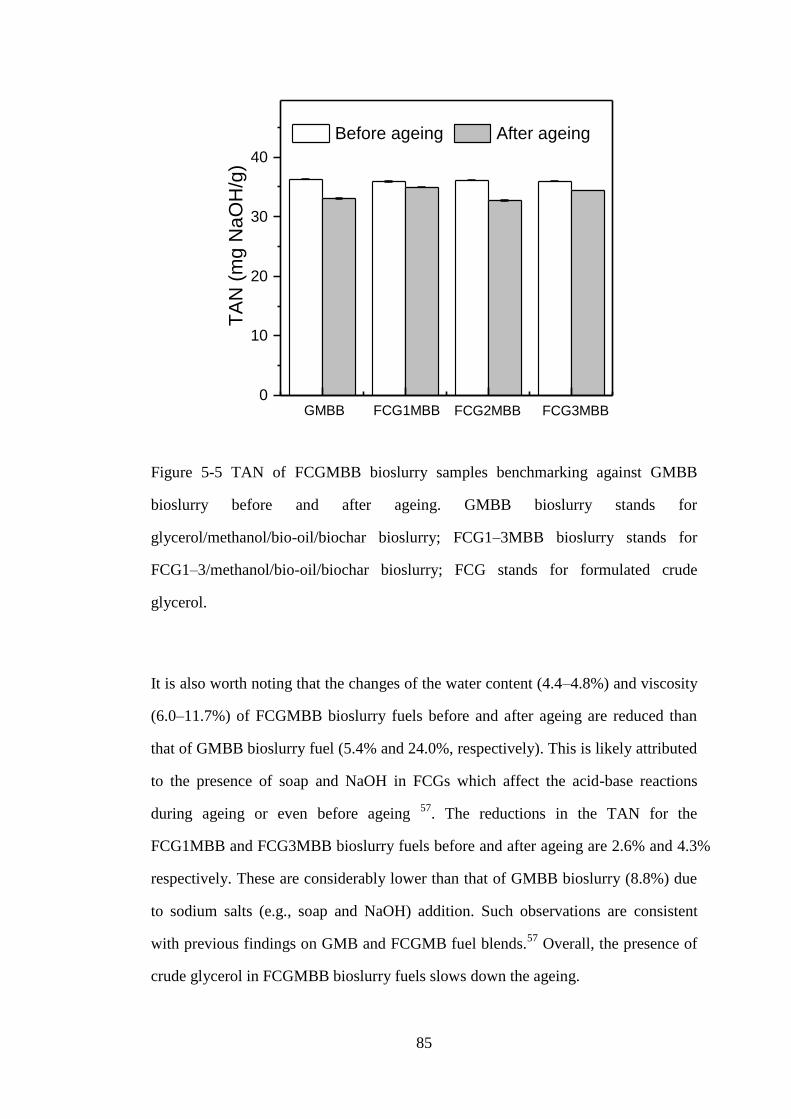
85
Figure 5-5 TAN of FCGMBB bioslurry samples benchmarking against GMBB
bioslurry before and after ageing. GMBB bioslurry stands for
glycerol/methanol/bio-oil/biochar bioslurry; FCG1–3MBB bioslurry stands for
FCG1–3/methanol/bio-oil/biochar bioslurry; FCG stands for formulated crude
glycerol.
It is also worth noting that the changes of the water content (4.4–4.8%) and viscosity
(6.0–11.7%) of FCGMBB bioslurry fuels before and after ageing are reduced than
that of GMBB bioslurry fuel (5.4% and 24.0%, respectively). This is likely attributed
to the presence of soap and NaOH in FCGs which affect the acid-base reactions
during ageing or even before ageing 57
. The reductions in the TAN for the
FCG1MBB and FCG3MBB bioslurry fuels before and after ageing are 2.6% and 4.3%
respectively. These are considerably lower than that of GMBB bioslurry (8.8%) due
to sodium salts (e.g., soap and NaOH) addition. Such observations are consistent
with previous findings on GMB and FCGMB fuel blends.57
Overall, the presence of
crude glycerol in FCGMBB bioslurry fuels slows down the ageing.
0
10
20
30
40
Before ageing After ageing
TA
N (
mg
Na
OH
/g)
FCG2MBB FCG3MBBFCG1MBBGMBB
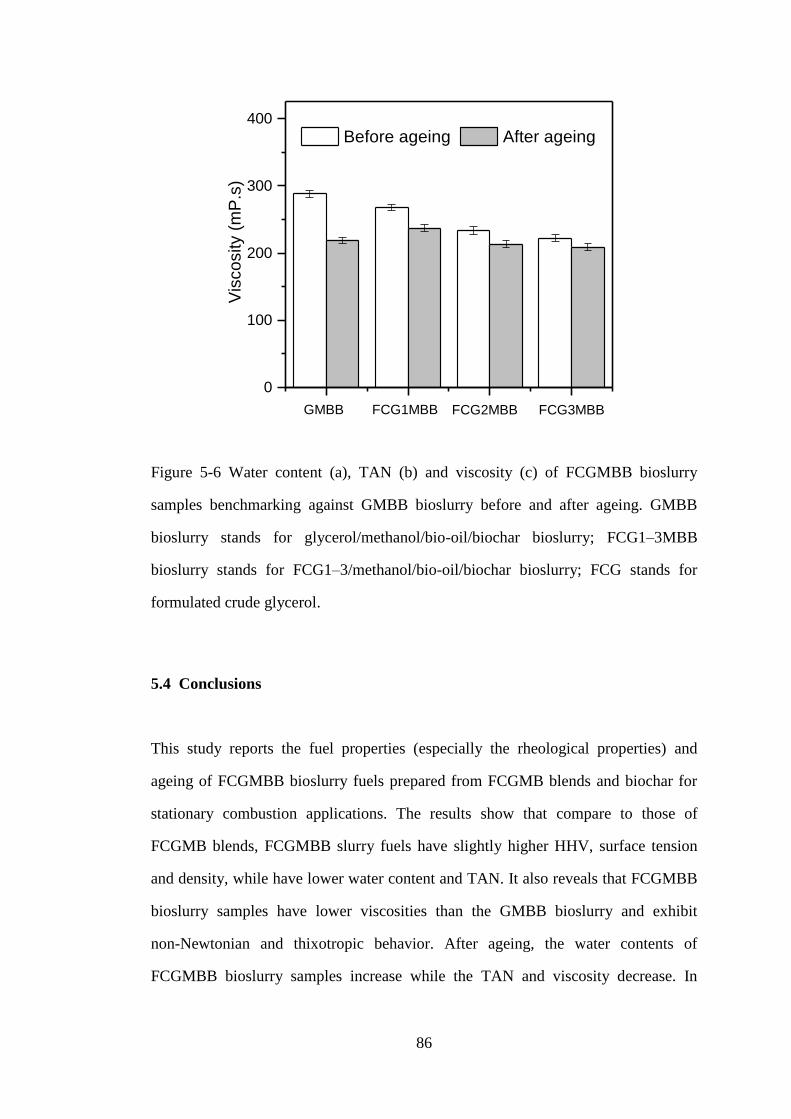
86
Figure 5-6 Water content (a), TAN (b) and viscosity (c) of FCGMBB bioslurry
samples benchmarking against GMBB bioslurry before and after ageing. GMBB
bioslurry stands for glycerol/methanol/bio-oil/biochar bioslurry; FCG1–3MBB
bioslurry stands for FCG1–3/methanol/bio-oil/biochar bioslurry; FCG stands for
formulated crude glycerol.
5.4 Conclusions
This study reports the fuel properties (especially the rheological properties) and
ageing of FCGMBB bioslurry fuels prepared from FCGMB blends and biochar for
stationary combustion applications. The results show that compare to those of
FCGMB blends, FCGMBB slurry fuels have slightly higher HHV, surface tension
and density, while have lower water content and TAN. It also reveals that FCGMBB
bioslurry samples have lower viscosities than the GMBB bioslurry and exhibit
non-Newtonian and thixotropic behavior. After ageing, the water contents of
FCGMBB bioslurry samples increase while the TAN and viscosity decrease. In
0
100
200
300
400
Before ageing After ageing
FCG2MBB FCG3MBBFCG1MBBGMBB
Vis
co
sity (
mP
.s)

87
comparison to the GMBB bioslurry fuel, the ageing of FCGMBB bioslurry fuels
slows down due to the presence of soap and NaOH in crude glycerol.

88
Chapter 6 Ignition Temperatures of Various Bio-oil Based Fuel Blends and
Slurry Fuels
6.1 Introduction
Utilisation of crude glycerol is challenging but of critical importance to the economic
and environmental performance of biodiesel production plants 51, 54, 57, 58, 214
. Recent
studies 16, 34, 57, 58, 60, 265
indicated that crude glycerol can be mixed with fast pyrolysis
bio-oil or its water soluble fraction (WSF), with or without the introduction of fine
biochar particles, to prepare new classes of bio-oil-based fuel blends or slurry fuels.
The reported fuel properties of these fuel blends or slurry fuels meet the
specifications on various aspects for stationary applications (e.g., combustion in
boilers) 58, 60, 265
. Ignition behaviour is an important consideration for safety during
fuel storage and transport as well as combustion performance during applications 167
.
The glycerol was reported to have an ignition temperature of 370 C 56, 261
. However,
little is known on the ignition behaviour of the fuel blends and slurry fuels prepared
from bio-oil (or bio-oil WSF) and glycerol, with or without biochar addition.
Therefore, the objective of this study is to investigate the ignition temperatures of
these bio-oil-based fuel blends or slurry fuels. The ignition temperature was
determined via two methods, ie. thermogravimetric analysis (TGA)171
and an
ASTM-based method modified from ASTM standard E659.

89
Table 6-1 Compositions of different types of formulated crude glycerol samples for
use in this study (wt %).
6.2 Ignition Temperatures of Biochar, Bio-oil and Bio-oil Based Fuel Blends
and Slurry Fuels Measured by TGA Method
Table 6-1 shows the compositions of different types of CG used in this study.
CG1–3 are used to prepare CG/methanol/bio-oil (hereafter referred to as CGMB)
blends while CG4–6 are used to prepare CG/WSF (hereafter referred to as CGWSF)
blends. CG7 and CG8 were also prepared to study the effect of sodium salts. Table
6-2 demonstrates the fuel properties of bio-oil, bio-oil WSF and biochar used in this
study.
Crude glycerol Glycerol Soap Water NaOH NaCl Methanol
CG1 83.3 10.4 4.2 2.1
CG2 81.2 14.6 4.2
CG3 66.7 10.4 20.8 2.1
CG4 80.0 10.0 4.0 2.0 4.0
CG5 78.0 14.0 4.0 4.0
CG6 64.0 10.0 20.0 2.0 4.0
CG7 76.2 23.8
CG8 72.7 22.7 4.6
CG: crude glycerol;
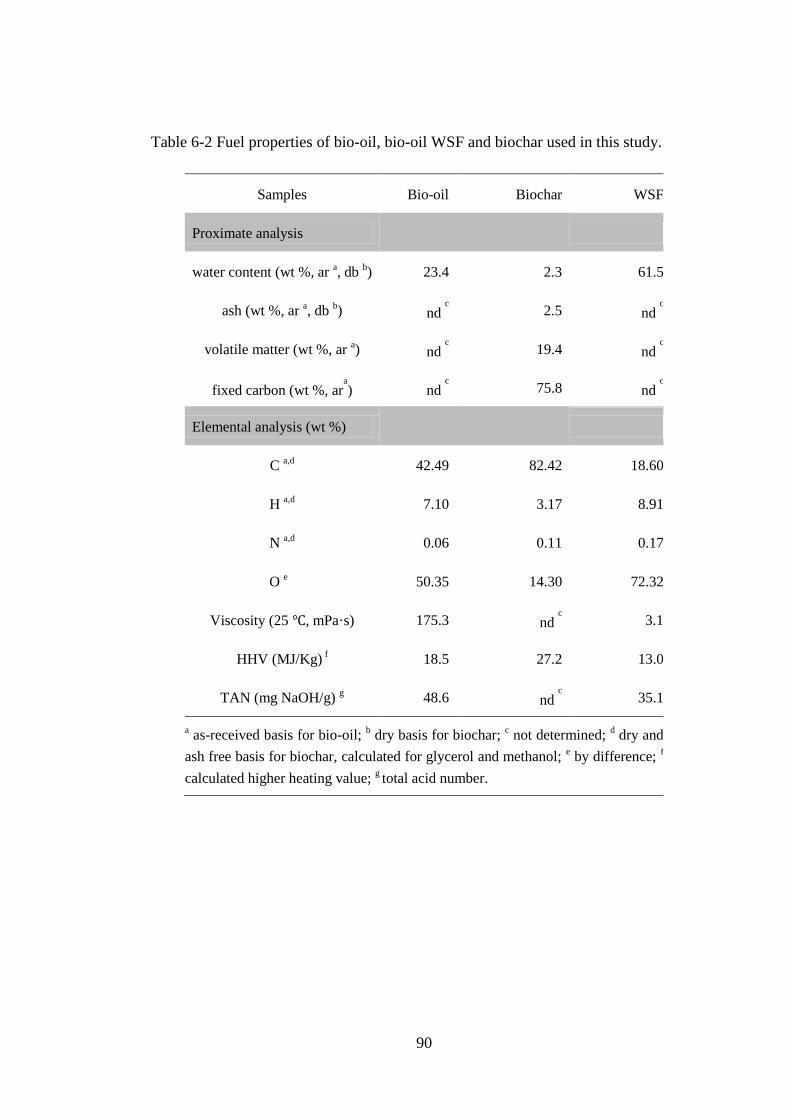
90
Table 6-2 Fuel properties of bio-oil, bio-oil WSF and biochar used in this study.
Samples Bio-oil Biochar WSF
Proximate analysis
water content (wt %, ar a, db
b) 23.4 2.3 61.5
ash (wt %, ar a, db
b) nd
c
2.5 nd c
volatile matter (wt %, ar a) nd
c
19.4 nd c
fixed carbon (wt %, ara
) nd c
75.8 nd c
Elemental analysis (wt %)
C a,d 42.49 82.42 18.60
H a,d 7.10 3.17 8.91
N a,d 0.06 0.11 0.17
O e 50.35 14.30 72.32
Viscosity (25 ℃, mPa·s) 175.3 nd c
3.1
HHV (MJ/Kg) f 18.5 27.2 13.0
TAN (mg NaOH/g) g 48.6 nd
c
35.1
a as-received basis for bio-oil;
b dry basis for biochar;
c not determined;
d dry and
ash free basis for biochar, calculated for glycerol and methanol; e by difference;
f
calculated higher heating value; g total acid number.
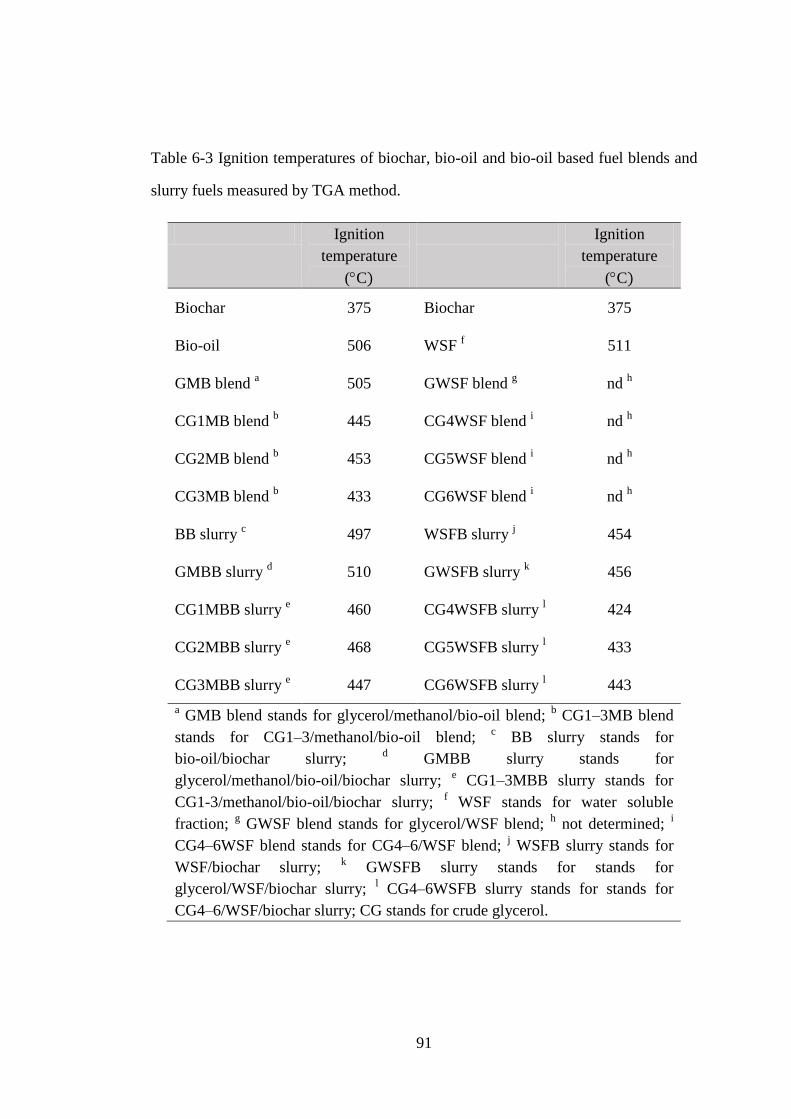
91
Table 6-3 Ignition temperatures of biochar, bio-oil and bio-oil based fuel blends and
slurry fuels measured by TGA method.
Ignition
temperature
(C)
Ignition
temperature
(C)
Biochar 375 Biochar 375
Bio-oil 506 WSF f 511
GMB blend a 505 GWSF blend
g nd
h
CG1MB blend b 445 CG4WSF blend
i nd
h
CG2MB blend b 453 CG5WSF blend
i nd
h
CG3MB blend b 433 CG6WSF blend
i nd
h
BB slurry c 497 WSFB slurry
j 454
GMBB slurry d 510 GWSFB slurry
k 456
CG1MBB slurry e 460 CG4WSFB slurry
l 424
CG2MBB slurry e 468 CG5WSFB slurry
l 433
CG3MBB slurry e 447 CG6WSFB slurry
l 443
a GMB blend stands for glycerol/methanol/bio-oil blend;
b CG1–3MB blend
stands for CG1–3/methanol/bio-oil blend; c BB slurry stands for
bio-oil/biochar slurry; d GMBB slurry stands for
glycerol/methanol/bio-oil/biochar slurry; e CG1–3MBB slurry stands for
CG1-3/methanol/bio-oil/biochar slurry; f WSF stands for water soluble
fraction; g GWSF blend stands for glycerol/WSF blend;
h not determined;
i
CG4–6WSF blend stands for CG4–6/WSF blend; j WSFB slurry stands for
WSF/biochar slurry; k GWSFB slurry stands for stands for
glycerol/WSF/biochar slurry; l CG4–6WSFB slurry stands for stands for
CG4–6/WSF/biochar slurry; CG stands for crude glycerol.

92
Table 6-3 shows the ignition temperatures of the bio-oil based blend and slurry fuels
measured by TGA method. First, the results show that bio-oil or WSF alone has high
ignition temperature being 506 and 511 C, respectively. The difficulty in the
ignition of bio-oil or WSF is likely due to the formation of carbonaceous solid by
cracking reactions at high temperature (such residue solid is known to be hard to
ignite 243
). The slightly higher ignition temperature of WSF in comparison to bio-oil
can be attribute to the negative effect of higher water content in WSF.
Second, ignition temperatures of the slurry fuels containing CG are lower compared
to those slurries with only bio-oil, WSF or glycerol. For example, CGMB/biochar
(CGMBB) slurry fuels have ignition temperatures in a range of 445–470 C while
bio-oil/biochar (hereafter referred to as BB) and glycerol/methanol/bio-oil/biochar
(hereafter referred to as GMBB) slurry ignited at 497 and 510 C, respectively.
Third, the ignition temperatures of CGWSF/biochar (CGWSFB) slurry fuels
(424–445 C) tested by TGA method are lower than that of glycerol/WSF/biochar
(GWSFB) slurry (456 C). This is attributed to the presence of sodium salt in CGs
which may has catalytic effect on ignition. It was known that inorganic species
decreases the ignition temperatures of solid fuels 266
. To prove this point for these
liquid/slurry fuels, further experiments were undertaken to measure the ignition
temperatures of fuels prepared from CGs without sodium salts. It was found that the
ignition temperatures are 502 and 469 C for CG7MBB slurry and CG8WSFB slurry,
respectively. Such ignition temperatures are considerably higher than the
corresponding fuels prepared from CGs with sodium salts, i.e. 447 and 443 C for
CG3MBB slurry and CG6WSFB slurry, respectively.
Last, GMBB or CGMBB slurry fuels demonstrate higher ignition temperatures
compared with their corresponding blends. Although biochar has an ignition
93
temperature of 375 C, lower than that of the GMB or CGMB blends, the addition of
biochar has increased the ignition temperature. This is probably due to the
evaporation of some fuel components during TGA analysis before ignition takes
place, resulting in less volatile and more carbonaceous solid (due to the interactions
between bio-oil components and biochar 16, 34, 265
). In the cases of CGWSF and
GWSF blend fuels, these blends have very high weight losses (over 80%, caused by
the evaporation of volatile components) in the temperature range of 35–300 C so
that the ignition temperatures cannot even be determined by the TGA method. This
suggests the limitation of the TGA method that effectively measures the ignition
temperature of the solid residue after at least some evaporation.
6.3 Ignition Temperature of Selected Bio-oil Based Fuels Tested by
ASTM-based Method and TGA Method
Consequently, selected fuel samples were subjected to external analysis of ignition
temperature using an ASTM-based method, with the results presented in Figure 6-1
that also include the results from the TGA method for benchmarking. The results
show that both CGMBB slurry and CGWSFB slurry fuels have higher ignition
temperatures than the corresponding blends. Such results are consistent with the
TGA results. In addition, the ignition temperature of WSF is much higher than the
WSF based blend and slurry fuels. Therefore, these results indicates the positive
effects of CG and/or biochar addition on WSF ignition.
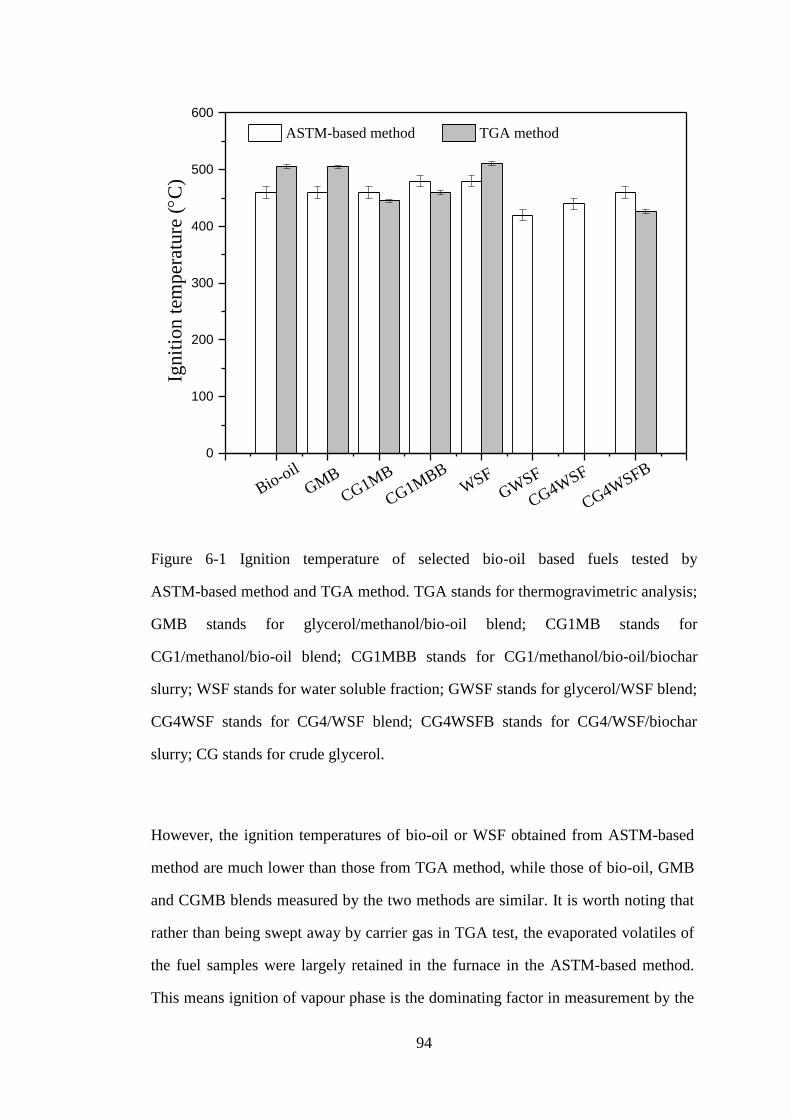
94
Figure 6-1 Ignition temperature of selected bio-oil based fuels tested by
ASTM-based method and TGA method. TGA stands for thermogravimetric analysis;
GMB stands for glycerol/methanol/bio-oil blend; CG1MB stands for
CG1/methanol/bio-oil blend; CG1MBB stands for CG1/methanol/bio-oil/biochar
slurry; WSF stands for water soluble fraction; GWSF stands for glycerol/WSF blend;
CG4WSF stands for CG4/WSF blend; CG4WSFB stands for CG4/WSF/biochar
slurry; CG stands for crude glycerol.
However, the ignition temperatures of bio-oil or WSF obtained from ASTM-based
method are much lower than those from TGA method, while those of bio-oil, GMB
and CGMB blends measured by the two methods are similar. It is worth noting that
rather than being swept away by carrier gas in TGA test, the evaporated volatiles of
the fuel samples were largely retained in the furnace in the ASTM-based method.
This means ignition of vapour phase is the dominating factor in measurement by the
0
100
200
300
400
500
600
CG4WSF
CG4WSFB
GWSF
WSF
CG1MBB
CG1MBGMB
Bio-oil
Ign
itio
n t
emp
erat
ure
(C
)
ASTM-based method TGA method
95
ASTM-based method, while TGA method is more emphasized on ignition of the
solid residue after evaporation. The high ignition temperature of WSF compared to
that of the bio-oil tested by the ASTM-based method indicates the negative effect of
water on vapour phase ignition. The significant reductions in ignition temperatures
of the GWSF or CGWSF blends compared to that of WSF tested by ASTM-based
method are also likely due to the significant decrease in water content of the blends.
The ASTM-based method is applicable for determining ignition temperatures of
volatile fuels but is time consuming and labour intensive especially when increasing
temperature in small intervals to observe ignition. Conversely, TGA method is easy
to operate and the accuracy of ignition temperature measurement is within 3 C.
Although emphasising more on ignition of the solid residue, the TGA method can
provide information on evaporation profile and comparison of the ignition difficulty
of different samples. Combining the information given by these two methods, it can
be concluded that glycerol or crude glycerol at high proportion in CGWSF based
fuels can significantly improve the ignition behaviour in vapour phase. The results
further suggest that biochar and salts in CG can affect the ignition temperatures via
changing the compositions of vapour and solid residue or introducing catalytic effect.
Compared with bio-oil or WSF alone as liquid fuels or together with biochar as
slurry fuels, addition of crude glycerol into these fuels produce blends or slurries
with better ignition property.
6.4 Conclusion
This study reports the ignition temperature of a series of bio-oil based fuel blends
and slurry fuels by two methods. The results show that bio-oil has a high ignition
temperature because the formed carbonaceous solid is hard to decompose. Sodium
salt in CGs have positive effect on bio-oil based fuels ignition while water have

96
negative effect. Biochar has a very low ignition temperature, however, slurry fuels
have higher ignition temperature than their corresponding blends, and the possible
reason is less volatile and more carbonaceous solid were formed during combustion.
The two methods have different emphasis, the ASTM-based method emphasized on
ignition of vapour phase while TGA method more emphasized on ignition of the
solid residue after evaporation.
97
Chapter 7 Differential Scanning Calorimetry Studies on the Cold Flow
Properties of Fuel Mixtures from Bio-oil, Crude Glycerol, Methanol and/or
Biochar
7.1 Introduction
Biodiesel can be used as a liquid fuel or mixed with other fuels in various
applications.25, 79, 267
The rapid-growing biodiesel industry produces a large surplus
of glycerol as by-product in the market.54, 214, 268
Utilisation of crude glycerol is a key
concern for the industry’s economic and environmental performance54, 268, 269
and
direct utilization of crude glycerol is highly desired. One attractive option16, 34, 57, 58, 60,
265 is to mix crude glycerol with fast pyrolysis bio-oil, methanol and/or biochar to
prepare bio-oil based fuel mixtures for stationary combustion applications (e.g.,
combustion in boilers). It was reported that these mixtures have fuel properties that
are equivalent to or even better than that of bio-oil, including heating value, surface
tension, density, total acid number (TAN), viscosity, and water content.34, 57, 58, 60
Under cold climate conditions, cold flow property is an important consideration of a
fuel42, 173
because problematic solidification or even partial solidification may take
place during fuel handling, operation and transport.165, 166
However, the cold flow
property of these bio-oil based fuel mixtures is seldom reported in the open literature.
Furthermore, evaluating cold flow properties of bio-oil via conventional parameters
(e.g., cloud point and pour point41, 181, 267
) is known to be laborious and time
consuming especially when testing pour point which need to preheat samples (which
may also lead to water separation on sample’s surface).41
It is even difficult to
observe the cloud point of bio-oil due to its dark colour.127, 270
Fortunately, cold
flow properties can be associated with the melting point of each fuel component and
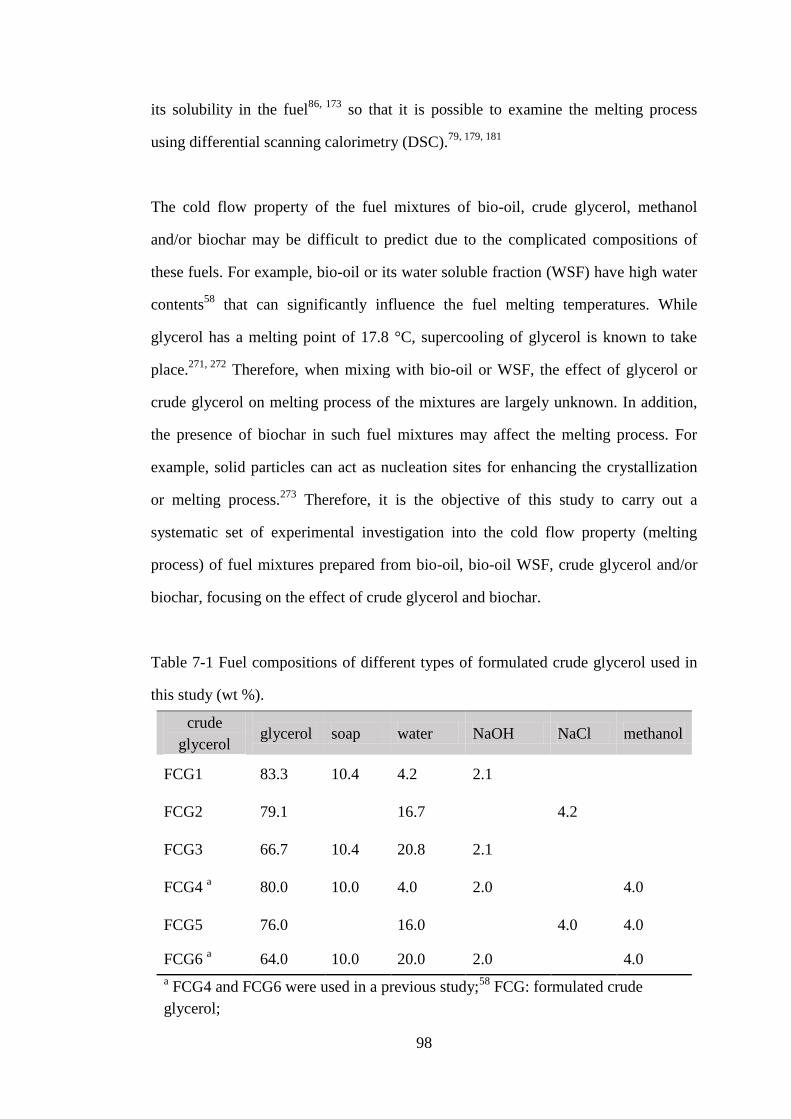
98
its solubility in the fuel86, 173
so that it is possible to examine the melting process
using differential scanning calorimetry (DSC).79, 179, 181
The cold flow property of the fuel mixtures of bio-oil, crude glycerol, methanol
and/or biochar may be difficult to predict due to the complicated compositions of
these fuels. For example, bio-oil or its water soluble fraction (WSF) have high water
contents58
that can significantly influence the fuel melting temperatures. While
glycerol has a melting point of 17.8 °C, supercooling of glycerol is known to take
place.271, 272
Therefore, when mixing with bio-oil or WSF, the effect of glycerol or
crude glycerol on melting process of the mixtures are largely unknown. In addition,
the presence of biochar in such fuel mixtures may affect the melting process. For
example, solid particles can act as nucleation sites for enhancing the crystallization
or melting process.273
Therefore, it is the objective of this study to carry out a
systematic set of experimental investigation into the cold flow property (melting
process) of fuel mixtures prepared from bio-oil, bio-oil WSF, crude glycerol and/or
biochar, focusing on the effect of crude glycerol and biochar.
Table 7-1 Fuel compositions of different types of formulated crude glycerol used in
this study (wt %).
crude
glycerol glycerol soap water NaOH NaCl methanol
FCG1 83.3 10.4 4.2 2.1
FCG2 79.1 16.7 4.2
FCG3 66.7 10.4 20.8 2.1
FCG4 a 80.0 10.0 4.0 2.0 4.0
FCG5 76.0 16.0 4.0 4.0
FCG6 a 64.0 10.0 20.0 2.0 4.0
a FCG4 and FCG6 were used in a previous study;
58 FCG: formulated crude
glycerol;
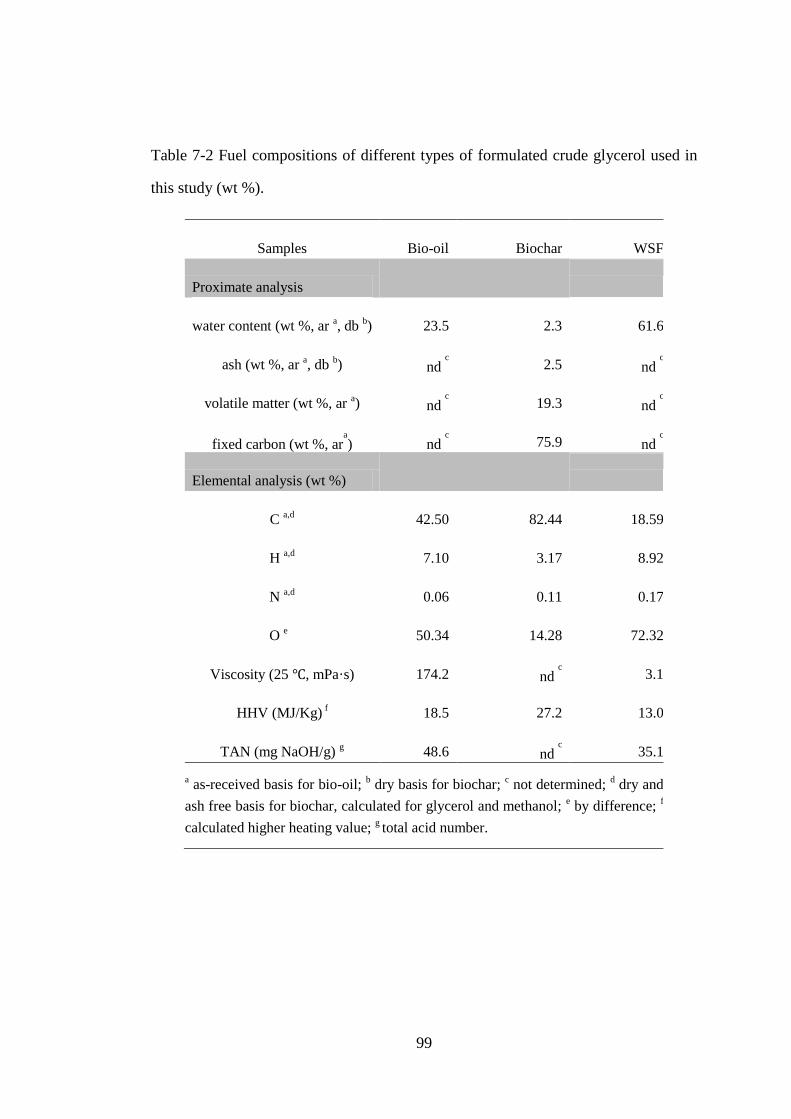
99
Table 7-2 Fuel compositions of different types of formulated crude glycerol used in
this study (wt %).
Samples Bio-oil Biochar WSF
Proximate analysis
water content (wt %, ar a, db
b) 23.5 2.3 61.6
ash (wt %, ar a, db
b) nd
c
2.5 nd c
volatile matter (wt %, ar a) nd
c
19.3 nd c
fixed carbon (wt %, ara
) nd c
75.9 nd c
Elemental analysis (wt %)
C a,d 42.50 82.44 18.59
H a,d 7.10 3.17 8.92
N a,d 0.06 0.11 0.17
O e 50.34 14.28 72.32
Viscosity (25 ℃, mPa·s) 174.2 nd c
3.1
HHV (MJ/Kg) f 18.5 27.2 13.0
TAN (mg NaOH/g) g 48.6 nd
c
35.1
a as-received basis for bio-oil;
b dry basis for biochar;
c not determined;
d dry and
ash free basis for biochar, calculated for glycerol and methanol; e by difference;
f
calculated higher heating value; g total acid number.
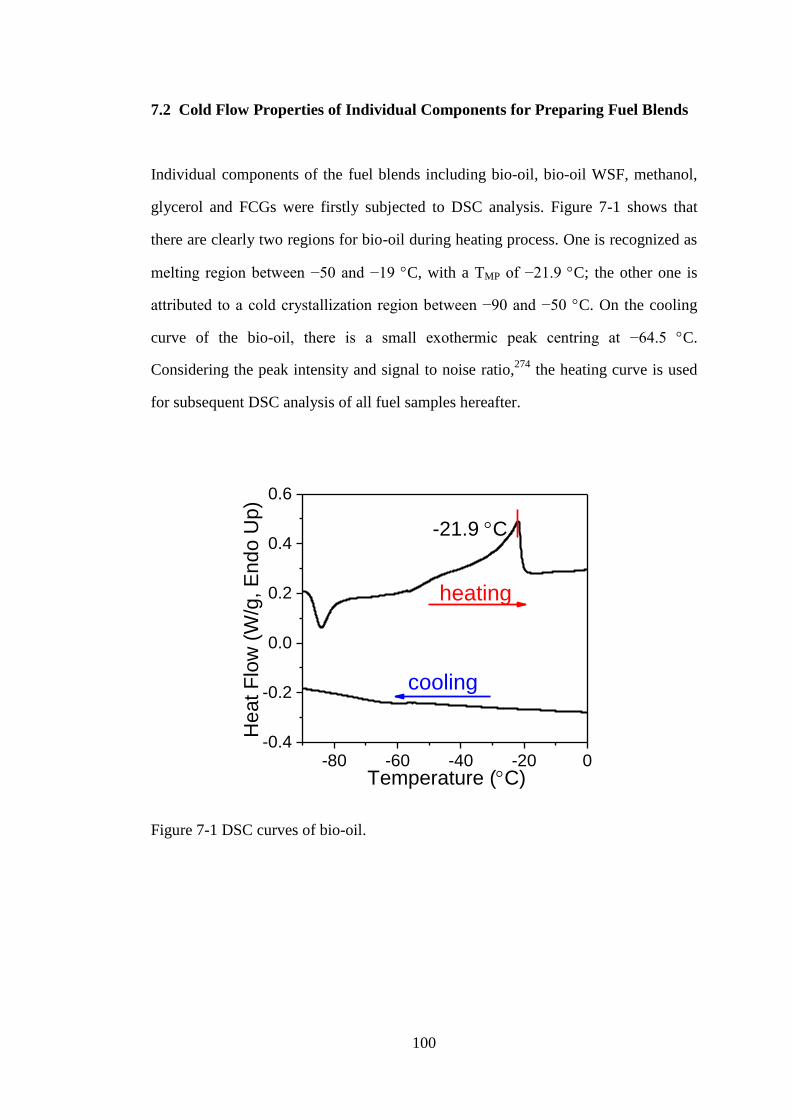
100
7.2 Cold Flow Properties of Individual Components for Preparing Fuel Blends
Individual components of the fuel blends including bio-oil, bio-oil WSF, methanol,
glycerol and FCGs were firstly subjected to DSC analysis. Figure 7-1 shows that
there are clearly two regions for bio-oil during heating process. One is recognized as
melting region between −50 and −19 C, with a TMP of −21.9 C; the other one is
attributed to a cold crystallization region between −90 and −50 C. On the cooling
curve of the bio-oil, there is a small exothermic peak centring at −64.5 C.
Considering the peak intensity and signal to noise ratio,274
the heating curve is used
for subsequent DSC analysis of all fuel samples hereafter.
Figure 7-1 DSC curves of bio-oil.
-80 -60 -40 -20 0-0.4
-0.2
0.0
0.2
0.4
0.6
He
at
Flo
w (
W/g
, E
nd
o U
p)
-21.9 C
Temperature (C)
heating
cooling

101
Figure 7-2 DSC curves of (a) WSF and (b) methanol.
Figure 7-2a shows that bio-oil WSF has a TMP at −8.7 C which is considerably
higher than that of bio-oil, most likely due to the much higher water content of WSF
(61.6%) than that of the bio-oil (23.5%, see Table 7-2). Such high TMP foresees
issues associated with direct application of WSF under cold weather conditions. As
to glycerol or FCGs, no peak was found most likely due to supercooling of
glycerol261, 271
. For methanol, the DSC curve (see Figure 7-2b) is similar to those
reported in literature239
, and the melting temperature of methanol obtained in this
study is −99.5 C which is in good agreement with reported value (−97.6 C).
-80 -60 -40 -20 0 200.0
0.5
1.0
1.5
2.0
-140 -120 -100 -80 -600
4
8
12
-8.7 C
Heat F
low
(W
/g, E
ndo U
p)
Temperature (C)
(a) WSF
(b) Methanol
Heat F
low
(W
/g, E
ndo U
p)
Temperature (C)
-99.5 C
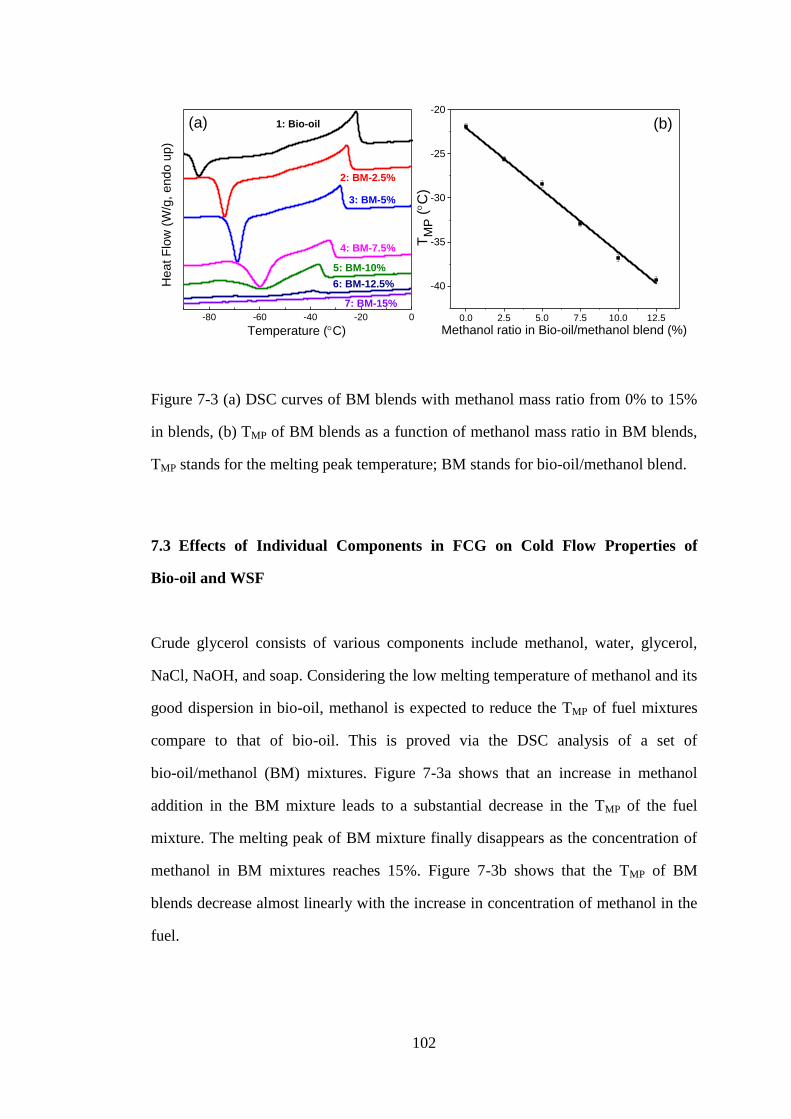
102
Figure 7-3 (a) DSC curves of BM blends with methanol mass ratio from 0% to 15%
in blends, (b) TMP of BM blends as a function of methanol mass ratio in BM blends,
TMP stands for the melting peak temperature; BM stands for bio-oil/methanol blend.
7.3 Effects of Individual Components in FCG on Cold Flow Properties of
Bio-oil and WSF
Crude glycerol consists of various components include methanol, water, glycerol,
NaCl, NaOH, and soap. Considering the low melting temperature of methanol and its
good dispersion in bio-oil, methanol is expected to reduce the TMP of fuel mixtures
compare to that of bio-oil. This is proved via the DSC analysis of a set of
bio-oil/methanol (BM) mixtures. Figure 7-3a shows that an increase in methanol
addition in the BM mixture leads to a substantial decrease in the TMP of the fuel
mixture. The melting peak of BM mixture finally disappears as the concentration of
methanol in BM mixtures reaches 15%. Figure 7-3b shows that the TMP of BM
blends decrease almost linearly with the increase in concentration of methanol in the
fuel.
-80 -60 -40 -20 0 0.0 2.5 5.0 7.5 10.0 12.5
-40
-35
-30
-25
-20
Temperature (C)
Heat F
low
(W
/g,
en
do u
p)
(a)
7: BM-15%
6: BM-12.5%
5: BM-10%
4: BM-7.5%
3: BM-5%
2: BM-2.5%
1: Bio-oil
(b)
TM
P (C
)
Methanol ratio in Bio-oil/methanol blend (%)
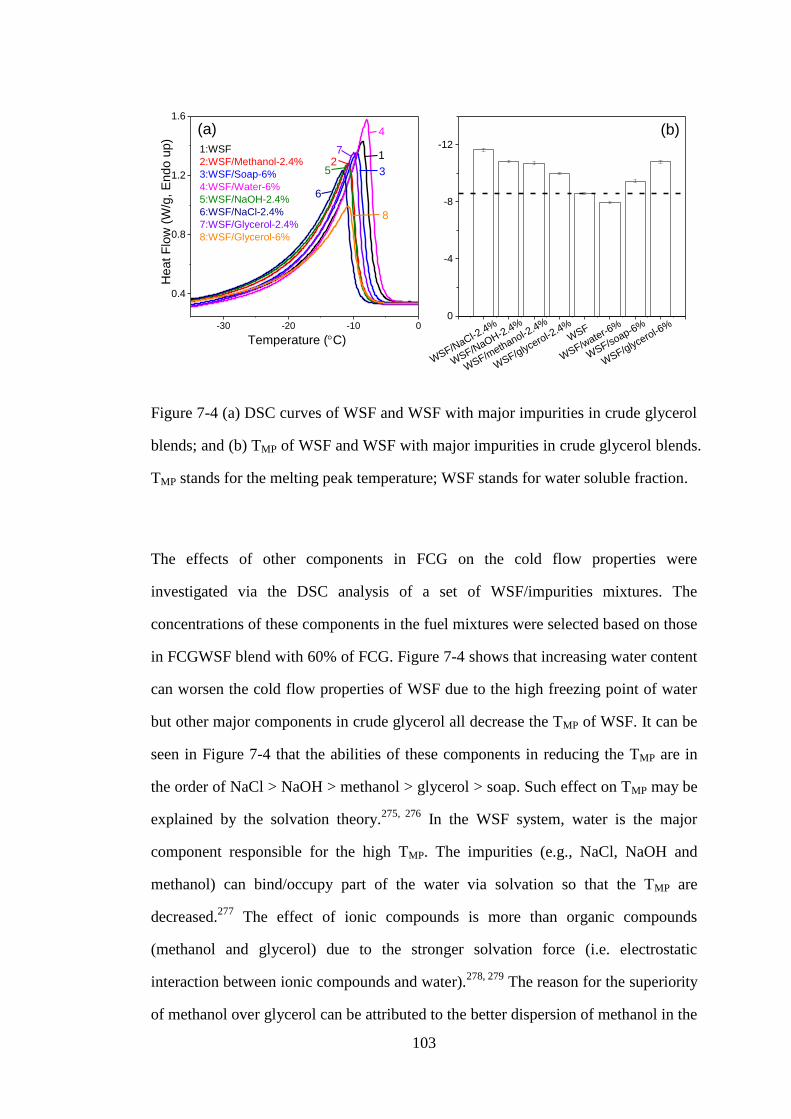
103
Figure 7-4 (a) DSC curves of WSF and WSF with major impurities in crude glycerol
blends; and (b) TMP of WSF and WSF with major impurities in crude glycerol blends.
TMP stands for the melting peak temperature; WSF stands for water soluble fraction.
The effects of other components in FCG on the cold flow properties were
investigated via the DSC analysis of a set of WSF/impurities mixtures. The
concentrations of these components in the fuel mixtures were selected based on those
in FCGWSF blend with 60% of FCG. Figure 7-4 shows that increasing water content
can worsen the cold flow properties of WSF due to the high freezing point of water
but other major components in crude glycerol all decrease the TMP of WSF. It can be
seen in Figure 7-4 that the abilities of these components in reducing the TMP are in
the order of NaCl > NaOH > methanol > glycerol > soap. Such effect on TMP may be
explained by the solvation theory.275, 276
In the WSF system, water is the major
component responsible for the high TMP. The impurities (e.g., NaCl, NaOH and
methanol) can bind/occupy part of the water via solvation so that the TMP are
decreased.277
The effect of ionic compounds is more than organic compounds
(methanol and glycerol) due to the stronger solvation force (i.e. electrostatic
interaction between ionic compounds and water).278, 279
The reason for the superiority
of methanol over glycerol can be attributed to the better dispersion of methanol in the
-30 -20 -10 0
0.4
0.8
1.2
1.6
(a)
Temperature (C)
Heat F
low
(W
/g, E
ndo u
p)
1:WSF
2:WSF/Methanol-2.4%
3:WSF/Soap-6%
4:WSF/Water-6%
5:WSF/NaOH-2.4%
6:WSF/NaCl-2.4%
7:WSF/Glycerol-2.4%
8:WSF/Glycerol-6%
5
4
32
1
6
7
8
0
-4
-8
-12
(b)
WSF/glycerol-6
%
WSF/soap-6%
WSF/N
aCl-2.4%
WSF/N
aOH-2.4%
WSF/m
ethanol-2.4%
WSF/glycerol-2
.4%
WSF/w
ater-6%
WSF
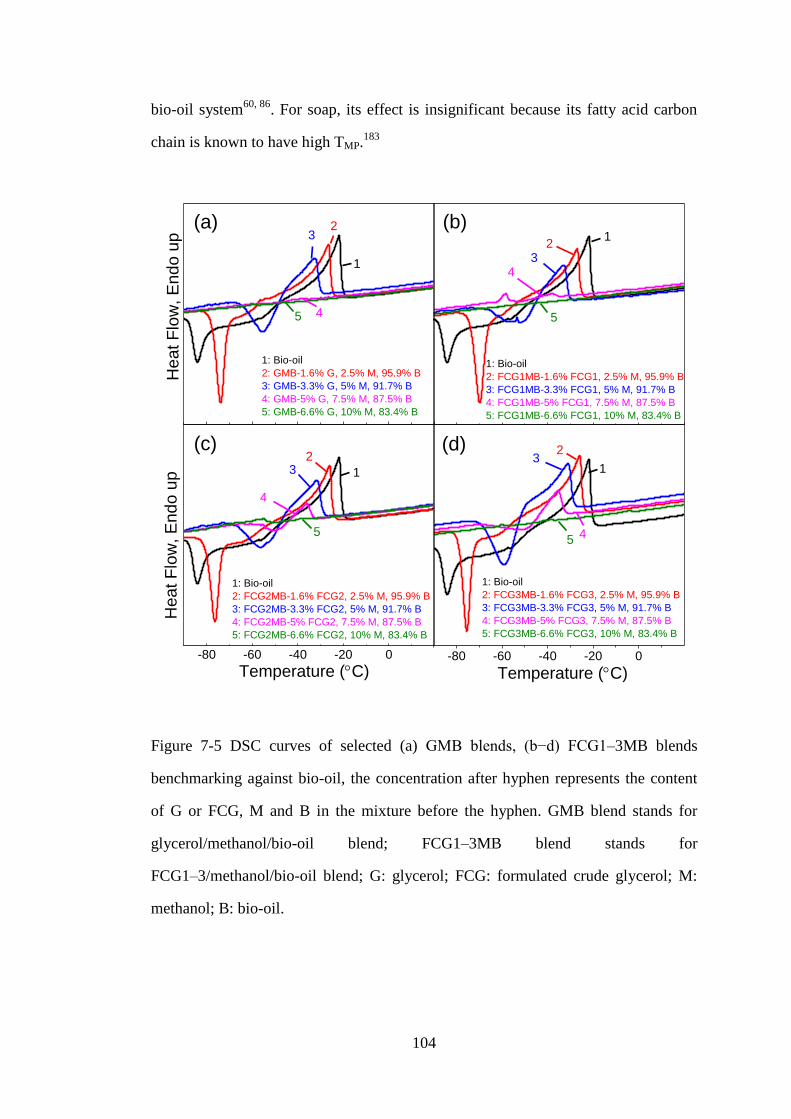
104
bio-oil system60, 86
. For soap, its effect is insignificant because its fatty acid carbon
chain is known to have high TMP.183
Figure 7-5 DSC curves of selected (a) GMB blends, (b−d) FCG1–3MB blends
benchmarking against bio-oil, the concentration after hyphen represents the content
of G or FCG, M and B in the mixture before the hyphen. GMB blend stands for
glycerol/methanol/bio-oil blend; FCG1–3MB blend stands for
FCG1–3/methanol/bio-oil blend; G: glycerol; FCG: formulated crude glycerol; M:
methanol; B: bio-oil.
-80 -60 -40 -20 0 -80 -60 -40 -20 0
1: Bio-oil
2: GMB-1.6% G, 2.5% M, 95.9% B
3: GMB-3.3% G, 5% M, 91.7% B
4: GMB-5% G, 7.5% M, 87.5% B
5: GMB-6.6% G, 10% M, 83.4% B
H
eat F
low
, E
nd
o u
p
(a)
Heat F
low
, E
nd
o u
p 32
1
45
(b)
5
1: Bio-oil
2: FCG1MB-1.6% FCG1, 2.5% M, 95.9% B
3: FCG1MB-3.3% FCG1, 5% M, 91.7% B
4: FCG1MB-5% FCG1, 7.5% M, 87.5% B
5: FCG1MB-6.6% FCG1, 10% M, 83.4% B
43
21
3
(c)
1: Bio-oil
2: FCG2MB-1.6% FCG2, 2.5% M, 95.9% B
3: FCG2MB-3.3% FCG2, 5% M, 91.7% B
4: FCG2MB-5% FCG2, 7.5% M, 87.5% B
5: FCG2MB-6.6% FCG2, 10% M, 83.4% B
2
1
5
4
(d)
1: Bio-oil
2: FCG3MB-1.6% FCG3, 2.5% M, 95.9% B
3: FCG3MB-3.3% FCG3, 5% M, 91.7% B
4: FCG3MB-5% FCG3, 7.5% M, 87.5% B
5: FCG3MB-6.6% FCG3, 10% M, 83.4% B
32
1
45
Temperature (C)
Temperature (C)
105
7.4 Cold Flow Properties of FCGMB Fuel Blends Prepared From FCG,
Methanol and Bio-oil
Figure 7-5 shows that the cold flow properties of FCGMB blends benchmarking with
the glycerol/methanol/bio-oil (GMB) blend. As the addition of FCG1−3 and
methanol into the fuel blend increase, there is a significant shift of the TMP to a lower
temperature region. The melting peak virtually disappears when the contents of
FCGs and methanol have been increased to 6.6% and 10%, respectively. For the
GMB blends with the absence of impurities, the melting peak disappears at even
lower glycerol or methanol concentrations (5% and 7.5%, respectively). This proves
that not only methanol but also glycerol/FCGs indeed can improve the cold flow
properties of such bio-oil based fuel mixtures, and also suggests that the improve
extent of glycerol is higher than FCGs.
To further investigate the influence of FCG or glycerol, methanol concentration was
kept constant at 5% while increasing the FCG or glycerol ratio in the mixture as is
shown in Figure 7-6. With increasing amount (up to 3%, based on detailed discussion
on solubility of FCGs in FCGMB system previously57, 60
) of glycerol and FCG1−3,
the TMP of the mixtures become lower (from −28.3 to −31.7, −31.2, −30.5 and −29.6
C for BM5-G and BM5-FCG1–3 respectively). In addition, the TMP of BM5-G and
BM5-FCG blends with same concentration of G/FCGs follows the trend of BM5-G <
BM5-FCG1 < BM5-FCG2 < BM5-FCG3, as is shown in figure 7-7. This indicates
the influence on TMP decrease follows the sequence of glycerol > FCG1 > FCG2 >
FCG3. The observed difference in the effect of glycerol and FCGs can be mainly
attributed to the effect of water that is presented in the FCGs. Because of the
negative effect of water on cold flow properties (see section 7.2), glycerol has a
better performance than FCGs in decreasing the TMP of the fuel blends. For the same
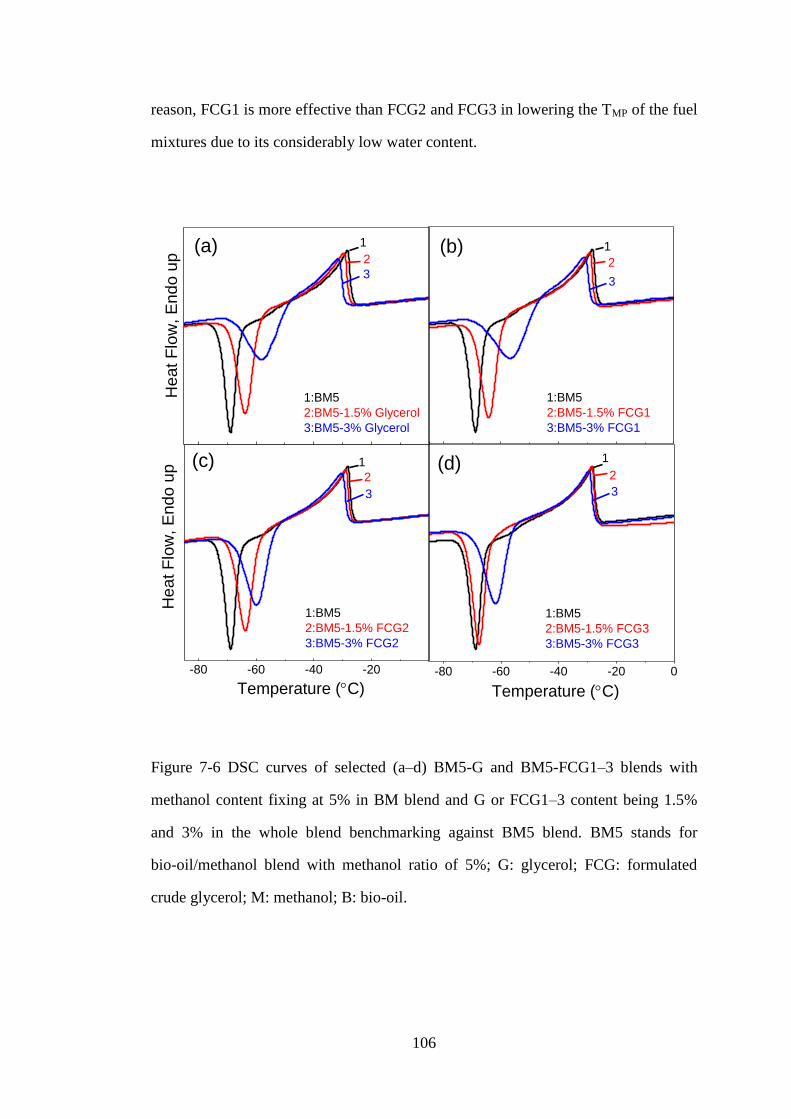
106
reason, FCG1 is more effective than FCG2 and FCG3 in lowering the TMP of the fuel
mixtures due to its considerably low water content.
Figure 7-6 DSC curves of selected (a–d) BM5-G and BM5-FCG1–3 blends with
methanol content fixing at 5% in BM blend and G or FCG1–3 content being 1.5%
and 3% in the whole blend benchmarking against BM5 blend. BM5 stands for
bio-oil/methanol blend with methanol ratio of 5%; G: glycerol; FCG: formulated
crude glycerol; M: methanol; B: bio-oil.
-80 -60 -40 -20 -80 -60 -40 -20 0
He
at F
low
, E
nd
o u
pH
ea
t F
low
, E
nd
o u
p
(a) 1
1:BM5
2:BM5-1.5% Glycerol
3:BM5-3% Glycerol
3
2
(b)
1:BM5
2:BM5-1.5% FCG1
3:BM5-3% FCG1
3
2
1
(c)
1:BM5
2:BM5-1.5% FCG2
3:BM5-3% FCG2
3
2
1
Temperature (C)
(d)
1:BM5
2:BM5-1.5% FCG3
3:BM5-3% FCG3
Temperature (C)
3
2
1
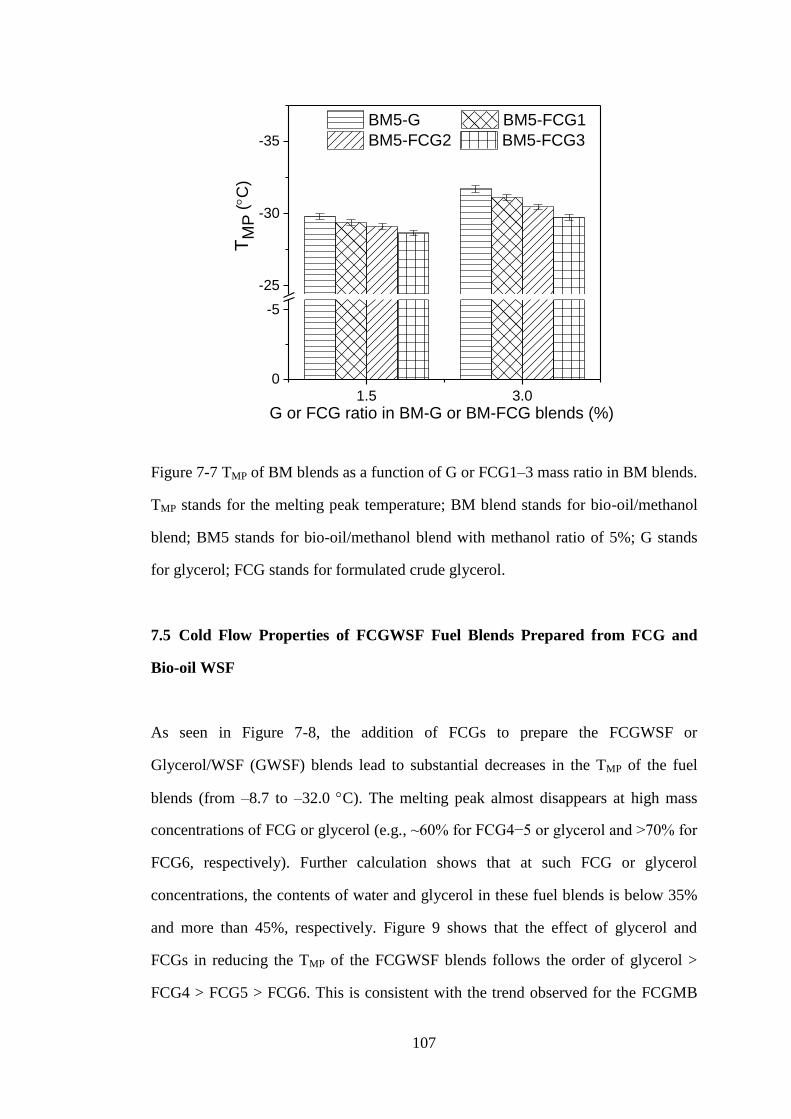
107
Figure 7-7 TMP of BM blends as a function of G or FCG1–3 mass ratio in BM blends.
TMP stands for the melting peak temperature; BM blend stands for bio-oil/methanol
blend; BM5 stands for bio-oil/methanol blend with methanol ratio of 5%; G stands
for glycerol; FCG stands for formulated crude glycerol.
7.5 Cold Flow Properties of FCGWSF Fuel Blends Prepared from FCG and
Bio-oil WSF
As seen in Figure 7-8, the addition of FCGs to prepare the FCGWSF or
Glycerol/WSF (GWSF) blends lead to substantial decreases in the TMP of the fuel
blends (from –8.7 to –32.0 C). The melting peak almost disappears at high mass
concentrations of FCG or glycerol (e.g., ~60% for FCG4−5 or glycerol and >70% for
FCG6, respectively). Further calculation shows that at such FCG or glycerol
concentrations, the contents of water and glycerol in these fuel blends is below 35%
and more than 45%, respectively. Figure 9 shows that the effect of glycerol and
FCGs in reducing the TMP of the FCGWSF blends follows the order of glycerol >
FCG4 > FCG5 > FCG6. This is consistent with the trend observed for the FCGMB
1.5 3.00
-5
-25
-30
-35
G or FCG ratio in BM-G or BM-FCG blends (%)
TM
P (C
)
BM5-G BM5-FCG1
BM5-FCG2 BM5-FCG3

108
system and the reason is the difference in water content of FCGs (see section 7.3).
Figure 7-8 also shows that the cold crystallization peak appears when the
concentrations of glycerol, FCG4 and FCG5 reach 40% or the concentration of
FCG6 reaches 60%.
Figure 7-8 DSC curves of (a–d) GWSF and (b–d) FCG4–6WSF blends with glycerol
or FCG4–6 ratio varying from 20% to 80%. GWSF stands for G/WSF blends;
FCG4–6WSF stands for FCG4–6WSF blends; G stands for glycerol; FCG stands for
formulated crude glycerol; WSF stands for water soluble fraction.
-80 -60 -40 -20 0 20 -80 -60 -40 -20 0 20
(a)
1:WSF
2:GWSF-20%
3:GWSF-40%
4:GWSF-60%
5:GWSF-80%
5
4
3
2
1
(b)
-80 -60 -40 -20 0 20
1:WSF
2:FCG4WSF-20%
3:FCG4WSF-40%
4:FCG4WSF-60%
4
3
2
1
He
at F
low
(W
/g, E
nd
o u
p) (c)
Temperature (C)Temperature (C)
He
at F
low
(W
/g, E
nd
o u
p)
1:WSF
2:FCG5WSF-20%
3:FCG5WSF-40%
4:FCG5WSF-60%
5:FCG5WSF-80%
3
2
1
5
4
(d)
-80 -60 -40 -20 0 20
1:WSF
2:FCG6WSF-20%
3:FCG6WSF-40%
4:FCG6WSF-60%
5:FCG6WSF-70%
1
2
3
4
5

109
The results clearly show that the additions of FCG or glycerol can substantially
improve cold flow properties of bio-oil based fuels. The approach of preparing
FCGWSF fuel blends from bio-oil WSF and crude glycerol is an attractive technical
option for crude glycerol utilisation due to the very high glycerol uptake and
favourable cold flow properties. Furthermore, the results also demonstrate that water
plays an important role in influencing the TMP of the fuels. It should be noted that for
FCG4WSF with 60% FCG4 and FCG6WSF with 70% FCG6, there are small peaks
at around 7 C. These can be attributed to the formation of fatty acid esters due to the
reaction between fatty acids (formed from soap react with acids) and alcohols,58, 179,
181 leading to the FCG4WSF and FCG6WSF blend fuels being gel- or jelly-like
instead of clear solution when stored at 4 C.
Figure 7-9 TMP of GWSF and FCG4–6WSF blends as a function of G or FCG4–6
mass ratio in blends. TMP stands for the melting peak temperature; GWSF stands for
G/WSF blends; FCG4–6WSF stands for FCG4–6WSF blends; G stands for glycerol;
FCG stands for formulated crude glycerol; WSF stands for water soluble fraction.
20 40 600.0
-2.5
-20
-30
-40
TM
P (C
)
FCG or Glycerol ratio in blend (%)
GWSF FCG4WSF
FCG5WSF FCG6WSF
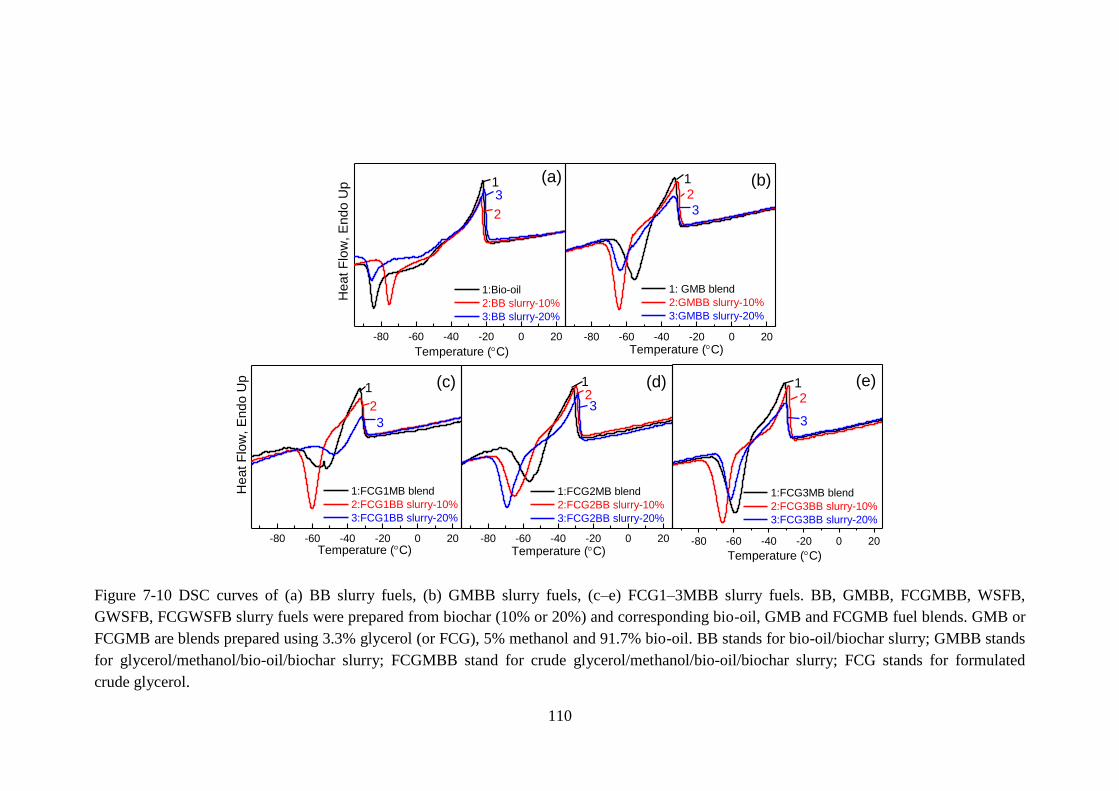
110
Figure 7-10 DSC curves of (a) BB slurry fuels, (b) GMBB slurry fuels, (c–e) FCG1–3MBB slurry fuels. BB, GMBB, FCGMBB, WSFB,
GWSFB, FCGWSFB slurry fuels were prepared from biochar (10% or 20%) and corresponding bio-oil, GMB and FCGMB fuel blends. GMB or
FCGMB are blends prepared using 3.3% glycerol (or FCG), 5% methanol and 91.7% bio-oil. BB stands for bio-oil/biochar slurry; GMBB stands
for glycerol/methanol/bio-oil/biochar slurry; FCGMBB stand for crude glycerol/methanol/bio-oil/biochar slurry; FCG stands for formulated
crude glycerol.
-80 -60 -40 -20 0 20 -80 -60 -40 -20 0 20
-80 -60 -40 -20 0 20 -80 -60 -40 -20 0 20 -80 -60 -40 -20 0 20
1:Bio-oil
2:BB slurry-10%
3:BB slurry-20%
(a)
3
2
1
He
at F
low
, E
nd
o U
p
Temperature (C)Temperature (C)
Temperature (C)Temperature (C)Temperature (C)
1: GMB blend
2:GMBB slurry-10%
3:GMBB slurry-20%
(b)
2
3
1
1:FCG1MB blend
2:FCG1BB slurry-10%
3:FCG1BB slurry-20%
(c)
He
at F
low
, E
nd
o U
p
2
3
1
1:FCG2MB blend
2:FCG2BB slurry-10%
3:FCG2BB slurry-20%
23
1 (d)
1:FCG3MB blend
2:FCG3BB slurry-10%
3:FCG3BB slurry-20%
(e)
2
3
1
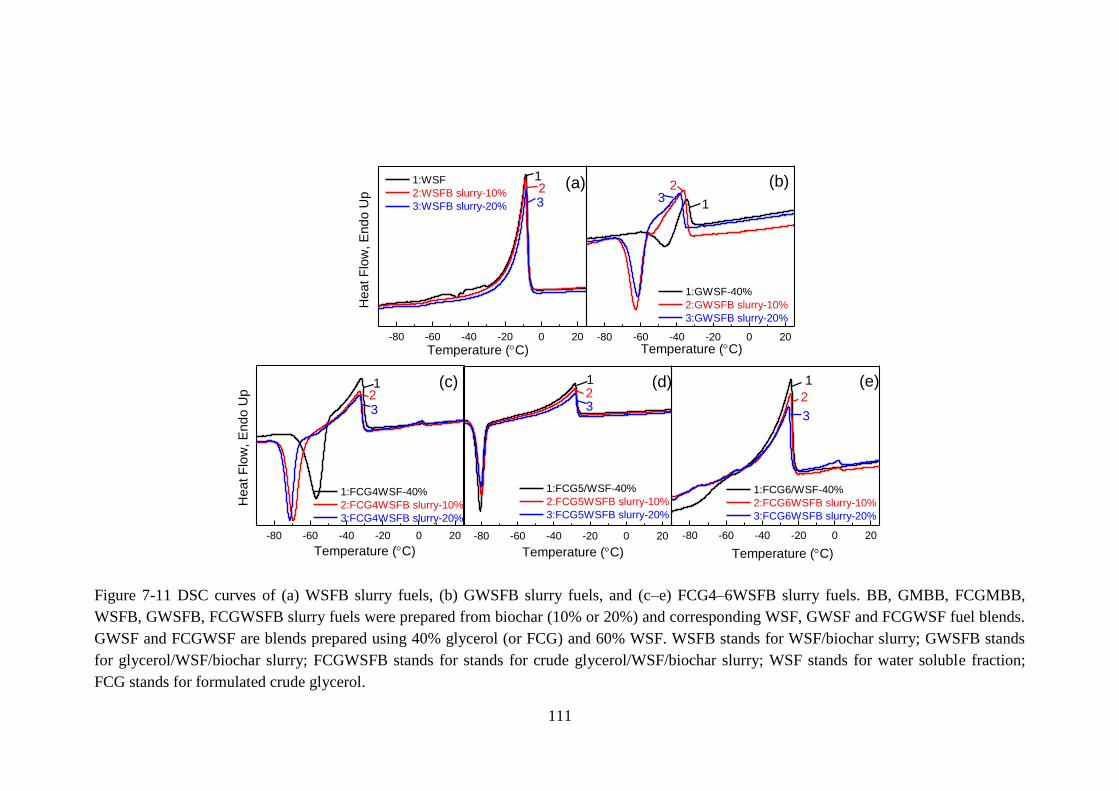
111
Figure 7-11 DSC curves of (a) WSFB slurry fuels, (b) GWSFB slurry fuels, and (c–e) FCG4–6WSFB slurry fuels. BB, GMBB, FCGMBB,
WSFB, GWSFB, FCGWSFB slurry fuels were prepared from biochar (10% or 20%) and corresponding WSF, GWSF and FCGWSF fuel blends.
GWSF and FCGWSF are blends prepared using 40% glycerol (or FCG) and 60% WSF. WSFB stands for WSF/biochar slurry; GWSFB stands
for glycerol/WSF/biochar slurry; FCGWSFB stands for stands for crude glycerol/WSF/biochar slurry; WSF stands for water soluble fraction;
FCG stands for formulated crude glycerol.
-80 -60 -40 -20 0 20 -80 -60 -40 -20 0 20
-80 -60 -40 -20 0 20 -80 -60 -40 -20 0 20 -80 -60 -40 -20 0 20
He
at F
low
, E
nd
o U
p
He
at F
low
, E
nd
o U
p
1:WSF
2:WSFB slurry-10%
3:WSFB slurry-20%
(a)
32
1
1:GWSF-40%
2:GWSFB slurry-10%
3:GWSFB slurry-20%
(b)
32
1
1:FCG4WSF-40%
2:FCG4WSFB slurry-10%
3:FCG4WSFB slurry-20%
(c)
321 (d)
321
1:FCG5/WSF-40%
2:FCG5WSFB slurry-10%
3:FCG5WSFB slurry-20%
Temperature (C)Temperature (C)
Temperature (C) Temperature (C)
3
2
1
Temperature (C)
(e)
1:FCG6/WSF-40%
2:FCG6WSFB slurry-10%
3:FCG6WSFB slurry-20%

112
7.6 Cold Flow Properties of FCGMB/Biochar (FCGMBB) and
FCGWSF/Biochar (FCGWSFB) Slurry Fuels
Figure 7-10 presents the DSC curves for bioslurry fuels prepared from FCGMB or
FCGWSF blends with the additions of biochar. Even at 20% biochar loading level,
the TMP of the slurry fuels are still very similar to the respective blends, with very
slight increases (< 4 C). This means the presence of fine biochar particles in the fuel
mixtures has very little effect on the TMP of these bio-oil based fuels.
However, it appears that the cold crystallization peak can be affected by presence of
biochar. Figure 7-10 and Figure 7-11 show that the cold crystallization peaks of most
slurries studied shift to lower temperatures than those of the respective blends. In
addition, the presence of biochar particles in the fuel mixtures also shift the small
melting peaks at 7 C for FCG4WSF and FCG6WSF blends (see section 7.3) to ~2
C, with increased intensities. While the exact reasons are unknown at present, there
are two possible reasons for such an observation. One is that the biochar particles in
the fuel mixtures can act as nucleation agents for the crystallization of slurry fuels
hence enhancing this process. Similar observations were reported in a previous study
on the role of calcium carbonate (CaCO3) particles in the cold crystallization
behaviour of poly(ethylene terephthalate).273
The other is the possible changes in the
properties and compositions of bio-oil components in a bioslurry system, as a result
of interactions between bio-oil and biochar particles.16, 265
Nevertheless, the results
clearly show that FCG with low water content can produce bio-oil/FCG and
WSF/FCG blends with better cold flow properties. The results also show that with
the presence of biochar, FCG containing high content of soap (e.g., 10%) may cause
some solidification issues when mixing with WSF at a high concentration (above
40%) in the fuel mixture.
113
7.7 Conclusion
This study investigates the cold flow properties of various fuel mixtures from bio-oil,
crude glycerol, methanol and/or biochar by determine TMP using DSC. The results
show that bio-oil and WSF have a TMP of -21.9 and -8.7 C which may problematic
when direct utilization under cold weather conditions. The addition of FCG can
significantly improve cold flow properties of both FCGMB and FCGWSF fuel
blends, which can alleviate or even eliminate those issues. Except water that
increases the TMP, all other components in FCGs decrease the TMP due to the
solvation effect hence improve the cold flow properties of the fuel mixtures, with the
order of improvements of NaCl > NaOH > Methanol > Glycerol > Soap. Suspended
biochar particles in the slurry fuels have very limited effect on the cold flow
properties of slurry fuels. The presence of biochar particles only slightly affect the
solidification of FCGWSFB slurry fuels when the FCG has a high soap content (e.g.,
10%) and its loading level is over 40% in the slurry fuels.
114
Chapter 8 Bed Agglomeration during Bio-oil Fast Pyrolysis in a
Fluidised-Bed Reactor
8.1 Introduction
Biomass as a solid fuel has undesired properties such as low energy density, poor
grindability, bulky, fibrous and widely dispersed and is not suitable for long distance
transport.18, 19, 35, 36
Fast pyrolysis of biomass,5, 7, 9, 109, 280-282
as a thermochemical
technology, is an attractive approach to produce high-energy-density bio-oil which is
suitable for transport for centralised processing and biochar that can be applied
locally for soil amendment and carbon sequestration.4, 8, 14, 109, 283, 284
Depending on
the destination of bio-oil subsequent centralised applications, bio-oil may be
upgraded and/or refined for producing liquid transport fuels through further
thermochemical processing.
Fluidised-bed reactors are widely adopted in various thermochemical processing (e.g.,
pyrolysis, combustion and gasification) of various fuels due to its advantages in
isothermal operation condition, fuel flexibility and low operating temperature.13, 61, 64,
285-287 One key operational issue is bed agglomeration that may lead to defluidisation,
leading to detrimental effect on the durable operations of a fluidised-bed reactor.63, 65,
66, 73 It is noted that bed agglomeration during biomass combustion/gasification is
driven by ash species and has been extensively investigated.61, 63-66, 72, 73, 288
However,
as shown in a series of recent experimental studies by Wu et al.,67-71, 238
bed
agglomeration during biomass pyrolysis is completely different and driven by
organic matter that contains various aromatic-ring systems. Bio-oil, as a product of
biomass pyrolysis, is known to contain various aromatic compounds,58, 211, 218
and it
may be used as a direct feedstock in fluidised-bed for various thermochemical
processing. Therefore, it is plausible to investigate bed agglomeration phenomena
115
during bio-oil pyrolysis under various conditions. In addition, apart from aromatic
compounds, bio-oil also contains various other chemicals such as alcohols, ketones,
sugars, and carboxylic acids etc.4, 240
However, it is largely unknown if other
components in the bio-oil are also important and may play synergistic effect on bed
agglomeration during pyrolysis. Therefore, it is reasonable to further investigate the
fundamental mechanism responsible for bed agglomeration during bio-oil fast
pyrolysis in fluidised-bed reactor.
Therefore, this paper aims to systematically investigate bed agglomeration during the
pyrolysis of bio-oil in a fluidised-bed reactor at 500–800 C. In addition to bio-oil,
bio-oil fractions (water-soluble fraction or water-insoluble fraction) and model
compounds were also investigated to reveal the fundamental mechanisms responsible
for bed agglomeration.
Table 8-1 Fuel properties of bio-oil, bio-oil WSF and WIF used in this study.
Elemental analysis
(wt%)a
Water content Density Viscosity HHVd
Ca H
a N
a O
b wt%, ar
c
g/mL,
arc
mPa s, 25 ℃ MJ/kg
Bio-oil 55.90 5.92 0.09 38.09 23.50 1.20 178.4 18.64
WSFe 48.20 4.85 0.44 46.52 61.10 1.07 3.0 12.89
WIFf 66.13 6.74 0.07 27.06 nd
g 0.81 6.3 24.26
a dry basis;
b by difference;
c as-received basis;
d calculated HHV (higher heating
value); e water-soluble fraction;
f water-insoluble fraction in ethanol at a
concentration of 27.3%; g not determined.

116
Figure 8-1 Particle size distribution of the bed samples collected from the fast
pyrolysis of bio-oil in a fluidised-bed pyrolysis reactor at 500–800 C.
8.2 Evidence and Extent of Bed Agglomeration during Fast Pyrolysis of Bio-oil
in a Fluidised-Bed Reactor
Figure 8-1 presents the PSD of the bed samples collected after bio-oil fast pyrolysis
at 500–800 C. Because the silica sand particles as bed material have a size of
125−250 µm, any particles > 250 µm collected after pyrolysis can be safely
considered to bed agglomerates. Figure 8-1 shows that depending on pyrolysis
temperature, the bed agglomerates (i.e. the materials > 250 µm) contribute to 12.6 to
40.4% of the total mass of the bed samples. The bed agglomerates distributed in the
size fractions of 250−355 µm, 355−500 µm, 0.5−1.0 mm, 1.0–3.0 mm and > 3 mm
account for 3.5−12.1%, 1.3−6.2%, 0.6−5.9%, 0.3−4.4% and 6.9−13.0% of the total
bed agglomerates, respectively.
5
10
15
60
70
80
90
100
(1) 500 oC
(2) 600 oC
(3) 700 oC
(4) 800 oC
4
3
21
>3 mm
2-3 mm
1-2 mm
0.5-1 mm
355-500 m
250-355 m
125-250 m
Size fraction
Ma
ss in
siz
e f
ractio
n,
wt
% d
b
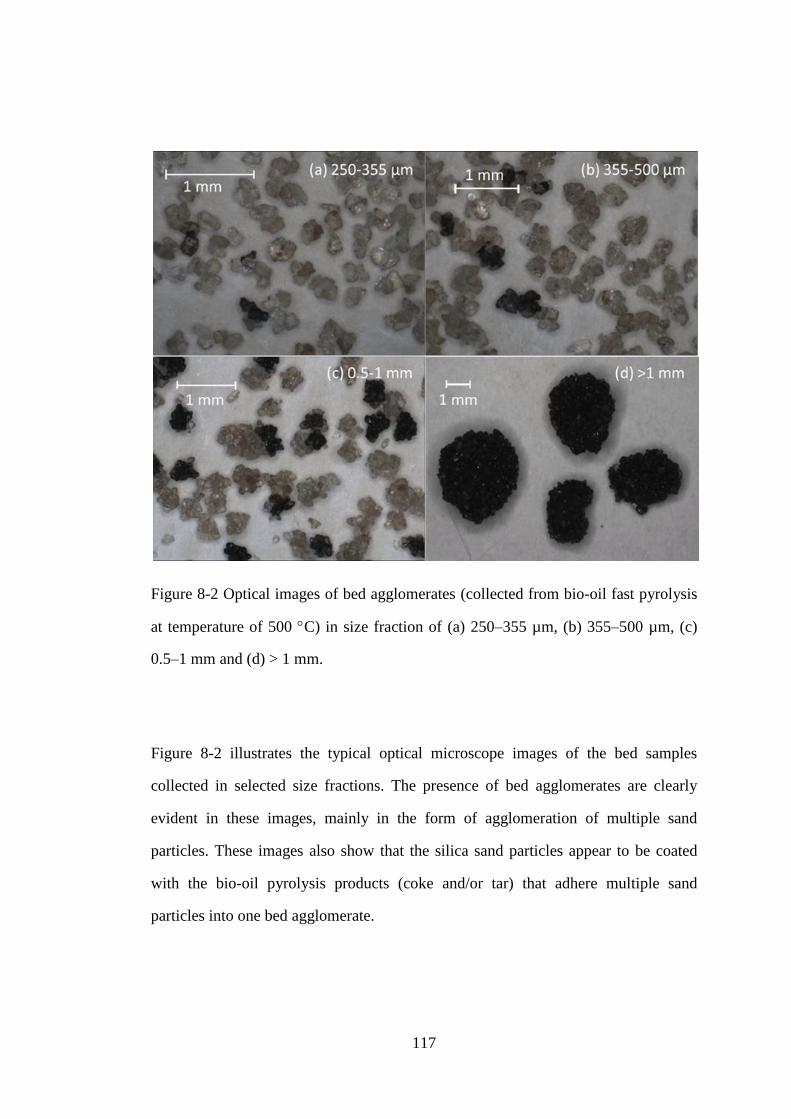
117
Figure 8-2 Optical images of bed agglomerates (collected from bio-oil fast pyrolysis
at temperature of 500 C) in size fraction of (a) 250–355 µm, (b) 355–500 µm, (c)
0.5–1 mm and (d) > 1 mm.
Figure 8-2 illustrates the typical optical microscope images of the bed samples
collected in selected size fractions. The presence of bed agglomerates are clearly
evident in these images, mainly in the form of agglomeration of multiple sand
particles. These images also show that the silica sand particles appear to be coated
with the bio-oil pyrolysis products (coke and/or tar) that adhere multiple sand
particles into one bed agglomerate.
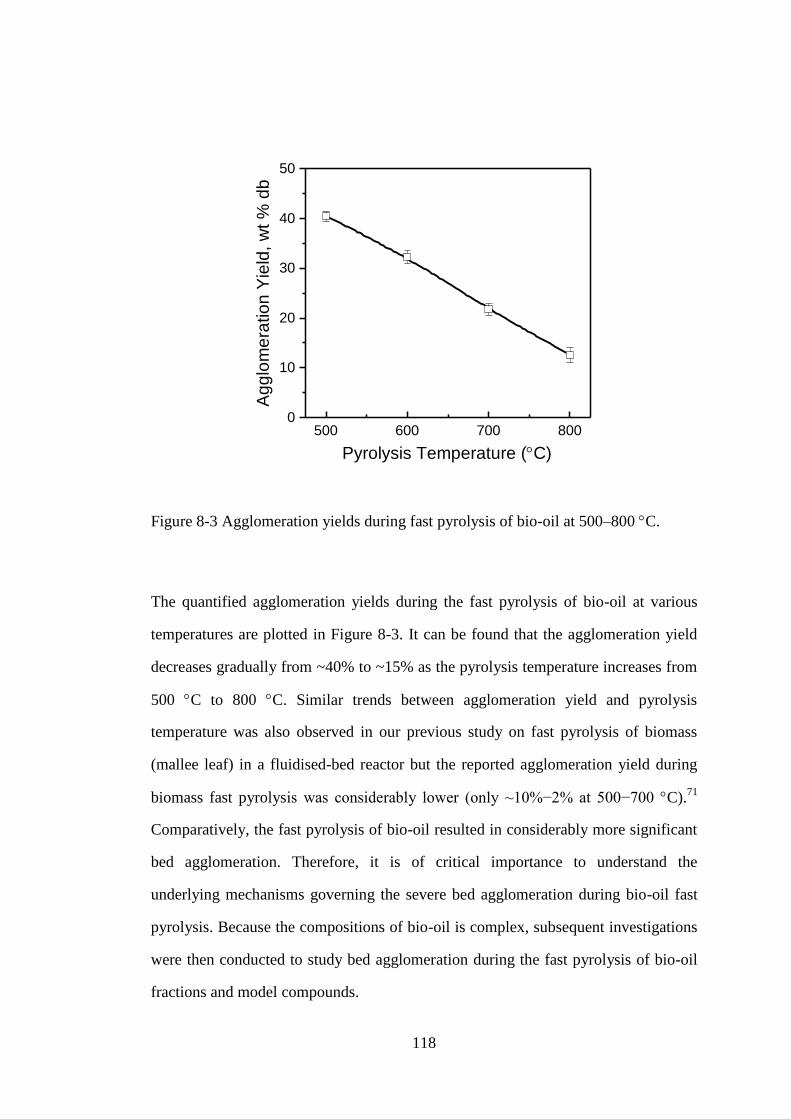
118
Figure 8-3 Agglomeration yields during fast pyrolysis of bio-oil at 500–800 C.
The quantified agglomeration yields during the fast pyrolysis of bio-oil at various
temperatures are plotted in Figure 8-3. It can be found that the agglomeration yield
decreases gradually from ~40% to ~15% as the pyrolysis temperature increases from
500 C to 800 C. Similar trends between agglomeration yield and pyrolysis
temperature was also observed in our previous study on fast pyrolysis of biomass
(mallee leaf) in a fluidised-bed reactor but the reported agglomeration yield during
biomass fast pyrolysis was considerably lower (only ~10%−2% at 500−700 C).71
Comparatively, the fast pyrolysis of bio-oil resulted in considerably more significant
bed agglomeration. Therefore, it is of critical importance to understand the
underlying mechanisms governing the severe bed agglomeration during bio-oil fast
pyrolysis. Because the compositions of bio-oil is complex, subsequent investigations
were then conducted to study bed agglomeration during the fast pyrolysis of bio-oil
fractions and model compounds.
500 600 700 8000
10
20
30
40
50
Pyrolysis Temperature (C)
Ag
glo
me
ratio
n Y
ield
, w
t %
db
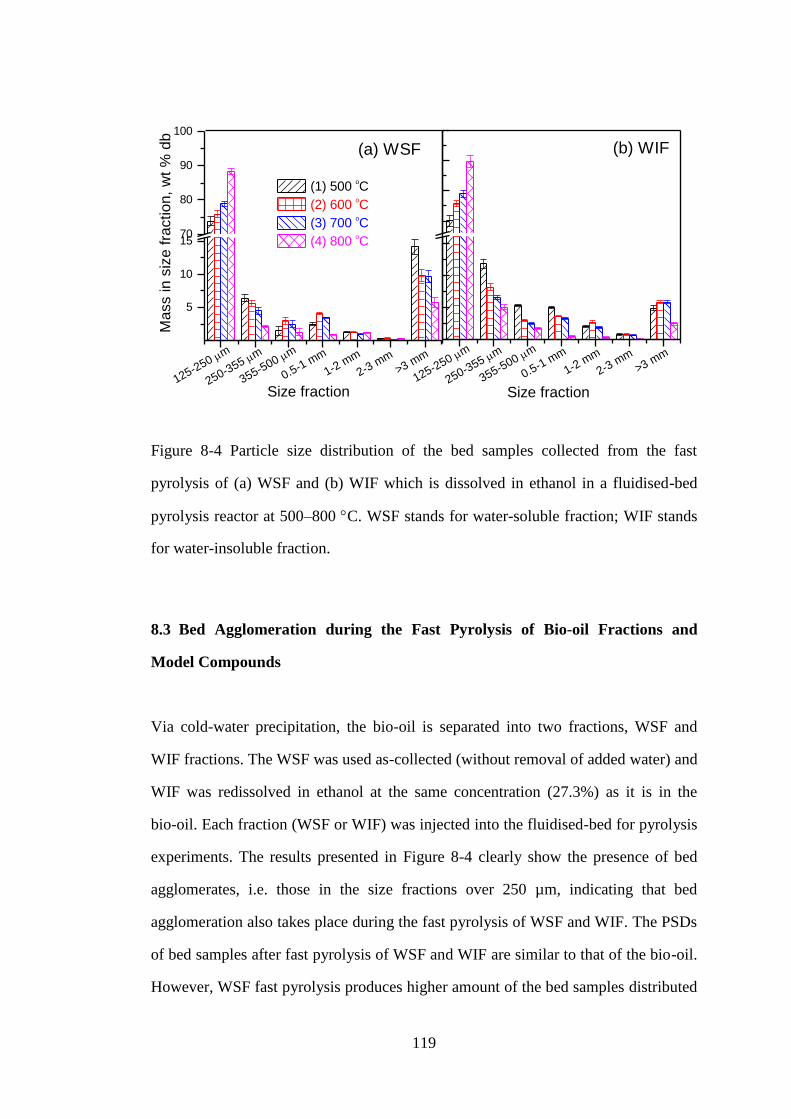
119
Figure 8-4 Particle size distribution of the bed samples collected from the fast
pyrolysis of (a) WSF and (b) WIF which is dissolved in ethanol in a fluidised-bed
pyrolysis reactor at 500–800 C. WSF stands for water-soluble fraction; WIF stands
for water-insoluble fraction.
8.3 Bed Agglomeration during the Fast Pyrolysis of Bio-oil Fractions and
Model Compounds
Via cold-water precipitation, the bio-oil is separated into two fractions, WSF and
WIF fractions. The WSF was used as-collected (without removal of added water) and
WIF was redissolved in ethanol at the same concentration (27.3%) as it is in the
bio-oil. Each fraction (WSF or WIF) was injected into the fluidised-bed for pyrolysis
experiments. The results presented in Figure 8-4 clearly show the presence of bed
agglomerates, i.e. those in the size fractions over 250 µm, indicating that bed
agglomeration also takes place during the fast pyrolysis of WSF and WIF. The PSDs
of bed samples after fast pyrolysis of WSF and WIF are similar to that of the bio-oil.
However, WSF fast pyrolysis produces higher amount of the bed samples distributed
5
10
1570
80
90
100
(1) 500 oC
(2) 600 oC
(3) 700 oC
(4) 800 oC
Mass in s
ize f
raction,
wt
% d
b(a) WSF
>3 mm
2-3 mm
1-2 mm
0.5-1 mm
355-500 m
250-355 m
125-250 m
Size fraction
>3 mm
2-3 mm
1-2 mm
0.5-1 mm
355-500 m
250-355 m
(b) WIF
125-250 m
Size fraction
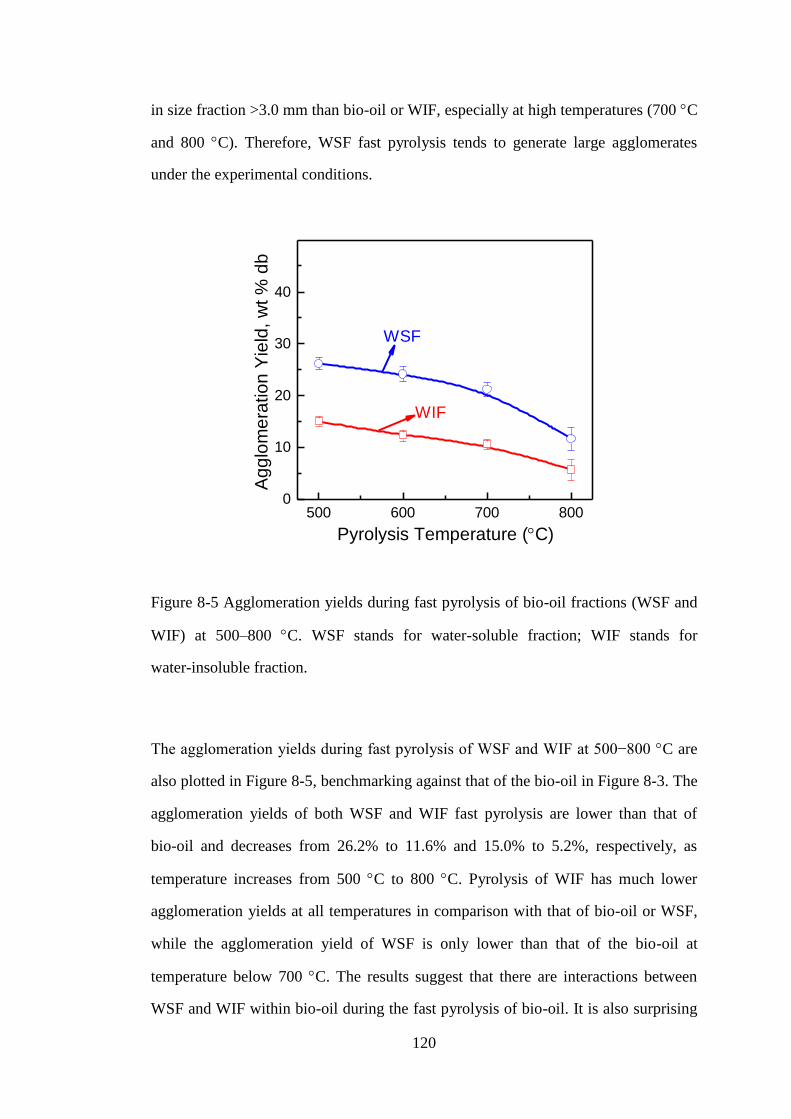
120
in size fraction >3.0 mm than bio-oil or WIF, especially at high temperatures (700 C
and 800 C). Therefore, WSF fast pyrolysis tends to generate large agglomerates
under the experimental conditions.
Figure 8-5 Agglomeration yields during fast pyrolysis of bio-oil fractions (WSF and
WIF) at 500–800 C. WSF stands for water-soluble fraction; WIF stands for
water-insoluble fraction.
The agglomeration yields during fast pyrolysis of WSF and WIF at 500−800 C are
also plotted in Figure 8-5, benchmarking against that of the bio-oil in Figure 8-3. The
agglomeration yields of both WSF and WIF fast pyrolysis are lower than that of
bio-oil and decreases from 26.2% to 11.6% and 15.0% to 5.2%, respectively, as
temperature increases from 500 C to 800 C. Pyrolysis of WIF has much lower
agglomeration yields at all temperatures in comparison with that of bio-oil or WSF,
while the agglomeration yield of WSF is only lower than that of the bio-oil at
temperature below 700 C. The results suggest that there are interactions between
WSF and WIF within bio-oil during the fast pyrolysis of bio-oil. It is also surprising
500 600 700 8000
10
20
30
40
Ag
glo
me
ratio
n Y
ield
, w
t %
db
Pyrolysis Temperature (C)
WIF
WSF
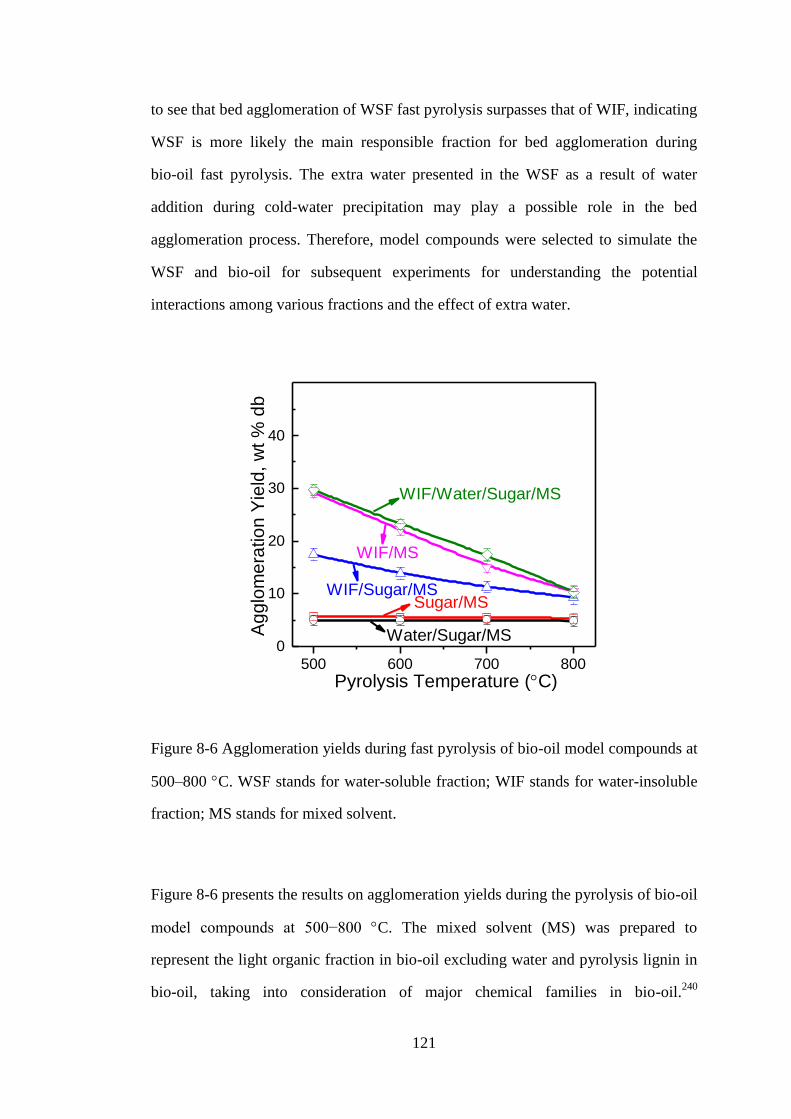
121
to see that bed agglomeration of WSF fast pyrolysis surpasses that of WIF, indicating
WSF is more likely the main responsible fraction for bed agglomeration during
bio-oil fast pyrolysis. The extra water presented in the WSF as a result of water
addition during cold-water precipitation may play a possible role in the bed
agglomeration process. Therefore, model compounds were selected to simulate the
WSF and bio-oil for subsequent experiments for understanding the potential
interactions among various fractions and the effect of extra water.
Figure 8-6 Agglomeration yields during fast pyrolysis of bio-oil model compounds at
500–800 C. WSF stands for water-soluble fraction; WIF stands for water-insoluble
fraction; MS stands for mixed solvent.
Figure 8-6 presents the results on agglomeration yields during the pyrolysis of bio-oil
model compounds at 500−800 C. The mixed solvent (MS) was prepared to
represent the light organic fraction in bio-oil excluding water and pyrolysis lignin in
bio-oil, taking into consideration of major chemical families in bio-oil.240
500 600 700 800
0
10
20
30
40
Ag
glo
me
ratio
n Y
ield
, w
t %
db
Sugar/MS
Pyrolysis Temperature (C)
WIF/MS
WIF/Sugar/MS
WIF/Water/Sugar/MS
Water/Sugar/MS
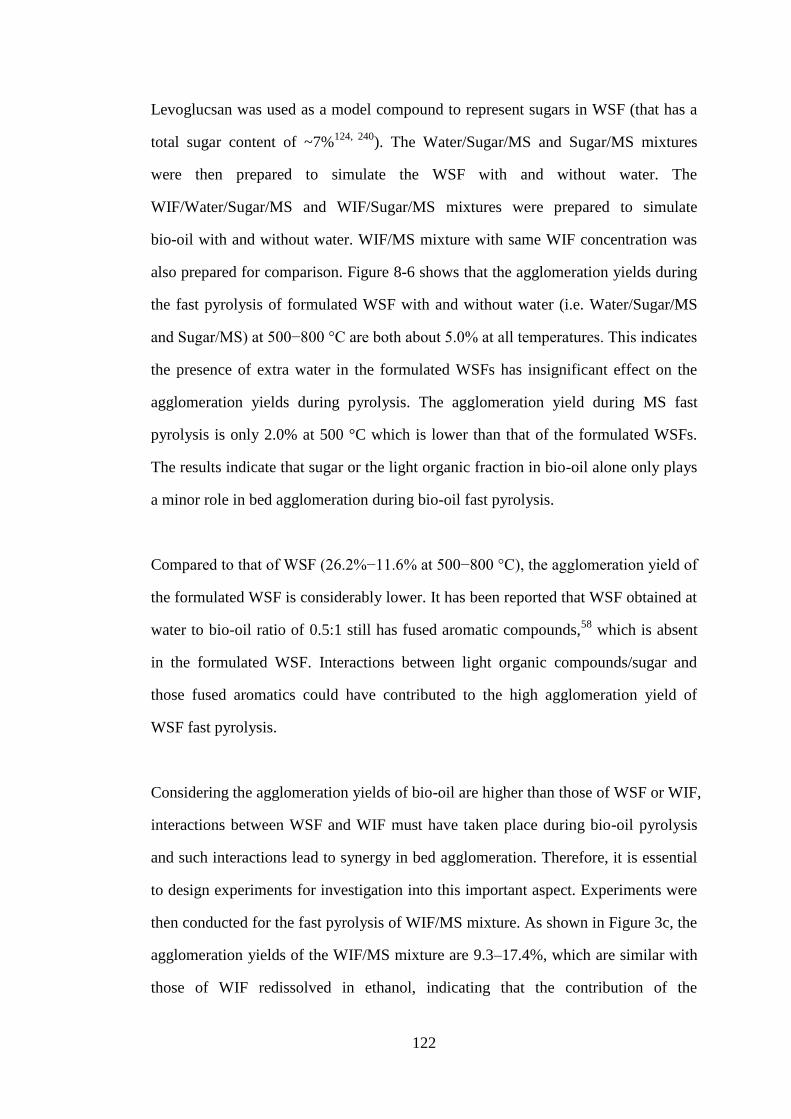
122
Levoglucsan was used as a model compound to represent sugars in WSF (that has a
total sugar content of ~7%124, 240
). The Water/Sugar/MS and Sugar/MS mixtures
were then prepared to simulate the WSF with and without water. The
WIF/Water/Sugar/MS and WIF/Sugar/MS mixtures were prepared to simulate
bio-oil with and without water. WIF/MS mixture with same WIF concentration was
also prepared for comparison. Figure 8-6 shows that the agglomeration yields during
the fast pyrolysis of formulated WSF with and without water (i.e. Water/Sugar/MS
and Sugar/MS) at 500−800 °C are both about 5.0% at all temperatures. This indicates
the presence of extra water in the formulated WSFs has insignificant effect on the
agglomeration yields during pyrolysis. The agglomeration yield during MS fast
pyrolysis is only 2.0% at 500 °C which is lower than that of the formulated WSFs.
The results indicate that sugar or the light organic fraction in bio-oil alone only plays
a minor role in bed agglomeration during bio-oil fast pyrolysis.
Compared to that of WSF (26.2%−11.6% at 500−800 °C), the agglomeration yield of
the formulated WSF is considerably lower. It has been reported that WSF obtained at
water to bio-oil ratio of 0.5:1 still has fused aromatic compounds,58
which is absent
in the formulated WSF. Interactions between light organic compounds/sugar and
those fused aromatics could have contributed to the high agglomeration yield of
WSF fast pyrolysis.
Considering the agglomeration yields of bio-oil are higher than those of WSF or WIF,
interactions between WSF and WIF must have taken place during bio-oil pyrolysis
and such interactions lead to synergy in bed agglomeration. Therefore, it is essential
to design experiments for investigation into this important aspect. Experiments were
then conducted for the fast pyrolysis of WIF/MS mixture. As shown in Figure 3c, the
agglomeration yields of the WIF/MS mixture are 9.3–17.4%, which are similar with
those of WIF redissolved in ethanol, indicating that the contribution of the
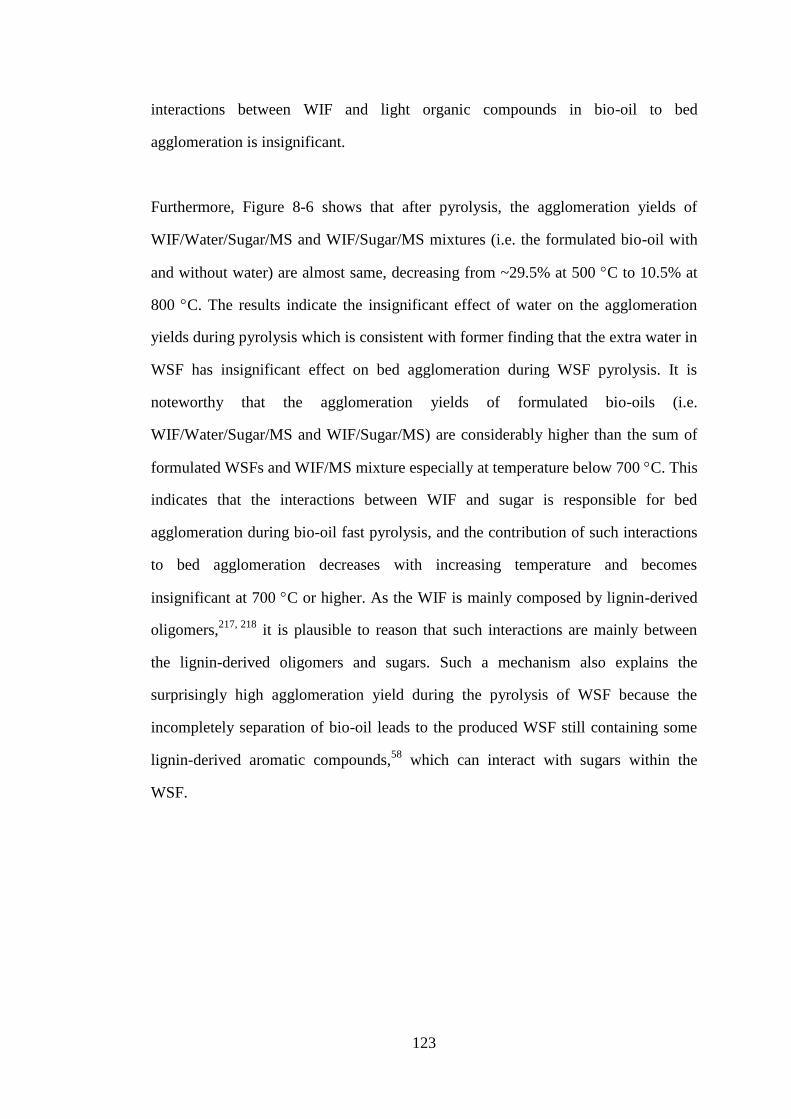
123
interactions between WIF and light organic compounds in bio-oil to bed
agglomeration is insignificant.
Furthermore, Figure 8-6 shows that after pyrolysis, the agglomeration yields of
WIF/Water/Sugar/MS and WIF/Sugar/MS mixtures (i.e. the formulated bio-oil with
and without water) are almost same, decreasing from ~29.5% at 500 C to 10.5% at
800 C. The results indicate the insignificant effect of water on the agglomeration
yields during pyrolysis which is consistent with former finding that the extra water in
WSF has insignificant effect on bed agglomeration during WSF pyrolysis. It is
noteworthy that the agglomeration yields of formulated bio-oils (i.e.
WIF/Water/Sugar/MS and WIF/Sugar/MS) are considerably higher than the sum of
formulated WSFs and WIF/MS mixture especially at temperature below 700 C. This
indicates that the interactions between WIF and sugar is responsible for bed
agglomeration during bio-oil fast pyrolysis, and the contribution of such interactions
to bed agglomeration decreases with increasing temperature and becomes
insignificant at 700 C or higher. As the WIF is mainly composed by lignin-derived
oligomers,217, 218
it is plausible to reason that such interactions are mainly between
the lignin-derived oligomers and sugars. Such a mechanism also explains the
surprisingly high agglomeration yield during the pyrolysis of WSF because the
incompletely separation of bio-oil leads to the produced WSF still containing some
lignin-derived aromatic compounds,58
which can interact with sugars within the
WSF.
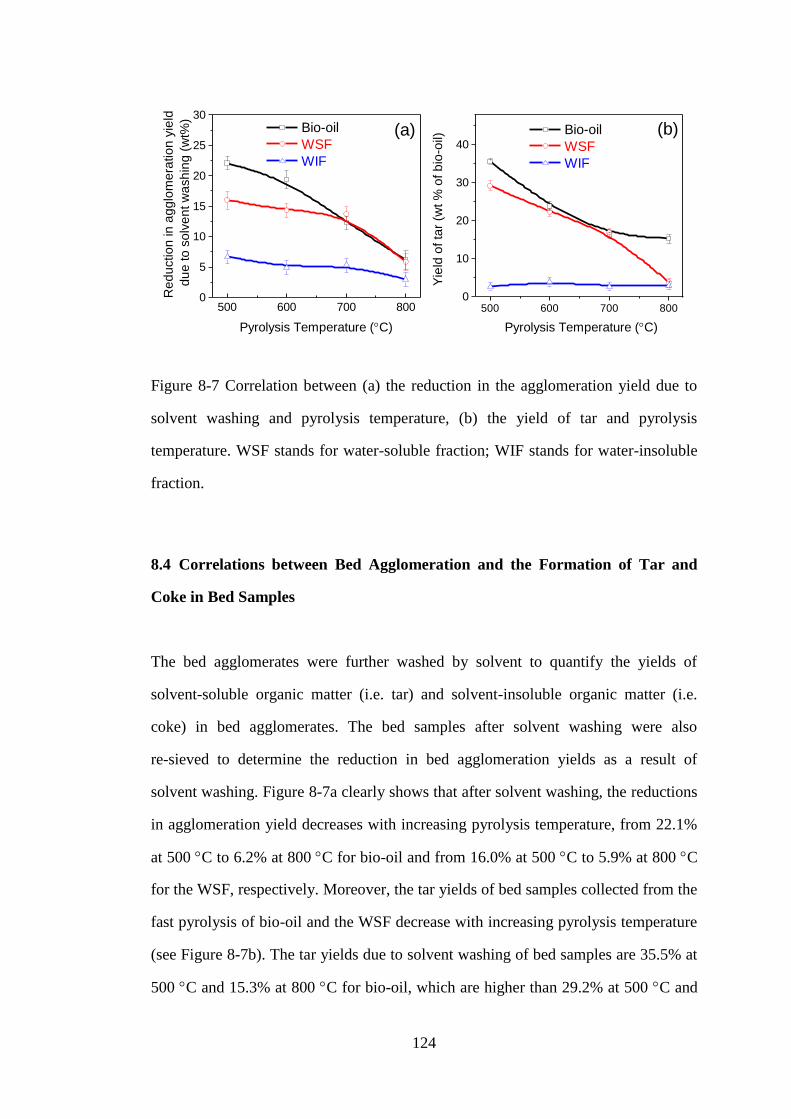
124
Figure 8-7 Correlation between (a) the reduction in the agglomeration yield due to
solvent washing and pyrolysis temperature, (b) the yield of tar and pyrolysis
temperature. WSF stands for water-soluble fraction; WIF stands for water-insoluble
fraction.
8.4 Correlations between Bed Agglomeration and the Formation of Tar and
Coke in Bed Samples
The bed agglomerates were further washed by solvent to quantify the yields of
solvent-soluble organic matter (i.e. tar) and solvent-insoluble organic matter (i.e.
coke) in bed agglomerates. The bed samples after solvent washing were also
re-sieved to determine the reduction in bed agglomeration yields as a result of
solvent washing. Figure 8-7a clearly shows that after solvent washing, the reductions
in agglomeration yield decreases with increasing pyrolysis temperature, from 22.1%
at 500 C to 6.2% at 800 C for bio-oil and from 16.0% at 500 C to 5.9% at 800 C
for the WSF, respectively. Moreover, the tar yields of bed samples collected from the
fast pyrolysis of bio-oil and the WSF decrease with increasing pyrolysis temperature
(see Figure 8-7b). The tar yields due to solvent washing of bed samples are 35.5% at
500 C and 15.3% at 800 C for bio-oil, which are higher than 29.2% at 500 C and
500 600 700 8000
5
10
15
20
25
30
500 600 700 8000
10
20
30
40
Re
du
ctio
n in
ag
glo
me
ratio
n y
ield
du
e to
so
lve
nt w
ash
ing
(w
t%)
Bio-oil
WSF
WIF
(a)
Pyrolysis Temperature (C)
Yie
ld o
f ta
r (w
t %
of b
io-o
il)
(b) Bio-oil
WSF
WIF
Pyrolysis Temperature (C)

125
3.7 at 800 C for the WSF, respectively. However, for WIF, both the tar yields
(3.87–2.6%) and the reductions (6.7–3.0%) in agglomeration yields as results of
solvent washing are very low and only the latter one decreases with increasing
pyrolysis temperature while the former one remain similar. This is attributed to the
thermal cracking of bio-oil and WSF.218
It was observed previously that the yield of
“washed tar” from lignin-derived oligomers (or WIF) was very low when pyrolysis
temperature is higher than 500 C, due the decomposition of large molecules and its
enhanced evaporation.218
Figure 8-8 Correlation between (a) the agglomeration yield after solvent washing and
pyrolysis temperature, (b) the yield of coke and pyrolysis temperature. WSF stands
for water-soluble fraction; WIF stands for water-insoluble fraction.
Figure 8-8b shows that the coke yields of bed samples collected from the fast
pyrolysis of bio-oil, WSF and WIF all decrease with increasing pyrolysis
temperature (from 6.4 to 5.5%, 4.6 to 0.83% and 5.2 to 1.7% as pyrolysis
temperature increases from 500 C to 800 C, respectively). Less coke is formed at
higher temperatures, attributed to the intensified decomposition reactions.217
The
coke yield of bio-oil is the highest while that of WSF is the lowest but only slightly
500 600 700 8000
5
10
15
20
25
30
500 600 700 8000
2
4
6
8
10(a)
Ag
glo
me
ratio
n y
ield
afte
r so
lve
nt
wa
sh
ing
(w
t %
)
Bio-oil
WSF
WIF
Pyrolysis Temperature (C)
(b)Y
ield
of co
ke
(w
t %
of b
io-o
il) Bio-oil
WSF
WIF
Pyrolysis Temperature (C)
126
lower than that of WIF. The WSF has much less possibility to form coke than WIF
during pyrolysis at temperatures above 450 C because the WIF has considerably
higher concentration of aromatic species, which act as precursors for coke
formation.217, 218
In despite of the low yields (less than 6.4%) of coke in comparison
to the tar yields, coke does play a significant role in the formation of bed
agglomeration. As shown in Figure 8-8a, after solvent washing, the agglomeration
yields for bio-oil, WSF and WIF are still high and also decreases with increasing
temperature, following the same sequence of bio-oil>WSF>WIF as those before
solvent washing.
Figure 8-9 Correlation between (a) the reduction in the agglomeration yield due to
solvent washing and the yield of tar and (b) the agglomeration yield after solvent
washing and the yield of coke. WSF stands for water-soluble fraction; WIF stands
for water-insoluble fraction.
The correlations between the reduction in agglomeration yields and tar yield and
between the agglomeration yield after solvent washing and the coke yield are plotted
in the panel e and f of Figure 8-9. It can be seen that the all experimental data for the
reduction in agglomeration yields and tar yields obtained from all feedstock (bio-oil,
0 5 10 15 20 25 30 35 400
5
10
15
20
25
30
35
0 1 2 3 4 5 6 70
5
10
15
20
25
(a)
Re
du
ctio
n in
ag
glo
me
ratio
n y
ield
du
e
to s
olv
en
t w
ash
ing
(w
t %
)
Yield of tar (wt % of bio-oil)
Bio-oil
WSF
WIF
(b)
Ag
glo
me
ratio
n y
ield
afte
r so
lve
nt
wa
sh
ing
(w
t %
)
Yield of coke (wt % of bio-oil)
Bio-oil
WSF
WIF
127
WSF and WIF) fits into one single broadly linear correlation. This indicates the role
of such tars generated from various feedstock play a similar role in the formation of
bed agglomeration. For the correlation between the agglomeration yields after
solvent washing and the coke yield, it is interesting to see that the experimental data
obtained from both WSF and WIF broadly fit into one single broadly linear
correlation when WSF or WIF is pyrolyzed individually. While the experimental
data from bio-oil also fits into a broadly linear correlation, the gradient of the trend
line is considerably steeper than that of the correlated line for the data from WSF and
WIF. This clearly indicates that synergy between the WSF and WIF during fast
pyrolysis in enhancing bed agglomeration.
8.5 Conclusions
This study investigates the bed agglomeration of bio-oil during fast pyrolysis in a
fluidised-bed reactor at different temperatures. The results show that the
agglomeration yield of bio-oil at 500 C is as high as 40% and then decrease to 15%
with temperature increase to 800 C. Based on the studies of bed agglomeration of
bio-oil fractions and model compounds, the interactions between lignin-derived
oligomers and sugar is found to be responsible for bed agglomeration during bio-oil
fast pyrolysis and the higher agglomeration yield of WSF (26.2–11.6%, 500–800 C)
compared to that of WIF (15.0–5.2%, 500–800 C). Such interactions decrease with
increasing temperature and become insignificant at 700 °C or higher. The studies of
bed agglomeration of bio-oil fractions and model compounds also indicates the
insignificant effect of water on bed agglomeration during pyrolysis of bio-oil or WSF.
Bed agglomeration of bio-oil during fast pyrolysis also has broadly liner correlation
with the formation of tar and coke in bed samples. The gradient of the trend line for
the data from bio-oil is considerably steeper than that of the correlated line for WSF

128
and WIF which indicates that synergy between the WSF and WIF during fast
pyrolysis in enhancing bed agglomeration.

129
Chapter 9 Conclusions and Recommendations
9.1 Introduction
This chapter concluded the significant discoveries of the present investigation.
Overall, this thesis has described a series of systematic study on fuel properties and
fast pyrolysis of bio-oil and its derived fuel mixtures. The bio-oil derived fuel
mixtures employed in this experimental program include water-soluble fraction
(WSF), G/methanol/bio-oil (GMB, G stands for glycerol) and CG/methanol/bio-oil
(CGMB, CG stands for crude glycerol) blends, G/WSF (GWSF) and CG/WSF
(CGWSF) blend, GMB/biochar (GMBB) and CGMB/biochar (CGMBB) slurries,
and GWSF/biochar (GWSFB) and CGWSF/biochar (CGWSFB) slurries. Firstly, this
study has explored the fuel properties and ageing of GMBB and CGMBB slurry fuels.
Secondly, ignition behaviour of bio-oil and bio-oil based fuel mixtures were
investigated via two methods, i.e. thermogravimetric analysis (TGA) method and an
ASTM-based method. Thirdly, this thesis also has reported about the cold flow
properties of bio-oil and its derived fuel mixtures determined by differential scanning
calorimetry. Finally, fundamental understanding about bed agglomeration
phenomenon during fast pyrolysis of bio-oil in a fluidised-bed reactor under different
temperatures was achieved. Detailed findings from this PhD study and some
recommendations for future work are listed below.
9.2 Conclusions
Conclusions are outlined based on the four targets of this thesis study which detailed
below.
130
9.2.1 Fuel properties and ageing of glycerol/methanol/bio-oil/biochar and crude
glycerol/methanol/bio-oil/biochar slurry fuels
Biochar loading level plays an important role in the fuel properties of both
GMBB and BB slurry fuels. With the biochar loading level increases, the
water content and total acid number (referred to as TAN) of slurry fuels
decrease while the viscosity increases.
Compared to BB bioslurry, GMBB bioslurry have lower water content,
viscosity and TAN due to the presence of both methanol and glycerol. The
addition of methanol and glycerol also reduce the leaching of AAEM species
from biochar into liquid phase.
FCGMBB slurry fuels have equivalent to or even better fuel properties in
comparison with GMBB slurry or FCGMB blend. This also proves the major
impurities contained in FCG have little effect on the fuel properties of fuel
samples.
After ageing, the TAN and viscosity of both GMBB and FCGMBB slurry
fuels decreased while the water content increased which can be attributed to
the esterification, acetalization and/or polycondensation reactions.
9.2.2 Ignition temperatures of various bio-oil based fuel blends and slurry fuels
The bio-oil and WSF are difficult to ignite with ignition temperatures being
506 C and 511 C respectively. This may attributed to the carbonaceous
solid produced by cracking reactions at high temperature. WSF has a slightly
131
higher ignition temperature compare with bio-oil indicates water has negative
effect on ignition.
Slurry fuels containing CG have lower ignition temperatures than other slurry
fuels due to the catalytic effect of sodium salt in CG on ignition.
The ignition temperatures of slurry fuels are higher compared to their
corresponding fuel blends due to the addition of biochar although it has an
ignition temperature of 375 C which is lower than that of blend fuels. This
may because some fuel components evaporated before ignited during TGA
analysis which resulted in more carbonaceous solid and less volatile.
The ASTM-based method is dominated by ignition of vapour phase while the
TGA method is dominated by ignition of solid residue after evaporation.
9.2.3 Differential scanning calorimetry studies on the cold flow properties of fuel
mixtures from bio-oil, crude glycerol, methanol and/or biochar
Bio-oil has a TMP of 21.9 C which is considerably lower than that of WSF
with TMP being 8.7 C for the reason that WSF has a very high water content
(61.6%). This indicates that both bio-oil and WSF have problems on direct
utilization when the weather is cold and thus limited their applications.
All components except water in FCGs decrease the TMP of fuel samples due
to solvent effect and their ability in reducing the TMP follows the order of
NaCl > NaOH > methanol > glycerol > soap.
FCGMB and FCGWSF have much better cold flow properties than bio-oil
and WSF respectively, due to the addition of FCG. Compare to FCGs,
glycerol has better ability on improving cold flow properties of bio-oil based
132
fuels because the presence of water because water has negative effect in cold
flow properties.
Biochar particles in slurry fuels have very little effect on the cold flow
behaviour of bio-oil based fuels, only lead to a decrease of barely 4 C in the
TMP when biochar loading rate is 20%.
9.2.4 Bed agglomeration during bio-oil fast pyrolysis in a fluidised-bed reactor
With the pyrolysis temperature increase from 500 to 800 C, the bed
agglomeration yield of bio-oil, WSF and WIF decrease from 40.0% to 15.0%,
26.2% to 11.6%, and 15.0% to 5.2%.
Based on the investigations on bed agglomeration of both bio-oil fractions
and model compounds, the high bed agglomeration yields of bio-oil and WSF
are attributed to the interactions between sugar and lignin-derived oligomers.
The results also show that such interactions weaken with pyrolysis
temperature increase and water has insignificant effect on bed agglomeration
during bio-oil or WSF fast pyrolysis.
The bed agglomeration yield versus the tar (and/or coke) yield follows broad
linear correlations. The gradients of the trend line for the data from WSF and
WIF are gentler than that of the corresponding line for bio-oil which suggests
the synergy effect between WSF and WIF on enhancing the bed
agglomeration during fast pyrolysis.
133
9.3 Recommendations
Based on the outcome of this PhD project, recommendations for future work are
listed below considering several research gaps:
1. This PhD thesis focuses on fuel properties of fuel blends and slurry fuels
prepared from formulated CG and the effect of impurities in CG on fuel
properties. However, industrial CG has more complex compositions than the
formulated CG. Fuel properties of fuel mixture prepared from industrial CG need
to be characterised. Cold flow behaviour and ignition behaviour of the prepared
fuels also need to be investigated.
2. Limited by present experiment rigs, this study has characterised the cold flow
properties by the DSC melting process with determination of melting point.
Future works need to devise suitable experimental facilities for determining the
pour point, cold filter plugging point or frozen point of the fuels.
3. Limited by time frame, this PhD research has not completed the study on bed
agglomeration during bio-oil derived fuel mixtures in a fluidised-bed reactor.
This can be an important research topic in future work, particularly considering
the effect of impurities in CG and biochar on bed agglomeration.
4. Since fuel properties of bio-oil derived fuel mixtures meet the requirements for
further combustion/gasification utilizations, future experimental research are also
required for understanding the atomization and combustion/gasification
behaviour of these fuel mixtures for practical applications.
134
References
1. Jacobson, K.; Maheria, K. C.; Kumar Dalai, A., Bio-oil valorization: A review.
Renewable and Sustainable Energy Reviews 2013, 23, 91-106.
2. Akhtar, J.; Amin, N. A. S., A review on process conditions for optimum bio-oil
yield in hydrothermal liquefaction of biomass. Renewable and Sustainable Energy
Reviews 2011, 15, (3), 1615-1624.
3. Laird, D. A.; Brown, R. C.; Amonette, J. E.; Lehmann, J., Review of the
pyrolysis platform for coproducing bio-oil and biochar. Biofuels, Bioproducts and
Biorefining 2009, 3, (5), 547-562.
4. Vamvuka, D., Bio-oil, solid and gaseous biofuels from biomass pyrolysis
processes—An overview. International Journal of Energy Research 2011, 35, (10),
835-862.
5. Bridgwater, A. V., An overview of fast pyrolysis of biomass. Organic
Geochemistry 1999, 30,, (12), 1479.
6. Czernik, S.; Bridgwater, A., Overview of applications of biomass fast pyrolysis
oil. Energy & Fuels 2004, 18, (2), 590-598.
7. Bridgwater, A. V., Renewable fuels and chemicals by thermal processing of
biomass. Chemical Engineering Journal 2003, 91, (2), 87-102.
8. Carpenter, D.; Westover, T. L.; Czernik, S.; Jablonski, W., Biomass feedstocks
for renewable fuel production: a review of the impacts of feedstock and pretreatment
on the yield and product distribution of fast pyrolysis bio-oils and vapors. Green
Chem. 2014, 16, (2), 384-406.
9. Kersten, S. R. A., Biomass pyrolysis in a fluidized bed reactor. Part 1: Literature
review and model simulations. Industrial & Engineering Chemistry Research 2005,
44, (23), 8773.
10. Yakima County Public, W.; Solid waste, d., Review of Biomass Fuels and
Technologies. In R.W.BECK: 2003.
11. Kersten, S. R. A.; Wang, X.; Prins, W.; van Swaaij, W. P. M., Biomass Pyrolysis
in a Fluidized Bed Reactor. Part 1: Literature Review and Model Simulations.
Industrial & Engineering Chemistry Research 2005, 44, (23), 8773-8785.
12. Bridgwater, A. V.; Meier, D.; Radlein, D., An overview of fast pyrolysis of
biomass. Organic Geochemistry 1999, 30, (12), 1479-1493.

135
13. Kim, J.-S., Production, separation and applications of phenolic-rich bio-oil – A
review. Bioresource Technology 2015, 178, 90-98.
14. Lehto, J.; Oasmaa, A.; Solantausta, Y.; Kytö, M.; Chiaramonti, D., Review of
fuel oil quality and combustion of fast pyrolysis bio-oils from lignocellulosic
biomass. Applied Energy 2014, 116, 178-190.
15. Diebold, J. P., A Review of the Chemical and Physical Mechanisms of the
Storage Stability of Fast Pyrolysis Bio-Oils. National Renewable Energy Laboratory
Golden, CO (United States): 2000.
16. Zhang, M.; Liaw, S. B.; Wu, H., Bioslurry as a Fuel. 5. Fuel Properties
Evolution and Aging during Bioslurry Storage. Energy & Fuels 2013, 27, (12),
7560-7568.
17. Trinh, T. N.; Jensen, P. A.; Dam-Johansen, K.; Knudsen, N. O.; Sørensen, H. R.;
Szabo, P., Properties of slurries made of fast pyrolysis oil and char or beech wood.
Biomass and Bioenergy 2014, 61, 227-235.
18. Yu, Y.; Wu, H., Bioslurry as a Fuel. 2. Life-Cycle Energy and Carbon Footprints
of Bioslurry Fuels from Mallee Biomass in Western Australia. Energy & Fuels 2010,
24, (10), 5660-5668.
19. Wu, H.; Yu, Y.; Yip, K., Bioslurry as a Fuel. 1. Viability of a Bioslurry-Based
Bioenergy Supply Chain for Mallee Biomass in Western Australia. Energy & Fuels
2010, 24, (10), 5652-5659.
20. Lian, X.; Xue, Y.; Zhao, Z.; Xu, G.; Han, S.; Yu, H., Progress on upgrading
methods of bio-oil: A review. International Journal of Energy Research 2017, 41,
(13), 1798-1816.
21. Saber, M.; Nakhshiniev, B.; Yoshikawa, K., A review of production and
upgrading of algal bio-oil. Renewable and Sustainable Energy Reviews 2016, 58,
918-930.
22. Zhang, M. Properties of bio-oil based fuel mixtures: biochar/bio-oil slurry fuels
and glycerol/bio-oil fuel blends. 2015.
23. Zhang, L.; Liu, R.; Yin, R.; Mei, Y., Upgrading of bio-oil from biomass fast
pyrolysis in China: A review. Renewable and Sustainable Energy Reviews 2013, 24,
66-72.
24. Reyhanitash, E.; Tymchyshyn, M.; Yuan, Z.; Albion, K.; van Rossum, G.; Xu,
C., Upgrading Fast Pyrolysis Oil via Hydrodeoxygenation and Thermal Treatment:
Effects of Catalytic Glycerol Pretreatment. Energy & Fuels 2014, 28, (2),
1132-1138.
136
25. Jiang, X.; Ellis, N., Upgrading Bio-oil through Emulsification with Biodiesel:
Mixture Production. Energy & Fuels 2010, 24, (2), 1358-1364.
26. Bridgwater, A. V., Review of fast pyrolysis of biomass and product upgrading.
Biomass and Bioenergy 2012, 38, 68-94.
27. Mortensen, P. M.; Grunwaldt, J. D.; Jensen, P. A.; Knudsen, K. G.; Jensen, A.
D., A review of catalytic upgrading of bio-oil to engine fuels. Applied Catalysis A:
General 2011, 407, (1–2), 1-19.
28. Zhang, Q.; Chang, J.; Wang, T.; Xu, Y., Review of biomass pyrolysis oil
properties and upgrading research. Energy Conversion and Management 2007, 48,
(1), 87-92.
29. Bridgwater, A. V.; Cottam, M. L., Opportunities for biomass pyrolysis liquids
production and upgrading. Energy & Fuels 1992, 6, (2), 113-120.
30. Fatih Demirbas, M., Biorefineries for biofuel upgrading: A critical review.
Applied Energy 2009, 86, S151-S161.
31. Xiu, S.; Shahbazi, A., Bio-oil production and upgrading research: A review.
Renewable and Sustainable Energy Reviews 2012, 16, (7), 4406-4414.
32. Fermoso, J.; Pizarro, P.; Coronado, J. M.; Serrano, D. P., Advanced biofuels
production by upgrading of pyrolysis bio-oil. Wiley Interdisciplinary Reviews:
Energy and Environment 2017, 6, (4), 1-18.
33. Ghezelchi, M. H.; Garcia-Perez, M.; Wu, H., Bioslurry as a Fuel. 7: Spray
Characteristics of Bio-Oil and Bioslurry via Impact and Twin-Fluid Atomizers.
Energy & Fuels 2015, 29, (12), 8058-8065.
34. Zhang, M.; Wu, H., Bioslurry as a Fuel. 6. Leaching Characteristics of Alkali
and Alkaline Earth Metallic Species from Biochar by Bio-oil Model Compounds.
Energy & Fuels 2015, 29, (4), 2535-2541.
35. Abdullah, H.; Wu, H., Bioslurry as a Fuel. 4. Preparation of Bioslurry Fuels
from Biochar and the Bio-oil-Rich Fractions after Bio-oil/Biodiesel Extraction.
Energy & fuels 2011, 25, (4), 1759-1771.
36. Abdullah, H.; Mourant, D.; Li, C.-Z.; Wu, H., Bioslurry as a Fuel. 3. Fuel and
Rheological Properties of Bioslurry Prepared from the Bio-oil and Biochar of Mallee
Biomass Fast Pyrolysis. Energy & Fuels 2010, 24, (10), 5669-5676.
37. Gashaw, A.; Getachew, T., A Review on Biodiesel Production as Alternative
Fuel. 2015, 6.

137
38. Aransiola, E. F.; Ojumu, T. V.; Oyekola, O. O.; Madzimbamuto, T. F.;
Ikhu-Omoregbe, D. I. O., A review of current technology for biodiesel production:
State of the art. Biomass and Bioenergy 2014, 61, 276-297.
39. Verma, D.; Raj, J.; Pal, A.; Jain, M., A critical review on production of biodiesel
from various feedstocks. 8.
40. Bateni, H.; Saraeian, A.; Able, C., A comprehensive review on biodiesel
purification and upgrading. Biofuel Research Journal 2017, 4, (3), 668-690.
41. Monirul, I. M.; Masjuki, H. H.; Kalam, M. A.; Zulkifli, N. W. M.; Rashedul, H.
K.; Rashed, M. M.; Imdadul, H. K.; Mosarof, M. H., A comprehensive review on
biodiesel cold flow properties and oxidation stability along with their improvement
processes. RSC Adv. 2015, 5, (105), 86631-86655.
42. Misra, R. D.; Murthy, M. S., Blending of additives with biodiesels to improve
the cold flow properties, combustion and emission performance in a compression
ignition engine—A review. Renewable and Sustainable Energy Reviews 2011, 15,
(5), 2413-2422.
43. R. U, O.; A. L, A.; A. F, A., Biodiesel: Fuel for the Future (A Brief Review).
International Journal of Energy Engineering 2012, 2, (5), 223-231.
44. Krishna Murthy, T. P., Biodiesel: A Review. Journal of Engineering Research
and Applications 2013, 3, (6), 902-912.
45. Viana, M. B.; Freitas, A. V.; Leitão, R. C.; Pinto, G. A. S.; Santaella, S. T.,
Anaerobic digestion of crude glycerol: a review. Environmental Technology Reviews
2012, 1, (1), 81-92.
46. Rodrigues, A.; Bordado, J. C.; Santos, R. G. d., Upgrading the Glycerol from
Biodiesel Production as a Source of Energy Carriers and Chemicals—A
Technological Review for Three Chemical Pathways. Energies 2017, 10, (11), 1817.
47. Ayoub, M.; Abdullah, A. Z., Critical review on the current scenario and
significance of crude glycerol resulting from biodiesel industry towards more
sustainable renewable energy industry. Renewable and Sustainable Energy Reviews
2012, 16, (5), 2671-2686.
48. Bagnato, G.; Iulianelli, A.; Sanna, A.; Basile, A., Glycerol Production and
Transformation: A Critical Review with Particular Emphasis on Glycerol Reforming
Reaction for Producing Hydrogen in Conventional and Membrane Reactors.
Membranes 2017, 7, (2), 17
49. Pradima, J.; Kulkarni, M. R.; Archna, Review on enzymatic synthesis of value
added products of glycerol, a by-product derived from biodiesel production.
Resource-Efficient Technologies 2017, 3, (4), 394-405.
138
50. Konstantinovic, S.; Danilovic, B.; Ciric, J.; Ilic, S.; Savic, D.; Veljkovic, V.,
Valorization of crude glycerol from biodiesel production. Chemical Industry and
Chemical Engineering Quarterly 2016, 22, (4), 461-489.
51. Yang, F.; Hanna, M. A.; Sun, R., Value-added uses for crude glycerol-a
byproduct of biodiesel production. Biotechnol Biofuels 2012, 5, (13), 1–10.
52. Thompson, J. C.; He, B. B., Characterization of Crude Glycerol from Biodiesel
Production from Multiple Feedstocks. Applied Engineering in Agriculture 2006, 22,
(2), 261-265.
53. Dasari, M., Crude glycerol potential described. Feedstuffs 2007, 79, (1), 16–19.
54. Gholami, Z.; Abdullah, A. Z.; Lee, K.-T., Dealing with the surplus of glycerol
production from biodiesel industry through catalytic upgrading to polyglycerols and
other value-added products. Renewable and Sustainable Energy Reviews 2014, 39,
327-341.
55. Steinmetz, S. A.; Herrington, J. S.; Winterrowd, C. K.; Roberts, W. L.; Wendt, J.
O. L.; Linak, W. P., Crude glycerol combustion: Particulate, acrolein, and other
volatile organic emissions. Proceedings of the Combustion Institute 2013, 34, (2),
2749-2757.
56. Bohon, M. D.; Metzger, B. A.; Linak, W. P.; King, C. J.; Roberts, W. L.,
Glycerol combustion and emissions. Proceedings of the Combustion Institute 2011,
33, (2), 2717-2724.
57. Zhang, M.; Wu, H., Effect of major impurities in crude glycerol on solubility
and properties of glycerol/methanol/bio-oil blends. Fuel 2015, 159, 118-127.
58. Zhang, M.; Wu, H., Fuel Mixtures from Crude Glycerol, Bio-oil Water Soluble
Fraction and Biochar for Stationary Applications. Energy & Fuels 2016, 30,
8419-8424.
59. Zhang, M.; Wu, H., Fuel Mixtures from Crude Glycerol, the
Bio-oil–Water-Soluble Fraction, and Biochar for Stationary Applications. Energy &
Fuels 2016, 30, (10), 8419-8424.
60. Zhang, M.; Wu, H., Phase Behavior and Fuel Properties of
Bio-Oil/Glycerol/Methanol Blends. Energy & Fuels 2014, 28, (7), 4650-4656.
61. Öhman, M.; Pommer, L.; Nordin, A., Bed Agglomeration Characteristics and
Mechanisms during Gasification and Combustion of Biomass Fuels. Energy & Fuels
2005, 19, (4), 1742-1748.
62. Burton, A. H. Bed agglomeration during biomass fast pyrolysis in a fluidised
bed reactor. 2016.

139
63. Öhman, M.; Nordin, A.; Skrifvars, B.-J.; Backman, R.; Hupa, M., Bed
Agglomeration Characteristics during Fluidized Bed Combustion of Biomass Fuels.
Energy & Fuels 2000, 14, (1), 169-178.
64. Natarajan, E.; Öhman, M.; Gabra, M.; Nordin, A.; Liliedahl, T.; Rao, A. N.,
Experimental determination of bed agglomeration tendencies of some common
agricultural residues in fluidized bed combustion and gasification. Biomass and
Bioenergy 1998, 15, (2), 163–169.
65. Öhman, M.; Nordin, A., A New Method for Quantification of Fluidized Bed
Agglomeration Tendencies: A Sensitivity Analysis. Energy & Fuels 1998, 12, (1),
90-94.
66. Öhman, M.; Nordin, A., The Role of Kaolin in Prevention of Bed
Agglomeration during Fluidized Bed Combustion of Biomass Fuels. Energy & Fuels
2000, 14, (3), 618-624.
67. Burton, A.; Wu, H., Bed Agglomeration during the Drying of Mallee Leaf in
Fluidized Bed. Industrial & Engineering Chemistry Research 2016, 55, (6),
1796-1800.
68. Burton, A.; Wu, H., Diagnosis of bed agglomeration during biomass pyrolysis in
fluidised-bed at a wide range of temperatures. Fuel 2016, 179, 103-107.
69. Burton, A.; Wu, H., Differences in Bed Agglomeration Behavior during the Fast
Pyrolysis of Mallee Bark, Leaf, and Wood in a Fluidised-bed Reactor at 500 °C.
Energy & Fuels 2015, 29, (6), 3753-3759.
70. Burton, A.; Wu, H., Influence of biomass particle size on bed agglomeration
during biomass pyrolysis in fluidised bed. Proceedings of the Combustion Institute
2017, 36, (2), 2199-2205.
71. Burton, A.; Wu, H., Mechanistic Investigation into Bed Agglomeration during
Biomass Fast Pyrolysis in a Fluidised-bed Reactor. Energy & Fuels 2012, 26, (11),
6979-6987.
72. Lin, C.-L.; Wey, M.-Y.; Yu, W.-J., Emission characteristics of organic and
heavy metal pollutants in fluidized bed incineration during the
agglomeration/defluidization process. Combustion and Flame 2005, 143, (3),
139-149.
73. Brus, E.; Öhman, M.; Nordin, A., Mechanisms of Bed Agglomeration during
Fluidised-bed Combustion of Biomass Fuels. Energy & Fuels 2005, 19, (3), 825-832.
74. Kumar, A.; Kumar, N.; Baredar, P.; Shukla, A., A review on biomass energy
resources, potential, conversion and policy in India. Renewable and Sustainable
Energy Reviews 2015, 45, 530-539.
140
75. Wang, Y. Transformation of bio-oil during pyrolysis and reforming. Curtin
University, 2012.
76. Czernik, S.; Bridgwater, A. V., Overview of Applications of Biomass Fast
Pyrolysis Oil. Energy & Fuels 2004, 18, (2), 590-598.
77. No, S.-Y., Application of bio-oils from lignocellulosic biomass to transportation,
heat and power generation—A review. Renewable and Sustainable Energy Reviews
2014, 40, 1108-1125.
78. Zhen, X.; Wang, Y., An overview of methanol as an internal combustion engine
fuel. Renewable and Sustainable Energy Reviews 2015, 52, 477-493.
79. Knothe, G.; Van Gerpen, J. H.; Krahl, J.; others, The biodiesel handbook. AOCS
press Champaign, IL 2005; Vol. 1.
80. Rustandi, F.; Wu, H., Biodiesel Production from Canola in Western Australia:
Energy and Carbon Footprints and Land, Water, and Labour Requirements.
Industrial & Engineering Chemistry Research 2010, 49, (22), 11785-11796.
81. Agarwal, A. K., Biofuels (alcohols and biodiesel) applications as fuels for
internal combustion engines. Progress in Energy and Combustion Science 2007, 33,
(3), 233-271.
82. Anwar, A.; Garforth, A., Challenges and opportunities of enhancing cold flow
properties of biodiesel via heterogeneous catalysis. Fuel 2016, 173, 189-208.
83. Quispe, C. A. G.; Coronado, C. J. R.; Carvalho Jr, J. A., Glycerol: Production,
consumption, prices, characterization and new trends in combustion. Renewable and
Sustainable Energy Reviews 2013, 27, (Supplement C), 475-493.
84. Bruun, E. W.; Müller-Stöver, D.; Ambus, P.; Hauggaard-Nielsen, H.,
Application of biochar to soil and N2O emissions: potential effects of blending
fast-pyrolysis biochar with anaerobically digested slurry. European Journal of Soil
Science 2011, 62, (4), 581-589.
85. Saidur, R.; Abdelaziz, E. A.; Demirbas, A.; Hossain, M. S.; Mekhilef, S., A
review on biomass as a fuel for boilers. Renewable and Sustainable Energy Reviews
2011, 15, (5), 2262-2289.
86. Waldron, K. W., Advances in Biorefineries: Biomass and Waste Supply Chain
Exploitation. Elsevier: 2014.
87. Demirbas, A., Combustion of Biomass. Energy Sources, Part A: Recovery,
Utilization, and Environmental Effects 2007, 29, (6), 549-561.
88. Quaak, P.; Knoef, H.; Stassen, H., Energy from biomass: A review of combustion
and gasification technologies. The World Bank: 1999.

141
89. Dwyer, T., A review of biomass heating for UK homes and commercial
applications. International Journal of Low-Carbon Technologies 2006, 1, (4),
329-335.
90. Nanda, S.; A. Kozinski, J.; K. Dalai, A., Lignocellulosic Biomass: A Review of
Conversion Technologies and Fuel Products. Current Biochemical Engineering 2015,
3, (1), 24-36.
91. Maciejewska, A.; Veringa, H.; Sanders, J.; Peteves, S. D., Co-firing of biomass
with coal: constraints and role of biomass pre-treatment. DG JRC Institute for
Energy 2006.
92. Zhang, L.; Xu, C.; Champagne, P., Overview of recent advances in
thermo-chemical conversion of biomass. Energy Conversion and Management 2010,
51, (5), 969-982.
93. Özbay, N.; Pütün, A. E.; Pütün, E., Structural analysis of bio-oils from pyrolysis
and steam pyrolysis of cottonseed cake. Journal of Analytical and Applied Pyrolysis
2001, 60, (1), 89-101.
94. Panwar, N. L.; Kothari, R.; Tyagi, V. V., Thermo chemical conversion of
biomass – Eco friendly energy routes. Renewable and Sustainable Energy Reviews
2012, 16, (4), 1801-1816.
95. Ni, M.; Leung, D. Y. C.; Leung, M. K. H.; Sumathy, K., An overview of
hydrogen production from biomass. Fuel Processing Technology 2006, 87, (5),
461-472.
96. Mohan, D.; Pittman, C. U.; Steele, P. H., Pyrolysis of Wood/Biomass for Bio-oil:
A Critical Review. Energy & Fuels 2006, 20, (3), 848-889.
97. Bridgwater, A., Fast pyrolysis processes for biomass. Renewable and
Sustainable Energy Reviews 2000, 4, (1), 1-73.
98. Cha, J. S.; Park, S. H.; Jung, S.-C.; Ryu, C.; Jeon, J.-K.; Shin, M.-C.; Park, Y.-K.,
Production and utilization of biochar: A review. Journal of Industrial and
Engineering Chemistry 2016, 40, 1-15.
99. Sohi, S. P.; Krull, E.; Lopez-Capel, E.; Bol, R., A Review of Biochar and Its Use
and Function in Soil. In Advances in Agronomy, Elsevier: 2010; Vol. 105, pp 47-82.
100. Patra, J. M.; Panda, S. S.; Dhal, N. K., Biochar as a low-cost adsorbent for
heavy metal removal: A review. 2017, 7.
101. Qambrani, N. A.; Rahman, M. M.; Won, S.; Shim, S.; Ra, C., Biochar
properties and eco-friendly applications for climate change mitigation, waste
142
management, and wastewater treatment: A review. Renewable and Sustainable
Energy Reviews 2017, 79, 255-273.
102. Cao, X.; Sun, S.; Sun, R., Application of biochar-based catalysts in biomass
upgrading: a review. RSC Adv. 2017, 7, (77), 48793-48805.
103. Aller, M. F., Biochar properties: Transport, fate, and impact. Critical
Reviews in Environmental Science and Technology 2016, 46, (14-15), 1183-1296.
104. Xie, T.; Reddy, K. R.; Wang, C.; Yargicoglu, E.; Spokas, K., Characteristics
and Applications of Biochar for Environmental Remediation: A Review. Critical
Reviews in Environmental Science and Technology 2015, 45, (9), 939-969.
105. Domingues, R. R.; Trugilho, P. F.; Silva, C. A.; Melo, I. C. N. A. d.; Melo,
L. C. A.; Magriotis, Z. M.; Sánchez-Monedero, M. A., Properties of biochar derived
from wood and high-nutrient biomasses with the aim of agronomic and
environmental benefits. PLOS ONE 2017, 12, (5), 1-19.
106. Abdullah, H.; Mediaswanti, K. A.; Wu, H., Biochar as a Fuel: 2. Significant
Differences in Fuel Quality and Ash Properties of Biochars from Various Biomass
Components of Mallee Trees. Energy & Fuels 2010, 24, (3), 1972-1979.
107. Yip, K.; Xu, M.; Li, C.-Z.; Jiang, S. P.; Wu, H., Biochar as a Fuel: 3.
Mechanistic Understanding on Biochar Thermal Annealing at Mild Temperatures
and Its Effect on Biochar Reactivity. Energy & Fuels 2011, 25, (1), 406-414.
108. Gao, X.; Wu, H., Biochar as a Fuel: 4. Emission Behavior and
Characteristics of PM1 and PM10 from the Combustion of Pulverized Biochar in a
Drop-Tube Furnace. Energy & fuels 2011, 25, (MAIJUN), 2702-2710.
109. Oasmaa, A.; Czernik, S., Fuel Oil Quality of Biomass Pyrolysis OilsState of
the Art for the End Users. Energy & Fuels 1999, 13, (4), 914-921.
110. Diebold, J. P.; Scahill, J. W.; Czernik, S.; Phillips, S. D.; Feik, C. J.,
Progress in the Production of Hot-Gas Filtered Biocrude Oil at Nrel. In National
Renewable Energy Lab., Golden, CO, United States: 1995.
111. Xu, M.; Sheng, C., Influences of the Heat-Treatment Temperature and
Inorganic Matter on Combustion Characteristics of Cornstalk Biochars. Energy &
Fuels 2012, 26, (1), 209-218.
112. Yip, K.; Tian, F.; Hayashi, J.-i.; Wu, H., Effect of Alkali and Alkaline Earth
Metallic Species on Biochar Reactivity and Syngas Compositions during Steam
Gasification <sup>†</sup>. Energy & Fuels 2010, 24, (1), 173-181.
113. Jensen, P. A.; Stenholm, M.; Hald, P., Deposition Investigation in
Straw-Fired Boilers. Energy & Fuels 1997, 11, (5), 1048-1055.

143
114. Jenkins, B. M.; Baxter, L. L.; Jr, T. R. M.; Miles, T. R., Combustion
properties of biomass. Fuel processing technology 1998, 54, (1-3), 17-46.
115. Gabra, M.; Nordin, A.; Ohman, M.; Kjellstrom, B., Alkali retention
separation during bagasse gasiÿcation: a comparison between a uidised bed and a
cyclone gasiÿer. Biomass and Bioenergy 2001, 21, (6), 461-476.
116. Gao, X., Emission of inorganic particulate matter during the combustion of
biomass, biochar and Collie coal. 2011.
117. Srivastava, S. C.; Godiwalla, K. M.; Banerjee, M. K., Review Fuel ash
corrosion of boiler and superheater tubes. Journal of materials science 1997, 32, (4),
835-849.
118. Cutler, A. J. B.; Raask, E., External corrosion in coal-fired boilers:
Assessment from laboratory data. Corrosion Science 1981, 21, (11), 789-800.
119. Sakaguchi, M.; Watkinson, A. P.; Ellis, N., Steam Gasification of Bio-Oil
and Bio-Oil/Char Slurry in a Fluidized Bed Reactor. Energy & Fuels 2010, 24, (9),
5181-5189.
120. Hagman, H.; Backman, R.; Boström, D., Co-combustion of Animal Waste,
Peat, Waste Wood, Forest Residues, and Industrial Sludge in a 50 MW <sub>th</sub>
Circulating Fluidised-bed Boiler: Ash Transformation, Ash/Deposit Characteristics,
and Boiler Failures. Energy & Fuels 2013, 27, (10), 5617-5627.
121. Jones, F.; Niklasson, F.; Lindberg, D.; Hupa, M., Effects of Reduced Bed
Temperature in Laboratory- and Full-Scale Fluidised-bed Boilers: Particle, Deposit,
and Ash Chemistry. Energy & Fuels 2013, 27, (8), 4999-5007
122. Lynch, D.; Henihan, A. M.; Kwapinski, W.; Zhang, L.; Leahy, J. J., Ash
Agglomeration and Deposition during Combustion of Poultry Litter in a Bubbling
Fluidised-bed Combustor. Energy & Fuels 2013, 27, (8), 4684-4694.
123. Lindfors, C.; Kuoppala, E.; Oasmaa, A.; Solantausta, Y.; Arpiainen, V.,
Fractionation of Bio-Oil. Energy & Fuels 2014, 28, (9), 5785-5791.
124. Stankovikj, F.; McDonald, A. G.; Helms, G. L.; Olarte, M. V.; Garcia-Perez,
M., Characterization of the Water-Soluble Fraction of Woody Biomass Pyrolysis
Oils. Energy & Fuels 2017, 31, (2), 1650-1664.
125. Yu, Y.; Liu, D.; Wu, H., Characterization of Water-Soluble Intermediates
from Slow Pyrolysis of Cellulose at Low Temperatures. Energy & Fuels 2012, 26,
(12), 7331-7339.
144
126. Garcia-Perez, M.; Chaala, A.; Pakdel, H.; Kretschmer, D.; Roy, C.,
Characterization of bio-oils in chemical families. Biomass and Bioenergy 2007, 31,
(4), 222-242.
127. Anja Oasmaa, E. L., Päivi Koponen, Johanna Levander & Eija Tapola,
Physical characterisation of biomass-based pyrolysis liquids. VTT publication 306
1997.
128. Zhang, M.; Gao, X.; Wu, H., A Method for the Quantification of Alkali and
Alkaline Earth Metallic Species in Bioslurry Fuels. Energy & Fuels 2013, 27, (11),
6823-6830.
129. Lehto, J.; Oasmaa, A.; Solantausta, Y.; Kytö, M.; Chiaramonti, D., Fuel oil
quality and combustion of fast pyrolysis bio-oils. VTT: Espoo, 2013.
130. Garcìa-Pérez, M.; Chaala, A.; Pakdel, H.; Kretschmer, D.; Rodrigue, D.;
Roy, C., Multiphase Structure of Bio-oils. Energy & Fuels 2006, 20, (1), 364-375.
131. Darmstadt, H.; Garcia-Perez, M.; Adnot, A.; Chaala, A.; Kretschmer, D.;
Roy, C., Corrosion of Metals by Bio-Oil Obtained by Vacuum Pyrolysis of Softwood
Bark Residues. An X-ray Photoelectron Spectroscopy and Auger Electron
Spectroscopy Study. Energy & Fuels 2004, 18, (5), 1291-1301.
132. Aubin, H.; Roy, C., STUDY ON THE CORROSIVENESS OP WOOD
PYROLYSIS OILS. Fuel Science and Technology International 1990, 8, (1), 77-86
133. Oasmaa, A.; Kuoppala, E., Fast Pyrolysis of Forestry Residue. 3. Storage
Stability of Liquid Fuel. Energy & Fuels 2003, 17, (4), 1075-1084.
134. Diebold, J. P.; Czernik, S., Additives To Lower and Stabilize the Viscosity
of Pyrolysis Oils during Storage. Energy & Fuels 1997, 11, (5), 1081-1091.
135. Lu, Q.; Li, W.-Z.; Zhu, X.-F., Overview of fuel properties of biomass fast
pyrolysis oils. Energy Conversion and Management 2009, 50, (5), 1376-1383.
136. Wall, T. F., Mineral matter transformations and ash deposition in pulverised
coal combustion. Symposium (International) on Combustion 1992, 24, (1),
1119-1126.
137. Tsai, S. C.; Vu, T., Atomization of coal-water slurry using twin-fluid jet
atomizer. Fuel 1987, 66, (11), 1596-1602.
138. Lefebvre, A. H.; McDonell, V. G., Atomization and Sprays. CRC Press:
2017.
139. Lefebvre, A., Atomization and Sprays. CRC Press: 1988.
145
140. Scholze, B.; Meier, D., Characterization of the water-insoluble fraction from
pyrolysis oil (pyrolytic lignin). Part I. PY–GC/MS, FTIR, and functional groups.
Journal of Analytical and Applied Pyrolysis 2001, 60, (1), 41-54.
141. Zheng, X.; Fu, Y.; Chang, J.; Liang, S., Classified Separation of Flash
Pyrolysis Oil. BioEnergy Research 2013, 6, (4), 1165-1172.
142. Xu, D.; Savage, P. E., Effect of temperature, water loading, and Ru/C
catalyst on water-insoluble and water-soluble biocrude fractions from hydrothermal
liquefaction of algae. Bioresource Technology 2017, 239, 1-6.
143. Garcia-Perez, M.; Wang, S.; Shen, J.; Rhodes, M.; Lee, W. J.; Li, C.-Z.,
Effects of Temperature on the Formation of Lignin-Derived Oligomers during the
Fast Pyrolysis of Mallee Woody Biomass. Energy & Fuels 2008, 22, (3), 2022-2032.
144. Chen, H.-W.; Song, Q.-H.; Liao, B.; Guo, Q.-X., Further Separation,
Characterization, and Upgrading for Upper and Bottom Layers from Phase
Separation of Biomass Pyrolysis Oils. Energy & Fuels 2011, 25, (10), 4655-4661.
145. Sanna, A.; Vispute, T. P.; Huber, G. W., Hydrodeoxygenation of the
aqueous fraction of bio-oil with Ru/C and Pt/C catalysts. Applied Catalysis B:
Environmental 2015, 165, 446-456.
146. Ortiz-Toral, P. J.; Satrio, J.; Brown, R. C.; Shanks, B. H., Steam Reforming
of Bio-oil Fractions: Effect of Composition and Stability. Energy & Fuels 2011, 25,
(7), 3289-3297.
147. Meng, J.; Moore, A.; Tilotta, D.; Kelley, S.; Park, S., Toward Understanding
of Bio-Oil Aging: Accelerated Aging of Bio-Oil Fractions. ACS Sustainable
Chemistry & Engineering 2014, 2, (8), 2011-2018.
148. Qin, F.; Cui, H.; Yi, W.; Wang, C., Upgrading the Water-Soluble Fraction
of Bio-oil by Simultaneous Esterification and Acetalation with Online Extraction.
Energy & Fuels 2014, 28, (4), 2544-2553.
149. Scholze, B.; Hanser, C.; Meier, D., Characterization of the water-insoluble
fraction from fast pyrolysis liquids (pyrolytic lignin): Part II. GPC, carbonyl goups,
and 13C-NMR. Journal of Analytical and Applied Pyrolysis 2001, 58, (Supplement
C), 387-400.
150. Sipilä, K.; Kuoppala, E.; Fagernäs, L.; Oasmaa, A., Characterization of
biomass-based flash pyrolysis oils. Biomass and Bioenergy 1998, 14, (2), 103-113.
151. Kechagiopoulos, P. N.; Voutetakis, S. S.; Lemonidou, A. A.; Vasalos, I. A.,
Hydrogen Production via Steam Reforming of the Aqueous Phase of Bio-Oil in a
Fixed Bed Reactor. Energy & Fuels 2006, 20, (5), 2155-2163.
146
152. Basagiannis, A. C.; Verykios, X. E., Steam reforming of the aqueous
fraction of bio-oil over structured Ru/MgO/Al2O3 catalysts. Catalysis Today 2007,
127, (1-4), 256-264.
153. Wei, Y.; Lei, H.; Wang, L.; Zhu, L.; Zhang, X.; Liu, Y.; Chen, S.; Ahring,
B., Liquid–Liquid Extraction of Biomass Pyrolysis Bio-oil. Energy & Fuels 2014, 28,
(2), 1207-1212.
154. Elkasabi, Y.; Mullen, C. A.; Boateng, A. A., Aqueous Extractive Upgrading
of Bio-Oils Created by Tail-Gas Reactive Pyrolysis To Produce Pure Hydrocarbons
and Phenols. ACS Sustainable Chemistry & Engineering 2015, 3, (11), 2809-2816.
155. Sharma, R. K.; Bakhshi, N. N., Catalytic upgrading of pyrolysis oil. Energy
& Fuels 1993, 7, (2), 306-314.
156. Bertero, M.; de la Puente, G.; Sedran, U., Fuels from bio-oils: Bio-oil
production from different residual sources, characterization and thermal conditioning.
Fuel 2012, 95, 263-271.
157. Ba, T.; Chaala, A.; Garcia-Perez, M.; Rodrigue, D.; Roy, C., Colloidal
Properties of Bio-oils Obtained by Vacuum Pyrolysis of Softwood Bark.
Characterization of Water-Soluble and Water-Insoluble Fractions. Energy & Fuels
2004, 18, (3), 704-712.
158. Bayerbach, R.; Meier, D., Characterization of the water-insoluble fraction
from fast pyrolysis liquids (pyrolytic lignin). Part IV: Structure elucidation of
oligomeric molecules. Journal of Analytical and Applied Pyrolysis 2009, 85, (1),
98-107.
159. Bayerbach, R.; Nguyen, V. D.; Schurr, U.; Meier, D., Characterization of
the water-insoluble fraction from fast pyrolysis liquids (pyrolytic lignin): Part III.
Molar mass characteristics by SEC, MALDI-TOF-MS, LDI-TOF-MS, and Py-FIMS.
Journal of Analytical and Applied Pyrolysis 2006, 77, (2), 95-101.
160. Mullen, C. A.; Boateng, A. A., Characterization of water insoluble solids
isolated from various biomass fast pyrolysis oils. Journal of Analytical and Applied
Pyrolysis 2011, 90, (2), 197-203.
161. Zakzeski, J.; Bruijnincx, P. C. A.; Jongerius, A. L.; Weckhuysen, B. M., The
Catalytic Valorization of Lignin for the Production of Renewable Chemicals.
Chemical Reviews 2010, 110, (6), 3552-3599.
162. Mohamed Abdel Raouf Mohamed, M. Development of non-petroleum
binders derived from fast pyrolysis bio-oils for use in flexible pavement. Iowa State
University, Ames, Iowa, 2010.

147
163. Williams, R. C.; Satrio, J.; Rover, M.; Brown, R. C.; Teng, S., Utilization of
Fractionated Bio-Oil in Asphalt. In Washington, D.C., 2009; pp 11-15.
164. Nakos, P.; Tsiantzi, S.; Athanassiadou, E., Wood Adhesives Made with
Pyrolysis Oils. In Maritim-Airport Hotel, Hanover, Germany, 2001; p 14.
165. Deshmukh, S.; Bharambe, D. P., Wax Dispersant Additives for Improving
the Low Temperature Flow Behavior of Waxy Crude Oil. Energy Sources, Part A:
Recovery, Utilization, and Environmental Effects 2012, 34, (12), 1121-1129.
166. Krishna, C. R.; Thomassen, K.; Brown, C.; Butcher, T. A.; Anjom, M.;
Mahajan, D., Cold Flow Behavior of Biodiesels Derived from Biomass Sources.
Industrial & Engineering Chemistry Research 2007, 46, (26), 8846-8851.
167. Lu, J.-J.; Chen, W.-H., Investigation on the ignition and burnout
temperatures of bamboo and sugarcane bagasse by thermogravimetric analysis.
Applied Energy 2015, 160, 49-57.
168. Li, X. G.; Lv, Y.; Ma, B. G.; Jian, S. W.; Tan, H. B., Thermogravimetric
investigation on co-combustion characteristics of tobacco residue and high-ash
anthracite coal. Bioresource Technology 2011, 102, (20), 9783-9787.
169. Li, J.; Paul, M. C.; Czajka, K. M., Studies of Ignition Behavior of Biomass
Particles in a Down-Fire Reactor for Improving Co-firing Performance. Energy &
Fuels 2016, 30, (7), 5870-5877.
170. Li, X.-g.; Ma, B.-g.; Xu, L.; Hu, Z.-w.; Wang, X.-g., Thermogravimetric
analysis of the co-combustion of the blends with high ash coal and waste tyres.
Thermochimica Acta 2006, 441, (1), 79-83.
171. Tognotti, L.; Malotti, A.; Petarca, L.; Zanelli, S., Measurement of Ignition
Temperature of Coal Particles Using a Thermogravimetric Technique. Combustion
Science and Technology 1985, 44, (1-2), 15-28.
172. Zhang, D.-k.; Wall, T. F., Ignition of coal particles: the influence of
experimental technique. Fuel 1994, 73, (7), 1114-1119.
173. Zuleta, E. C.; Rios, L. A.; Benjumea, P. N., Oxidative stability and cold
flow behavior of palm, sacha-inchi, jatropha and castor oil biodiesel blends. Fuel
Processing Technology 2012, 102, 96-101.
174. Rick, F.; Vix, U., Product Standards for Pyrolysis Products for Use as Fuel
in Industrial Firing Plants. In Biomass Pyrolysis Liquids Upgrading and Utilization,
Bridgwater, A. V.; Grassi, G., Eds. Springer Netherlands: Dordrecht, 1991; pp
177-218.
148
175. Dunn, R. O.; Honary, L.; Conconi, C.; Dean, S. W., Cold Flow Properties of
Biodiesel by Automatic and Manual Analysis Methods. Journal of ASTM
International 2010, 7, (4), 102618.
176. Dunn, R. O., Low-temperature flow properties of vegetable oil/cosolvent
blend diesel fuels. Journal of the American Oil Chemists' Society 2002, 79, (7),
709-715.
177. Dunn, R. O., Improving the cold flow properties of biodiesel by
fractionation. INTECH Open Access Publisher: 2011.
178. Claudy, P.; Letoffe, J.-M.; Neff, B.; Damin, B., Diesel Fuels: Determination
of Onset Crystallization Temperature, Pour Point and Filter Plugging Point by
Differential Scanning Calorimetry(DSC). Correlation with Standard Test Methods.
Fuel 1986, 65, 861-864.
179. Garcia-Perez, M.; Adams, T. T.; Goodrum, J. W.; Das, K. C.; Geller, D. P.,
DSC studies to evaluate the impact of bio-oil on cold flow properties and oxidation
stability of bio-diesel. Bioresource Technology 2010, 101, (15), 6219-6224.
180. Dunn, R. O., Effects of Monoacylglycerols on the Cold Flow Properties of
Biodiesel. Journal of the American Oil Chemists' Society 2012, 89, (8), 1509-1520.
181. Dunn, R. O., Thermal analysis of alternative diesel fuels from vegetable oils.
Journal of the American Oil Chemists' Society 1999, 76, (1), 109–115.
182. Dunn, R. O., Effects of minor constituents on cold flow properties and
performance of biodiesel. Progress in Energy and Combustion Science 2009, 35, (6),
481-489.
183. Knothe, G.; Dunn, R. O., A Comprehensive Evaluation of the Melting
Points of Fatty Acids and Esters Determined by Differential Scanning Calorimetry.
Journal of the American Oil Chemists' Society 2009, 86, (9), 843-856.
184. Gollakota, A. R. K.; Reddy, M.; Subramanyam, M. D.; Kishore, N., A
review on the upgradation techniques of pyrolysis oil. Renewable and Sustainable
Energy Reviews 2016, 58, 1543-1568.
185. Si, Z.; Zhang, X.; Wang, C.; Ma, L.; Dong, R., An Overview on Catalytic
Hydrodeoxygenation of Pyrolysis Oil and Its Model Compounds. Catalysts 2017, 7,
(12), 169.
186. Zhang, Q.; Chang, J.; Wang; Xu, Y., Upgrading Bio-oil over Different Solid
Catalysts. Energy & Fuels 2006, 20, (6), 2717-2720.
149
187. Saidi, M.; Samimi, F.; Karimipourfard, D.; Nimmanwudipong, T.; Gates, B.
C.; Rahimpour, M. R., Upgrading of lignin-derived bio-oils by catalytic
hydrodeoxygenation. Energy & Environmental Science 2013, 7, (1), 103-129.
188. Adjaye, J. D.; Bakhshi, N. N., Production of hydrocarbons by catalytic
upgrading of a fast pyrolysis bio-oil. Part II: Comparative catalyst performance and
reaction pathways. Fuel Processing Technology 1995, 45, (3), 185–202.
189. Adjaye, J. D.; Bakhshi, N. N., Production of hydrocarbons by catalytic
upgrading of a fast pyrolysis bio-oil. Part I: Conversion over various catalysts. Fuel
Processing Technology 1995, 45, (3), 161–183.
190. Lin, C.-Y.; Chen, L.-W., Emulsification characteristics of three- and
two-phase emulsions prepared by the ultrasonic emulsification method. Fuel
Processing Technology 2006, 87, (4), 309-317.
191. Lin, C.; Chen, L., Engine performance and emission characteristics of
three-phase diesel emulsions prepared by an ultrasonic emulsification method. Fuel
2006, 85, (5-6), 593-600.
192. Prakash, R.; Singh, R. K.; Murugan, S., Experimental investigation on a
diesel engine fueled with bio-oil derived from waste wood–biodiesel emulsions.
Energy 2013, 55, 610-618.
193. Prakash, R.; Singh, R. K.; Murugan, S., Experimental Studies on a Diesel
Engine Fueled withWood Pyrolysis Oil Diesel Emulsions. International Journal of
Chemical Engineering and Applications 2011, 395-399.
194. Prakash, R.; Singh, R. K.; Murugan, S., Experimental studies on combustion,
performance and emission characteristics of diesel engine using different biodiesel
bio oil emulsions. Journal of the Energy Institute 2015, 88, (1), 64-75.
195. Hernández, J. F.; Morlá, J. C., Fuel Emulsions Using Biomass Pyrolysis
Products as an Emulsifier Agent. Energy & Fuels 2003, 17, (2), 302-307.
196. Yin, Q.; Wang, S.; Li, X.; Guo, Z.; Gu, Y., Review of Bio-oil Upgrading
Technologies and Experimental Study on Emulsification of Bio-oil and Diesel. In
2010 International Conference on Optoelectronics and Image Processing, IEEE:
Haiko, Hainan, China, 2010; pp 343-347.
197. Guo, Z.; Wang, S.; Wang, X., Stability mechanism investigation of
emulsion fuels from biomass pyrolysis oil and diesel. Energy 2014, 66, 250-255.
198. Wang, X.-l.; Yuan, X.-z.; Huang, H.-j.; Leng, L.-j.; Li, H.; Peng, X.; Wang,
H.; Liu, Y.; Zeng, G.-m., Study on the solubilization capacity of bio-oil in diesel by
microemulsion technology with Span80 as surfactant. Fuel Processing Technology
2014, 118, 141-147.
150
199. Li, Y.; Wang, T.; Liang, W.; Wu, C.; Ma, L.; Zhang, Q.; Zhang, X.; Jiang,
T., Ultrasonic Preparation of Emulsions Derived from Aqueous Bio-oil Fraction and
0# Diesel and Combustion Characteristics in Diesel Generator. Energy & Fuels 2010,
24, (3), 1987-1995.
200. Jiang, X.; Ellis, N., Upgrading Bio-oil through Emulsification with
Biodiesel: Thermal Stability. Energy & Fuels 2010, 24, (4), 2699-2706.
201. Prakash, R.; Singh, R. K.; Murugan, S., Use of Biodiesel and Bio-oil
Emulsions as an Alternative Fuel for Direct Injection Diesel Engine. Waste and
Biomass Valorization 2013, 4, (3), 475-484.
202. Ikura, M.; Mirmiran, S.; Stanciulescu, M.; Sawatzky, H. Pyrolysis
liquid-in-diesel oil microemulsion. 1998.
203. Chiaramonti, D.; Bonini, M.; Fratini, E.; Tondi, G.; Gartner, K.; Bridgwater,
A. V.; Grimm, H. P.; Soldaini, I.; Webster, A.; Baglioni, P., Development of
emulsions from biomass pyrolysis liquid and diesel and their use in engines—Part 2:
tests in diesel engines. Biomass and Bioenergy 2003, 25, (1), 101-111.
204. Huber, G. W.; Iborra, S.; Corma, A., Synthesis of Transportation Fuels from
Biomass: Chemistry, Catalysts, and Engineering. Chemical Reviews 2006, 106, (9),
4044-4098.
205. Bridgwater, A. V., Upgrading Fast Pyrolysis Liquids. In Thermochemical
Processing of Biomass, Wiley-Blackwell: 2011; pp 157-199.
206. French, R.; Czernik, S., Catalytic pyrolysis of biomass for biofuels
production. Fuel Processing Technology 2010, 91, (1), 25-32.
207. Trane, R.; Dahl, S.; Skjøth-Rasmussen, M. S.; Jensen, A. D., Catalytic
steam reforming of bio-oil. International Journal of Hydrogen Energy 2012, 37, (8),
6447-6472.
208. Wang, W.; Wang, Y.; Liu, Y., Production of hydrogen by ethanol steam
reforming over nickel–metal oxide catalysts prepared via urea–nitrate combustion
method. International Journal of Energy Research 2011, 35, (6), 501-506.
209. Zhang, M.; Wu, H., Stability of emulsion fuels prepared from fast pyrolysis
bio-oil and glycerol. Fuel 2017, 206, 230-238.
210. Zhang, M.; Yewe-Siang Lee Shee We, M.; Wu, H., Direct emulsification of
crude glycerol and bio-oil without addition of surfactant via ultrasound and
mechanical agitation. Fuel 2018, 227, 183-189.
211. Zhang, M.; Shen, Q.; Wu, H., Adsorption Characteristics of Bio-oil on
Biochar in Bioslurry Fuels Energy & Fuels 2017, 31, (9), 9619-9626.
151
212. Patzer, R.; Norris, M.; Doering, A.; Jorgenson, R.; Neece, C.; Zimmerli, B.,
Stack Emissions Evaluation: Combustion of Crude Glycerin and Yellow Grease in an
Industrial Fire Tube Boiler. Agricultural Utilization Research Institute, Marshall,
MN, USA, 2007.
213. Fernando, S.; Adhikari, S.; Kota, K.; Bandi, R., Glycerol based automotive
fuels from future biorefineries. Fuel 2007, 86, (17-18), 2806-2809.
214. Leoneti, A. B.; Aragão-Leoneti, V.; de Oliveira, S. V. W. B., Glycerol as a
by-product of biodiesel production in Brazil: Alternatives for the use of unrefined
glycerol. Renewable Energy 2012, 45, 138-145.
215. Dahmen, N.; Henrich, E.; Dinjus, E.; Weirich, F., The bioliq® bioslurry
gasification process for the production of biosynfuels, organic chemicals, and energy.
Energy, Sustainability and Society 2012, 2, (1), 3.
216. Zhang, M.; Shen, Q.; Wu, H., Adsorption Characteristics of Bio-oil on
Biochar in Bioslurry Fuels. Energy & Fuels 2017, 31, (9), 9619-9626.
217. Wang, Y.; Mourant, D.; Hu, X.; Zhang, S.; Lievens, C.; Li, C.-Z., Formation
of coke during the pyrolysis of bio-oil. Fuel 2013, 108, 439-444.
218. Wang, Y.; Li, X.; Mourant, D.; Gunawan, R.; Zhang, S.; Li, C.-Z.,
Formation of Aromatic Structures during the Pyrolysis of Bio-oil. Energy & Fuels
2012, 26, (1), 241-247.
219. Wang, Y.; Hu, X.; Mourant, D.; Song, Y.; Zhang, L.; Lievens, C.; Xiang, J.;
Li, C.-Z., Evolution of aromatic structures during the reforming of bio-oil:
Importance of the interactions among bio-oil components. Fuel 2013, 111, 805-812.
220. Wang, Y.; Hu, X.; Song, Y.; Min, Z.; Mourant, D.; Li, T.; Gunawan, R.; Li,
C.-Z., Catalytic steam reforming of cellulose-derived compounds using a
char-supported iron catalyst. Fuel Processing Technology 2013, 116, 234-240.
221. Ramachandran, R. P. B.; Rossum, G. v.; Swaaij, W. P. M. v.; Kersten, S. R.
A., Evaporation of biomass fast pyrolysis oil: Evaluation of char formation.
Environmental Progress & Sustainable Energy 2009, 28, (3), 410-417.
222. Sanna, A.; Ogbuneke, K.; Andrésen, J. M., Bio-coke from upgrading of
pyrolysis bio-oil for co-firing. Fuel 2009, 88, (12), 2340-2347.
223. Wang, D.; Czernik, S.; Montané, D.; Mann, M.; Chornet, E., Biomass to
Hydrogen via Fast Pyrolysis and Catalytic Steam Reforming of the Pyrolysis Oil or
Its Fractions. Industrial & Engineering Chemistry Research 1997, 36, (5),
1507-1518.

152
224. Milne, T. A.; Evans, R. J.; Abatzaglou, N., Biomass Gasifier ''Tars'': Their
Nature, Formation, and Conversion. In National Renewable Energy Laboratory,
Golden, CO (US): 1998.
225. Gayubo, A. G.; Valle, B.; Aguayo, A. T.; Olazar, M.; Bilbao, J., Pyrolytic
lignin removal for the valorization of biomass pyrolysis crude bio-oil by catalytic
transformation. Journal of Chemical Technology & Biotechnology 2010, 85, (1),
132-144.
226. Barrie, J.; Peter, M., Industrial and Process Furnaces - 2nd Edition.
Butterworth-Heinemann: 2013.
227. Xiu, S.; Rojanala, H. K.; Shahbazi, A.; Fini, E. H.; Wang, L., Pyrolysis and
combustion characteristics of Bio-oil from swine manure. Journal of Thermal
Analysis and Calorimetry 2012, 107, (2), 823-829.
228. Yang, S. I.; Wu, M. S., The droplet combustion and thermal characteristics
of pinewood bio-oil from slow pyrolysis. Energy 2017, 141, 2377-2386.
229. Feng, C.; Gao, X.; Wu, H., Emission of particulate matter during the
combustion of bio-oil and its fractions under air and oxyfuel conditions. Proceedings
of the Combustion Institute 2017, 36, (3), 4061-4068.
230. Feng, C.; Gao, X.; Wu, H., Particulate matter emission from bio-oil
incomplete combustion under conditions relevant to stationary applications. Fuel
2016, 171, 143-150.
231. Pradana, Y. S.; Budiman, A., BIO-SYNGAS DERIVED FROM
INDONESIAN OIL PALM EMPTY FRUIT BUNCH (EFB) USING
MIDDLE-SCALE GASIFICATION. Journal of Engineering Science and
Technology 2015, 10, 1-8.
232. Venderbosch, R. H.; van de Beld, L.; Prins, W., ENTRAINED FLOW
GASIFICATION OF BIO-OIL FOR SYNTHESIS GAS. 2002, 5.
233. Zhang, Y.; Brown, T. R.; Hu, G.; Brown, R. C., Comparative
techno-economic analysis of biohydrogen production via bio-oil gasification
and bio-oil reforming. Biomass and Bioenergy 2013, 51, 99-108.
234. Zhang, M.; Chen, H.-P.; Gao, Y.; He, R.-X.; Yang, H.-P.; Wang, X.-H.;
Zhang, S.-H., EXPERIMENTAL STUDY ON BIO-OIL
PYROLYSIS/GASIFICATION. 2010, 12.
235. Scala, F.; Chirone, R.; Salatino, P., The influence of fine char particles
burnout on bed agglomeration during the fluidized bed combustion of a biomass fuel.
Fuel Processing Technology 2003, 84, (1), 229-241.
153
236. Garba, M. U.; Ingham, D. B.; Ma, L.; Degereji, M. U.; Pourkashanian, M.;
Williams, A., Modelling of deposit formation and sintering for the co-combustion of
coal with biomass. Fuel 2013, 113, 863-872.
237. Siegell, J. H., High-temperature de fluidization. Powder Technology 1984,
38, (1), 13-22.
238. Burton, A.; Wu, H., Quantification of Interactions between Sand and
Pyrolyzing Biomass Particles in Fluidised-bed under Fast Pyrolysis Conditions
Pertinent to Bio-Oil Production. Industrial & Engineering Chemistry Research 2015,
54, (32), 7990-7997.
239. Takaizumi, K.; Wakabayashi, T., The freezing process in methanol-,
ethanol-, and propanol-water systems as revealed by differential scanning
calorimetry. Journal of solution chemistry 1997, 26, (10), 927–939.
240. Li, M.; Zhang, M.; Yu, Y.; Wu, H., Ternary System of Pyrolytic Lignin,
Mixed-Solvent and Water: Phase Diagram and Implications. Energy & Fuels 2018,
32, (1), 465-474.
241. Boucher, M. E.; Chaala, A.; Pakdel, H.; Roy, C., Bio-oils obtained by
vacuum pyrolysis of softwood bark as a liquid fuel for gas turbines. Part II: Stability
and ageing of bio-oil and its blends with methanol and a pyrolytic aqueous phase.
Biomass and Bioenergy 2000, 19, (5), 351-361.
242. Naske, C. D.; Polk, P.; Wynne, P. Z.; Speed, J.; Holmes, W. E.; Walters, K.
B., Postcondensation Filtration of Pine and Cottonwood Pyrolysis Oil and Impacts on
Accelerated Aging Reactions. Energy & Fuels 2012, 26, (2), 1284-1297.
243. Ren, X.; Meng, J.; Moore, A. M.; Chang, J.; Gou, J.; Park, S.,
Thermogravimetric investigation on the degradation properties and combustion
performance of bio-oils. Bioresource Technology 2014, 152, 267-274.
244. Ibrahim, N.; Jensen, P. A.; Dam-Johansen, K.; Hamid, M. K. A.; Kasmani,
R. M.; Ali, R. R., Experimental Investigation of Combustion Behavior of Flash
Pyrolysis Oil. In Developments in Sustainable Chemical and Bioprocess Technology,
Pogaku, R.; Bono, A.; Chu, C., Eds. Springer US: Boston, MA, 2013; pp 181-187.
245. Crnkovic, P. M.; Koch, C.; Ávila, I.; Mortari, D. A.; Cordoba, A. M.;
Moreira dos Santos, A., Determination of the activation energies of beef tallow and
crude glycerin combustion using thermogravimetry. Biomass and Bioenergy 2012,
44, 8-16.
246. Weng, L.; Li, W.; Zuo, J., DSC determination of partial ternary phase
diagrams of methanol/sodium chloride/water and propylene glycol/sodium
154
chloride/water and their applications for synthesized diagrams. Thermochimica Acta
2011, 512, (1–2), 225-232.
247. Standard, A., AS 1038.6.1—1997 (2013). Coal and Coke—Analysis and
Testing. Part 6.1: Higher Rank Coal and Coke—Ultimate Analysis—Carbon and
Hydrogen. In Standard Australia: Sydney, Australia, 2013.
248. Sheng, C.; Azevedo, J. L. T., Estimating the higher heating value of biomass
fuels from basic analysis data. Biomass and Bioenergy 2005, 28, (5), 499-507.
249. Mohan, D.; Pittman, C. U.; Steele, P. H., Pyrolysis of Wood/Biomass for
Bio-oil: A Critical Review. Energy & Fuels 2006, 20, (3), 848-889.
250. Mellin, P.; Kantarelis, E.; Yang, W., Computational fluid dynamics
modeling of biomass fast pyrolysis in a fluidized bed reactor, using a comprehensive
chemistry scheme. Fuel 2014, 117, Part A, 704-715.
251. Zhou, S.; Garcia-Perez, M.; Pecha, B.; McDonald, A. G.; Westerhof, R. J.
M., Effect of particle size on the composition of lignin derived oligomers obtained by
fast pyrolysis of beech wood. Fuel 2014, 125, 15-19.
252. Gao, X.; Wu, H., Aerodynamic Properties of Biochar Particles: Effect of
Grinding and Implications. Environmental Science & Technology Letters 2014, 1, (1),
60-64.
253. Henrich, E.; Weirich, F., Pressurized Entrained Flow Gasifiers for Biomass.
Environmental Engineering Science 2004, 21, 53-64.
254. Abdullah, H.; Wu, H., Bioslurry as a Fuel. 4. Preparation of Bioslurry Fuels
from Biochar and the Bio-oil-Rich Fractions after Bio-oil/Biodiesel Extraction.
Energy & Fuels 2011, 25, 1759-1771.
255. Zhang, M.; Wu, H., Bioslurry as a Fuel. 6. Leaching Characteristics of
Alkali and Alkaline Earth Metallic Species from Biochar by Bio-oil Model
Compounds. Energy & Fuels 2015, 29, 2535−2541.
256. Ghezelchi, M. H.; Garcia-Perez, M.; Wu, H., Bioslurry as a Fuel. 7: Spray
Characteristics of Bio-Oil and Bioslurry via Impact and Twin-Fluid Atomizers.
Energy & Fuels 2015, 29, 8058–8065.
257. Chen, G.; Yao, J.; Liu, J.; Yan, B.; Shan, R., Biomass to hydrogen-rich
syngas via catalytic steam gasification of bio-oil/biochar slurry. Bioresource
Technology 2015, 198, 108-114.
258. Delgado, R.; Rosas, J. G.; Gómez, N.; Martínez, O.; Sanchez, M. E.; Cara, J.,
Energy valorisation of crude glycerol and corn straw by means of slow co-pyrolysis:
Production and characterisation of gas, char and bio-oil. Fuel 2013, 112, (0), 31-37.
155
259. Leng, L.; Yuan, X.; Zeng, G.; Chen, X.; Wang, H.; Li, H.; Fu, L.; Xiao, Z.;
Jiang, L.; Lai, C., Rhamnolipid based glycerol-in-diesel microemulsion fuel:
Formation and characterization. Fuel 2015, 147, (0), 76-81.
260. Okoye, P. U.; Hameed, B. H., Review on recent progress in catalytic
carboxylation and acetylation of glycerol as a byproduct of biodiesel production.
Renewable and Sustainable Energy Reviews 2016, 53, 558-574.
261. Glycerine Producers, A., Physical properties of glycerine and its solutions.
Glycerine Producers' Association: New York, 1963.
262. Cheong, W. J.; Carr, P. W., The Surface Tension of Mixtures of Methanol,
Acetonitrile, Tetrahydrofuran, Isopropanol, Tertiary Butanol and Dimethyl-Sulfoxide
with Water at 25°C. Journal of Liquid Chromatography 1987, 10, (4), 561-581.
263. Oasmaa, A.; Kuoppala, E.; Selin, J.-F.; Gust, S.; Solantausta, Y., Fast
Pyrolysis of Forestry Residue and Pine. 4. Improvement of the Product Quality by
Solvent Addition. Energy & Fuels 2004, 18, (5), 1578-1583.
264. Gao, W.; Zhang, M.; Wu, H., Ignition temperatures of various bio-oil based
fuel blends and slurry fuels. Fuel 2017, 207, 240-243.
265. Gao, W.; Zhang, M.; Wu, H., Fuel properties and ageing of bioslurry
prepared from glycerol/methanol/bio-oil blend and biochar. Fuel 2016, 176, 72-77.
266. Vamvuka, D.; Tsamourgeli, V.; Galetakis, M., Study on Catalytic
Combustion of Biomass Mixtures with Poor Coals. Combustion Science and
Technology 2014, 186, (1), 68-82.
267. Liu, G., Development of low-temperature properties on biodiesel fuel: a
review. International Journal of Energy Research 2015, 39, (10), 1295-1310.
268. Tasnadi-Asztalos, Z.; Agachi, P.-S.; Cormos, C.-C., Evaluation of energy
efficient low carbon hydrogen production concepts based on glycerol residues from
biodiesel production. International Journal of Hydrogen Energy 2015, 40, (22),
7017-7027.
269. Xiao, Y.; Xiao, G.; Varma, A., A Universal Procedure for Crude Glycerol
Purification from Different Feedstocks in Biodiesel Production: Experimental and
Simulation Study. Industrial & Engineering Chemistry Research 2013, 52, (39),
14291-14296.
270. Standard Test Method for Cloud Point of Petroleum Products and Liquid
Fuels. In ASTM International: 2016.
271. van Koningsveld, H., The crystal structure of glycerol and its conformation.
Recueil des Travaux Chimiques des Pays-Bas 1968, 87, (3), 243-254.

156
272. Lane, L. B., Freezing Points of Glycerol and Its Aqueous Solutions.
Industrial & Engineering Chemistry 1925, 17, (9), 924-924.
273. Pingping, Z.; Dezhu, M., Study on the double cold crystallization peaks of
poly (ethylene terephthalate) 3. The influence of the addition of calcium carbonate
(CaCO 3). European polymer journal 2000, 36, (11), 2471–2475.
274. Zabarnick, S.; Widmor, N., Studies of Jet Fuel Freezing by Differential
Scanning Calorimetry. Energy & Fuels 2001, 15, (6), 1447-1453.
275. Jones, H. C., The nature of solution. Journal of the Franklin Institute 1912,
173, (3), 217-238.
276. Chen, C. S.; Steven, N., Prediction and Correlation of Freezing Point
Depression of Aqueous Solutions. 1987, 30, (4).
277. Chen, C. S., Sorption Isotherm and Freezing Point Depression Equations of
Glycerol Solutions. 1987, 30, (1).
278. Westwell, M. S.; Searle, M. S.; Wales, D. J.; Williams, D. H., Empirical
correlations between thermodynamic properties and intermolecular forces. Journal of
the American Chemical Society 1995, 117, (18), 5013–5015.
279. Katritzky, A. R.; Jain, R.; Lomaka, A.; Petrukhin, R.; Maran, U.; Karelson,
M., Perspective on the Relationship between Melting Points and Chemical Structure.
Crystal Growth & Design 2001, 1, (4), 261-265.
280. Czernik, S.; Bridgwater, A. V., Overview of Applications of Biomass Fast
Pyrolysis Oil. Energy Fuels 2004, 18, (2), 590-598.
281. Mohan, D.; Pittman, C. U.; Steele, P. H., Pyrolysis of Wood/Biomass for
Bio-oil: A Critical Review. Energy Fuels 2006, 20, (3), 848-889.
282. Solantausta, Y.; Oasmaa, A.; Sipilä, K.; Lindfors, C.; Lehto, J.; Autio, J.;
Jokela, P.; Alin, J.; Heiskanen, J., Bio-oil Production from Biomass: Steps toward
Demonstration. Energy & Fuels 2012, 26, (1), 233-240.
283. Eldabbagh, F.; Ramesh, A.; Hawari, J.; Hutny, W.; Kozinski, J. A.,
Particle–metal interactions during combustion of pulp and paper biomass in a
fluidized bed combustor. Combustion and Flame 2005, 142, (3), 249-257.
284. Ennis, C. J.; Garry Evans, A.; Islam, M.; Komang Ralebitso-Senior, T.;
Senior, E., Biochar: Carbon Sequestration, Land Remediation, and Impacts on Soil
Microbiology. Critical reviews in environmental science and technology 2012, 42,
(21-24), 2311-2364.
157
285. Galgano, A.; Salatino, P.; Crescitelli, S.; Scala, F.; Maffettone, P. L., A
model of the dynamics of a fluidized bed combustor burning biomass. Combustion
and Flame 2005, 140, (4), 371-384.
286. Dennis, J. S.; Hayhurst, A. N.; Scott, S. A., The combustion of large
particles of char in bubbling fluidized beds: The dependence of Sherwood number
and the rate of burning on particle diameter. Combustion and Flame 2006, 147, (3),
185-194.
287. Chirone, R.; Salatino, P.; Scala, F.; Solimene, R.; Urciuolo, M., Fluidized
bed combustion of pelletized biomass and waste-derived fuels. Combustion and
Flame 2008, 155, (1), 21-36.
288. Hupa, M., Ash-Related Issues in Fluidised-bed Combustion of Biomasses:
Recent Research Highlights. Energy & Fuels 2012, 26, (1), 4-14.
Every reasonable effort has been made to acknowledge the owners of copyright
material. I would be pleased to hear from any copyright owner who has been
omitted or incorrectly acknowledged.
158
APPENDIXⅠ: ATTRIBUTION TABLES
A. Fuel properties and ageing of bioslurry prepared from glycerol/methanol/bio-oil
blend and biochar, Wenran Gao; Mingming Zhang; Hongwei Wu*, Fuel, 2016,
176, 72-77.
Authors and full affiliations:
Conception
and design
Experiments
conduction &
data acquisition
Data
processing
& analysis
Interpretation
& discussion
Manuscript
writing,
revision and
finalisation
Final
Approval
Mingming
Zhang
× × × ×
I acknowledge that these represent my contribution to the above research output.
Sign:
Hongwei
Wu
× × × × ×
I acknowledge that these represent my contribution to the above research output.
Sign:
159
B. Ignition temperatures of various bio-oil based fuel blends and slurry fuels,
Wenran Gao; Mingming Zhang; Hongwei Wu*, Fuel, 2017, 207, 240-243.
Authors and full affiliations:
Conception
and design
Experiments
conduction &
data acquisition
Data
processing
& analysis
Interpretation
& discussion
Manuscript
writing,
revision and
finalisation
Final
Approval
Mingming
Zhang
× × × ×
I acknowledge that these represent my contribution to the above research output.
Sign:
Hongwei
Wu
× × × × ×
I acknowledge that these represent my contribution to the above research output.
Sign:

160
C. Differential scanning calorimetry studies on the cold flow properties of fuel
mixtures from bio-oil, crude glycerol, methanol, and/or biochar, Wenran Gao;
Mingming Zhang; Hongwei Wu*, Energy & Fuels, 2017, 31 (8), 8348-8355.
Authors and full affiliations:
Conception
and design
Experiments
conduction &
data acquisition
Data
processing
& analysis
Interpretation
& discussion
Manuscript
writing,
revision and
finalisation
Final
Approval
Mingming
Zhang
× × × ×
I acknowledge that these represent my contribution to the above research output.
Sign:
Hongwei
Wu
× × × × ×
I acknowledge that these represent my contribution to the above research output.
Sign:
161
D. Bed Agglomeration during Bio-oil Fast Pyrolysis in a Fluidised-bed Reactor,
Wenran Gao; Mingming Zhang; Hongwei Wu*, Energy & Fuels, 2018, 32 (3),
3608-3613.
Authors and full affiliations:
Conception
and design
Experiments
conduction &
data acquisition
Data
processing
& analysis
Interpretation
& discussion
Manuscript
writing,
revision and
finalisation
Final
Approval
Mingming
Zhang
× × × ×
I acknowledge that these represent my contribution to the above research output.
Sign:
Hongwei
Wu
× × × × ×
I acknowledge that these represent my contribution to the above research output.
Sign:

162
APPENDIXⅡ: COPYRIGHT PERMISSION STATEMENTS
A. Chapter 4, reprinted with permission from “Gao, W.; Zhang, M.; Wu, H., Fuel
properties and ageing of bioslurry prepared from glycerol/methanol/bio-oil blend
and biochar. Fuel 2016, 176, 72-77”.

163
B. Chapter 5 and chapter 6, reprinted with permission from “Gao, W.; Zhang, M.;
Wu, H., Ignition temperatures of various bio-oil based fuel blends and slurry
fuels. Fuel, 2017, 207, 240-243”.
164
C. Chapter 7, reprinted with permission from “Gao, W.; Zhang, M.; Wu, H.,
Differential scanning calorimetry studies on the cold flow properties of fuel
mixtures from bio-oil, crude glycerol, methanol, and/or biochar, Energy & Fuels,
2017, 31 (8), 8348-8355”.
165
D. Chapter 8, reprinted with permission from “Gao, W.; Zhang, M.; Wu, H.,
Differential scanning calorimetry studies on the cold flow properties of fuel
mixtures from bio-oil, crude glycerol, methanol, and/or biochar, Energy & Fuels,
2017, 31 (8), 8348-8355”.
Copyright © 2022 FDOKUMEN