A general model for air-side proton exchange membrane fuel cell contamination
at SciVerse ScienceDirect
Renewable Energy 50 (2013) 921e931
Contents lists available
Renewable Energy
journal homepage: www.elsevier .com/locate/renene
Effects of catalyst loading gradient in catalyst layers on performance of polymerelectrolyte membrane fuel cells
Ramin Roshandel*, Farzad AhmadiDepartment of Energy Engineering, Sharif University of Technology, P.O. Box 11365-9567, Tehran, Iran
a r t i c l e i n f o
Article history:Received 27 April 2012Accepted 13 August 2012Available online
Keywords:Fuel cellModelingAgglomerateNon-uniform catalyst
* Corresponding author. Tel.: þ98 21 6616 6127; faE-mail address: [email protected] (R. Roshand
0960-1481/$ e see front matter � 2012 Elsevier Ltd.http://dx.doi.org/10.1016/j.renene.2012.08.040
a b s t r a c t
In this paper, numerical and analytical approaches are presented to evaluate the effect of catalyst loadinggradient in the catalyst layer (CL) of a polymer electrolyte membrane (PEM) fuel cell. The model isdeveloped based on agglomerate catalyst and accounts for reactant spices and charge (ion and electron)transport in the cathode side of a PEM fuel cell. The special variation of catalyst loading is considered intwo direction, "across the layer" frommembrane/CL interface to gas diffusion layer (GDL) and "in catalystplane" under the channels and land areas in the channel direction. A fuel cell test stand is designed andbuilt to facilitate experimental validation of the model. The primary basic analytical investigation showsimprovement in fuel cell performance in comparison with uniform catalyst loading. More detailednumerical simulations confirm the analytical results and indicate that the catalyst loading distribution inthe both directions has the significant effect on the catalyst utilization. It is also found that the keyquestion of where to apply more catalyst to increases power density is addressed by the concept oflocations at which the reaction occurs at the highest rate.
� 2012 Elsevier Ltd. All rights reserved.
1. Introduction
Fuel cells enable a clean and efficient production of heat andpower from a diversity of primary energy sources. Even though,substantial improvements have been made over the past few yearsin the cell design and material utilization, several technical barriersstill exist that prevent the PEM fuel cells from commercialization.Among the various obstacles, the most important are low cellperformance due to low catalyst utilization, and high cost due toplatinum (Pt) catalyst used in the catalyst layer (CL) [1]. Hence,there has been considerable interest in the design and optimizationof catalyst layers aiming at performance improvement and costreduction.
1.1. Catalyst layer modeling
The development of a theoretical model of a PEM fuel cell, aswell as corresponding analyses, is essential to achieve a clearunderstanding of the effect of CL structure and different catalystmaterials on the cell performance. The earliest works on PEM fuelcell modeling were those reported by Bernardi et al. [2,3] andSpringer et al. [4]. These models were one-dimensional (1D),
x: þ98 21 6616 6102.el).
All rights reserved.
isothermal, and steady state but provided good insight intofundamentals of the relevant transport phenomena in the elec-trodes. Detailed models focusing on the CL have been reported bynumerous researchers. Thin film or macroscopic models considerthe CL as a continuum (homogeneousmodel) [5,6]. In this approachthe CL is regarded as an interface between GDL and membrane andit does not responsible for any losses due to catalyst structure orcomposition. Microscopic models consider the transportphenomena at pore level (agglomerate model) [7e15]. In theagglomerate model, the CL is regarded as a region consisting ofsmall homogenous agglomerates and agglomerate is surroundedby electrolyte film.
There are a few works, which developed CL models based oncylindrical agglomerates. Iczkowski et al. [16] and Ridge et al. [17]were two of the first researchers which represent typicalcylindrical-agglomerate models. More recently, there has beenincreased interest in spherical-agglomerate models; Broka et al.[18] reported that spherical agglomeratemodel is more appropriatechoices for the CLs.
Wang et al. [7] present a spherical flooded-agglomerate modelfor the cathode CL which includes the kinetics of oxygen reduction.They suggested that to achieve high catalyst utilization and cellperformance; it is better design and manufacture non-uniform CL.Base on this idea, Song et al. [8] developed a multi-layer agglom-erate model which considered CL to be composed of severalsub-layers. Their simulations suggested that decreasing the
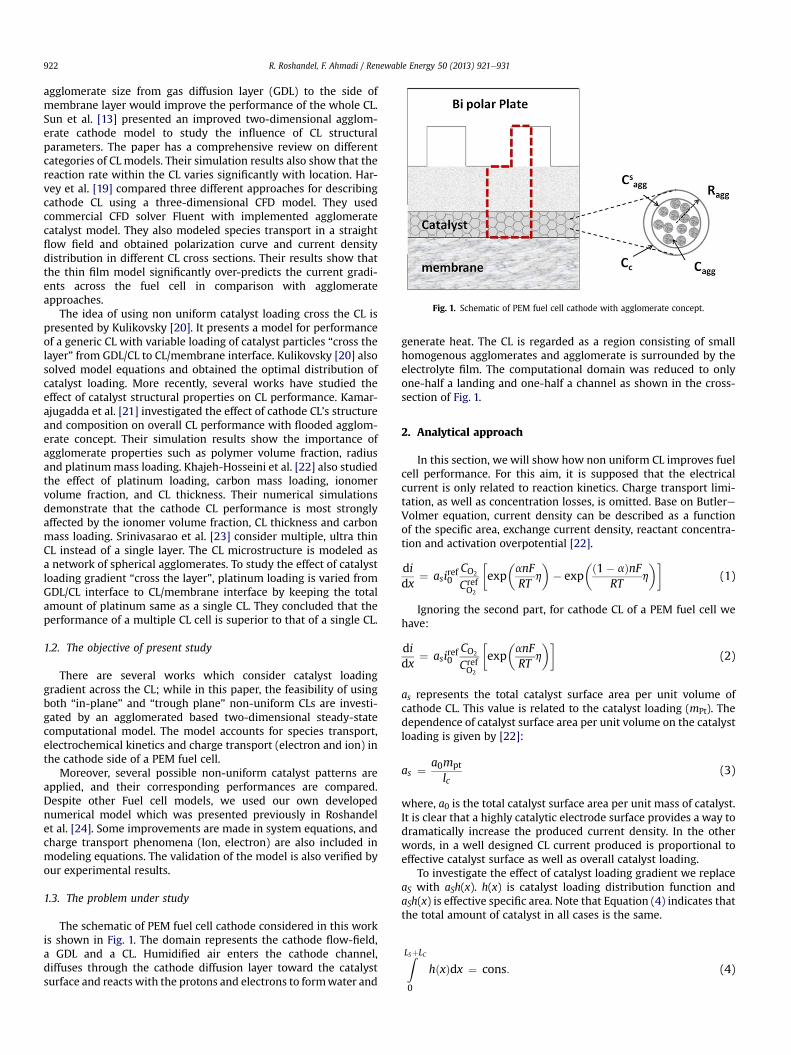
Fig. 1. Schematic of PEM fuel cell cathode with agglomerate concept.
R. Roshandel, F. Ahmadi / Renewable Energy 50 (2013) 921e931922
agglomerate size from gas diffusion layer (GDL) to the side ofmembrane layer would improve the performance of the whole CL.Sun et al. [13] presented an improved two-dimensional agglom-erate cathode model to study the influence of CL structuralparameters. The paper has a comprehensive review on differentcategories of CL models. Their simulation results also show that thereaction rate within the CL varies significantly with location. Har-vey et al. [19] compared three different approaches for describingcathode CL using a three-dimensional CFD model. They usedcommercial CFD solver Fluent with implemented agglomeratecatalyst model. They also modeled species transport in a straightflow field and obtained polarization curve and current densitydistribution in different CL cross sections. Their results show thatthe thin film model significantly over-predicts the current gradi-ents across the fuel cell in comparison with agglomerateapproaches.
The idea of using non uniform catalyst loading cross the CL ispresented by Kulikovsky [20]. It presents a model for performanceof a generic CL with variable loading of catalyst particles “cross thelayer” from GDL/CL to CL/membrane interface. Kulikovsky [20] alsosolved model equations and obtained the optimal distribution ofcatalyst loading. More recently, several works have studied theeffect of catalyst structural properties on CL performance. Kamar-ajugadda et al. [21] investigated the effect of cathode CL’s structureand composition on overall CL performance with flooded agglom-erate concept. Their simulation results show the importance ofagglomerate properties such as polymer volume fraction, radiusand platinummass loading. Khajeh-Hosseini et al. [22] also studiedthe effect of platinum loading, carbon mass loading, ionomervolume fraction, and CL thickness. Their numerical simulationsdemonstrate that the cathode CL performance is most stronglyaffected by the ionomer volume fraction, CL thickness and carbonmass loading. Srinivasarao et al. [23] consider multiple, ultra thinCL instead of a single layer. The CL microstructure is modeled asa network of spherical agglomerates. To study the effect of catalystloading gradient “cross the layer”, platinum loading is varied fromGDL/CL interface to CL/membrane interface by keeping the totalamount of platinum same as a single CL. They concluded that theperformance of a multiple CL cell is superior to that of a single CL.
1.2. The objective of present study
There are several works which consider catalyst loadinggradient across the CL; while in this paper, the feasibility of usingboth “in-plane” and “trough plane” non-uniform CLs are investi-gated by an agglomerated based two-dimensional steady-statecomputational model. The model accounts for species transport,electrochemical kinetics and charge transport (electron and ion) inthe cathode side of a PEM fuel cell.
Moreover, several possible non-uniform catalyst patterns areapplied, and their corresponding performances are compared.Despite other Fuel cell models, we used our own developednumerical model which was presented previously in Roshandelet al. [24]. Some improvements are made in system equations, andcharge transport phenomena (Ion, electron) are also included inmodeling equations. The validation of the model is also verified byour experimental results.
1.3. The problem under study
The schematic of PEM fuel cell cathode considered in this workis shown in Fig. 1. The domain represents the cathode flow-field,a GDL and a CL. Humidified air enters the cathode channel,diffuses through the cathode diffusion layer toward the catalystsurface and reacts with the protons and electrons to formwater and
generate heat. The CL is regarded as a region consisting of smallhomogenous agglomerates and agglomerate is surrounded by theelectrolyte film. The computational domain was reduced to onlyone-half a landing and one-half a channel as shown in the cross-section of Fig. 1.
2. Analytical approach
In this section, we will show how non uniform CL improves fuelcell performance. For this aim, it is supposed that the electricalcurrent is only related to reaction kinetics. Charge transport limi-tation, as well as concentration losses, is omitted. Base on ButlereVolmer equation, current density can be described as a functionof the specific area, exchange current density, reactant concentra-tion and activation overpotential [22].
didx
¼ asiref0CO2
CrefO2
�exp
�anFRT
h
�� exp
�ð1� aÞnFRT
h
��(1)
Ignoring the second part, for cathode CL of a PEM fuel cell wehave:
didx
¼ asiref0CO2
CrefO2
�exp
�anFRT
h
��(2)
as represents the total catalyst surface area per unit volume ofcathode CL. This value is related to the catalyst loading (mPt). Thedependence of catalyst surface area per unit volume on the catalystloading is given by [22]:
as ¼ a0mpt
lc(3)
where, a0 is the total catalyst surface area per unit mass of catalyst.It is clear that a highly catalytic electrode surface provides a way todramatically increase the produced current density. In the otherwords, in a well designed CL current produced is proportional toeffective catalyst surface as well as overall catalyst loading.
To investigate the effect of catalyst loading gradient we replaceaS with aSh(x). h(x) is catalyst loading distribution function andaSh(x) is effective specific area. Note that Equation (4) indicates thatthe total amount of catalyst in all cases is the same.
ZLSþLC
0
hðxÞdx ¼ cons: (4)
R. Roshandel, F. Ahmadi / Renewable Energy 50 (2013) 921e931 923
The modified form of Equation (2), now can be written as:
i ¼ZLSþLC
0
hðxÞ � G� CO2dx (5)
G ¼ asiref0
CrefO2
�exp
�anFRT
h
��(6)
Reactant concentration is lower under the land areas, due to thechannel/shoulder configuration. In the simplest approach, supposethe concentration is C0 under channels. Then lC0 (0�l � 1) can bereactant concentration under the land areas:
CO2
�x� ¼
�C0 0 � x � LSlC0 LS � x � LS þ LC
(7)
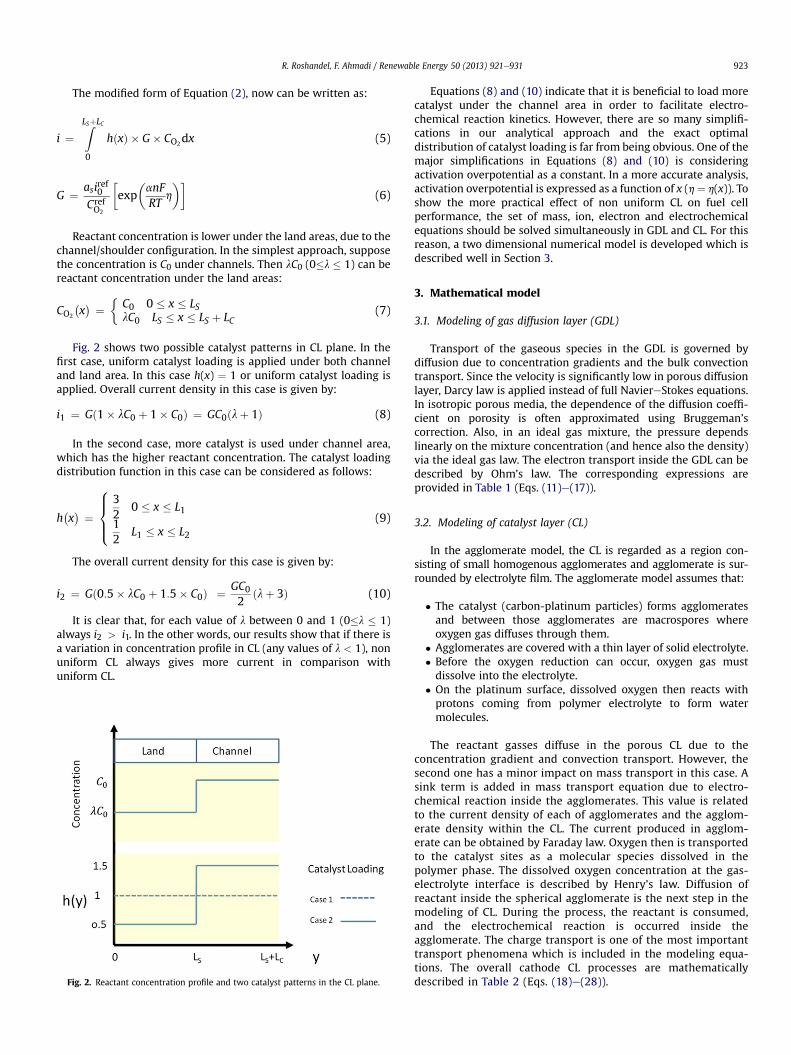
Fig. 2 shows two possible catalyst patterns in CL plane. In thefirst case, uniform catalyst loading is applied under both channeland land area. In this case h(x) ¼ 1 or uniform catalyst loading isapplied. Overall current density in this case is given by:
i1 ¼ Gð1� lC0 þ 1� C0Þ ¼ GC0ðlþ 1Þ (8)
In the second case, more catalyst is used under channel area,which has the higher reactant concentration. The catalyst loadingdistribution function in this case can be considered as follows:
h�x� ¼
8>><>>:32
0 � x � L112
L1 � x � L2(9)
The overall current density for this case is given by:
i2 ¼ Gð0:5� lC0 þ 1:5� C0Þ ¼ GC02
ðlþ 3Þ (10)
It is clear that, for each value of l between 0 and 1 (0�l � 1)always i2 > i1. In the other words, our results show that if there isa variation in concentration profile in CL (any values of l < 1), nonuniform CL always gives more current in comparison withuniform CL.
Fig. 2. Reactant concentration profile and two catalyst patterns in the CL plane.
Equations (8) and (10) indicate that it is beneficial to load morecatalyst under the channel area in order to facilitate electro-chemical reaction kinetics. However, there are so many simplifi-cations in our analytical approach and the exact optimaldistribution of catalyst loading is far from being obvious. One of themajor simplifications in Equations (8) and (10) is consideringactivation overpotential as a constant. In a more accurate analysis,activation overpotential is expressed as a function of x (h¼ h(x)). Toshow the more practical effect of non uniform CL on fuel cellperformance, the set of mass, ion, electron and electrochemicalequations should be solved simultaneously in GDL and CL. For thisreason, a two dimensional numerical model is developed which isdescribed well in Section 3.
3. Mathematical model
3.1. Modeling of gas diffusion layer (GDL)
Transport of the gaseous species in the GDL is governed bydiffusion due to concentration gradients and the bulk convectiontransport. Since the velocity is significantly low in porous diffusionlayer, Darcy law is applied instead of full NaviereStokes equations.In isotropic porous media, the dependence of the diffusion coeffi-cient on porosity is often approximated using Bruggeman’scorrection. Also, in an ideal gas mixture, the pressure dependslinearly on the mixture concentration (and hence also the density)via the ideal gas law. The electron transport inside the GDL can bedescribed by Ohm’s law. The corresponding expressions areprovided in Table 1 (Eqs. (11)e(17)).
3.2. Modeling of catalyst layer (CL)
In the agglomerate model, the CL is regarded as a region con-sisting of small homogenous agglomerates and agglomerate is sur-rounded by electrolyte film. The agglomerate model assumes that:
� The catalyst (carbon-platinum particles) forms agglomeratesand between those agglomerates are macrospores whereoxygen gas diffuses through them.
� Agglomerates are covered with a thin layer of solid electrolyte.� Before the oxygen reduction can occur, oxygen gas mustdissolve into the electrolyte.
� On the platinum surface, dissolved oxygen then reacts withprotons coming from polymer electrolyte to form watermolecules.
The reactant gasses diffuse in the porous CL due to theconcentration gradient and convection transport. However, thesecond one has a minor impact on mass transport in this case. Asink term is added in mass transport equation due to electro-chemical reaction inside the agglomerates. This value is relatedto the current density of each of agglomerates and the agglom-erate density within the CL. The current produced in agglom-erate can be obtained by Faraday law. Oxygen then is transportedto the catalyst sites as a molecular species dissolved in thepolymer phase. The dissolved oxygen concentration at the gas-electrolyte interface is described by Henry’s law. Diffusion ofreactant inside the spherical agglomerate is the next step in themodeling of CL. During the process, the reactant is consumed,and the electrochemical reaction is occurred inside theagglomerate. The charge transport is one of the most importanttransport phenomena which is included in the modeling equa-tions. The overall cathode CL processes are mathematicallydescribed in Table 2 (Eqs. (18)e(28)).
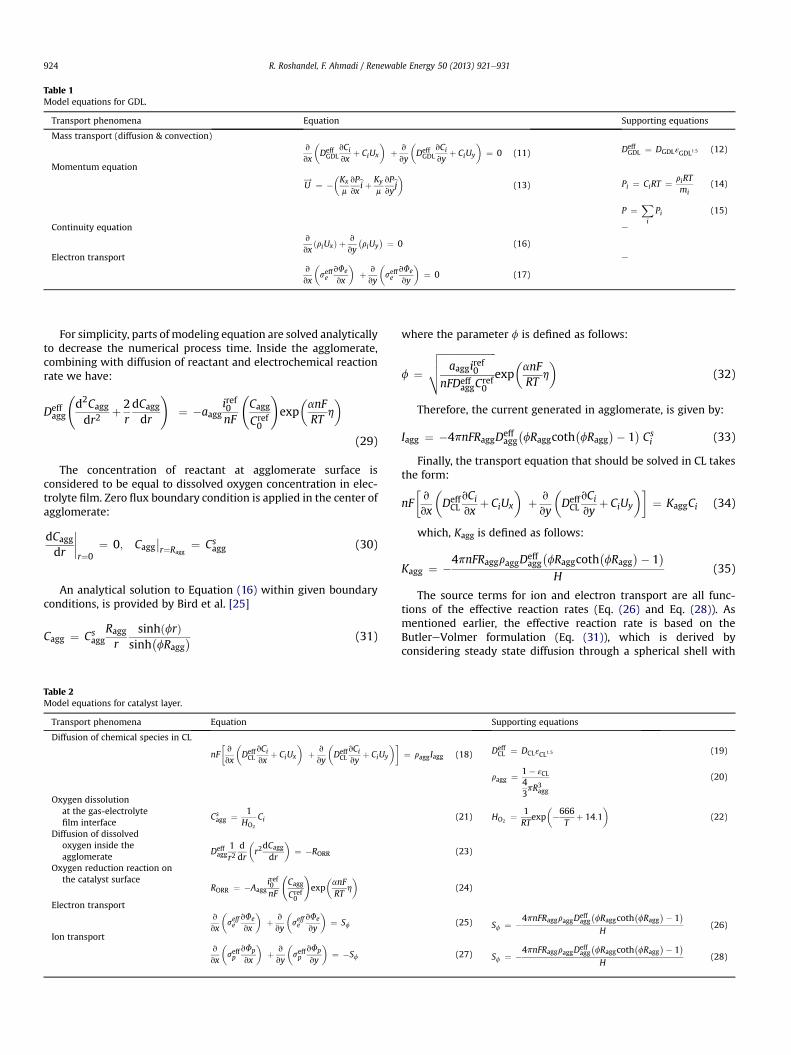
Table 1Model equations for GDL.
Transport phenomena Equation Supporting equations
Mass transport (diffusion & convection)v
vx
�DeffGDL
vCivx
þ CiUx
�þ v
vy
�DeffGDL
vCivy
þ CiUy
�¼ 0 (11) Deff
GDL ¼ DGDLεGDL1:5 (12)
Momentum equation
U! ¼ �
�Kx
m
vPvxbi þ Ky
m
vPvybj� (13) Pi ¼ CiRT ¼ riRT
mi(14)
P ¼Xi
Pi (15)
Continuity equationv
vxðriUxÞ þ v
vy
�riUy
� ¼ 0 (16)
e
Electron transportv
vx
�seffe
vFe
vx
�þ v
vy
�seffe
vFe
vy
�¼ 0 (17)
e
R. Roshandel, F. Ahmadi / Renewable Energy 50 (2013) 921e931924
For simplicity, parts of modeling equation are solved analyticallyto decrease the numerical process time. Inside the agglomerate,combining with diffusion of reactant and electrochemical reactionrate we have:
Deffagg
d2Caggdr2
þ 2rdCaggdr
!¼ �aagg
iref0nF
CaggCref0
!exp
�anFRT
h
�(29)
The concentration of reactant at agglomerate surface isconsidered to be equal to dissolved oxygen concentration in elec-trolyte film. Zero flux boundary condition is applied in the center ofagglomerate:
dCaggdr
r¼0
¼ 0; Caggr¼Ragg
¼ Csagg (30)
An analytical solution to Equation (16) within given boundaryconditions, is provided by Bird et al. [25]
Cagg ¼ Csagg
Raggr
sinhðfrÞsinh
�fRagg
� (31)
Table 2Model equations for catalyst layer.
Transport phenomena Equation
Diffusion of chemical species in CL
nF�v
vx
�DeffCL
vCivx
þ CiUx
�þ v
vy
�DeffCL
vCivy
þ CiUy
��
Oxygen dissolutionat the gas-electrolytefilm interface
Csagg ¼ 1
HO2
Ci
Diffusion of dissolvedoxygen inside theagglomerate
Deffagg
1r2
ddr
�r2dCaggdr
�¼ �RORR
Oxygen reduction reaction onthe catalyst surface
RORR ¼ �Aaggiref0nF
CaggCref0
!exp
�anFRT
h
�Electron transport
v
vx
�seffe
vFe
vx
�þ v
vy
�seffe
vFe
vy
�¼ Sf
Ion transportv
vx
�seffp
vFp
vx
�þ v
vy
�seffp
vFp
vy
�¼ �Sf
where the parameter f is defined as follows:
f ¼ffiffiffiffiffiffiffiffiffiffiffiffiffiffiffiffiffiffiffiffiffiffiffiaaggiref0
nFDeffaggC
ref0
vuut exp�anFRT
h
�(32)
Therefore, the current generated in agglomerate, is given by:
Iagg ¼ �4pnFRaggDeffagg�fRaggcoth
�fRagg
�� 1�Csi (33)
Finally, the transport equation that should be solved in CL takesthe form:
nF�v
vx
�DeffCL
vCivx
þ CiUx
�þ v
vy
�DeffCL
vCivy
þ CiUy
��¼ KaggCi (34)
which, Kagg is defined as follows:
Kagg ¼ �4pnFRaggraggDeffagg�fRaggcoth
�fRagg
�� 1�
H(35)
The source terms for ion and electron transport are all func-tions of the effective reaction rates (Eq. (26) and Eq. (28)). Asmentioned earlier, the effective reaction rate is based on theButlereVolmer formulation (Eq. (31)), which is derived byconsidering steady state diffusion through a spherical shell with
Supporting equations
¼ raggIagg (18) DeffCL ¼ DCLεCL1:5 (19)
ragg ¼ 1� εCL43pR3agg
(20)
(21) HO2¼ 1
RTexp
��666
Tþ 14:1
�(22)
(23)
(24)
(25) Sf ¼ �4pnFRaggraggDeffagg�fRaggcoth
�fRagg
�� 1�
H(26)
(27) Sf ¼ �4pnFRaggraggDeffagg�fRaggcoth
�fRagg
�� 1�
H(28)
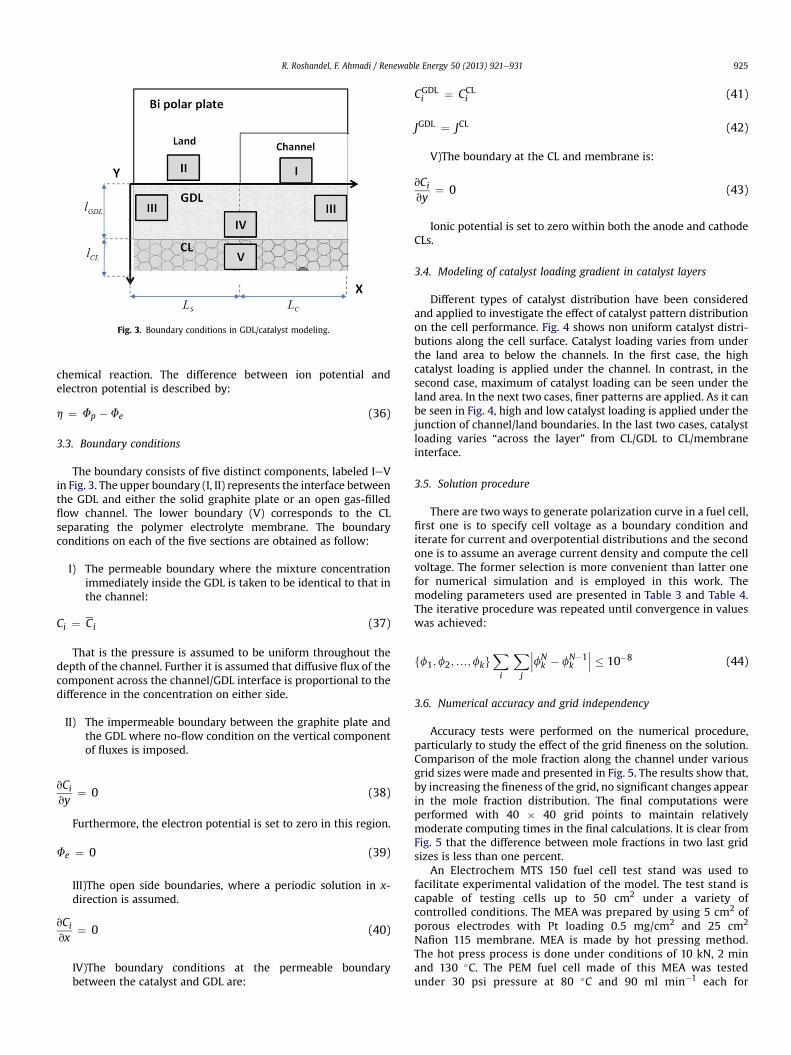
Fig. 3. Boundary conditions in GDL/catalyst modeling.
R. Roshandel, F. Ahmadi / Renewable Energy 50 (2013) 921e931 925
chemical reaction. The difference between ion potential andelectron potential is described by:
h ¼ Fp � Fe (36)
3.3. Boundary conditions
The boundary consists of five distinct components, labeled IeVin Fig. 3. The upper boundary (I, II) represents the interface betweenthe GDL and either the solid graphite plate or an open gas-filledflow channel. The lower boundary (V) corresponds to the CLseparating the polymer electrolyte membrane. The boundaryconditions on each of the five sections are obtained as follow:
I) The permeable boundary where the mixture concentrationimmediately inside the GDL is taken to be identical to that inthe channel:
Ci ¼ Ci (37)
That is the pressure is assumed to be uniform throughout thedepth of the channel. Further it is assumed that diffusive flux of thecomponent across the channel/GDL interface is proportional to thedifference in the concentration on either side.
II) The impermeable boundary between the graphite plate andthe GDL where no-flow condition on the vertical componentof fluxes is imposed.
vCivy
¼ 0 (38)
Furthermore, the electron potential is set to zero in this region.
Fe ¼ 0 (39)
III)The open side boundaries, where a periodic solution in x-direction is assumed.
vCivx
¼ 0 (40)
IV)The boundary conditions at the permeable boundarybetween the catalyst and GDL are:
CGDLi ¼ CCL
i (41)
JGDL ¼ JCL (42)
V)The boundary at the CL and membrane is:
vCivy
¼ 0 (43)
Ionic potential is set to zero within both the anode and cathodeCLs.
3.4. Modeling of catalyst loading gradient in catalyst layers
Different types of catalyst distribution have been consideredand applied to investigate the effect of catalyst pattern distributionon the cell performance. Fig. 4 shows non uniform catalyst distri-butions along the cell surface. Catalyst loading varies from underthe land area to below the channels. In the first case, the highcatalyst loading is applied under the channel. In contrast, in thesecond case, maximum of catalyst loading can be seen under theland area. In the next two cases, finer patterns are applied. As it canbe seen in Fig. 4, high and low catalyst loading is applied under thejunction of channel/land boundaries. In the last two cases, catalystloading varies “across the layer” from CL/GDL to CL/membraneinterface.
3.5. Solution procedure
There are two ways to generate polarization curve in a fuel cell,first one is to specify cell voltage as a boundary condition anditerate for current and overpotential distributions and the secondone is to assume an average current density and compute the cellvoltage. The former selection is more convenient than latter onefor numerical simulation and is employed in this work. Themodeling parameters used are presented in Table 3 and Table 4.The iterative procedure was repeated until convergence in valueswas achieved:
ff1;f2;.;fkgXi
Xj
fNk � fN�1
k
� 10�8 (44)
3.6. Numerical accuracy and grid independency
Accuracy tests were performed on the numerical procedure,particularly to study the effect of the grid fineness on the solution.Comparison of the mole fraction along the channel under variousgrid sizes were made and presented in Fig. 5. The results show that,by increasing the fineness of the grid, no significant changes appearin the mole fraction distribution. The final computations wereperformed with 40 � 40 grid points to maintain relativelymoderate computing times in the final calculations. It is clear fromFig. 5 that the difference between mole fractions in two last gridsizes is less than one percent.
An Electrochem MTS 150 fuel cell test stand was used tofacilitate experimental validation of the model. The test stand iscapable of testing cells up to 50 cm2 under a variety ofcontrolled conditions. The MEA was prepared by using 5 cm2 ofporous electrodes with Pt loading 0.5 mg/cm2 and 25 cm2
Nafion 115 membrane. MEA is made by hot pressing method.The hot press process is done under conditions of 10 kN, 2 minand 130 �C. The PEM fuel cell made of this MEA was testedunder 30 psi pressure at 80 �C and 90 ml min�1 each for
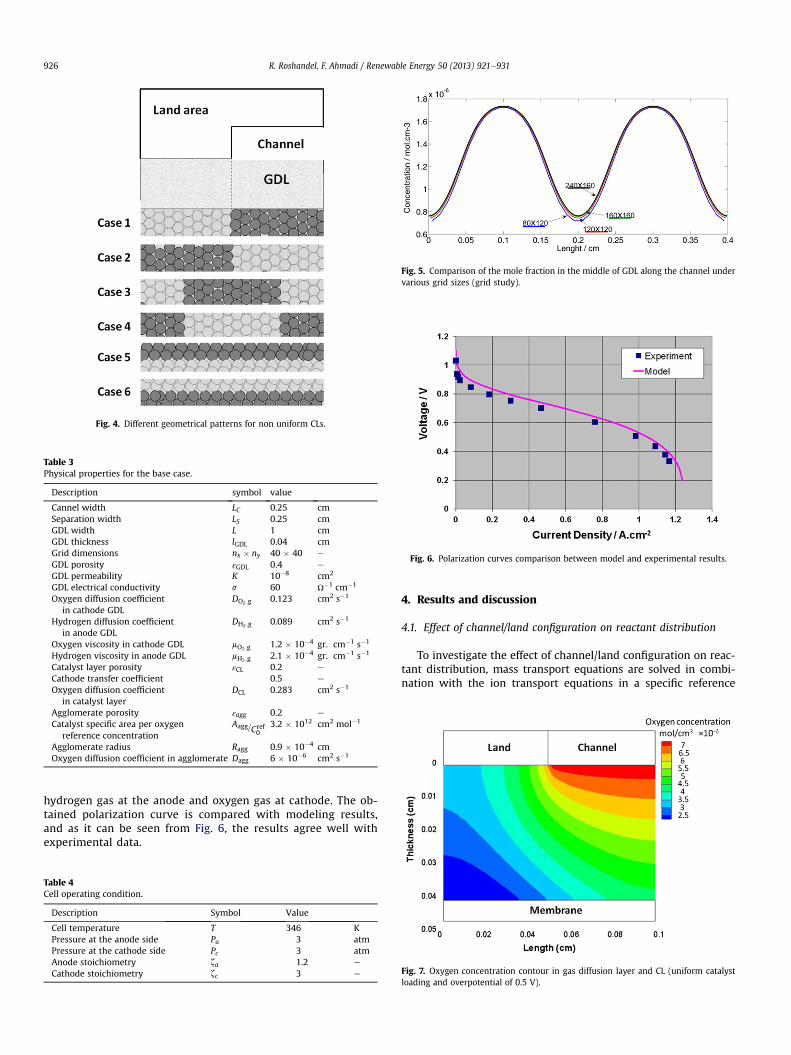
Table 3Physical properties for the base case.
Description symbol value
Cannel width LC 0.25 cmSeparation width LS 0.25 cmGDL width L 1 cmGDL thickness lGDL 0.04 cmGrid dimensions nx � ny 40 � 40 e
GDL porosity εGDL 0.4 e
GDL permeability K 10�8 cm2
GDL electrical conductivity s 60 U�1 cm�1
Oxygen diffusion coefficientin cathode GDL
DO2 ;g 0.123 cm2 s�1
Hydrogen diffusion coefficientin anode GDL
DH2 ;g 0.089 cm2 s�1
Oxygen viscosity in cathode GDL mO2 ;g 1.2 � 10�4 gr. cm�1 s�1
Hydrogen viscosity in anode GDL mH2 ;g 2.1 � 10�4 gr. cm�1 s�1
Catalyst layer porosity εCL 0.2 e
Cathode transfer coefficient 0.5 e
Oxygen diffusion coefficientin catalyst layer
DCL 0.283 cm2 s�1
Agglomerate porosity εagg 0.2 e
Catalyst specific area per oxygenreference concentration
Aagg=Cref0
3.2 � 1012 cm2 mol�1
Agglomerate radius Ragg 0.9 � 10�4 cmOxygen diffusion coefficient in agglomerate Dagg 6 � 10�6 cm2 s�1
Fig. 5. Comparison of the mole fraction in the middle of GDL along the channel undervarious grid sizes (grid study).
Fig. 4. Different geometrical patterns for non uniform CLs.
Fig. 6. Polarization curves comparison between model and experimental results.
R. Roshandel, F. Ahmadi / Renewable Energy 50 (2013) 921e931926
hydrogen gas at the anode and oxygen gas at cathode. The ob-tained polarization curve is compared with modeling results,and as it can be seen from Fig. 6, the results agree well withexperimental data.
Table 4Cell operating condition.
Description Symbol Value
Cell temperature T 346 KPressure at the anode side Pa 3 atmPressure at the cathode side Pc 3 atmAnode stoichiometry za 1.2 e
Cathode stoichiometry zc 3 e
4. Results and discussion
4.1. Effect of channel/land configuration on reactant distribution
To investigate the effect of channel/land configuration on reac-tant distribution, mass transport equations are solved in combi-nation with the ion transport equations in a specific reference
Fig. 7. Oxygen concentration contour in gas diffusion layer and CL (uniform catalystloading and overpotential of 0.5 V).
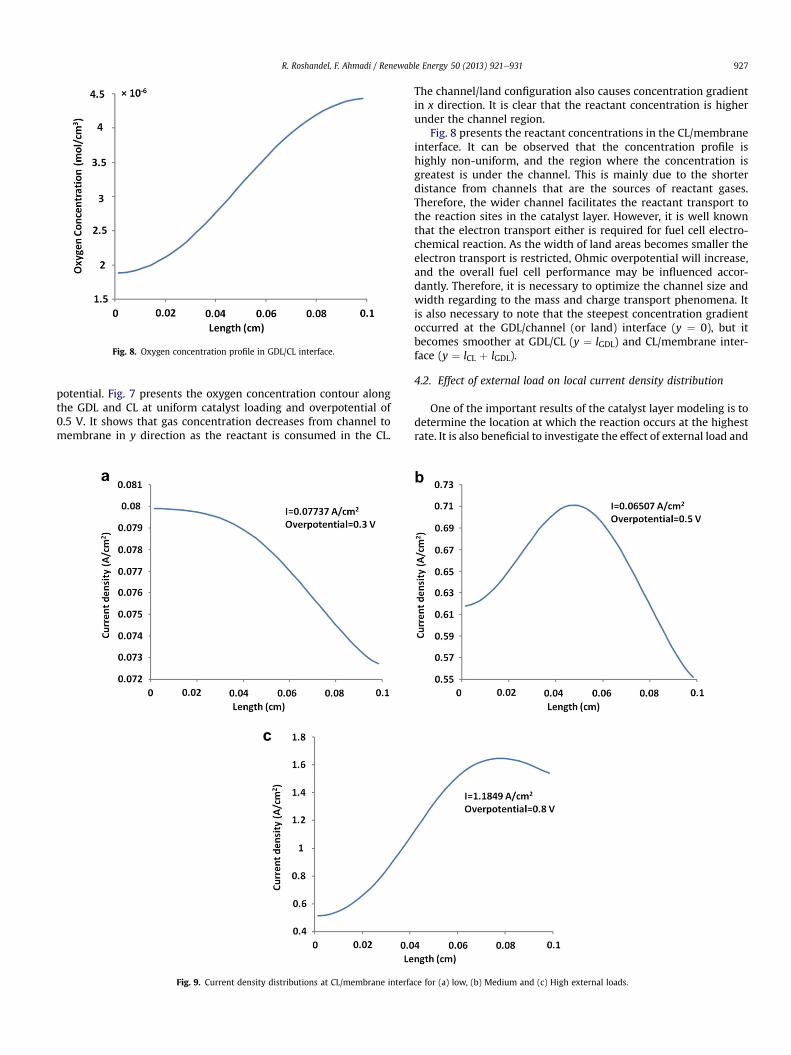
Fig. 8. Oxygen concentration profile in GDL/CL interface.
R. Roshandel, F. Ahmadi / Renewable Energy 50 (2013) 921e931 927
potential. Fig. 7 presents the oxygen concentration contour alongthe GDL and CL at uniform catalyst loading and overpotential of0.5 V. It shows that gas concentration decreases from channel tomembrane in y direction as the reactant is consumed in the CL.
Fig. 9. Current density distributions at CL/membrane interfa
The channel/land configuration also causes concentration gradientin x direction. It is clear that the reactant concentration is higherunder the channel region.
Fig. 8 presents the reactant concentrations in the CL/membraneinterface. It can be observed that the concentration profile ishighly non-uniform, and the region where the concentration isgreatest is under the channel. This is mainly due to the shorterdistance from channels that are the sources of reactant gases.Therefore, the wider channel facilitates the reactant transport tothe reaction sites in the catalyst layer. However, it is well knownthat the electron transport either is required for fuel cell electro-chemical reaction. As the width of land areas becomes smaller theelectron transport is restricted, Ohmic overpotential will increase,and the overall fuel cell performance may be influenced accor-dantly. Therefore, it is necessary to optimize the channel size andwidth regarding to the mass and charge transport phenomena. Itis also necessary to note that the steepest concentration gradientoccurred at the GDL/channel (or land) interface (y ¼ 0), but itbecomes smoother at GDL/CL (y ¼ lGDL) and CL/membrane inter-face (y ¼ lCL þ lGDL).
4.2. Effect of external load on local current density distribution
One of the important results of the catalyst layer modeling is todetermine the location at which the reaction occurs at the highestrate. It is also beneficial to investigate the effect of external load and
ce for (a) low, (b) Medium and (c) High external loads.
R. Roshandel, F. Ahmadi / Renewable Energy 50 (2013) 921e931928
operating condition on the local current density distribution.Fig. 9aec present the current density profiles for three external loadregimes that may be considered to represent low, medium and highcurrent density, respectively. It can be seen that the reaction doesnot occur uniformly within the CL. At low current density, oxygendiffusion is fast enough under the channel, but electrons passshorter distance under the land area. Therefore, the reaction rate ishigher under the land area (Fig. 9a). At medium current density(Fig. 9b), the place of maximum current density is predicated to beat the junction between channel and land area but as the currentdensity increases, the place of maximum current moves to underthe channels where reactant gases can be easily transported(Fig. 9c). These results are also confirmed by Sun et al. [13] andPharoah et al. [14].
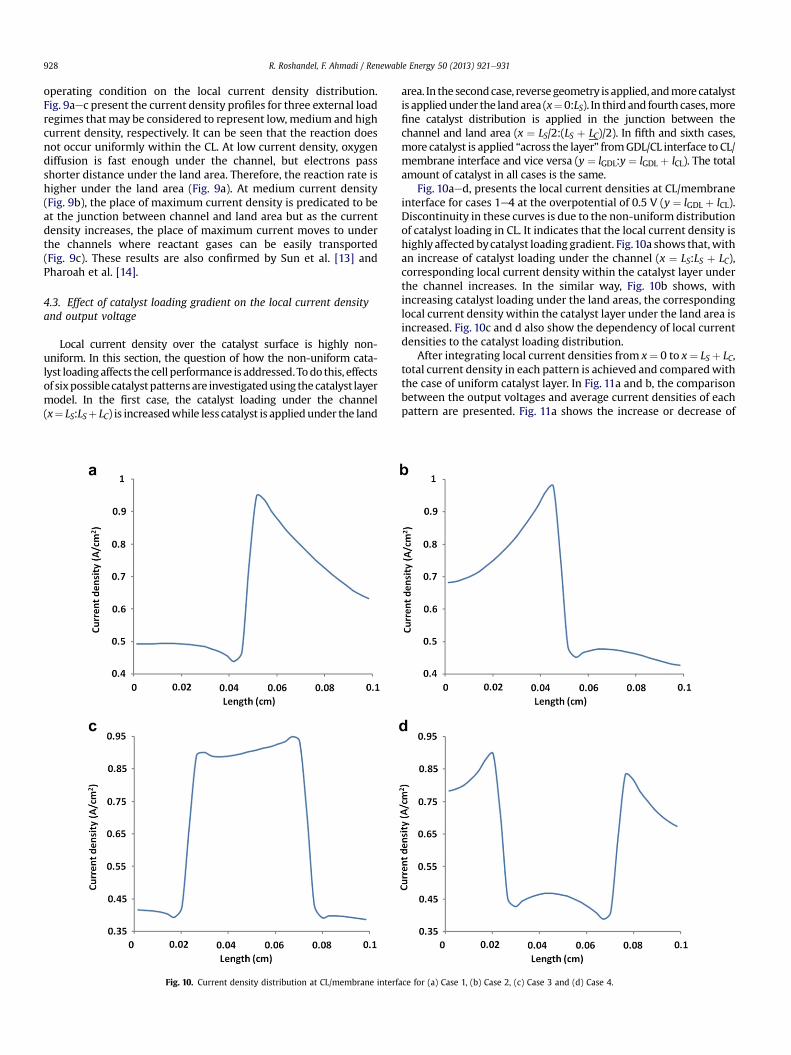
4.3. Effect of catalyst loading gradient on the local current densityand output voltage
Local current density over the catalyst surface is highly non-uniform. In this section, the question of how the non-uniform cata-lyst loadingaffects the cell performance is addressed. Todo this, effectsof sixpossiblecatalystpatternsare investigatedusing the catalyst layermodel. In the first case, the catalyst loading under the channel(x¼ LS:LSþ LC) is increasedwhile less catalyst is appliedunder the land
Fig. 10. Current density distribution at CL/membrane interf
area. In the secondcase, reversegeometry is applied, andmore catalystis appliedunder the landarea (x¼0:LS). In third and fourth cases,morefine catalyst distribution is applied in the junction between thechannel and land area (x ¼ LS/2:(LS þ LC)/2). In fifth and sixth cases,more catalyst is applied “across the layer” fromGDL/CL interface to CL/membrane interface and vice versa (y ¼ lGDL:y ¼ lGDL þ lCL). The totalamount of catalyst in all cases is the same.
Fig. 10aed, presents the local current densities at CL/membraneinterface for cases 1e4 at the overpotential of 0.5 V (y ¼ lGDL þ lCL).Discontinuity in these curves is due to the non-uniform distributionof catalyst loading in CL. It indicates that the local current density ishighly affected bycatalyst loading gradient. Fig.10a shows that,withan increase of catalyst loading under the channel (x ¼ LS:LS þ LC),corresponding local current density within the catalyst layer underthe channel increases. In the similar way, Fig. 10b shows, withincreasing catalyst loading under the land areas, the correspondinglocal current density within the catalyst layer under the land area isincreased. Fig. 10c and d also show the dependency of local currentdensities to the catalyst loading distribution.
After integrating local current densities from x¼ 0 to x¼ LS þ LC,total current density in each pattern is achieved and comparedwiththe case of uniform catalyst layer. In Fig. 11a and b, the comparisonbetween the output voltages and average current densities of eachpattern are presented. Fig. 11a shows the increase or decrease of
ace for (a) Case 1, (b) Case 2, (c) Case 3 and (d) Case 4.
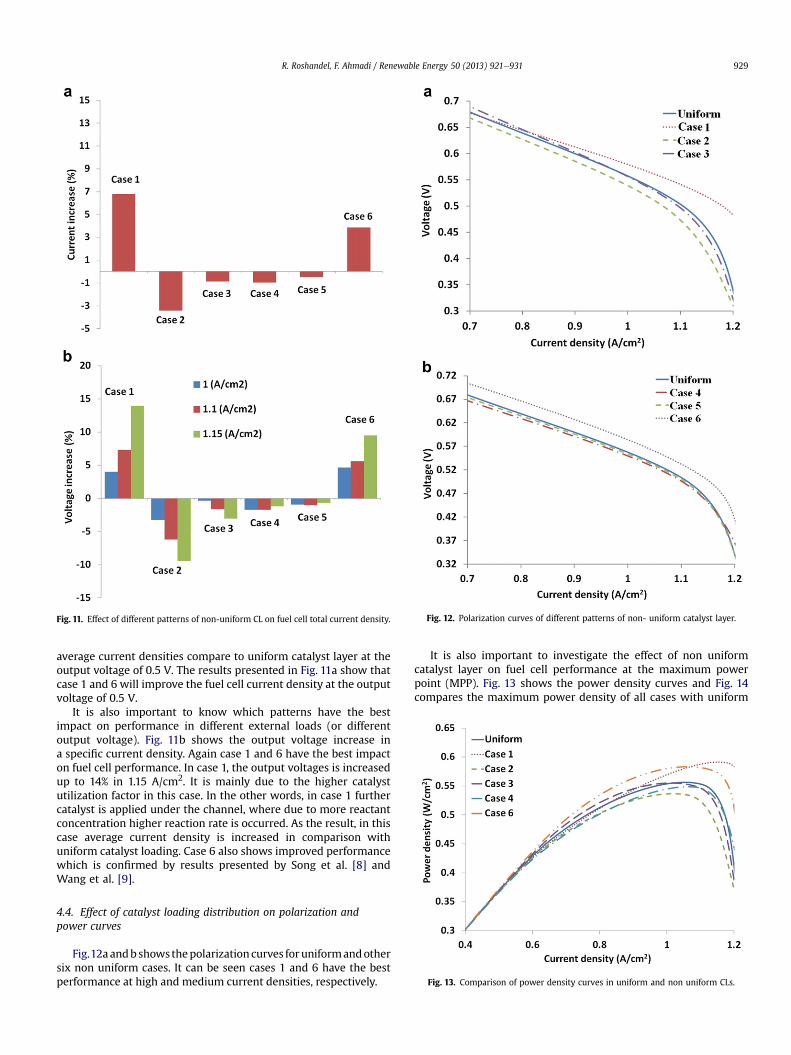
Fig. 11. Effect of different patterns of non-uniform CL on fuel cell total current density. Fig. 12. Polarization curves of different patterns of non- uniform catalyst layer.
R. Roshandel, F. Ahmadi / Renewable Energy 50 (2013) 921e931 929
average current densities compare to uniform catalyst layer at theoutput voltage of 0.5 V. The results presented in Fig. 11a show thatcase 1 and 6 will improve the fuel cell current density at the outputvoltage of 0.5 V.
It is also important to know which patterns have the bestimpact on performance in different external loads (or differentoutput voltage). Fig. 11b shows the output voltage increase ina specific current density. Again case 1 and 6 have the best impacton fuel cell performance. In case 1, the output voltages is increasedup to 14% in 1.15 A/cm2. It is mainly due to the higher catalystutilization factor in this case. In the other words, in case 1 furthercatalyst is applied under the channel, where due to more reactantconcentration higher reaction rate is occurred. As the result, in thiscase average current density is increased in comparison withuniform catalyst loading. Case 6 also shows improved performancewhich is confirmed by results presented by Song et al. [8] andWang et al. [9].
Fig. 13. Comparison of power density curves in uniform and non uniform CLs.
4.4. Effect of catalyst loading distribution on polarization andpower curves
Fig.12a andb showsthepolarizationcurves foruniformandothersix non uniform cases. It can be seen cases 1 and 6 have the bestperformance at high and medium current densities, respectively.
It is also important to investigate the effect of non uniformcatalyst layer on fuel cell performance at the maximum powerpoint (MPP). Fig. 13 shows the power density curves and Fig. 14compares the maximum power density of all cases with uniform
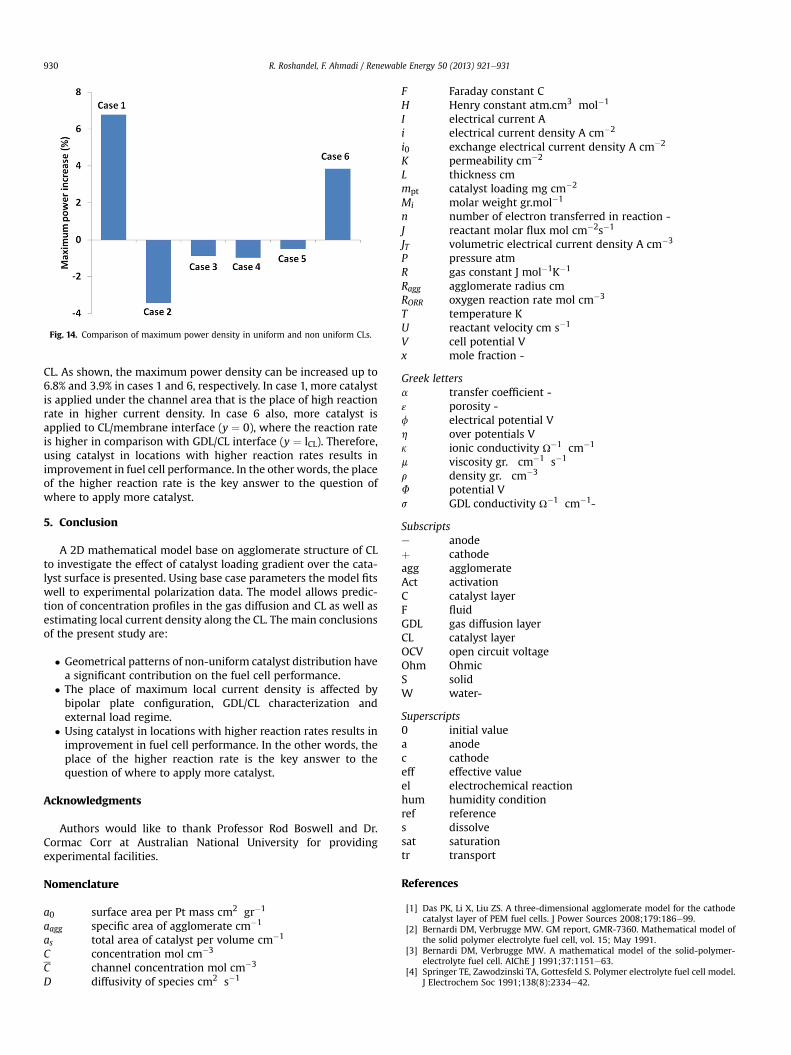
Fig. 14. Comparison of maximum power density in uniform and non uniform CLs.
R. Roshandel, F. Ahmadi / Renewable Energy 50 (2013) 921e931930
CL. As shown, the maximum power density can be increased up to6.8% and 3.9% in cases 1 and 6, respectively. In case 1, more catalystis applied under the channel area that is the place of high reactionrate in higher current density. In case 6 also, more catalyst isapplied to CL/membrane interface (y ¼ 0), where the reaction rateis higher in comparison with GDL/CL interface (y ¼ lCL). Therefore,using catalyst in locations with higher reaction rates results inimprovement in fuel cell performance. In the other words, the placeof the higher reaction rate is the key answer to the question ofwhere to apply more catalyst.
5. Conclusion
A 2D mathematical model base on agglomerate structure of CLto investigate the effect of catalyst loading gradient over the cata-lyst surface is presented. Using base case parameters the model fitswell to experimental polarization data. The model allows predic-tion of concentration profiles in the gas diffusion and CL as well asestimating local current density along the CL. The main conclusionsof the present study are:
� Geometrical patterns of non-uniform catalyst distribution havea significant contribution on the fuel cell performance.
� The place of maximum local current density is affected bybipolar plate configuration, GDL/CL characterization andexternal load regime.
� Using catalyst in locations with higher reaction rates results inimprovement in fuel cell performance. In the other words, theplace of the higher reaction rate is the key answer to thequestion of where to apply more catalyst.
Acknowledgments
Authors would like to thank Professor Rod Boswell and Dr.Cormac Corr at Australian National University for providingexperimental facilities.
Nomenclature
a0 surface area per Pt mass cm2 gr�1
aagg specific area of agglomerate cm�1
as total area of catalyst per volume cm�1
C concentration mol cm�3
C channel concentration mol cm�3
D diffusivity of species cm2 s�1
F Faraday constant CH Henry constant atm.cm3 mol�1
I electrical current Ai electrical current density A cm�2
i0 exchange electrical current density A cm�2
K permeability cm�2
L thickness cmmpt catalyst loading mg cm�2
Mi molar weight gr.mol�1
n number of electron transferred in reaction -J reactant molar flux mol cm�2s�1
JT volumetric electrical current density A cm�3
P pressure atmR gas constant J mol�1K�1
Ragg agglomerate radius cmRORR oxygen reaction rate mol cm�3
T temperature KU reactant velocity cm s�1
V cell potential Vx mole fraction -
Greek lettersa transfer coefficient -ε porosity -f electrical potential Vh over potentials Vk ionic conductivity U�1 cm�1
m viscosity gr. cm�1 s�1
r density gr. cm�3
F potential Vs GDL conductivity U�1 cm�1-
Subscriptse anodeþ cathodeagg agglomerateAct activationC catalyst layerF fluidGDL gas diffusion layerCL catalyst layerOCV open circuit voltageOhm OhmicS solidW water-
Superscripts0 initial valuea anodec cathodeeff effective valueel electrochemical reactionhum humidity conditionref references dissolvesat saturationtr transport
References
[1] Das PK, Li X, Liu ZS. A three-dimensional agglomerate model for the cathodecatalyst layer of PEM fuel cells. J Power Sources 2008;179:186e99.
[2] Bernardi DM, Verbrugge MW. GM report, GMR-7360. Mathematical model ofthe solid polymer electrolyte fuel cell, vol. 15; May 1991.
[3] Bernardi DM, Verbrugge MW. A mathematical model of the solid-polymer-electrolyte fuel cell. AIChE J 1991;37:1151e63.
[4] Springer TE, Zawodzinski TA, Gottesfeld S. Polymer electrolyte fuel cell model.J Electrochem Soc 1991;138(8):2334e42.
R. Roshandel, F. Ahmadi / Renewable Energy 50 (2013) 921e931 931
[5] Berning T, Liu DM, Djilali N. Three-dimensional computational analysisof transport phenomena in a PEM fuel cell. J Power Sources 2002;106:284e94.
[6] Um S, Wang CY. Three-dimensional analysis of transport and electrochemicalreactions in polymer electrolyte membrane fuel cells. J Power Sources 2004;125:20e51.
[7] Wang Q, Song D, Navessin T, Holdcroft S, Liu S. A mathematical model andoptimization of the cathode catalyst layer structure in PEM fuel cells. Elec-trochim Acta 2004;50:725e30.
[8] Song D, Wang Q, Liu S, Navessin T, Holdcroft S. Numerical study of PEM fuelcell with non-uniform catalyst layer. Electrochim Acta 2004;50:731e7.
[9] Wang Q, Eikerling M, Song D, Liu S. Structure and performance of differenttypes of agglomerates in cathode catalyst layer of PEM fuel cells. J ElectroanalChem 2004;573:61e9.
[10] Farhat ZN. Modeling of catalyst layer micro structural refinement and catalystutilization in a PEM fuel cell. J Power Sources 2004;138:68e78.
[11] Du CY, Yang T, Shi PF, Yin GP, Cheng XQ. Performance analysis of the orderedand the conventional catalyst layers in proton exchange membrane fuel cells.Electrochim Acta 2006;51:4934e41.
[12] Madhusudana Rao R, Rengaswamy R. Dynamic characteristics of sphericalagglomerate for study of cathode catalyst layer in proton exchange membranefuel cells. J Power Sources 2006;158:110e23.
[13] Sun W, Peppley BA, Karan K. An improved two-dimensional agglomeratecathode model to study the influence of catalyst layer structural parameters.Electrochim Acta 2005;50:3359e74.
[14] Pharoah JG, Karan K, Sun W. On effective transport coefficients in PEM fuelcell electrodes: anisotropy of the porous transport layers. J Power Sources2006;161:214e24.
[15] Marr C, Li X. Composition and performance modeling of catalyst layer ina proton exchange membrane fuel cell. J Power Sources 1999;77:17e27.
[16] Iczkowski RP, Cutlip MB. Voltage losses in fuel cell cathodes. J Electrochem Soc1980;127:1433e40.
[17] Ridge SJ, White RE, Tsou Y, Beaver RN, Eisman GA. J. Electrochem. Soc. 1989;136(7):1902.
[18] Broka K, Ekdunge P. Modelling the PEM fuel cell cathode. J Appl Electrochem1997;27:281e9.
[19] Harvey D, Pharoah JG, Karan K. A comparison of different approaches tomodeling the PEMFC catalyst layer. J Power Sources 2008;179:209e19.
[20] Kulikovsky AA. Optimal shape of catalyst loading across the active layer ofa fuel cell. Electrochem Commun 2009;11:1951e5.
[21] Kamarajugadda S, Mazumder S. Numerical investigation of the effect ofcathode catalyst layer structure and composition on polymer electrolytemembrane fuel cell performance. J Power Sources 2008;183:629e42.
[22] Khajeh-Hosseini-Dalasm N, Kermani MJ, Ghadiri Moghaddam D,Stockie JM. A parametric study of cathode catalyst layer structuralparameters on the performance of a PEM fuel cell. Int J Hydrogen Energy2010;35:2417e27.
[23] Srinivasarao M, Bhattacharyya D, Rengaswamy R, Narasimhan S. Performanceanalysis of a PEM fuel cell cathode with multiple catalyst layers. Int JHydrogen Energy 2010;35:6356e65.
[24] Roshandel R, Farhanieh B. The effects of non-uniform distribution of catalystloading on polymer electrolyte membrane fuel cell performance. Int JHydrogen Energy 2007;32:4424e37.
[25] Bird RB, Stewart WE, Lightfoot EN. Transport phenomena. New York: JohnWilly & Sons, Inc.; 1960.
Copyright © 2022 FDOKUMEN