A general model for air-side proton exchange membrane fuel cell contamination
13
Publisher’s version / Version de l'éditeur: Contact us / Contactez nous: [email protected]. http://nparc.cisti-icist.nrc-cnrc.gc.ca/npsi/jsp/nparc_cp.jsp?lang=fr L’accès à ce site Web et l’utilisation de son contenu sont assujettis aux conditions présentées dans le site LISEZ CES CONDITIONS ATTENTIVEMENT AVANT D’UTILISER CE SITE WEB. READ THESE TERMS AND CONDITIONS CAREFULLY BEFORE USING THIS WEBSITE. NRC Publications Record / Notice d'Archives des publications de CNRC: http://nparc.cisti-icist.nrc-cnrc.gc.ca/npsi/ctrl?action=rtdoc&an=17101714&lang=en http://nparc.cisti-icist.nrc-cnrc.gc.ca/npsi/ctrl?action=rtdoc&an=17101714&lang=fr Access and use of this website and the material on it are subject to the Terms and Conditions set forth at http://nparc.cisti-icist.nrc-cnrc.gc.ca/npsi/jsp/nparc_cp.jsp?lang=en NRC Publications Archive Archives des publications du CNRC This publication could be one of several versions: author’s original, accepted manuscript or the publisher’s version. / La version de cette publication peut être l’une des suivantes : la version prépublication de l’auteur, la version acceptée du manuscrit ou la version de l’éditeur. For the publisher’s version, please access the DOI link below./ Pour consulter la version de l’éditeur, utilisez le lien DOI ci-dessous. http://dx.doi.org/10.1016/j.jpowsour.2008.10.029 Journal of Power Sources, 186, pp. 435-445, 2009 A general model for air-side proton exchange membrane fuel cell contamination Shi, Zheng; Song, Datong; Li, Hui; Fatih, Khalid; Tang, Yanghua; Zhang, Jianlu; Wang, Zhenwei; Wu, Shaohong; Liu, Zhong-Sheng; Wang, Haijiang; Zhang, Jiujun
-
Upload
independent -
Category
Documents
-
view
1 -
download
0
Transcript of A general model for air-side proton exchange membrane fuel cell contamination

Publisher’s version / Version de l'éditeur:
Contact us / Contactez nous: [email protected].
http://nparc.cisti-icist.nrc-cnrc.gc.ca/npsi/jsp/nparc_cp.jsp?lang=fr
L’accès à ce site Web et l’utilisation de son contenu sont assujettis aux conditions présentées dans le site
LISEZ CES CONDITIONS ATTENTIVEMENT AVANT D’UTILISER CE SITE WEB.
READ THESE TERMS AND CONDITIONS CAREFULLY BEFORE USING THIS WEBSITE.
NRC Publications Record / Notice d'Archives des publications de CNRC:http://nparc.cisti-icist.nrc-cnrc.gc.ca/npsi/ctrl?action=rtdoc&an=17101714&lang=en
http://nparc.cisti-icist.nrc-cnrc.gc.ca/npsi/ctrl?action=rtdoc&an=17101714&lang=fr
Access and use of this website and the material on it are subject to the Terms and Conditions set forth at
http://nparc.cisti-icist.nrc-cnrc.gc.ca/npsi/jsp/nparc_cp.jsp?lang=en
NRC Publications Archive
Archives des publications du CNRC
This publication could be one of several versions: author’s original, accepted manuscript or the publisher’s version. / La version de cette publication peut être l’une des suivantes : la version prépublication de l’auteur, la version acceptée du manuscrit ou la version de l’éditeur.
For the publisher’s version, please access the DOI link below./ Pour consulter la version de l’éditeur, utilisez le lien DOI ci-dessous.
http://dx.doi.org/10.1016/j.jpowsour.2008.10.029
Journal of Power Sources, 186, pp. 435-445, 2009
A general model for air-side proton exchange membrane fuel cell
contaminationShi, Zheng; Song, Datong; Li, Hui; Fatih, Khalid; Tang, Yanghua; Zhang, Jianlu; Wang, Zhenwei; Wu, Shaohong; Liu, Zhong-Sheng; Wang, Haijiang; Zhang, Jiujun

This article appeared in a journal published by Elsevier. The attached
copy is furnished to the author for internal non-commercial research
and education use, including for instruction at the authors institution
and sharing with colleagues.
Other uses, including reproduction and distribution, or selling or
licensing copies, or posting to personal, institutional or third party
websites are prohibited.
In most cases authors are permitted to post their version of the
article (e.g. in Word or Tex form) to their personal website or
institutional repository. Authors requiring further information
regarding Elsevier’s archiving and manuscript policies are
encouraged to visit:
http://www.elsevier.com/copyright

Author's personal copy
Journal of Power Sources 186 (2009) 435–445
Contents lists available at ScienceDirect
Journal of Power Sources
journa l homepage: www.e lsev ier .com/ locate / jpowsour
A general model for air-side proton exchange membrane fuel cell contamination
Zheng Shi ∗, Datong Song, Hui Li, Khalid Fatih, Yanghua Tang, Jianlu Zhang, Zhenwei Wang,Shaohong Wu, Zhong-Sheng Liu, Haijiang Wang, Jiujun Zhang
Institute for Fuel Cell Innovation, National Research Council of Canada, Vancouver, BC, Canada V6T 1W5
a r t i c l e i n f o
Article history:
Received 19 August 2008
Received in revised form
30 September 2008
Accepted 1 October 2008
Available online 17 October 2008
Keywords:
PEM fuel cells
Air contaminants and impurities
Contamination model
Toluene
Oxygen reduction reaction mechanism
Degradation
a b s t r a c t
This paper presents a general model for air-side feed stream contamination that has the capability of
simulating both transient and steady-state performance of a PEM fuel cell in the presence of air-side
feed stream impurities. The model is developed based on the oxygen reduction reaction mechanism,
contaminant surface adsorption/desorption, and electrochemical reaction kinetics. The model is then
applied to the study of air-side toluene contamination. Experimental data for toluene contamination at
four current densities (0.2, 0.5, 0.75 and 1.0 A cm−2) and three contamination levels (1, 5 and 10 ppm) were
used to validate the model. In addition, it is expected that, with parameter adjustment, this model can
also be used to predict performance degradation caused by other air impurities such as nitrogen oxides
(NOx) and sulfur oxides (SOx).
Crown Copyright © 2008 Published by Elsevier B.V. All rights reserved.
1. Introduction
Proton exchange membrane fuel cell (PEMFC) contamination
caused by impurities is an important issue in fuel cell operation and
applications. Contaminants can be classified into two categories
according to the source: external and hardware. External impuri-
ties enter the fuel cell mainly through the fuel or air feed stream. The
major impurities in hydrogen fuel produced from reformate include
CO, CO2, H2S, NH3, organic sulfur–carbon, and carbon–hydrogen
compounds, and those in air include pollutants such as NOx, SOx,
NH3, O3 and small organic compounds. The impurities introduced
through hardware sources contain metal ions such as Fe3+, Cu2+,
Ni2+, and Cr3+ from gas diffusion layers, bipolar plates, and system
components, Na, Ca, and S from membranes, and Si from gaskets
and cooling fluid.
It has been demonstrated that even trace amounts of impurities
in the fuel or air stream or the fuel cell system components can
severely poison the anode, membrane, and cathode, particularly at
low-temperature operation. The contaminants can: strongly or irre-
versibly adsorb on the catalyst surface, blocking the reaction sites;
enter the membrane, reducing proton conductivity; and change
the hydrophobicity/hydrophilicity of the catalyst layer interface,
∗ Corresponding author. Tel.: +1 604 221 3000.
E-mail address: [email protected] (Z. Shi).
affecting mass transportation. As a result, contaminants cause per-
formance degradation and sometimes permanent damage to the
membrane electrode assemblies (MEAs) [1–3]. To address this
issue, a great deal of effort has been put into identifying the poten-
tial impacts of contamination, understanding the contamination
mechanisms, and developing mitigation strategies.
At present, contamination research concentrates on three major
areas: (1) experimental impact observation and validation; (2)
theoretical modeling of contamination to provide a fundamen-
tal understanding of the mechanisms and to develop predictive
tools; and (3) contamination mitigation strategy development.
With respect to contamination impact observation, the effects on
fuel cell performance of impurities such as CO, CO2, H2S, and NH3
in the fuel feed [4–20] and SOx, NOx, H2S, and NH3 [16,21–24] in
the air stream have been extensively examined. A study of battle-
field air impurities such as benzene, propane, HCN, CNCL, sarin, and
sulfur mustard has also been reported [25]. In terms of model devel-
opment for predicting fuel cell contamination, numerous studies
on fuel cell contamination have been conducted, especially for CO
contamination [26–37]. For fuel-side H2S contamination, a kinetic
model has been developed to study both transient and steady fuel
cell performance [38]. But to the best of our knowledge a compre-
hensive predictive model for air-side feed stream contamination is
not yet available in the literature, other than a preliminary adsorp-
tion model for NO2 [39]. Since air pollutants have a large effect on
fuel cell applications, for example, portable power units for indoor
0378-7753/$ – see front matter. Crown Copyright © 2008 Published by Elsevier B.V. All rights reserved.
doi:10.1016/j.jpowsour.2008.10.029

Author's personal copy
436 Z. Shi et al. / Journal of Power Sources 186 (2009) 435–445
Nomenclature
CO2oxygen concentration in the catalyst layer
CH+ proton concentration in the CCL
CP concentration of species P
CP′ concentration of species P′
C0P
contaminant concentration in the cathode channel
DO2,air bulk oxygen diffusivity
DeffO2,air
effective oxygen diffusivity
F Faraday’s constant
Icell cell current density
ka3f and ka3b forward and backward reaction rates of the
reaction (a-iii)
kap3f and kap3b forward and backward reaction rates of the
reaction (a-vi)
kjf and kjb forward and backward reaction rates of the jth
reaction (j = 1, 2, . . ., 5)
kpjf and kpjb forward and backward reaction rates of the reac-
tions (a-iv), (a-v), (a-vii) and (a-viii) (j = 1, 2, 4, 5)
LCGDL thickness of the cathode gas diffusion layer
n number of the Pt sites occupied by contaminant P
nj electron transfer number for the corresponding
individual electrochemical half-reaction (j = 1, 2, . . .,5)
na3 electron transfer number
nap3 electron transfer number of the reaction (a-vi)
nO2electron transfer number of the ORR
pO2oxygen partial pressure
pCGC gas pressure in gas channel
psatvapor saturated water vapor pressure
q electron transfer number of the reaction (a-vii)
R ideal gas constant
R0 fuel cell internal resistance (membrane resistance)
t time
T temperature
Vcell cell voltage
V0 open circuit voltage (OCV)
z electron transfer number of the reaction (a-viii)
Greek symbols
˛j electron transfer coefficient for the corresponding
individual electrochemical half-reaction, j = 1, 2, . . .,5
˛a3 electron transfer coefficient of the electrochemical
half-reaction
˛ap3, ˛p4 and ˛p5 electron transfer coefficients of reactions
(a-vi), (a-vii) and (a-viii)
� total surface
c ratio of the active surface to the geometric surface
of the CCL
εCGDL porosity of the cathode gas diffusion layer
�a anode overpotential
�c cathode overpotential
�Pt, �Pt–O2, �Pt–O2H, �Ptn−P and �Ptn−P′ surface coverages of
corresponding species
�0Pt , �0
Pt–O2and �0
Pt–O2Hsurface coverages of corresponding
species without contaminant
and underground applications and fleet vehicles for outdoor appli-
cations, developing a predictive model for air-side contamination
is necessary in order to evaluate fuel cell performance under the
above-mentioned conditions.
In this paper, we present our work on the development of a gen-
eral model for fuel cell air-side feed stream contamination. This
is a kinetic model that is mainly based on the proposed oxygen
reduction mechanisms, the contaminant’s surface adsorption, and
the electrode reaction mechanism. The model has the capability to
simulate both transient and steady-state cell performance in the
presence of an air contaminant. The model is further validated by
our experimental data collected in the presence of toluene in a fuel
cell air-side feed stream. These experimental data were obtained
at different current densities and several toluene contamination
levels. The model is further employed to examine the toluene con-
tamination effect on cell performance at low concentration levels.
2. Model development
2.1. Oxygen reduction reaction
The oxygen reduction reaction (ORR) is a multi-electron multi-
step reaction. For the ORR on a platinum (Pt) surface, two Tafel
regions are generally observed in both acidic and alkaline solu-
tions. At low current densities (high electrode potential), a Tafel
slope of −60 mV dec−1 can be observed, whereas high current den-
sities (low electrode potential) yield a Tafel slope of −120 mV dec−1
[40]. The difference in Tafel slopes is attributable to partial cov-
erage of the Pt surface by the oxygen-containing intermediates O
and OH. Experimental study indicates that the reaction rate is first
order with respect to oxygen. Extensive research of the ORR on Pt
surfaces has been conducted in the past 40 or so years and a con-
siderable number of ORR mechanisms have been proposed [41–44].
Yet despite numerous studies of the ORR, the detailed mechanism
remains elusive. Damjanovic and co-workers [40,45,46] proposed
that the charge transfer to the adsorbed oxygen molecule, with or
without simultaneous proton transfer, is the rate-determining step
(associative model):
M + O2 → M–O2 (1)
M–O2 + H++ e−
→ M–O2H(rds) (2)
M–O2H + 3H++ 3e−
→ 2H2O + M (3)
where M represents a metal such as Pt. Yeager et al. [47] proposed
that the first step involves dissociative chemisorption of the O2
molecule, which occurs simultaneously with the charge transfer
(dissociative model):
Pt +12
O2 + e−→ Pt–O− (4)
In the search to understand ORR mechanisms, several model-
based impedance spectroscopy studies were reported that
employed either an associative kinetic model or a dissociative one
[48–50]. In another kinetic model study [51], both associative and
dissociative mechanisms were analyzed.
In recent years, many theoretical explorations of the ORR mech-
anism using quantum mechanic methods have been reported,
as shown in the review articles [52,53]. These studies supplied
information on each elementary step, such as activation ener-
gies, reaction energies, and reversible potentials. Anderson and
co-workers [54,55] investigated the activation barrier for each of
the following electron transfer steps:
Pt–O2 + H+(aq) + e− (U) → Pt–OOH (5)
Pt–OOH + H+(aq) + e− (U) → Pt–(OHOH) (6)

Author's personal copy
Z. Shi et al. / Journal of Power Sources 186 (2009) 435–445 437
Pt–OHOH + H+(aq) + e− (U) → Pt–OH + H2O (7)
Pt–OH + H+(aq) + e− (U) → Pt–OH2 (8)
Their results showed that the first electron transfer has a smaller
activation energy barrier than that of oxygen dissociation, and that
OOH easily dissociates once formed after the first electron transfer.
Norskov et al. [56,57] examined the thermodynamic properties
of both associative and dissociative mechanisms:
12
O2+∗
→ O∗ (9)
O∗+ H+
+ e−→ HO∗ (10)
HO∗+ H+
+ e−→ H2O +
∗ (11)
where * denotes a site on the surface.
O2 +∗→ O2
∗ (12)
O2∗+ (H+
+ e−) → HO2∗ (13)
HO2∗+ (H+
+ e−) → H2O + O∗ (14)
O∗+ (H+
+ e−) → HO∗ (15)
HO∗+ (H+
+ e−) → H2O +∗ (16)
The results illustrated that both mechanisms are possible and are
controlled by electrode potential. At high electrode potential, the
activation energy barrier for O2 dissociation will increase; thus, the
associative mechanism is dominant. Jacob’s study [58] also demon-
strated that both the associative and the dissociative mechanism
may occur simultaneously, with a higher ratio of occurrence for
the associative pathway. In another theoretical study [59], Walch
et al. formulated a suitable mechanism table for the prominent ORR
pathway. This mechanism includes chemical, electrochemical, and
side reactions as follows:
Chemical reaction:
O2(ads) ↔ O(ads) + O(ads) (17)
O2H(ads) ↔ O(ads) + OH(ads) (18)
H2O(ads) ↔ H(ads) + HO(ads) (19)
OH(ads) + OH(ads) ↔ O(ads) + H2O(ads) (20)
OH(ads) + O(ads) ↔ O(ads) + OH(ads) (21)
Electrochemical reaction:
O2(ads) + H+
(aq) + e−↔ O2H(ads) (22)
OH(ads) + H+
(aq) + e−↔ H2O(ads) (23)
O(ads) + H+
(aq) + e−↔ OH(ads) (24)
H2O(ads) ↔ O(ads) + 2H+
(aq) + 2e− (25)
Side reaction:
Pt ↔ Pt2+
(aq) + 2e− (26)
Pt2+
(aq) + H2O ↔ PtO + 2H+
(aq) (27)
Pt2+
(aq) + H2 ↔ Pt + 2H+
(aq) (28)
2.2. Proposed general cathode contamination model
In our attempt to develop a cathode contamination model, we
start with a simple ORR mechanism. Since the associative model
has substantial experimental and theoretical support, we adopt it
and propose the following mechanism:
Pt + O2
k1f
⇄
k1b
Pt–O2 (i)
Pt–O2 + H++ e−
k2f exp(−(˛2n2F�c/RT))
⇄
k2b exp(((1−˛2)n2F�c)/RT)
Pt–O2H (ii)
Pt–O2H + e−+ H+
k3f exp(−(˛3n3F�c/RT))
⇄
k3b exp(((1−˛3)n3F�c)/RT)
H2O + Pt–O (iii)
Pt–O + H++ e−
k4f exp(−(˛4n4�cF/RT))
⇄
k4b exp(((1−˛4)n4�cF)/RT)
Pt–OH (iv)
Pt–OH + H++ e−
k5f exp(−(˛5n5�cF/RT))
⇄
k5b exp(((1−˛5)n5�cF)/RT)
Pt + H2O (v)
where Pt is the active site for oxygen adsorption, which may contain
more than one Pt site, kjf and kjb are the forward and backward reac-
tion rates of the jth reaction (j = 1, 2, . . ., 5), ˛j is the electron transfer
coefficient for the corresponding individual electrochemical half-
reaction, nj is the electron transfer number for the corresponding
individual electrochemical half-reaction, �c is the cathode over-
potential, and F, R and T are Faraday’s constant, the universal gas
constant, and cell temperature, respectively.
In our model, we further propose that the first electron trans-
fer (reaction (ii)) is the rate-determining step. In this case, we can
further simplify the model to
Pt + O2
k1f
⇄
k1b
Pt–O2 (a-i)
Pt–O2 + H++ e−
k2f exp(−(˛2n2F�c/RT))
⇄
k2b exp(((1−˛2)n2F�c)/RT)
Pt–O2H (a-ii)
Pt–O2H + 3e−+ 3H+
ka3f exp(−(˛a3na3F�c/RT))
⇄
ka3b exp(((1−˛a3)na3F�c)/RT)
2H2O + Pt (a-iii)
where ka3f and ka3b are the forward and backward reaction rates
of the reaction (a-iii), and ˛a3 and na3 are the electron transfer
coefficient and electron transfer number of the electrochemical
half-reaction, respectively.
Reaction (a-ii) is the rate-determining step. The advantage of
this simplified model is that we can use one intermediate cover-
age Pt–OOH as the total oxygen-containing intermediates coverage,
which also includes Pt-O and Pt-OH.
For a general air-side contaminant P, we consider the following
possible electrode and surface reactions:
nPt + Pkp1f
⇄
kp1b
Ptn–P (a-iv)
P + nPt–O2
kp2f
⇄
kp2b
Ptn–P + nO2 (a-v)
P + nPt–O2H + 3ne−+ 3nH+
kap3f exp(−(˛ap3nap3F�c/RT))
⇄
kap3b exp(((1−˛ap3)nap3F�c)/RT)
2nH2O + Ptn–P (a-vi)
Ptn–P + mH2Okp4f exp((˛p4qF�c/RT))
⇄
kp4b exp(−((1−˛p4)qF�c)/RT)
Ptn–P′+ qH+
+ qe− (a-vii)
Ptn–P + l H2Okp5f exp(˛p5zF�c/RT)
⇄
kp5b exp(−((1−˛p5)zF�c)/RT)
nPt + P′′+ zH+
+ ze− (a-viii)
where Ptn is the adsorption site for P.

Author's personal copy
438 Z. Shi et al. / Journal of Power Sources 186 (2009) 435–445
Based on the proposed ORR and contaminant mechanisms,
the Pt surface is covered by the following five species: Pt, Pt–O2,
Pt–O2H, Ptn–P and Ptn–P′, where P′ is an oxidized form of P. Thus
for the cathode catalyst surface coverage, we have
1 = �Pt + �Pt–O2+ �Pt–O2H + �Ptn–P + �Ptn–P′ (29)
where �Pt, �Pt-O2, �Pt-O2H, �Ptn-P and �Ptn-P′ are the surface coverage
of the above five species, respectively.
If we assume reaction (a-i) is fast and always at its equilibrium,
we have
k1fCO2�Pt� = k1b�Pt–O2
� (30)
where Ŵ is the total surface and CO2is the oxygen concentration in
the cathode catalyst layer (CCL). We will have
�Pt–O2=
k1fCO2
k1b�Pt (31)
Assuming reaction (a-iii) is always at its equilibrium,
ka3f�Pt–O2H�C3H+ exp
(
−˛a3na3�cF
RT
)
= ka3b�Pt� exp
(
(1 − ˛a3)na3�cF
RT
)
(32)
where CH+ is the proton concentration in the CCL. Solving the above
equation for �Pt–O2H results in
�Pt–O2H =ka3b
ka3fC3H+
exp
(
na3�cF
RT
)
�Pt (33)
Substituting Eqs. (31) and (33) into Eq. (29) and solving for �Pt yields
�Pt = A(1 − �Ptn–P − �Ptn–P′ ) (34)
where
A =1
1 +k1fCO2
k1b+
ka3b
ka3fC3H+
exp(
na3�cFRT
)
(35)
Let
B =k1f
k1bCO2
A (36)
and
C =ka3b
ka3fC3H+
exp
(
na3�cF
RT
)
A (37)
Then the surface coverages of Pt–O2 and Pt–O2H are given as
follows:
�Pt–O2= B(1 − �Ptn–P − �Ptn–P′ ) (38)
and
�Pt–O2H = C(1 − �Ptn−P − �Ptn−P′ ) (39)
If there is no contaminant present in the cathode catalyst layer
(CCL), the surface coverages of Pt, Pt–O2 and Pt–O2H are only deter-
mined by the oxygen reduction reactions ((a-i), (a-ii) and (a-iii)) and
are given as
�0Pt =
1
1 + (k1fCO2/k1b) + (ka3b/ka3fC
3H+ ) exp(na3�cF/RT)
(40)
�0Pt–O2
=k1f
k1bCO2
�0Pt (41)
�0Pt–O2H =
ka3b
ka3fC3H+
exp
(
na3�cF
RT
)
�0Pt (42)
where �0Pt
, �0Pt–O2
, and �0Pt–O2H
are the surface coverages of the cor-
responding species without contaminant.
Based on the proposed reaction mechanism, the changes in the
surface coverages of Ptn–P and Ptn–P′ are given as
d�Ptn−P
dt= kp1fCP�n
Pt − kp1b�Ptn−P + kp2fCP�nPt–O2
− kp2b�Ptn−PCnO2
+ kap3fCP�nPt–O2HC3
H+ exp
(
−˛ap3nap3�cF
RT
)
− kap3b exp
(
(1 − ˛ap3)nap3�cF
RT
)
�Ptn−P
− kp4f exp
(
˛p4q�cF
RT
)
�Ptn−P
+ kp4bCq
H+ exp
(
−(1 − ˛p4)q�cF
RT
)
�Ptn−P′
− kp5f exp
(
˛p5z�cF
RT
)
�Ptn−P
+ kp5bCP′ CzH+ exp
(
−(1 − ˛p5)z�cF
RT
)
�nPt
= −
[
kp1b + kp2bCnO2
+ kap3b exp
(
(1 − ˛ap3)nap3�cF
RT
)
+kp4f exp
(
˛p4q�cF
RT
)
+ kp5f exp
(
˛p5z�cF
RT
)]
�Ptn−P
+
[
kp1fCPAn+ kp2fCPBn
+ kap3fCPC3H+ Cn exp
×
(
−˛ap3nap3�cF
RT
)
+ kp5bCP′ CzH+ An exp
×
(
−(1 − ˛p5)z�cF
RT
)]
(1 − �Ptn−P − �Ptn−P′ )n
+ kp4bCq
H+ exp
(
−(1 − ˛p4)q�cF
RT
)
�Ptn−P′ (43)
andd�Ptn−P′
dt= kp4f exp
(
˛p4q�cF
RT
)
�Ptn−P
− kp4bCq
H+ exp
(
−(1 − ˛p4)q�cF
RT
)
�Ptn−P′ (44)
with the following initial conditions
�Ptn−P(t = 0) = 0 (45)
and
�Ptn−P′ (t = 0) = 0 (46)
where t denotes time and CP and CP′ are the concentration of species
P and P′, respectively. The cathode current density controlled by
forward and backward rates of reaction (a-ii) [60] is calculated by
Ic = nO2F c
[
k2f�Pt–O2CH+ exp
(
−˛2n2�cF
RT
)
− k2b�Pt–O2H exp
(
(1 − ˛2)n2�cF
RT
)]
(47)
where nO2is the electron transfer number of the ORR and c is the
ratio of the active surface to the geometric surface of the CCL.
Author's personal copy
Z. Shi et al. / Journal of Power Sources 186 (2009) 435–445 439
When there is no contamination, no current, and overpotential
(Ic = �c = 0), k2b can be expressed from Eq. (47) as
k2b = k2f
�0Pt–O2
�0Pt–O2H
CH+ (48)
Substituting Eqs. (36)–(42) and (48) into Eq. (47) results in
Ic = nO2F ck2f
k1f
k1bCO2
ACH+ exp
(
−˛2n2�cF
RT
)
×
[
1 − exp
(
n2�cF
RT
)]
(1 − �Ptn−P − �Ptn−P′ ) (49)
The fuel cell voltage is estimated by
Vcell = V0− �a − �c − R0Ic (50)
where V0 is the open circuit voltage (OCV) of the fuel cell, �a is the
anode overpotential, and R0 is the fuel cell internal resistance. The
OCV is given by [61]
V0= 4.1868
[
70650 + 8T log(T) − 92.84T
2F
]
(51)
Anode over-potential is generally small compared to cathode over-
potential and can be neglected:
�a ≈ 0 (52)
Therefore, Eq. (50) can be rewritten as
Vcell = V0− �c − R0Ic (53)
2.3. Toluene contamination model
Several studies of toluene adsorption on Pt have been reported
[62–67]. These demonstrate (1) that in the gas phase, toluene and
benzene adsorb first as a �-complex (benzene ring parallel to the
surface) with a weaker electron transfer to Pt as compared with
ethane and propane [64]; (2) that an excess of the toluene can trans-
form the �-complex into a �-complex; and (3) that the substituent
groups play an important role in the ordering of the overlayers but
have less effect on the adsorption strength [62]. While adsorbed
aromatic compounds are in an electrochemical environment, their
molecular orientation and packing density depend on factors such
as chemical composition, concentration, temperature, electrode
potential, and the interaction between electrode and anions. The
literature [68] suggests that all the aromatic compounds interact
via their aromatic ring parallel to the Pt surface, the benzene and
toluene mainly adsorbing without dissociation. One study [63] also
indicated that the adsorbed toluene can be electrochemically oxi-
dized partially to higher oxidation state intermediates and partially
to CO2.
To study the adsorption behaviour of toluene on Pt in conditions
similar to those of fuel cell operation, a toluene adsorption isotherm
study of polycrystalline platinum electrode was conducted [69].
It was found that the Langmuir type of adsorption fits well the
adsorption isotherms in the studied temperature ranges (25–80 ◦C).
The estimated free energy of adsorption revealed toluene’s strong
affinity towards the Pt surface; it was found that toluene adsorbed
mainly as a �-complex (vertical orientation) at low concentration
and temperature, while the �-complex predominated at high con-
centration and particularly high temperatures.
Based on the experimental evidence, we propose that toluene
adsorption (reaction (a-iv)) is the dominant mechanism for air-side
toluene contamination in a fuel cell. At high electrode poten-
tial, toluene electrochemical oxidation takes place, which yields
intermediates and carbon dioxides in higher oxidized states (as
expressed in reactions (a-vii) and (a-viii)).
Toluene adsorption configuration is a complicated issue,
strongly dependent on toluene concentration, temperature, and
electrode potential. Vertical (�) and flat (�) configurations are pos-
sible. Initially, we will consider only toluene adsorption as the
dominant contamination mechanism. We start with the simplest
single-site adsorption model.
In our model, oxygen pressure in the cathode catalyst layer,
which is different from the pressure in the channel due to the pres-
sure drop across the gas diffusion layer, is estimated by Fick’s law
as
pO2= 0.21(pCGC − psat
vapor) − RTLCGDLIc
4FDeffO2,air
(54)
where pO2, pCGC and psat
vapor are the oxygen partial pressure, gas
pressure in the gas channel, and saturated water vapor pressure,
respectively, LCGDL is the thickness of the cathode gas diffusion layer,
and DeffO2,air
is the effective oxygen diffusivity in air.
psatvapor = exp
(
11.6832 −3816.44
T − 46.13
)
(55)
The effective oxygen diffusivity is estimated by the Bruggeman
relation,
DeffO2,air
= (εCGDL)1.5DO2,air (56)
where εCGDL is the porosity of the cathode gas diffusion layer and
DO2,air is the bulk oxygen diffusivity in air.
The oxygen concentration in the cathode catalyst layer is calcu-
lated by the gas law
CO2=
pO2
RT(57)
3. Experimental results
The testing platform design for fuel cell toluene contamination
has been described in another paper [70]. All tests were con-
ducted on a Fideris 100 W fuel cell test station with a single-cell
hardware purchased from Teledyne (50 cm2 CH-50). The flow field
plates were designed and fabricated in-house using single ser-
pentine flow channels of 1.2 mm width, 1.0 mm channel depth,
and 1.0 mm landing. The membrane electrode assembly (MEA)
has an active area of 50 cm2. The gas diffusion layer (GDL), pur-
chased from SGL Carbon Group, was a PTFE (20 wt%) and carbon
black impregnated carbon paper. The catalyst coated membrane
(CCM) (manufactured by Ion Power) was made of Nafion® 211
membrane with 0.4 mg cm−2 Pt loading on both anode and cath-
ode sides. A fresh MEA was employed for each contamination
test.
In all fuel cell tests both with and without toluene present,
the voltage-current polarization curves (steady-state polarization
curves) were collected using a load bank controlled in a constant-
current pattern. The relative humidity (RH) of the fuel cell was
controlled at 80% for both anode and cathode sides, and the cell
temperature and backpressure were controlled at 80 ◦C and 30 psig,
respectively.
4. Results and discussion
4.1. ORR parameter study
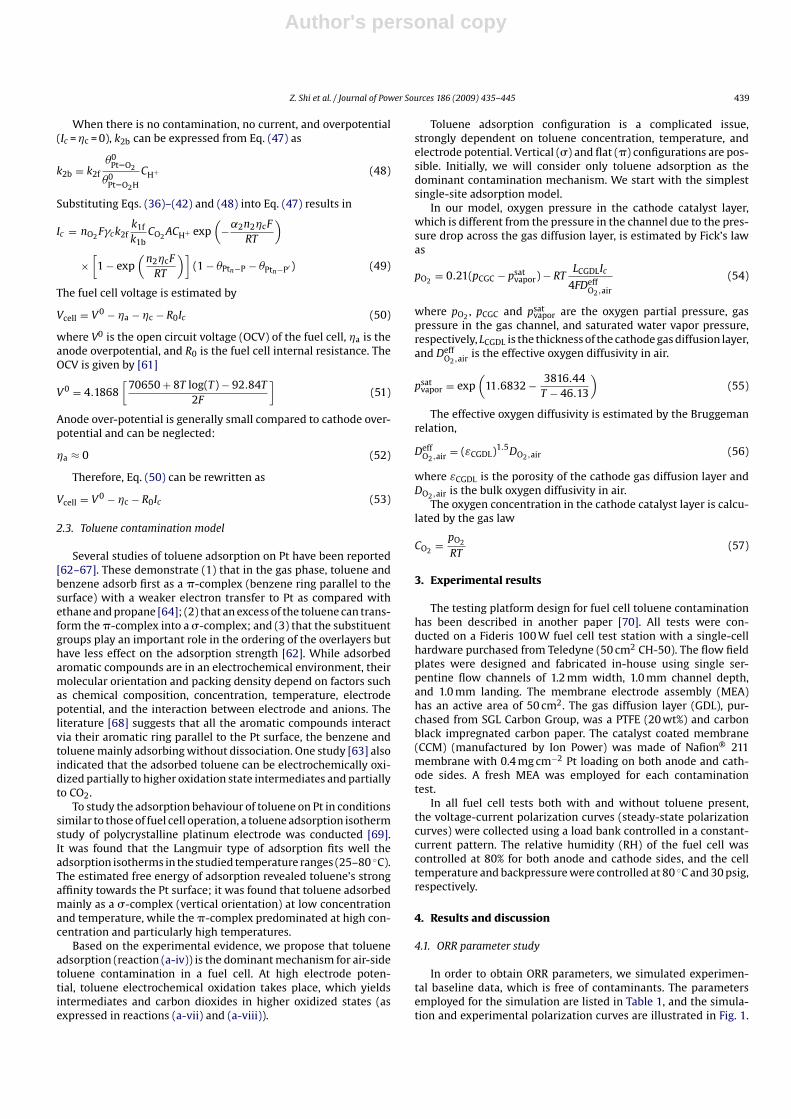
In order to obtain ORR parameters, we simulated experimen-
tal baseline data, which is free of contaminants. The parameters
employed for the simulation are listed in Table 1, and the simula-
tion and experimental polarization curves are illustrated in Fig. 1.
Author's personal copy
440 Z. Shi et al. / Journal of Power Sources 186 (2009) 435–445
Table 1
Parameter values used in polarization fitting.
F 96485 C mol−1
R 8.315 J K−1 mol−1
T 353 K
nO24
c 5000 cm2 cm−2
�a 0 V
n 1
n2 1
na3 1
˛ap3 0.5
nap3 1
˛p4 0.5
q 1
˛p5 0.5
z 1
LCGDL 3.53 × 10⁻² cm
pCGC 30 psig
DO2,air 1.366 × 10⁻¹ cm2 s−1
εCGDL 0.8
CH+ 1.7273 × 10⁻³ mol cm−3
Table 2
Estimated parameter values based on the baseline polarization curve.
k1f
k1b5.8 × 104 cm3 mol−1
ka3f
ka3b5.52 × 104 (cm3)3 (mol−1)3
k2f 1.64 × 10⁻¹¹ s−1 cm3 mol−1
˛2 0.815
Table 2 lists the estimations of these parameters from the simu-
lation. Our estimated rate constant for the rate-determining step
(reaction (a-ii)) is 1.64 × 10⁻¹¹. This number is quite similar to the
rate constant of 2.54 × 10⁻¹¹, which is derived from a reported
experimental exchange current density obtained at fuel cell operat-
Fig. 1. Comparison of calculated and experimental polarization curve in the absence
of contaminant.
ing conditions in a high current density region, with a temperature
of 80 ◦C [71]. The estimated symmetric parameter for the same
reaction (˛2) is 0.815.
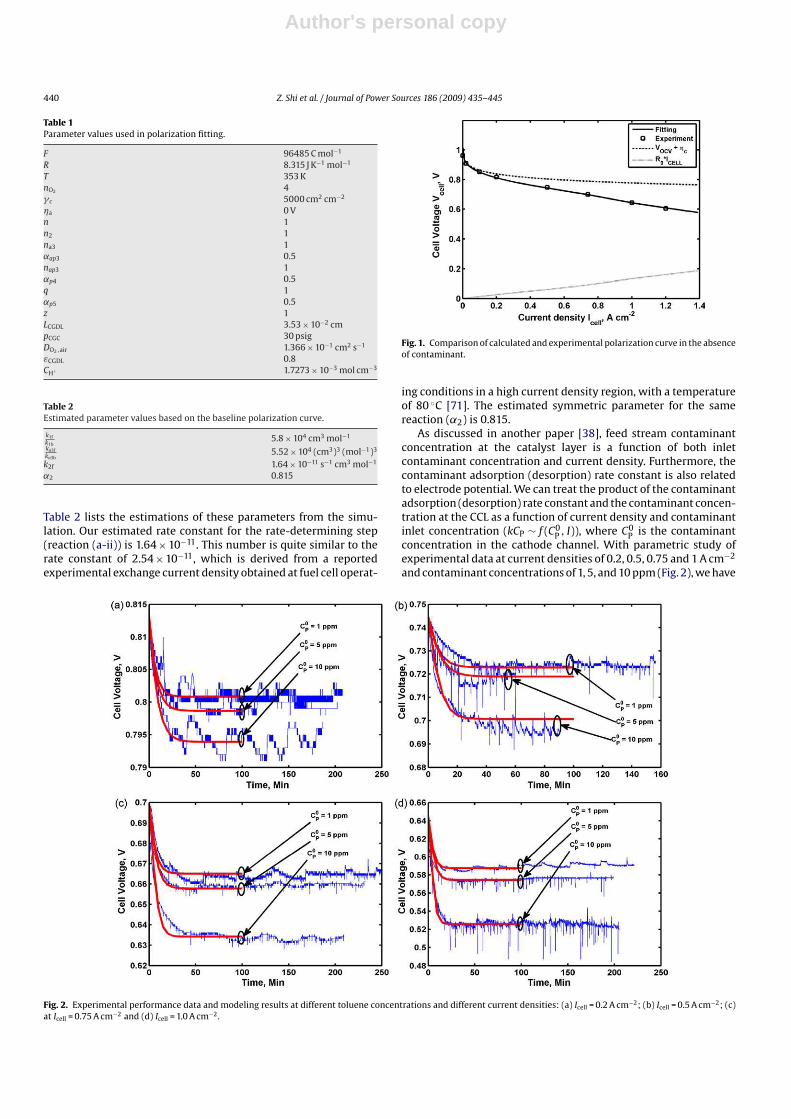
As discussed in another paper [38], feed stream contaminant
concentration at the catalyst layer is a function of both inlet
contaminant concentration and current density. Furthermore, the
contaminant adsorption (desorption) rate constant is also related
to electrode potential. We can treat the product of the contaminant
adsorption (desorption) rate constant and the contaminant concen-
tration at the CCL as a function of current density and contaminant
inlet concentration (kCP ∼ f (C0P
, I)), where C0P
is the contaminant
concentration in the cathode channel. With parametric study of
experimental data at current densities of 0.2, 0.5, 0.75 and 1 A cm−2
and contaminant concentrations of 1, 5, and 10 ppm (Fig. 2), we have
Fig. 2. Experimental performance data and modeling results at different toluene concentrations and different current densities: (a) Icell = 0.2 A cm−2; (b) Icell = 0.5 A cm−2; (c)
at Icell = 0.75 A cm−2 and (d) Icell = 1.0 A cm−2 .

Author's personal copy
Z. Shi et al. / Journal of Power Sources 186 (2009) 435–445 441
Fig. 3. Comparison of simulated and experimental steady-state performance under
different toluene contaminations.
obtained a relationship between contaminant adsorption (desorp-
tion) rate constants, toluene concentration at the CCL, and current
density that enables us to predict cell performance and surface cov-
erage. Fig. 3 presents a comparison of steady-state cell performance
under different toluene concentration levels.
4.2. Model simulation
With the developed toluene contamination model, we simu-
lated transient and steady-state cell performance (Figs. 4 and 5) at
different current densities and with toluene concentrations at ppb
levels, which closely resemble normal indoor and outdoor toluene
levels. As presented in Fig. 4, at a current density of 0.2 A cm−2
the voltage drop due to the presence of 750 ppb toluene can be
9 mV. If the current density is increased to 0.5, 0.75 and 1.0 A cm−2,
Fig. 5. Effects of toluene contaminations on steady-state fuel cell performance.
the same amount of toluene can cause corresponding cell perfor-
mance drops up to 16, 27, and 48 mV, respectively. As shown in
Fig. 4(d), at a current density of 1.0 A cm−2, the cell voltage drops
due to toluene concentrations of 250, 500 and 750 ppb are 37, 42
and 48 mV, respectively. Fig. 5 shows the effects of toluene contam-
ination on steady-state cell performance at different concentration
levels. Thus, the extent to which toluene contamination affects cell
performance depends on toluene concentration and current den-
sity. Based on this model, we can estimate the maximum allowable
toluene concentration in order to limit the voltage drop to a certain
range. For instance, to limit the contamination potential drop to
less than 10 mV, with a current density of 1.0 A cm−2, toluene con-
centration should be less than 100 ppb. One can also estimate the
degree of cell performance degradation at a certain contaminant
level and current density.
Fig. 4. Simulated fuel cell transient performance at different current densities and different toluene concentrations.

Author's personal copy
442 Z. Shi et al. / Journal of Power Sources 186 (2009) 435–445
Fig. 6. Pt surface coverages at different current densities and different toluene concentrations.
Fig. 7. Oxygen surface coverages at different current densities and different toluene concentrations.

Author's personal copy
Z. Shi et al. / Journal of Power Sources 186 (2009) 435–445 443
Fig. 8. Oxygen-containing intermediates surface coverages at different current densities and different toluene concentrations.
Fig. 9. Toluene surface coverages at different current densities and different toluene concentrations.
Author's personal copy
444 Z. Shi et al. / Journal of Power Sources 186 (2009) 435–445
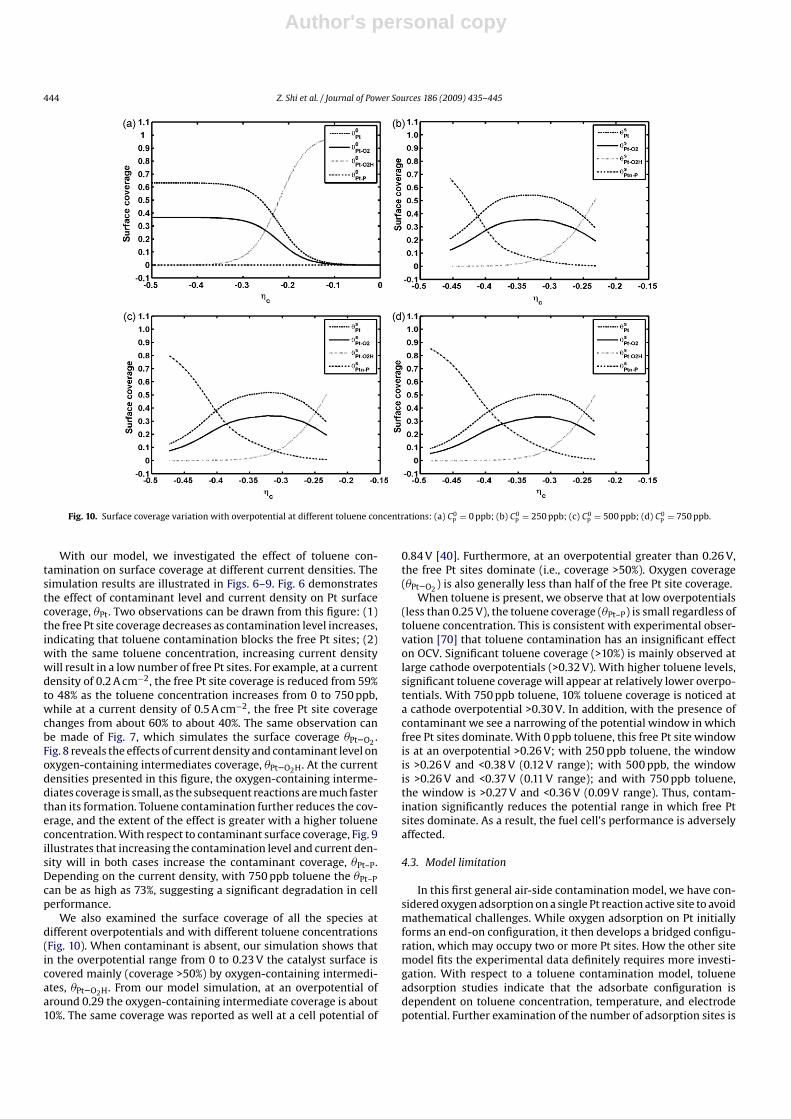
Fig. 10. Surface coverage variation with overpotential at different toluene concentrations: (a) C0P
= 0 ppb; (b) C0P
= 250 ppb; (c) C0P
= 500 ppb; (d) C0P
= 750 ppb.
With our model, we investigated the effect of toluene con-
tamination on surface coverage at different current densities. The
simulation results are illustrated in Figs. 6–9. Fig. 6 demonstrates
the effect of contaminant level and current density on Pt surface
coverage, �Pt. Two observations can be drawn from this figure: (1)
the free Pt site coverage decreases as contamination level increases,
indicating that toluene contamination blocks the free Pt sites; (2)
with the same toluene concentration, increasing current density
will result in a low number of free Pt sites. For example, at a current
density of 0.2 A cm−2, the free Pt site coverage is reduced from 59%
to 48% as the toluene concentration increases from 0 to 750 ppb,
while at a current density of 0.5 A cm−2, the free Pt site coverage
changes from about 60% to about 40%. The same observation can
be made of Fig. 7, which simulates the surface coverage �Pt–O2.
Fig. 8 reveals the effects of current density and contaminant level on
oxygen-containing intermediates coverage, �Pt–O2H. At the current
densities presented in this figure, the oxygen-containing interme-
diates coverage is small, as the subsequent reactions are much faster
than its formation. Toluene contamination further reduces the cov-
erage, and the extent of the effect is greater with a higher toluene
concentration. With respect to contaminant surface coverage, Fig. 9
illustrates that increasing the contamination level and current den-
sity will in both cases increase the contaminant coverage, �Pt–P.
Depending on the current density, with 750 ppb toluene the �Pt–P
can be as high as 73%, suggesting a significant degradation in cell
performance.
We also examined the surface coverage of all the species at
different overpotentials and with different toluene concentrations
(Fig. 10). When contaminant is absent, our simulation shows that
in the overpotential range from 0 to 0.23 V the catalyst surface is
covered mainly (coverage >50%) by oxygen-containing intermedi-
ates, �Pt–O2H. From our model simulation, at an overpotential of
around 0.29 the oxygen-containing intermediate coverage is about
10%. The same coverage was reported as well at a cell potential of
0.84 V [40]. Furthermore, at an overpotential greater than 0.26 V,
the free Pt sites dominate (i.e., coverage >50%). Oxygen coverage
(�Pt–O2) is also generally less than half of the free Pt site coverage.
When toluene is present, we observe that at low overpotentials
(less than 0.25 V), the toluene coverage (�Pt–P) is small regardless of
toluene concentration. This is consistent with experimental obser-
vation [70] that toluene contamination has an insignificant effect
on OCV. Significant toluene coverage (>10%) is mainly observed at
large cathode overpotentials (>0.32 V). With higher toluene levels,
significant toluene coverage will appear at relatively lower overpo-
tentials. With 750 ppb toluene, 10% toluene coverage is noticed at
a cathode overpotential >0.30 V. In addition, with the presence of
contaminant we see a narrowing of the potential window in which
free Pt sites dominate. With 0 ppb toluene, this free Pt site window
is at an overpotential >0.26 V; with 250 ppb toluene, the window
is >0.26 V and <0.38 V (0.12 V range); with 500 ppb, the window
is >0.26 V and <0.37 V (0.11 V range); and with 750 ppb toluene,
the window is >0.27 V and <0.36 V (0.09 V range). Thus, contam-
ination significantly reduces the potential range in which free Pt
sites dominate. As a result, the fuel cell’s performance is adversely
affected.
4.3. Model limitation
In this first general air-side contamination model, we have con-
sidered oxygen adsorption on a single Pt reaction active site to avoid
mathematical challenges. While oxygen adsorption on Pt initially
forms an end-on configuration, it then develops a bridged configu-
ration, which may occupy two or more Pt sites. How the other site
model fits the experimental data definitely requires more investi-
gation. With respect to a toluene contamination model, toluene
adsorption studies indicate that the adsorbate configuration is
dependent on toluene concentration, temperature, and electrode
potential. Further examination of the number of adsorption sites is

Author's personal copy
Z. Shi et al. / Journal of Power Sources 186 (2009) 435–445 445
underway in our lab. It is known that the ORR rate depends on the
Pt crystalline faces, as does the toluene adsorption rate. This rate
difference and interplay may be one reason why overall, our simple
adsorption models fit the experimental data. Furthermore, in real-
ity toluene concentration in air is at the ppb level, so experimental
validation at the ppb level is in progress at our lab.
5. Summary
We successfully developed a general air-side feed stream con-
tamination model, which has been validated with experimental
data on fuel cell toluene contamination at four different current
densities (0.2, 0.5, 0.75, and 1 A cm−2) and three toluene concen-
trations (1, 5, and 10 ppm). This model employs the associative
oxygen reduction mechanism and considers possible contaminant
reactions, such as surface adsorption, competitive adsorption, and
electrochemical oxidation. The model has the capability to simu-
late and predict both transient and steady-state cell performance.
Using it we examined toluene contamination effects on cell per-
formance. Our model reveals that with 750 ppb toluene, a 48-mV
performance drop at 1 A cm−2 can be expected. The contamina-
tion level and current density determine the extent of performance
degradation. Our model simulation indicates that without contam-
inant, the oxygen-containing species dominate the catalyst surface
at overpotentials <0.25 V. At overpotentials >0.26 V, free Pt sites
dominate. In the presence of toluene contaminants, the surface
coverage is not affected at low overpotentials (<0.25 V). Toluene
contamination dominates at larger overpotentials (>0.3 V). With
750 ppb toluene, 20% toluene coverage is predicted at cathode over-
potentials >35 V, while 50% coverage is predicted at overpotentials
>0.40 V.
Acknowledgment
We would like to acknowledge support for this research from
the National Research Council of Canada, Institute for Fuel Cell
Innovation (NRC-IFCI).
References
[1] P.R. Hayter, P. Mitchell, R.A.J. Dams, C. Dudfield, N. Gladding, The effect of con-taminants in the fuel and air streams on the performance of a solid polymer fuelcell, Contract Report (ETSUF/02/00126/REP) Wellman CJB Limited, Portsmouth,UK, 1997.
[2] D. Brumbaugh, J. Guthrie, Literature Survey of Fuel Cell Contaminants, US FuelCell Council (Ed), US Fuel Cell Council, 2004.
[3] X. Cheng, Z. Shi, N. Glass, L. Zhang, J. Zhang, D. Song, Z.S. Liu, H. Wang, J. Shen,J. Power Sources 165 (2007) 739.
[4] H.P. Dhar, L.G. Christner, A.K. Kush, J. Electrochem. Soc. 134 (1987) 3021.[5] H.F. Oetjen, V.M. Schmidt, U. Stimming, F. Trila, J. Electrochem. Soc. 143 (1996)
3838.[6] C. Sishtla, G. Koncar, R. Platon, S. Gamburzev, A.J. Appleby, O.A. Velev, J. Power
Sources 71 (1998) 249.[7] F.A. Uribe, T.A. Zawodzinski, Electrochemical Society Meeting Abstract, San
Francisco, 2001.[8] F.A. Uribe, S. Gottesfeld, T.A. Zawodzinski, J. Electrochem. Soc. 149 (2002)
A293–A296.[9] F.A. de Bruijn, D.C. Papageorgopoulos, E.F. Sitters, G.J.M. Janssen, J. Power
Sources 110 (2002) 117.[10] N. Rajalakshmi, T.T. Jayanth, K.S. Dhathathreyan, Fuel Cell 3 (4) (2003) 177–180.[11] R. Halseid, J.S. Preben Vie, R. Tunold, J Power Sources 154 (2006) 343.[12] M. Murthy, M. Esayian, A. Hobson, S. MacKenzie, W.-k. Lee, J.W. Van Zee, J.
Electrochem. Soc. 148 (2001) A1141–A1147.[13] M. Murthy, M. Esayian, W.-k. Lee, J.W. Van Zee, J. Electrochem. Soc. 150 (2003)
A29–A34.[14] R. Mohtadi, W.-k. Lee, S. Cowan, J.W. Van Zee, M. Murthy, Electrochem. Solid-
State Lett. 6 (2003) A272–A274.[15] R. Mohtadi, W.K. Lee, J.W. Van Zee, Appl. Catal. B: Environ. 56 (2005) 37.[16] S. Knights, N. Jia, C. Chuy, J. Zhang, 2005 Fuel Cell Seminar: Fuel Cell Progress,
Challenges and Markets Abstract, Palm Springs, 2005.[17] W. Shi, B. Yi, M. Hou, F. Jing, H. Yu, P. Ming, J. Power Sources 164 (2007) 272.
[18] R.K. Ahluwalia, X. Wang, J. Power Sources 180 (2008) 122.[19] R.J. Behm, Z. Jusys, J. Power Sources 154 (2006) 327.[20] A.K. Meland, S. Kjelstrup, J. Electroanal. Chem. 610 (2007) 171.[21] D. Yang, J. Ma, L. Xu, M. Wu, H. Wang, Electrochim. Acta 51 (2006) 4039.[22] R. Mohtadi, W. Lee, J.W. Van Zee, J. Power Sources 138 (2004) 216.[23] F. Jing, M. Hou, W. Shi, J. Fu, H. Yu, P. Ming, B. Yi, J. Power Sources 166 (2007)
172.[24] Y. Garsany, O.A. Baturina, K.E. Swider-Lyons, J. Electrochem. Soc. 154 (2007)
B670–B675.[25] J.M. Moore, P.L. Adcock, J.B. Lakeman, G.O. Mepsted, J. Power Sources 85 (2000)
254.[26] T. Springer, T. Zawodzinski, S. Gottesfeld, in: J. McBreen, S. Mukherjee, S.
Srinivasan (Eds.), Proceedings of the Symposium on Electrode Material and Pro-cesses for Energy Conversion and Storage IV, Pennington, NJ, ElectrochemicalSociety, Inc. 1997.
[27] T.E. Springer, T. Rockward, T.A. Zawodzinski, S. Gottesfeld, J. Electrochem. Soc.148 (2001) A11–A23.
[28] X. Wang, I.M. Hsing, Y.J. Leng, P.L. Yue, Electrochim. Acta 46 (2001) 4397.[29] P. Rama, R. Chen, R. Thring, Proceedings of the Institution of Mechanical Engi-
neers, Part A, J. Power Energy, 219 (2005) 255.[30] K.K. Bhatia, C.-Y. Wang, Electrochim. Acta 49 (2004) 2333.[31] J.J. Baschuk, A.M. Rowe, X. Li, J. Energy Res. Technol. 125 (2003) 94.[32] J.J. Baschuk, Xianguo Li, Int. J. Global Energy Issues 20 (2003) 245.[33] S.H. Chan, S.K. Goh, S.P. Jiang, Electrochim. Acta 48 (2003) 1905.[34] J. Zhang, H. Wang, D.P. Wilkinson, D. Song, J. Shen, Z.-S. Liu, J. Power Sources
147 (2005) 58.[35] A.A. Shah, P.C. Sui, G.S. Kim, S. Ye, J. Power Sources 166 (2007) 1.[36] D.J.L. Brett, P. Aguiar, N.P. Brandon, A.R. Kucernak, Int. J. Hydrogen Energy 32
(2007) 863.[37] C.G. Farrell, C.L. Gardner, M. Ternan, J. Power Sources 171 (2007) 282.[38] Z. Shi, D. Song, J. Zhang, Z.S. Liu, S. Knights, R. Vohra, N. Jia, D. Harvey, J. Elec-
trochem. Soc. 154 (2007) B609–B615.[39] J. St-Pierre, N. Jia, R. Rahmani, J. Electrochem. Soc. 155 (2008) B315–B320.[40] A. Damjanovic, M.A. Genshaw, Electrochim. Acta 15 (1970) 1281.[41] K. Kinoshita, in: K. Kinoshita (Ed.), Electrochemical Oxygen Technology, John
Wiley & Sons, Inc., New York, 1992, Ch. 2.[42] R. Adzic, in: J. Lipkowski, P.N. Ross (Eds.), Electrocatalysis, Wiley-VCH, New York,
1998, Ch. 5.[43] M. Gattrell, B. MacDougall, in: W. Vielstich, H.A. Gasteiger, A. Lamm (Eds.),
Handbook of Fuel Cells—Foundamentals, Technology and Applications; vol. 2:Electrocatalysis, John Wiley & Sons, 2003, Ch. 30.
[44] P.N. Ross Jr., in: W. Vielstich, H.A. Gasteiger, A. Lamm (Eds.), Handbook of FuelCells—Foundamentals, Technology and Applications, vol. 2: Electrocatalysis,John Wiley & Sons, 2003, Ch. 31.
[45] A. Damjanovic, V. Brusic, Electrochim. Acta 12 (1967) 615.[46] D.B. Sepa, M.V. Vojnovic, Lj. M. Vracar, A. Damjanovic, Electrochim. Acta 32
(1987) 129.[47] E. Yeager, M. Razaq, D. Gervasio, A. Razaq, D. Tryk, in: D. Scherson, D. Tryk, M.
Daroux, X. Xing (Eds.), Structure Effects in Electrocatalysis and Oxygen Electro-chemistry, Proc. Vo. 92-11, The Electrochem. Soc. Inc., Pennington, NJ, 1992, p.440.
[48] O. Antoine, Y. Bultel, R. Durand, J. Electroanal. Chem. 499 (2001) 85.[49] H. Kuhn, A. Wokaun, G.G. Scherer, Electrochim. Acta 52 (2007) 2322.[50] C.Y. Du, T.S. Zhao, C. Xu, J. Power Sources 167 (2007) 265.[51] V.P. Zhdanov, B. Kasemo, Electrochem. Commun. 8 (2006) 1132.[52] Z. Shi, J. Zhang, Z.S. Liu, H. Wang, D.P. Wilkinson, Electrochim. Acta 51 (2006)
1905.[53] Z. Shi, in: J. Zhang (Ed.), PEM Fuel Cell Electrocatalysts and Catalyst Layer,
Springer, 2008, Ch. 5.[54] A.B. Anderson, T.V. Albu, J. Electrochem. Soc. 147 (2000) 4229.[55] R.A. Sidik, A.B. Anderson, J. Electroanal. Chem. 528 (2002) 69.[56] J.K. Norskov, J. Rossmeisl, A. Logadottir, L. Lindqvist, J.R. Kitchin, T. Bligaard, H.
Jonsson, J. Phys. Chem. B 108 (2004) 17886.[57] G.S. Karlberg, J. Rossmeisl, J.K. Norskov, Phys. Chem. Chem. Phys. 9 (2007) 5158.[58] T. Jacob, Fuel Cell 6 (2006) 159.[59] S. Walch, A. Dhanda, M. Aryanpour, H. Pitsch, J. Phys. Chem. C 112 (2008)8464.[60] J. Newman, K.E. Thomas-Alyea, Electrochemical Systems, John Wiley & Sons,
2004, p. 210.[61] A.E. Weber, R.M. Darling, J. Newman, J. Electrochem. Soc. 151 (2004) A1715.[62] J.L. Gland, G.A. Somorjai, Surf. Sci. 41 (1974) 387.[63] J. Zhu, T. Hartung, D. Tegtmeyer, H. Baltruschat, J. Heitbaum, J. Electroanal. Chem.
244 (1988) 273.[64] Z. Hlavathy, P. Tetenyi, Appl. Surf. Sci. 252 (2005) 412.[65] M.C. Tsai, E.L. Muetterties, J. Am. Chem. Soc. 104 (1982) 2534.[66] S. Chiang, Chem. Rev. 97 (1997) 1083.[67] A.T. Hubbard, Chem. Rev. 88 (1988) 633.[68] J.L. RodrØguez, E. Pastor, Electrochim. Acta 45 (2000) 4279.[69] K. Fatih, H. Wang, Z. Shi, D. Song, H. Li, J. Zhang, W. Shaohong, J. Zhang, Elec-
trochim. Acta, submitted for publication.[70] H. Li, J. Zhang, K. Fatih, Y. Tang, Z. Wang, Z. Shi, W. Shaohong, D. Song, J. Zhang,
N. Jia, S. Wessel, R. Abouatallah, N. Joos, J. Power Sources 185 (2008) 272.[71] C. Song, Y. Tang, J.L. Zhang, J. Zhang, H. Wang, J. Shen, S. McDermid, J. Li, P. Kozak,
Electrochim. Acta 52 (2007) 2552.