Dynamic first principles model of a complete reversible fuel cell system
14
Journal of Power Sources 182 (2008) 240–253 Contents lists available at ScienceDirect Journal of Power Sources journal homepage: www.elsevier.com/locate/jpowsour Dynamic first principles model of a complete reversible fuel cell system Tim M. Brown a , Jacob Brouwer a,∗ , G. Scott Samuelsen a , Franklin H. Holcomb b , Joel King c a National Fuel Cell Research Center (NFCRC), University of California, Irvine, Irvine, CA 92697-3550, United States b U.S. Army Engineer Research & Development Center, Construction Engineering Research Lab, 2902 Newmark Drive, Champaign, IL 61826-9005, United States c Alion Science and Technology, U.S. Army National Automotive Center, AMSRD-TAR/N (MS 289), Warren, MI 48397-5000, United States article info Article history: Received 4 February 2008 Received in revised form 7 March 2008 Accepted 16 March 2008 Available online 4 April 2008 Keywords: Reversible fuel cell Dynamic model PEM fuel cell PEM electrolyzer Hydride tank abstract A dynamic model of a discrete reversible fuel cell (RFC) system has been developed in a Matlab Simulink ® environment. The model incorporates first principles dynamic component models of a proton exchange membrane (PEM) fuel cell, a PEM electrolyzer, a metal hydride hydrogen storage tank, and a cooling system radiator, as well as empirical models of balance of plant components. Dynamic simulations show unique charging and discharging control issues and highlight factors contributing to overall system efficiency. © 2008 Elsevier B.V. All rights reserved. 1. Background and introduction Reversible fuel cell (RFC) systems act as “rechargeable” energy storage devices designed to work as turn-key systems with electric- ity being the only input and output. This may allow future systems to replace traditional chemical storage batteries in applications where the potential performance benefits outweigh the cost trade- offs [1]. The major components in an RFC system are a fuel cell, an electrolyzer (unitized RFC systems use just one device to perform both functions, discrete systems have separate fuel cell and elec- trolyzer devices), and a hydrogen storage tank. Numerous balance of plant components are also necessary for a practical system [2]. It is only through thorough modeling of all these components that true system efficiencies can be estimated. Fig. 1 shows a schematic diagram of the RFC system modeled in this work, demonstrating the complex auxiliary components and circuitous integration of all of the parts. The RFC system is “charged” by supplying electricity to an elec- trolyzer that disassociates water yielding hydrogen and oxygen. The oxygen is vented to the atmosphere and the hydrogen is stored in the hydrogen tank. The current system uses a reversible metal hydride compound confined in an aluminum tank for hydrogen storage. When power is needed from the system, hydrogen is sup- plied by the tank to the fuel cell where it is combined with air to produce electricity, heat, and water. ∗ Corresponding author. Tel.: +1 949 824 1999; fax: +1 949 824 7423. E-mail address: [email protected] (J. Brouwer). The RFC energy storage system is unique when compared to tra- ditional chemical batteries because the power capability, energy storage capacity, and recharge rate are all determined indepen- dently [3]. With the exception of shared controls and plumbing, the hydrogen tank capacity solely determines the energy storage of the system, the fuel cell power output governs the power output of the system, and the electrolyzer power determines the “recharge” rate of the system. These properties lead to system advantages in specialized applications, particularly for those applications that require low to moderate power, long duration performance, and/or strict weight requirements. The fuel cell and electrolyzer can be sized as needed for the power requirement, while the hydrogen storage tank can simply be sized up or down, independently, to meet the energy storage requirement. A traditional chemical bat- tery would require increases in all parameters in order to meet the demands of just one of these design criteria. Consequently, a fuel cell/electrolyzer system can theoretically achieve a better energy density than even state-of-the-art chemical batteries [4]. In order to evaluate the performance of a fuel cell rechargeable energy system, to garner insight into the dynamic response char- acteristics of the system and individual components, and to design superior systems in the future, a dynamic model of a RFC system is developed in a modular Matlab Simulink ® framework. 1.1. Experimental RFC system description The particular regenerative fuel cell system being modeled was designed to replace lead-acid batteries onboard a U.S. Army Stryker vehicle and consists of a 5.5 kW fuel cell, a 3.6 kW electrolyzer, and 0378-7753/$ – see front matter © 2008 Elsevier B.V. All rights reserved. doi:10.1016/j.jpowsour.2008.03.077
-
Upload
independent -
Category
Documents
-
view
2 -
download
0
Transcript of Dynamic first principles model of a complete reversible fuel cell system

Journal of Power Sources 182 (2008) 240–253
Contents lists available at ScienceDirect
Journal of Power Sources
journa l homepage: www.e lsev ier .com/ locate / jpowsour
Dynamic first principles model of a complete reversible fuel cell system
sen92697ch LabMS 28
rete rincor, a PEMcal mcontr
Tim M. Browna, Jacob Brouwera,∗, G. Scott Samuela National Fuel Cell Research Center (NFCRC), University of California, Irvine, Irvine, CAb U.S. Army Engineer Research & Development Center, Construction Engineering Researc Alion Science and Technology, U.S. Army National Automotive Center, AMSRD-TAR/N (
a r t i c l e i n f o
Article history:Received 4 February 2008Received in revised form 7 March 2008Accepted 16 March 2008Available online 4 April 2008
Keywords:Reversible fuel cellDynamic modelPEM fuel cellPEM electrolyzerHydride tank
a b s t r a c t
A dynamic model of a discenvironment. The modelmembrane (PEM) fuel cellradiator, as well as empiricharging and discharging
1. Background and introduction
Reversible fuel cell (RFC) systems act as “rechargeable” energystorage devices designed to work as turn-key systems with electric-ity being the only input and output. This may allow future systems
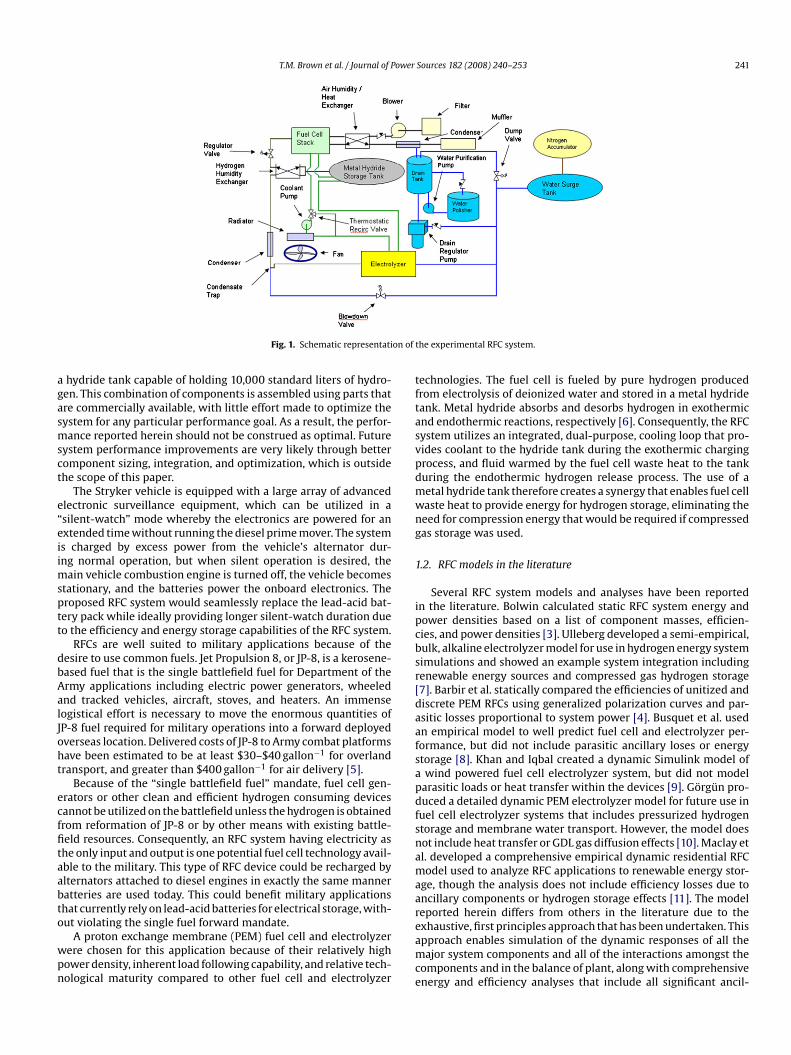
to replace traditional chemical storage batteries in applicationswhere the potential performance benefits outweigh the cost trade-offs [1]. The major components in an RFC system are a fuel cell, anelectrolyzer (unitized RFC systems use just one device to performboth functions, discrete systems have separate fuel cell and elec-trolyzer devices), and a hydrogen storage tank. Numerous balanceof plant components are also necessary for a practical system [2].It is only through thorough modeling of all these components thattrue system efficiencies can be estimated. Fig. 1 shows a schematicdiagram of the RFC system modeled in this work, demonstratingthe complex auxiliary components and circuitous integration of allof the parts.The RFC system is “charged” by supplying electricity to an elec-trolyzer that disassociates water yielding hydrogen and oxygen. Theoxygen is vented to the atmosphere and the hydrogen is storedin the hydrogen tank. The current system uses a reversible metalhydride compound confined in an aluminum tank for hydrogenstorage. When power is needed from the system, hydrogen is sup-plied by the tank to the fuel cell where it is combined with air toproduce electricity, heat, and water.
∗ Corresponding author. Tel.: +1 949 824 1999; fax: +1 949 824 7423.E-mail address: [email protected] (J. Brouwer).
0378-7753/$ – see front matter © 2008 Elsevier B.V. All rights reserved.doi:10.1016/j.jpowsour.2008.03.077
a, Franklin H. Holcombb, Joel Kingc
-3550, United States, 2902 Newmark Drive, Champaign, IL 61826-9005, United States9), Warren, MI 48397-5000, United States
eversible fuel cell (RFC) system has been developed in a Matlab Simulink®
porates first principles dynamic component models of a proton exchangeelectrolyzer, a metal hydride hydrogen storage tank, and a cooling system
odels of balance of plant components. Dynamic simulations show uniqueol issues and highlight factors contributing to overall system efficiency.
© 2008 Elsevier B.V. All rights reserved.
The RFC energy storage system is unique when compared to tra-ditional chemical batteries because the power capability, energystorage capacity, and recharge rate are all determined indepen-dently [3]. With the exception of shared controls and plumbing,the hydrogen tank capacity solely determines the energy storage ofthe system, the fuel cell power output governs the power output ofthe system, and the electrolyzer power determines the “recharge”rate of the system. These properties lead to system advantages
in specialized applications, particularly for those applications thatrequire low to moderate power, long duration performance, and/orstrict weight requirements. The fuel cell and electrolyzer can besized as needed for the power requirement, while the hydrogenstorage tank can simply be sized up or down, independently, tomeet the energy storage requirement. A traditional chemical bat-tery would require increases in all parameters in order to meet thedemands of just one of these design criteria. Consequently, a fuelcell/electrolyzer system can theoretically achieve a better energydensity than even state-of-the-art chemical batteries [4].In order to evaluate the performance of a fuel cell rechargeableenergy system, to garner insight into the dynamic response char-acteristics of the system and individual components, and to designsuperior systems in the future, a dynamic model of a RFC system isdeveloped in a modular Matlab Simulink® framework.
1.1. Experimental RFC system description
The particular regenerative fuel cell system being modeled wasdesigned to replace lead-acid batteries onboard a U.S. Army Strykervehicle and consists of a 5.5 kW fuel cell, a 3.6 kW electrolyzer, and
T.M. Brown et al. / Journal of Power Sources 182 (2008) 240–253 241
on of
Fig. 1. Schematic representatia hydride tank capable of holding 10,000 standard liters of hydro-gen. This combination of components is assembled using parts thatare commercially available, with little effort made to optimize thesystem for any particular performance goal. As a result, the perfor-mance reported herein should not be construed as optimal. Futuresystem performance improvements are very likely through bettercomponent sizing, integration, and optimization, which is outsidethe scope of this paper.
The Stryker vehicle is equipped with a large array of advancedelectronic surveillance equipment, which can be utilized in a“silent-watch” mode whereby the electronics are powered for anextended time without running the diesel prime mover. The systemis charged by excess power from the vehicle’s alternator dur-ing normal operation, but when silent operation is desired, themain vehicle combustion engine is turned off, the vehicle becomesstationary, and the batteries power the onboard electronics. Theproposed RFC system would seamlessly replace the lead-acid bat-tery pack while ideally providing longer silent-watch duration dueto the efficiency and energy storage capabilities of the RFC system.
RFCs are well suited to military applications because of thedesire to use common fuels. Jet Propulsion 8, or JP-8, is a kerosene-based fuel that is the single battlefield fuel for Department of theArmy applications including electric power generators, wheeled
and tracked vehicles, aircraft, stoves, and heaters. An immenselogistical effort is necessary to move the enormous quantities ofJP-8 fuel required for military operations into a forward deployedoverseas location. Delivered costs of JP-8 to Army combat platformshave been estimated to be at least $30–$40 gallon−1 for overlandtransport, and greater than $400 gallon−1 for air delivery [5].Because of the “single battlefield fuel” mandate, fuel cell gen-erators or other clean and efficient hydrogen consuming devicescannot be utilized on the battlefield unless the hydrogen is obtainedfrom reformation of JP-8 or by other means with existing battle-field resources. Consequently, an RFC system having electricity asthe only input and output is one potential fuel cell technology avail-able to the military. This type of RFC device could be recharged byalternators attached to diesel engines in exactly the same mannerbatteries are used today. This could benefit military applicationsthat currently rely on lead-acid batteries for electrical storage, with-out violating the single fuel forward mandate.
A proton exchange membrane (PEM) fuel cell and electrolyzerwere chosen for this application because of their relatively highpower density, inherent load following capability, and relative tech-nological maturity compared to other fuel cell and electrolyzer
the experimental RFC system.
technologies. The fuel cell is fueled by pure hydrogen producedfrom electrolysis of deionized water and stored in a metal hydridetank. Metal hydride absorbs and desorbs hydrogen in exothermicand endothermic reactions, respectively [6]. Consequently, the RFCsystem utilizes an integrated, dual-purpose, cooling loop that pro-vides coolant to the hydride tank during the exothermic chargingprocess, and fluid warmed by the fuel cell waste heat to the tankduring the endothermic hydrogen release process. The use of ametal hydride tank therefore creates a synergy that enables fuel cellwaste heat to provide energy for hydrogen storage, eliminating theneed for compression energy that would be required if compressedgas storage was used.
1.2. RFC models in the literature
Several RFC system models and analyses have been reportedin the literature. Bolwin calculated static RFC system energy andpower densities based on a list of component masses, efficien-cies, and power densities [3]. Ulleberg developed a semi-empirical,bulk, alkaline electrolyzer model for use in hydrogen energy systemsimulations and showed an example system integration includingrenewable energy sources and compressed gas hydrogen storage[7]. Barbir et al. statically compared the efficiencies of unitized and
discrete PEM RFCs using generalized polarization curves and par-asitic losses proportional to system power [4]. Busquet et al. usedan empirical model to well predict fuel cell and electrolyzer per-formance, but did not include parasitic ancillary loses or energystorage [8]. Khan and Iqbal created a dynamic Simulink model ofa wind powered fuel cell electrolyzer system, but did not modelparasitic loads or heat transfer within the devices [9]. Gorgun pro-duced a detailed dynamic PEM electrolyzer model for future use infuel cell electrolyzer systems that includes pressurized hydrogenstorage and membrane water transport. However, the model doesnot include heat transfer or GDL gas diffusion effects [10]. Maclay etal. developed a comprehensive empirical dynamic residential RFCmodel used to analyze RFC applications to renewable energy stor-age, though the analysis does not include efficiency losses due toancillary components or hydrogen storage effects [11]. The modelreported herein differs from others in the literature due to theexhaustive, first principles approach that has been undertaken. Thisapproach enables simulation of the dynamic responses of all themajor system components and all of the interactions amongst thecomponents and in the balance of plant, along with comprehensiveenergy and efficiency analyses that include all significant ancil-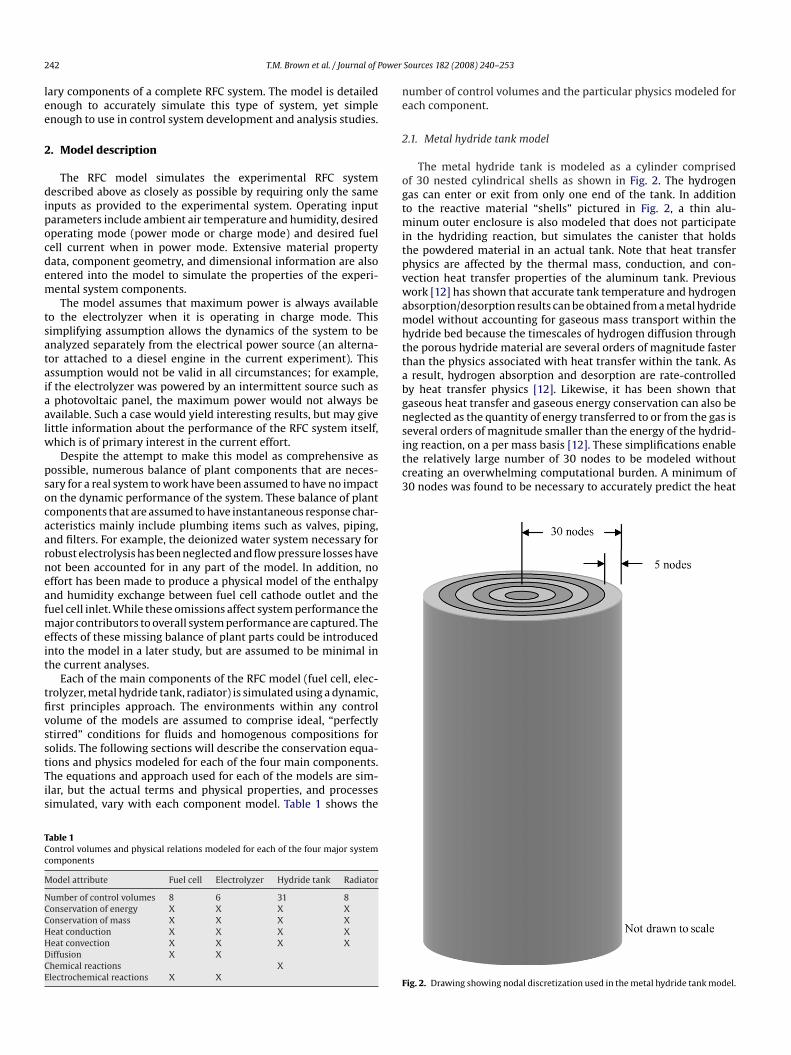
ower
to the reactive material “shells” pictured in Fig. 2, a thin alu-minum outer enclosure is also modeled that does not participatein the hydriding reaction, but simulates the canister that holdsthe powdered material in an actual tank. Note that heat transferphysics are affected by the thermal mass, conduction, and con-vection heat transfer properties of the aluminum tank. Previouswork [12] has shown that accurate tank temperature and hydrogenabsorption/desorption results can be obtained from a metal hydridemodel without accounting for gaseous mass transport within thehydride bed because the timescales of hydrogen diffusion throughthe porous hydride material are several orders of magnitude fasterthan the physics associated with heat transfer within the tank. Asa result, hydrogen absorption and desorption are rate-controlledby heat transfer physics [12]. Likewise, it has been shown thatgaseous heat transfer and gaseous energy conservation can also beneglected as the quantity of energy transferred to or from the gas isseveral orders of magnitude smaller than the energy of the hydrid-ing reaction, on a per mass basis [12]. These simplifications enablethe relatively large number of 30 nodes to be modeled withoutcreating an overwhelming computational burden. A minimum of30 nodes was found to be necessary to accurately predict the heat
242 T.M. Brown et al. / Journal of P
lary components of a complete RFC system. The model is detailedenough to accurately simulate this type of system, yet simpleenough to use in control system development and analysis studies.
2. Model description
The RFC model simulates the experimental RFC systemdescribed above as closely as possible by requiring only the sameinputs as provided to the experimental system. Operating inputparameters include ambient air temperature and humidity, desiredoperating mode (power mode or charge mode) and desired fuelcell current when in power mode. Extensive material propertydata, component geometry, and dimensional information are alsoentered into the model to simulate the properties of the experi-mental system components.
The model assumes that maximum power is always availableto the electrolyzer when it is operating in charge mode. Thissimplifying assumption allows the dynamics of the system to beanalyzed separately from the electrical power source (an alterna-tor attached to a diesel engine in the current experiment). Thisassumption would not be valid in all circumstances; for example,if the electrolyzer was powered by an intermittent source such asa photovoltaic panel, the maximum power would not always beavailable. Such a case would yield interesting results, but may givelittle information about the performance of the RFC system itself,which is of primary interest in the current effort.
Despite the attempt to make this model as comprehensive aspossible, numerous balance of plant components that are neces-sary for a real system to work have been assumed to have no impacton the dynamic performance of the system. These balance of plantcomponents that are assumed to have instantaneous response char-
acteristics mainly include plumbing items such as valves, piping,and filters. For example, the deionized water system necessary forrobust electrolysis has been neglected and flow pressure losses havenot been accounted for in any part of the model. In addition, noeffort has been made to produce a physical model of the enthalpyand humidity exchange between fuel cell cathode outlet and thefuel cell inlet. While these omissions affect system performance themajor contributors to overall system performance are captured. Theeffects of these missing balance of plant parts could be introducedinto the model in a later study, but are assumed to be minimal inthe current analyses.Each of the main components of the RFC model (fuel cell, elec-trolyzer, metal hydride tank, radiator) is simulated using a dynamic,first principles approach. The environments within any controlvolume of the models are assumed to comprise ideal, “perfectlystirred” conditions for fluids and homogenous compositions forsolids. The following sections will describe the conservation equa-tions and physics modeled for each of the four main components.The equations and approach used for each of the models are sim-ilar, but the actual terms and physical properties, and processessimulated, vary with each component model. Table 1 shows the
Table 1Control volumes and physical relations modeled for each of the four major systemcomponents
Model attribute Fuel cell Electrolyzer Hydride tank Radiator
Number of control volumes 8 6 31 8Conservation of energy X X X XConservation of mass X X X XHeat conduction X X X XHeat convection X X X XDiffusion X XChemical reactions XElectrochemical reactions X X
Sources 182 (2008) 240–253
number of control volumes and the particular physics modeled foreach component.
2.1. Metal hydride tank model
The metal hydride tank is modeled as a cylinder comprisedof 30 nested cylindrical shells as shown in Fig. 2. The hydrogengas can enter or exit from only one end of the tank. In addition
Fig. 2. Drawing showing nodal discretization used in the metal hydride tank model.
ower Sources 182 (2008) 240–253 243
Table 2Metal hydride tank parameters
Parameter Value Units Reference
Number of tanks 3 Per designHydride material LaNi5 Per designCanister material Aluminum Per designCanister thickness 1.6 mm Per design
T.M. Brown et al. / Journal of P
transfer, and consequently the hydrogen absorption level, in thetank due to the heavy dependence of absorption on temperatureand the relatively poor heat transfer characteristics of powderedmetal hydride.
No absorption–desorption hysteresis is accounted for in thepresent model. The hysteresis associated with the LaNi5 alloy usedherein is 0.13, meaning that 13.8% more pressure is required to fillthe tank than is returned when it is emptied [6]. This effect wouldserve to lower the overall RFC system efficiency.
2.1.1. Rate of hydride reactionThe hydriding reaction rate is modeled as
mreaction = −Ca e(−Ea/RT) ln(
Pg
PvH
)(�full − �node)VS (1)
where Ca is the reaction rate constant, Ea is the activation energy,R is the ideal gas constant, and �full and �node are the saturatedand nodal densities of the solid alloy, respectively [13]. Pg is thehydrogen pressure within the node, and due to the fast transportof hydrogen through the powered metal, Pg is always assumed tobe equal to the head pressure at the inlet to the tank. PvH is thepressure predicted by the van’t Hoff equation [6]:
ln(PvH) = �H
RTg− �S
R(2)
The values of enthalpy of reaction, �H, and the change in entropyfor the reaction, �S, were experimentally determined for the givenhydride alloy being used [6].
2.1.2. Solid alloy conservation of massThe volume of solid hydride alloy within a node, VS, is equal to
the non-porous volume of the node:
VS = (1 − ε)Vnode (3)
where ε is the porosity of the metal hydride. The mass of the solid,mS, in the node is
mS = �nodeVS (4)
The mass in a node can only change by absorbing or desorbinghydrogen. The mass conservation equation is consequently writtenas
∂mS
∂t= mreaction (5)
This can be integrated to find the instantaneous nodal mass. Whenplugged back into Eq. (4), this gives the value of metal hydride den-sity needed to calculate the rate of hydrogen absorption given byEq. (1).
2.1.3. Conservation of energyThe change in energy of the solid alloy in each node is due to
three processes: (1) conduction with solid in surrounding nodes,(2) heat release or generation during the sorption reaction, and(3) mass change via hydrogen sorption. The energy conservationequation for the solid within each node is therefore:
∂ES
∂t= Qconduction + mreaction�H (6)
where the rate of change of solid energy can be written as
∂ES
∂t= ∂(�nodeVSChTS)
∂t(7)
The nodal solid temperature can be found by combining (6) and (7)and numerically integrating.
As mentioned previously, for computational efficiency and neg-ligible error, the temperature of the hydrogen gas in each node
Total hydrogen capacity 10,000 SL Per designMaximum pressure, Pmax 689.5 kPa Per designLength, l 0.384 m Per designDiameter, d 0.148 m Per designHydride conductioncoefficient, kh
1.0 W (m K)−1 [14]
Aluminum conductioncoefficient, kAl
237 W (m K)−1 [15]
Hydride specific heat, Ch 418.7 J (kg K)−1 [16]Al specific heat, CAl 903 J (kg K)−1 [15]Density of Al, �Al 2700 kg m−3 [15]Density of hydride metal,�h
8300 kg m−3 [6]
Solid porosity, ε 0.44 CalculatedActivation energy, Ea 31,000 J mol−1 [14]Reaction rate constant, Ca 2800 s−1 [17]Enthalpy of reaction, �H 30,800 J mol−1 [6]Entropy of reaction, �S 108 J (mol K)−1 [6]Convection coefficientbetween canister andcoolant, h
700 W (m2 K)−1 [12]a
a This value was established experimentally for a cylindrical tank subjected to acirculating water bath.
is assumed to be the same as the temperature of the solid metalhydride in that node. Consequently, in all parts of the tank:
Tg = TS (8)
2.1.4. Heat transferHeat transfer within the tank is governed by Fourier’s law:
Qconduction = −ksA∂T
∂x(9)
where A is the cross-sectional area between adjacent nodes and xis the distance between nodal centers. Eq. (9) applies to conductionbetween the metal hydride nodes and between the outermost nodeand the aluminum enclosure. Convective heat transfer described byNewton’s Law of Cooling takes place between the outer surface ofthe aluminum enclosure and the circulating coolant as follows:
Qconvection = hAc dT (10)
Here Ac refers to the outer surface area of the aluminum canister.
2.1.5. Model parametersThe system modeled in this paper uses three individual, cylin-
drical tanks cooled by submersion in a flowing water bath, whichapproximates the experimental configuration. The specificationsfor these tanks are given in Table 2.
2.2. PEM fuel cell model
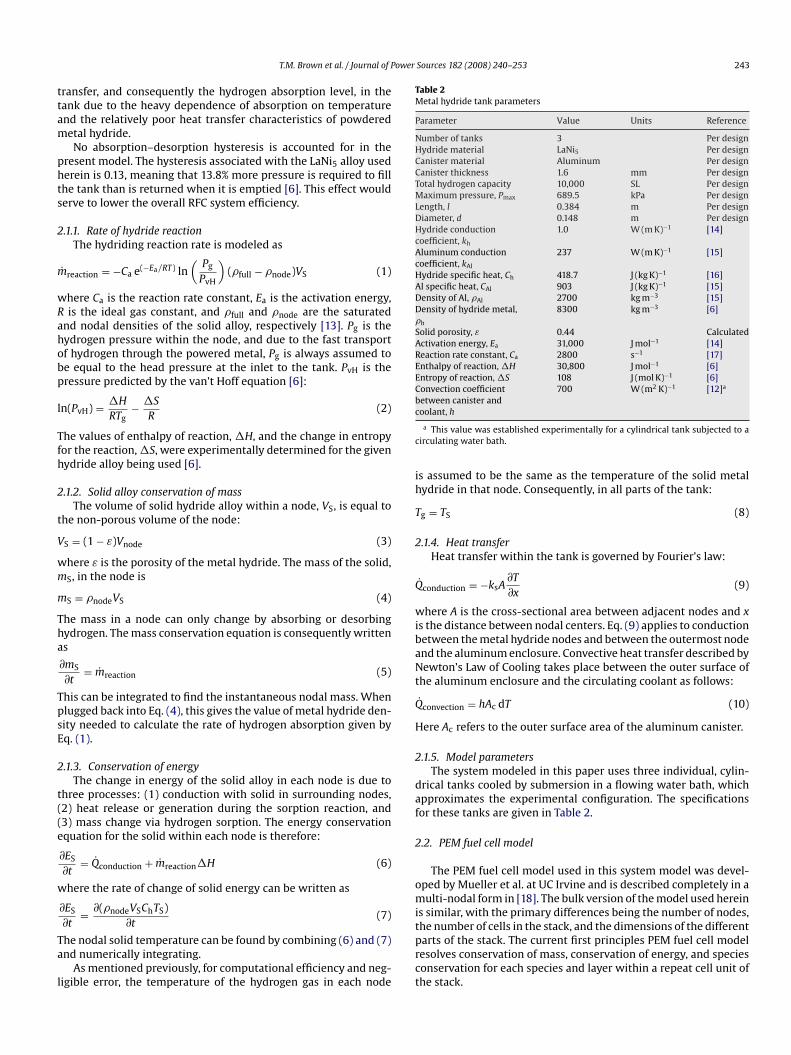
The PEM fuel cell model used in this system model was devel-oped by Mueller et al. at UC Irvine and is described completely in amulti-nodal form in [18]. The bulk version of the model used hereinis similar, with the primary differences being the number of nodes,the number of cells in the stack, and the dimensions of the differentparts of the stack. The current first principles PEM fuel cell modelresolves conservation of mass, conservation of energy, and speciesconservation for each species and layer within a repeat cell unit ofthe stack.
244 T.M. Brown et al. / Journal of Power
gas v solid dt diffuse diffuse ht
Fig. 3. Diagram showing eight control volumes modeled in the PEM fuel cell com-ponent.
The model is divided into eight control volumes: anode andcathode gas diffusion layers, bulk gas chambers, current collectors,membrane, and cathode side coolant channel, as shown in Fig. 3.The first principles approach enables prediction of species concen-trations and temperatures for each gas or solid in each layer of thecell repeat unit and the output cell voltage at any time. The stackoutputs are simply determined by multiplying or adding the cellrepeat unit outputs as determined by the number of series or par-allel cells in the stack. For example, for unit cells connected in seriesthe total stack voltage is given by
Vtotal = nVcell (11)
where n is the number of cells in series. In this case the total stackcurrent is the unit cell current. Similar calculations are used todetermine total stack species flux values.
The multi-nodal model reported in [18] has been validatedagainst actual operating data from several PEM fuel cells. How-ever, due to the large computational requirements of the complexmulti-nodal model, the reduction to just one node has been madeto allow integration into the larger RFC system model. Experienceshows that this model still produces good predictions of stack tem-perature, voltage, and outlet species concentrations.
2.2.1. Mass conservationMass must be conserved in the bulk gas, GDL, and membrane
sections of the fuel cell model while tabulating the proper speciesconcentrations of hydrogen, oxygen, nitrogen, and water. The gen-eral species conservation equation for a control volume can bewritten as
dn
dt= nin − nout + nreact +
∑ndiffuse (general form) (12)
where nin and nout are the convective molar fluxes in and out ofthe control volume, nreact is the molar rate of species production,and
∑ndiffuse is the sum of the species diffusion rates. This is the
most general mass conservation equation. Certain terms drop outdepending upon the particular control volume that is being mod-eled. For example, only the reaction and diffusion terms are usedin the GDL layers where gases diffuse and react:
dn
dt= nreact +
∑ndiffuse (GDL) (13)
Sources 182 (2008) 240–253
Only diffusion and bulk convective flow terms are used in the bulkgas layers because no reactions are occurring:
dn
dt= nin − nout +
∑ndiffuse (bulk gas layers) (14)
And the membrane species conservation equation contains onlydiffusion terms with no bulk fluid flow or reaction:
dn
dt=
∑ndiffuse (membrane) (15)
Species conservation is maintained by integrating these equationsfor each species in each control volume within the model.
For each control volume, relative humidity is calculated as afunction of temperature. Any mass of water exceeding saturation ismodeled as condensed liquid.
2.2.2. Energy conservationThe general conservation of energy equation used in each fuel
cell control volume is written as
mCvdT
dt=∑
minhin −∑
mouthout +∑
Qht +∑
Qreact (general form)
(16)
where, on the left side, m is the mass of the component, Cv is theconstant volume specific heat, T is temperature, and t is time. Onthe right, min and mout are the mass transfer rates entering and exit-ing the control volume and hin and hout are the associated enthalpyvalues, respectively. Heat transfer with surrounding nodes is givenby Qht and any heat generated or consumed by chemical reac-tions is given by Qreact. Again, the terms used depend upon the fuelcell component being analyzed. For the current collectors, Eq. (16)reduces to
msolidCdT
dt=
∑Qht (current collectors) (17)
because the solid components have no enthalpy transferred by con-vection nor any reactions occurring within the solid. For the MEA(both GDL layers and the membrane are assumed to be at the sametemperature) all of the terms in Eq. (16) are used with the caveatthat the enthalpy flow term refers to energy transferred via diffu-sion, not bulk convective flow:(∑
m C +∑
m C)
dT =∑
m h +∑
Q
+∑
Qreact (MEA) (18)
For the bulk gas layers, energy is transferred by heat, bulk convec-tive flow, and diffusion, but no reaction energy is included:(∑
mgasCv +∑
msolidC)
dT
dt=
∑minhin −
∑mouthout
+∑
mdiffusehdiffuse
+∑
Qht (bulk gas layers)
(19)
Again, the model simultaneously integrates these equations to cal-culate the temperature of each control volume.
2.2.3. Heat transferHeat is transferred between layers in the fuel cell model by con-
duction and convection, as described in Section 2.1.4 by Eqs. (9) and(10). Heat conduction occurs between each current collector and
ower
T.M. Brown et al. / Journal of Pthe corresponding GDL and heat convection occurs between eachbulk gas and the respective current collectors and GDLs. Addition-ally, convection heat transfer between the coolant and the cathodecurrent collector removes heat from the cell.
Convection coefficients are determined using the Nusselt num-ber, Nu:
h = Nu × kf
DH(20)
where kf is the fluid conduction heat transfer coefficient and DH isthe hydraulic diameter of the channel being modeled.
2.2.4. DiffusionDiffusion of gases from the bulk gas flow channels to the GDLs
plays an important role in modeling fuel cell behavior because poorgas transport to reaction sites can lead to concentration losses. Thismodel accounts for diffusion of gases from the bulk phase to theGDL by calculating a mass transport coefficient:
gm = Sh × Dm
DH(21)
where Sh is the Sherwood number and Dm is the diffusion coef-ficient. This is then used to calculate a total resistance, Rdiffuse, todiffusion:
Rdiffuse = A
(1/gm) + (tGDL/Deffm )
(22)
where Deffm is the effective diffusion coefficient modified via the
Bruggeman relation:
Deffm = ε3/2
GDLDm (23)
used to account for porosity (εGDL) and tortuosity in the GDL, andtGDL is the thickness of the catalyst layer. Species flux is calculatedas
ndiffuse = Rdiffuse(C2 − C1) (24)
where C2 and C1 are the molar concentrations in the bulk gas phaseand GDL.
2.2.5. Water transportWater can be transported through the ionic membrane via the
process of osmotic drag whereby water molecules are effectively“dragged” from the anode to the cathode by proton transport mech-anisms in the membrane. Additionally, water can “back-diffuse”
from the cathode to the anode due to a concentration gradient. Bothof these processes are accounted for in the current model becausemembrane water content significantly impacts cell performance(especially membrane protonic conductivity).The rate of water molecules transported by osmotic drag (�H2O)is directly proportional to the number of protons transferredthrough the membrane:
�H2O = nd
AF(25)
where nd is the membrane water content dependent drag coeffi-cient:
nd = 2.5�
22(26)
� = 0.043 + 17.81a − 39.85a2 + 36a3, for 0 < a ≤ 1 (27)
and a is the water activity as given by Springer et al. [19]. Waterdiffusion due to the concentration gradient between the electrodesis determined by
�H2O = DwACc − Ca
t(28)
Sources 182 (2008) 240–253 245
where Dw is the diffusion coefficient and t is the membrane thick-ness. The diffusion is given as
Dw = D� exp[
2416(
1303
− 1T
)](29)
where
D� =
⎧⎪⎨⎪⎩
10−6 for � < 2[1 + 2(� − 2)] × 10−6 for 2 ≤ � ≤ 3[3 − 1.67(� − 3)] × 10−6 for 3 < � < 4.51.25 × 10−6 for 4.5 ≤ �
(30)
2.2.6. ElectrochemistryThe rates of the electrochemical reactions occurring in the fuel
cell are considered instantaneous in the current model because thetimescales of these reactions are far faster than those associatedwith the other physics included in the model [18]. The electrochem-ical potential of the reactions is modeled using the Nernst equationcoupled with equations for ohmic and activation polarization lossesas given by Eq. (31), for anode and cathode compartments bothoperated at the same pressure:
V = −�G(T)nF
+ RT
nFln
[XH2 X1/2
O2
XH2OP1/2
]− ac
RT
nFln
(i
i0
)− iR (31)
The first term provides the theoretical potential based on Gibb’s freeenergy as a function of temperature. The change in Gibb’s energy isgiven by
�G(T)=(−241.9495 + 0.0411 × T+1.0641 × 10⁻⁵×T2−2.4087×10⁻⁹×T3)
×1000 (32)
The second term in Eq. (31) modifies the theoretical potential toaccount for the operating pressure, temperature, and species con-centrations. The third term is a voltage reduction due to activationlosses derived from the Tafel expression, and the final term is avoltage reduction due to Ohm’s law, where the resistance, R, is amembrane water content dependent term:
R = (0.005139� − 0.00326) exp[
1268(
1303
− 1273 + T
)](33)
The rates of all reactions are modeled as instantaneous and propor-tional to the current:
nreact = i
nF(34)
where i is the operating current, F is Faraday’s constant, and n is thenumber of moles of electrons transferred during the reaction permole of the species reacted. Eq. (34) therefore assumes infinitelyfast reaction with perfect electron transfer by every reaction.
Concentration polarization has been neglected in this modelbecause the RFC system never enters the operation regime whereconcentration losses become significant. The maximum currentdensity of the fuel cell is 490 mA cm−2 when operating at full powerof 5.5 kW.
2.2.7. Fuel cell model parametersSeveral parameters used in this system model are given in
Table 3.
2.3. PEM electrolyzer
The electrolyzer model is based closely on the fuel cell model.It too is a bulk model utilizing the same fundamental equations
246 T.M. Brown et al. / Journal of Power Sources 182 (2008) 240–253
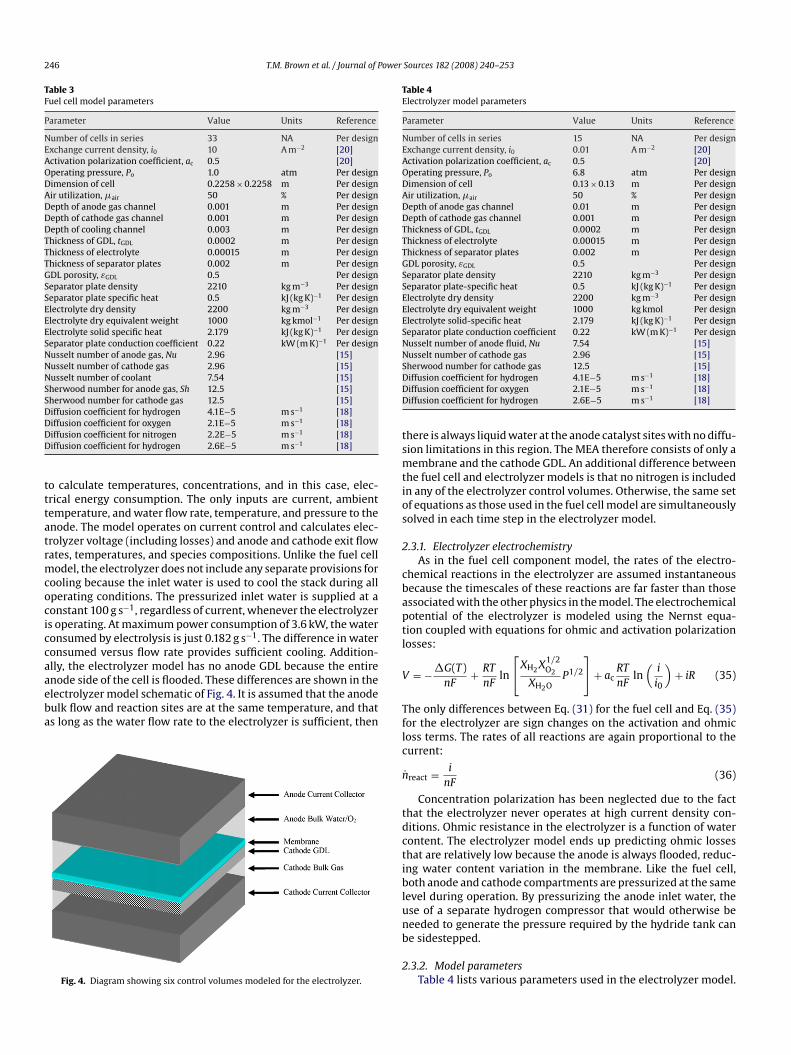
Table 3Fuel cell model parameters
Parameter Value Units Reference
Number of cells in series 33 NA Per designExchange current density, i0 10 A m−2 [20]Activation polarization coefficient, ac 0.5 [20]Operating pressure, Po 1.0 atm Per designDimension of cell 0.2258 × 0.2258 m Per design
Table 4Electrolyzer model parameters
Parameter Value Units Reference
Number of cells in series 15 NA Per design
Air utilization, air 50 % Per designDepth of anode gas channel 0.001 m Per designDepth of cathode gas channel 0.001 m Per designDepth of cooling channel 0.003 m Per designThickness of GDL, tGDL 0.0002 m Per designThickness of electrolyte 0.00015 m Per designThickness of separator plates 0.002 m Per designGDL porosity, εGDL 0.5 Per designSeparator plate density 2210 kg m−3 Per designSeparator plate specific heat 0.5 kJ (kg K)−1 Per designElectrolyte dry density 2200 kg m−3 Per designElectrolyte dry equivalent weight 1000 kg kmol−1 Per designElectrolyte solid specific heat 2.179 kJ (kg K)−1 Per designSeparator plate conduction coefficient 0.22 kW (m K)−1 Per designNusselt number of anode gas, Nu 2.96 [15]Nusselt number of cathode gas 2.96 [15]Nusselt number of coolant 7.54 [15]Sherwood number for anode gas, Sh 12.5 [15]Sherwood number for cathode gas 12.5 [15]Diffusion coefficient for hydrogen 4.1E−5 m s−1 [18]Diffusion coefficient for oxygen 2.1E−5 m s−1 [18]Diffusion coefficient for nitrogen 2.2E−5 m s−1 [18]
−1
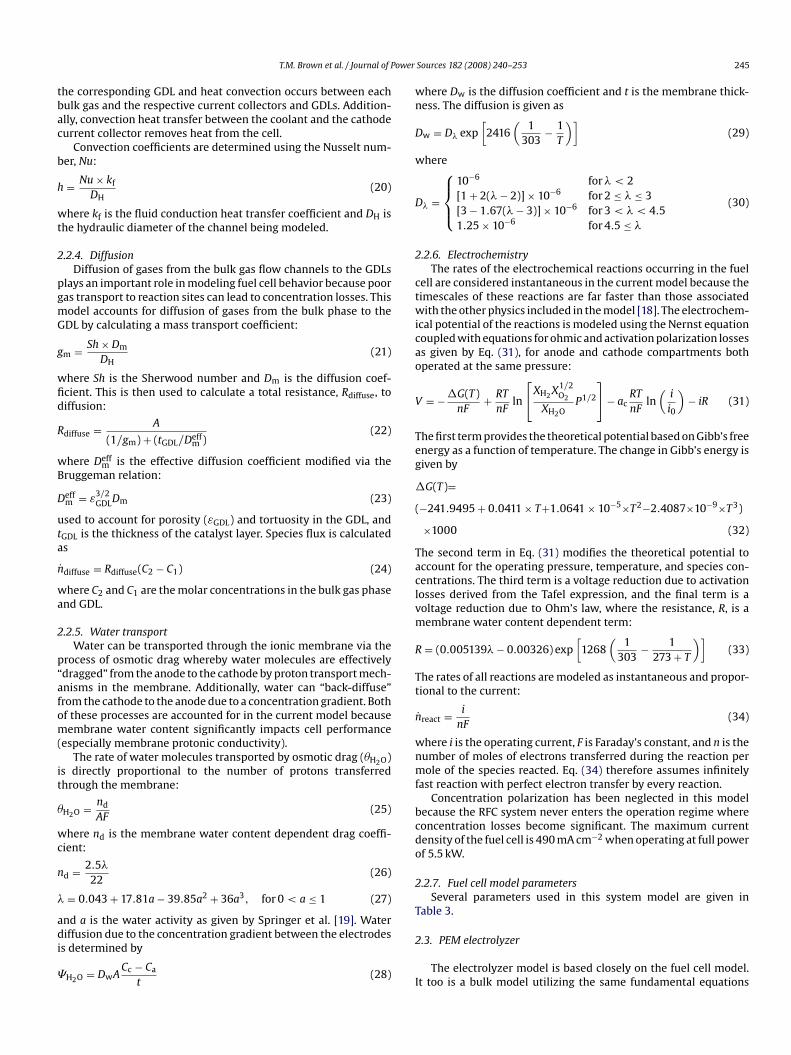
Diffusion coefficient for hydrogen 2.6E−5 m s [18]to calculate temperatures, concentrations, and in this case, elec-trical energy consumption. The only inputs are current, ambienttemperature, and water flow rate, temperature, and pressure to theanode. The model operates on current control and calculates elec-trolyzer voltage (including losses) and anode and cathode exit flowrates, temperatures, and species compositions. Unlike the fuel cellmodel, the electrolyzer does not include any separate provisions forcooling because the inlet water is used to cool the stack during alloperating conditions. The pressurized inlet water is supplied at aconstant 100 g s−1, regardless of current, whenever the electrolyzeris operating. At maximum power consumption of 3.6 kW, the waterconsumed by electrolysis is just 0.182 g s−1. The difference in waterconsumed versus flow rate provides sufficient cooling. Addition-ally, the electrolyzer model has no anode GDL because the entireanode side of the cell is flooded. These differences are shown in theelectrolyzer model schematic of Fig. 4. It is assumed that the anodebulk flow and reaction sites are at the same temperature, and thatas long as the water flow rate to the electrolyzer is sufficient, then
Fig. 4. Diagram showing six control volumes modeled for the electrolyzer.
Exchange current density, i0 0.01 A m−2 [20]Activation polarization coefficient, ac 0.5 [20]Operating pressure, Po 6.8 atm Per designDimension of cell 0.13 × 0.13 m Per designAir utilization, air 50 % Per designDepth of anode gas channel 0.01 m Per designDepth of cathode gas channel 0.001 m Per designThickness of GDL, tGDL 0.0002 m Per designThickness of electrolyte 0.00015 m Per designThickness of separator plates 0.002 m Per designGDL porosity, εGDL 0.5 Per designSeparator plate density 2210 kg m−3 Per designSeparator plate-specific heat 0.5 kJ (kg K)−1 Per designElectrolyte dry density 2200 kg m−3 Per designElectrolyte dry equivalent weight 1000 kg kmol Per designElectrolyte solid-specific heat 2.179 kJ (kg K)−1 Per designSeparator plate conduction coefficient 0.22 kW (m K)−1 Per designNusselt number of anode fluid, Nu 7.54 [15]Nusselt number of cathode gas 2.96 [15]Sherwood number for cathode gas 12.5 [15]Diffusion coefficient for hydrogen 4.1E−5 m s−1 [18]Diffusion coefficient for oxygen 2.1E−5 m s−1 [18]Diffusion coefficient for hydrogen 2.6E−5 m s−1 [18]
there is always liquid water at the anode catalyst sites with no diffu-sion limitations in this region. The MEA therefore consists of only amembrane and the cathode GDL. An additional difference betweenthe fuel cell and electrolyzer models is that no nitrogen is includedin any of the electrolyzer control volumes. Otherwise, the same setof equations as those used in the fuel cell model are simultaneouslysolved in each time step in the electrolyzer model.
2.3.1. Electrolyzer electrochemistryAs in the fuel cell component model, the rates of the electro-
chemical reactions in the electrolyzer are assumed instantaneousbecause the timescales of these reactions are far faster than thoseassociated with the other physics in the model. The electrochemicalpotential of the electrolyzer is modeled using the Nernst equa-tion coupled with equations for ohmic and activation polarizationlosses:
V = −�G(T)nF
+ RT
nFln
[XH2 X1/2
O2
XH2OP1/2
]+ ac
RT
nFln
(i
i0
)+ iR (35)
The only differences between Eq. (31) for the fuel cell and Eq. (35)for the electrolyzer are sign changes on the activation and ohmicloss terms. The rates of all reactions are again proportional to thecurrent:
nreact = i
nF(36)
Concentration polarization has been neglected due to the factthat the electrolyzer never operates at high current density con-ditions. Ohmic resistance in the electrolyzer is a function of watercontent. The electrolyzer model ends up predicting ohmic lossesthat are relatively low because the anode is always flooded, reduc-ing water content variation in the membrane. Like the fuel cell,both anode and cathode compartments are pressurized at the samelevel during operation. By pressurizing the anode inlet water, theuse of a separate hydrogen compressor that would otherwise beneeded to generate the pressure required by the hydride tank canbe sidestepped.
2.3.2. Model parametersTable 4 lists various parameters used in the electrolyzer model.
ower
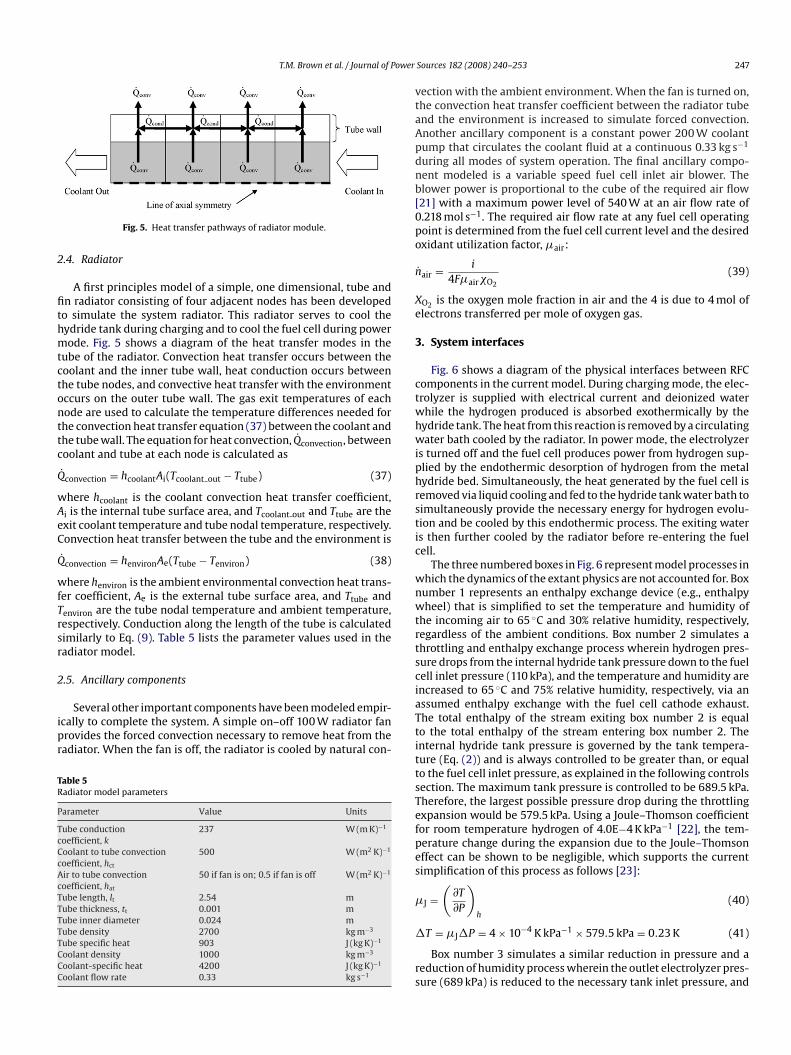
T.M. Brown et al. / Journal of PFig. 5. Heat transfer pathways of radiator module.
2.4. Radiator
A first principles model of a simple, one dimensional, tube andfin radiator consisting of four adjacent nodes has been developedto simulate the system radiator. This radiator serves to cool thehydride tank during charging and to cool the fuel cell during powermode. Fig. 5 shows a diagram of the heat transfer modes in thetube of the radiator. Convection heat transfer occurs between thecoolant and the inner tube wall, heat conduction occurs betweenthe tube nodes, and convective heat transfer with the environmentoccurs on the outer tube wall. The gas exit temperatures of eachnode are used to calculate the temperature differences needed forthe convection heat transfer equation (37) between the coolant andthe tube wall. The equation for heat convection, Qconvection, betweencoolant and tube at each node is calculated as
Qconvection = hcoolantAi(Tcoolant out − Ttube) (37)
where hcoolant is the coolant convection heat transfer coefficient,Ai is the internal tube surface area, and Tcoolant out and Ttube are theexit coolant temperature and tube nodal temperature, respectively.Convection heat transfer between the tube and the environment is
Qconvection = henvironAe(Ttube − Tenviron) (38)
where henviron is the ambient environmental convection heat trans-fer coefficient, Ae is the external tube surface area, and Ttube andTenviron are the tube nodal temperature and ambient temperature,respectively. Conduction along the length of the tube is calculatedsimilarly to Eq. (9). Table 5 lists the parameter values used in theradiator model.
2.5. Ancillary components
Several other important components have been modeled empir-ically to complete the system. A simple on–off 100 W radiator fanprovides the forced convection necessary to remove heat from theradiator. When the fan is off, the radiator is cooled by natural con-
Table 5Radiator model parameters
Parameter Value Units
Tube conductioncoefficient, k
237 W (m K)−1
Coolant to tube convectioncoefficient, hct
500 W (m2 K)−1
Air to tube convectioncoefficient, hat
50 if fan is on; 0.5 if fan is off W (m2 K)−1
Tube length, lt 2.54 mTube thickness, tt 0.001 mTube inner diameter 0.024 mTube density 2700 kg m−3
Tube specific heat 903 J (kg K)−1
Coolant density 1000 kg m−3
Coolant-specific heat 4200 J (kg K)−1
Coolant flow rate 0.33 kg s−1
Sources 182 (2008) 240–253 247
vection with the ambient environment. When the fan is turned on,the convection heat transfer coefficient between the radiator tubeand the environment is increased to simulate forced convection.Another ancillary component is a constant power 200 W coolantpump that circulates the coolant fluid at a continuous 0.33 kg s−1
during all modes of system operation. The final ancillary compo-nent modeled is a variable speed fuel cell inlet air blower. Theblower power is proportional to the cube of the required air flow[21] with a maximum power level of 540 W at an air flow rate of0.218 mol s−1. The required air flow rate at any fuel cell operatingpoint is determined from the fuel cell current level and the desiredoxidant utilization factor, air:
nair = i
4FairO2
(39)
XO2 is the oxygen mole fraction in air and the 4 is due to 4 mol ofelectrons transferred per mole of oxygen gas.
3. System interfaces
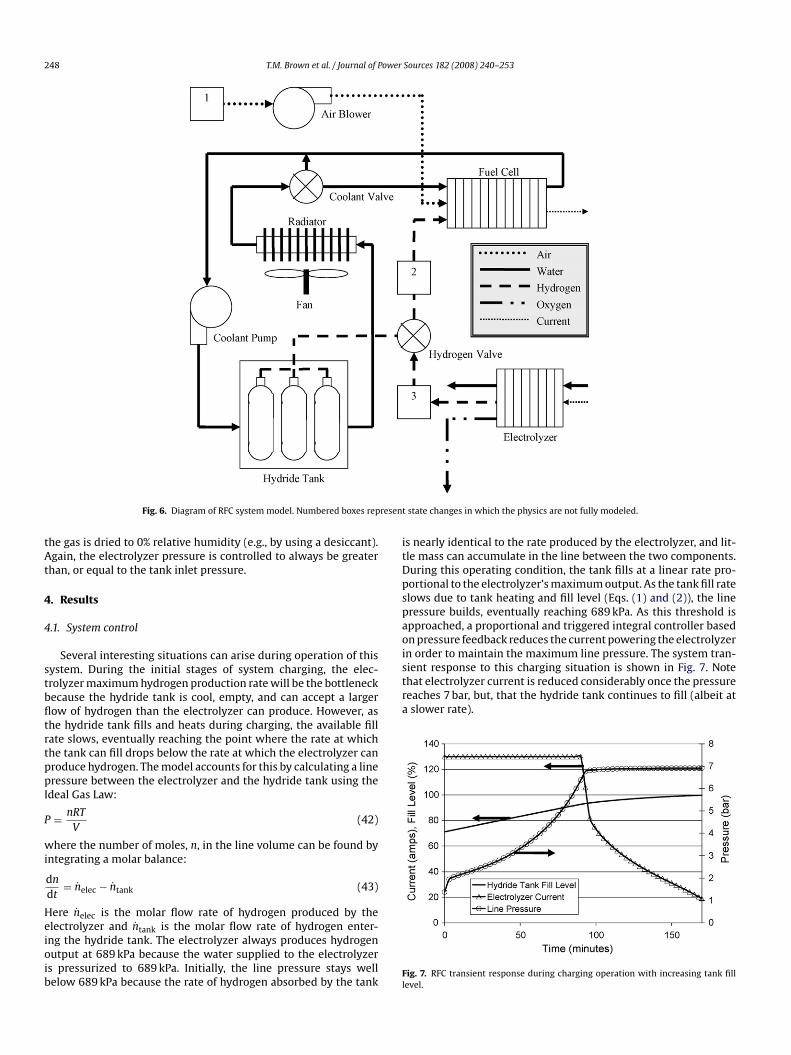
Fig. 6 shows a diagram of the physical interfaces between RFCcomponents in the current model. During charging mode, the elec-trolyzer is supplied with electrical current and deionized waterwhile the hydrogen produced is absorbed exothermically by thehydride tank. The heat from this reaction is removed by a circulatingwater bath cooled by the radiator. In power mode, the electrolyzeris turned off and the fuel cell produces power from hydrogen sup-plied by the endothermic desorption of hydrogen from the metalhydride bed. Simultaneously, the heat generated by the fuel cell isremoved via liquid cooling and fed to the hydride tank water bath tosimultaneously provide the necessary energy for hydrogen evolu-tion and be cooled by this endothermic process. The exiting wateris then further cooled by the radiator before re-entering the fuelcell.
The three numbered boxes in Fig. 6 represent model processes inwhich the dynamics of the extant physics are not accounted for. Boxnumber 1 represents an enthalpy exchange device (e.g., enthalpywheel) that is simplified to set the temperature and humidity ofthe incoming air to 65 ◦C and 30% relative humidity, respectively,regardless of the ambient conditions. Box number 2 simulates athrottling and enthalpy exchange process wherein hydrogen pres-sure drops from the internal hydride tank pressure down to the fuelcell inlet pressure (110 kPa), and the temperature and humidity areincreased to 65 ◦C and 75% relative humidity, respectively, via an
assumed enthalpy exchange with the fuel cell cathode exhaust.The total enthalpy of the stream exiting box number 2 is equalto the total enthalpy of the stream entering box number 2. Theinternal hydride tank pressure is governed by the tank tempera-ture (Eq. (2)) and is always controlled to be greater than, or equalto the fuel cell inlet pressure, as explained in the following controlssection. The maximum tank pressure is controlled to be 689.5 kPa.Therefore, the largest possible pressure drop during the throttlingexpansion would be 579.5 kPa. Using a Joule–Thomson coefficientfor room temperature hydrogen of 4.0E−4 K kPa−1 [22], the tem-perature change during the expansion due to the Joule–Thomsoneffect can be shown to be negligible, which supports the currentsimplification of this process as follows [23]:J =(
∂T
∂P
)h
(40)
�T = J�P = 4 × 10⁻⁴ K kPa−1 × 579.5 kPa = 0.23 K (41)
Box number 3 simulates a similar reduction in pressure and areduction of humidity process wherein the outlet electrolyzer pres-sure (689 kPa) is reduced to the necessary tank inlet pressure, and
248 T.M. Brown et al. / Journal of Power Sources 182 (2008) 240–253
resent state changes in which the physics are not fully modeled.
is nearly identical to the rate produced by the electrolyzer, and lit-tle mass can accumulate in the line between the two components.During this operating condition, the tank fills at a linear rate pro-portional to the electrolyzer’s maximum output. As the tank fill rateslows due to tank heating and fill level (Eqs. (1) and (2)), the linepressure builds, eventually reaching 689 kPa. As this threshold isapproached, a proportional and triggered integral controller basedon pressure feedback reduces the current powering the electrolyzerin order to maintain the maximum line pressure. The system tran-sient response to this charging situation is shown in Fig. 7. Notethat electrolyzer current is reduced considerably once the pressure
Fig. 6. Diagram of RFC system model. Numbered boxes rep
the gas is dried to 0% relative humidity (e.g., by using a desiccant).Again, the electrolyzer pressure is controlled to always be greaterthan, or equal to the tank inlet pressure.
4. Results
4.1. System control
Several interesting situations can arise during operation of thissystem. During the initial stages of system charging, the elec-trolyzer maximum hydrogen production rate will be the bottleneck
because the hydride tank is cool, empty, and can accept a largerflow of hydrogen than the electrolyzer can produce. However, asthe hydride tank fills and heats during charging, the available fillrate slows, eventually reaching the point where the rate at whichthe tank can fill drops below the rate at which the electrolyzer canproduce hydrogen. The model accounts for this by calculating a linepressure between the electrolyzer and the hydride tank using theIdeal Gas Law:P = nRT
V(42)
where the number of moles, n, in the line volume can be found byintegrating a molar balance:
dn
dt= nelec − ntank (43)
Here nelec is the molar flow rate of hydrogen produced by theelectrolyzer and ntank is the molar flow rate of hydrogen enter-ing the hydride tank. The electrolyzer always produces hydrogenoutput at 689 kPa because the water supplied to the electrolyzeris pressurized to 689 kPa. Initially, the line pressure stays wellbelow 689 kPa because the rate of hydrogen absorbed by the tank
reaches 7 bar, but, that the hydride tank continues to fill (albeit ata slower rate).
Fig. 7. RFC transient response during charging operation with increasing tank filllevel.
T.M. Brown et al. / Journal of Power
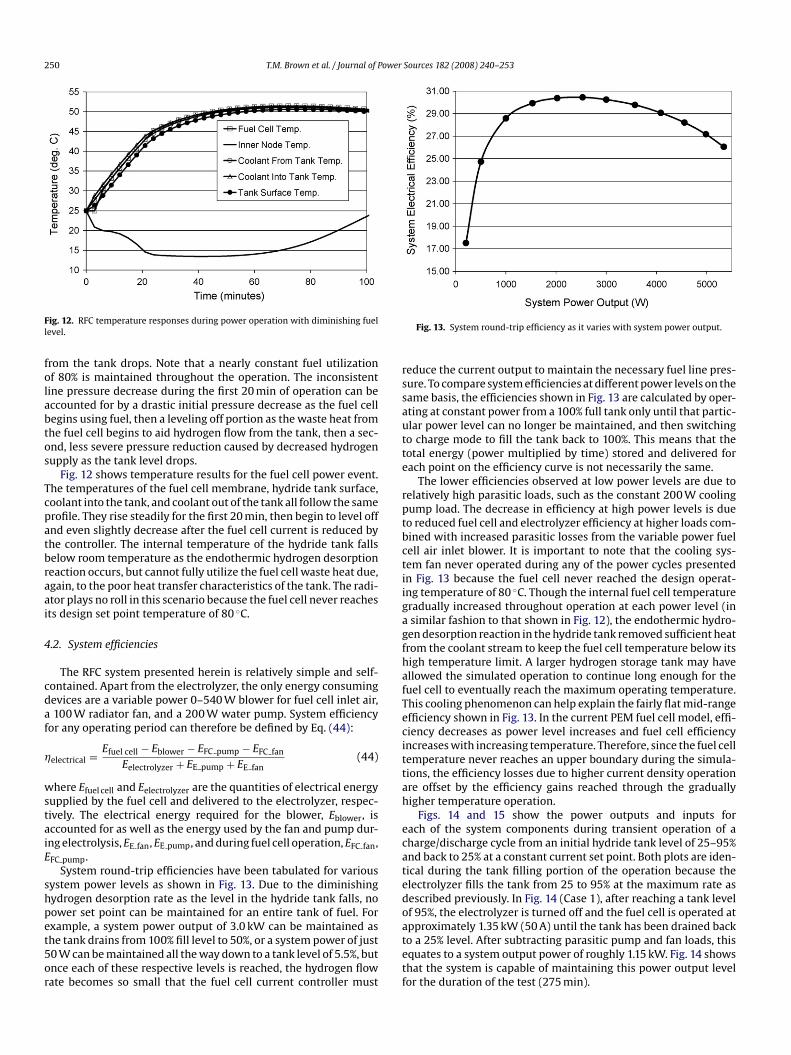
Additionally, fuel utilization is controlled to maintain cell voltageand ensure efficient operation.
The fuel cell control strategy uses pressure feedback to controlcurrent. If the line pressure is greater than the minimum pressure,
Fig. 8. RFC temperature responses during charging operation with increasing tankfill level.
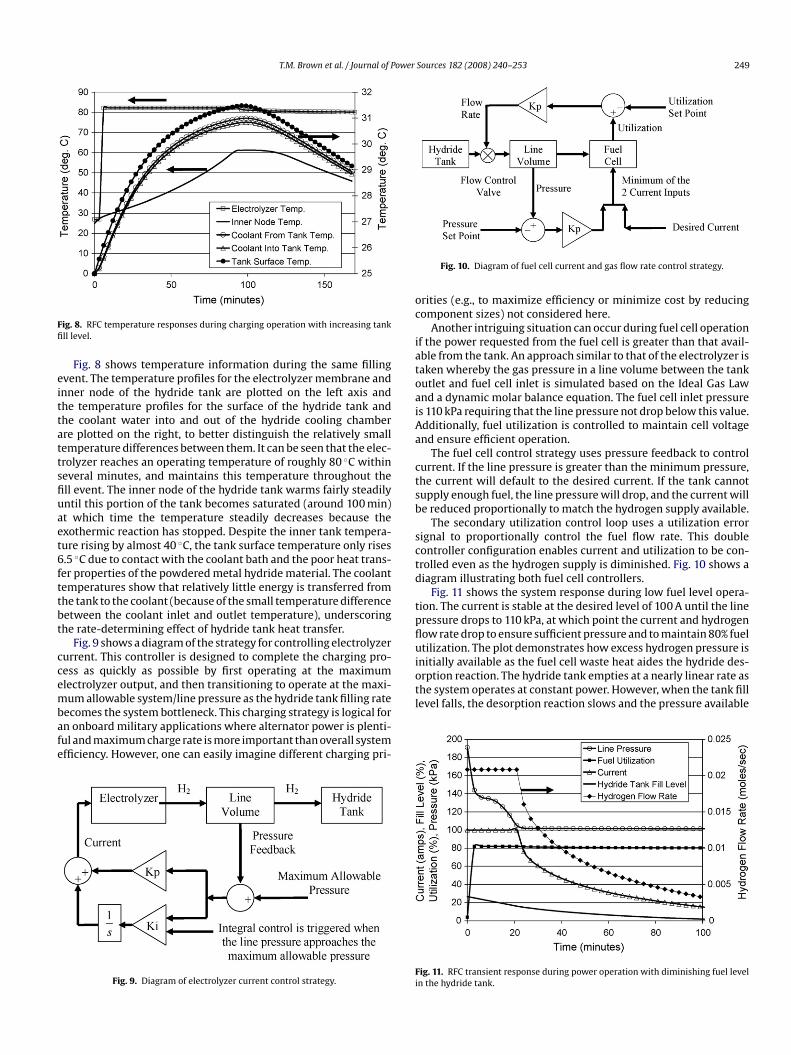
Fig. 8 shows temperature information during the same fillingevent. The temperature profiles for the electrolyzer membrane andinner node of the hydride tank are plotted on the left axis andthe temperature profiles for the surface of the hydride tank andthe coolant water into and out of the hydride cooling chamberare plotted on the right, to better distinguish the relatively smalltemperature differences between them. It can be seen that the elec-trolyzer reaches an operating temperature of roughly 80 ◦C within
several minutes, and maintains this temperature throughout thefill event. The inner node of the hydride tank warms fairly steadilyuntil this portion of the tank becomes saturated (around 100 min)at which time the temperature steadily decreases because theexothermic reaction has stopped. Despite the inner tank tempera-ture rising by almost 40 ◦C, the tank surface temperature only rises6.5 ◦C due to contact with the coolant bath and the poor heat trans-fer properties of the powdered metal hydride material. The coolanttemperatures show that relatively little energy is transferred fromthe tank to the coolant (because of the small temperature differencebetween the coolant inlet and outlet temperature), underscoringthe rate-determining effect of hydride tank heat transfer.Fig. 9 shows a diagram of the strategy for controlling electrolyzercurrent. This controller is designed to complete the charging pro-cess as quickly as possible by first operating at the maximumelectrolyzer output, and then transitioning to operate at the maxi-mum allowable system/line pressure as the hydride tank filling ratebecomes the system bottleneck. This charging strategy is logical foran onboard military applications where alternator power is plenti-ful and maximum charge rate is more important than overall systemefficiency. However, one can easily imagine different charging pri-
Fig. 9. Diagram of electrolyzer current control strategy.
Sources 182 (2008) 240–253 249
Fig. 10. Diagram of fuel cell current and gas flow rate control strategy.
orities (e.g., to maximize efficiency or minimize cost by reducingcomponent sizes) not considered here.
Another intriguing situation can occur during fuel cell operationif the power requested from the fuel cell is greater than that avail-able from the tank. An approach similar to that of the electrolyzer istaken whereby the gas pressure in a line volume between the tankoutlet and fuel cell inlet is simulated based on the Ideal Gas Lawand a dynamic molar balance equation. The fuel cell inlet pressureis 110 kPa requiring that the line pressure not drop below this value.
the current will default to the desired current. If the tank cannotsupply enough fuel, the line pressure will drop, and the current willbe reduced proportionally to match the hydrogen supply available.
The secondary utilization control loop uses a utilization errorsignal to proportionally control the fuel flow rate. This doublecontroller configuration enables current and utilization to be con-trolled even as the hydrogen supply is diminished. Fig. 10 shows adiagram illustrating both fuel cell controllers.
Fig. 11 shows the system response during low fuel level opera-tion. The current is stable at the desired level of 100 A until the linepressure drops to 110 kPa, at which point the current and hydrogenflow rate drop to ensure sufficient pressure and to maintain 80% fuelutilization. The plot demonstrates how excess hydrogen pressure isinitially available as the fuel cell waste heat aides the hydride des-orption reaction. The hydride tank empties at a nearly linear rate asthe system operates at constant power. However, when the tank filllevel falls, the desorption reaction slows and the pressure available
Fig. 11. RFC transient response during power operation with diminishing fuel levelin the hydride tank.
250 T.M. Brown et al. / Journal of Power Sources 182 (2008) 240–253
Fig. 12. RFC temperature responses during power operation with diminishing fuellevel.
from the tank drops. Note that a nearly constant fuel utilizationof 80% is maintained throughout the operation. The inconsistentline pressure decrease during the first 20 min of operation can beaccounted for by a drastic initial pressure decrease as the fuel cellbegins using fuel, then a leveling off portion as the waste heat fromthe fuel cell begins to aid hydrogen flow from the tank, then a sec-ond, less severe pressure reduction caused by decreased hydrogensupply as the tank level drops.
Fig. 12 shows temperature results for the fuel cell power event.The temperatures of the fuel cell membrane, hydride tank surface,coolant into the tank, and coolant out of the tank all follow the sameprofile. They rise steadily for the first 20 min, then begin to level offand even slightly decrease after the fuel cell current is reduced bythe controller. The internal temperature of the hydride tank fallsbelow room temperature as the endothermic hydrogen desorptionreaction occurs, but cannot fully utilize the fuel cell waste heat due,again, to the poor heat transfer characteristics of the tank. The radi-ator plays no roll in this scenario because the fuel cell never reachesits design set point temperature of 80 ◦C.
4.2. System efficiencies
The RFC system presented herein is relatively simple and self-contained. Apart from the electrolyzer, the only energy consuming
devices are a variable power 0–540 W blower for fuel cell inlet air,a 100 W radiator fan, and a 200 W water pump. System efficiencyfor any operating period can therefore be defined by Eq. (44):�electrical = Efuel cell − Eblower − EFC pump − EFC fan
Eelectrolyzer + EE pump + EE fan(44)
where Efuel cell and Eelectrolyzer are the quantities of electrical energysupplied by the fuel cell and delivered to the electrolyzer, respec-tively. The electrical energy required for the blower, Eblower, isaccounted for as well as the energy used by the fan and pump dur-ing electrolysis, EE fan, EE pump, and during fuel cell operation, EFC fan,EFC pump.
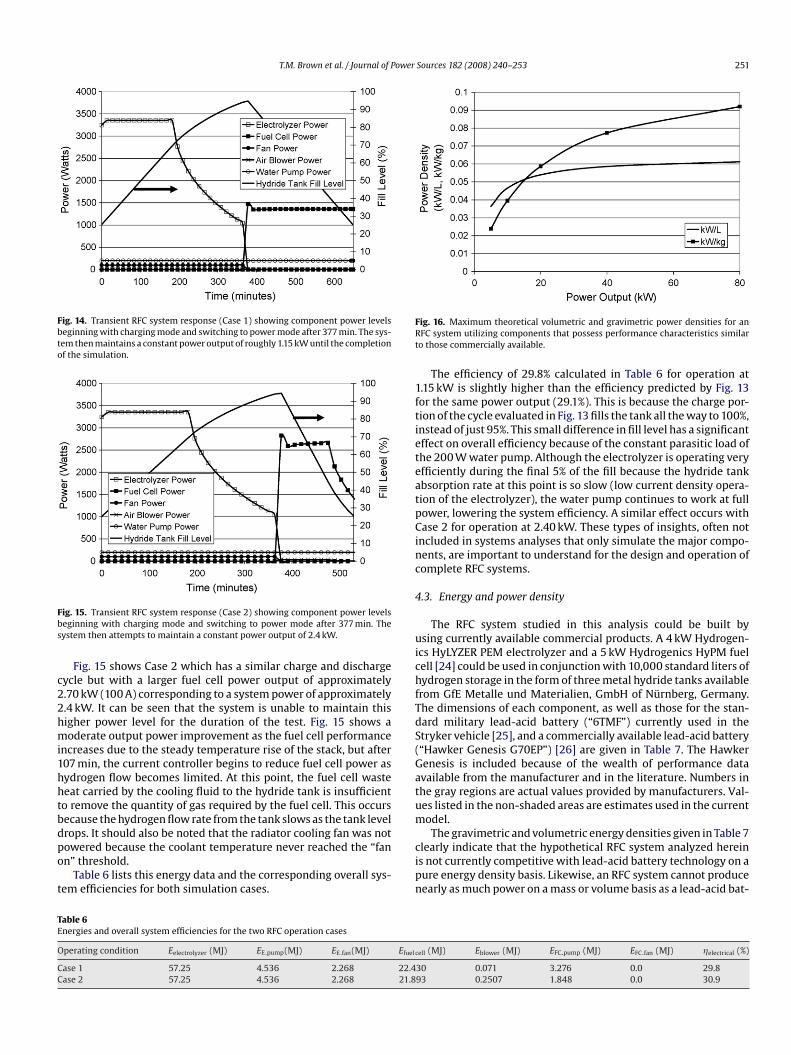
System round-trip efficiencies have been tabulated for varioussystem power levels as shown in Fig. 13. Due to the diminishinghydrogen desorption rate as the level in the hydride tank falls, nopower set point can be maintained for an entire tank of fuel. Forexample, a system power output of 3.0 kW can be maintained asthe tank drains from 100% fill level to 50%, or a system power of just50 W can be maintained all the way down to a tank level of 5.5%, butonce each of these respective levels is reached, the hydrogen flowrate becomes so small that the fuel cell current controller must
Fig. 13. System round-trip efficiency as it varies with system power output.
reduce the current output to maintain the necessary fuel line pres-sure. To compare system efficiencies at different power levels on thesame basis, the efficiencies shown in Fig. 13 are calculated by oper-ating at constant power from a 100% full tank only until that partic-ular power level can no longer be maintained, and then switchingto charge mode to fill the tank back to 100%. This means that thetotal energy (power multiplied by time) stored and delivered foreach point on the efficiency curve is not necessarily the same.
The lower efficiencies observed at low power levels are due torelatively high parasitic loads, such as the constant 200 W coolingpump load. The decrease in efficiency at high power levels is dueto reduced fuel cell and electrolyzer efficiency at higher loads com-bined with increased parasitic losses from the variable power fuelcell air inlet blower. It is important to note that the cooling sys-tem fan never operated during any of the power cycles presentedin Fig. 13 because the fuel cell never reached the design operat-ing temperature of 80 ◦C. Though the internal fuel cell temperaturegradually increased throughout operation at each power level (ina similar fashion to that shown in Fig. 12), the endothermic hydro-gen desorption reaction in the hydride tank removed sufficient heatfrom the coolant stream to keep the fuel cell temperature below itshigh temperature limit. A larger hydrogen storage tank may haveallowed the simulated operation to continue long enough for thefuel cell to eventually reach the maximum operating temperature.This cooling phenomenon can help explain the fairly flat mid-range
efficiency shown in Fig. 13. In the current PEM fuel cell model, effi-ciency decreases as power level increases and fuel cell efficiencyincreases with increasing temperature. Therefore, since the fuel celltemperature never reaches an upper boundary during the simula-tions, the efficiency losses due to higher current density operationare offset by the efficiency gains reached through the graduallyhigher temperature operation.Figs. 14 and 15 show the power outputs and inputs foreach of the system components during transient operation of acharge/discharge cycle from an initial hydride tank level of 25–95%and back to 25% at a constant current set point. Both plots are iden-tical during the tank filling portion of the operation because theelectrolyzer fills the tank from 25 to 95% at the maximum rate asdescribed previously. In Fig. 14 (Case 1), after reaching a tank levelof 95%, the electrolyzer is turned off and the fuel cell is operated atapproximately 1.35 kW (50 A) until the tank has been drained backto a 25% level. After subtracting parasitic pump and fan loads, thisequates to a system output power of roughly 1.15 kW. Fig. 14 showsthat the system is capable of maintaining this power output levelfor the duration of the test (275 min).
T.M. Brown et al. / Journal of Power Sources 182 (2008) 240–253 251
Fig. 14. Transient RFC system response (Case 1) showing component power levelsbeginning with charging mode and switching to power mode after 377 min. The sys-tem then maintains a constant power output of roughly 1.15 kW until the completionof the simulation.
Fig. 15. Transient RFC system response (Case 2) showing component power levelsbeginning with charging mode and switching to power mode after 377 min. Thesystem then attempts to maintain a constant power output of 2.4 kW.
Fig. 15 shows Case 2 which has a similar charge and dischargecycle but with a larger fuel cell power output of approximately2.70 kW (100 A) corresponding to a system power of approximately2.4 kW. It can be seen that the system is unable to maintain thishigher power level for the duration of the test. Fig. 15 shows amoderate output power improvement as the fuel cell performanceincreases due to the steady temperature rise of the stack, but after107 min, the current controller begins to reduce fuel cell power ashydrogen flow becomes limited. At this point, the fuel cell wasteheat carried by the cooling fluid to the hydride tank is insufficientto remove the quantity of gas required by the fuel cell. This occursbecause the hydrogen flow rate from the tank slows as the tank leveldrops. It should also be noted that the radiator cooling fan was notpowered because the coolant temperature never reached the “fanon” threshold.
Table 6 lists this energy data and the corresponding overall sys-tem efficiencies for both simulation cases.
Table 6Energies and overall system efficiencies for the two RFC operation cases
Operating condition Eelectrolyzer (MJ) EE pump(MJ) EE fan(MJ) Efuel
Case 1 57.25 4.536 2.268 22.4Case 2 57.25 4.536 2.268 21.8
Fig. 16. Maximum theoretical volumetric and gravimetric power densities for anRFC system utilizing components that possess performance characteristics similarto those commercially available.
The efficiency of 29.8% calculated in Table 6 for operation at1.15 kW is slightly higher than the efficiency predicted by Fig. 13for the same power output (29.1%). This is because the charge por-tion of the cycle evaluated in Fig. 13 fills the tank all the way to 100%,instead of just 95%. This small difference in fill level has a significanteffect on overall efficiency because of the constant parasitic load ofthe 200 W water pump. Although the electrolyzer is operating veryefficiently during the final 5% of the fill because the hydride tankabsorption rate at this point is so slow (low current density opera-tion of the electrolyzer), the water pump continues to work at fullpower, lowering the system efficiency. A similar effect occurs withCase 2 for operation at 2.40 kW. These types of insights, often notincluded in systems analyses that only simulate the major compo-nents, are important to understand for the design and operation ofcomplete RFC systems.
4.3. Energy and power density
The RFC system studied in this analysis could be built byusing currently available commercial products. A 4 kW Hydrogen-ics HyLYZER PEM electrolyzer and a 5 kW Hydrogenics HyPM fuelcell [24] could be used in conjunction with 10,000 standard liters ofhydrogen storage in the form of three metal hydride tanks availablefrom GfE Metalle und Materialien, GmbH of Nurnberg, Germany.The dimensions of each component, as well as those for the stan-dard military lead-acid battery (“6TMF”) currently used in theStryker vehicle [25], and a commercially available lead-acid battery(“Hawker Genesis G70EP”) [26] are given in Table 7. The HawkerGenesis is included because of the wealth of performance dataavailable from the manufacturer and in the literature. Numbers inthe gray regions are actual values provided by manufacturers. Val-ues listed in the non-shaded areas are estimates used in the currentmodel.
The gravimetric and volumetric energy densities given in Table 7clearly indicate that the hypothetical RFC system analyzed hereinis not currently competitive with lead-acid battery technology on apure energy density basis. Likewise, an RFC system cannot producenearly as much power on a mass or volume basis as a lead-acid bat-
cell (MJ) Eblower (MJ) EFC pump (MJ) EFC fan (MJ) �electrical (%)
30 0.071 3.276 0.0 29.893 0.2507 1.848 0.0 30.9
252 T.M. Brown et al. / Journal of Power
Table 7RFC system component and lead-acid battery dimensions, and calculated energy and pow
aEnergy output during C20 discharge cycle. bPower output sustainable for 5 min. cProducin this analysis. Therefore, the size and weight of the 10 kW fuel cell were halved to estima1.15 kW operation.
charging rate in the second regime can be increased by enabling
Fig. 17. Maximum theoretical volumetric and gravimetric energy densities for anRFC system utilizing components that possess performance characteristics similarto those commercially available.
tery. However, the storage capability of the RFC is close enough tothat of the battery that one can envision niche applications wherethe theoretically superior cyclic durability, modular design, and lackof self-discharge properties of the RFC system may outweigh theenergy density deficiency as compared to traditional battery tech-
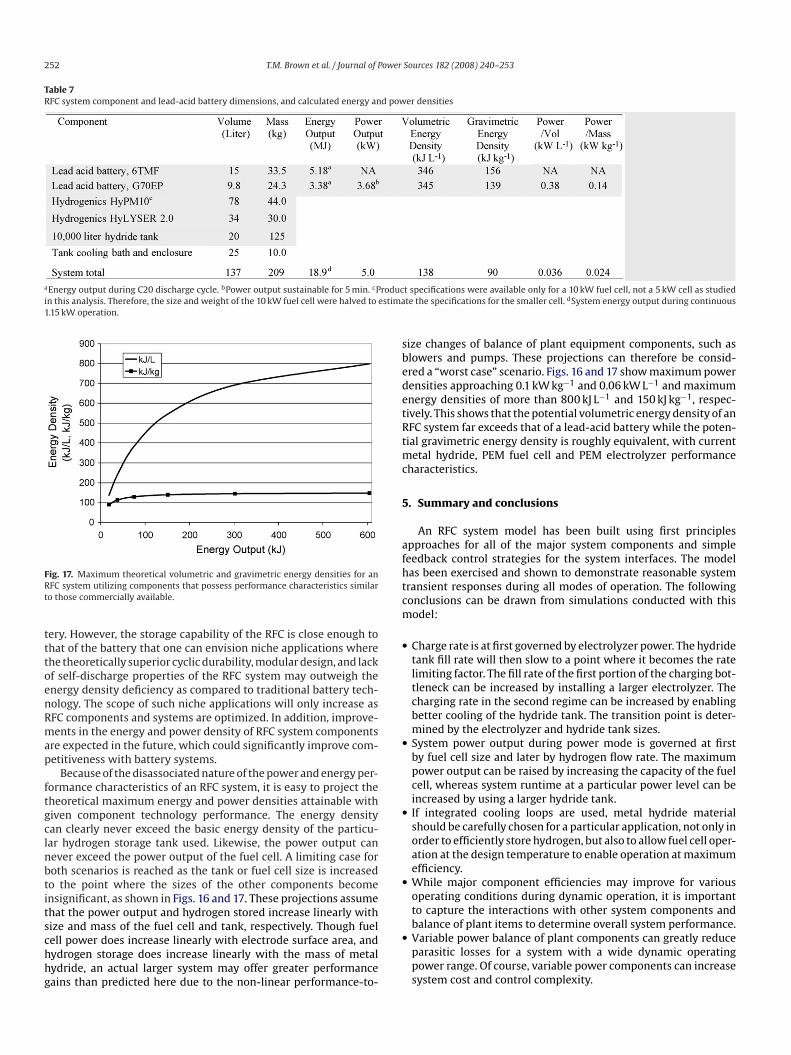
nology. The scope of such niche applications will only increase asRFC components and systems are optimized. In addition, improve-ments in the energy and power density of RFC system componentsare expected in the future, which could significantly improve com-petitiveness with battery systems.Because of the disassociated nature of the power and energy per-formance characteristics of an RFC system, it is easy to project thetheoretical maximum energy and power densities attainable withgiven component technology performance. The energy densitycan clearly never exceed the basic energy density of the particu-lar hydrogen storage tank used. Likewise, the power output cannever exceed the power output of the fuel cell. A limiting case forboth scenarios is reached as the tank or fuel cell size is increasedto the point where the sizes of the other components becomeinsignificant, as shown in Figs. 16 and 17. These projections assumethat the power output and hydrogen stored increase linearly withsize and mass of the fuel cell and tank, respectively. Though fuelcell power does increase linearly with electrode surface area, andhydrogen storage does increase linearly with the mass of metalhydride, an actual larger system may offer greater performancegains than predicted here due to the non-linear performance-to-
Sources 182 (2008) 240–253
er densities
t specifications were available only for a 10 kW fuel cell, not a 5 kW cell as studiedte the specifications for the smaller cell. dSystem energy output during continuous
size changes of balance of plant equipment components, such asblowers and pumps. These projections can therefore be consid-ered a “worst case” scenario. Figs. 16 and 17 show maximum powerdensities approaching 0.1 kW kg−1 and 0.06 kW L−1 and maximumenergy densities of more than 800 kJ L−1 and 150 kJ kg−1, respec-tively. This shows that the potential volumetric energy density of anRFC system far exceeds that of a lead-acid battery while the poten-tial gravimetric energy density is roughly equivalent, with currentmetal hydride, PEM fuel cell and PEM electrolyzer performancecharacteristics.
5. Summary and conclusions
An RFC system model has been built using first principlesapproaches for all of the major system components and simplefeedback control strategies for the system interfaces. The modelhas been exercised and shown to demonstrate reasonable systemtransient responses during all modes of operation. The followingconclusions can be drawn from simulations conducted with thismodel:
• Charge rate is at first governed by electrolyzer power. The hydridetank fill rate will then slow to a point where it becomes the ratelimiting factor. The fill rate of the first portion of the charging bot-tleneck can be increased by installing a larger electrolyzer. The
better cooling of the hydride tank. The transition point is deter-mined by the electrolyzer and hydride tank sizes.
• System power output during power mode is governed at firstby fuel cell size and later by hydrogen flow rate. The maximumpower output can be raised by increasing the capacity of the fuelcell, whereas system runtime at a particular power level can beincreased by using a larger hydride tank.
• If integrated cooling loops are used, metal hydride materialshould be carefully chosen for a particular application, not only inorder to efficiently store hydrogen, but also to allow fuel cell oper-ation at the design temperature to enable operation at maximumefficiency.
• While major component efficiencies may improve for variousoperating conditions during dynamic operation, it is importantto capture the interactions with other system components andbalance of plant items to determine overall system performance.
• Variable power balance of plant components can greatly reduceparasitic losses for a system with a wide dynamic operatingpower range. Of course, variable power components can increasesystem cost and control complexity.

[
[
T.M. Brown et al. / Journal of Power
References
[1] W. Smith, J. Power Sources 86 (2000) 74–83.[2] A. Bergen, et al., J. Power Sources 164 (2007) 624–630.[3] K. Bolwin, J. Power Sources 40 (1992) 307–321.[4] F. Barbir, T. Molter, L. Dalton, Int. J. Hydrogen Energy 30 (2004) 351–357.[5] Defense Board Science Task Force on Improving Fuel Efficiency of Weapons
Platforms, “More Capable Warfighting Through Reduced Fuel Burden,” Reportto the Office of the Under Secretary of Defense for Acquisition, Technology, andLogistics, Washington, DC, January 2001.
[6] G. Sandrock, State-of-the-Art—Review of Hydrogen Storage in Reversible MetalHydrides for Military Fuel Cell Applications, Department of the Navy, Office ofNaval Research, 1997.
[7] O. Ulleberg, Int. J. Hydrogen Energy 28 (2003) 21–33.[8] S. Busquet, C.E. Hubert, J. Labbe, D. Mayer, R. Metkemeijer, J. Power Sources 134
(2004) 41–48.[9] M.J. Khan, M.T. Iqbal, Renew. Energy 30 (2005) 421–439.10] H. Gorgun, Int. J. Hydrogen Energy 31 (2006) 29–38.
[11] J. Maclay, J. Brouwer, G.S. Samuelsen, Int. J. Hydrogen Energy 31 (2006)994–1009.
12] T. Brown, J. Brouwer, G.S. Samuelsen, Int. J. Hydrogen Energy, in revision, April2008.
[[
[
[
[
[
[[
[
[
[[[
Sources 182 (2008) 240–253 253
13] U. Mayer, M. Groll, W. Supper, J. Less-Common Met. 131 (1987) 235–244.14] A. Jemni, S. Nasrallah, J. Lamloumi, Int. J. Hydrogen Energy 24 (1999) 631–
644.15] F. Incropera, D. DeWitt, Fundamentals of Heat and Mass Transfer, John Wiley
and Sons, 1996.16] S. Gadre, et al., Ind. Eng. Chem. Res. 42 (2003) 1713–1722.
[17] S. Suda, N. Kobayashi, J. Less-Common Met. 73 (1980) 119–126.18] F. Mueller, J. Brouwer, S. Kang, H. Kim, K. Min, J. Power Sources 163 (2007)
814–829.19] T.E. Springer, T.A. Zawodzinski, S. Gottesfeld, J. Electrochem. Soc. 138 (1991)
2334–2342.20] J. Larminie, A. Dicks, Fuel Cell Systems Explained, second ed., Wiley, 2003.21] R. Fox, A. McDonald, Introduction to Fluid Mechanics, fourth ed., Wiley, New
York, 1992.22] E. Herrck, L. Johnston, I. Bezman, C. Hood, J. Am. Chem. Soc. 68 (1946)
2367–2373.23] M. Moran, H. Shapiro, Fundamentals of Engineering Thermodynamics, John
Wiley & Sons, 1995.24] http://www.hydrogenics.com.25] http://www.milbatteries.com/hawker/brochure.html.26] EnerSys Genesis Selection Guide, fifth ed., US-GPL-SG-002, July 2006.