
An electrochemical-based fuel-cell model suitable for electrical engineering automation approach
10
IEEE TRANSACTIONS ON INDUSTRIAL ELECTRONICS, VOL. 51, NO. 5, OCTOBER 2004 1103 An Electrochemical-Based Fuel-Cell Model Suitable for Electrical Engineering Automation Approach Jeferson M. Corrêa, Student Member, IEEE, Felix A. Farret, Luciane N. Canha, and Marcelo G. Simões, Senior Member, IEEE Abstract—This paper presents a dynamic electrochemical model for representation, simulation, and evaluation of performance of small size generation systems emphasizing particularly proton exchange membrane fuel-cell (PEMFC) stacks. The results of the model are used to predict the output voltage, efficiency, and power of FCs as a function of the actual load current and of the constructive and operational parameters of the cells. Partial and total load insertion and rejection tests were accomplished to evaluate the dynamic response of the studied models. The results guarantee a better analytical performance of these models with respect to former ones with a consequent reduction in time and costs of projects using FCs as the primary source of energy. Additionally, this electrochemical model was tested for the SR-12 Modular PEM Generator, a stack rated at 500 W, manufactured by Avista Laboratories, for the Ballard Mark V FC and for the BCS 500-W stack. Index Terms—Automation, control, fuel cells (FCs), modeling and simulation. I. INTRODUCTION N ONPOLLUTING energy generation and other environ- mental issues have been driving during the last few years an increasing demand for new energy conversion technologies. Within such perspective, fuel cell (FC) systems have been showing up as a promising alternative due their high efficiency, low aggression to the environment, excellent dynamic response, and superior reliability and durability in space, automotive, and stationary applications. In particular, proton exchange membrane FCs (PEMFCs) are considered great alternatives for distributed sources of energy. PEMFCs produce water as by-product waste, operating at low temperatures and allowing fast startup. PEMFCs use a solid polymer as the electrolyte, reducing construction, transportation, and safety concerns. An FC produces electrochemical power due to the passage of a rich gas in hydrogen through an anode and in oxygen (or air) through a cathode, with an electrolyte between the anode and cathode to enable the exchange of electrical charges (ions). The ion flow through the electrolyte produces an electrical current in an external circuit or load. Manuscript received October 29, 2002; revised March 26, 2004. Abstract published on the Internet July 15, 2004. This work was supported by the Co- ordenação de Aperfeiçoamento de Pessoal de Nível Superior (CAPES), by the National Council of Research and Development (CNPq), by the AES-Sul Dis- tribution Company, by the Advanced Machines Company (AMC), and by the National Science Foundation (NSF). J. M. Corrêa and M. G. Simões are with the Colorado School of Mines, Golden, CO 80401 USA (e-mail: [email protected]; [email protected]). F. A. Farret and L. N. Canha are with the Federal University of Santa Maria, 97.105.900 Santa Maria, Brazil (e-mail: [email protected]; [email protected]). Digital Object Identifier 10.1109/TIE.2004.834972 Any hydrocarbon material, in principle, can be used as fuel independent on being gas, liquid, or solid. However, these mate- rials have to pass through a reformer to liberate the hydrogen of the carbon. Natural gas, for example, is reformed through vapor and high temperatures. A similar process, called gasification, is applied to coal, biomass, and to a wide range of hydrocarbon residues [9]. Under normal operation, a simple FC typically produces 0.5–0.9 V. For use in energy generation systems, where a relatively high power is needed, several cells are connected in series, arranging a stack that can supply hundreds of kilowatts. It is expected that in near future commercially available prod- ucts will be rated at the megawatt range. There is a need for a reliable mathematical model. Such model can allow the evaluation of the PEMFC dynamic per- formance for small-size electrical energy generation systems, reducing cost and time along the design stage and tests. Such need motivated us to conduct an electrochemical modeling to determine the open-circuit voltage and the voltage drops of the cells for each operating point. In power generation systems, the dynamic response is extremely important for the planner of control and management systems, especially when there is injection of energy into the grid. Therefore, special attention should be given to the dynamic response of the FC. Different models of PEMFCs are available in the literature [1], [2]. In [3], a dynamical model for the PEMFC is presented, but it is more suitable for electrochemical purposes than for elec- trical engineering. For example, when considering the injection of FC energy into the grid, the generation control system should decide which amount of power the FC will supply to the grid, as a function of the load demand. For this, the dynamic response of the FC, considering the viewpoint of energy systems, should be compatible with the fast variations of a random load curve. Recently, this subject has caught the attention of many authors [4]–[8]. For example, in [4] 1 is presented a dynamical model using PSpice, which is adequate for circuit simulation, including power electronics. In [8], is presented a very simplified electrical model, which is used to derive a fuzzy control system for a boost dc/dc converter. Taking these aspects into consideration, this paper presents a model that predicts the FC stack performance against situations commonly encountered in electrical power generation systems, like insertion and rejection of loads, efficiency, and power char- acteristics. Using the present dynamical model, it is also pos- sible to develop several control techniques for the operation of 1 Slides of [4] are available at http://www.nfcrc.uci.edu/UFFC/PowerElec- tronics/PDFs/20_Famouri.pdf 0278-0046/04$20.00 © 2004 IEEE
-
Upload
independent -
Category
Documents
-
view
2 -
download
0
Transcript of An electrochemical-based fuel-cell model suitable for electrical engineering automation approach

IEEE TRANSACTIONS ON INDUSTRIAL ELECTRONICS, VOL. 51, NO. 5, OCTOBER 2004 1103
An Electrochemical-Based Fuel-Cell Model Suitablefor Electrical Engineering Automation Approach
Jeferson M. Corrêa, Student Member, IEEE, Felix A. Farret, Luciane N. Canha, andMarcelo G. Simões, Senior Member, IEEE
Abstract—This paper presents a dynamic electrochemical modelfor representation, simulation, and evaluation of performance ofsmall size generation systems emphasizing particularly protonexchange membrane fuel-cell (PEMFC) stacks. The results ofthe model are used to predict the output voltage, efficiency, andpower of FCs as a function of the actual load current and ofthe constructive and operational parameters of the cells. Partialand total load insertion and rejection tests were accomplishedto evaluate the dynamic response of the studied models. Theresults guarantee a better analytical performance of these modelswith respect to former ones with a consequent reduction in timeand costs of projects using FCs as the primary source of energy.Additionally, this electrochemical model was tested for the SR-12Modular PEM Generator, a stack rated at 500 W, manufacturedby Avista Laboratories, for the Ballard Mark V FC and for theBCS 500-W stack.
Index Terms—Automation, control, fuel cells (FCs), modelingand simulation.
I. INTRODUCTION
NONPOLLUTING energy generation and other environ-mental issues have been driving during the last few years
an increasing demand for new energy conversion technologies.Within such perspective, fuel cell (FC) systems have beenshowing up as a promising alternative due their high efficiency,low aggression to the environment, excellent dynamic response,and superior reliability and durability in space, automotive,and stationary applications. In particular, proton exchangemembrane FCs (PEMFCs) are considered great alternativesfor distributed sources of energy. PEMFCs produce water asby-product waste, operating at low temperatures and allowingfast startup. PEMFCs use a solid polymer as the electrolyte,reducing construction, transportation, and safety concerns.
An FC produces electrochemical power due to the passage ofa rich gas in hydrogen through an anode and in oxygen (or air)through a cathode, with an electrolyte between the anode andcathode to enable the exchange of electrical charges (ions). Theion flow through the electrolyte produces an electrical currentin an external circuit or load.
Manuscript received October 29, 2002; revised March 26, 2004. Abstractpublished on the Internet July 15, 2004. This work was supported by the Co-ordenação de Aperfeiçoamento de Pessoal de Nível Superior (CAPES), by theNational Council of Research and Development (CNPq), by the AES-Sul Dis-tribution Company, by the Advanced Machines Company (AMC), and by theNational Science Foundation (NSF).
J. M. Corrêa and M. G. Simões are with the Colorado School of Mines,Golden, CO 80401 USA (e-mail: [email protected]; [email protected]).
F. A. Farret and L. N. Canha are with the Federal University ofSanta Maria, 97.105.900 Santa Maria, Brazil (e-mail: [email protected];[email protected]).
Digital Object Identifier 10.1109/TIE.2004.834972
Any hydrocarbon material, in principle, can be used as fuelindependent on being gas, liquid, or solid. However, these mate-rials have to pass through a reformer to liberate the hydrogen ofthe carbon. Natural gas, for example, is reformed through vaporand high temperatures. A similar process, called gasification, isapplied to coal, biomass, and to a wide range of hydrocarbonresidues [9].
Under normal operation, a simple FC typically produces0.5–0.9 V. For use in energy generation systems, where arelatively high power is needed, several cells are connected inseries, arranging a stack that can supply hundreds of kilowatts.It is expected that in near future commercially available prod-ucts will be rated at the megawatt range.
There is a need for a reliable mathematical model. Suchmodel can allow the evaluation of the PEMFC dynamic per-formance for small-size electrical energy generation systems,reducing cost and time along the design stage and tests. Suchneed motivated us to conduct an electrochemical modeling todetermine the open-circuit voltage and the voltage drops of thecells for each operating point. In power generation systems,the dynamic response is extremely important for the plannerof control and management systems, especially when there isinjection of energy into the grid. Therefore, special attentionshould be given to the dynamic response of the FC.
Different models of PEMFCs are available in the literature[1], [2]. In [3], a dynamical model for the PEMFC is presented,but it is more suitable for electrochemical purposes than for elec-trical engineering. For example, when considering the injectionof FC energy into the grid, the generation control system shoulddecide which amount of power the FC will supply to the grid, asa function of the load demand. For this, the dynamic responseof the FC, considering the viewpoint of energy systems, shouldbe compatible with the fast variations of a random load curve.Recently, this subject has caught the attention of many authors[4]–[8]. For example, in [4]1 is presented a dynamical modelusing PSpice, which is adequate for circuit simulation, includingpower electronics. In [8], is presented a very simplified electricalmodel, which is used to derive a fuzzy control system for a boostdc/dc converter.
Taking these aspects into consideration, this paper presents amodel that predicts the FC stack performance against situationscommonly encountered in electrical power generation systems,like insertion and rejection of loads, efficiency, and power char-acteristics. Using the present dynamical model, it is also pos-sible to develop several control techniques for the operation of
1Slides of [4] are available at http://www.nfcrc.uci.edu/UFFC/PowerElec-tronics/PDFs/20_Famouri.pdf
0278-0046/04$20.00 © 2004 IEEE
1104 IEEE TRANSACTIONS ON INDUSTRIAL ELECTRONICS, VOL. 51, NO. 5, OCTOBER 2004
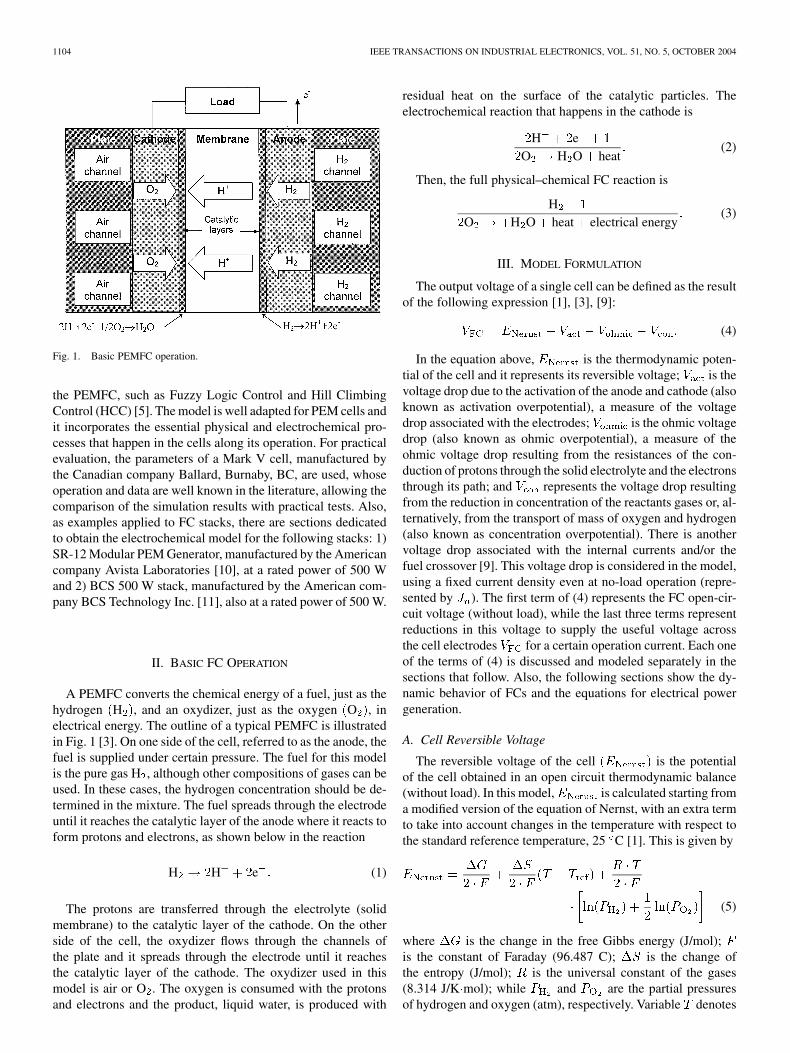
Fig. 1. Basic PEMFC operation.
the PEMFC, such as Fuzzy Logic Control and Hill ClimbingControl (HCC) [5]. The model is well adapted for PEM cells andit incorporates the essential physical and electrochemical pro-cesses that happen in the cells along its operation. For practicalevaluation, the parameters of a Mark V cell, manufactured bythe Canadian company Ballard, Burnaby, BC, are used, whoseoperation and data are well known in the literature, allowing thecomparison of the simulation results with practical tests. Also,as examples applied to FC stacks, there are sections dedicatedto obtain the electrochemical model for the following stacks: 1)SR-12 Modular PEM Generator, manufactured by the Americancompany Avista Laboratories [10], at a rated power of 500 Wand 2) BCS 500 W stack, manufactured by the American com-pany BCS Technology Inc. [11], also at a rated power of 500 W.
II. BASIC FC OPERATION
A PEMFC converts the chemical energy of a fuel, just as thehydrogen H , and an oxydizer, just as the oxygen O , inelectrical energy. The outline of a typical PEMFC is illustratedin Fig. 1 [3]. On one side of the cell, referred to as the anode, thefuel is supplied under certain pressure. The fuel for this modelis the pure gas H , although other compositions of gases can beused. In these cases, the hydrogen concentration should be de-termined in the mixture. The fuel spreads through the electrodeuntil it reaches the catalytic layer of the anode where it reacts toform protons and electrons, as shown below in the reaction
H H e (1)
The protons are transferred through the electrolyte (solidmembrane) to the catalytic layer of the cathode. On the otherside of the cell, the oxydizer flows through the channels ofthe plate and it spreads through the electrode until it reachesthe catalytic layer of the cathode. The oxydizer used in thismodel is air or O . The oxygen is consumed with the protonsand electrons and the product, liquid water, is produced with
residual heat on the surface of the catalytic particles. Theelectrochemical reaction that happens in the cathode is
H eO H O heat
(2)
Then, the full physical–chemical FC reaction is
HO H O heat electrical energy
(3)
III. MODEL FORMULATION
The output voltage of a single cell can be defined as the resultof the following expression [1], [3], [9]:
(4)
In the equation above, is the thermodynamic poten-tial of the cell and it represents its reversible voltage; is thevoltage drop due to the activation of the anode and cathode (alsoknown as activation overpotential), a measure of the voltagedrop associated with the electrodes; is the ohmic voltagedrop (also known as ohmic overpotential), a measure of theohmic voltage drop resulting from the resistances of the con-duction of protons through the solid electrolyte and the electronsthrough its path; and represents the voltage drop resultingfrom the reduction in concentration of the reactants gases or, al-ternatively, from the transport of mass of oxygen and hydrogen(also known as concentration overpotential). There is anothervoltage drop associated with the internal currents and/or thefuel crossover [9]. This voltage drop is considered in the model,using a fixed current density even at no-load operation (repre-sented by ). The first term of (4) represents the FC open-cir-cuit voltage (without load), while the last three terms representreductions in this voltage to supply the useful voltage acrossthe cell electrodes for a certain operation current. Each oneof the terms of (4) is discussed and modeled separately in thesections that follow. Also, the following sections show the dy-namic behavior of FCs and the equations for electrical powergeneration.
A. Cell Reversible Voltage
The reversible voltage of the cell is the potentialof the cell obtained in an open circuit thermodynamic balance(without load). In this model, is calculated starting froma modified version of the equation of Nernst, with an extra termto take into account changes in the temperature with respect tothe standard reference temperature, 25 C [1]. This is given by
(5)
where is the change in the free Gibbs energy (J/mol);is the constant of Faraday (96.487 C); is the change ofthe entropy (J/mol); is the universal constant of the gases(8.314 J/K mol); while and are the partial pressuresof hydrogen and oxygen (atm), respectively. Variable denotes
CORRÊA et al.: ELECTROCHEMICAL-BASED FC MODEL SUITABLE FOR ELECTRICAL ENGINEERING AUTOMATION APPROACH. 1105
the cell operation temperature (K) and the reference temper-ature. Using the standard pressure and temperature (SPT) valuesfor , and , (5) can be simplified to [1]
(6)
It has to be noted that membrane temperature and gases par-tial pressures change with cell current: with increasing current,partial pressure of hydrogen or oxygen decreases, whereas tem-perature increases.
B. Activation Voltage Drop
As shown in [1], the activation overpotential, including anodeand cathode, can be calculated by
(7)
where is the cell operating current (A), and the ’s repre-sent parametric coefficients for each cell model, whose valuesare defined based on theoretical equations with kinetic, thermo-dynamic, and electrochemical foundations [1]. is the con-centration of oxygen in the catalytic interface of the cathodemol/cm , determined by
(8)
C. Ohmic Voltage Drop
The ohmic voltage drop results from the resistance to theelectrons transfer through the collecting plates and carbon elec-trodes, and the resistance to the protons transfer through thesolid membrane. In this model, a general expression for resis-tance is defined to include all the important parameters of themembrane. The equivalent resistance of the membrane is calcu-lated by
(9)
where is the specific resistivity of the membrane for theelectron flow ( cm), is the cell active area cm and is thethickness of the membrane (cm), which serves as the electrolyteof the cell.
The membrane of the Nafion type considered in this work isa registered trademark of Dupont and broadly used in PEMFC.Dupont uses the following product designations to denote thethickness of the Nafion membranes:
Nafion mil m
Nafion mil m
Nafion mil m
The following numeric expression for the resistivity of theNafion membranes is used [1]:
(10)where the term is the specific resistivity( cm) at no current and at 30 C; the exponential term in the
denominator is the temperature factor correction if the cell isnot at 30 C. The parameter is an adjustable parameter witha possible maximum value of 23. This parameter is influencedby the preparation procedure of the membrane and it is a func-tion of relative humidity and stoichiometry relation of the anodegas. It may have a value order of 14 under the ideal conditionof 100% relative humidity. There are also reported values in theorder of 22 and 23 under oversaturated conditions.
Using the value of (9) for the membrane resistance, the fol-lowing expression determines the ohmic voltage drop:
(11)
where represents the resistance to the transfer of protonsthrough the membrane, usually considered constant.
D. Concentration Or Mass Transport Voltage Drop
The mass transport affects the concentrations of hydrogenand oxygen. This, in turn, causes a decrease of the partialpressures of these gases. Reduction in the pressures of oxygenand hydrogen depend on the electrical current and on the phys-ical characteristics of the system. To determine an equationfor this voltage drop, a maximum current density is defined,
, under which the fuel is being used at the same rate ofthe maximum supply speed. The current density cannot surpassthis limit because the fuel cannot be supplied at a larger rate.Typical values for are in the range of 500–1500 mA/cm .
Thus, the voltage drop due to the mass transport can be de-termined by
(12)
where is a parametric coefficient, which depends on thecell and its operation state, and represents the actual currentdensity of the cell A/cm .
E. Dynamics of the Cell
In FCs a phenomenon known as “charge double layer” ex-ists. This phenomenon is of extreme importance for the under-standing of the cell dynamics: whenever two differently chargedmaterials are in contact there is a charge accumulation on theirsurfaces or a load transfer from one to the other. The chargelayer on the interface electrode/electrolyte (or close to the in-terface) acts as a storage of electrical charges and energy and,in this way, it behaves as an electrical capacitor. If the voltagechanges, there will be some time for the charge (and the asso-ciated current) to vanish (if the voltage increases) or to increase(if the voltage decreases). Such a delay affects the activationand concentration potentials. It is important to point out that theohmic overpotential is not affected, since it is linearly related tothe cell current through Ohm’s Law. Thus, a change in the cur-rent causes an immediate change in the ohmic voltage drop.
In this way, it can be considered that a first-order delay existsin the activation and concentration voltages. The time constant
associated with this delay is the product
(13)
where represents the equivalent capacitance (F) of the systemand the equivalent resistance . The value of the capac-

1106 IEEE TRANSACTIONS ON INDUSTRIAL ELECTRONICS, VOL. 51, NO. 5, OCTOBER 2004
Fig. 2. Generation system with PEMFC stacks.
itance is of some few farads. The resistance is determinedfrom the cell output current and the calculated activation andconcentration voltages. In this way, these voltages will changedynamically with the current, until they reach their new steady-stated values. Then, is obtained from
(14)
In broad terms, the capacitive effect assures the good dynamicperformance of the cell, since the voltage moves smoothly to anew value in response to a change in the current demand.
F. Power Generation
An electrical energy generation system using a stack ofPEMFCs can be represented according to Fig. 2, which showsthe stack with the feeding of hydrogen, oxygen (air), and waterfor refrigeration, as well as its output products, hot water andelectricity. represents the stack output voltage, which isobtained from the multiplication of the FC voltage and thenumber of cells. The reformer is also represented, to obtainhydrogen starting from a fuel with hydrocarbon. The amountof components of the system will depend, mainly, on the totalpower of the stack.
The electrical output of energy of the cell is linked to a cer-tain load, represented in the diagram of Fig. 2 as a generic load.There is no restriction related to the load type, since the powersupplied by the stack is enough to feed it. For example, in sys-tems used to inject energy into the grid, the load can representa boost dc/dc converter, followed by a dc/ac converter, linked tothe grid through a transformer. In isolated systems it can rep-resent a purely resistive load (heating) or a resistive–inductiveload (motor), for example. In any case, the density of current ofthe cell A/cm is defined by the following expression:
(15)
The instantaneous electrical power supplied by the cell to theload can be determined by the equation
(16)
where is the cell output voltage for each operating condi-tion, (4), and is the output power, in watts.
With a liquid state subproduct, the FC efficiency can be de-termined from the equation [9]
(17)
where is the fuel utilization coefficient, generally in the rangeof 95%, and 1.48 V represents the maximum voltage that can beobtained using the higher heating value (HHV) for the hydrogenenthalpy. Fuel utilization is assumed to be constant, which isvalid where the FC has a hydrogen flow rate control. In this case,the hydrogen is supplied according to the load current.
IV. SIMULATION RESULTS
A. Model Validation
For validation of the model, one single cell, model BallardMark V, was simulated, which was fed with gases H and O ,using the membrane Nafion 117. The parameters used for thissimulation are presented in Table I. Also, Sections V and VIpresent results for two stack models that confirm the modelresults.
It should be made a proviso related to the parameters of thecells and of the model. The main proposal of this model is tosupply the characteristics of the system operation in a more pre-cisely possible way, allowing the development and improve-ment of electrical energy generation systems using this newand highly promising technology. However, there is a series ofparameters involved in this model, some of them empiric andothers difficult to determine. For the simulations that follow, theparameters were mainly obtained in the literature and the resultsfully agree with those presented in the literature. With develop-ment of the technology, more precise parameters, easier to de-termine, will be obtained, due to the great and growing world-wide interest in the subject. For the current situation, a modelthat can be used as a block in the construction of simulatorsof generation systems using PEMFC, with reasonable resultsand good dynamic response, comes as a quite interesting and
CORRÊA et al.: ELECTROCHEMICAL-BASED FC MODEL SUITABLE FOR ELECTRICAL ENGINEERING AUTOMATION APPROACH. 1107
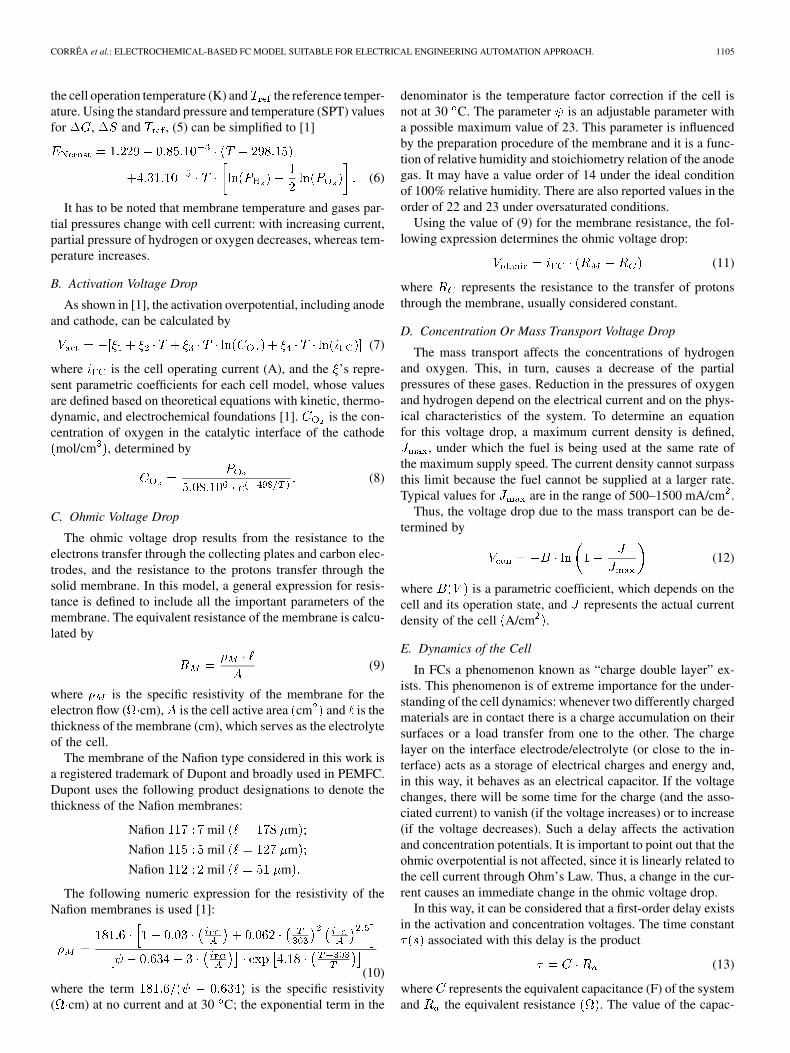
TABLE IPARAMETERS OF THE BALLARD MARK V FUEL CELL
Fig. 3. Ballard PEMFC polarization curve.
Fig. 4. Ballard PEMFC efficiency.
up-to-date option, which can benefit planners and researchersof the subject.
The cell polarization curve represents the FC output voltageas a function of the current density in steady state. The resultobtained with the simulation is presented in Fig. 3, which alsoshows the practical test results presented in [1]. The simulationresults show good agreement with the experimental ones. Forcurrent density values above 0.1 A/cm and below 1.3 A/cmthe absolute error was less than 3%. This figure is completelyacceptable taking into account the difficulty of finding the rightvalues for the different model parameters.
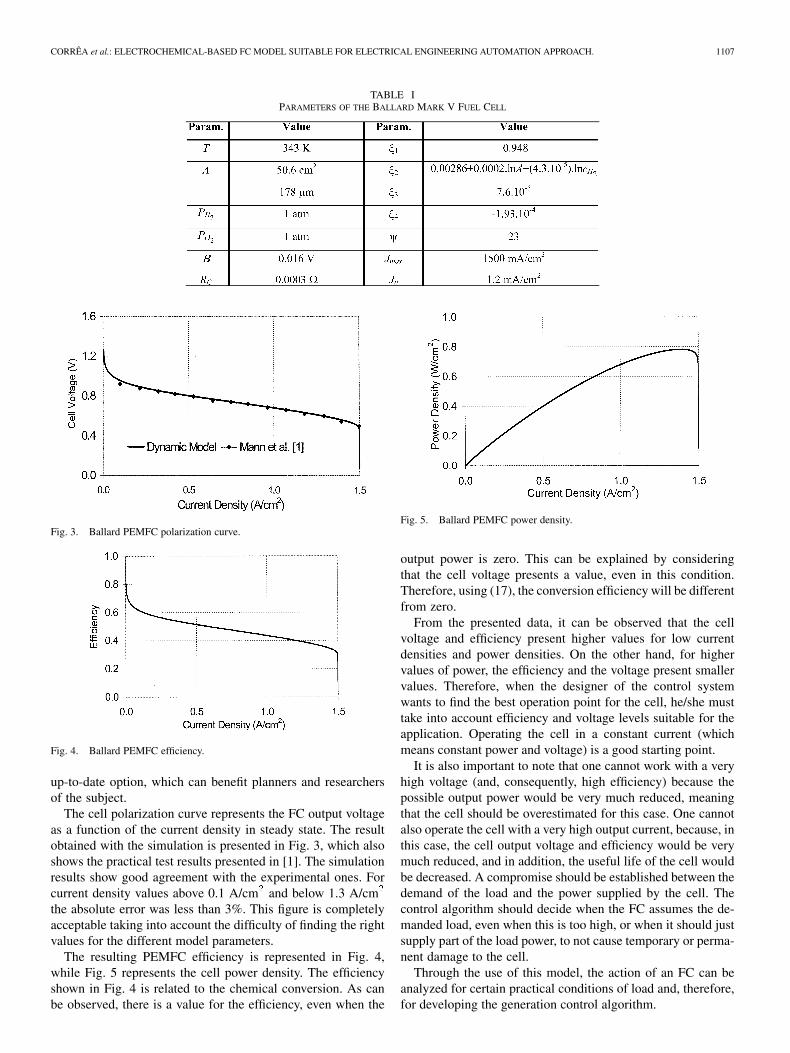
The resulting PEMFC efficiency is represented in Fig. 4,while Fig. 5 represents the cell power density. The efficiencyshown in Fig. 4 is related to the chemical conversion. As canbe observed, there is a value for the efficiency, even when the
Fig. 5. Ballard PEMFC power density.
output power is zero. This can be explained by consideringthat the cell voltage presents a value, even in this condition.Therefore, using (17), the conversion efficiency will be differentfrom zero.
From the presented data, it can be observed that the cellvoltage and efficiency present higher values for low currentdensities and power densities. On the other hand, for highervalues of power, the efficiency and the voltage present smallervalues. Therefore, when the designer of the control systemwants to find the best operation point for the cell, he/she musttake into account efficiency and voltage levels suitable for theapplication. Operating the cell in a constant current (whichmeans constant power and voltage) is a good starting point.
It is also important to note that one cannot work with a veryhigh voltage (and, consequently, high efficiency) because thepossible output power would be very much reduced, meaningthat the cell should be overestimated for this case. One cannotalso operate the cell with a very high output current, because, inthis case, the cell output voltage and efficiency would be verymuch reduced, and in addition, the useful life of the cell wouldbe decreased. A compromise should be established between thedemand of the load and the power supplied by the cell. Thecontrol algorithm should decide when the FC assumes the de-manded load, even when this is too high, or when it should justsupply part of the load power, to not cause temporary or perma-nent damage to the cell.
Through the use of this model, the action of an FC can beanalyzed for certain practical conditions of load and, therefore,for developing the generation control algorithm.

1108 IEEE TRANSACTIONS ON INDUSTRIAL ELECTRONICS, VOL. 51, NO. 5, OCTOBER 2004
Fig. 6. Stack current for partial load insertion and rejection test.
Fig. 7. Stack voltage for partial load insertion and rejection test.
Several tests were run using the model discussed in this paperwith both total and partial load insertion and rejection situations.The most expressive of these tests were the partial load insertionand rejection, as discussed below.
B. Partial Load Insertion and Rejection Tests
Results from the model for one single cell are extrapolated foran association in a series of FCs, resulting in an output voltage
that is the sum of the individual cell voltages. In the sameway, it is possible to obtain the total stack output characteristicvariables against the load current.
For the following results, the tests correspond to the use of aBallard Mark V PEMFC stack, consisting of an association of35 cells, with an active area for each cell of 232 cm , with apower of 5 kW at 960 mA/cm . The capacitor used to evaluatethe dynamic response is of 3 F [9]. The other parameters are thesame as those described in Table I. In agreement with the modeldescribed in Section III, the partial pressures of hydrogen andoxygen influence the resulting stack voltage. In the simulationsthat follow, air was used as the oxydizer and, then, the partialpressure of oxygen becomes 0.2095 atm [9].
Fig. 6 depicts the load current for test of a partial load in-sertion followed by load rejection. Initially, the stack supplies50 A to the load; after 3 s of simulation, the current is increasedto 150 A, and remains at this value until the simulation timereaches 7 s. Finally, the load current is decreased again to 50 A,until the end of the simulation s .
Fig. 8. Stack power for partial load insertion and rejection test.
Fig. 9. Stack efficiency for partial load insertion and rejection test.
Fig. 7 presents the curve of the resulting voltage. It can be no-ticed that there is a response attenuated as much in the insertionas in the load rejection, as expected. The values of the voltageare 30.70 V before the load increase, 25.83 V during the loadpulse and, again, 30.70 V when the current is decreased. Thesevalues are obtained after having ceased the transient regime.Fig. 8 presents the power response. A peak can be observed atthe load insertion instant, with a maximum value of 4.36 kW.When the load is decreased, the power presents a minimumvalue of 1.37 kW. The power steady-state value is 1.53 kW fora current of 50 A and 3.87 kW for a current of 150 A.
The stack efficiency is shown in Fig. 9. The behavior is similarto the voltage, since these are directly related. The steady-statevalues for the efficiency are 56.2% for a current of 50 A and47.3% for a current of 150 A. It can be noticed that there isa significant reduction in the efficiency for variations of the de-manded current, which should be taken into consideration whenone evaluates a certain system.
V. MODELING OF AN SR-12 MODULAR PEM GENERATOR
The SR-12 Modular PEM Generator, manufactured by AvistaLaboratories, is a modular FC stack, which has some character-istics adequate for use in electrical generation systems [10]. Re-cently, the Colorado School of Mines received one SR-12 Mod-ular PEM Generator, with a rated power of 500 W. The dataprovided by Avista Laboratories for the SR-12 stack was usedto match the model proposed in this paper. The procedure to ob-tain the parameters for this specific stack is as follows.
CORRÊA et al.: ELECTROCHEMICAL-BASED FC MODEL SUITABLE FOR ELECTRICAL ENGINEERING AUTOMATION APPROACH. 1109
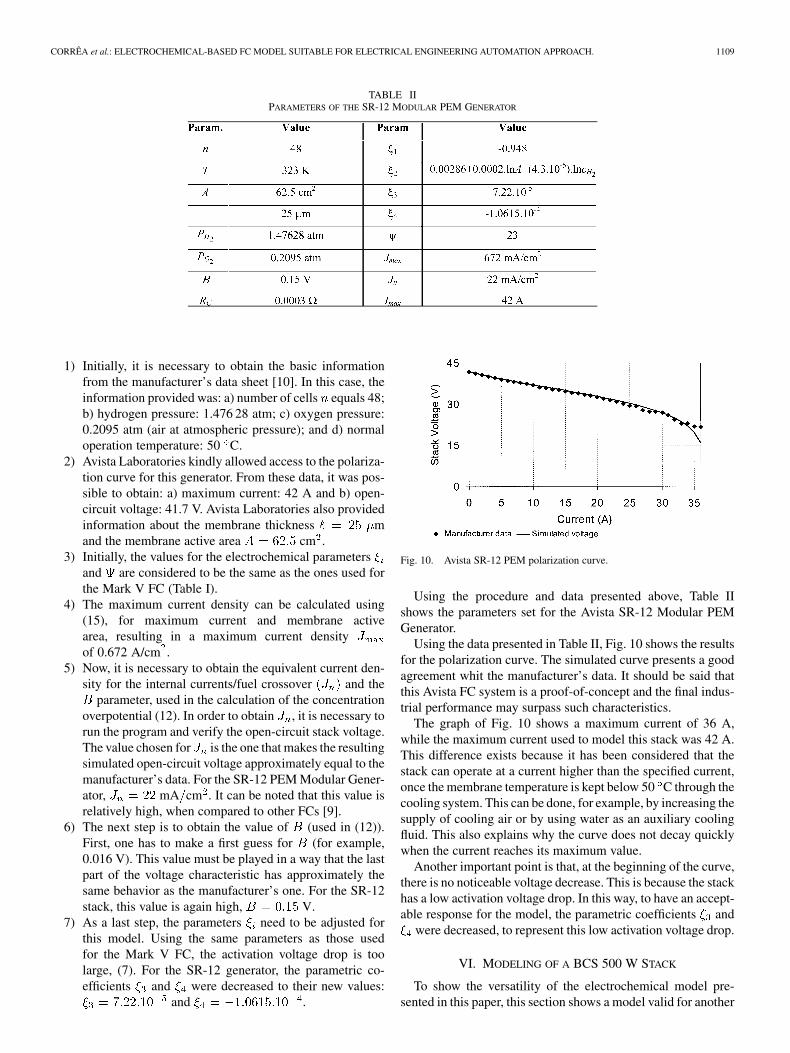
TABLE IIPARAMETERS OF THE SR-12 MODULAR PEM GENERATOR
1) Initially, it is necessary to obtain the basic informationfrom the manufacturer’s data sheet [10]. In this case, theinformation provided was: a) number of cells equals 48;b) hydrogen pressure: 1.476 28 atm; c) oxygen pressure:0.2095 atm (air at atmospheric pressure); and d) normaloperation temperature: 50 C.
2) Avista Laboratories kindly allowed access to the polariza-tion curve for this generator. From these data, it was pos-sible to obtain: a) maximum current: 42 A and b) open-circuit voltage: 41.7 V. Avista Laboratories also providedinformation about the membrane thickness mand the membrane active area cm .
3) Initially, the values for the electrochemical parametersand are considered to be the same as the ones used forthe Mark V FC (Table I).
4) The maximum current density can be calculated using(15), for maximum current and membrane activearea, resulting in a maximum current densityof 0.672 A/cm .
5) Now, it is necessary to obtain the equivalent current den-sity for the internal currents/fuel crossover and the
parameter, used in the calculation of the concentrationoverpotential (12). In order to obtain , it is necessary torun the program and verify the open-circuit stack voltage.The value chosen for is the one that makes the resultingsimulated open-circuit voltage approximately equal to themanufacturer’s data. For the SR-12 PEM Modular Gener-ator, mA cm . It can be noted that this value isrelatively high, when compared to other FCs [9].
6) The next step is to obtain the value of (used in (12)).First, one has to make a first guess for (for example,0.016 V). This value must be played in a way that the lastpart of the voltage characteristic has approximately thesame behavior as the manufacturer’s one. For the SR-12stack, this value is again high, V.
7) As a last step, the parameters need to be adjusted forthis model. Using the same parameters as those usedfor the Mark V FC, the activation voltage drop is toolarge, (7). For the SR-12 generator, the parametric co-efficients and were decreased to their new values:
and .
Fig. 10. Avista SR-12 PEM polarization curve.
Using the procedure and data presented above, Table IIshows the parameters set for the Avista SR-12 Modular PEMGenerator.
Using the data presented in Table II, Fig. 10 shows the resultsfor the polarization curve. The simulated curve presents a goodagreement whit the manufacturer’s data. It should be said thatthis Avista FC system is a proof-of-concept and the final indus-trial performance may surpass such characteristics.
The graph of Fig. 10 shows a maximum current of 36 A,while the maximum current used to model this stack was 42 A.This difference exists because it has been considered that thestack can operate at a current higher than the specified current,once the membrane temperature is kept below 50 C through thecooling system. This can be done, for example, by increasing thesupply of cooling air or by using water as an auxiliary coolingfluid. This also explains why the curve does not decay quicklywhen the current reaches its maximum value.
Another important point is that, at the beginning of the curve,there is no noticeable voltage decrease. This is because the stackhas a low activation voltage drop. In this way, to have an accept-able response for the model, the parametric coefficients and
were decreased, to represent this low activation voltage drop.
VI. MODELING OF A BCS 500 W STACK
To show the versatility of the electrochemical model pre-sented in this paper, this section shows a model valid for another
1110 IEEE TRANSACTIONS ON INDUSTRIAL ELECTRONICS, VOL. 51, NO. 5, OCTOBER 2004
TABLE IIIPARAMETERS OF THE 500-W BCS STACK
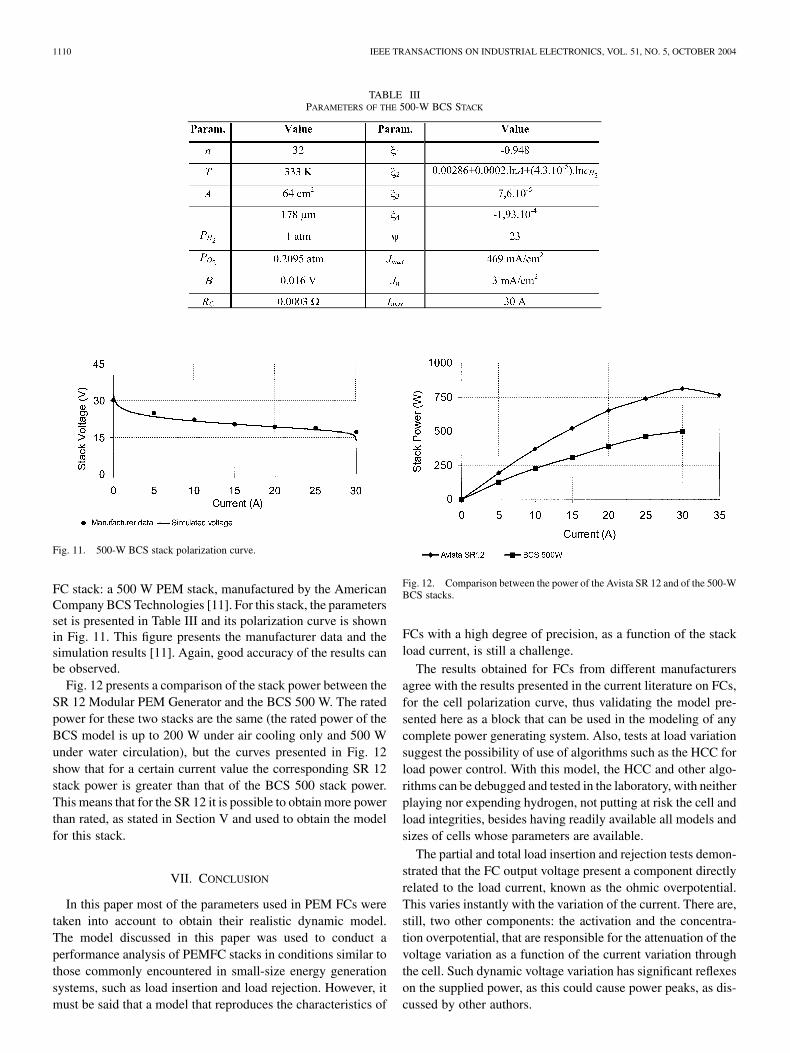
Fig. 11. 500-W BCS stack polarization curve.
FC stack: a 500 W PEM stack, manufactured by the AmericanCompany BCS Technologies [11]. For this stack, the parametersset is presented in Table III and its polarization curve is shownin Fig. 11. This figure presents the manufacturer data and thesimulation results [11]. Again, good accuracy of the results canbe observed.
Fig. 12 presents a comparison of the stack power between theSR 12 Modular PEM Generator and the BCS 500 W. The ratedpower for these two stacks are the same (the rated power of theBCS model is up to 200 W under air cooling only and 500 Wunder water circulation), but the curves presented in Fig. 12show that for a certain current value the corresponding SR 12stack power is greater than that of the BCS 500 stack power.This means that for the SR 12 it is possible to obtain more powerthan rated, as stated in Section V and used to obtain the modelfor this stack.
VII. CONCLUSION
In this paper most of the parameters used in PEM FCs weretaken into account to obtain their realistic dynamic model.The model discussed in this paper was used to conduct aperformance analysis of PEMFC stacks in conditions similar tothose commonly encountered in small-size energy generationsystems, such as load insertion and load rejection. However, itmust be said that a model that reproduces the characteristics of
Fig. 12. Comparison between the power of the Avista SR 12 and of the 500-WBCS stacks.
FCs with a high degree of precision, as a function of the stackload current, is still a challenge.
The results obtained for FCs from different manufacturersagree with the results presented in the current literature on FCs,for the cell polarization curve, thus validating the model pre-sented here as a block that can be used in the modeling of anycomplete power generating system. Also, tests at load variationsuggest the possibility of use of algorithms such as the HCC forload power control. With this model, the HCC and other algo-rithms can be debugged and tested in the laboratory, with neitherplaying nor expending hydrogen, not putting at risk the cell andload integrities, besides having readily available all models andsizes of cells whose parameters are available.
The partial and total load insertion and rejection tests demon-strated that the FC output voltage present a component directlyrelated to the load current, known as the ohmic overpotential.This varies instantly with the variation of the current. There are,still, two other components: the activation and the concentra-tion overpotential, that are responsible for the attenuation of thevoltage variation as a function of the current variation throughthe cell. Such dynamic voltage variation has significant reflexeson the supplied power, as this could cause power peaks, as dis-cussed by other authors.

CORRÊA et al.: ELECTROCHEMICAL-BASED FC MODEL SUITABLE FOR ELECTRICAL ENGINEERING AUTOMATION APPROACH. 1111
The characteristics outlined in this paper should be taken intoaccount during the design stage of FC energy generation sys-tems. It would permit one to conclude the need for other sourcesof energy necessary to attenuate the effects of the abrupt varia-tions of power, since these could damage the cells temporarilyor permanently.
For injection of energy into the grid and driving larger loads,this power characteristic imposes the use of power converters toelevate and to control the voltage across the cell terminals andthe power supplied to the load.
Using a simple procedure and data obtained from the manu-facturer and from the literature, it is possible to obtain a modelfor an FC stack, whose resulting characteristic is similar to thereal system. For example, the results obtained for the SR-12PEM Modular Generator, for the Ballard Mark V, and for the500 W BCS stack presented good agreement with their manu-facturer’s data. In this way, the model for these stacks could beused to analyze the behavior of actual stacks in FC generationsystems.
ACKNOWLEDGMENT
The authors extend special thanks to J. R. Gomes,J. B. Parizzi, and A. S. Padilha for their help with thiswork. The authors also recognize and appreciate the strongsupport from the Federal University of Santa Maria for allowingall of the tests to be performed in their laboratories (LHIPAE,NUDEMI, and NUPEDEE) and the facilities of the EngineeringDivision, Colorado School of Mines. The cooperation and en-couragement received from Avista Laboratories, especiallyfrom P. Christensen and F. Ignazzitto, were also very importantfor corroborating the model presented in this paper.
REFERENCES
[1] R. F. Mann, J. C. Amphlett, M. A. I. Hooper, H. M. Jensen, B. A. Pep-pley, and P. R. Roberge, “Development and application of a general-ized steady-state electrochemical model for a PEM fuel cell,” J. PowerSources, vol. 86, pp. 173–180, 2000.
[2] J. J. Baschuck and X. Li, “Modeling of polymer electrolyte membranefuel cells with variable degrees of water flooding,” J. Power Sources, vol.86, pp. 181–196, 2000.
[3] J. C. Amphlett, R. F. Mann, B. A. Peppley, P. R. Roberge, and A. Ro-drigues, “A model predicting transient responses of proton exchangemembrane fuel cells,” J. Power Sources, vol. 61, pp. 183–188, 1996.
[4] P. Famouri and R. Gemmen, “PEM fuel cell electric circuit model,” pre-sented at the Power Electronics for Fuel Cells Workshop, Nat. Fuel CellsRes. Center, Univ. California, Irvine, CA, Aug. 8–9, 2002.
[5] F. A. Farret, J. R. Gomes, and A. S. Padilha, “Comparison of thehill climbing methods used in micro powerplants,” in Proc. IEEEINDUSCON 2000, Porto Alegre, Brazil, pp. 756–760.
[6] J. Padullés, G. W. Ault, and J. R. McDonald, “An integrated SOFC plantdynamic model for power systems simulation,” J. Power Sources, vol.86, pp. 495–500, 2000.
[7] D. Chu and R. Jiang, “Performance of polymer electrolyte membranefuel cell (PEMFC) stacks—Part I. Evaluation and simulation of anair-breathing PEMFC stack,” J. Power Sources, vol. 83, pp. 128–133,1999.
[8] Y. Kim and S. Kim, “An electrical modeling and fuzzy logic control ofa fuel cell generation system,” IEEE Trans. Energy Conversion, vol. 14,pp. 239–244, June 1999.
[9] J. E. Larminie and A. Dicks, Fuel Cell Systems Explained. Chichester,U.K.: Wiley, 2000, pp. 308–308.
[10] SR-12 Modular PEM Generator Operator’s Manual, Last Revised7/2000; Revision 0000, Avista Laboratories, Spokane, WA, July 2000.
[11] “Data sheet of a 500 W fuel cell stack,” BCS Technologies, Englewood,CO, 2001.
Jeferson M. Corrêa (S’95) was born in Augusto Pes-tana, Brazil, in 1972. He received the B.Sc. degree inelectrical engineering in 1997 and the M.Sc. degreein 2002 from the Federal University of Santa Maria,Santa Maria, Brazil, where he is working toward thePh.D. degree.
He is currently conducting research at the Col-orado School of Mines, Golden, working withintegration of renewable energy sources and withpower quality improvement. His employment expe-rience includes the companies General Motors do
Brasil Ltda, Philip Morris Brasil SA, and WEG Automação Ltda, where hewas a Manufacturing and Maintenance Engineer, mainly developing factoryautomation systems and predictive and preventive maintenance coordination.His research interests include control systems, renewable energy sources,modeling and simulation, industrial automation, and power electronics.
Mr. Corrêa has received several academic awards, as well as awards fromthe Brazilian agency CACISM and the Brazilian company CRT. He has alsoreceived awards for conference paper presentations and an IEEE Student TravelGrant to attend the 37th Annual Meeting of the IEEE Industry ApplicationsSociety held in Pittsburgh, PA, in 2002.
Felix A. Farret received the B.E. and M.Sc. degreesin electrical engineering from the Federal Univer-sity of Santa Maria, Santa Maria, Brazil, in 1972and 1986, respectively, the M.Sc. degree from theUniversity of Manchester, Manchester, U.K., andthe Ph.D. degree from the University of London,London, U.K.
Since 1974, he has taught in the Department ofElectronics and Computation, Federal Universityof Santa Maria. He works in an interdisciplinaryeducational background related to power electronics,
power systems, nonlinear controls, and renewable energy conversion. He iscurrently committed to undergraduate- and graduate-level teaching and toresearch activities. Energy engineering systems for industrial applications arepart of his current focus. In more recent years, he coordinated several techno-logical processes in renewable sources of energy which were transferred toBrazilian enterprises such as AES-South Energy Distributor, Hydro ElectricalPower Plant Generation of Nova Palma, and CCE Power Control EngineeringLtd. related to integration of micro power plants from distinct primary sources;voltage and speed control by the load for induction generators; low-powerPEM fuel cell applications and model development. Injection of electricalpower into to the grid is currently his major interest. In Brazil, he has beendeveloping several intelligent systems for industrial applications related toinjection, location, and sizing of renewable sources of energy for distributionand industrial systems including fuel cells, hydropower, wind power, photo-voltaic applications, and other ac–ac and dc–ac links. He is the author of Useof Small Sources of Electrical Energy (Santa Maria, Brazil: Federal Univ. ofSanta Maria Press, 1999) (in Portuguese). He has been a Visiting Professor atthe Colorado School of Mines, Golden.

1112 IEEE TRANSACTIONS ON INDUSTRIAL ELECTRONICS, VOL. 51, NO. 5, OCTOBER 2004
Luciane N. Canha graduated in electrical engi-neering and received the M.S. degree in 1994 and1996, respectively, from the Federal University ofSanta Maria, Santa Maria, Brazil, where she is cur-rently working toward the Ph.D. degree in electricalengineering.
She has been an Assistant Professor of ElectricalEngineering at the Federal University of Santa Mariasince 1997. Her research interests include fuel cells,distributed generation, and distribution system anal-ysis and operation.
Marcelo G. Simões (S’89–M’95–SM’98) receivedthe B.S. and M.Sc. degrees in electrical engineeringfrom the University of São Paulo, São Paulo, Brazil,in 1985 and 1990, respectively, the Ph.D. degree inelectrical engineering from the University of Ten-nessee, Knoxville, in 1995, and the Livre-Docencia(D.Sc.) degree in mechanical engineering from theUniversity of São Paulo, in 1998.
He joined the faculty of Colorado School of Mines,Golden, in 2000 and has been working to establishresearch and education activities in the development
of intelligent control for high-power electronics applications in renewable anddistributed energy systems.
Dr. Simões is a recipient of a National Science Foundation (NSF)—Fac-ulty Early Career Development (CAREER) Award, which is the NSF’smost prestigious award for new faculty members, recognizing activities ofteacher/scholars who are considered most likely to become the academicleaders of the 21st century. He is serving as the IEEE Power Electronics SocietyIntersociety Chairman, as Associate Editor for Energy Conversion, as wellas Editor for Intelligent Systems, of the IEEE TRANSACTIONS ON AEROSPACE
AND ELECTRONIC SYSTEMS, and as Associate Editor for Power Electronicsand Drives of the IEEE TRANSACTIONS ON POWER ELECTRONICS. He hasbeen actively involved in the Steering and Organization Committee of theIEEE/DOE/DOD 2005 International Future Energy Challenge.