Leukocytic-Vascular Endothelial Growth Factor and Integrin ...

Biophysical Journal Volume 85 December 2003 3951–3962 3951
FRET Detection of Cellular a4-Integrin Conformational Activation
Alexandre Chigaev,* Tione Buranda,* Denise C. Dwyer,* Eric R. Prossnitz,y and Larry A. Sklar**Department of Pathology and Cancer Center, and yDepartment of Cell Biology and Physiology, University of New MexicoHealth Sciences Center, Albuquerque, New Mexico
ABSTRACT Integrins are cell adhesion receptors, expressed on every cell type, that have been postulated to undergoconformational changes upon activation. Here, different affinity states were generated by exposing a4-integrins to divalent ionsor by inside-out activation using a chemokine receptor. We probed the dynamic structural transformation of the integrin on livecells using fluorescence resonance energy transfer (FRET) between a peptide donor, which specifically binds to the a4-integrin,and octadecyl rhodamine B acceptors incorporated into the plasma membrane. We analyzed the data using a model thatdescribes FRET between a random distribution of donors and acceptors in an infinite plane. The distance of closest approachwas found to vary with the affinity of the integrin. The change in distance of closest approach was ;50 A between resting andMn21 activated receptors and;25 A after chemokine activation. We used confocal microscopy to probe the lateral organizationof donors and acceptors subsequent to integrin activation. Taken together, FRET and confocal results suggest that changesin FRET efficiencies are primarily due to the vertical extension of the integrin. The coordination between the extension ofa4-integrin and its affinity provides a mechanism for Dembo’s catch-bond concept.
INTRODUCTION
Integrins are cell surface receptors, expressed by all multi-
cellular animals, that mediate cell-matrix, cell-cell, and cell-
pathogen interactions. Integrins participate in a large number
of physiological processes including tissue morphogenesis,
inflammatory recruitment of leukocytes, blood coagulation,
wound healing, and others (Humphries, 2000; Hynes, 1992;
Shimaoka et al., 2002). A remarkable feature of integrins in
comparison to other adhesion molecules is that their ability
to bind ligand can be regulated by intracellular signaling.
Regulation of integrin function can be evaluated by changes
in the avidity (adhesive properties) of a cell (Shimaoka et al.,
2002). Several different mechanisms, including rapid change
in the conformation (affinity modulation), clustering, and
association with cytoskeletal elements have been proposed to
explain the functional responses (Bazzoni and Hemler, 1998;
Diamond and Springer, 1994; Dustin and Springer, 1989;
Faull et al., 1994; Loftus et al., 1994; Stewart and Hogg,
1996; Van Kooyk et al., 1999).
Over the last decade, conformational changes within
integrin family members have been detected using mAbs that
recognize activation-dependent epitopes (Lu et al., 2001;
Bazzoni and Hemler, 1998), electron microscopy with
aIIbb3-integrin (Du et al., 1993), or using the change in the
affinity for ligand of the a4-integrin (Chen et al., 1999b).
Cell activation may also lead to changes in the topography of
integrins on the cell surface (Bazzoni et al., 1998). In
electron micrographs, integrin molecules (a5b1, aIIbb3)
appeared as a round headpiece on a long stalk region
(Nermut et al., 1988; Du et al., 1993; Takagi et al., 2001).
X-ray crystallography of aVb3 revealed a bent conformation,
in which the headpiece is folded over the tailpiece and each
integrin ‘‘leg’’ is bent at its ‘‘knee’’ (Xiong et al., 2001). It
has been proposed that an ‘‘unusual flexibility’’ of the
molecule ‘‘may be linked to integrin regulation’’ (Xiong
et al., 2001). A nuclear magnetic resonance study of the Cys-
rich module-3 of the integrin b2 subunit (not resolved by
crystal structure) and the subsequent modeling of the I-EGF
domains of aVb3 have demonstrated that epitopes for mAbs
that are buried in the bent conformation become exposed
after activation of the integrin (Beglova et al., 2002). Based
on such data, it has been proposed that the bent conforma-
tion represents an inactive integrin state and that activation
is accompanied by a ‘‘switchblade-like’’ opening of the
integrin (Shimaoka et al., 2002; Beglova et al., 2002).
The a4b1-integrin is unique among the leukocyte integrins
in that it supports both rolling and firm adhesive interactions
(Alon et al., 1995; Chen et al., 1999a). The relationship
between the molecular affinity for ligands, the adhesive
avidity for cell attachment, molecular conformation, and
lateral organization is therefore of particular interest for this
integrin class. An adhesion-dependent conversion among
states of different avidity has been previously predicted for
integrins from theoretical considerations and described as
the catch-bond concept (Dembo et al., 1988). This work
represents the first systematic attempt to evaluate the
relationship between integrin affinity and conformation on
live cells, using fluorescence techniques to resolve vertical
and lateral contributions.
Here, we used flow cytometry and fluorescence resonance
energy transfer (FRET) to probe the dynamic structural
transformation of the integrin in response to divalent cations
and cell stimulation. We used a fluorescent peptide derivative
that specifically binds to a4-integrin (Chigaev et al., 2001) as
a donor and octadecyl rhodamine B (R18) as an acceptor. We
Submitted February 27, 2003, and accepted for publication August 14,2003.
Alexandre Chigaev and Tione Buranda contributed equally to this work.
Address reprint requests to Prof. Larry A. Sklar, Dept. of Pathology and
Cancer Center, University of New Mexico HSC, Albuquerque, NM 87131.
Tel.: 505-272-6892; Fax: 505-272-6995; E-mail: [email protected].
� 2003 by the Biophysical Society
0006-3495/03/12/3951/12 $2.00

interpreted acceptor surface density, and transfer in terms of
separation distances (Wolber and Hudson, 1979). We found
that the separation distance between the binding sites of the
integrin molecule and membrane surface depends on the
affinity state of the integrin, generated using divalent cations.
Replacing Ca21with Mn21 resulted in an apparent extension
of ;50 A. In addition, the human monoblastoid cell line
U937 transfected with wild-type and mutant formyl peptide
receptor (Kew et al., 1997) showed an effect of ‘‘inside-out’’
signaling on integrin conformation. The changes in the
efficiency of FRET and affinity were intermediate to the
maximal ion-induced changes, and the time course of these
changes coincided with the dynamics of the affinity changes
described elsewhere (Chigaev et al., 2001, 2003). With
confocal microscopy we verified that the lateral distribution
of the integrin and the acceptor molecules was not detectably
altered by any of the cell treatments.
MATERIALS AND METHODS
Cell lines and transfectant construct
The human monoblastoid U937 cell line was purchased from ATCC
(Rockville, MD). Site-directed mutants of formyl peptide receptor (FPR) in
U937 cells were prepared as described (Kew et al., 1997).
Probes for FRET
Octadecyl rhodamine B chloride (R18) and 5-octadecanoylaminofluorescein
(F18) were from Molecular Probes (Eugene, OR).
Fluorescently labeled peptides
The a4 specific peptide derivative (Chen et al., 1999a,b) 4-((n9-2-methylphenyl)ureido)-phenylacetyl-L-leucyl-L-aspartyl-L-valyl-L-prolyl-
L-alanyl-L-alanyl-L-lysine (LDV peptide derivative) and its FITC-conju-
gated analog were synthesized at Commonwealth Biotechnologies (Rich-
mond, VA). fNle-Leu-Phe-Nle-Tyr-Lys-Alexa633 was synthesized as
follows. Alexa Fluor 633 carboxylic acid succinimidyl ester (Molecular
Probes) and fNle-Leu-Phe-Nle-Tyr-Lys (Sigma, St. Louis, MO) were each
dissolved in anhydrous dimethyl sulfoxide to 2 mM. Equal volumes were
incubated at room temperature overnight with 100 mM TEA and the product
used without further purification.
Flow cytometry
Cell- and bead-based fluorescence measurements were performed on
a Becton-Dickinson FACScan flow cytometer (Sunnyvale, CA) interfaced
to a Power PC Macintosh using the CellQuest software package. The
FACScan is equipped with a 15-mW air-cooled argon ion laser. The laser
output is fixed at 488 nm.
Equilibrium binding of LDV-FITC to a4b1-integrinson cells
The detailed analysis of LDV-FITC binding was described previously
(Chigaev et al., 2001, 2003). Cells were treated with a range of con-
centrations of the fluorescent ligand (typically 0–12 nM) in the presence of
divalent cations (1 mM Mn21, 1 mM Mn21 11 mM Ca21, and 1 mM
Ca21). Nonspecific binding was determined using 500-fold excess unlabeled
peptide. All experiments were performed in HEPES buffer (110 mM NaCl,
10 mM KCI, 10 mM glucose, 1 mM MgCl2, and 30 mM HEPES, pH 7.4)
containing 0.1% HSA. U937 cells were used at a density of 1 3 106 cells/
ml). Incubations have been performed for short times at 378C and overnight
on ice with qualitatively similar results. Analysis was performed on the
FACScan by acquiring 5000–10,000 events. Thus, mean channel fluores-
cence (MCF) values for specific and nonspecific binding were obtained for
each ligand concentration; the difference between the two, (DMCF)
represents specific binding. Dissociation constants (Kd) were calculated
using a single site (hyperbolic) binding equation from measurements of the
site concentration, site occupancy, and free ligand (curve fits were performed
using GraphPad Prism (San Diego, CA). It is worth noting that calibration
methods are available to convert MCF into site numbers (Chigaev et al.,
2003).
Kinetic analysis of binding and dissociation
Kinetic analysis was done as described previously (Chigaev et al., 2001,
2003). Briefly, cells (1 3 106 cells/ml) were preincubated in HEPES buffer
with the specified concentrations of divalent cations for 10–30 min at 378C.Samples were analyzed for 30–120 s to establish a baseline, then the
fluorescent ligand was added, and FACS acquisition was immediately re-
established, losing 5–10 s of the total time course. The resulting data were
converted to mean channel fluorescence over time using FACSQuery
software developed by Bruce Edwards.
Fluorescence resonance energy transfer
General considerations
Fluorescence resonance energy transfer (FRET) is a distance-dependent
interaction between the electronic excited states of two chromophores in
which excitation is transferred from an excited donor (D*) molecule (e.g.,
fluorescein) to an acceptor (A) molecule (e.g., rhodamine) without emission
of a photon. The characteristic distance at which the donor fluorescence and
FRET are equally probable is defined as R0. On a surface, the efficiency of
FRET is determined from the reduction in the emission quantum yield of the
donor according to Eq. 1, where QD refers to the emission yield of the donor
in the absence of acceptors, andQDA refers to the donor emission yield in the
presence of acceptors expressed in terms of acceptors per unit area as
acceptors/R20 (Wolber and Hudson, 1979),
E ¼ 1� QDA
QD
: (1)
R0 is calculated according to
R0 ¼ ðJQDk2=n
4Þ1=6ð9:793 103AÞ; (2)
where J is the donor-acceptor spectral overlap in cm3 M�1 and n is the
refractive index (1.333) of the medium. k2 is the dipole-dipole orientation
factor (usually taken as 2/3) (Lakowicz, 1999). However, for randomized
static orientations of donors and acceptors, k2 ¼ 0.476. In the case of LDV-
FITC immobilized by VLA-4 and R18 embedded in the membrane,
a combination of dynamic and static factors are likely in place.
Energy transfer in two dimensions
Energy transfer data were analyzed by expressions that describe energy
transfer between random distributions of donors and acceptors on lipid
membrane surfaces (Dewey and Hammes, 1980; Doody et al., 1983; Fung
and Stryer, 1978; Sklar et al., 1980; Wolber and Hudson, 1979). We have
used two approaches that will be described below. The first approach
(Wolber and Hudson, 1979) involves the calculation of the distance of
3952 Chigaev et al.
Biophysical Journal 85(6) 3951–3962
closest approach (rc) between randomly distributed donors and acceptors on
an infinite plane and is described by a simple series approximation, as
QDA
QD
¼ A1e�k1c 1A2e
�k2c; (3)
where
c ¼ acceptors=R2
0; (4)
and where R0 ¼ 55 A (Haugland, 2002). The values of A1, k1, A2, and k2were taken from Table 1 in Wolber and Hudson and correspond to the exact
solution to the series approximation for different values of rc expressed as
a function of R0. It is important to note that the values of k2 for rc/R0 ¼ 1.1
and 1.3 in the original reference (Wolber and Hudson, 1979) have been
recently corrected from 0.4654 and 0.5633, to 0.04654 and 0.005633,
respectively (see Table 15.2 in Lakowicz, 1999). This approach is valid for
0\ c\ 0.5 and when the distance of closest approach is\1.3 R0. Outside
this range FRET is significantly overestimated. Thus the second approach of
Dewey and Hammes is complementary to the Wolber and Hudson method
in that it can be used to account for energy transfer in the range spanning
0.7 R0 \ rc \ 2 R0 (Dewey and Hammes, 1980). The formulation of
Dewey and Hammes assumes that donors and acceptors are uniformly
distributed on parallel planes, separated by a distance L. However, the pos-sibility of an excluded volume around the donor is not accounted for, thus L
is nominally equivalent to the distance of closest approach (rc) in Eq. 3.
Because the limiting values of rc examined in this work were on the order
of R0 or less, the data were analyzed using the Wolber and Hudson ap-
proach. Thus the Dewey and Hammes method will not be discussed further,
although it is worth noting that, for similar ranges of 1 # R0 and 0.5 # c,
these methods give similar results.
FRET experimental design
The excited state donors used in this work are the LDV-FITC peptide and
F18, whereas the acceptor is R18. The effective use of these probes in our
experiments requires that they have similar spectral characteristics, so as to
yield similar values of R0. The values of R0 for the set of donor-acceptor
pairs used here were derived from calculation of the overlap integral J in
buffer solution. The respective values of J were of the same magnitude (1.57
3 10�13 cm�3 M�1). The derived values of R0 were determined to be 52 and
55 A, for k2 ¼ 0.476 and 0.667, respectively.
To characterize the distance of closest approach between the integrin
headgroup and the lipid membrane, we used the a4 specific ligand, LDV-
FITC, as a FRET donor with octadecyl rhodamine B chloride (R18)
lipophilic probe as an acceptor. U937 cells were preincubated with 50–100
nM LDV-FITC. Samples were incubated with different concentrations of
R18 (up to 20 mM) for 1 min and then donor intensities were measured using
the FACScan flow cytometer at 378C. To characterize lateral energy transfer
on the cells we used 5-octadecanoylaminofluorescein (F18) as the donor
probe (1 mM, 1-min incubation time). The surface calibration experiments
were performed at temperatures at \158C to minimize the uptake of the
donor (F18) probe and were performed in parallel with 1 mM Ca21 LDV-
FITC treated cells.
For real-time FRET experiments, U937 cells were stably transfected with
the wild-type or the nondesensitizing mutant (DST) of the formyl peptide
receptor. The U937 cells were preincubated with 50–100 nM LDV-FITC
(to saturate low affinity sites of the integrin) in HHB buffer containing
1.5 mM CaCl2 and 1 mM MgCl2. Flow cytometric analysis was performed
continuously for up to 1000 s. Samples were analyzed for 60–120 s to
establish a baseline, then saturating R18 (10 mM final) was added to yield
maximal quenching. One minute after R18 was added, fMLFF peptide (0.1
mM) was added. FACS acquisition was immediately re-established, losing
5–10 s of the total time course. The cells were also tested using low (3–5
nM) concentration of LDV-FITC to determine the affinity change (Chigaev
et al., 2001).
Confocal microscopy
U937 cells were washed once with 0.5 mM EDTA and resuspended in
preheated (378C) HEPES buffer containing 0.1% HSA and the specified
concentrations of divalent cations. A total of 2 3 106 cells/ml were stained
for 5–15 min at 378C with 50–100 nM LDV-FITC or 1–5 min with 1 mM
R18. The control sample was removed and immediately fixed in ice-cold 2%
paraformaldehyde. For activation experiments cells were stimulated with 20
nM fNle-Leu-Phe-Nle-Tyr-Lys-Alexa633 peptide (Molecular Probes).
Samples were collected at 0, 30, 180, and 300 s after addition of the formyl
peptide and immediately fixed with 2% ice-cold paraformaldehyde then
stored overnight at 48C. The following day cells were washed with ice-cold
PBS and resuspended in Vectashield (Vector Laboratories, Burlingame,
CA). Fluorescence microscopy was performed with confocal microscope
(Zeiss 510 Laser Scanning Microscope) using the 633 1.4 DIC oil
immersion objective lens, and laser excitation at 488, 543, and 633 nm. The
surface distribution of receptors and fluorescent molecules was quantified
with LSM 510 image analysis software. Minimal fluorescence was detected
when cells were unstained or blocked with 500-fold excess of the unlabeled
LDV peptide derivative.
RESULTS
Different affinity states of the integrin detectedusing small fluorescent ligand
Different affinity states of the integrin were generated using
combinations of divalent cations or using inside-out
signaling through G-protein coupled receptors (see Integrin
Conformation is Regulated by Inside-Out Signaling). States
of different affinity for the LDV-peptide exhibit homoge-
neous dissociation rate constants indicative of individual
conformations (Table 1 and (Chigaev et al., 2001). This
ligand competes for the same binding site as the natural
ligand (Chigaev et al., 2001; Chen et al., 1999b). Mn21 is
usually used to generate a high affinity state while Ca21
stabilizes a low affinity conformation (Chen et al., 1999b; Hu
et al., 1996; Humphries, 1996; Mould et al., 1995). We used
three different combinations of Ca21 and Mn21 (1 mM
Mn21, 1 mM Mn21 1 1 mM Ca21, and 1 mM Ca21) to
generate different affinities of the integrin as described in
Materials and Methods (see Equilibrium Binding of LDV-
FITC to a4b1-Integrins on Cells; and Kinetic Analysis of
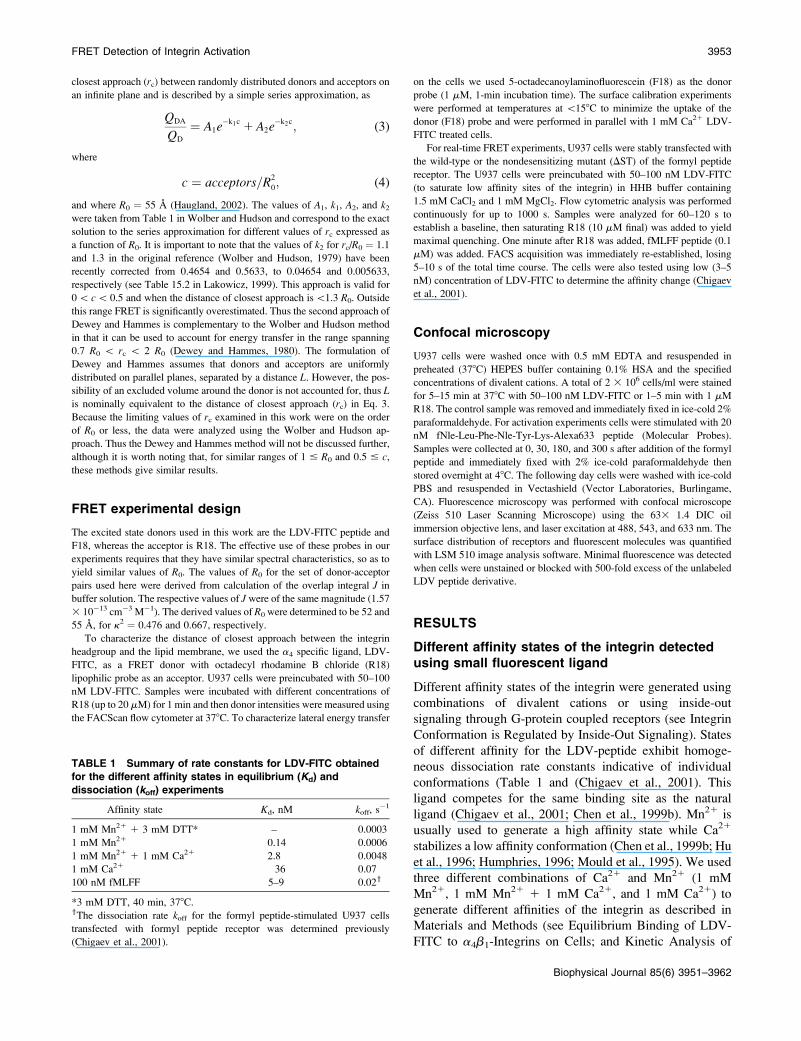
TABLE 1 Summary of rate constants for LDV-FITC obtained
for the different affinity states in equilibrium (Kd) and
dissociation (koff) experiments
Affinity state Kd, nM koff, s�1
1 mM Mn21 1 3 mM DTT* – 0.0003
1 mM Mn21 0.14 0.0006
1 mM Mn21 1 1 mM Ca21 2.8 0.0048
1 mM Ca21 36 0.07
100 nM fMLFF 5–9 0.02y
*3 mM DTT, 40 min, 378C.yThe dissociation rate koff for the formyl peptide-stimulated U937 cells
transfected with formyl peptide receptor was determined previously
(Chigaev et al., 2001).
FRET Detection of Integrin Activation 3953
Biophysical Journal 85(6) 3951–3962

Binding and Dissociation). With this protocol we were able
to generate affinity states which spanned [2 orders of
magnitude in the affinity of the a4-integrin as measured by
LDV-FITC binding and dissociation (Table 1). The dis-
sociation constants (Kd) were from 0.14 nM in a buffer
containing 1 mM Mn21 to 36 nM in a buffer containing
1 mM Ca21. The dissociation rates (koff) ranged from 0.0006
s�1 to 0.07 s�1, respectively. Having thus established the
conditions necessary for the generation of several affinity
states from equilibrium binding and dissociation experi-
ments, we turned to FRET measurements to characterize the
conformational state associated with a given affinity state.
The distance of closest approach betweenthe integrin ligand binding site (LDV-FITC)and the cell membrane probes (R18) dependson the affinity state of the integrin
Fig. 1 shows a schematic representation of the lateral
organization of plasma membrane, probes, and receptors.
Shown in the scheme is an integrin ab heterodimer that is
inactive and bent over, with the two cytoplasmic domains
closely apposed. Upon activation the integrin assumes an
extended upright conformation. Energy transfer between
lipophilic probes and the integrins bearing fluorescent
ligands provides a way of characterizing changes in the
conformational state of the integrin, including any concom-
itant changes in the lateral organization of the plasma
membrane. The fluorescent peptide (LDV-FITC) specifically
binds to the a4-integrin as a fluorescent donor and octadecyl
rhodamine B (R18) lipophilic probe functions as an acceptor.
Addition of octadecyl rhodamine B (R18) leads to the
incorporation of the lipid acceptor into the cell membrane,
which results in FRET between the LDV-FITC peptide and
R18. The efficiency of FRET was shown to depend on the
affinity state of the integrin.
Fig. 2 shows the quenching of donor fluorescence as
a function of the concentration of acceptor under different
ionic conditions. For the lowest affinity state (1 mM Ca21 in
buffer; curve, m, in Fig. 2), the efficiency of FRET reached
100% at maximum surface coverage of acceptors. At the
higher affinity states, the efficiency of FRET decreased to
values of 80% and 48% for the 1 mM Mn21 1 1 mM Ca21,
and 1 mM Mn21-containing buffers, respectively (curves, �,
and d, in Fig. 2).
Because the R18 membrane acceptor probe inserts into the
cell plasma membrane with an unknown partition co-
efficient, we must estimate its surface density. To calibrate
data from cells, the experimental values of acceptors per R20
were determined by overlaying the quenching of a fluores-
cein lipid donor (F18) and the R18 acceptor on the calculated
data from Wolber and Hudson. The experiments were
conducted in such a way (time and temperature) as to
minimize the redistribution of the two probes into in-
tracellular membranes. Specifically, the use of F18 as a donor
probe is complicated by the probe’s tendency to undergo
rapid flip-flop between the outer and inner leaflets as well as
getting internalized in cytosolic space. To avoid the problem
of flip-flop, we performed the calibration experiment using
the F18 at 158C. The results showed (Fig. 3 A) that the F18/R18 transfer and the LDV FITC/R18 transfer in the presence
of Ca21 to be equivalent to within experimental error. This
means that the separation distance of the resting integrin was
near 0 A. The data shown in Figs. 2 and 3 Bwere collected at
378C. We used the idea that the resting integrin was at the
same height at both 158C and 378C to calibrate the surface
density according to Wolber and Hudson and then overlaid
the rest of the data set for the other ionic conditions.
The formalism of Wolber and Hudson (1979) (see
Materials and Methods) was used to analyze the FRET data
in terms of donor-acceptor separation distances. FRET is
expressed in terms of relative donor emission (QDA/QD) as
a function of the surface coverage of acceptors per unit area
(acceptors per R20; where R0 for the fluorescein-rhodamine
pair is 55 A). The analysis provides insight both into the
surface density of acceptors and the distance of nearest
approach between donor and acceptors. The distance of
closest approach between the donor probe (LDV-FITC) and
R18 acceptor probes might be a reflection of several factors:
the size of a protein or conformation, the distance of the
donor above the membrane, or the presence of a boundary
lipid which excludes the acceptor. It is important to note that
the FRET analysis used here does not distinguish between
lateral and vertical separation distances. The consequences
FIGURE 1 Lateral organization of cellular plasma membrane and
receptors. An integrin ab heterodimer that is inactive and is bent over,
with the two cytoplasmic domains closely apposed. Upon activation the
integrin assumes an extended upright conformation. When activated, the
formyl peptide receptor is known to aggregate in punctate microdomains
believed to be lipid rafts. Energy transfer between lipid probes and receptors
bearing fluorescent ligands provides a way of studying lateral organization
and integrin conformation. The fluorescent peptide derivatives (LDV-FITC)
binds to the a4-integrin as a fluorescent donor. Octadecyl rhodamine B
(R18), a lipophilic probe, inserts into the membrane as an acceptor. (Adapted
from Vaz and Melo, 2001.)
3954 Chigaev et al.
Biophysical Journal 85(6) 3951–3962

of this limitation and applicability of this FRET model to our
analysis will be developed in the Discussion section.
Because the Wolber and Hudson model is only valid for
acceptor densities# 0.5 acceptors/R20; the analysis of the data
in Fig. 2 is truncated. Thus the derived data shown in Fig. 3
represents the analysis of the data shown in the box as limited
by the FRET model. Fig. 3 B shows the same treatment of
FRET data for the three divalent cation-regulated affinity
states. Whereas the lowest affinity state exhibits the highest
quenching, the higher affinity states exhibit less efficient
quenching (Table 2). Based on the calibration curve of Fig. 3
A and the calculated donor-acceptor distances from Wolber
and Hudson (1979), the lowest affinity state of the integrin
exhibits FRET similar to that expected if it were located
much less than R0 from the quencher, i.e., near the membrane
surface. The separation distance for the highest affinity
conformation is at a distance comparable to R0, whereas the
middle conformation lies at an intermediate distance.
For the various conditions under which FRET was
measured, it is useful to comment on the factors that may
affect the magnitude of R0. The components of R0 that might
be sensitive to changes in the affinity state are the donor
quantum yield and the orientation factor (QD and k2 in Eq. 2).Previous measurements showed that maximal ligand binding
FIGURE 2 Energy transfer measurements on cells between LDV-FITC
donor and R18 acceptor. (A) Fluorescent intensity measurements were made
as a function of R18 concentration under three different cation conditions
(1 mM Mn21, d; 1 mM Mn21 1 1 mM Ca21, �; and 1 mM Ca21, m).
Quenching data are plotted for total and nonspecific LDV-FITC binding
conditions. Nonspecific binding was determined by measuring fluorescence
associated with cells in the presence of a 500-fold excess of LDV unlabeled
peptide. The FRET data were obtained using U937 cells equilibrated with
100 nM of LDV-FITC with or without 50 mM LDV unlabeled peptide.
Samples were incubated with increasing concentrations of R18 (up to 20
mM) for 1 min and the green FITC fluorescence was measured using
a Becton-Dickinson FACScan flow cytometer (Sunnyvale, CA). Data are
plotted as mean channel fluorescence vs. concentration of R18. (B) The data
from Fig. 2 A replotted as relative donor fluorescence intensity versus R18
concentration for different affinity states of the a4b1-integrin. The values
corresponding to nonspecific binding were subtracted and the data were
normalized. One representative experiment out of five is shown. Data points
represent means6 SE of the mean. Because the Wolber and Hudson model
is only valid for acceptor densities of #0.5 acceptors/R20; the analysis of the
representative data in Fig. 2 is truncated. Thus the derived data shown in Fig.
3 represents the analysis of the data shown in the box as limited by the FRET
model.
FIGURE 3 Calibration of acceptor surface density and distance of
separation. The relative quantum yield, QDA/QD is plotted vs. acceptors/
R20 (Eq. 1) for randomly oriented donors and acceptors on lipid membranes.
QDA is the donor quantum yield in the presence of acceptors and QD is the
quantum yield in the absence of acceptors. (A) Determination of lateral
energy transfer as a function of acceptor surface density calculated according
to Wolber and Hudson (—). The FRET data corresponding to the F18/R18
membrane probes on U937 cells (n) and the LDV-FITC/R18 (�) at lowaffinity state of the integrin (1 mMCa21) are overlaid. (B) Energy transfer as
a function of donor distance of closest approach expressed in terms of R0
according to the calculations of Wolber and Hudson. The surface densities
are estimated for B from the results of A. Three affinity states are shown:
1 mM Mn21, ¤; 1 mM Mn21 1 1 mM Ca21, w; and 1 mM Ca21, �.
FRET Detection of Integrin Activation 3955
Biophysical Journal 85(6) 3951–3962

(site number and its associated fluorescence) is independent
of affinity state, suggesting that QD is invariant. (Chigaev
et al., 2003). Two important limiting values of k2 in
membranes are 0.667 and 0.476 corresponding to the
randomization of donor-acceptor orientation by rotational
diffusion of donors and acceptors before FRET, and the
static randomization of donor-acceptor orientations, that
otherwise remain constant during the lifetime of the donor
(Lakowicz 1999). These limiting values of k2 produce
a variation in the value of R0 of ;5% and would change the
slopes of the quenching curves by 10% or less.
Integrin conformation is regulated byinside-out signaling
Integrin affinity is known to be regulated by inside-out
signaling by intracellular pathways (Hughes and Pfaff, 1998;
Shimaoka et al., 2002). The signaling occurs through the
cytoplasmic domain and rapidly activates ligand binding and
the proposed conformational changes (Shimaoka et al.,
2002). To determine whether the integrin conformation
could be affected by the inside-out signaling, we used the
human monoblastoid cell line U937 stably transfected with
the wild-type formyl peptide receptor or the receptor mutant
DST, which lacks all serines and threonines in the C-terminal
tail and therefore does not desensitize (Prossnitz, 1997).
Previously, we showed that the affinity change could be
detected on live cells in response to the activation of several
receptors (Chigaev et al., 2001). Here, changes in the
efficiency of FRET were detected (Fig. 4), and the time
course of these changes for two different mutants of the
formyl peptide receptor coincides with the time course of the
affinity changes, measured by the peptide binding. As these
experiments were performed near ligand saturation, the
alteration in the signal under FRET conditions could not be
attributed to a change in ligand binding affinity (curve, —, in
Fig. 4 A), and is thus most likely related to a change in
conformation. The nondesensitizing mutant DST signaled
over a longer duration than the wild-type receptor, as was
shown before for the affinity change (Chigaev et al., 2001).
The magnitude of the energy transfer for the ‘‘physiologi-
cally activated state of the receptor’’ therefore was similar to
the intermediate affinity receptor state formed by divalent
cations with excess Ca21 (Chigaev et al., 2001).
It is worth commenting on the characteristics of the two
curves denoted by (—) and (- - -) in Fig. 4. In the first curve,
addition of an aliquot of a high concentration (2 mL 10�4 M
in DMSO) of fMLFF apparently results in a 20% drop in the
intensity of the LDV-FITC. This appears to be associated
with an effect of fMLFF on the nonspecific fluorescence
signal (background rather than receptor binding of LDV-
FITC, data not shown) but the mechanism has not been
determined. However, since this does not occur when Mn21
cations are used, this behavior has minimal impact on our
model FRET determinations. The second curve appears to
gradually drift upwards in time. As R18 may flip-flop
TABLE 2 Separation distances between LDV-FITC bound to
the a4-integrin and the cell membrane surface
Affinity state
Maximal FRET
efficiency (E, %)
Separation distance
(fraction of R0)*
1 mM Mn21 1 3 mM DTT* 35 1.04–1.56
1 mM Mn21 48 0.80–1.25
1 mM Mn21 1 1 mM Ca21 80 0.45–0.91
1 mM Ca21 100 0.00–0.45
100 nM fMLFF 65–85 0.45–0.73y
*Based on calibration of acceptor surface densities for resting receptor in
1 mM Ca21 and assigned to 0 A separation distance. Twenty percent
uncertainty in calibration leads to uncertainty in separation distance;0.5 R0.yUncertainty arises from the uncertainty of FRET efficiency.
FIGURE 4 Real-time FRET experiments with physiological integrin
activation. U937 cells stably transfected with the nondesensitizing mutant
(DST) of formyl peptide receptor (FPR) were preincubated with 100 nM
LDV-FITC peptide to saturate low affinity sites of the integrin in a buffer
containing 1.5 mM CaCl2 and 1 mM MgCl2. Next, the LDV-FITC
fluorescence was quenched after octadecyl rhodamine B addition (R18, 10
mM). Cells were then activated using formyl peptide (fMLFF, 100 nM) and
the unquenching reaction was followed. (A) Data plotted as mean channel
fluorescence versus time for three conditions: quenched, - - - ; quenched and
stimulated, . . . ; and unquenched and stimulated, —. The unquenched control
shows that no additional LDV-FITC binding is detected after fMLFF
addition to contribute to the quenching analysis. (B) U937 cells transfected
with wild-type formyl peptide receptor (. . .) or with the nondesensitizing
mutant DST (—) were treated as described in Fig. 3 A. Data are replotted
by subtracting the baseline data from unstimulated cells and normalizing to
the unquenched fluorescence value of 1.0 before the addition of R18 and the
quenched value of 0 caused by the addition of 10 mM R18. Because the
formyl peptide receptor mutant DST does not desensitize, the a4-integrin
remains in a state of the constant affinity (Chigaev et al., 2001). The drift in
the baseline quenching of Fig. 4 may be a result of R18 redistribution into
inner membrane with a half-time of tens of minutes.
3956 Chigaev et al.
Biophysical Journal 85(6) 3951–3962

between the outer and inner leaflets of the plasma membrane
and be internalized as well, a reduction in acceptor density in
the outer leaflet would result in the gradual diminution of
FRET over time, with a half-time of ;10 min.
Integrin molecules and R18 do not detectablysegregate upon affinity regulation bydivalent cations
We next used confocal microscopy to test whether cell
treatment affects the gross distribution of donor (LDV-FITC)
and acceptor (R18) molecules on the cell surface. The
specificity of the LDV-FITC fluorescence was tested using
confocal microscopy with 500-fold excess of the unlabeled
LDV peptide derivative (compare Fig. 5, c and d). We found
that the surface distribution of the a4-integrin on U937 cells
was relatively diffuse. Small uneven surface distribution of
the fluorescence on the cell surface (arrows, Fig. 5 c) oftendescribed as ‘‘integrin clustering,’’ corresponds to the sites
of microvilli, which can be seen on the DIC image (arrows,
Fig. 5 a). The presence of an ‘‘extra’’ amount of the plasma
membrane in these areas may account for the additional
fluorescence intensity. It was also shown that on lympho-
cytes that a4b7-integrin is highly concentrated on microvil-
lus sites, whereas the b2-integrin LFA-1 is excluded from
villi (Berlin et al., 1995).
Next, we examined the ability of divalent ions to affect the
distribution of LDV-FITC (FRET donor) and R18 molecules
(FRET acceptors). U937 cells were stained with R18 or
LDV-FITC in buffers containing different concentrations of
Ca21 and Mn21 (see Materials and Methods). As expected,
there was no segregation of R18 and LDV-FITC and no
detectable difference in the distribution of R18 or LDV-FITC
between U937 cells, incubated in buffers with varying
concentrations of divalent cations (Fig. 6).
a4-Integrin and R18 do not form detectableclusters after formyl peptide receptor stimulation
Clustering of activated G-protein coupled receptors is a well-
described phenomenon. Clustering is related to the receptor
desensitization, and internalization (Pierce et al., 2002;
Rockman et al., 2002). In contrast to the wild-type receptor,
the DST mutant of FPR, does not desensitize and internalize
(Prossnitz, 1997), providing an opportunity to compare FPR
a4-integrin and acceptor distribution. U937 cells transfected
with DST mutant of FPR, stained with R18, and a saturating
concentration of LDV-FITC, were stimulated with 20 nM
FIGURE 5 Specificity of LDV-FITC binding to U937 cells. U937 cells
were incubated with 100 nM LDV-FITC in presence (b, d, and f ) or absence
(a, c, and e) of 50 mM of LDV blocking peptide, fixed overnight with 2%
ice-cold PFA. (a and b) DIC image, (c and d ) LDV-FITC fluorescence, and
(e and f ) overlay. This experiment was repeated 33 and gave similar results.
Bar is 10 mm.
FIGURE 6 Distribution of LDV-FITC and R18 molecules is not altered in
buffers with different concentration of divalent cations. U937 cells were
preincubated in buffers containing 1 mMCa21 (a), 1 mMMn21 plus 10 mM
Ca21 (b), 1 mMMn21 plus 1 mMCa21 (c), and 1 mMMn21 (d ) only. Cells
were stained with 20 nMR18 for 1 min (a–d, red ) or 100 nM LDV-FITC for
5 min (a�d, green) as for the FRET experiment. This experiment was
repeated 43 and gave similar results. Bar is 10 mm.
FRET Detection of Integrin Activation 3957
Biophysical Journal 85(6) 3951–3962

fNle-Leu-Phe-Nle-Tyr-Lys-Alexa633 peptide and fixed in
2% paraformaldehyde. We found that 3–5 min after cell
stimulation, the receptors segregated into the punctate
structures (red arrow, Fig. 7 c), which were not co-localized
with LDV-FITC bound to a4b1-integrin (Fig. 7 b) and R18
membrane staining (Fig. 7 a). In contrast, segregation of
LDV-FITC or R18 was not detected in our experiments. We
also found a significant co-localization between LDV-FITC
and R18 on the plasma membrane ( yellow arrows, Fig. 7, a,b, and d ). However, in addition to the staining of the plasma
membrane, R18 (as other lipophilic dyes) does internalize
over tens of minutes and stain all internal membranes (see
time course in Fig. 4 A, showing loss of FRET over time). No
significant internalization of LDV-FITC peptide was found
during the time of the experiments. Thus, after cell stim-
ulation through chemokine receptor the formyl peptide recep-
tors form a punctate pattern on the cell surface, whereas the
distribution of LDV-FITC donors and R18 acceptors re-
mains unaffected.
DISCUSSION
Integrin conformations
Distinct conformations of integrin molecules have been
visualized by electron microscopy (Du et al., 1993; Nermut
et al., 1988; Takagi et al., 2001, 2002) and suggested by
other methods (Chen et al., 1999b; Chigaev et al., 2001;
Hughes and Pfaff, 1998). The model of a switchblade-like
opening motion of integrin proposed by Beglova and co-
workers is based on the finding that the activation-dependent
and ligand-induced binding site epitopes of integrins are
hidden in the bent conformation and exposed in the extended
state (Beglova et al., 2002). This model implies a conforma-
tional change in response to integrin activation. Here using
live cells constitutively expressing a4b1-integrin (one of the
most conformationally flexible among b1-integrins; Bazzoni
et al., 1998) we show that FRET reports a change in
separation distance between the cell surface and the integrin
binding pocket consistent with the argument that favors
conformational change in the integrin. It is worth noting that
the a4-integrin subunit (CD49d) can form a heterodimer with
the b1 (CD29) or the b7 subunit, thus forming VLA-4 (a4b1)
or a4b7-integrin (Chan et al., 1992). VLA-4 recognizes the
QIDS sequence in VCAM-1, and the LDV sequence in
fibronectin. Similarly, the LDT sequence of MAdCAM-1 is
essential for a4b7-integrin binding (Fong et al., 1997; Viney
et al., 1996). Thus, LDV can potentially bind to both types of
integrins albeit with different affinities. As U937 cells
express much more of the b1 subunit than the b7 subunit, the
measurements described here predominantly reflects a4b1
(Chigaev et al., 2001).
Distance of closest approach
A key finding is the occurrence of a progressive increase in
a4-integrin affinity, a decrease in ligand dissociation rate, and
an increase in distance of closest approach (rc) to the LDV-
FITC binding site within the membrane as the integrin is
activated. Based on the current knowledge about integrin
activation and conformational changes, it is tempting to
attribute the distances of closest approach as determined for
the activated states to be solely due to the straightening of
the stalks from a bent to an upright position. However, the
FRET models used here do not, on their own, distinguish
between lateral and vertical separation distances between
the donor and acceptors. The plasma membrane is likely to be
heterogeneous with lateral organization of proteins into
FIGURE 7 a4-Integrin and R18 do not cluster after formyl peptide
receptor stimulation. U937 cells transfected with DST mutant FPR were
stained for 5 min with 100 nM LDV-FITC and 1 mM R18. Next, cells were
stimulated with 20 nM fNle-Leu-Phe-Nle-Tyr-Lys-Alexa633 peptide, fixed,
and analyzed by confocal microscopy. 3-min time-point is shown. (a)
Membrane staining with R18, (b) LDV-FITC, (c) punctate structures of
FPR, stained with fNle-Leu-Phe-Nle-Tyr-Lys-Alexa633, (d ) overlay of a, b,and c, (e) DIC image, and (f ) overlay of a, b, c, and e. No segregation or
clustering of R18 (a) or LDV-FITC (b) with fNle-Leu-Phe-Nle-Tyr-Lys-
Alexa633 (c, red arrow) was detected. Co-localization ( yellow) of R18
incorporated into the plasma membrane and LDV-FITC is shown ( yellowarrows). R18, as other lipophilic dyes do, internalizes (Molecular Probes);
therefore all internal cell membranes are stained (red on a, d, and f ). This
experiment was repeated 43 and gave similar results. Bar is 10 mm.
3958 Chigaev et al.
Biophysical Journal 85(6) 3951–3962

microdomains, such as lipid rafts and caveolae, mediating cell
signaling and adhesion (Brown and London, 1998; Kenwor-
thy, 2002; Simons and Ikonen, 1997; Simons and Toomre,
2000). Lipid rafts are associated with order-preferring lipid
such as sphingolipids and cholesterol, whereas the nonraft
regions tend to be composed of disorder-preferring lipids.
Thus, different probes distribute according to their partition
coefficients for a given environment. R18 belongs to the class
of lipid probes that prefer disorder, and is generally excluded
from lipid rafts (Vaz and Melo, 2001).
One argument that favors a lateral contribution is an
apparent increase in rc (i.e., upward deviation from Wolber-
Hudson model) with increasing acceptor density (Fig. 3) as
the affinity state is elevated. If integrin activation also
involves separation of the stalks, closely apposed in the
inactive state, the protein breadth could increase. Moreover,
we cannot rule out the formation of nanoscopic clusters of
integrins, which could potentially ‘‘shield’’ some LDV-FITC
donors from acceptor quenching. However, several concepts
also argue that the distance in Figs. 3 and 4 represent the
vertical rather than the horizontal separation between donors
and acceptors. Energy transfer is in general dependent upon
acceptor rather than donor lateral distribution. Thus, one
would have to hypothesize a ‘‘clustering of the lipid probe
acceptors’’ induced by divalent cations. It is hard to imagine
how donors and acceptors could become progressively
laterally separated in Fig. 3 by the addition of specific
cations. Moreover, under conditions of cell activation in Fig.
4, it has been suggested that lipid rafts might tend to
segregate lipid probe or protein components (Leitinger and
Hogg, 2002). However, a4b1 VLA-4 and a4b7-integrins
have been shown to be excluded from lipid rafts (Shamri
et al., 2002). We also show in Tables 1 and 2 that adding
DTT to Mn21 leads to slower ligand dissociation and
increased separation distance. The dithiol compounds are
well-known modulators of integrin-dependent adhesion
(Edwards et al., 1995, 1998; Schwartz and Harlan, 1989).
Thus, in three independent conditions that are highly
unlikely to have similar consequences for lateral distribution
of donor or acceptor, there is a correlation between ligand
binding to the integrin and the distance of closest approach of
R18 to the ligand binding site. The most probable cause is
therefore a change in vertical separation attributable to
extension of the integrin.
Because cellular lipid rafts are on the order of #0.1 mm(Anderson and Jacobson, 2002; Brown and London, 1998;
Kenworthy, 2002; Kenworthy et al., 2000; Maxfield, 2002),
and resolution of the microscope images is limited to ;0.1
mm, the lack of visible clusters in Figs. 5–7 does not rule out
the existence of microdomains. An additional argument
against the accumulation of the integrins into lipid rafts is
based on the poor correlation between the real-time FRET
response to activation of the integrin (Fig. 4) and the
expected diffusion time of integrin traveling across the cell
membrane toward a presumed microdomain. The half-time
corresponding to the diminution of FRET due to activation
of the integrin by a large excess of cations is \10 s (not
shown), and \30 s (Fig. 4) for activation by inside-out
signaling. In contrast, the diffusion time of integrin
molecules to travel distances of a few microns (\3 mm) as
measured by fluorescence recovery after photobleaching is
on the order of minutes (D ;10�10 cm2 s�1; see also Erb
et al., 1997; Lippincott-Schwartz et al., 2001; Tsuruta et al.,
2002). Taken together, the equilibrium and kinetic evidence
suggest that the changes in FRET observed for the a4b1-
integrin are most likely due to conformational changes alone.
By chemically attaching fluorescent tags to order preferring
lipid probes such as GM1 ganglioside (Samsonov et al.,
2001) it may be possible to probe the lipid domains that
surround the receptors.
Uncertainties in vertical separation
The Wolber-Hudson model for FRET efficiency is based on
the assumption that the integrin-bound donor moiety located
above the membrane interacts with acceptor lipid probes that
distribute uniformly in the membrane. The relevance of the
model is supported by the close correlation between the F18/
R18 calibration curve and the LDV-FITC/R18 FRET data
for the resting receptor in Fig. 3. As the F18 and R18 probes
are expected to have similar partition coefficients throughout
the plasma membrane, the close match between these two
curves suggests that the areas near the integrin are equally
accessible to the lipid probe as the ‘‘integrin free’’ areas.
Furthermore, the microscopy images shown in Figs. 6 and 7
indicate a relatively diffuse distribution of the integrin and
the R18 (albeit limited in resolution to ;0.1 mm) with some
co-localization.
However, several factors limit the reliability of the absolute
values of the distances reported here. Since proteins typically
occupy ;20–50% of the membrane surface area (Saxton,
1989; Saxton and Jacobson, 1997), the assumption of random
distribution of acceptors and their actual surface densities is
an approximation. Second, the partition coefficient of the R18
lipid probes is likely to vary over different microregions of
the laterally organized plasma membrane (Vaz and Melo,
2001). Models based onMonte Carlo simulations of FRET in
‘‘crowded biological membranes’’ have been published but
do not appear to be applicable to the data presented here
(Zimet et al., 1995).We have reported in Table 2 the ranges of
separation distances based on uncertainties of;20% in local
acceptor surface density. Deviations between the model and
experimental data may result from imperfect calibration or
segregation, particularly at high acceptor concentrations.
Compared to uncertainties introduced by surface density, the
impact of the uncertainty in k2 on R0 is likely to be small
because the R18 molecules are randomly oriented with
respect to the binding pocket. In the binding pocket, LDV-
FITC is likely to have at least limited motion, as there is
torsional freedom in the FITC linkage and the amino acids
FRET Detection of Integrin Activation 3959
Biophysical Journal 85(6) 3951–3962

after LDV do not appear to contribute to overall ligand
binding to the integrin (Lin et al., 1999).
Signaling and integrin activation
Placing the headpiece of the resting integrin near the
membrane surface allows for an extension of the Mn21
activated headpiece;50 A from the surface. This distance is
approximately one-half that expected if the integrin molecule
undergoes the conformational change from the fully folded
to the fully extended conformation (compare Fig. 3, H and I,in Takagi et al., 2002). The activation of the integrin by
inside-out signaling through a G-protein coupled receptor
leads to the rapid unquenching of the donor fluorescence,
which we interpret as a conformational change, that moves
the molecule headpiece away from the lipid bilayer ;25 A.
In this case, the intermediate integrin conformational state
induced by inside-out signaling would not be fully extended.
The DTT treated and divalent activated integrin extends;75
A. The data support the notion that the conformational
changes which promotes the extension has at the same time
a progressive effect on the ligand binding affinity. The
possibility that the effect of DTT is in the disulfide regulated
integrin hinge region will be discussed elsewhere (Chigaev
et al., unpublished results). Others have reported that the
reduction of disulfide bonds within an integrin’s cysteine-
rich domain leads to global conformational changes of both
aIib- and b3-integrin subunits (Yan and Smith, 2001).
Our data do not at this time support a fully extended
integrin conformation (see Fig. 6 E in Takagi et al., 2002). It
is possible, therefore, that the fully extended conformation is
short-lived or artificially generated by using soluble recom-
binant unclasped integrin molecules (Takagi et al., 2002).
Alternatively, the fully extended conformation may exist at
the moment of the engagement of the molecule by the natural
ligand (e.g., VCAM-1 on endothelial cells) or may be a part of
the cell braking system while it rolls on endothelium (Chen
and Springer, 1999). These data therefore provide a mech-
anism to account for the notion of a catch-bond (Dembo
et al., 1988). Such a bond would allow the forces of a cell-cell
adhesive interaction to transduce a molecular extension
and to induce a new conformation in the ligand-binding
pocket that creates higher affinity, longer ligand residence
time, and higher adhesive avidity.
Synergy in FRET in flow cytometryand microscopy
This study has employed a combination of flow cytometry,
confocal microscopy, and FRET to examine the problem of
conformational changes associated with integrin activation at
cell surfaces. Generally, with FRET microscopy, it is
possible to obtain quantitative temporal and spatial in-
formation about the organization, and interactions of cellular
components such as proteins, lipids, enzymes, etc. (Ken-
worthy and Edidin, 1999; Kenworthy et al., 2000;
Lippincott-Schwartz et al., 2001). However, steady-state
microscopy measurements are typically affected by several
sources of optical distortions that must be accounted for.
These include background fluorescence, autofluorescence,
photobleaching, direct excitation of acceptors, and the
dependence of FRET on acceptor concentrations (Gordon
et al., 1998). In the present work, the potential for very high
fluorescence backgrounds from the real-time titration of lipid
probes to cells would interfere with the effective use of
microscopy. Flow cytometry is thus an effective alternative
tool for quantitative FRET measurements in such an en-
vironment due to its intrinsic capacity to discriminate be-
tween free and cell-associated probes (Buranda et al., 1999;
Nolan and Sklar, 1998; Sklar et al., 2002). Thus, in this
work we have used flow cytometry for quantitation of
FRET measurements and microscopy to visualize the lateral
organization of cell membrane components. Using flow
cytometry to resolve details of FRET in real-time (Fig. 4) and
under steady-state conditions (Figs. 2 and 3) enabled us to
define conditions under which no gross changes in the spatial
distribution of donor and acceptor probes could be visualized
after cell activation (Figs. 5–7).
We acknowledge the National Institutes of Health (grants P50 HL56384-
06, IR01 RR14175, and IR24 CA88339-02 to L.A.S.; and AI36357 and
AI43932 to E.R.P.) and the Dedicated Health Research Funds of the
University of New Mexico School of Medicine (grant C-2192-RAC to
T.B.) for support of this work. Images in this article were generated in the
Fluorescence Microscopy Facility, which received support from the
National Center for Research Resources 1 S10 RR14668, National Science
Foundation MCB9982161, National Center for Research Resources P20
RR11830, National Cancer Institute R24 CA88339, the University of New
Mexico Health Sciences Center, and the University of New Mexico Cancer
Center.
REFERENCES
Alon, R., P. D. Kassner, M. W. Carr, E. B. Finger, M. E. Hemler, and T. A.Springer. 1995. The integrin VLA-4 supports tethering and rolling inflow on VCAM-1. J. Cell Biol. 128:1243–1253.
Anderson, R. G., and K. Jacobson. 2002. A role for lipid shells in targetingproteins to caveolae, rafts, and other lipid domains. Science. 296:1821–1825.
Bazzoni, G., and M. E. Hemler. 1998. Are changes in integrin affinity andconformation overemphasized? Trends Biochem. Sci. 23:30–34.
Bazzoni, G., L. Ma, M. L. Blue, and M. E. Hemler. 1998. Divalent cationsand ligands induce conformational changes that are highly divergentamong b1-integrins. J. Biol. Chem. 273:6670–6678.
Beglova, N., S. C. Blacklow, J. Takagi, and T. A. Springer. 2002. Cysteine-rich module structure reveals a fulcrum for integrin rearrangement uponactivation. Nat. Struct. Biol. 9:282–287.
Berlin, C., R. F. Bargatze, J. J. Campbell, U. H. von Andrian, M. C. Szabo,S. R. Hasslen, R. D. Nelson, E. L. Berg, S. L. Erlandsen, and E. C.Butcher. 1995. a4-integrins mediate lymphocyte attachment and rollingunder physiologic flow. Cell 80:413–422.
Brown, D. A., and E. London. 1998. Functions of lipid rafts in biologicalmembranes. Annu. Rev. Cell Dev. Biol. 14:111–136.
Buranda, T., G. P. Lopez, J. Keij, R. Harris, and L. A. Sklar. 1999.Peptides, antibodies, and FRET on beads in flow cytometry: a model
3960 Chigaev et al.
Biophysical Journal 85(6) 3951–3962

system using fluoresceinated and biotinylated b-endorphin. Cytometry.37:21–31.
Chan, B. M., M. J. Elices, E. Murphy, and M. E. Hemler. 1992. Adhesionto vascular cell adhesion molecule 1 and fibronectin. Comparison ofa4b1 (VLA-4) and a4b7 on the human B cell line JY. J. Biol. Chem.267:8366–8370.
Chen, C., J. L. Mobley, O. Dwir, F. Shimron, V. Grabovsky, R. R. Lobb,Y. Shimizu, and R. Alon. 1999a. High affinity very late antigen-4 subsetsexpressed on T-cells are mandatory for spontaneous adhesion strength-ening but not for rolling on VCAM-1 in shear flow. J. Immunol.162:1084–1095.
Chen, L. L., A. Whitty, R. R. Lobb, S. P. Adams, and R. B. Pepinsky.1999b. Multiple activation states of integrin a4b1 detected through theirdifferent affinities for a small molecule ligand. J. Biol. Chem.274:13167–13175.
Chen, S., and T. A. Springer. 1999. An automatic braking system thatstabilizes leukocyte rolling by an increase in selectin bond number withshear. J. Cell Biol. 144:185–200.
Chigaev, A., A. M. Blenc, J. V. Braaten, N. Kumaraswamy, C. L. Kepley,R. P. Andrews, J. M. Oliver, B. S. Edwards, E. R. Prossnitz, R. S.Larson, and L. A. Sklar. 2001. Real-time analysis of the affinityregulation of a4-integrin. The physiologically activated receptor isintermediate in affinity between resting and Mn21 or antibody activation.J. Biol. Chem. 276:48670–48678.
Chigaev, A., G. Zwartz, S. W. Graves, D. C. Dwyer, H. Tsuji, T. D. Foutz,B. S. Edwards, E. R. Prossnitz, R. S. Larson, and L. A. Sklar. 2003.a4b1-integrin affinity changes govern cell adhesion. J. Biol. Chem.278:38174–38182.
Dembo, M., D. C. Torney, K. Saxman, and D. Hammer. 1988. Thereaction-limited kinetics of membrane-to-surface adhesion and detach-ment. Proc. R. Soc. Lond. B Biol. Sci. 234:55–83.
Dewey, T. G., and G. G. Hammes. 1980. Calculation on fluorescenceresonance energy transfer on surfaces. Biophys. J. 32:1023–1035.
Diamond, M. S., and T. A. Springer. 1994. The dynamic regulation ofintegrin adhesiveness. Curr. Biol. 4:506–517.
Doody, M. C., L. A. Sklar, H. J. Pownall, J. T. Sparrow, A. M. Gotto, Jr.,and L. C. Smith. 1983. A simplified approach to resonance energytransfer in membranes, lipoproteins and spatially restricted systems.Biophys. Chem. 17:139–152.
Du, X., M. Gu, J. W. Weisel, C. Nagaswami, J. S. Bennett, R. Bowditch,and M. H. Ginsberg. 1993. Long range propagation of conformationalchanges in integrin aIIb b3. J. Biol. Chem. 268:23087–23092.
Dustin, M. L., and T. A. Springer. 1989. T-cell receptor cross-linkingtransiently stimulates adhesiveness through LFA-1. Nature. 341:619–624.
Edwards, B. S., M. S. Curry, E. A. Southon, A. S. Chong, and L. H. Graf,Jr. 1995. Evidence for a dithiol-activated signaling pathway in naturalkiller cell avidity regulation of leukocyte function antigen-1: structuralrequirements and relationship to phorbol ester- and CD16-triggeredpathways. Blood. 86:2288–2301.
Edwards, B. S., E. A. Southon, M. S. Curry, F. Salazar, J. M. Gale, M. K.Robinson, L. H. Graf, Jr., and J. L. Born. 1998. Oxidant inhibition ofaLb2-integrin adhesion: evidence for coordinate effects on conformationand cytoskeleton linkage. J. Leukoc. Biol. 63:190–202.
Erb, E. M., K. Tangemann, B. Bohrmann, B. Muller, and J. Engel. 1997.Integrin aIIb b3 reconstituted into lipid bilayers is nonclustered in itsactivated state but clusters after fibrinogen binding. Biochemistry.36:7395–7402.
Faull, R. J., N. L. Kovach, J. M. Harlan, and M. H. Ginsberg. 1994.Stimulation of integrin-mediated adhesion of T-lymphocytes andmonocytes: two mechanisms with divergent biological consequences.J. Exp. Med. 179:1307–1316.
Fong, S., S. Jones, M. E. Renz, H. H. Chiu, A. M. Ryan, L. G. Presta, andD. Jackson. 1997. Mucosal addressin cell adhesion molecule-1(MAdCAM-1). Its binding motif for a4b7 and role in experimentalcolitis. Immunol. Res. 16:299–311.
Fung, B. K., and L. Stryer. 1978. Surface density determination inmembranes by fluorescence energy transfer. Biochemistry. 17:5241–5248.
Gordon, G. W., G. Berry, X. H. Liang, B. Levine, and B. Herman. 1998.Quantitative fluorescence resonance energy transfer measurements usingfluorescence microscopy. Biophys. J. 74:2702–2713.
Haugland, R. P. 2002. Handbook of Fluorescent Probes and ResearchChemicals. Molecular Probes, Eugene, OR.
Hu, D. D., C. F. Barbas, and J. W. Smith. 1996. An allosteric Ca21 bindingsite on the b3-integrins that regulates the dissociation rate for RGDligands. J. Biol. Chem. 271:21745–21751.
Hughes, P. E., and M. Pfaff. 1998. Integrin affinity modulation. Trends CellBiol. 8:359–364.
Humphries, M. J. 1996. Integrin activation: the link between ligand bindingand signal transduction. Curr. Opin. Cell Biol. 8:632–640.
Humphries, M. J. 2000. Integrin structure. Biochem. Soc. Trans. 28:311–339.
Hynes, R. O. 1992. Integrins: versatility, modulation, and signaling in celladhesion. Cell. 69:11–25.
Kenworthy, A. 2002. Peering inside lipid rafts and caveolae. TrendsBiochem. Sci. 27:435–437.
Kenworthy, A. K., and M. Edidin. 1999. Imaging fluorescence resonanceenergy transfer as probe of membrane organization and molecularassociations of GPI-anchored proteins. Methods Mol. Biol. 116:37–49.
Kenworthy, A. K., N. Petranova, and M. Edidin. 2000. High-resolutionFRET microscopy of cholera toxin B-subunit and GPI-anchored proteinsin cell plasma membranes. Mol. Biol. Cell. 11:1645–1655.
Kew, R. R., T. Peng, S. J. DiMartino, D. Madhavan, S. J. Weinman, D.Cheng, and E. R. Prossnitz. 1997. Undifferentiated U937 cellstransfected with chemoattractant receptors: a model system to investigatechemotactic mechanisms and receptor structure/function relationships.J. Leukoc. Biol. 61:329–337.
Lakowicz, J. R. 1999. Principles of Fluorescence Spectroscopy. PlenumPress, New York.
Leitinger, B., and N. Hogg. 2002. The involvement of lipid rafts in theregulation of integrin function. J. Cell Sci. 115:963–972.
Lin, K., H. S. Ateeq, S. H. Hsiung, L. T. Chong, C. N. Zimmerman, A.Castro, W. C. Lee, C. E. Hammond, S. Kalkunte, L. L. Chen, R. B.Pepinsky, D. R. Leone, A. G. Sprague, W. M. Abraham, A. Gill, R. R.Lobb, and S. P. Adams. 1999. Selective, tight-binding inhibitors ofintegrin a4b1 that inhibit allergic airway responses. J. Med. Chem.42:920–934.
Lippincott-Schwartz, J., E. Snapp, and A. Kenworthy. 2001. Studyingprotein dynamics in living cells. Nat. Rev. Mol. Cell Biol. 2:444–456.
Loftus, J. C., J. W. Smith, and M. H. Ginsberg. 1994. Integrin-mediated celladhesion: the extracellular face. J. Biol. Chem. 269:25235–25238.
Lu, C., M. Ferzly, J. Takagi, and T. A. Springer. 2001. Epitope mapping ofantibodies to the C-terminal region of the integrin b2 subunit revealsregions that become exposed upon receptor activation. J. Immunol.166:5629–5637.
Maxfield, F. R. 2002. Plasma membrane microdomains. Curr. Opin. CellBiol. 14:483–487.
Mould, A. P., S. K. Akiyama, and M. J. Humphries. 1995. Regulation ofintegrin a5b1-fibronectin interactions by divalent cations. Evidence fordistinct classes of binding sites for Mn21, Mg21, and Ca21. J. Biol.Chem. 270:26270–26277.
Nermut, M. V., N. M. Green, P. Eason, S. S. Yamada, and K. M. Yamada.1988. Electron microscopy and structural model of human fibronectinreceptor. EMBO J. 7:4093–4099.
Nolan, J. P., and L. A. Sklar. 1998. The emergence of flow cytometry forsensitive, real-time measurements of molecular interactions. Nat.Biotechnol. 16:633–638.
Pierce, K. L., R. T. Premont, and R. J. Lefkowitz. 2002. Seven-transmembrane receptors. Nat. Rev. Mol. Cell Biol. 3:639–650.
FRET Detection of Integrin Activation 3961
Biophysical Journal 85(6) 3951–3962
Prossnitz, E. R. 1997. Desensitization of n-formylpeptide receptor-mediatedactivation is dependent upon receptor phosphorylation. J. Biol. Chem.272:15213–15219.
Rockman, H. A., W. J. Koch, and R. J. Lefkowitz. 2002. Seven-transmembrane-spanning receptors and heart function. Nature. 415:206–212.
Samsonov, A. V., I. Mihalyov, and F. S. Cohen. 2001. Characterization ofcholesterol-sphingomyelin domains and their dynamics in bilayermembranes. Biophys. J. 81:1486–1500.
Saxton, M. J. 1989. Lateral diffusion in an archipelago. Distancedependence of the diffusion coefficient. Biophys. J. 56:615–622.
Saxton, M. J., and K. Jacobson. 1997. Single-particle tracking: applicationsto membrane dynamics. Annu. Rev. Biophys. Biomol. Struct. 26:373–399.
Schwartz, B. R., and J. M. Harlan. 1989. Sulfhydryl reducing agentspromote neutrophil adherence without increasing surface expression ofCD11b/CD18 (Mac�1, Mo1). Biochem. Biophys. Res. Commun. 165:51–57.
Shamri, R., V. Grabovsky, S. W. Feigelson, O. Dwir, Y. Van Kooyk, andR. Alon. 2002. Chemokine stimulation of lymphocyte a4-integrin aviditybut not of leukocyte function-associated antigen-1 avidity to endothelialligands under shear flow requires cholesterol membrane rafts. J. Biol.Chem. 277:40027–40035.
Shimaoka, M., J. Takagi, and T. A. Springer. 2002. Conformationalregulation of integrin structure and function. Annu. Rev. Biophys.Biomol. Struct. 31:485–516.
Simons, K., and E. Ikonen. 1997. Functional rafts in cell membranes.Nature. 387:569–572.
Simons, K., and D. Toomre. 2000. Lipid rafts and signal transduction. Nat.Rev. Mol. Cell Biol. 1:31–39.
Sklar, L. A., M. C. Doody, A. M. Gotto, Jr., and H. J. Pownall. 1980.Serum lipoprotein structure: resonance energy transfer localization offluorescent lipid probes. Biochemistry. 19:1294–1301.
Sklar, L. A., B. S. Edwards, S. W. Graves, J. P. Nolan, and E. R. Prossnitz.2002. Flow cytometric analysis of ligand-receptor interactions andmolecular assemblies. Annu. Rev. Biophys. Biomol. Struct. 31:97–119.
Stewart, M., and N. Hogg. 1996. Regulation of leukocyte integrin function:affinity vs. avidity. J. Cell. Biochem. 61:554–561.
Takagi, J., H. P. Erickson, and T. A. Springer. 2001. C-terminal openingmimics ‘‘inside-out’’ activation of integrin a5b1. Nat. Struct. Biol.8:412–416.
Takagi, J., B. M. Petre, T. Walz, and T. A. Springer. 2002. Globalconformational rearrangements in integrin extracellular domains inoutside-in and inside-out signaling. Cell. 110:599–611.
Tsuruta, D., M. Gonzales, S. B. Hopkinson, C. Otey, S. Khuon, R. D.Goldman, and J. C. Jones. 2002. Microfilament-dependent movement ofthe b3-integrin subunit within focal contacts of endothelial cells. FASEBJ. 16:866–868.
Van Kooyk, Y., S. J. van Vliet, and C. G. Figdor. 1999. The actincytoskeleton regulates LFA-1 ligand binding through avidity rather thanaffinity changes. J. Biol. Chem. 274:26869–26877.
Vaz, W. L. C., and E. Melo. 2001. Fluorescence spectroscopic studies onphase heterogeneity in lipid bilayer membranes. J. Fluor. 11:255–271.
Viney, J. L., S. Jones, H. H. Chiu, B. Lagrimas, M. E. Renz, L. G. Presta,D. Jackson, K. J. Hillan, S. Lew, and S. Fong. 1996. Mucosal addressincell adhesion molecule-1: a structural and functional analysis demarcatesthe integrin binding motif. J. Immunol. 157:2488–2497.
Wolber, P. K., and B. S. Hudson. 1979. An analytic solution to the Forsterenergy transfer problem in two dimensions. Biophys. J. 28:197–210.
Xiong, J. P., T. Stehle, B. Diefenbach, R. Zhang, R. Dunker, D. L. Scott,A. Joachimiak, S. L. Goodman, andM.A. Arnaout. 2001. Crystal structureof the extracellular segment of integrin aVb3. Science. 294:339–345.
Yan, B., and J. W. Smith. 2001. Mechanism of integrin activation bydisulfide bond reduction. Biochemistry. 40:8861–8867.
Zimet, D. B., B. J. Thevenin, A. S. Verkman, S. B. Shohet, and J. R.Abney. 1995. Calculation of resonance energy transfer in crowdedbiological membranes. Biophys. J. 68:1592–1603.
3962 Chigaev et al.
Biophysical Journal 85(6) 3951–3962
Copyright © 2022 FDOKUMEN