Integrin αIIbβ3 - a journey from protein to cell
141
Integrin αIIbβ3 - a journey from protein to cell I n a u g u r a l d i s s e r t a t i o n zur Erlangung des akademischen Grades Doktor der Naturwissenschaften (Dr. rer. nat.) der Mathematisch-Naturwissenschaftlichen Fakultät der Universität Greifswald vorgelegt von Una Janke Greifswald, Dezember 2020
-
Upload
khangminh22 -
Category
Documents
-
view
3 -
download
0
Transcript of Integrin αIIbβ3 - a journey from protein to cell

Integrin αIIbβ3 - a journey from protein to cell
I n a u g u r a l d i s s e r t a t i o n
zur
Erlangung des akademischen Grades
Doktor der Naturwissenschaften (Dr. rer. nat.)
der
Mathematisch-Naturwissenschaftlichen Fakultät
der
Universität Greifswald
vorgelegt von
Una Janke
Greifswald, Dezember 2020

II
Dekan: Prof. Dr. Gerald Kerth
1. Gutachter: Prof. Dr. Mihaela Delcea
2. Gutachter: Prof. Dr. Anisur Rahman
Tag der Promotion: 23.03.2021

III
“The blood is life…”
Bram Stoker, Roman Dracula (1897)

I
Table of Contents
Abstract ..................................................................................................................................... I
Zusammenfassung ................................................................................................................... II
Contribution of Others ............................................................................................................. III
List of Abbreviations ............................................................................................................... IV
1. Introduction ....................................................................................................................... 1
1.1. Platelets and their role in health and disease ............................................................ 1 1.2. Platelet activation ....................................................................................................... 2 1.3. Platelet mechanics and cytoskeleton ......................................................................... 3 1.4. Platelet membranes and lipids ................................................................................... 5 1.5. The platelet integrin αIIbβ3 ........................................................................................ 7
1.5.1. Integrins .............................................................................................................. 7 1.5.2. Structure of αIIbβ3 .............................................................................................. 8 1.5.3. Activation and function of αIIbβ3 ...................................................................... 10 1.5.4. The role of divalent cations in integrin activation .............................................. 12
1.6. Biomimetic membrane systems ............................................................................... 13 1.6.1. Model membranes ............................................................................................ 13 1.6.2. Liposomes ........................................................................................................ 14
1.7. Nanoparticles and their applications ........................................................................ 16 1.8. Biophysical tools to study proteins and their interactions with lipids, drugs and nanoparticles ...................................................................................................................... 16
1.9. Aim of this thesis ......................................................................................................... 18
2. Materials .......................................................................................................................... 19
2.1. General equipment .................................................................................................. 19 2.2. Chemicals, kits and consumables ............................................................................ 21 2.3. Proteins, enzymes, nanoparticles and antibodies .................................................... 23 2.4. Purification procedures ............................................................................................ 24 2.5. Liposome preparation .............................................................................................. 24 2.6. Cell and bacterial culture ......................................................................................... 25 2.7. Software ................................................................................................................... 26
3. Experimental procedures ................................................................................................ 28
3.1. Enzyme-linked immunosorbent assay (ELISA) ........................................................ 28 3.2. Integrin purification ................................................................................................... 28

II
3.3. Integrin reconstitution into liposomes ....................................................................... 29 3.3.1. Reconstitution protocol with Triton X-100 ......................................................... 29 3.3.2. Reconstitution protocol with CHAPS ................................................................ 30
3.4. Characterization of liposomes .................................................................................. 30 3.4.1. Phosphate assay .............................................................................................. 30 3.4.2. Thin-layer chromatography (TLC) ..................................................................... 31 3.4.3. Transmission electron microscopy (TEM) – Negative staining ......................... 31 3.4.4. Sodium dodecylsulfate-polyacrylamide gel electrophoresis (SDS-PAGE) ....... 32 3.4.5. Determination of protein concentration ............................................................. 32 3.4.6. Dynamic light scattering (DLS) ......................................................................... 32
3.5. Activation of integrin ................................................................................................. 34 3.5.1. Flow cytometry of liposomes ............................................................................ 34 3.5.2. Quartz crystal microbalance with dissipation (QCM-D) monitoring................... 34 3.5.3. Nanoparticle synthesis and modification .......................................................... 36 3.5.4. Activation assay ................................................................................................ 36 3.5.5. Molecular dynamic simulations (MDS) ............................................................. 36 3.5.6. Circular dichroism (CD) spectroscopy .............................................................. 37
3.6. HEK293 cells as integrin expression platform ......................................................... 39 3.6.1. Cell culture and transfection ............................................................................. 39 3.6.2. Mutagenesis and isolation of plasmid DNA ...................................................... 40 3.6.3. Confocal microscopy ........................................................................................ 43 3.6.4. Flow cytometry and fluorescence-activated cell sorting (FACS) ...................... 43 3.6.5. Atomic force microscopy (AFM) ........................................................................ 45 3.6.6. Real time-deformability cytometry (RT-DC) ...................................................... 49 3.6.7. Statistical analysis ............................................................................................ 51
4. Results ............................................................................................................................ 52
4.1. Integrin αIIbβ3 in biomimetic systems ...................................................................... 52 4.1.1. Integrin characterization ................................................................................... 52 4.1.2. Bilayer formation of liposomes with various lipidic systems ............................. 53 4.1.3. Reconstitution of integrin into liposomes .......................................................... 55 4.1.4. Proteoliposome-derived bilayer formation ........................................................ 56 4.1.5. Conformational changes of integrin upon treatment with manganese .............. 59 4.1.6. Secondary structure changes upon manganese-induced integrin activation ... 62 4.1.7. Platelet integrin activation induced by clinical drugs ......................................... 63
4.1.8. Interaction of integrin αIIbβ3 with fibrinogen bioconjugates .............................. 66 4.1.9. Influence of different lipidic systems on platelet integrin activation .................. 68
4.2. HEK293 cells as an expression platform and model system to study the impact of integrin on cell elasticity ...................................................................................................... 75

III
4.2.1. Expression of integrin αIIbβ3 and co-localization ............................................. 76 4.2.2. Integrin activation and cytoskeletal rearrangements ........................................ 77 4.2.3. Cell elasticity and platelet integrin activation .................................................... 83
5. Discussion ....................................................................................................................... 85
5.1. Liposomes as biomimetic system ............................................................................ 85 5.2. Integrin activation in liposomes ................................................................................ 86 5.3. Influence of clinically relevant drugs on integrin activation ...................................... 88 5.4. Interaction of integrin αIIbβ3 with fibrinogen-nanoparticle bioconjugates ................ 89 5.5. Influence of the lipidic system on integrin dynamics ................................................ 91 5.6. Impact of integrin on cell elasticity and cytoskeleton ............................................... 95 5.7. Summary and perspectives ..................................................................................... 99
6. List of figures ................................................................................................................. 100
7. List of tables .................................................................................................................. 101
8. References .................................................................................................................... 102
9. Appendix ....................................................................................................................... 117
Acknowledgements .............................................................................................................. 128

I
Abstract
Blood platelets are primary major players in the coagulation cascade, that act upon damage in
blood vessels at the subendothelial surface. During this process, platelets change their shape,
release granules and aggregate by cross-linking of integrin αIIbβ3 via fibrinogen. The
heterodimeric transmembrane receptor integrin αIIbβ3 is highly expressed on platelets and its
regulation is bidirectional. Inside-out signaling leads to increased affinity for ligands due to
dramatic rearrangements in the integrin conformation changing from an inactive bent
conformation to an extended, high-affinity conformation. The swing-out motion of the integrin
head domain enables binding of ligands, e.g. fibrinogen, resulting in outside-in signaling
guiding kinase activation, shape change, platelet aggregation and spreading, subsequently.
Agonists (e.g. thrombin) and other triggers (e.g. shear stress) promote the activity of platelets,
making the study of specific proteins delicate. Therefore, this PhD thesis describes a
biomimetic system used to study αIIbβ3 membrane receptors. Integrin αIIbβ3 was successfully
reconstituted into liposomes and characterized by biophysical and molecular biological
methods (e.g. dynamic light scattering, transmission electron microscopy, circular dichroism
spectroscopy and flow cytometry). The fusion of liposomes to a solid substrate allows the
analysis of potential activation triggers and interaction partners concerning their role in integrin
αIIbβ3 activation in a lipid bilayer. Among others, quartz-crystal microbalance measurements
show that divalent ions and clinically relevant drugs (e.g. unfractionated heparin and quinine),
known to be involved in immune thrombocytopenia (ITP), are certainly candidates which
induce integrin activation and minor changes in protein secondary structure. In addition, protein
corona formation during contact of nanoparticles with blood components, such as fibrinogen,
as well as their interaction with artificial platelet model membranes containing integrins were
studied. Moreover, lipid environment can be strongly controlled as integrin activation is
dependent on the ratio of liquid-ordered and disordered phases within the membrane.
Eventually, by exclusion of disturbances of complex external and internal factors, the
established system enables the interaction analysis of various substances with receptors
under physiological conditions. In contrast, these disturbances are required to understand the
complex machinery of cellular processes in vivo. Hence, an expression platform, on the basis
of HEK293 cells, was established to study not only the interaction of integrin αIIbβ3 with
cytoskeletal networks, but also the impact of mutations on integrin resulting in a disease-like
phenotype. Mutations known to induce Glanzmann thrombasthenia (GT) symptoms, were
introduced and led to different mechanical properties of integrin-expressing cells, especially
during cell adhesion cells. Thereby, generation of biological and medically-relevant processes
combined with the biophysical setup contribute to understand disease mechanisms as well as
the action of therapeutic agents in diseases such as GT and ITP.

II
Zusammenfassung
Blutplättchen sind die Hauptakteure in der Gerinnungskaskade, die auf Schäden in
Blutgefäßen an der subendothelialen Oberfläche einwirken. Während dieses Prozesses
ändern Blutplättchen ihre Form, setzen Granula frei und aggregieren durch Vernetzung des
Integrins αIIbβ3 und Fibrinogen. Der heterodimere Transmembranrezeptor Integrin αIIbβ3 wird
auf Blutplättchen exprimiert und seine Regulation ist bidirektional. Inside-Out-Signale führen
zu einer erhöhten Affinität für Liganden aufgrund dramatischer Umlagerungen in der Integrin
Konformation, die sich von einer inaktiven geschlossenen Konformation zu einer gestreckten
Konformation mit hoher Affinität ändern. Die Ausschwenkbewegung der Integrin Kopfdomäne
ermöglicht die Bindung von Liganden, z.B. Fibrinogen, was zur Aktivierung von
Singalkaskaden, einer Blutplättchen Aggregation und einer anschließenden Ausbreitung führt.
Agonisten (z. B. Thrombin) und andere Trigger (z. B. Scherbeanspruchung) fördern die
Aktivität von Blutplättchen, wodurch die Untersuchung spezifischer Proteine schwierig wird.
Diese Doktorarbeit zeigt ein biomimetisches System zur Untersuchung von αIIbβ3-
Membranrezeptoren. Integrin αIIbβ3 wurde erfolgreich in Liposomen rekonstituiert und durch
biophysikalische und molekularbiologische Verfahren (z. B. dynamische Lichtstreuung,
Transmissionselektronenmikroskopie, Zirkulardichroismus-Spektroskopie und
Durchflusszytometrie) charakterisiert. Die Fusion von Liposomen mit einem festen Substrat
ermöglicht die Analyse potenzieller Aktivierungsauslöser und Interaktionspartner hinsichtlich
ihrer Rolle bei der Aktivierung des Integrins αIIbβ3 in einer Lipiddoppelschicht. Quarzkristall-
Mikrowaagen Messungen zeigen unter anderem, dass zweiwertige Ionen und klinisch
relevante Arzneimittel (z. B. unfraktioniertes Heparin und Chinin), von denen bekannt ist, dass
sie an der Immunthrombozytopenie (ITP) beteiligt sind, zweifellos Kandidaten sind, die eine
Integrin-Aktivierung und geringfügige Änderungen der Proteinsekundärstruktur induzieren.
Darüber hinaus wurden die Bildung von Proteinkorona beim Kontakt von Nanopartikeln mit
Blutbestandteilen wie Fibrinogen, sowie deren Wechselwirkung mit artifiziellen Integrin
Thrombozyten-Modellmembranen untersucht. Darüber hinaus kann die Lipidumgebung
gesteuert werden, da die Integrin-Aktivierung auch vom Verhältnis der geordneten und
ungeordneten Phasen innerhalb der Membran abhängt. Unter Ausschluss von Störungen
komplexer externer und interner Faktoren, ermöglicht das etablierte System schließlich die
Interaktionsanalyse verschiedener Substanzen mit Rezeptoren unter physiologischen
Bedingungen. Im Gegensatz dazu sind eben diese „Störungen“ erforderlich, um die komplexe
Maschinerie zellulärer Prozesse in vivo zu verstehen. Daher wurde eine Expressionsplattform
auf der Basis von HEK293-Zellen eingerichtet, um nicht nur die Wechselwirkung von Integrin
αIIbβ3 mit dem Zytoskelett zu untersuchen, sondern auch den Einfluss von Mutationen des
Integrins, was zu einem krankheitsähnlichen Phänotyp führt. Mutationen, von denen bekannt
ist, dass sie Glanzmann-Thrombasthenie (GT)-Symptome induzieren, wurden eingebracht

III
und führten zu unterschiedlichen mechanischen Eigenschaften von Integrin-exprimierenden
Zellen, insbesondere während der Zelladhäsion. Dadurch trägt die Erzeugung biologischer
und medizinisch relevanter Prozesse in Kombination mit dem biophysikalischen Aufbau dazu
bei, die Krankheitsmechanismen sowie die Wirkung von Therapeutika bei Krankheiten wie GT
und ITP zu verstehen.
Contribution of Others
Within the scope of this PhD thesis, several students wrote their Master and Bachelor theses
under my direct supervision in the Biophysical Chemistry group of Prof. Mihaela Delcea at the
University of Greifswald.
Therefore, I would like to mention Theresa Brinker, that carried out most of the AFM
measurements. In addition, Marco Harms, Alexandra Mitlehner and Aileen Weide established
the integrin purification, as well as the new lipidic system protocols, while Sophie Möller
contributed to the QCM-D experiments of nanoparticle-protein conjugates interacting with lipid
membranes.
Furthermore, MDS studies were performed by Dr. Martin Kulke and Norman Geist. Dr. Ulrike
Martens carried out the nanoparticle characterization and Dr. Peter Nestler prepared all AFM
images of QCM sensor crystals. TEM images were taken under direction of Dr. Rabea Schlüter
from the Imaging lab at the University of Greifswald.

IV
List of Abbreviations
The commonly used abbreviations for chemical and physical units, amino acids and DNA
bases are utilized.
αIIbβ3 Integrin αIIbβ3 or Glycoprotein IIbIIIa
ADP Adenosine diphosphate
ADMIDAS Adjacent site of MIDAS
AFM Atomic force microscopy
AH α-helical
Amp Ampicillin
ATP Adenosine triphosphate
AU Absorbance unit
BCA Bicinchoninic acid
BSA Bovine serum albumin
CD Circular Dichroism
CD41/61 Cluster of differentiation 41/61
CHAPS 3-[(3-Cholamidopropyl)-dimethylammonio]-1-propansulfonat
CIB1 Calcium- and integrin-binding protein 1
CMC Critical micelle concentration
ConA Concanavalin A
D Dissipation (QCM-D)
DAG Diacylglycerol
DC Deformability cytometry
DLS Dynamic light scattering
DMEM Dulbecco´s modified eagles medium
DMPC 1,2-Dimyristoyl-sn-glycero-3-phosphocholine
DMPG 1,2-Dimyristoyl-sn-glycero-3-phospho-(1'-rac-glycerol)
DMSO Dimethyl sulfoxide
DOPC 1,2-Dioleoyl-sn-Glycero-3-Phosphocholine
DTT Dithiothreitol
E. coli Escherichia coli
ECM Extracellular matrix
EDTA Ethylene diamine tetra acetic acid
e.g. exempli gratia
EGF Epidermal growth factor
ELISA Enzyme-linked immunosorbent assay
Emmeans estimated marginal means

V
ex/em Excitation/Emission
f Frequency (QCM-D)
FA Focal adhesions
FACS Fluorescence activated-cell sorting
FAK Focal adhesion kinase
FCS Fetal calf serum
Fb Fibrinogen
FITC Fluorescein isothiocyanate
FSC-A Forward scatter-area
FSC-H Forward scatter-height
g Factor of earth acceleration
G-418 Geneticin 418
GDP Guanosine diphosphate
GP Glycoprotein
GT Glanzmann thrombasthenia
GTP Guanosine triphosphate
HEK293 Human embryonic kidney 293
HEPES 2-[4-(2-hydroxyethyl)-1-piperazine]-ethane sulfonic acid
HRP Horseradish peroxidase
i.e. id est
IgM/IgG Immunoglobuline M/G
ITAM Immune receptor tyrosine-based activation motif
LIBS Ligand induced binding sites
LIMBS ligand-induced metal binding site
LUV large unilamellar vesicle
MES 2-(N-morpholino) ethane sulfonic acid
MIDAS Metal ion dependent adhesion site
MLV Multilamellar vesicle
NMR Nuclear magnetic resonance
NP Nanoparticle / Nonyl phenoxy polyethoxyl ethanol
OD Optical density
Optiprep Iodixanol 60 %
PAGE Polyacrylamide gel electrophoresis
PAR1 Proteinase activated receptor 1
PBS Phosphate buffer saline
PC Phosphatidylcholine
PDB Protein data bank

VI
PDI Polydispersive index
PE Phosphatidylethanolamine
PI3K Phosphoinositide 3-kinase
PKC Protein kinase C
PMSF Phenylmethylsulphonyl fluoride
PS Phosphatidylserine
PSD Position sensitive device
PSI Plexin-Semaphorin-Integrin domain
PTB Phospho-tyrosine binding
QCM-D Quartz crystal microbalance with dissipation monitoring
Rho Ras homolog gene
RT-DC Real time-deformability cytometry
SDS Sodium dodecyl sulfate
SEC Size exclusion chromatography
SEM Standard error of the mean
SM Sphingomyelin (N-stearoyl-D-erythro-sphingosylphosphorylcholine)
SSC-A Side scatter area
SUV Small unilamellar vesicles
Syk Spleen tyrosine kinase
SyMBS Synergistic metal ion binding site
TBST Tris buffed saline with tween-20
TC Tissue culture
TEM Transmission electron microscopy
TLC Thin layer chromatography
Tris 2-Amino-2-(hydroxymethyl)-1,3-propanediol
TXA2 Thromboxane A2
ULV Unilamellar vesicle
vWF von Willebrand factor
WB Western blot
WT Wildtype
YM Young’s Modulus

1
1. Introduction
1.1. Platelets and their role in health and disease Blood platelets are playing the major role in hemostasis and thrombosis. These anucleated
cells are produced by megakaryocytes in the bone marrow and circulate in the blood up to 10
days at high levels of 150-400 cells/µL whole blood until they are cleared in the liver and the
spleen. Contact of platelets with extracellular matrix (ECM) induced by injuries of the vessel
walls leads to a rapid adherence and aggregation resulting in clot formation, which prevents
excessive bleeding (Gianazza et al. 2020). Platelet function needs to be balanced since non-
functional clot formation causes bleeding disorders, whereas increased platelet reactivity leads
to higher risk of thrombosis. Currently, many studies focus again on additional platelet qualities
including inflammatory response in adaptive and innate immunity (Semple et al. 2011). In
response to several stimuli, platelets change their shape and release their granules, which in
turn, induces a signaling cascade activating more platelets, consequently. The different
granules contain secretion products such as coagulation factors, chemokines, cytokines,
prostaglandins and thromboxane A2. Among others, the fibrinogen receptor integrin αIIbβ3,
also named glycoprotein (GP) IIb/IIIa, is activated and platelet aggregation is initiated (Ghoshal
and Bhattacharyya 2014). Platelets are involved in a multitude of diseases including
hemostatic disorders, but also in diseases that are only indirectly related to platelet function
(e.g. atherothrombosis, diabetes mellitus, inflammatory diseases, cancer and neurological
disorders) (Gianazza et al. 2020).
Together with thrombotic thrombocytopenic purpura, von Willebrand disease, Bernard-Soulier
syndrome and Glanzmann thrombasthenia, immune thrombocytopenia (ITP) is one of the
common platelet disorders (Krishnegowda and Rajashekaraiah 2015). In most ITP patients,
autoantibodies target the platelet integrin αIIbβ3, which is followed by opsonization and
clearance of platelets by the immune system. This leads to higher bleeding risk, consequently
(Audia et al. 2017). The underlying mechanism is still unknown, although viral antigens and
antigenic mimicry may play an important role. Additionally, ITP emerges as accompanying
disease of autoimmune disorders, such as lupus erythematosus (Cines et al. 2009). Among
acute ITP (which affects mostly children) and chronic ITP, other isoforms are known e.g.
neonatal alloimmune thrombocytopenia, where maternal antibodies cross the placenta during
pregnancy, bind fetal platelet antigens and induce severe thrombocytopenia (Audia et al.
2017). Moreover, clinically used drugs can induce antibodies directed to platelet antigens, or
can decrease the platelet count and lastly, may cause thrombocytopenia. Potential drugs are
e.g. ibuprofen, tamoxifen, but also the αIIbβ3 inhibitors tirofiban and eptifibatide, that induce
antibodies directed to ligand-induced binding sites (LIBS) (Visentin and Liu 2007). The anti-

2
malaria drug quinine, is also known as a drug that causes destruction of platelets by the
immune system (Zhu et al. 2015).
The integrin αIIbβ3 is additionally responsible for the inherited bleeding deficiency Glanzmann
thrombasthenia (GT) characterized by dysfunctional integrin or the complete absence of
platelets caused by plenty of mutations in the genes encoding for both integrin subunits (Solh
et al. 2015). Interestingly, some cases of acquired GT are characterized by the presence of
antibodies that inhibit adhesive platelet function, without platelet destruction (Porcelijn et al.
2008).
1.2. Platelet activation Platelet activation includes various signaling pathways and is a highly complex biological
process illustrated in Figure 1. After exposure of ECM caused by injuries, platelet adhere via
glycoprotein receptors, mainly GP VI and exposed von Willebrand factor (vWF)/collagen
complexes leading to formation of a platelet monolayer. As a consequence, cells change their
shape and release their content of alpha- and dense granules, including important clotting
factors, as well as the platelet agonists thrombin, thromboxane A2, adenosine diphosphate
(ADP) and prostaglandin E2. Platelet activation induced by glycoproteins is mediated by
immunoreceptor tyrosine-based activation motif signaling, whereas stimulation through
agonists includes G-protein-coupled receptors.
Figure 1: Schematic illustration of clot formation. Upon injury, platelets and red blood cells bind to the ECM and are activated leading to release of clotting factors. In turn, these induce the coagulation cascade resulting in thrombin and fibrin formation among others. A stable clot is formed by activated platelets that aggregate and connect via activated integrin αIIbβ3 bridged with fibrinogen. Adapted from (Versteeg et al. 2013)

3
Agonist-initiated platelet activation signaling, e.g. by cleavage of protease-activated receptors
(PAR) by thrombin, starts with activation of phospholipase C, which leads downstream to
increased cytosolic Ca2+ ion concentration. As a consequence, the guanosine triphosphate
(GTP)-binding protein Rap1 is activated and initiates the binding of talin-1 to the cytoplasmatic
domain of integrin αIIbβ3. This integrin makes the platelet-platelet adhesion over fibrinogen or
vWF cross-linking feasible and plays a crucial role in aggregation as well as thrombus
formation. After binding of talin-1 and kindlin-3, αIIbβ3 receptor is upregulated and its activation
is induced. Due to the conformational shift, binding of its ligands is possible (Michelson et al.
2019; Yun et al. 2016). Typical ligands include fibrinogen, fibrin, von Willebrand factor,
fibronectin, vitronectin and thrombospondin-1. Many of these molecules contain a short RGD
motif, which is the main peptide sequence recognized by αIIbβ3. However, αIIbβ3 binds also
to other binding sites, e.g. the KQAGDV sequence in the γ-chain of fibrinogen (Durrant et al.
2017; Huang et al. 2019). The detailed activation of αIIbβ3 is described in Chapter 1.5.3.
Another important progress during hemostasis is the initiation of the coagulation cascade,
which ultimately leads to fibrin formation. Factor VII is released by damaged blood vessels and
forms a complex with tissue factors, which in turn, leads to the initiation of the activation of
various factors resulting in thrombin and other feedback loop activation. Thrombin is a serine
protease which causes fibrinogen conversion to fibrin to form a stable mesh around the platelet
clot (Figure 1). Simultaneously, negative regulatory control mechanisms are initiated e.g. by
inhibitors like antithrombin (Versteeg et al. 2013).
1.3. Platelet mechanics and cytoskeleton Upon injury, the platelet clot is a highly active material with a hierarchical structure. Fully
activated platelets form a compact core, whereas decreasingly less activated platelets are in
the outer shell due to an agonist concentration gradient rising from the inner core regulating
additionally the packing density. Platelets play a major role in regulation of forces and
contraction within the clot. Due to their contractive forces, stiffness of the clot increases
significantly and platelet-derived filopodia can remodel the fibrin mesh (Williams et al. 2019;
Lam et al. 2011). The cytoskeletal morphologies and shape changes upon clot formation
involve complex signaling pathways and proteins such as αIIbβ3 receptor, resulting in actin
remodeling.
However, platelets not only function as an executer, they are also highly sensitive
mechanosensors. They directly respond to the stiffness of their surroundings, which impacts
adhesion, aggregation and activation of the cells. Studies show that platelets respond to
immobilized, but not to soluble fibrinogen by integrin tension regulation (Zhang et al. 2018).
Spreading of platelets on fibrinogen show, among various F-actin bundles, contractile stress
fibers and thus, cytoskeletal rearrangements (Burridge and Wittchen 2013). Interestingly,

4
studies with platelets from patients suffering from Glanzmann thrombasthenia show
significantly rounder shaped cells and reduced cytoskeletal remodeling (Lickert et al. 2018).
This indicates already the important role of integrin αIIbβ3 in platelet mechanics.
Integrins and associated proteins build highly dynamic structures, the cell-matrix adhesions,
such as focal complexes, focal adhesions, fibrillary adhesions and podosomes. These
structures are characterized by the linkage of actin to the membrane resulting in places of
mechanotransduction by connection of ECM and cytoskeleton. Basically, such places, called
focal complexes, are initiated by the clustering of integrins. The latter evolve into stable focal
adhesions by either intracellular contractive machinery mediated by actomyosin or
extracellular-derived forces. The assembly of focal adhesions is mainly regulated by tyrosin
phosphorylation by e.g. Src kinases, focal adhesion kinase and phosphoinositid-3-kinase.
Typical proteins in focal adhesions are talin and tyrosine-phosphorylated proteins, that directly
link integrin and actin, but more than 50 other molecules with various functions are involved,
such as paxillin, Rho and vinculin (Geiger et al. 2001).
The fundamental process of shape change, upon the contractile event during platelet
activation, transmigrates from discoid shape, over spherical and slightly smaller cells right up
to formation of pseudopodia and lamellipodia. Fully spreading of platelets involves a radical
rise in polymerized actin. Unstimulated platelets contain only 40-50 % actin filaments (F-actin),
which escalate to 70 % after thrombin-induced stimulation. An essential molecule upon that
process is the Arp 2/3 complex, which induces the pointed-end nucleation activity of actin
filaments and causes branched polymers, consequently. Typical actin structures in activated
platelets are filopodia, lamellipodia, stress-like fibers and the contractile ring (Figure 2), (Bearer
et al. 2002).
Figure 2: Actin structures in activated cells/platelets. Schematic illustration of different actin structures showing stress fibers, lamellipodia, filopodia and contractile elements forming a contractile ring in activated platelets. Adapted from (Blanchoin et al. 2014)
5
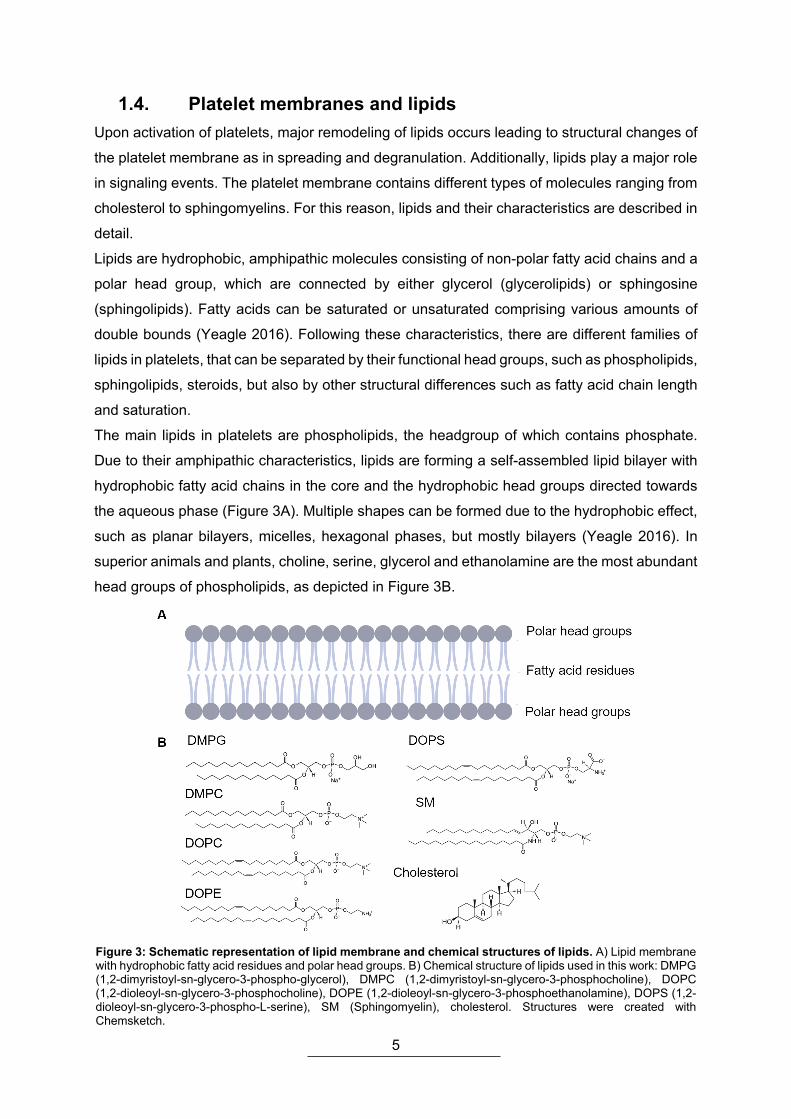
1.4. Platelet membranes and lipids Upon activation of platelets, major remodeling of lipids occurs leading to structural changes of
the platelet membrane as in spreading and degranulation. Additionally, lipids play a major role
in signaling events. The platelet membrane contains different types of molecules ranging from
cholesterol to sphingomyelins. For this reason, lipids and their characteristics are described in
detail.
Lipids are hydrophobic, amphipathic molecules consisting of non-polar fatty acid chains and a
polar head group, which are connected by either glycerol (glycerolipids) or sphingosine
(sphingolipids). Fatty acids can be saturated or unsaturated comprising various amounts of
double bounds (Yeagle 2016). Following these characteristics, there are different families of
lipids in platelets, that can be separated by their functional head groups, such as phospholipids,
sphingolipids, steroids, but also by other structural differences such as fatty acid chain length
and saturation.
The main lipids in platelets are phospholipids, the headgroup of which contains phosphate.
Due to their amphipathic characteristics, lipids are forming a self-assembled lipid bilayer with
hydrophobic fatty acid chains in the core and the hydrophobic head groups directed towards
the aqueous phase (Figure 3A). Multiple shapes can be formed due to the hydrophobic effect,
such as planar bilayers, micelles, hexagonal phases, but mostly bilayers (Yeagle 2016). In
superior animals and plants, choline, serine, glycerol and ethanolamine are the most abundant
head groups of phospholipids, as depicted in Figure 3B.
Figure 3: Schematic representation of lipid membrane and chemical structures of lipids. A) Lipid membrane with hydrophobic fatty acid residues and polar head groups. B) Chemical structure of lipids used in this work: DMPG (1,2-dimyristoyl-sn-glycero-3-phospho-glycerol), DMPC (1,2-dimyristoyl-sn-glycero-3-phosphocholine), DOPC (1,2-dioleoyl-sn-glycero-3-phosphocholine), DOPE (1,2-dioleoyl-sn-glycero-3-phosphoethanolamine), DOPS (1,2-dioleoyl-sn-glycero-3-phospho-L-serine), SM (Sphingomyelin), cholesterol. Structures were created with Chemsketch.

6
Another major membrane component within the lipids are the sphingolipids, such as
sphingomyelin (SM). Together with cholesterol, SM are the main elements of lipid rafts, that
are enriched specialized signaling areas (Yeagle 2016). Cholesterol belongs to sterols group
and has a rigid hydrocarbon skeleton with one hydroxyl group (Figure 3B). Cholesterol
increases both membrane stability and permeability. It arranges within the gaps between the
different fatty acid chains in the membrane. At exceedingly disordered region, as well as high
temperatures, cholesterol promotes membrane rigidity. However, in ordered membrane areas
or low temperatures cholesterol weakens the cohesive forces between the fatty acid residues
and mediates destabilization (Lee 2011; Kaiser et al. 2009; Brügger 2014).
The thermodynamic phases, also called gel phase (disordered) and liquid crystalline (ordered)
phase, are affected by increasing fatty acid tail lengths and the number of double bounds,
which reflects characteristic transition temperatures (Tm). Due to this fact, lateral diffusion of
lipids within the membrane (which is generally in fluid phase in a range of 1 µm2/s) can be
controlled (Sunshine and Iruela-Arispe 2017). Additionally, an exchange of lipids within the two
leaflets is slower and depends on the nature of head group, temperature, and fatty acid chain
length (Berg et al. 2002). In this PhD thesis, 1,2-dimyristoyl-sn-glycero-3-phosphocholine
(DMPC), 1,2-dimyristoyl-sn-glycero-3-phospho-glycerol (DMPG), 1,2-dioleoyl-sn-glycero-3-
phosphocholine (DOPC), SM (Sphingomyelin) and cholesterol were used as representative
lipids for biomimetic studies.
Membranes allow rotational, translational and trans-bilayer movement of lipids within the
membrane, which affects asymmetry. In platelet membranes, the cytosolic leaflet contains
phosphatidylethanolamine (28 %) and phosphatidylserine (10 %), while the external leaflet
contains mainly sphingolipids (18 %) and phosphatidylcholine (40 %) (Figure 4). Moreover,
membrane fluidity is maintained by integrated cholesterol (O'Donnell et al. 2014; Sunshine and
Iruela-Arispe 2017). Platelet membranes consist of sphingomyelins and cholesterol that are
enriched in specific domains (Figure 4) characterized by liquid-ordered instead of liquid-
disordered phases, namely lipid rafts (Kaiser et al. 2009).
Figure 4:Lipid distribution in the platelet membrane. The outer leaflet of the membrane comprises mainly PC (in grey) and the inner leaflet PS (in orange) and PE (in blue). SM (in green) and cholesterol (in black) are enriched in specific signaling domains, called lipid rafts.
7
Upon platelet activation, the membrane provides substrates for different enzyme reactions
converting lipids, consequently. This rearrangement contributes to the change in platelet shape
and the generation of prothrombotic substances, e.g. prostaglandins, phosphatidylinositides
and diacylglycerol. Additionally, conversion of lipids results in rising amount of
phosphatidylserine or phosphatidyl-ethanolamine in the external leaflet. Therefore, Ca2+ influx
is preserved and ions accumulate at the negatively charged membrane. Consequently,
scramblases are stabilized and promote coagulation by phospholipid rearrangements
(Williamson 2015; O'Donnell et al. 2014). Because integrins and also lipid composition, play a
major role in platelet activation, it is clear that lipid rafts present a key role in integrin function.
For instance, the lymphocyte integrins LFA-1 and α4β1 are recruited to lipid rafts upon T-cell
stimulation (Leitinger and Hogg 2002). In addition, the lateral organization of the plasma
membrane and its raft domains are associated with actin filamentous structures, which can be
inhibited by blocking of αIIbβ3. However, no integrin αIIbβ3 was detected in rafts after platelet
activation (Bodin et al. 2005).
1.5. The platelet integrin αIIbβ3 1.5.1. Integrins
Integrins are transmembrane receptors in vertebrates encoded by two genes in humans on
chromosome 17. They are responsible for a variety of unique functions depending on the type
of integrin. The most important function is the regulation of cell-cell and cell-ECM interaction
and therefore, cell adhesion as well as other physiological cell processes such as cell
migration, cell recruitment, tissue anchoring, inflammatory responses and cell aggregation
(Hughes 2001; Ye et al. 2012).
Integrins are heterodimeric bidirectional receptors composed of two non-covalently bound
subunits, namely α- and β-subunit. There are 18 α- und 8 β-subunits known, that could form
up to 24 different receptors with various purposes and distributions within the body. Each
subunit has one helical transmembrane domain and an unstructured short cytoplasmatic part,
that is important for integrin activation. The large extracellular fragment, containing the head
domain formed by both subunits, undergoes dramatic rearrangements upon integrin activation,
pointing the N-terminus towards the extracellular space (Campbell and Humphries 2011;
Michelson et al. 2019). The variety of integrin ligands indicates several different signaling
pathways. Most intracellular ligands are binding to the cytoplasmic tail of the β-subunit, which
enables to categorize the integrins evolutionary. β1, β2 and β7 integrins represent two thirds
of all integrins with loss of these integrins leading to severe effects, e.g. immunodeficiency and
neurological disorders. β3, β5, β6 and β8 integrins are arginine-glycine-aspartate (RGD) motif

8
receptors, with ligands such as collagen, laminin or fibrinogen. β4 integrins have a different
cytoplasmic domain and are only associated with the α6-subunit (Hughes 2001).
Only two integrins are formed with the β3-subunit, αIIbβ3 and αVβ3, which are both expressed
in platelets, while αVβ3 is additionally present in e.g. leukocytes, endothelial and cancer cells.
Platelets retain vascular integrity and prevent life-threatening blood loss. The possibility of clot
formation upon injury, is strongly dependent on the capability to aggregate. This is mediated
by integrin αIIbβ3, which is the most abundant platelet receptor with 80,000 copies per cell
representing 17% of total protein mass in the platelet membrane. Both subunits are
glycosylated polypeptide chains. After post-translational processing of the αIIb-subunit into a
heavy and a light chain linked by a disulfide bridge in the Golgi-apparatus, the 235 kDa protein
translocates to the membrane. Generally, all integrins undergo transition from a low affinity
state (bent, resting state) to a high-affinity state (active, extended) (Michelson et al. 2019;
Bennett 2005; Campbell and Humphries 2011).
1.5.2. Structure of αIIbβ3 The overall structure of platelet integrin αIIbβ3 is depicted in Figure 5A. The extracellular
domain of the αIIb-subunit contains a seven-bladed β-propeller, that could bind four divalent
ions providing stability to the interface through the thigh domain. The latter is followed by calf1-
and calf 2-domains, that are giving rigidity due to the large hydrophobic interface. The leg
domain contains two flexible areas, where the one between thigh and calf domain serves as a
“knee” region. The β3 extracellular domain comprises an A-domain with six β-sheets encircled
by 8 α-helices (Figure 5B). Additionally, this domain contains three metal-ion binding sites: the
metal-ion dependent adhesion site (MIDAS), the adjacent to MIDAS (ADMIDAS) and a ligand-
induced binding site also named as synergistic metal ions binding site (SyMBS). The A-domain
forms a large interface with the hybrid domain containing both hydrophilic and hydrophobic
residues. The plexin-semaphorin-integrin (PSI)-domain connects the hybrid domain with four
epidermal growth factor (EGF) like-domains, that contain flexible regions between the
individual parts and are cysteine-rich, but all 56 cysteines form disulfide bonds. A
conformational change and the flexibility of the legs cause a movement of the α7-helix in the
A-domain towards the hybrid domain, which leads to a swing-out motion of the hybrid domain
upon activation of integrin (Figure 5B; transition from yellow to orange). The extracellular β3
leg-domain finishs with a β-tail proximal to the membrane (Michelson et al. 2019; Campbell
and Humphries 2011; Bennett 2005).
Both subunits creating an interface between the β-propeller of the α-subunit and the A-domain
within the β-subunit. This forms, according to electron microscopy (EM) (Dai et al. 2015) and
cryo-EM (Adair and Yeager 2002; Xu et al. 2016), a globular head domain, whereas the other
parts display the stalk domains.

9
The transmembrane domains of both subunits are mostly α-helices that cross at a 25-30°
angle. These regions contain mostly hydrophobic amino acids, especially a GFFKR (glycine-
phenylalanine-phenylalanine-lysin-arginine) sequence serving as a crucial binding site for
Figure 5: Integrin αIIbβ3 structure. A) Structure of αIIbβ3 in closed (left) and open/active (right) conformation in a DMPG:DMPC (1:20) lipid membrane (cyan). αIIb-subunit is depicted in blue and β3-subunit in orange. Picture combines the structure from PDB-code 2k9j and ectodomain (PDB-code 3fcs), missing residues were added as random coils. Adapted from (Janke et al. 2019). B) Close-up view of the ligand-occupied β3 A-and hybrid-domain from PDB-code 2vdr (orange) aligned with A-domain from closed conformation (yellow; PDB-code 3fcs). Ca2+ (green) are located in the MIDAS and ADMIDAS. Swing-out motion of the hybrid domain is shown due to movement of the α7-helix upon integrin activation.

10
various intracellular regulator proteins. Transmitting of signals upon the different conformations
initiated through this sequence seems to be important for maintaining integrin inactive (Kim et
al. 2011; Michelson et al. 2019). Additionally, there are electrostatic interactions between the
two helices in the transmembrane domains of both subunits upon resting state, that are
destructed in active conformation (Ma et al. 2007). Therefore, the transmembrane domains
play an essential role in transmission of signals across the membrane.
The cytoplasmatic tails of αIIbβ3 are characterized by α-helices, but mostly unstructured
domains. In the absence of interaction partners, they are flexible and transient structures,
whereby both subunits interact with each other through their membrane proximal regions by
electrostatic and hydrophobic interactions. The β3-tail contains a NPLY and a NITY recognition
motif that induce binding of talin-1 and kindlin-3 via their PTB (phosphotyrosine binding)-
domain (Michelson et al. 2019). The talin head region associates with the β-tail, but whole
protein has also additional binding sites for actin and vinculin, which serves as a mechanical
link between integrin and the cytoskeleton. Moreover, talin faces the membrane by its positively
charged residues, which promotes the dissociation of the integrin cytoplasmatic tails by
breaking the salt bridge between αIIb- and β3-subunit and changes the angle of the
transmembrane domains, consequently (Kim et al. 2011). With the help of kindlin, talin induces
integrin activation and serves as a force sensor, as well as integrin affinity regulator (Sun et al.
2019).
1.5.3. Activation and function of αIIbβ3 Integrin αIIbβ3 exists in at least three conformational states: i) the bent conformation with the
head domain pointing towards the membrane, ii) the extended conformation but closed head,
and iii) the extended conformation with open head domain, which correspond to low-,
intermediate, and high affinity states, respectively (Xu et al. 2016).
Inside-out activation Activation process is achieved by two ways: i) receptor clustering and lateral movement, which
increases the avidity of ligand interactions, and ii) induction of conformational changes in both
subunits of the integrin increasing the ligand affinity. This requires a mechanism that converts
signals from the intracellular space through the membrane and a large distance (~20 nm),
which extends the extracellular domain of the integrin, consequently. The procedure, called
inside-out signaling, is initiated by multiple stimuli that work synergistically such as: agonist
binding to platelet receptors, e.g. protease-activated receptor 1 (PAR1), cell adhesion and
shear stress. In turn, diacylglycerol (DAG) is activated and intracellular Ca2+ concentration
arises, which activates Rap1, a small GTPase, and the protease calpain that cleaves talin-1
(Michelson et al. 2019). The latter consist of a 50 kDa head and a 220 kDa rod-domain. Talin
binds to the cytoplasmic tail of the β3-subunit and displace the αIIb-subunit away by binding to
the membrane proximal region. Kindlin-3 is significant for integrin activation and supports

11
activation by talin (Sun et al. 2019). The separation of the two subunits transmits the signal
through the transmembrane domains and this in turn, provides the driving force to trigger the
reversible conformational change in the extracellular domain. As a consequence, swing-out
motion of the hybrid domain causes opening of the integrin head domain (switchblade-model),
which is presented in Figure 5B. The platelet integrin conformation equilibrium changes
towards the high-affinity state and ligand binding is feasible (Ma et al. 2007; Kim et al. 2011;
Campbell and Humphries 2011). However, some studies predicting the so-called deadbolt-
model, where integrin stays in the bent conformation even upon ligand binding (Adair et al.
2005). Among the fact that talin connects integrin with the actin cytoskeleton, the degranulation
of actin polymers leads to a reduction of the tensile force and a reassociation of the subunits
as well as ligand dissociation, consequently (Michelson et al. 2019). The inside-out activation
is depicted schematically in Figure 6.
Ligand binding Typical ligands of αIIbβ3 are fibrinogen, fibrin, vWF and fibronectin, but their binding to integrin
requires divalent ions. Most ligands contain an RGD motif or additional binding motifs, as in
the γ-chain of fibrinogen which contains the KQAGDV motif. RGD binds the interface of the β3
A-domain and the αIIb β-propeller, whereby the acidic residues coordinate the divalent cation.
Fibrinogen is a major αIIbβ3 ligand and consists of Aα, Bβ and γ chains formed into three
Figure 6: Inside-out activation of integrin αIIbβ3. Platelets are activated and downstream of the activation cascade talin-1 is activated. Talin-1 binds to the cytoplasmatic tail of the β3-subunit (orange) and brings the bent (A) conformation of αIIbβ3 to the extended conformation (B). Ligand binding is possible leading to the ligand-occupied active conformation (C), is able to trigger further signaling cascades and can function as a mechano-sensor with the help of actin.

12
nodular domains. It intermediates integrin-integrin interaction and thus, promotes platelet
aggregation. Upon ligand binding, ligand-induced binding sites can be exposed and can induce
neoepitopes (i.e. new antibody-binding sites) being a cause of ITP (Bennett 2005; Campbell
and Humphries 2011). Bhoria et al. used the conformation-specific antibody PAC-1, which
exclusively recognizes the active state of integrin αIIbβ3, and observed binding to platelets
from patients suffering from ITP and thus, suggested that integrin αIIbβ3 exists in an active
state upon circulation (Bhoria et al. 2015). PAC-1 binds at the fibrinogen binding site formed
by the head domain (Taub et al. 1989). Other ligands, specifically several clinically used drugs,
are able to bind to αIIbβ3 and could induce conformational changes and even secondary drug-
induced autoantibodies. Potential candidates are αIIbβ3 inhibitors such as tirofiban, eptifibatide
or abciximab, but also the anti-malaria drug quinine (Visentin and Liu 2007). In addition, the
anticoagulant unfractionated heparin (UFH) is able to induce platelet aggregation and αIIbβ3
affinity changes (Xiao and Théroux 1998; Yagi et al. 2012; Gao et al. 2011). Interestingly, also
low-molecular weight heparins can affect integrin outside-in signaling, induce conformational
changes and platelet activation, which can be blocked by αIIbβ3 antagonists (Hashemzadeh
et al. 2008).
Outside-in signaling The outside-in signaling initiates complex pathways that act as a signal transducer to the cell
cytoplasm causing multiple cellular responses ranging from platelet spreading, clot formation,
cytoskeletal rearrangements and force sensing. The key players are members of the Src-family
and Syk kinases that are activated by tyrosine phosphorylation, as it is the case for various
proteins as well as the β3-tail. Downstream of the mentioned kinases phospholipase C, focal
adhesion kinase and protein kinase C are activated. Moreover calcium- and integrin-binding
protein 1 binds to the αIIb cytoplasmic tail and acts, among others as a negative regulator. It
should also be mentioned that Rho GTPase and Arp2/3 complex are part of the actin
machinery (Durrant et al. 2017).
1.5.4. The role of divalent cations in integrin activation In the human blood, 1 mM Ca2+ and 1 mM Mg2+ concentrations are observed that keep the
integrin in an inactive state and stabilize its structure. Intracellularly, integrins are activated
through inside-out activation by talin inducing the switchblade opening resulting in extension
of the head domain away from the plasma membrane. The equilibrium of the cell surface
integrins can be shifted by various stimuli, such as metal ions (Michelson et al. 2019).
There are several cation binding-sites throughout the integrin. The β-propeller of the αIIb-
subunit employs four divalent ion binding sites that are within the blades and coordinated
aspartic acid and asparagine residues giving rigidity to the structure. Mutagenesis analyses
show their importance for ligand recognition and heterodimer formation in integrin biogenesis
(Zhang and Chen 2012; Campbell and Humphries 2011). An additional Ca2+ binding site is

13
located at the “knee” between thigh and calf-1 domain, formed by highly acidic amino acids
and stabilizes the structure in both bent and extended conformation. Additionally, β3-subunit
A-domain consists of a metal ion cluster that consists of three metal ion binding sites. At the
center is the metal ion-dependent adhesion site (MIDAS), which is coordinated by Asp119,
Ser121, Ser123, Glu220 and Asp251. This region is responsible for signals from the integrin
head to other integrin domains and crucial for ligand binding, especially RGD-containing
ligands (Michelson et al. 2019; Zhang and Chen 2012). The MIDAS is flanked by two other
metal ion binding sites: the ADMIDAS and the SyMBS. Together with MIDAS, these regions in
the α7 helix support swing-out motion of the hybrid domain resulting in the transition from low
to a high-affinity state (Figure 5B). ADMIDAS inhibits the activation at high Ca2+ levels, whereas
Mn2+ compete with Ca2+ and increases ligand binding. Similarly, the SyMBS is a positive
regulator for increased ligand affinity (Michelson et al. 2019; Campbell and Humphries 2011).
Exogenously, integrins can be activated by specific antibodies, reducing agents and divalent
ions. Mn2+ increases the affinity to fibronectin of all β1-and β3-integrins. Almost all integrins
show an increased ligand affinity upon removal of Ca2+ but rise of Mn2+. Generally, Mn2+ and
Mg2+ supports ligand binding while Ca2+ inhibits binding. The affinities of the respective ions to
the metal ion binding sites are Mn2+>Mg2+>Ca2+. The non-physiological stimulus of Mn2+ shifts
the conformation equilibrium towards the active form. However, various experiments ranging
from studies with liposomes (Ye et al. 2008), FRET (Förster Resonance Energy Transfer)
(Zhang and Chen 2012) to cryo-EM (Ye et al. 2012) show controversial results concerning the
question, whether Mn2+ leads in fact to increased ligand affinity, but no maximal extension.
1.6. Biomimetic membrane systems 1.6.1. Model membranes
Biological membranes play a crucial role in life, display a site of communication and a barrier
between the inside and the outside of the cell. Many groundbreaking findings were achieved
over the past century, starting in 1916 with the study of surface chemistry by Langmuir
(Langmuir 1916), continuing with the discovery of the cell membrane by Gorter and Grendel
(Gorter and Grendel 1925), followed by the ultrastructure of a bilayer (Robertson 1959) and
the fluid mosaic model of cell membranes by Singer and Nicolson in the 70’s (Singer and
Nicolson 1972).
The design of biomimetic surfaces and the construction of model membranes enable the
elucidation of the basic principles of membrane biophysics. The investigation of membrane
proteins in vivo is impaired by multiple associated proteins and signaling pathways that might
interfere (Zhao and Lappalainen 2012). To study individual embedded proteins and their
activity, several biomimetic model membranes are suitable and allow the investigation under
physiological conditions. Transmembrane proteins conformation and activity can be modulated

14
by the lipid composition, e.g. hydrophilic and hydrophobic properties. Therefore, creation of
appropriate model membranes requires optimization to retain protein stability and activity.
Various model membranes were studied in the past. First, Langmuir monolayers should be
mentioned, where lipids self-assemble at the air-water interface. With this technique, surface
pressure, thickness and area can be controlled, but bilayer formation is only possible via
transfer to a solid substrate in air. Second, the formation of liposomes, a self-closed lipid
bilayer, can easily be formed by extrusion and sonication techniques. Protein reconstitution
requires detergents, that are forming phospholipid-protein-detergents mixtures. Detergents are
then slowly removed by dialysis, gel filtration or biobeads adsorption. Upon reaching the lipid
critical micelle concentration (CMC), the protein will spontaneously interact with the lipid
membrane and create proteoliposomes. Unfortunately, final orientation of the reconstituted
protein is only subject to limited control (Shen et al. 2013).
By vesicle fusion on hydrophilic supports due to van-der-Waals, electrostatic, hydration and
steric forces, supported lipid bilayers (SLB) are formed. Hence, numerous processes are
possible when liposomes meet a surface. Adsorption alone could already deform the
membrane leading to formation of bilayer disks. This deformation could be also induced by
neighboring vesicles, that fuse and rupture. Additionally, these patches could encourage more
vesicle fusion. These events are dependent on membrane-surface, intermembrane and intra-
membrane forces. Moreover, factors such as surface charge and roughness as well as vesicle
composition, concentration, charge and environmental conditions (pH, osmotic pressure,
temperature and ionic strength) play a critical role (Richter et al. 2006; Hardy et al. 2013).
However, in SLB formation one side of the hydrophilic head groups are tightly attached to the
surface, which affects the fluidity and orientation of the protein. Hence, tethered polymer SLB
systems were developed, e.g. with polyethylene glycol (PEG), creating space between
protein/membrane and support (Jackman et al. 2012). Lastly, nanodiscs shall be mentioned,
which make the study of individual particles and activity assays feasible. They are
characterized by self-assembly of lipids, that are surrounded by a membrane scaffold protein.
Such studies were already performed with various membrane proteins, e.g. G-protein coupled
receptors (Leitz et al. 2006), cytochrome molecules (Davydov et al. 2005) and insulin receptor
(Gutmann et al. 2020).
1.6.2. Liposomes Liposomes are vesicles consisting of one or more concentric bilayers enclosing aqueous
solution, which are presented as multilamellar vesicles (MLV) or unilamellar vesicles (ULV).
Further subgroups can be formed into small, large and giant ULV (Dimova 2019).
The reconstitution system strongly influences the activity of proteins. Thus, reconstitution
protocols require optimization. For integrin αIIbβ3, numerous studies were carried out using
liposomes (Ye et al. 2010), nanodiscs (Choi et al. 2013) and lipid bilayers (Frohnmayer et al.

15
2015). This PhD thesis focuses on protein reconstitution into liposomes. Basically, the
production of proteoliposomes is carried out by addition of detergents, followed by their slow
removal via addition of biobeads or extensive dialysis. There are several studies with
liposomes and reconstituted integrin molecules using lipids such as DMPC, DMPG (Erb and
Engel 2000), egg PC, PS (Ye et al. 2012), DOPC, 1,2-dipalmitoyl-sn-glycero-3-phosphocholine
(DPPC) and cholesterol (Ge et al. 2018).
Since 1960, liposomes find an application in nanomedicine, especially cancer therapy, due to
their improved bioavailability, decreased toxicity, increased circulation time, a targeted
controlled release of their core content, stability of drugs and enhanced solubility (Bozzuto and
Molinari 2015). Additionally, the amphiphilic phospholipid bilayer represents similarities to the
mammalian membrane, which improves cellular uptake in drug delivery systems.
Encapsulated hydrophobic or hydrophilic drugs are targeted released and properties of
liposomes can be easily controlled and modified (Figure 7).
For instance, circulation time can be prolonged by polyethylenglycol binding (PEGylation) (Suk
et al. 2016); immune response and phagocytosis are modulated by lipid charge; and fluidity as
well as permeability are affected by lipid transition temperature (Kraft et al. 2014). Proteins can
be attached to the liposomes surface and transmembrane proteins can be reconstituted into
the liposome membrane. Moreover, increased cholesterol content stabilizes the liposomes and
reduces unspecific protein interactions (Beltrán-Gracia et al. 2019).
Figure 7: Liposomes and their modifications. Liposomes can carry hydrophobic and hydrophilic drugs. They can be modulated by polymer coating (e.g. PEG) and proteins can be reconstituted or attached to the surface covalently. Lipid composition can be easily controlled. Depiction is adapted from (Beltrán-Gracia et al. 2019)

16
1.7. Nanoparticles and their applications In addition to liposomes, that are nanoparticles (NPs) due to their size ranging from 1 nm to
1 µm, other NPs find their way in the field of biomedical applications. They are classified in
carbon-based, metal, ceramic, polymeric and lipid-based NPs (Khan et al. 2019).
Nanoparticles can be synthesized with favored chemical compositions, shape, roughness,
surface charge, size and coating, dependent on their specific application. Either targeted drug
delivery or imaging utilization involve blood contact. The resulting interplay of blood
components with the highly active NP surface leads to a formation of a protein corona, which
decreases the surface energy (Vilanova et al. 2016; Auría-Soro et al. 2019). However,
alterations in protein structure upon NP-protein interaction may induce an immune response
and activate the complement system. Furthermore, these bioconjugates could result in
penetration of cell membranes, which in turn changes cell properties, receptors and signaling
pathways (Di Silvio et al. 2017). The effect is desired in targeted drug delivery, but should be
prevented for unspecific reactions. Due to this, NPs are coated with biocompatible materials,
such as dextran or PEG. Especially PEGylation prolongs circulation time and stabilization of
NPs in the blood stream. In this PhD thesis, properties of maghemite NPs (Fe2O3) and their
interaction with biomimetic platelet membranes are studied. Nanoparticles are applied in
several medical fields, e.g. magnetic resonance imaging, targeted drug delivery due to
magnetism and hyperthermia as a therapeutic procedure (Múzquiz-Ramos et al. 2015).
1.8. Biophysical tools to study proteins and their interactions with lipids, drugs and nanoparticles
Biophysics displays an interface of various interdisciplinary fields coming from biology, physics,
mathematics and chemistry to understand biological functions. Already Leonardo da Vinci
utilized the mechanism behind the bird flight to construct flying devices in the 16th century.
Moreover, Giovanni Alfonso Borelli used mathematics to prove biological theories and Luigi
Galvani laid the foundations for electrical potentials in the human body, and therefore, the
mechanism of muscle contraction and nerve stimulation. In the field of biophysics,
groundbreaking characters such as Schrödinger, van’t Hoff, Delbrück, and Einstein
characterize fundamental understanding of thermodynamics and kinetics, optics, osmotic
pressure, molecular Brownian motion, radiation and nuclear magnetic resonance (NMR).
Resulting instrument development for biological questions is nowadays called applied
biophysics and contributes to the knowledge of e.g. protein and deoxyribonucleic acid structure
determination, electrical impulses in cells, biological membranes and biomechanics.
Currently, biophysical tools can be used to study proteins, membranes and properties of cells.
For instance, structure of proteins can be characterized by circular dichroism (CD)

17
spectroscopy. Although CD spectroscopy results are limited compared to other techniques
such as X-ray, NMR or cryo-EM, CD spectroscopy has many advantages such as label-free
and material saving analysis. It uses ultraviolet wavelengths in the range of 240-190 nm to
display peptide bonds, protein folding and unfolding, which leads to specific spectra for detailed
secondary structures of proteins (Miles and Wallace 2016). Another promising technique to
study proteins in solution is dynamic light scattering (DLS). With DLS diffusion coefficient and
hydrodynamic radii can be calculated. Fundamental theories are Rayleigh scattering and the
Mie theory describing the scattering effects of particles in solution. Thereby, the Stokes-
Einstein equation describes that the friction exerted by a particle is proportional to its radius
and to the viscosity of the solvent surrounding the particles (Stetefeld et al. 2016).
Biofunctionalized surfaces have been elucidated by the appearance of multiple surface-
sensitive techniques e.g. atomic force microscopy (AFM), surface plasmon resonance (SPR),
ellipsometry and quartz-crystal microbalance (QCM). The latter is suitable for the study of
processes within thin films on different surfaces. It is a real-time measurement detecting
changes in the frequency of an oscillating piezoelectric quartz sensor, which can be converted
to mass adsorption. Additionally, viscoelastic properties of adsorbed material can be measured
with dissipation monitoring. This technique offers the opportunity to analyze biosensors,
multilayers of polymers and proteins, cell surfaces and its interaction as well as membranes
and cell toxicity (Tonda-Turo et al. 2018; Dixon 2008).
AFM monitors among imaging techniques combined with FRET and others, mechanical
properties of cell and their elasticity, as well as single molecule force microscopy and
microfluidics (Krieg et al. 2019). Other techniques were developed recently such as real-time
deformability cytometry (RT-DC) which promotes biomechanical studies in solution (Otto et al.
2015).
In this PhD thesis, a combination of biophysical, molecular biology techniques and molecular
dynamic simulations were used to elucidate the impact of integrin dynamics in a biomimetic
liposome- and cellular-system.
18
1.9. Aim of this thesis
Membrane receptors of the integrin family have been intensively studied over the last decades,
indicating their important role in health and disease. Integrin αIIbβ3 is crucial for platelet
aggregation, whose loss or impaired function leads to the disease Glanzmann thrombasthenia.
Additionally, the potential risk of interaction with drugs, but also abnormal conformational
changes within the integrin lead to generation of autoantibodies characteristic for the
autoimmune disorder immune thrombocytopenia (ITP). To gain insights into the mechanisms
behind these diseases, it is essential to study the transmembrane protein αIIbβ3 primarily
under physiological conditions. The complexity and heterogeneity of individual platelets make
the study of distinct proteins intricate demonstrating the necessity of a controlled system.
Hence, in this thesis experiments were designed to establish a platelet-mimicking membrane
system and reconstitution of the purified platelet receptor integrin αIIbβ3. After proving its
applicability, the system should be utilized for studying the conformational landscape of αIIbβ3
under artificial, physiological and clinically relevant conditions.
Furthermore, these experiments are aligned with studies of HEK293 cells co-expressing both
integrin subunits and conformation-related mutations. Cell studies facilitates the evaluation of
downstream effects of integrin activation and its impact on the cytoskeleton or cell mechanical
properties in general.
Aforementioned experiments are intended to advance the understanding of integrin activation
and its mechanism of action in diseases such as Glanzmann thrombasthenia or Immune
thrombocytopenia.

19
2. Materials
2.1. General equipment Name Manufacturer AcCellerator Zell Mechanik, Dresden, Germany
ÄKTA Explorer GE Healthcare, Chicago, USA – now Cytiva,
Washington, USA
ÄKTA Micro GE Healthcare, Chicago, USA
ÄKTA Pure GE Healthcare, Chicago, USA – now Cytiva,
Washington, USA
Amnis Imaging Flow Cytometer Luminex Corporation, Austin, USA
AFM Nanowizard 3 JPK BioAFM – Bruker Nano GmbH, Berlin,
Germany
Bacterial shaker innova 40 New Brunswick Scientific, Nurtingen,
Germany
BD FACS Aria III sorter Becton Dickinson, Franklin Lakes, USA
BD LSR II flow cytometer Becton Dickinson, Franklin Lakes, USA
CCD camera Sharpeye Tröndle, Moorenweis, Germany
Centrifuge Allegra X-15R Beckman Coulter, Krefeld, Germany
Centrifuge Heraeus Fresco 21 Thermo Fisher, Darmstadt, Germany
Chirascan CD spectrometer Applied Photophysics, Leatherhead, UK
Cytation 5 Plate Reader Biotek Instruments, Winooski, USA
DS-11 Spectrophotometer/Fluorometer DeNovix Inc., Wilmington, USA
Easycast Mini Gel Electrophoresis tank Thermo Fisher, Darmstadt, Germany
Elmasonic S 30 H Elma Schmidbauer GmbH, Singen,
Germany
Gel Dock XR imaging system Bio-Rad, Munich, Germany
iBright FL1500 Invitrogen, Carlsbad, USA
Incubator BINDER, Tuttlingen, Germany
Ismatec IPC-NP4 peristaltic pump Idex Health & Science, Wertheim-
Mondfeld, Germany
JS-4.750 Swinging bucket rotor Beckman Coulter, Krefeld, Germany
Leica TCS Sp5 confocal microscope Leica Camera AG, Wetzlar, Germany
Microscope Eclipse 50i Nikon, Minato, Japan
Microscope Eclipse TS100 Nikon, Minato, Japan
Microscope ix 81 Olympus, Shinjuku, Japan
Microscope Axio Observer Z1 Zeiss, Oberkochen, Germany

20
Mini Gel Tank Invitrogen, Carlsbad, USA
MiniMACS Separator Miltenyi Biotec GmbH, Bergisch Gladbach,
Germany
Mini Protean tetra vertical electrophoresis
cell
Bio-Rad, Munich, Germany
MLS-50 Rotor Beckman Coulter, Krefeld, Germany
OptimaTM MAX-XP Ultracentrifuge Beckman Coulter, Krefeld, Germany
Paradigm Plate Reader Beckman Coulter, Krefeld, Germany
PCR thermocycler C1000 touch thermal
cycler
Bio-Rad, Munich, Germany
pH meter Seven Easy Mettler Toledo, Gießen, Germany
Photometer NanoDrop 2000c Thermo Fisher, Darmstadt, Germany
Q-Sense Analyzer Biolin Scientific Holding AB, Västra
Frölunda, Sweden
SiO2-coated quartz crystal sensor Biolin Scientific Holding AB, Västra
Frölunda, Sweden
Scale Excellence XS64 Mettler Toledo, Gießen, Germany
Scale KERN EW 1500-2M Kern & Sohn, Balingen, Germany
Sorvall RC5C Plus Refrigerated Centrifuge Thermo Fisher, Darmstadt, Germany
Sorvall Rotor SS34 Thermo Fisher, Darmstadt, Germany
Sterile Bench Mars Safety Class 2 LaboGene, Lillerod, Denmark
TECAN infinite M200Pro plate reader Tecan group, Männedorf, Switzerland
Thermomixer Comfort Eppendorf, Hamburg, Germany
TransBlot SD Transfer Cell BioRad, Hercules, USA
Transmission electron microscope LEO 906 Carl Zeiss Microscopy GmbH, Oberkochen,
Germany
UV Ozone Pro Cleaner Plus Bioforce Nanoscience, Ames, USA
VWR Power Source VWR, Mönchweiler, Germany
Western Blot Imager Chemiluminescence
detector ChemiSmart 5100
PEQLAB Biotechnologie GmbH, Erlangen,
Germany
XCell SureLockTM Electrophoresis Cell Invitrogen, Carlsbad, USA
Zetasizer Nano ZS Malvern Instruments, Herrenberg, Germany
Zetasizer Ultra Malvern Instruments, Herrenberg, Germany

21
2.2. Chemicals, kits and consumables Name Manufacturer Acetic acid Carl Roth GmbH, Karlsruhe, Germany
Agarose Biozym Scientific GmbH, Hessisch
Oldendorf, Germany
Protein A and Leupeptide (A/L) Thermo Fisher, Darmstadt, Germany
Ammonium molybdate tetrahydrate Carl Roth GmbH, Karlsruhe, Germany
aqueous phosphotungistic acid VWR, Radnor, USA
Ammonium persulfate (APS) Sigma Aldrich, Taufkirchen, Germany
Ascorbic acid Merck KgaA, Darmstadt, Germany
Bicinchoninic acid (BCA) assay kit Sigma Aldrich, Taufkirchen, Germany
Bisacrylamide Carl Roth GmbH, Karlsruhe, Germany
Bromphenol blue Fisher Scientific, Leics, UK
Buffer 2 (50 mM NaCl, 10 mM Tris-HCl,
10 mM MgCl2, 1 mM DTT) and buffer 4
(50 mM potassium Acetate, 20 nM Tris-
acetate, 10 mM Magnesium Acetate, 1mM
DTT) for 1 x digestion buffer
NEB, Ipswich, USA
CaCl2 Carl Roth GmbH, Karlsruhe, Germany
Cantilever, tipless, CSC38 MikroMasch, Sofia, Bulgaria
Cell Carrier Zell Mechanik, Dresden, Germany
3-[(3-Cholamidopropyl)dimethylammonio]-1-
propanesulfonate (CHAPS)
Carl Roth GmbH, Karlsruhe, Germany
Chloroform Carl Roth GmbH, Karlsruhe, Germany
Coomassie Blue G- and R-250 Thermo Fisher, Darmstadt, Germany
Cuvettes, various Zetasizer Nano Series, Malvern,
Worcestershire, UK
Dextran-6 (6 kDa) Carl Roth GmbH, Karlsruhe, Germany
Dithiothreitol Carl Roth GmbH, Karlsruhe, Germany
Ethylenediaminetetraacetic acid (EDTA) Sigma Aldrich, Taufkirchen, Germany
Ethanol, 99,8 % Carl Roth GmbH, Karlsruhe, Germany
FACS tubes, Falcon Fisher Scientific, Leics, UK
Formalin Sigma Aldrich, Taufkirchen, Germany
GeneJET plasmid Miniprep Kit Thermo Fisher, Darmstadt, Germany
Glue Optical Adhesive 68 Norland, Cranbury, USA
Glutaraldehyde Agar Scientific, Stansted, UK

22
Gycerol Sigma Aldrich, Taufkirchen, Germany
HCl Carl Roth GmbH, Karlsruhe, Germany
Hellmanex III Hellma, Müllheim, DEU
4-(2-Hydroxyethyl)piperazine-1-
ethanesulfonic acid (HEPES)
Carl Roth GmbH, Karlsruhe, Germany
8 well µ-Slides Ibidi, Gräfelfing, Germany
Instant Skim Milk Powder Safeway, Pleasanton, USA
Isopropanol Carl Roth GmbH, Karlsruhe, Germany
KCl Fisher Scientific, Loughborough, UK
KH2PO4 Fisher Scientific, Loughborough, UK
Leupeptin Thermo Fisher, Darmstadt, Germany
Methanol Carl Roth GmbH, Karlsruhe, Germany
Methyl 𝛼𝛼-D mannopyranoside Carl Roth GmbH, Karlsruhe, Germany
MgCl2 AppliChem GmbH, Darmstadt, Germany
Microfluidic Chips FlicXX, 30 μm Zell Mechanik, Dresden, Germany
MnCl2 tetrahydrate Carl Roth GmbH, Karlsruhe, Germany
MS Column Miltenyi Biotec GmbH, Bergisch Gladbach,
Germany
NaCl Carl Roth GmbH, Karlsruhe, Germany
NaOH Fisher Scientific, Hampton, USA
Na4P2O7 Fisher Scientific, Hampton, USA
NP-40 Sigma Aldrich, Taufkirchen, Germany
Nitrocellulose membrane GE Healthcare, Chicago, USA
Novex Sharp Unstained Protein Standard Thermo Fisher, Darmstadt, Germany
NuPAGE 4-12% Bis-Tris Protein Gels Thermo Fisher, Darmstadt, Germany
NuPAGE MES SDS Running Buffer (20X) Thermo Fisher, Darmstadt, Germany
NuPAGE Transfer Buffer Thermo Fisher, Darmstadt, Germany
PMSF AppliChem GmbH, Darmstadt, Germany
PureLink HiPure Plasmid Maxiprep Kit Invitrogen, Carlsbad, Germany
DNA Stain G Serva, Heidelberg, Germany
Sodiumdodecyl sulfate (SDS) Merck KgaA, Darmstadt, Germany
Silica Beds 5 μm Bangs Laboratories, Fishers, USA
TLC plates, silica gel 60G, glass backed Merck KgaA, Darmstadt, Germany
Tris-Base Sigma Aldrich, Taufkirchen, Germany
Triton X-100 Carl Roth GmbH, Karlsruhe, Germany

23
Tween 20 AppliChem GmbH, Darmstadt, Germany
Tetramethylethylendiamin (TEMED) Carl Roth GmbH, Karlsruhe, Germany
TMB (3,3', 5,5' Tetramethylbenzidine)
substrate
Becton Dickinson, Franklin Lakes, USA
Tris-Glycine SDS Running Buffer Invitrogen, Carlsbad, USA
QuikChange II Site-Directed Mutagenesis Kit Agilent Technologies, Santa Clara, USA
West Pico Chemiluminescent substrate Thermo Fisher, Darmstadt, Germany
5 mm path length cuvette 110-QS; Hellma Analytics, Müllheim,
Germany
2.3. Proteins, enzymes, nanoparticles and antibodies Name Manufacturer α-helical (AH) peptide (sequence taken from
(Cho et al. 2007b))
GenScript Biotech, New Jersey, USA
Alexa Fluor® 647 anti-human CD41/CD61
antibody
BioLegend, SanDiego, USA
Anti-human β-actin antibody for WB Cell Signaling, Danvers, USA
Anti-human αβ-tubulin antibody for WB Cell Signaling, Danvers, USA
Anti-human CD41 Bio-Techne Holding, Minneapolis, USA
Anti-human CD61 antibody-HRP BioLegend, SanDiego, USA
Anti-human GAPDH antibody HyTest, Turku, Finland
Anti-rabbit IgG antibody-HRP Jackson ImmunoResearch Laboratories,
West Grove, USA
Anti-mouse IgG antibody-HRP Jackson ImmunoResearch Laboratories,
West Grove, USA
Anti-mouse IgG-Alexa Fluor 647 Thermo Fisher, Darmstadt, Germany
Alexa Fluor® 488 anti-human CD41 antibody BioLegend, SanDiego, USA
Alexa Fluor® 647 anti-human CD61 antibody BioLegend, SanDiego, USA
Bovine Serum Albumin Sigma Aldrich, Taufkirchen, Germany
Fibrinogen Merck KgaA, Darmstadt, Germany
Fibronectin Merck KgaA, Darmstadt, Germany
FITC anti-mouse IgM antibody BioLegend, SanDiego, USA
FITC anti-human CD41/CD61 antibody
PAC-1
BioLegend, SanDiego, USA
GeneRuler 1 kb DNA ladder Thermo Fisher, Darmstadt, Germany

24
GPIIbIIIa Integrin, αIIbβ3 Enzyme Research Laboratories, South
Bend, USA
Microstandard Sigma Aldrich, Taufkirchen, Germany
γ-Fe2O3 Nanoparticles Alli Abou-Hassan, Sorbonne Université,
Paris, France
Purified anti-human CD41/CD61 antibody
PAC-1
BioLegend, SanDiego, USA
Phalloidin CF 647 Biotium, Fremont, USA
PNGase F NEB, Ipswich, USA
Restriction enzymes: Bgl II, Hind III, Xho I,
EcoR I
NEB, Ipswich, USA
SeeBlue Plus2 Prestained Standard Thermo Fisher, Darmstadt, Germany
2.4. Purification procedures Name Manufacturer Affinity column HiTrap Con A 4B Columns
5mL
GE Healthcare, Freiburg, Germany
Size exclusion column HiPrep 16/60
Sephacryl S-300
HR column, 16 mm × 600 mm
GE Healthcare, Freiburg, Germany
Affinity column HiTrap Heparin HP 5mL GE Healthcare, Freiburg, Germany
Amicon Ultra-15 Centrifugal Filter Unit Merck KgaA, Darmstadt, Germany
2.5. Liposome preparation Name Manufacturer Bio-Beads SM-2 Resin Bio-Rad, Munich, Germany
Cholesterol (ovine) Avanti Polar Lipids Inc., Alabaster, USA
1,2-dimyristoyl-sn-glycero-3-
phosphocholine (DMPC)
Avanti Polar Lipids Inc., Alabaster, USA
1,2-Dimyristoyl-sn-glycero-3-phospho-rac-
(1-glycerol) sodium salt (DMPG)
Avanti Polar Lipids Inc., Alabaster, USA
1,2-dioleoyl-sn-glycero-3-phosphocholine
(DOPC)
Avanti Polar Lipids Inc., Alabaster, USA
Extruder Set Avanti Polar Lipids Inc., Alabaster, USA

25
Mini Dialysis Kit 1 kDa cut-off GE Healthcare, Freiburg, Germany
Mini Dialysis Kit 8 kDa cut-off GE Healthcare, Freiburg, Germany
Optiprep STEMCELL Technologies Inc., Vancouver,
Canada
Polycarbonate Membrane (pore size
100 nm)
Avanti Polar Lipids Inc., Alabaster, USA
Pyrextubes Sigma Aldrich, Taufkirchen, Germany
Spectra/Por 6 Dialysis Membranes, 10 kDa,
50 kDa
Spectrumchemical, New Brunswick, USA
N-stearoyl-D-erythro-
sphingosylphosphorylcholine (d18:1/18:0)
(SM)
Avanti Polar Lipids Inc., Alabaster, USA
Sucrose Merck KgaA, Darmstadt, Germany
2.6. Cell and bacterial culture Name Manufacturer Ampicillin Sigma Aldrich, Taufkirchen, Germany
Dimethyl sulfoxide (DMSO) Roth, Karlsruhe, Germany
Dulbecco´s Modified Eagles medium
(DMEM) high glucose
Biowest, Nuaille, France
Dulbecco´s Phosphate Buffer Saline w/o
Ca2+, Mg2+
Biowest, Nuaille, France
Dulbecco´s Phosphate Buffer Saline with
Ca2+, Mg2+, 10 x
Biowest, Nuaille, France
Fetal bovine serum (FBS), Qualified, H Biowest, Nuaille, France
Geneticin 418 (G-418) solution Biowest, Nuaille, France
Human Embryonic Kidney (HEK) 293 cell
line
FLI, Riems, Germany
HEK293 αIIbβ3 wildtype Biophysical chemistry, Greifswald, Germany
HEK293 αIIbβ3 active (C560R) Biophysical chemistry, Greifswald, Germany
HEK293 αIIbβ3 inactive (β3-R563C/αIIb-
R320C)
Biophysical chemistry, Greifswald, Germany
L-Glutamine 100x Biowest, Nuaille, France
NEB® 5-alpha Competent E. coli NEB, Ipswich, USA

26
LB Agar Carl Roth GmbH, Karlsruhe, Germany
LB Medium Carl Roth GmbH, Karlsruhe, Germany
pcDNA3.1. ITGA2B WT Biophysical Chemistry, Greifswald, Germany
(modified from Prof. Karen Vanhoorelbeke,
Kortrijk, Belgium)
pcDNA3.1. ITGA2B R320C Biophysical Chemistry, Greifswald, Germany
pcDNA3.1. ITGB3 WT Biophysical Chemistry, Greifswald, Germany
(modified from Prof. Karen Vanhoorelbeke,
Kortrijk, Belgium)
pcDNA3.1. ITGB3 C560R Biophysical Chemistry, Greifswald, Germany
pcDNA3.1. ITGB3 R563C Biophysical Chemistry, Greifswald, Germany
Penicillin/Streptavidin 100x Biowest, Nuaille, France
Transit-LT1 Transfection agent Mirus Bio, Madison, USA
Trypan Blue VWR International, Radnor, USA
Trypsin/EDTA 1x Biowest, Nuaille, France
2.7. Software Name Manufacturer Adobe Photoshop CS6 Adobe System Software, Dublin, Ireland
CD Pro-Data SX Chirascan Applied Photophysics, Leatherhead, UK
CD Pro-Data Viewer Applied Photophysics, Leatherhead, UK
Chemsketch ACD/Labs, Toronto, Canada
Expasy.org/protparam (Gasteiger et al. 2003)
FlowJo FlowJo LLC, Ashland, USA
GIMP 2.10.14 GIMP Development Team
i-control TECAN, Männedorf, Switzerland
Image-Lab Bio-Rad Laboratories, Hercules, USA
ImageSP software SYSPROG, Minsk, Belarus
JPK Software JPK BioAFM – Bruker Nano GmbH, Berlin,
Germany
JPK Data Processing JPK BioAFM – Bruker Nano GmbH, Berlin,
Germany
Microsoft Office 2016 Microsoft, Redmond, USA
Origin 2020 OriginLab, Northhampton, USA
PyMol 2.3 DeLano Scientific, San Fransisco, USA

27
Shape-In Zell Mechanik, Dresden, Germany
Shape-Out Zell Mechanik, Dresden, Germany
Snapgene 5.0.7. GSL Biotech LLC, San Diego, USA
Q-Soft401 V2.5 Biolin Scientific Holding AB, Västra
Frölunda, Sweden
Q-Tools V.3.0 Biolin Scientific Holding AB, Västra
Frölunda, Sweden
R R Core Team (2017). R: A language and
environment for statistical computing. R
Foundation for Statistical Computing,
Vienna, Austria. - https://www.R-project.org/
RStudio RStudio Team (2020). RStudio: Integrated
Development for R. RStudio, PBC, Boston,
USA- http://www.rstudio.com/
Unicorn 7.0 GE Healthcare, Freiburg, Germany
VMD 1.9 University of Illinois, Urbana-Champaign,
USA
Zetasizer Nano Software Malvern Instruments, Herrenberg, Germany
Zetasizer Ultra Software Malvern Instruments, Herrenberg, Germany

28
3. Experimental procedures
3.1. Enzyme-linked immunosorbent assay (ELISA) Enzyme-linked immunosorbent assay detects antigens, proteins or antibodies bound to a solid
phase, i.e. a microtiter plate. Enzyme-conjugated antibodies bind specifically to the antigen
and enzyme-substrate reaction leads to a color change, which identifies the presence of the
antigen.
Microtiter plates were coated with 100 ng/µL integrin αIIbβ3 in coating buffer consisting of
15 mM sodium bicarbonate, pH 9.5, incubated 12 h at 4 °C and washed with washing buffer
containing PBS with 0.05% Tween 20. After blocking for 2 h with 3 % bovine serum albumin in
PBS at 37°C, the plates were washed five times with washing buffer and were incubated for
1 h at room temperature (RT) with different antibody dilutions (mouse anti-human CD61 or
rabbit anti-human CD41). Plates were washed again five times with washing buffer and
70 ng/mL of the specific horseradish peroxidase (HRP)-coupled antibody (anti-rabbit IgG-HRP
and anti-mouse IgG-HRP) was added and incubated at RT for 45 min. After five times washing,
the plate was incubated with TMB (3,3', 5,5' Tetramethylbenzidine) substrate reagent for 5 min
at RT. The reaction was stopped by adding 100 µL 0.5 M H2SO4 and the optical density (OD)
was measured at 450 nm with a Tecan infinite 200 absorbance reader. For evaluation, the
values of a blank control, without integrin, were subtracted from the samples.
3.2. Integrin purification The purification of integrin αIIbβ3 followed a protocol adapted from Ye et al. (Ye et al. 2010).
For liposome preparation with Triton X-100, the used integrin αIIbβ3 was purchased from
Enzyme Research laboratories. However, integrin reconstitution following the protocol with
CHAPS was carried out with purified integrin from outdated human plasma.
Generally, the used buffers listed in Table 1 were filtered through a 0.22 µm membrane filter
and degassed by sonication for 30 min. Purification was performed with an ÄKTA Explorer or
an ÄKTA Pure System.
Briefly, 500 mL of platelet rich plasma were obtained from AG Cardiovascular Cell Research
at the University Medicine Greifswald and pelletized at 1,800 x g for 30 min at RT. The pellet
was dissolved in 50 mL wash buffer and centrifuged again to remove plasma proteins. The
pellet was dissolved in 50 mL lysis buffer and stirred carefully overnight at 4°C.
The mixture was centrifuged at 12,000 x g for 1 h at 4 °C. The filtered clear supernatant was
loaded onto a concanavalin A (ConA) column to separate the glycoproteins from the other
platelet proteins. The ConA column was equilibrated at a flow rate of 1 mL/min with integrin
buffer for five column volumes. After lysate injection, the column was washed extensively with
CHAPS buffer for at least ten column volumes to remove most of the Triton X-100. The elution

29
was initialized by ConA elution buffer. The eluate was collected in 5 mL tubes and the elution
peak fractions were analyzed via SDS-PAGE and integrin-containing fractions were pooled for
further steps.
To remove fibrinogen and thrombospondin 1, the ConA eluate was passed through a heparin
column using a flow rate of 1 mL/min after equilibration with CHAPS buffer. The flow through
was then concentrated to a volume of 2 mL with an Amicon Ultra-15 Centrifugal Filter Unit and
further purified by SEC using a HiPrep 16/60 Sephacryl S-300 column. The sample was loaded
onto the SEC column and eluted at 0.5 mL/min. Integrin-containing fractions were identified by
SDS-PAGE and respective protein content was determined by spectrophotometric
measurements. Table 1: Buffer compositions for integrin purification. The pH was adjusted to 7.4 using NaOH or HCl.
Buffer Name Composition Integrin buffer 20 mM Tris, 150 mM NaCl, 1 mM CaCl2,
1 mM MgCl2, 0.1 % Triton X-100
CHAPS buffer 20 mM HEPES, 150 mM NaCl, 1 mM CaCl2,
1 mM MgCl2, 1 % CHAPS
Wash buffer 20 mM Tris, 150 mM NaCl
Lysis buffer 20 mM Tris, 150 mM NaCl, 0.5 mM CaCl2,
1 % Triton X-100,
5 mM PMSF, 10 μmol Leupeptin
ConA elution buffer 20 mM Tris, 150 mM NaCl, 1 mM CaCl2,
1 mM MgCl2, 1 % CHAPS,
5 μmol Leupeptin, 200 mM methyl 𝛼𝛼-D
mannopyranoside
Heparin column elution buffer 20 mM Tris, 1M NaCl
3.3. Integrin reconstitution into liposomes 3.3.1. Reconstitution protocol with Triton X-100
The preparation of liposomes followed an adapted protocol from Erb and Engel (Erb and Engel
2000). The liposome buffer consisting of 20 mM Tris, 50 mM NaCl, and 1 mM CaCl2 was
adjusted to pH 7.4 with HCl. A final amount of 800 nmol DMPG:DMPC (ratio 1:20) or
DOPC:SM:cholesterol (ratio 37.5:37.5:25) was dried under a stream of nitrogen and incubated

30
under vacuum overnight. Dried lipids were dissolved in liposome buffer containing 0.1 % Triton
X-100 and 0.2 mg of αIIbβ3 in liposome buffer and incubated for 2 h at 37 °C. Afterwards,
Triton X-100 was removed by adding twice 70 mg SM-2 biobeads for 3 h at 37 °C. To separate
free (non-reconstituted) protein from the synthesized liposomes, the sample was added on a
four-step sucrose gradient (2 M, 1.2 M, 0.8 M, 0.4 M) and ultracentrifuged at 4 °C and
268,000 x g for 24 h. The liposome fraction was then dialyzed for three days against liposome
buffer, stored at 4 °C and used within four days.
3.3.2. Reconstitution protocol with CHAPS Liposomes were prepared following a protocol adapted from Coskun et al. (Coskun et al.
2011). Briefly, HEPES liposome buffer contained of 25 mM HEPES, 150 mM NaCl, 1 mM
CaCl2 with pH adjusted to 7.4 by HCl. 1.6 µmol lipid mixture consisting of
DOPC:SM:cholesterol (different ratios are indicated in the respective graphs), was dried under
a stream of nitrogen and vacuum overnight. Then, dried lipids were dissolved in HEPES
liposome buffer and incubated under shaking for 20 min at 54 °C. Unilamellar vesicles were
formed by freeze-thaw cycles (10 cycles) and subsequent extrusion at 54 °C through a 100 nm
pore size membrane. Afterwards, the liposomes were solubilized with CHAPS (approximately
0.9%), which was monitored by DLS as well as turbidity measurements, and incubated with
0.25 mg αIIbβ3 for 20 min at 30 °C. The sample was then dialyzed (four times against 2 L of
HEPES liposome buffer) for two days at 4 °C. Non-reconstituted protein was removed from
liposome fraction by a three step Optiprep gradient (30%, 10%, 5%) at 208,000 x g for 2 h.
The liposome fraction was collected and dialyzed for two days against HEPES liposome buffer.
3.4. Characterization of liposomes 3.4.1. Phosphate assay
Phosphate Assay was crucial for determination of phospholipid content after integrin
reconstitution into liposomes. A calibration standard curve was prepared with respective buffer
and 50 µL of the dilutions as well as the sample were transferred into glass tubes. After addition
of 500 µL 70 % perchloric acid the mixture was covered with glass marbles and incubated for
3 h at 200 °C. Subsequently, 1 mL of 10 % ammonium molybdate tetrahydrate solution and
1 mL 10 % ascorbic acid were added, mixed and incubated for 1 h at 37°C. From each tube
200 µL were added to a microtiter plate and absorbance was measured at 820 nm to detect
the emerged phosphomolybdic acid (Morrison 1964).

31
3.4.2. Thin-layer chromatography (TLC) TLC measurements were carried out to determine the presence of intact lipids in the liposome
and proteoliposome samples. Silica gel function as the stationary phase on a glass plate
whereas the solvent, which is the mobile phase, migrates because of capillary forces to the
top of the plate. The solvent meets the sample and carries it to the top of the plate as well. For
silica gel non-polar substances migrate faster to the top as polar substances, which causes
separation of different mixtures (Fuchs et al. 2011).
Lipids were extracted using a two-step extraction protocol established by Bligh and Dyer (Bligh
and Dyer 1959). First step was the addition of three volumes of chloroform:methanol 10:1
mixture, which was followed by 20 min incubation on ice and centrifugation at 1,000 x g at
4 °C. The organic phase was then collected and the first step was repeated with a chloroform:
methanol (2:1) mixture. The lipid containing organic phase was then dried under a stream of
nitrogen and the lipids were resuspended in 30 µL chloroform:methanol (2:1) mixture and
applied on a TLC plate silica gel 60G. TLC chamber as well as the TLC plate was washed and
equilibrated with methanol:chloroform (2:1) mixture. For TLC analysis
chloroform:methanol:water (65:25:4) was used as running solution. Lipids were stained by
20 min incubation in Coomassie Blue R-250 dissolved in 20% methanol and washed for 5 min
with 20 % methanol. Images were taken using a iBright FL1500 Imaging System.
3.4.3. Transmission electron microscopy (TEM) – Negative staining TEM is a powerful microscopy technique that overcomes the resolution limitations of light
microscopy. Electrons are emitted by an electron gun and accelerated. After passing through
electromagnetic lenses, the electron beam is focused onto the sample and shines through the
very thin specimen. The transmitted beam is recombined and magnified to form a picture on
the image plane. The impact of electrons excites the screen and a magnified image of the
sample is visible (Williams and Carter 1996). For the visualization of small biological structures
such as proteins or lipids, negative staining with phosphotungstic acid was used, which stains
the background to create higher contrast.
TEM samples preparation and imaging were carried out in the Imaging lab of Dr. Rabea
Schlüter at the University of Greifswald (Germany). Proteoliposomes were allowed to adsorb
onto a glow discharged carbon-coated holey Pioloform film on a 400-mesh grid for 5 min. For
the negative stain, the grid was transferred onto two droplets of deionized water and
subsequently on a droplet of 2 % aqueous phosphotungistic acid (pH 7.4) for 30 s and finally
on a second droplet for 4 min. Next, samples were blotted with filter paper, air-dried and
analyzed using a transmission electron microscope LEO 906 at an acceleration voltage of
80 kV. Pictures were taken with flat films with a magnification of 60,000-times or with a wide-
angle dual speed CCD camera Sharpeye, which was operated by the ImageSP software.
Afterwards, the micrographs were analyzed using Adobe Photoshop CS6.

32
3.4.4. Sodium dodecylsulfate-polyacrylamide gel electrophoresis (SDS-PAGE)
In SDS-PAGE, proteins are separated in a polyacrylamide gel by their size. Under denaturating
conditions, internal charges are covered by an overall negative charge caused by SDS in the
added loading dye containing also dithiothreitol (DTT) as reducing agent (Table 2).
SDS-PAGE was carried out to detect the integrin subunits under reductive conditions upon
protein purification, as well as reconstitution into liposomes. Samples were incubated 5 min at
95 °C and loaded to Tris-Glycine gels (12%). The gels were run in Tris-Gylcine Buffer for 35 –
55 min at 150-200 V, visualized with Coomassie blue G-250 and imaged in an iBright FL1500.
Table 2: Composition of loading dye for SDS-PAGE.
Ingredient Amount for 10 mL Tris/HCl 0.5 M pH 6.8 7 mL
Gylcerol 3 mL
SDS 1 g
DTT 0.93 g
Bromphenol Blue 1.2 mg
3.4.5. Determination of protein concentration Determination of protein concentration of purified protein was measured using a
spectrophotometer. The protein content was calculated using the absorbance at 280 nm
(Simonian 2002), with a theoretical extinction coefficient and molecular weight obtained from
the expasy.org/protparam webtool (Gasteiger et al. 2003).
Determination of protein concentration in proteoliposomes was done by a modified bicinchonic
acid (BCA) assay adapted from Parmar et al. (Parmar et al. 1999). Protein microstandards or
25 µL proteoliposome samples were pipetted into a microtiter plate. After addition of 25 µL of
0.5 % SDS, 50 µL of working BCA reagent was added to each well. The plate was incubated
for 2 h at 37 °C and the absorbance was measured at 562 nm. The protein concentration in
the samples was determined from a standard curve with the mentioned protein standard. Due
to peptide bonds in the protein, Cu2+ ions are reduced to Cu+ ions, during the reaction of the
BCA assay. The Cu+ ions are forming a violet complex with the BCA, whose absorbance can
be measured at 562 nm (Smith et al. 1985).
3.4.6. Dynamic light scattering (DLS) Generally, in DLS, known also as photon correlation spectroscopy, a monochromatic beam of
light encounters a solution containing macromolecules, resulting in the detection of the

33
scattered light as function of the size of macromolecules. Due to Rayleigh scattering, larger
molecules will scatter the light more strongly than a small molecule at a given wavelength.
DLS enables the measurement of the size of macromolecules due to its Brownian motion,
which is dependent on the solvent’s viscosity and, by temperature as well. The scattering
intensity fluctuates over time due to the Brownian motion of particles in solution, which can be
characterized by a specific autocorrelation function at a specific detection angle. By fitting the
correlation curve to an exponential function, the diffusion coefficient (Df) can be calculated
(Stetefeld et al. 2016).
Assuming that the macromolecules form a perfect sphere, their size can be calculated from
the hydrodynamic diameter (RH) obtained from the Stokes-Einstein equation (1) where KB= the
Boltzmann constant, T= temperature in K, η= viscosity (Stetefeld et al. 2016):
𝐷𝐷𝑓𝑓 = 𝑘𝑘𝐵𝐵𝑇𝑇6𝜋𝜋𝜋𝜋𝑅𝑅𝐻𝐻
(1)
DLS measurements were carried out on a Zetasizer Nano ZS or Ultra and the hydrodynamic
diameter data was analyzed with the corresponding Zetasizer software. Liposome and
proteoliposome samples were diluted in respective liposome buffer (1:10) and 500 µL were
transferred to a 10 mm path length cuvette. After an equilibration time of 2 min at 37 °C
measurements were performed at a detector angle of 173° with a refractive index of 1.45 and
absorption of 0.001 with standard solvent parameters as referred to water or PBS. Each
measurement included at least 10 runs and was repeated three times.
In addition to size measurements, the same instrument can measure the charge of small
particles. Therefore, zeta potential was calculated for nanoparticle experiments. Charged ions
produce an electrical double layer comprising Stern layer (containing oppositely charged ions
as the particle) and the diffuse layer (containing both oppositely and same ion species). By
applying an electric field, the charged particles move towards the counter electrode, which is
affected by the diffuse layer, where the zeta potential describes the potential at this particle-
dispersant interface. Here, the Hückel approximation is used, which assumes that the electrical
double layer is thicker than the particle (Bhattacharjee 2016).
Zeta potential measurements of nanoparticles were performed in disposable folded capillary
cells with an equilibration time of 2 min at 37°C. The intensity of the backscatters 638-nm-laser
beam of four independent samples was measured in automatic mode. The electrostatic
stability of the colloidal suspension via zeta potential measurements was carried out with 20
runs and three measurements in monomodal mode with a maximum voltage of 10 V.

34
3.5. Activation of integrin Experiments of integrin activation, that are described in the following chapters, were carried
out with several techniques. The conformation specific antibody PAC-1 only binds to the active
conformation of integrin αIIbβ3 (Taub et al. 1989) and is used as a marker for active integrin.
Activation was attempted to be induced with divalent ions or with different clinically relevant
drugs.
3.5.1. Flow cytometry of liposomes This high-throughput technique is explained more detailed in Chapter 3.6.4. For the validation
of successful integrin reconstitution into liposomes flow cytometry experiments were carried
out. For integrin detection, the monoclonal antibodies anti-CD61-Alexa 647 and anti-CD41
were used. For antibody binding, 10 µL of purified PE CF-fluorescently labelled liposomes
were mixed with 1 µL of 200 µg/mL anti-CD61-Alexa 647 and 1 µL of 500 µg/mL anti-CD41 for
30 min at RT. Afterwards, the anti-CD41 antibody samples were incubated with 1 µL of the
secondary goat anti-mouse IgG-Alexa Fluor 647 antibody for 10 min at RT. Samples were then
diluted with 290 µL liposome buffer and analyzed in a BD LSR II Flow Cytometer. By addition
of 1 µL of 100 mg/mL conformation-specific Alexa 647-labelled PAC-1 IgM antibody to PE CF-
liposomes in buffer, with 1 mM MnCl2 (control for activation) or EDTA (negative control) integrin
activation was detected. The FlowJo 7.6.5 software was used for evaluation. Gating strategy
is described in Figure S1.
3.5.2. Quartz crystal microbalance with dissipation (QCM-D) monitoring QCM-D theory. Quartz crystal microbalance with dissipation (QCM-D) monitoring is a real time
and label-free technique to characterize the mass and viscoelastic properties of an adsorbed
layer on a crystal. With a mass sensitivity in the ng/cm2 range in liquid it can be utilized for a
broad range of research fields (Höök et al. 1998), such as membrane-protein (Marx 2003) or
protein-protein interactions (Oom et al. 2012). Additionally, QCM-D has been shown to be a
useful tool to study the formation of supported lipid bilayers (SLB) (Richter et al. 2003).
This biophysical technique uses acoustic waves generated by an oscillating piezoelectric
quartz crystal, by applying an electric field to the quartz, which is sandwiched between two
electrodes. When a sufficient voltage is applied close to the resonant frequency (f0 = 5 MHz)
of the crystal, it results in oscillation and several harmonics (n = 3,5,7,9,11,13). The linear
relationship between changes in the frequency of the oscillation (Δf) due to adsorbed mass
(Δm) on the surface of the crystal was demonstrated by Sauerbrey in 1959 (Sauerbrey 1959)
and is given by equation (2):
∆𝑚𝑚 = −𝐶𝐶n∆𝑓𝑓 (2)

35
Where n is the harmonic number and
𝐶𝐶 = 𝑡𝑡𝑞𝑞𝜌𝜌𝑞𝑞𝑓𝑓0
(3)
With tq is the thickness of the quartz and ρq being the density of the quartz. To hold the
Sauerbrey relationship three assumptions must be fulfilled. First, the adsorbed mass has to be
smaller relative to the mass of the crystal. Second, the adsorbed mass is rigid and third, the
adsorbed mass is consistently distributed over the surface of the crystal. For viscous and
elastic contributions, which is mostly the case for studies with liquid phases, the Sauerbrey
assumption cannot be hold. Therefore, dissipation (D) monitoring of the mass deposits with
viscoelastic character is addressed to interpret the data. The decay of a crystal’s oscillation
occurs when the applied voltage is stopped and the softness of the adsorbed material dampens
the crystals remaining oscillation. D is defined as:
𝐷𝐷 = 𝐸𝐸𝐷𝐷𝐷𝐷𝐷𝐷𝐷𝐷𝐷𝐷𝐷𝐷𝐷𝐷𝐷𝐷𝐷𝐷𝐷𝐷2𝜋𝜋𝐸𝐸𝑆𝑆𝐷𝐷𝑆𝑆𝑆𝑆𝐷𝐷𝐷𝐷
(4)
With Edissipated being the energy dissipated during one oscillatory cycle and Estored being the
energy stored in the oscillating system (Dixon 2008).
Experimental details. QCM-D measurements were carried out with a Q-sense Analyzer under
continuous flow of 25 µL/min driven by a peristaltic pump at 37 °C. The SiO2-coated quartz
crystal sensors were cleaned using a 2 % SDS solution for at least 30 min at RT followed by
rinsing with ultrapure water. Then, crystals were dried under a stream of nitrogen and exposed
for 20 min to UV-ozone. Resonance frequency and dissipation were measured at several
harmonics (15, 25, 35, 45, 55, 65 MHz) simultaneously. Changes in dissipation (ΔD) and
frequency (Δf) of the seventh overtone (35 MHz) are presented in the QCM graphs. After
equilibration of the system with liposome buffer (15 min), liposomes or proteoliposomes were
injected into the system. After surface adsorption, the system was washed for at least 20 min
with liposome buffer. For integrin activation experiments, liposome buffer containing 1 mM
MnCl2 or 5 mM EDTA was loaded into the system and incubated under continuous flow for
approximately 1 h. PAC-1 was finally added at a concentration of 5 µg/mL for interaction
analysis followed by rinsing with the respective buffer.
For drug interaction analyses, Mn2+ treatment was replaced by clinically relevant drugs:
250 µg/mL UFH, 250 µg/mL fondaparinux or 50 µg/mL quinine sulfate diluted in liposome
buffer were introduced into the system for 10 min after washing and PAC-1 injection was
performed, subsequently. Measurement with different lipid ratios of DOPC, SM and cholesterol
was adapted by usage of 13 µM α-helical (AH) peptide to force vesicle fusion (Cho et al.
2007b).
For QCM measurements with nanoparticles, the system was changed to PBS buffer due to
enhanced aggregation of nanoparticles in other buffer systems. After equilibrating the system

36
with PBS buffer for 10 min, liposomes or proteoliposomes were injected into the system as
described above. After bilayer formation, the system was treated with PBS buffer containing
1 mM MnCl2, 1 mM MgCl2 and 1 mM CaCl2 and incubated under continuous flow for
approximately 30 min. NPs or purified bioconjugates were added (~2 x 10¹¹ citrate
particles/mL, ~5.8 x 10¹⁰ dextran-modified/mL and ~6.5 x 10¹⁰ PEG-particles/mL) followed by
rinsing with the respective PBS buffer. Data analysis was achieved using Q-Tools V.3.0 and
QSoft401 V2.5. Frequency and dissipation changes of the 7th overtone between time of
injection (Δf7inject; ΔD7inject) of PAC-1 or NPs and 10 min after rinsing with buffer (Δf7rinse;
ΔD7rinse) were calculated as shown in (5):
∆𝑓𝑓7𝑖𝑖𝑖𝑖𝑖𝑖𝑖𝑖𝑖𝑖𝑖𝑖 − ∆𝑓𝑓7𝑟𝑟𝑖𝑖𝑖𝑖𝑟𝑟𝑖𝑖 = ∆𝑓𝑓 and ∆𝐷𝐷7𝑖𝑖𝑖𝑖𝑖𝑖𝑖𝑖𝑖𝑖𝑖𝑖 − ∆𝐷𝐷7𝑟𝑟𝑖𝑖𝑖𝑖𝑟𝑟𝑖𝑖 = ∆𝐷𝐷 (5) The difference is plotted as Δf or ΔD in the respective graphs.
3.5.3. Nanoparticle synthesis and modification Nanoparticle synthesis was performed as described by Martens and Janke et al. (Martens et
al. 2020). Briefly, a mixture of 20 % ammonium hydroxide, 1.8 mol ferric and ferrous chlorides
was oxidized by addition of a 1.3 mol iron nitrate solution and heated to 80 °C. After washing
and suspension in 2 M nitric acid solution, the mixture was magnetically decanted and 5 %
nitric acid were added and stirred for 10 min. For citrate coating, sodium citrate was added
with a molar ratio of Fe/Citrate = 0.13 and heated to 80 °C for 30 min followed by decantation
and suspension in water.
3.5.4. Activation assay Activation assay for proteoliposomes was performed following a protocol adapted from Ye et
al. (Ye et al. 2010). Anti-human CD41/61 PAC-1 antibody (PAC-1 antibody) was coated on a
96 well microtiter plate at 4 °C overnight. Afterwards, the plate was blocked with liposome
buffer containing 30 mg/mL bovine serum albumin and PE CF-fluorescently labelled liposomes
or proteoliposomes were added under different conditions, which are indicated in the
respective graphs. The plate was then incubated for 4 h at 37 °C and unattached liposomes
were washed away with liposome buffer. After addition of 100 µL 1 % Triton X-100 in liposome
buffer, fluorescence was detected in a microplate reader at ex485/em535 nm. The respective
liposome fluorescence signal was subtracted from the proteoliposome signal.
3.5.5. Molecular dynamic simulations (MDS) Integrin model. MDS were carried out following a published protocol (Janke et al. 2019).
Briefly, a complete model was built from the X-ray structure of the ectodomain (PDB-code:
3fcs), the NMR structure of the transmembrane domain (PDB-code: 2k9j) and missing residues
were added as random coil (Zhu et al. 2008), as well as modifications such as glycosylations
and ions were considered. After energy minimization, overstretched bonds were relaxed. The
integrin was then embedded in a DMPC:DMPG (20:1 ratio) membrane equilibrated for 350 ns

37
in an isothermal-isobaric (NPT) ensemble. An open conformation of integrin was obtained with
steered MD by constant velocity pulling.
Detailed simulation parameters are described by Janke et al (Janke et al. 2019). For the
simulation of the ion effect on the integrin structure the following conditions were tested: i)
seven Ca2+ and one Mg2+ ion as present in the X-ray structure (Zhu et al. 2008), ii) three
structural ions in the proximity of the active center were replaced with Mn2+, and iii) all structure
ions were removed. Each system was first equilibrated for 350 ns in the NPT, followed by
100 ns production trajectory, and conformations were collected every 700 ps. The structural
distribution and MDS secondary structure were analyzed and predicted with the AmberTools
program CppTraj (Roe and Cheatham 2013) over the whole trajectory.
3.5.6. Circular dichroism (CD) spectroscopy CD-theory. CD spectroscopy is a biophysical method to determine the secondary and tertiary
structure of proteins in solution due to their chirality. Differential absorbed left (L)- and right
(R)-handed circularly polarized light by chiral molecules leads to an elliptical polarized radiation
as long as its difference in absorption (ΔA) is not zero (Kelly et al. 2005):
∆𝐴𝐴 = 𝐴𝐴𝐿𝐿 − 𝐴𝐴𝑅𝑅 (6)
The difference in A, which is elliptical polarized radiation, is measured as ellipticity (𝜃𝜃) in
degrees, both have a numerical relationship namely (Kelly et al. 2005; Johnson 1988):
𝜃𝜃 = 32.98 ∙ ∆𝐴𝐴 (7)
The CD spectrum is obtained when the dichroism is measured as a function of wavelength.
The intensity of the CD signal is directly proportional to the concentration (c) of the determined
protein and the pathlength (𝑑𝑑), which is characterized by the Lambert-Beer law (Kelly et al.
2005; Swinehart 1962):
∆A = ∆ε∙c∙𝑑𝑑 with ∆ε= 𝜀𝜀𝐿𝐿 − 𝜀𝜀𝑅𝑅 (8)
Here, the specific extinction coefficient (∆ε) is the difference between the one from left (𝜀𝜀𝐿𝐿) and
right polarized light (𝜀𝜀𝑅𝑅).
A CD signal can be negative or positive and is observed when a protein is optically active
mostly due to the amide chromophores of the peptide bonds. The chiral center contains a C
atom with four different substituents (below 240 nm). Additionally, proteins comprise also
aromatic amino acids (260-320 nm) or disulfide bonds (~260 nm), that absorb at different
wavelengths and the sum results in specific protein structures that give a unique CD signal.
Far UV spectra (180-260 nm) associate with various types of secondary structures such as α-
helix, β-sheets or random-coil (Figure 8). Besides, spectra in the region 260-320 nm arise from
the aromatic amino acids and can indicate changes in the tertiary structure (Kelly et al. 2005;
Miles and Wallace 2016).

38
In this PhD thesis, CD experiments were carried out for determination of secondary protein
structural changes upon treatment with different ions and drugs.
Experimental details. CD spectra were measured in a Chirascan CD spectrometer equipped
with a temperature control unit at 37 °C. A 5 mm path length cuvette with integrin concentration
of 0.4 µM incorporated into liposomes was used for measurements at wavelengths in the range
of 195-360 nm. Spectra were recorded with a bandwidth of 1.0 nm, a scanning speed of
15 nm/min and three repetitions. Spectra of liposomes were subtracted from proteoliposomes
for the data analysis. For determination of Mn2+- and EDTA- induced changes in the secondary
structure of αIIbβ3, the sample was first measured in liposome buffer, afterwards MnCl2 was
added to a final concentration of 1 mM and the sample was incubated 45 min before
measurement. Next, 50 mM EDTA was added to the same cuvette to a final concentration of
5 mM and incubated for 45 min at RT. For drug treatment experiments, respective volume of
UFH (0-295 µg/mL), fondaparinux (0-122 µg/mL) or quinine sulfate (0-1.5 µg/mL) were titrated
to the cuvette and equilibrated for 5 min at 37 °C before each measurement. Normalization of
the data was calculated by the wavelength dependent mean residue delta epsilon (MRDE) that
Figure 8: Far UV CD spectra associated with various types of secondary structure. Black curve-α-helix; orange curve-anti-parallel β-sheet; blue curve-type I β-turn; green curve-extended 31-helix or poly (Pro) II helix; grey curve-irregular structure. Adapted from (Kelly et al. 2005).

39
consists of concentration c, number of amino acids AA, path length of the cuvette d and the
constant resulting from the conversion of differential absorbance to ellipticity:
𝑀𝑀𝑀𝑀𝐷𝐷𝑀𝑀 = 𝐶𝐶𝐶𝐶 [𝑚𝑚𝑚𝑚𝑚𝑚𝑚𝑚]𝑐𝑐[𝑀𝑀]×𝐴𝐴𝐴𝐴×𝑚𝑚[𝑐𝑐𝑚𝑚]×32,982
(9)
3.6. HEK293 cells as integrin expression platform 3.6.1. Cell culture and transfection
Human embryonic kidney cells (HEK293), wild type (WT) integrin αIIbβ3 expressing HEK293
cells (HEK αIIbβ3 WT) and its mutants HEK293 αIIbβ3 active (C560R) (Ruiz et al. 2001), as
well as HEK293 αIIbβ3 inactive (β3-R563C/αIIb-R320C) (Takagi et al. 2002) were grown in
T25/T75 cell culture flasks in DMEM with high glucose concentration supplemented with 10 %
FCS, 1% Pen-Strep and 1% L-glutamine at 37°C and 5% CO2 atmosphere. Media for integrin
WT and mutant expressing cells contained 2.5 mg/mL G-418 additionally. Cell passaging was
performed three times a week. The medium was removed and cells were washed with 5 mL
PBS, followed by digestion with Trypsin/EDTA. After 2 min, detachment of the cells was
stopped by addition of cell culture medium. The cell suspension was centrifuged at 250 x g for
5 min and 105 cells/mL were resuspended in an appropriate amount of fresh media,
respectively. For cell counting, 10 µL of the cell suspension were mixed with 90 µL Trypan
Blue and transferred into a Neubauer chamber and cell number per mL was calculated
according to the following equation:
(𝑐𝑐𝑚𝑚𝑐𝑐𝑐𝑐𝑐𝑐 𝑐𝑐𝑐𝑐𝑐𝑐𝑐𝑐𝑡𝑡𝑚𝑚𝑚𝑚)4
∙ 10 ∙ 1000 = 𝑖𝑖𝑖𝑖𝑐𝑐𝑐𝑐𝑟𝑟 𝑚𝑚𝑚𝑚� (10)
For transfection experiments, lipofection was carried out with TransIT-LT1 transfection
reagent, where the complex consisting of plasmid DNA and lipids forming liposomes enters
the cells. This technique is used to introduce purified nucleic acids, especially plasmid DNA,
into eukaryotic cells, resulting in expression of the favored protein via translation and
transcription. For this purpose, HEK293 cells were seeded in a 24-well plate, in such a way
that they were grown sub-confluently (70 %) at the moment of transfection. Further procedure
followed manufacturer’s instructions and the cells were transfected with the vectors pcDNA
3.1. ITGA2B WT, pcDNA 3.1 ITGB3 WT, pcDNA3.1. ITGA2B R320C, pcDNA3.1. ITGB3
C560R and pcDNA3.1. ITGB3 R563C, respectively. After the transfected cells were grown for
24 h, selection media containing 2.5 mg/mL G-418 replaced the regular media (all expression
plasmids used in this work contain a G-418 resistance sequence as selection marker). For
generation of a homogenous cell line fluorescence activated cell sorting (FACS) was carried
out (Chapter 3.6.4).

40
3.6.2. Mutagenesis and isolation of plasmid DNA Mutagenesis of integrin αIIbβ3 plasmid DNA For the generation of HEK293 cells expressing integrin αIIbβ3 wildtype (WT) as well as for the
mutants HEK293 αIIbβ3 active and HEK293 αIIbβ3 inactive several plasmids were used.
The constructs pcDNA3.1(-)GPIIb and GPIIIa, which were a kind gift from Prof. Karen
Vanhoorelbeke, were used as templates for the mutagenesis. First, polymorphisms in the
GPIIIa plasmid (c. 1043G>A/p. R348Q [M1] and c. 1459G>A/p. A487T [M2]) were mutated
back to the WT NCBI sequence ID: NM_000419.4), from now on namely pcDNA 3.1 ITGA2B
WT. For the constitutively active integrin construct, the mutation C560R (Ruiz et al. 2001) was
introduced in pcDNA3.1 ITGB3 WT plasmid. For the constitutively inactive integrin, two
mutations were inserted: R563C to the ITGB3 WT plasmid and R320C to the ITGA2B plasmid
resulting in the mutant constructs pcDNA3.1. ITGA2B R320C and pcDNA3.1. ITGB3 R563C
respectively (Takagi et al. 2002).
Mutagenesis is used for the introduction of targeted mutations in the plasmid DNA sequence
and was performed with the QuikChange II Site-Directed Mutagenesis Kit following
manufacturer’s instructions. The utilized primers are listed in Table 3.
Table 3: Mutagenesis and Sequencing Primer Sequences.
Name Sequence 5’-3’ ITGB3 R563C forward TACTGCAACTGTACCACGTGTACTGACACCTGCAT
ITGB3 R563C reverse ATGCAGGTGTCAGTACACGTGGTACAGTTGCAGT
ITGB3 C560R forward GACCGGCTACTACTGCAACCGTACCACGCGTACTG
ITGB3 C560R reverse CAGTACGCGTGGTACGGTTGCAGTAGTAGCCGGTC
ITGA2B R320C forward ATGGAGAGCCGGGCAGACTGTAAACTGGCCGAAGT
ITGA2B R320C forward ACTTCGGCCAGTTTACAGTCTGCCCGGCTCTCCAT
ITGA2B M1 forward CTGTATATGGAGAGCCGGGCAGACCGAAAACTG
ITGA2B M1 reverse CAGTTTTCGGTCTGCCCGGCTCTCCATATACAG
ITGA2B M2 forward CAGCCAGTGGTGAAGGCCTCTGTCCAGCTAC
ITGA2B M2 reverse GTAGCTGGACAGAGGCCTTCACCACTGGCTG
ITGA2B-F1 ITGA2B-R1 ITGA2B-F2 ITGA2B-R2 ITGA2B-F3 ITGA2B-R3 ITGB3-R1 ITGB3-F1
CCTCTCCTTTGACTCCAGCA
CAAAATTTCCACCGCTCCCA
TCGAGATGAGGCAGACTTCC
GGCACACATACGTCATCTTC
GTGAATGGTCTTCACCTCAG
CAGCTTACGAGAACTGGATC
ACTGACTTGAGTGACCTGGG
GCAGGCTACAGTCTGTGATG

41
ITGB3-R2 ITGB3-F2 ITGB3-F3 ITGB3-R3
GCAGGCACAGTCACAATCAA
CCCTGGCCTCAAGTCTTGTA
TGACGACTTCTCCTGTGTCC
CTACCACATACAGGATGGAC
bGH-R TTGTCTTCCCAATCCTCCCC
T7 TAATACGACTCACTATAGGG
The mutagenesis polymerase chain reaction (PCR) contained the ingredients listed in Table
4.
Table 4: PCR reaction mixture.
Template DNA 40 ng
dNTPs 1 µL (10 mM)
5x amplification buffer 5 µL
Mutagenesis primer fw 10 pmol
Mutagenesis primer rev 10 pmol
Polymerase 1 µL
DMSO 5 µL
Deionized water To 50 µL
The reaction mixture was shortly mixed and incubated in a thermocycler as shown in Table 5. Table 5: PCR conditions
Step Temperature Time Cycles Denaturation 95 °C 30 sec 1
Denaturation 95 °C 30 sec
Annealing 55 °C 1 min 16
Elongation 68 °C 8 min
Cooling 4 °C Infinite (not longer than
12 hours)
1
Afterwards, the reaction mixture was incubated with 1 µL of the restriction enzyme DpnI to
remove the template DNA, which is dam-methylated, different from the new amplified DNA.
Finally, the mixture was transformed in Escherichia coli (E. coli) NEB 5 alpha.
42
Transformation in competent Escherichia coli During transformation, free DNA is introduced to competent bacterial cells. For this purpose,
competent E. coli (NEB 5 alpha) were thawed on ice for 10 min and mixed with 1 µL of the
DpnI digested PCR reaction solution for 30 min. After a heat shock at 42 °C for 30 s the mixture
was incubated on ice for 5 min. Next, 950 µL LB-Media was added and incubated at 37 °C for
1 h. Finally, 10, 100 and 500 µL were added to LB-agar plates containing 100 µg/mL of the
selective antibiotic ampicillin (Amp) and incubated overnight at 37 °C. Grown colonies were
picked, transferred to 2 mL LB-media and incubated at 37 °C in a bacterial shaker overnight.
Plasmid DNA isolation and sequencing Plasmid DNA was isolated directly from the transformed bacteria after growing overnight in
LB-Media supplemented with ampicillin by the GeneJET plasmid Miniprep Kit following
manufacturer’s instructions. 500 µL of the remaining bacteria culture were frozen in 25 %
glycerol at -80 °C. The obtained plasmid DNA was sent to Microsynth SEQlab GmbH
(Göttingen, Germany) and the sequence was verified by Sanger-Sequencing by usage of the
primers mentioned in Table 3. Results were evaluated using Snapgene. When the desired
mutations were introduced, 250 mL LB Media with Amp were inoculated with 500 µL of
overnight culture and incubated at 37 °C in a bacterial shaker overnight, to obtain more plasmid
DNA for further experiments. The plasmid DNA was isolated by usage of the PureLink HiPure
Plasmid Maxiprep Kit following manufacturer’s instructions. Concentration of the prepared
plasmid DNA was determined with a spectrophotometer (A260 nm) and DNA was stored at
-20 °C.
Agarose gel electrophoresis DNA fragments can be separated by their size via agarose gel electrophoresis. Therefore,
DNA sample with loading dye (0.03% bromphenol blue, 0.03 % xylene cyanol FF, 30 %
glycerol, 10 mM Tris HCl, 50 mM EDTA) was loaded onto a 1 % agarose gel mixed with 0.5 µL
DNA Stain G. The fragments were separated by 100 V for 50 min in a mini electrophoresis
system with 1 x TAE buffer (40 mM Tris, 1 mM EDTA, 20 mM acetic acid, pH 8). For guidance,
a DNA ladder (GeneRuler 1 kb) was also loaded onto the gel. Finally, the gel was imaged
under UV-light in a Gel Dock XR imaging system.
Restriction digestion Restriction endonucleases cut DNA at specific sequences and enables thereby the evaluation
of produced Plasmid DNA. The batch was mixed as follows:

43
Template DNA 4 µL
10 x Buffer 2 or Buffer 4 2 µL
Enzyme 1 µL
Deionized water 13 µL
Buffer was applied following manufacturer’s instruction for the respective enzyme. The mixture
was incubated for at least 1 h at 37 °C. Afterwards, the samples were loaded onto an agarose
gel for electrophoretic separation.
3.6.3. Confocal microscopy Confocal microscopy theory. The confocal microscopy provides various advantages
towards conventional light microscopy such as a controlled strait focus depth and the removal
of non-focused light. A laser is reflected by a dichroic mirror and focused on the specimen
through a water or oil immersion objective. Fluorescent or reflected light is collected by the
same objective lens and directed through the detector. A pinhole allows only in focus light and
eliminates the scattered out-focused light, which reduces the background generally. Several
layers can be imaged which enables the depiction of 3D objects (Diaspro 2002).
Sample preparation. The cells were grown on 8 well µ-Slides, incubated 20 min with media
or media containing 1 mM MnCl2. Then cells were washed three times and fixed using 4 %
paraformaldehyde for 30 min at RT. Afterwards, cells were permeabilized for 4 min with 0.1 %
Triton X-100. 3 % BSA blocking solution was added for 30 min, followed by addition of
respective primary antibody for 1 h at RT. Secondary antibody was then added in the dilutions
indicated in the graphs for 45 min. Samples were washed in between the incubation steps
three times with PBS containing 0.05 % Tween-20, respectively. Finally, slides were covered
with PBS and visualized in a Leica TCS Sp5 confocal microscope. The representative pictures
were taken at 40x magnification and 5x zoom. Picture assessment was performed with GIMP
2.10.14.
3.6.4. Flow cytometry and fluorescence-activated cell sorting (FACS) FACS theory. Differently from the microscope, a flow cytometer quantifies a set of parameters
from particles or cells in suspension in a high-throughput manner. Fluorescently-labeled
suspended particles in a continuous flow pass a beam of light of a single wavelength performed
by optical filters that block certain wavelengths. Thereby, every particle scatter in a distinct way
the light, that is detected by a photodiode as well as a photomultiplier tube and converted into
electrical signals. Additionally, the conjugated fluorescent substance emits, after excitation,

44
light which can be detected as well. Therefore, flow cytometry is applied for research, but also
for various diagnostic tests in the clinics.
According to morphological and structural characteristics, the light is scattered differently: the
forward scatter (FSC) is associated with the cell size, whereas the lateral side scatter (SSC)
depends on the cytoplasmic granularity of the cell. Fluorescent light, e.g. bound monoclonal
antibodies conjugated with a fluorophore, is emitted and a series of lenses collects the
scattered light (Errante 2016).
In order to sort cells, a gate is applied to the desired population of cells. By usage of a
conductive sheath fluid, the sample stream is vibrated in the moment it exits the nozzle,
causing stream brake- up into droplets with each containing one cell (Figure 9). Negatively and
positively charged plates on either side of the stream cause deflection of the droplets that meet
the sorting gate criteria by applying of charge. The cells are collected in specific containers
and can be used for further experiments. Cell sorting enables the synthesis of homogenous
cell culture samples with a high degree of purity (Rowley 2012).
Sample preparation of cells. Cells were incubated on a 6-well plate with media, activation
medium containing 1mM MnCl2, or activation media with added 5 mM EDTA for 20 min and
detached with Trypsin/EDTA for 2 min. After stopping detachment with media, the sample was
transferred into a FACS tube and centrifuged at 250 x g for 5 min. The supernatant was
Figure 9: FACS setup. Adapted from (Rowley, 2012).

45
discarded and the pellet washed with PBS and centrifuged at 250 x g for 5 min. Next, pellet
was solved in 300 µL PBS and fluorescently-labeled antibodies were added according
manufacturer’s instructions for 15 min. Finally, the sample was washed with PBS and
measured in a BD LSR II flow cytometer.
For sorting experiments 1 x 10⁵ CD41 and CD61 positive (+) cells were collected in a BD FACS
Aria III and seeded in a 12-well plate for further experiments. Sorting was carried out until a
98% homogenous cell culture was reached. Respective antibodies are indicated in the graphs.
Evaluation of the data was carried out using the software FlowJo V10. First, the cell region
was marked in the side scatter area (SSC-A) versus front scatter area (FSC-A) plot. Then, the
cells were pictured in the front scatter height (FSC-H) versus FCS-A plot. Afterwards, from the
single cells, the mean fluorescence intensity was plotted by using the histogram of the
corresponding fluorescence channel. Data processing is representatively demonstrated in
Figure S2.
3.6.5. Atomic force microscopy (AFM) AFM theory. The AFM was invented in the 1980s by Binnig, Quate and Gerber and has
become a relevant tool in different research fields such as surface science, material science
or medical biology. This imaging technique allows resolution of surfaces on atomic level.
Basically, a sharp tip mounted at the end of a cantilever, scans the surface of the sample line-
by-line. Thereby, the cantilever is deflected and a feedback system adjusts the distance
between sample and cantilever tip to keep a constant deflection. According to Hook’s law, a
force is needed to extent the spring with a specific spring constant k, and the distance that is
extended x depends linearly on the applied force F (Giuliodori et al. 2009):
𝐹𝐹 = 𝑘𝑘 ∙ 𝑥𝑥 (11)
A laser beam is reflected from the back side of the cantilever onto a position sensitive
photodetector (Figure 10). Deflection of the laser beam on the detector is utilized to measure
the deflection of the cantilever. By plotting the deflection of the cantilever versus its position on
the surface a three-dimensional image of the surface is obtained.

46
Generally, two operating modes are used for imaging: the contact mode where the tip is in
contact with the surface with a distance less than a few angstroms and the tapping mode, in
which the tip is vibrating in its resonant frequency, due to its piezoelectric characteristics, with
spacing to the sample of tens to hundreds of angstroms. The resonant frequency of the
oscillation decreases as the sample is approached due to forces (e.g. van der Waals forces)
that tend to be quite small in the range of 10-12 N, which in turn makes a non-destructive
imaging possible (Butt et al. 2005).
Besides imaging of surfaces, AFM can be used to measure force-versus-distance curves.
Here, the cantilever is moved towards the surface and retracted again. The vertical deflection
is recorded and converted to a force-distance curve (Senden 2001; Maghsoudy-Louyeh et al.
2018; Butt et al. 2005).
By knowing the mechanical properties of the cantilever, sample elasticity (Young’s Modulus-
YM) can be calculated using the Hertz model. The Young Modulus is defined as the ratio
between the applied forces (F) per unit surface to the material and its deformation. The higher
the YM, the stiffer the material. The Hertz Model describes elastic deformation when an applied
force causes an indentation depth when pressing a probe into a soft surface. It assumes: i) an
isotropic and linear elastic solid having a half spherical shape, ii) the indenter must have a
spherical shape and iii) the indented sample is assumed to be thicker in comparison to the
indentation depth. The Poisson’s ratio (ν) depends on the used material and is set to 0.5 for
soft biological samples. Additionally, different indenter geometries (includes also α = face angle
given by the cantilever) lead to different radii of the contact circle (R) and indention depth (δ).
Figure 10: Schematic of the cantilever deflection. The position sensitive device (PSD) is indicated as a photodiode. ΔPSD is the distance of the movement of the the laser spot, Zc is the cantilever deflection. Adapted from (Butt et al., 2005).

47
The YM is calculated for spherical probes using the following equation (Kuznetsova et al. 2007;
NanoWizard 2014):
𝐹𝐹 = 𝑌𝑌𝑀𝑀1− 𝜈𝜈2
�𝑎𝑎2+ 𝑅𝑅2
2𝑐𝑐𝑖𝑖 𝑅𝑅+𝑎𝑎
𝑅𝑅−𝑎𝑎− 𝑎𝑎𝑀𝑀� (12)
𝛿𝛿 = 𝑎𝑎2𝑐𝑐𝑖𝑖𝑀𝑀 + 𝑎𝑎𝑀𝑀 − 𝑎𝑎
Even intra- and intermolecular forces of biomolecules can be measured when a tip is
functionalized with biomolecules that interact with molecules on the surface. The required force
to pull the interaction molecules apart can be determined and displayed in a force-distance
curve (Figure 11).
Figure 11: Ideal force-distance curve. Ideal force-distance curve describing a single approach-retract cycle of the AFM tip. The Cantilever is approaching the sample surface (A). The first contact between the tip and the surface is characterized by van der Waals forces that causes an attraction of the tip towards the surface (B). Thus, the tip applies a force upon the surface that causes to sample indentation and cantilever deflection (C). Then, the cantilever tries to retract and to break off from the surface (D). Various adhesive forces between the sample and the AFM tip impair tip retraction. The force-distance curves give the values of adhesive forces (E). The tip is removed and loses contact to the surface by exceeding the adhesive forces (F). Adapted from (Shahin et al. 2005).
Experimental details. All cell AFM experiments were performed by Theresa Brinker, Master
student between 04.2019-06.2020 in the Biophysical Chemistry group of Prof. Delcea, at the
University of Greifswald. For measurements, an AFM Nanowizard 3 AFM System with an
inverted Olympus ix81 microscope was used.

48
5 µm silica beads were attached to a tip-less silicon cantilevers called colloidal probes. A thin
stripe of UV glue was placed on a clean glass slide. The cantilever was dipped into the glue
and excessive glue was removed by dipping on the glass surface. Afterwards, the cantilever
was pressed onto a single silica bead in water. After the attachment, the glue was exposed to
UV-light for 30 min for hardening. A side view image of the cantilever depicts effective
attachment of the bead (Figure 12).
Glass slides where prior to use cleaned using RCA cleaning solution containing NH3:H2O2:
H2O (1:1:6) at 70 °C for 10 min. Next, slides were rinsed extensively with water and dried under
nitrogen. The cantilever was calibrated using mica surfaces with the JPK SPM Control
Software using the thermal noise method, which allows the conversion of the nanometer
deflection of the cantilever into force by usage of the Hooke’s law (see equation 11). The
thermal noise method plots the cantilever fluctuations as a function of frequency. At the
resonance frequency, the cantilever will have the greatest amplitude and its curve can be fitted
with a Lorentz function. Determined spring constants show a range provided by the
manufacturer of 0.003 – 0.13 N/m.
Force measurements were carried out with a force set point of 1 nN and a velocity of 5 μm/s
on a 5x5 grid with 25 points across an area of 5x5 µm. Each measurement was repeated three
times at RT before a new cell was selected. Force-versus-distance curves from at least 20
cells were acquired.
The cells were seeded in a 6-well plate containing the rinsed glass slides with a cell count of
1 x 10⁶. For activation experiments with divalent ions, cells were incubated with 1mM MnCl2,
for 1 h at 37°C prior to measurement the AFM.
Measurements of sample surface topology were carried out in tapping mode AFM using the
JPK AFM as well as Multimode AFM equipped with Nanoscope IIIa controller. For imaging in
air Nanoscope AFM and OMCL-AC160TS cantilevers (42 N/m spring constant, 8 nm tip
curvature) were used, while images in solution were recorded with JPK AFM and Econo-FESP-
Au cantilevers (3 N/m spring constant, < 10 nm tip curvature). Alignment of AFM piezo
Figure 12: AFM cantilever with attached silica bead. Picture was taken by T. Brinker, Greifswald.

49
scanners was confirmed by imaging calibration grating TGZ01 and TGG01. Image processing
including line-by-line polynomial flattening and plane subtraction was carried out to account for
sample tilting.
The AFM imaging of liposomes was carried out by Dr. Peter Nestler from the University of
Greifswald. Tapping mode AFM images were taken in buffer solution after collapse of
liposomes or proteoliposomes on a QCM crystal (SiO2). Height profiles of the DMPG:DMPC
bilayer before and after AFM tip-scratching were evaluated. The same area was imaged again
after applying AFM tip-scratch technique. Therefore, a 3 µm x 3 µm subarea was scanned in
AFM contact mode using 0.5 µN vertical force in order to reveal the QCM crystal surface.
Afterwards tapping mode image of both samples before and after tip-scratching were scanned
for an area of 10 µm x 10 µm for liposomes and 7 µm x 7 µm for proteoliposomes. Histograms
of height distributions were evaluated using JPK software and are fitted using Gaussian
distribution. JPK Data Processing software was used for AFM force curve processing. The
force curves were fitted to the Hertz Model indicated above (12). Inadequately data fitting due
to disturbed measurements were excluded from data processing.
3.6.6. Real time-deformability cytometry (RT-DC) RT-DC theory. Cell deformability can be used as an indicator for changes in the cytoskeleton
and enables a label-free method in various areas of research and diagnostics, e.g. cell cycle
phase analysis or stem cell differentiation (Otto et al. 2015). In 2012, Gosset et al. showed a
high-throughput deformability cytography technique (Gossett et al. 2012), which was advanced
by O. Otto et al. three years later by processing the data simultaneously to the measurement
(Otto et al. 2015). Cells were flown through a microfluidic channel constriction and deformed
(Figure 13A). This deformation is illuminated with a pulsed high-power LED captured by a high-
speed metal-oxide semiconductor camera and the shape change is further analyzed with an
image analysis algorithm in the software. The results are displayed in a scatter plot with the
deformation and the size of the cell (Figure 13B).

50
Figure 13: RT-DC setup. A) Setup and measurement principle (inset shows top view of constriction). B) Scatter dot plot of deformation versus cell size (cross-sectional area) of 8792 cells (dots). Color indicates a linear density of events. Adapted from (Otto et al. 2015)
Experimental details. For the RT-DC measurements, cells were transferred in cell carrier
(<1% methyl cellulose in PBS) to adjust the viscosity. For this, cells were grown on 6 well plate
and detached with trypsin/EDTA for 2 min. New media was added and cells were centrifuged
at 250 x g for 5 min. The cell pellet was then resuspended in 80-100 µL cell carrier.
For activation experiments with divalent ions, cells were incubated with 1mM MnCl2, or 5mM
EDTA for 30 min prior to measurement in RT-DC.
Measurements were performed in a microfluidic chip with a 30 µm channel width. The sheath
and sample tubes were added to 1 mL syringes and filled with cell carrier. Sample was then
added to the chip. Once cells were detected in the flow channel, flow rate was set to 0.16 μL/s
and measurements was taken, followed by a second measurement at 0.32 μL/s. Finally,
measurements at the reservoir was carried out that acts as a shape control without shear
stress. For data processing flow rate 0.16 µL/s was used.
RT-DC data was processed using the Shape-Out software. Upper limit for range area ratio is
set to 1.05. The value refers to the ratio of convex hull area to cell area and all cells with a
difference greater than 5% of those areas are excluded from further analysis. Young’s Modulus
was calculated from analytical model within the Shape-Out software.

51
3.6.7. Statistical analysis Statistical analysis was performed by Theresa Brinker, Master student between 04.2019-
06.2020 in the Biophysical Chemistry group of Prof. Delcea, University of Greifswald. Analysis
of processed AFM and RT-DC data was performed using R and RStudio. Data sets were
collected and exported as .txt file for usage in R.
The 5th and 95th percentile were calculated and only data points inside these boundaries were
used for further analysis.
For the use of linear mixed models (LMM), normal distribution of residuals is assumed by
creation of Q-Q-Plot of the residuals. Best distribution of residuals in Q-Q-Plots was displayed
after log-transformation. Therefore, statistical analysis was carried out with the linear mixed
effects model with log-transformed data.
From fitted models, estimated marginal means (emmeans) were calculated. Emmeans correct
imbalance by giving each group an equal weight, if data is imbalanced due to different groups
with varying number of data points.
Statistical significance has been calculated on three experimental replicates carried out on
separate measurement days. For LMM, a pair-wise comparison is performed where the data
is split into a fixed effect, a random effect and random fluctuations. The fixed effects describe
the statistical difference between two groups (e.g. control and treatments), whereas random
effect and random fluctuations account for systemic and random influences such as
heterogeneous cell populations or temperature fluctuations.

52
4. Results
4.1. Integrin αIIbβ3 in biomimetic systems Integrin αIIbβ3 was reconstituted in a biomimetic membrane system, in particular liposomes,
to allow studies under physiological conditions, as shown schematically in Figure 14.
Subsequently, integrin was treated with ions, drugs or specific ligands and potential activation
of integrin was determined by the binding of the conformation-specific IgM antibody PAC-1,
which is only binding to the extended, opened integrin αIIbβ3 (Taub et al. 1989). For generation
of the biomimetic system several steps were taken: i) pure integrin characterization, ii) bilayer
formation of different lipids by vesicle fusion technique, iii) reconstitution of integrin into
liposomes, and iv) integrin-containing lipid bilayer characterization on SiO2 quartz crystals.
4.1.1. Integrin characterization Pure integrin αIIbβ3 (commercially available) was characterized, prior to activation
measurements, by several biophysical and molecular biology methods. Results are displayed
in Figure 15. An ELISA assay with specific antibodies for the respective subunit was carried
Figure 14: Schematic illustration of the proteoliposomes and structure of integrin αIIbβ3. A) Proteoliposomes after the reconstitution procedure. αIIbβ3 (αIIb-subunit in blue and β3-subunit in orange) is reconstituted into liposomes and treated with Triton X-100 as well as biobeads and used for further experiments. B) Structure of αIIbβ3 in bent (left) and open/active (right) conformation in a DMPG:DMPC (1:20) lipid membrane (cyan). The integrin model combines the αIIbβ3 transmembrane domain (PDB-code 2k9j) and ectodomain (PDB-code 3fcs), missing residues were added as random coils (αIIb-subunit in blue and β3-subunit in orange) Adapted from (Janke et al. 2019)

53
out and the results are shown in Figure 15A. For the αIIb-(CD41), as well as for the β3- subunit
(CD61) the ELISA shows positive signal with an increasing absorbance up to 1 AU. The
purchased antibodies have a different affinity to their respective subunits, which results in
varying antibody concentrations to reach potential saturation of binding. Additionally, the
presence of both subunits was verified by a reductive SDS-PAGE (Figure 15B). The protein
migrated as two visible bands at 110 kDa (blue arrow; αIIb-subunit heavy chain) and 90 kDa
(orange arrow, β3-subunit). Additionally, a band appears at 18 kDa. Moreover, protein stability
was determined by heating the protein in HEPES buffer containing detergent. Thermal
denaturation of proteins induces aggregation, which in turn, results in an increase in size,
observed here at 50.4 °C (Figure 15C). The red line shows a fitting curve applied from the
Thermal Denaturation Plugin from Origin software using a two-state denaturation model
(Niklasson et al. 2015).
4.1.2. Bilayer formation of liposomes with various lipidic systems Integrin containing lipid bilayer should be treated with different drugs, ions or ligands and the
integrin activation state was probed using the conformation specific PAC-1 antibody. For QCM-
D activation experiments supported lipid bilayers (SLBs) can be formed via vesicle fusion
technique. This makes the analysis of membrane proteins and their interaction behavior in a
biomimetic system feasible.
For lipid bilayer formation on SiO2 sensor crystals, first, several lipid compositions were
examined for analysis of vesicle rupture events. Therefore, egg phosphatidylcholine (PC) and
phosphatidylglycerol (PG) were mixed in different ratios and were run over a SiO2 sensor
surface (Figure 16). QCM-D detects mass adsorption (changes in frequency Δf) and the
viscoelastic properties (changes in dissipation ΔD) of adsorbed material. For an excess of PC
Figure 15: Pure integrin αIIbβ3 characterization. A) ELISA for αIIbβ3 integrin subunit detection. 100 ng/well integrin αIIbβ3 are coated on a microtiter plate and different dilutions of antibodies against αIIb-subunit (blue) and β3-subunit (orange) were added. B) Reductive SDS-PAGE gel of pure integrin protein showing protein molecular weight standard (M) and both integrin bands corresponding to the αIIb- (blue) and β3-subunit (orange) C) Protein stability measurements in Zetasizer Ultra. Z-Average of 0.5 mg/mL Integrin αIIbβ3 was measured with increasing temperature. For fitting, ThermDena denaturation plugin using a two-state model of Origin software was used.

54
(PC:PG 4:1, Figure 16A) as well as balanced amounts of PC and PG (1:1, Figure 16B) the
QCM-D graph show typical bilayer formation: after a baseline was reached liposomes show a
strong binding to the SiO2 substrate, as indicated by the decrease in Δf and increase in ΔD.
Both changes reach a peak and then return back again oppositely to a stable value of Δf with
-25 Hz and ΔD with 0.5 x 10⁻⁶ due to release of enclosed aqueous buffer. However, excess
amounts of PG (Figure 16C) show a constant decrease in f that stabilizes at -150 Hz and an
increase in D up to 36 x 10-6.
Egg PC and egg PG were not suitable for successful integrin reconstitution as indicated by our
results, where no integrin could be shown after reconstitution (data not shown), and by another
protocol e.g. from Erb and Engel (Erb and Engel 2000). Therefore, other lipids were selected.
DMPG and DMPC liposomes show comparative bilayer formation behavior as egg PC and egg
PG (Figure 17). Only DMPC or a high ratio of DMPC:DMPG display typical vesicle rupture and
bilayer formation, where its baseline levels out at values of Δf with -25 Hz and ΔD with 0.5 x
10-6 (Figure 17A and Figure 17B). A balanced ratio of DMPC:DMPG from 1:1 leads to low
adsorption of liposomes, reaching a baseline at Δf of -10 Hz and ΔD of 1 x 10⁻⁶, whereas
smaller amounts as well as total absence of DMPC (Figure 17D and Figure 17E) reach
comparable Δf values, but changes in dissipation up to 15 x 10-6. Finally, the DMPC:DMPG
ratio 20:1 was chosen for integrin αIIbβ3 reconstitution into liposomes.
Figure 16: Representative QCM-D data showing the changes in frequency f (blue) and dissipation D (red) of the seventh overtone after injection of egg PC:egg PG liposomes with various lipid ratios at 37°C on a SiO2 sensor. A) 0.8 µM egg PC and egg PG ratio 4:1. B) 0.8 µM egg PC and egg PG ratio 1:1. C) 0.8 µM egg PC and egg PG ratio 1:4.

55
4.1.3. Reconstitution of integrin into liposomes Various techniques were used for validation of successful integrin reconstitution into
liposomes. Figure 18A shows the hydrodynamic diameter of integrin-containing liposomes,
namely proteoliposomes, as well as liposomes measured by DLS. The diameter of
proteoliposomes (255 ± 16.6 nm) was substantially larger than that of liposomes (161 ±
1.3 nm). The presence of the two integrin subunits was verified by flow cytometry of
fluorescently labeled PE CF proteoliposomes (Figure 18B). Over 80 % CD41 (αIIb-subunit)
and CD61 (β3-sununit) positive events were detected, whereas bare liposomes showed no
Figure 17: Representative QCM-D data showing the changes in frequency f (blue) and dissipation D (red) of the seventh overtone after injection of DMPC:DMPG liposomes with various lipid ratios at 37°C on a SiO2 sensor. A) 0.8 µM DMPC. B) 0.8 µM DMPC:DMPG ratio 20:1 C) 0.8 µM DMPC:DMPG ratio 1:1. D) 0.8 µM DMPC:DMPG ratio 1:20. E) 0.8 µM DMPG.

56
staining by anti-CD41 or anti-CD61 antibodies. TEM images of DMPG:DMPC vesicles in
Figure 18C show the globular proteoliposomes with the integrin ectodomain showing a clearly
distinguishable spherical head and a stalk domain at the rim of the membrane, which is
indicated by a black arrow. Moreover, a reducing SDS-PAGE shows two visible bands in the
proteoliposomes sample, corresponding to the two integrin subunits and no migrating protein
bands for bare liposomes (Figure 18D).
Figure 18: Validation of αIIbβ3 reconstitution into liposomes. A) DLS data showing the hydrodynamic diameter of liposomes (black) and proteoliposomes (red) of three replicate experiments measured in liposome buffer at 37 °C. B) FACS-plots with liposomes and proteoliposomes from three independent measurements. Percentages of the mean ± standard error of the mean (SEM) of anti-CD41 (blue) and anti-CD61 binding (orange) on PE CF- liposomes were statistically analyzed. C) TEM images of proteoliposomes. The inset presents a close-up view of integrin αIIbβ3 (indicated by arrow) reconstituted in a membrane. D) Reductive Tris-Glycine SDS-PAGE showing liposomes (-) and proteoliposomes (+) and protein molecular weight standard (M). The bands corresponding to the αIIb-(blue) and β3-subunit (orange) are specified by arrows. Adapted from (Janke et al. 2019).
4.1.4. Proteoliposome-derived bilayer formation Contrary to blank liposomes, as it was depicted in Figure 17C, the injection of the
proteoliposomes lead to a strong increase in the dissipation (12 x 10-6), but only slightly higher
changes in frequency (-50 Hz), which is displayed in Figure 19 as a representative
experimental QCM-D profile. However, the increase in D is not as high as it would be predicted

57
for a vesicle layer with such large liposomes (Richter et al. 2006), which indicates a SLB with
higher dissipation due to the huge ectodomain of the integrin and remaining liposomes on the
bilayer.
A specific procedure was applied for the QCM-D experiments for integrin activation (Figure
19). After reaching a baseline (phase I), liposomes or proteoliposomes formed a SLB (phase
II) and were then washed with the respective buffer. Different treatments are run over the
surface, e.g. divalent ions or drugs (phase III), followed by injection of antibodies and different
ligands (phase IV). The equilibrium shift in f and D between time of injection in phase IV (Δf7
inject; ΔD7 inject) and the time of rinsing in phase V (Δf7 rinse; ΔD7 rinse) was calculated and
correspond to the adsorbed mass(Δm). Eventually, the obtained values are indicators for
interaction and binding to the bare SLB or SLB containing integrin.
To confirm the homogenous formation of SLB or integrin-containing SLB, AFM measurements
of the QCM crystal surface were carried out, as depicted in Figure 20. Tapping mode images
were taken of a liposome- or proteoliposome derived bilayer fused on a SiO2 QCM crystal.
Contact mode was then applied to the bilayer via AFM tip-scratch technique and the height
Figure 19: Representative QCM-D experimental profile of changes in dissipation (D-red) and frequency f (blue) of the seventh overtone at 37 °C. Respective buffer was injected over the SiO2 surface (phase I). After reaching a baseline, liposomes (dashed line) or proteoliposomes (solid line) were added and the formation of a bilayer is presented (phase II). After washing with the respective buffer e.g. containing 1 mM Mn2+ (phase III), ligands (drugs, antibodies or nanoparticles) were injected (phase IV). Rinsing with buffer followed (phase V). Adapted from (Martens et al. 2019).

58
profile was measured again by tapping mode, subsequently. Figure 20A and Figure 20B show
the liposome-derived bilayer before and after scratching, respectively, as well as
corresponding height profiles. Before scratching, the surface is homogenously covered and
saturated, no blank substrate is visible, which would be indicated by dark color. The
corresponding height profile fluctuates between -2 and + 2 nm representing a height of the
covering of approximately 4 nm.
After scratching, followed by imaging in tapping mode of a larger area, a dark colored part
appeared showing the blank substrate at the scratched area. Additionally, small triangular
patterns are getting visible across the homogenous layer on the substrate.
The corresponding histogram height distribution, comparing the height of the scratched area
and the bilayer region, confirms a height distance of 4.3 nm. Figure 20C and Figure 20D display
the same setup but with a proteoliposome-derived bilayer, expecting an integrin-containing
bilayer. The sample covered the surface homogenously and bigger clusters are visible with a
height of approximately 8 nm, becoming broader and rectangular after scratching and imaging.
Figure 20: Tapping mode AFM image of DMPG:DMPC bilayers with and without integrin αIIbβ3. A) Image of a QCM SiO2 crystal in buffer solution after collapse of liposomes. Height profile of bilayer before AFM tip-scratching is depicted in the upper right panel. Section line corresponds to the red line in A. B) Tapping mode AFM image of the same sample area after applying AFM tip-scratch technique as described in Chapter 3.6.5. The color-coded height bar ranges 8 nm. Histograms of height distribution after AFM tip-scratching is displayed right next to the picture. Height distributions are extracted either from region with exposed QCM crystal (blue) or intact bilayer (green), corresponding to blue and green rectangles in B, respectively. Histograms are fitted using Gaussian distribution for QCM crystal and DMPG-DMPC bilayer (red lines) revealing an average bilayer thickness of 4.3 nm. C) Corresponding tapping mode AFM image of DMPG:DMPC bilayer containing integrin αIIbβ. Same setup as described in A. D) Tapping mode AFM image of the same sample area after applying AFM tip-scratch technique. Same setup as described in B.

59
After scratching, histogram height distribution shows a difference in height peaks between
QCM crystal surface and bilayer of 4 nm. However, a second height profile peak appears at 8-
10 nm.
Diluted liposome samples (1:5 in liposome buffer) show bigger structures after tapping mode
imaging, with a height profile up to 60 nm, which is displayed in Figure 21A. Figure 21B depicts
a pure integrin sample air dried on a mica sheet, which exhibits a spherical head domain and
two stalk domains with a lateral length of approximately 30 nm.
4.1.5. Conformational changes of integrin upon treatment with manganese
This thesis addresses further the activation state of integrin αIIbβ3 reconstituted in liposomes
by an activation assay with the conformation-specific antibody PAC-1. Figure 22 shows a
schematic illustration of two experimental setups: QCM-D (A) and activation assay (B). In
QCM-D, vesicles rupture on the sensor surface can be observed and PAC-1 binding to
activated integrin is measured. As confirming experiment, activation assays were carried out,
whereby PAC-1 antibody was immobilized on a microtiter plate and PE CF-labeled liposome
binding was detected. Additionally, PE CF-labeled liposomes were incubated with fluorescently
labeled PAC-1 antibody and binding was detected in a flow cytometer (not illustrated).
Figure 21: Tapping mode AFM image of a DMPG-DMPC liposome containing αIIbβ. A) Proteoliposomes were diluted 1:5 in liposome buffer (0.16 µM lipids). Image is taken in buffer solution after adsorption of proteoliposomes on mica. Scanned area is 2 µm x 2 µm and the color-coded height bar ranges 8 nm. The corresponding height profile of the DMPG-DMPC proteoliposome along the section line layer (red line) is depicted at the bottom. B) Tapping mode AFM image of a single αIIbβ3 integrin deposited on mica. Depicted area measures 75 nm x 75 nm and the color-coded height bar ranges 1 nm. Image is taken in air after sample drying.

60
The activation assay in Figure 23A shows substantially greater binding of PAC-1 to PE CF-
labelled proteoliposomes after treatment with Mn2+ (red) in comparison to EDTA-treated
proteoliposomes (blue). PAC-1 binding was increased without any additional ingredients
(green), whereas flow cytometry measurements show only 2 % binding of PAC-1 to
fluorescently-labelled proteoliposomes (Figure 23B). Mn2+-treated liposomes show 25 %
positive PAC-1 binding and no PAC-1 signal was observed in proteoliposomes incubated with
EDTA for flow cytometry measurements.
Moreover, the complementary biophysical method QCM-D was used to address PAC-1 binding
after formation of a SLB. The changes in f (top) and D (bottom) upon PAC-1 binding are
depicted in Figure 23C. After the mentioned vesicle fusion, the SLB signal of bare liposomes
(black) equilibrates at Δf at -26 ± 0.2 Hz and ΔD response of the opposite direction at 0.5 ± 0.1
x 10-6. Proteoliposomes-created SLB (green) stabilizes at -53 Hz and rises in ΔD up to 12 x
10-6. Upon rinsing in phase III with buffer containing 1 mM Mn2+ (red) Δf decreases
approximately 5 Hz and ΔD increases 2.5 x 10⁻⁶, and EDTA-treatment (blue) reaches changes
of D up to 5 x 10⁻⁶. For determination of integrin activation state, PAC-1 antibody was injected,
subsequently (phase IV). Integrin-containing bilayer treated with Mn2+ (red) showed a reduction
in Δf of 4 ± 0.3 Hz, while regular buffer treatment induces only 1.9 ± 0.7 Hz. Incubation of
integrin-containing bilayer with EDTA led to even lower changes in f. Corresponding response
in ΔD increases conversely. Control measurements without protein (pink, light blue, black)
show neither changes in f, nor in D in phase IV.
Figure 22: Integrin activation detection setup. A) Schematic illustration (not in scale) of the formation of a proteoliposome-derived bilayer with reconstituted integrin αIIbβ3 on a SiO2 quartz sensor. We predict in our QCM-D experiments the fusion of proteoliposomes to the sensor surface to form a bilayer. Possibly, some proteoliposomes remain on the lipid bilayer. B) Schematic illustration (not in scale) for the setup of the activation assay. PAC-1 antibody is coated on a microtiter plate and differently treated PE CF-proteoliposomes bind to the antibody. Fluorescence (indicated by red stars) is then measured and evaluated. Adapted from (Janke et al. 2019).

61
Figure 23: Activation of integrin αIIbβ3. A) Activation assay with PAC-1 antibody. Each value is the mean of three independent measurements ± SEM. Binding of PE CF-(proteo)liposomes to 5 µg/mL PAC-1 coated on a microtiter plate was analyzed after incubation with buffer (green), 1 mM Mn2+ (red) and 5 mM EDTA (blue). Signal of bare liposome samples were subtracted from proteoliposome results. Relative fluorescence units (RFU) specify PE CF fluorescence. B) Integrin activation was investigated by flow cytometry with PE CF-labelled liposomes subtracted from proteoliposomes signal. PAC-1-Alexa 647-coupled antibody was added and percentages of the mean ± SEM of Alexa-647 signal of PE positive events treated with buffer (green), Mn2+ (red) and EDTA (blue) are shown. C) Representative QCM-D data displaying the changes in frequency f (top) and dissipation D (bottom) of the seventh overtone for the binding of PAC-1 antibody at 37 °C. Buffer was injected trough the SiO2 sensors (phase I) and after achieving a baseline (proteo)liposomes were injected. The formation of a bilayer is displayed (phase II). After washing with either liposome buffer, liposome buffer containing 1 mM Mn2+, or 5 mM EDTA (phase III), PAC-1 antibody was inserted (phase IV) and binding was detected (indicated by arrows). Rinsing with the respective buffer followed (phase V). Adapted from (Janke et al. 2019).

62
4.1.6. Secondary structure changes upon manganese-induced integrin activation
To study potential changes in αIIbβ3 secondary structures and its correlation to the activation
state of the protein, CD spectroscopy measurements were carried out. Figure 24A shows
representative far-UV CD spectra of proteoliposomes (green), 1 mM Mn2+-treated
proteoliposomes (red) and after addition of 5 mM EDTA (blue).
Figure 24: CD spectra and MDS of αIIbβ3 A) Far-UV region CD spectra of αIIbβ3 reconstituted into liposomes in buffer (green), with addition of 1 mM Mn2+ (red) or 5 mM EDTA (blue). Representative spectrum recorded with proteoliposomes (protein concentration of ~0.4 µM) or liposomes in 5 mm path length cuvettes at 37 °C is displayed. Liposome spectra were subtracted from the respective proteoliposome spectra. B) MDS representing the regions that changed in the antiparallel β-sheet probability after removal of all structural ions (bottom) or conversion of the three Ca2+ in the MIDAS, ADMIDAS and SyMBS to Mn2+ (top). The blue and red colored regions illustrate the loss or formation of β-sheets, respectively, compared to protein with Ca2+ and Mg2+ only. The β-sheet probability did not change in transparent/white regions. Mn2+ are colored in purple and Ca2+ ions in yellow C) Changes in the secondary structure distribution of integrin αIIbβ3 in buffer environment, after addition of 1 mM Mn2+ experimentally or converting the three ions in the MIDAS and ADMIDAS region to Mn2+ by MDS, and after addition of 5 mM EDTA experimentally or removal of all structural ions during MDS. The calculation of the experimental secondary structure content was carried out with the deconvolution of CD spectra using CDNN software. The MDS secondary structure was calculated with CPPTRAJ. Results correspond to three independent measurements ± SEM. Adapted from (Janke et al. 2019).

63
Bare liposome spectrum is subtracted from respective proteoliposome spectrum and an
integrin far-UV spectrum arises, with one minimum at 210 nm. Mn2+ treatment leads to a
decrease in amplitude, that can be nearly recovered due to EDTA addition.
Molecular dynamic simulations (MDS) studies were performed to confirm the obtained CD
results. For this purpose, all divalent ions were either removed to mimic the experimental
addition of EDTA or the corresponding divalent ions in MIDAS, ADMIDAS and SyMBS of the
β3-subunit were altered to Mn2+. Figure 24B illustrates the changes in β-sheet probability (red-
less β-sheet, blue-higher β-sheet content). Without any divalent ions, various β-sheets
destabilize at the PSI-domain, whereas new β-sheets are formed in the calf-1 as well as calf-
2 domain and already present ones extend in the hybrid domain. Rearrangements occur also
in the β-propeller of the α-subunit, which could be also observed after the exchange of the
divalent ions in the metal ion-binding sides by Mn2+. Additionally, elongation and formation of
new β-sheets in the calf-1 and EGF2-domain arise. Changes in the secondary structure
content for experimental and simulated methods are depicted in Figure 24C. Results of MDS
studies support the CD results, whereby the α-helical content is decreasing with 0.6 % and β-
sheet content rises by 1 % after adding Mn2+ in both methods.
4.1.7. Platelet integrin activation induced by clinical drugs In addition to the treatment with ions, several drugs, that are known to interact with the integrin
αIIbβ3 were tested. Changes in the secondary structure of integrin during the incubation with
the anticoagulant drugs fondaparinux, unfractionated heparin (UFH) and quinine are displayed
in Figure 25A where far UV spectra of liposome-subtracted proteoliposomes upon titration with
rising concentrations of the respective drugs are shown. The extracted normalized CD signal
as MRDE values at 210 nm wavelength are plotted in Figure 25B. The spectra show an
increase in the amplitude with increasing concentration of UFH (Figure 25A) resulting in
reduced MRDE values at 210 nm (blue, Figure 25B). Treatment of proteoliposomes with rising
fondaparinux concentrations leads to insignificant changes of the MRDE signal (purple), which
can be also observed with quinine at concentration between 0.1-1.5 µg/mL (black). A linear
dependency of the MRDE at 210 nm on the logarithm of the drug concentrations, especially
for UFH, can be described within the experimental error, which indicates integrin secondary
structural changes upon UFH treatment.

64
QCM-D results reveal activation state detection by PAC-1 antibody to integrin-containing SLB
upon treatment with fondaparinux, UFH and quinine. Figure 26A shows the representative
QCM-D graphs, starting with the liposome (pink) or proteoliposome (purple) injection followed
by SLB formation and treatment with the drugs, respectively. Untreated SLB and integrin-
containing SLB are highlighted in grey and black, respectively. Changes in f (blue) and D (red)
during PAC-1 injection indicate binding to the bilayer embedded activated αIIbβ3 and are
extracted (as Δf and ΔD) in Figure 26B. The shift in f and D for quinine (4.3 Hz; 1.1 x 10⁻⁶) and
Mn2+ (4.0 Hz; 1.4 x 10⁻⁶)-treated integrin containing bilayer are similar and higher than in the
absence of drug or Mn2+ (buffer, 1.9 Hz; 0.5 x 10⁻⁶).
Figure 25: Integrin αIIbβ3 secondary structure after treatment with drugs. A) The far-UV region CD spectra of αIIbβ3 reconstituted into liposomes in buffer (dark green), and with increasing concentrations of fondaparinux (left), UFH (middle) and quinine (right), respectively. Representative spectra verified for proteoliposomes (protein concentration ~0.4 µM) in 5 mm path length cuvettes at 37 °C are presented. Liposome spectra were subtracted from the respective proteoliposome spectra. B) Normalized single wavelength plot for corresponding MRDE values at 210 nm from far-UV region CD spectra of αIIbβ3 reconstituted into liposomes incubated with rising concentrations of UFH (blue), fondaparinux (purple) and quinine (black), respectively. Normalized means from three independent measurements ± SEM are displayed as dots that were extracted from (A) Respective trendlines were applied to guide the reader. Adapted from (Janke et al. 2019).

65
UFH (3.0 Hz; 1.2 x 10⁻⁶) and fondaparinux (2.0 Hz; 0.7 x 10⁻⁶) show similar PAC-1 binding
compared to buffer control. Additionally, only half of the buffer signal is found upon addition of
EDTA. Furthermore, the activation assay with PAC-1 coated on a microtiter plate confirm the
Figure 26: Integrin αIIbβ3 activation by drug treatment. A) Changes in frequency Δf (top) and dissipation ΔD (bottom) of the seventh overtone after drug treatment of liposome (pink)- and proteoliposome-derived bilayer (purple) at 37 °C. The bilayer was treated with the respective drugs (250 µg/mL fondaparinux, 250 µg/mL UFH and 50 µg/mL quinine sulfate), which is indicated by the first arrow and PAC-1 antibody was added (second arrow) followed by rinsing with liposome buffer. Buffer control treatments of liposome (grey)- and proteoliposome-derived bilayer (black) are displayed in the graph with fondaprinux B) Changes in Δf (blue) and ΔD (red) upon injection of PAC-1 were subtracted from values after rinsing. PAC-1 injection event is indicated by the respective arrows in the representative QCM graphs in (A) with proteoliposomes after treatment with buffer, 1 mM Mn2+, 250 µg/mL fondaparinux, 50 µg/mL quinine, 250 µg/mL UFH and 5 mM EDTA for at least 15 min at 37°C. Results correspond to three independent measurements ± SEM C) Drug activation assay with PAC-1 antibody. Each value is the mean of three independent measurements ± SEM. PE CF-liposomes/proteoliposomes bind to 5 µg/mL PAC-1 coated to a microtiter plate. Binding was detected after the incubation with buffer (dashed, green), 1 mM Mn2+ (dashed, red), 5mM EDTA (dashed, blue), 250 µg/mL fondaparinux (purple), 250 µg/mL UFH (blue) and 50 µg/mL quinine (black). Liposome sample values were subtracted from proteoliposomes values. The y-axis presents relative fluorescence units (RFU). Adapted from (Janke et al. 2019).

66
QCM data (Figure 26C). After incubation with quinine (black) or Mn2+(dashed, red), the highest
binding tendency of PE CF-labelled proteoliposomes to PAC-1 could be detected in
comparison to the buffer control (dashed, green). UFH-treated proteoliposomes (blue) display
higher fluorescence signal than fondaparinux (purple) as well as the buffer control, where the
latter are on the same level. Again, EDTA treatment shows the lowest binding activity of PAC-
1 to proteoliposomes (dashed, blue).
4.1.8. Interaction of integrin αIIbβ3 with fibrinogen bioconjugates An upcoming trend in biomedical research and diagnostics is the treatment with nanoparticles,
whose spectrum of application reaches from imaging to targeted drug delivery. All scenarios
involve blood contact, which includes high abundant proteins, e.g. the integrin αIIbβ3 ligand
fibrinogen and blood cells, e.g. platelets. Therefore, the already presented biophysical setup
for manipulation of activation state of integrin is applied to study the binding of differently
coated fibrinogen-bioconjugated nanoparticles to integrin-containing membranes.
First, size and charge of differently coated Fe2O3 nanoparticles are characterized and are
presented in Figure 27A and Figure 27B, respectively. Before the incubation with fibrinogen
(Fb), citrate-stabilized particles (yellow) reveal a hydrodynamic diameter of 35 nm, while
dextran (blue)- and polyethylene glycol (PEG, red)-coating leads to sizes of 38 nm and 42 nm,
respectively (Figure 27A). After 1 h incubation of nanoparticles with Fb (dashed bars), the
hydrodynamic diameter rises up to 75 nm for citrated and 100 nm for dextran modified
nanoparticles. However, PEGylated nanoparticles stay at 42 nm after 1 h incubation with Fb.
Moreover, zeta potential of nanoparticles was measured before and after incubation with Fb
for 3 h (Figure 27B). Bioconjugate formation results in a change of the zeta potential from -
38 mV to -2 mV for citrated and -37 mV to -7 mV for dextran nanoparticle, but for PEG-
nanoparticles only 2 mV changes resulting in a value of -4 mV.
Finally, the behavior of citrated-, dextran- and PEGylated nanoparticles in the presence and in
the absence of fibrinogen upon interaction with lipid bilayers containing integrin was analyzed
(Figure 27C). A SLB out of blank liposomes or proteoliposomes was formed on a SiO2 sensor
surface by vesicle fusion technique followed by injection of different types of unconjugated or
Fb-conjugated nanoparticles. The QCM-D graphs depict the equilibrium shift of f and D
between NPs injection and rinsing measured in experimental phase IV (Figure 19). The
acquired data corresponds to the adsorbed mass of nanoparticles during the injection period.
Introduction of the SLB to a solution of unconjugated nanoparticles leads to insignificant
changes in in f and D, where dextran and PEG nanoparticles reach minor changes of Δf = 3 Hz
and in ΔD = 1 x 10⁻⁶. Additionally, also Fb alone and Fb-conjugated nanoparticles show no
changes in neither f or D. However, for integrin-containing SLB f changes to 33 Hz and D to 6
x 10-6 upon injection of unconjugated citrated- as well as dextran- coated nanoparticles. PEG

67
coating shows tenfold less values (3 Hz in f and 0.5 x·10-6 in D). Conjugation of PEG
nanoparticles to Fb does not change significantly these results. However, Fb-conjugated
citrate and dextran nanoparticles show significant less adsorption to integrin-containing SLB
(~5 Hz in f and 0.5·10-6 in D) compared to unconjugated nanoparticles.
Figure 27: Fibrinogen-coated nanoparticle binding to artificial platelet membrane. A) Hydrodynamic diameter (intensity weighted distribution) and B) Zeta potential of citrate- (C-NP-yellow), dextran- (D-NP-blue) and PEG-functionalized (PEG-NP-red) maghemite nanoparticles and their bioconjugates with fibrinogen (dashed) in PBS. Results correspond to three independent measurements ± SEM C) Changes in dissipation (top) and frequency (bottom) during injection of fibrinogen (Fb), bare NP (C-citrate, D-dextran, PEG-NP) and fibrinogen-coated NPs (+Fb) received from QCM-D experiments during experimental phase IV (Figure 19). NPs and bioconjugates were added to SLB without (white) or with incorporated integrin (black). The running buffer was PBS without any divalent ions. D) Changes in dissipation (top) and frequency (bottom) during injection of fibrinogen (Fb), bare (C-citrate, D-dextran, PEG-NP) and fibrinogen-coated NPs (+Fb) after incubation with divalent ions (1 mM CaCl2, MgCl2, MnCl2), received from QCM-D experiments during experimental phase IV. NPs and bioconjugates injected to SLB without (white) or with incorporated integrin (black). Adapted from (Martens et al. 2020).

68
Integrin conformation and binding behavior depend on several divalent ions, hence, SLBs were
treated with Ca2+, Mg2+ and Mn2+, where the latter favors the active, ligand binding
conformation of αIIbβ3. Figure 27D shows changes in f and D upon nanoparticle injection after
treatment of the SLB and integrin-containing SLB with divalent ions. The first prominent
variance is that only the buffer switch from divalent ion-supplemented PBS to PBS show
already changes in f (10 Hz) and D (6 x 10⁻⁶) for liposome as well as proteoliposome-derived
SLB, but not for empty sensor surface (Figure S3). Due to stability of the nanoparticle
conjugates, the particles are suspended in PBS without divalent ions. Consequently, the buffer
switch leads to a mismatch that causes a shift in f and D upon NP injection, which is indicated
by the dashed line in Figure 27D. For this reason, changes in that range have to be evaluated
with care.
Injection of citrate-, dextran NPs and the respective bioconjugates to the proteoliposome-
derived SLB results in high Δf (up to 25 Hz for dextran) and ΔD (6 x 10⁻⁶), whereas no changes
occur in the bare SLB sample. Fb conjugation leads to less than half of adsorption for citrate
and dextran coated nanoparticles, but even more compared to no divalent ion treated integrin-
membrane. By contrast, PEGylated blank and Fb-conjugated NPs show no changes in f after
divalent ion treatment, whereas D increased for both SLB and integrin-containing SLB.
4.1.9. Influence of different lipidic systems on platelet integrin activation In this chapter the effect of different lipidic systems on integrin receptor activation will be
presented. For this purpose, a new reconstitution protocol for integrin αIIbβ3 into liposomes
was established using lipids closer to the mammalian cell membrane, since conventional
protocols use lipids with short fatty acid chains typically represented in bacterial cell
membranes. For a better control of the environmental and purification conditions integrin
αIIbβ3 was purified from outdated human platelets for liposome preparation with different lipids
and detergents, subsequently.
After lysis of the platelets, integrin was purified following a protocol from Gingras et al. (Gingras
et al. 2013). First, all glycoproteins, which includes also integrin αIIbβ3, were captured by a
Concanavalin A column. The elution profile is depicted in Figure 28A and elution was induced
by a buffer containing high concentrations of mannopyranoside sugar (Buffer B). Platelet lysate
was loaded on the column and washed with at least 10 column volumes with CHAPS buffer,
to remove Triton X-100, for the samples that should contain CHAPS. The column was then
eluted, which gives peak up to 300 mAu going back to 0 until end of elution. The blue bar
represents the fractions loaded onto the SDS-PAGE (Figure 28B). Both subunits are present
at approximately 100 kDa and 130 kDa in the elution fractions with varying concentrations
decreasing with the volume of elution buffer.

69
In a second step, eluted fractions were loaded on a heparin column to remove other
components of the blood e.g. antithrombin III (Figure 28C), resulting in a band larger than
180 kDa and two bands between 100 and 130 kDa corresponding to integrin in the flow through
Figure 28: Purification of integrin αIIbβ3. A) Elution chromatogram of the ConA column (black) eluted with a flow rate of 1 mL/min and 100 % elution buffer (red), collected elution fractions are indicated in blue. Elution Buffer B was 20 mM HEPES, 150 mM NaCl, 1 mM CaCl2, 1 mM MgCl2, 1 % CHAPS, 5 μmol Leupeptin, 200 mM methyl 𝛼𝛼-D mannopyranoside. B) Reductive SDS-PAGE of ConA Elution factions and protein molecular weight standard (M) shown on the left. Elution fractions are indicated by a blue bar and integrin subunits are displayed by arrows. C) Chromatogram of heparin column (black) eluted with a flow rate of 1 mL/min and 100% elution buffer containing 20 mM Tris, 1M NaCl (red). D) Reductive SDS-PAGE of heparin column. Protein molecular weight marker (M), flow through (1) and elution fraction (2) E) Size exclusion chromatogram of concentrated heparin flow through with a flow rate of 0.5 mL/min, collected elution fractions are indicated in blue. F) Reductive SDS-PAGE of SEC elution factions and protein molecular weight standard (M) shown on the left, elution fractions (1-8) are indicated by a blue bar and concentrated Heparin FT is displayed (9-10). Integrin control is loaded in lane 11.

70
of the heparin column (Figure 28D). The latter mentioned bands are not present in the elution
peak fraction. The last step includes a size exclusion chromatography (SEC) to remove
impurities e.g. fibrinogen or thrombospondin depicted in Figure 28E. The concentrated heparin
flow through was loaded on the column and several peaks appear. The fractions were collected
and analyzed in a reductive SDS-PAGE shown in Figure 28F. In the peak fractions, indicated
by the blue bar, both subunits of the integrin can be detected at approximately 110 kDa and
130 kDa corresponding to the same size of the integrin control bands as well as the bands in
the heparin flow through. The intensity of the bands corresponds to the height of the peaks.
This purified integrin was used further for liposome preparation following the reconstitution
protocol with CHAPS, described in Chapter 3.3.2.
Different lipids and compositions were used to study its influence on the activation dynamics
of integrin αIIbβ3. First, DMPC and DMPG lipids were exchanged to DOPC, SM and
cholesterol in a ratio 37.5:37.5:25 and integrin was reconstituted with the already presented
Triton X-100 protocol (Erb and Engel 2000).
Figure 29: Characterization of integrin reconstitution into different lipid systems. A-C) DLS data showing hydrodynamic diameter of liposomes (black) and proteoliposomes (blue) of three independent measurements in respective buffer at 37°C. Liposomes are reconstituted with A) DMPG:DMPC lipids and Triton X-100 B) DOPC:SM:cholesterol and Triton X-100 and C) DOPC:SM:cholesterol and CHAPS. Corresponding Z-Average and polydispersive Index (PDI) are specified in the table under the graphs. D-F) Correlation function distribution fit (lines) of the corresponding DLS measurement (dots) for liposomes (black) and proteoliposomes (blue).

71
Figure 29 shows the hydrodynamic diameter of these liposomes (B) compared to the
liposomes prepared with DMPG:DMPC (A). DMPG:DMPC liposomes display a hydrodynamic
diameter of 136 nm for liposomes, 358 nm for proteoliposomes and a PDI around 0.27 (Figure
29A). Moreover, the corresponding correlation function distribution fit describes the data well
(Figure 29D). However, same preparation method but different lipids (DOPC, SM and
cholesterol) produce liposomes (2312 nm) and proteoliposomes (1733 nm) larger than 1500
nm (Figure 29B). Additionally, the PDI shows values upon 0.5 and a correlation distribution fit
deviating from the measured data points (Figure 29E). Changing of the reconstitution protocol
to a method based on excessive dialysis (Coskun et al. 2011) and the detergent CHAPS leads
to liposomes with a hydrodynamic diameter of 384 nm and 189 nm for proteoliposomes which
is depicted in Figure 29C. The PDI is under 0.3 and the fit of the correlation distribution function
describes the measured data points (Figure 29F).
Additionally, reductive SDS-PAGE shows bands for all proteoliposome samples and control
integrin at approximately 90 and 110 kDa (Figure 30) corresponding to the control integrin, that
could be detected with highest intensity of bands for the Triton X-100 reconstitution protocol
with DMPG and DMPC (Figure 30) as well as its modified version with DOPC, SM and
cholesterol. Several ratios of DOPC, SM and cholesterol are applied, giving different rates of
lipid-ordered and lipid-disordered phases [ratios taken from (Kaiser et al. 2009)].
Figure 30: Reductive SDS PAGE of liposomes and proteoliposomes prepared with different lipids and lipid ratios. Reductive SDS-PAGE of protein molecular weight standard (M) and control of integrin αIIbβ3 (Ctrl). The bands corresponding to the αIIb- (blue) and β3-subunit (orange) are indicated by arrows. DOPC:SM:cholesterol proteoliposomes (even numbers) and liposomes (odd numbers) following the modified reconstitution protocol from Coskun et al. with ratios, 25:35:40 (1,2), 45:30:25 (3,4), 60:28:12 (5,6), 70:25:5 (7,8) are shown. Additionally, proteoliposomes and liposomes prepared using reconstitution procedure of Erb and Engel (Erb and Engel 2000) with Triton X-100 are shown. DOPC:SM:cholesterol in a ratio 37.5:37.5:25 (9,10) and DMPG:DMPC lipids with a ratio 1:20 (11,12) are displayed.

72
High amounts of cholesterol lead to less intense protein bands after reconstitution
(DOPC:SM:cholesterol 25:35:40-lane 2), whereas high amounts of DOPC show more intense
integrin bands (all other ratios DOPC:SM:cholesterol 37.5:37.5:25; 45:30:25; 60:28:12;
70:25:5- lane 3-10). The different lipid ratio derived (proteo-)liposome hydrodynamic diameters
were measured in DLS (Table 6) and mostly, a heterogeneous size distribution was found, as
indicated by high PDI values ranging from 0.363, for ratio with the maximum cholesterol
concentration, to over 0.75 for high DOPC content. Size decreases upon arising DOPC
content, whereas the ratio with highest cholesterol concentration are becoming larger up to
sizes over 700 nm. In most samples a second peak (by intensity) appears, which is mostly
under 100 nm. Bare liposomes are significantly larger compared to proteoliposomes, except
for the ratio 70:25:5, where liposomes are smaller (275 nm) than proteoliposomes (337 nm).
Lipid stability for every liposome ratio after reconstitution was detected in a thin layer
chromatography (Figure S4). Table 6: Hydrodynamic diameters of different DOPC:SM:cholesterol ratios after integrin reconstitution or blank liposomes. Data was collected using a Zetasizer Ultra.
DOPC:SM: cholesterol
Peak one by intensity
[d.nm] Peak two by intensity
[d.nm] PDI
25:35:40 liposomes 739.33 81.2 0.437 proteoliposomes 652 111.5 0.363
45:30:25 liposomes 814.75 54.1 0.389 proteoliposomes 580.33 68.1 0.495
60:28:12 liposomes 475.33 42.6 0.447 proteoliposomes 320 457.8 0.441
70:25:05 liposomes 275 - 0.76 proteoliposomes 337 41.4 0.75
The ratio with liposome sizes around 150 nm, intense protein bands in SDS-PAGE and a PDI
under 0.7 was chosen for negative stain imaging in transmission electron microscopy (Figure
31). Additionally, these samples were compared to the Triton X-100 protocol derived
(proteo)liposomes comprising of DOPC, SM and cholesterol. The proteoliposomes prepared
with the CHAPS protocol show a spherical shape structure with size of 200 nm (Figure 31A
and 31B). A close-up view allows the identification of elongated structures at the rim of the
liposomes forming a head and thinner leg domain (indicated by arrows) with a size of
approximately 20 nm which are not detectable in liposomes (Figure 31C and 31D).
DOPC:SM:cholesterol proteoliposomes formed by the reconstitution procedure with Triton X-
100 display indeed similar structures at the edge of the spherical shaped vesicles, but huge
accumulations of aggregated liposome structures with various sizes (Figure 31E and 31F)
which are also visible for liposomes alone (Figure 31G and 31H).

73
Figure 31: TEM images of (proteo)liposomes with different preparation methods. A) Proteoliposomes prepared with CHAPS protocol and DOPC:SM:cholesterol ratio 45:35:25. B) Rectangle insert close-up from A. Protein is indicated by the black arrows. C) Liposomes prepared with CHAPS protocol and DOPC:SM:cholesterol ratio 45:35:25. D) Rectangle insert close-up from C. E) Proteoliposomes prepared with Triton X-100 protocol and DOPC:SM:cholesterol ratio 45:35:25. F) Rectangle insert close-up from E. Protein is indicated by the black arrows. G) Liposomes prepared with Triton X-100 protocol and DOPC:SM:cholesterol ratio 45:35:25. H) Rectangle insert close-up from G.

74
The influence of varying lipid compositions on integrin activation was further analyzed using
an adapted QCM-D setup which is already described in chapter 4.1.5. Briefly, blank liposomes
or proteoliposomes were injected and a lipid bilayer was generated with an amphipathic, α-
helical (AH) peptide derived from hepatitis C virus (Cho et al. 2007a; Cho et al. 2007b). After
SLB formation, the membrane was treated with or without Mn2+ to induce potential integrin
activation. Finally, PAC-1 antibody was injected and changes in frequency and dissipation
were detected. The changes upon mass adsorption between f before PAC-1 injection and f
after rinsing (Δf) is displayed in Figure 32 and shows the PAC-1 binding to buffer (black)- or
Mn2+-treated (red) proteoliposome-derived SLB. Non-treated SLB with integrin show the
highest PAC-1 binding (1.2 Hz) in the ratio 37.5:37.5:25, while 25:35:40 and 45:30:25 show
the least changes in f (~0.2 Hz).
The question arises whether integrin activation could be impaired by the presence of different
lipid ratios. Therefore, SLB was treated with Mn2+ to induce integrin activation and only the
ratios 37.5:37.5:25 and 45:30:25, as well as the DMPG:DMPC derived SLB show high
difference between Mn2+ treated SLB and the buffer control (>1 Hz), where the latter even
increased from 1.1 to 4 Hz upon Mn2+ treatment. All other ratios (25:35:40, 60:28:12 and
70:25:5) display changes in f comparable to buffer controls. DOPC:SM:cholesterol
proteoliposomes prepared with Triton X-100 exhibits vesicle fusion to the substrate,
equilibrating at -150 Hz (Δf) and 30 x 10-6 (ΔD). High changes in frequency and dissipation
indicate the formation of a vesicle layer, therefore no formation of a SLB was observed, not
even with AH-fusion peptide treatment, and PAC-1 binding is not reliable due to unspecific
adsorption to the surface. The corresponding QCM graph is depicted in Figure S5.
Figure 32: Activation of integrin αIIbβ3 reconstituted within different lipid ratios: Changes in Δ f upon injection start of PAC-1 were subtracted from values after rinsing. QCM-D experiments were carried out with proteoliposomes after treatment with buffer (black) or 1 mM Mn2+ (red) for at least 30 min at 37°C. DOPC:SM:cholesterol derived proteoliposomes with different ratios are injected onto a SiO2 surface and vesicle fusion was forced with 13 µM AH peptide. Afterwards, membrane was treated for at least 30 min with either HEPES liposome buffer or buffer containing 1 mM MnCl2, followed by injection of PAC-1 antibody diluted 1:50 in the respective buffer. Finally, membrane was rinsed with the respective buffer. Results correspond to two-three independent measurements ± SEM. Overall results are depicted in Table S1.

75
4.2. HEK293 cells as an expression platform and model system to study the impact of integrin on cell elasticity
Proceeding from the artificial membrane system and its many advantages, proteoliposomes
alone are not able to mimic the highly complex network in cells, such as blood platelets.
Platelets are highly active and can be triggered by various external influences including shear
stress. Additionally, mutagenesis of platelets is not easily possible due to absence of the
nucleus. Therefore, an integrin expression platform in HEK293 cells mimicking indeed the
complex cell network but avoiding the delicate activation threshold of platelets was established.
For understanding of the integrin activation and its effect on the actin cytoskeletal structures
as well as resulting mechanical properties of the cell, mutations were introduced leading to
constantly active or inactive integrins. Several setups where established to address impact of
integrin αIIbβ3 on cell mechanical properties and are illustrated in Figure 33. Both adhesive
and suspended cell elasticity was studied by the two biophysical methods AFM and RT-DC.
Figure 33C shows a close up view of the cell membrane containing either integrin αIIbβ3
wildtype (WT), αIIb-(ITGA2B) R320C and β3-(ITGB3) R563C for inactive integrin mutant
(αIIbβ3 Inactive) or β3-(ITGB3) C560R for the constantly active integrin mutant (αIIbβ3 Active).
Talin-1 binds to the integrin cytoplasmic tails and connects them with vinculin and the actin
filaments. Additionally, confocal images were taken to see the direct influence of integrin
activation on the cytoskeleton.
Figure 33: Schematic illustration of integrin effect analysis on cell mechanical properties. A) Elasticity of adhesive HEK293 cells was examined by AFM. B) Cell deformability in suspension was measured in RT-DC. C) Close-up of the interface between extracellular matrix (ECM) and cytosol of the cells (not in scale). The membrane is illustrated containing integrin αIIbβ3 (αIIb-blue; β3-orange) wildtype, mutations αIIb (ITGA2B) R320C and β3 (ITGB3) R563C for inactive integrin, as well as β3 (ITGB3) C560R for the constantly active integrin. The integrin cytoplasmic tail is related to talin-1, which is associated with actin and vinculin among others.

76
4.2.1. Expression of integrin αIIbβ3 and co-localization For preparation of the integrin wildtype and mutant expressing cells, site directed mutagenesis
was carried out and HEK293 cells were transfected to express the desired integrin protein.
Plasmid DNA was verified by restriction enzyme digestion and Sanger-sequencing. Confocal
microscopy imaging reveal presence of both subunits by fluorescently-labeled antibody
staining. Fluorescence signal is displayed at the rim of the integrin expressing cells and is
depicted in Figure 34. All cells show a profile size of around 20 nm. Integrin expression and
membrane localization was validated and the fluorescence signal is evenly distributed over the
entire edge of the cells.
Furthermore, subunit expression was controlled by flow cytometry measurements. Figure 35
presents the results after staining the different cell lines with fluorescently-labeled antibodies
against the αIIb- and β3-subunit. Additional to fluorescence signal, size and granularity can be
detected via forward and side scatter (FSC and SSC) and are shown in Figure 35A. Cells of
interest were gated in a FSC versus SSC plot to exclude debris and doublets. Single parameter
histograms of single cells were used further to identify the expressed marker CD41,
Figure 34: Representative confocal images of co-localized integrin subunits. Different cell lines were stained with primary antibodies from left to right: anti-CD41 Alexa 488 (green) and anti-CD61 Alexa 647 (red) in a dilution of 1:100. Both fluorescence channels are overlaid for co-localization in a merge picture and brightfield image is shown on the right. Scale bar corresponds to 10 µm for all images.

77
corresponding to the αIIb-subunit (B) and CD61, as marker for the β3-subunit (C), respectively.
The appropriate frequency of positive signal is summarized in Figure 35D. HEK293 cells do
not show any signal, while αIIbβ3 WT expressing cells have over 91 % CD41- and 89 % CD61-
positive cells. Also, αIIbβ3 inactive cells show 94 % CD41- and 89% CD61-positive signal,
which can be replicated by the αIIbβ3 active mutant cells (87 % CD41-positive, and 97 %
CD61-positive cells).
4.2.2. Integrin activation and cytoskeletal rearrangements Integrin activation was induced by Mn2+ treatment and active conformation-specific antibody
binding (PAC-1) to the different cell lines expressing wildtype (WT) as well as its integrin
mutants was analyzed in a flow cytometer. Figure 36 shows all β3-positive single cells that are
additionally positive for PAC-1 antibody fluorescence signal (gating strategy is presented in
Figure S2). Control cell line (HEK293) shows no signal at all, whereas PAC-1 positive events
increase in WT integrin expressing cells from 5 % to 20 % upon Mn2+ treatment. The
constitutively active integrin expressing cells increase from 25 % to 70 % PAC-1 signal due to
incubation with Mn2+. Moreover, inactive integrin mutant cells show comparable PAC-1 binding
as for WT integrin. The presence of EDTA, which leads to removal of divalent cations, leads
to no PAC-1 binding to all four cell lines.
Figure 35: Integrin subunit detection in flow cytometry. A) Representative FACS dot plot. The indicated gate (black) was further used for analysis by creation of a histogram of the fluorescence intensity of anti-CD41 Alexa 488 (B-CD41+) and anti-CD61 Alexa 647 (C- CD61+) diluted 1:100 in PBS from HEK293 (blue), HEK293-αIIbb3 WT (cyan), HEK293-αIIbb3 inactive (green) and HEK293-αIIbb3 active (orange) cells. Statistical analysis was done with FlowJo software and is summarized in D. Results correspond to three independent measurements ± SEM.

78
Actin filaments are highly associated with the cytoplasmic tails of integrins and play a major
role upon integrin activation and platelet aggregation, consequently (Durrant et al. 2017;
Bearer et al. 2002). Therefore, confocal images of the actin filaments, and integrin were taken
and compared to cells treated with Mn2+. Figure 37 displays the cell lines HEK293, HEK293-
αIIbb3 WT treated with and without Mn2+, stained with phalloidin, to spot the actin filaments,
and the FITC labelled integrin β3-subunit antibody. All cells show a size between 10 and 25 nm
and cell nuclei stained with Hoechst 33242 (blue). Generally, actin filaments localize mostly at
the membrane of the cells but form also small accumulations inside the cells. Integrin
expressing cells (WT) display brighter actin filament signal at the edge of the cells but also at
the interface between two cells, compared to control HEK293 cells. Especially Mn2+ treatment
leads to small extensions of the membrane, called filopodia, in integrin expressing cells but
less pronounced in HEK293 control cells.
In active mutant expressing cells (Figure 38) additional large fibers within the cytoplasm are
visible. Inactive integrin expressing cells show phalloidin signal intensified at the edge of the
cells, especially at the contact interface between two cells.
Furthermore, Mn2+ treated cells show also augmented lamellipodia along the edge of the cells.
Additionally, all integrin expressing cells (with or without Mn2+ treatment) show anti-β3 antibody
signal, particularly intense at the membrane of the cell, which leads to a co-localization of both
phalloidin and integrin β3 signal in the merged picture indicated by a yellow color (Figure 38).
Staining of activated integrin with the conformation specific antibody PAC-1 (Figure 39 and
Figure 40) shows a significant signal exclusively in the active integrin mutant cell line treated
with Mn2+ (Figure 40), which is located at the cytoplasm next to the membrane of the cell and
appears as clustered dots. Additionally, the HEK293-αIIbβ3 active cell line shows filamentous
Figure 36: PAC-1 binding to cells expressing the β3-subunit variants. HEK293, HEK298 αIIbβ3 WT, HEK293 αIIbβ3 active and HEK293 αIIbβ3 inactive cells were incubated with anti-CD61 FITC antibody (1:100) and PAC-1 antibody conjugated with Alexa-647 (1:100) in PBS. Beforehand, cells were incubated 30 minutes with cell culture medium containing 1 mM Mn2+, 5 mM EDTA or buffer. Statistical analysis was carried out using Flow Jo software. Single FITC and Alexa-647 positive cells are displayed. Results correspond to three independent measurements ± SEM.

79
structures in the phalloidin staining ranging from the nucleus horizontally through the
membrane and are distributed in the whole cytoplasm.
Figure 37: Representative confocal images of integrin β3-subunit and cell cytoskeletal structure. HEK293 and HEK293 integrin WT expressing cells were treated with and without 1 mM Mn2+ for 30 min and stained with phalloidin 647 (1:10) as well as anti-integrin β3 FITC antibody (1:40). Nucleus was stained using Hoechst 33242 (1:1000). All fluorescence channels (nucleus-blue, actin filaments-red and β3-subunit- green), are overlaid for co-localization in a merge picture. Scale bar corresponds to 25 µm for all images.

80
Figure 38: Representative confocal images of integrin β3-subunit and cell cytoskeletal structure of mutants. HEK293 expressing active and inactive αIIbβ3 mutants were treated with and without 1 mM Mn2+ for 20 min and stained with phalloidin 647 (1:10) as well as anti-integrin β3 FITC antibody (1:40). Nucleus was stained using Hoechst 33242 (1:1000). All fluorescence channels (nucleus-blue, actin filaments-red and β3-green), are overlaid for co-localization in a merge picture. Scale bar corresponds to 25 µm for all images.
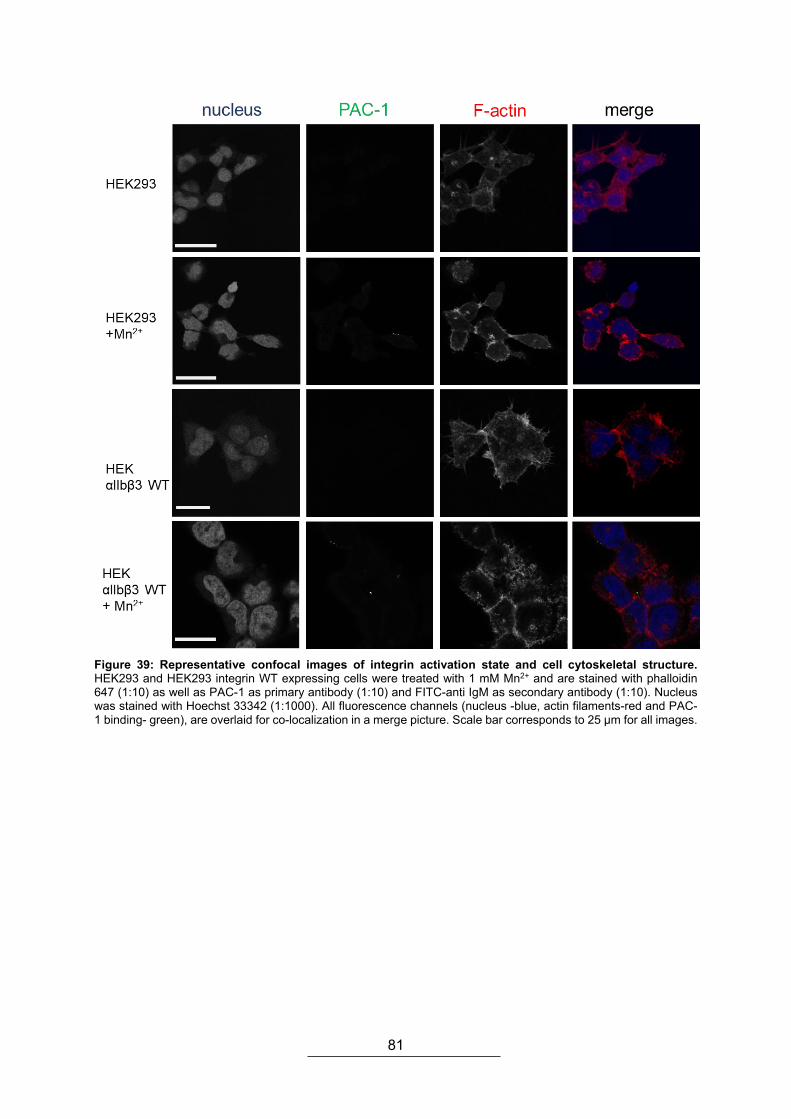
81
Figure 39: Representative confocal images of integrin activation state and cell cytoskeletal structure. HEK293 and HEK293 integrin WT expressing cells were treated with 1 mM Mn2+ and are stained with phalloidin 647 (1:10) as well as PAC-1 as primary antibody (1:10) and FITC-anti IgM as secondary antibody (1:10). Nucleus was stained with Hoechst 33342 (1:1000). All fluorescence channels (nucleus -blue, actin filaments-red and PAC-1 binding- green), are overlaid for co-localization in a merge picture. Scale bar corresponds to 25 µm for all images.

82
Figure 40: Representative confocal images of integrin activation state and cell cytoskeletal structure of mutants. HEK293 active and inactive integrin expressing mutant cells were treated with 1 mM Mn2+and are stained with phalloidin 647 (1:10) as well as PAC-1 as primary antibody (1:10) and FITC-anti IgM as secondary antibody (1:10). Nucleus was stained with Hoechst 33342 (1:1000). All fluorescence channels (nucleus-blue, actin filaments-red and PAC-1 binding- green), are overlaid for co-localization in a merge picture. Scale bar corresponds to 25 µm for all images.

83
4.2.3. Cell elasticity and platelet integrin activation Cell mechanical properties of the cell lines HEK293, HEK αIIbβ3 WT, HEK αIIbβ3 inactive and
HEK αIIbβ3 active in adherent and suspension state were measured using two methods: AFM
and RT-DC corresponding to adherent and suspended state, respectively. Young’s modulus
(YM) was calculated and the estimated marginal means and standard error of the means are
obtained from a linear mixed effect model in R (software R). The used model considers
clustering and distribution of datapoints and was therefore selected to display the results. First,
YM of all cell lines obtained from both methods were compared in Figure 41.
HEK293 cells show a mean YM of 212 Pa in AFM, but threefold higher values of 720 Pa in
RT-DC. Same significance is present in HEK αIIbβ3 WT cells where AFM measurements give
YM means at 107 Pa, whereas RT-DC studies show mean YM of 719 Pa. Although no
significant differences can be observed in RT-DC studies, integrin WT and active mutant
expressing cells are softer than control HEK293 and αIIbβ3 inactive cell lines in AFM
measurements. Cells expressing active mutant of integrin show YM of 725 Pa in RT-DC and
196 Pa in AFM, where this difference is also displayed in inactive mutant expressing cells but
with generally increased YM.
Since literature from the past decades and previous liposome studies described in Chapter
4.1.5 show the importance of divalent cations ions, especially Mn2+ ions, for the structure and
activation state of integrin αIIbβ3, the influence of integrin activation, induced by these ions,
on the cell elasticity was studied (Figure 42). Control cells in adherent state measured in AFM
show upon Mn2+ treatment softer cells changing mean YM from 212 Pa to under 120 Pa,
whereas Mn2+ treatment of integrin WT cells lead to increased mean YM ranging from 107 Pa
of untreated up to 160 for Mn2+- treated cells. The same trend is observable for the active
Figure 41: Cell elasticity in AFM versus RT-DC measurement. Marginal means of measured Young‘s Modulus of untreated HEK293, HEK αIIbβ3 WT, HEK αIIbβ3 active and inactive cells in RT-DC (black) and AFM (red). Statistical analysis was carried out from linear mixed models and error bars represents standard error of the mean.

84
mutant expressing cells with YM for untreated cells at 196 Pa and ion treated cells at 225 Pa
(Figure 42A). Inactive mutant represents the opposite trend, with decreasing YM caused by
Mn2+ incubation, with highest YM at 300 Pa to 290 Pa. Basically, integrin WT and active mutant
expressing cells give lower mean YM values compared to HEK293 control cells, while inactive
mutant shows highest YM.
By contrast, comparing adherent cells with the cells in suspension, the results demonstrate
another tendency regarding the elasticity (Figure 42B). Integrin-expressing cells show
significantly reduced mean YM after treatment with Mn2+ compared to the respective untreated
cells. The most significant effect is observed in integrin WT expressing cells with YM going
from 720 Pa to 680 Pa. EDTA treatment, which captures all divalent ions, leads to increased
YM in all four cell lines, especially in integrin expressing cells (WT and mutant), reaching values
up to 750 Pa. Additionally, except inactive mutant cells, all cells are basically softer than control
HEK293 cells. The results already indicate the importance of the adhesion state for different
integrin-conformation cell lines.
Figure 42: Cell elasticity upon different treatment in AFM and RT-DC. A) Mean Young‘s Modulus of HEK293 , HEK293 αIIbβ3 WT, HEK293 αIIbβ3 active and inactive cells treated with 1 mM Mn2+ measured in AFM and B) treated with 1 mM Mn2+ or 5 mM EDTA in RT-DC. Statistical analysis was carried out from linear mixed models and error bars represents standard error of the mean.

85
5. Discussion
5.1. Liposomes as biomimetic system In the first part of this thesis a membrane-like biomimetic system (liposomes) was applied to
study the platelet integrin αIIbβ3, excluding any additional manipulations caused by e.g.
platelet activators or other signaling proteins. Therefore, integrin alone was characterized prior
to reconstitution procedure. ELISA and reductive SDS-PAGE reveal that both subunits are
present in the protein stock. Utilized concentrations of the two antibodies to reach potential
saturation assume different affinities (Hulme and Trevethick 2010). Integrin shows a size of
15 nm in DLS, which is supported by AFM measurements of pure air dried integrin, showing a
size of approximately 22 nm, considering lateral AFM tip convolution artifacts and
consequently decreased lateral resolution because of the tip geometry (Canet-Ferrer et al.
2014). AFM images confirm the DLS results and literature values for the size of the integrin
(Bennett 2005). Moreover, protein stability was checked by DLS by heating the integrin,
resulting in aggregation and an increase in size, consequently. By application of a thermal
denaturation plugin assuming a two-state model (Niklasson et al. 2015), a melting temperature
of 50.5 °C was determined, which is slightly lower than already published for fragments of
integrin αIIbβ3 (Makogonenko et al. 1996) as well as Tm forecasted by prediction websites (Ku
et al. 2009).
To study the membrane protein integrin αIIbβ3 in a biomimetic and artificial physiological
environment in QCM-D, conditions for lipid bilayer formation were examined. Since
Frohnmayer et al. used egg PC and egg PG for αIIbβ3 reconstitution (Frohnmayer et al. 2015),
these lipids were initially chosen for QCM-D experiments and vesicle rupture was studied. High
amounts of PC lead to a typical bilayer formation with a temporary huge frequency and
dissipation change due to vesicle adsorption and water release during fusion, coming to a
baseline at -25 Hz and a dissipation between 0-1 x 10⁻⁶ (Richter et al. 2003; Richter et al.
2006). Interestingly, at higher amounts of PG, only vesicle layers are formed without any
rupture event. This could be due to the fact that the potential negative charge by the headgroup
of PG leads to small rejections between liposomes that cause a low coverage of the surface,
consequently. It is known, that a low coverage promotes vesicle layers, but no vesicle fusion
(Hardy et al. 2013). Additionally, the lack in formation of SLBs with PG was assigned to its
charged head groups, but also the molecular shape (Israelachvili et al. 1976; Lind et al. 2019),
considering that these lipids do not prefer the lamellar structure of a bilayer (Lee 2004).
By contrast, PC has a cylindrical shaped head group and will self-assemble into a lamellar
phase similar to biological membranes (Lee 2004; Dickey and Faller 2008). Though, the
existence of “non-bilayer” lipids, as PG, in membranes has been found to be required for
certain transmembrane proteins to maintain its functionality and conformational state (Lee

86
2004). Consequently, a higher egg PC:egg PG ratio was chosen for bilayer formation and
therefore used in the integrin reconstitution procedure.
Frohnmayer et al. (Frohnmayer et al. 2015) assumed integrin reconstitution within egg PC and
egg PG but without substantial evidence. In addition, the protocols carried out in this thesis
also demonstrated no integrin reconstitution with these lipids. Moreover, the studies of Erb and
Engel (Erb and Engel 2000) confirm no reconstitution success. Potentially, detergent and its
CMC (critical micellar concentration) as well as unsaturation of lipids play a role. Hence, the
protocol was changed to DMPG and DMPC, that show same results as egg PG and egg PC
in SLB formation behavior, but successful integrin reconstitution. The dissipation increased
upon higher amounts of DMPG, corresponding to a vesicle layer and no SLB (Richter et al.
2006), whereas higher DMPC levels led to SLB formation. Therefore, 20:1 DMPC:DMPG ratio
was selected for αIIbβ3 reconstitution and further experiments.
The successful reconstitution of αIIbβ3 into DMPG:DMPC liposomes was demonstrated by
DLS showing larger proteoliposomes compared to bare liposomes. Additionally, TEM images
confirm the association of the typical integrin structure, with a head domain and its two stalk
domains (Bennett 2005; Takagi et al. 2002), attached or inserted to the membrane of the
vesicles, which was also presented by the authors of the original reconstitution protocol (Erb
and Engel 2000). Both αIIb- and β3-subunits can be detected by flow cytometry via binding of
subunit specific antibodies, and SDS-PAGE showing the corresponding αIIbβ3 bands (Bennett
2005). In this thesis, it is expected, that potentially occurring oppositely orientated integrins
reconstituted into liposomes do not contribute to activation measurements and adhesion.
5.2. Integrin activation in liposomes For detection of activated integrin, several complementary methods were used. One of them
is the already described QCM-D technique, which enables the study of liposome rupture and
formation of supported lipid bilayers (Jing et al. 2014; Frohnmayer et al. 2015; Hardy et al.
2013; Lind and Cárdenas 2016). Frohnmayer et al. investigated the binding of αIIbβ3
proteoliposomes to extracellular matrix in QCM-D (Frohnmayer et al. 2015), but the system
shown in this thesis, and in the resultant publications (Janke et al. 2019; Martens et al. 2020)
has not been previously contemplated for the interaction measurements of SLBs containing
full-length αIIbβ3. Proteoliposome injection leads to a decrease in frequency (f), which is
comparable to the blank liposome measurement. However, a strong rise in dissipation (D)
upon injection can be observed indeed, but not as high as it would be expected without any
SLB formation (Richter et al. 2006). The different values of D compared to blank liposome
injection, can be explained by either the grand ectodomain of the 235 kDa αIIbβ3 (Adair and
Yeager 2002) or small amounts of proteoliposomes remaining on the saturated SLB covered
SiO2 substrate (Richter et al. 2003). Additionally, AFM results confirm the formation of a bilayer

87
with a height of ~4.3 nm (Goksu et al. 2009) in both liposome- and proteoliposome-treated
SiO2 surface emerging from QCM-D experiments. The integrin-containing bilayers shows
additional clusters with a height between 8 and 10 nm within the bilayer. Lateral resolution
implies clustering of integrins, but decreased lateral resolution due to tip geometry must be
considered. Moreover, contact mode imaging leads to remaining biomaterial at the cantilever
wherefore artifacts increase, displayed as small triangular structures.
QCM-D measurements, as well as flow cytometry and activation assay results show an
increased binding of the conformation-specific antibody PAC-1 upon treatment with Mn2+
compared to standard buffer conditions and after capture of divalent ions with EDTA. This
binding directs to the importance of divalent ions such as Ca2+ and especially Mn2+ for an
activation process of αIIbβ3, which was also subject in other studies over the past decades
(Zhang and Chen 2012; Frohnmayer et al. 2015; Ye et al. 2010; Litvinov et al. 2012). Prior
studies revealed eight divalent cation binding sites in the head domain auf αIIbβ3 (Zhang and
Chen 2012). In detail, the MIDAS, which is important for integrin ligand binding, is able to bind
Ca2+ and Mg2+, while other binding sites are only capable of binding Ca2+. These metal ions
initiate structural changes in the integrin head domain, resulting in a displacement of the α7-
helix (Figure 5B) by two helical turns upon integrin activation (Zhang and Chen 2012; Campbell
and Humphries 2011). It is controversially debated if a complete activation of αIIbβ3 is reached,
once Mn2+ compete with the divalent ions in the integrin head and increases the ligand affinity
(Kamata et al. 2005). The results of this thesis reveal PAC-1 binding and assume Mn2+-induced
activation of αIIbβ3. However, in the activation assay also control buffer shows increased
activation, which could be due to long incubation times with PAC-1 antibody or unspecific
binding to the microtiter plate.
CD spectroscopy measurements should clarify whether the opening of the head domain, due
to activation, correlates to changes in the protein secondary structure. Several studies
concentrate on specific domains of the integrin reaching from the I domain of leukocyte integrin
(Fairbanks et al. 1995), or head domain of α3β1 (Furrer et al. 2006) and the cytoplasmic as
well as transmembrane fragments of αIIbβ3 (Li et al. 2002). In this thesis, full-length integrin in
a lipid environment was considered. Moreover, the integrin motion upon activation was
predicted by crystal structures (Xiong et al. 2002) and MDS studies (Puklin-Faucher et al. 2006;
Gahmberg et al. 2009) but do not show major changes in integrin secondary structure upon
activation. Taken together with the CD results in this thesis, findings confirm the switchblade
model for integrin activation, as it was shown by several groups (Zhu et al. 2008; Takagi et al.
2002; Beglova et al. 2002; Bidone et al. 2017; Kulke and Langel 2020). Here, a drastic
rearrangement of the extracellular domain structure by a switchblade-like opening of the
interface between headpiece and stalk domain leads to the extension of the ligand binding
domain away from the plasma membrane. Dramatic changes in secondary structure do not

88
occur, which can be explained by presumable motion of basically disordered regions e.g. the
flexible knee region between the EGF- domains of the β-subunit (Zhu et al. 2008).
Nevertheless, due to solvent shifts resulting from hydrophobic lipid environment, differential
light scattering or absorption flattening effects (Miles and Wallace 2016; Ciancaglini et al.
2012), evaluation of CD results from liposomes/proteoliposomes is complicated. In addition,
lipid-to-protein ratio, which was in this thesis as about 1000:1, influences strongly the data
quality resulting in the exclusion of lower wavelengths in CD spectra data evaluation and
limited extend of data deconvolution (Ciancaglini et al. 2012).
MDS studies, implemented to confirm CD data, show minor changes in β-sheet content of the
knee region of both integrin subunits, which includes calf-1 and EGF2 domain, respectively.
Looking at the overall β-sheet probability, finally reduced force is needed for unfolding the
protein by e.g. Mn2+ treatment due to a decrease in the interaction between thigh and calf-1 as
well as EGF1 and EGF2 domains. These changes could be assigned from the MIDAS to the
rearrangement of the β-sheets in the β-propeller. However, exclusion of divalent cations in
MDS results in random changes of secondary structure in all integrin domains, whereas
experimental EDTA-induced removal of divalent ions leads to differing results. Experimentally,
might be that several ions are not reachable by EDTA and stay coordinated in the head domain
or even EDTA could impact the (proteo)liposomes due to destabilizing lipid effects
(Prachayasittikul et al. 2007). If assumed that only MIDAS, ADMIDAS and SyMDS ions,
located in the β-subunit, are extracted in MDS, changes in integrin secondary structure might
be insignificant such as in experimental data.
Summarized, the results reveal, minor secondary structural changes during Mn2+- induced
activation of αIIbβ3.
5.3. Influence of clinically relevant drugs on integrin activation
The introduced biophysical methods were applied to test clinically relevant drugs (quinine,
unfractionated heparin and fondaparinux) for their effect on αIIbβ3 activation. Especially
quinine and unfractionated heparin (UFH) are known to be involved in drug-induced
thrombocytopenia and interaction with αIIbβ3 (Visentin and Liu 2007). Although low
concentrations of quinine do not lead to changes in secondary structure in CD spectroscopy
experiments, quinine treatment induces PAC-1 binding indicating αIIbβ3 activation. The blood
plasma concentration of quinine in treated patients with uncomplicated falciparum malaria is
approximately 6 µg/mL and it was not achieved in the CD measurements in this thesis, due to
its chirality (Vieira et al. 2008). Nonetheless, potential structural changes upon integrin
activation could be the consequence of possible binding sites of quinine involved in the swing-
out movement by the β3 α7-helix interaction with the hybrid domain (Campbell and Humphries

89
2011). Two probable explanations can describe the interaction of quinine to αIIbβ3. On the one
hand, quinine binds to the αIIbβ3 head domain and leads to the extended state resulting in
PAC-1 binding, consequently. On the other hand, quinine facilitates the interaction between
PAC-1 IgM antibody and αIIbβ3 independently from the conformational state due to increased
affinity. The latter was presented recently for quinine dependent mouse antibodies (Bougie et
al. 2015; Bougie et al. 2006; Zhu et al. 2015), whereas option one suited to the displayed
results in this thesis showing the quinine-induced activation of αIIbβ3. This might provoke the
exposure of cryptic epitopes such as ligand-induced binding sites, leading to drug-induced
thrombocytopenia and high bleeding risk, consequently (Visentin and Liu 2007).
Interestingly, heparin (UFH) treatment of integrin initiates other changes in secondary structure
compared to Mn2+ treatment shown by oppositely influenced CD-spectra minimum, while both
lead to αIIbβ3 activation as shown in QCM-D and activation assays.Additionally, other studies
with integrins showing heparin binding to homologous regions to the β3-subunit in their head
domains, respectively (Vorup-Jensen et al. 2007; Ballut et al. 2013). Probably, activation is
stimulated by UFH and Mn2+ but initiated by different mechanisms. Hence, interaction of UFH
with the RGD binding site of αIIbβ3, which was shown already elsewhere (Sobel et al. 2001),
could cause the extension of the integrin and in PAC-1 binding, consequentially. On the
contrary, fondaparinux treatment reveals neither strong activation of αIIbβ3, nor changes in
secondary structure. Obviously, varying lengths of sulfated polysaccharide chains contacts
contrarily αIIbβ3, as it was shown also for other proteins e.g. platelet-factor 4 (PF4). In this
instance, heparin/PF4 complex-induced thrombocytopenia is accompanied by potential
platelet activation by αIIbβ3 (Gao et al. 2011; Kreimann et al. 2014).
To conclude, Mn2+, quinine and UFH treatment induce the action of αIIbβ3 and show only minor
changes in integrin secondary structure. The presentation of hidden regions in the integrin
head domain region upon extension of the extracellular parts, could lead to induction of
immune system response and immunogenicity in some patients (Bhoria et al. 2015; Visentin
and Liu 2007). The presented platelet membrane mimicking system enables the investigation
of potential binding of e.g. autoantibodies under almost infinitely possible conditions and may
become of increasing importance in clinical research.
5.4. Interaction of integrin αIIbβ3 with fibrinogen-nanoparticle bioconjugates
Apart from clinically relevant drugs, also nanoparticles are becoming more and more important
in research and diagnostics e.g. targeted drug delivery. Especially, superparamagnetic NPs
are frequently used because of their biocompatibility and stability, among others (Mahdavi et
al. 2013). Due to blood contact upon injection, a protein corona is formed by high abundant
proteins such as fibrinogen, and cell interactions of e.g. platelets with the formed bioconjugates

90
might also be induced. Therefore, fibrinogen corona formation was detected by increase in
size and a decreased zeta potential after protein corona formation.
Interestingly, PEGylated NPs show less fibrinogen corona formation in all used methods
compared to citrate- and dextran- coated bioconjugates. PEGylation of NPs is a strategy to
shield the NP surface from aggregation and protein adsorption as well as prolongation of blood
circulation time (Suk et al. 2016), thus explaining the slow protein adsorption and the absence
of corona formation (Martens et al. 2020). Once injection through the blood occurred, potential
binding to cell membranes and receptors could be induced, as it is already described
elsewhere (Fröhlich 2016). The previously described biophysical setup using QCM-D, can be
applied to study the interaction of differently coated NPs with the introduced artificial platelet-
like membrane system containing integrin αIIbβ3 receptor. After SLB formation with- and
without integrin, changes in frequency and dissipation are measured during NP injection. There
was only minor adsorption of bare NPs to blank lipid bilayer, whereas strong binding to integrin-
containing bilayer was detected for citrate- and dextran-coated NPs. This effect could be due
to the impact of various adhesion forces between blank NP surface and integrin inserted in the
bilayer, such as electrostatic, hydrophobic and van-der-Waals forces (Auría-Soro et al. 2019;
Zhao and Stenzel 2018).
However, PEGylated NPs without- or even with fibrinogen corona show comparable low
changes in mass adsorption. In accordance with the NPs characterization data, a potential
explanation is an interplay of the minor amount of protein corona formation and the properties
of PEG leading to steric hindrance for blood component binding, which results in acceptance
by the immune system and a high circulation time in the body (Suk et al. 2016). Fibrinogen
corona formation for dextran and citrate NPs lead to lower adsorption to integrin-containing
bilayer, which can be explained by the diminished surface energy and reduction of unspecific
binding, consequently (Di Silvio et al. 2017; Lesniak et al. 2012). It has to be mentioned that
the particle number differs between the different coating, thus effects on the binding behavior
to the membrane could not be excluded. Additionally, fibrinogen circulates in the human blood
at high concentrations (2-4.5 mg/mL) (Kattula et al. 2017), whereas in bioconjugate preparation
initially 1 mg/mL fibrinogen was applied and after magnetic separation concentration was even
lower. However, also pure fibrinogen shows only minor interaction with proteoliposome-derived
bilayer.
Stability, but also integrin dynamic and activation depends strongly on divalent cations, e.g.
Ca2+, Mg2+, Mn2+. Therefore, lipid bilayers were treated with these ions to activate the integrin
and to make ligand binding feasible. This biophysical setup mimics the stimulation of platelets
and its potential interaction with NPs in an artificial biomimetic system. Interestingly, even the
alternation from divalent ions-containing buffer to PBS without divalent cations lead to changes
in both bilayer and integrin-containing bilayer, which was not observed for blank SiO2 surface.

91
In conclusion, divalent cations lead to a significantly softer and thicker bilayer due to potential
hydration of the lipid headgroups and swelling of the interfacial water, consequently (Alsop et
al. 2016). However, it should be mentioned, that all NPs are suspended in PBS without any
divalent cations due to aggregation of NPs. The buffer mismatch during treatment of bilayer
and NPs injection results in hardly estimated shifts in frequency and dissipation, that need to
be evaluated carefully. Nonetheless, dextran and citrated NPs, as well as their bioconjugates,
result in a shift that exceeds the buffer mismatch for integrin-containing bilayer. Bioconjugates
show increased binding affinity for divalent cation-treated integrin bilayer compared to
untreated proteoliposome-derived bilayer. These findings confirm, the importance of divalent
cations for integrin stability and activation (Janke et al. 2019; Campbell and Humphries 2011).
The αIIbβ3 head domain opens up upon Mn2+ treatment and exposes the binding site for
fibrinogen through a RGD sequence in the fibrinogen Aα chain or by the KQAGDV motif located
in the γ chain (Hantgan et al. 2010). On the contrary, both PEG NPs and their fibrinogen-
conjugated modification show only minor changes in adsorption for both liposome- and
proteoliposome-derived bilayer, whereas viscoelasticity arises upon NP injection, which could
be explained by the hygroscopic effect of PEG (Baird et al. 2010).
In conclusion, fibrinogen bioconjugates of dextran and citrated NPs bind especially to Mn2+-
treated integrin-containing bilayer, while PEGylated maghemite NPs with and without
fibrinogen show only minor contact under both conditions. The shielding effect of PEG could
lead to a reduction of unspecific binding of blood components to the injected NPs and could
possibly protect from activation of immune cells and platelet aggregation, as it is known already
from other studies with various NPs (Suk et al. 2016; Guildford et al. 2009; Fröhlich 2016).
Upon platelet stimulation, where activated integrins are present, the results reveal NPs major
role in clot formation. Additionally, the biophysical setup could be applied in future experiments
predicting NP binding to biomimetic membranes and thus, importance for targeted drug
delivery and elimination of toxicity, consequently.
5.5. Influence of the lipidic system on integrin dynamics The perfect state for an artificial membrane mimicking system would be an environment closely
related to the physiological lipid bilayers that belted the different membrane proteins in cells.
Recreation of these complex environment is almost impossible, but a more appropriate lipid
membrane system was aimed during this thesis. DMPC and DMPG have saturated short fatty
acid chains and are mostly prominent in prokaryotic membranes (Cronan and Thomas 2009).
Integrin αIIbβ3 is unfailingly expressed in mammalian cells, specifically blood platelets and its
progenitors megakaryocytes, which leads to the development of a reconstitution protocol
containing components of such membranes, e.g. DOPC, SM and cholesterol (O'Donnell et al.
2014).

92
Firstly, DMPG and DMPC were replaced by the DOPC (unsaturated lipid), SM (saturated lipid)
and cholesterol, lipids that are especially in the external leaflet of the platelet membrane, but
protocol remains unchanged with hydrophobic adsorption (biobeads) of Triton X-100. Indeed,
much protein was detected after density gradient in a reductive SDS-PAGE, but a highly
heterogeneous mixture of huge liposomes was formed. Additionally, TEM images confirm
aggregation of both liposome and proteoliposome sample.
Upon synthesis of lipid embedded membrane proteins in liposomes, several detergents are
suitable for reconstitution of membrane proteins depending on several factors such as lipids,
proteins and lipid-to-protein ratios. One important aspect is the CMC that is defined as the
minimal concentration of detergent that is needed for formation of micelles of individual
detergent molecules (Rosen and Kunjappu 2012). This leads to a change in surface tension
and depends on factors such as pH, ionic strength, temperature, presence of protein and lipids.
Additionally, different detergents have different properties, that can be advantageous or
drawbacks for reconstitution protocols. For instance, Triton X-100, a nonionic detergent,
inhibits activity of reconstituted proton pump channel or changes the orientation of bacterial
transporter protein within the liposome membrane (Seddon et al. 2004). This detergent, with a
low CMC, is suitable for detergent removal by hydrophobic adsorption, e.g. with biobeads, as
it was done in the used protocol.
However, the zwitterionic detergent CHAPS can be easily removed by dialysis due to its high
CMC and the disintegration into micelles or into smaller monomers with a dilution below the
CMC (Seddon et al. 2004). Depending on the used membrane components, solubilization
behavior of detergents differ dramatically. Triton X-100 interaction with SM and cholesterol is
unfavorable and fully solubilization would need an intensively increased detergent
concentration, whereas CHAPS showed equally solubilized lipid micelles containing all applied
liposome components (Rodi et al. 2014). Changing the lipids from DMPG/DMPC to
DOPC/SM/cholesterol could potentially lead to incomplete solubilization by Triton X-100
resulting in reconstituted protein admittedly, but heterogeneous liposome generation.
Incomplete lipid solubilization and possible protein aggregation due to disordering detergent
can be additionally reported in this thesis.
Since a homogenous size distribution and functional protein were required for further analysis,
other more suitable detergent for integrin reconstitution was chosen. CHAPS has a steroid
type chemical structure and protein disaggregating properties. In addition, complete removal
is possible due to excessive dialysis, which was not the case for Triton X-100. Hence,
reconstitution procedure was changed towards an adapted protocol based on extrusion, to
form homogenous size distribution, and dialysis from Coskun et al. (Coskun et al. 2011).
Integrin was successfully reconstituted, confirmed by intense integrin bands in a reduced SDS-
PAGE after density gradient as well as protein structures in TEM images. Moreover, DLS data
93
shows smaller PDI compared to the preparation with Triton X-100. Different from data with
DMPG/DMPC lipids, proteoliposomes are smaller than bare liposomes, which could be due to
the fact of variable ionic gradients during dialysis or protein-induced stabilization of lipids. The
latter protects proteoliposomes even more from vesicle fusion compared to bare liposomes
(Miller and Dahl 1982; Crommelin et al. 1986).
Biological membranes generate highly dynamic structures that are sterol- and sphingolipid-
enriched ordered assemblies characterized by specific proteins, called lipid rafts. In the
nanoscale, raft assembly is created by tightly packing of cholesterol and saturated acyl chains
leading to a thickening and stiffening of the membrane segment. For artificial model
membranes these phases can be separated in i) liquid-ordered (Lo) phase, containing highly
dense saturated lipids and cholesterol, and ii) liquid-disordered (Ld) phase, comprising of
mainly unsaturated lipids in disordered state (Kaiser et al. 2009; Simons and Sampaio 2011).
Therefore, different ratios of DOPC, SM and cholesterol were utilized to mimic liquid-ordered
and liquid disordered phases and even raft domains of membranes.
High cholesterol content leads to less integrin reconstitution which could have two potential
reasons: firstly, integrin αIIbβ3 does not favor highly ordered phases, which was already
published in studies of blood platelets, showing indeed important role in αIIbβ3-dependent
upregulation of microdomains upon platelet stimulation but only minor detection of integrin
inside rafts of activated platelets (Bodin et al. 2005; Wonerow et al. 2002). Interestingly, other
integrins such as LFA-1 and α4β1 are mobilized upon activation to the lipid rafts (Leitinger and
Hogg 2002).
Secondly, high cholesterol content leads to a shift in CMC for liposomes solubilization (Rodi et
al. 2014; Schürholz 1996), resulting in less solubilized membrane and less reconstituted
integrin, consequently. Hence, high cholesterol content of liposomes impedes the successful
reconstitution of αIIbβ3, without potential increase of detergent concentration. Generally,
making a protein “raftophilic” is a topic that is still unclear, although studies indicate the
important role of palmytoilation as well as properties of the proteins, e.g. glycosyl phosphatidyl
inositol- anchors (Simons and Sampaio 2011).
Nonetheless, DLS data of the liposomes consisting different ratios of DOPC, SM and
cholesterol reveal decreasing size with increasing amounts of DOPC content, whereas PDI
values increase dramatically. For highly cholesterol packed liposomes the opposite trend is
apparent, which is summarized in Figure 43.

94
Interestingly, DOPC is set as an inverted cone shaped lipid (Simons and Sampaio 2011),
prominently forming lamellar structures (Nagle and Tristram-Nagle 2000), that are not as
dense as bilayers consisting of unsaturated PC lipids (Costigan et al. 2000), but shows
tendency to form smaller liposomes compared to liposomes consisting of saturated lipids in
this thesis. Possible explanations could be i) the presence of cholesterol, that destabilizes at
specific concentrations, the DOPC bilayer by reductions of the packing stress, ii) due to the
fact that DOPC is able to form hexagonal phases of large dimensions (Chen and Rand 1997),
and/or iii) pressure induced by the various shapes of protein transmembrane domains (Koller
and Lohner 2014), leading to higher curvature, heterogeneous size distribution and smaller
liposomes, consequently. Additionally, high SM and cholesterol content causes highly packed
lipid phases that stabilize lamellar bilayer structures (Shipley et al. 1974), which could explain
the high size of SM- and cholesterol-enriched liposomes.
Taking into account also the potential of activating the integrin αIIbβ3 receptor in a lipid bilayer
comprising varying ratios ranging from liquid-ordered (DOPC:SM:cholesterol 25:35:40) to
disordered phases (70:25:5), it appears that highly disordered phases (70:25:5 and 60:28:12)
already lead to partial activation of αIIbβ3. This activation level could not be increased by Mn2+
treatment, whereas high amount of cholesterol, thus ordered phases, lead to even vanishingly
low activation. The latter could be also explainable by the fact of only minor integrin
reconstitution success indicated by the SDS-PAGE. Interestingly, a mixture of both phases
(45:30:25) showed less auto-activated integrin under physiological conditions but high
activation after Mn2+ incubation, which confirms previous studies (Campbell and Humphries
Figure 43: Schematic summary of the effect of various lipidic systems on αIIbβ3 activation. Lipid systems varying in liquid-ordered (Lo) and liquid-disordered (Ld) phases.

95
2011; Zhang and Chen 2012). Even small rise of the saturation of the hydrocarbon chains by
increasing amounts of SM (37.5:37.5:25) or usage of originally appointed DMPG:DMPC
liposomes, lead to partial integrin extension without additional induction of activation by
divalent cations. In contrast to samples with highly ordered phases, these lipid ratios could be
still shifted towards activated integrin upon Mn2+ injection (Figure 43).
Summarized, high content of cholesterol potentially diminishes integrin reconstitution and does
not favor integrin activation. Nonetheless, high content of liquid-disordered phases, formed by
DOPC, facilitates high unspecific integrin activation. Even small increasements of saturated
lipids, related to liquid-ordered phase, show also unspecific integrin activation. However,
integrin ectodomain extension upon Mn2+ treatment is still feasible. Lowest unspecific
activation but specific activated integrin by divalent cations represents the “balanced course”
DOPC:SM:cholesterol ratio 45:30:25. Given these findings, the lipid environment and its
flexibility versus rigidity likely play an essential role in receptor regulation and downstream
signaling upon platelet aggregation.
5.6. Impact of integrin on cell elasticity and cytoskeleton Platelet activation and aggregation includes, beyond the influence of lipids and ligands,
structural changes and rearrangements of the actin cytoskeleton, which is mediated mainly by
the mechanical sensors, namely integrins. Thus, understanding the mechanisms behind
integrin activation, the cytoskeleton needs to be considered. Biomimetic minimal systems,
such as liposomes, are not efficiently mimicking the highly complex actin machinery behind
the integrin dynamics. Therefore, an expression platform was created using HEK293 cells,
which are widely used as stable human derived cells for transfection (Graham et al. 1977).
Integrin wildtype (WT) was expressed and additionally mutated protein expressing cells were
synthesized, that contain mutations to either keep the integrin constantly active or constantly
inactive. The inactivated mutant, causing a Glanzmann thrombasthenia-like phenotype, results
from a disulfide-bridge linking the integrin head to the leg domains, which should lock the
protein in the bent conformation (Takagi et al. 2002). While, point mutation of cysteine to
arginine in the β3-head keeps the integrin in an extended conformation, by disruption of a
disulfide bridge (Ruiz et al. 2001). Co-localization in all four cell lines was confirmed
successfully by flow cytometry measurements and confocal microscopy images.
The cytoskeletal network is closely related to the membrane via its interaction with integrins
(Durrant et al. 2017). Upon activation of integrins, actin arrangements change, which is
basically the initiator for shape change and adhesion of cells to a substrate or other cells
(Bearer et al. 2002). The cell elasticity is mainly dependent on the cytoskeleton; therefore, it
serves as an indicator for the processes within the cytoskeletal machinery by certain triggers
(Gavara and Chadwick 2016). Expression alone or even external induction of integrin αIIbβ3

96
activation potentially leads to changes in cell mechanics indicating variations in actin
filamentous distribution.
First, integrin extension caused by Mn2+ was studied in flow cytometer measurements by
binding of the active conformation-specific antibody PAC-1. Mn2+ shifts the equilibrium towards
the active conformation, which is observable in all integrin-expressing cells, especially in the
active mutant-expressing cells. Although constant active conformation was expected for the
active mutant under both untreated and Mn2+-treated conditions, Mn2+ increases the activation
dramatically. Probably, mutations induce integrin extension but the head domain is not entirely
directed towards the extracellular space, making the PAC-1 binding site at the interface of both
subunits in the head domain not accessible for huge proteins as IgM antibodies. Mn2+ binds
the cation binding sites (e.g. MIDAS) and directs the αIIbβ3 head even more upright (Tiwari et
al. 2011; Zhang and Chen 2012), which could clarify the increased activation signal in the flow
cytometer.
Surprisingly, also inactive mutant-expressing cells show activation levels similar to the WT
integrin, although completely loss of PAC-1 binding would be expected. Disulfide linkers
between head and leg domains of the αIIbβ3, that should keep the integrin in the bent
conformation, might be not formed for every protein, leading to partial expression of flexible
integrin that is able to extend. However, active mutant cells express high amounts of extended
integrin, whereas WT shows less and inactive integrin expressing cells even lower Mn2+-
induced activation, basically. The chelator EDTA, which captures divalent cations (Oviedo and
Rodríguez 2003), leads in turn to no activation detection at all cell lines indicating again the
importance of divalent ions for protein stability and activation, even for constitutively active
integrin (Zhang and Chen 2012).
Integrins build a bridge between adhesion sites and the actin filaments, which raises the
question whether actin rearrangements due to integrin activation result in cell elasticity
differences. Initially, actin filaments, as well as the β3-subunit, were imaged in confocal
microscopy and additionally treated with Mn2+ to induce activation. Interestingly, already
integrin expression alone, leads to F-actin recruitment to the membrane, specifically to the
interfaces of two cells, leading to a co-localization of integrin and actin filaments. Especially at
the cell periphery, the actin network forms lamellipodia-like structures, which favors adhesion
contacts and serves as mechano-sensor (Oakes et al. 2018). Accordingly, integrin expression
results in actin recruitment and augmented development of lamellipodia, which was also
observed for other integrins (Guillou et al. 2008; Pinco et al. 2002).
Upon manganese treatment, all cells intensify lamellipodia characteristics and induce
additional filopodia extensions indicating increased actin polymerization and induction of
migration and development of cell-cell interactions. Albeit, integrin expressing cells show even
higher accumulations of lamellipodia and filopodia compared to control. Additionally, small dot-

97
shaped F-actin structures accumulate inside the cells indicating rearrangement of F-actin
(Haghparast et al. 2015). PAC-1 antibody is most of all constructed and advertised for flow
cytometry measurements, anyhow, signal was detected as clustered dots at the periphery and
edge of Mn2+-treated active integrin mutant expressing cells in confocal microscopy images.
Confirming the results of the flow cytometry activation, Mn2+ treatment supported active integrin
conformation. Moreover, the integrin conformation alone seems to play only a minor role, while
presence of integrin affects indeed cytoskeletal rearrangements (Pinco et al. 2002). Treatment
with Mn2+ intensifies the described effect compared to control cells, but could have already
minor side effects independently from the integrin expression, such as oxidative stress
introduction in mitochondria (Smith et al. 2017) and interaction with cation binding sites at the
filaments to drive actin polymerization (Kang et al. 2012).
The actin rearrangements observed in confocal microscopy are potentially associated with
differences in cell elasticity, which was studied for adherent cells in AFM and suspended cell
in RT-DC.
Generally, cells in suspension are characterized by an isotropic actin cytoskeleton and an actin
cortex, which is a network underlying the membrane provoking cortical stiffness (Schwarz and
Safran 2013). In contrast, adherent cells comprising of an anisotropic actin distribution
consisting of additional subsystems, namely lamellipodia, that pushes outwards against the
membrane and contractile actin filaments forming stress fibers. These areas are sides of
adhesion, which are anchored to the receptor connecting them to the ECM, which is displayed
also in presented confocal images. The ventral and dorsal stress fibers are flexible, whereas
upon adhesion tension is developed leading to force sensing and spreading, consequently
(Schwarz and Safran 2013).
Difference between suspension and adherent cells mirrors in dramatically differences in cell
stiffness, which is displayed in the presented results by high YM in the suspension, but lower
YM in adherent cells. This was already observed for HEK293 cells in other studies (Haghparast
et al. 2015; Haghparast et al. 2013). While integrin expression has no significant effect on
elasticity for cells in suspension (RT-DC), adherent integrin expressing cells in AFM show
significantly softer cells. The difference is not surprising, due to integrins main function as
adhesion receptor connecting ECM and cytoskeleton (Schwarz and Safran 2013; Campbell
and Humphries 2011).
In adherent cells, ventral stress fibers as well as lamellipodia in the cell periphery promote
adhesion contacts to the substrate at the adhesion sites. Actin reorganization concentrate on
the ventral site, whereas AFM measurements are taken from the dorsal site of the cells.
Therefore, AFM results have to be interpreted carefully, since elasticity changes across the
cell. Potential recruitment of actin to the adhesion sites, especially in integrin WT and active
mutant expressing cells (Oakes et al. 2018; Schwarz and Safran 2013), could lead to softer

98
cell surface in AFM compared to control cells as well as inactive mutant expressing cells.
Furthermore, the adhesion area is highly active and actin polymerization forces modulate the
integrin-ECM connection leading to increased integrin density and initiation of integrin
clustering. Consequently, adhesions sites and cell spreading are stabilized, whose elastic
characteristics depend strongly on the type of integrin (Pinco et al. 2002; Lange et al. 2016;
Lacaria et al. 2020).
This process can be forced in especially WT integrin expressing cells by induction of integrin
active state by Mn2+ ions (Zhang and Chen 2012). Interestingly, WT- and active mutant
expressing cells become stiffer in AFM upon incubation with Mn2+, which could be explained
by stronger attachment and spreading mediated by increased integrin clustering among the
whole cell (Zhang and Chen 2012; Gingras et al. 2013; Oakes et al. 2018). This effect is not
present in suspended cells in RT-DC, confirming the fact of the high importance of adhesion
interfaces in cell mechanical behavior. The cells expressing inactive integrin, and the control
cells without any integrin, show comparable effects in both complemental methods.
However, Mn2+ treatment leads to higher elasticity for i) all cell lines in RT-DC and ii) for control
and inactive mutant expressing cells in AFM, although studies of Lange et al. (Lange et al.
2016) show stiffer cells upon Mn2+ treatment. Other factors could affect the cell mechanics
upon ion incubation, such as divalent ion interaction with the lipid bilayers by different binding
behavior to lipid headgroups (Binder and Zschörnig 2002) or induction of cellular processes
e.g. apoptosis through caspase activation and ER stress within the cell (Smith et al. 2017).
Contrary results indicating already the highly complex network and interplay of different factors
ranging from cell type, membrane composition, adhesion sites, actin polymerization (Scipion
et al. 2018), integrin expression and its activation state (Lickert et al. 2018). Finally, divalent
ions play a major role in integrin stability and activation as well as plenty cellular processes,
which emerges in samples treated with EDTA (Tiwari et al. 2011; Chaigne-Delalande and
Lenardo 2014; Bashford et al. 1988; Gingell et al. 1970), that captures all divalent ions: cortical
stiffness increases significantly in all cell lines in RT-DC.
Apparently, mutations influencing the activation state of αIIbβ3 (as in Glanzmann
thrombasthenia), have a drastic effect on cell mechanics and actin reorganization which in
turn, controls the platelet performance upon clot formation in hemostasis. The discussed
results reveal the radical differences whether cells are in suspension thus, circulating in the
blood, or adhere to substrates such as sites of injury and exposed ECM.

99
5.7. Summary and perspectives The integrin αIIbβ3 fulfill plenty of functions and is major part in several cell processes. Ranging
from adhesion to activation of various signaling pathways, αIIbβ3 affects cellular shape up to
platelet survival and platelet death. Disease mediated by the receptor αIIbβ3 are based on
incorrect αIIbβ3 expression, structural and functional abnormalities and dysregulated immune
response, among others. Many external factors can influence the transmembrane protein
stability and its conformation. Moreover, highly reactive platelets can be triggered already by
small stimuli, which makes studies on αIIbβ3 extremely delicate.
Therefore, the development of biomimetic systems advanced upon the last decades, which
enables to focus on simplified networks for understanding of transmembrane protein function
(e.g. liposomes, nanodiscs and lipid bilayers). Results in this study reveal the importance of
divalent ions, especially Mn2+ and Ca2+, for integrin activation with receptor reconstituted into
liposomes. However, also the clinically relevant drugs heparin and quinine are found to interact
with αIIbβ3 and affect its conformation. Furthermore, biomedical applications, such as
maghemite NPs, can be tested for interaction with artificial platelet membranes. Since not only
ligands and interaction partners are capable for integrin alterations, also lipidic environment
can be controlled in the introduced membrane systems. Hence, integrins associate with
several other important molecules that play a crucial role in surveillance of integrins but also
essential downstream events.
To mimic the highly complex system in vivo, a HEK293 cell based-expression platform was
generated, which enables the genetic modification of the integrin as well as the consideration
of the influence of cellular proteins, such as actin. The analyses of mutated integrins, exhibit
the consequential role of actin rearrangements due to αIIbβ3 activation. For this reason, also
the mechanical properties of cells change, albeit the cell status, whether its adherent or in
suspension, has a significant collateral impact on the cell elasticity.
The biophysical tools combined with the established biomimetic systems in this thesis, enable
the analysis of receptors, such as αIIbβ3, to elucidate associated disease mechanisms, study
induction of immunogenicity, reveal the importance of varying lipidic environment and the
connection between adhesions sites and cellular actin network. The findings contribute to the
development of diagnostic tools and treatment strategies against certain diseases, e.g.
autoantibody induction by integrin neoepitopes in ITP or targeted drug delivery systems.

100
6. List of figures
Figure 1: Schematic illustration of clot formation. ..................................................................... 2
Figure 2: Actin structures in activated cells/platelets. ............................................................... 4
Figure 3: Schematic representation of lipid membrane and chemical structures of lipids. ....... 5
Figure 4:Lipid distribution in the platelet membrane.. ............................................................... 6
Figure 5: Integrin αIIbβ3 structure. ........................................................................................... 9
Figure 6: Inside-out activation of integrin αIIbβ3. ................................................................... 11
Figure 7: Liposomes and their modifications. ......................................................................... 15
Figure 8: Far UV CD spectra associated with various types of secondary structure.............. 38
Figure 9: FACS setup. ............................................................................................................ 44
Figure 10: Schematic of the cantilever deflection.. ................................................................. 46
Figure 11: Ideal force-distance curve.. ................................................................................... 47
Figure 12: AFM cantilever with attached silica bead.. ............................................................ 48
Figure 13: RT-DC setup. ........................................................................................................ 50
Figure 14: Schematic illustration of the proteoliposomes and structure of integrin αIIbβ3. .... 52
Figure 15: Pure integrin αIIbβ3 characterization.. .................................................................. 53
Figure 16: Representative QCM-D data showing the changes in frequency f (blue) and dissipation D (red) of the seventh overtone after injection of egg PC/egg PG liposomes with various lipid ratios at 37°C on a SiO2 sensor. ........................................................................ 54
Figure 17: Representative QCM-D data showing the changes in frequency f (blue) and dissipation D (red) of the seventh overtone after injection of DMPC:DMPG liposomes with various lipid ratios at 37°C on a SiO2 sensor. ......................................................................... 55
Figure 18: Validation of αIIbβ3 reconstitution into liposomes. ................................................ 56
Figure 19: Representative QCM-D experimental profile of changes in dissipation (D-red) and frequency f (blue) of the seventh overtone at 37 °C. .............................................................. 57
Figure 20: Tapping mode AFM image of DMPG:DMPC bilayers with and without integrin αIIbβ3. .................................................................................................................................... 58
Figure 21: Tapping mode AFM image of a DMPG-DMPC liposome containing αIIbβ. .......... 59
Figure 22: Integrin activation detection setup. ........................................................................ 60
Figure 23: Activation of integrin αIIbβ3. .................................................................................. 61
Figure 24: CD spectra and MDS of αIIbβ3 ............................................................................. 62
Figure 25: Integrin αIIbβ3 secondary structure after treatment with drugs. ............................ 64
Figure 26: Integrin αIIbβ3 activation by drug treatment.. ........................................................ 65
Figure 27: Fibrinogen-coated nanoparticle binding to artificial platelet membrane. ............... 67
Figure 28: Purification of Integrin αIIbβ3. ............................................................................... 69
Figure 29: Characterization of integrin reconstitution into different lipid systems. ................. 70

101
Figure 30: Reductive SDS PAGE of liposomes and proteoliposomes prepared with different lipids and lipid ratios.. ............................................................................................................. 71
Figure 31: TEM image of (proteo)liposomes with different preparation methods ................... 73
Figure 32: Activation of Integrin αIIbβ3 reconstituted within different lipid ratios .................... 74
Figure 33: Schematic illustration of integrin effect analysis on cell mechanical properties.. .. 75
Figure 34: Representative confocal images of co-localized Integrin subunits. ....................... 76
Figure 35: Integrin subunit detection in flow cytometry. ......................................................... 77
Figure 36: PAC-1 binding to cells expressing the β3-subunit variants. .................................. 78
Figure 37: Representative confocal images of integrin β3-subunit and cell cytoskeletal structure. ................................................................................................................................ 79
Figure 38: Representative confocal images of integrin β3-subunit and cell cytoskeletal structure of mutants. ............................................................................................................... 80
Figure 39: Representative confocal images of integrin activation state and cell cytoskeletal structure. ................................................................................................................................ 81
Figure 40: Representative confocal images of integrin activation state and cell cytoskeletal structure of mutants. ............................................................................................................... 82
Figure 41: Cell elasticity in AFM versus RT-DC measurement. ............................................. 83
Figure 42: Cell elasticity upon different treatment in AFM and RT-DC. ................................. 84
Figure 43: Summary of the effect of various lipidic systems on αIIbβ3 activation.. ................ 94
Figure S1: Representative FACS plots for Integrin detection and activation measurements with liposomes ............................................................................................................................. 117
Figure S2: Representative FACS plots for integrin activation with HEK293 cells . .............. 118
Figure S3: Representative QCM-D experimental profile for the buffer changes. ................. 118
Figure S4: Thin-layer chromatography of lipids extracted from liposome samples .............. 119
Figure S5: Representative QCM-D experimental profile of DOPC:SM:cholesterol liposomes/proteoliposomes. ................................................................................................. 119
7. List of tables
Table 1: Buffer compositions for integrin purification. ............................................................ 29
Table 2: Composition of loading dye for SDS-PAGE. ............................................................ 32
Table 3: Mutagenesis and Sequencing Primer Sequences. .................................................. 40
Table 4: PCR reaction mixture. .............................................................................................. 41
Table 5: PCR conditions ......................................................................................................... 41
Table 6: Hydrodynamic diameters of different DOPC:SM:cholesterol ratios after integrin reconstitution or blank liposomes. .......................................................................................... 72
Table S1: Changes in frequency upon PAC-1 binding to liposome- or proteoliposome-derived bilayer with different lipid ratios in QCM-D measurements. ................................................ 121
Table S2: Contrast of two cell lines and their respective p-values from RT-DC measurement……………………………………………………………………………………….123

102
Table S3: Contrast of two cell lines and their respective p-values from AFM measurement……………………………………………………………………………………….125
8. References
Adair, B. D., Xiong, J.-P., Maddock, C., Goodman, S. L., Arnaout, M. A. and Yeager, M. (2005). Three-dimensional EM structure of the ectodomain of integrin alphaVbeta3 in a
complex with fibronectin. The Journal of cell biology 168, 1109–1118.
Adair, B. D. and Yeager, M. (2002). Three-dimensional model of the human platelet integrin
alpha IIbbeta 3 based on electron cryomicroscopy and x-ray crystallography. Proceedings
of the National Academy of Sciences of the United States of America 99, 14059–14064.
Alsop, R. J., Maria Schober, R. and Rheinstädter, M. C. (2016). Swelling of phospholipid
membranes by divalent metal ions depends on the location of the ions in the bilayers. Soft
matter 12, 6737–6748.
Audia, S., Mahévas, M., Samson, M., Godeau, B. and Bonnotte, B. (2017). Pathogenesis
of immune thrombocytopenia. Autoimmunity reviews 16, 620–632.
Auría-Soro, C., Nesma, T., Juanes-Velasco, P., Landeira-Viñuela, A., Fidalgo-Gomez, H., Acebes-Fernandez, V., Gongora, R., Almendral Parra, M. J., Manzano-Roman, R. and Fuentes, M. (2019). Interactions of Nanoparticles and Biosystems: Microenvironment of
Nanoparticles and Biomolecules in Nanomedicine. Nanomaterials (Basel, Switzerland) 9.
Baird, J. A., Olayo-Valles, R., Rinaldi, C. and Taylor, L. S. (2010). Effect of molecular weight,
temperature, and additives on the moisture sorption properties of polyethylene glycol.
Journal of pharmaceutical sciences 99, 154–168.
Ballut, L., Sapay, N., Chautard, E., Imberty, A. and Ricard-Blum, S. (2013). Mapping of
heparin/heparan sulfate binding sites on αvβ3 integrin by molecular docking. Journal of
molecular recognition: JMR 26, 76–85.
Bashford, C. L., Alder, G. M., Graham, J. M., Menestrina, G. and Pasternak, C. A. (1988).
Ion modulation of membrane permeability: effect of cations on intact cells and on cells and
phospholipid bilayers treated with pore-forming agents. The Journal of membrane biology
103, 79–94.
Bearer, E. L., Prakash, J. M. and Li, Z. (2002). Actin dynamics in platelets. International
review of cytology 217, 137–182.
Beglova, N., Blacklow, S. C., Takagi, J. and Springer, T. A. (2002). Cysteine-rich module
structure reveals a fulcrum for integrin rearrangement upon activation. Nature structural
biology 9, 282–287.
Beltrán-Gracia, E., López-Camacho, A., Higuera-Ciapara, I., Velázquez-Fernández, J. B. and Vallejo-Cardona, A. A. (2019). Nanomedicine review: clinical developments in
liposomal applications. Cancer Nano 10, 1175.

103
Bennett, J. S. (2005). Structure and function of the platelet integrin alphaIIbbeta3. The Journal
of clinical investigation 115, 3363–3369.
Berg, J. M., Tymoczko, J. L. and Stryer, L. (2002). Biochemistry. New York, [Bethesda, MD]:
W.H. Freeman; NCBI.
Bhattacharjee, S. (2016). DLS and zeta potential - What they are and what they are not?
Journal of controlled release: official journal of the Controlled Release Society 235, 337–
351.
Bhoria, P., Sharma, S., Varma, N., Malhotra, P., Varma, S. and Luthra-Guptasarma, M. (2015). Effect of steroids on the activation status of platelets in patients with Immune
thrombocytopenia (ITP). Platelets 26, 119–126.
Bidone, T. C., Polley, A., Durumeric, A., Driscoll, T., Iwamoto, D., Calderwood, D., Schwartz, M. A. and Voth, G. A. (2017). New Insights into the Conformational Activation
of Full-Length Integrin.
Binder, H. and Zschörnig, O. (2002). The effect of metal cations on the phase behavior and
hydration characteristics of phospholipid membranes. Chemistry and Physics of Lipids 115,
39–61.
Bligh, E. G. and Dyer, W. J. (1959). A rapid method of total lipid extraction and purification.
Can. J. Biochem. Physiol. 37, 911–917.
Bodin, S., Soulet, C., Tronchère, H., Sié, P., Gachet, C., Plantavid, M. and Payrastre, B. (2005). Integrin-dependent interaction of lipid rafts with the actin cytoskeleton in activated
human platelets. Journal of cell science 118, 759–769.
Bougie, D. W., Peterson, J., Rasmussen, M. and Aster, R. H. (2015). Mechanism of quinine-
dependent monoclonal antibody binding to platelet glycoprotein IIb/IIIa. Blood 126, 2146–
2152.
Bougie, D. W., Wilker, P. R. and Aster, R. H. (2006). Patients with quinine-induced immune
thrombocytopenia have both “drug-dependent” and “drug-specific” antibodies. Blood 108,
922–927.
Bozzuto, G. and Molinari, A. (2015). Liposomes as nanomedical devices. International
journal of nanomedicine 10, 975–999.
Brügger, B. (2014). Lipidomics: analysis of the lipid composition of cells and subcellular
organelles by electrospray ionization mass spectrometry. Annual review of biochemistry
83, 79–98.
Burridge, K. and Wittchen, E. S. (2013). The tension mounts: stress fibers as force-
generating mechanotransducers. The Journal of cell biology 200, 9–19.
Butt, H.-J., Cappella, B. and Kappl, M. (2005). Force measurements with the atomic force
microscope: Technique, interpretation and applications. Surface Science Reports 59, 1–
152.

104
Campbell, I. D. and Humphries, M. J. (2011). Integrin structure, activation, and interactions.
Cold Spring Harbor perspectives in biology 3.
Canet-Ferrer, J., Coronado, E., Forment-Aliaga, A. and Pinilla-Cienfuegos, E. (2014).
Correction of the tip convolution effects in the imaging of nanostructures studied through
scanning force microscopy. Nanotechnology 25, 395703.
Chaigne-Delalande, B. and Lenardo, M. J. (2014). Divalent cation signaling in immune cells.
Trends in immunology 35, 332–344.
Chen, Z. and Rand, R. P. (1997). The influence of cholesterol on phospholipid membrane
curvature and bending elasticity. Biophysical Journal 73, 267–276.
Cho, N.-J., Cheong, K. H., Lee, C., Frank, C. W. and Glenn, J. S. (2007a). Binding dynamics
of hepatitis C virus’ NS5A amphipathic peptide to cell and model membranes. Journal of
virology 81, 6682–6689.
Cho, N.-J., Cho, S.-J., Cheong, K. H., Glenn, J. S. and Frank, C. W. (2007b). Employing an
amphipathic viral peptide to create a lipid bilayer on Au and TiO2. Journal of the American
Chemical Society 129, 10050–10051.
Choi, W.-S., Rice, W. J., Stokes, D. L. and Coller, B. S. (2013). Three-dimensional
reconstruction of intact human integrin αIIbβ3: new implications for activation-dependent
ligand binding. Blood 122, 4165–4171.
Ciancaglini, P., Simão, A. M. S., Bolean, M., Millán, J. L., Rigos, C. F., Yoneda, J. S., Colhone, M. C. and Stabeli, R. G. (2012). Proteoliposomes in nanobiotechnology.
Biophysical reviews 4, 67–81.
Cines, D. B., Liebman, H. and Stasi, R. (2009). Pathobiology of secondary immune
thrombocytopenia. Seminars in hematology 46, S2-14.
Coskun, Ü., Grzybek, M., Drechsel, D. and Simons, K. (2011). Regulation of human EGF
receptor by lipids. Proceedings of the National Academy of Sciences of the United States
of America 108, 9044–9048.
Costigan, S.C., Booth, P.J. and Templer, R.H. (2000). Estimations of lipid bilayer geometry
in fluid lamellar phases. Biochimica et Biophysica Acta (BBA) - Biomembranes 1468, 41–
54.
Crommelin, D. J. A., Fransen, G. J. and Salemink, P. J. M. (1986). Stability of Liposomes
on Storage. In Targeting of Drugs With Synthetic Systems (ed. G. Gregoriadis, J. Senior
and G. Poste), pp. 277–287. Boston, MA: Springer US.
Cronan, J. E. and Thomas, J. (2009). Chapter 17 Bacterial Fatty Acid Synthesis and its
Relationships with Polyketide Synthetic Pathways. In Complex Enzymes in Microbial
Natural Product Biosynthesis, Part B: Polyketides, Aminocoumarins and Carbohydrates,
pp. 395–433: Elsevier.

105
Dai, A., Ye, F., Taylor, D. W., Hu, G., Ginsberg, M. H. and Taylor, K. A. (2015). The Structure
of a Full-length Membrane-embedded Integrin Bound to a Physiological Ligand. The
Journal of biological chemistry 290, 27168–27175.
Davydov, D. R., Fernando, H., Baas, B. J., Sligar, S. G. and Halpert, J. R. (2005). Kinetics
of dithionite-dependent reduction of cytochrome P450 3A4: heterogeneity of the enzyme
caused by its oligomerization. Biochemistry 44, 13902–13913.
Di Silvio, D., Maccarini, M., Parker, R., Mackie, A., Fragneto, G. and Baldelli Bombelli, F. (2017). The effect of the protein corona on the interaction between nanoparticles and lipid
bilayers. Journal of colloid and interface science 504, 741–750.
Diaspro, A., ed. (2002). Confocal and two-photon microscopy: foundations, applications, and
advances: Wiley-Liss. New York.
Dickey, A. and Faller, R. (2008). Examining the contributions of lipid shape and headgroup
charge on bilayer behavior. Biophysical Journal 95, 2636–2646.
Dimova, R. (2019). Giant Vesicles and Their Use in Assays for Assessing Membrane Phase
State, Curvature, Mechanics, and Electrical Properties. Annual review of biophysics 48,
93–119.
Dixon, M. C. (2008). Quartz Crystal Microbalance with Dissipation Monitoring: Enabling Real-
Time Characterization of Biological Materials and Their Interactions. Journal of
Biomolecular Techniques : JBT 19, 151–158.
Durrant, T. N., van den Bosch, M. T. and Hers, I. (2017). Integrin αIIbβ3 outside-in signaling.
Blood 130, 1607–1619.
Erb, E. M. and Engel, J. (2000). Reconstitution of functional integrin into phospholipid vesicles
and planar lipid bilayers. Methods in molecular biology (Clifton, N.J.) 139, 71–82.
Errante, P. R. (2016). Flow cytometry: a literature review. Journal of Biological and Medical
sciences. 2, 221.
Fairbanks, M. B., Pollock, J. R., Prairie, M. D., Scahill, T. A., Baczynskyj, L., Heinrikson, R. L. and Stockman, B. J. (1995). Purification and structural characterization of the
CD11b/CD18 integrin alpha subunit I domain reveals a folded conformation in solution.
FEBS letters 369, 197–201.
Fröhlich, E. (2016). Action of Nanoparticles on Platelet Activation and Plasmatic Coagulation.
Current medicinal chemistry 23, 408–430.
Frohnmayer, J. P., Brüggemann, D., Eberhard, C., Neubauer, S., Mollenhauer, C., Boehm, H., Kessler, H., Geiger, B. and Spatz, J. P. (2015). Minimal synthetic cells to
study integrin-mediated adhesion. Angewandte Chemie (International ed. in English) 54,
12472–12478.

106
Fuchs, B., Süss, R., Teuber, K., Eibisch, M. and Schiller, J. (2011). Lipid analysis by thin-
layer chromatography—a review of the current state. Journal of chromatography. A 1218,
2754–2774.
Furrer, J., Luy, B., Basrur, V., Roberts, D. D. and Barchi, J. J. (2006). Conformational
analysis of an alpha3beta1 integrin-binding peptide from thrombospondin-1: implications
for antiangiogenic drug design. Journal of medicinal chemistry 49, 6324–6333.
Gahmberg, C. G., Fagerholm, S. C., Nurmi, S. M., Chavakis, T., Marchesan, S. and Grönholm, M. (2009). Regulation of integrin activity and signalling. Biochimica et
biophysica acta 1790, 431–444.
Gao, C., Boylan, B., Fang, J., Wilcox, D. A., Newman, D. K. and Newman, P. J. (2011).
Heparin promotes platelet responsiveness by potentiating αIIbβ3-mediated outside-in
signaling. Blood 117, 4946–4952.
Gasteiger, E., Gattiker, A., Hoogland, C., Ivanyi, I., Appel, R. D. and Bairoch, A. (2003).
ExPASy: The proteomics server for in-depth protein knowledge and analysis. Nucleic acids
research 31, 3784–3788.
Gavara, N. and Chadwick, R. S. (2016). Relationship between cell stiffness and stress fiber
amount, assessed by simultaneous atomic force microscopy and live-cell fluorescence
imaging. Biomechanics and modeling in mechanobiology 15, 511–523.
Ge, Y., Gao, J., Jordan, R. and Naumann, C. A. (2018). Changes in Cholesterol Level Alter
Integrin Sequestration in Raft-Mimicking Lipid Mixtures. Biophysical Journal 114, 158–167.
Geiger, B., Bershadsky, A., Pankov, R. and Yamada, K. M. (2001). Transmembrane
crosstalk between the extracellular matrix—cytoskeleton crosstalk. Nature reviews.
Molecular cell biology 2, 793–805.
Ghoshal, K. and Bhattacharyya, M. (2014). Overview of platelet physiology: its hemostatic
and nonhemostatic role in disease pathogenesis. The Scientific World Journal 2014,
781857.
Gianazza, E., Brioschi, M., Baetta, R., Mallia, A., Banfi, C. and Tremoli, E. (2020). Platelets
in Healthy and Disease States: From Biomarkers Discovery to Drug Targets Identification
by Proteomics. International Journal of Molecular Sciences 21.
Gingell, D., Garrod, D. R. and Palmer, J. F. (1970). Divalent Cations and Cell Adhesion. In
A Symposium on Calcium and Cellular Function (ed. A. W. Cuthbert), pp. 59–64. London:
Palgrave Macmillan UK.
Gingras, A. R., Ye, F. and Ginsberg, M. H. (2013). Reconstructing integrin activation in vitro.
Methods in molecular biology (Clifton, N.J.) 1046, 1–17.
Giuliodori, M. J., Lujan, H. L., Briggs, W. S., Palani, G. and DiCarlo, S. E. (2009). Hooke’s
law: applications of a recurring principle. Advances in physiology education 33, 293–296.

107
Goksu, E. I., Vanegas, J. M., Blanchette, C. D., Lin, W.-C. and Longo, M. L. (2009). AFM
for structure and dynamics of biomembranes. Biochimica et biophysica acta 1788, 254–
266.
Gorter, E. and Grendel, F. (1925). On biomolecular layers of lipoids on the chromocytes of
the blood. The Journal of experimental medicine 41, 439–443.
Gossett, D. R., Tse, H. T. K., Lee, S. A., Ying, Y., Lindgren, A. G., Yang, O. O., Rao, J., Clark, A. T. and Di Carlo, D. (2012). Hydrodynamic stretching of single cells for large
population mechanical phenotyping. Proceedings of the National Academy of Sciences of
the United States of America 109, 7630–7635.
Graham, F. L., Smiley, J., Russell, W. C. and Nairn, R. (1977). Characteristics of a human
cell line transformed by DNA from human adenovirus type 5. The Journal of general
virology 36, 59–74.
Guildford, A. L., Poletti, T., Osbourne, L. H., Di Cerbo, A., Gatti, A. M. and Santin, M. (2009). Nanoparticles of a different source induce different patterns of activation in key
biochemical and cellular components of the host response. Journal of the Royal Society,
Interface 6, 1213–1221.
Guillou, H., Depraz-Depland, A., Planus, E., Vianay, B., Chaussy, J., Grichine, A., Albigès-Rizo, C. and Block, M. R. (2008). Lamellipodia nucleation by filopodia depends
on integrin occupancy and downstream Rac1 signaling. Experimental cell research 314,
478–488.
Gutmann, T., Schäfer, I. B., Poojari, C., Brankatschk, B., Vattulainen, I., Strauss, M. and Coskun, Ü. (2020). Cryo-EM structure of the complete and ligand-saturated insulin
receptor ectodomain. The Journal of cell biology 219.
Haghparast, S. M. A., Kihara, T. and Miyake, J. (2015). Distinct mechanical behavior of
HEK293 cells in adherent and suspended states. PeerJ 3, e1131.
Haghparast, S. M. A., Kihara, T., Shimizu, Y., Yuba, S. and Miyake, J. (2013). Actin-based
biomechanical features of suspended normal and cancer cells. Journal of bioscience and
bioengineering 116, 380–385.
Hantgan, R. R., Stahle, M. C. and Lord, S. T. (2010). Dynamic regulation of fibrinogen:
integrin αIIbβ3 binding. Biochemistry 49, 9217–9225.
Hardy, G. J., Nayak, R. and Zauscher, S. (2013). Model cell membranes: Techniques to form
complex biomimetic supported lipid bilayers via vesicle fusion. Current Opinion in Colloid
& Interface Science 18, 448–458.
Hashemzadeh, M., Furukawa, M., Goldsberry, S. and Movahed, M. R. (2008). Chemical
structures and mode of action of intravenous glycoprotein IIb/IIIa receptor blockers: A
review. Experimental and clinical cardiology 13, 192–197.

108
Höök, F., Rodahl, M., Brzezinski, P. and Kasemo, B. (1998). Energy Dissipation Kinetics for
Protein and Antibody−Antigen Adsorption under Shear Oscillation on a Quartz Crystal
Microbalance. Langmuir 14, 729–734.
Huang, J., Li, X., Shi, X., Zhu, M., Wang, J., Huang, S., Huang, X., Wang, H., Li, L., Deng, H. et al. (2019). Platelet integrin αIIbβ3: signal transduction, regulation, and its therapeutic
targeting. Journal of hematology & oncology 12, 26.
Hughes, A. L. (2001). Evolution of the integrin alpha and beta protein families. Journal of
molecular evolution 52, 63–72.
Hulme, E. C. and Trevethick, M. A. (2010). Ligand binding assays at equilibrium: validation
and interpretation. British journal of pharmacology 161, 1219–1237.
Israelachvili, J. N., Mitchell, D. J. and Ninham, B. W. (1976). Theory of self-assembly of
hydrocarbon amphiphiles into micelles and bilayers. J. Chem. Soc., Faraday Trans. 2 72,
1525.
Jackman, J., Knoll, W. and Cho, N.-J. (2012). Biotechnology Applications of Tethered Lipid
Bilayer Membranes. Materials 5, 2637–2657.
Janke, U., Kulke, M., Buchholz, I., Geist, N., Langel, W. and Delcea, M. (2019). Drug-
induced activation of integrin alpha IIb beta 3 leads to minor localized structural changes.
PloS one 14, e0214969.
Jing, Y., Trefna, H., Persson, M., Kasemo, B. and Svedhem, S. (2014). Formation of
supported lipid bilayers on silica: relation to lipid phase transition temperature and liposome
size. Soft matter 10, 187–195.
Johnson, W. C. (1988). Secondary structure of proteins through circular dichroism
spectroscopy. Annual review of biophysics and biophysical chemistry 17, 145–166.
Kaiser, H.-J., Lingwood, D., Levental, I., Sampaio, J. L., Kalvodova, L., Rajendran, L. and Simons, K. (2009). Order of lipid phases in model and plasma membranes. Proceedings
of the National Academy of Sciences of the United States of America 106, 16645–16650.
Kamata, T., Handa, M., Sato, Y., Ikeda, Y. and Aiso, S. (2005). Membrane-proximal
alpha/beta stalk interactions differentially regulate integrin activation. The Journal of
biological chemistry 280, 24775–24783.
Kang, H., Bradley, M. J., McCullough, B. R., Pierre, A., Grintsevich, E. E., Reisler, E. and La Cruz, E. M. de (2012). Identification of cation-binding sites on actin that drive
polymerization and modulate bending stiffness. Proceedings of the National Academy of
Sciences of the United States of America 109, 16923–16927.
Kattula, S., Byrnes, J. R. and Wolberg, A. S. (2017). Fibrinogen and Fibrin in Hemostasis
and Thrombosis. Arteriosclerosis, thrombosis, and vascular biology 37, e13-e21.
Kelly, S. M., Jess, T. J. and Price, N. C. (2005). How to study proteins by circular dichroism.
Biochimica et biophysica acta 1751, 119–139.

109
Khan, I., Saeed, K. and Khan, I. (2019). Nanoparticles: Properties, applications and toxicities.
Arabian Journal of Chemistry 12, 908–931.
Kim, C., Ye, F. and Ginsberg, M. H. (2011). Regulation of integrin activation. Annual review
of cell and developmental biology 27, 321–345.
Koller, D. and Lohner, K. (2014). The role of spontaneous lipid curvature in the interaction of
interfacially active peptides with membranes. Biochimica et biophysica acta 1838, 2250–
2259.
Kraft, J. C., Freeling, J. P., Wang, Z. and Ho, R. J. Y. (2014). Emerging research and clinical
development trends of liposome and lipid nanoparticle drug delivery systems. Journal of
pharmaceutical sciences 103, 29–52.
Kreimann, M., Brandt, S., Krauel, K., Block, S., Helm, C. A., Weitschies, W., Greinacher, A. and Delcea, M. (2014). Binding of anti-platelet factor 4/heparin antibodies depends on
the thermodynamics of conformational changes in platelet factor 4. Blood 124, 2442–2449.
Krieg, M., Fläschner, G., Alsteens, D., Gaub, B. M., Roos, W. H., Wuite, G. J. L., Gaub, H. E., Gerber, C., Dufrêne, Y. F. and Müller, D. J. (2019). Atomic force microscopy-based
mechanobiology. Nat Rev Phys 1, 41–57.
Krishnegowda, M. and Rajashekaraiah, V. (2015). Platelet disorders: an overview. Blood
coagulation & fibrinolysis : an international journal in haemostasis and thrombosis 26, 479–
491.
Ku, T., Lu, P., Chan, C., Wang, T., Lai, S., Lyu, P. and Hsiao, N. (2009). Predicting melting
temperature directly from protein sequences. Computational Biology and Chemistry 33,
445–450.
Kulke, M. and Langel, W. (2020). Molecular dynamics simulations to the bidirectional
adhesion signaling pathway of integrin αV β3. Proteins 88, 679–688.
Kuznetsova, T. G., Starodubtseva, M. N., Yegorenkov, N. I., Chizhik, S. A. and Zhdanov, R. I. (2007). Atomic force microscopy probing of cell elasticity. Micron (Oxford, England :
1993) 38, 824–833.
Lacaria, L., Lange, J. R., Goldmann, W. H., Rico, F. and Alonso, J. L. (2020). αvβ3 integrin
expression increases elasticity in human melanoma cells. Biochemical and biophysical
research communications 525, 836–840.
Lam, W. A., Chaudhuri, O., Crow, A., Webster, K. D., Li, T.-D., Kita, A., Huang, J. and Fletcher, D. A. (2011). Mechanics and contraction dynamics of single platelets and
implications for clot stiffening. Nature materials 10, 61–66.
Lange, J. R., Goldmann, W. H. and Alonso, J. L. (2016). Influence of αvβ3 integrin on the
mechanical properties and the morphology of M21 and K562 cells. Biochemical and
biophysical research communications 478, 1280–1285.

110
Langmuir, I. (1916). The constitution and fundamental properties of solids and liquids. Part I.
Solids. J. Am. Chem. Soc. 38, 2221–2295.
Lee, A. G. (2004). How lipids affect the activities of integral membrane proteins. Biochimica et
biophysica acta 1666, 62–87.
Lee, A. G. (2011). Biological membranes: the importance of molecular detail. Trends in
biochemical sciences 36, 493–500.
Leitinger, B. and Hogg, N. (2002). The involvement of lipid rafts in the regulation of integrin
function. Journal of cell science 115, 963–972.
Leitz, A. J., Bayburt, T. H., Barnakov, A. N., Springer, B. A. and Sligar, S. G. (2006).
Functional reconstitution of Beta2-adrenergic receptors utilizing self-assembling Nanodisc
technology. BioTechniques 40, 601-2, 604, 606, passim.
Lesniak, A., Fenaroli, F., Monopoli, M. P., Åberg, C., Dawson, K. A. and Salvati, A. (2012).
Effects of the presence or absence of a protein corona on silica nanoparticle uptake and
impact on cells. ACS nano 6, 5845–5857.
Li, R., Babu, C. R., Valentine, K., Lear, J. D., Wand, A. J., Bennett, J. S. and DeGrado, W. F. (2002). Characterization of the monomeric form of the transmembrane and cytoplasmic
domains of the integrin beta 3 subunit by NMR spectroscopy. Biochemistry 41, 15618–
15624.
Lickert, S., Sorrentino, S., Studt, J.-D., Medalia, O., Vogel, V. and Schoen, I. (2018).
Morphometric analysis of spread platelets identifies integrin αIIbβ3-specific contractile
phenotype. Scientific reports 8, 5428.
Lind, T. K. and Cárdenas, M. (2016). Understanding the formation of supported lipid bilayers
via vesicle fusion-A case that exemplifies the need for the complementary method
approach (Review). Biointerphases 11, 20801.
Lind, T. K., Skoda, M. W. A. and Cárdenas, M. (2019). Formation and Characterization of
Supported Lipid Bilayers Composed of Phosphatidylethanolamine and
Phosphatidylglycerol by Vesicle Fusion, a Simple but Relevant Model for Bacterial
Membranes. ACS omega 4, 10687–10694.
Litvinov, R. I., Mekler, A., Shuman, H., Bennett, J. S., Barsegov, V. and Weisel, J. W. (2012). Resolving two-dimensional kinetics of the integrin αIIbβ3-fibrinogen interactions
using binding-unbinding correlation spectroscopy. The Journal of biological chemistry 287,
35275–35285.
Ma, Y.-Q., Qin, J. and Plow, E. F. (2007). Platelet integrin alpha(IIb)beta(3): activation
mechanisms. Journal of thrombosis and haemostasis: JTH 5, 1345–1352.
Maghsoudy-Louyeh, S., Kropf, M. and Tittmann, B. R. (2018). Review of Progress in Atomic
Force Microscopy. TONIJ 12, 86–104.

111
Mahdavi, M., Ahmad, M. B., Haron, M. J., Namvar, F., Nadi, B., Rahman, M. Z. A. and Amin, J. (2013). Synthesis, surface modification and characterisation of biocompatible
magnetic iron oxide nanoparticles for biomedical applications. Molecules (Basel,
Switzerland) 18, 7533–7548.
Makogonenko, E. M., Yakubenko, V. P., Ingham, K. C. and Medved, L. V. (1996). Thermal
Stability of Individual Domains in Platelet Glycoprotein IIbIIIa. Eur J Biochem 237, 205–
211.
Martens, U., Janke, U., Möller, S., Talbot, D., Abou-Hassan, A. and Delcea, M. (2020).
Interaction of fibrinogen–magnetic nanoparticle bioconjugates with integrin reconstituted
into artificial membranes. Nanoscale 41, 4306.
Marx, K. A. (2003). Quartz crystal microbalance: a useful tool for studying thin polymer films
and complex biomolecular systems at the solution-surface interface. Biomacromolecules
4, 1099–1120.
Michelson, A. D., Cattaneo, M., Frelinger, A. L. and Newman, P. J., eds. (2019). Platelets:
Academic Press, an imprint of Elsevier. London, United Kingdom.
Miles, A. J. and Wallace, B. A. (2016). Circular dichroism spectroscopy of membrane
proteins. Chemical Society reviews 45, 4859–4872.
Miller, D. C. and Dahl, G. P. (1982). Early events in calcium-induced liposome fusion.
Biochimica et Biophysica Acta (BBA) - Biomembranes 689, 165–169.
Morrison, W. R. (1964). A fast, simple and reliable method for the microdetermination of
phosphorus in biological materials. Analytical Biochemistry 7, 218–224.
Múzquiz-Ramos, E. M., Guerrero-Chávez, V., Macías-Martínez, B. I., López-Badillo, C. M. and García-Cerda, L. A. (2015). Synthesis and characterization of maghemite
nanoparticles for hyperthermia applications. Ceramics International 41, 397–402.
Nagle, J. F. and Tristram-Nagle, S. (2000). Structure of lipid bilayers. Biochimica et
biophysica acta 1469, 159–195.
NanoWizard (2014). Determining the elastic modulus of biological samples using atomic force
microscopy. http://www.jpk.com/afm.230.en.html.
Niklasson, M., Andresen, C., Helander, S., Roth, M. G. L., Zimdahl Kahlin, A., Lindqvist Appell, M., Mårtensson, L.-G. and Lundström, P. (2015). Robust and convenient
analysis of protein thermal and chemical stability. Protein science : a publication of the
Protein Society 24, 2055–2062.
Oakes, P. W., Bidone, T. C., Beckham, Y., Skeeters, A. V., Ramirez-San Juan, G. R., Winter, S. P., Voth, G. A. and Gardel, M. L. (2018). Lamellipodium is a myosin-
independent mechanosensor. Proceedings of the National Academy of Sciences of the
United States of America 115, 2646–2651.

112
O’Donnell, V. B., Murphy, R. C. and Watson, S. P. (2014). Platelet lipidomics: modern day
perspective on lipid discovery and characterization in platelets. Circulation research 114,
1185–1203.
Oom, A., Poggi, M., Wikström, J. and Sukumar, M. (2012). Surface interactions of
monoclonal antibodies characterized by quartz crystal microbalance with dissipation:
impact of hydrophobicity and protein self-interactions. Journal of pharmaceutical sciences
101, 519–529.
Otto, O., Rosendahl, P., Mietke, A., Golfier, S., Herold, C., Klaue, D., Girardo, S., Pagliara, S., Ekpenyong, A., Jacobi, A. et al. (2015). Real-time deformability cytometry: on-the-fly
cell mechanical phenotyping. Nature methods 12, 199-202, 4 p following 202.
Oviedo, C. and Rodríguez, J. (2003). EDTA: the chelating agent under environmental
scrutiny. Quím. Nova 26, 901–905.
Parmar, M. M., Edwards, K. and Madden, T. D. (1999). Incorporation of bacterial membrane
proteins into liposomes: factors influencing protein reconstitution. Biochimica et biophysica
acta 1421, 77–90.
Pinco, K. A., He, W. and Yang, J. T. (2002). alpha4beta1 integrin regulates lamellipodia
protrusion via a focal complex/focal adhesion-independent mechanism. Molecular biology
of the cell 13, 3203–3217.
Porcelijn, L., Huiskes, E., Maatman, R., Kreuk, A. de and Haas, M. de (2008). Acquired
Glanzmann’s thrombasthenia caused by glycoprotein IIb/IIIa autoantibodies of the
immunoglobulin G1 (IgG1), IgG2 or IgG4 subclass: a study in six cases. Vox sanguinis 95,
324–330.
Prachayasittikul, V., Isarankura-Na-Ayudhya, C., Tantimongcolwat, T., Nantasenamat, C. and Galla, H.-J. (2007). EDTA-induced membrane fluidization and destabilization:
biophysical studies on artificial lipid membranes. Acta biochimica et biophysica Sinica 39,
901–913.
Puklin-Faucher, E., Gao, M., Schulten, K. and Vogel, V. (2006). How the headpiece hinge
angle is opened: New insights into the dynamics of integrin activation. The Journal of cell
biology 175, 349–360.
Richter, R., Mukhopadhyay, A. and Brisson, A. (2003). Pathways of Lipid Vesicle Deposition
on Solid Surfaces: A Combined QCM-D and AFM Study. Biophysical Journal 85, 3035–
3047.
Richter, R. P., Bérat, R. and Brisson, A. R. (2006). Formation of solid-supported lipid
bilayers: an integrated view. Langmuir 22, 3497–3505.
Robertson, J. D. (1959). The ultrastructure of cell membranes and their derivatives.
Biochemical Society symposium 16, 3–43.

113
Rodi, P. M., Bocco Gianello, M. D., Corregido, M. C. and Gennaro, A. M. (2014).
Comparative study of the interaction of CHAPS and Triton X-100 with the erythrocyte
membrane. Biochimica et biophysica acta 1838, 859–866.
Roe, D. R. and Cheatham, T. E. (2013). PTRAJ and CPPTRAJ: Software for Processing and
Analysis of Molecular Dynamics Trajectory Data. Journal of chemical theory and
computation 9, 3084–3095.
Rosen, M. J. and Kunjappu, J. T. (2012). Surfactants and interfacial phenomena. Hoboken,
N.J: Wiley.
Rowley, T. (2012). Flow Cytometry - A Survey and the Basics. Mater Methods 2.
Ruiz, C., Liu, C. Y., Sun, Q. H., Sigaud-Fiks, M., Fressinaud, E., Muller, J. Y., Nurden, P., Nurden, A. T., Newman, P. J. and Valentin, N. (2001). A point mutation in the cysteine-
rich domain of glycoprotein (GP) IIIa results in the expression of a GPIIb-IIIa (alphaIIbbeta3)
integrin receptor locked in a high-affinity state and a Glanzmann thrombasthenia-like
phenotype. Blood 98, 2432–2441.
Sauerbrey, G. (1959). Verwendung von Schwingquarzen zur Wägung dünner Schichten und
zur Mikrowägung. Z. Physik 155, 206–222.
Schürholz, T. (1996). Critical dependence of the solubilization of lipid vesicles by the detergent
CHAPS on the lipid composition. Functional reconstitution of the nicotinic acetylcholine
receptor into preformed vesicles above the critical micellization concentration. Biophysical
Chemistry 58, 87–96.
Schwarz, U. S. and Safran, S. A. (2013). Physics of adherent cells. Journal of cell science
85, 1327–1381.
Scipion, C. P. M., Ghoshdastider, U., Ferrer, F. J., Yuen, T.-Y., Wongsantichon, J. and Robinson, R. C. (2018). Structural evidence for the roles of divalent cations in actin
polymerization and activation of ATP hydrolysis. Proceedings of the National Academy of
Sciences of the United States of America 115, 10345–10350.
Seddon, A. M., Curnow, P. and Booth, P. J. (2004). Membrane proteins, lipids and
detergents: not just a soap opera. Biochimica et biophysica acta 1666, 105–117.
Semple, J. W., Italiano, J. E. and Freedman, J. (2011). Platelets and the immune continuum.
Nature reviews. Immunology 11, 264–274.
Senden, T. J. (2001). Force microscopy and surface interactions. Current Opinion in Colloid
& Interface Science 6, 95–101.
Shahin, V., Ludwig, Y., Schafer, C., Nikova, D. and Oberleithner, H. (2005). Glucocorticoids
remodel nuclear envelope structure and permeability. Journal of cell science 118, 2881–
2889.

114
Shen, H.-H., Lithgow, T. and Martin, L. (2013). Reconstitution of membrane proteins into
model membranes: seeking better ways to retain protein activities. International Journal of
Molecular Sciences 14, 1589–1607.
Shipley, G. G., Avecilla, L. S. and Small, D. M. (1974). Phase behavior and structure of
aqueous dispersions of sphingomyelin. Journal of lipid research 15, 124–131.
Simonian, M. H. (2002). Spectrophotometric Determination of Protein Concentration. Current
Protocols in Food Analytical Chemistry 4, B1.3.1-B1.3.7.
Simons, K. and Sampaio, J. L. (2011). Membrane organization and lipid rafts. Cold Spring
Harbor perspectives in biology 3, a004697.
Singer, S. J. and Nicolson, G. L. (1972). The fluid mosaic model of the structure of cell
membranes. Science (New York, N.Y.) 175, 720–731.
Smith, M. R., Fernandes, J., Go, Y.-M. and Jones, D. P. (2017). Redox dynamics of
manganese as a mitochondrial life-death switch. Biochemical and biophysical research
communications 482, 388–398.
Smith, P. K., Krohn, R. I., Hermanson, G. T., Mallia, A. K., Gartner, F. H., Provenzano, M. D., Fujimoto, E. K., Goeke, N. M., Olson, B. J. and Klenk, D. C. (1985). Measurement of
protein using bicinchoninic acid. Analytical Biochemistry 150, 76–85.
Sobel, M., Fish, W. R., Toma, N., Luo, S., Bird, K., Mori, K., Kusumoto, S., Blystone, S. D. and Suda, Y. (2001). Heparin modulates integrin function in human platelets. Journal of
vascular surgery 33, 587–594.
Solh, T., Botsford, A. and Solh, M. (2015). Glanzmann’s thrombasthenia: pathogenesis,
diagnosis, and current and emerging treatment options. Journal of blood medicine 6, 219–
227.
Stetefeld, J., McKenna, S. A. and Patel, T. R. (2016). Dynamic light scattering: a practical
guide and applications in biomedical sciences. Biophysical reviews 8, 409–427.
Suk, J. S., Xu, Q., Kim, N., Hanes, J. and Ensign, L. M. (2016). PEGylation as a strategy for
improving nanoparticle-based drug and gene delivery. Advanced drug delivery reviews 99,
28–51.
Sun, Z., Costell, M. and Fässler, R. (2019). Integrin activation by talin, kindlin and mechanical
forces. Nature cell biology 21, 25–31.
Sunshine, H. and Iruela-Arispe, M. L. (2017). Membrane lipids and cell signaling. Current
opinion in lipidology 28, 408–413.
Swinehart, D. F. (1962). The Beer-Lambert Law. J. Chem. Educ. 39, 333.
Takagi, J., Petre, B. M., Walz, T. and Springer, T. A. (2002). Global Conformational
Rearrangements in Integrin Extracellular Domains in Outside-In and Inside-Out Signaling.
Cell 110, 599–611.

115
Taub, R., Gould, R. J., Garsky, V. M., Ciccarone, T. M., Hoxie, J., Friedman, P. A. and Shattil, S. J. (1989). A monoclonal antibody against the platelet fibrinogen receptor
contains a sequence that mimics a receptor recognition domain in fibrinogen. The Journal
of biological chemistry 264, 259–265.
Tiwari, S., Askari, J. A., Humphries, M. J. and Bulleid, N. J. (2011). Divalent cations regulate
the folding and activation status of integrins during their intracellular trafficking. Journal of
cell science 124, 1672–1680.
Tonda-Turo, C., Carmagnola, I. and Ciardelli, G. (2018). Quartz Crystal Microbalance With
Dissipation Monitoring: A Powerful Method to Predict the in vivo Behavior of Bioengineered
Surfaces. Frontiers in bioengineering and biotechnology 6, 158.
Versteeg, H. H., Heemskerk, J. W. M., Levi, M. and Reitsma, P. H. (2013). New
fundamentals in hemostasis. Physiological reviews 93, 327–358.
Vieira, J. L. F., Borges, L. M. G., Nascimento, M. T. S. and Gomes, A. d. L. S. (2008).
Quinine levels in patients with uncomplicated falciparum malaria in the Amazon region of
Brazil. The Brazilian journal of infectious diseases: an official publication of the Brazilian
Society of Infectious Diseases 12, 353–354.
Vilanova, O., Mittag, J. J., Kelly, P. M., Milani, S., Dawson, K. A., Rädler, J. O. and Franzese, G. (2016). Understanding the Kinetics of Protein-Nanoparticle Corona
Formation. ACS nano 10, 10842–10850.
Visentin, G. P. and Liu, C. Y. (2007). Drug-induced thrombocytopenia. Hematology/oncology
clinics of North America 21, 685-96, vi.
Vorup-Jensen, T., Chi, L., Gjelstrup, L. C., Jensen, U. B., Jewett, C. A., Xie, C., Shimaoka, M., Linhardt, R. J. and Springer, T. A. (2007). Binding between the integrin alphaXbeta2
(CD11c/CD18) and heparin. The Journal of biological chemistry 282, 30869–30877.
Williams, D. B. and Carter, C. B. (1996). Transmission Electron Microscopy. A Textbook for
Materials Science. Boston, MA, s.l.: Springer US.
Williams, E. K., Oshinowo, O., Ravindran, A., Lam, W. A. and Myers, D. R. (2019). Feeling
the Force: Measurements of Platelet Contraction and Their Diagnostic Implications.
Seminars in thrombosis and hemostasis 45, 285–296.
Williamson, P. (2015). Phospholipid Scramblases. Lipid insights 8, 41–44.
Wonerow, P., Obergfell, A., Wilde, J. I., Bobe, R., Asazuma, N., Brdicka, T., Leo, A., Schraven, B., Horejsí, V., Shattil, S. J. et al. (2002). Differential role of glycolipid-enriched
membrane domains in glycoprotein VI- and integrin-mediated phospholipase Cgamma2
regulation in platelets. The Biochemical journal 364, 755–765.
Xiao, Z. and Théroux, P. (1998). Platelet activation with unfractionated heparin at therapeutic
concentrations and comparisons with a low-molecular-weight heparin and with a direct
thrombin inhibitor. Circulation 97, 251–256.

116
Xiong, J.-P., Stehle, T., Zhang, R., Joachimiak, A., Frech, M., Goodman, S. L. and Arnaout, M. A. (2002). Crystal structure of the extracellular segment of integrin alpha
Vbeta3 in complex with an Arg-Gly-Asp ligand. Science (New York, N.Y.) 296, 151–155.
Xu, X.-P., Kim, E., Swift, M., Smith, J. W., Volkmann, N. and Hanein, D. (2016). Three-
Dimensional Structures of Full-Length, Membrane-Embedded Human α(IIb)β(3) Integrin
Complexes. Biophysical Journal 110, 798–809.
Yagi, M., Murray, J., Strand, K., Blystone, S., Interlandi, G., Suda, Y. and Sobel, M. (2012).
Heparin modulates the conformation and signaling of platelet integrin αIIbβ3. Thrombosis
research 129, 743–749.
Ye, F., Hu, G., Taylor, D., Ratnikov, B., Bobkov, A. A., McLean, M. A., Sligar, S. G., Taylor, K. A. and Ginsberg, M. H. (2010). Recreation of the terminal events in physiological
integrin activation. The Journal of cell biology 188, 157–173.
Ye, F., Kim, C. and Ginsberg, M. H. (2012). Reconstruction of integrin activation. Blood 119,
26–33.
Ye, F., Liu, J., Winkler, H. and Taylor, K. A. (2008). Integrin alpha IIb beta 3 in a membrane
environment remains the same height after Mn2+ activation when observed by cryoelectron
tomography. Journal of molecular biology 378, 976–986.
Yeagle, P. L. (2016). The Membranes of Cells. s.l.: Elsevier Science.
Yun, S.-H., Sim, E.-H., Goh, R.-Y., Park, J.-I. and Han, J.-Y. (2016). Platelet Activation: The
Mechanisms and Potential Biomarkers. BioMed research international 2016, 9060143.
Zhang, K. and Chen, J. (2012). The regulation of integrin function by divalent cations. Cell
adhesion & migration 6, 20–29.
Zhang, Y., Qiu, Y., Blanchard, A. T., Chang, Y., Brockman, J. M., Ma, V. P.-Y., Lam, W. A. and Salaita, K. (2018). Platelet integrins exhibit anisotropic mechanosensing and harness
piconewton forces to mediate platelet aggregation. Proceedings of the National Academy
of Sciences of the United States of America 115, 325–330.
Zhao, H. and Lappalainen, P. (2012). A simple guide to biochemical approaches for analyzing
protein-lipid interactions. Molecular biology of the cell 23, 2823–2830.
Zhao, J. and Stenzel, M. H. (2018). Entry of nanoparticles into cells: the importance of
nanoparticle properties. Polym. Chem. 9, 259–272.
Zhu, J., Luo, B.-H., Xiao, T., Zhang, C., Nishida, N. and Springer, T. A. (2008). Structure of
a complete integrin ectodomain in a physiologic resting state and activation and
deactivation by applied forces. Molecular cell 32, 849–861.
Zhu, J., Zhu, J., Bougie, D. W., Aster, R. H. and Springer, T. A. (2015). Structural basis for
quinine-dependent antibody binding to platelet integrin αIIbβ3. Blood 126, 2138–2145.
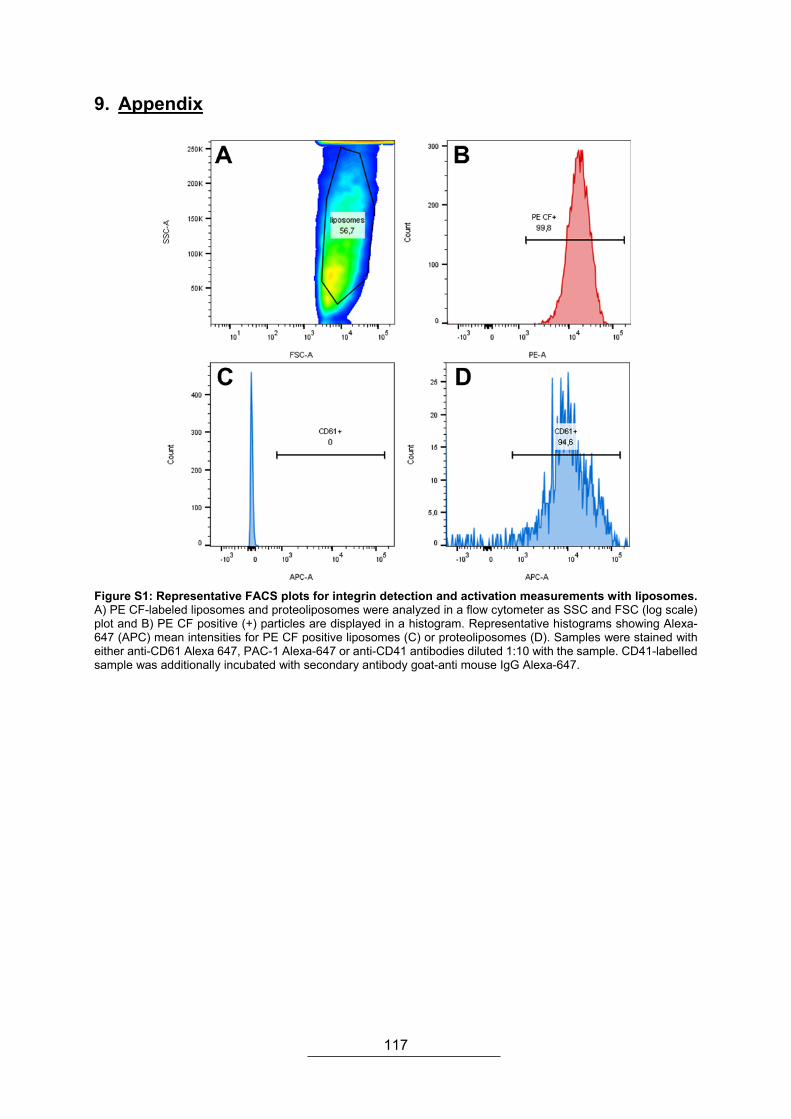
117
9. Appendix
Figure S1: Representative FACS plots for integrin detection and activation measurements with liposomes. A) PE CF-labeled liposomes and proteoliposomes were analyzed in a flow cytometer as SSC and FSC (log scale) plot and B) PE CF positive (+) particles are displayed in a histogram. Representative histograms showing Alexa-647 (APC) mean intensities for PE CF positive liposomes (C) or proteoliposomes (D). Samples were stained with either anti-CD61 Alexa 647, PAC-1 Alexa-647 or anti-CD41 antibodies diluted 1:10 with the sample. CD41-labelled sample was additionally incubated with secondary antibody goat-anti mouse IgG Alexa-647.

118
Figure S2: Representative FACS plots for integrin activation measurements with HEK293 cells. (A) First SSC and FSC were plotted and (B) single cells were marked using the FSC-H (h-heigth) parameter. C) From the single cells all Alexa-488 and APC (corresponding Alexa 647) positive cells (stained with anti-CD61 Alexa 488 and PAC-1 Alexa-647 antibodies 1:100 dilution in PBS) were tagged and are displayed for C) HEK293 and D) active integrin mutant expressing cells. Afterwards, histograms of all CD61 positive cells, representative for HEK293 cells (E) and for active integrin mutant (F), were marked and from this population, PAC-1 positive cells were gated (G).
Figure S3: Representative QCM-D experimental profile for the buffer changes. Changes in dissipation (D-red) and frequency f (blue) of the seventh overtone at 37 °C. PBS buffer was injected over the SiO2 sensors and after reaching a baseline, liposomes or proteoliposomes were injected (10 min) and the formation of a bilayer was observed except for control injections of buffer on blank surface. After a washing step with PBS containing 1 mM Mn2+, 1 mM Ca2+, 1mM Mg2+. Rinsing with PBS buffer (60 min) followed for bilayer samples.

119
Figure S4: Thin-layer chromatography of lipids extracted from liposome samples. A) DOPC, SM and cholesterol standard. 1- liposomes CHAPS protocol, 2- proteoliposomes CHAPS protocol, 3- liposomes Triton protocol, 4- proteoliposomes Triton protocol, B) DMPG and DMPC standards, 5- liposomes Triton protocol, 6- proteoliposomes Triton protocol.
Figure S5: Representative QCM-D experimental profile of DOPC:SM:cholesterol liposomes/proteoliposomes. Changes in dissipation (D-red) and frequency f (blue) of the seventh overtone at 37 °C. HEPES buffer was injected over the SiO2 sensors and after reaching a baseline, liposomes or proteoliposomes, prepared with Triton protocol and 37.5:37.5:25 lipid ratio DOPC:SM:cholesterol, were injected (10 min) and the absorbance of vesicles was observed. Vesicle fusion should be induced by injection of AH peptide at 2000 s. After a washing step with HEPES buffer, PAC-1 antibody was injected (7500 s) which was followed by rinsing with buffer.

120
Table S1: Changes in frequency upon PAC-1 binding to liposome- or proteoliposome-derived bilayer with different lipid ratios in QCM-D measurements. Bilayer was formed on SiO2 surface at 37 °C. Different ratios of DOPC:SM:cholesterol and DMPG:DMPC 1:20 as control are loaded on the sensor surface.
Δ f [Hz] liposomes proteoliposomes buffer Mn2+ buffer Mn2+
25:35:40 0,25 ± 0,11 0,79 ± 0,13 0,46 ± 0,21 0,38 ± 0,17
37.5:37.5:25 0,25 ± 0,00 0,20 ± 0,00 1,28 ± 0,41 2,04 ± 0,70
45:30:25 0,26 ± 0,04 0,50 ± 0,07 0,28 ± 0,10 1,63 ± 0,21
60:28:12 0,27 ± 0,14 0,24 ± 0,16 0,62 ± 0,13 1,46 ± 0,58
70:25:5 0,35 ± 0,25 0,50 ± 0,35 0,92 ± 0,39 0,87 ± 0,18
20:1 1,00 ± 0,00 0,20 ± 0,00 1,39 ± 0,04 4,00 ± 0,14
R-Skript – Evaluation of RT-DC and AFM data using RStudio with linear mixed model ####### RT-DC Mutants #############
#set working directory
setwd("C:/Users/Thersa/Desktop/Statistik/HiWi")
# load packages
pacman::p_load(tidyverse, car, lmerTest, emmeans, MASS, Hmisc)
emm_options(lmerTest.limit = 100000)
RTDC <- read_delim(file = "RT-DC_Una.txt",
delim = "\t",
col_names = TRUE)
RTDC$cell_line <- as.factor(RTDC$cell_line) #??
RTDC$cell_line <- relevel(RTDC$cell_line, ref = "integrin")
levels(factor(RTDC$cell_line))
RTDC$treatment <- as.factor(RTDC$treatment)
RTDC$treatment <- relevel(RTDC$treatment, ref = "untreated ")
levels(factor(RTDC$treatment))
l1 <- quantile(RTDC$YM_kPa, c(0.05))
u1 <- quantile(RTDC$YM_kPa, c(0.95))
RTDC_new <- lmer(log(YM_kPa) ~ factor(cell_line) * factor(treatment)
+ (1|replica),

121
data = RTDC,
REML = FALSE,
subset = (YM_kPa >= l1 & YM_kPa <= u1))
Anova(RTDC_new)
summary(RTDC_new)
ls_new <- emmeans(RTDC_new,
pairwise ~ cell_line*treatment,
adjust = NULL,
type = "response")
sum_new <- summary(ls_new, type = "response")
sum_new$emmeans <- as.data.frame(sum_new$emmeans)
ggplot(sum_new$emmeans,
aes(x=as.factor(cell_line),
y=response,
fill=factor(treatment))) +
geom_bar(position=position_dodge(),
stat="identity") +
geom_errorbar(aes(ymin = response - SE,
ymax = response + SE),
width=0.2,
position = position_dodge(0.9)) +
coord_cartesian(ylim = c(0, 1)) +
ylab("YM [kPa] means") +
ggtitle("RTDC Una") +
xlab("cell line")
###################################
########################################
######### AFM Mutants ##################
####################################
###################################
#set working directory
setwd("C:/Users/Thersa/Desktop/Statistik/HiWi")

122
# load packages
pacman::p_load(tidyverse, car, lmerTest, emmeans, MASS, Hmisc)
emm_options(lmerTest.limit = 50000)
# load data
AFM <- read_delim(file = "AFM_komplett.txt",
delim = "\t",
col_names = TRUE)
# define factors and set "integrin" as reference factor
AFM$cell_line <- as.factor(AFM$cell_line) #??
levels(factor(AFM$cell_line))
AFM$cell_line <- relevel(AFM$cell_line, ref = "integrin")
levels(factor(AFM$cell_line))
AFM$treatment <- as.factor(AFM$treatment)
AFM$treatment <- relevel(AFM$treatment, ref = "untr")
levels(factor(AFM$treatment))
#due to some very high values, outliers are removed (here meaning the highest and lowest 1% of all data points)
l1 <- quantile(AFM$Data, c(0.05))
u1 <- quantile(AFM$Data, c(0.95))
#only values in between lower and upper percentiles are used for model fitting
# fit data to generalizes linear mixed model
AFM_model <- lmer(log(Data) ~ factor(cell_line) * factor(treatment) +
(1|replica) +
(1|replica:cell_ID) +
(1|replica:cell_ID:position_ID),
data = AFM,
REML = FALSE,
subset = (Data >= l1 & Data <= u1))
# & (replica=="C")
#perform Anova to check for significance
Anova(AFM_model)
summary(AFM_model)
#calculate estimated marginal means
ls_afm <- emmeans(AFM_model,

123
pairwise ~ cell_line*treatment,
adjust = NULL)
#warning: "treatment" and "cell_line" is not a factor
sum_afm <- summary(ls_afm, type = "response")
sum_afm$emmeans <- as.data.frame(sum_afm$emmeans)
ggplot(sum_afm$emmeans,
aes(x=as.factor(cell_line),
y=response,
fill=factor(treatment))) +
geom_bar(position=position_dodge(),
stat="identity") +
geom_errorbar(aes(ymin = response - SE,
ymax = response + SE),
width=0.2,
position = position_dodge(0.9)) +
coord_cartesian(ylim = c(0, 350)) +
ylab("YM [Pa] means") +
ggtitle("AFM Mutants") +
xlab("cell line")
################ Tests
ranef(AFM_model)
coef(AFM_model)
print(dotplot(ranef(AFM_model, condVar=T))[['replica']])
print(dotplot(ranef(AFM_model, condVar=T), groups=AFM$cell_line)[['replica']])
Statistical Analysis – p-values Table S2: Contrast of two cell lines and their respective p-values from RT-DC measurement as described in chapter 3.6.6. The different cell lines are stated with short names: integrin αIIbβ3 wildtype=” integrin”, αIIbβ3 Inactive=” inactive”, αIIbβ3 Active=” active”, HEK293= “ control”. The treatments are stated as untreated-standard cell media, Mn-standard cell media containing 1 mM MnCl2, EDTA-standard cell media containing 5 mM EDTA. Significance levels are displayed according to the p-values as [***] for p-values < 0.001, [**] for p-values 0.001 – ≤ 0.01 and [*] for p-values of 0.01 – 0.05.
contrast p-value significance cell line treatment cell line treatment integrin untreated / active untreated 0.0938 integrin untreated / control untreated 0.2133 integrin untreated / inactive untreated <.0001 ***

124
integrin untreated / integrin EDTA <.0001 *** integrin untreated / active EDTA <.0001 *** integrin untreated / control EDTA <.0001 *** integrin untreated / inactive EDTA <.0001 *** integrin untreated / integrin Mn <.0001 *** integrin untreated / active Mn <.0001 *** integrin untreated / control Mn <.0001 *** integrin untreated / inactive Mn 0.0024 ** active untreated / control untreated 0.0022 ** active untreated / inactive untreated <.0001 *** active untreated / integrin EDTA <.0001 *** active untreated / active EDTA <.0001 *** active untreated / control EDTA <.0001 *** active untreated / inactive EDTA <.0001 *** active untreated / integrin Mn <.0001 *** active untreated / active Mn 0.0013 ** active untreated / control Mn <.0001 *** active untreated / inactive Mn <.0001 *** control untreated / inactive untreated <.0001 *** control untreated / integrin EDTA <.0001 *** control untreated / active EDTA <.0001 *** control untreated / control EDTA <.0001 *** control untreated / inactive EDTA <.0001 *** control untreated / integrin Mn <.0001 *** control untreated / active Mn <.0001 *** control untreated / control Mn <.0001 *** control untreated / inactive Mn 0.0500 * inactive untreated / integrin EDTA <.0001 *** inactive untreated / active EDTA <.0001 *** inactive untreated / control EDTA <.0001 *** inactive untreated / inactive EDTA <.0001 *** inactive untreated / integrin Mn <.0001 *** inactive untreated / active Mn <.0001 *** inactive untreated / control Mn <.0001 *** inactive untreated / inactive Mn 0.0089 ** integrin EDTA / active EDTA 0.0009 *** integrin EDTA / control EDTA 0.0005 *** integrin EDTA / inactive EDTA 0.0001 *** integrin EDTA / integrin Mn <.0001 ***

125
Table S3: Contrast of two cell lines and their respective p-values from AFM measurement as described in chapter 3.6.5. The different cell lines are stated with short names: integrin αIIbβ3 wildtype=” integrin”, αIIbβ3 Inactive=” inactive”, αIIbβ3 Active=” active”, HEK293= “control”. The treatments are stated as untreated-standard cell media, Mn-standard cell media containing 1 mM MnCl2. Significance levels are displayed according to the p-values as [***] for p-values < 0.001, [**] for p-values 0.001 – ≤ 0.01 and [*] for p-values of 0.01 – 0.05.
contrast p-value significance cell line treatment cell line treatment control untreated / control Mn <0.0001 *** integrin untreated / integrin Mn <0.0001 *** active untreated / active Mn 0.0262 * inactive untreated / inactive Mn 0.8364 control untreated / integrin untreated <0.0001 *** control untreated / active untreated 0.2507 control untreated / inactive untreated <0.0001 *** control Mn / integrin Mn 0.0008 ** control Mn / active Mn <0.0001 *** control Mn / inactive Mn <0.0001 ***

126

127
128
Acknowledgements
Diese Arbeit wäre ohne die Hilfe und Unterstützung von vielen besonderen Menschen nicht
möglich gewesen.
Many thanks to Mihaela Delcea, who supervised and guided me through my whole PhD time.
You gave me the opportunity to grow every day with challenges, excelling and learning a lot
about myself. Thank you also for the freedom, patience and confidence during this time period.
Ich möchte auch gern Frau Professorin Sabine Müller danken, die mich als „kommissarische
Doktormutter“ aufgenommen und mir den Einstieg als Promovendin erleichtert hat.
This work was financially supported by the European Research Council (ERC) Starting Grant
‘PredicTOOL’ (637877).
Peter Nestler, dir bin ich sehr dankbar für deine Unterstützung als Seelsorger, positiv-Denker
und als guter Vermittler physikalischen Wissens für Dummies.
Ich möchte mich außerdem vom ganzen Herzen bei Felix Nagel bedanken! Ohne dich hätte
ich vermutlich schon vor zwei Jahren aufgehört und hätte aufgegeben. Wegen dir bin ich
wieder gerne ins Labor gegangen, in Zeiten in denen es mir nicht gut ging. Danke für den Spaß
während der Arbeit, das gemeinsame Echauffieren über alles und jeden, für
Glühwein/Pizza/Bier//Wein/Doku Abende und die sinnvollen wie auch sinnlosen Diskussionen.
Du weißt ja geteiltes Leid ist halbes Leid… und dafür bin ich dir sehr dankbar.
In diesem Zuge möchte ich auch der gesamten Arbeitsgruppe Biophysikalische Chemie, früher
Nanostructure, danken! Ganz besonderer Dank gilt dabei Anne Susemihl, Alexandra
Mitlehner, Aileen Weide und Eric Tönnies, für den Spaß und die tolle Arbeitsatmosphäre; nicht
zuletzt auch für eure Hilfe im Laboralltag und eure immerwährende Motivation, selbst bei
niederschlagenden Ergebnissen, wenn wieder nichts geklappt hat oder ich einfach, mal
wieder, keine Zeit hatte.
Danke auch an Ina Buchholz, für die liebe Aufnahme in die Arbeitsgruppe, die lustigen
Dienstreisen und wissenschaftlichen Ratschläge.
Ohne die aufmunternden Worte und die Hilfe von Doreen Biedenweg und Astrid Kempcke
wäre ich so manches Mal verzweifelt. Danke dafür!
Martin und Norman möchte ich für amüsante Arbeitsgruppenausflüge und interessante
tiefgründige Gespräche danken, sowie den Willen immer eine Lösung zu finden, das ist eine
tolle Eigenschaft! Danke Norman für deine Hilfe und Geduld bei den Bildern!
Auch Herrn Oliver Otto, Ünal Coskun und Theresia Gutmann gilt mein Dank für die
Unterstützung, neue wissenschaftliche Perspektiven und inspirierenden Diskussionen.
Stephanie Spiegler, dir danke ich für deine Geduld und deinen Rat während der Mutagenesen,
ohne den ich so manches Mal keinen Ausweg gewusst hätte.

129
I would like to thank also Adnane Achour and Tim Schulte from the Karolinska Institute in
Stockholm for their support, even when my cells are doing crazy things, and the opportunity to
learn new techniques in your lab!
Many thanks also to Prof. Karen Vanhoorelbeke for the kind gift of Plasmid DNA, which was
the basis for the mutagenesis studies and cell experiments.
Vielen Dank an Theresa Brinker und Stephan Groß für die Hilfe bei der statistischen
Auswertung der AFM und RT-DC Daten.
Auch dem Imaging Center des Instituts für Biologie der Universität Greifswald möchte ich für
die TEM Bilder danken.
Dem Mentoring Programm der Universität Greifswald, besonders Frau Hoppe und Frau
Ehmler, als auch dem Graduiertenkolleg BioX, danke ich für interessante und entscheidende
Seminare und Workshops. Besonderer Dank gilt auch meiner Mentorin Professorin Müller-
Hilke; durch Ihre ehrlichen Worte und den wegweisenden Gesprächen konnte ich viel lernen
und wichtige Entscheidungen treffen.
Ein herzliches Dankeschön geht an Annemarie Struck, ohne die ich diese Arbeit wohl nie
beendet hätte. Sie haben mich in meiner dunkelsten Zeit wiederaufgebaut und mir den Mut
gegeben weiter zu machen.
Theresa Schwaiger meine liebe, dir danke ich für deine großartige Sicht auf die Dinge und
deine Gelassenheit, die mich inspiriert und so manches Mal vor der Verzweiflung bewahrt hat.
An meine Voltis in Wusterhusen geht ein großer Dank für Eure Unterstützung und die geistigen
Pausen sowie die Erdung, die ich immer wieder gebraucht habe. Dank dafür!
Meine lieben Freunde, euch danke ich für die Aufmunterungen, Auszeiten, Motivationsschübe
und Hilfe während der letzten Jahre! Ihr seid wunderbar.
Björn, dir danke ich von Herzen dafür, dass du mir den Rücken freigehalten, meine Launen
ertragen und mich trotzdem geheiratet hast. Du bist das wunderbarste was mir passiert ist.
Meine liebe Familie, ganz besonders meinen Eltern, danke ich für die Freiheit und
Unterstützung in jedweder Hinsicht. Ihr habt mir all das ermöglicht und dafür bin ich euch auf
ewig dankbar!