AZIMUTHAL SHEAR WAVE ANISOTROPY ANALYSIS, GUIDED IN TIME DOMAIN
Upload
independentCategory
view
5download
0
Journal of Hydrology (2008) 358, 35–45
ava i lab le a t www.sc iencedi rec t . com
journal homepage: www.elsevier .com/ locate / jhydrol
Fracture anisotropy characterization in crystallinebedrock using field-scale azimuthal self potentialgradient
DeBonne N. Wishart *, Lee D. Slater, Alexander E. Gates
Rutgers University, Department of Earth and Environmental Sciences, Newark, NJ 07102, USA
Received 8 November 2007; received in revised form 2 May 2008; accepted 17 May 2008
00do
*
19
KEYWORDSAzimuthal;Self potential;Anisotropy;Resistivity;Fracture;Heterogeneity
22-1694/$ - see front mattei:10.1016/j.jhydrol.2008.05
Corresponding author. Tel65.E-mail address: natwish@a
r ª 200.017
.: +1 97
ndromed
Summary The potential for the geophysical characterization of fractured rock bulkanisotropy using azimuthal self potential gradient (ASPG) method was investigated at fourfractured rock field sites in the New Jersey Highlands (NJH) province. A visual (from polarplots) and empirical (from linear regression of cross plots) correlation exists betweenASPG measurements and dominant fracture strike orientations mapped at three of thefour study sites, with the magnitude of the SP signal positively correlated to the numberof fractures (N) along the same azimuth. This result is consistent with recent electroki-netic theory that invokes a dependence of the streaming potential coupling coefficienton microgeometry in addition to hydraulic gradient. Based on local surface drainage pat-terns and regional fracture orientations, the direction of the positive lobe of the ASPG sig-nal appears indicative of the likely flow direction within fracture sets. Three repeatmeasurements at one site over a one year period consistently reproduced the ASPG lobesalong major and minor fracture sets, although the magnitude of the self potential variedalong the major strike set possibly due to variable rates of groundwater flow. WhereasASPG captured hydraulic-anisotropy at three of four sites, resistivity anisotropy only dom-inated azimuthal resistivity surveys (ARS) data at one site. Our results suggest that ASPG isa surprisingly simple, effective tool for characterization of fracture-dominated media. Inaddition to defining the fracture-induced hydraulic anisotropy, the direction of fracture-controlled flow is evident from the polarity of the SP signal.ª 2008 Elsevier B.V. All rights reserved.
8 Elsevier B.V. All rights reserved
3 353 5100; fax: +1 973 353
a.rutgers.edu (D. N. Wishart).
Introduction
Fractures and fracture zones in crystalline bedrock serve assources of clean groundwater, form potential pathways forthe transport of contaminants, and dictate the hydraulic
.
36 D.N. Wishart et al.
properties of crystalline rock. Quantification of fracturegeometry is therefore important in groundwater modeling.Information on the presence, extent, intensity, and direc-tion of fracturing is important to the development of regio-nal groundwater resources, and the design of remediationstrategies to combat contaminated groundwater. Key fea-tures that influence fluid flow via secondary porositythrough a fracture-dominated network include fracture ori-entation (directionality), fracture density, and interconnec-tivity (Sharma and Baranwal, 2005). Fracture/jointinterconnectivity is a function of the number of joint sec-tions controlled by orientation, length and density. Thehydrodynamics of the fracture flow system will approachthose in porous media if flow through the fracture networkis enhanced by high density and interconnectivity of frac-tures (Schmelling and Ross, 1989). The preferential fracturestrike orientation associated with the paleo-stress or pres-ent stress on the rock typically results in bulk anisotropy,whereas variable density or wide-aperture fractures domi-nating the flow network make it hydraulically-heteroge-neous. Anisotropy is therefore useful for defining bedrockfracture orientation, delineating likely field-scale flowdirections and developing models of flow and transport.Anisotropy, continuity, and directional connectivity in frac-ture systems are typically difficult to estimate from conven-tional joint/fracture studies at isolated outcrops (LaPointeand Hudson, 1985; Taylor and Flemming, 1988). It is possibleto evaluate local anisotropy in fractures surrounding a bore-hole using a borehole televiewer and related techniques,but techniques for larger scale characterization of bulk frac-ture anisotropy are lacking. Indeed, the complex geometryand distribution of fractures makes it difficult to use a singlemethod to map fracture-induced anisotropy, especiallywhere bedrock fractures are unexposed at the surface.
Such issues have encouraged geophysicists to explorehow electrical methods may be used to characterize bulkin situ fracture geometry (e.g. Taylor and Flemming,1988; Watson and Barker, 1999). In crystalline rock, electri-cal current and groundwater are both channeled throughthe fracture network. Groundwater exploration in fracturedrock aquifers using electric geophysical methods is there-fore well-established (e.g. Mota et al., 2004). The azimuthalresistivity survey (ARS) method, based on the injection of acontrolled electric current into the ground (Ritzi and Ando-lsek, 1992; Taylor and Flemming, 1988; Skjernaa andJørgensen, 1993), was developed as a tool for bulk fracturedrock anisotropy characterization. Previous authors showthat electrical anisotropy may be controlled by the prefer-ential fracture strike orientation (Busby, 2000; Watson andBarker, 1999). Electrical anisotropy is therefore dependenton the orientation of rock fractures and can be used to inferprincipal directions of hydraulic anisotropy (Watson andBarker, 1999). However, interpretation is hindered by thefact that (1) other factors (e.g. disseminated ore grains orclay veins) can impart an electrical anisotropy unrelatedto groundwater flow, and (2) electrical heterogeneity (e.g.due to variable fracture density or variation in overburdenlithology and thickness) can profoundly impact electricalresistivity.
Heterogeneity can be separated from anisotropy in anARS survey by using appropriate asymmetric array configura-tions. A square array was used by Hansen and Lane (1996) to
characterize anisotropy of fracture apertures and porosityin high-angle fractures and also by Lane et al. (1995) todetermine fracture orientation in crystalline rocks. Otherasymmetric arrays such as the Square array, Dipole-Equato-rial array (Semenov, 1975), T array, and the pole–dipoleArrow Type (AT) array (a modified T array) have beenadopted to distinguish electrical anisotropy due to a frac-ture network from electrical heterogeneity in the subsur-face (Bolshakov et al., 1995). The AT Array is particularlywell suited for quantifying heterogeneity versus anisotropy,having the highest sensitivity to electrical anisotropy (k) ofall ARS arrays, with a sensitivity of k5 compared to k for tra-ditional collinear (symmetric) arrays (Bolshakov et al.,1997).
Wishart et al. (2006), in a laboratory-scale physical mod-el study, proposed the azimuthal self potential gradient(ASPG) method as an alternative or complementary methodto ARS. ASPG voltages due to electrical currents induced bythe flow of groundwater through a fractured network aresensed as a function of azimuth and used to infer frac-ture-induced hydraulic anisotropy. In this paper, we expandon Wishart et al. (2006) by exploring the application of theASPG method for field-scale characterization of fracturedrock aquifers at sites where fracture orientations wereavailable from local outcrops. We present results demon-strating that the ASPG method proposed by Wishart et al.(2006) is an effective, simple geophysical method for quan-tifying bulk fracture-induced anisotropy in bedrockaquifers.
Self potential
Self potentials arise from multiple mechanisms including:(1) electro-diffusional effects due to gradients in the chem-ical potentials of charge carriers, (2) redox reactions andcoupled electron transport associated with metallic conduc-tors (geobattery effects), (3) thermoelectric coupling, and(4) the divergence of a streaming current density associatedwith fluid flow as of interest here. The electrokinetic effectresults from the relative displacement between the chargedmineral surface and the associated electrical double layer.A streaming current density is generated due to the dragof excess electrical charge in the diffuse layer, whilst anelectroosmotic contribution to fluid transport results froma viscous drag of pore water associated with displacementof electrical charge in an electric field. Coupling of the elec-trical (u) and pore fluid pressure (p) potentials is classicallyperformed via constitutive equations at the scale of arepresentative elemental volume (e.g. Ishido and Mizutani,1981; Morgan et al., 1989). The electrokinetic couplingcoefficient
C ¼ ouop
� �ð1Þ
a key electrochemical property of the double layer is re-lated to the zeta potential, a key electrochemical propertyof the double layer, via the Helmholtz–Smoluchowski equa-tion (in the absence of surface conductivity). However, thiscoupling coefficient is independent of the microgeometry ofthe porous medium and does not explain experimental data,for example, the strong increase in C with increasing perme-
Fracture anisotropy characterization in crystalline bedrock using field-scale azimuthal self potential gradient 37
ability in sandstone (Jouniaux and Pozzi, 1995a,b). In orderto address this limitation, Revil and Leroy (2004) and Revilet al. (2005) present a new formulation for the coupled con-stitutive equations, presented in Boleve et al. (2007) as
j ¼ rE � Q vu ð2Þu ¼ �KrH ð3Þ
where j is the electrical current density (in A m�2), u is theseepage velocity (m s�1), r is the electrical conductivity(S m�1) E = �$u is the electric field, H= dp/qfg is the changein hydraulic head (relative to hydrostatic H0), K is thehydraulic conductivity (m s�1) and Q v is the excess chargeof the diffuse layer per pore unit volume (C m�3) (qf is massdensity in kg m�3 and g is gravitation acceleration m s�2).This formulation neglects the electroosmotic contributionto the seepage velocity, which is valid when the only com-ponent of the electric field produced is that through elec-trokinetic coupling (Boleve et al., 2007).
Combining Eqs. (1)–(3) provides the following formula-tion of the streaming potential coefficient (Revil and Leroy,2004; Revil et al., 2005)
C ¼ �Q vk
rgf
; ð4Þ
where k (m2) is the intrinsic permeability and gf (in Pa s) isthe dynamic sheer viscosity. Expressing the streaming po-tential relative to hydraulic head (instead of pore fluid pres-sure) yields
C ¼ �Q vK
r: ð5Þ
Unlike in the classical Helmholtz–Smoluchowski formula-tions, the electrokinetic coupling coefficients derived in thistheory depend on the microgeometry of the porous mediumas evident by the appearance of k in Eq. (4) and K in Eq. (5).Such a dependence on microgeometry can describe previ-ously published experimental data (Jouniaux and Pozzi,1995a,b; Wishart et al., 2006) as well as the data we showin this paper. In contrast, earlier explanations for thedependence of C on k using the classical constitutive equa-tions had to invoke an indirect dependence on k based on as-sumed surface conductivity effects (Jouniaux and Pozzi,1995a,b). Importantly, Eqs. (1) and (2) clearly suggest a cor-relation between self potential anisotropy and hydraulicanisotropy associated with flow of pore water (the seepagevelocity u) that serves as the source of the electric current.We demonstrate here how this dependence can be exploitedfor the ASPG characterization of fracture-induced anisot-ropy in bedrock.
Recent hydrogeophysical applications based on the ‘elec-trokinetic SP effect’ include simulation of flow in geother-mal reservoirs (e.g. Ishido and Pritchett, 1999), evaluationof seepage from earthen dams (e.g. Rozycki et al., 2006),and observation of water flow towards a pumping well (Revilet al., 2003; Rizzo et al., 2004) to name a few examples.Wishart et al. (2006), in a laboratory study on a physicalscale model, demonstrated how the electrokinetic self po-tential mechanism may provide an opportunity to infer flowdirections and hydraulic anisotropy as a result of fluid flowwithin a fractured, anisotropic bedrock aquifer (Wishart etal., 2006). As fluid flows in fractured or porous media, con-
vective transport of charge in the electrical double layer re-sults in a streaming current density that is usually positive(depending on the polarity of the pH dependent surfacecharge) in the direction of flow. The divergence of thisstreaming current is the source of the electrokinetic poten-tial (u) that is proportional to the applied pore pressure gra-dient. Fig. 1 shows a schematic representing a conceptualunderstanding of the dependence of the streaming potentialon azimuth in a fractured, hydraulically anisotropic rocksystem as demonstrated in laboratory models by Wishartet al. (2006). The ASPG signal depends on the pore pressuregradient driving flow within fracture sets, as well as theinterconnected fracture density controlling K that controlsthe magnitude of the coupling coefficient (Eq. (5)). Wishartet al. (2006) showed that the polarity of the SP signal isindicative of the flow direction in fracture sets as expectedfrom theory (the positive lobe of the ASPG signal is in thedirection of flow and that SP anisotropy correlates well withhydraulic anisotropy). Wishart et al. (2006) also provide evi-dence of the expected proportionality between pore pres-sure gradient driving flow within a specific fracture systemand SP along the azimuth of that fracture set.
Field sites
The region of the New Jersey Highlands (NJH) Province (Fig.2) is underlain by fractured, folded, crystalline rocks of Mid-dle Proterozoic-age (Carswell and Rooney, 1976). Theserocks are Grenville-Age orthogneiss and paragneiss intrudedby granites and unconformably overlain by the Paleozoicconglomerates, sandstones, shales, and carbonates of theValley and Ridge Province (Volkert and Drake, 1998). Theextent and complexity of joints around faults and disconti-nuities in the NJH formed from regional tectonic activityinvolving (1) compression during the Proterozoic and Paleo-zoic and (2) extension during the Proterozoic and Mesozoic(Ratcliffe, 1980; Gates, 1998). Several episodes of tectonicoverprinting and the superimposition of some fault zonesoccurred during Post-Grenvillian orogenies. Faults observedin the NJH are vertical to steeply dipping. The region is pre-dominantly dissected mostly by northeast-trending, high-angle faults and a second set of less abundant northwest-trending faults (Fig. 2a). The two dominant regional jointsets strike at N40�E [040�] and N50�W [310�] (Fig. 2a). Thewater table in the NJH is highest in the spring and lowestin the fall or early winter with fluctuations in the regionalwater table occurring on the order of 0.2 m–2.0 m belowspring levels. The major source of groundwater for domes-tic, industrial, and municipal uses in Bergen, Passaic, andEssex counties is the unconfined fractured bedrock aquiferof the NJH. The extensive area is declared ‘‘environmen-tally-sensitive’’ and the region’s water resources are pro-tected by the Federal Government under the enactmentof the Highlands Preservation Act (2004).
The four NJH field sites are Back Beach Park (BB), PassaicCounty, Wawayanda State Park (WY), Sussex County, andAuthur Stanlick (AS) and Mahlon Dickerson (MD), MorrisCounty (Fig. 2). Representative fracture orientation datawere mapped from outcrops within a 100 m radius aroundthe surveyed field sites and site-specific fracture and jointdensity analyses were plotted on standard rose diagrams.
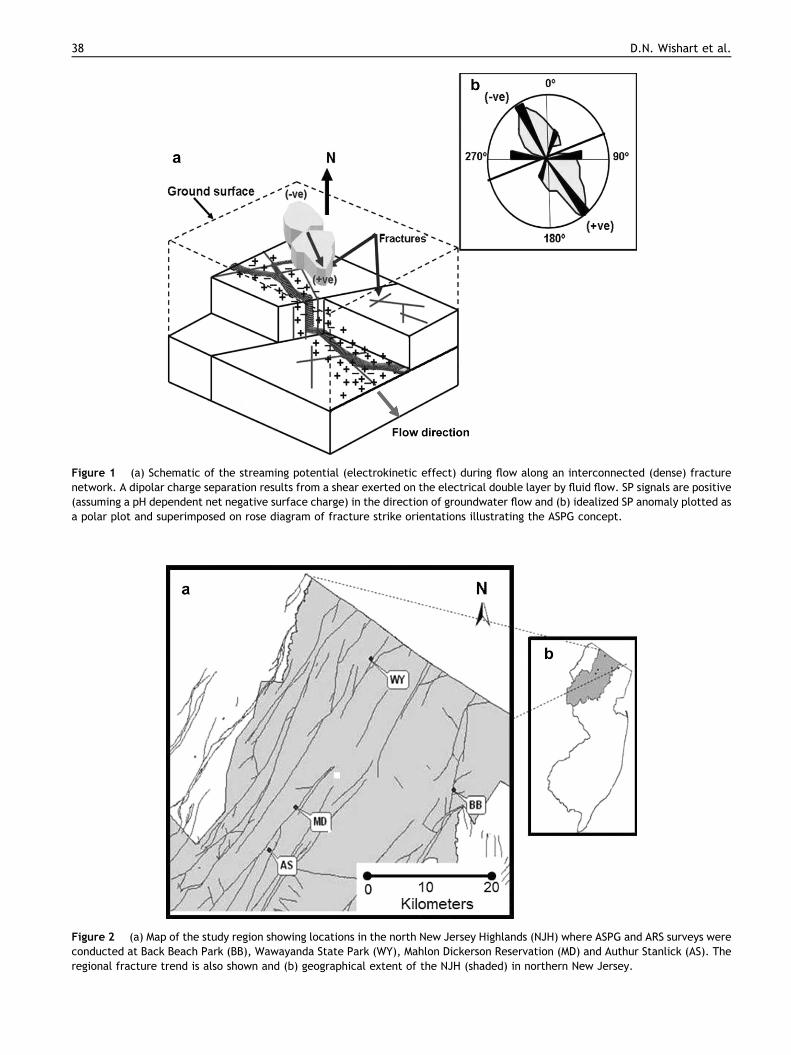
Figure 1 (a) Schematic of the streaming potential (electrokinetic effect) during flow along an interconnected (dense) fracturenetwork. A dipolar charge separation results from a shear exerted on the electrical double layer by fluid flow. SP signals are positive(assuming a pH dependent net negative surface charge) in the direction of groundwater flow and (b) idealized SP anomaly plotted asa polar plot and superimposed on rose diagram of fracture strike orientations illustrating the ASPG concept.
Figure 2 (a) Map of the study region showing locations in the north New Jersey Highlands (NJH) where ASPG and ARS surveys wereconducted at Back Beach Park (BB), Wawayanda State Park (WY), Mahlon Dickerson Reservation (MD) and Authur Stanlick (AS). Theregional fracture trend is also shown and (b) geographical extent of the NJH (shaded) in northern New Jersey.
38 D.N. Wishart et al.

Table 1 Electrical and hydraulic anisotropy characterization of bedrock fractures at four field sites in the New Jersey Highlands(NJH) Province
Site Fractureorientation(azimuth)
Fracturedensitya
(fractures/m)
O/Eratiob
(K)
Flowcharacterizationc
(Hydraulic)
Resistivitycharacterizationd
(Electrical)
BB 010�–030� 6 0.5 Anisotropic Anisotropic280�–290�
WY 300�–310� 3 0.36 Anisotropic Heterogeneous350�–010�050�–060�
MD 310�–320� 12 0.84 Anisotropic Heterogeneous050�–060�
AS 290�–300� 2 3.95 Heterogeneous Heterogeneous310�–320�010�–020�
a Fracture density based on 60 cm counting grid placed over fracture outcrops at field sites.b O/E ratio determined from a frequency domain analysis using a Discrete Fourier Transform (DFT) of the ‘odd and even harmonics’ of
the energy spectra associated with SP data sets.c Site hydraulic anisotropy characterization based on the energy spectra for SP data sets.d Site electrical resistivity anisotropy characterization based on comparison resistance curves measured between potential electrodes
MN1–MN2.
Fracture anisotropy characterization in crystalline bedrock using field-scale azimuthal self potential gradient 39
Lineament studies provided additional structural data to en-sure the continuous extension of the fracture systems fromthe outcrops to bedrock beneath covered areas where ASPGand ARS surveys were conducted so as to compensate forany inherent bias in structural data.
Average fracture density at the local outcrops mappedaround the sites ranged from a minimum of two fractures/meter at AS to a maximum of 12 fractures/meter at MD. Re-sults of these surveys are summarized in Table 1. Primaryfracture maxima trending 010�–030� and secondary maximaat 280�–290� are present at BB where a strong east–westset of closely-spaced, zonal joints dominate the north endof the site. Primary maxima are situated parallel to control-ling joints observed at outcrops along the eastern border ofthe site, approximately 40 m from the center of the array.Three fracture maxima were recorded for WY at 300�–310�, 050�–060� and 350�–010�. Strong and pervasive jointmaxima trend at 310�–320� and 050�–060� at MD. The frac-ture set that strikes at 300�–310� forms a well-developedand prominent joint set along the outcrops exposed to theeast side of the MD field site. The AS site is significantlymore structurally complex than the other sites mapped withthree fracture maxima: the primary set at 290�–300�, thesecondary set at 310�–320� and the third set at 010�–020�. At AS, a strongly-banded pyroxene-hornblende gneissintercalated with a calc-silicate-quartzite sequence impartsa strong anisotropy to the rock with orthogonal joints atoutcrops over an exposed mylonite zone. Less than 10% ofthe joints at the sites have dip angles shallower than 60�making inclination analysis unnecessary at each of the fieldsites.
Two-dimensional electrical resistivity and seismic refrac-tion surveys were employed to non-invasively estimate thedepth of overburden above the fractured bedrock at thefour sites. These geophysical surveys suggest that the
unconsolidated sediments (glacial till) overlying bedrockhave approximate thicknesses of 7 m at BB, 3 m at MD andWY, and 6 m at AS. The depth to the water table at BB(3 m) was resolved from radar profiles, whereas the depthto the water table at the WY, MD and AS was assumed fromadjoining lake levels to be 0.5 m below the ground surfaceas they are hydraulically-connected to the groundwatersystem.
Instrumentation and field procedure
The azimuthal array for asymmetric dipole (allowing fordistinction of anisotropy from heterogeneity) ASPG mea-surements consisted of 36 potential electrodes positionedin 4-in holes along two concentric circles [18 electrode posi-tions along each circle] flagged on the ground surface at 20�increments through 360� (Fig. 3a and b). The simple instru-mentation consisted of a survey wire connected to two cus-tom-made, non-polarizable PbCl–PbCl2 electrodes (basedon Petiau, 2000) kept a fixed distance apart and connectedto a precision multimeter (input impedance >10 MOhm)Magnetic north was determined with a Brunton compassand defined as the 0� azimuth for ASPG data. The distanceD between the radii of both circles (Fig. 3a and b) is one-third the radius of the outer circle (i.e. for diameters of24 m, 36 m and 42 m used at the three sites, D = 4 m, 6 m,and 7 m). Data for the 0� azimuth were collected with elec-trode one connected to the positive terminal on the voltme-ter, with electrode 28 connected to the negative terminal.ASPG measurements were then made as a function of azi-muth by rotating the array at 20� increments through 360�(Fig. 3a and b). Careful effort was made to relocate exactelectrode positions for three repeat surveys over a year per-iod at BB site. Daily electrode drift of less than 0.2 mV were
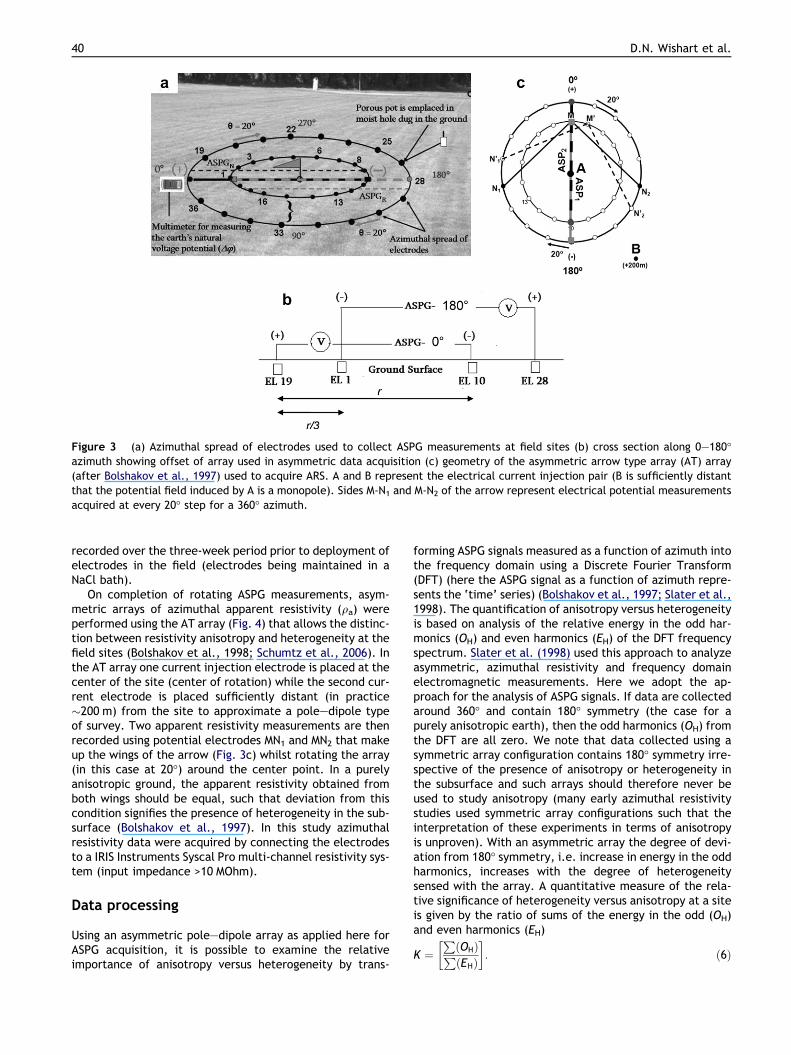
Figure 3 (a) Azimuthal spread of electrodes used to collect ASPG measurements at field sites (b) cross section along 0–180�azimuth showing offset of array used in asymmetric data acquisition (c) geometry of the asymmetric arrow type array (AT) array(after Bolshakov et al., 1997) used to acquire ARS. A and B represent the electrical current injection pair (B is sufficiently distantthat the potential field induced by A is a monopole). Sides M-N1 and M-N2 of the arrow represent electrical potential measurementsacquired at every 20� step for a 360� azimuth.
40 D.N. Wishart et al.
recorded over the three-week period prior to deployment ofelectrodes in the field (electrodes being maintained in aNaCl bath).
On completion of rotating ASPG measurements, asym-metric arrays of azimuthal apparent resistivity (qa) wereperformed using the AT array (Fig. 4) that allows the distinc-tion between resistivity anisotropy and heterogeneity at thefield sites (Bolshakov et al., 1998; Schumtz et al., 2006). Inthe AT array one current injection electrode is placed at thecenter of the site (center of rotation) while the second cur-rent electrode is placed sufficiently distant (in practice�200 m) from the site to approximate a pole–dipole typeof survey. Two apparent resistivity measurements are thenrecorded using potential electrodes MN1 and MN2 that makeup the wings of the arrow (Fig. 3c) whilst rotating the array(in this case at 20�) around the center point. In a purelyanisotropic ground, the apparent resistivity obtained fromboth wings should be equal, such that deviation from thiscondition signifies the presence of heterogeneity in the sub-surface (Bolshakov et al., 1997). In this study azimuthalresistivity data were acquired by connecting the electrodesto a IRIS Instruments Syscal Pro multi-channel resistivity sys-tem (input impedance >10 MOhm).
Data processing
Using an asymmetric pole–dipole array as applied here forASPG acquisition, it is possible to examine the relativeimportance of anisotropy versus heterogeneity by trans-
forming ASPG signals measured as a function of azimuth intothe frequency domain using a Discrete Fourier Transform(DFT) (here the ASPG signal as a function of azimuth repre-sents the ‘time’ series) (Bolshakov et al., 1997; Slater et al.,1998). The quantification of anisotropy versus heterogeneityis based on analysis of the relative energy in the odd har-monics (OH) and even harmonics (EH) of the DFT frequencyspectrum. Slater et al. (1998) used this approach to analyzeasymmetric, azimuthal resistivity and frequency domainelectromagnetic measurements. Here we adopt the ap-proach for the analysis of ASPG signals. If data are collectedaround 360� and contain 180� symmetry (the case for apurely anisotropic earth), then the odd harmonics (OH) fromthe DFT are all zero. We note that data collected using asymmetric array configuration contains 180� symmetry irre-spective of the presence of anisotropy or heterogeneity inthe subsurface and such arrays should therefore never beused to study anisotropy (many early azimuthal resistivitystudies used symmetric array configurations such that theinterpretation of these experiments in terms of anisotropyis unproven). With an asymmetric array the degree of devi-ation from 180� symmetry, i.e. increase in energy in the oddharmonics, increases with the degree of heterogeneitysensed with the array. A quantitative measure of the rela-tive significance of heterogeneity versus anisotropy at a siteis given by the ratio of sums of the energy in the odd (OH)and even harmonics (EH)
K ¼PðOHÞPðEHÞ
� �: ð6Þ
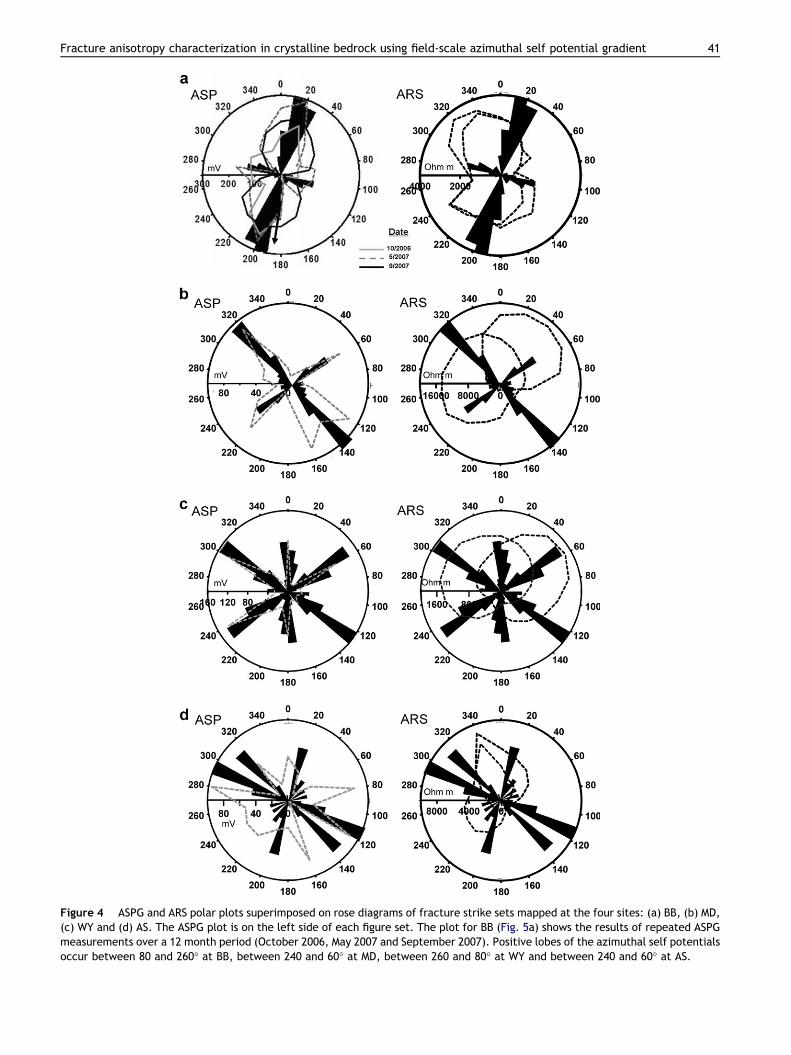
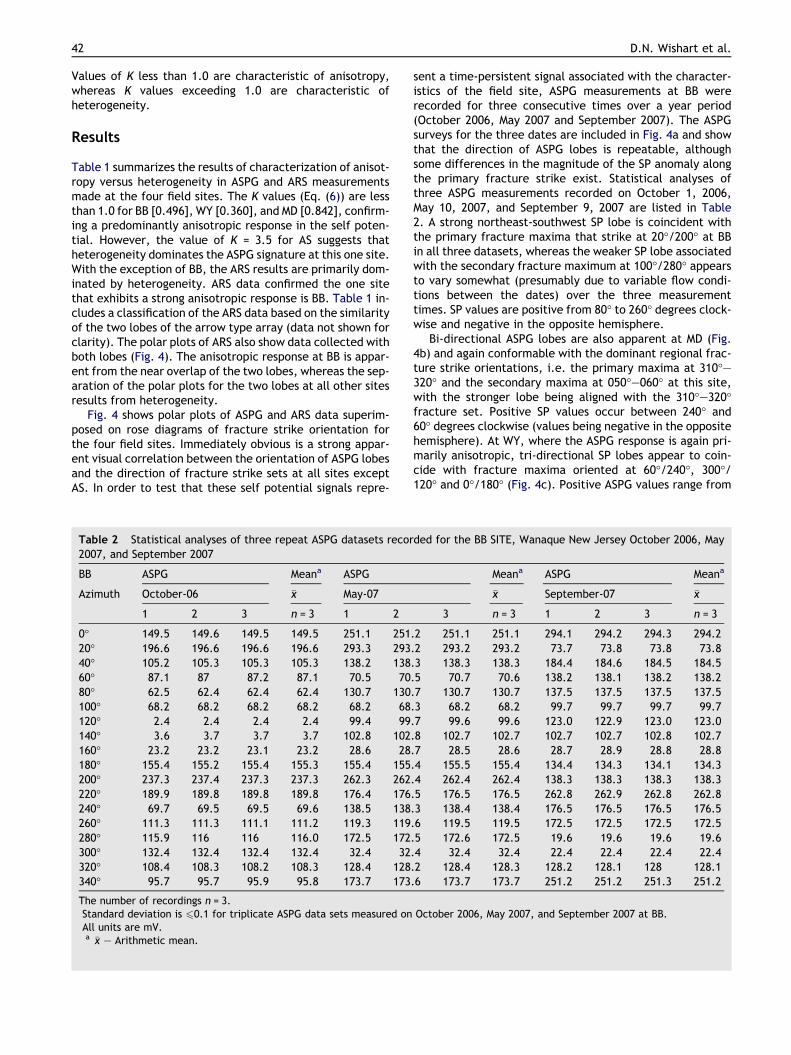
Figure 4 ASPG and ARS polar plots superimposed on rose diagrams of fracture strike sets mapped at the four sites: (a) BB, (b) MD,(c) WY and (d) AS. The ASPG plot is on the left side of each figure set. The plot for BB (Fig. 5a) shows the results of repeated ASPGmeasurements over a 12 month period (October 2006, May 2007 and September 2007). Positive lobes of the azimuthal self potentialsoccur between 80 and 260� at BB, between 240 and 60� at MD, between 260 and 80� at WY and between 240 and 60� at AS.
Fracture anisotropy characterization in crystalline bedrock using field-scale azimuthal self potential gradient 41
42 D.N. Wishart et al.
Values of K less than 1.0 are characteristic of anisotropy,whereas K values exceeding 1.0 are characteristic ofheterogeneity.
Results
Table 1 summarizes the results of characterization of anisot-ropy versus heterogeneity in ASPG and ARS measurementsmade at the four field sites. The K values (Eq. (6)) are lessthan 1.0 for BB [0.496], WY [0.360], and MD [0.842], confirm-ing a predominantly anisotropic response in the self poten-tial. However, the value of K = 3.5 for AS suggests thatheterogeneity dominates the ASPG signature at this one site.With the exception of BB, the ARS results are primarily dom-inated by heterogeneity. ARS data confirmed the one sitethat exhibits a strong anisotropic response is BB. Table 1 in-cludes a classification of the ARS data based on the similarityof the two lobes of the arrow type array (data not shown forclarity). The polar plots of ARS also show data collected withboth lobes (Fig. 4). The anisotropic response at BB is appar-ent from the near overlap of the two lobes, whereas the sep-aration of the polar plots for the two lobes at all other sitesresults from heterogeneity.
Fig. 4 shows polar plots of ASPG and ARS data superim-posed on rose diagrams of fracture strike orientation forthe four field sites. Immediately obvious is a strong appar-ent visual correlation between the orientation of ASPG lobesand the direction of fracture strike sets at all sites exceptAS. In order to test that these self potential signals repre-
Table 2 Statistical analyses of three repeat ASPG datasets recor2007, and September 2007
BB ASPG Meana ASPG
Azimuth October-06 �x May-07
1 2 3 n = 3 1 2
0� 149.5 149.6 149.5 149.5 251.1 25120� 196.6 196.6 196.6 196.6 293.3 29340� 105.2 105.3 105.3 105.3 138.2 13860� 87.1 87 87.2 87.1 70.5 7080� 62.5 62.4 62.4 62.4 130.7 130100� 68.2 68.2 68.2 68.2 68.2 68120� 2.4 2.4 2.4 2.4 99.4 99140� 3.6 3.7 3.7 3.7 102.8 102160� 23.2 23.2 23.1 23.2 28.6 28180� 155.4 155.2 155.4 155.3 155.4 155200� 237.3 237.4 237.3 237.3 262.3 262220� 189.9 189.8 189.8 189.8 176.4 176240� 69.7 69.5 69.5 69.6 138.5 138260� 111.3 111.3 111.1 111.2 119.3 119280� 115.9 116 116 116.0 172.5 172300� 132.4 132.4 132.4 132.4 32.4 32320� 108.4 108.3 108.2 108.3 128.4 128340� 95.7 95.7 95.9 95.8 173.7 173
The number of recordings n = 3.Standard deviation is 60.1 for triplicate ASPG data sets measured onAll units are mV.a �x – Arithmetic mean.
sent a time-persistent signal associated with the character-istics of the field site, ASPG measurements at BB wererecorded for three consecutive times over a year period(October 2006, May 2007 and September 2007). The ASPGsurveys for the three dates are included in Fig. 4a and showthat the direction of ASPG lobes is repeatable, althoughsome differences in the magnitude of the SP anomaly alongthe primary fracture strike exist. Statistical analyses ofthree ASPG measurements recorded on October 1, 2006,May 10, 2007, and September 9, 2007 are listed in Table2. A strong northeast-southwest SP lobe is coincident withthe primary fracture maxima that strike at 20�/200� at BBin all three datasets, whereas the weaker SP lobe associatedwith the secondary fracture maximum at 100�/280� appearsto vary somewhat (presumably due to variable flow condi-tions between the dates) over the three measurementtimes. SP values are positive from 80� to 260� degrees clock-wise and negative in the opposite hemisphere.
Bi-directional ASPG lobes are also apparent at MD (Fig.4b) and again conformable with the dominant regional frac-ture strike orientations, i.e. the primary maxima at 310�–320� and the secondary maxima at 050�–060� at this site,with the stronger lobe being aligned with the 310�–320�fracture set. Positive SP values occur between 240� and60� degrees clockwise (values being negative in the oppositehemisphere). At WY, where the ASPG response is again pri-marily anisotropic, tri-directional SP lobes appear to coin-cide with fracture maxima oriented at 60�/240�, 300�/120� and 0�/180� (Fig. 4c). Positive ASPG values range from
ded for the BB SITE, Wanaque New Jersey October 2006, May
Meana ASPG Meana
�x September-07 �x
3 n = 3 1 2 3 n = 3
.2 251.1 251.1 294.1 294.2 294.3 294.2
.2 293.2 293.2 73.7 73.8 73.8 73.8
.3 138.3 138.3 184.4 184.6 184.5 184.5
.5 70.7 70.6 138.2 138.1 138.2 138.2
.7 130.7 130.7 137.5 137.5 137.5 137.5
.3 68.2 68.2 99.7 99.7 99.7 99.7
.7 99.6 99.6 123.0 122.9 123.0 123.0
.8 102.7 102.7 102.7 102.7 102.8 102.7
.7 28.5 28.6 28.7 28.9 28.8 28.8
.4 155.5 155.4 134.4 134.3 134.1 134.3
.4 262.4 262.4 138.3 138.3 138.3 138.3
.5 176.5 176.5 262.8 262.9 262.8 262.8
.3 138.4 138.4 176.5 176.5 176.5 176.5
.6 119.5 119.5 172.5 172.5 172.5 172.5
.5 172.6 172.5 19.6 19.6 19.6 19.6
.4 32.4 32.4 22.4 22.4 22.4 22.4
.2 128.4 128.3 128.2 128.1 128 128.1
.6 173.7 173.7 251.2 251.2 251.3 251.2
October 2006, May 2007, and September 2007 at BB.
Fracture anisotropy characterization in crystalline bedrock using field-scale azimuthal self potential gradient 43
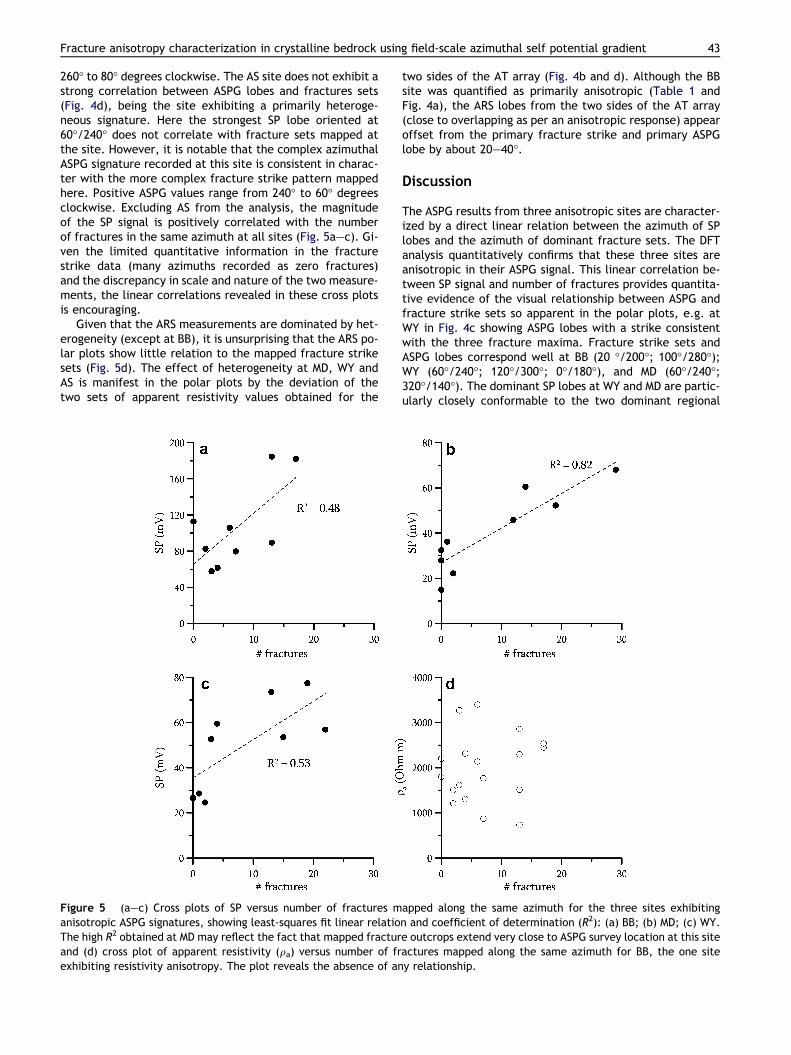
260� to 80� degrees clockwise. The AS site does not exhibit astrong correlation between ASPG lobes and fractures sets(Fig. 4d), being the site exhibiting a primarily heteroge-neous signature. Here the strongest SP lobe oriented at60�/240� does not correlate with fracture sets mapped atthe site. However, it is notable that the complex azimuthalASPG signature recorded at this site is consistent in charac-ter with the more complex fracture strike pattern mappedhere. Positive ASPG values range from 240� to 60� degreesclockwise. Excluding AS from the analysis, the magnitudeof the SP signal is positively correlated with the numberof fractures in the same azimuth at all sites (Fig. 5a–c). Gi-ven the limited quantitative information in the fracturestrike data (many azimuths recorded as zero fractures)and the discrepancy in scale and nature of the two measure-ments, the linear correlations revealed in these cross plotsis encouraging.
Given that the ARS measurements are dominated by het-erogeneity (except at BB), it is unsurprising that the ARS po-lar plots show little relation to the mapped fracture strikesets (Fig. 5d). The effect of heterogeneity at MD, WY andAS is manifest in the polar plots by the deviation of thetwo sets of apparent resistivity values obtained for the
Figure 5 (a–c) Cross plots of SP versus number of fractures manisotropic ASPG signatures, showing least-squares fit linear relatioThe high R2 obtained at MD may reflect the fact that mapped fracturand (d) cross plot of apparent resistivity (qa) versus number of frexhibiting resistivity anisotropy. The plot reveals the absence of an
two sides of the AT array (Fig. 4b and d). Although the BBsite was quantified as primarily anisotropic (Table 1 andFig. 4a), the ARS lobes from the two sides of the AT array(close to overlapping as per an anisotropic response) appearoffset from the primary fracture strike and primary ASPGlobe by about 20–40�.
Discussion
The ASPG results from three anisotropic sites are character-ized by a direct linear relation between the azimuth of SPlobes and the azimuth of dominant fracture sets. The DFTanalysis quantitatively confirms that these three sites areanisotropic in their ASPG signal. This linear correlation be-tween SP signal and number of fractures provides quantita-tive evidence of the visual relationship between ASPG andfracture strike sets so apparent in the polar plots, e.g. atWY in Fig. 4c showing ASPG lobes with a strike consistentwith the three fracture maxima. Fracture strike sets andASPG lobes correspond well at BB (20 �/200�; 100�/280�);WY (60�/240�; 120�/300�; 0�/180�), and MD (60�/240�;320�/140�). The dominant SP lobes at WY and MD are partic-ularly closely conformable to the two dominant regional
apped along the same azimuth for the three sites exhibitingn and coefficient of determination (R2): (a) BB; (b) MD; (c) WY.e outcrops extend very close to ASPG survey location at this siteactures mapped along the same azimuth for BB, the one sitey relationship.
44 D.N. Wishart et al.
fracture strike sets at N40�E [040�] and N50�W [310�] andpresumably result from a structural influence on groundwa-ter flow at these sites. As detailed in Wishart et al. (2006),we attribute this correlation to the electrokinetic SP effectassociated with flow within the fractures. From Eqs. (4) and(5) the strength of the ASPG anomaly at a given azimuth isassumed to depend on [1] the hydraulic gradient drivingflow through dense joints (fractures), and [2] the microge-ometry of the fractured rock and the resulting permeability(controlled by density of interconnected fractures) alongthat azimuth. ASPG results at three times separated by �6month intervals at BB (Fig. 4a) are remarkably consistentalthough the magnitude of the SP anomaly in the directionof the dominant fracture strike set (20�/200�) differs. Wetentatively suggest that this relates to variable seepagevelocity along the direction of this fracture set.
The ARS data shows an electrically-anisotropic signaturepossibly related to the fracture sets only at the BB site (Fig.4a). Fig. 4b and d shows that ARS is strongly impacted byheterogeneity at the other three sites. Consequently, thereis no correspondence between azimuthal apparent resistiv-ity and fracture maxima at MD, WY and AS. Furthermore,there is no quantifiable correlation between the azimuthof resistivity lobes and the azimuth of fracture density setsat BB (Fig. 5a).
Our field studies are consistent with both theory invokinga dependence of the streaming potential coupling coeffi-cient on microgeometry (Revil and Leroy, 2004; Revil etal., 2005) and tank model studies (Wishart et al., 2006) inthat ASPG lobes coincide with the orientation of dominantfracture sets. Wishart et al. (2006) also showed that the po-sitive lobe of any pair of ASPG measurements is aligned inthe direction of flow within the fracture set. This result isconsistent with electrokinetic theory when the mineral sur-face contains a net negative charge such that the diffuseEDL has a net positive charge (i.e. an excess of cations)(Fig. 1). We should therefore expect the positive lobe ofthe pair of ASPG lobes aligning with fracture sets to be inthe direction of groundwater flow i.e. down the hydraulicgradient. Unfortunately, the hydraulic head distributionwithin the fractured aquifer at these sites is unknown,which also prevents estimation of the streaming potentialcoupling coefficient at the field sites. However, surfacedrainage patterns provide some clues as to the likely domi-nant regional hydraulic gradient within the aquifer. At BB,the Wanaque River adjoining the site flows from north tosouth. The positive SP lobe for the dominant (20�/200�)fracture set is indeed the 200� lobe as expected if the sur-face drainage pattern is generally indicative of the regionalhydraulic gradient in the aquifer. Similar consistencies areobserved for the MD and WY sites (Fig. 4b and c). The posi-tive SP lobes falling in the more northern hemisphere of theASPG plots is consistent with the general regional flowdirection to the north that would be inferred from the trendof the Wawayanda Lake, nearby adjacent lakes, the Waway-anda River, and other nearby streams that flow to the north-east. Thus the field datasets reported here appear tofurther support the concept that the polarity of the SP lobescan be used to infer the flow directions within fracture sets.Unlike the other three sites, ASPG data do not correlate wellwith mapped fracture orientation data at AS (Fig. 4d). Asnoted earlier, the AS site is structurally complex and frac-
ture orientation mapping from outcrop analysis wasdifficult.
Conclusions
We have provided field-scale evidence to support the labo-ratory findings of Wishart et al. (2006) that ASPG is an effec-tive tool for the characterization of bulk anisotropy infractured rock aquifers. The visual correspondence betweenmultiple SP lobes and multiple strike sets (most notably atMD, Fig. 5b) suggests a surprisingly high sensitivity to frac-ture-induced hydraulic anisotropy. A significant linear rela-tionship between SP signal and number of fractures alongthe same azimuth was observed at three of the four studysites, consistent with recent electrokinetic theory that in-vokes a dependence of the streaming potential couplingcoefficient on microgeometry via permeability. We also findevidence that the polarity of the SP lobes indicates thedirection of groundwater flow within fracture sets as previ-ously proven in laboratory-scale physical models (Wishart etal., 2006). Tests at one site show that the ASPG anomaly isreproduced at three times over a one year period, althoughthe magnitude of the SP along the direction of dominantstrike varies. We assume this temporal variation relates tochanges in flow rates within the fractures driven by variablehydraulic gradients. This opens up the possibility of extend-ing the ASPG method as a tool for monitoring flow rates infractured rock aquifers, as suggested by Wishart et al.(2006) who noted that the ASPG along the azimuth of a frac-ture set should be linearly dependent on the hydraulic gra-dient driving flow in that direction. Finally, we note that theASPG technique is a very simple and inexpensive method toapply in the field, even when compared to the ARS geophys-ical technique, and appears to offer significant potential forthe hydrogeophysical characterization of fracture-domi-nated media.
Acknowledgements
Financial support for this work provided by the New JerseyWater Resources Institute (NJWRRI) Grant is gratefullyacknowledged by the authors. We thank New Jersey StateGeologist Richard Volkert for assistance with the selectionof the field sites and the provision of structural and geologicdata. Andre Bolden (Rutgers-Newark) assisted with fielddata acquisition. Excellent review comments provided byAndre Revil (Colorado School of Mines) and John Lane (Uni-ted States Geological Survey) greatly improved the qualityof this manuscript.
References
Bolshakov, D.K., Modin, I.N., Pervago, E.V., Shevnin, V.A., 1995.Anisotropy effects investigations by resistivity method in someinhomogeneous media. In: 57th Meeting, European Associationof Exploration Geophysicists, Extended Abstracts, 95, PO34.
Bolshakov, D.K., Modin, I.N., Pervago, E.V., Shevnin, V.A., 1997.Separation of anisotropy and inhomogeneity influence by thespectral analysis of azimuthal resistivity diagrams. In: Proceed-ings of the 3rd EEGS-ES Meeting, Aarhus, Denmark, September1997.
Fracture anisotropy characterization in crystalline bedrock using field-scale azimuthal self potential gradient 45
Bolshakov, D.K., Modin, I.N., Pervago, E.V., Shevnin, V.A., 1998.New step in anisotropy studies: arrow-type array. In: Proceed-ings of 4th EEGS-ES Meeting in Barcelona, Spain, September1998.
Boleve, A., Revil, A., Janod, F., Mattiuzzo, J.L., Jardani, A., 2007.Forward modeling and validation of a new formulation tocompute self-potential signals associated with ground waterflow. Hydrology and Earth System Sciences 11, 1661–1671.
Busby, J.P., 2000. The effectiveness of azimuthal apparent resis-tivity as a method for determining fracture strike orientations.Geophysical Prospecting 48, 677–695.
Carswell, L.D., Rooney, J.G., 1976. Summary of Geology andGroundwater Resources of Passaic County, New Jersey: Trenton,New Jersey, US Geological Survey, Water Resources Investiga-tions Report 76-75, 47 p.
Gates, A.E., 1998. Early compression and late dextral transpressionwithin the Grenvillian event of the Hudson Highlands, NY, USA.In: Sinha, A.K. (Ed.), Basement Tectonics 13. Kluwer AcademicPublishers, Dordrecht, The Netherlands, pp. 85–98.
Hansen Jr., B.P., Lane, J.W., 1996. Orientation and characteristicsof fractures in crystalline bedrock determined by surface andborehole geophysical surveys, Millville and Uxbridge, Massachu-setts. In: Bell, R.S., Cramer, M.H. (Eds.), Symposium on theApplication of Geophysics to Engineering and EnvironmentalProblems, Keystone, Colorado, April 28–May 2, 1996, Proceed-ings: Wheat Ridge, Colorado, Environmental and EngineeringGeophysical Society, pp. 927–940.
Ishido, T., Mizutani, H., 1981. Experimental and theoretical basis ofelectrokinetic phenomena in rock–water systems and its appli-cations to geophysics. Journal of Geophysical Research 86 (B3),1763–1777.
Ishido, T., Pritchett, J.W., 1999. Numerical simulation of electro-kinetic potentials associated with subsurface fluid flow. Journalof Geophysical Research 104 (B7), 15247–15259.
Jouniaux, L., Pozzi, J.P., 1995a. Permeability dependence ofstreaming potential in rocks for various fluid conductivities.Geophysical Research Letters 22 (4), 485–488.
Jouniaux, L., Pozzi, J.P., 1995b. Streaming potential and perme-ability of saturated sandstones under triaxial stress – conse-quences for electrotelluric anomalies prior to earthquakes.Journal of Geophysical Research 100 (10), 10197–10209.
LaneJr., J.W.,Haeni,F.P.,Watson,W.M.,1995.Useofa square-arraydirect current resistivity method to detect fractures in crystallinebedrock in New Hampshire. Ground Water 33 (3), 476–485.
LaPointe, P.R., Hudson, J.A., 1985. Characterization and interpre-tation of rock mass joint patterns. Geological Society of AmericaSpecial Paper 199, 37.
Morgan, F.D., Williams, E.R., Madden, T.R., 1989. Streamingpotential properties of westerly granite with applications.Journal of Geophysical Research 94, 12,449–12,461.
Mota, R., Monteiro Santos, F.A., Mateus, A., Marques, F.O., Goncal-ves, M.A., Figueras, J., Amaral, H., 2004. Granite fracturing andincipient pollution beneatha recent landfill facility as detectedbygeoelectric surveys. Journal of Applied Geophysics 57, 11–22.
Petiau, G., 2000. Second generation of lead–lead chloride elec-trodes for geophysical applications. Pure and Applied Geophysics157, 357–382.
Ratcliffe, N.M., 1980. Brittle faults (Ramapo fault) and phylloniticductile shear zones in the basement rocks of the Ramapo seismiczones, New York and New Jersey, and their relationship to
current seismicity. In: Manspeizer, W. (Ed.), Field Studies ofNew Jersey Geology and Guide to Field Trips: 52nd AnnualMeeting, Newark, NJ, Newark College of Arts and Sciences,Rutgers University.
Revil, A., Naudet, V., Nouzaret, J., Pessel, M., 2003. Principles ofelectrography applied to self potential electrokinetic source andhydrogeological applications. Water Resources Research 39 (5),1114. doi:10.1029/2001WR000916.
Revil, A., Leroy, P., 2004. Governing equations for ionic transport inporous shales. Journal of Geophysical Research 109 (B03208).doi:10.1029/2003JB002755.
Revil, A., Leroy, P., Titov, K., 2005. Characterization of transportproperties of argillaceous sediments: application to the Callovo-Oxfordian argillite. Journal of Geophysical Research 110(B06202), 1–18. doi:10.1029/2004JB003442.
Ritzi, R.W., Andolsek, R.H., 1992. Relation between anisotropictransmissivity and azimuthal resistivity surveys in shallow,fractured, carbonate flow systems. Ground Water 30, 774–780.
Rizzo, E., Suski, B., Revil, A., Straface, B., Troisi, S., 2004. Self-potential signals associated with pumping tests experiments.Journal of Geophysical Research 109 (B10203), 1–14.doi:10.1029/2004JB003049.
Rozycki, A., Ruiz Fonticiella, J.M., Cuadra, A., 2006. Detection andevaluation of horizontal fractures in earth dams using the self-potential method. Engineering Geology 82, 145–153.
Schumtz, M., Andrieux, P., Bobachev, A., Montoroi, J., Nasri, S.,2006. Azimuthal resistivity soundings over a steeply dippinganisotropic formation: a case history in central Tunisia. Journalof Applied Geophysics 60 (3–4), 213–224.
Schmelling, S.G., Ross, R.R., 1989. Contaminant transport infractured media: models for decision makers, EPA SuperfundIssue Paper, EPA/540/4-89/004.
Semenov, A.S., 1975. Rock anisotropy and electrical field peculiar-ities in anisotropic media. Ser. Geol. and Geography (24), 40–47, Vestnik of Leningrad University, 40-47 (In Russian).
Sharma, S.P., Baranwal, V.C., 2005. Delineation of groundwater-bearing fracture zones in a hard rock area integrating very lowfrequency electromagnetic and resistivity data. Journal ofApplied Geophysics 57, 155–166.
Skjernaa, L., Jørgensen, N.O., 1993. Detection of local fracturessystems by azimuthal resistivity surveys: examples from southNorway. Memoirs of the 24th Congress of International Associ-ation of Hydrogeologists, 662–671.
Slater, L.D., Sandberg, S.K., Jankowski, M., 1998. Survey designprocedures and data processing techniques applied to the EMazimuthal resistivity method. Journal of Environmental andEngineering Geophysics 3, 167–177.
Taylor, R.W., Flemming, A.H., 1988. Characterizing jointed systemsby azimuthal resistivity surveys. Ground Water 26, 464–474.
Volkert, R.A., Drake Jr., A.A. 1998. Geochemistry and stratigraphicrelations of Middle Proterozoic rocks of the New Jersey High-lands, US Geological Survey Professional Paper 1565-C.
Watson, K.A., Barker, R.D., 1999. Differentiating anisotropy andlateral effects using offset Wenner azimuthal resistivity sound-ings. Geophysics 64, 739–745.
Wishart, D.N., Slater, L.D., Gates, A.E., 2006. Self potentialimproves characterization of hydraulically-active fractures fromazimuthal geoelectrical measurements. Geophysical ResearchLetters 33, 17314. doi:10.1029/2006GL027092.
Copyright © 2022 FDOKUMEN