Fractional Counts - The Simulation of Low Probability Events
10
Fractional Counts - The Simulation of Low Probability Events R.L. Coldwell Department of Physics, University of Florida, Gainesville, FL 32611 [email protected] G. P. Lasche, and A. Jadczyk Constellation Technology Corporation, 7887 Bryan Dairy Road, Suite 100, Largo, FL 33777 [email protected] [email protected] Abstract. The code RobSim has been added to Ro b W in 1 . It simulates spectra resulting from gamma rays striking an array of detectors made up of different components. These are frequently used set coincidence and anti-coincidence windows that decide if individual events are part of the signal. The first problem is the construction of the detector. Then owing to statistical nature of the responses of these elements there is a random nature in the response that can be taken into account by including fractional counts in the output spectrum somewhat complicating the error analysis as Poisson statistics are no longer applicable. The “dos” version of the code presented here along with a very brief set of directions in the readme.txt is in simul.zip . INTRODUCTION The code began life as BSIMUL. It was built to aid in the construction of the BGO shielded GRAD 2 detector that was eventually used in an Antarctic balloon borne observation of supernova 1987A 3 . Fractional Counts http://www.phys.ufl.edu/~coldwell/const/denton2/talk2.htm 1 of 10 23-Dec-10 16:26
-
Upload
ronininstitute -
Category
Documents
-
view
0 -
download
0
Transcript of Fractional Counts - The Simulation of Low Probability Events

Fractional Counts - The Simulation of Low ProbabilityEvents
R.L. Coldwell
Department of Physics, University of Florida, Gainesville, FL [email protected]
G. P. Lasche, and A. Jadczyk
Constellation Technology Corporation, 7887 Bryan Dairy Road, Suite100, Largo, FL 33777 [email protected] [email protected]
Abstract. The code RobSim has been added to RobWin1. It simulatesspectra resulting from gamma rays striking an array of detectors made up ofdifferent components. These are frequently used set coincidence andanti-coincidence windows that decide if individual events are part of thesignal. The first problem is the construction of the detector. Then owing tostatistical nature of the responses of these elements there is a random naturein the response that can be taken into account by including fractional countsin the output spectrum somewhat complicating the error analysis as Poissonstatistics are no longer applicable. The “dos” version of the code presentedhere along with a very brief set of directions in the readme.txt is in
simul.zip.
INTRODUCTION
The code began life as BSIMUL. It was built to aid in the construction of
the BGO shielded GRAD2 detector that was eventually used in an
Antarctic balloon borne observation of supernova 1987A3.
Fractional Counts http://www.phys.ufl.edu/~coldwell/const/denton2/talk2.htm
1 of 10 23-Dec-10 16:26

FIGURE 1. Sample detector similar to that used by the NEAR-X and Gamma Raygroup at NASA Goddard.
Fractional Counts http://www.phys.ufl.edu/~coldwell/const/denton2/talk2.htm
2 of 10 23-Dec-10 16:26

The simulation works by assigning materials and detector properties to aseries of zones. There are five zones in figure 1, which is the detector asdrawn on the screen. Output spectra are assigned by almost a computerlanguage. After an input photon has been completely absorbed or has leftthe detector, the energy absorbed in zone n is assigned the name En. For thespectrum consisting of the energy detected in NaI, zone 3, the directionlines are the name of the spectrum on one line followed by E3 always onthe next.
The anti-coincidence spectrum direction lines are a bit more complex
NAIAC.SPE3 if not (10 < E1+E2 < 10000) or (50 < E4 < 10500)
The first line is the name of the file in which the spectrum will be placed.The second line tells the code to add the probability of energy absorbed inE3 to the spectrum only if the energies in zones 1, 2 and 4 are "essentially"zero. The code spreads the energies according to the input full width athalf-maximum and input photo-peak response function. The above set ofdirections with 50000 input photons produce the results shown in figure 2in 2-5 minutes on a laptop computer with a 366 MHz Celeron processor.
Robwin
Fractional Counts http://www.phys.ufl.edu/~coldwell/const/denton2/talk2.htm
3 of 10 23-Dec-10 16:26

FIGURE 2. Input photon is 2614 KeV. Top spectrum is NaI alone. Bottomspectrum is NaI in anti-coincidence with any event in plastic or BGO.
COMPUTATIONAL METHOD
The code follows photons through matter. These photons have 3 possibleinteractions. They can be completely absorbed in a single encounter, theycan Compton scatter and they can engage in pair production. Theexperimental cross sections for these three reactions are stored for mostmaterials. In addition it is possible to use information about the density andcharge dependence to deduce the relationship of non-stored cross sections
to stored ones4 -- this last has been implemented only for HgI2 at this time.
Electrons are not followed they are absorbed with the photons.
simplot
simplot2
The detector in figure 1 is defined by a set of lines in rho and z. Asubroutine returns the material present at any value of (rho,z). The basicmethod is to calculate the distance to the nearest defining line in rho and inz. If the material on both sides of the line is the same, the distance isextended to the next line. Stored experimental cross sections are then used
to find the probability of interaction. A random number generator5
determines if, where, and how the photon interacts. If the interaction isphoto absorption, the photon tracking stops. If the interaction is a Comptonscattering, its direction is changed randomly in accordance with the Klein-
Nishina formula6. Pair production emits both a pair of 511 KeV photons
and a series of bremsstrahlung7 photons. The raw and anti-coincidencespectra are given in figure 2 for 2614 KeV input photons. The same spectrafor 6 MeV photons are shown in figure 3.
Fractional Counts http://www.phys.ufl.edu/~coldwell/const/denton2/talk2.htm
4 of 10 23-Dec-10 16:26

FIGURE 3. Input photon is 6000 KeV. Top spectrum is NaI alone. Bottomspectrum is NaI in anti-coincidence with any event in plastic or BGO.
The largest peak in this spectrum is the single escape peak in which allthe incoming energy except that in one of the 511 KeV gamma raysproduced by a pair production event is absorbed in the NaI in zone 3. Theanti-coincidence spectrum is still a very clean representation of the case inwhich all of the energy is absorbed in the NaI, but in the presence ofbackground from other sources, it is not as easily found as is the firstescape peak.
FRACTIONAL COUNTS
The full width at half-maximum response of each detector is used tocalculate the probability of the energy absorbed in the combination of zonesdescribing a detector being reported as occurring in any one of the channelsranging over the full photo-response of the detector. The sums of theseprobabilities over many input photons are the spectra plotted in figures 2and 3. This could have been accomplished, however, by reporting the
Fractional Counts http://www.phys.ufl.edu/~coldwell/const/denton2/talk2.htm
5 of 10 23-Dec-10 16:26

energy in the single channel corresponding to it, followed by a convolutionwith the appropriate photo-response function. The earlier versions of thecode did exactly this, although the convolution step was frequently notmade.
Fractional counts begin to be worthwhile in simulating the attempts madeto suppress the photo-peak in figure 3. The following method for isolatingpeaks from high-energy lines is due to the NASA Goddard X and Gamma-
Ray group8. The lines defining the spectrum are
NaiCoBgo.sp 2 //NaI in coincidence with 511 or 1022 MeV in BGO //inanti-coincidence with a plastic front shield//Coin window for BGO is 491 KeV to 531 KeV//and from 1002 KeV to 1042E3 if (491 < E1 + E2 < 531) or (1002 < E1 + E2 < 1042) not (10 < E4 <10000)
FIGURE 4. Input photon is 6000 KeV. Spectrum is NaI in coincidencewith a 511 or 1022 KeV photon in the BGO and nothing detected in theplastic.
The spectrum reported in figure 4 is
The k refers to the type of spectrum or equivalently to the set of zones inwhich energy E has been absorbed. The subscript i refers to energy ofchannel i. The probability P includes the spread due to the photo-responseof the detector and also that in the other zones. That is the probability is
Fractional Counts http://www.phys.ufl.edu/~coldwell/const/denton2/talk2.htm
6 of 10 23-Dec-10 16:26

calculated that the event would be vetoed or accepted for every event. Anenergy higher than the window around the 511 could be accepted owing tothe fact that the detector in charge of vetoing responds as though it were inthe proper range or it could be vetoed even though it is in the correct range.This is a straightforward calculation from the photo-response functions ineach zone on an event by event basis, but it is not one that would be easy tomake after the events are summed. If there were an energy for which aseries of unlikely events need to conspire such as two or more detectorsresponding at the edge of their usual response functions, this event will beseen as a small value of Pk for many photons in equation 1. It is of course
possible to randomly select a single channel in which to report a 1. In thiscase it will take 10000 photons to see a single channel with an average
probability of 10-4.
The photo-response function of the BGO in figure 4 is that of the NaI,which is approximately that of either peak in figure 4. Actually BGO isusually not that energy sensitive. Quadrupling the width of the peak for theBGO leaves "essentially" the same spectrum but divides the strength of thelines by about 4. This is plotted on a logarithmic scale in figure 5.
FIGURE 5. Input photon is 6000 KeV. Spectrum is NaI in coincidencewith a 511 or 1022 KeV photon in the BGO -- wide response function --and nothing detected in the plastic.
The vertical lines in figure 5 are the error estimates in the determination ofthe spectrum. They are the error of the entire curve and not that of theindividual points.
Fractional Counts http://www.phys.ufl.edu/~coldwell/const/denton2/talk2.htm
7 of 10 23-Dec-10 16:26

STANDARD DEVIATION OF THE SPECTRUM
Include zero as a perfectly acceptable probability. Define Pj to be the
probability reported for channel i of the k th spectrum after the j the photonhas been stopped or exited the system. Then denote the average value of thei'th channel in the k'th spectrum as <P>. The standard deviation estimatebegins with the definition
Where j is a sum over the N photons tracked by RobSim.
The variance in this value is defined by
Owing to the fact that the P's are totally uncorrelated, it is assumed thatthe off diagonal terms average to zero so that
This means that
The standard deviation in <P> is the square root of this quantity divided
Fractional Counts http://www.phys.ufl.edu/~coldwell/const/denton2/talk2.htm
8 of 10 23-Dec-10 16:26
by the number of observations N
The spectrum of course is N times <P>. Thus the standard deviation inthe spectrum is
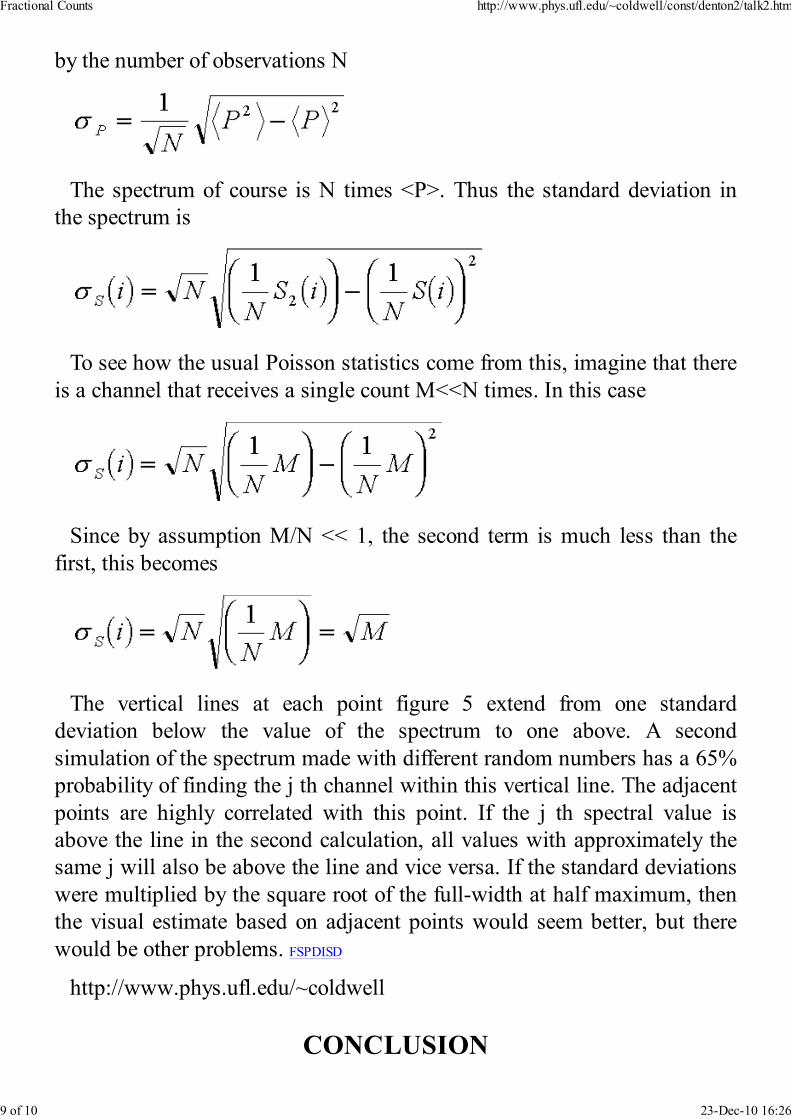
To see how the usual Poisson statistics come from this, imagine that thereis a channel that receives a single count M<<N times. In this case
Since by assumption M/N << 1, the second term is much less than thefirst, this becomes
The vertical lines at each point figure 5 extend from one standarddeviation below the value of the spectrum to one above. A secondsimulation of the spectrum made with different random numbers has a 65%probability of finding the j th channel within this vertical line. The adjacentpoints are highly correlated with this point. If the j th spectral value isabove the line in the second calculation, all values with approximately thesame j will also be above the line and vice versa. If the standard deviationswere multiplied by the square root of the full-width at half maximum, thenthe visual estimate based on adjacent points would seem better, but therewould be other problems. FSPDISD
http://www.phys.ufl.edu/~coldwell
CONCLUSION
Fractional Counts http://www.phys.ufl.edu/~coldwell/const/denton2/talk2.htm
9 of 10 23-Dec-10 16:26

The code RobSim estimates a detector response function . Typicallythis is calculated by repeatedly allowing a photon of energy E' to enter thesystem of zones. The code allows a user to imagine detectors connected toeach of a number of various zones and to use these to find the "best"possible response function. An attempt has been made to make this processas fast and intuitive as possible.
REFERENCES
1 R.L. Coldwell, "Robust Fitting of Spectra to Splines with VariableKnots", CP475, Application of Accelerators in Research and Industry,edited by J.L. Duggan and I.L Morgan AIP Press, New York (1999)
2 A.C. Rester, R.B. Piercey, G. Eichhorn, R.L. Coldwell, J. McKisson,D.W. Ely, H.M. Mann and D.A. Jenkins, "The GRAD Gamma-RaySpectrometer", IEEE Trans. on Nucl. Sci. 33, 732 (1986).
3 A.C. Rester, R.L. Coldwell, F.E. Dunnam, G. Eichhorn, J.I. Trombka, R.Starr and G.P. Lasche, "Gamma-Ray Observations on Supernova 1987Afrom Antarctica", Ap. J. 342, L71 (1989).
4 Robley D. Evans, The Atomic Nucleus, McGraw Hill, 1955 pp.686-715
5 R.L. Coldwell, "Correlational Defects in the Standard IBM 360 RandomNumber Generator and the Classical Ideal Gas Correlation Function",, J.Computational Phys. 14, 223(1974)
6 E.U. Condon, "X Rays",in Handbook of Physics, ed E.U. Condon andHugh Odishaw, McGraw-Hill (1958)pp 7-128-7-129
7 R.L. Coldwell, M.W. Katoot, and P.S. Haskins, "Interactions of
Multi-Mev Gamma Rays with Matter", pp. 125-131,High EnergyRadiation Background in Space, AIP Conference Proceedings #186,Edited by A.C. Rester and J.I. Trombka (AIP, New York, 1989)
8 L.G. Evans, R. Starr, J.I. Trombka, T. McClanahan, S.H. Bailey, I.Mikheeva, J. Bhangoo, J. Bruckner, and J.O. Goldsten, "Calibration ofthe NEAR Gamma-Ray Spectrometer", Icarus (in press)
Fractional Counts http://www.phys.ufl.edu/~coldwell/const/denton2/talk2.htm
10 of 10 23-Dec-10 16:26