FORM TALYSURF INTRA Operator's Handbook - Taylor Hobson
190
P.O. Box 36, New Star Road, Thurmaston Lane, Leicester LE4 9JQ England. . Telephone +44 (0)116 2763771 Fax +44 (0)116 2741350 Website www.taylor-hobson.com K505/46 FORM TALYSURF INTRA Operator’s Handbook
-
Upload
khangminh22 -
Category
Documents
-
view
0 -
download
0
Transcript of FORM TALYSURF INTRA Operator's Handbook - Taylor Hobson
P.O. Box 36, New Star Road, Thurmaston Lane, Leicester LE4 9JQ England. .Telephone +44 (0)116 2763771 Fax +44 (0)116 2741350
Website www.taylor-hobson.com
K505/46
FFOORRMM TTAALLYYSSUURRFF
IINNTTRRAA
OOppeerraattoorr’’ss HHaannddbbooookk

Publication K505/46 Issue 1.5, June 2002Handbook revision applicableto software Version 1 issue 5
CONTENTS
Issue 1.5, June 2002 Page i
PageSAFETY............................................................................... 1
SPECIFICATIONS.............................................................. 5
SETTING-UP..................................................................... 11
DESCRIPTION.................................................................. 17
OPERATION ..................................................................... 67
PARAMETER DEFINITIONS AND THEORY............... 81
ACCESSORIES ............................................................... 127
GLOSSARY..................................................................... 161
APPENDIX A Data Exchange Protocol Conversion....... 179
CUSTOMER SERVICES ................................................ 185

CONTENTS
Page ii Issue 1.5, June 2002
SAFETY
Issue 1.5, June 2002 Page 1
WARNINGS
Battery ChargingUse only the batteries (249/36) and the battery charger(265/943) supplied by Taylor Hobson Limited, in accordancewith the manufacturer’s instructions. Using unsuitable batterycharging equipment may result in an explosion and causeinjury and damage.
Battery Short CircuitDo not place a battery in a container that also has metalobjects that may cause a short circuit. (e.g. do not carry abattery in a pocket that also contains coins or other metalobjects). If the battery is short-circuited, an internal fuse willblow. This will render the battery useless.
Instrument StorageIf the instrument is to be unused or stored for more than oneweek, the batteries must be removed.
DisposalBatteries can present an environmental hazard. Therefore:Remove the batteries before disposing of a Traverse Unit or aProcessor Control Module. The batteries can be returned toTaylor Hobson Limited for safe disposal.
SAFETY
Page 2 Issue 1.5, June 2002
CAUTIONS
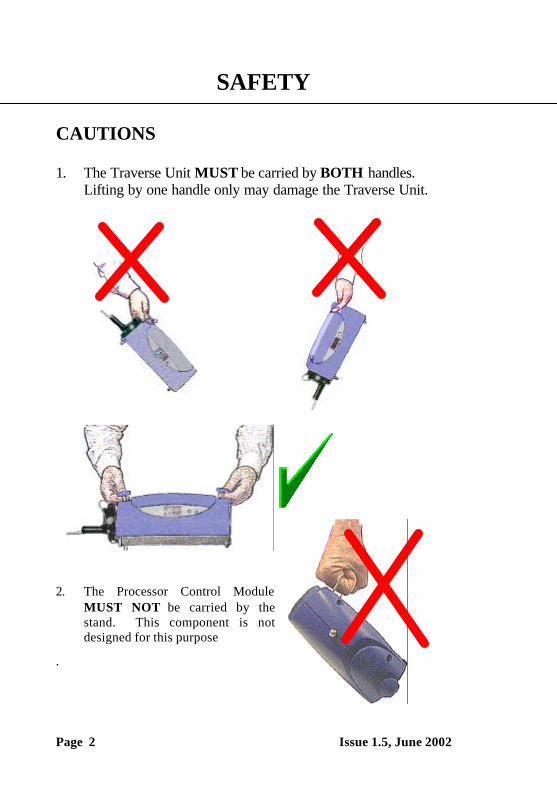
1. The Traverse Unit MUST be carried by BOTH handles.Lifting by one handle only may damage the Traverse Unit.
2. The Processor Control ModuleMUST NOT be carried by thestand. This component is notdesigned for this purpose
.
SAFETY
Issue 1.5, June 2002 Page 3
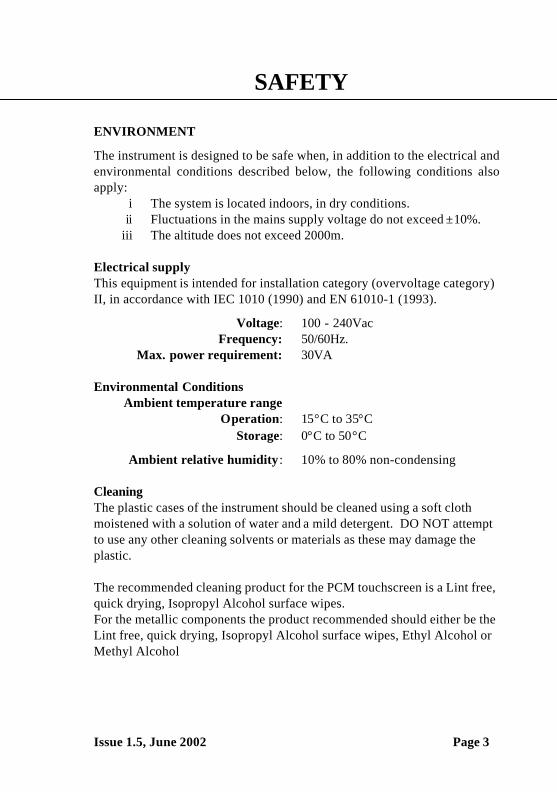
ENVIRONMENT
The instrument is designed to be safe when, in addition to the electrical andenvironmental conditions described below, the following conditions alsoapply:
i The system is located indoors, in dry conditions.ii Fluctuations in the mains supply voltage do not exceed ±10%.
iii The altitude does not exceed 2000m.
Electrical supplyThis equipment is intended for installation category (overvoltage category)II, in accordance with IEC 1010 (1990) and EN 61010-1 (1993).
Voltage: 100 - 240VacFrequency: 50/60Hz.
Max. power requirement: 30VA
Environmental Conditions Ambient temperature range
Operation: 15°C to 35°C Storage: 0°C to 50°C
Ambient relative humidity : 10% to 80% non-condensing
CleaningThe plastic cases of the instrument should be cleaned using a soft clothmoistened with a solution of water and a mild detergent. DO NOT attemptto use any other cleaning solvents or materials as these may damage theplastic.
The recommended cleaning product for the PCM touchscreen is a Lint free,quick drying, Isopropyl Alcohol surface wipes.For the metallic components the product recommended should either be theLint free, quick drying, Isopropyl Alcohol surface wipes, Ethyl Alcohol orMethyl Alcohol
SAFETY
Page 4 Issue 1.5, June 2002
SPECIFICATION
Issue 1.5, June 2002 Page 5
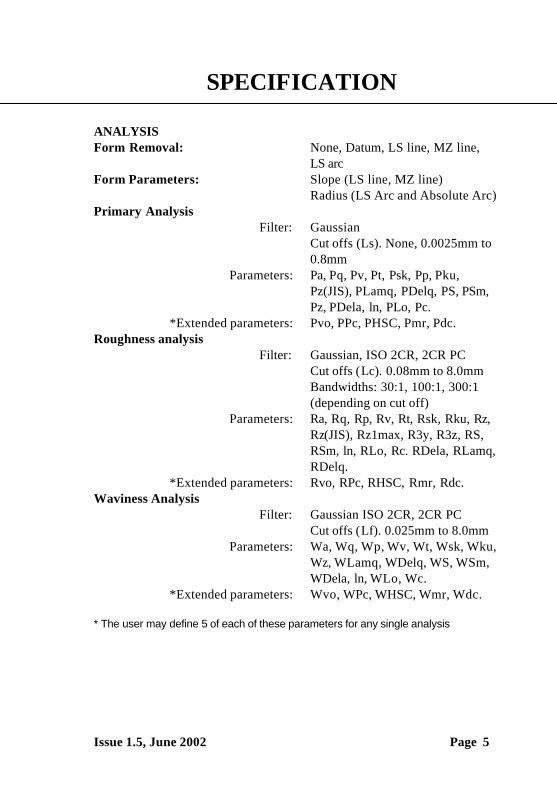
ANALYSISForm Removal: None, Datum, LS line, MZ line,
LS arcForm Parameters: Slope (LS line, MZ line)
Radius (LS Arc and Absolute Arc)Primary Analysis
Filter: GaussianCut offs (Ls). None, 0.0025mm to0.8mm
Parameters: Pa, Pq, Pv, Pt, Psk, Pp, Pku,Pz(JIS), PLamq, PDelq, PS, PSm,Pz, PDela, ln, PLo, Pc.
*Extended parameters: Pvo, PPc, PHSC, Pmr, Pdc.Roughness analysis
Filter: Gaussian, ISO 2CR, 2CR PCCut offs (Lc). 0.08mm to 8.0mmBandwidths: 30:1, 100:1, 300:1(depending on cut off)
Parameters: Ra, Rq, Rp, Rv, Rt, Rsk, Rku, Rz,Rz(JIS), Rz1max, R3y, R3z, RS,RSm, ln, RLo, Rc. RDela, RLamq,RDelq.
*Extended parameters: Rvo, RPc, RHSC, Rmr, Rdc.Waviness Analysis
Filter: Gaussian ISO 2CR, 2CR PCCut offs (Lf). 0.025mm to 8.0mm
Parameters: Wa, Wq, Wp, Wv, Wt, Wsk, Wku,Wz, WLamq, WDelq, WS, WSm,WDela, ln, WLo, Wc.
*Extended parameters: Wvo, WPc, WHSC, Wmr, Wdc.
* The user may define 5 of each of these parameters for any single analysis

SPECIFICATION
Page 6 Issue 1.5, June 2002
Rk AnalysisFilter: Gaussian
Cut offs (Lc). 0.08mm to 8.0mmBandwidths: 30:1, 100:1, 300:1(depending on cut off)
Parameters: Rk, Mr1, Mr2, Rpk, Rvk, A1, A2.R&W Analysis
A and B cutoffs: ISO standard values from for0.02/0.1mm to 0.5/2.5mm anduser entered values up toA=5mm, B=25mm.
Parameters: Pt, R, AR, Rx, W, AW, Wx,Wte, SR, SAR, SW, SAW
INSTRUMENT (M112/2936)
Traverse (measuring) length: 0.1mm to 50mm (0.004in to1.97in)
Run up distance required: 0.3mm (0.01in) max. Straightness (using 1mm range conical diamond stylus):
Form best fit straight line: 0.3µm over 50mm(12µin over1.97in)
0.2 over any 20mm(0.78µin over any0.78in).
Inclination best fit straight line: + 35 degrees(Range referred to straightnessdatum)
Accuracy of slope measurement: within 3% of measured angle(Ra less than 0.1µm)
Form best fit circular arc (P+V): 0.25µm/9.5mm (10µin/0.37in)on calibration ball
Radius (min 1mm, max 1000mm): within 2% at 1mm,0.04% at 12.5-28mm0.2% at 1000mm
Parameter measurement height: within 2% +6nm(peak parameters only)
SPECIFICATION
Issue 1.5, June 2002 Page 7
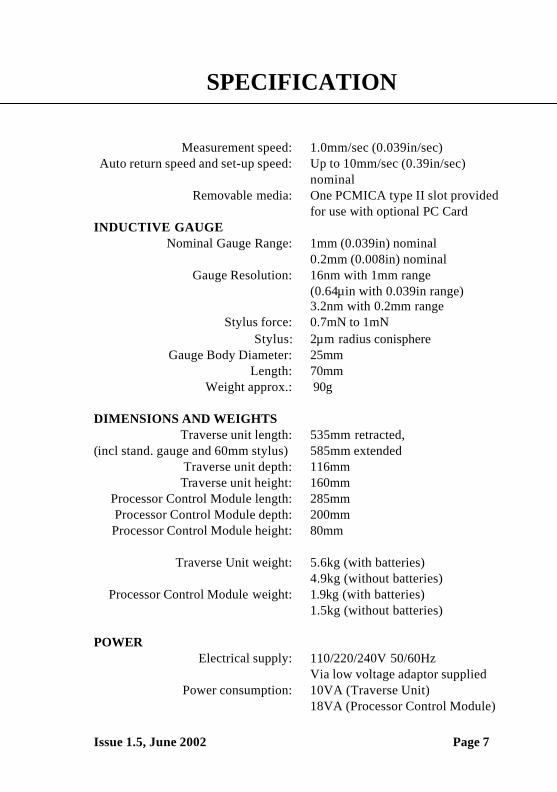
Measurement speed: 1.0mm/sec (0.039in/sec) Auto return speed and set-up speed: Up to 10mm/sec (0.39in/sec)
nominalRemovable media: One PCMICA type II slot provided
for use with optional PC CardINDUCTIVE GAUGE Nominal Gauge Range: 1mm (0.039in) nominal
0.2mm (0.008in) nominal Gauge Resolution: 16nm with 1mm range
(0.64µin with 0.039in range)3.2nm with 0.2mm range
Stylus force: 0.7mN to 1mNStylus: 2µm radius conisphere
Gauge Body Diameter: 25mmLength: 70mm
Weight approx.: 90g
DIMENSIONS AND WEIGHTSTraverse unit length: 535mm retracted,
(incl stand. gauge and 60mm stylus) 585mm extendedTraverse unit depth: 116mmTraverse unit height: 160mm
Processor Control Module length: 285mmProcessor Control Module depth: 200mmProcessor Control Module height: 80mm
Traverse Unit weight: 5.6kg (with batteries)4.9kg (without batteries)
Processor Control Module weight: 1.9kg (with batteries)1.5kg (without batteries)
POWERElectrical supply: 110/220/240V 50/60Hz
Via low voltage adaptor suppliedPower consumption: 10VA (Traverse Unit)
18VA (Processor Control Module)
SPECIFICATION
Page 8 Issue 1.5, June 2002
Batteries (optional): 6V NiMH rechargeableCharger (optional): For three batteries, charge time
two hoursBattery life: two hours
INFRA RED COMMUNICATIONRange: 1m
Angular range: + 20°
CALIBRATION ARTEFACTFor use on 60mm long stylus arms: Precision Tungsten Carbide
ball nominally 25mm diameter
For use on 120mm long stylus arms: Ball nominally 44mm diameter
Stylus details
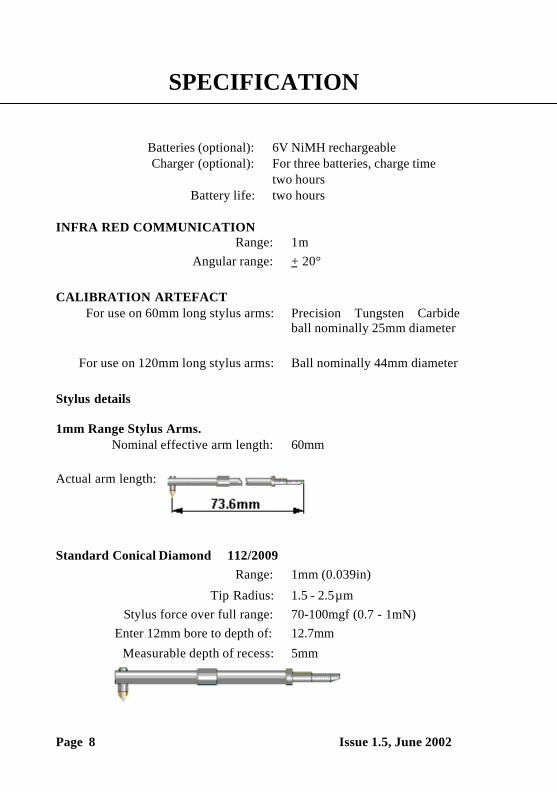
1mm Range Stylus Arms.Nominal effective arm length: 60mm
Actual arm length:
Standard Conical Diamond 112/2009Range: 1mm (0.039in)
Tip Radius: 1.5 - 2.5µmStylus force over full range: 70-100mgf (0.7 - 1mN)
Enter 12mm bore to depth of: 12.7mm
Measurable depth of recess: 5mm
SPECIFICATION
Issue 1.5, June 2002 Page 9
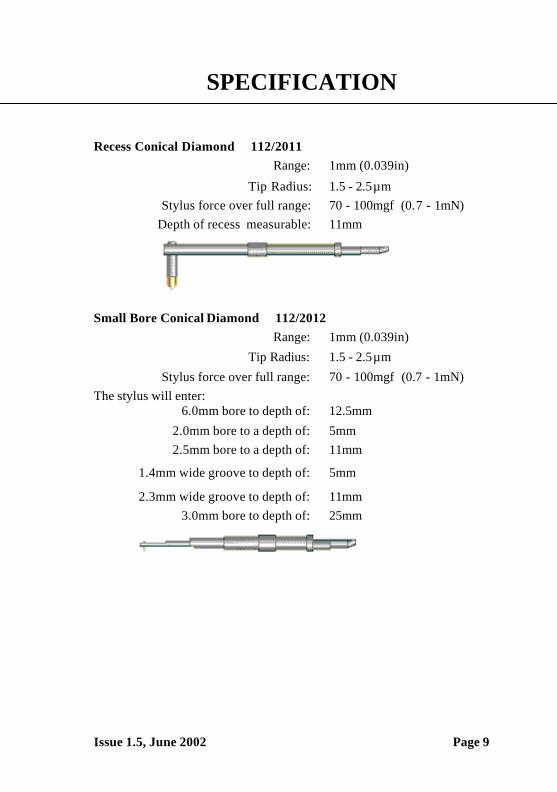
Recess Conical Diamond 112/2011Range: 1mm (0.039in)
Tip Radius: 1.5 - 2.5µmStylus force over full range: 70 - 100mgf (0.7 - 1mN)
Depth of recess measurable: 11mm
Small Bore Conical Diamond 112/2012Range: 1mm (0.039in)
Tip Radius: 1.5 - 2.5µm
Stylus force over full range: 70 - 100mgf (0.7 - 1mN)The stylus will enter:
6.0mm bore to depth of: 12.5mm
2.0mm bore to a depth of: 5mm2.5mm bore to a depth of: 11mm
1.4mm wide groove to depth of: 5mm
2.3mm wide groove to depth of: 11mm3.0mm bore to depth of: 25mm

SPECIFICATION
Page 10 Issue 1.5, June 2002
Chisel Edge Diamond Stylus Arm 112/2013Range: 1mm (0.039in)
Chisel Edge Tip: 2.5µm x 0.9µmStylus force over full range: 70 - 100mgf (0.7 - 1mN)
The stylus will enter 12mm boreto a depth of: 12.7mm
2mm Range Arm With Sapphire Ball Stylus (Cannot be used with aGuard Nosepiece).
Nominal effective arm length: 120mm
Actual arm length:
Standard Ball Stylus 112/2010Range: 2mm (0.078in)
Ball radius: 0.5mm ± 0.125µmStylus force over full range: 1.5 - 2.0 gf (15 – 20N)Measurable depth of recess: 11mm
SETTING UP
Issue 1.5, June 2002 Page 11
SETTING UP THE INSTRUMENT
Unpacking the Instrument
Initial installation is carried out by a service engineer, or a representative,of Taylor Hobson Limited. PLEASE DO NOT UNPACK YOURINSTRUMENT, OR ASSOCIATED PRODUCTS, UNLESS WITHPRIOR AGREEMENT WITH A SERVICE ENGINEER ORREPRESENTATIVE OF TAYLOR HOBSON LIMITED.
Siting the instrument
The overall accuracy of measurement results will be influenced byenvironmental conditions, particularly; draughts, vibration and the rate atwhich the ambient temperature changes. The choice of location depends onthe application requirement. However, to ensure that the optimumperformance is achieved, wherever possible, the instrument hardwareshould be installed with consideration given to the surroundings in which itwill operate.
The following items must be considered when siting the instrument;
Draughts
Draughts and airborne vibration should be avoided particularlywhen measuring in the skidless mode. Avoid placing theinstrument in draughts or directly under air conditioning vents.
For particularly critical applications it is often beneficial to coverthe instrument to minimise the effects of air movement andairborne vibration.
Temperature Gradients
Avoid siting the instrument in areas that have a very rapidtemperature gradient, as in the case of being near windows orskylights where sunlight may fall on the instrument.
SETTING UP
Page 12 Issue 1.5, June 2002
Areas that experience temperature gradients of over 2°C/hour arenot ideal for the measurement of precise form. For themeasurement of surface texture parameters, a higher value can betolerated (in the order of 5°C/hour).
Vibration
Vibration is particularly detrimental for the measurement ofsurface texture. It is essential that a good solid table, with anti-vibration mountings, is provided for applications in potentially“noisy” environments. The Taylor Hobson Instrument desk withanti-vibration mounts is recommended.
Power Supply-Mains Operation
It is important that a clean power supply should be provided to theinstrument. If in doubt, many computer peripheral dealers cansupply a suitable Un-interruptible Power Supply (U.P.S.). Acomplete U.P.S. system for the instrument can be obtained fromTaylor Hobson Limited.
Hardware Installation
Table
A strong stable mounting, such as an instrument desk, is requiredto support the instrument (particularly when a column and stand isincluded). With the instrument desk in the required position, usethe adjustable feet on the table to bring the table level. A bubblelevel should be used to assist the operation and check the result.
CAUTION
The base and column, together, weigh a maximum of 136 Kg (299lbs). If the column and base are being used, the table must becapable of safely supporting this weight plus any otheraccessories.
SETTING UP
Issue 1.5, June 2002 Page 13
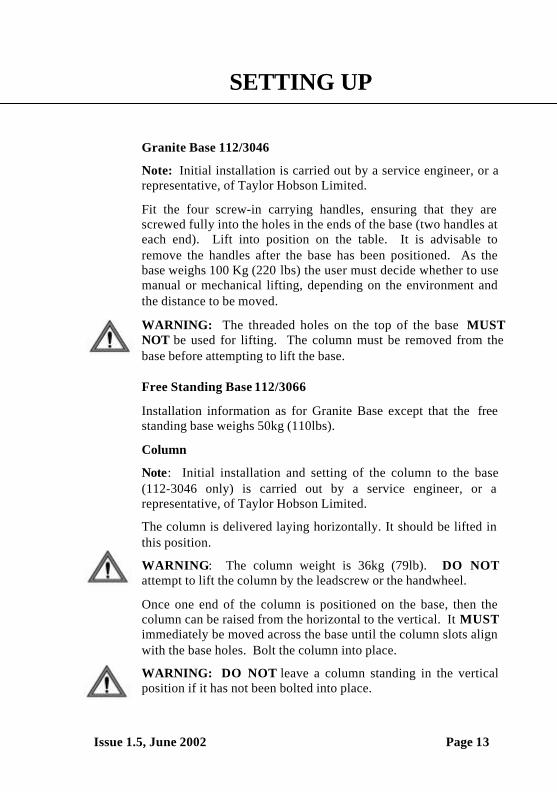
Granite Base 112/3046
Note: Initial installation is carried out by a service engineer, or arepresentative, of Taylor Hobson Limited.
Fit the four screw-in carrying handles, ensuring that they arescrewed fully into the holes in the ends of the base (two handles ateach end). Lift into position on the table. It is advisable toremove the handles after the base has been positioned. As thebase weighs 100 Kg (220 lbs) the user must decide whether to usemanual or mechanical lifting, depending on the environment andthe distance to be moved.
Free Standing Base 112/3066
Installation information as for Granite Base except that the freestanding base weighs 50kg (110lbs).
Column
Note: Initial installation and setting of the column to the base(112-3046 only) is carried out by a service engineer, or arepresentative, of Taylor Hobson Limited.
The column is delivered laying horizontally. It should be lifted inthis position.
WARNING: The column weight is 36kg (79lb). DO NOTattempt to lift the column by the leadscrew or the handwheel.
Once one end of the column is positioned on the base, then thecolumn can be raised from the horizontal to the vertical. It MUSTimmediately be moved across the base until the column slots alignwith the base holes. Bolt the column into place.
WARNING: DO NOT leave a column standing in the verticalposition if it has not been bolted into place.
WARNING: The threaded holes on the top of the base MUSTNOT be used for lifting. The column must be removed from thebase before attempting to lift the base.
SETTING UP
Page 14 Issue 1.5, June 2002
The user must decide whether to use manual or mechanical lifting,depending on the environment and the distance to be moved.
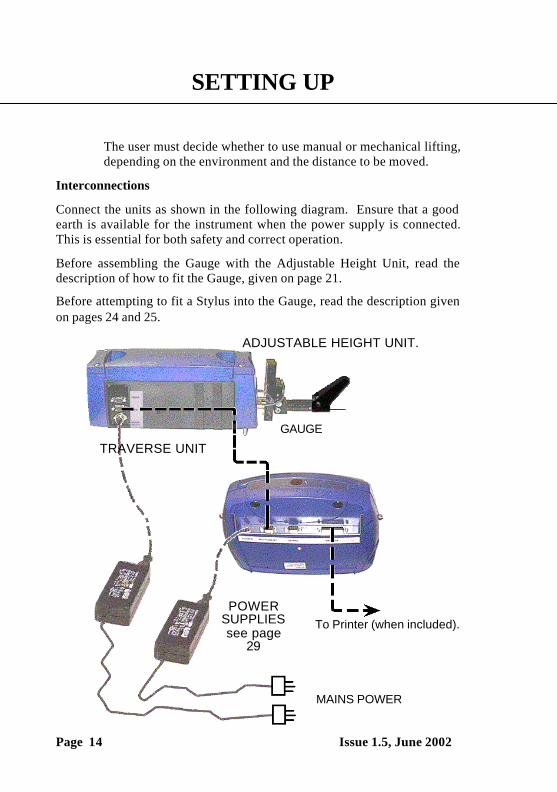
Interconnections
Connect the units as shown in the following diagram. Ensure that a goodearth is available for the instrument when the power supply is connected.This is essential for both safety and correct operation.
Before assembling the Gauge with the Adjustable Height Unit, read thedescription of how to fit the Gauge, given on page 21.
Before attempting to fit a Stylus into the Gauge, read the description givenon pages 24 and 25.
MAINS POWER
POWERSUPPLIESsee page
29
To Printer (when included).
TRAVERSE UNIT
GAUGE
ADJUSTABLE HEIGHT UNIT.
SETTING UP
Issue 1.5, June 2002 Page 15
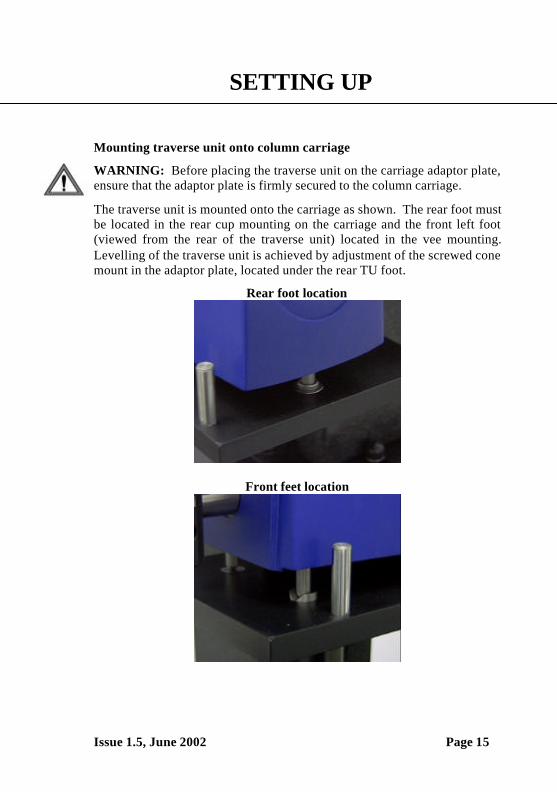
Mounting traverse unit onto column carriage
WARNING: Before placing the traverse unit on the carriage adaptor plate,ensure that the adaptor plate is firmly secured to the column carriage.
The traverse unit is mounted onto the carriage as shown. The rear foot mustbe located in the rear cup mounting on the carriage and the front left foot(viewed from the rear of the traverse unit) located in the vee mounting.Levelling of the traverse unit is achieved by adjustment of the screwed conemount in the adaptor plate, located under the rear TU foot.
Rear foot location
Front feet location
SETTING UP
Page 16 Issue 1.5, June 2002
Interconnections when mounted onto column and base
The electrical connections to the traverse unit when mounted on the columnare identical. Care must be taken when positioning the traverse unit on thecolumn carriage that the cables to the traverse unit are not or are not likelyto be stretched during operation.
Upgrading software
If the software is upgraded or the software on the PCM needs replacing thenthe software upgrade for the PCM is performed as follows:
• With the PCM switched on copy any measurement data files and PreSetfiles that need to be preserved from the Internal drive on to a sparePCMCIA card. This is done using the ‘File’ menu.
• Insert the PCMCIA card containing the software upgrade into the PCM.• Switch the PCM off and on.• A banner is displayed on the PCM screen along with information about
reformatting the Internal drive. The file(s) are then copied from thePCMCIA card to the Internal drive.
• The PCM software is then automatically started and the first menu isdisplayed, e.g. Measure Menu.
• Remove the PCMCIA Card.
DESCRIPTION
Issue 1.5, June 2002 Page 17
CONTENTSINTRODUCTION 18
THE TRAVERSE UNIT 19THE ADJUSTABLE HEIGHT UNIT 21
Locking the hinge 21Fitting the Gauge 22
THE GAUGE 23THE STYLUS 24
CAUTION 24
PROCESSOR CONTROL MODULE 25Sleep Mode 27
THE POWER SUPPLY 28
BATTERIES 29BATTERIES IN THE PROCESSOR CONTROL MODULE 30BATTERIES IN THE TRAVERSE UNIT 31
CHARGING BATTERIES 32
WARNING 32Charger Operation 34
CALIBRATION STANDARD 35Ball Standard 35
Turning the Ball 36Cleaning 36
Three Line Calibration standard 37Three Line and Ra Calibration standard 37
Cleaning 38
THE SOFTWARE 39THE MAIN MENUS 39THE FILE MENU 41THE MEASURE MENU 45THE ANALYSIS MENU 48THE PRINT MENU 56THE CALIBRATION MENU 59THE CONFIGURE MENU 62THE RESULTS PAGES 65
DESCRIPTION
Page 18 Issue 1.5, June 2002
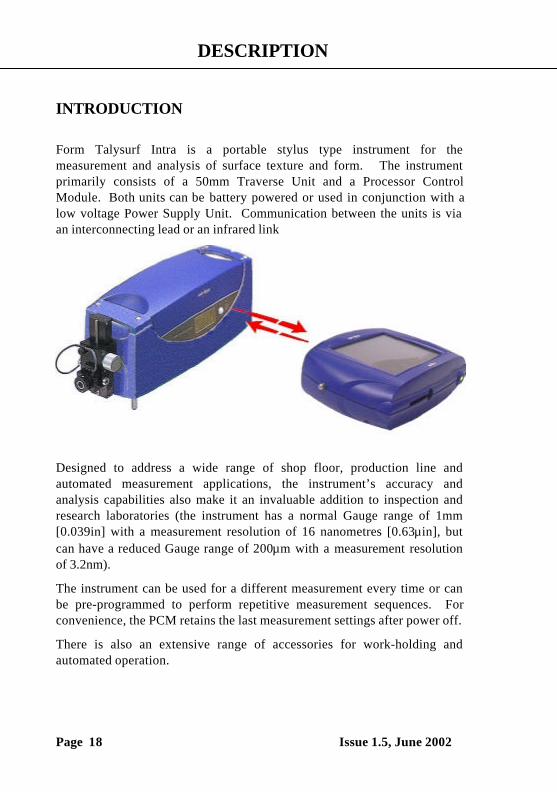
INTRODUCTION
Form Talysurf Intra is a portable stylus type instrument for themeasurement and analysis of surface texture and form. The instrumentprimarily consists of a 50mm Traverse Unit and a Processor ControlModule. Both units can be battery powered or used in conjunction with alow voltage Power Supply Unit. Communication between the units is viaan interconnecting lead or an infrared link
Designed to address a wide range of shop floor, production line andautomated measurement applications, the instrument’s accuracy andanalysis capabilities also make it an invaluable addition to inspection andresearch laboratories (the instrument has a normal Gauge range of 1mm[0.039in] with a measurement resolution of 16 nanometres [0.63µin], butcan have a reduced Gauge range of 200µm with a measurement resolutionof 3.2nm).
The instrument can be used for a different measurement every time or canbe pre-programmed to perform repetitive measurement sequences. Forconvenience, the PCM retains the last measurement settings after power off.
There is also an extensive range of accessories for work-holding andautomated operation.
DESCRIPTION
Issue 1.5, June 2002 Page 19
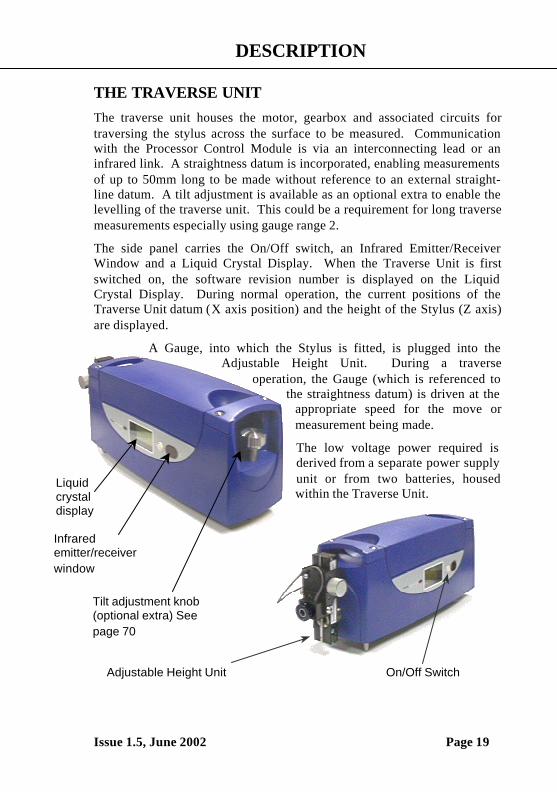
THE TRAVERSE UNITThe traverse unit houses the motor, gearbox and associated circuits fortraversing the stylus across the surface to be measured. Communicationwith the Processor Control Module is via an interconnecting lead or aninfrared link. A straightness datum is incorporated, enabling measurementsof up to 50mm long to be made without reference to an external straight-line datum. A tilt adjustment is available as an optional extra to enable thelevelling of the traverse unit. This could be a requirement for long traversemeasurements especially using gauge range 2.
The side panel carries the On/Off switch, an Infrared Emitter/ReceiverWindow and a Liquid Crystal Display. When the Traverse Unit is firstswitched on, the software revision number is displayed on the LiquidCrystal Display. During normal operation, the current positions of theTraverse Unit datum (X axis position) and the height of the Stylus (Z axis)are displayed.
A Gauge, into which the Stylus is fitted, is plugged into theAdjustable Height Unit. During a traverse
operation, the Gauge (which is referenced tothe straightness datum) is driven at the
appropriate speed for the move ormeasurement being made.
The low voltage power required isderived from a separate power supplyunit or from two batteries, housedwithin the Traverse Unit.
On/Off Switch
Tilt adjustment knob(optional extra) Seepage 70
Adjustable Height Unit
Liquidcrystaldisplay
Infraredemitter/receiverwindow
DESCRIPTION
Page 20 Issue 1.5, June 2002
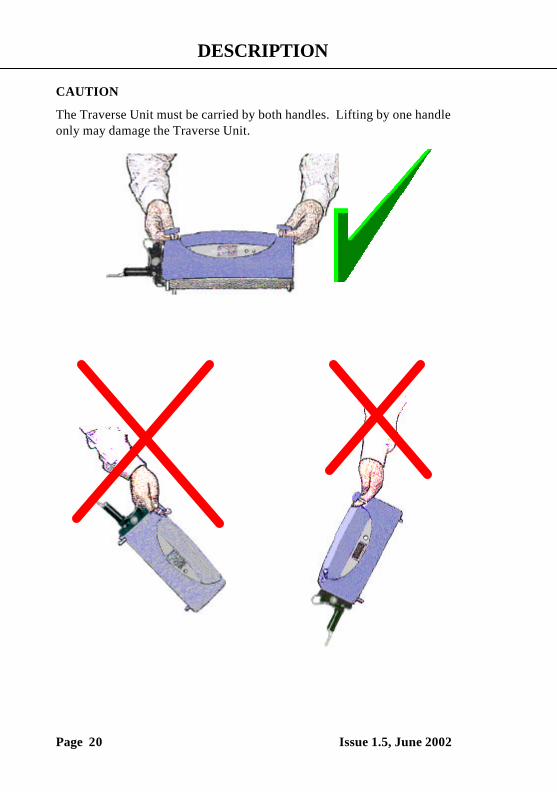
CAUTION
The Traverse Unit must be carried by both handles. Lifting by one handleonly may damage the Traverse Unit.

DESCRIPTION
Issue 1.5, June 2002 Page 21
THE ADJUSTABLE HEIGHT UNITMounted on the end of the Traverse Unit datum shaft is a Adjustable HeightUnit.
The assembly, complete with gauge, can be raised and lowered by rotatingthe vertical adjustment knob on the side of the unit (clockwise to raise thepick-up, anti-clockwise to lower it). Stop screws at each end of the verticaltraverse guide bar limit the travel of the height adjuster.
The range of vertical adjustment allows the stylus to be positioned between70mm (nominal) above traverse unit base and 24mm (nominal) belowtraverse unit base.
Stop
Stop
VerticalAdjustmentKnob
Gauge
Datum bar
Gauge locking screw
Height adjuster
Gauge block
DESCRIPTION
Page 22 Issue 1.5, June 2002
Fitting the GaugeThe Gauge is mounted onto the Height Adjuster by carefully engaging thesmall diameter connector at the rear of the Gauge into the socket on thefront of the Gauge Block. The Gauge Block is screwed onto the HeightAdjuster. The Gauge Block socket houses a number of pins. These mustalign with the holes in the end of the Gauge connector. When the Gauge isfully engaged with the Gauge Block, turn the Gauge Locking Screw, on thetop of the Gauge Block and gently clamp the Gauge.
The adjustable height unit enables the gauge to be used in both its normalposition and at right angles according to how the gauge block is oriented.Page 21 shows the gauge block and the gauge in the normal position. Byunscrewing the gauge block from the height adjuster it can then be screwedback onto the height adjuster oriented through 90o to enable right angle use.
IMPORTANTWhen using the adjustable height unit in right angle mode, the pick-up mustfirst be calibrated in the normal in-line condition then, without disturbingthe stylus, the pick-up should be removed from the gauge block. The gaugeblock is then refitted as stated above and the pick up carefully reinsertedinto the gauge block.
Note. When a right angle measurement is made, Right Angle Pick- upUSED must be selected from the menu GAUGE SET UP options.IMPORTANTIt is not practical to use a right angle attachment, in conjunction with theaccessory column and stand as the stylus will overhang the edge of the base.However, should this arrangement be required, a suitable column and standcan be supplied on application to Taylor Hobson or its local agents.
There will be degradation in performance when using the right angleattachment with all gauges and styli.
Note. When the right angle attachment is required, the chisel styli shouldnot be used.
DESCRIPTION
Issue 1.5, June 2002 Page 23
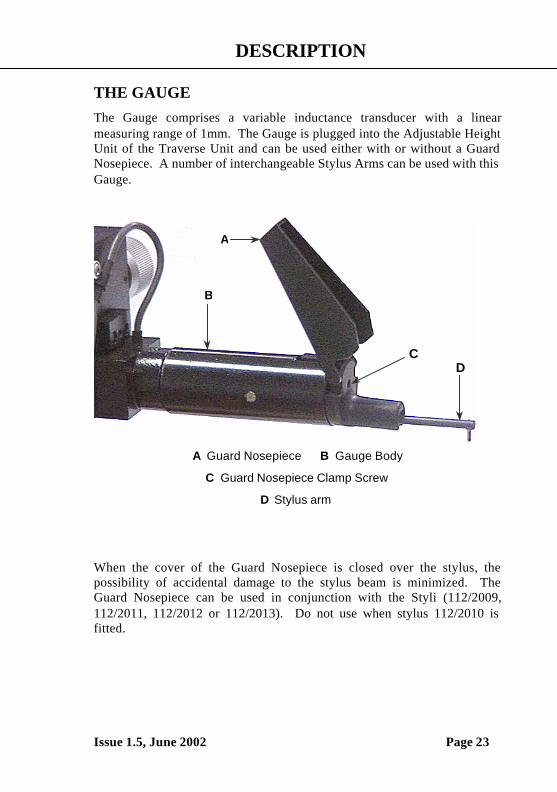
THE GAUGEThe Gauge comprises a variable inductance transducer with a linearmeasuring range of 1mm. The Gauge is plugged into the Adjustable HeightUnit of the Traverse Unit and can be used either with or without a GuardNosepiece. A number of interchangeable Stylus Arms can be used with thisGauge.
A Guard Nosepiece B Gauge Body
C Guard Nosepiece Clamp Screw
D Stylus arm
When the cover of the Guard Nosepiece is closed over the stylus, thepossibility of accidental damage to the stylus beam is minimized. TheGuard Nosepiece can be used in conjunction with the Styli (112/2009,112/2011, 112/2012 or 112/2013). Do not use when stylus 112/2010 isfitted.
DC
A
B
DESCRIPTION
Page 24 Issue 1.5, June 2002
THE STYLUSThe standard Stylus types available for use with the inductive Gauge arediamond tipped with an effective arm length of 60mm and Sapphire balltipped with an effective arm length of 120mm. The measurement range isdependent on the length of the Stylus Arm i.e. a 60mm arm gives a range of1mm, a 120mm arm gives a range of 2mm.
The type of assessment required determines the Stylus to be used. Surfacetexture assessments are only valid when a Diamond Tipped Stylus is fitted.Form assessment is available with all styli, the vertical range required totrace the component profile will determine the length of Stylus Arm to beused.
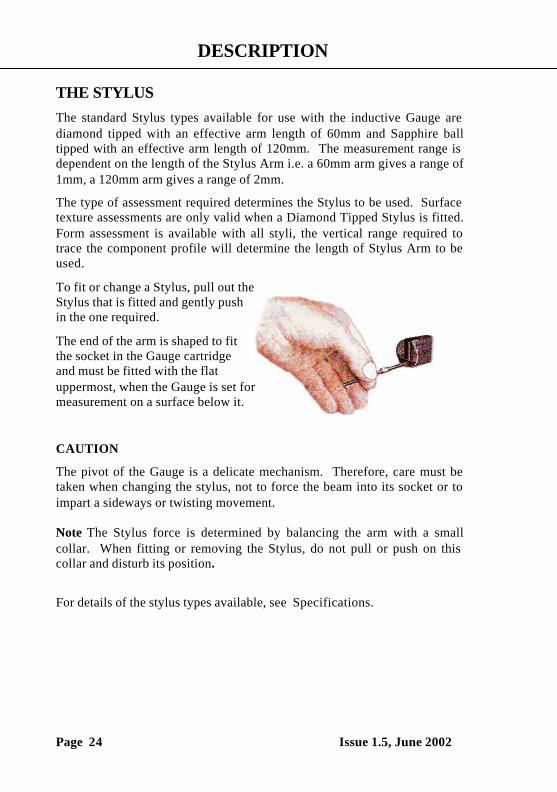
To fit or change a Stylus, pull out theStylus that is fitted and gently pushin the one required.
The end of the arm is shaped to fitthe socket in the Gauge cartridgeand must be fitted with the flatuppermost, when the Gauge is set formeasurement on a surface below it.
CAUTION
The pivot of the Gauge is a delicate mechanism. Therefore, care must betaken when changing the stylus, not to force the beam into its socket or toimpart a sideways or twisting movement.
Note The Stylus force is determined by balancing the arm with a smallcollar. When fitting or removing the Stylus, do not pull or push on thiscollar and disturb its position.
For details of the stylus types available, see Specifications.

DESCRIPTION
Issue 1.5, June 2002 Page 25
THE PROCESSOR CONTROL MODULEThe Processor Control Module provides the operator interface and dataprocessing requirements for the instrument. It can be used either hand-heldor desk mounted.
All instrument operation commands, analysis requirements and resultsdisplays are via a touch pad screen.
Instructions and data are passed between the Processor Control Module anda compatible Traverse Unit via an interconnecting lead or an infrared link.This enables the Processor Control Module to be used up to a distance of1.0m from the traverse unit (providing that there is an uninterrupted line ofsight between the infrared emitters and receivers).The low voltage power required is derived from a separate power supplyunit, or from a battery, housed within the Unit.
DESCRIPTION
Page 26 Issue 1.5, June 2002
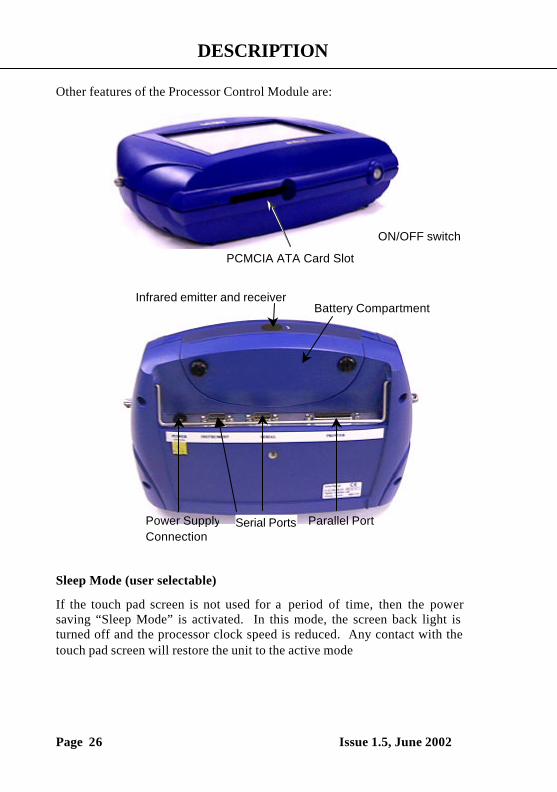
Other features of the Processor Control Module are:
Sleep Mode (user selectable)
If the touch pad screen is not used for a period of time, then the powersaving “Sleep Mode” is activated. In this mode, the screen back light isturned off and the processor clock speed is reduced. Any contact with thetouch pad screen will restore the unit to the active mode
Power SupplyConnection
Serial Ports Parallel Port
Battery CompartmentInfrared emitter and receiver
PCMCIA ATA Card Slot
ON/OFF switch

DESCRIPTION
Issue 1.5, June 2002 Page 27
CAUTION
The Processor Control Module must NOT be carried by the stand. Thiscomponent is not designed for this purpose.
DESCRIPTION
Page 28 Issue 1.5, June 2002
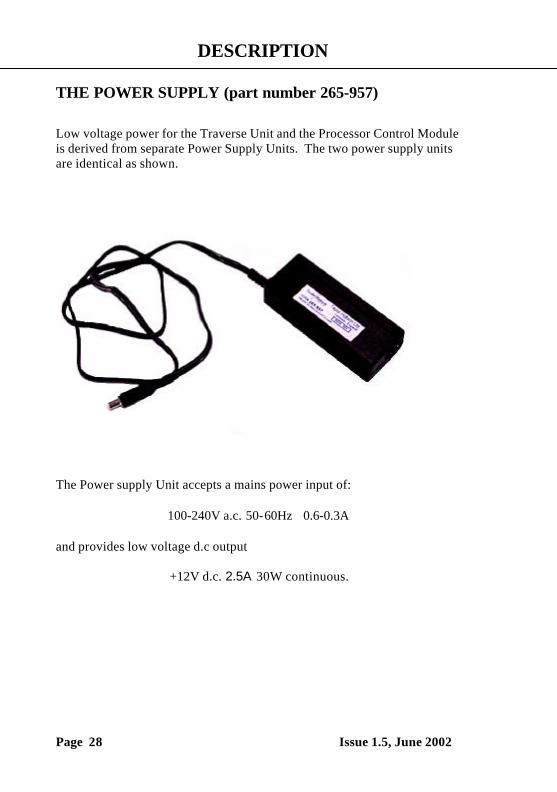
THE POWER SUPPLY (part number 265-957)
Low voltage power for the Traverse Unit and the Processor Control Moduleis derived from separate Power Supply Units. The two power supply unitsare identical as shown.
The Power supply Unit accepts a mains power input of:
100-240V a.c. 50-60Hz 0.6-0.3A
and provides low voltage d.c output
+12V d.c. 2.5A 30W continuous.

DESCRIPTION
Issue 1.5, June 2002 Page 29
BATTERIESUse only the batteries supplied by Taylor Hobson Limited, part number249/36. Allocate a particular battery for use in the Processor ControlModule and the other two for use in the Traverse Unit. Ensure that theythen remain only in use with their allocated units.
Do not use a partially charged battery with a fully charged battery in thetraverse unit.
Battery Condition on DeliveryThe instrument is delivered with the batteries in a discharged state. Beforeuse, the batteries must be fully charged. Batteries must only be charged inthe Taylor Hobson charger, part number 265/943.
StorageIf the instrument is to be unused or stored for more than one week, thebatteries must be removed.
DisposalBatteries can present an environmental hazard. Therefore:Remove the batteries before disposing of a Traverse Unit or a ProcessorControl Module.
The batteries can be returned to Taylor Hobson Limited for safe disposal.
Battery Short CircuitDo not place a battery in a container that also has metal objects that maycause a short circuit. (e.g. do not carry a battery in a pocket that alsocontains coins or other metal objects). If the battery is short-circuited, aninternal fuse will blow. This will render the battery useless.
Note. If batteries are left in either unit when powered by the powersupplies, it should be noted that there will still be a small current drawnfrom the batteries which will discharge the batteries over a period of time.If the either unit is to be powered by the power supply then the batteriesshould be removed.

DESCRIPTION
Page 30 Issue 1.5, June 2002
BATTERIES IN THE PROCESSOR CONTROL MODULE
To access the battery, ensure that the unit is switched off. Turn the twofasteners, to release the cover to the battery compartment and lift off thecover.
To fit the battery:Tilt the battery so that the end with thecontacts is inserted first into thecompartment in the PCM. Then pushthe battery into position until it is fullyengaged.
To remove the batteries:
Pull on the end of the battery that isaway from the contacts and lift thebattery out of its compartment.
DESCRIPTION
Issue 1.5, June 2002 Page 31
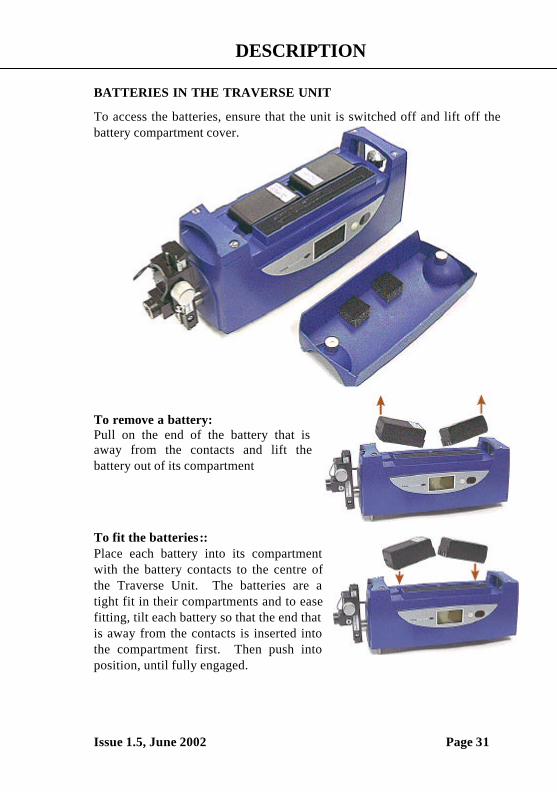
BATTERIES IN THE TRAVERSE UNIT
To access the batteries, ensure that the unit is switched off and lift off thebattery compartment cover.
To remove a battery:Pull on the end of the battery that isaway from the contacts and lift thebattery out of its compartment
To fit the batteries::Place each battery into its compartmentwith the battery contacts to the centre ofthe Traverse Unit. The batteries are atight fit in their compartments and to easefitting, tilt each battery so that the end thatis away from the contacts is inserted intothe compartment first. Then push intoposition, until fully engaged.
DESCRIPTION
Page 32 Issue 1.5, June 2002
CHARGING BATTERIES
Before charging a battery it must be removed from the Traverse Unit orProcessor Control Module and placed into the charger supplied..
Recharging partially charged batteriesUnlike Nicad batteries, the batteries supplied with the instrument do nothave a memory retention problem. Partially charged batteries may,therefore, be charged, as required. Do not attempt to discharge a battery bycreating a short circuit (see WARNING below).
WARNING
Using unsuitable charging equipment may result in an explosion withassociated injury and damage.
Use only the charger supplied, in accordance with the manufacturer’sinstructions . A full charge will require up to 2 hours.
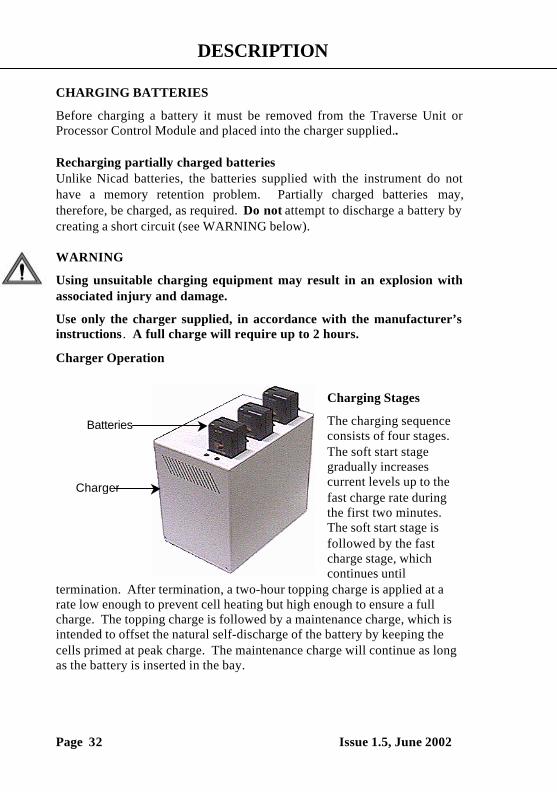
Charger Operation
Charging Stages
The charging sequenceconsists of four stages.The soft start stagegradually increasescurrent levels up to thefast charge rate duringthe first two minutes.The soft start stage isfollowed by the fastcharge stage, whichcontinues until
termination. After termination, a two-hour topping charge is applied at arate low enough to prevent cell heating but high enough to ensure a fullcharge. The topping charge is followed by a maintenance charge, which isintended to offset the natural self-discharge of the battery by keeping thecells primed at peak charge. The maintenance charge will continue as longas the battery is inserted in the bay.
Charger
Batteries
DESCRIPTION
Issue 1.5, June 2002 Page 33
The RED Charge Status indicator is activated continuously during soft startand fast charge. The GREEN Charge Status indicator is activatedcontinuously during topping and maintenance charge.
Charge Termination Methods
The charger uses voltage slope, maximum temperature and charge timermethods to terminate fast charge. The maximum temperature and fastcharge timer are used as a safety backup during the main charge cycle.
If the temperature of the battery exceeds the maximum limit during a chargecycle, the charger will shutdown and stop charging. The YELLOW BatteryTemperature indicator will latch on indicating a Hot Battery condition. Theuser must remove the battery and manually reset the charger via therecessed push-button switch situated at the back of the unit. The batterymust be allowed to cool before it can be reinserted and charged again.
Note: Repeated over temperature shutdowns indicates a potential faultcondition and the battery must be removed from service immediately andreturned to the supplier with details of the problem.
The charger uses a timer to limit the fast charge duration to 144 minutes.For safety, the fast charge timer is always enabled and cannot be disabled.
Note: Powering-up, removing and re-inserting a battery, or manuallyresetting the charger using the push-button switch will reset the safetytimer.
Battery Detection
Upon power-up, removal of a battery, or manual reset after an overtemperature shutdown condition, the charger enters the battery pollingdetect mode. To indicate this mode, the YELLOW indicator will flashcontinuously. Once a battery is installed in a charger bay, the YELLOWindicator will stop flashing and the charger will enter the soft start stage.
Cold Battery Charging
The charger checks for a cold battery before initiating fast charge. If a coldbattery is present before fast charge begins, the charger begins a two hourtopping charge cycle. If the battery is still cold after the two hour toppingcharge is complete, the charger begins a maintenance charge. The
DESCRIPTION
Page 34 Issue 1.5, June 2002
maintenance charge will continue for as long as the battery remains cold.The charger checks the temperature every second to see if the battery haswarmed up. If the battery warms up, the charger stops the topping ormaintenance charge and begins the fast charge cycle.
The GREEN Charge Status indicator and the YELLOW BatteryTemperature indicator will be active, indicating that a low current charge isbeing applied to the battery that is outside the specified temperature rangefor fast charging.
Safety Features
In the event of an accidental short circuit across the battery terminals insidethe charger bay, the charger will automatically limit the internal current to1.8A (normal fast charge current) to prevent damage to the electronics. TheGREEN Charge Status indicator will flash and the YELLOW BatteryTemperature indicator will turn on indicating the condition. The user mustimmediately turn off system power and remove the short circuit obstructionfrom the charger bay.
The input to each charger circuit is internally protected with a 3.15A fuse.A blown fuse indicates a fault condition and must not be replaced by theuser.
Additionally, each battery pack includes a PTC fuse to protect againstaccidental short circuits across the battery pack terminals. The PTC shouldautomatically reset itself when the short circuit condition is removed. If thepack does not recover from the short circuit condition, the battery must beremoved from service immediately and returned to the supplier with detailsof the problem.
Please refer to the Operating and Safety Instructions for the Fast ChargerSystem and Battery Packs supplied with the charger unit for additionalsafety information.
DESCRIPTION
Issue 1.5, June 2002 Page 35
CALIBRATION STANDARDThere are two Calibration Standards; the Calibration Ball and the Three-Line Calibration Standard.
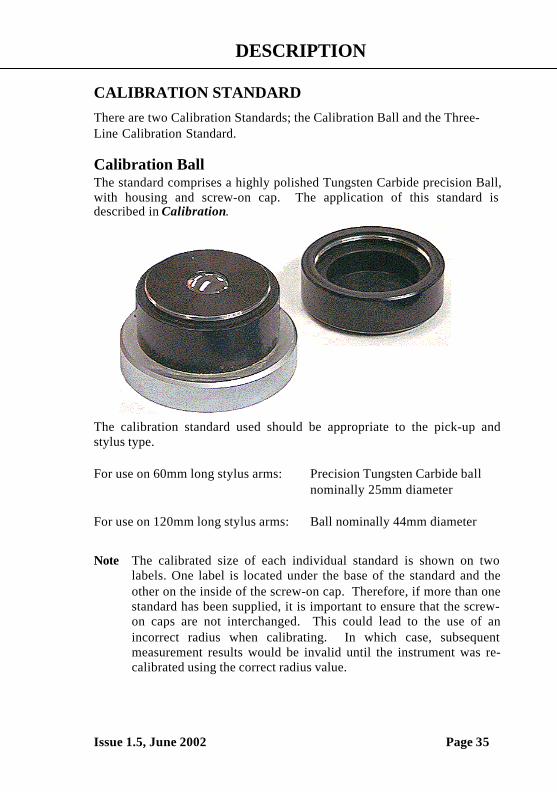
Calibration BallThe standard comprises a highly polished Tungsten Carbide precision Ball,with housing and screw-on cap. The application of this standard isdescribed in Calibration.
The calibration standard used should be appropriate to the pick-up andstylus type.
For use on 60mm long stylus arms: Precision Tungsten Carbide ballnominally 25mm diameter
For use on 120mm long stylus arms: Ball nominally 44mm diameter
Note The calibrated size of each individual standard is shown on twolabels. One label is located under the base of the standard and theother on the inside of the screw-on cap. Therefore, if more than onestandard has been supplied, it is important to ensure that the screw-on caps are not interchanged. This could lead to the use of anincorrect radius when calibrating. In which case, subsequentmeasurement results would be invalid until the instrument was re-calibrated using the correct radius value.

DESCRIPTION
Page 36 Issue 1.5, June 2002
Turning the BallIf damage (e.g. scratches etc.) has occurred to the calibration ball anddifficulty is experienced in obtaining a suitable calibration, then it isadvisable to rotate the ball to present an undamaged surface area. This canbe done as follows:
1. Ensure that the cap is firmly screwed in position.
2. Using a small screwdriver remove the plastic cover from the base ofthe housing to reveal three socket head screws (3mm).
3. Loosen the screws but do not remove them.
4. Gently lift up the black housing from its base to break the seal of the'O' ring on the ball.
5. Turn the ball to a new, undamaged position.
6. Tighten the three socket head screws and replace the plastic cover.
CleaningThe standard should be cleaned using a non-staining solvent such asMethanol AR (CH3OH) on a lint free cloth or a lens tissue. Alternatively,any commercially available lens cleaning liquid can be used.
Caution. DO NOT use any form of abrasive cleaner.
DESCRIPTION
Issue 1.5, June 2002 Page 37
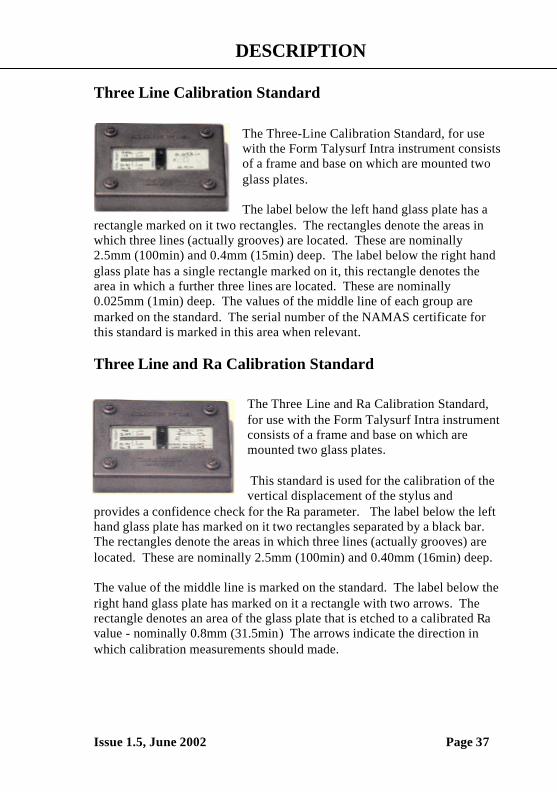
Three Line Calibration Standard
The Three-Line Calibration Standard, for usewith the Form Talysurf Intra instrument consistsof a frame and base on which are mounted twoglass plates.
The label below the left hand glass plate has arectangle marked on it two rectangles. The rectangles denote the areas inwhich three lines (actually grooves) are located. These are nominally2.5mm (100min) and 0.4mm (15min) deep. The label below the right handglass plate has a single rectangle marked on it, this rectangle denotes thearea in which a further three lines are located. These are nominally0.025mm (1min) deep. The values of the middle line of each group aremarked on the standard. The serial number of the NAMAS certificate forthis standard is marked in this area when relevant.
Three Line and Ra Calibration Standard
The Three Line and Ra Calibration Standard,for use with the Form Talysurf Intra instrumentconsists of a frame and base on which aremounted two glass plates.
This standard is used for the calibration of thevertical displacement of the stylus and
provides a confidence check for the Ra parameter. The label below the lefthand glass plate has marked on it two rectangles separated by a black bar.The rectangles denote the areas in which three lines (actually grooves) arelocated. These are nominally 2.5mm (100min) and 0.40mm (16min) deep.
The value of the middle line is marked on the standard. The label below theright hand glass plate has marked on it a rectangle with two arrows. Therectangle denotes an area of the glass plate that is etched to a calibrated Ravalue - nominally 0.8mm (31.5min) The arrows indicate the direction inwhich calibration measurements should made.
DESCRIPTION
Page 38 Issue 1.5, June 2002
Cleaning of the three-line standardThe standard should be cleaned using a non-staining solvent such asMethanol AR * on a lint free cloth or a lens tissue. Alternatively, anycommercially available lens cleaning liquid
DESCRIPTION
Issue 1.5, June 2002 Page 39
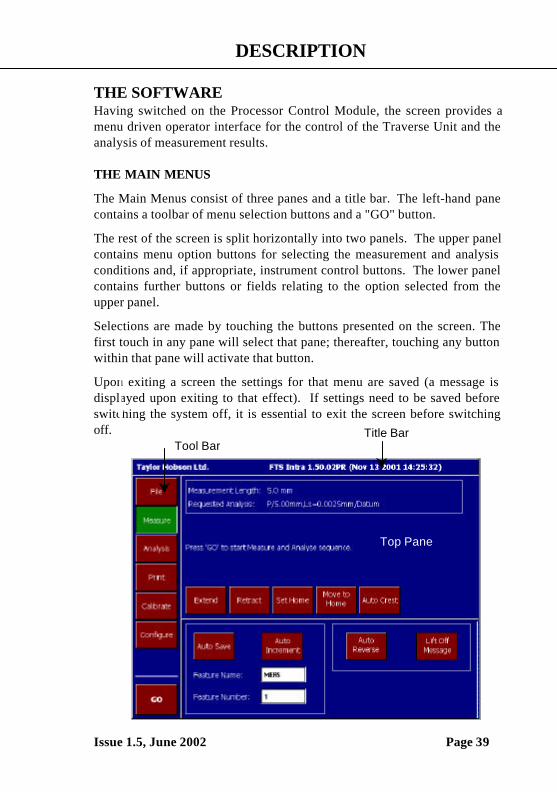
THE SOFTWAREHaving switched on the Processor Control Module, the screen provides amenu driven operator interface for the control of the Traverse Unit and theanalysis of measurement results.
THE MAIN MENUS
The Main Menus consist of three panes and a title bar. The left-hand panecontains a toolbar of menu selection buttons and a "GO" button.
The rest of the screen is split horizontally into two panels. The upper panelcontains menu option buttons for selecting the measurement and analysisconditions and, if appropriate, instrument control buttons. The lower panelcontains further buttons or fields relating to the option selected from theupper panel.
Selections are made by touching the buttons presented on the screen. Thefirst touch in any pane will select that pane; thereafter, touching any buttonwithin that pane will activate that button.
Upon exiting a screen the settings for that menu are saved (a message isdisplayed upon exiting to that effect). If settings need to be saved beforeswitching the system off, it is essential to exit the screen before switchingoff.
Tool BarTitle Bar
Top Pane

DESCRIPTION
Page 40 Issue 1.5, June 2002
User inputsThere are occasions when the user is required to input information. Whenthis is required, the software will present either a virtual keyboard or anumber pad, as appropriate. To make an entry, press on the appropriatekeys, then press the OK key
The currently saved entry is displayed above the entry field.
OKPressing this key will cause thecontents of the entry field to besaved (except if the field isclear, in which case, thecurrently saved entry isretained).ClearPressing this key will clear theentry field.
Exp.The facility of entering numerical values in exponential form is available.This is done by entering a value, pressing the Exp key then entering theexponent. (e.g. 123 e –3 = 0.123).
CancelPressing this key will abandon the current activity; the currently saved entryis retained.
DESCRIPTION
Issue 1.5, June 2002 Page 41
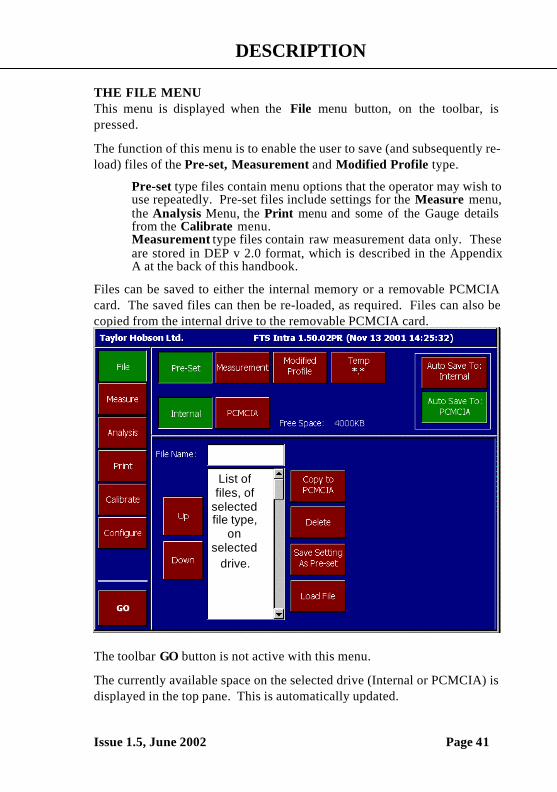
THE FILE MENUThis menu is displayed when the File menu button, on the toolbar, ispressed.
The function of this menu is to enable the user to save (and subsequently re-load) files of the Pre-set, Measurement and Modified Profile type.
Pre-set type files contain menu options that the operator may wish touse repeatedly. Pre-set files include settings for the Measure menu,the Analysis Menu, the Print menu and some of the Gauge detailsfrom the Calibrate menu.Measurement type files contain raw measurement data only. Theseare stored in DEP v 2.0 format, which is described in the AppendixA at the back of this handbook.
Files can be saved to either the internal memory or a removable PCMCIAcard. The saved files can then be re-loaded, as required. Files can also becopied from the internal drive to the removable PCMCIA card.
The toolbar GO button is not active with this menu.
The currently available space on the selected drive (Internal or PCMCIA) isdisplayed in the top pane. This is automatically updated.
List offiles, of
selectedfile type,
onselected
drive.
DESCRIPTION
Page 42 Issue 1.5, June 2002
THE FILE MENUThe options are as follows:
Pre-SetThis option causes the filing system to function only with files of the Pre-set type.
MeasurementThis option causes the filing system to function only with files of theMeasurement type.
Modified ProfileThis option causes the filing system to function only with files of theModified Profile type.
Note: When selected the option Load File in the bottom pane is notavailable.
InternalSelecting this option causes the internal memory to be selected as thecurrent drive for saving or loading files.
Note: Files in internal memory should be kept to an absolute minimum toensure that analysis times are not impaired.
PCMCIASelecting this option causes the removable PCMCIA card to be selected asthe current drive for saving or loading files.
Auto Save to internal/PCMCIA
The “Auto Save To” option specifies the drive destination, either Internal orPCMCIA, when the Measurement Auto Save option is used
File Name:Use this field to enter a file name (up to 8 characters). Any file named inthe File Name field will be used in any Copy, Delete, Save or Loadoperation. If the File Name field is empty, then the file that is highlightedin the File List will be used.
Note. Any name entered in the File Name field, is cleared when theUp/Down buttons are used.
A File List is located below the File Name field and provides a list of filesof the selected type, on the selected drive.
DESCRIPTION
Issue 1.5, June 2002 Page 43
Up / DownPressing these bottom pane buttons causes the highlight to be scrolledthrough the file names in the File List. By pressing the appropriateoption button, the highlighted file can then be copied, deleted, saved orloaded.
Copy to PCMCIA, This bottom pane option is available only when theInternal drive is selected)Selecting this option enables the currently active file (see File Name) tobe copied from the Internal drive to the PCMCIA card.
DeleteSelecting this bottom pane option enables the currently active file (seeFile Name ) to be deleted from the currently selected drive.
Save Setting As Pre-SetThis option is available only when the file type Pre-set is selected andenables the current Pre-Set values to be saved to a file (see File Name ).
Save MeasurementThis option is available only when the file types Measurement orModified Profile are are selected and enables the current measured datato be saved to a file (see File Name ).
Load FileSelecting this option enables the currently active file to be loaded (seeFile Name ). This option is not available when Modified Profile isselected.
When a Measurement file is loaded, it will be automatically analysedusing the current analysis settings. When a Pre-set file is loaded, thecurrent Preset options are replaced.
DESCRIPTION
Page 44 Issue 1.5, June 2002
Examples
The following examples can provide an insight into how each of the filetypes may be re-loaded and applied. These assume that a number ofmeasurements, with different measurement and analysis conditions, havebeen made and files saved of both the Measurement and Pre-set type.
Measurement:An application, of this file type, is to load previously saved measurementdata and automatically analyse the data using the current Analysis Menusettings and display the results:
1. Select the File menu, and then select the Measurement option.
2. Use the Up / Down keys to move the highlight onto the requiredsaved file. Select the Load File button.
Pre-setAn application, of this file type, is to assess measurement data to a numberof different analysis conditions without repeatedly reconfiguring theAnalysis Menu options. This is a useful application if it is required tofrequently assess sets of different parts to different measurement andanalysis conditions.
The data analysed can be from either the current measurement, a newmeasurement or from a previously saved Measurement type file.
The procedure is as follows:
1. Select the File menu, and then select the Pre-set option.
2. Use the Up / Down keys to move the highlight onto the requiredsaved file. Select the Load File button. The settings for theMeasure menu, the Analysis Menu, the Print menu and some of theGauge details from the Calibrate menu are changed to those of thePre-set file.
3. To start a new Measure and Analyse sequence, press the Measuremenu button from the toolbar and then press the GO key. To justreanalyse the current measurement data, select the Analysis Menuand press the GO key.

DESCRIPTION
Issue 1.5, June 2002 Page 45
THE MEASURE MENU
This menu is displayed when the software is first started and when theMeasure button is pressed.
The function of this menu is to enable the user to:
Control the movement of the Traverse Unit in order to position thestylus ready for the start of the measurement.
Initiate a measurement sequence (with auto reverse, if required) withautomatic analysis of results.
Specify feature names and feature numbers for the automatic saving ofmeasurement data.
The current measurement length, analysis type, filters and reference linedetails are displayed in the top pane.
Pressing the GO button, from this menu, causes a measurement andanalysis to be initiated, with automatic display of the results.
DESCRIPTION
Page 46 Issue 1.5, June 2002
The control button and field functions are as follows:
Extend/ RetractThe Extend option causes the Gauge to be traversed away from theTraverse Unit. The Retract option causes the Gauge to be traversedtowards the Traverse Unit.
A short press on these buttons causes the Gauge to be moved a smalldistance, typically 50µm. Holding a button down will cause the Gauge tostart moving slowly, to allow set up, then accelerate up to the top speed. Onreleasing the button, the traverse is stopped.
Set HomeThis option causes the current position of the Gauge to be defined as theHome position. The position display on the Traverse Unit will be set tozero.
Move to HomeThis option causes the Gauge to move to the defined Home position (thezero position on the Traverse Unit display).
Auto CrestSelecting this option causes the Auto-Crest routine to be run. This is aprocedure that automatically finds the crown (or valley) of a convex (orconcave) surface.
Auto SaveWhen selected, this option causes measurement data to be automaticallysaved after each measurement, to the filename specified by the FeatureName and Number. The Feature Number is automatically incremented aftereach save, when the Auto-increment option is selected.The destination for the file, either Internal or PCMCIA drive, is set in theFile menu.
Auto Increment/OverwriteThis button provides a toggle between the Auto Increment and Overwriteoptions and is only active when the Auto Save option is selected.
If Overwrite is selected, then when an Auto Save is made and a file withthat name already exists, the existing file will be overwritten, withoutprompting the user. If the Auto Increment option is selected, then when anAuto increment exists, the user will be prompted with the option tooverwrite or not (Ok/Cancel).
DESCRIPTION
Issue 1.5, June 2002 Page 47
Feature Name
This field is used to enter a name of up to six characters only (see alsoFeature Number). The name may not include spaces, but may include theunderscore ( _ ) and numeric characters.
Feature NumberThis field is used to enter a number between 0 and 99. This will beappended to the current Feature Name, to form a filename into which datafrom the next measurement will be saved.
Note After a measurement has been made the user always has the optionof saving the data by using the File Menu.
Auto ReverseThis option causes the Gauge to be automatically returned to its startingposition after a measurement has been made.
Lift off MessageThis option is available when Auto Reverse is selected. If this option isselected then, after a measurement has been made, a message is displayedthat prompts the user to lift the stylus before the auto reverse occurs. Themessage must be cleared before the auto reverse can take place.

DESCRIPTION
Page 48 Issue 1.5, June 2002
THE ANALYSIS MENU
This menu is displayed when the Analysis menu button, on the toolbar, ispressed.
The function of this menu is to enable the user to select the parameters andconditions for the evaluation of measurement data.
Pressing the GO button, from this menu, causes the current measurementdata to be re-analysed and displayed to the conditions currently selected. Asummary of these details is given in the Requested Analysis summary, in thetop pane.
Five types of analysis may be performed: Primary, Roughness, WavinessRk and R&W. Press the required analysis button to display the menu forsetting the conditions and parameter selections for that analysis.
DESCRIPTION
Issue 1.5, June 2002 Page 49
The button and field functions are as follows:
Primary
This button must be pressed in order to select the conditions and parametersfor the analysis of a primary filtered assessment of the measured data. Withthis button selected, the bottom pane displays buttons for selecting the cut-off length of the Ls filter and a field into which the required Data Lengthcan be entered.
RoughnessThis button must be pressed in order to select the conditions and parametersfor the analysis of a roughness filtered assessment of the measured data.
With this button selected, the bottom pane displays buttons for selecting thetype of filter, the cut-off lengths of the Lc and Ls filters and fields forentering the number of cutoffs or the Data Length required. (see Inter-dependencies between options , on the following page). The currentBandwidth value is displayed and automatically updated as values of Lcand Ls are changed.
WavinessThis button must be pressed in order to select the conditions and parametersfor the analysis of a waviness filtered assessment of the measured data.
With this button selected, the bottom pane displays buttons for selecting thetype of filter, the cut-off length of the Lf filter and fields for entering thenumber of cutoffs or the Data Length required. (see Inter-dependenciesbetween options , on the following page).
RkThis button must be pressed in order to select the conditions and parametersfor the analysis of an Rk filtered assessment of the measured data.
With this button selected, the bottom pane displays buttons for selecting thecut-off lengths of the Lc and Ls filters and fields for selecting the number ofcutoffs or the Data Length required. (see Inter-dependencies betweenoptions, on the following page). The current Bandwidth value is displayedand automatically updated as values of Lc and Ls are changed.

DESCRIPTION
Page 50 Issue 1.5, June 2002
R&WThis button must be pressed in order to select the conditions andparameters for the analysis of an Rk filtered assessment of the measureddata.
With this button pressed, the bottom pane displays buttons for selecting thecut-offs and Data lengths for the measurement. The cut-off and data lengthvalues can be one of three standard options or values entered by the user.
Show ResultPressing this button causes the Results page from the current analysis to bedisplayed.
Form TypePressing this button, causes the reference line option buttons to be displayedand allows a new Form Type to be selected. The options available in thebottom pane are:
LS Line, this is positioned such that the sum of the squares of thedeviations of the profile from the line is a minimum. The result is areference line through the profile data.
MZ Line, this is defined by a pair of lines which just enclose theprofile such that the distance between the lines is a minimum. The refernceline is the mean position between the two lines.
LS Arc, the radius of a measured surface is determined by fittingan arc to the measurement data. This is positioned such that the sum of thesquares of the deviations of the profile from the line of arc is a minimum.The radius of the arc is then calculated.
Absolute Arc , with this option form errors are calculated withreference to a user specified radius. The user enters the reference radius inthe Radius window which is visible when Absolute Arc is selected.
Datum, this is a line that is accurately parallel to the surface beingmeasured enabling all of the surface irregularities to be measured andanalysed with reference to the datum line.
None.
DESCRIPTION
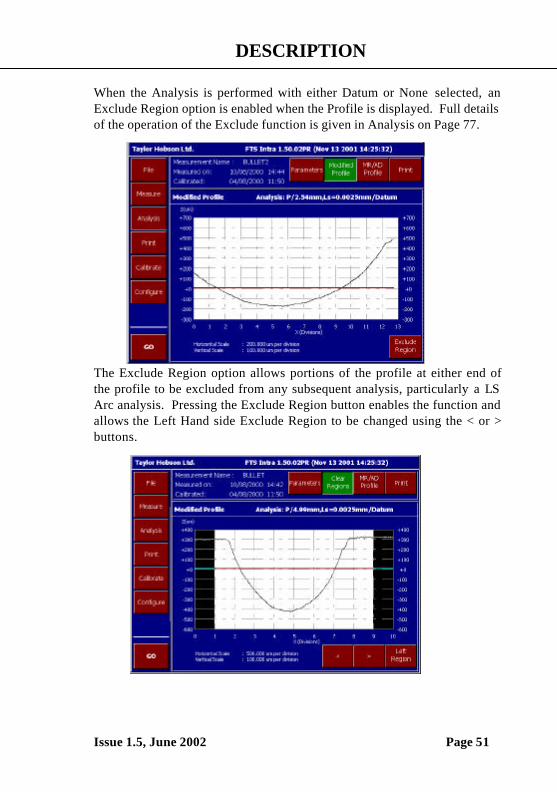
Issue 1.5, June 2002 Page 51
When the Analysis is performed with either Datum or None selected, anExclude Region option is enabled when the Profile is displayed. Full detailsof the operation of the Exclude function is given in Analysis on Page 77.
The Exclude Region option allows portions of the profile at either end ofthe profile to be excluded from any subsequent analysis, particularly a LSArc analysis. Pressing the Exclude Region button enables the function andallows the Left Hand side Exclude Region to be changed using the < or >buttons.
DESCRIPTION
Page 52 Issue 1.5, June 2002
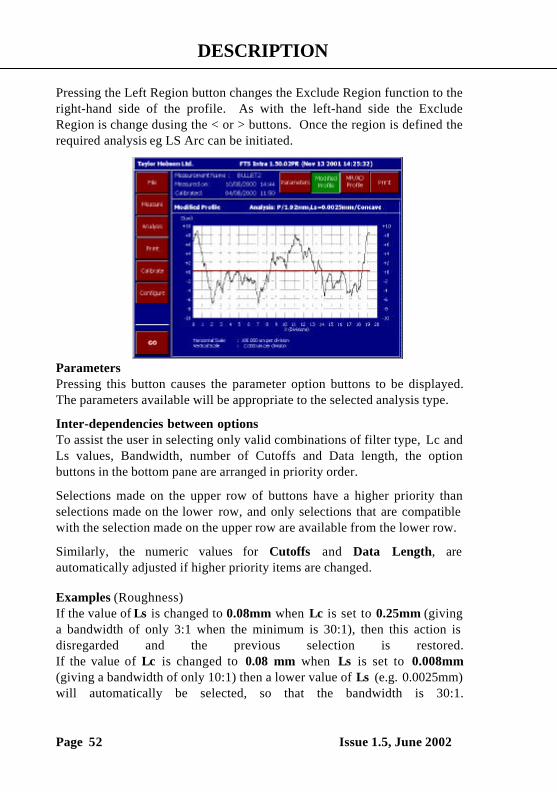
Pressing the Left Region button changes the Exclude Region function to theright-hand side of the profile. As with the left-hand side the ExcludeRegion is change dusing the < or > buttons. Once the region is defined therequired analysis eg LS Arc can be initiated.
ParametersPressing this button causes the parameter option buttons to be displayed.The parameters available will be appropriate to the selected analysis type.
Inter-dependencies between optionsTo assist the user in selecting only valid combinations of filter type, Lc andLs values, Bandwidth, number of Cutoffs and Data length, the optionbuttons in the bottom pane are arranged in priority order.
Selections made on the upper row of buttons have a higher priority thanselections made on the lower row, and only selections that are compatiblewith the selection made on the upper row are available from the lower row.
Similarly, the numeric values for Cutoffs and Data Length, areautomatically adjusted if higher priority items are changed.
Examples (Roughness)If the value of Ls is changed to 0.08mm when Lc is set to 0.25mm (givinga bandwidth of only 3:1 when the minimum is 30:1), then this action isdisregarded and the previous selection is restored.If the value of Lc is changed to 0.08 mm when Ls is set to 0.008mm(giving a bandwidth of only 10:1) then a lower value of Ls (e.g. 0.0025mm)will automatically be selected, so that the bandwidth is 30:1.
DESCRIPTION
Issue 1.5, June 2002 Page 53
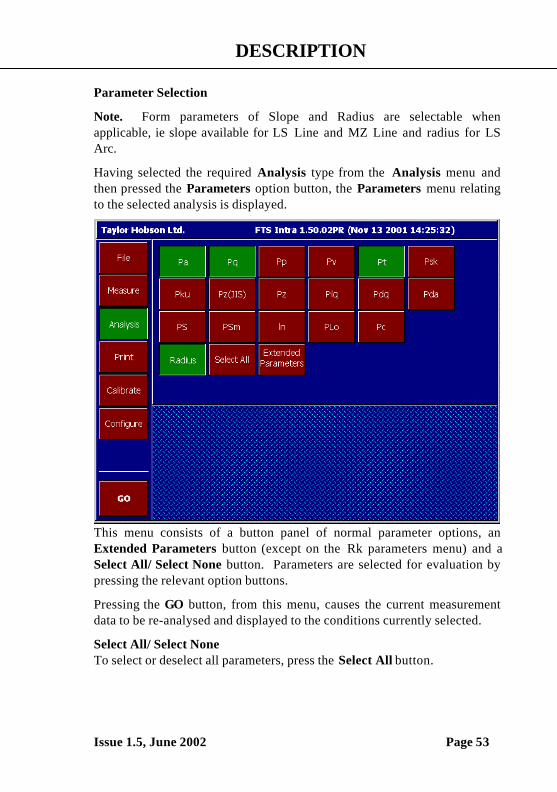
Parameter Selection
Note. Form parameters of Slope and Radius are selectable whenapplicable, ie slope available for LS Line and MZ Line and radius for LSArc.
Having selected the required Analysis type from the Analysis menu andthen pressed the Parameters option button, the Parameters menu relatingto the selected analysis is displayed.
This menu consists of a button panel of normal parameter options, anExtended Parameters button (except on the Rk parameters menu) and aSelect All/ Select None button. Parameters are selected for evaluation bypressing the relevant option buttons.
Pressing the GO button, from this menu, causes the current measurementdata to be re-analysed and displayed to the conditions currently selected.
Select All/ Select NoneTo select or deselect all parameters, press the Select All button.
DESCRIPTION
Page 54 Issue 1.5, June 2002
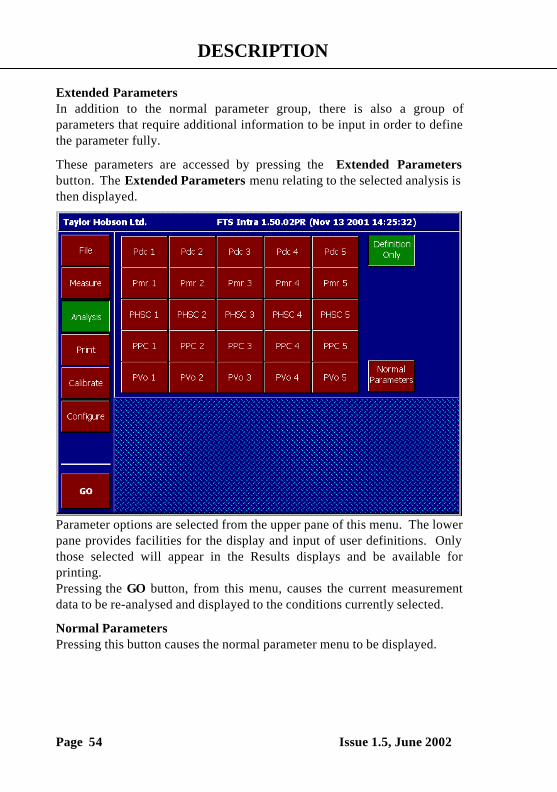
Extended ParametersIn addition to the normal parameter group, there is also a group ofparameters that require additional information to be input in order to definethe parameter fully.
These parameters are accessed by pressing the Extended Parametersbutton. The Extended Parameters menu relating to the selected analysis isthen displayed.
Parameter options are selected from the upper pane of this menu. The lowerpane provides facilities for the display and input of user definitions. Onlythose selected will appear in the Results displays and be available forprinting.Pressing the GO button, from this menu, causes the current measurementdata to be re-analysed and displayed to the conditions currently selected.
Normal ParametersPressing this button causes the normal parameter menu to be displayed.
DESCRIPTION
Issue 1.5, June 2002 Page 55
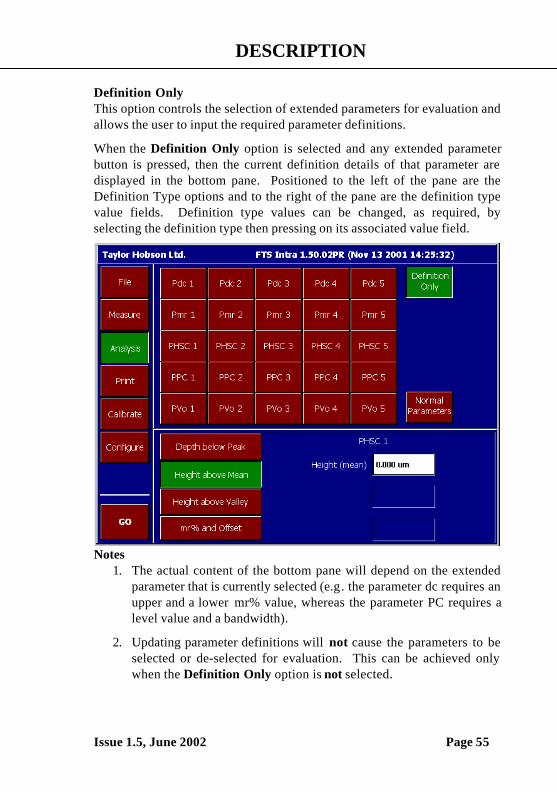
Definition OnlyThis option controls the selection of extended parameters for evaluation andallows the user to input the required parameter definitions.
When the Definition Only option is selected and any extended parameterbutton is pressed, then the current definition details of that parameter aredisplayed in the bottom pane. Positioned to the left of the pane are theDefinition Type options and to the right of the pane are the definition typevalue fields. Definition type values can be changed, as required, byselecting the definition type then pressing on its associated value field.
Notes1. The actual content of the bottom pane will depend on the extended
parameter that is currently selected (e.g. the parameter dc requires anupper and a lower mr% value, whereas the parameter PC requires alevel value and a bandwidth).
2. Updating parameter definitions will not cause the parameters to beselected or de-selected for evaluation. This can be achieved onlywhen the Definition Only option is not selected.
DESCRIPTION
Page 56 Issue 1.5, June 2002
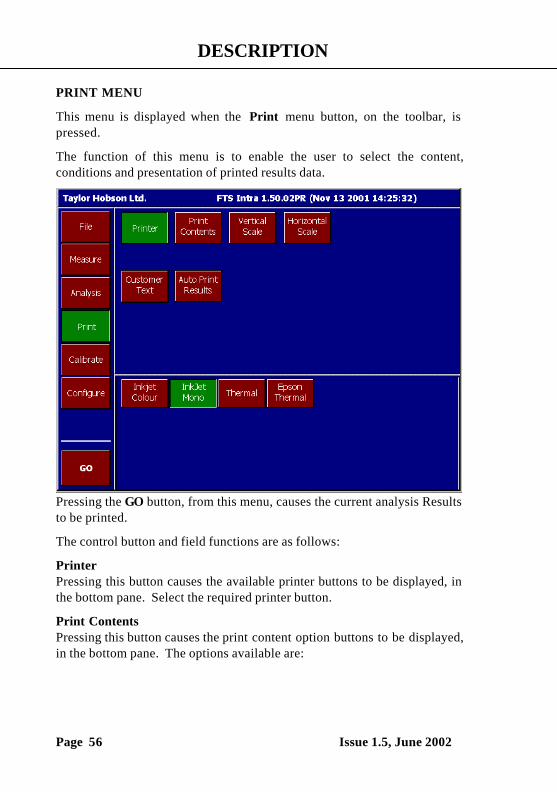
PRINT MENU
This menu is displayed when the Print menu button, on the toolbar, ispressed.
The function of this menu is to enable the user to select the content,conditions and presentation of printed results data.
Pressing the GO button, from this menu, causes the current analysis Resultsto be printed.
The control button and field functions are as follows:
PrinterPressing this button causes the available printer buttons to be displayed, inthe bottom pane. Select the required printer button.
Print ContentsPressing this button causes the print content option buttons to be displayed,in the bottom pane. The options available are:
DESCRIPTION
Issue 1.5, June 2002 Page 57
HeaderWhen this option is selected, a header is included in any printouts.This includes the Taylor Hobson company name, instrument type,measurement date, calibration state, analysis details, measurementname and, if entered, any customer text.
ParametersSelecting this option causes a list of the parameters that areselected for evaluation, with their calculated values to be includedin the print-out.
Modified ProfileSelecting this option causes a graphical representation of theModified profile data to be included in the print-out.
MR/ADSelecting this option causes a graphical representation of theMaterial Ratio and the Amplitude Distribution curves to beincluded in the print-out.
Vertical ScalePressing this button causes the option buttons, for selecting the requiredvertical scale for graphical outputs to be displayed, in the bottom pane. Theoption buttons provide a range of fixed scale and an Automatic option(Automatic provides the best fit scale for the chart).
Note. The minimum selectable scale setting is 0.05µm/div, but ifgauge range 1 is selected and a 60mm stylus arm is in use, then theminimum scale that will be printed out is 0.1µm/div. Also if gaugerange 1 is selected and a 120mm stylus arm is in use, then the minimumscale that will be printed out is 0.2µm/div. Only if gauge range 2 isselected, with either the 60mm or the 120mm stylus arms, will0.05µm/div scale settings be printed.
Horizontal ScalePressing this button causes the option buttons, for selecting the requiredhorizontal scale of graphical outputs, to be displayed in the bottom pane.The option buttons provide a range of fixed scale and an Automatic option(Automatic provides the best fit scale for the chart).
DESCRIPTION
Page 58 Issue 1.5, June 2002
Customer Text
Pressing this button causes a Customer text field to be displayed in thebottom pane. Text, of up to 40 characters can be entered in this field. Thisis included in any printout, when the Header option is selected.
Auto Print ResultsWhen this option is selected, results data is automatically printed after eachdata analysis.
DESCRIPTION
Issue 1.5, June 2002 Page 59
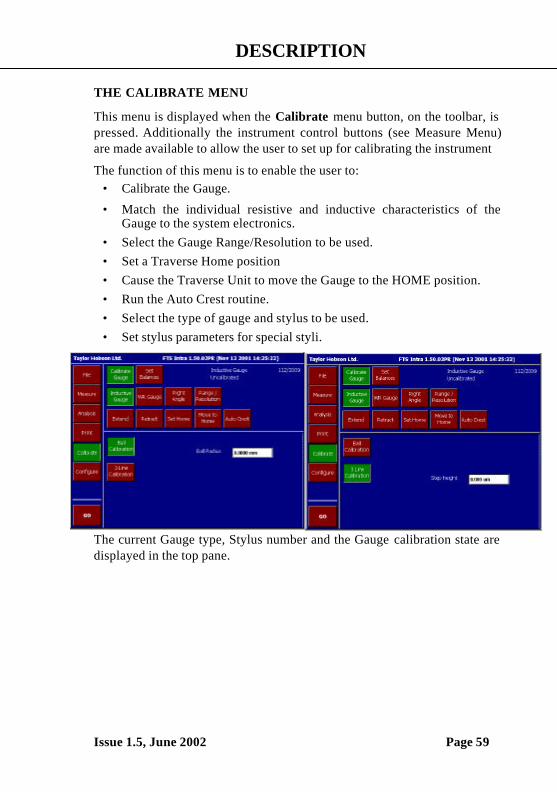
THE CALIBRATE MENU
This menu is displayed when the Calibrate menu button, on the toolbar, ispressed. Additionally the instrument control buttons (see Measure Menu)are made available to allow the user to set up for calibrating the instrument
The function of this menu is to enable the user to:• Calibrate the Gauge.
• Match the individual resistive and inductive characteristics of theGauge to the system electronics.
• Select the Gauge Range/Resolution to be used.• Set a Traverse Home position• Cause the Traverse Unit to move the Gauge to the HOME position.• Run the Auto Crest routine.• Select the type of gauge and stylus to be used.• Set stylus parameters for special styli.
The current Gauge type, Stylus number and the Gauge calibration state aredisplayed in the top pane.
DESCRIPTION
Page 60 Issue 1.5, June 2002
Calibrate Gauge
When this option is selected, a Ball Calibration and a 3-line Calibrationbutton display in the bottom pane. Select the required option and enter theradius of the calibration ball or the step height, to which the instrument is tobe calibrated, into the field displayed. When the GO button is pressed, aroutine is run to calibrate the instrument. (see Gauge Calibration-page 72).
Set BalancesWhen this option is selected and the GO button is pressed, a routine is runto match the individual resistive and inductive characteristics of the Gaugeto the system electronics. (see Set Balances -page 69).
Inductive GaugeWhen this option is pressed and selected, then a list of available styli for thecurrent Gauge and the details of the currently selected stylus are displayedin the bottom pane. The list of styli options includes Special #1 andSpecial #2. These options enable the user to input details of their ownspecial styli.
WR GaugeWhen this option is pressed and selected, then a list of available styli for thecurrent Gauge and the details of the currently selected stylus are displayedin the bottom pane. The list of styli options includes Special #1 andSpecial #2. These options enable the user to input details of their ownspecial styli.
Right AngleThis button MUST be pressed if the Right Angle Attachment is fitted, seeRight Angle Attachment on Page 134.
There are a number of options available when the Calibrate Gauge andeither the Inductive Gauge or the WR Gauge buttons are pressed. Theseoptions are detailed as follows:
Up / DownPressing these buttons causes the highlight to be scrolled throughthe list of Styli.
SelectPressing this button causes the highlighted Stylus to be selected asthe current stylus. Any details from a previous calibration for thatstylus are installed and the displayed stylus dimensions areappropriately updated.
DESCRIPTION
Issue 1.5, June 2002 Page 61
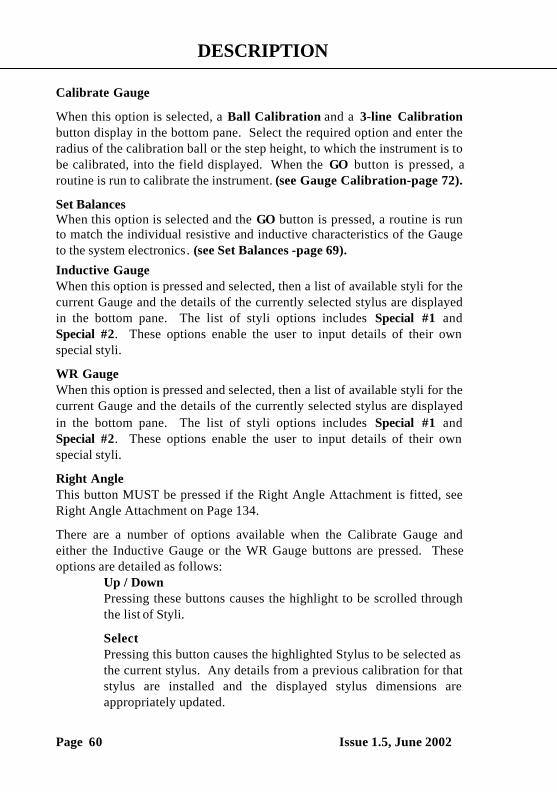
Entering Details of a Special Stylus
Using the Up / Down buttons move the highlight through the list ofstyli options, to highlight either Special #1 or Special #2, and pressthe Select button.
Press on each of the Shank Clearance, Shank Length, TipRadius and Arm Length fields in turn and enter the details of thespecial stylus.
Note If, after calibration, the details of a special stylus arechanged, then the calibration is lost and the default calibrationvalues are implemented.
Range/ResolutionWhen this option is selected, option buttons for selecting the requiredGauge range and resolution are displayed in the bottom pane. One of thebuttons is always selected. Selecting a non-selected button will change thecurrent range and resolution setting and update the calibration details, fromthe calibration file.
DESCRIPTION
Page 62 Issue 1.5, June 2002
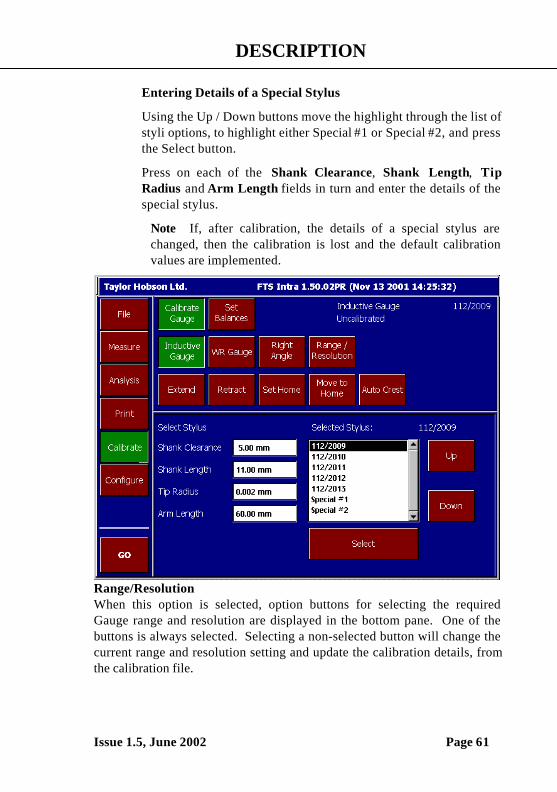
THE CONFIGURE MENU
This menu is displayed when the Configure menu button, on the toolbar, ispressed.
The function of this menu is to enable the user to set the Screen Colours, theDate and Time, the Language the information is presented in, the Units ofmeasurement, the Power Save facility and select the Traverse Unit on or offline.
The settings made from this menu are saved in a system configuration fileand are restored to the system when the PCM. is switched on. The toolbarGO button is not active with this menu.
The current Date and Time are displayed in the top pane.
DESCRIPTION
Issue 1.5, June 2002 Page 63
The control button and field functions are as follows:
Screen ColoursSelecting this option causes the screen colour option buttons to be displayedin the bottom pane. Each option represents a pre-defined colour schemesuch as light on dark or dark on light. When a selection is made the menucolour scheme is immediately changed.
Note The colour schemes also apply to the results displays
Set Date & TimeSelecting this option causes buttons for selecting the type of presentationand fields for updating the date and time to be displayed in the top pane.
LanguagePressing this button enables the user to select the language that theinformation is presented on the PCM in. The options available are given asa series of buttons located in the bottom pane. At present the languagesavailable are English, French, German, Italian, Spanish, BrazilianPortuguese, Polish and Czech.

DESCRIPTION
Page 64 Issue 1.5, June 2002
Reset to DefaultsSelecting this option causes the settings for the system configuration,Measurement, Analysis and Printer to revert to their default values. Thecalibration menu selections, including the current Gauge and Stylus, willalso be reset, thereby putting the system into a known state.
As a consequence, the physical configuration of the system might no longermatch the software configuration.
Inch UnitsWhen this option is selected, all input and output values are in inch units.When not selected, all input and output values are in metric units.
Power SaveIf, when this option is selected, no action is carried out on the PCM formore than ten minutes, then the LCD light is switched off and the processoris switched to minimum power mode. This condition will persist until thescreen is touched. Full operation is then restored.
TU ConnectedWhen this option is selected, communication with the Traverse Unit isattempted (e.g. to control movements, set units and gauge magnification andto start a measurement). When not selected no communications with theTU will be attempted.
Note. If prior to switching off the TU is not connected to the PCM andthe ‘TU not connected’ button is not selected, then an error is generated. Ifanalysis only is required when the PCM is switched on, then the errormessage may have to be cleared up to three times before data can be loadedfor analysis
DESCRIPTION
Issue 1.5, June 2002 Page 65
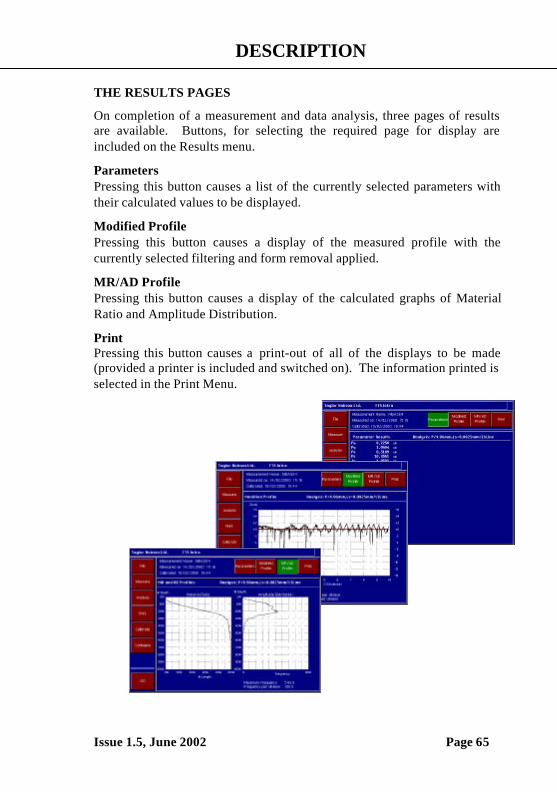
THE RESULTS PAGES
On completion of a measurement and data analysis, three pages of resultsare available. Buttons, for selecting the required page for display areincluded on the Results menu.
ParametersPressing this button causes a list of the currently selected parameters withtheir calculated values to be displayed.
Modified ProfilePressing this button causes a display of the measured profile with thecurrently selected filtering and form removal applied.
MR/AD ProfilePressing this button causes a display of the calculated graphs of MaterialRatio and Amplitude Distribution.
PrintPressing this button causes a print-out of all of the displays to be made(provided a printer is included and switched on). The information printed isselected in the Print Menu.
DESCRIPTION
Page 66 Issue 1.5, June 2002
OPERATION
CONTENTS
Issue 1.5, June 2002 Page 67
SWITCHING ON 68
SETTING THE GAUGE BALANCES AND CALIBRATION 68SET BALANCES 69
Y-Axis Cresting 70X-Axis Cresting 70
GAUGE CALIBRATION 72Calibrating using the Ball Standard 72Assessing Calibration Results 73Calibrating using the 3-Line Standard 75
MAKING MEASUREMENTS 77Tilt adjustment option 78
ANALYSIS 79Raw data 79Exclude options feature 79
OPERATION
Page 68 Issue 1.5, June 2002
SWITCHING ON
The Traverse Unit MUST be powered up before the Processor ControlModule so that when the PCM is powered up it can detect the TraverseUnit. If the PCM is powered up first, an error is generated.
SETTING THE GAUGE BALANCES AND CALIBRATION
Setting the Gauge balancesThis is an automatic procedure that tests the electrical characteristics of thegauge and causes its individual resistive and inductive characteristics to bematched to the system electronics.
It is essential to carry out this procedure when the system has been newlyinstalled, relocated, or when the gauge has been changed.
Note The instrument must be calibrated immediately after setting thebalances.
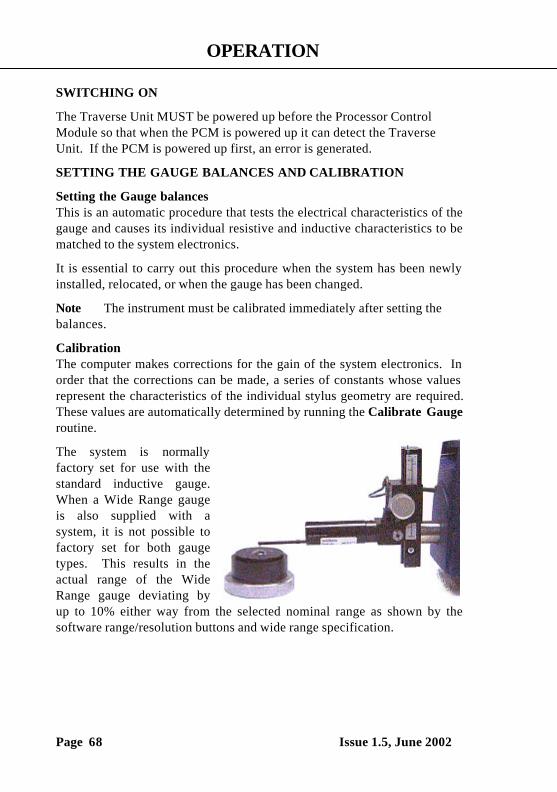
CalibrationThe computer makes corrections for the gain of the system electronics. Inorder that the corrections can be made, a series of constants whose valuesrepresent the characteristics of the individual stylus geometry are required.These values are automatically determined by running the Calibrate Gaugeroutine.
The system is normallyfactory set for use with thestandard inductive gauge.When a Wide Range gaugeis also supplied with asystem, it is not possible tofactory set for both gaugetypes. This results in theactual range of the WideRange gauge deviating byup to 10% either way from the selected nominal range as shown by thesoftware range/resolution buttons and wide range specification.
OPERATION
Issue 1.5, June 2002 Page 69
When using the right angle attachment, the pick-up must first be calibratedin the normal in-line condition, see Right -Angle attachment information fordetails.
SET BALANCES
The Set Balances procedure requires that the Stylus is traversed over asuitable radial surface. An appropriate surface is provided by thecalibration ball and this is particularly convenient, as it is required that thegauge is re-calibrated after the balances are set.
The procedure is as follows:
On the PCM Unit, press the Calibrate button, on the toolbar, to display theCalibrate menu. Select either the Inductive Gauge or WR Gauge buttonsdepending upon which gauge is fitted and ensure that the details of thecurrent Stylus are correctly entered in the bottom pane.
Before a Set Balances or Calibration routine can be carried out, the Ballstandard must be placed below the stylus tip and crested in both the X andY axes (this is to position the stylus exactly on the crest of the ball). Use theExtend or Retract key to extend the traverse unit to its approximate midposition and then centre the ball standard beneath the stylus tip.
For the Set Balance routine, nominal cresting is sufficient. However, forthe Calibration routine, it is important to achieve crowning of the bestaccuracy possible.
As the instrument must be calibrated immediately after setting the balances,cresting must be carried out to the best accurately possible. For this reasonit is preferred that the standard is mounted on a Y axis table. If a Y axistable is not available, then the standard can be carefully moved by hand.
The cresting procedure is as follows:
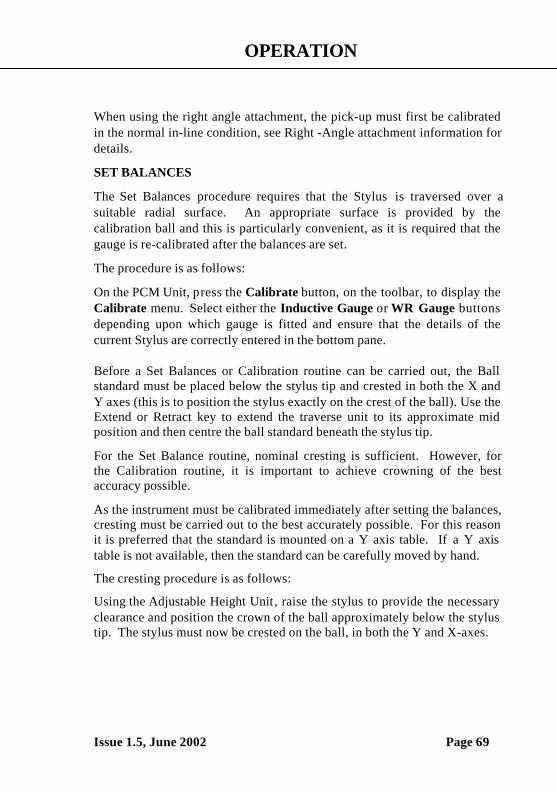
Using the Adjustable Height Unit, raise the stylus to provide the necessaryclearance and position the crown of the ball approximately below the stylustip. The stylus must now be crested on the ball, in both the Y and X-axes.
OPERATION
Page 70 Issue 1.5, June 2002
Y-axis cresting:From the Calibrate Menu, select the widest range (1mm for InductiveGauge with 112/2009 stylus). Lower the stylus into contact with the ballof the standard until the Traverse Unit display indicates that the gauge isapproximately mid-range (gauge reading approximately zero).
Caution. When manually contacting a component with thestylus, the Traverse Unit display must be observed carefully as damageto the stylus may occur if the display changes to +***.**; this indicatesa gauge out of range (high) position and at a small distance beyond thisthe mechanical end stop will be encountered.
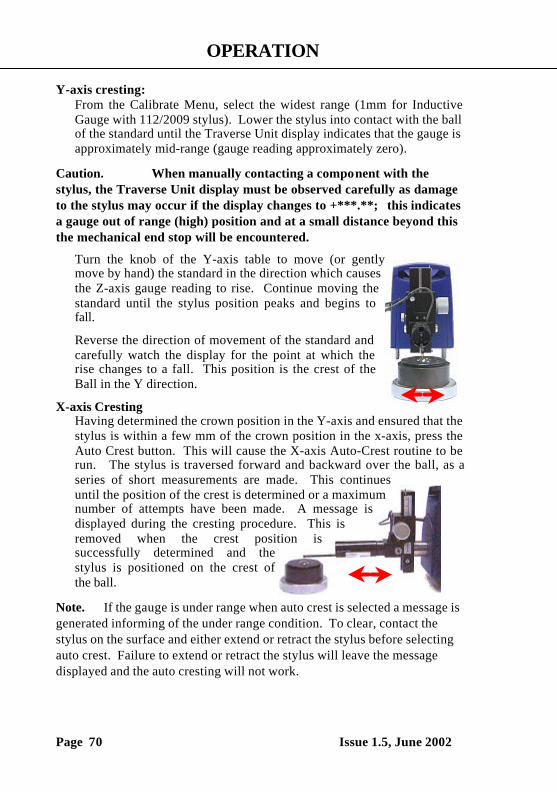
Turn the knob of the Y-axis table to move (or gentlymove by hand) the standard in the direction which causesthe Z-axis gauge reading to rise. Continue moving thestandard until the stylus position peaks and begins tofall.
Reverse the direction of movement of the standard andcarefully watch the display for the point at which therise changes to a fall. This position is the crest of theBall in the Y direction.
X-axis CrestingHaving determined the crown position in the Y-axis and ensured that thestylus is within a few mm of the crown position in the x-axis, press theAuto Crest button. This will cause the X-axis Auto-Crest routine to berun. The stylus is traversed forward and backward over the ball, as aseries of short measurements are made. This continuesuntil the position of the crest is determined or a maximumnumber of attempts have been made. A message isdisplayed during the cresting procedure. This isremoved when the crest position issuccessfully determined and thestylus is positioned on the crest ofthe ball.
Note. If the gauge is under range when auto crest is selected a message isgenerated informing of the under range condition. To clear, contact thestylus on the surface and either extend or retract the stylus before selectingauto crest. Failure to extend or retract the stylus will leave the messagedisplayed and the auto cresting will not work.
OPERATION
Issue 1.5, June 2002 Page 71
Select the Set Balances option from the top pane of the PCM display andpress the GO button. A message is displayed, instructing the user toensure that the Stylus is crowned in both the X and Y axes and is set to aspecific displacement.
Use the Adjustable Height Unit to adjust the height of the Gauge untilthe Traverse Unit display indicates a Stylus height reading ofapproximately the specified value. Do not disturb the position of theStylus from the ball crown.
Select the OK option, from the displayed message panel. The balancesetting procedure is then carried out.
The Gauge should now be calibrated.
Note. Calibration should be performed using the appropriatecalibration artefact, see SPECIFICATION.

OPERATION
Page 72 Issue 1.5, June 2002
GAUGE CALIBRATION
Calibrating using the Ball Standard
Gauge Calibration should be performed on each gauge range to be used.
This is carried out as follows:
On the PCM Unit, press the Calibrate button, on the toolbar, to displaythe Calibrate menu.
Select either the Inductive Gauge or WR Gauge buttons dependingupon which gauge is fitted and ensure that the details of the currentStylus are correctly entered in the bottom pane.
From the top pane, select the Calibrate Gauge option and then in thelower pane select Ball Calibration . Into the Ball Radius field, in thebottom pane, enter the radius of the calibration ball to which theinstrument is to be calibrated.
The Calibration procedure is then, as follows:
Before the calibration measurement is made, the Ball standard must beplaced below the stylus tip and crested, to the best accurately possible,in both the X and Y-axes. This procedure is the same as for Setting theBalances and is described on the previous page.
Having positioned the Stylus on the crest of the calibration ball, selectthe gauge range to be used and then select the Calibrate Gauge optionfrom the top pane of the PCM display and press the GO button.
A message, instructing the user to ensure that the Stylus is crowned inboth the X and Y axes and is set to a specific displacement.
Use the Adjustable Height Unit to adjust the height of the Gauge untilthe Traverse Unit display indicates a Stylus height reading ofapproximately the specified value. Do not disturb the position of theStylus in the X and Y-axes. Press the OK button on the message.
The stylus is traversed forward and backward over the ball, as a series ofshort measurements is made. This process continues until the requiredsurface data is obtained. The data is analysed and the calibrationmeasurement results are displayed. This is overlaid with a message:
Press the Continue button.
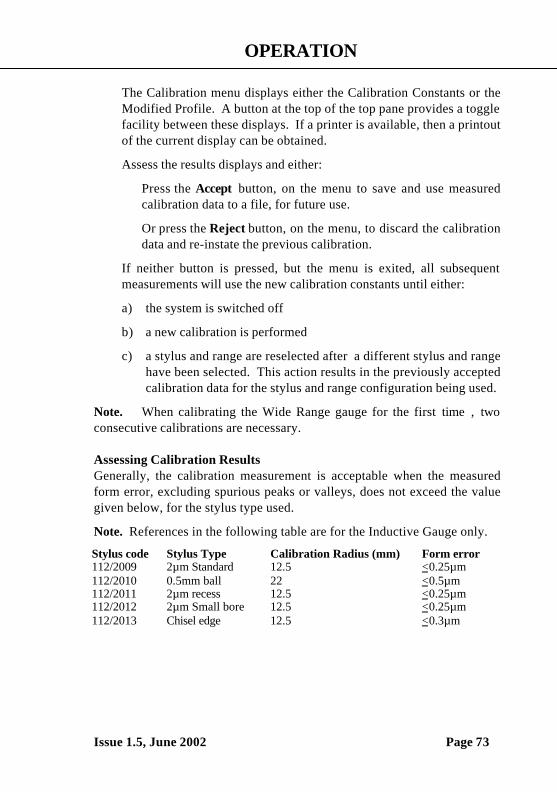
OPERATION
Issue 1.5, June 2002 Page 73
The Calibration menu displays either the Calibration Constants or theModified Profile. A button at the top of the top pane provides a togglefacility between these displays. If a printer is available, then a printoutof the current display can be obtained.
Assess the results displays and either:
Press the Accept button, on the menu to save and use measuredcalibration data to a file, for future use.
Or press the Reject button, on the menu, to discard the calibrationdata and re-instate the previous calibration.
If neither button is pressed, but the menu is exited, all subsequentmeasurements will use the new calibration constants until either:
a) the system is switched off
b) a new calibration is performed
c) a stylus and range are reselected after a different stylus and rangehave been selected. This action results in the previously acceptedcalibration data for the stylus and range configuration being used.
Note. When calibrating the Wide Range gauge for the first time , twoconsecutive calibrations are necessary.
Assessing Calibration ResultsGenerally, the calibration measurement is acceptable when the measuredform error, excluding spurious peaks or valleys, does not exceed the valuegiven below, for the stylus type used.
Note. References in the following table are for the Inductive Gauge only.
Stylus code Stylus Type Calibration Radius (mm) Form error112/2009 2µm Standard 12.5 <0.25µm112/2010 0.5mm ball 22 <0.5µm112/2011 2µm recess 12.5 <0.25µm112/2012 2µm Small bore 12.5 <0.25µm112/2013 Chisel edge 12.5 <0.3µm
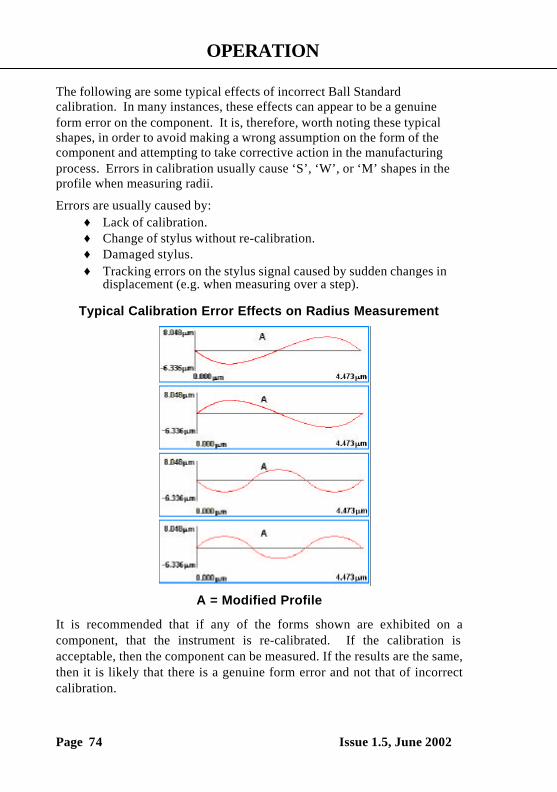
OPERATION
Page 74 Issue 1.5, June 2002
The following are some typical effects of incorrect Ball Standardcalibration. In many instances, these effects can appear to be a genuineform error on the component. It is, therefore, worth noting these typicalshapes, in order to avoid making a wrong assumption on the form of thecomponent and attempting to take corrective action in the manufacturingprocess. Errors in calibration usually cause ‘S’, ‘W’, or ‘M’ shapes in theprofile when measuring radii.
Errors are usually caused by:♦ Lack of calibration.♦ Change of stylus without re-calibration.♦ Damaged stylus.♦ Tracking errors on the stylus signal caused by sudden changes in
displacement (e.g. when measuring over a step).
Typical Calibration Error Effects on Radius Measurement
A = Modified Profile
It is recommended that if any of the forms shown are exhibited on acomponent, that the instrument is re-calibrated. If the calibration isacceptable, then the component can be measured. If the results are the same,then it is likely that there is a genuine form error and not that of incorrectcalibration.
OPERATION
Issue 1.5, June 2002 Page 75
Calibrating using the 3-Line Standard
Gauge Calibration should be performed on each gauge range to be used.
Calibrate using the 2.5µm (nominal) height lines on the 3- line standard.
Note. Before performing the calibration procedure, a check measurementshould be made to ensure that:a) the calibration traverse can be completed without the gauge goingout of range,b) all three lines are contained in the traverse,c) the 3-line standard is nominally level (ie parallel to the traversedatum) and,d) the line standard is in good condition (ie no scratches or dirt).
The calibration is carried out as follows:
On the PCM Unit, press the Calibrate button, on the toolbar, to displaythe Calibrate menu.
Select either the Inductive Gauge or WR Gauge buttons dependingupon which gauge is fitted and ensure that the details of the currentStylus are correctly entered in the bottom pane.
From the top pane, select the Calibrate Gauge option and then in thelower pane select 3-Line Calibration . Into the Step Height field, in thebottom pane, enter the height of the step on the 3-line calibrationstandard to which the instrument is to be calibrated.
The Calibration and check measurement procedure is then, as follows:
Place the calibration standard below the stylus, lower the stylus intocontact with the standard at a point just in front of the marked rectanglewhich contains the three lines to be measured. The stylus should bepositioned to bring the gauge reading to approximately its mid-positioni.e. a reading of about zero.
Check that the calibration standard is nominally level with respect to thetraverse unit. This can be done initially by eye and then by observingthe gauge height position at the two ends of the proposed traverse(which is typically 4mm long). Perform a check measurement asfollows:
OPERATION
Page 76 Issue 1.5, June 2002
Press the Analysis button to display the Analysis menu. Press thePrimary button and in the bottom pane select None and a data length of4mm. Press the Form Type button and in the bottom pane select None .
Press the Measure button followed by Go, but ensuring that the AutoReverse button is enabled and the lift off message is disabled, to performthe measurement. If the above conditions are met perform thecalibration as stated below. Return to the Calibrate menu and press Go.Follow the on-screen messages.
After traversing the 3-line standard, the Calibration menu displays eitherthe Calibration Constants or the Modified Profile. A button at the top ofthe top pane provides a toggle facility between these displays. If aprinter is available, then a printout of the current display can beobtained.
Assess the results displays (see note below) and either:
Press the Accept button, on the menu to save and use measuredcalibration data to a file, for future use.
Or press the Reject button, on the menu, to discard the calibrationdata and re-instate the previous calibration.
If neither button is pressed, but the menu is exited, all subsequentmeasurements will use the new calibration constants until either:
a) the system is switched off
b) a new calibration is performed
c) a stylus and range are reselected after a different stylus andrange have been selected. This action results in the previouslyaccepted calibration data for the stylus and range configurationbeing used.
Note. The calibration procedure compares the measured averagedistance from the adjacent ‘tops’ of the central line to the ‘bottom’ ofthat central line with the stated Step Height value and alters the gaugegain accordingly. From a calibration graph, if this average distance (notthe Pt value) does not agree with the 4% tolerance, recalibrate theinstrument. If there is a considerable difference between the stated andmeasured values, then perform the procedure for setting the balance andphase of the system before re-calibrating.
OPERATION
Issue 1.5, June 2002 Page 77
MAKING MEASUREMENTS
Making a measurement involves acquiring data from the surface of thecomponent. This data is collected as many thousands of discrete points, towhich the gauge calibration corrections are applied. The data is thenprocessed and the results are displayed. The computer retains theunprocessed profile data, which can then be used for further analyses withdifferent selections of filter, parameters and form etc.
Before making a measurement, there are a few general points of procedurethat should be applied.
1. Ensure that the Set Balances routine has been recently run for theGauge fitted and that the system has been correctly Calibrated (seethe previous chapter- SETTING THE GAUGE BALANCES ANDCALIBRATION).
2. Ensure that the Gauge Information is correct for the current gauge(see the Calibrate menu).
3. From the Analysis menu, select the required Parameters, Reference,Data Length and Filter, as appropriate.
4. Select the Measure menu. Set up the component with respect to theline of traverse of the stylus. The surface to be measured shouldgenerally be parallel to the line of traverse and when measuringalong the length of a cylindrical component, the crest of thecomponent must be directly under the stylus.
If a curved component (convex or concave) is being measured, thecomponent should be crested in both the X and Y as stated on page64
The smallest curved component that can be successfully crested is1mm radius (Range 1) and 2mm (Range 2) for a diamond stylus(112/2009) and 3mm (Ranges 1 and 2) for a ball stylus (112/2010)
The maximum curved component that can be successfully crested is1000mm radius for both ball and diamond stylus tips.

OPERATION
Page 78 Issue 1.5, June 2002
5. Use the Adjustable Height Unit to bring the stylus into contact withthe component. Adjust the height of the Gauge, so that during themeasurement, the Stylus movement will remain within Gauge rangeover the entire measurement length.
Do not lower the Stylus so that it is pressed hard against thecomponent. This will cause damage to the stylus. A Traverseoperation cannot be made if the Gauge is over-range. Whenmanually contacting a component with the stylus, the Traverse Unitdisplay must be observed carefully as damage to the stylus mayoccur if the display changes to +***.**; this indicates a gauge outof range (high) position and at a small distance beyond this themechanical end stop will be encountered.
6. From the Measure menu, press the GO button. The measurementtraverse is carried out and the results are displayed.
A measurement using the LS line and primary analysis will displaythe slope (or tilt) angle.
Tilt adjustment option
If the Traverse Unit has the optional tilt adjustment, the following tablegives the relationship between tilt angle and turns of the tilt adjustmentknob.
Tilt Angle Turns of tiltadjustment knob
0.014º 0.1
0.035º 0.25
0.071º 0.5
0.141º 1
0.282º 2
0.705º 5
1.409º 10
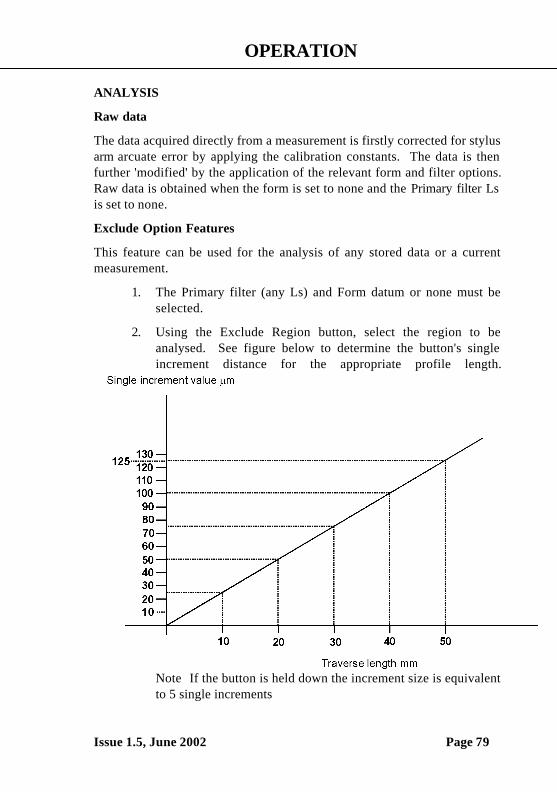
OPERATION
Issue 1.5, June 2002 Page 79
ANALYSIS
Raw data
The data acquired directly from a measurement is firstly corrected for stylusarm arcuate error by applying the calibration constants. The data is thenfurther 'modified' by the application of the relevant form and filter options.Raw data is obtained when the form is set to none and the Primary filter Lsis set to none.
Exclude Option Features
This feature can be used for the analysis of any stored data or a currentmeasurement.
1. The Primary filter (any Ls) and Form datum or none must beselected.
2. Using the Exclude Region button, select the region to beanalysed. See figure below to determine the button's singleincrement distance for the appropriate profile length.
Note If the button is held down the increment size is equivalentto 5 single increments
OPERATION
Page 80 Issue 1.5, June 2002
3. To analyse the selected region, press the Analysis button andselect Form Type and Filter required for the analysis. To ensurethat the full included region is analysed the data length/numberof cut-offs should be set to a value greater than or equal to theincluded region.
4. Press Go to perform the analysis.
If a different analysis is required the sequence from 1 to 4 must be repeated.If after following 1 and 2 the Go button is pressed the analysis will beperformed over the selected region. If then 3 and 4 are performed theresultant analysis will be over the full region and not the selected region.

PARAMETERS AND DEFINITIONS
CONTENTS
Issue 1.5, June 2002 Page 81
What surface texture is and why it is necessary to measure it are subjectscovered in the book Exploring Surface Texture, from Taylor Hobson. Theuser is advised to read this book to obtain background information onsurface texture in general and on stylus-type measuring instruments inparticular. It also gives useful information on parameters: their derivationand use.
N.B. Some of these parameters are not applicable to your instrument
Page
MEASURING SURFACE TEXTURE 84DATALOGGING 86DATA CORRECTION 86FORM REMOVAL PROCESS 86FILTERING 87PARAMETER CALCULATION 87FORM REMOVAL 88STRAIGHT LINE FITS 88ARCUATE FITS 88DATUM & NULL REFERENCES 88
FILTERS 90FOURIER PRINCIPLE 90APPLICATION TO INSTRUMENT BANDWIDTH 91WAVINESS (FILTERING) 93PRIMARY FILTERING 94FILTERING OPTIONS 94DATA POINTS AND FILTERING OPTIONS 94CUT OFF/FILTER TYPES 962CR FILTERS 97GAUSSIAN FILTERS 99RK FILTER 100R & W FILTER 100
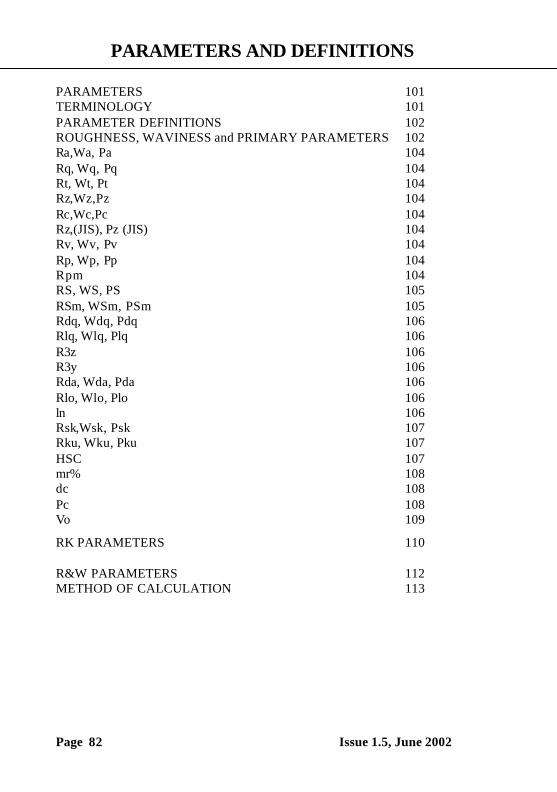
PARAMETERS AND DEFINITIONS
Page 82 Issue 1.5, June 2002
PARAMETERS 101TERMINOLOGY 101PARAMETER DEFINITIONS 102ROUGHNESS, WAVINESS and PRIMARY PARAMETERS 102Ra,Wa, Pa 104Rq, Wq, Pq 104Rt, Wt, Pt 104Rz,Wz,Pz 104Rc,Wc,Pc 104Rz,(JIS), Pz (JIS) 104Rv, Wv, Pv 104Rp, Wp, Pp 104Rpm 104RS, WS, PS 105RSm, WSm, PSm 105Rdq, Wdq, Pdq 106Rlq, Wlq, Plq 106R3z 106R3y 106Rda, Wda, Pda 106Rlo, Wlo, Plo 106ln 106Rsk,Wsk, Psk 107Rku, Wku, Pku 107HSC 107mr% 108dc 108Pc 108Vo 109
RK PARAMETERS 110
R&W PARAMETERS 112METHOD OF CALCULATION 113
PARAMETERS AND DEFINITIONS
Issue 1.5, June 2002 Page 83
CALIBRATION 115
CALIBRATION ERRORS 116RADIUS (MATHEMATICAL REFERENCE) 118ACCURACY OF RADIUS MEASUREMENT 119THE EFFECT OF STYLUS GEOMETRY 120STYLUS FLANKING 121
SAMPLING INTERVAL THEORY 123ALIASING 123EFFECT ON RESULTS 124
AMPLIFIER CHARACTERISTICS 125
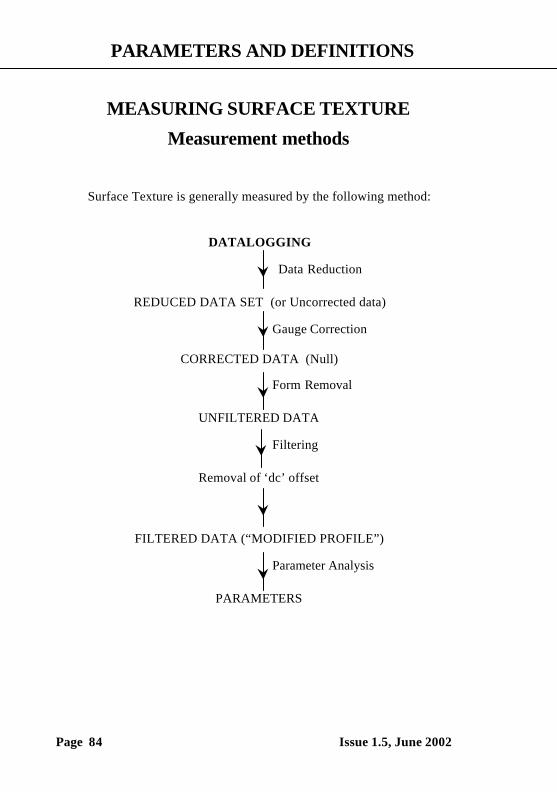
PARAMETERS AND DEFINITIONS
Page 84 Issue 1.5, June 2002
MEASURING SURFACE TEXTURE
Measurement methods
Surface Texture is generally measured by the following method:
DATALOGGING
Data Reduction
REDUCED DATA SET (or Uncorrected data)
Gauge Correction
CORRECTED DATA (Null)
Form Removal
UNFILTERED DATA
Filtering
Removal of ‘dc’ offset
FILTERED DATA (“MODIFIED PROFILE”)
Parameter Analysis
PARAMETERS
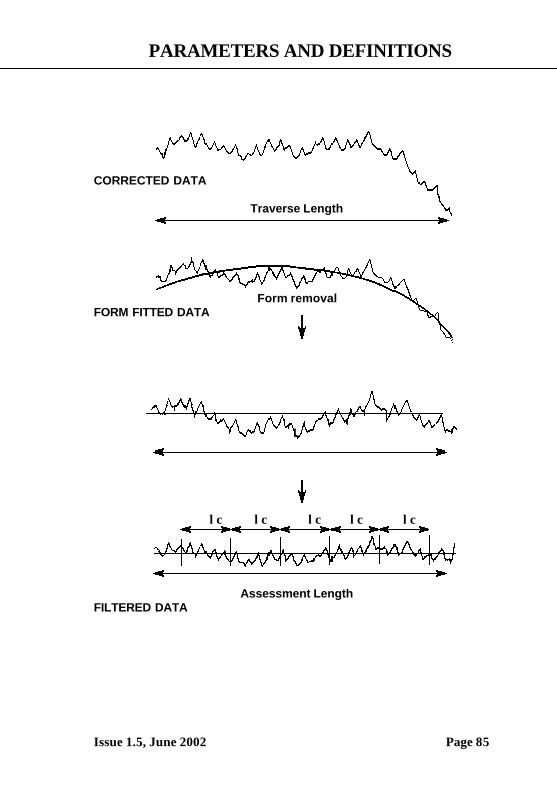
PARAMETERS AND DEFINITIONS
Issue 1.5, June 2002 Page 85
CORRECTED DATA
Traverse Length
Form removalFORM FITTED DATA
L
λc λc λc λc λc
Assessment LengthFILTERED DATA

PARAMETERS AND DEFINITIONS
Page 86 Issue 1.5, June 2002
DATALOGGINGData is collected at regular intervals along the Surface, at a spacing of0.5µm.
Generally, this large amount of data may be reduced to a smaller set tomake the data more manageable and to speed up subsequent processing.This is performed using a weighted average method. A reduction ratio ischosen so that sufficient data density remains in order to allow the filters(see FILTERING) to achieve reasonable transmission characteristics, evenfor short wavelength filtering.
The data reduction process also performs the function of anti-aliasing.
DATA CORRECTIONThe reduced data will be unscaled and contain distortion due to thesystematic errors in the gauge. A scaling and correction is thereforeapplied, based on the Gauge Correction factors, that results inCORRECTED DATA.
FORM REMOVAL PROCESSForm Removal is the elimination of the nominal shape of the componentfrom the assessment of texture. This includes removal of slope orcurvature. Form Removal may be applied either to access the form or toremove the form from subsequent surface analyses.
Form Removal, in general, fits a reference shape (Reference line) to thecorrected data. A by-product of this process is the characteristics of thereference figure regarding slope or radius. The removal of form from theCORRECTED DATA results in the UNFILTERED DATA.
Individual options of Form Removal are defined later in this section.
PARAMETERS AND DEFINITIONS
Issue 1.5, June 2002 Page 87
FILTERINGAlthough the data at this point has been reduced, it is normally referred toas UNFILTERED. However, if required at this stage, filtering is carriedout. There are many methods of filtering but all are intended to removewavelengths from the data that are of no interest. This may be because ofthe intended function of the surface or in order to eliminate invalid datacaused by extraneous noise etc.
Some filters result in discarding part of the data. The resulting data set afterthis stage, whether filtering has been applied or not, is known as theMODIFIED PROFILE.
Care should be taken if applying filters to data if FORM REMOVAL hasbeen performed for the purposes of form measurement. Filters by definitiondistort this profile and are therefore best avoided unless restricted tofiltering out wavelengths that are much shorter than those characteristic ofcomponent form.
Definitions and characteristics of the various standard filters are discussedlater in this section.
PARAMETER CALCULATIONMathematical parameters may be calculated from the MODIFIEDPROFILE. There are many parameters dealing with the characteristics ofthe surface geometry, these are discussed later in this section.
PARAMETERS AND DEFINITIONS
Page 88 Issue 1.5, June 2002
Form removalThe purposes of form removal is to provide a reference line or figure to:- a) Uniquely define the form and its position. b) Provide a reference about which surface finish parameters may
be calculated.Possible form options are:
STRAIGHT LINE FITS Least Squares Straight Line - This technique uses the method of leastsquares to derive a MEAN LINE such that the sum of the squares of theresidual deviations are minimised. This mean line becomes the ‘Referenceline’.
Minimum Zone Lines - These lines are a geometric fit of two parallel linesenclosing the profile such that their separation is a minimum.The bisecting line of the two MZ lines becomes the ‘Reference line’.Both straight line references inherently removes SLOPE from the data.SLOPE as measured to the instrument datum is a RESULT of these types ofFORM REMOVAL. The convention is, SLOPES which indicate a risingstylus are positive and those indicating a falling stylus are negative.
ARCUATE FITSLeast Squares Arc - This is the best-fit arc such that the sum of the squaresof the deviations from the arc are at a minimum.
Absolute Arc , This arc is calculated with reference to a specified radius.
This reference line also provides a radius result and the shape of the arc,either concave or convex.
DATUM & NULL REFERENCESDuring the explanation of data correction, we explained that prior to theform fitting, the data was simply known as CORRECTED DATA. Whilstthis data is now qualified by the calibration factors, the reference origin ofthe data remains as the gauge electrical zero.
PARAMETERS AND DEFINITIONS
Issue 1.5, June 2002 Page 89
Data represented in this form is known as NULL (Form type ‘None’), andin itself is useful since subsequent measurements can be compared by fixingthe gauge zero.
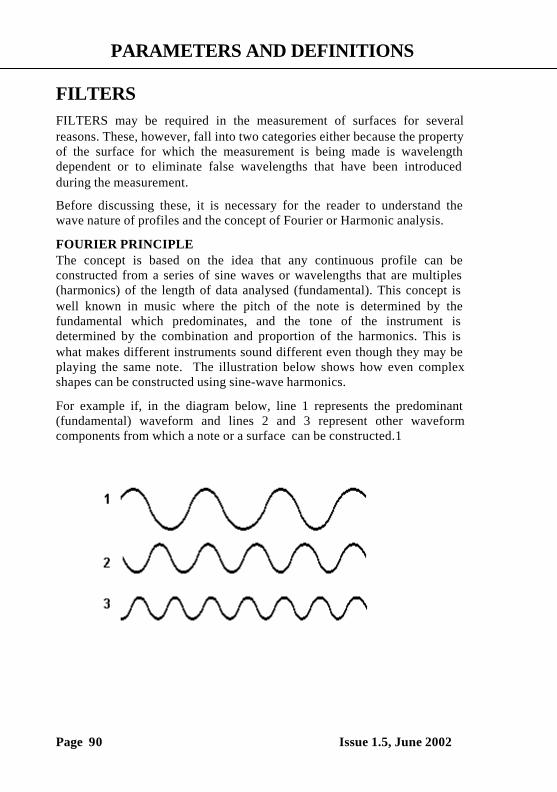
PARAMETERS AND DEFINITIONS
Page 90 Issue 1.5, June 2002
FILTERSFILTERS may be required in the measurement of surfaces for severalreasons. These, however, fall into two categories either because the propertyof the surface for which the measurement is being made is wavelengthdependent or to eliminate false wavelengths that have been introducedduring the measurement.
Before discussing these, it is necessary for the reader to understand thewave nature of profiles and the concept of Fourier or Harmonic analysis.
FOURIER PRINCIPLEThe concept is based on the idea that any continuous profile can beconstructed from a series of sine waves or wavelengths that are multiples(harmonics) of the length of data analysed (fundamental). This concept iswell known in music where the pitch of the note is determined by thefundamental which predominates, and the tone of the instrument isdetermined by the combination and proportion of the harmonics. This iswhat makes different instruments sound different even though they may beplaying the same note. The illustration below shows how even complexshapes can be constructed using sine-wave harmonics.
For example if, in the diagram below, line 1 represents the predominant(fundamental) waveform and lines 2 and 3 represent other waveformcomponents from which a note or a surface can be constructed.1

PARAMETERS AND DEFINITIONS
Issue 1.5, June 2002 Page 91
Then, when waveform 2 is superimposed onto the fundamental, theresulting form can be as shown below.
When waveform 3 is the superimposed onto the form generated fromwaveforms 1 and 2, then a resulting form can be as shown below.
Note that not all components are in step with each other i.e. we need toknow not only the amplitude of the component but also its phase in relationto the fundamental.
APPLICATION TO INSTRUMENTATION-BANDWIDTHIn measurement technology and electronics pure sine waves are welcomedbecause they are easy to handle and the response to processing can bereadily predicted. In this way, if the instrument response can be defined forsine waves of specific wavelength, then because of the Fourier principle(and the assumption that the measuring instrument is a linear system) theresponse to any surface can be predicted by considering the surface as agroup of sine wave components.
The problem is that all natural systems, be they electronic or mechanical,do not respond equally to signals of different wavelengths in the same way.
aa
a b
X
Y
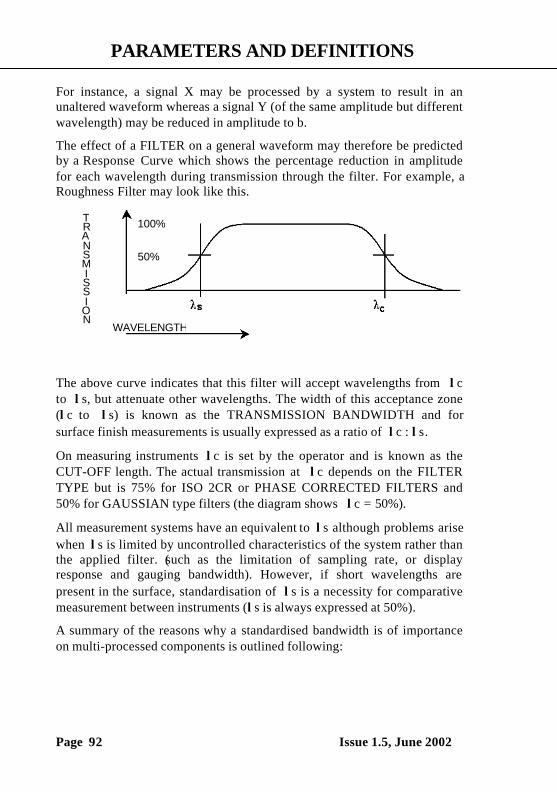
PARAMETERS AND DEFINITIONS
Page 92 Issue 1.5, June 2002
For instance, a signal X may be processed by a system to result in anunaltered waveform whereas a signal Y (of the same amplitude but differentwavelength) may be reduced in amplitude to b.
The effect of a FILTER on a general waveform may therefore be predictedby a Response Curve which shows the percentage reduction in amplitudefor each wavelength during transmission through the filter. For example, aRoughness Filter may look like this.
The above curve indicates that this filter will accept wavelengths from λcto λs, but attenuate other wavelengths. The width of this acceptance zone(λc to λs) is known as the TRANSMISSION BANDWIDTH and forsurface finish measurements is usually expressed as a ratio of λc : λs.
On measuring instruments λc is set by the operator and is known as theCUT-OFF length. The actual transmission at λc depends on the FILTERTYPE but is 75% for ISO 2CR or PHASE CORRECTED FILTERS and50% for GAUSSIAN type filters (the diagram shows λc = 50%).
All measurement systems have an equivalent to λs although problems arisewhen λs is limited by uncontrolled characteristics of the system rather thanthe applied filter. (such as the limitation of sampling rate, or displayresponse and gauging bandwidth). However, if short wavelengths arepresent in the surface, standardisation of λs is a necessity for comparativemeasurement between instruments (λs is always expressed at 50%).
A summary of the reasons why a standardised bandwidth is of importanceon multi-processed components is outlined following:
100%
50%
TRANSMISSION
WAVELENGTH
PARAMETERS AND DEFINITIONS
Issue 1.5, June 2002 Page 93
• Slope or Curvature related parameters are very sensitive to smallwavelengths, and can be dominated by them. The use of a standardisedbandwidth ensures that measurements made are 'Like for Like'.
• Conventional systems allow the stylus geometry to define the lowerlimit of the bandwidth. Since the geometry is not easily defined orcontrolled the use of a definable bandwidth is preferred.
• The use of selectable bandwidths allows a sensible correlation ofmeasurements made over long assessment lengths.
ISO identifies standard CUT-OFF wavelengths in the series 0.025, 0.08,0.25, 0.8, 2.5, 8 mm etc. which result in BANDWIDTHS of 100:1, 300:1,1000:1, (these being the ratios of the above) with 300:1 as preference.
Establishment of λs also has the dual purpose of providing ANTI-ALIASING of the data when in digital form.
WAVINESS (FILTERING) Waviness filtering is essentially the same as for ROUGHNESS, except thatthe FILTER CUT-OFF is specified at the shorter wavelength end of thetransmission curve (therefore, for waviness, λs is not relevant). The longerwavelength end of the transmission curve is limited by the traverse length.The cut off is referred to as λf.
In practice, the lower end of the response is so long that it may be taken tobe close to infinity (i.e. straight line component). Therefore, bandwidthcriteria are not currently generally used in waviness measurements.
ALIASING during WAVINESS measurement is not normally a problemprovided λf is 5 times larger than the sampling interval.
PARAMETERS AND DEFINITIONS
Page 94 Issue 1.5, June 2002
PRIMARY (FILTERING)A primary filter may be applied instead of Roughness or Waviness filtering.The cutoff length is λs. This has the same effect as Waviness filtering, andis typically used with a short wavelength to filter out the high frequency(e.g. noise) elements from the measurement.
FILTERING OPTIONSFiltering options allow the user to specify the cutoff length of the filteringand additionally for Roughness the bandwidth.
NOTE Unless this provision is deliberately made to limit the shortwavelength (high frequency) response of an instrument, it wouldotherwise be determined by the stylus geometry, the electricalamplifier characteristics, or the sampling interval.
These factors would give rise to quite different filteringcharacteristics, and result in different parameter results when thesame surface is measured on different types of instrument.
DATA POINTS AND FILTERING OPTIONSMeasurements are made with a data spacing of 0.5 um so that detailedinformation can be obtained about the surface finish. However, for longercutoff lengths it is not necessary to use all of this data density and so thedata is reduced using an anti-aliasing weighted-average filter. This helps toreduce the time to analyse the measurement data.
The selection of cutoff length (and bandwidth for Roughness filtering), isconstrained by the following criteria:
1. At least 5 points must be available in each filter cutoff length.This applies to the Roughness low pass filter (λs), the Primaryfilter (λs) and the Waviness filter (λf). However, for Primarytypically 10 points are used in each cutoff length, and forWaviness up to 500 points will be used.
2. The data reduction ratio must be a whole number.3. The Roughness bandwidth is determined from a ratio between
the standard cutoff lengths, with limits of about 30:1 to about300:1.
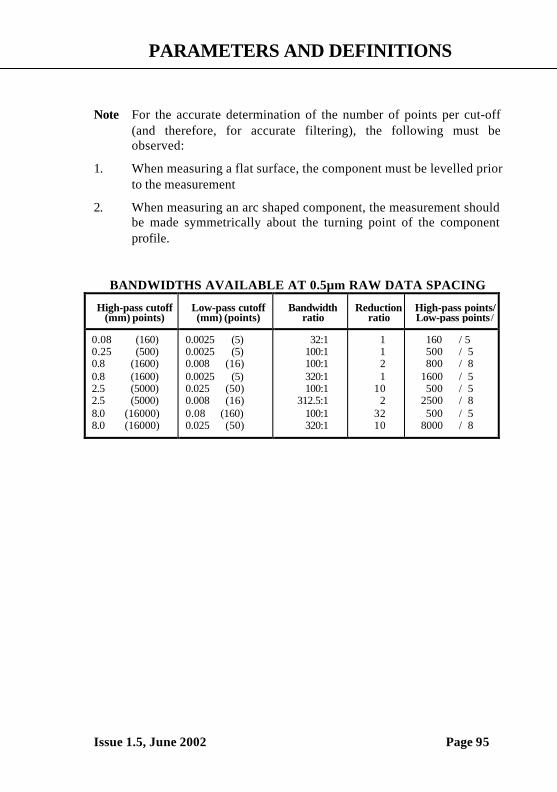
PARAMETERS AND DEFINITIONS
Issue 1.5, June 2002 Page 95
Note For the accurate determination of the number of points per cut-off(and therefore, for accurate filtering), the following must beobserved:
1. When measuring a flat surface, the component must be levelled priorto the measurement
2. When measuring an arc shaped component, the measurement shouldbe made symmetrically about the turning point of the componentprofile.
BANDWIDTHS AVAILABLE AT 0.5µm RAW DATA SPACING
High-pass cutoff(mm) points)
Low-pass cutoff(mm) (points)
Bandwidthratio
Reductionratio
High-pass points/Low-pass points/
0.08 (160)0.25 (500)0.8 (1600)0.8 (1600)2.5 (5000)2.5 (5000)8.0 (16000)8.0 (16000)
0.0025 (5)0.0025 (5)0.008 (16)0.0025 (5)0.025 (50)0.008 (16)0.08 (160)0.025 (50)
32:1100:1100:1320:1100:1
312.5:1100:1320:1
1121
102
3210
160 / 5500 / 5800 / 8
1600 / 5500 / 5
2500 / 8500 / 5
8000 / 8
PARAMETERS AND DEFINITIONS
Page 96 Issue 1.5, June 2002
Cutoff/filter typesThe PROFILE FILTERS for the Roughness long wavelength cutoff, λc,and Waviness cutoff, λf, can be selected by the user from the followingfilter types:
ISO 2CR, 2CR PC (phase corrected), Gaussian filter.
The Primary filter and Roughness short wavelength cutoff, λs areimplemented using the Gaussian filter.
These filters do not give a sharp cut in response to irregularities of widthsgreater than the cut-off length. Instead there is a gradual fall-off inresponse, as shown in the graphs on the following pages.
The 2CR filters (including 2CR PC) have been standardised to have atransmission of 75% at the selected CUT-OFF. This means that theamplitudes of the irregularities having a spacing equal to the CUT-OFFlength are reduced to 75% of their true value. The amplitudes of shorterwavelength irregularities will be almost unchanged. The amplitudes oflonger wavelength irregularities are progressively reduced.
However, Gaussian filters have a transmission of 50% at the cut-offwavelength. This means that the addition of the roughness filtered profileto the waviness filtered profile equals the original unfiltered profile.Coupled with the data discarding arrangement described later, this filtertends to provide a less distorted profile analysis.
The effects of a filter on a particular point depend on the data values of theprevious or following adjacent points (or both dependent on the filter type).For this reason, filtered data cannot be calculated at the extreme ends of thedata.
To minimise this problem, after filtering has taken place, some of the datacollected from the ends of the traverse (particularly the start) is discarded.The amount of data discarded and its location, is dependent on the filterused, as follows:
ISO 2CR -The first two cut-offs are discarded.
2CR PC -The first and last cut-off are discarded.
Gaussian -Half of the first cut-off and half of the last cut-off are discarded.
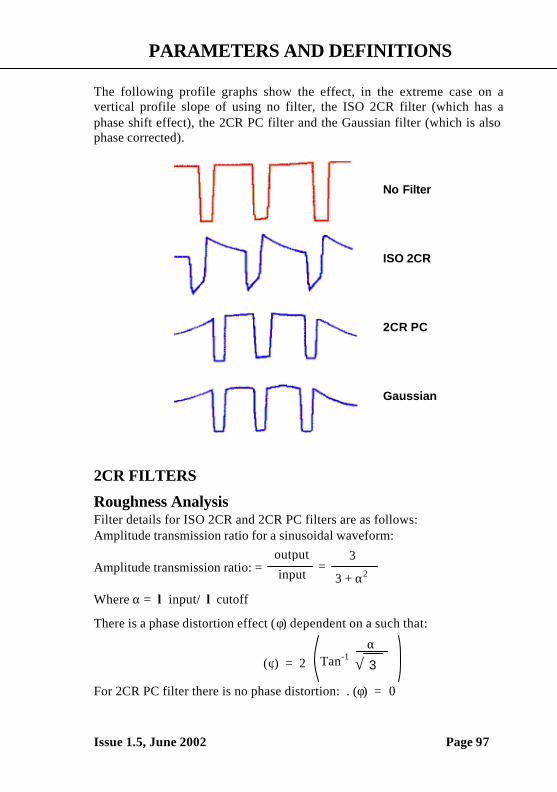
PARAMETERS AND DEFINITIONS
Issue 1.5, June 2002 Page 97
The following profile graphs show the effect, in the extreme case on avertical profile slope of using no filter, the ISO 2CR filter (which has aphase shift effect), the 2CR PC filter and the Gaussian filter (which is alsophase corrected).
2CR FILTERS
Roughness AnalysisFilter details for ISO 2CR and 2CR PC filters are as follows:Amplitude transmission ratio for a sinusoidal waveform:
Amplitude transmission ratio: =
Where α = λ input/ λ cutoff
There is a phase distortion effect (φ) dependent on a such that:
For 2CR PC filter there is no phase distortion: . (φ) = 0
No Filter
ISO 2CR
2CR PC
Gaussian
output
input3
3 + α2=
αTan-1 √ 3(φ) = 2
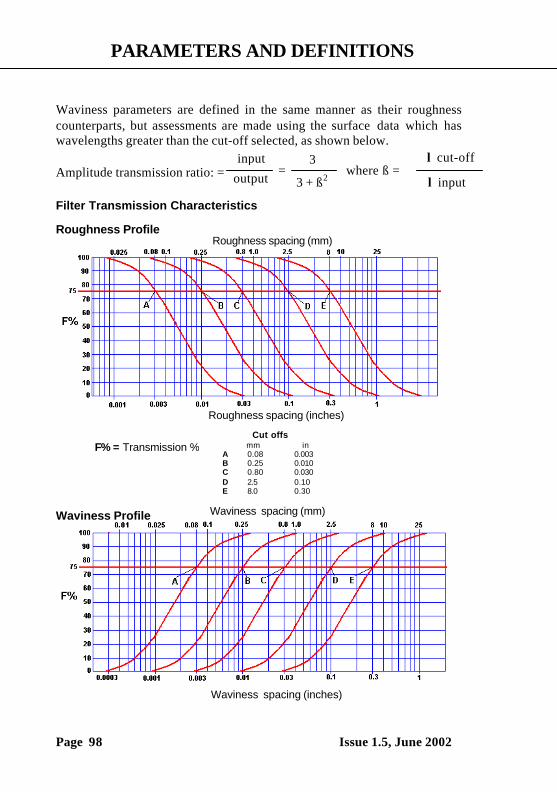
PARAMETERS AND DEFINITIONS
Page 98 Issue 1.5, June 2002
Waviness parameters are defined in the same manner as their roughnesscounterparts, but assessments are made using the surface data which haswavelengths greater than the cut-off selected, as shown below.
Amplitude transmission ratio: =
Filter Transmission Characteristics
Roughness Profile
Waviness Profile Waviness spacing (mm)
Waviness spacing (inches)
Roughness spacing (inches)
Roughness spacing (mm)
F% = Transmission %
input
output3
3 + ß2=
λ cut-off
λ inputwhere ß =
Cut offs mm in
A 0.08 0.003B 0.25 0.010C 0.80 0.030D 2.5 0.10E 8.0 0.30
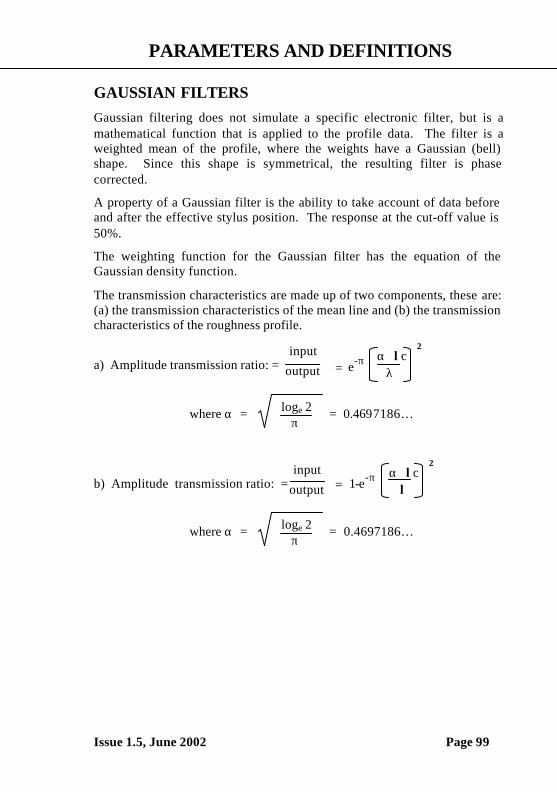
PARAMETERS AND DEFINITIONS
Issue 1.5, June 2002 Page 99
GAUSSIAN FILTERSGaussian filtering does not simulate a specific electronic filter, but is amathematical function that is applied to the profile data. The filter is aweighted mean of the profile, where the weights have a Gaussian (bell)shape. Since this shape is symmetrical, the resulting filter is phasecorrected.
A property of a Gaussian filter is the ability to take account of data beforeand after the effective stylus position. The response at the cut-off value is50%.
The weighting function for the Gaussian filter has the equation of theGaussian density function.
The transmission characteristics are made up of two components, these are:(a) the transmission characteristics of the mean line and (b) the transmissioncharacteristics of the roughness profile.
a) Amplitude transmission ratio: =
where α = = 0.4697186…
b) Amplitude transmission ratio: =
where α = = 0.4697186…
α λc
2
λ= e-π
input
output
loge 2 π
input
output = 1-e-π
α λc 2
λ
loge 2 π
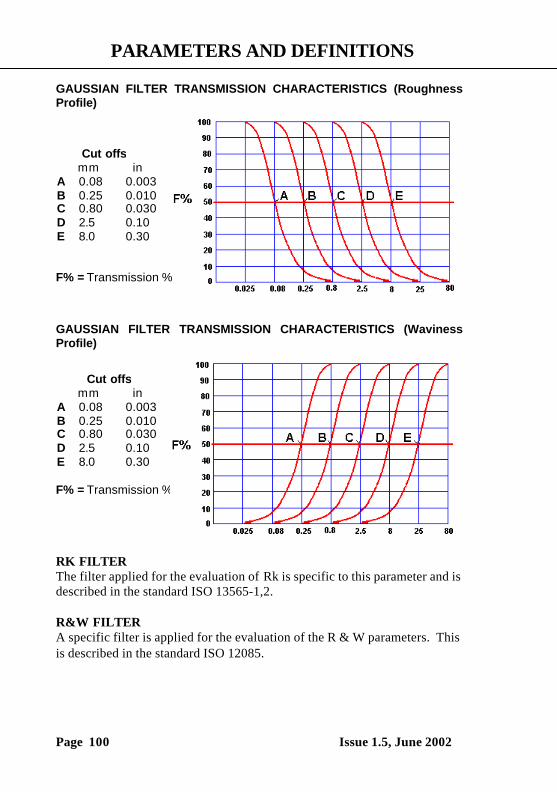
PARAMETERS AND DEFINITIONS
Page 100 Issue 1.5, June 2002
GAUSSIAN FILTER TRANSMISSION CHARACTERISTICS (RoughnessProfile)
F% = Transmission %
GAUSSIAN FILTER TRANSMISSION CHARACTERISTICS (WavinessProfile)
F% = Transmission %
RK FILTERThe filter applied for the evaluation of Rk is specific to this parameter and isdescribed in the standard ISO 13565-1,2.
R&W FILTERA specific filter is applied for the evaluation of the R & W parameters. Thisis described in the standard ISO 12085.
Cut offs mm in
A 0.08 0.003B 0.25 0.010C 0.80 0.030D 2.5 0.10E 8.0 0.30
Cut offs mm in
A 0.08 0.003B 0.25 0.010C 0.80 0.030D 2.5 0.10E 8.0 0.30
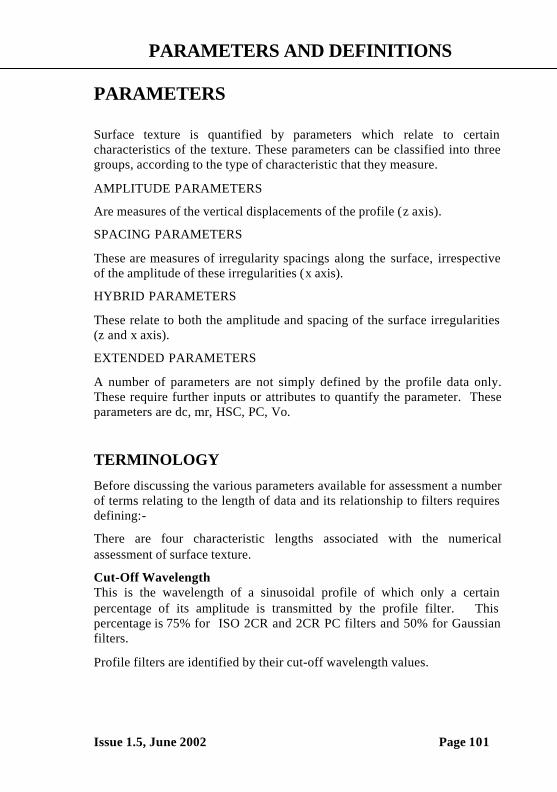
PARAMETERS AND DEFINITIONS
Issue 1.5, June 2002 Page 101
PARAMETERS
Surface texture is quantified by parameters which relate to certaincharacteristics of the texture. These parameters can be classified into threegroups, according to the type of characteristic that they measure.
AMPLITUDE PARAMETERS
Are measures of the vertical displacements of the profile (z axis).
SPACING PARAMETERS
These are measures of irregularity spacings along the surface, irrespectiveof the amplitude of these irregularities (x axis).
HYBRID PARAMETERS
These relate to both the amplitude and spacing of the surface irregularities(z and x axis).
EXTENDED PARAMETERS
A number of parameters are not simply defined by the profile data only.These require further inputs or attributes to quantify the parameter. Theseparameters are dc, mr, HSC, PC, Vo.
TERMINOLOGY
Before discussing the various parameters available for assessment a numberof terms relating to the length of data and its relationship to filters requiresdefining:-
There are four characteristic lengths associated with the numericalassessment of surface texture.
Cut-Off WavelengthThis is the wavelength of a sinusoidal profile of which only a certainpercentage of its amplitude is transmitted by the profile filter. Thispercentage is 75% for ISO 2CR and 2CR PC filters and 50% for Gaussianfilters.
Profile filters are identified by their cut-off wavelength values.
PARAMETERS AND DEFINITIONS
Page 102 Issue 1.5, June 2002
Sampling LengthThis is the length of the reference line determined to be equal to the cut-offwavelength used in the Profile Filter in characterising the surfaceroughness. For primary filtering, this is equal to the evaluation length.
Evaluation Length (Assessment) - lnThe length of modified profile data measured along the reference line overwhich the values of surface finish parameters are calculated. Also known asthe assessment length or data length (and referred to as ln). It may containone or more sampling lengths.
Traverse LengthNominal distance travelled by the traverse unit during data logging.However, any allowances for acceleration or stabilisation which may bemade are not included. It can be greater than the evaluation length, due tothe discarding of some data if filtering has been applied.
PARAMETER DEFINITIONSROUGHNESS, WAVINESS and PRIMARY PARAMETERSThis section contains definitions for the Roughness (R), Waviness (W) andPrimary (P) parameters. Where the mathematical description for each ofthese filter modes is the same, only the Roughness parameter is described.
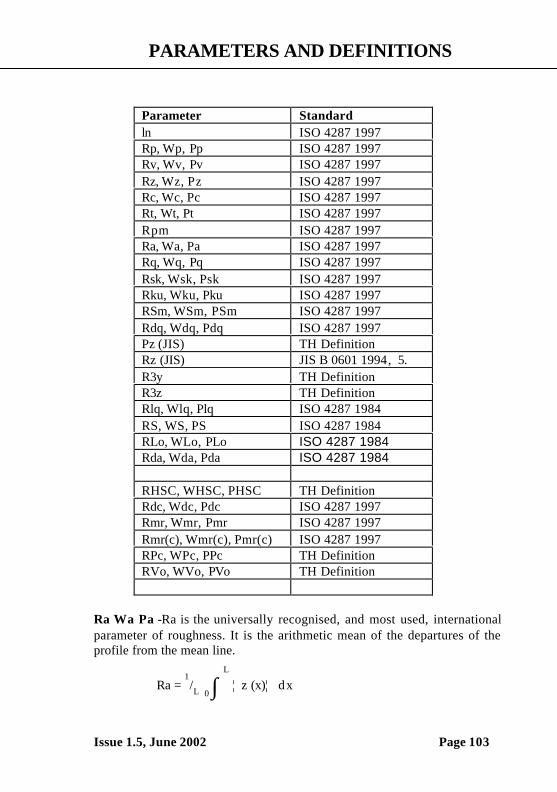
PARAMETERS AND DEFINITIONS
Issue 1.5, June 2002 Page 103
Parameter Standardln ISO 4287 1997Rp, Wp, Pp ISO 4287 1997Rv, Wv, Pv ISO 4287 1997Rz, Wz, Pz ISO 4287 1997Rc, Wc, Pc ISO 4287 1997Rt, Wt, Pt ISO 4287 1997Rpm ISO 4287 1997Ra, Wa, Pa ISO 4287 1997Rq, Wq, Pq ISO 4287 1997Rsk, Wsk, Psk ISO 4287 1997Rku, Wku, Pku ISO 4287 1997RSm, WSm, PSm ISO 4287 1997Rdq, Wdq, Pdq ISO 4287 1997Pz (JIS) TH DefinitionRz (JIS) JIS B 0601 1994, 5.R3y TH DefinitionR3z TH DefinitionRlq, Wlq, Plq ISO 4287 1984RS, WS, PS ISO 4287 1984RLo, WLo, PLo ISO 4287 1984Rda, Wda, Pda ISO 4287 1984
RHSC, WHSC, PHSC TH DefinitionRdc, Wdc, Pdc ISO 4287 1997Rmr, Wmr, Pmr ISO 4287 1997Rmr(c), Wmr(c), Pmr(c) ISO 4287 1997RPc, WPc, PPc TH DefinitionRVo, WVo, PVo TH Definition
Ra Wa Pa -Ra is the universally recognised, and most used, internationalparameter of roughness. It is the arithmetic mean of the departures of theprofile from the mean line.
Ra = 1/L 0 ∫
L
¦ z (x)¦ dx
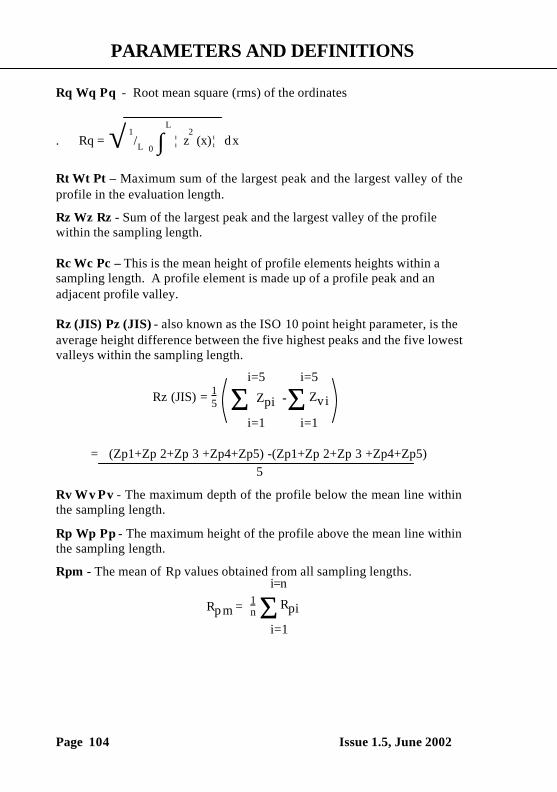
PARAMETERS AND DEFINITIONS
Page 104 Issue 1.5, June 2002
Rq Wq Pq - Root mean square (rms) of the ordinates
. Rq = √ 1/L
0 ∫
L
¦ z2 (x)¦ dx
Rt Wt Pt – Maximum sum of the largest peak and the largest valley of theprofile in the evaluation length.
Rz Wz Rz - Sum of the largest peak and the largest valley of the profilewithin the sampling length.
Rc Wc Pc – This is the mean height of profile elements heights within asampling length. A profile element is made up of a profile peak and anadjacent profile valley.
Rz (JIS) Pz (JIS) - also known as the ISO 10 point height parameter, is theaverage height difference between the five highest peaks and the five lowestvalleys within the sampling length.
= (Zp1+Zp 2+Zp 3 +Zp4+Zp5) -(Zp1+Zp 2+Zp 3 +Zp4+Zp5)5
Rv Wv Pv - The maximum depth of the profile below the mean line withinthe sampling length.
Rp Wp Pp - The maximum height of the profile above the mean line withinthe sampling length.
Rpm - The mean of Rp values obtained from all sampling lengths.
Σ1nRp m =
i=n
Rpi
i=1
Σi=5
Zvi
i=1
15Rz (JIS) =
i=5
Zpi -
i=1Σ
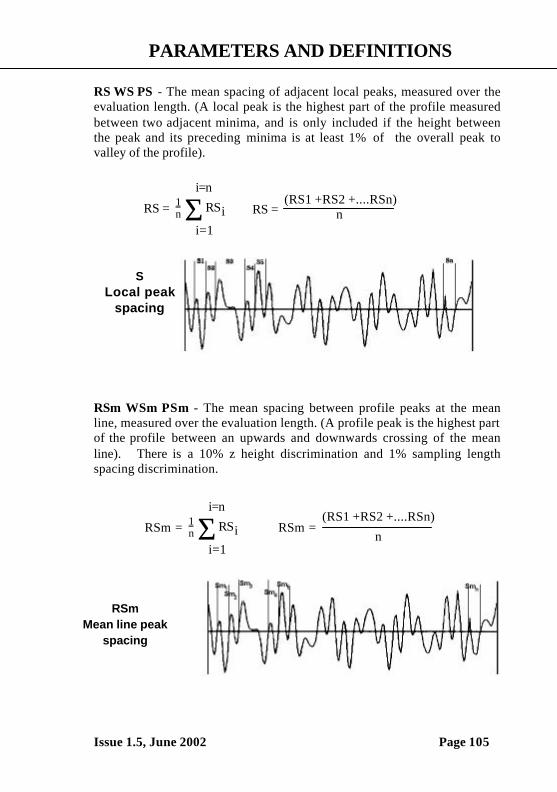
PARAMETERS AND DEFINITIONS
Issue 1.5, June 2002 Page 105
RS WS PS - The mean spacing of adjacent local peaks, measured over theevaluation length. (A local peak is the highest part of the profile measuredbetween two adjacent minima, and is only included if the height betweenthe peak and its preceding minima is at least 1% of the overall peak tovalley of the profile).
RSm WSm PSm - The mean spacing between profile peaks at the meanline, measured over the evaluation length. (A profile peak is the highest partof the profile between an upwards and downwards crossing of the meanline). There is a 10% z height discrimination and 1% sampling lengthspacing discrimination.
Σ1nRS =
i=n
RSii=1
(RS1 +RS2 +....RSn)nRS =
SLocal peak
spacing
(RS1 +RS2 +....RSn)
nRSm =Σ1
nRSm =
i=n
RSii=1
RSmMean line peak
spacing
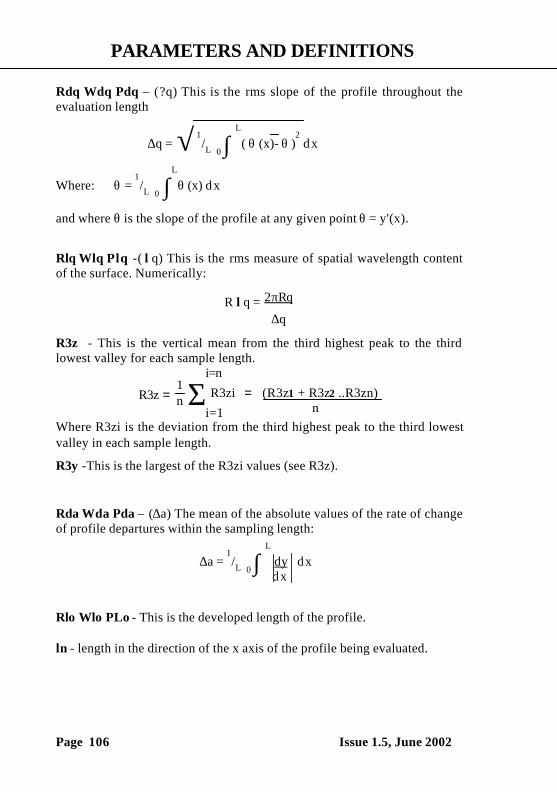
PARAMETERS AND DEFINITIONS
Page 106 Issue 1.5, June 2002
∆q = √ 1/L
0 ∫
L
( θ (x)- θ )2 dx
Rdq Wdq Pdq – (?q) This is the rms slope of the profile throughout theevaluation length
Where: θ = 1/L
0 ∫
L
θ (x) dx
and where θ is the slope of the profile at any given point θ = y'(x).
Rlq Wlq Plq -( λq) This is the rms measure of spatial wavelength contentof the surface. Numerically:
R λq = 2πRq
∆q
R3z - This is the vertical mean from the third highest peak to the thirdlowest valley for each sample length.
Where R3zi is the deviation from the third highest peak to the third lowestvalley in each sample length.
R3y -This is the largest of the R3zi values (see R3z).
Rda Wda Pda – (∆a) The mean of the absolute values of the rate of changeof profile departures within the sampling length:
∆a = 1/L
0 ∫
L
dy dx
Rlo Wlo PLo - This is the developed length of the profile.
ln - length in the direction of the x axis of the profile being evaluated.
R3z =
i=n
i=1Σ R3zi = (R3z1 + R3z2 ..R3zn)
n
1n
dx
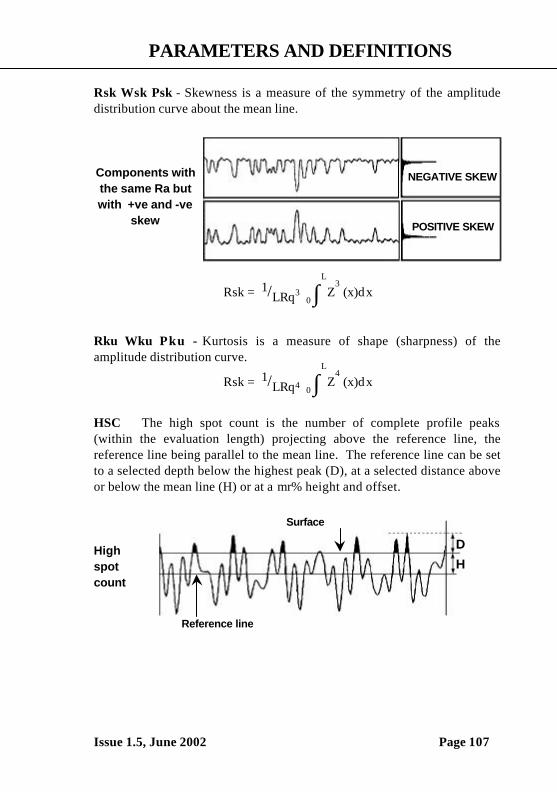
PARAMETERS AND DEFINITIONS
Issue 1.5, June 2002 Page 107
Rsk Wsk Psk - Skewness is a measure of the symmetry of the amplitudedistribution curve about the mean line.
Rsk = 1/LRq3 0 ∫
L
Z3 (x)dx
Rku Wku Pku - Kurtosis is a measure of shape (sharpness) of theamplitude distribution curve.
Rsk = 1/LRq4 0 ∫
L
Z4 (x)dx
HSC The high spot count is the number of complete profile peaks(within the evaluation length) projecting above the reference line, thereference line being parallel to the mean line. The reference line can be setto a selected depth below the highest peak (D), at a selected distance aboveor below the mean line (H) or at a mr% height and offset.
Highspotcount
Components withthe same Ra butwith +ve and -ve
skew
NEGATIVE SKEW
POSITIVE SKEW
Surface
Reference line
D
H
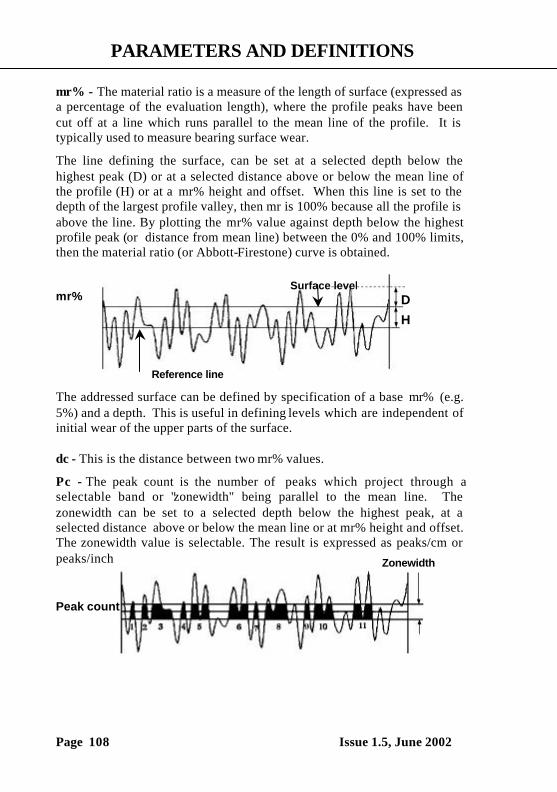
PARAMETERS AND DEFINITIONS
Page 108 Issue 1.5, June 2002
mr% - The material ratio is a measure of the length of surface (expressed asa percentage of the evaluation length), where the profile peaks have beencut off at a line which runs parallel to the mean line of the profile. It istypically used to measure bearing surface wear.
The line defining the surface, can be set at a selected depth below thehighest peak (D) or at a selected distance above or below the mean line ofthe profile (H) or at a mr% height and offset. When this line is set to thedepth of the largest profile valley, then mr is 100% because all the profile isabove the line. By plotting the mr% value against depth below the highestprofile peak (or distance from mean line) between the 0% and 100% limits,then the material ratio (or Abbott-Firestone) curve is obtained.
mr%
The addressed surface can be defined by specification of a base mr% (e.g.5%) and a depth. This is useful in defining levels which are independent ofinitial wear of the upper parts of the surface.
dc - This is the distance between two mr% values.
Pc - The peak count is the number of peaks which project through aselectable band or "zonewidth" being parallel to the mean line. Thezonewidth can be set to a selected depth below the highest peak, at aselected distance above or below the mean line or at mr% height and offset.The zonewidth value is selectable. The result is expressed as peaks/cm orpeaks/inch
Peak count
Zonewidth
Reference line
D
H
Surface level
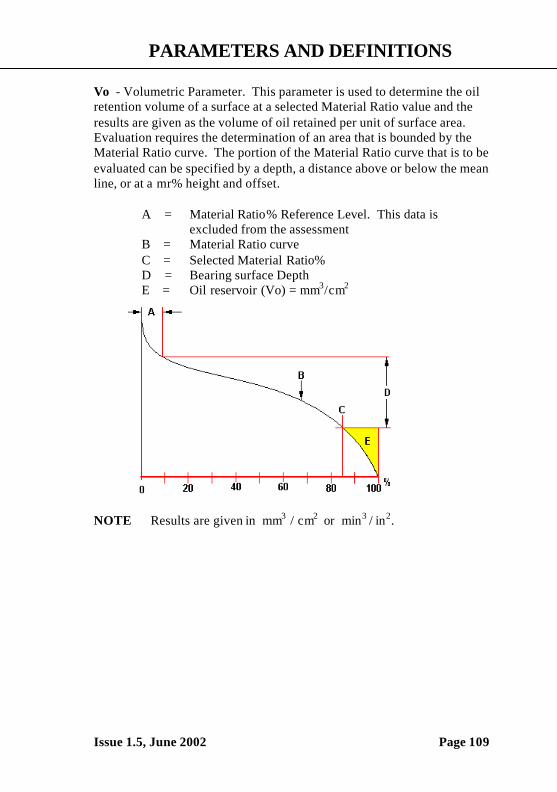
PARAMETERS AND DEFINITIONS
Issue 1.5, June 2002 Page 109
Vo - Volumetric Parameter. This parameter is used to determine the oilretention volume of a surface at a selected Material Ratio value and theresults are given as the volume of oil retained per unit of surface area.Evaluation requires the determination of an area that is bounded by theMaterial Ratio curve. The portion of the Material Ratio curve that is to beevaluated can be specified by a depth, a distance above or below the meanline, or at a mr% height and offset.
A = Material Ratio% Reference Level. This data isexcluded from the assessment
B = Material Ratio curveC = Selected Material Ratio%D = Bearing surface DepthE = Oil reservoir (Vo) = mm3/cm2
NOTE Results are given in mm3 / cm2 or min3 / in2.
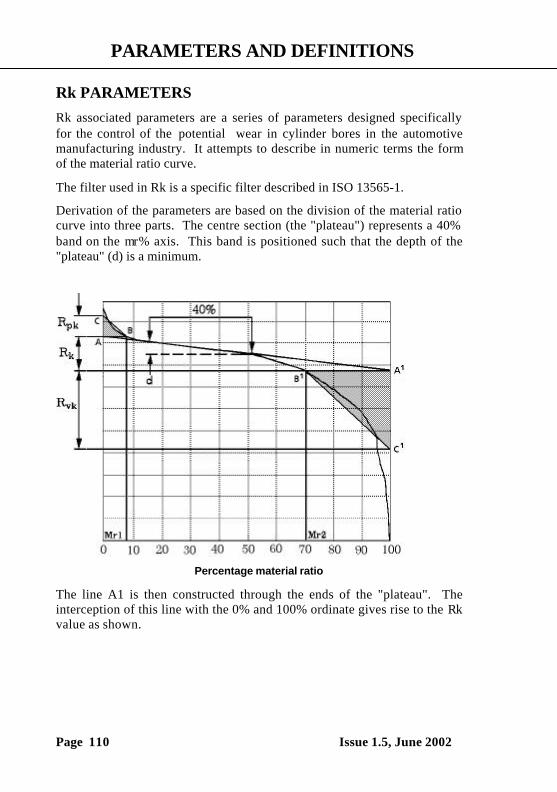
PARAMETERS AND DEFINITIONS
Page 110 Issue 1.5, June 2002
Rk PARAMETERSRk associated parameters are a series of parameters designed specificallyfor the control of the potential wear in cylinder bores in the automotivemanufacturing industry. It attempts to describe in numeric terms the formof the material ratio curve.
The filter used in Rk is a specific filter described in ISO 13565-1.
Derivation of the parameters are based on the division of the material ratiocurve into three parts. The centre section (the "plateau") represents a 40%band on the mr% axis. This band is positioned such that the depth of the"plateau" (d) is a minimum.
Percentage material ratio
The line A1 is then constructed through the ends of the "plateau". Theinterception of this line with the 0% and 100% ordinate gives rise to the Rkvalue as shown.
PARAMETERS AND DEFINITIONS
Issue 1.5, June 2002 Page 111
Two triangles are then constructed ABC (from which the parameter A1 isderived) and A1B1C1 (from which the parameter A2 is derived) on basesAB and A1B1, such that their areas are equal to the area above AB andunder the curve, and the area below A1B1 and over the curve respectively,shown as shaded areas on the illustration.
a) The top portion of the surface (length AC) which will quickly beworn away when the engine begins to run. This is known as theReduced Peak Height = Rpk. The actual volume of material whichwill be worn away (parameter A1) is determined from the triangleA1B1C1). Results are given in mm3 / cm2 or min3 / in2.
b) The long term running surface which will influence the performanceand life of the cylinder. This is known as the kernal RoughnessDepth = Rk (Rk = The depth of the Roughness Core Profile).
c) The oil retaining capability of the deep troughs which have beenmachined into the surface. This is known as the Reduced ValleyDepth = Rvk. (length of A1 C1). Tha actual volume of oil retained(parameter A2) is determined from the triangle ABC.). Results aregiven in mm3 / cm2 or min3 / in2.
d) The Material Ratios Mr1 and Mr2 (in %) are determined from the line ofintersection coinciding with the upper limit of the Roughness CoreProfile.
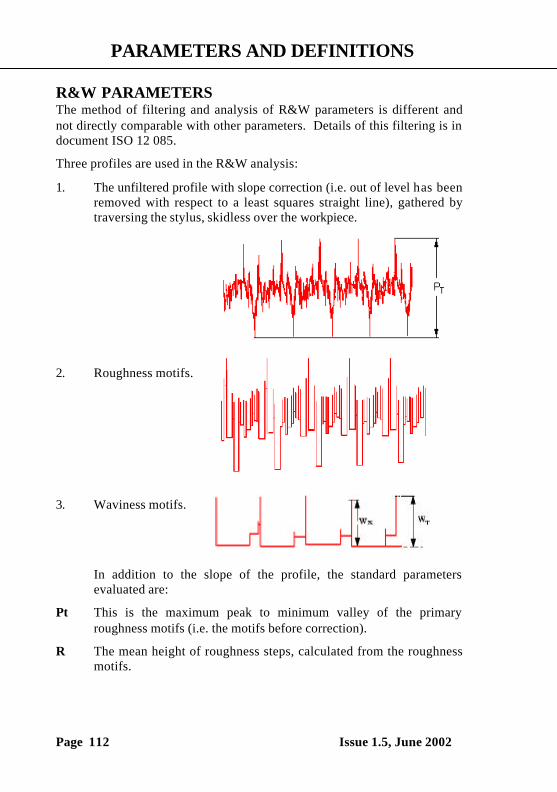
PARAMETERS AND DEFINITIONS
Page 112 Issue 1.5, June 2002
R&W PARAMETERSThe method of filtering and analysis of R&W parameters is different andnot directly comparable with other parameters. Details of this filtering is indocument ISO 12 085.
Three profiles are used in the R&W analysis:
1. The unfiltered profile with slope correction (i.e. out of level has beenremoved with respect to a least squares straight line), gathered bytraversing the stylus, skidless over the workpiece.
2. Roughness motifs.
3. Waviness motifs.
In addition to the slope of the profile, the standard parametersevaluated are:
Pt This is the maximum peak to minimum valley of the primaryroughness motifs (i.e. the motifs before correction).
R The mean height of roughness steps, calculated from the roughnessmotifs.
PARAMETERS AND DEFINITIONS
Issue 1.5, June 2002 Page 113
AR The mean spacing between individual roughness motifs.
Rx The maximum peak to adjacent minimum valley (maximumindividual motif) of the primary roughness motifs.
SR The standard deviation of R.
SAR The standard deviation of Ar.
SW The standard deviation of W.
SAW The standard deviation of Aw.
Wte The maximum peak to minimum peak of the corrected roughnessenvelope (in practice, calculated from the waviness motifs).
W The mean height of waviness motifs.
AW The mean spacing between individual waviness motifs. Wavinessspacings greater than the waviness cut-off length are not consideredfor Aw calculations.
Wx The maximum individual motif of the waviness motifs.
METHOD OF CALCULATIONThe sampling points collected from the measured slope corrected profile aresubjected to a filtering process, from which the roughness motifs areconstructed.
During this process, each peak contained within the data is detected andsubjected to four tests. The peaks that fail these tests are eliminated fromthe envelope, the procedure being repeated until no further peaks can beeliminated. The residual motifs are designated the roughness motifs fromwhich the Pt, Rx, AR and provisional R values are calculated.
Individual peaks are assessed once again for correction of amplitude(attenuation of isolated peak). When this is completed, the correctedroughness motifs are derived, from which the final value of R is calculated.
The peaks only of the corrected roughness motifs are then filtered again toform the waviness motifs, from which the W, Wx, WT and AW values arecalculated.
PARAMETERS AND DEFINITIONS
Page 114 Issue 1.5, June 2002
Notes: As with all graphical methods, there are occasions when parametercalculation can fail. Two examples of this are described following:1. Due to the algorithms method of peak elimination, it is possible to
obtain slightly different parameter results from the same surfaceturned through 180 degrees. This is due to a different set of peaksand valleys being used for motif construction, based on the first peakencountered. This motif is then used for final parameter assessmentwhich can show this condition, however, differences will be small.
2. If a surface is of periodic nature (i.e. Sinusoidal), some parameterresults can be indeterminate, depending on the surface wavelengthand the number of points used for calculation. If a purely periodicsurface is measured with sufficient data points to represent thatsurface, all peaks will be in line leaving no waviness motif andhence no Waviness parameters. In this condition the results areshown as : Aw = ******
If the number of data points is reduced causing an aliasing condition(See section on "Aliasing" further in this chapter) then a wavinessprofile may be created from the same data set. In this condition theWaviness parameter will be based on the sampled data criteria andnot the surface undulations.
3. The surface should satisfy the criterion that the roughness peak tovalley, PT, should not exceed 150 times the resolution of the gauge.
PARAMETERS AND DEFINITIONS
Issue 1.5, June 2002 Page 115
CALIBRATION (using the ball standard)Because of the large range and high resolution the associated accuracyachievable, the calibration of the gauging system requires the inclusion of anumber of sources of error which would normally be ignored by moreconventional surface finish instruments. In addition to the gain correction,there are two main causes of non-linearity in the gauge:
1. First and most important, is the non-linearity, which is due to thearcuate movement of the stylus arm about the pivot. Ideally, as thegauge moves through the full measurement range, the stylus tipshould move in a linear motion parallel to the Z axis. However, thestylus tip moves as a defined arc about a pivot thus introducing non-linearities in both X and Z co-ordinates.
2. Secondly, as the gauge moves through the full measurement rangethe transducer within the pick-up alters characteristics, introducingsome minor non-linearities in the Z co-ordinates.
The nett effect of this is a non-linear relationship between the measured co-ordinates (x, z) and the actual co-ordinates (X, Z). These are related by thegeneral formula;
Z = f (z)X = x + g (Z)
where f () and g () are functions that can be determined empirically.
The two functions f () and g () are approximated by 3rd order polynomials.Thus the calibration formula becomes;
Z = z1 z + z2z2 + z3z3
X = x + x1 Z + x2Z2 + x3Z
3
where z1,z2,z3,x1,x2,x3 are the calibration constants.
The calibration constants are related to the stylus geometry as well as theconstruction of the transducer of the pick-up. The exact relationship is notimportant since they all can be determined empirically via the automaticcalibration routine provided in the instrument software..
PARAMETERS AND DEFINITIONS
Page 116 Issue 1.5, June 2002
This empirical determination is performed by measurement of a knowncontrolled form (the calibration ball) which can be produced traceable toNational and International Standards and provides an artifact that can beeasily set-up on the instrument.
NOTE - The calibration of the instrument is valid only in that part of thevertical range over which the calibration of the instrument is carried out.Different stylus/calibration ball combinations produce different validvertical calibration ranges of the instruments. Caution must be used whenmeasuring outside this valid calibrated vertical range since themeasurements may not be as accurate as those taken within the validcalibrated range. This is particularly so with the small bore styli which havea very limited valid calibration range.
Calibration ErrorsOutlined, on the next page, are some typical effects of incorrect calibrationwhen measuring radii. In many instances these effects can appear to be agenuine form error on the component. It is, therefore, worth noting thesetypical shapes in order to avoid making a wrong assumption on the form ofthe component and attempting to take corrective action in the manufacturingprocess.
Errors in calibration usually cause 'S', 'W', or 'M' shapes in the profile whenmeasuring radii, as shown in the following illustrations. The reasons forthis include:
• Lack of calibration.
• Change of stylus without re-calibration.
• Damaged stylus and/or stylus arm pivots.
• 'Tracking' errors on the stylus signal caused by sudden changes indisplacement (e.g. When measuring over a step).
It is recommended that if any of the forms shown in the followingillustrations are exhibited on a component that the instrument is re-calibrated. If the calibration is acceptable then the component can be re-measured.

PARAMETERS AND DEFINITIONS
Issue 1.5, June 2002 Page 117
TYPICAL CALIBRATION ERROR EFFECTS ON RADIUSMEASUREMENT
A = Modified Profile
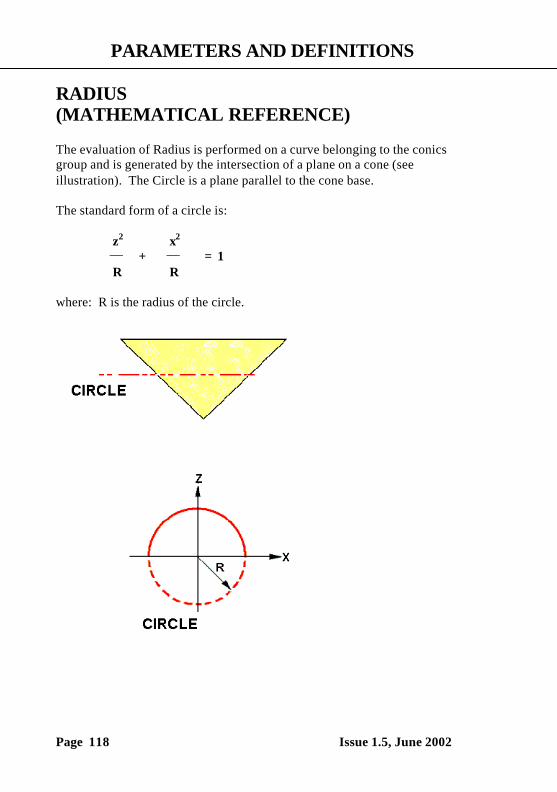
PARAMETERS AND DEFINITIONS
Page 118 Issue 1.5, June 2002
RADIUS(MATHEMATICAL REFERENCE)
The evaluation of Radius is performed on a curve belonging to the conicsgroup and is generated by the intersection of a plane on a cone (seeillustration). The Circle is a plane parallel to the cone base.
The standard form of a circle is:
z2 x2
___ + ___ = 1 R R
where: R is the radius of the circle.
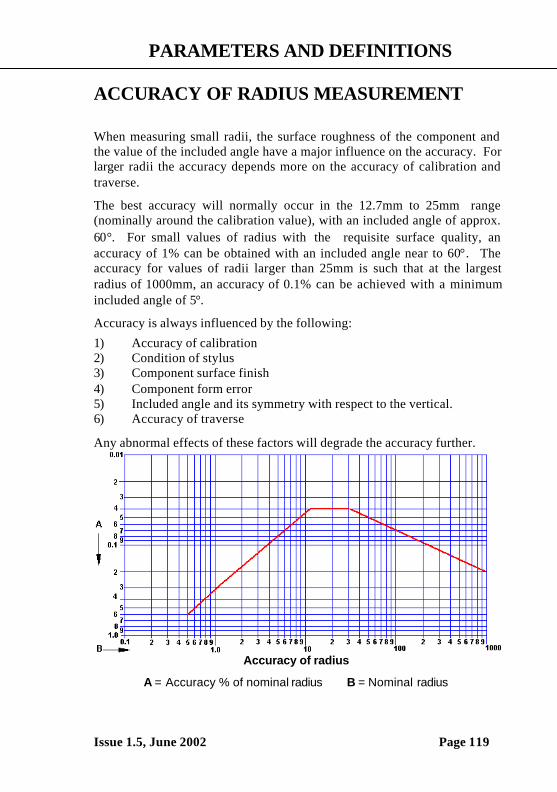
PARAMETERS AND DEFINITIONS
Issue 1.5, June 2002 Page 119
ACCURACY OF RADIUS MEASUREMENT
When measuring small radii, the surface roughness of the component andthe value of the included angle have a major influence on the accuracy. Forlarger radii the accuracy depends more on the accuracy of calibration andtraverse.
The best accuracy will normally occur in the 12.7mm to 25mm range(nominally around the calibration value), with an included angle of approx.60°. For small values of radius with the requisite surface quality, anaccuracy of 1% can be obtained with an included angle near to 60°. Theaccuracy for values of radii larger than 25mm is such that at the largestradius of 1000mm, an accuracy of 0.1% can be achieved with a minimumincluded angle of 5°.
Accuracy is always influenced by the following:
1) Accuracy of calibration2) Condition of stylus3) Component surface finish4) Component form error5) Included angle and its symmetry with respect to the vertical.6) Accuracy of traverse
Any abnormal effects of these factors will degrade the accuracy further.
Accuracy of radius
A = Accuracy % of nominal radius B = Nominal radius
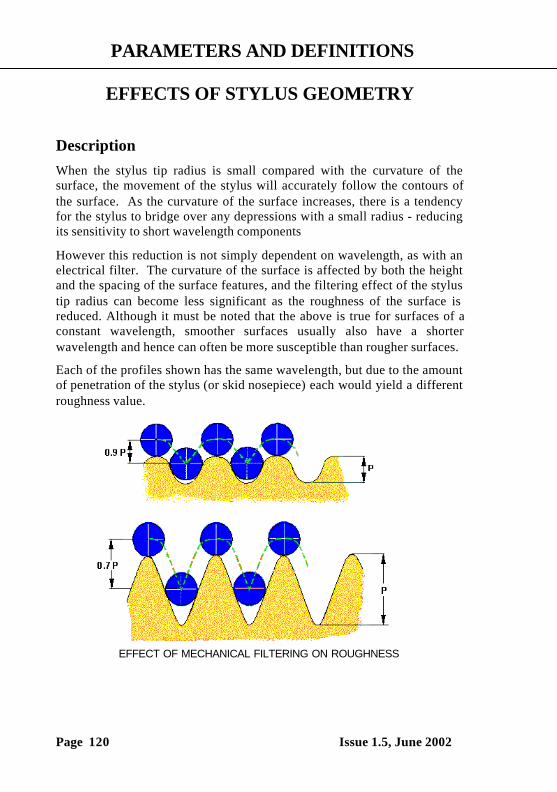
PARAMETERS AND DEFINITIONS
Page 120 Issue 1.5, June 2002
EFFECTS OF STYLUS GEOMETRY
DescriptionWhen the stylus tip radius is small compared with the curvature of thesurface, the movement of the stylus will accurately follow the contours ofthe surface. As the curvature of the surface increases, there is a tendencyfor the stylus to bridge over any depressions with a small radius - reducingits sensitivity to short wavelength components
However this reduction is not simply dependent on wavelength, as with anelectrical filter. The curvature of the surface is affected by both the heightand the spacing of the surface features, and the filtering effect of the stylustip radius can become less significant as the roughness of the surface isreduced. Although it must be noted that the above is true for surfaces of aconstant wavelength, smoother surfaces usually also have a shorterwavelength and hence can often be more susceptible than rougher surfaces.
Each of the profiles shown has the same wavelength, but due to the amountof penetration of the stylus (or skid nosepiece) each would yield a differentroughness value.
EFFECT OF MECHANICAL FILTERING ON ROUGHNESS
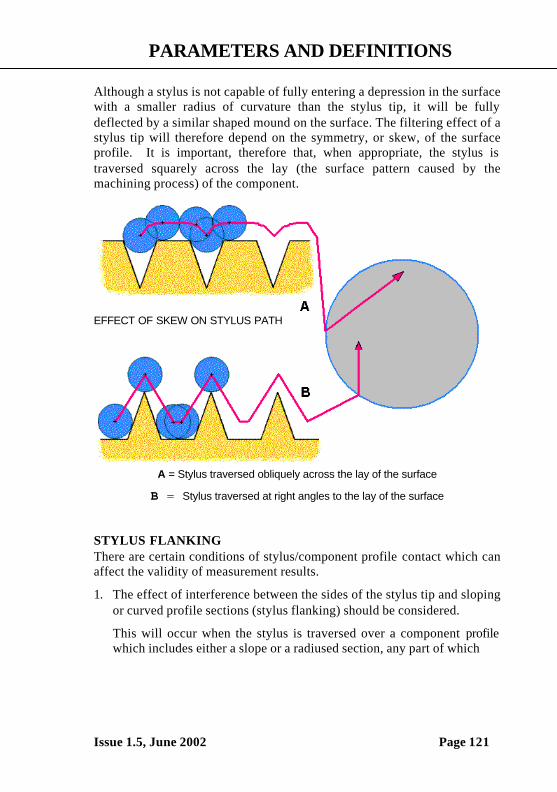
PARAMETERS AND DEFINITIONS
Issue 1.5, June 2002 Page 121
Although a stylus is not capable of fully entering a depression in the surfacewith a smaller radius of curvature than the stylus tip, it will be fullydeflected by a similar shaped mound on the surface. The filtering effect of astylus tip will therefore depend on the symmetry, or skew, of the surfaceprofile. It is important, therefore that, when appropriate, the stylus istraversed squarely across the lay (the surface pattern caused by themachining process) of the component.
EFFECT OF SKEW ON STYLUS PATH
A = Stylus traversed obliquely across the lay of the surface
B = Stylus traversed at right angles to the lay of the surface
STYLUS FLANKINGThere are certain conditions of stylus/component profile contact which canaffect the validity of measurement results.
1. The effect of interference between the sides of the stylus tip and slopingor curved profile sections (stylus flanking) should be considered.
This will occur when the stylus is traversed over a component profilewhich includes either a slope or a radiused section, any part of which
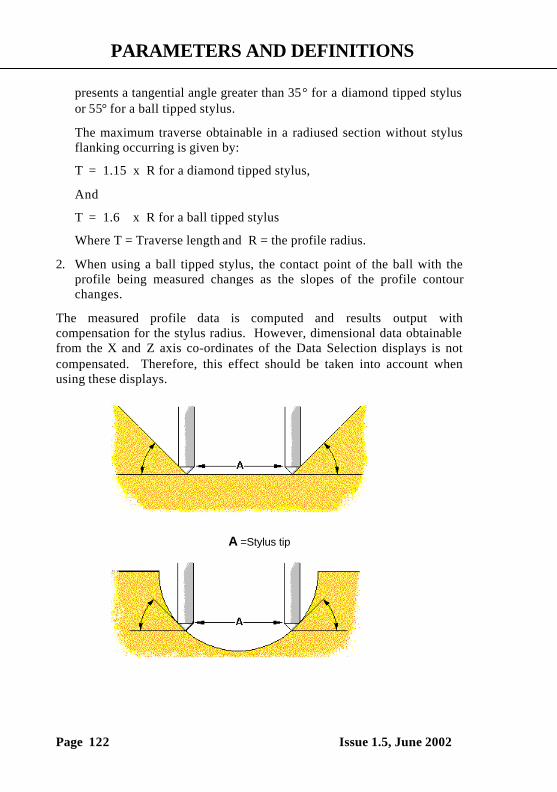
PARAMETERS AND DEFINITIONS
Page 122 Issue 1.5, June 2002
presents a tangential angle greater than 35° for a diamond tipped stylusor 55° for a ball tipped stylus.
The maximum traverse obtainable in a radiused section without stylusflanking occurring is given by:
T = 1.15 x R for a diamond tipped stylus,
And
T = 1.6 x R for a ball tipped stylus
Where T = Traverse length and R = the profile radius.
2. When using a ball tipped stylus, the contact point of the ball with theprofile being measured changes as the slopes of the profile contourchanges.
The measured profile data is computed and results output withcompensation for the stylus radius. However, dimensional data obtainablefrom the X and Z axis co-ordinates of the Data Selection displays is notcompensated. Therefore, this effect should be taken into account whenusing these displays.
A =Stylus tip
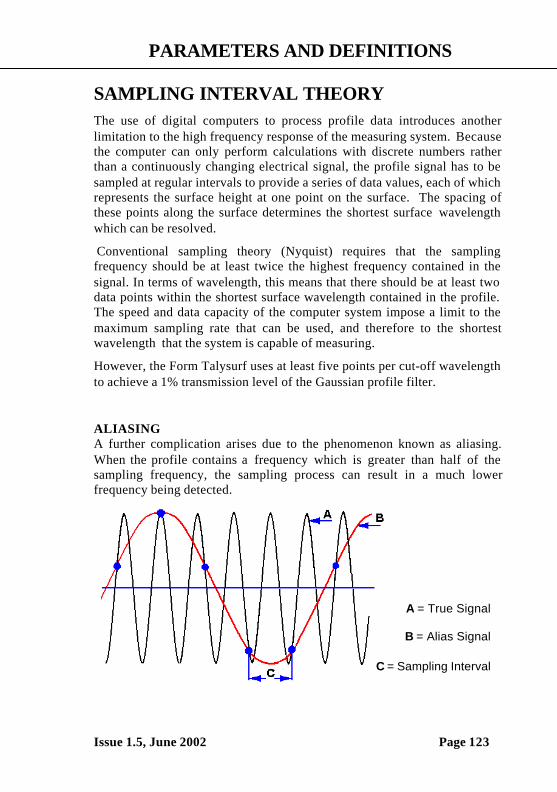
PARAMETERS AND DEFINITIONS
Issue 1.5, June 2002 Page 123
SAMPLING INTERVAL THEORYThe use of digital computers to process profile data introduces anotherlimitation to the high frequency response of the measuring system. Becausethe computer can only perform calculations with discrete numbers ratherthan a continuously changing electrical signal, the profile signal has to besampled at regular intervals to provide a series of data values, each of whichrepresents the surface height at one point on the surface. The spacing ofthese points along the surface determines the shortest surface wavelengthwhich can be resolved.
Conventional sampling theory (Nyquist) requires that the samplingfrequency should be at least twice the highest frequency contained in thesignal. In terms of wavelength, this means that there should be at least twodata points within the shortest surface wavelength contained in the profile.The speed and data capacity of the computer system impose a limit to themaximum sampling rate that can be used, and therefore to the shortestwavelength that the system is capable of measuring.
However, the Form Talysurf uses at least five points per cut-off wavelengthto achieve a 1% transmission level of the Gaussian profile filter.
ALIASINGA further complication arises due to the phenomenon known as aliasing.When the profile contains a frequency which is greater than half of thesampling frequency, the sampling process can result in a much lowerfrequency being detected.
A = True Signal
B = Alias Signal
C = Sampling Interval
PARAMETERS AND DEFINITIONS
Page 124 Issue 1.5, June 2002
The detected frequency is the difference between the sampling and actualprofile frequencies. If the sampled data were used to create a profile graph,the effect of aliasing would be to introduce long wavelength componentsinto the profile, which were not present on the actual surface. To preventthis happening, it is usual to provide an electrical filter which removes anyunwanted high frequencies from the profile data before it is sampled. Such afilter is commonly described as an anti-aliasing filter.
EFFECT ON RESULTS With most manufactured surfaces, the longer wavelength components ofthe surface texture tend to have the greatest amplitudes. This is a naturalconsequence of most manufacturing processes. When the surface textureparameters of this type of surface are assessed, the short wavelength limitand bandwidth become much less significant than the long wavelength limit(cut-off), because it is mainly the long wavelengths which are contributingto the parameter values.
Very high precision surfaces, which have been subjected to a succession ofmachining operations, do not always show this same increase in amplitudewith wavelength. The effect of the multiple machining is to remove thelong wavelength components leaving only the short wavelengths. For thesesurfaces, the parameter values obtained after a measurement will be verysensitive to bandwidth and short wavelength limits. Not surprisingly, it iswith this type of surface that most anomalies are found when measurementsare made using different types of instrument.
PARAMETERS AND DEFINITIONS
Issue 1.5, June 2002 Page 125
AMPLIFIER CHARACTERISTICSAll electronic amplifier systems have a finite upper limit to their frequencyrange. Although it is possible to design amplifiers with very high upperfrequency limits, and very large bandwidths, the frequency range isnormally restricted in order to improve the noise performance.
Both the transducer and the amplifier generate some electrical noise and thisis then superimposed on the profile signal and effectively limits theresolution of the instrument. The amount of noise introduced is directlyrelated to the bandwidth of the system and for high resolution, it is usual todesign the amplifier with only the minimum bandwidth required.
The amplifier bandwidth is normally limited by the inclusion of electricalfiltering networks. Although such filters may have a variety of differentcharacteristics, their filtering effect is dependent only on frequency and isnot affected by the amplitude of the signal or by the skew of the profile.
PARAMETERS AND DEFINITIONS
Page 126 Issue 1.5, June 2002
ACCESSORIES
Issue 1.5, June 2002 Page 127
CONTENTSPage
Granite Base (112/2007-01) 128
Granite Base (112/3046-01) 130
Column (112/3117-01) 132
Column (112/3046-01) 134
Free Standing Base (112/3066) 136
The Wide range pick-up (112/2628) 138
Adjustable Vee Block (112/1326) 141
Workholding, Vee Block, Plain (112/1283) 142
Workholding, Vee Block, 150mm (112/1645) 143
Workholding, Worktable, 'Y' Axis (112/1826) 144
Workholding, Universal 146
Full Version (112/3064) 146
X-Y Stage and Vee block only (112/3067) 147
Taylor Hobson Fast charger (265-943) 148
Printer (112/2762) 154
Epson Thermal 155
Deskjet Printer (112/2902) 156
Laserjet Printer (112/2696) 157
PCMCIA Card (112/3022) 158
PCM Stand (112/3047) 159
Flight case 160

ACCESSORIES
Page 128 Issue 1.5, June 2002
Granite Base (112/2007-01)
The base is of an epoxy granite construction on anti-vibration mounts, andprovides a firm support for the column and workpieces. The isolation fromvibration provided by the base enables the system to be used up tomaximum performance level close to normal engineering environments(this does not include high energy activity such as forging, planing,shearing, bending etc). Two tee slots enables fixtures and base accessoriesto be secured to the surface.
WARNING: The threaded holes on the top of the base MUST NOT beused for lifting. The column must be removed from the base beforeattempting to lift the base.
Four handles are provided for lifting the base, which weighs 100kg (220lbs). These handles must be fully screwed into the threaded holes in theends of the base (two handles at each end). The user must decide whetherto use manual or mechanical lifting, depending on the environment and thedistance to be moved
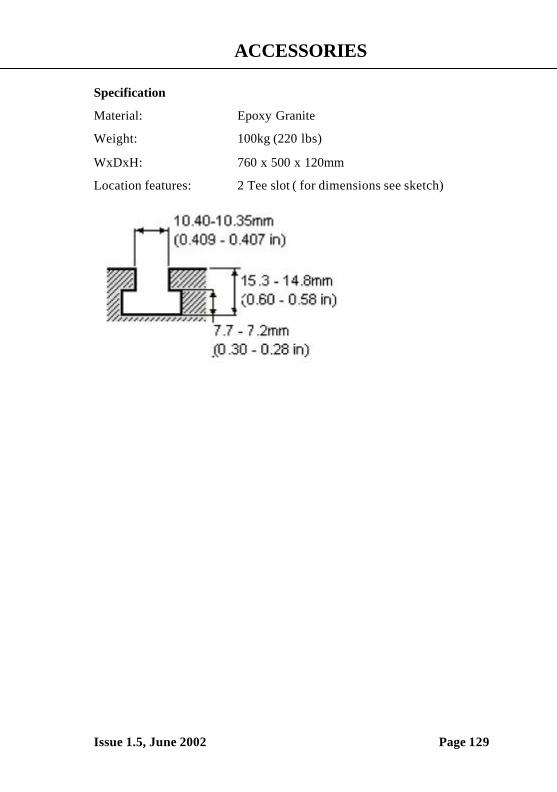
ACCESSORIES
Issue 1.5, June 2002 Page 129
Specification
Material: Epoxy Granite
Weight: 100kg (220 lbs)
WxDxH: 760 x 500 x 120mm
Location features: 2 Tee slot ( for dimensions see sketch)
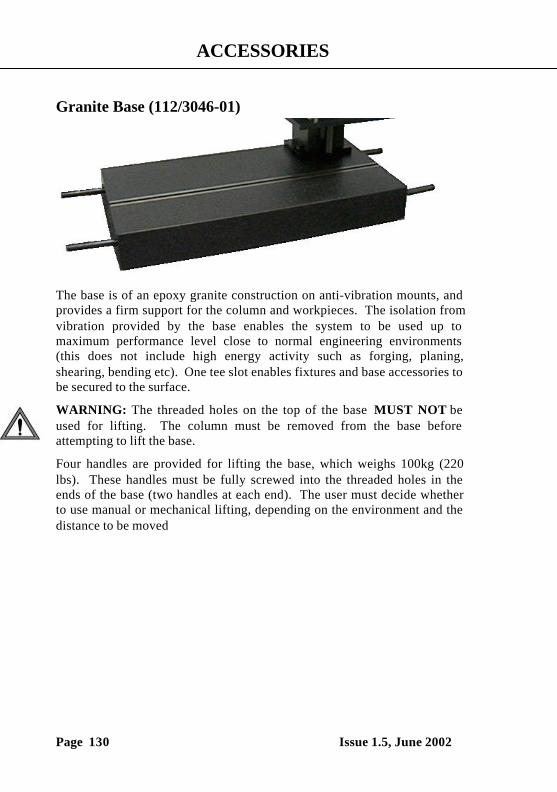
ACCESSORIES
Page 130 Issue 1.5, June 2002
Granite Base (112/3046-01)
The base is of an epoxy granite construction on anti-vibration mounts, andprovides a firm support for the column and workpieces. The isolation fromvibration provided by the base enables the system to be used up tomaximum performance level close to normal engineering environments(this does not include high energy activity such as forging, planing,shearing, bending etc). One tee slot enables fixtures and base accessories tobe secured to the surface.
WARNING: The threaded holes on the top of the base MUST NOT beused for lifting. The column must be removed from the base beforeattempting to lift the base.
Four handles are provided for lifting the base, which weighs 100kg (220lbs). These handles must be fully screwed into the threaded holes in theends of the base (two handles at each end). The user must decide whetherto use manual or mechanical lifting, depending on the environment and thedistance to be moved
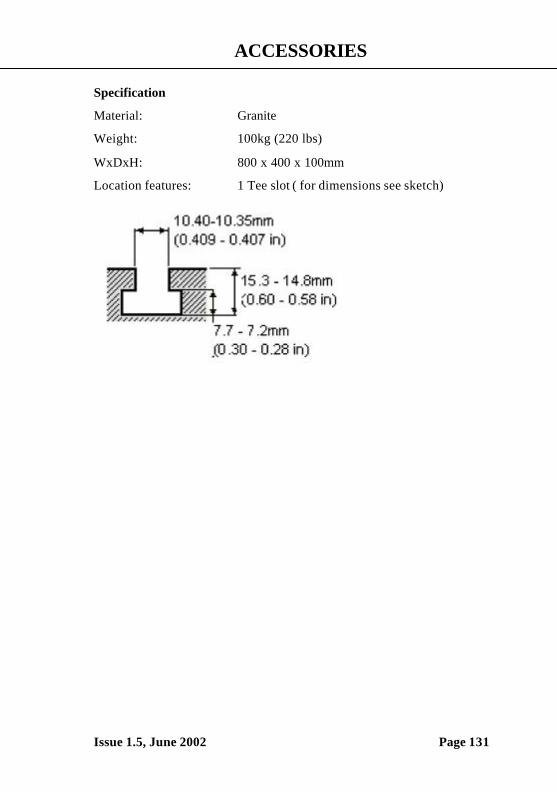
ACCESSORIES
Issue 1.5, June 2002 Page 131
Specification
Material: Granite
Weight: 100kg (220 lbs)
WxDxH: 800 x 400 x 100mm
Location features: 1 Tee slot ( for dimensions see sketch)
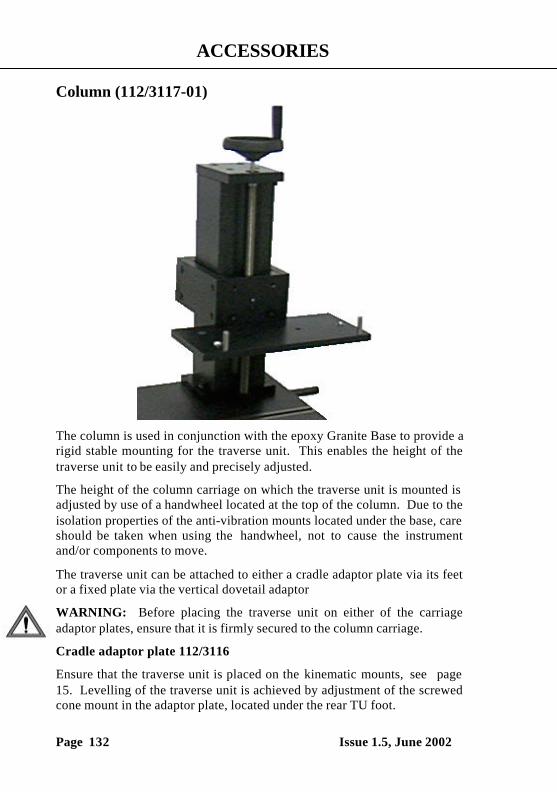
ACCESSORIES
Page 132 Issue 1.5, June 2002
Column (112/3117-01)
The column is used in conjunction with the epoxy Granite Base to provide arigid stable mounting for the traverse unit. This enables the height of thetraverse unit to be easily and precisely adjusted.
The height of the column carriage on which the traverse unit is mounted isadjusted by use of a handwheel located at the top of the column. Due to theisolation properties of the anti-vibration mounts located under the base, careshould be taken when using the handwheel, not to cause the instrumentand/or components to move.
The traverse unit can be attached to either a cradle adaptor plate via its feetor a fixed plate via the vertical dovetail adaptor
WARNING: Before placing the traverse unit on either of the carriageadaptor plates, ensure that it is firmly secured to the column carriage.
Cradle adaptor plate 112/3116
Ensure that the traverse unit is placed on the kinematic mounts, see page15. Levelling of the traverse unit is achieved by adjustment of the screwedcone mount in the adaptor plate, located under the rear TU foot.
ACCESSORIES
Issue 1.5, June 2002 Page 133
Fixed plate 112/3107
The fixed plate provides a more permanent location for the traverse unit andensure a better noise performance as the traverse unit is directly attached tothe carriage via a dovetail. The fixed plate is set to ensure the traverse unitaxis is parallel to the base within 100µm/50mm. There is no allowance fortilt adjustments on the fixed plate.
A carriage clamp screw is provided to enable the carriage to be clamped tothe column during sensitive measurements.
Specification
Material: Epoxy Granite
Weight: 35kg
Height to top of handwheel: 810mm
Depth (including adaptorplate and clamp): 340mm
Width (including adaptor plate): 355mm
Minimum height of adaptorplate underside from base: 30mm
Maximum height of adaptorplate underside from base: 372mm
Range of movement on levelling screw: Nominally +4mm from(only cradle adaptor plate) level position
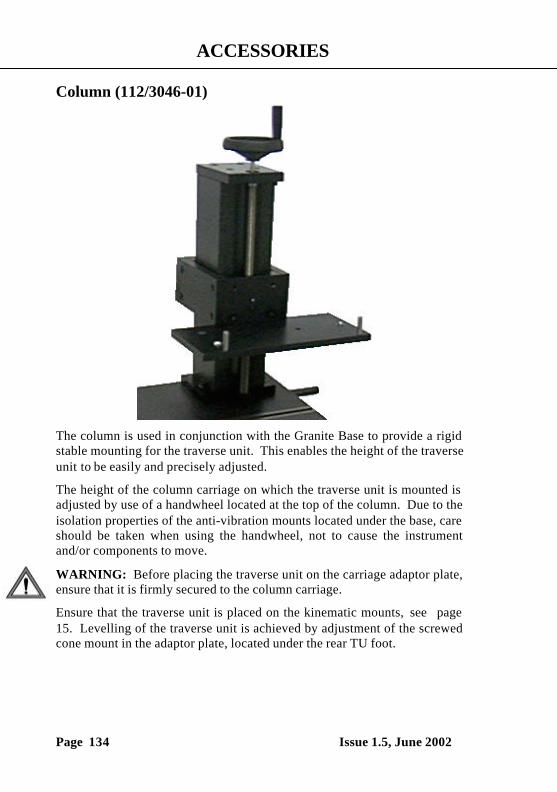
ACCESSORIES
Page 134 Issue 1.5, June 2002
Column (112/3046-01)
The column is used in conjunction with the Granite Base to provide a rigidstable mounting for the traverse unit. This enables the height of the traverseunit to be easily and precisely adjusted.
The height of the column carriage on which the traverse unit is mounted isadjusted by use of a handwheel located at the top of the column. Due to theisolation properties of the anti-vibration mounts located under the base, careshould be taken when using the handwheel, not to cause the instrumentand/or components to move.
WARNING: Before placing the traverse unit on the carriage adaptor plate,ensure that it is firmly secured to the column carriage.
Ensure that the traverse unit is placed on the kinematic mounts, see page15. Levelling of the traverse unit is achieved by adjustment of the screwedcone mount in the adaptor plate, located under the rear TU foot.
ACCESSORIES
Issue 1.5, June 2002 Page 135
A carriage clamp screw is provided to enable the carriage to be clamped tothe column during sensitive measurements.
Specification
Material: Granite
Weight: 36kg
Height to top of handwheel: 522mm
Depth (including adaptorplate and clamp): 420mm
Width (including adaptor plate): 310mm
Minimum height of adaptorplate underside from base: 30mm
Maximum height of adaptorplate underside from base: 350mm
Range of movement on levelling screw: Nominally +4mm fromlevel position
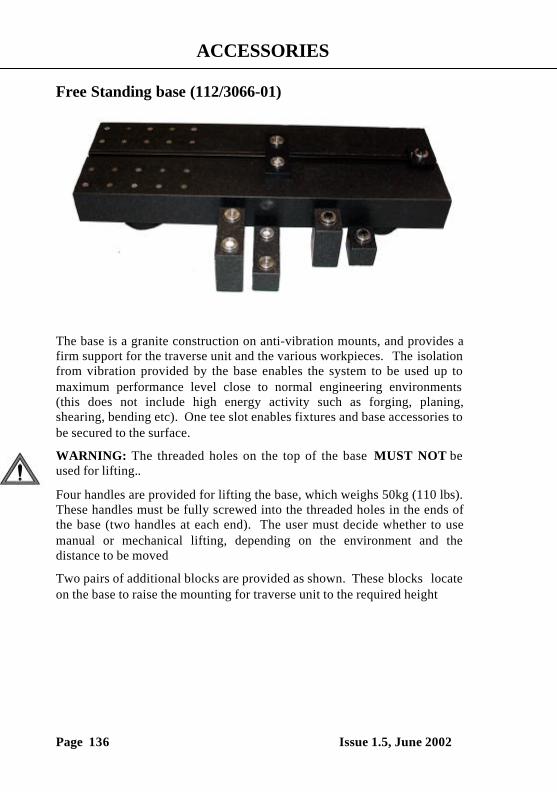
ACCESSORIES
Page 136 Issue 1.5, June 2002
Free Standing base (112/3066-01)
The base is a granite construction on anti-vibration mounts, and provides afirm support for the traverse unit and the various workpieces. The isolationfrom vibration provided by the base enables the system to be used up tomaximum performance level close to normal engineering environments(this does not include high energy activity such as forging, planing,shearing, bending etc). One tee slot enables fixtures and base accessories tobe secured to the surface.
WARNING: The threaded holes on the top of the base MUST NOT beused for lifting..
Four handles are provided for lifting the base, which weighs 50kg (110 lbs).These handles must be fully screwed into the threaded holes in the ends ofthe base (two handles at each end). The user must decide whether to usemanual or mechanical lifting, depending on the environment and thedistance to be moved
Two pairs of additional blocks are provided as shown. These blocks locateon the base to raise the mounting for traverse unit to the required height
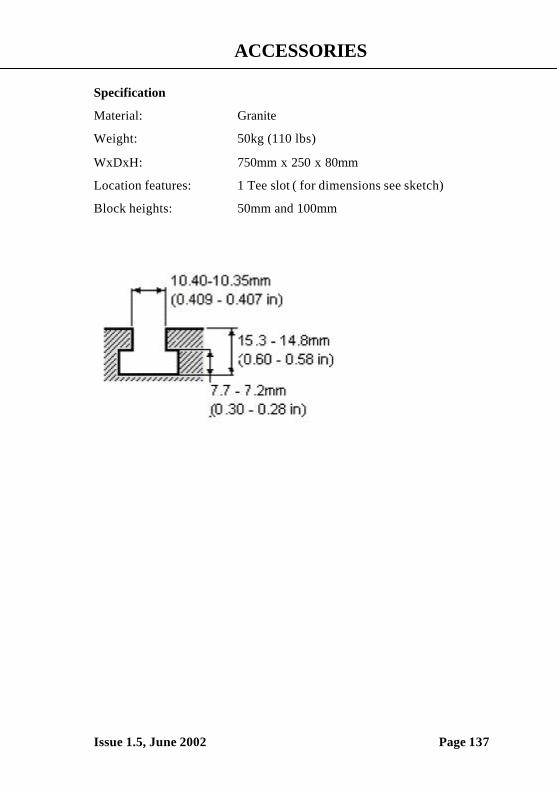
ACCESSORIES
Issue 1.5, June 2002 Page 137
Specification
Material: Granite
Weight: 50kg (110 lbs)
WxDxH: 750mm x 250 x 80mm
Location features: 1 Tee slot ( for dimensions see sketch)
Block heights: 50mm and 100mm
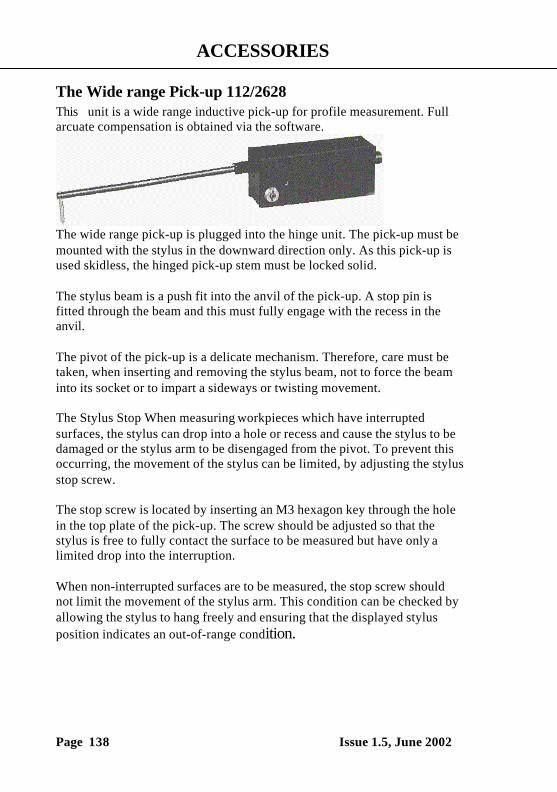
ACCESSORIES
Page 138 Issue 1.5, June 2002
The Wide range Pick-up 112/2628This unit is a wide range inductive pick-up for profile measurement. Fullarcuate compensation is obtained via the software.
The wide range pick-up is plugged into the hinge unit. The pick-up must bemounted with the stylus in the downward direction only. As this pick-up isused skidless, the hinged pick-up stem must be locked solid.
The stylus beam is a push fit into the anvil of the pick-up. A stop pin isfitted through the beam and this must fully engage with the recess in theanvil.
The pivot of the pick-up is a delicate mechanism. Therefore, care must betaken, when inserting and removing the stylus beam, not to force the beaminto its socket or to impart a sideways or twisting movement.
The Stylus Stop When measuring workpieces which have interruptedsurfaces, the stylus can drop into a hole or recess and cause the stylus to bedamaged or the stylus arm to be disengaged from the pivot. To prevent thisoccurring, the movement of the stylus can be limited, by adjusting the stylusstop screw.
The stop screw is located by inserting an M3 hexagon key through the holein the top plate of the pick-up. The screw should be adjusted so that thestylus is free to fully contact the surface to be measured but have only alimited drop into the interruption.
When non-interrupted surfaces are to be measured, the stop screw shouldnot limit the movement of the stylus arm. This condition can be checked byallowing the stylus to hang freely and ensuring that the displayed stylusposition indicates an out-of-range condition.
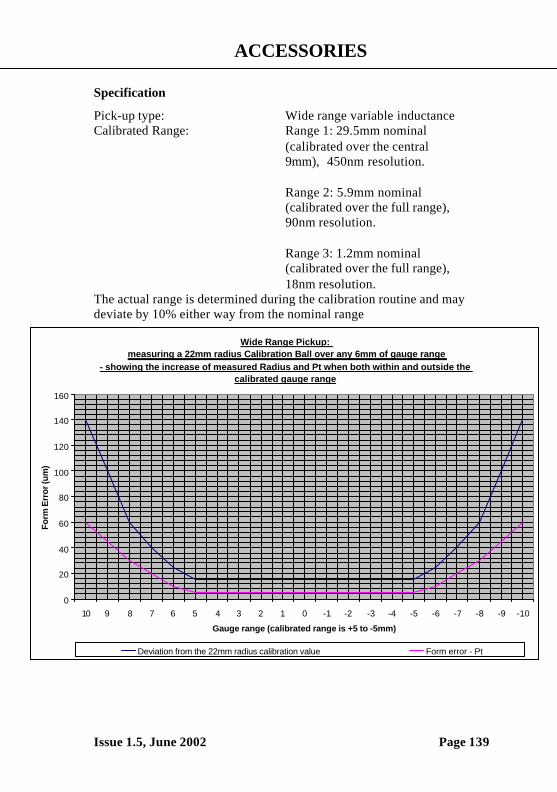
ACCESSORIES
Issue 1.5, June 2002 Page 139
Specification
Pick-up type: Wide range variable inductanceCalibrated Range: Range 1: 29.5mm nominal
(calibrated over the central9mm), 450nm resolution.
Range 2: 5.9mm nominal(calibrated over the full range),90nm resolution.
Range 3: 1.2mm nominal(calibrated over the full range),18nm resolution.
The actual range is determined during the calibration routine and maydeviate by 10% either way from the nominal range
Wide Range Pickup: measuring a 22mm radius Calibration Ball over any 6mm of gauge range
- showing the increase of measured Radius and Pt when both within and outside the calibrated gauge range
0
20
40
60
80
100
120
140
160
10 9 8 7 6 5 4 3 2 1 0 -1 -2 -3 -4 -5 -6 -7 -8 -9 -10
Gauge range (calibrated range is +5 to -5mm)
Form
Err
or (u
m)
Deviation from the 22mm radius calibration value Form error - Pt
ACCESSORIES
Page 140 Issue 1.5, June 2002
Dimensions (W x D x H): 97mm, 30mm, 40mm(3.8 x 1.18 x 1.57in)
Weight: 230gInterchangeable StyliTungsten carbide15o chisel tip- K501/1684: 20µm tip radiusTungsten carbide30o conical tip-K501/1685: 20µm tip radiusSapphire Ball-K501/1686: 500µm tip radiusResolution 850nm (83µin)Stylus Force: 3gf (0.03N) nominalRadius accuracy: <0.5% *Form best fit circular arc - Pt: <5µm *Calibration standard required 44mm diameter ball
*Figures quoted are for measurements made within the calibrated range ofthe pick-up.
Note. Shank clearance, shank length and arm length (as stated in theCalibrate menu) are with respect to the gauge pivot point.
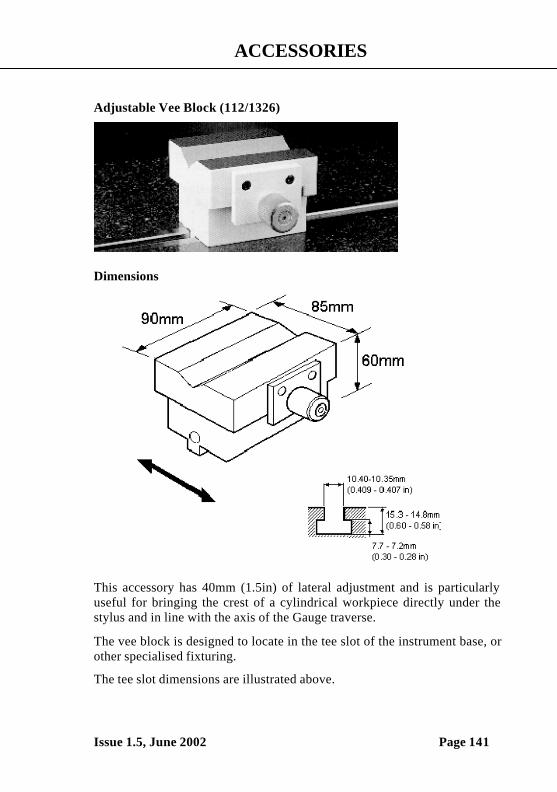
ACCESSORIES
Issue 1.5, June 2002 Page 141
Adjustable Vee Block (112/1326)
Dimensions
This accessory has 40mm (1.5in) of lateral adjustment and is particularlyuseful for bringing the crest of a cylindrical workpiece directly under thestylus and in line with the axis of the Gauge traverse.
The vee block is designed to locate in the tee slot of the instrument base, orother specialised fixturing.
The tee slot dimensions are illustrated above.
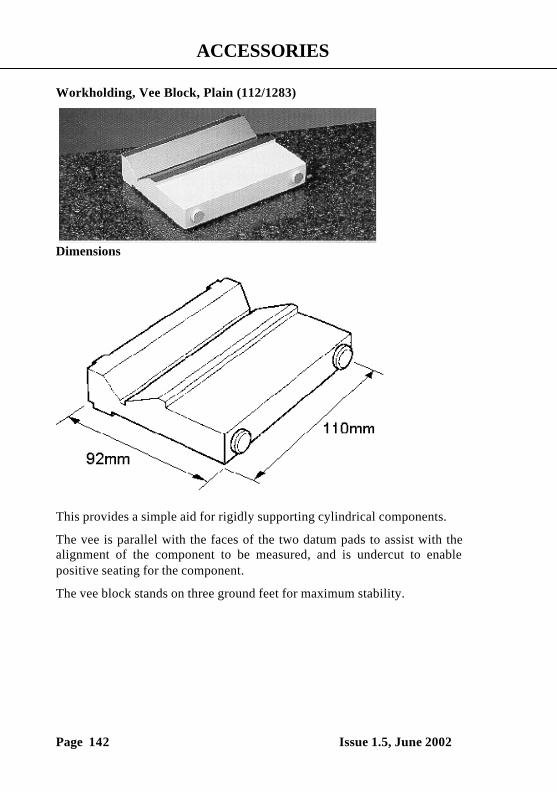
ACCESSORIES
Page 142 Issue 1.5, June 2002
Workholding, Vee Block, Plain (112/1283)
Dimensions
This provides a simple aid for rigidly supporting cylindrical components.
The vee is parallel with the faces of the two datum pads to assist with thealignment of the component to be measured, and is undercut to enablepositive seating for the component.
The vee block stands on three ground feet for maximum stability.
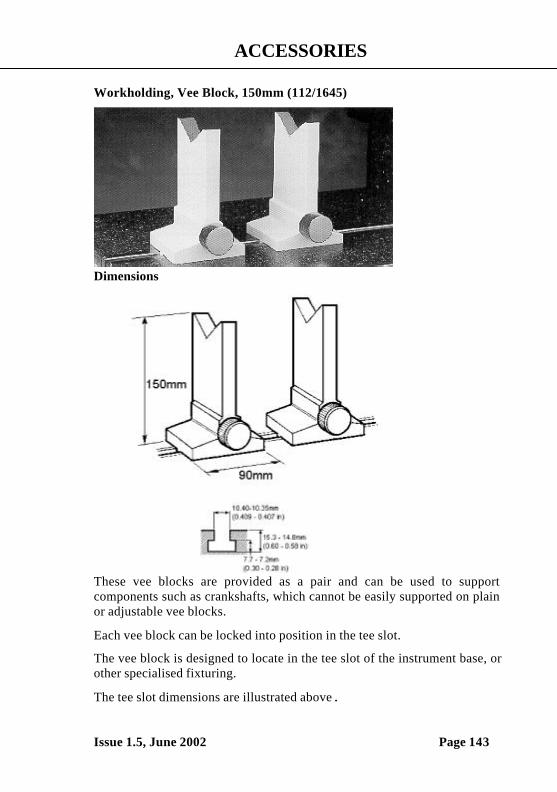
ACCESSORIES
Issue 1.5, June 2002 Page 143
Workholding, Vee Block, 150mm (112/1645)
Dimensions
These vee blocks are provided as a pair and can be used to supportcomponents such as crankshafts, which cannot be easily supported on plainor adjustable vee blocks.
Each vee block can be locked into position in the tee slot.
The vee block is designed to locate in the tee slot of the instrument base, orother specialised fixturing.
The tee slot dimensions are illustrated above.
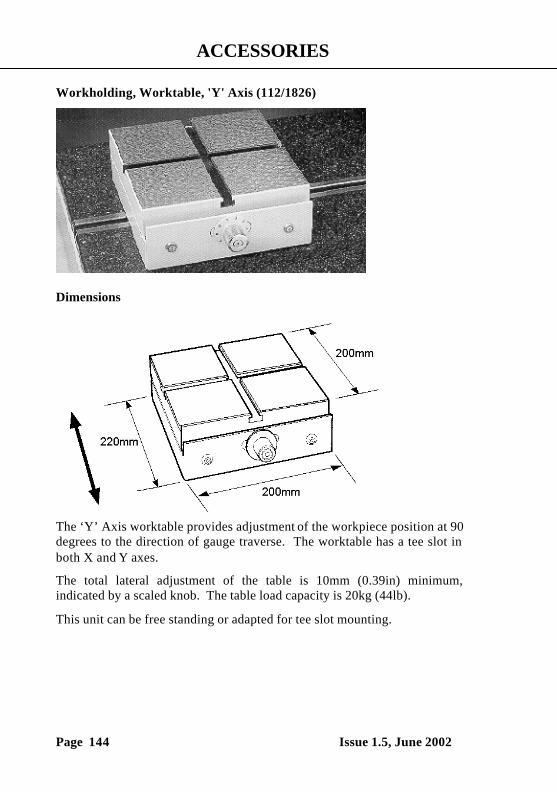
ACCESSORIES
Page 144 Issue 1.5, June 2002
Workholding, Worktable, 'Y' Axis (112/1826)
Dimensions
The ‘Y’ Axis worktable provides adjustment of the workpiece position at 90degrees to the direction of gauge traverse. The worktable has a tee slot inboth X and Y axes.
The total lateral adjustment of the table is 10mm (0.39in) minimum,indicated by a scaled knob. The table load capacity is 20kg (44lb).
This unit can be free standing or adapted for tee slot mounting.
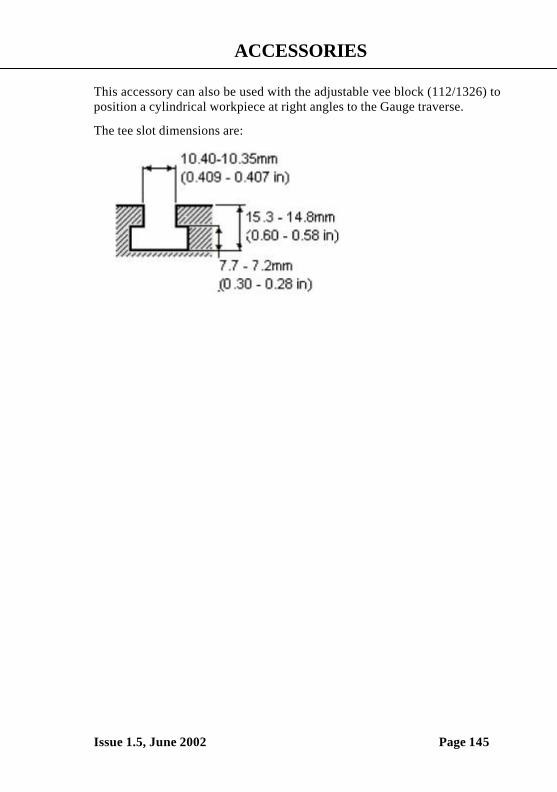
ACCESSORIES
Issue 1.5, June 2002 Page 145
This accessory can also be used with the adjustable vee block (112/1326) toposition a cylindrical workpiece at right angles to the Gauge traverse.
The tee slot dimensions are:
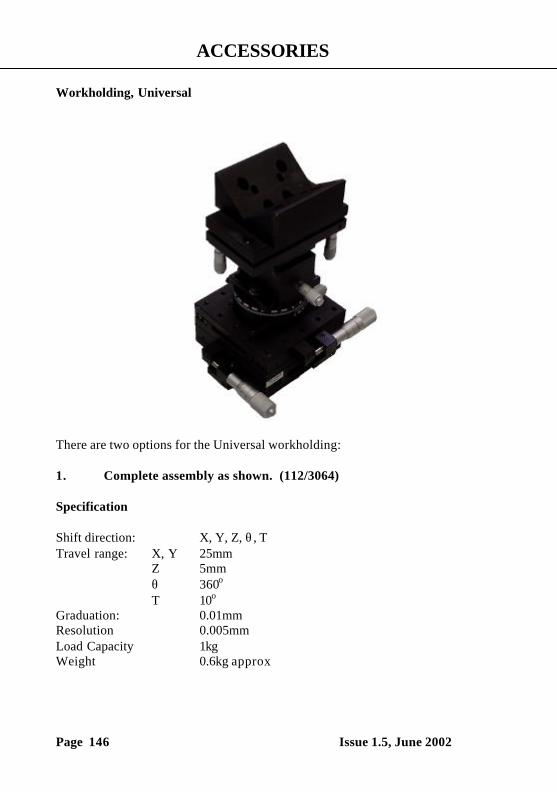
ACCESSORIES
Page 146 Issue 1.5, June 2002
Workholding, Universal
There are two options for the Universal workholding:
1. Complete assembly as shown. (112/3064)
Specification
Shift direction: X, Y, Z, θ , TTravel range: X, Y 25mm
Z 5mmθ 360o
T 10o
Graduation: 0.01mmResolution 0.005mmLoad Capacity 1kgWeight 0.6kg approx
ACCESSORIES
Issue 1.5, June 2002 Page 147
X-Y Stage and Vee block only. (112/3067)
Specification
Shift direction: X, YTravel range: X, Y 25mmGraduation: 0.01mmResolution 0.005mmLoad Capacity 1kg
Attaching both options to the base/free standing base
Both options are supplied with an Interface plate that fits into the tee slot ofthe base. Two screws can then be tightened to secure the interface plate andhence the workholding to which it is attached, in place on the base. A 4mmA/F Allen key is required to tighten the two screws.
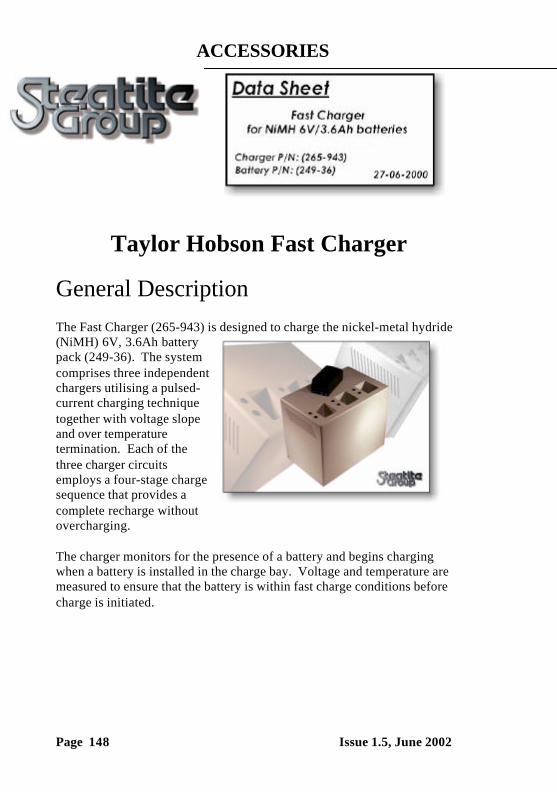
ACCESSORIES
Page 148 Issue 1.5, June 2002
Taylor Hobson Fast Charger
General DescriptionThe Fast Charger (265-943) is designed to charge the nickel-metal hydride(NiMH) 6V, 3.6Ah batterypack (249-36). The systemcomprises three independentchargers utilising a pulsed-current charging techniquetogether with voltage slopeand over temperaturetermination. Each of thethree charger circuitsemploys a four-stage chargesequence that provides acomplete recharge withoutovercharging.
The charger monitors for the presence of a battery and begins chargingwhen a battery is installed in the charge bay. Voltage and temperature aremeasured to ensure that the battery is within fast charge conditions beforecharge is initiated.
ACCESSORIES
Issue 1.5, June 2002 Page 149
Features• Three independent charger bays
with dedicated signal indicators.• Multiple charge termination methods:
- Voltage slope- Maximum temperature- Charge timer
• Four stage charge sequence:- Soft start charge- Fast charge- Topping charge- Maintenance charge
• Reverse-pulse charging in all charge stages.• Fast charge time: < 2½ hours.• Out-of-temperature range detection:
- Hot battery: charger shutdown- Cold battery: low current charge
• Continuous polling mode for battery detection.
Charger OperationCharging Stages
The charging sequence consists of four stages. The soft start stagegradually increases current levels up to the fast charge rate during the firsttwo minutes. The soft start stage is followed by the fast charge stage, whichcontinues until termination. After termination, a two-hour topping charge isapplied at a rate low enough to prevent cell heating but high enough toensure a full charge. The topping charge is followed by a maintenancecharge, which is intended to offset the natural self-discharge of the batteryby keeping the cells primed at peak charge. The maintenance charge willcontinue as long as the battery is inserted in the bay.
The RED Charge Status indicator is activated continuously during soft startand fast charge. The GREEN Charge Status indicator is activatedcontinuously during topping and maintenance charge.
ACCESSORIES
Page 150 Issue 1.5, June 2002
Charge Termination Methods
The charger uses voltage slope, maximum temperature and charge timermethods to terminate fast charge. The maximum temperature and fastcharge timer are used as a safety backup during the main charge cycle.
If the temperature of the battery exceeds the maximum limit during a chargecycle, the charger will shutdown and stop charging. The YELLOW BatteryTemperature indicator will latch on indicating a Hot Battery condition. Theuser must remove the battery and manually reset the charger via therecessed push-button switch situated at the back of the unit. The batterymust be allowed to cool before it can be reinserted and charged again.
Note: Repeated over temperature shutdowns indicates a potential faultcondition and the battery must be removed from service immediately andreturned to the supplier with details of the problem.
The charger uses a timer to limit the fast charge duration to 144 minutes.For safety, the fast charge timer is always enabled and cannot be disabled.
Note: Powering-up, removing and re-inserting a battery, or manuallyresetting the charger using the push-button switch will reset the safetytimer.
Battery Detection
Upon power-up, removal of a battery, or manual reset after an overtemperature shutdown condition, the charger enters the battery pollingdetect mode. To indicate this mode, the YELLOW indicator will flashcontinuously. Once a battery is installed in a charger bay, the YELLOWindicator will stop flashing and the charger will enter the soft start stage.

ACCESSORIES
Issue 1.5, June 2002 Page 151
Cold Battery Charging
The charger checks for a cold battery before initiating fast charge. If a coldbattery is present before fast charge begins, the charger begins a two hourtopping charge cycle. If the battery is still cold after the two hour toppingcharge is complete, the charger begins a maintenance charge. Themaintenance charge will continue for as long as the battery remains cold.The charger checks the temperature every second to see if the battery haswarmed up. If the battery warms up, the charger stops the topping ormaintenance charge and begins the fast charge cycle.
The GREEN Charge Status indicator and the YELLOW BatteryTemperature indicator will be active, indicating that a low current charge isbeing applied to the battery that is outside the specified temperature rangefor fast charging.
Safety Features
In the event of an accidental short circuit across the battery terminals insidethe charger bay, the charger will automatically limit the internal current to1.8A (normal fast charge current) to prevent damage to the electronics. TheGREEN Charge Status indicator will flash and the YELLOW BatteryTemperature indicator will turn on indicating the condition. The user mustimmediately turn off system power and remove the short circuit obstructionfrom the charger bay.
The input to each charger circuit is internally protected with a 3.15A fuse.A blown fuse indicates a fault condition and must not be replaced by theuser.
Additionally, each battery pack includes a PTC fuse to protect againstaccidental short circuits across the battery pack terminals. The PTC shouldautomatically reset itself when the short circuit condition is removed. If thepack does not recover from the short circuit condition, the battery must beremoved from service immediately and returned to the supplier with detailsof the problem.
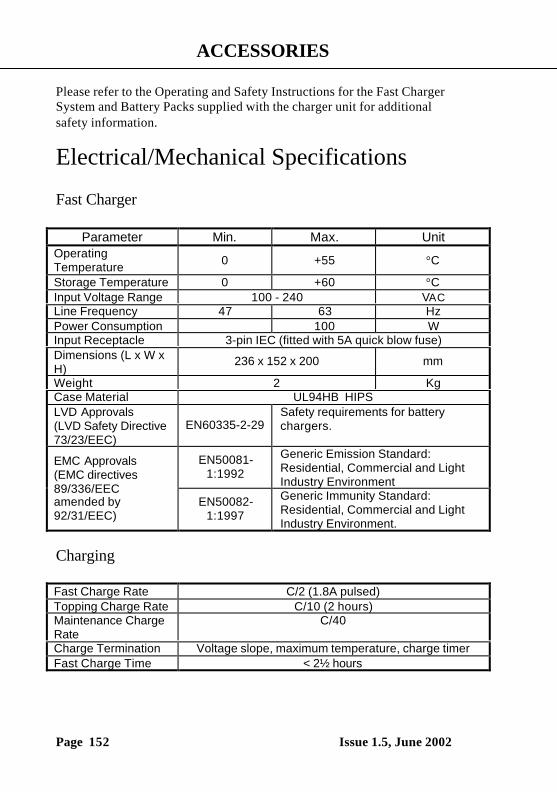
ACCESSORIES
Page 152 Issue 1.5, June 2002
Please refer to the Operating and Safety Instructions for the Fast ChargerSystem and Battery Packs supplied with the charger unit for additionalsafety information.
Electrical/Mechanical Specifications
Fast Charger
Parameter Min. Max. UnitOperatingTemperature 0 +55 °C
Storage Temperature 0 +60 °CInput Voltage Range 100 - 240 VACLine Frequency 47 63 HzPower Consumption 100 WInput Receptacle 3-pin IEC (fitted with 5A quick blow fuse)Dimensions (L x W xH)
236 x 152 x 200 mm
Weight 2 KgCase Material UL94HB HIPSLVD Approvals(LVD Safety Directive73/23/EEC)
EN60335-2-29Safety requirements for batterychargers.
EN50081-1:1992
Generic Emission Standard:Residential, Commercial and LightIndustry Environment
EMC Approvals(EMC directives89/336/EECamended by92/31/EEC)
EN50082-1:1997
Generic Immunity Standard:Residential, Commercial and LightIndustry Environment.
Charging
Fast Charge Rate C/2 (1.8A pulsed)Topping Charge Rate C/10 (2 hours)Maintenance ChargeRate
C/40
Charge Termination Voltage slope, maximum temperature, charge timerFast Charge Time < 2½ hours
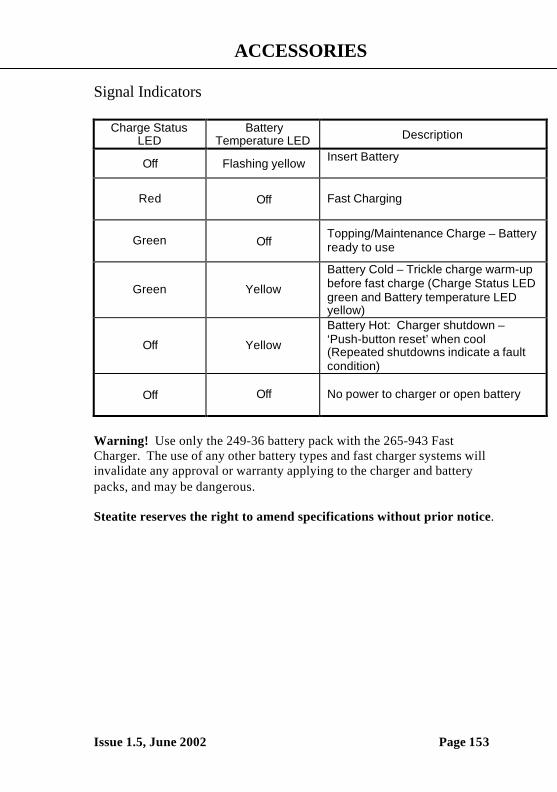
ACCESSORIES
Issue 1.5, June 2002 Page 153
Signal Indicators
Charge StatusLED
BatteryTemperature LED Description
Off Flashing yellow Insert Battery
Red Off Fast Charging
Green OffTopping/Maintenance Charge – Batteryready to use
Green Yellow
Battery Cold – Trickle charge warm-upbefore fast charge (Charge Status LEDgreen and Battery temperature LEDyellow)
Off Yellow
Battery Hot: Charger shutdown –‘Push-button reset’ when cool(Repeated shutdowns indicate a faultcondition)
Off Off No power to charger or open battery
Warning! Use only the 249-36 battery pack with the 265-943 FastCharger. The use of any other battery types and fast charger systems willinvalidate any approval or warranty applying to the charger and batterypacks, and may be dangerous.
Steatite reserves the right to amend specifications without prior notice.
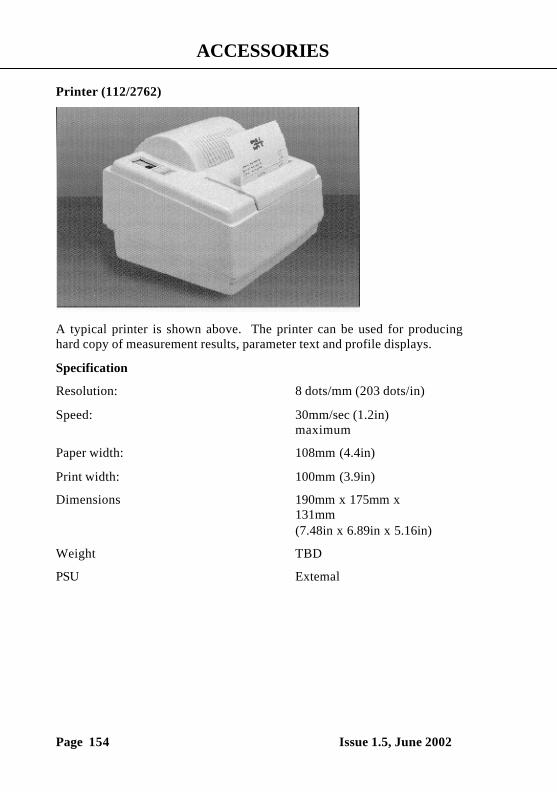
ACCESSORIES
Page 154 Issue 1.5, June 2002
Printer (112/2762)
A typical printer is shown above. The printer can be used for producinghard copy of measurement results, parameter text and profile displays.
Specification
Resolution: 8 dots/mm (203 dots/in)
Speed: 30mm/sec (1.2in) maximum
Paper width: 108mm (4.4in)
Print width: 100mm (3.9in)
Dimensions 190mm x 175mm x131mm(7.48in x 6.89in x 5.16in)
Weight TBD
PSU External
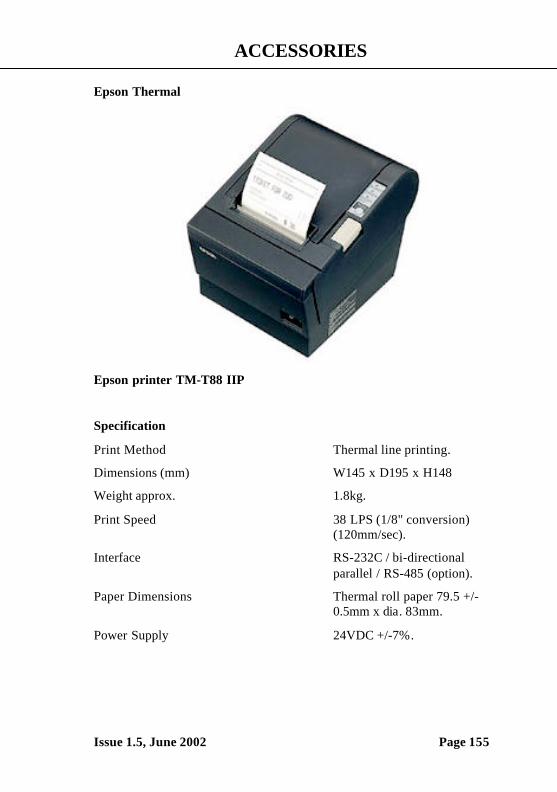
ACCESSORIES
Issue 1.5, June 2002 Page 155
Epson Thermal
Epson printer TM-T88 IIP
Specification
Print Method Thermal line printing.
Dimensions (mm) W145 x D195 x H148
Weight approx. 1.8kg.
Print Speed 38 LPS (1/8" conversion)(120mm/sec).
Interface RS-232C / bi-directionalparallel / RS-485 (option).
Paper Dimensions Thermal roll paper 79.5 +/-0.5mm x dia. 83mm.
Power Supply 24VDC +/-7%.
ACCESSORIES
Page 156 Issue 1.5, June 2002
Deskjet Printer 112/2902
DescriptionThe Hewlett Packard Deskjet 950C printer can be supplied as an optionalaccessory and provides an alternative or addition to the printer 112/2762.
Results printouts are output to fit on A4 or Letter size paper.
Details of operation and specification are provided in the manufacturer'shandbooks.
Versions are supplied appropriate to the country in which it is to beoperated:
112/2902 E for use in the U.K.112/2902 F for use in France112/2902 G for use in Germany112/2902 I for use in Italy112/2902 S for use in Spain112/2902 U for use in the U.S.A. and Canada.
Important
1. Do not load the printer driver software supplied with the Deskjetprinter. The printer drivers required for use with Taylor Hobsonequipment, are included and loaded with the instrument software.
2. Use only the lead supplied with the Taylor Hobson equipment toconnect the printer to the parallel port of the computer. Do not usethe lead supplied with the printer.
For further details on the printer, refer to the manufacturer's handbooksupplied.
ACCESSORIES
Issue 1.5, June 2002 Page 157
Laserjet Printer 112/2696
DescriptionThe Hewlett Packard Laserjet printer can be supplied as an optionalaccessory and provides an alternative or addition to the printer 112/2762.
Results printouts are output to fit on A4 or Letter size paper.
Details of operation and specification are provided in the manufacturer'shandbooks.
Versions are supplied appropriate to the country in which it is to beoperated:
112/2696 E for use in the U.K.112/2696 F for use in France112/2696 G for use in Germany112/2696 I for use in Italy112/2696 S for use in Spain112/2696 U for use in the U.S.A. and Canada.
Important
1. Do not load the printer driver software supplied with the Laserjetlaser printer. The printer drivers required for use with TaylorHobson equipment, are included and loaded with the instrumentsoftware.
3. Use only the lead supplied with the Taylor Hobson equipment toconnect the printer to the parallel port of the computer. Do not usethe lead supplied with the printer.
For further details on the laser printer, refer to the manufacturer's handbooksupplied.
ACCESSORIES
Page 158 Issue 1.5, June 2002
PCMCIA Card (112/3022)
The flash disk socket on the Intra PCM is designated as:
PCMCIA Type II
This specification covers the physical and electricalspecifications of the interface.
The flash memory cards must conform to the following specification:
PC Card ATA
Specification
Removable media: One PCMCIA Type II slot provided foruse with optional PC Card ATA Flash Disks.

ACCESSORIES
Issue 1.5, June 2002 Page 159
PCM Stand (112/3047)
A PCM stand is available to mount the PCM.
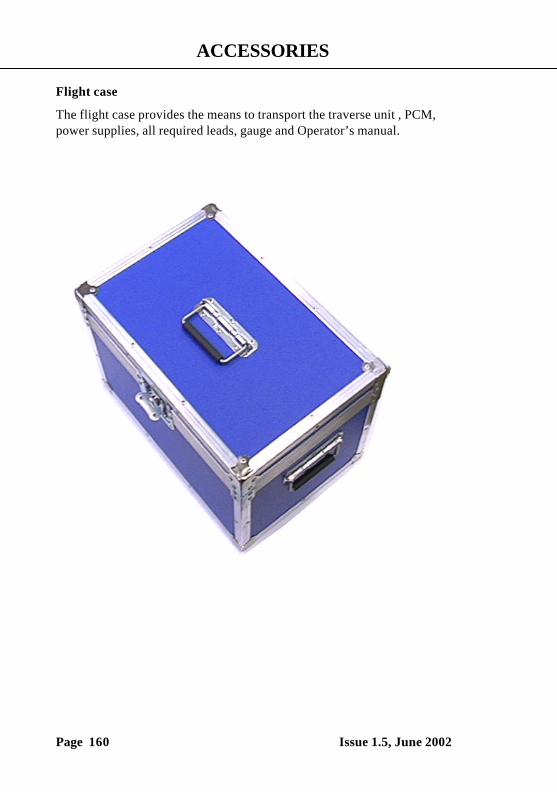
ACCESSORIES
Page 160 Issue 1.5, June 2002
Flight case
The flight case provides the means to transport the traverse unit , PCM,power supplies, all required leads, gauge and Operator’s manual.
GLOSSARY
Issue 1.5, June 2002 Page 161
This glossary contains descriptions of terms used in connection withthe measurement and analysis of surface texture. Some terms
relate to the functions and facilities of certain types of hardware orsoftware and may not apply to your particular system.
AA-D converter
Analogue to digital converter which is used on the analogueoutput of the transducer to create Data Points.
Amplitude DistributionThe distribution of frequency with which peaks of the sameheight occur in the measured profile data.
AnalogueFaithful representation of the changing states of something inthe real world. The essence of analogue representation isthat the measurement value is continuously variable, usuallybetween known limits. The output from a transducer isanalogue. An analogue signal is converted to digital in an A-D converter.
AnalysisCan refer to Primary Analysis or analysis of roughness,waviness etc. Analysis comprises form fit, form removal,filtering and parameters.
Arcuate CorrectionThe correction applied to the output from the transducer tocompensate for the fact that the stylus (whose arm ispivoted) moves in an arc rather than a straight line.
GLOSSARY
Page 162 Issue 1.5, June 2002
Assessment LengthThat part of the profile which remains after the various filtershave removed sampling lengths (or parts thereof) fromeither end of the data length.
Auto ReverseA facility to re-position the stylus at the start positionautomatically after a data collection pass. It does notautomatically repeat the pass.
AxisUnlike some other branches of mathematics and science, they-axis is “front-to-back”, the z-axis is vertical and the x-axis is(as in the normal convention) horizontal. The term “z axis” isnormally used to describe the column.
Axis CalibrationThe action of specifying to the software the positions atwhich the traverse unit and column carriage are regarded asbeing located. This then provides a reference point on eachaxis for subsequent measurement or movement. Thepositions will normally be close to the physical positions (forexample, the extreme left position of the traverse unit isnominally zero) but the reference will be precise; the physicalposition is not.
GLOSSARY
Issue 1.5, June 2002 Page 163
BBalance
This term used to describe the resistive balance and phasecharacteristics that relate to inductive gauges only.
BandwidthThe ratio between the wavelengths of the Lc Cut-off and LsCut-off values.
Specifies the ratio of the low pass cut-off to the high passcut-off and represents the range of wavelengths that willremain after the filtering process
Bearing RatioAlternative term for material ratio.
CCalibration
A generic term which, in terms of surface metrologyembraces axis calibration and gauge calibration.
Calibration ConstantA numerical value that is required by the algorithms used tocalculate the parameters. Typically, 6 such constants arecomputed during a calibration session. Used to minimiseinaccuracies in the hardware.
Calibration StandardA test surface having known values.
CoefficientA mathematical term whose equivalent in the present contextis Calibration Constant.
GLOSSARY
Page 164 Issue 1.5, June 2002
ConstantSee Calibration Constant
Crowning (cresting)For surface measurement, crowning (sometimes referred toas cresting) is the process of determining the highest point ofa component that has a convex form, or the lowest point of aconcave form. This is normally an iterative process in whichthe stylus is traversed over the component a number of timesuntil the position of the turning point is established.
The stylus is then automatically positioned at this point onthe component. The term Cresting is more properly appliedto the alignment of the stylus to the axis of rotation of aninstrument designed for the measurement of roundness
Cut-offA portion of the profile, with length of sampling length,which is often regarded as a basic element in a specificationof a surface measurement. The term is also used to refer to awavelength but is ambiguous when used unqualified in thissense. In this sense, the qualified term Lc Cut-off or Ls Cut-off should be used instead.
Cut-off LengthA term often used to mean the same as Sampling Length.
GLOSSARY
Issue 1.5, June 2002 Page 165
DData Collection
The term used to describe the action of drawing the stylusacross the component. (The term “measurement” can beambiguous and is not normally used unqualified).
Data LengthThe distance over which the stylus is drawn while datacollection is taking place. Data Length does not include Run-up Length. The use of filters reduces data length down toassessment length. It is, arithmetically, the sampling lengthtimes the number of cut-offs used in the measurement. Alsoknown as evaluation length and measurement length.
GLOSSARY
Page 166 Issue 1.5, June 2002
Data PointA point on the analogue representation of the surface contourwhich has been sampled by the A-D converter and,consequently, had its position in space recorded by having co-ordinates allocated to it.
DatumA fixed reference, to which the displacements of the stylusare referred. An independent straight datum is embodied inthe Traverse Unit.
Desert LandscapeAn analogy from nature which is often used to illustrate theconcepts of roughness, waviness and form.
DeviceAn element which goes to form part of an instrument.Examples of elements would include the traverse unit,gauge, motorised y table, etc.
GLOSSARY
Issue 1.5, June 2002 Page 167
E
Evaluation LengthA term which means the same as Data Length.
ExtendMovement of the traverse unit to the left.
Extended ParameterA surface finish parameter such as dc or HSC that requiresone or more pieces of additional information to be specifiedfor its calculation such as ‘height’.
F
FilterA device for excluding unwanted, but closely specified, partsof the raw data profile from the analysis.
FormThe overall “shape” of the object under test and the accuracywith which it conforms to a perfectly shaped conceptualmodel. In terms of the analogy with a desert landscape ,form is the large undulations of hills and valleys.
Form AnalysisThe calculation, carried out in the software, which creates aconceptual form fit (for example a straight line or an arc). It isthe variation between this form fit and the real profile thatenables parameters to be calculated.

GLOSSARY
Page 168 Issue 1.5, June 2002
Form AnalysisThe calculation, carried out in the software, which creates aconceptual form fit (for example a straight line or an arc). Itis the variation between this form fit and the real profile thatenables parameters to be calculated.
Form FitA theoretical line or arc with which the real profile iscompared.
GGauge
Mechanical assembly comprising the transducer, a pivotingmechanism to allow the stylus to move within its stylusrange and an electrical connection.
Gauge CalibrationThe measurement of an appropriate calibration standard (eg a radius) to enable the software to derive a set ofcalibration constants which are applicable to a the currentgauge and gauge range.
Gauge OrientationWhether the stylus is pressing UP or DOWN on thecomponent. A gauge orientation of NORMAL is pressingDOWN, INVERTED is pressing UP. The gauge isconstructed such that, when pressing UP, the stylus exertsthe same force on the component as when pressing DOWN.
.

GLOSSARY
Issue 1.5, June 2002 Page 169
Gauge RangeThe distance of vertical travel which the particular transducerpermits the stylus to make. Normally in the range 0.5mm to20.0mm.
Gauge ResolutionThe smallest movement which the instrument can detect.
H
IInductive
The type of transducer that is housed within a gauge andconverts the movements of the stylus into electrical signals.An inductive transducer employs the very small movementsof the stylus to move an armature between two coils tochange their relative electrical inductance. The amplitudeand direction of these changes provide the output from thegauge.

GLOSSARY
Page 170 Issue 1.5, June 2002
JKLLc Cut-off
Used to specify the long wavelength limit for the Roughnessbandpass filter. Wavelengths longer than this length will beremoved by the filtering process.
See also Ls Cut-off and bandwidth.
GLOSSARY
Issue 1.5, June 2002 Page 171
LengthAn ambiguous term when used unqualified. See AssessmentLength, Cut-off Length, Data Length, Evaluation Length,Measurement Length, Sampling Length, Run-up Length, andTraverse Length.
Ls Cut-offThe short wavelength limit for the Roughness band pass filterand primary filter.
The Ls Cut-off specifies the low pass cut-off length for theselected filter. Wavelengths shorter than this length will beremoved by the filter process.
See also Lc Cut-off and bandwidth.
Lf Cut-offThe short wavelength limit for the Waviness filter.Wavelengths shorter than this length will be removed by thefilter process.
MMaterial Ratio
The ratio expressed as a percentage, of the length of surfaceat any specified depth in the profile to the evaluation length.
Measurement AxisThe axis from which measurements are taken (x-axis) andused in the computation.
Measurement LengthA term which means the same as Data Length.
GLOSSARY
Page 172 Issue 1.5, June 2002
Measurement LoopThe physical connection between the structural elements ofthe instrument which provide the physical reference againstwhich the movement of the stylus is measured. Themeasurement loop will typically comprise the transducer,stem, carriage, column, base, clamp and component and allthe connections between them.
Measurement SpeedThe speed at which the traverse unit moves during datacollection. See also Movement Speed.
Modified ProfileThe output from the analysis after form removal and filteringwhich is used in the further analysis of Primary, Roughnessand Waviness surface finish.
N
OOff-line
Used to indicate that the software is not to communicate withthe instrument. Typically used when analyses use previouslystored measurement data.
GLOSSARY
Issue 1.5, June 2002 Page 173
P
ParameterThe set of values used in surface metrology to describe thetexture of a surface in quantitative terms. Phase GratingInterferometric transducer.
Primary AnalysisAnalysis that takes primary data as its input carries out formfit, primary filtering and calculates primary parameters. Theoutput from primary analysis is called the Modified Profile.
GLOSSARY
Page 174 Issue 1.5, June 2002
Primary FilterThe low pass filter used to reduce the number of data pointsfrom a data collection. It is an intelligent selection in that ittakes account of the profile to reflect any significant featurethat may be so narrow that data density selection mightmiss it.
Primary ParametersParameters which are produced by primary analysis.
ProfileThe trace of the component. It is stored digitally in termsdata points.
QQualifier
The optional variable(s) used in the calculation of aparameter.

GLOSSARY
Issue 1.5, June 2002 Page 175
RRange
see Gauge Range
Raw ProfileA term often used which means broadly the same asPrimary Data . Also known as Raw Data.
Resolutionsee Gauge Resolution
RetractingStylus movement from left to right. Measurement must takeplace only while the stylus is retracting in order to avoid theeffect of backlash in the mechanism and to prevent the stylusfrom digging in to the component. The opposite of retract isextend.
RoughnessThe microscopic ridges by which the surface differs from aperfectly smooth line or plane. It is described in terms of thewavelength of the profile. In terms of the analogy with adesert landscape , roughness is the grains of sand.
Roughness FilterA filter which removes longer wavelengths (that is, removeswaviness).
Run-up LengthThe amount of travel allowed for the traverse mechanism tostabilise before data collection begins.
GLOSSARY
Page 176 Issue 1.5, June 2002
SSampling Length
A term which has different meanings in different contexts.For a primary profile, it is equal to the data length. Forroughness and waviness analysis, it is equal to theselected Lc Cut-off wavelength. Also known as Cut-offLength.
StylusThe element which follows the contour of the component.
Surface TextureSee Texture
GLOSSARY
Issue 1.5, June 2002 Page 177
TTexture
The generic terms which includes roughness, wavinessand form. It is conveniently described by analogy with adesert landscape .
TransducerThe device which converts stylus movement to an electrical(analogue) signal. The analogue signal is converted todigital in an A-D converter.
Traverse LengthThe full distance over which the stylus is drawn for a datacollection operation. It includes Run-up Length.Arithmetically it is Data Length plus Run-up Length.
Traverse UnitThe drive unit which moves the stylus in the x-axis. Datacollection must take place only while the traverse unit isretracting.
GLOSSARY
Page 178 Issue 1.5, June 2002
U
V
WWaviness
Undulations which are larger than roughness but smallerthan the shape called “form”. It is described in terms of thewavelength of the profile. In terms of the analogy with adesert landscape , waviness is the ripples in the sand.
Waviness FilterA filter which removes shorter wavelengths (that is, removesroughness).
WavelengthThe distance between corresponding features of asubstantially repetitive profile.
XYZ

APPENDIX A
Issue 1.5, June 2002 Page 179
APPENDIX A
DATA EXCHANGE PROTOCOL CONVERSION
DescriptionThe CONV_DEP program is a utility that enables the operator to transformmeasurement data files, from their original binary format into the ASCIIformat.
Note The CONV_DEP program is run from a Windows commandprompt box.
File ConversionThe CONV_DEP program must be executed with three parameters, theseare:
• The source path and filename.• The type of output required (-A for ASCII format or -B for Binary
format).• The destination path and filename.
Typical examples of commands are:
CONV-DEP MEAS01.PRF -A MEAS01.TXT
The above command causes the data in raw profile file MEAS01.PRF to beconverted into ASCII character format and output to the file MEAS01.TXT.
Restrictions and limitationsThe Form Talysurf INTRA can only read data in a Binary format.
DATA EXCHANGE PROTOCOL (version 2.0)
IntroductionThe 'DEP v2.0' file protocol enables Measurement data (Raw profile)information to be saved with sufficient detail for the reproduction of thedata at a later date.
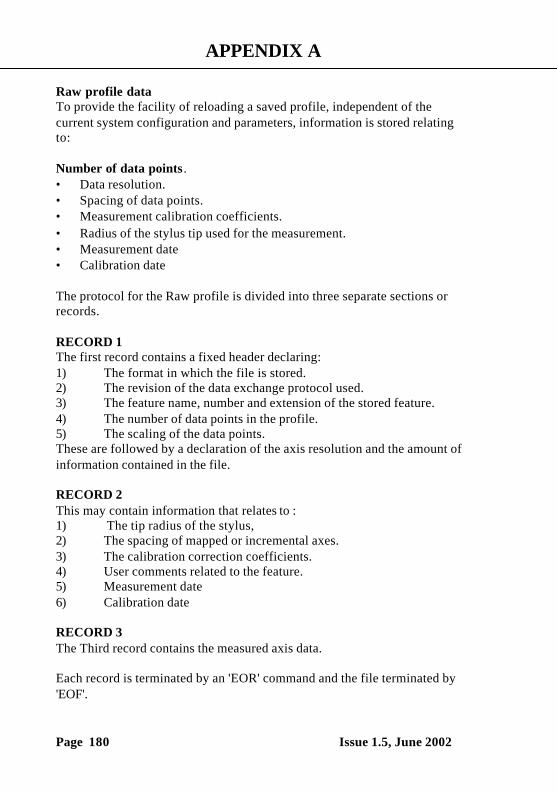
APPENDIX A
Page 180 Issue 1.5, June 2002
Raw profile dataTo provide the facility of reloading a saved profile, independent of thecurrent system configuration and parameters, information is stored relatingto:
Number of data points .• Data resolution.• Spacing of data points.• Measurement calibration coefficients.• Radius of the stylus tip used for the measurement.• Measurement date• Calibration date
The protocol for the Raw profile is divided into three separate sections orrecords.
RECORD 1The first record contains a fixed header declaring:1) The format in which the file is stored.2) The revision of the data exchange protocol used.3) The feature name, number and extension of the stored feature.4) The number of data points in the profile.5) The scaling of the data points.These are followed by a declaration of the axis resolution and the amount ofinformation contained in the file.
RECORD 2This may contain information that relates to :1) The tip radius of the stylus,2) The spacing of mapped or incremental axes.3) The calibration correction coefficients.4) User comments related to the feature.5) Measurement date6) Calibration date
RECORD 3The Third record contains the measured axis data.
Each record is terminated by an 'EOR' command and the file terminated by'EOF'.

APPENDIX A
Issue 1.5, June 2002 Page 181
Note. When measurement data is saved via the CONV-DEP utility, thefile created is identified by the Feature name and Number of the originalmeasurement. This information is included in the record 1 of the data fileand is not changed by renaming the file.
ConventionsIn the descriptions which follow:• The Italic Text indicates mandatory text that appears at the start or end
of the record.
DESCRIPTION OF SPECIFIC TERMS VALID IN RECORD 1
Field Name Example / CommentOptions
'Data format' :'0' - Indication of binary file format.:'1' - Indication of ASCII file format.
'Revision No.' :'2' - DEP Revision 2.00.'<cr><lf>' : - Line Terminator
'Feature Name' : 'RTH_' - Name padded with spaces to 6 characters.
'Feature No.' : 0.0e0 - Number in double precision floating point format.
'Feature Type' : 'PRF' - Raw PRoFile data.'<cr><lf>' : - Line Terminator.
'Axis' : 'CX' - Cartesian X-axis data.: 'CZ' - Cartesian Z-axis data.
'Data Type' : 'M' - Mapped data.'No. Data Points' : 4.003e3 - Number of data points (double
precision float).'Units' : 'M' - Metres.
: 'MM': 'UM': 'NM': 'PM': 'IN' - Inches.: 'MIN': 'UIN': 'NIN'
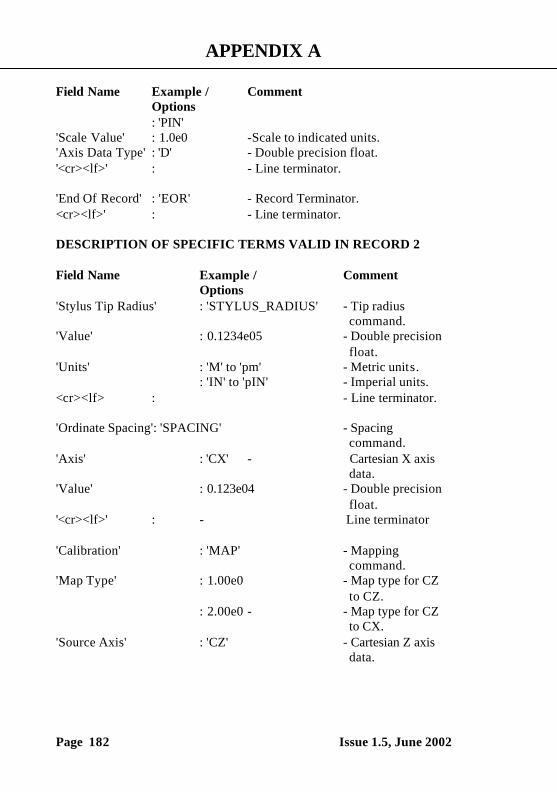
APPENDIX A
Page 182 Issue 1.5, June 2002
Field Name Example / CommentOptions: 'PIN'
'Scale Value' : 1.0e0 -Scale to indicated units.'Axis Data Type' : 'D' - Double precision float.'<cr><lf>' : - Line terminator.
'End Of Record' : 'EOR' - Record Terminator.<cr><lf>' : - Line terminator.
DESCRIPTION OF SPECIFIC TERMS VALID IN RECORD 2
Field Name Example / CommentOptions
'Stylus Tip Radius' : 'STYLUS_RADIUS' - Tip radius command.
'Value' : 0.1234e05 - Double precision float.
'Units' : 'M' to 'pm' - Metric units.: 'IN' to 'pIN' - Imperial units.
<cr><lf> : - Line terminator.
'Ordinate Spacing': 'SPACING' - Spacing command.
'Axis' : 'CX' - Cartesian X axis data.
'Value' : 0.123e04 - Double precision float.
'<cr><lf>' : - Line terminator
'Calibration' : 'MAP' - Mapping command.
'Map Type' : 1.00e0 - Map type for CZ to CZ.
: 2.00e0 - - Map type for CZ to CX.
'Source Axis' : 'CZ' - Cartesian Z axis data.
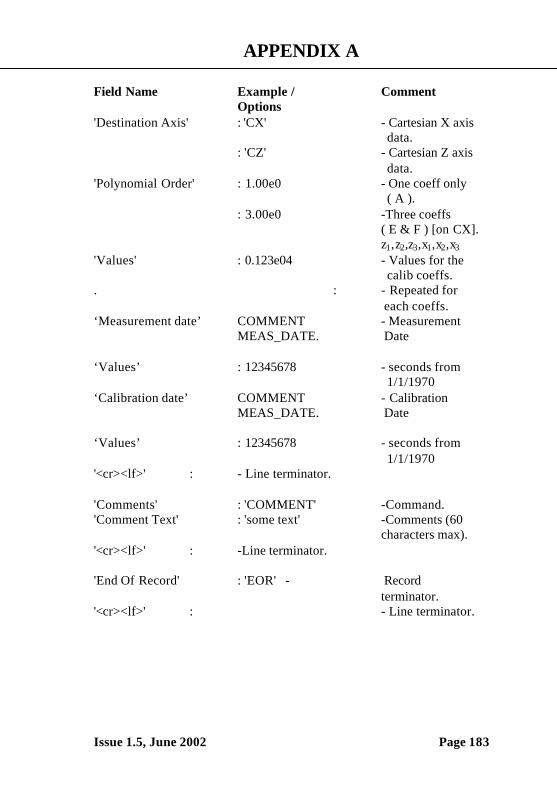
APPENDIX A
Issue 1.5, June 2002 Page 183
Field Name Example / CommentOptions
'Destination Axis' : 'CX' - Cartesian X axis data.
: 'CZ' - Cartesian Z axis data.
'Polynomial Order' : 1.00e0 - One coeff only ( A ).
: 3.00e0 -Three coeffs( E & F ) [on CX].z1,z2,z3,x1,x2,x3
'Values' : 0.123e04 - Values for the calib coeffs.
. : - Repeated for each coeffs.
‘Measurement date’ COMMENT - MeasurementMEAS_DATE. Date
‘Values’ : 12345678 - seconds from 1/1/1970
‘Calibration date’ COMMENT - CalibrationMEAS_DATE. Date
‘Values’ : 12345678 - seconds from 1/1/1970
'<cr><lf>' : - Line terminator.
'Comments' : 'COMMENT' -Command.'Comment Text' : 'some text' -Comments (60
characters max).'<cr><lf>' : -Line terminator.
'End Of Record' : 'EOR' - Recordterminator.
'<cr><lf>' : - Line terminator.
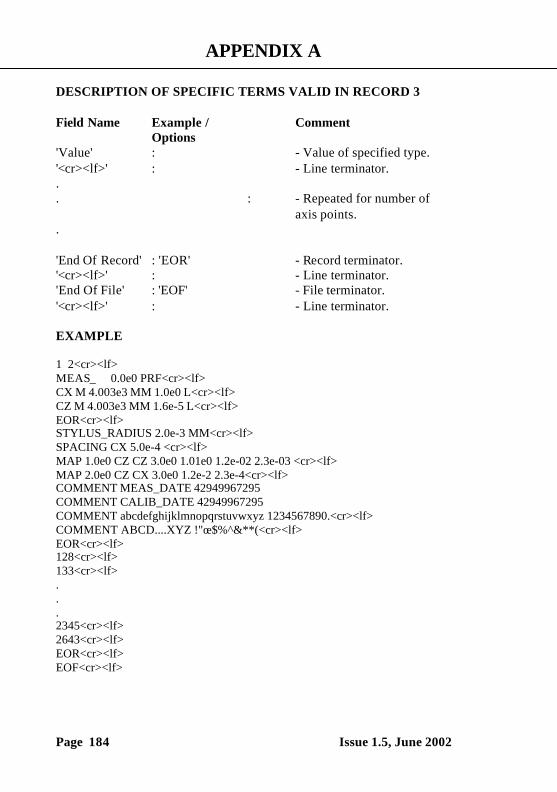
APPENDIX A
Page 184 Issue 1.5, June 2002
DESCRIPTION OF SPECIFIC TERMS VALID IN RECORD 3
Field Name Example / CommentOptions
'Value' : - Value of specified type.'<cr><lf>' : - Line terminator... : - Repeated for number of
axis points..
'End Of Record' : 'EOR' - Record terminator.'<cr><lf>' : - Line terminator.'End Of File' : 'EOF' - File terminator.'<cr><lf>' : - Line terminator.
EXAMPLE
1 2<cr><lf>MEAS_ 0.0e0 PRF<cr><lf>CX M 4.003e3 MM 1.0e0 L<cr><lf>CZ M 4.003e3 MM 1.6e-5 L<cr><lf>EOR<cr><lf>STYLUS_RADIUS 2.0e-3 MM<cr><lf>SPACING CX 5.0e-4 <cr><lf>MAP 1.0e0 CZ CZ 3.0e0 1.01e0 1.2e-02 2.3e-03 <cr><lf>MAP 2.0e0 CZ CX 3.0e0 1.2e-2 2.3e-4<cr><lf>COMMENT MEAS_DATE 42949967295COMMENT CALIB_DATE 42949967295COMMENT abcdefghijklmnopqrstuvwxyz 1234567890.<cr><lf>COMMENT ABCD....XYZ !"œ$%^&**(<cr><lf>EOR<cr><lf>128<cr><lf>133<cr><lf>...2345<cr><lf>2643<cr><lf>EOR<cr><lf>EOF<cr><lf>
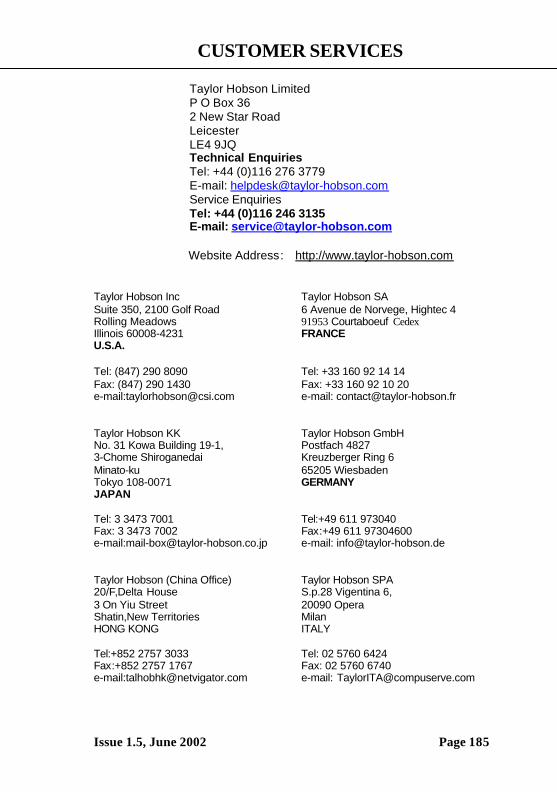
CUSTOMER SERVICES
Issue 1.5, June 2002 Page 185
Taylor Hobson LimitedP O Box 362 New Star RoadLeicesterLE4 9JQTechnical EnquiriesTel: +44 (0)116 276 3779E-mail: [email protected] EnquiriesTel: +44 (0)116 246 3135E-mail: [email protected]
Website Address: http://www.taylor-hobson.com
Taylor Hobson Inc Taylor Hobson SASuite 350, 2100 Golf Road 6 Avenue de Norvege, Hightec 4Rolling Meadows 91953 Courtaboeuf CedexIllinois 60008-4231 FRANCEU.S.A.
Tel: (847) 290 8090 Tel: +33 160 92 14 14Fax: (847) 290 1430 Fax: +33 160 92 10 20e-mail:[email protected] e-mail: [email protected]
Taylor Hobson KK Taylor Hobson GmbHNo. 31 Kowa Building 19-1, Postfach 48273-Chome Shiroganedai Kreuzberger Ring 6Minato-ku 65205 WiesbadenTokyo 108-0071 GERMANYJAPAN
Tel: 3 3473 7001 Tel:+49 611 973040Fax: 3 3473 7002 Fax:+49 611 97304600e-mail:[email protected] e-mail: [email protected]
Taylor Hobson (China Office) Taylor Hobson SPA20/F,Delta House S.p.28 Vigentina 6,3 On Yiu Street 20090 OperaShatin,New Territories MilanHONG KONG ITALY
Tel:+852 2757 3033 Tel: 02 5760 6424Fax:+852 2757 1767 Fax: 02 5760 6740e-mail:[email protected] e-mail: [email protected]
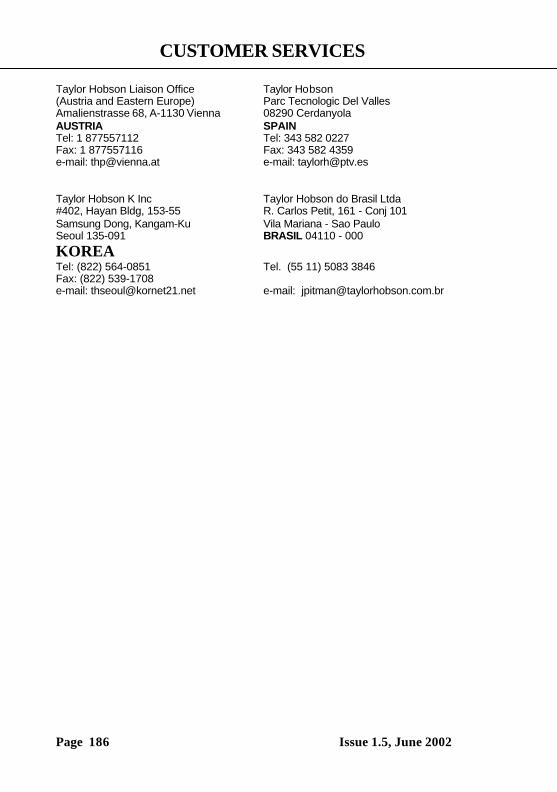
CUSTOMER SERVICES
Page 186 Issue 1.5, June 2002
Taylor Hobson Liaison Office Taylor Hobson(Austria and Eastern Europe) Parc Tecnologic Del VallesAmalienstrasse 68, A-1130 Vienna 08290 CerdanyolaAUSTRIA SPAINTel: 1 877557112 Tel: 343 582 0227Fax: 1 877557116 Fax: 343 582 4359e-mail: [email protected] e-mail: [email protected]
Taylor Hobson K Inc Taylor Hobson do Brasil Ltda#402, Hayan Bldg, 153-55 R. Carlos Petit, 161 - Conj 101Samsung Dong, Kangam-Ku Vila Mariana - Sao PauloSeoul 135-091 BRASIL 04110 - 000
KOREATel: (822) 564-0851 Tel. (55 11) 5083 3846Fax: (822) 539-1708e-mail: [email protected] e-mail: [email protected]