
FORM 40-F - AnnualReports.com
269
UNITED STATES SECURITIES AND EXCHANGE COMMISSION WASHINGTON, D.C. 20549 FORM 40-F [ ] REGISTRATION STATEMENT PURSUANT TO SECTION 12 OF THE SECURITIES EXCHANGE ACT OF 1934 OR [X] ANNUAL REPORT PURSUANT TO SECTION 13(a) OR 15(d) OF THE SECURITIES EXCHANGE ACT OF 1934 FIRST MINING GOLD CORP. (Exact name of registrant as specified in its charter) Suite 1800 – 925 West Georgia Street, Vancouver, British Columbia V6C 3L2, Canada (604) 688-3033 (Address and telephone number of Registrant’s principal executive offices) National Registered Agents, Inc. 1090 Vermont Avenue N.W., Suite 910 Washington D.C. 20005 (202) 371-8090 (Name, address (including zip code) and telephone number (including area code) of agent for service in the United States) --------------------- For the fiscal year ended December 31, 2017 Commission File Number 000 - 55607 British Columbia, Canada 1040 Not Applicable (Province or other jurisdiction (Primary Standard Industrial (I.R.S. Employer of incorporation or Classification Code Number) Identification Number) organization)
-
Upload
khangminh22 -
Category
Documents
-
view
0 -
download
0
Transcript of FORM 40-F - AnnualReports.com
UNITED STATES SECURITIES AND EXCHANGE COMMISSION
WASHINGTON, D.C. 20549
FORM 40-F
[ ] REGISTRATION STATEMENT PURSUANT TO SECTION 12 OF THE SECURITIES EXCHANGE ACT OF 1934
OR
[X] ANNUAL REPORT PURSUANT TO SECTION 13(a) OR 15(d) OF THE SECURITIES EXCHANGE ACT OF 1934
FIRST MINING GOLD CORP. (Exact name of registrant as specified in its charter)
Suite 1800 – 925 West Georgia Street, Vancouver, British Columbia V6C 3L2, Canada
(604) 688-3033 (Address and telephone number of Registrant’s principal executive offices)
National Registered Agents, Inc. 1090 Vermont Avenue N.W., Suite 910
Washington D.C. 20005 (202) 371-8090
(Name, address (including zip code) and telephone number (including area code) of
agent for service in the United States) ---------------------
For the fiscal year ended December 31, 2017 Commission File Number 000-55607
British Columbia, Canada 1040 Not Applicable (Province or other jurisdiction (Primary Standard Industrial (I.R.S. Employer
of incorporation or Classification Code Number) Identification Number) organization)

- 2 -
Securities to be registered pursuant to Section 12(b) of the Act:
Securities registered pursuant to Section 12(g) of the Act: Common Shares, no par value
Securities for which there is a reporting obligation pursuant to Section 15(d) of the Act: None
For annual reports, indicate by check mark the information filed with this Form.
Indicate the number of outstanding shares of each of the issuer’s classes of capital or common stock as of the close of the period covered by the annual report. 552,547,616
Indicate by check mark whether the Registrant (1) has filed all reports required to be filed by Section 13 or 15(d) of the Exchange Act during the preceding 12 months (or for such shorter period that theRegistrant was required to file such reports), and (2) has been subject to such filing requirements for the past 90 days.
[☑] Yes [ ] No
Indicate by check mark whether the registrant has submitted electronically and posted on its corporate Web site, if any, every Interactive Data File required to be submitted and posted pursuant to Rule405 of Regulation S-T (§232.405 of this chapter) during the preceding 12 months (or for such shorter period that the Registrant was required to submit and post such files).
[ ] Yes [☑] No
Indicate by check mark whether the registrant is an emerging growth company as defined in Rule 12b-2 of the Exchange Act.
[☑] Yes [ ] No
If an emerging growth company that prepares its financial statements in accordance with U.S. GAAP, indicate by check mark if the registrant has elected not to use the extended transition period forcomplying with any new or revised financial accounting standards provided pursuant to Section 13(a) of the Exchange Act.
[ ] Yes [☑] No
Title of each class: Name of exchange on which registered:
None None
[☑] Annual information form [☑] Audited annual financial statements
- 3 -
EXPLANATORY NOTE
First Mining Gold Corp. (the “Company” or the “Registrant”) is a Canadian issuer eligible, pursuant to Section 13 of the Securities Exchange Act, to file its annual report on Form 40-F pursuant to themulti-jurisdictional disclosure system of the Exchange Act. The Company is a “foreign private issuer” as defined in Rule 3b-4 under the Exchange Act. Equity securities of the Company are accordinglyexempt from Sections 14(a), 14(b), 14(c), 14(f) and 16 of the Exchange Act pursuant to Rule 3a12-3.
FORWARD-LOOKING STATEMENTS
This annual report on Form 40-F and the exhibits attached hereto contain “forward-looking statements” within the meaning of the United States Private Securities Litigation Reform Act of 1995 and“forward-looking information” within the meaning of applicable Canadian securities legislation. Forward-looking statements, which are all statements other than statements of historical fact, include,but are not limited to, statements with respect to the future price of commodities, the estimation of mineral reserves and mineral resources, the realization of mineral reserve estimates, the timing andamount of estimated future production, costs of production, reserve determination and reserve conversion rates. Generally, these forward-looking statements can be identified by the use of forward-looking terminology such as “plans”, “expects” or “does not expect”, “is expected”, “budget”, “scheduled”, “estimates”, “forecasts”, “intends”, “anticipates” or “does not anticipate”, or “believes”, orvariations of such words and phrases or statements that certain actions, events or results “may”, “could”, “would”, “might” or “will be taken”, “occur” or “be achieved”. Forward-looking statements aresubject to known and unknown risks, uncertainties and other factors that may cause the actual results, level of activity, performance or achievements of the Company to be materially different from thoseexpressed or implied by such forward-looking statements, including but not limited to: fluctuations in the price of commodities; risks related to mining and exploration operations including risks relatedto fluctuations in the price of the primary commodities mined at such operations, actual results of mining and exploration activities, economic and political risks of the jurisdictions in which the miningand exploration operations are located, changes in project parameters as plans continue to be refined; and differences in the interpretation or application of tax laws and regulations; as well as thosefactors discussed in the section entitled “Risks that can affect our business” in the Company’s annual information form (the “AIF”) for the financial year ended December 31, 2017. Forward-lookingstatements are based on assumptions management believes to be reasonable, including but not limited to: no material adverse change in the market price of commodities, that the mining and explorationoperations will operate and the mining projects will be completed in accordance with their public statements and achieve their stated production outcomes, and such other assumptions and factors as setout herein. Although the Company has attempted to identify important factors that could cause actual results to differ materially from those contained in forward-looking statements, there may be otherfactors that cause results not to be as anticipated, estimated or intended. There can be no assurance that forward-looking statements will prove to be accurate. Accordingly, readers should not place unduereliance on forward-looking statements. The forward-looking statements and forward-looking information contained or incorporated by reference in this annual report on Form 40-F are included for thepurpose of providing investors with information to assist them in understanding the Company’s expected financial and operational performance and may not be appropriate for other purposes. TheCompany does not undertake to update any forward-looking statements that are included or incorporated by reference herein, except in accordance with applicable securities laws.
- 4 -
NOTE TO UNITED STATES READERS – DIFFERENCES IN UNITED STATES AND CANADIAN REPORTING PRACTICES
The Company is permitted, under a multi-jurisdictional disclosure system adopted by the United States, to prepare this annual report on Form 40-F in accordance with Canadian disclosure requirements,which are different from those of the United States. The Company prepares its financial statements (the “Audited Financial Statements”) in accordance with International Financial ReportingStandards as issued by the International Accounting Standards Board.
The AIF filed as Exhibit 99.1 to this annual report on Form 40-F has been prepared in accordance with the requirements of the securities laws in effect in Canada, which differ from the requirements ofUnited States securities laws. The terms “mineral reserve”, “proven mineral reserve” and “probable mineral reserve” are Canadian mining terms as defined in accordance with Canadian NationalInstrument 43-101 – Standards of Disclosure for Mineral Projects (“NI 43-101”) and the Canadian Institute of Mining, Metallurgy and Petroleum (“CIM”) Definition Standards on Mineral Resourcesand Mineral Reserves, adopted by the CIM Council, as amended. These definitions differ from the definitions in the United States Securities and Exchange Commission (the “SEC”) Industry Guide 7(“SEC Industry Guide 7”) under the United States Securities Act of 1933, as amended. Under SEC Industry Guide 7 standards, a “final” or “bankable” feasibility study is required to report reserves,the three-year historical average price is used in any reserve or cash flow analysis to designate reserves and the primary environmental analysis or report must be filed with the appropriate governmentalauthority.
In addition, the terms “mineral resource”, “measured mineral resource”, “indicated mineral resource” and “inferred mineral resource” are defined in and required to be disclosed by NI 43-101;however, these terms are not defined terms under SEC Industry Guide 7 and are normally not permitted to be used in reports and registration statements filed with the SEC. Investors are cautioned not toassume that any part or all of mineral deposits in these categories will ever be converted into reserves. “Inferred mineral resources” have a great amount of uncertainty as to their existence and as to theireconomic and legal feasibility. It cannot be assumed that all or any part of an inferred mineral resource will ever be upgraded to a higher category. Under Canadian rules, estimates of inferred mineralresources may not form the basis of feasibility or pre-feasibility studies, except in rare cases. Investors are cautioned not to assume that all or any part of an inferred mineral resource exists or iseconomically or legally mineable. Disclosure of “contained ounces” in a resource is permitted disclosure under Canadian regulations; however, the SEC normally only permits issuers to reportmineralization that does not constitute “reserves” by SEC standards as in place tonnage and grade without reference to unit measures.
Accordingly, information contained in this annual report on Form 40-F and the documents incorporated by reference herein containing descriptions of the Company’s mineral deposits may not becomparable to similar information made public by U.S. companies subject to the reporting and disclosure requirements under the United States federal securities laws and the rules and regulationsthereunder.
- 5 -
CURRENCY
Unless otherwise indicated, all dollar amounts in this annual report on Form 40-F are in Canadian dollars. The functional currency of the Company, the parent entity, is the Canadian dollar and for theMexican and US subsidiaries, the functional currency is the United States dollar. The financial statement presentation currency is the Canadian dollar. The expenditures of our operations where incurredin currencies other than Canadian dollars are translated at the exchange rates in effect at the date of the underlying transactions. Differences arising from these foreign currency transactions are recordedin the consolidated statement of net loss.
ANNUAL INFORMATION FORM
The AIF is filed as Exhibit 99.1 to, and incorporated by reference in, this annual report on Form 40-F.
AUDITED ANNUAL FINANCIAL STATEMENTS
The Audited Financial Statements for the year ended December 31, 2017, including the report of the independent registered public accounting firm with respect thereto, is filed as Exhibit 99.2 to, andincorporated by reference in, this annual report on Form 40-F.
MANAGEMENT’S DISCUSSION AND ANALYSIS
The Company’s management’s discussion and analysis of results of operations and financial condition for the year ended December 31, 2017 is filed as Exhibit 99.3 to, and incorporated by reference in,this annual report on Form 40-F.
CERTIFICATIONS
See Exhibits 99.4, 99.5, 99.6 and 99.7, which are included as Exhibits to this annual report on Form 40-F.
DISCLOSURE CONTROLS AND PROCEDURES
Evaluation of Disclosure Controls and Procedures
At the end of the period covered by this annual report on Form 40-F, an evaluation was carried out under the supervision of, and with the participation of, the Company’s management, including theChief Executive Officer (“CEO”) and Chief Financial Officer (“CFO”), of the effectiveness of the Company’s disclosure controls and procedures (as defined in Rule 13a –15(e) and Rule 15d – 15(e)under the Exchange Act). Based upon the results of that evaluation, the CEO and the CFO have concluded that as of the end of the period covered by this annual report on Form 40-F, the Company’sdisclosure controls and procedures were effective. Disclosure controls and procedures include controls and other procedures that are designed to ensure that (i) information required to be disclosed by theCompany in reports that it files or submits to the SEC under the Exchange Act is recorded, processed, summarized and reported within the appropriate time periods specified in applicable rules andforms and (ii) information required to be disclosed by the Company in reports filed under the Exchange Act is accumulated and communicated to the Company’s management, including the CEO andCFO, as appropriate, to allow for accurate and timely decisions regarding required disclosure.
- 6 -
Management’s Report on Internal Control over Financial Reporting
The Company’s management, with the participation of the CEO and CFO, is responsible for establishing and maintaining adequate internal control over financial reporting as defined in Rules 13a-15(f)and 15d-15(f) under the Exchange Act. The Company’s internal control over financial reporting is a process designed to provide reasonable assurance regarding the reliability of financial reporting andthe preparation and fair presentation of financial statements for external purposes in accordance with International Financial Reporting Standards as issued by the International Accounting StandardsBoard. The Company’s internal control over financial reporting includes policies and procedures that:
Because of its inherent limitations, the Company’s internal control over financial reporting may not prevent or detect misstatements. Additionally, projections of any evaluation of effectiveness to futureperiods are subject to the risk that controls may become inadequate because of changes in conditions, or that the degree of compliance with the policies or procedures may deteriorate.
Management assessed the effectiveness of the Company’s internal control over financial reporting as of December 31, 2017, based on the criteria set forth in Internal Control –Integrated Framework(2013) issued by the Committee of Sponsoring Organizations of the Treadway Commission. This evaluation included review of the documentation of controls, evaluation of the design effectiveness ofcontrols, testing of the operating effectiveness of controls and a conclusion on this evaluation. Based on this evaluation, management has concluded that the Company’s internal control over financialreporting was effective and no material weakness was identified as of December 31, 2017.
• maintain records that accurately and fairly reflect, in reasonable detail, the transactions and dispositions of assets of the Company; • provide reasonable assurance that transactions are recorded as necessary for preparation of financial statements in accordance with IFRS; • provide reasonable assurance that the Company’s receipts and expenditures are made only in accordance with authorizations of management and the Company’s Directors; and • provide reasonable assurance regarding prevention or timely detection of unauthorized acquisition, use, or disposition of the Company’s assets that could have a material effect on
the Company’s consolidated financial statements.
- 7 -
Attestation Report of the Registered Public Accounting Firm
Pursuant to section 404(b) of the Sarbanes-Oxley Act of 2002, as amended by section 103 of the Jumpstart Our Business Startups Act, the Company is not required to include an auditor attestation reportin this annual report on Form 40-F.
Changes in Internal Control over Financial Reporting
During the period covered by this annual report on Form 40-F, no change occurred in the Company’s internal control over financial reporting that has materially affected, or is reasonably likely tomaterially affect, the Company’s internal control over financial reporting.
Limitations of Controls and Procedures
The Company’s management, including the CEO and CFO, does not expect that its disclosure controls and procedures or internal controls and procedures will prevent all error and all fraud. A controlsystem, no matter how well conceived and operated, can provide only reasonable, not absolute, assurance that the objectives of the control system are met. Further, the design of a control system mustreflect the fact that there are resource constraints, and the benefits of controls must be considered relative to their costs. Because of the inherent limitations in all control systems, no evaluation ofcontrols can provide absolute assurance that all control issues and instances of fraud, if any, within the Company have been detected. These inherent limitations include the realities that judgments indecision-making can be faulty, and that breakdowns can occur because of simple error or mistake. Additionally, controls can be circumvented by the individual acts of some persons, by collusion of twoor more people, or by management override of the control. The design of any system of controls also is based in part upon certain assumptions about the likelihood of future events, and there can be noassurance that any design will succeed in achieving its stated goals under all potential future conditions; over time, control may become inadequate because of changes in conditions, or the degree ofcompliance with the policies or procedures may deteriorate. Because of the inherent limitations in a cost-effective control system, misstatements due to error or fraud may occur and not be detected.
AUDIT COMMITTEE
Audit Committee
The Company’s board of directors has a separately designated standing audit committee established in accordance with section 3(a)(58)(A) of the Exchange Act. The members of the Company’s auditcommittee are identified on pages 148 to 149 of the AIF, filed as Exhibit 99.1 and incorporated by reference herein. In the opinion of the Company’s board of directors, all members of the auditcommittee are independent (as determined under Rule 10A-3 of the Exchange Act and the rules of the New York Stock Exchange) and are financially literate.
- 8 -
Audit Committee Financial Expert
The Company’s board of directors has determined that Raymond Polman is the audit committee financial expert, in that he has an understanding of generally accepted accounting principles and financialstatements and is able to assess the general application of accounting principles, including, in connection with the accounting for estimates, accruals and reserves. The financial expert has experiencepreparing, auditing, analyzing or evaluating financial statements that entail accounting issues of equal breadth and complexity to the Company’s financial statements (or actively supervising anotherperson who did so). The financial expert also has an understanding of internal controls and procedures for financial reporting and an understanding of audit committee functions.
CODE OF ETHICS
The Company has adopted a written Code of Business Conduct and Ethics. A copy of this code is available on the Company’s website at http://www.firstmininggold.com or to any person withoutcharge, by written request addressed to: First Mining Gold Corp., Attention: Corporate Secretary, Suite 1800 – 925 West Georgia Street, Vancouver, British Columbia V6C 3L2, Canada 1.844.306.8827,or by email ([email protected]).
PRINCIPAL ACCOUNTANT FEES AND SERVICES
PricewaterhouseCoopers LLP served as the Registrant's principal accountant (the “Principal Accountant”) for the year ended December 31, 2017, prior to which BDO Canada LLP served in thiscapacity.
Audit Fees
The aggregate fees billed and expected to be billed by the Principal Accountant for the fiscal years ended December 31, 2017 and 2016, for professional services rendered by the Principal Accountant forthe audit of the Company’s annual financial statements or services that are normally provided by the Principal Accountant in connection with statutory and regulatory filings or engagements for suchfiscal years were $195,775 and $131,750, respectively.
Audit-Related Fees
There were no audit-related fees billed by the Principal Accountant for the fiscal years ended December 31, 2017 and 2016.
Tax Fees
The aggregate fees billed by the Principal Accountant for the fiscal years ended December 31, 2017 and 2016, for professional services rendered by the Principal Accountant for tax compliance, taxadvice, tax planning and other services were $8,936 and $34,714 respectively. The Tax Fees predominantly relate to tax compliance services in Mexico and the US.
- 9 -
All Other Fees
There were no additional fees billed by the Principal Accountant for the fiscal years ended December 31, 2017 and 2016.
Audit Committee Pre-Approval Policies and Procedures
Since the enactment of the Sarbanes-Oxley Act of 2002 on July 30, 2002, all audit and non-audit services performed by the Registrant’s outside auditors are pre-approved by the audit committee of theRegistrant.
AUDIT COMMITTEE PRE-APPROVAL POLICIES AND PROCEDURES
See Exhibit 99.26 for the Company’s Audit Committee Charter, incorporated by reference in this annual report on Form 40-F.
OFF-BALANCE SHEET ARRANGEMENTS
The Company does not have any off-balance sheet arrangements that have or are reasonably likely to have a current or future effect on its financial condition, changes in financial condition, revenues orexpenses, results of operations, liquidity, capital expenditures or capital resources that is material to investors, or relationships with unconsolidated special purpose entities.
TABULAR DISCLOSURE OF CONTRACTUAL OBLIGATIONS
The information provided under the heading “Management’s Discussion and Analysis –Financial Instruments – Liquidity Risk” contained in Exhibit 99.3 as filed with this annual report on Form 40-Fcontains the Company’s disclosure of contractual obligations and is incorporated by reference herein.
UNDERTAKINGS
The Company undertakes to make available, in person or by telephone, representatives to respond to inquiries made by the SEC staff, and to furnish promptly, when requested to do so by the SEC staff,information relating to: the securities registered pursuant to Form 40-F; the securities in relation to which the obligation to file an annual report on Form 40-F arises; or transactions in said securities.
CONSENT TO SERVICE OF PROCESS
The Company filed an Appointment of Agent for Service of Process and Undertaking on Form F-X with respect to the class of securities in relation to which the obligation to file this annual report onForm 40-F arises.
- 10 -
EXHIBIT INDEX
Exhibit Description
99.1 Annual Information Form of the Company for the year ended December 31, 2017
99.2 Audited consolidated financial statements and related audit reports of the Company, for the year ended December 31, 2017 are exhibits to and form a part of this annual report
99.3 Management’s Discussion and Analysis for the year ended December 31, 2017
99.4 CEO Certification pursuant to Rule 13a-14(a) or 15d-14(a) of the Securities Exchange Act of 1934, as adopted pursuant to Section 302 of the Sarbanes-Oxley Act of 2002
99.5 CFO Certification pursuant to Rule 13a-14(a) or 15d-14(a) of the Securities Exchange Act of 1934, as adopted pursuant to Section 302 of the Sarbanes-Oxley Act of 2002
99.6 CEO Certification pursuant to 18 U.S.C. Section 1350, as adopted pursuant to Section 906 of the Sarbanes-Oxley Act of 2002
99.7 CFO Certification pursuant to 18 U.S.C. Section 1350, as adopted pursuant to Section 906 of the Sarbanes-Oxley Act of 2002
99.8 Consent of Dr. Gilles Arseneau, Ph.D., P.Geo., of SRK Consulting (Canada) Inc.
99.9 Consent of Dr. Adrian Dance, Ph.D., P.Eng., of SRK Consulting (Canada) Inc.
99.10 Consent of Victor Munoz, P.Eng., M.Eng., of SRK Consulting (Canada) Inc.
99.11 Consent of Grant Carlson, P.Eng., of SRK Consulting (Canada) Inc.
99.12 Consent of Neil Winkelmann, FAusIMM, of SRK Consulting (Canada) Inc.
99.13 Consent of Bruce Andrew Murphy, P.Eng., of SRK Consulting (Canada) Inc.
99.14 Consent of Michael Royle, M.App.Sci., P.Geo., of SRK Consulting (Canada) Inc.
99.15 Consent of Dr. Ewoud Maritz Rykaart, Ph.D., P.Eng., of SRK Consulting (Canada) Inc.
- 11 -
99.16 Consent of Mark Liskowich, P.Geo., of SRK Consulting (Canada) Inc.
99.17 Consent of Todd McCracken, P.Geo., of WSP Canada Inc.
99.18 Consent of Mark Drabble, B.App.Sci (Geology), MAIG, MAusIMM, of Optiro Pty Limited
99.19 Consent of Kahan Cervoj, B.App.Sci (Geology), MAIG, MAusIMM, of Optiro Pty Limited
99.20 Consent of B. Terrence Hennessey, P.Geo., of Micon International Limited
99.21 Consent of Alan J. San Martin, MAusIMM(CP), of Micon International Limited
99.22 Consent of Sam J. Shoemaker, Jr., B.Sc., Reg’d Mem SME, of Micon International Limited
99.23 Consent of Michael P. Cullen, M.Sc., P.Geo., of Mercator Geological Services Limited
99.24 Consent of PricewaterhouseCoopers LLP, Independent Registered Public Accounting Firm
99.25 Consent of BDO Canada LLP, Independent Registered Public Accounting Firm
99.26 Audit Committee Charter of the Company

- 12 -
SIGNATURES
Pursuant to the requirements of the Exchange Act, the Registrant certifies that it meets all of the requirements for filing on Form 40-F and has duly caused this annual report to be signed on its behalf bythe undersigned, thereto duly authorized.
Date: March 22, 2018
FIRST MINING GOLD CORP.
By: /s/ Jeff SwinogaJeff Swinoga President and Chief Executive Officer
CONTENTS
Page 2
Important information about this document 4Reporting currency and financial information 4Caution about forward-looking information 4Examples of forward-looking information in this AIF 4Material risks 5Material assumptions 6National Instrument 43-101 definitions 7Glossary of units 9Glossary of elements 9Cautionary note to US investors 10
About First Mining 11Vision and strategy 11General overview of our business 12Reorganizations 22Major developments 22Recent developments 27Recent developments (continued) 28Significant acquisitions 28How First Mining was formed 29Corporate organization chart 29Our projects 30
Material Properties 31
Springpole 31Technical report 31Project description, location and access 31History 33Geological setting, mineralization and deposit types 34Exploration 35Drilling 35Sampling, analysis and data verification 36Mineral processing and metallurgical testing 39Mineral resource estimates 39Mining Operations 41Processing and Recovery Operations 43Infrastructure, Permitting and Compliance Activities 43Capital and Operating Costs 45Exploration, Development and Production 46
Goldlund 47Technical report 47Project description, location and access 47History 48Geological setting, mineralization and deposit types 48Exploration 50Drilling 50Sampling, analysis and data verification 50Mineral processing and metallurgical testing 55Mineral resource estimates 55Recent activities 56
Cameron 81Technical report 81Project description, location and access 81History 82Geological setting, mineralization and deposit type 83Exploration 83Drilling 84Sampling, analysis and data verification 84Mineral processing and metallurgical testing 89Mineral resource estimates 90
CONTENTS (continued)
Page 3
Pickle Crow 92Technical report 92Project description, location and access 92History 93Geological setting, mineralization and deposit types 94Exploration 95Drilling 96Sampling, analysis and data verification 96Mineral processing and metallurgical testing 99Mineral resource estimates 101Recent activities 102
Hope Brook 105Technical report 105Property description, location and access 105History 106Geological setting, mineralization and deposit types 107Exploration 108Drilling 108Sampling, analyses and data verification 109Mineral processing and metallurgical testing 112Mineral resource estimates 112
Non-material properties 114
Risks that can affect our business 119Types of risk 119Exploration, development, production and operational risks 120Financial risks 124Political risks 127Regulatory risks 128Environmental risks 129Industry risks 131Other risks 132
Investor information 136Share capital 136Common shares 136Preferred shares 137Security-based compensation and convertible securities 137Material contracts 138Market for our securities 138Trading activity 139Our team 140Audit Committee information 147Interests of experts 150Legal counsel 151Additional information 151
Appendix A – Audit Committee Charter 152
Important information about this document
Information on our website is not part of this AIF, nor is it incorporated by reference herein. Our filings on SEDAR are also not part of this AIF, nor are they incorporated by reference herein.
Reporting currency and financial information
The reporting currency of the Company is Canadian dollars. Unless we have specified otherwise, all dollar amounts (“$”) referred to in this AIF are in Canadian dollars. Any references to “US$” meanUnited States (US) dollars.
All financial information presented in this AIF has been prepared in accordance with International Financial Reporting Standards as issued by the International Accounting Standards Board.
Caution about forward-looking information
This AIF includes statements and information about our expectations for the future. When we discuss our strategy, business prospects and opportunities, plans and future financial and operatingperformance, or other things that have not yet taken place, we are making statements considered to be forward-looking information or forward-looking statements under applicable securities laws. Werefer to them in this AIF as forward-looking information.
Key things to understand about the forward-looking information in this AIF:
Forward-looking information is designed to help you understand management’s current views of our near and longer term prospects. It may not be appropriate for other purposes. We will not update orrevise this forward-looking information unless we are required to do so by applicable securities laws.
Examples of forward-looking information in this AIF
Page 4
Throughout this document, the terms we, us, our,the Company and First Mining mean First MiningGold Corp. and its subsidiaries, in the context..
This annual information form (“AIF”) provides important information about the Company. It describes, among other things, our history, our markets, our exploration and development projects, our mineral resources, sustainability, our regulatory environment, the risks we face in our business and the market for our shares.
• It typically includes words and phrases about the future, such as expect, believe, estimate, anticipate, plan, intend, predict, goal, target, forecast, project, scheduled, potential,strategy and proposed (see examples listed below).
• It is based on a number of material assumptions, including those we have listed below, which may prove to be incorrect.
• Actual results and events may be significantly different from what we currently expect, because of the risks associated with our business. We list a number of these material risks onthe next page. We recommend you also review other parts of this AIF, including the section “Risks that can affect our business” starting on page 119, which discuss other materialrisks that could cause our actual results to differ from current expectations.
• statements regarding future acquisitions of mineral properties
• our plan to retain a residual interest in any of our projects in the form of royalties, metal streams, minority interests or equity positions
Material risks
Page 5
• statements relating to our vision and strategy
• our intention to eventually pay a dividend to our shareholders
• our intention to de-risk our material assets through exploration, drilling, calculating resource estimates, conducting economic studies and other activities;
• our intention to utilize our management team’s expertise to successfully permit and construct producing mines at our material assets
• statements relating to the criteria we will use when assessing potential acquisitions
• our belief that we will continue to be able to locate and retain professionals with the necessary specialized skills and knowledge
• statements regarding shifts in gold demand, increases in the number of urban consumers in China and India and increases in disposable income
• our intention to continue to make expenditures to ensure compliance with applicable laws and regulations
• our intentions and expectations regarding exploration at any of our mineral properties
• forecasts relating to mining, development and other activities at our operations
• forecasts relating to market developments and trends in global supply and demand for gold
• future royalty and tax payments and rates
• future work on our non-material properties
• our mineral reserve and mineral resource estimates
• exploration, development and production risks
• global financial conditions
• commodity price fluctuations
• availability of capital and financing on acceptable terms
• our mineral reserve and resource estimates may not be reliable, or we may encounterunexpected or challenging geological, hydrological or mining conditions
• our exploration plans may be delayed or may not succeed
• we may not be able to obtain or maintain necessary permits or approvals from governmentauthorities
• we may be adversely affected by changes in foreign currency exchange rates, interest ratesor tax rates
• our estimates of production, purchases, costs, decommissioning or reclamation expenses,or our tax expense estimates, may prove to be inaccurate
• natural phenomena, including inclement weather, fire, flood and earthquakes
• our operations may be disrupted due to problems with our own or our customers' facilities,the unavailability of reagents or equipment, equipment failure, lack of tailings capacity,labour shortages, ground movements, transportation disruptions or accidents
• we may be affected by environmental, safety and regulatory risks, including increasedregulatory burdens or delays
• there may be defects in, or challenges to, title to our properties
• we may be unable to enforce our legal rights under our existing agreements, permits orlicences, or may be subject to litigation or arbitration that has an adverse outcome
• accidents or equipment breakdowns may occur
• cyclical nature of the mining industry
• there may be changes to government regulations or policies, including tax and trade lawsand policies or other exploration and development risk
• uncertainties and costs related to determining whether mineral resources or mineralreserves exist on a property
• future sales by existing shareholders could reduce the market price of our shares
• a substantial number of our shares are held by an exchange traded fund which is in aposition to exercise influence over matters requiring shareholder approval, among otherthings
Material assumptions
Page 6
• the assumptions regarding market conditions upon which we have based our capitalexpenditure expectations
• the availability of additional capital and financing on acceptable terms, or at all
• our mineral reserve and resource estimates and the assumptions upon which they are basedare reliable
• the success of our exploration plans
• our expectations regarding spot prices and realized prices for gold and other preciousmetals
• market developments and trends in global supply and demand for gold meetingexpectations
• our expectations regarding tax rates and payments, foreign currency exchange rates andinterest rates
• our reclamation expenses
• the geological conditions at our properties
• our ability to comply with current and future environmental, safety and other regulatoryrequirements, and to obtain and maintain required regulatory approvals without unduedelay
• our operations are not significantly disrupted as a result of natural disasters, governmentalor political actions, litigation or arbitration proceedings, the unavailability of reagents,equipment, operating parts and supplies critical to our activities, equipment failure, labourshortages, ground movements, transportation disruptions or accidents or other explorationand development risks
• our ability to support stakeholders necessary to develop our mineral projects
• the accuracy of geological, mining and metallurgical estimates
• maintaining good relationships with the communities in which we operate
National Instrument 43-101 definitions
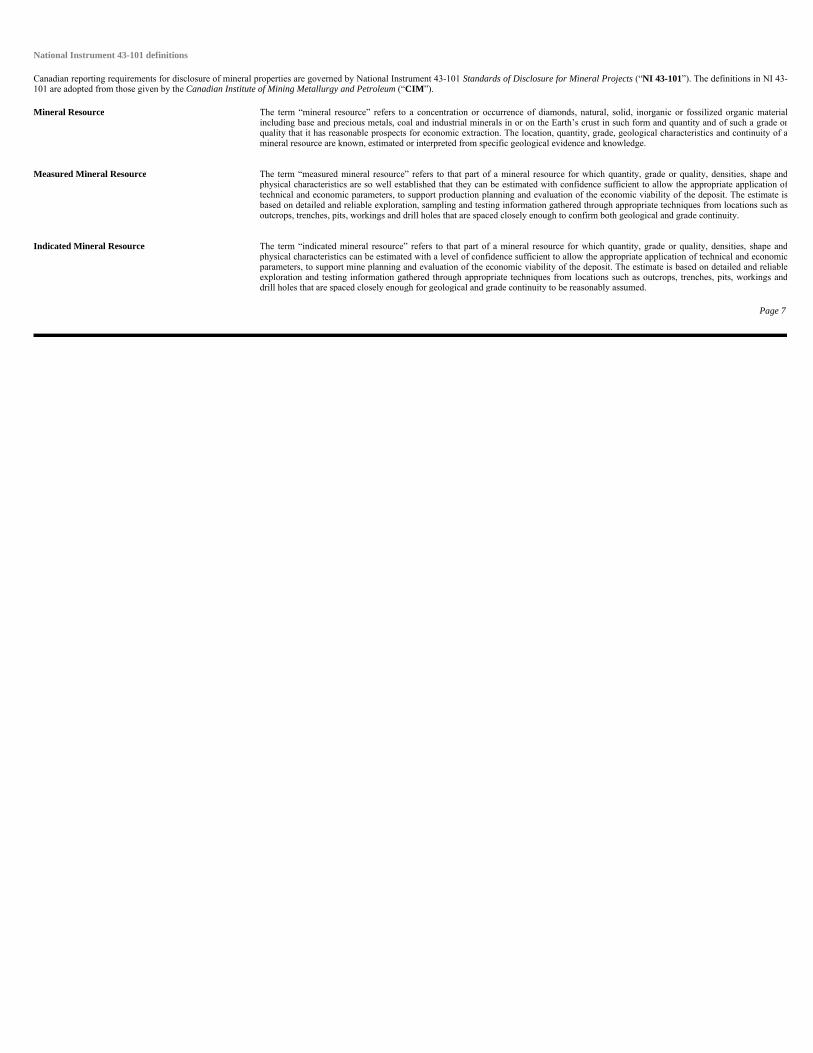
Canadian reporting requirements for disclosure of mineral properties are governed by National Instrument 43-101 Standards of Disclosure for Mineral Projects (“NI 43-101”). The definitions in NI 43-101 are adopted from those given by the Canadian Institute of Mining Metallurgy and Petroleum (“CIM”).
Page 7
Mineral Resource The term “mineral resource” refers to a concentration or occurrence of diamonds, natural, solid, inorganic or fossilized organic materialincluding base and precious metals, coal and industrial minerals in or on the Earth’s crust in such form and quantity and of such a grade orquality that it has reasonable prospects for economic extraction. The location, quantity, grade, geological characteristics and continuity of amineral resource are known, estimated or interpreted from specific geological evidence and knowledge.
Measured Mineral Resource The term “measured mineral resource” refers to that part of a mineral resource for which quantity, grade or quality, densities, shape andphysical characteristics are so well established that they can be estimated with confidence sufficient to allow the appropriate application oftechnical and economic parameters, to support production planning and evaluation of the economic viability of the deposit. The estimate isbased on detailed and reliable exploration, sampling and testing information gathered through appropriate techniques from locations such asoutcrops, trenches, pits, workings and drill holes that are spaced closely enough to confirm both geological and grade continuity.
Indicated Mineral Resource The term “indicated mineral resource” refers to that part of a mineral resource for which quantity, grade or quality, densities, shape andphysical characteristics can be estimated with a level of confidence sufficient to allow the appropriate application of technical and economicparameters, to support mine planning and evaluation of the economic viability of the deposit. The estimate is based on detailed and reliableexploration and testing information gathered through appropriate techniques from locations such as outcrops, trenches, pits, workings anddrill holes that are spaced closely enough for geological and grade continuity to be reasonably assumed.

Page 8
Inferred Mineral Resource The term “inferred mineral resource” refers to that part of a mineral resource for which quantity and grade or quality can be estimated on the basis of geological evidence and limited sampling and reasonably assumed, but not verified, geological and grade continuity. The estimate is based on limited information and sampling gathered through appropriate techniques from locations such as outcrops, trenches, pits, workings and drill holes.
Qualified Person The term “qualified person” refers to an individual who is an engineer or geoscientist with at least five years of experience in mineralexploration, mine development, production activities and project assessment, or any combination thereof, including experience relevant tothe subject matter of the project or report and is a member in good standing of a self-regulating organization.
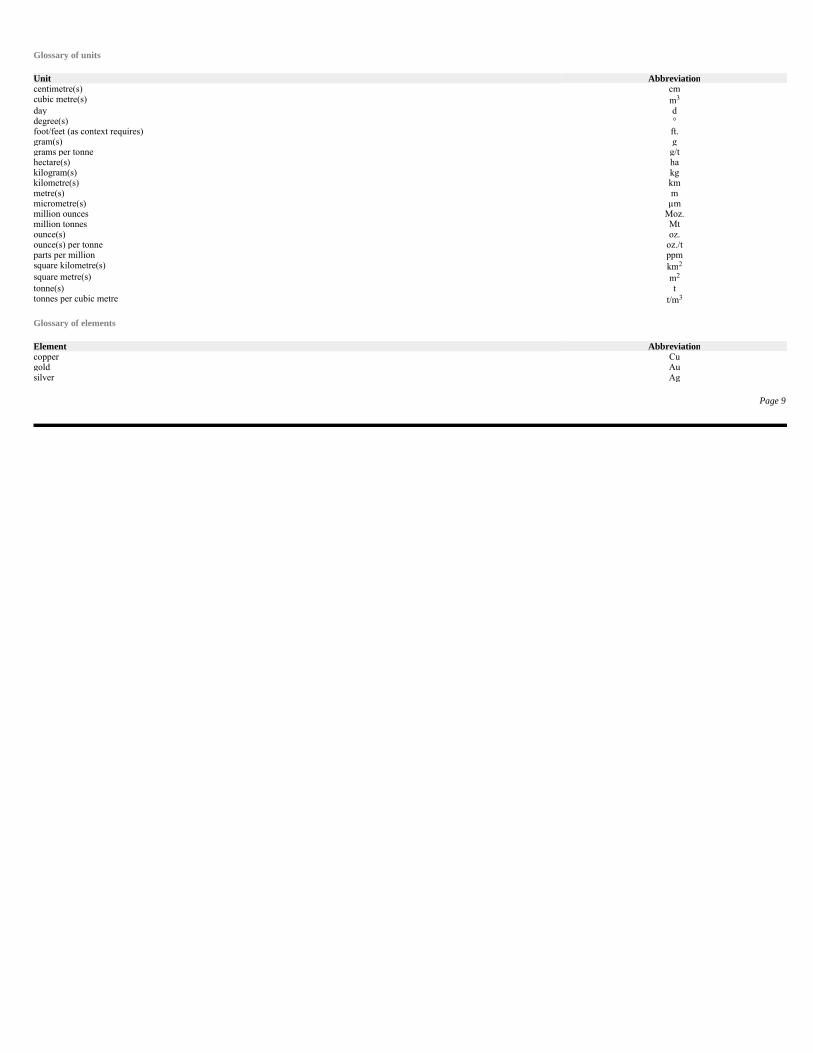
Glossary of units
Glossary of elements
Page 9
Unit Abbreviationcentimetre(s) cm cubic metre(s) m3
day d degree(s) ° foot/feet (as context requires) ft. gram(s) g grams per tonne g/t hectare(s) ha kilogram(s) kg kilometre(s) km metre(s) m micrometre(s) µm million ounces Moz. million tonnes Mt ounce(s) oz. ounce(s) per tonne oz./t parts per million ppm square kilometre(s) km2
square metre(s) m2
tonne(s) t tonnes per cubic metre t/m3
Element Abbreviationcopper Cu gold Au silver Ag
Cautionary note to US investors
Technical disclosure contained or incorporated by reference in this AIF has not been prepared in accordance with the requirements of United States securities laws and uses terms that comply withreporting standards in Canada with certain estimates prepared in accordance with NI 43-101.
NI 43-101 is a rule developed by the Canadian Securities Administrators that establishes standards for all public disclosure an issuer makes of scientific and technical information concerning mineralprojects. Unless otherwise indicated, all mineral reserve and mineral resource estimates contained in this AIF have been prepared in accordance with NI 43-101 and the CIM Classification System.
Canadian standards, including NI 43-101, differ significantly from the requirements of the United States Securities and Exchange Commission (“SEC”), and mineral reserve and resource informationcontained or incorporated by reference in this AIF may not be comparable to similar information disclosed by US companies. In particular, and without limiting the generality of the foregoing, the term“resource” does not equate to the term “reserves”.
Under US standards, mineralization may not be classified as a “reserve” unless the determination has been made that the mineralization could be economically and legally produced or extracted at thetime the reserve determination is made and volumes that are not “reserves” should not be disclosed. Among other things, all necessary permits would be required to be in hand or issuance imminent inorder to classify mineralized material as reserves under SEC standards. Accordingly, mineral reserve estimates included in this AIF may not qualify as “reserves” under SEC standards. The SEC’sdisclosure standards normally do not permit the inclusion of information concerning “measured mineral resources”, “indicated mineral resources” or “inferred mineral resources” or other descriptions ofthe amount of mineralization in mineral deposits that do not constitute “reserves” by US standards in documents filed with the SEC.
Our US investors should also understand that “inferred mineral resources” have a great amount of uncertainty as to their existence and great uncertainty as to their economic and legal feasibility. Itcannot be assumed that all or any part of an “inferred mineral resource” will ever be upgraded to a higher category. Under Canadian rules, estimated “inferred mineral resources” may not form the basisof feasibility or pre-feasibility studies except in rare cases. Investors are cautioned not to assume that all or any part of an “inferred mineral resource” exists or is economically or legally mineable.Disclosure of “contained ounces” in a resource is permitted disclosure under Canadian regulations; however, the SEC normally only permits issuers to report mineralization that does not constitute“reserves” by SEC standards as in-place tonnage and grade without reference to unit measures. In addition, the definitions of “proven mineral reserves” and “probable mineral reserves” under reportingstandards in Canada differ in certain respects from the standards of the SEC. Accordingly, information concerning mineral deposits set forth or incorporated by reference herein may not be comparablewith information made public by companies that report in accordance with US standards.
Page 10
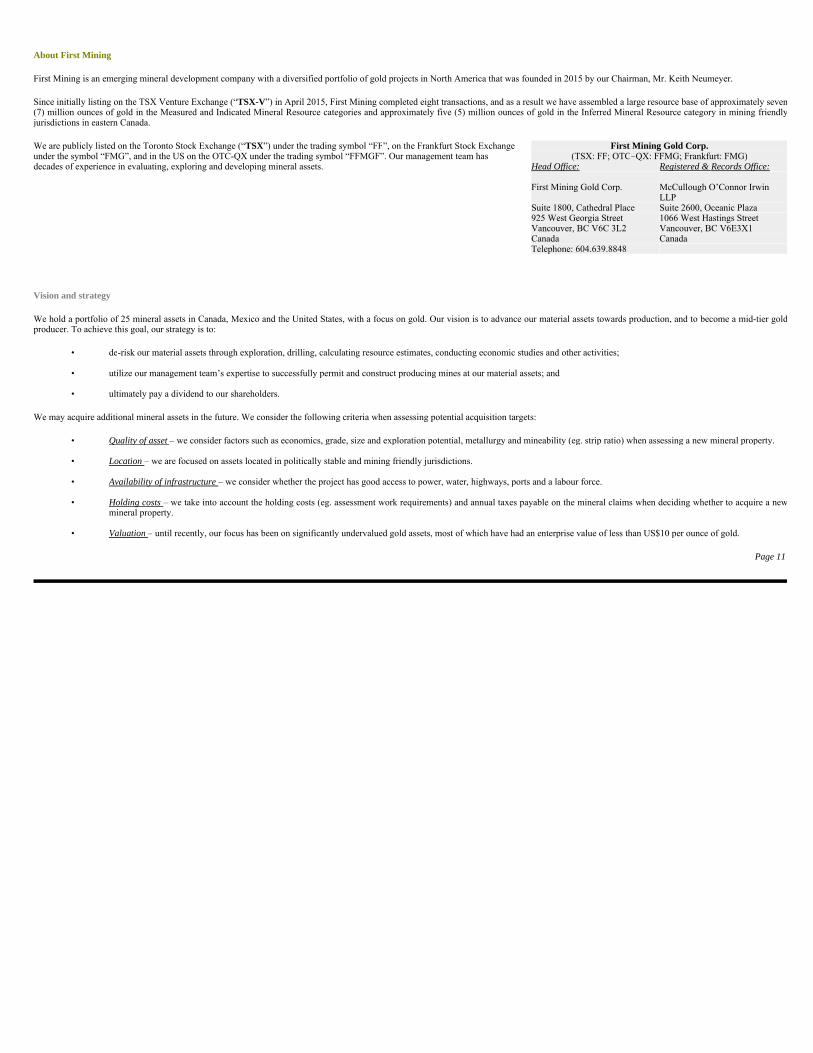
About First Mining
First Mining is an emerging mineral development company with a diversified portfolio of gold projects in North America that was founded in 2015 by our Chairman, Mr. Keith Neumeyer.
Since initially listing on the TSX Venture Exchange (“TSX-V”) in April 2015, First Mining completed eight transactions, and as a result we have assembled a large resource base of approximately seven(7) million ounces of gold in the Measured and Indicated Mineral Resource categories and approximately five (5) million ounces of gold in the Inferred Mineral Resource category in mining friendlyjurisdictions in eastern Canada.
Vision and strategy
We hold a portfolio of 25 mineral assets in Canada, Mexico and the United States, with a focus on gold. Our vision is to advance our material assets towards production, and to become a mid-tier goldproducer. To achieve this goal, our strategy is to:
We may acquire additional mineral assets in the future. We consider the following criteria when assessing potential acquisition targets:
Page 11
We are publicly listed on the Toronto Stock Exchange (“TSX”) under the trading symbol “FF”, on the Frankfurt Stock Exchange under the symbol “FMG”, and in the US on the OTC-QX under the trading symbol “FFMGF”. Our management team has decades of experience in evaluating, exploring and developing mineral assets.
First Mining Gold Corp.(TSX: FF; OTC–QX: FFMG; Frankfurt: FMG)
Head Office: Registered & Records Office:
First Mining Gold Corp. McCullough O’Connor Irwin LLP
Suite 1800, Cathedral Place Suite 2600, Oceanic Plaza 925 West Georgia Street 1066 West Hastings Street Vancouver, BC V6C 3L2 Vancouver, BC V6E3X1 Canada Canada Telephone: 604.639.8848
• de-risk our material assets through exploration, drilling, calculating resource estimates, conducting economic studies and other activities;
• utilize our management team’s expertise to successfully permit and construct producing mines at our material assets; and
• ultimately pay a dividend to our shareholders.
• Quality of asset – we consider factors such as economics, grade, size and exploration potential, metallurgy and mineability (eg. strip ratio) when assessing a new mineral property.
• Location – we are focused on assets located in politically stable and mining friendly jurisdictions.
• Availability of infrastructure – we consider whether the project has good access to power, water, highways, ports and a labour force.
• Holding costs – we take into account the holding costs (eg. assessment work requirements) and annual taxes payable on the mineral claims when deciding whether to acquire a newmineral property.
• Valuation – until recently, our focus has been on significantly undervalued gold assets, most of which have had an enterprise value of less than US$10 per ounce of gold.
General overview of our business
We are in the exploration and development stage of our corporate development, and we do not currently own any producing properties. Consequently, we have no current operating income or cash flowfrom our properties, nor have we had any income from operations in the past three financial years. At this time, our operations are primarily funded by equity subscriptions.
An investment in First Mining is speculative and involves a high degree of risk due to the nature of our business and the present stage of exploration of our mineral properties. We encourage readers tocarefully consider the risk factors that are set out in this AIF in the section “Risks that can affect our business” which starts on page 119.
Principal products
We are currently in the exploration and development stage and do not produce, develop or sell mineral products. Our principal focus is on gold.
Specialized skills and knowledge
Our business requires individuals with specialized skills and knowledge in the areas of geology, drilling, geophysics, geochemistry, metallurgy and mineral processing, implementation of explorationprograms, mining engineering, accounting, and compliance. To date, we have been able to locate and retain such professionals in Canada and in the USA, and we believe we will be able to continue todo so.
Competitive conditions
We operate in a very competitive industry and compete with other companies in the mineral exploration and mining industry in all phases of exploration and development, including: (a) raising thecapital necessary to fund our operations and the potential development of our properties; and (b) obtaining the resources to conduct exploration and development activities on our properties.
As a result of this competition, we may at times compete with other companies that have greater financial resources and technical facilities and we may be unable to attract or retain qualified personnel.As well, we cannot assure you that additional capital or other types of financing will be available if needed or that, if available, the terms of such financing will be favourable to us.
Cycles
The mining business is subject to commodity price cycles. The gold market, late in 2010, made significant gains in terms of US dollars but remained volatile throughout 2011 and suffered significantdeclines in 2013 and 2014. The financial markets for mining in general and mineral exploration and development in particular, continued to be very weak through to 2017. If the global economy stallsand commodity prices decline as a consequence, a continuing period of lower prices could significantly affect the economic potential of many of our current properties and may result in First Miningceasing work on, or dropping its interest in, some or all of our properties. As we do not carry on production activities, our ability to fund ongoing exploration is affected by the availability of financing(and particularly equity financing) which, in turn, is affected by the strength of the economy and other general economic factors.
In addition, our mineral exploration activities may be subject to seasonality due to adverse weather conditions at our project sites. Drilling and other exploration activities on our properties may berestricted during the winter season as a result of various weather related factors including, without limitation, inclement weather, snow covering the ground, frozen ground and restricted access due tosnow, ice or other weather related factors.
Page 12
Gold market fundamentals and trends1
Gold is a precious metal. It has emotional, cultural and financial value and different people across the globe buy gold for different reasons, often influenced by a range of national socio-cultural factors,local market conditions and wider macro-economic drivers. Throughout history, gold has been treasured for its natural beauty and radiance. For this reason, many cultures have imagined gold torepresent the sun. Long before any gold can be extracted, significant exploration and development needs to take place, both to determine, as accurately as possible, the size of the deposit as well as howto extract and process the ore efficiently, safely and responsibly. On average, it takes between 10-20 years before a mine is even ready to produce material that can be refined. Modern gold miningpredominantly takes place in areas where there is a significant concentration of gold-bearing ore (ore body). Today, 60%-70% of the world’s gold production comes from surface mines, while theremainder is from underground gold mines.
Below are a few interesting facts about gold:
________________________
1All of the information contained in this section “Gold market fundamentals and trends” has been sourced from an article by the World Gold Council titled “Gold Demand Trends Full Year 2017”,which was published by the World Gold Council on February 6, 2018, and from sections of the World Gold Council’s website, www.gold.org. First Mining has not independently verified any of thisinformation and makes no assurances as to its accuracy. Readers should visit the World Gold Council’s website for comprehensive details regarding the discussion contained in this section.
Page 13
• Approximately 187,200 t of gold has been mined since the beginning of civilisation. • Over 90% of the world’s gold has been mined since the California Gold Rush. • All of the gold ever mined would fit into a crate of 21 m3. In addition, if all of the existing gold in the world was pulled into a 5 micron thick wire, it could wrap around the world
11.2 million times. • The largest gold coin ever created was cast by the Perth Mint in 2012. Weighing 1 t and measuring 80 cm in diameter, it surpassed the previous record, a 2007, $1 million coin which
was just 53 cm across. • There are 147.3 million oz. (approximately 4,600 t) of gold stored in the US Bullion Depositary at Fort Knox. • There are just over 31 g in a troy ounce of gold. • A “London Good Delivery Bar”, the standard unit of traded gold, is made from 400 troy oz. of gold. • It is rarer to find a 1 oz. nugget of gold than it is to find a five carat diamond. • 1 oz. of pure gold can be hammered into a single sheet of gold that is 9 m2. • Gold melts at 1,064 °C, and the boiling point of gold is 2,808 °C. • The temperature of the human body is 37 °C. Gold’s conductivity of heat means that it rapidly reaches body temperature. This is one of the reasons why gold has become valued for
use in jewellery. Around half of all gold mined today is made into jewellery, which remains the single largest use of gold.
Demand
The modern gold market is a picture of diversity and growth. Since the early 1970s, the annual volume of gold produced has tripled, the amount of gold bought annually has quadrupled and gold marketshave flourished across the globe. Gold is now bought by a far more diverse set of consumers and investors than at any previous time in history. Over the last decade, demand for gold has moved East.This has been driven not only by cultural affinity, but also by wealth creation and income growth in some of the world’s most dynamic and rapidly growing economies.
Gold has many diverse uses. It is fashioned into jewellery, it is used to manage risk in financial portfolios and protect the wealth of nations, and it is found in smart phones and cutting-edge medicaldiagnostics. These diverse uses for gold (in jewellery and technology, and by central banks and investors), mean that, across the decades, different sectors in the gold market have risen in prominence atdifferent points in the global economic cycle. This self-balancing nature of the gold market typically means that there is a sustained base level of demand.
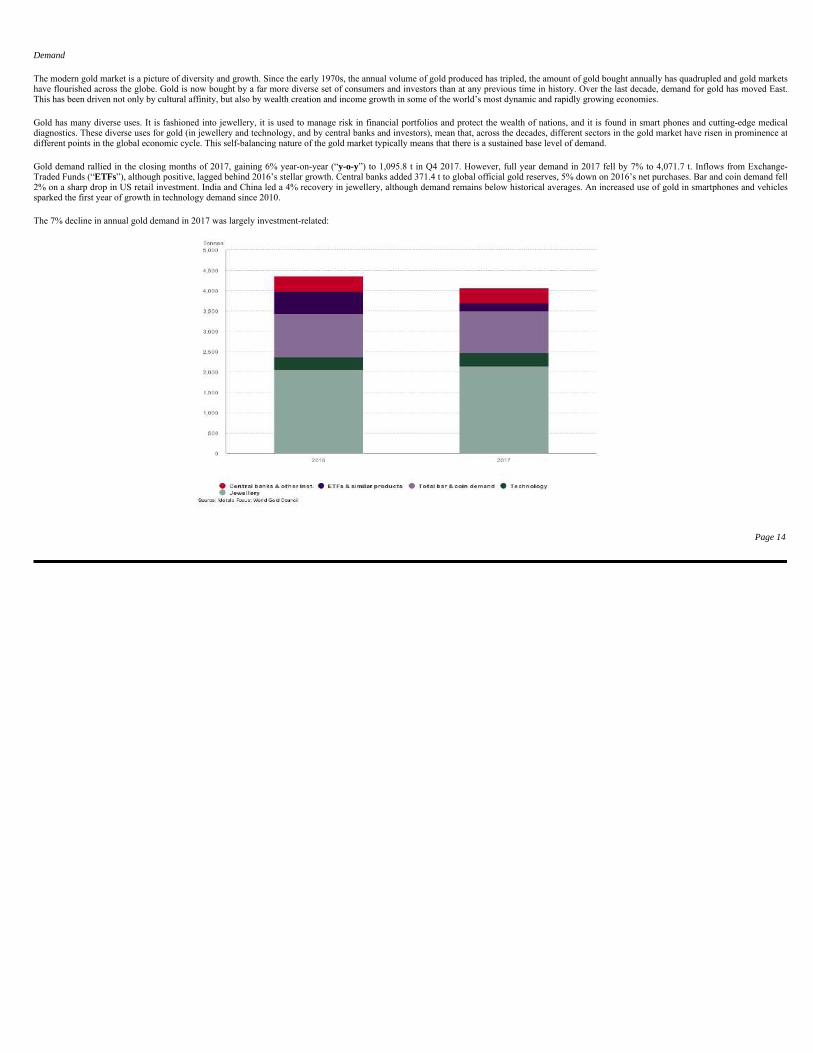
Gold demand rallied in the closing months of 2017, gaining 6% year-on-year (“y-o-y”) to 1,095.8 t in Q4 2017. However, full year demand in 2017 fell by 7% to 4,071.7 t. Inflows from Exchange-Traded Funds (“ETFs”), although positive, lagged behind 2016’s stellar growth. Central banks added 371.4 t to global official gold reserves, 5% down on 2016’s net purchases. Bar and coin demand fell2% on a sharp drop in US retail investment. India and China led a 4% recovery in jewellery, although demand remains below historical averages. An increased use of gold in smartphones and vehiclessparked the first year of growth in technology demand since 2010.
The 7% decline in annual gold demand in 2017 was largely investment-related:
Page 14
Jewellery
A dominant area of demand for gold has always been jewellery. Prized for its value and beauty, gold jewellery has a universal status that remains constant.
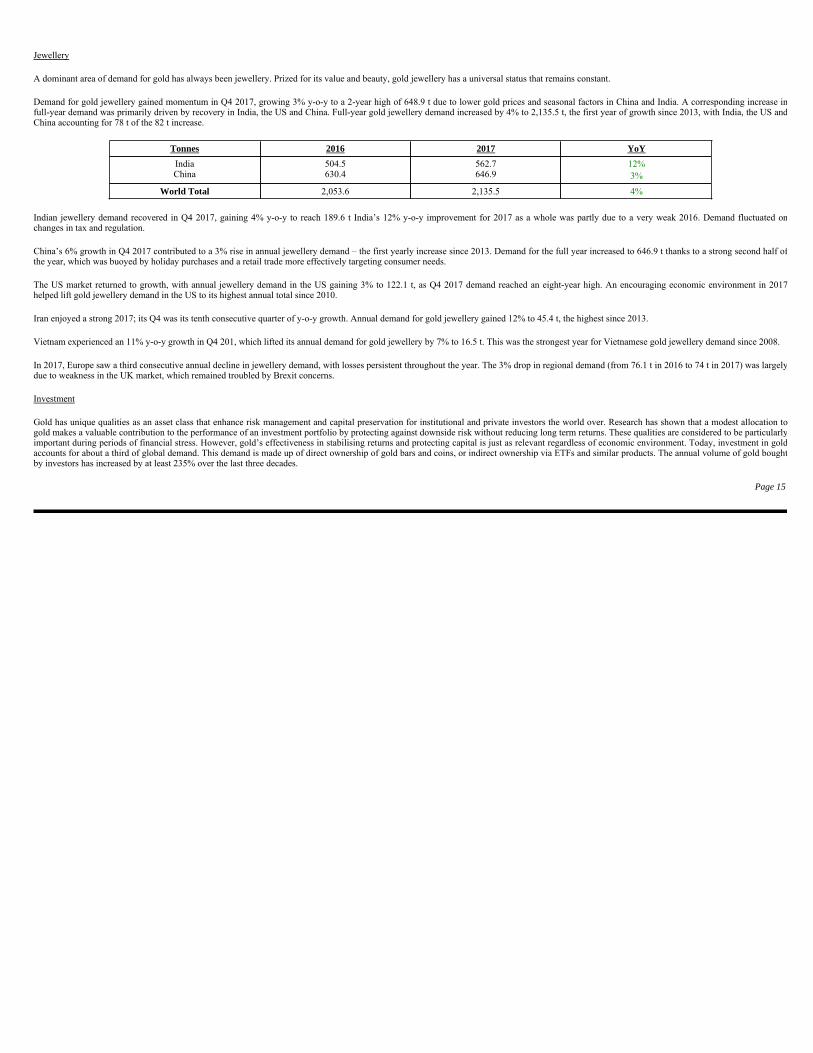
Demand for gold jewellery gained momentum in Q4 2017, growing 3% y-o-y to a 2-year high of 648.9 t due to lower gold prices and seasonal factors in China and India. A corresponding increase infull-year demand was primarily driven by recovery in India, the US and China. Full-year gold jewellery demand increased by 4% to 2,135.5 t, the first year of growth since 2013, with India, the US andChina accounting for 78 t of the 82 t increase.
Indian jewellery demand recovered in Q4 2017, gaining 4% y-o-y to reach 189.6 t India’s 12% y-o-y improvement for 2017 as a whole was partly due to a very weak 2016. Demand fluctuated onchanges in tax and regulation.
China’s 6% growth in Q4 2017 contributed to a 3% rise in annual jewellery demand – the first yearly increase since 2013. Demand for the full year increased to 646.9 t thanks to a strong second half ofthe year, which was buoyed by holiday purchases and a retail trade more effectively targeting consumer needs.
The US market returned to growth, with annual jewellery demand in the US gaining 3% to 122.1 t, as Q4 2017 demand reached an eight-year high. An encouraging economic environment in 2017helped lift gold jewellery demand in the US to its highest annual total since 2010.
Iran enjoyed a strong 2017; its Q4 was its tenth consecutive quarter of y-o-y growth. Annual demand for gold jewellery gained 12% to 45.4 t, the highest since 2013.
Vietnam experienced an 11% y-o-y growth in Q4 201, which lifted its annual demand for gold jewellery by 7% to 16.5 t. This was the strongest year for Vietnamese gold jewellery demand since 2008.
In 2017, Europe saw a third consecutive annual decline in jewellery demand, with losses persistent throughout the year. The 3% drop in regional demand (from 76.1 t in 2016 to 74 t in 2017) was largelydue to weakness in the UK market, which remained troubled by Brexit concerns.
Investment
Gold has unique qualities as an asset class that enhance risk management and capital preservation for institutional and private investors the world over. Research has shown that a modest allocation togold makes a valuable contribution to the performance of an investment portfolio by protecting against downside risk without reducing long term returns. These qualities are considered to be particularlyimportant during periods of financial stress. However, gold’s effectiveness in stabilising returns and protecting capital is just as relevant regardless of economic environment. Today, investment in goldaccounts for about a third of global demand. This demand is made up of direct ownership of gold bars and coins, or indirect ownership via ETFs and similar products. The annual volume of gold boughtby investors has increased by at least 235% over the last three decades.
Page 15
Tonnes 2016 2017 YoY
India China
504.5 630.4
562.7 646.9
12% 3%
World Total 2,053.6 2,135.5 4%
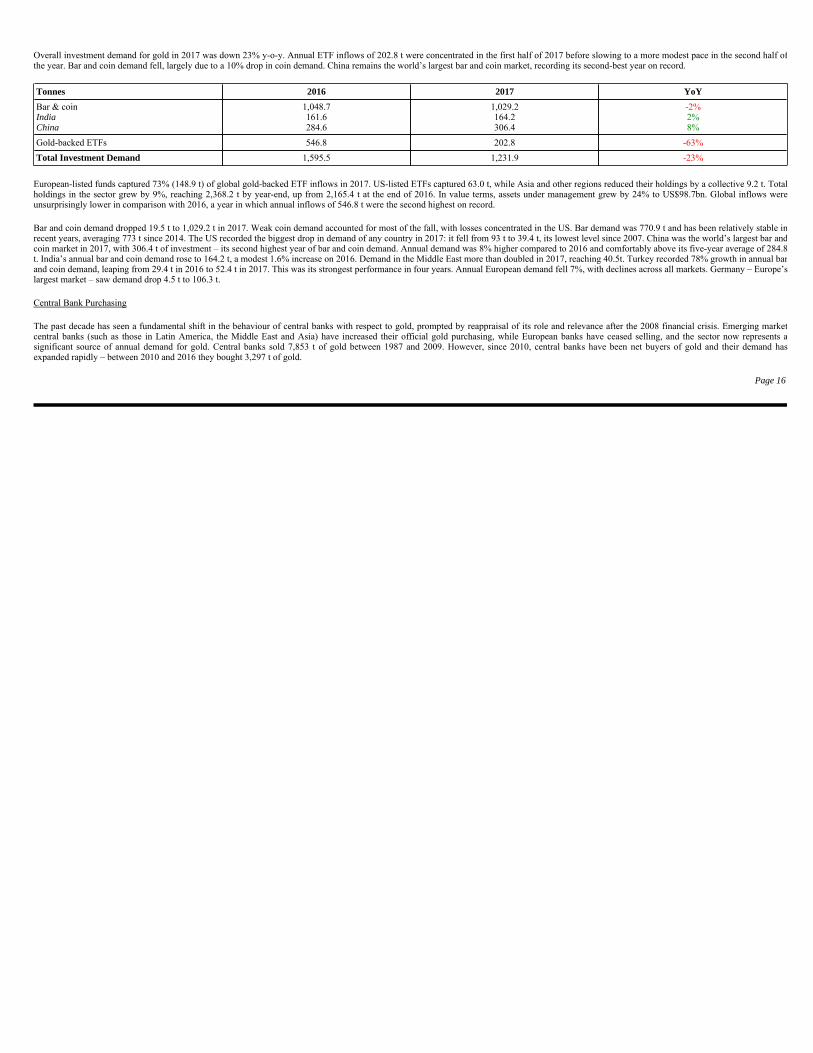
Overall investment demand for gold in 2017 was down 23% y-o-y. Annual ETF inflows of 202.8 t were concentrated in the first half of 2017 before slowing to a more modest pace in the second half ofthe year. Bar and coin demand fell, largely due to a 10% drop in coin demand. China remains the world’s largest bar and coin market, recording its second-best year on record.
European-listed funds captured 73% (148.9 t) of global gold-backed ETF inflows in 2017. US-listed ETFs captured 63.0 t, while Asia and other regions reduced their holdings by a collective 9.2 t. Totalholdings in the sector grew by 9%, reaching 2,368.2 t by year-end, up from 2,165.4 t at the end of 2016. In value terms, assets under management grew by 24% to US$98.7bn. Global inflows wereunsurprisingly lower in comparison with 2016, a year in which annual inflows of 546.8 t were the second highest on record.
Bar and coin demand dropped 19.5 t to 1,029.2 t in 2017. Weak coin demand accounted for most of the fall, with losses concentrated in the US. Bar demand was 770.9 t and has been relatively stable inrecent years, averaging 773 t since 2014. The US recorded the biggest drop in demand of any country in 2017: it fell from 93 t to 39.4 t, its lowest level since 2007. China was the world’s largest bar andcoin market in 2017, with 306.4 t of investment – its second highest year of bar and coin demand. Annual demand was 8% higher compared to 2016 and comfortably above its five-year average of 284.8t. India’s annual bar and coin demand rose to 164.2 t, a modest 1.6% increase on 2016. Demand in the Middle East more than doubled in 2017, reaching 40.5t. Turkey recorded 78% growth in annual barand coin demand, leaping from 29.4 t in 2016 to 52.4 t in 2017. This was its strongest performance in four years. Annual European demand fell 7%, with declines across all markets. Germany – Europe’slargest market – saw demand drop 4.5 t to 106.3 t.
Central Bank Purchasing
The past decade has seen a fundamental shift in the behaviour of central banks with respect to gold, prompted by reappraisal of its role and relevance after the 2008 financial crisis. Emerging marketcentral banks (such as those in Latin America, the Middle East and Asia) have increased their official gold purchasing, while European banks have ceased selling, and the sector now represents asignificant source of annual demand for gold. Central banks sold 7,853 t of gold between 1987 and 2009. However, since 2010, central banks have been net buyers of gold and their demand hasexpanded rapidly – between 2010 and 2016 they bought 3,297 t of gold.
Page 16
Tonnes 2016 2017 YoY
Bar & coin India China
1,048.7 161.6 284.6
1,029.2 164.2 306.4
-2% 2% 8%
Gold-backed ETFs 546.8 202.8 -63%
Total Investment Demand 1,595.5 1,231.9 -23%

This change in behaviour is a clear acknowledgement of the benefits that gold can bring to a reserve portfolio. Some banks have bought gold to diversify their portfolios, especially from US$denominated assets, with which gold has a strong negative correlation. Others have bought gold as a hedge against tail risks or because of its inflation-hedging characteristics (gold has a long history ofmaintaining its purchasing power). Gold plays a prominent role in reserve asset management, as it is one of the few assets that is universally permitted by the investment guidelines of the world’s centralbanks. This is in part due to the gold market being deep and liquid, which is a key characteristic required by reserve asset managers.
Central banks continued to bolster gold reserves in 2017. Total global gold reserves increased by 73.1 t in Q4, bringing full-year net purchases in 2017 to 371.4 t, 5% lower than 2016 demand). The 38%y-o-y decline in demand in Q4 was entirely driven by Venezuela’s swap deal lapsing. The agreement with Deutsche Bank was valued at US$1.7 billion, which represents approximately 45 t of gold.
Growth in global gold reserves continued to be dominated by a small number of large purchasers. Russian net gold purchases in 2017 hit 223.5 t, lifting their gold reserves to 1,838.8 t (+14%) by the endof 2017. This marks the 11th year of growth in their gold reserves, and the third consecutive year in which net annual purchases topped 200 t.
The most notable purchaser of the year was Turkey. The central bank increased its gold reserves by an average of 11 t per month from May. By the end of 2017, gold reserves had increased by 86 t toover 200 t, in line with Turkey’s view that gold is a key reserve asset. Kazakhstan remained committed to increasing their gold reserves. The central bank bought a net 11.6 t in Q4 2017, taking its totalnet purchases for the year to 42.9 t. This brought Kazakhstan’s gold reserves to just over 300 t, 40% of total reserves, at the end of 2017. Other noteworthy purchasers in 2017 were: Colombia (4.6 t),Venezuela (4.4 t), Indonesia (2.5 t), Jordan (2.2 t), Kyrgyz Republic (1.8 t), Thailand (1.6 t) and Mongolia (1.3 t).
Notwithstanding Venezuela’s lapsed swap, significant net sales were limited in 2017. Most countries left their gold reserves relatively untouched during the year. Germany was the only significant sellerthroughout the year, using 4.3 t of gold reserves for its coin-minting program.
Demand for Gold in Technology
Gold has long been central to innovations in electronics. Its conductivity and resistance to corrosion make it the material of choice for manufacturers of high-specification components in the electronicsindustry. Gold has also been used in dentistry for centuries due to its excellent biocompatibility.
Today the unique properties of gold and the advent of “nanotechnology” are driving new uses in medicine, engineering and environmental management. Beyond electronics and dentistry, gold is usedacross a variety of high-technology industries, in complex and difficult environments, including the space industry, and in fuel cells. NASA’s James Webb Space Telescope, due to be launched in 2018,will search for the first galaxies that formed in the early universe. The telescope’s 18 hexagonal mirror segments have been covered with a microscopically-thin gold coating, making use of the metal’sproperties as an efficient reflector of infrared light.
Page 17
Gold nanoparticles are being used to improve the efficiency of solar cells, and gold-based materials are showing promise in the search for new, more effective fuel cell catalysts. Groundwatercontamination is a common problem around the world in industrialised areas, and another innovative use of gold is helping break down contaminants into their component parts.
Gold can also be used to build highly-targeted methods for delivering drugs into the human body. A range of healthcare and catalytic applications for gold is currently being developed as the field ofnanotechnology expands. Gold nanoparticles are at the heart of the hundreds of millions of Rapid Diagnostic Tests that are used globally every year. This well established, and critically important,technology has changed the face of disease diagnosis in the developing world over the last decade. Gold-based drugs have been developed and used to treat illnesses such as rheumatoid arthritis.Research is currently ongoing into the role that gold can play in cancer treatment. A method has already been developed that delivers anti-cancer drugs directly to tumours using gold nanoparticles.
Gold’s catalytic properties are also beginning to create demand from both within the automotive sector (as the metal has now been proven to be a commercially viable alternative to other materials incatalytic converters), and within the chemical industry.
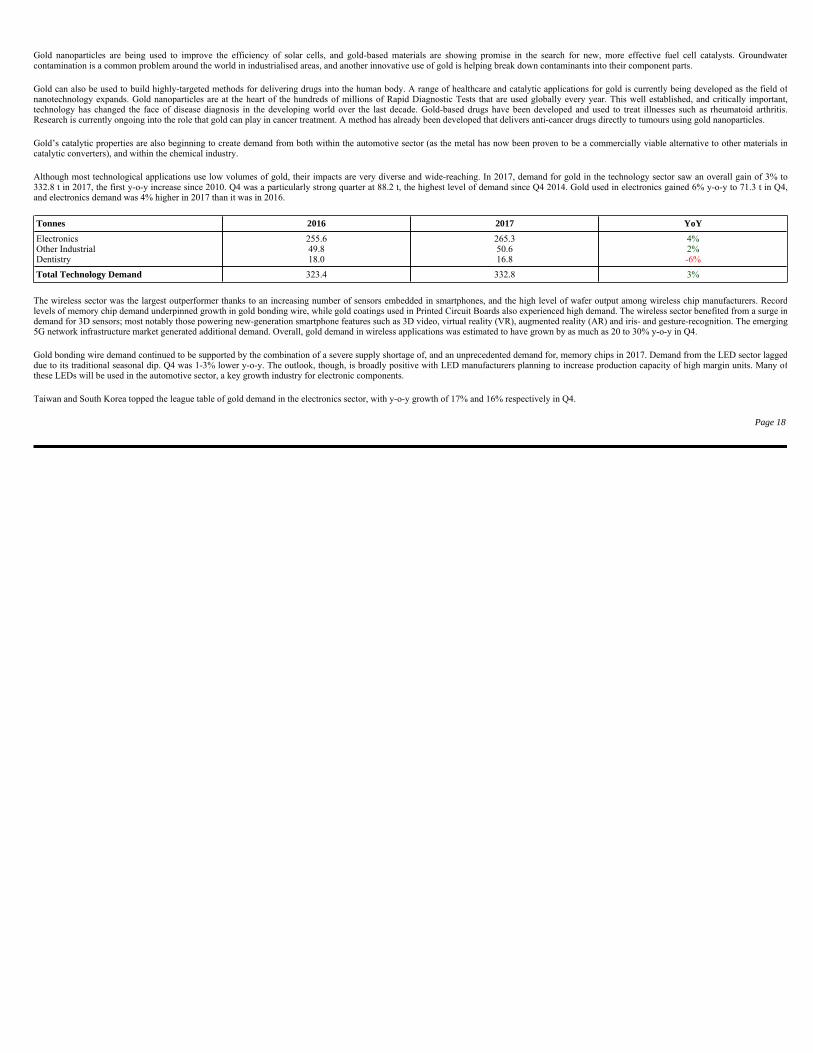
Although most technological applications use low volumes of gold, their impacts are very diverse and wide-reaching. In 2017, demand for gold in the technology sector saw an overall gain of 3% to332.8 t in 2017, the first y-o-y increase since 2010. Q4 was a particularly strong quarter at 88.2 t, the highest level of demand since Q4 2014. Gold used in electronics gained 6% y-o-y to 71.3 t in Q4,and electronics demand was 4% higher in 2017 than it was in 2016.
The wireless sector was the largest outperformer thanks to an increasing number of sensors embedded in smartphones, and the high level of wafer output among wireless chip manufacturers. Recordlevels of memory chip demand underpinned growth in gold bonding wire, while gold coatings used in Printed Circuit Boards also experienced high demand. The wireless sector benefited from a surge indemand for 3D sensors; most notably those powering new-generation smartphone features such as 3D video, virtual reality (VR), augmented reality (AR) and iris- and gesture-recognition. The emerging5G network infrastructure market generated additional demand. Overall, gold demand in wireless applications was estimated to have grown by as much as 20 to 30% y-o-y in Q4.
Gold bonding wire demand continued to be supported by the combination of a severe supply shortage of, and an unprecedented demand for, memory chips in 2017. Demand from the LED sector laggeddue to its traditional seasonal dip. Q4 was 1-3% lower y-o-y. The outlook, though, is broadly positive with LED manufacturers planning to increase production capacity of high margin units. Many ofthese LEDs will be used in the automotive sector, a key growth industry for electronic components.
Taiwan and South Korea topped the league table of gold demand in the electronics sector, with y-o-y growth of 17% and 16% respectively in Q4.
Page 18
Tonnes 2016 2017 YoY
Electronics Other Industrial Dentistry
255.6 49.8 18.0
265.3 50.6 16.8
4% 2% -6%
Total Technology Demand 323.4 332.8 3%
Supply
Over the past 10 years, the annual total supply of gold has averaged around 4,000 t. In 2016, the total global supply of gold was 4,571 t, with global demand at 4,309 t for the year. In the last quarter of2016, global gold supply was 1,036 t (demand for gold for the same period was 994 t).
Mine production accounts for the largest part of gold supply – typically, 75% each year. However, annual demand requires more gold than is newly mined and the shortfall is made up from recycling. Asit is virtually indestructible, nearly all of the gold ever mined is theoretically still accessible in one form or another and potentially available for recycling.
Recycling is the source of gold supply that is most immediately responsive to the gold price and economic shocks. The majority of recycled gold (around 90%) comes from jewellery, with gold extractedfrom technology providing the remaining 10%.
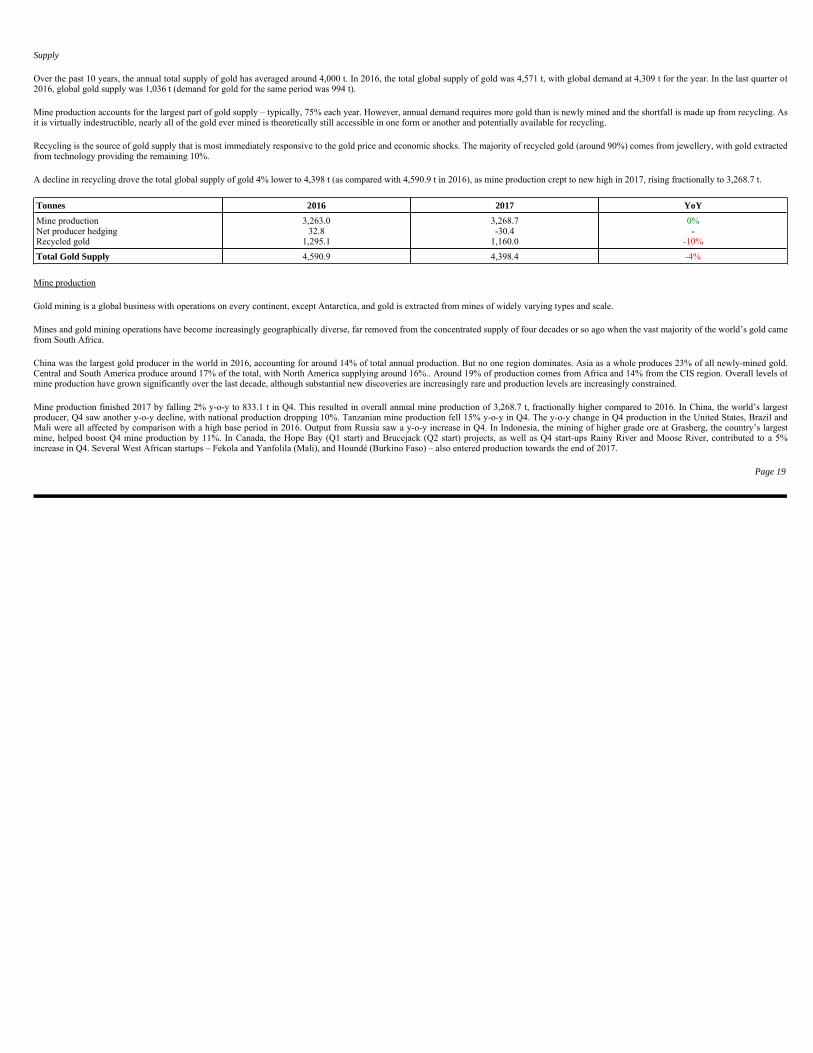
A decline in recycling drove the total global supply of gold 4% lower to 4,398 t (as compared with 4,590.9 t in 2016), as mine production crept to new high in 2017, rising fractionally to 3,268.7 t.
Mine production
Gold mining is a global business with operations on every continent, except Antarctica, and gold is extracted from mines of widely varying types and scale.
Mines and gold mining operations have become increasingly geographically diverse, far removed from the concentrated supply of four decades or so ago when the vast majority of the world’s gold camefrom South Africa.
China was the largest gold producer in the world in 2016, accounting for around 14% of total annual production. But no one region dominates. Asia as a whole produces 23% of all newly-mined gold.Central and South America produce around 17% of the total, with North America supplying around 16%.. Around 19% of production comes from Africa and 14% from the CIS region. Overall levels ofmine production have grown significantly over the last decade, although substantial new discoveries are increasingly rare and production levels are increasingly constrained.
Mine production finished 2017 by falling 2% y-o-y to 833.1 t in Q4. This resulted in overall annual mine production of 3,268.7 t, fractionally higher compared to 2016. In China, the world’s largestproducer, Q4 saw another y-o-y decline, with national production dropping 10%. Tanzanian mine production fell 15% y-o-y in Q4. The y-o-y change in Q4 production in the United States, Brazil andMali were all affected by comparison with a high base period in 2016. Output from Russia saw a y-o-y increase in Q4. In Indonesia, the mining of higher grade ore at Grasberg, the country’s largestmine, helped boost Q4 mine production by 11%. In Canada, the Hope Bay (Q1 start) and Brucejack (Q2 start) projects, as well as Q4 start-ups Rainy River and Moose River, contributed to a 5%increase in Q4. Several West African startups – Fekola and Yanfolila (Mali), and Houndé (Burkino Faso) – also entered production towards the end of 2017.
Page 19
Tonnes 2016 2017 YoY
Mine production Net producer hedging Recycled gold
3,263.0 32.8
1,295.1
3,268.7 -30.4
1,160.0
0% -
-10%
Total Gold Supply 4,590.9 4,398.4 -4%
Net producer hedging
The volume of gold that is supplied to the market each year can also be marginally affected by forward selling of future production – known as producer hedging. There are times when miners will wantto lock in a specific price for their future gold production – for example, to manage project costs or debt servicing. These commitments will affect the amount of gold that enters the market. In previousdecades, these hedging agreements had a substantial impact on supply levels but in recent years they have been relatively small and shorter term in nature.
Total net de-hedging in 2017 reached 30.4 t, bringing an end to three consecutive years of modest net hedging. The overall global hedgebook now stands at around 222 t. In October, Westgold Resourcesannounced an increase in its short-term hedgebook of 40,000 oz. to lock in higher local prices. In November, Gold Road – which is developing the Gruyere gold mine in Australia – announced that ithad entered into forward agreements which hedged 200,000 oz. to secure a portion of the mine’s future production. And in the same month, Resolute Mining announced it had agreed to hedge 72,000 oz.of output, to fund the expansion project at its Ravenswood gold mine.
Recycled gold
Because gold is virtually indestructible, all the gold ever mined still exists, apart from a small amount which has been lost. Gold is recoverable from most of its uses and capable of being melted down,re-refined and reused. Recycled gold therefore plays an important part in the dynamics of the gold market. While gold mine production is relatively inelastic, the gold recycling industry provides aneasily-traded supply of gold when it is needed, thereby helping to stabilise the gold price.
Gold recycling activity spent much of 2017 normalising after an impressive 2016. Despite the gold price performing relatively well in many currencies throughout 2017, the annual supply of recycledgold fell 10% to 1,160 t, from 1,295.1 t in 2016. Q4 was the only quarter which saw a y-o-y increase in gold recycling during 2017: the 276.6 t sold back by consumers was 8% higher than the sameperiod in 2016.
East Asian and Middle Eastern markets drove declines in recycling during 2017. Recycling activity in 2016 was particularly high in Indonesia, Turkey and Egypt. This also made subsequent price levelsin 2017 appear less attractive to consumers open to selling, contributing to the relative weakness in the y-o-y comparison.
In Western markets, the relatively strong performance of gold in US$ terms supported recycling levels in the United States. But gold’s weaker price performance in euro terms meant that Europeanrecycling fared less well. In the UK, recycling activity continued to re-adjust in 2017, after jumping in response to the 2016 Brexit referendum.
Page 20
Economic dependence
Our business is dependent on the acquisition, exploration, development and operation of mineral properties. We are not dependent on any contract to sell our products or services or to purchase themajor part of our requirements for goods, services or raw materials, or on any franchise or licence or other agreement to use a patent, formula, trade secret, process or trade name upon which ourbusiness depends.
Employees
As of the date of this AIF, we have 19 full-time employees and 5 part-time employees, and we utilize consultants and contractors as needed to carry on many of our activities and, in particular, tosupervise and carry out the work programs at our mineral projects.
Environmental protection
We are subject to the laws and regulations relating to environmental matters in all jurisdictions in which we operate, including provisions relating to property reclamation, discharge of hazardousmaterials and other matters.
We may also be held liable should environmental problems be discovered that were caused by former owners and operators of our projects. We conduct our mineral exploration activities in compliancewith applicable environmental protection legislation. Our mineral properties have not created any significant disturbance as far as we know, and we do not consider any of our properties to be a financialrisk to First Mining. In addition, we are not aware of any existing environmental concerns related to any of our properties that may result in material liability to First Mining. From a financial reportingperspective, there were no reclamation liability amounts recorded in our audited annual financial statements for the year ended December 31, 2017, given that the nature of any reclamation work inrelation to our mineral properties is not material to First Mining at this time. We are also not aware of any existing environmental problems related to any of our properties that may result in materialliability to First Mining.
If needed, and to the extent that it can be done economically, we make and will continue to make expenditures to ensure compliance with applicable laws and regulations. New environmental laws andregulations, amendments to existing laws and regulations, or more stringent implementation of existing laws and regulations could have a material adverse effect on us, both financially andoperationally, by potentially increasing capital and/or operating costs and delaying or preventing the development of our mineral properties.
We believe that the policies and procedures implemented by our executive management team provide a safe working environment for all of our employees, consultants, contractors and stakeholders. Werecognize that safety and environmental due diligence are significant components that enable long-term sustainability of our operations and support our objective of projects being completed in a costeffective and timely manner with excellent quality control.
Bankruptcy and similar procedures
There are no bankruptcies, receivership or similar proceedings against us, nor are we aware of any such pending or threatened proceedings. We have not commenced any bankruptcy, receivership orsimilar proceedings during our history.
Page 21
Foreign operations
We currently hold an interest in certain non-material exploration stage mineral resource properties located in Mexico and the United States. Such properties are exposed to various degrees of political,economic and other risks and uncertainties. See “Risks that can affect our business” starting on page 119.
Reorganizations
On March 30, 2015, we completed our “Qualifying Transaction” (as such term is defined under the policies of the TSX-V) and acquired all of the issued and outstanding common shares of KCPMinerals Inc. (formerly known as Sundance Minerals Ltd.) (“Sundance”) (the “Sundance Acquisition”). In connection with the Sundance Acquisition, we changed our name to “First Mining FinanceCorp.”, completed a four-to-one (4:1) share consolidation and continued under the laws of the province of British Columbia pursuant to the provisions of the Business Corporations Act (BritishColumbia) (the “BCBCA”).
Major developments
Page 22
2015
March
We completed the Sundance Acquisition as our “Qualifying Transaction” pursuant to the policies of the TSX-V and became a Tier 2 Mining Issuer listed on the TSX-V.
May
• We entered into a definitive arrangement agreement with Coastal Gold Corp. (“Coastal Gold”), holder of the Hope Brook property (the “Hope Brook Property”) located in southwestern Newfoundland, pursuant to which we would acquire all of Coastal Gold’s outstanding shares by way of a court-approved plan of arrangement (the “Coastal GoldArrangement”).
July
• We completed the acquisition of Coastal Gold pursuant to the Coastal Gold Arrangement. Under the transaction, each Coastal Gold shareholder received 0.1625 of a share of First Mining for each Coastal Gold share they held. As a result of the transaction, we acquired the Hope Brook Property.
• Mr. Derek Iwanaka joined First Mining as Vice President, Investor Relations.
September
• We entered into a definitive arrangement agreement with Gold Canyon Resources Inc. (“Gold Canyon”), holder of the Springpole gold project (the “Springpole Project”) located in the Red Lake Mining District of Ontario, pursuant to which we would acquire all of Gold Canyon’s outstanding shares by way of a court- approved plan of arrangement (the “Gold CanyonArrangement”).
2015
September (continued)
• We entered into a definitive arrangement with PC Gold Inc. (“PC Gold”), holder of the Pickle Crow property (the “Pickle Crow Property”) located in Northwestern Ontario, pursuant to which we would acquire all of PC Gold’s outstanding shares by way of a court-approved plan of arrangement (the “Gold Canyon Arrangement”).
November
• We completed the acquisition of Gold Canyon pursuant to the Gold Canyon Arrangement.Under the transaction, each Gold Canyon shareholder received one share of First Mining foreach Gold Canyon share they held. As a result of the transaction, we acquired the SpringpoleProject.
• We completed the acquisition of PC Gold pursuant to the PC Gold Arrangement. Under thetransaction, each PC Gold shareholder received 0.2571 of a share of First Mining for each PCGold share they held. As a result of the transaction, we acquired the Pickle Crow Property.
• We entered into a definitive arrangement agreement with Goldrush Resources Ltd.(“Goldrush”), holder of two royalty interests on two gold projects in Burkina Faso, WestAfrica, pursuant to which we would acquire all of Goldrush’s outstanding shares by way of acourt-approved plan of arrangement (the “Goldrush Arrangement”).
Major developments (continued)
Page 23
2016
January
• We completed the acquisition of Goldrush pursuant to the Goldrush Arrangement and, as aresult, we acquired their treasury of approximately $3.4 million. Under the transaction, eachGoldrush shareholder received 0.0714 of a share of First Mining for each Goldrush share theyheld.
February
• We entered into a definitive arrangement agreement with Clifton Star Resources Inc. (“CliftonStar”) pursuant to which we would acquire all of Clifton Star’s outstanding shares by way of acourt-approved plan of arrangement (the “Clifton Star Arrangement”).
March
• We entered into a purchase agreement with Brionor Resources Inc. (“Brionor”) pursuant towhich we agreed to acquire the Pitt gold property (the “Pitt Property”).
April
• We completed our acquisition of Clifton Star pursuant to the Clifton Star Arrangement. Underthe transaction, each Clifton Star shareholder received one First Mining share for each CliftonStar share they held. As a result of the transaction, we acquired the Québec mineral propertiesthat were held by Clifton Star, namely a 100% interest in the Duquesne gold project (the“Duquesne Project”), a 100% interest in four early-stage precious and base metals projects,and a 10% indirect interest in the Duparquet gold project (the “Duparquet Project”). Inaddition, we acquired Clifton Star’s treasury of approximately $11 million in cash. Followingthe transaction, Michel Bouchard, Clifton Star’s former President and CEO, joined our Board.
• We completed our purchase of the Pitt Property from Brionor for $1.25 million, of which$250,000 was paid in cash and the remaining $1 million was satisfied through the issuance toBrionor of 2,535,293 First Mining shares (based on the 20-day VWAP of Brionor’s shares as ofMarch 6, 2016).
May
• We entered into a share purchase agreement with Chalice Gold Mines Limited (“Chalice”),pursuant to which we agreed to acquire all of the shares of Cameron Gold Operations Ltd.(“Cameron Gold”), a wholly-owned subsidiary of Chalice and owner of the Cameron goldproject in Ontario (the “Cameron Project”).
2016
May (continued)
• We entered into an amalgamation agreement with Tamaka Gold Corporation (“Tamaka”), aprivately held mineral exploration company that held a 100% interest in the Goldlund goldproject in Ontario (the “Goldlund Project”), pursuant to which Tamaka would become awholly-owned subsidiary of First Mining (the “Tamaka Amalgamation”). June
• We completed our acquisition of Cameron Gold. In connection with the transaction, we issued32,260,836 First Mining shares to Chalice. Under the terms of the transaction, Chalice agreednot to sell more than 4,032,604 First Mining shares in any month after the expiry of the fourmonth hold period on October 10, 2016, unless the sale is in a single block to a purchaseracceptable to First Mining. In addition, we issued Chalice a 1% net smelter returns (“NSR”)royalty on certain claims within the Cameron Project, and we have a right to repurchase 0.5%of the NSR royalty for $1 million.
• We completed the Tamaka Amalgamation, which resulted in Tamaka becoming a wholly-owned subsidiary of First Mining. Under the transaction, former Tamaka shareholders receivedan aggregate of approximately 92.5 million First Mining shares. In addition, under the terms ofthe transaction, certain Tamaka shareholders who held in the aggregate approximately 39.6%of the outstanding Tamaka shares have deposited the First Mining shares that they receivedunder the transaction into escrow. 5,931,658 of these escrowed First Mining shares were bereleased from escrow on June 17, 2017, and every six months thereafter a further 5,931,658First Mining shares will be released from escrow, until the final escrow release on June 17,2019.
• Mr. Samir Patel was appointed as our new Corporate Counsel and Corporate Secretary, andMr. Bill Tanaka joined the Company as Vice President, Technical Services.
• We granted 10,595,000 stock options to directors, officers, employees and consultants of FirstMining, with an exercise price of $0.75 and exercisable for five years. Certain of these optionsare subject to vesting provisions in accordance with the rules and policies of the TSX-V.
Major developments (continued)
Page 24
2016
August
• We closed a non-brokered private placement (the “Private Placement”) of units (the “Units”)under which we raised gross proceeds of $27 million. We issued 33,750,000 Units with eachUnit consisting of one First Mining share and one-half of a common share purchase warrant topurchase a First Mining share at $1.10 for a period of three years following the closing of thePrivate Placement. Certain of our directors and officers subscribed for an aggregate of1,139,659 Units in the Private Placement.
September
• We completed the sale of all of the outstanding shares of one of our Mexican subsidiaries,Minera Terra Plata S.A. de C.V. (“Terra Plata”), which owns the Peñasco Quemado, LaFrazada and Pluton properties (the “Mexican Silver Properties”) located in Mexico to SilverOne Resources Inc. (“Silver One”), formerly BRS Ventures Ltd. As a result of the transaction,Terra Plata became a wholly-owned subsidiary of Silver One, and Silver One acquiredownership of the Mexican Silver Properties. As consideration, we received six million commonshares of Silver One, and we retained a 2.5% NSR royalty on the Mexican Silver Properties.Silver One may buy back 1.5% of this NSR royalty by paying US$1 million to us.
• Mr. Andrew Marshall was appointed as our new Chief Financial Officer.
2016
October
• We commenced a metallurgical drill program at our Springpole Project, comprised of up tofour drill holes totaling approximately 1,500 m. The intent of the metallurgical testing programwas to determine the optimal grind size and processing flow sheet so as to maximizemetallurgical recoveries. The results from this metallurgical testing program were incorporatedinto a new Preliminary Economic Assessment (“PEA”) for Springpole.
November
• We commenced of a diamond drilling program at our Pickle Crow gold project, comprised ofup to eight drill holes totaling approximately 1,100 m.
December
• We provided an update of our exploration and corporate activities, and informed our investorsthat our Board has approved a $21 million exploration and development budget for 2017,which contemplated approximately 47,000 m of infill and exploration drilling at our priorityCanadian asset.
Major developments (continued)
Page 25
2017
January
• We announced the filing of an amended technical report for the Pitt Gold Project titled “NI 43-101 Technical Report and Review of the Preliminary Resource Estimate for the Pitt GoldProject, Duparquet Township, Abitibi Region, Quebec, Canada”, and dated January 5, 2017.
• We announced the release of an initial mineral resource estimate for our Goldlund Gold Projectlocated near the town of Sioux Lookout in northwestern Ontario.
• We announced the commencement of a 27,000 m drilling campaign at our Goldlund GoldProject, focused on in-fill and resource expansion of Zone Seven (the “2017 Goldlund DrillProgram”), and the signing of definitive asset purchase agreements to purchase certain mineralclaims located in Ontario and Québec.
February
• We announced the completion of our Fall 2016 drilling program at our Pickle Crow Project,which consisted of nine holes comprising approximately 1,300 m of drilling, and thecompletion of a metallurgical diamond drill program at our Springpole Gold Project located innorthwestern Ontario.
• We announced the filing of a technical report outlining the initial resource estimate for ourGoldlund Gold Project entitled “Technical Report and Resource Estimation Update on theGoldlund Project”, and dated January 23, 2017.
• We announced the completion of the acquisition of certain mineral claims located in Ontarioand Québec, and the grant of 10,630,000 stock options to directors, officers, employees andconsultants of First Mining, with an exercise price of $0.85 and exercisable for five years.Certain of these options are subject to vesting provisions.
March
• We announced the release of an updated mineral resource estimate for our Cameron GoldProject located near the town of Sioux Narrows in northwestern Ontario.
April
• We announced the assay results from the first 12 holes of Phase 1 of the 2017 Goldlund DrillProgram (see our news release dated April 25, 2017 for detailed information). The highlights ofthese holes were as follows:
o Hole GL-17-044 intersected 26.0 m of 2.14 g/t Au (including 2.0 m of 18.43 g/t Au);
o Hole GL-17-021 intersected 52.0 m of 2.21 g/t Au (including 2.0 m of 43.09 g/t Au); and
o Hole GL-17-017 intersected 62.0 m of 0.90 g/t Au (including 2.0 m of 12.74 g/t Au).
2017
May
• We announced the second set of assay results from Phase 1 of the 2017 Goldlund Drill Program, with 10 of the 11 drill holes assayed intersecting significant gold mineralization (see our news release dated May 2, 2017 for detailed information). The highlights of these holes were as follows:
o Hole GL-17-084 intersected 34.0 m of 4.30 g/t Au (including 2.0 m of 48.72 g/t Au);
o Hole GL-17-105 intersected 10.0 m of 1.90 g/t Au (including 2.0 m of 9.14 g/t Au); and
o Hole GL-17-071 intersected 45.2 m of 0.97 g/t Au (including 30.0 m of 1.26 g/t Au).
• We announced the third set of assay results from Phase 1 of the 2017 Goldlund Drill Program, with 12 of the 14 drill holes assayed intersecting significant gold mineralization (see our news release dated May 24, 2017 for detailed information). The highlights of these holes were as follows:
o Hole GL-17-032 intersected 64.5 m of 3.25 g/t Au (including 0.5 m of 335.76 g/t Au);
o Hole GL-17-059 intersected 70.5 m of 2.50 g/t Au (including 0.5 m of 186.49 g/t Au);
o Hole GL-17-073 intersected 48.0 m of 2.34 g/t Au (including 2.0 m of 36.53 g/t Au); and
o Hole GL-17-014 intersected 6.0 m of 30.69 g/t Au (including 2.0 m of 91.63 g/t Au).
June
• We announced the fourth set of assay results from Phase 1 of the 2017 Goldlund Drill Program, with all 12 of the drill holes assayed intersecting significant gold mineralization (see our news release dated June 20, 2017 for detailed information). The highlights of these holes were as follows:
Major developments (continued)
Page 26
2017
June (continued)
o Hole GL-17-005 intersected 313.0 m of 0.81 g/t Au (including 2.0 m of 42.15 g/t Au);
o Hole GL-17-028 intersected 94.0 m of 0.97 g/t Au (including 2.0 m of 14.64 g/t Au);
o Hole GL-17-060 intersected 14.0 m of 6.05 g/t Au (including 2.0 m of 38.54 g/t Au); and
o Hole GL-17-029 intersected 10.0 m of 4.11 g/t Au (including 2.0 m of 10.66 g/t Au).
• We announced that we had received approval from the TSX to graduate from the TSX-V to the TSX, and our common shares commenced trading on the TSX.
• We announced the results of our 2017 annual general meeting (the “2017 AGM”) of shareholders, with all matters voted on at the 2017 AGM passed.
July
• We announced the fifth set of assay results from Phase 1 of the 2017 Goldlund Drill Program, with all 11 of the drill holes assayed intersecting significant gold mineralization (see our news dated July 10, 2017 for detailed information). The highlights of these holes were as follows:
o Hole GL-17-002 intersected 14.0 m of 1.48 g/t Au (including 2.0 m of 8.00 g/t Au);
o Hole GL-17-042 intersected 22.0 m of 1.20 g/t Au (including 2.0 m of 9.66 g/t Au); and
o Hole GL-17-002 intersected 28.0 m of 0.85 g/t Au (including 14.0 m of 1.14 g/t Au).
• We announced the sixth set of assay results from Phase 1 of the 2017 Goldlund Drill Program, comprising 14 drill holes (see our news release dated July 27, 2017 for detailed information). The highlights of these holes were as follows:
o Hole GL-17-106 intersected 202.0 m of 1.39 g/t Au (including 2.0 m of 43.28 g/t Au);
2017
July (continued)
o Hole GL-17-053 intersected 179.0 m of 1.13 g/t Au (including 2.0 m of 12.07 g/t Au);
o Hole GL-17-065 intersected 90.0 m of 1.32 g/t Au (including 2.0 m of 11.82 g/t Au); and
o Hole GL-17-107 intersected 134.0 m of 0.91 g/t Au (including 2.0 m of 13.92 g/t Au).
September
• We announced the seventh and final set of assay results from Phase 1 of the 2017 Goldlund Drill Program, with 17 of the 26 drill holes assayed intersecting significant gold mineralization (see our news release dated September 11, 2017 for detailed information). The highlights of these holes were as follows:
o Hole GL-17-103 intersected 52.0 m of 2.18 g/t Au (including 32.0 m of 3.41 g/t Au);
o Hole GL-17-069 intersected 66.0 m of 1.51 g/t Au (including 28.0 m of 2.03 g/t Au);
o Hole GL-17-068 intersected 68.0 m of 0.91 g/t Au (including 42.0 m of 1.36 g/t Au); and
o Hole GL-17-041 intersected 60.0 m of 1.02 g/t Au (including 18.0 m of 2.26 g/t Au).
In total, Phase 1 of the 2017 Goldlund Drilling Program comprised 100 holes (24,300 m), of which 87 holes intersected intervals of significant gold mineralization.
• We announced the commencement of Phase 2 of the 2017 Goldlund Drilling Program to identify new areas of gold mineralization and to expand the overall resource base at the Goldlund property, with data from Phases 1 and 2 to be incorporated into a new mineral resource estimate for the Goldlund Project.
• We announced the acquisition of two claim groups, the Satterly Lake claims (the “Satterly Claims”), totaling 2,368 ha. The Satterly Claims are adjacent to the western edge of our Springpole gold project, and also surround our Horseshoe Island claims in the Red Lake Mining District, 12 km southwest of Springpole.
• We announced the positive results of an independent Preliminary Economic Assessment (“PEA”) for our Springpole Project. The PEA was prepared in accordance with NI 43-101. See the section of this AIF titled “Springpole” for comprehensive details of the PEA.
Major developments (continued)
Recent developments
Page 27
2017
OctoberWe filed a technical report the PEA on our Springpole Project that was prepared by SRK Consulting (Canada) Inc. in accordance with NI 43-101. The report, which is titled “Preliminary Economic Assessment Update for the Springpole Gold Project, Ontario, Canada” and is dated October 16, 2017, can be found under our SEDAR profile at www.sedar.com, and on our website at www.firstminnggold.com.
2018
January
• We announced a new corporate strategy to focus on advancing our existing properties tomaximize shareholder value, and we changed our name to “First Mining Gold Corp.” Or sharescommenced trading on the TSX under the new corporate name on January 11th, and our tickersymbol remained as “FF”.
• In connection with our new corporate strategy, we announced the appointment by our Board ofMr. Jeff Swinoga as the Company’s new Chief Executive Officer (“CEO”). Mr. Swinogasucceeded Dr. Chris Osterman as CEO, and Dr. Osterman assumed the role of Chief OperatingOfficer of the Company to focus on the development of our projects. Mr. Patrick Donnellyremained as President of the Company.
February
• We announced assay results from Phase 2 of the 2017 Goldlund Drill Program, comprising 4drill holes (see our news release dated February 5, 2018 for detailed information). Thehighlights of these holes were as follows:
o Hole GL-17-010 intersected 83.0 m of 1.35 g/t Au (including 1.0 m of 74.95 g/t Au);
o Hole GL-17-051 intersected 72.0 m of 0.65 g/t Au (including 2.0 m of 6.18 g/t Au); and
o Hole GL-17-106 intersected 56.0 m of 0.40 g/t Au (including 2.0 m of 4.74 g/t Au).
• The primary goal of these 4 deep diamond drill holes was to gain further knowledge on thegeology and gold mineralization within the deeper sections of Zone 7 of the Goldlund Project.Each of these holes were originally drilled during the Phase 1 drilling program, and wereextended during the Phase 2 drilling program, and they demonstrate that gold mineralization atthe Goldlund Project continues at considerable depths.
2018
February (continued)
• We announced further assay results from Phase 2 of the 2017 Goldlund Drill Program,comprising 14 drill holes from drilling in Zones 1 and 5 at the Goldlund Project (see our newsrelease dated February 8, 2018 for detailed information). The highlights of these holes were asfollows:
o Hole GL-17-128 intersected 3.0 m of 10.76 g/t Au (including 1.0 m of 30.27 g/t Au);
o Hole GL-17-119 intersected 16.0 m of 1.15 g/t Au (including 2.0 m of 3.69 g/t Au); and
o Hole GL-17-126 intersected 10.0 m of 1.50 g/t Au (including 2.0 m of 3.58 g/t Au).
Of the 14 drill holes, four holes were infill holes that targeted the area between Zones 1 and 5,with all four holes intersecting gold mineralization. Eight of the holes were also infill holes thatwere located within Zone 1 (six of these holes intersected gold mineralization). The remainingtwo holes were exploration holes that targeted potential additional hanging wall mineralizationoutside of the current resource area, south of Zone 5 (neither of these holes intersected goldmineralization).
• We announced that we had signed a negotiation protocol agreement (the “NegotiationProtocol”) with the Lac Seul First Nation, the Slate Falls First Nation and the Cat Lake FirstNation in Ontario (together, the “Shared Territory Protocol Nations”). Under the NegotiationProtocol, First Mining and the Shared Territory Protocol Nations have agreed to work togetherin a responsible, cooperative and productive manner in relation to the development of ourSpringpole Project.

Recent developments (continued)
Significant acquisitions
We have not completed any significant acquisitions during our most recently completed financial year.
Page 28
2018
March
• We announced that a Project Description for Springpole had been submitted to, andsubsequently accepted by, the Canadian Environmental Assessment Agency (the “Agency”).The acceptance of the Project Description by the Agency initiates the screening process todetermine whether a federal EA is required for Springpole. The Agency now has until April20, 2018 to decide whether a federal EA is required for Springpole (a public comment periodwill also take place during this time, between March 6 and 26th). For further details regardingthe federal EA process, please see the Company’s news release dated March 7, 2018.
2018
March (continued)
• We announced the departure of Patrick Donnelly as First Mining’s President, and theassumption of the role of President by Jeff Swinoga, with Mr. Swinoga becoming theCompany’s President and CEO. We also announced the appointment of Mr. Swinoga to theBoard.
How First Mining was formed
We were incorporated on April 4, 2005 in the Province of Alberta, Canada pursuant to the Business Corporations Act (Alberta) under the name “Parkdale Petroleum Ltd.” and changed our name on May3, 2005 to “Albion Petroleum Ltd.” (“Albion”). Albion was initially listed as a “capital pool company” (“CPC”) on the TSX-V on September 30, 2005 under the policies of the TSX-V. As a CPC,Albion’s only business had been to identify and evaluate businesses or assets with a view to completing a “Qualifying Transaction” (as that term is defined in TSX-V Policy 2.4) .
On July 1, 2014, Albion and Sundance entered into an arrangement agreement whereby Albion agreed to acquire all of the issued and outstanding shares of Sundance in exchange for shares of theresulting entity. On March 11, 2015, Sundance was renamed as KCP Minerals Inc. (“KCP”), and on March 30, 2015, Albion consolidated all of its issued and outstanding shares on a four-for-one basis.Subsequently, Albion acquired all of the issued and outstanding shares of KCP on a one-for-one basis, constituting its Qualifying Transaction. Immediately following the completion of the transaction,Albion was renamed as “First Mining Finance Corp.” On March 30, 2015, First Mining was continued under the laws of the Province of British Columbia, Canada pursuant to the BCBCA, and as aresult, First Mining is now governed by the laws of the Province of British Columbia. On January 8, 2018, we changed our name to “First Mining Gold Corp.”.
We are a reporting issuer in the province of British Columbia (our principal reporting jurisdiction) and in each of the other provinces of Canada. We currently have the following material wholly-ownedsubsidiaries:
Our other subsidiaries, which each have total assets and revenues less than 10%, and in the aggregate less than 20%, of our total consolidated assets or our total consolidated revenue, are excluded fromthe above list.
Corporate organization chart
The following diagram shows our current corporate structure and material subsidiaries, including the properties held by the various subsidiaries:
Page 29
• Gold Canyon Resources Inc., a company incorporated under the BCBCA.
• Tamaka Gold Corporation, a company incorporated under the Business CorporationsAct (Ontario) (“OBCA”).
• PC Gold Inc., a company incorporated under the OBCA.
• Cameron Gold Operations Ltd., a company incorporated under the OBCA.
• Coastal Gold Corp., a company incorporated under the OBCA.
For more information:
You can find more information about First Mining on SEDAR (www.sedar.com), and on ourwebsite (www.firstmininggold.com).
See our most recent management proxy circular dated May 10, 2017 for additional information, including how our directors and officers are compensated, principal holders of our securities, and securities authorized for issuance under our equity compensation plans.
See our audited consolidated annual financial statements and management’s discussion and analysis for the financial year ended December 31, 2017 for additional financial information.

Note:
Our projects
We have interests in mineral properties located in Canada, Mexico and the United States. As at December 31, 2017, these properties were carried on our balance sheet as assets with a total book value ofapproximately $240 million. The book value consists of acquisition costs plus cumulative expenditures on properties for which the Company has future exploration plans. The current book value is notnecessarily the same as the total expenditures on each property by the Company, as part of the expenditures on some properties have been written down. The book value is also not necessarily the fairmarket value of the properties.
Our material and non-material projects are set out below.
Page 30
• Our other subsidiaries, which each have total assets and revenues less than 10%, and in the aggregate less than 20%, of our total consolidated assets or our total consolidated revenue, are excluded from the above chart.
Material projects
• Springpole Project (Ontario) p. 31 • Goldlund Property (Ontario) p. 46 • Cameron Property (Ontario) p. 79 • Pickle Crow Property (Ontario) p. 90 • Hope Brook Property (Newfoundland & Labrador) p. 102
Non-material projects
• Canada… p. 110 • Mexico… p. 115 • United States… p. 118
Springpole
Technical report
The Springpole property project (the “Springpole Project”) description is based on the project’s technical report: Preliminary Economic Assessment Update for the Springpole Gold Project, Ontario,Canada (issue date October 16, 2017, effective date June 6, 2017) (the “Springpole Technical Report”). The report was prepared for us in accordance with NI 43-101, by or under the supervision ofDr. Gilles Arseneau, Ph.D., P.Geo.; Dr. Adrian Dance, Ph.D., P.Eng.; Victor Munoz, P.Eng. M.Eng; Grant Carlson, P.Eng; Neil Winkelmann, FAusIMM; Bruce Andrew Murphy, P.Eng; Michael Royle,M.App.Sci., P.Geo.; Dr. Ewoud Maritz Rykaart, Ph.D., P.Eng.; and Mark Liskowich, P.Geo.; all qualified persons within the meaning of NI 43-101. The following description has been prepared underthe supervision of Dr. Chris Osterman, Ph.D., P.Geo., who is a qualified person within the meaning of NI 43-101, but is not independent of us. All currencies used in this summary of the SpringpoleTechnical Report are in U.S. dollars unless otherwise noted.
The conclusions, projections and estimates included in this description are subject to the qualifications, assumptions and exclusions set out in the Springpole Technical Report, except as suchqualifications, assumptions and exclusions may be modified in this AIF. We recommend you read the Springpole Technical Report in its entirety to fully understand the project. You can download acopy from our SEDAR profile (www.sedar.com), or from our website (www.firstmininggold.com).
Project description, location and access
The Springpole Project lies approximately 110 km northeast of the Municipality of Red Lake in northwest Ontario, Canada. The latitude and longitude coordinates for the project are:
The Universal Transverse Mercator map projection based on the World Geodetic System 1984 (WGS84) zone 15N is:
During late spring, summer, and early fall, the Springpole Project is accessible by floatplane direct to Springpole Lake or Birch Lake. All fuel, food, and material supplies are flown in from Red Lake orPickle Lake, Ontario, or from Winnipeg, Manitoba, with flight distances of 110 km, 167 km, and 370 km, respectively. The closest road access at present is the landing at the old South Bay Mine onConfederation Lake, approximately 50 km away by air. During winter, an ice road approximately 85 km long is constructed from the South Bay landing point on Confederation Lake to a point about 1km from Springpole Lake camp. During breakup in spring and freeze-up in fall, access to the Springpole Project is by helicopter.
Page 31
Latitude N51° 23' 44.3"
Longitude W92° 17' 37.4"
Easting 549,183
Northing 5,693,578
Average Elevation 395 m
Gold Canyon acquired ownership of five patented claims in 1993 and six unpatented mining claims and related Crown leases for surface rights in 2011. The five patented claims are fee simple parcelswith mining and surface rights attached to all five claims registered with the Land Registry Office, Kenora, Ontario. A total of 300 contiguous unpatented mining claims make up the greater area of theSpringpole Project and have been staked directly by Gold Canyon.
Through Gold Canyon, we lease 10 patented claims which are fee simple parcels with mining and surface rights attached to registered, together with the notices of lease, with the Land Registry Office inKenora, Ontario. The lease is for a term of 21 years less one day and terminates on April 14, 2031. Under the lease, we are obligated to pay all applicable property taxes related to the 10 patented claimsduring the lease term together with advance royalty payments on a sliding scale of $50,000 per year (2011-2016), $60,000 (2016-2021), and $80,000 (2021-2031). These payments are to be credited tofuture NSR payables, if any. We have an option to acquire these 10 patented claims and would be required to do so upon the commencement of commercial production on these or certain adjoiningpatented claims. This option term is renewable for a further period of five years by providing notice and a $25,000 payment. The consideration payable is, at our option on exercise or at the option of theleaseholder upon commencement of commercial production, either (a) $5 million with the leaseholder retaining a 1% NSR or (b) $4 million with the leaseholder retaining a 2% NSR. We have a right offirst refusal on any sale of the remaining royalty interest on certain terms and conditions.
Through Gold Canyon, we also have an option and lease to a further 15 patented mining claims which are fee simple parcels with mining and surface rights attached and registered, together with thenotice of option and lease, with the Land Registry Office, Kenora, Ontario. The option can be exercised by us before expiry of the earlier option period by confirmation of good standing of theagreement and payment of a $50,000 renewal fee. We are required to make option payments in the aggregate amount of $35,000 per year and to expend an aggregate of CDN$300,000 on miningoperations in each option term as a condition of any renewal and to pay all property taxes related to these patented claims. We have an option to acquire the 15 claims and would be required to do soupon the commencement of commercial production at any time during the option period by payment of an aggregate of $2 million. Upon exercise of the purchase option, we must also acquire the cabinon the property for the lesser of fair market value or $20,000.
Underlying royalties which affect the Springpole Project are:
Page 32
• 3% NSR on five patented claims payable to Jubilee Gold Exploration Ltd. (“Jubilee Gold”) upon commencement of commercial production with advance royalty payments of $70,000 peryear, adjusted using the yearly Consumer Price Index. We have an option to acquire 1% of the NSR for $1,000,000 at any time, and a right of first refusal on any sale of the NSR. We canterminate the royalty obligations at any time by transferring the five patented claims back to Jubilee Gold;
• 3% NSR on 10 leased patented claims payable to a leaseholder upon commencement of commercial production with advance royalty payments on a sliding scale of $50,000 per year (2011-2016), $60,000 per year (2016-2021), and $80,000 per year (2021-2031). We have a right to acquire up to 2% of the NSR for $1,000,000 per 1% at any time;
• 3% NSR on 15 patented claims (held by us pursuant to an option and lease) is payable to an optionor and leaseholder during the option term upon commencement of commercial productionor a 1% NSR if the purchase option is exercised prior to commercial production. We have a right to acquire the remaining 1% NSR by a payment of $500,000; and
• 3% NSR on six unpatented mining claims payable to an individual vendor upon commencement of commercial production with advance royalty payments of $50,000 per year. We have anoption to acquire all or a portion of the NSR at a rate of $500,000 per 1% of the NSR.

We are required to purchase a vacation home owned by a vendor that is located on the Springpole Project upon commencement of commercial production.
To keep an unpatented mining claim current, the mining claim holder must perform $400 per mining claim unit worth of approved assessment work per year, immediately following the initial stakingdate. The claim holder has two years to file one year worth of assessment work.
Surface rights are separate from mining rights. Should any method of mining be appropriate, other than those claims for which Crown leases were issued, the surface rights would need to be secured.
History
Gold exploration on the property was carried out during two main periods, one during the 1920s to 1940s, and a second period from 1985 to the present.
Between 1933 and 1936, extensive trenching and prospecting was conducted on the Springpole Project, including 10 short holes totalling 458.5 m. Limited trenching and prospecting was competed in1945.
The area remained dormant until 1985. On the 30 patented claims line cutting was done at both 30.5 m centres and 61 m centres. Subsequently, geological mapping, humus geochemistry, and groundgeophysics were conducted over the grids.
From 1986 through 1989, 118 diamond drill holes were completed in seven drill phases totalling 38,349 m. In addition, during 1986 and 1987, approximately 116,119 m2 of mechanical stripping wascarried out and four petrographic reports were produced.
From 1989 through 1992, an induced polarization survey over the central portion of the Portage zone under Springpole Lake was conducted and the Springpole Project was tested with eighteen coreholes totalling 6,195 m. The majority of the drilling was conducted on the Portage zone. At the same time, a seven core hole drill program was completed around the east margins of Springpole Lake andlake-bottom sediment sampling of Springpole Lake east of Johnson Island was completed.
During 1995, an exploration program consisting of remapping of the main area, of some of the existing drill core, and a reinterpretation of the geology was carried. During the 1995 and 1996 programs,an additional 69 holes were drilled totalling 15,085 m on the Springpole Project proper and two drill holes on Johnson Island. By late 1996, Gold Canyon acquired 100% of the Springpole Project. GoldCanyon continued exploration in 1997 and 1998 with another 51 core holes totalling 5,642 m.
In the summer of 1998 a lake bottom sediment sampling program was conducted in several areas of the Springpole Project.
During 2004, 2005, and 2006, diamond drilling programs were conducted on the property by Gold Canyon.
In the fall of 2007, Gold Canyon embarked on a limited exploration program to further investigate the Fluorite zone that was previously identified.
Page 33
From early August through to the end of October 2009, Gold Canyon re-logged and re-sampled a portion of the historic drill core stored at Gold Canyon's project site and temporary tent camp.
During the spring and summer of 2010, a total of 8,664.2 m of HQ core drilling was completed in 23 drill holes.
In the winter of 2010, a total of six diamond drill holes were drilled for a total of 1,774.5 m of HQ drilling.
In 2011, Gold Canyon carried out a drill program which totaled 28,750 m in 80 diamond core holes.
A 2012 drill program began in-filling the Portage zone based upon results of the 2011 drill program. The 2012 drill program totaled 38,069 m in 87 diamond core holes.
In 2013, Gold Canyon commissioned SRK Consulting (Canada) Inc. (“SRK”) to complete a preliminary economic assessment on the Springpole Project.
On November 13, 2015, we acquired Gold Canyon, and as a result, the Springpole Project. In October 2016 we commenced a drilling program at the Springpole Project to collect additional material formetallurgical testing.
In February 2017, we announced the results of the drilling program. A total of four holes comprising 1,712 m were drilled, with hole locations specifically chosen to recover sample material that isrepresentative of the Springpole deposit.
Geological setting, mineralization and deposit types
The Springpole Project is within the Archean-aged Birch-Uchi Greenstone Belt. Studies of the southern part of the Birch-Uchi greenstone belt have revealed a long, multistage history of crustaldevelopment. Based on mapping, lithogeochemistry, and radiometric dating, the supracrustal rocks of the greenstone belt were subdivided into three stratigraphic group-scale units (listed in decreasingage): the Balmer, Woman and Confederation assemblages. This three-part subdivision was applied to most of the Uchi Subprovince. The Confederation assemblage is thought to be a continental margin(Andean-type) arc succession, versus the less certain tectono-stratigraphic context of the other assemblages. Some relatively small conglomeratic units likely form a synorogenic, discontinuouslydistributed, post-Confederation assemblage in the Birch-Uchi greenstone belt.
The northern margin of the Birch-Uchi greenstone belt forms a pattern of sub-regional scale cusps of supracrustal strata alternating with batholiths. Basaltic units are prominent around the periphery ofthe greenstone belt and may be part of the Woman assemblage but the accuracy of this stratigraphic assignment is unknown. It is suggested that Confederation assemblage age rocks make up the bulk ofthe greenstone belt.
Page 34
The Springpole Project is underlain by a polyphase alkali, trachyte intrusive displaying autolithic breccia. The intrusive is comprised of a system of multiple phases of trachyte that is believed to be partof the roof zone of a larger syenite intrusive; fragments displaying phaneritic textures were observed from deeper drill cores in the southeast portion of the Portage zone. Early intrusive phases consist ofmegacrystic feldspar phenocrysts of albite and orthoclase feldspar in an aphanitic groundmass. Successive phases show progressively finer grained porphyritic texture while the final intrusive phases areaphanitic. Within the country rocks to the north and east are trachyte and lamprophyre dikes and sills that source from the trachyte- or syenite-porphyry intrusive system.
The main intrusive complex appears to contain many of the characteristics of alkaline, porphyry style mineralization associated with diatreme breccias (e.g. Cripple Creek, Colorado). This style ofmineralization is characterized by the Portage zone and portions of the East Extension zone where mineralization is hosted by diatreme breccia in aphanitic trachyte. It is suspected that the ductileshearing and brittle faulting have played a significant role in redistributing structurally controlled blocks of the mineralized rock. Diamond drilling in the winter of 2010 revealed a more complexalteration with broader, intense zones of potassic alteration replacing the original rock mass with biotite and pyrite. In the core area of the deposit where fine grained disseminated gold mineralizationoccurs with biotite, the primary potassic alteration mineral, gold displays a good correlation with potassium/rubidium.
Exploration
No on-going exploration activity is currently underway at the Springpole Project, however, we did drill four representative holes in 2016 to provide material for additional metallurgical testing, theresults of which are discussed under the heading “Mineral processing and metallurgical testing”.
Drilling
During the winters of 2007 and 2008 Gold Canyon conducted drill programs that completed 21 holes totalling 3,159 m, 11 holes totalling 2,122 m, and 7 holes totalling 2,452 m of diamond core drilling,respectively.
During the winter of 2010, a total of six diamond drill holes were drilled for a total of 1,774.5 m of HQ drilling. Two drill holes were not completed and both holes ended in altered and mineralized rock.The drill program revealed a more complex alteration with broader, intense zones of potassic alteration replacing the original rock mass with biotite and pyrite. During the summer and fall of 2010, atotal of 8,664.2 m of HQ core drilling was completed in 23 drill holes, averaging 44.23 m of drilling per 24-hour shift, including time for moving the drill between drill sites.
The 2011 drill program totaled 28,750 m in 80 diamond core holes. Five of the diamond core holes were drilled for the purpose of metallurgical testing. All these holes were twins of previously drilledholes.
The 2012 drill program began in-filling the Portage zone based upon results of the 2011 drill program. The goal was to in-fill areas where inferred mineral resource had been defined in the February2012 mineral resource update and to expand the mineral resource area to the southeast. The 2012 drill program totaled 38,069 m in 87 diamond core holes.
The 2013 oriented-core drill program was implemented to collect rock geotechnical data within the immediate vicinity of the proposed open pit. Approximately 2,450 m of drilling was completed on 7drillholes (SG13-200 to SG13-206).
Page 35
We implemented the 2016 drill program to collect additional material from the Portage Zone so that additional metallurgical testing could be carried out. In total, 1,712 m were drilled in the four holes(PM-DH-01 to 04). Results of the metallurgical test results are discussed under the heading “Mineral processing and metallurgical testing”.
Sampling, analysis and data verification
Detailed descriptions of the drill core were carried out under the supervision of a senior geologist, a member in good standing of the Association of Professional Geologists of Ontario and AmericanInstitute of Professional Geologists. The core logging was carried out on-site in a dedicated core logging facility. Drill log data were recorded onto paper logs that were later scanned and digitized.
Core was laid out 30 to 40 boxes at a time. First, the core was photographed in 15 m batches prior to logging or sampling. This was followed by a geotechnical log that recorded quantitative andqualitative engineering data including detailed recovery data and rock quality designation. Any discrepancies between marker blocks and measured core length were addressed and resolved at this stage.The core was then marked up for sampling.
For the 2010 and 2011 drill programs, all the drill core intervals were sampled using sample intervals of 1 m. During the 2012 drilling program, Gold Canyon changed its standard sample length from 1to 2 m lengths. However, in zones of poor recovery, 1.5 m or 3 m samples were sometimes collected. Samples over the standard sample length were typically half core samples and whole core wasgenerally only taken in intervals of poor core recovery across the sampled interval. Sampling marks were made on the core and sample tickets were stapled into the core boxes at the beginning of eachsample interval. Quality control samples were inserted into the sample stream.
Inserting quality control samples involved the addition of certified blanks, certified gold standards, and field and laboratory duplicates. Field duplicates were collected by quartering the core in thesampling facility on-site. Laboratory duplicates were collected by splitting the first coarse reject and crushing and then generating a second analytical pulp. Blank, standards and duplicates made up 10%of the total sample stream. Sample tickets were marked blank, field or laboratory duplicate, or standard, and a sample tag was stapled into the core box within the sample stream.
Geological descriptions were recorded for all core recovered. Separate columns in the log allow description of the lithology, alteration style, intensity of alteration, relative degree of alteration, sulphidepercentage, rock colour, vein type, and veining density. A separate column was reserved for written notes on lithology, mineralization, structure, vein orientations/relations etc. The header page listed thehole number, collar coordinates, final depth, start/end dates, and the name of the core logging geologist.
Following the logging and core marking procedures described above, the core was passed to the sampling facility. Core sampling was performed by experienced sampling technicians from AckewanceExploration & Services (“Ackewance”) of Red Lake, Ontario, and quality control was maintained through regular verification by on-site geologists. Core was broken, as necessary, into manageablelengths. Pieces were removed from the box without disturbing the sample tags, were cut in half lengthwise with a diamond saw, and then both halves were carefully repositioned in the box. When acomplete hole was processed in this manner, one half was collected for assay while the other half remained in the core box as a witness. The remaining core in the boxes was then photographed at 51 cm(20 inch) intervals.
Page 36

All logs and photographs were then submitted to the senior geologist/project manager for review and were archived. Data were backed up.
The sampling technician packed one half of the split core sample intervals into transparent vinyl sample bags that were sequentially numbered to match the sample number sequences in the sample tagbooklets used by the core-logging geologists. The numbered, blank portion of the triplicate sample tag was placed in the bag with the sample; the portion that was marked with the sample intervalremained stapled into the bottom of the core box at the point where the sample interval begins. Sample bags were then sealed with plastic tags. Sealed sample bags were packed into rice sacks fivesamples at a time. All sacks were individually labeled with the name of the company, number of samples contained therein, and the number sequence of the samples therein. Sacks were assignedsequential numbers on a per shipment basis. A project geologist then checked the sample shipment and created a shipping manifest for the sample batch. A copy was given to the project manager and acopy was sent along with the sample shipment. A copy of the sample shipment form was also sent via e-mail to the analytical laboratory.
The project geologist prepared the sample submission form for the assay laboratory. This form identifies the number of sample sacks as well as the sequence of sample numbers to be submitted. Due tothe remote location, the shipment was then loaded on to a plane or helicopter and flown direct to Red Lake where representatives of the commercial analytical laboratory met the incoming flight andtook the samples to the laboratory by pickup truck.
Once at the laboratory, a manager checked the rice sacks and sample numbers on the submission form. The laboratory then split the received sample manifest into batches for analysis, assigned a workorder to the batch, and sent a copy of the mineral analysis acknowledgement form to the project manager.
Aluminum tags embossed with the hole number, box number, and box interval (from/to) were prepared and stapled onto the ends of each core box. Core boxes were cross-stacked on pallets and thenmoved to on-site storage.
Core samples collected at the drill site were held in closed core boxes sealed with fiber tape; at various times of day, camp staff collected the core boxes that were then delivered to the core loggingfacility. All core logging, sampling and storage took place at the Springpole Project site. Following the logging and marking of core, all core preparation and sampling was performed by techniciansfrom Ackewance of Red Lake, Ontario, under the supervision of the project manager. All on-site sampling activities were directly supervised by the project manager.
All primary assay work since the 2010 drill program has been performed by SGS Laboratories in Red Lake (gold), Ontario and Don Mills (silver and multi-element) in Toronto, Ontario. The SGS RedLake and Don Mills facilities are certified and conform to requirements CAN-P-1579 and CAN-P-4E (ISO/IEC 17025:2005). Certification is accredited for precious metals including gold and silver and52 element geochemical analyses.
We have attested that there is no commercial nor other type of relationship between us and SGS Laboratories that would adversely affect the independence of SGS Laboratories.
All samples received by SGS Red Lake were processed through a sample tracking system that is an integral part of their laboratory information management system. This system utilizes bar coding andscanning technology that provides complete chain of custody records for every stage in the sample preparation and analytical process.
Page 37
Samples were dried, and then crushed to 70% of the sample passing 2 mm (-70 mesh). A 250 g sample was split off the crushed material, and pulverized to 85% passing 75 micron (-200 mesh). A 30 gsplit of the pulp was used for gold fire assay and a 2 g split was used for silver analysis. Crushing and pulverizing equipment was cleaned with barren wash material between sample preparation batchesand, where necessary, between highly mineralized samples. Sample preparation stations were also equipped with dust extraction systems to reduce the risk of sample contamination. Once the gold assaywas complete, a pulp was sent to the SGS Toronto facility for silver and possibly for multi-element geochemical analysis.
As part of the standard internal quality control procedures used by the laboratory, each batch of 75 Springpole Project core samples included four blanks, four internal standards, and eight duplicatesamples. In the event that any reference material or duplicate result would fall outside the established control limits, the sample batches would be re-assayed.
Pulps and rejects of the samples were stored by SGS at its Red Lake facility at the request of Gold Canyon.
Prepared samples were analyzed for gold by fire assay with atomic absorption finish. Samples returning assays in excess of 10g/t gold were re-analyzed with a gravimetric finish.
Prepared pulp samples shipped from SGS Red Lake to SGS Toronto were analyzed for silver by three-acid digestion with atomic absorption finish.
During the winter 2010 program, prepared samples were analyzed for 52 elements by acid digestion (3:1 HCl: HNO3).
Of the 18 drill holes completed in 2007 and 2008, comprising a total of 1,374 assay intervals analyzed for gold, SRK, who prepared the Springpole Technical Report, checked a total of 137 samplesrepresenting 10% of the total against the original certificates. No errors were found.
A total of 3,135 assay values for gold and 3,161 assay values for silver in the database were compared against the original protected PDF assay certificates submitted by SGS Red Lake. These totalsrepresent 10.1% and 10.4% of the total number of assays for gold and silver, respectively.
Of the original assay values checked against certificates, the focus was on values material to any resource estimate, either higher-grade intervals or very low grade intervals in proximity to higher-gradeintervals. The average grade of gold samples verified was 2.05 g/t Au. The average grade of silver samples checked was 8.27 g/t Ag.
Only two errors were found for gold:
No errors were found with respect to silver assays.
This represents an error rate of 0.064% in gold assays and an error rate of 0.0% in silver assays. This error rate is well within acceptable industry standards.
Page 38
• The gold value of sample interval SP10-028 from 433 m to 436 m (sample number 8287) was found to have an entered value of 5.96 g/t gold against a value on the assay certificate of 9.00 g/t gold.
• The gold value of sample interval SP11-076 from 69 to 70 m (sample number 14583) having the value of 0.45 oz./t was incorrectly placed in the parts per billion column.
As part of the mineral resource estimation process, the author of the Springpole Technical Report reviewed the QA/QC data collected by Gold Canyon, reviewed the procedures in place to assure assaydata quality, and verified the assay database against original assay certificates provided directly to the author by SGS Red Lake, the assay laboratory. A total of 53,431 gold assays, 46% of the assaydata, were checked against original assay certificates. No significant database errors were identified. About 143 minor rounding errors were observed. None of the rounding errors are deemed material orof any significance to the mineral resource estimate presented in this report.
Mineral processing and metallurgical testing
Over the period from 1989 to 2013, three testwork campaigns were completed on samples of Springpole mineralised material by SGS Lakefield in Ontario and SGS Mineral Services in Vancouver,Canada. Since 2013, one testwork program has been completed by Base Metallurgical Laboratories Ltd. in 2017 to further investigate the option of flotation followed by concentrate leaching. A Mastercomposite was prepared from the drillcore intervals and tested for both rougher flotation as well as whole feed leaching at grind P80 sizes down to 20µm. Additional comminution tests were conductedalong with an estimate of the fine grind power requirements based on a Levin test and Eliason test (small mass, IsaMill signature plot). As a second phase, five samples were prepared at a range of headgrades from 1.0 g/t to 7.0 g/t to investigate the effect of head grade on leach extraction.
The metallurgical testwork programs conducted to date suggest the Portage zone to be quite consistent in its properties, with fine-grained gold particles associated mainly with petzite.
SRK, the author of the Springpole Technical Report recommends that additional testwork be undertaken to confirm whether cyanide detoxification can be completed successfully and within normalreagent cost levels and that thickening and filtering characteristics should be confirmed to increase confidence in the estimation of dewatering costs. SRK is of the opinion that further variability testingis warranted to confirm the expected grinding power requirements as well as cyanide consumption and that opportunities exist to recover some of the cyanide in the leach tailings rather than destroy itprior to being pumped to the tailings management facility.
Mineral resource estimates
The mineral resource model for the Springpole Project considers 644 core boreholes drilled by Gold Canyon and previous owners of the property during the period of 2003 to 2014 and four holes drilledby us in 2016.
The revised mineral resource estimate (March 17, 2017) was based on a gold price of $1,400/oz. and a silver price of $15/oz., both considered reasonable economic assumptions by the author of theSpringpole Technical Report. To establish a reasonable prospect of economic extraction in an open pit context, the resources were defined within an optimized pit shell with pit walls set at 45°. Assumedrecoveries of 80% for gold and 60% for silver were used (Note: A silver recovery assumption of 85% was used for mine design and evaluation based on more recent data). Mining costs were estimatedat $2/t of total material, processing costs estimated at $12/t and general and administrative (“G&A”) costs estimated at $2/t. A cut-off grade (“COG”) of 0.4 g/t gold was calculated, and is considered tobe an economically reasonable value corresponding with breakeven mining costs. Approximately 90% of the revenue for the proposed project is derived from gold and 10% from silver.
Note: For the mine development (Whittle™ optimization) and economic analysis in the Springpole Technical Report, updated input parameters were used.
Page 39
Mineral resources were estimated by ordinary kriging using Gemcom block modelling software in 10 m x 10 m x 6 m blocks. Grade estimates were based on capped, 3 m composited assay data.
Capping levels were set at 25 g/t for gold and 200 g/t for silver. Blocks were classified as indicated mineral resources if at least two drill holes and six composites were found within a 60 m x 60 m x 40m search ellipse. All other interpolated blocks were classified as inferred mineral resource. Mineral resources were then validated using Gemcom GEMS (6.7) software.
This resource model includes mineralized material in the Main, East Extension and Portage zones spanning from geologic sections 0-1, 500 m in the northwest to 0-250 m in the southeast. Along theaxis of the Portage zone, resource modelling includes mineralized material generally ranging from the surface to a depth of 340-440 m below surface.
Mineral resources that are not mineral reserves do not have demonstrated economic viability. There is no certainty that all or any part of the mineral resources would be converted into mineral reserves.The estimate of mineral resources may be materially affected by environmental, permitting, legal, title, taxation, sociopolitical, marketing, or other relevant issues. The quantity and grade of reportedinferred mineral resources in this estimation are uncertain in nature. There has been insufficient exploration to define these inferred mineral resources as an indicated or measured mineral resource butthe author of the Springpole Technical Report is of the opinion that with additional drilling, the majority of the inferred mineral resources could be upgraded to indicated mineral resources.
The updated resource estimate is summarized in the table below.
Source: Springpole Project, Northwestern Ontario, SRK Consulting, March 17, 2017.
*Mineral resources are reported in relation to a conceptual pit shell. Mineral resources are not mineral reserves and do not have demonstrated economic viability. All figures are rounded to reflect therelative accuracy of the estimate. All composites have been capped where appropriate. **Open pit mineral resources are reported at a cut-off grade of 0.4 g/t gold. Cut-off grades are based on a gold price of $1,400/oz. and a gold processing recovery of 80% and a silver price of $15/oz.and a silver processing recovery of 60%.
Mineral resources that are not mineral reserves do not have demonstrated economic viability. The estimate of mineral resources may be materially affected by environmental, permitting, legal, title,taxation, sociopolitical, marketing, or other relevant issues. The quantity and grade of reported inferred mineral resources in this estimation are uncertain in nature and there has been insufficientexploration to define these inferred mineral resources as an indicated or measured mineral resource, and it is uncertain if further exploration will result in upgrading them to an indicated or measuredmineral resource category. SRK, the author of the Springpole Technical Report, is of the opinion that further attempts to convert the remaining inferred material to indicated would be of questionablevalue. The current proportion of the resource classified as inferred is 7.6% of total tonnes and 4.7% of contained gold.
Page 40
Category Quantity
Grade Metal
Au Ag Au Ag
(Mt) (g/t) (g/t) (Moz.) (Moz.)
Open Pit**
Indicated 139.1 1.04 5.4 4.67 24.19
Inferred 11.4 0.63 3.1 0.23 1.12

Mining Operations
The mine development plan for the Springpole Project contemplates open pit mining with a mine plan to mine a total of 151 Mt of mineralised material (139 Mt of processing plant feed) and 319 Mt ofwaste (2.1:1 overall strip ratio mined and 2.4:1 strip ratio for material processed) over a twelve-year mine production life, including stockpile reclamation. The current life of mine (“LOM”) plan focuseson achieving steady plant feed production rates, and mining of higher grade material early in schedule, as well as balancing grade and strip ratios. An elevated cut-off grade is applied throughout themine life. Low grade mineralised material is stockpiled and processed at the end of mining.
The LOM production schedule is shown in the table below. The open pit mining operation is planned as an owner-operated scenario.
Page 41
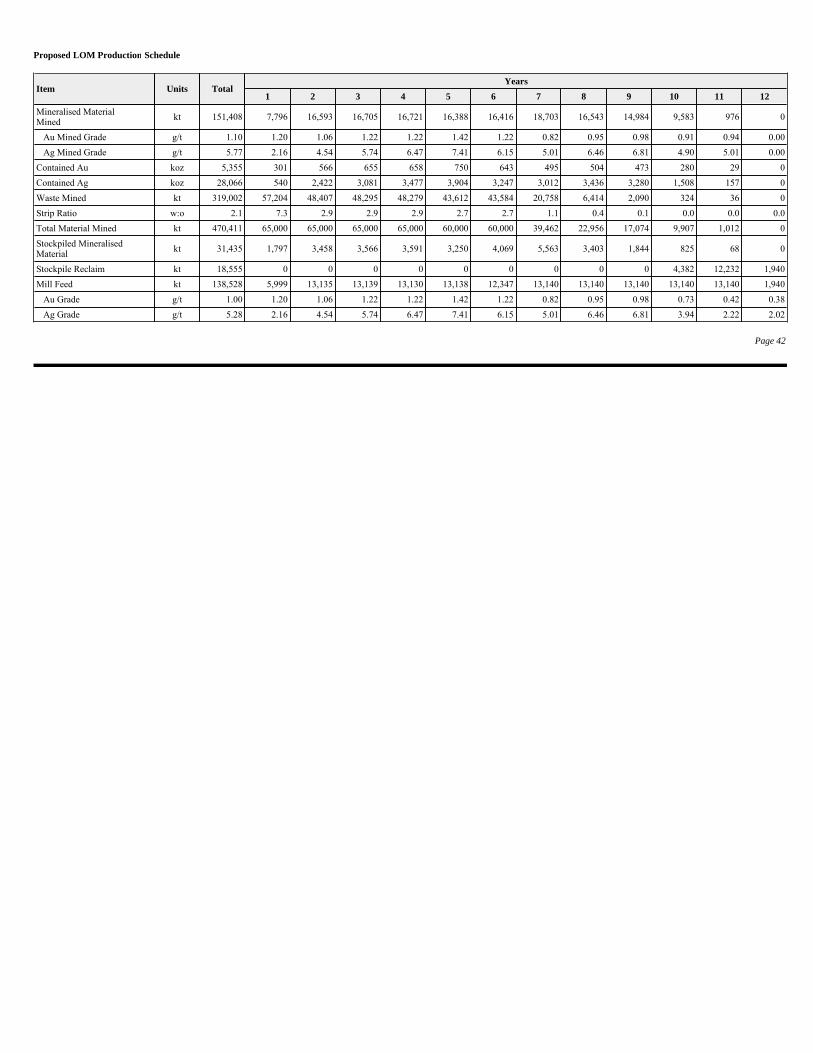
Proposed LOM Production Schedule
Page 42
Item Units TotalYears
1 2 3 4 5 6 7 8 9 10 11 12
Mineralised MaterialMined
kt 151,408 7,796 16,593 16,705 16,721 16,388 16,416 18,703 16,543 14,984 9,583 976 0
Au Mined Grade g/t 1.10 1.20 1.06 1.22 1.22 1.42 1.22 0.82 0.95 0.98 0.91 0.94 0.00
Ag Mined Grade g/t 5.77 2.16 4.54 5.74 6.47 7.41 6.15 5.01 6.46 6.81 4.90 5.01 0.00
Contained Au koz 5,355 301 566 655 658 750 643 495 504 473 280 29 0
Contained Ag koz 28,066 540 2,422 3,081 3,477 3,904 3,247 3,012 3,436 3,280 1,508 157 0
Waste Mined kt 319,002 57,204 48,407 48,295 48,279 43,612 43,584 20,758 6,414 2,090 324 36 0
Strip Ratio w:o 2.1 7.3 2.9 2.9 2.9 2.7 2.7 1.1 0.4 0.1 0.0 0.0 0.0
Total Material Mined kt 470,411 65,000 65,000 65,000 65,000 60,000 60,000 39,462 22,956 17,074 9,907 1,012 0
Stockpiled MineralisedMaterial
kt 31,435 1,797 3,458 3,566 3,591 3,250 4,069 5,563 3,403 1,844 825 68 0
Stockpile Reclaim kt 18,555 0 0 0 0 0 0 0 0 0 4,382 12,232 1,940
Mill Feed kt 138,528 5,999 13,135 13,139 13,130 13,138 12,347 13,140 13,140 13,140 13,140 13,140 1,940
Au Grade g/t 1.00 1.20 1.06 1.22 1.22 1.42 1.22 0.82 0.95 0.98 0.73 0.42 0.38
Ag Grade g/t 5.28 2.16 4.54 5.74 6.47 7.41 6.15 5.01 6.46 6.81 3.94 2.22 2.02

The proposed overall site layout for the Springpole Project includes an open pit, waste rock facilities, plant site and tailings management facility locations. Much of the planned open pit lies beneathnorthern embayment of Springpole Lake. The mine plan requires that this embayment be dammed and dewatered, prior to mining commencement. The proposed dammed portion of Springpole Lake isproportiately small and totals 152 Ha representing 6.1% of the total surface area of the lake.
The mine design process for the deposit commenced with the development of Whittle optimization input parameters. These parameters included estimates of metal price, mining dilution, processrecovery, offsite costs, geotechnical constraints (slope angles) and royalties.
Processing and Recovery Operations
The Springpole Technical Report envisages a 36,000 t/d process plant treating moderate hardness (BWi of 12 kWh/t to 14 kWh/t) material averaging 1 g/t gold and 6 g/t silver. Testwork determined thata moderate grind P80 size of 70 µm should achieve 80% gold extraction through whole-ore cyanide leaching for at least 24 hours (design of 36 hours). Gravity recovery was considered optional underthe Springpole Technical Report, as only higher grade feed would benefit from including this circuit.
Based on the testwork results in 2012/2013 and in 2017, the Portage zone material is very consistent in grade and leaching characteristics. There does not appear to be much requirement for metallurgicaldomaining or characterisation of different areas of the Portage zone. The minor East Extension, Camp and Main zones are different in their gold mineralogy and have been evaluated in the 2012/2013metallurgical testwork programs.
Infrastructure, Permitting and Compliance Activities
There is no existing infrastructure within 50 km of the Springpole Project area. The primary access point for the Springpole Project will likely be a two lane access corridor road. SRK is of the view that,based on a cursory review of the alignment using low resolution topographical mapping, it is anticipated that only basic cut/fill techniques will be required to construct the road. The unpaved roadsurface will require ongoing maintenance consisting of re-grading and topdressing the running surface to reduce the wear on the haul truck and heavy equipment tires. Topdressing will be sourced fromthe local borrow sources used during construction.
There are four 7 m wide single lane access roads located throughout the Springpole Project area. All single lane access roads will be constructed using conventional cut and fill techniques prior to theplacing of an approximately 0.5 m thick compacted sub-base layer sourced from locally developed and approved borrow sources. Routine surface water management along all roads will be achieved byensuring the roads are graded with a crown. Eleven locations along the access corridor road will have corrugate steel culverts installed to allow surface water to pass while no culverts have beenidentified for the single lane access roads.
Two major stream crossings will be required along the access corridor road. An arched culvert will be constructed at the Deaddog Stream Crossing while a pre-fabricated bridge will be constructed at theBirch River Crossing.
Surface infrastructure earthworks will also use conventional cut and fill techniques to provide suitably graded areas to place the buildings and allow for surface drainage. The buildings will be ofmodular design or consist of fully contained prefabricated components. These structures will require minimal on-site construction, plumbing, and electrical work.
Page 43
Substantial storage of fuel will not be required on-site due to the easy access to the nearby highway. Some fuel storage will be required for the mine, haul, and light vehicle fleets, as well as for the heavyequipment and production of ammonium nitrate/fuel oil, a bulk explosive. It has been assumed that a 5 ML fuel tank farm, within a suitably-sized bund, is to be constructed at the mine site. The FuelTank Farm should be located on a blasted bedrock foundation. Compacted engineered backfill will be used to bring the foundation up to the appropriate grades and provide suitable bedding material forthe lined containment facility, as well as be used for pedestal supports for the fuel tanks.
A 60 km long by 23 m wide right-of-way will be cleared, grubbed and prepared for the installation of a 115 kV wood pole transmission line using 636,000 mils conductor. The right-of-way will startfrom Highway 105 near Ear Falls and travel a further 90 km alongside the existing Hydro One corridor overland where it will connect to and follow the access corridor road to the project site.
The potential impacts the project may have on Springpole and/or Birch Lake are considered to be the more environmentally and socially sensitive components of the project. We are cognizant of thesesensitivities and have taken steps to design the project with these sensitivities in mind. To that end, the project is designed to avoid direct interaction with the Birch Lake watershed, and all baselinestudies carried out to date are structured to identify areas of risk so they can be protected to minimize impact during the development and operation of the project or totally avoided.
The proposed project will need to be screened under the Canadian Environmental Assessment Act 2012 (“CEAA”). The requirement of a federal Environmental Assessment (“EA”) will become cleareronce consultations with CEAA administrators for the development of a project description are completed; however, it is expected that a federal assessment of the proposed project will be required giventhe project’s potential impacts on fish, fish habitat, and other aquatic species. At the provincial level, it is anticipated the project will require multiple Class EAs or individual EAs to develop the miningproject.
The management of the mine waste (tailings and waste rock) also represents a longer term environmental concern. The tailings management facility and waste rock repository will likely assimilate fishbearing ponds and doing so will likely involve additional fish habitat compensation. The next phase of engineering for the Springpole Project will further evaluate alternative mine waste managementareas to avoid impacting water bodies. The environmental risks associated with tailings and waste rock management following operations will be addressed as part of the project’s detailed closure plan.
All potential environmental impacts associated with the Springpole Project can be mitigated through the implementation of accepted engineering practices currently employed throughout Canada’smining industry. A detailed monitoring plan will also be developed to ensure environmental compliance of all components of the mine throughout its construction, operation, closure, and post-closureactivities.
We comply with permit, notice and consultation requirements as they relate to the on-going exploration work on the Springpole Project. Legislation that requires material permits and notices include theprovincial Mining Act, Public Lands Act, Lakes and Rivers Improvement Act, Ontario Water Resources Act, as well as the federal Fisheries Act.
To date, no formal memorandum of understanding agreements have been signed with local First Nations.
Page 44

Capital and Operating Costs
Project costs in the Springpole Technical Report were estimated from a combination of sources including first principles, reference projects, vendor’s quotes, cost service publications and SRKexperience. Costs were considered from the commencement of production forward. Costs incurred prior to this date were considered as “sunk” for the purposes of economic assessment.
The capital cost estimate for the project is shown in the table below at a total of $723M. Contingency of 10% was included for mine capital costs and 13.5% for process plant while a 40% contingency ofdirect capital cost estimates was used for the tailings management facility and other infrastructure. Engineering, procurement, construction and management costs are contained within the underlyingestimates. Property acquisition costs are not included in the capital estimate.
Capital Cost Estimates
*Including 10% contingency on mine, 13.5% on process plant, and 40% infrastructure capital including tailings facility.
A summary of the operating cost estimate by SRK is shown in the table below. The OP mining operating cost assumes owner-operated mining including technical/supervisory support staff. Diesel fuelwas estimated to cost $0.78/L and power was estimated to cost $0.08/kWh.
Operating Cost Estimates
*Troy Ounce of AuEq = total revenue from precious metals divided by gold price per ounce
The economic analysis that forms part of this summary of the Springpole Technical Report is intended to provide an initial review of the Springpole Project’s potential and is preliminary in nature. Theeconomic analysis includes consideration of inferred mineral resources that are considered too speculative geologically to have the economic considerations applied to them that would enable them to becategorized as mineral reserves, and there is no certainty that the preliminary economic assessment based on these mineral resources will be realized. Mineral resources that are not mineral reserves donot have demonstrated economic viability.
Page 45
Item $M
Preconstruction Owners Costs 7
Initial Capital 579
Sustaining Capital 117
Mine Closure 20
*Total Capital Costs 723
ActivityLOM($M)
Per Tonne ofMill Feed ($)
Per Ounce ofAuEq* ($)
Mining including stockpile re-handle 733 5.29 190.00
Processing 1,038 7.49 268.87
Water Management 2 0.01 0.44
Tailings Handling 202 1.47 52.41
G&A 247 1.78 63.90
Total Operating Cost 2,221 16.04 575.62
Treatment and Refining Charges 18 N/A 4.61
Royalty Per Ounce @3% 150 N/A 38.86
Total Cash Costs including Royalty and TCRC 2,389 N/A 619.09

The base case economic analysis results indicate an after-tax net present value of $792M at a 5% discount rate with an IRR of 26.2% . Payback will be in early year four of production in a projectedtwelve-year LOM. The economics are based on a base case of $1,300/oz long-term gold price, $20/oz long-term silver price, and production rate of 36,000 t/d over 365 d/yr. Direct operating costs areestimated to be $619/oz of AuEq. Total capital costs are estimated at $723M, consisting of initial capital costs of $586M, ongoing sustaining capital of $117M and mine closure costs estimated at $20M.
Exploration, Development and Production
There is no on-going exploration taking place on the Springpole Project at this time.
Page 46

Goldlund
Technical report
The Goldlund Property project (the “Goldlund Project”) description is based on the project’s technical report: Technical Report and Resource Estimation Update on the Goldlund Project, Patricia andKenora Mining Division, Ontario (issue date February 7, 2017, effective date September 20, 2016) (the “Goldlund Technical Report”). The report was prepared for us in accordance with NI 43-101,by or under the supervision of Todd McCracken, P.Geo.; a qualified person within the meaning of NI 43-101. The following description has been prepared under the supervision of Dr. Chris Osterman,Ph.D., P.Geo., who is a qualified person within the meaning of NI 43-101, but is not independent of us.
The conclusions, projections and estimates included in this description are subject to the qualifications, assumptions and exclusions set out in the Goldlund Technical Report, except as suchqualifications, assumptions and exclusions may be modified in this AIF. We recommend you read the Goldlund Technical Report in its entirety to fully understand the project. You can download a copyfrom our SEDAR profile (www.sedar.com), or from our website (www.firstmininggold.com).
Project description, location and access
The Goldlund Project is located in northwestern Ontario, approximately 30 km northeast from Dryden and stretches over several townships of the Patricia Mining and Kenora Mining Divisions ofnorthwestern Ontario. The Goldlund Project is centered at 49.900203 north latitude and 92.341103 west longitude (545800E, 5527400N NAD 83 Zone 15) NTS 52F/16.
Access to the Goldlund Project is by Ontario Provincial Highway 72, approximately 60 km from Dryden, or approximately 45 km southwest of Sioux Lookout. A private all-weather gravel road leadsfrom this point to the Goldlund Property. The road into the Goldlund Property would require upgrading to sustain any form of mining operations, but is accessible by two-wheel drive vehicle forexploration. Regularly scheduled passenger air service and charter flights are available to the towns of Dryden and Sioux Lookout.
We have full surface rights on the 27 patents and 1 mining lease (the “Mining Lease”). Surface rights to the remaining claim on the Goldlund Project currently remain with the Crown. The OntarioMining Act (2010) grants surface access to a mineral claim without owning the surface rights, with proper consultation with stakeholders in the area. All claims and patents are registered to our wholly-owned subsidiary Goldlund.
Underlying royalties which affect the Goldlund Property are:
Page 47
• 1% NSR payable to an arm’s length vendor for 36 claims totalling 576 ha;
• 1% NSR payable to Goldlund Mines Limited on any ore mined above 50 m below the existing shaft collar for 6 patented claims and 3 patented claim covered by the Mining Lease.We have a right of first refusal in the event the holder wishes to dispose of its interest in the NSR;
• 2.5% NSR payable to Rio Algom Limited for 21 patented claims. We have the right to purchase the NSR in its entirety for $2,500,000 and a right of first of refusal in the event thatRio wishes to sell the NSR.
• 2% NSR payable to 1074127 Ontario Limited in accordance with industry practice on the sale of all minerals from the property for 13 mining claims. We have right to purchase100% of the NSR at any time for $1,500,000 and a right of first refusal in the event that the holder wishes to sell the NSR.

The Goldlund Project has two historic shafts that have been capped, an underground portal that has been blocked, a small open pit that is partially flooded, a waste rock stockpile, a mineralized materialstockpile, a building housing the original mill on the Goldlund Property, and small tailing containment facility. All have been overgrown with vegetation.
All permits and licenses to conduct exploration work in the Goldlund Project are in place.
History
Exploration of the Goldlund Property dates back to the 1940s. From the late 1940s up until 1988, intermittent exploration was carried out by various companies mainly on five gold bearing zones. Pastwork included shaft sinking, driving a ramp, and underground development, including drifting and crosscuts on four levels.
There was a major period of exploration in the area from 1946 to 1952, in response to the discovery of gold mineralization in the southeastern part of Echo Township. The historic Newlund andWindward gold deposits were discovered during this period.
The Newlund prospect saw extensive underground exploration (4,570 m of drifts and crosscuts, 6,220 m of diamond drilling) through five levels, via a 255 m deep shaft. The first level (200 ft.) of theNewlund/Goldlund workings extends for over 3.2 km, connecting on the west with the 68 m shaft of the Windward prospect, crossing the entire Windward claim block.
Virtually no work was carried out on the Echo Township gold prospects from 1952 to 1973. In 1974, most of the surface facilities were rehabilitated and re-sampled portions of the first and secondlevels. In total, some 151,000 ft. (approximately 46,000 m) of surface drilling has been completed in 506 holes, and more than 60,000 ft. (approximately 18,300 m) of underground drilling has beencompleted in 466 holes.
From mid-1982 to early 1985, an underground mine and an open pit mine was operated on the Goldlund Property and processed material through the mill at the site. Production records have beencompiled that show underground mine production of approximately 100,000 tons (approximately 90,700 t) at an estimated grade of 0.15 oz./ st (approximately 4.23 g/t) gold together with open pitproduction of approximately 43,000 st (approximately 39,000 t), at an estimated grade of 0.17 oz./ st (approximately 4.80 g/t) gold. Plant records show that some 132,000 st (approximately 119,750 t)were processed, with 18,000 oz. of recovered gold.
Geological setting, mineralization and deposit types
The Goldlund Project is situated within a northeasterly-projecting arm of the Wabigoon Sub-province extending from Wabigoon Lake to Sioux Lookout. The area is underlain by sedimentary andvolcanic rocks, numerous intermediate to mafic sub-volcanic intrusive sheets, and intruded by several granitoid stocks. The stratigraphic assemblage has been subdivided into five principal rock groups:
Page 48
• Northern Volcanic Belt;
• Northern Sedimentary Group;
• Central Volcanic Belt;
• Southern Sedimentary Group; and
• Southern Volcanic Belt.

The area has been affected by multiple deformational events resulting in a predominately northeasterly structural fabric. Gold exploration dates back to at least the 1940s with the majority of occurrenceslocated in the Central and Southern Volcanic Belts.
The area is comprised of meta-volcanic and meta-sedimentary rocks intruded by several granitoid stocks and many smaller porphyritic and non-porphyritic bodies. The area has been subjected to at leastfour phases of deformation resulting in a predominantly northeasterly-striking structural grain. Regional and more important local alteration occurred in two pulses; one preceding the earliestdeformation and one coinciding with the late deformation. Quartz veining, gold mineralization, and related alteration are related to the later alteration event.
A 3 km wide belt of Precambrian basaltic volcanic rocks strikes northeast across the Goldlund Project. This basaltic formation is bound by Precambrian sediments to the north and to the south, with awedge of felsic volcanics that occurs between the basalt and sediments to the south of the basalt.
A suite of Leucotonolite to diorite sills (“granodiorite” in mine terminology) have intruded near the contact between the tuffs to the south and the spherulitic lavas to the north. These strata-parallel sillsdip from vertical to -80° southward and range from 14 meter to 60 meter in thickness. A subsidiary suite of sills intrude narrow tuff beds in spherulitic basalt lavas. These strata-parallel intrusions areknown to extend northeastward well beyond the Goldlund Project and south-westward beyond Cross Echo Lake where they re-appear just south of Troutfly Lake. It has been postulated that this series ofintrusions may occur intermittently over a strike-length of 15 km.
The gold mineralization occurs concentrated in quartz filled cross fractures that strike 010° to 015° and dip northwest at -40° to -75°. Historically it is reported that these gold bearing fractures occurconcentrated in zones that extend intermittently at intervals of 200 m to 300 m along the 1.6 km length of the underground workings that has been explored to a vertical depth of 150 m to 200 m on theformer Windfall and Goldlund Property.
Gold mineralization occurs in essentially two types of deposits in the area of the Goldlund Project with the most important gold mineralization being associated with quartz vein and stock-workstructures.
Gold mineralization at the Goldlund Project is hosted by zones of northeast-trending and gently to moderately northwest-dipping quartz stockworks (comprised of numerous quartz veinlets less than 1cm to 20 cm thick). The stockwork zones form bands within the dikes that intrude the east-northeast-trending mafic volcanic country rocks. The quartz veins and veinlets contain occasional fine-grainedto coarse-grained pyrite. The intervening areas between the quartz veinlets exhibit strong to moderate feldspathic alteration associated with common fine to medium-grained pyrite and magnetite.
The mineralized sills strike generally northeast (065°) and dip steeply to the southeast. The quartz stockwork veins generally strike 010° to 015° and dip northwest at -40° to -75°. This results in ashallow rake within the various zones.
Page 49

The identified mineralization fits an Archean shear zone-hosted quartz vein model (“Archean Lode gold”).
The dominant, and economically most significant type, of the shear zone hosted occurrences are transverse vein arrays within competent rocks and particularly the intermediate to mafic sub-volcanicintrusive sheets. Vein systems occupy tensional fractures related to internal deformation of the competent units as folds tightened during stage three deformation. Vein arrays could be expected todevelop near fold hinges, within fold limbs, and along axial planar foliations. The orientations of individual veins within the arrays are affected by their locations within folds.
Exploration
As of the effective date of the Goldlund Technical Report, we had not conducted any surface exploration on the Goldlund Project.
Drilling
As of the effective date of the Goldlund Technical Report, we had not conducted any diamond drilling on the Goldlund Project. All reported diamond drilling completed by Tamaka was done prior toour amalgamation with Tamaka. Tamaka conducted three drilling programmes: 2007 – 2008, 2011 and 2013 – 2014.
The drilling conducted by Tamaka was designed to extend and expand the potential resource of the Goldlund Project by targeting strike and down dip potential of the various mineralized zones as wellas increase the confidence level in the continuity of resource of the Goldlund Project by targeting the known mineralized zones on the Goldlund Project with infill drilling.
The drilling was completed by C3 Drilling of Ithaca, New York and North Star Drilling Ltd. of Thunder Bay. The drilling program was managed independently by geologists employed by FladgateExploration Consulting Corporation (“Fladgate”) based in Thunder Bay and monitored by the Tamaka employees. A total of 24 drillholes were completed during the 2013 and 2014 drill program. Allholes were drilled NQ (47.6 mm) and all drilling runs were in 10 ft. intervals (3 m).
Sampling, analysis and data verification
The following is a description of the sampling methodology for the Tamaka 2007 – 2008 drilling program:
Page 50
• Drillers deliver the four-row NQ or NQ2 core boxes to the core logging facility.
• Core lids are removed and the boxes placed on the core logging table in order.
• A technician measures run lengths to confirm block markers.
• The technician records the rock quality designation (“RQD”) of the core on a computer form.
• Magnetic susceptibility is recorded over the entire hole length at 0.5 m intervals.
• Core is photographed (both wet and dry).
• Logging is completed by the geologist directly into a Microsoft Excel spreadsheet template form. Each drill log is a separate file:
o logs record lithology, structures, alteration and sulphide content;
o all geology related marking on the core use a yellow lumber crayon.
The following is a description of the sampling methodology for the Tamaka 2011 drilling program:
Page 51
• Sample intervals marked with a red lumber crayon on the core.
• Sample lengths are variable, 20 cm minimum sample length, 1.5 m maximum sample length.
• The samples do not cross lithological boundaries:
o quartz veins are isolated if possible as well as zones in increased sulphides or alteration;
o shoulder sample of 1 m are collected on both sides of the mineralized sections;
o due to the nature of the mineralization, and from the onset of drilling, the decision was made by Tamaka staff to collect samples continuously from collar to toe of hole. • Three dedicated technicians were trained on sampling:
o top-mounted core saw with a four-compartment settling tanks to recycle the water;
o a sample interval sheet was generated by the geologist logging the core; the sheet contained the Borehole ID, From, To intervals, and sample number;
o the technician verifies the sample number from the sample sheet with the sample number from pre-printed sample books provided by the laboratory;
o the technician cuts the core and places one half in a plastic sample bag and returns the other half to the core box;
o one sample tag is placed in the sample bag, one sample tag is stapled into the core box at the beginning of the sample interval;
o sample bags with sample and sample tag are sealed with fibre tape.
• Quality assurance and quality control samples are inserted into the sample stream. Standards, blanks, field, and crush duplicates were inserted into the sample series using the samenumber sequence as the samples themselves. A QA/QC sample was inserted every 30 samples and were alternate between crush duplicates, field duplicates, standards, and blanks.Pulp duplicates performed by Accurassay were also incorporated in the program.
• Samples are placed in rice bags and stored in the core logging facility until shipment.
• A Tamaka employee delivers the samples to Manitoulin Transport in Dryden for delivery to Accurassay Laboratories (“Accurassay”) in Thunder Bay. Accurassay is an accreditedfacility, conforming to requirements of CAN P-4E ISO/IEC 17025, and CAN-P-1579.
• The laboratory returned all course rejects and pulps to Tamaka for storage at the Goldlund Project.
• Drill core was delivered by C3 Drilling to the Tamaka core logging facility located on site at the end of every shift.
• Core was put on the core logging tables for logging by the geologist or geological technician.
• A geologist technician checked the block measurements and measures recorded the RQD. Errors in block measurements were reported to the geologists.
• A technician recorded the magnetic susceptibility using a hand-held instrument for each 3 m length of core.
• Certain initial holes were logged into Microsoft Excel spreadsheets and the remainder were logged into a Gemcom© Gemslogger (“Gemslogger”) Microsoft Access database.
• A geologist entered the header information from a planned drillhole spreadsheet.
• A geologist logged the core, recording lithology, alteration, structure, and mineralization in Gemslogger or the spreadsheet and marking the intervals with a grease pen.
• A geologist inserted sample tags for intervals to be sampled, recording these intervals in Gemslogger or the spreadsheet.
• Sample lengths range between 0.2 and 2.6 m in length with an average sampling length of around 0.7 m.
• No samples crossed lithological boundaries.
Page 52
• At least two shoulder samples are taken on either side of the mineralization.
• Sample tags marked with Standard Reference Material (“SRM”), blanks and duplicates were inserted at set intervals by the geologist.
• Core was photographed after logging and sampling was completed; both wet and dry photos were taken.
• Core was then relocated to the core splitting facility.
• A technician then double checked the intervals given in the sample booklet with printed logs from Gemslogger.
• Core was split using a top-mounted diamond saw blade.
• Half of the core was placed in a sample bag while the other half was replaced in the core box.
• Blanks and SRMs were inserted as specified in the sample booklet. Standards, blanks, field, and crush duplicates were inserted into the sample series using the same numbersequence as the samples themselves. A QA/QC sample was inserted every 30 samples and were alternate between crush duplicates, field duplicates, standards, and blanks. Pulpduplicates performed by Accurassay were also incorporated in the program.
• For field duplicates, the remaining half of the core was quarter split and placed in a sample bag.
• For coarse duplicates, a sample tag was placed in an empty sample bag.
• The sample tag was stapled to the inside of the sample bag and the sample bag is stapled closed.
• Sample tags were placed in rice bags and stored in crates awaiting shipment.
• Crates were shipped every week to Accurassay Laboratories in Thunder Bay by Manitoulin Transport.
• Downhole surveys were conducted using a Maxibor instrument while the drill rig was still setup on the drill pad.
• Once the drill rig was moved, collar locations were verified using a hand-held GPS.
• Once all the data is finalized in the field, the field databases/spreadsheets were transferred to the office in Thunder Bay where the master database is stored.
The following is a description of the sampling methodology for the Tamaka 2013-2014 drilling program:
Page 53
• Drillers deliver the four-row NQ or NQ2 core boxes to the core logging facility.
• Core lids are removed and the boxes placed on the core logging table in order.
• A technician measures run lengths to confirm block markers.
• The technician records the rock quality designation (“RQD”) of the core on a computer form.
• Magnetic susceptibility is recorded over the entire hole length at 0.5 m intervals.
• Core is photographed (both wet and dry).
• Logging is completed by the geologist directly into a Microsoft Excel spreadsheet template form.
• Each drill log is a separate file:
o logs record lithology, structures, alteration and sulphide content;
o all geology related markings on the core use a yellow lumber crayon.
• Sample intervals marked with a red lumber crayon on the core. • Sample lengths are variable; 20 cm minimum sample length, 1.5 m maximum sample length.
• The samples do not cross lithological boundaries:
o quartz veins are isolated if possible as well as zones in increased sulphides or alteration;
o shoulder sample of 1 m are collected on both sides of the mineralized sections;
o due to the nature of the mineralization, and from the onset of drilling, the decision was made by Tamaka staff to collect samples continuously from collar to toe of hole.
• Three dedicated technicians were trained on sampling:
o top-mounted core saw with a four-compartment settling tanks to recycle the water;
o a sample interval sheet was generated by the geologist logging the core; the sheet contained the Borehole ID, From, To intervals, and sample number;
o the technician verifies the sample number from the sample sheet with the sample number from pre-printed sample books provided by the laboratory;
o the technician cuts the core and places one half in a plastic sample bag and returns the other half to the core box;
o one sample tag is placed in the sample bag, one sample tag is stapled into the core box at the beginning of the sample interval;
o sample bags with sample and sample tag are sealed with fibre tape;
o quality assurance and quality control samples are inserted into the sample stream. Standards, blanks, field, and crush duplicates were inserted into the sample series usingthe same number sequence as the samples themselves. A QA/QC sample was inserted every 30 samples and were alternate between crush duplicates, field duplicates,standards, and blanks. Pulp duplicates performed by Accurassay were also incorporated in the program. A second aliquot of pulp (from the pulps remaining afterAccurassay analysis) from samples (predetermined by Fladgate) by Accurassay to be shipped to a separate lab for analysis.
All samples for each of the Tamaka drill programs are processed using both jaw crushers and ring mill pulverizers. Samples received by the lab were processed using the following sample preparationpackages:
The 2007 – 2008 samples were analyzed for gold and silver using a four acid digestion followed by a 50 g fire assay (FA) with inductively coupled plasma (“ICP”) finish.
Certain of the 2011 samples were analyzed using a conventional 30 g Fire Assay with an Atomic Absorption finish (“FA/AA”) for gold and a 0.25 aqua regia digestion with an AA finish for silver. Forthe remaining 2011 samples, a 50 g conventional fire assay with an AA finish and a 0.25 aqua regia digestion with an AA finish for silver was performed from the 500 g pulp. A second 500 g pulp wasanalyzed using a gravimetric finish for samples in excess of 10 ppm gold. In total, during the 2011 drill program, 10,914 core samples were sent to the laboratory for analysis.
All 2012 and 2013-2014 samples were analyzed by a 50 g conventional fire assay with an AA finish and a 0.25 aqua regia digestion with an AA finish for silver was performed from the 500 g pulp. Asecond 500 g pulp was analyzed using a gravimetric finish for samples in excess of 10 ppm gold.
Tamaka’s QA/QC for each of its drilling programs was generally consistent. The QA/QC programs consisted of the insertion of blanks, Standard Reference Manual (“SRM”) samples, field duplicates,and crush duplicates into the sample stream at set intervals. SRMs were inserted every 20th sample while blanks were inserted every 27th to 30th sample. Field and crush duplicates were inserted into thesample stream only for the latter portion of the 2011 drilling campaign with a frequency of one field duplicate every 30th sample and one crush duplicate every 32nd sample. In addition to the field-inserted QA/QC program, the laboratories operate their own laboratory QA/QC system. The labs insert quality control materials, blanks and duplicates on each analytical run.
The Tamaka database has gone through several validations. The original data files received prior to the 2010 resource estimate were validated using 103 (10%) of the 1,065 drillholes in the totaldatabase. The validation was completed by the author of the Goldlund Technical Report, while he was employed by Tetra Tech. Data verification was completed on collar co-ordinates, end-of-holedepth, down-the-hole survey measurements, “From” and “To” intervals, measurements of assay sampling intervals, and gold grades that were compiled from hand written drill logs into Microsoft Excelspreadsheets. The error rate of the initial dataset exceeded the acceptable limit of 1% of errors. Most errors were insignificant and related to mistakes in transcription. Tamaka retrieved the dataset fromTetra Tech and corrected the entire dataset before returning the files to Tetra Tech. The second round of validation of the dataset returned no errors.
Page 54
• Samples are placed in rice bags and stored in the core logging facility until shipment.
• A Tamaka employee delivers the samples to Manitoulin Transport in Dryden for delivery to Accurassay in Thunder Bay.
• The laboratory returned all course rejects and pulps to Tamaka for storage at the Goldlund Project.
• Dry, crush (less than 5 kg) 90% -8 mesh (2 mm);
• Split (1,000 g); and
• Pulverize to 90% -150 mesh (106 μ).
2011 and 2012 round of validation – All data is now recorded and received digitally, so it is possible to check 100% of the assay data for Tamaka surface holes against the digital assay certificates.There is 100% agreement between the assay certificates and the assay data in the database. The same is true of collar coordinates, survey data, and lithology intervals.
2013 and 2014 round of validation – All data is now recorded and received digitally, so it is possible to check 100% of the assay data for Tamaka surface holes against the digital assay certificates.There is 100% agreement between the assay certificates and the assay data in the database. The same is true of collar coordinates, survey data, and lithology intervals.
The drillhole data was imported into Surpac 6.6, which has a routine that checks for duplicate intervals, overlapping intervals, and intervals beyond the end of hole. The errors identified in the routinewere checked against the original logs and corrected.
Mineral processing and metallurgical testing
Tamaka received completed results of three metallurgical studies on the Goldlund Property; a gold deportment study, a scoping study including comminution testing, and a review of the acid-baseaccounting completed as part of the scoping study.
Reported overall gold extraction for the high-grade samples by gravity separation, flotation of the gravity tailing, and cyanidation of the flotation concentrate ranged from 55% to 74%. Reported overallgold extraction for bulk testing and composites by gravity separation and cyanidation of the entire gravity tailing ranged from 85% to 96%.
The majority of samples were determined to be not Potential Acid Generating (“PAG”), however two samples did have neutralization potential ratios of less than 1 and sulphide-sulphur greater than12%, indicating that they are PAG. Due to the limited number of samples, these results should be considered preliminary, and further sampling and testing is required to accurately determine whether thetailings would be PAG.
Mineral resource estimates
We compiled all the data used in completing the mineral resource from original source drillhole documents and from plan and section originals and copies. The Goldlund Project has been drilled by1,816 drillholes. However, only drillholes within the areas of interest and with exploration potential were included in the database. In addition to the drillhole database, a dataset containing undergroundwall sampling intervals was included. Wall sampling was conducted as continuous samples on both walls and at times at chest and back heights. The wall sampling data was converted into drillholeformat to supplement the dataset. All resource estimations were conducted using Surpac version 6.6.
A pit shell analysis using a base case of US$1,350 gold price and a cut-off grade of 0.4 g/t Au, provided a pit constrained Indicated gold resource estimate of 9.3 Mt with an average grade of 1.87 g/t andadditional pit constrained Inferred resource of 40.9 Mt with an average grade of 1.33 g/t for the Goldlund Property. Table A summarizes the Whittle pit constrained resource.
Page 55
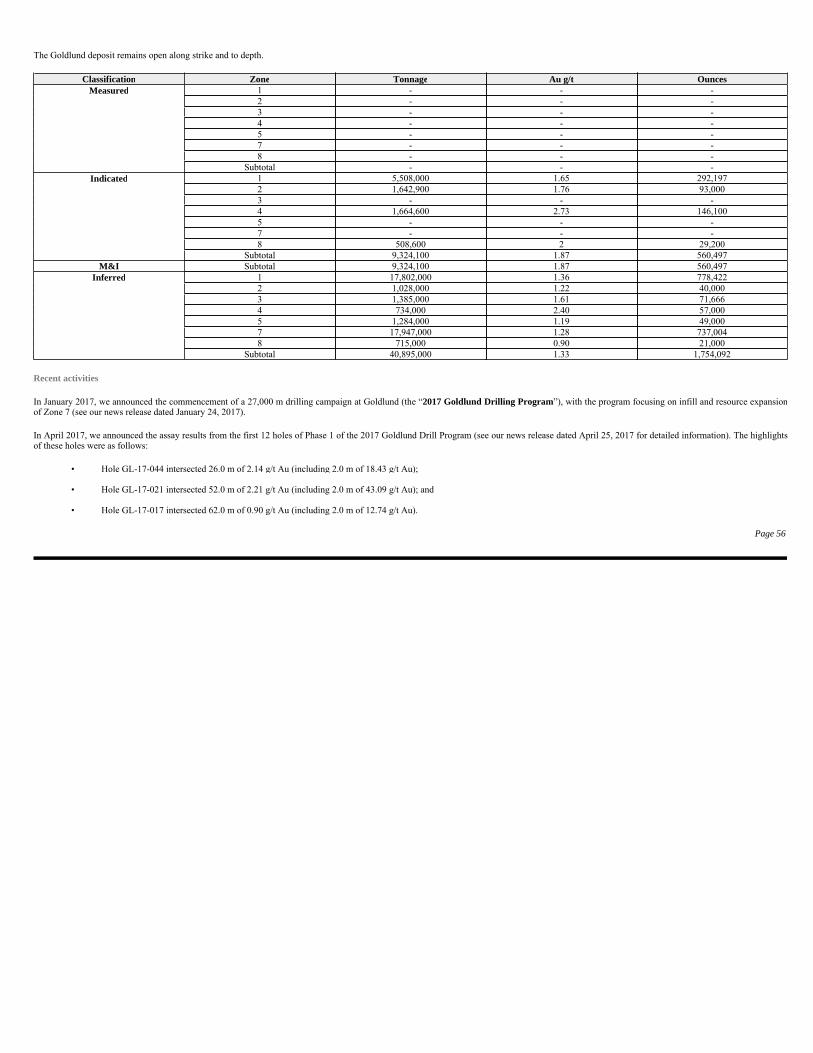
The Goldlund deposit remains open along strike and to depth.
Recent activities
In January 2017, we announced the commencement of a 27,000 m drilling campaign at Goldlund (the “2017 Goldlund Drilling Program”), with the program focusing on infill and resource expansionof Zone 7 (see our news release dated January 24, 2017).
In April 2017, we announced the assay results from the first 12 holes of Phase 1 of the 2017 Goldlund Drill Program (see our news release dated April 25, 2017 for detailed information). The highlightsof these holes were as follows:
Page 56
Classification Zone Tonnage Au g/t OuncesMeasured 1 - - -
2 - - -3 - - -4 - - -5 - - -7 - - -8 - - -
Subtotal - - -Indicated 1 5,508,000 1.65 292,197
2 1,642,900 1.76 93,000 3 - - -4 1,664,600 2.73 146,100 5 - - -7 - - -8 508,600 2 29,200
Subtotal 9,324,100 1.87 560,497 M&I Subtotal 9,324,100 1.87 560,497
Inferred 1 17,802,000 1.36 778,422 2 1,028,000 1.22 40,000 3 1,385,000 1.61 71,666 4 734,000 2.40 57,000 5 1,284,000 1.19 49,000 7 17,947,000 1.28 737,004 8 715,000 0.90 21,000
Subtotal 40,895,000 1.33 1,754,092
• Hole GL-17-044 intersected 26.0 m of 2.14 g/t Au (including 2.0 m of 18.43 g/t Au);
• Hole GL-17-021 intersected 52.0 m of 2.21 g/t Au (including 2.0 m of 43.09 g/t Au); and
• Hole GL-17-017 intersected 62.0 m of 0.90 g/t Au (including 2.0 m of 12.74 g/t Au).
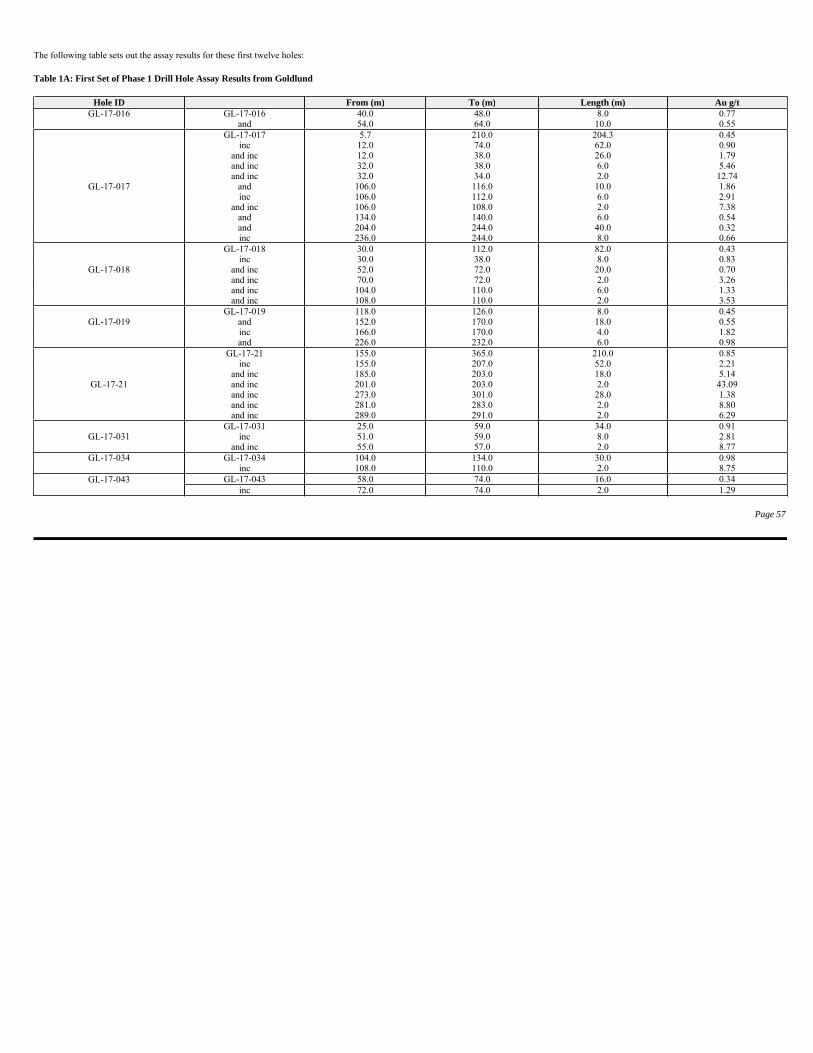
The following table sets out the assay results for these first twelve holes:
Table 1A: First Set of Phase 1 Drill Hole Assay Results from Goldlund
Page 57
Hole ID From (m) To (m) Length (m) Au g/tGL-17-016 GL-17-016 40.0 48.0 8.0 0.77
and 54.0 64.0 10.0 0.55 GL-17-017 5.7 210.0 204.3 0.45
inc 12.0 74.0 62.0 0.90 and inc 12.0 38.0 26.0 1.79 and inc 32.0 38.0 6.0 5.46 and inc 32.0 34.0 2.0 12.74
GL-17-017 and 106.0 116.0 10.0 1.86 inc 106.0 112.0 6.0 2.91
and inc 106.0 108.0 2.0 7.38 and 134.0 140.0 6.0 0.54 and 204.0 244.0 40.0 0.32 inc 236.0 244.0 8.0 0.66
GL-17-018 30.0 112.0 82.0 0.43 inc 30.0 38.0 8.0 0.83
GL-17-018 and inc 52.0 72.0 20.0 0.70 and inc 70.0 72.0 2.0 3.26 and inc 104.0 110.0 6.0 1.33 and inc 108.0 110.0 2.0 3.53
GL-17-019 118.0 126.0 8.0 0.45 GL-17-019 and 152.0 170.0 18.0 0.55
inc 166.0 170.0 4.0 1.82 and 226.0 232.0 6.0 0.98
GL-17-21 155.0 365.0 210.0 0.85 inc 155.0 207.0 52.0 2.21
and inc 185.0 203.0 18.0 5.14 GL-17-21 and inc 201.0 203.0 2.0 43.09
and inc 273.0 301.0 28.0 1.38 and inc 281.0 283.0 2.0 8.80 and inc 289.0 291.0 2.0 6.29
GL-17-031 25.0 59.0 34.0 0.91 GL-17-031 inc 51.0 59.0 8.0 2.81
and inc 55.0 57.0 2.0 8.77 GL-17-034 GL-17-034 104.0 134.0 30.0 0.98
inc 108.0 110.0 2.0 8.75 GL-17-043 GL-17-043 58.0 74.0 16.0 0.34
inc 72.0 74.0 2.0 1.29
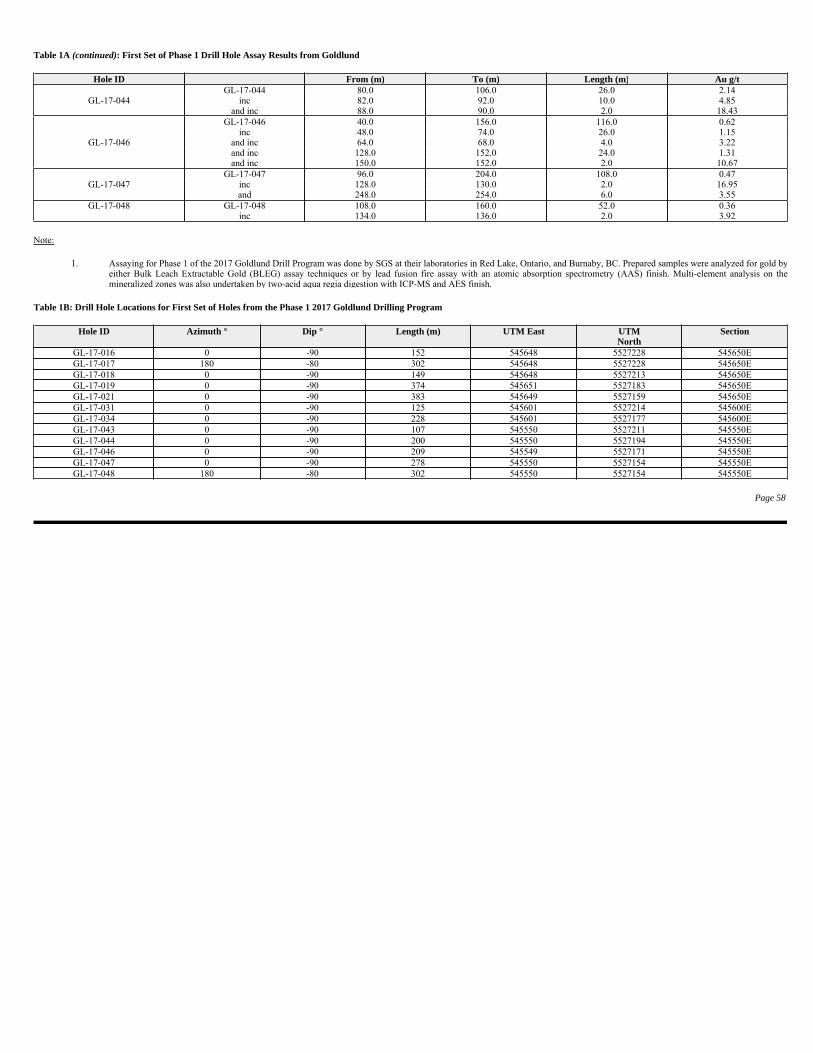
Table 1A (continued): First Set of Phase 1 Drill Hole Assay Results from Goldlund
Note:
Table 1B: Drill Hole Locations for First Set of Holes from the Phase 1 2017 Goldlund Drilling Program
Page 58
Hole ID From (m) To (m) Length (m) Au g/tGL-17-044 80.0 106.0 26.0 2.14
GL-17-044 inc 82.0 92.0 10.0 4.85 and inc 88.0 90.0 2.0 18.43
GL-17-046 40.0 156.0 116.0 0.62 inc 48.0 74.0 26.0 1.15
GL-17-046 and inc 64.0 68.0 4.0 3.22 and inc 128.0 152.0 24.0 1.31 and inc 150.0 152.0 2.0 10.67
GL-17-047 96.0 204.0 108.0 0.47 GL-17-047 inc 128.0 130.0 2.0 16.95
and 248.0 254.0 6.0 3.55 GL-17-048 GL-17-048 108.0 160.0 52.0 0.36
inc 134.0 136.0 2.0 3.92
1. Assaying for Phase 1 of the 2017 Goldlund Drill Program was done by SGS at their laboratories in Red Lake, Ontario, and Burnaby, BC. Prepared samples were analyzed for gold byeither Bulk Leach Extractable Gold (BLEG) assay techniques or by lead fusion fire assay with an atomic absorption spectrometry (AAS) finish. Multi-element analysis on themineralized zones was also undertaken by two-acid aqua regia digestion with ICP-MS and AES finish.
Hole ID Azimuth ° Dip ° Length (m) UTM East UTMNorth
Section
GL-17-016 0 -90 152 545648 5527228 545650E GL-17-017 180 -80 302 545648 5527228 545650E GL-17-018 0 -90 149 545648 5527213 545650E GL-17-019 0 -90 374 545651 5527183 545650E GL-17-021 0 -90 383 545649 5527159 545650E GL-17-031 0 -90 125 545601 5527214 545600E GL-17-034 0 -90 228 545601 5527177 545600E GL-17-043 0 -90 107 545550 5527211 545550E GL-17-044 0 -90 200 545550 5527194 545550E GL-17-046 0 -90 209 545549 5527171 545550E GL-17-047 0 -90 278 545550 5527154 545550E GL-17-048 180 -80 302 545550 5527154 545550E
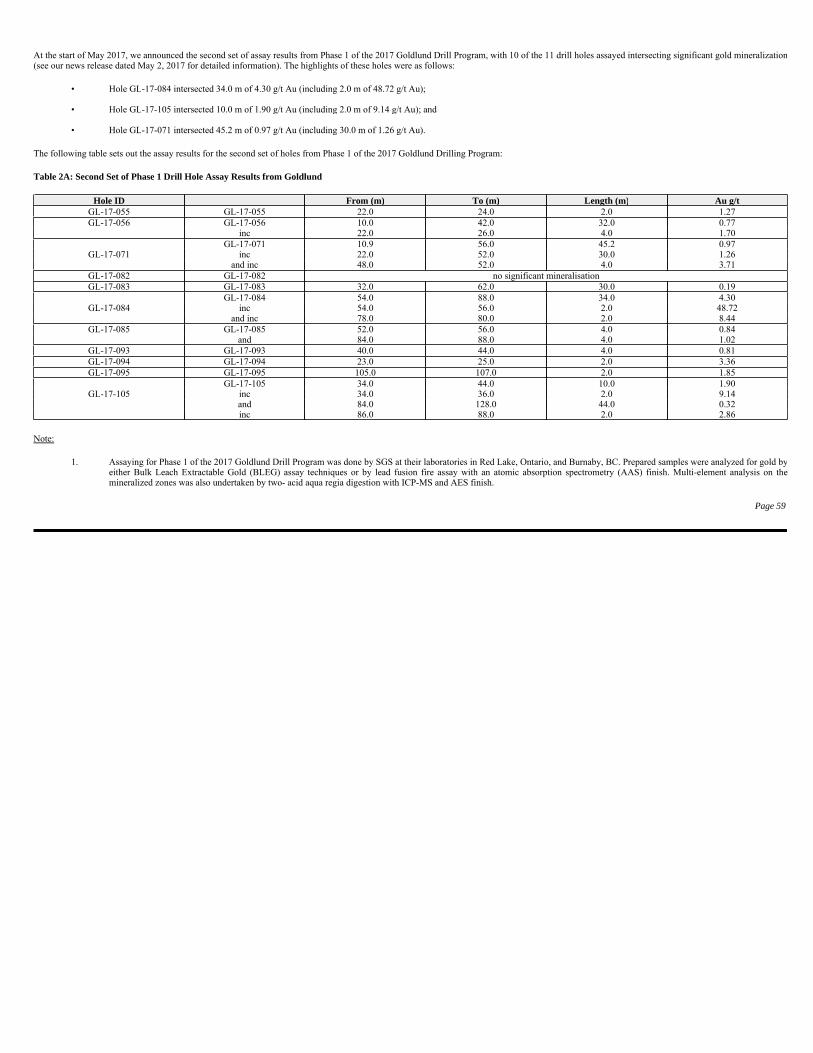
At the start of May 2017, we announced the second set of assay results from Phase 1 of the 2017 Goldlund Drill Program, with 10 of the 11 drill holes assayed intersecting significant gold mineralization(see our news release dated May 2, 2017 for detailed information). The highlights of these holes were as follows:
The following table sets out the assay results for the second set of holes from Phase 1 of the 2017 Goldlund Drilling Program:
Table 2A: Second Set of Phase 1 Drill Hole Assay Results from Goldlund
Note:
Page 59
• Hole GL-17-084 intersected 34.0 m of 4.30 g/t Au (including 2.0 m of 48.72 g/t Au);
• Hole GL-17-105 intersected 10.0 m of 1.90 g/t Au (including 2.0 m of 9.14 g/t Au); and
• Hole GL-17-071 intersected 45.2 m of 0.97 g/t Au (including 30.0 m of 1.26 g/t Au).
Hole ID From (m) To (m) Length (m) Au g/tGL-17-055 GL-17-055 22.0 24.0 2.0 1.27 GL-17-056 GL-17-056 10.0 42.0 32.0 0.77
inc 22.0 26.0 4.0 1.70 GL-17-071 10.9 56.0 45.2 0.97
GL-17-071 inc 22.0 52.0 30.0 1.26 and inc 48.0 52.0 4.0 3.71
GL-17-082 GL-17-082 no significant mineralisation GL-17-083 GL-17-083 32.0 62.0 30.0 0.19
GL-17-084 54.0 88.0 34.0 4.30 GL-17-084 inc 54.0 56.0 2.0 48.72
and inc 78.0 80.0 2.0 8.44 GL-17-085 GL-17-085 52.0 56.0 4.0 0.84
and 84.0 88.0 4.0 1.02 GL-17-093 GL-17-093 40.0 44.0 4.0 0.81 GL-17-094 GL-17-094 23.0 25.0 2.0 3.36 GL-17-095 GL-17-095 105.0 107.0 2.0 1.85
GL-17-105 34.0 44.0 10.0 1.90 GL-17-105 inc 34.0 36.0 2.0 9.14
and 84.0 128.0 44.0 0.32 inc 86.0 88.0 2.0 2.86
1. Assaying for Phase 1 of the 2017 Goldlund Drill Program was done by SGS at their laboratories in Red Lake, Ontario, and Burnaby, BC. Prepared samples were analyzed for gold byeither Bulk Leach Extractable Gold (BLEG) assay techniques or by lead fusion fire assay with an atomic absorption spectrometry (AAS) finish. Multi-element analysis on themineralized zones was also undertaken by two- acid aqua regia digestion with ICP-MS and AES finish.
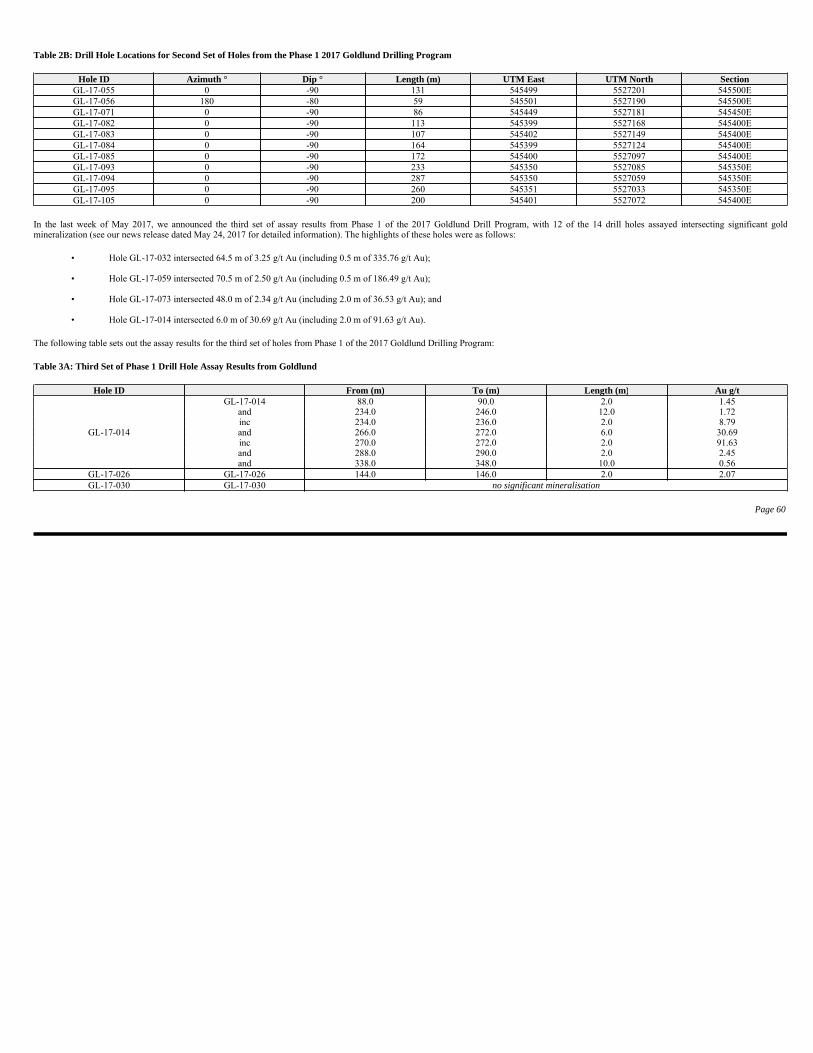
Table 2B: Drill Hole Locations for Second Set of Holes from the Phase 1 2017 Goldlund Drilling Program
In the last week of May 2017, we announced the third set of assay results from Phase 1 of the 2017 Goldlund Drill Program, with 12 of the 14 drill holes assayed intersecting significant goldmineralization (see our news release dated May 24, 2017 for detailed information). The highlights of these holes were as follows:
The following table sets out the assay results for the third set of holes from Phase 1 of the 2017 Goldlund Drilling Program:
Table 3A: Third Set of Phase 1 Drill Hole Assay Results from Goldlund
Page 60
Hole ID Azimuth ° Dip ° Length (m) UTM East UTM North SectionGL-17-055 0 -90 131 545499 5527201 545500E GL-17-056 180 -80 59 545501 5527190 545500E GL-17-071 0 -90 86 545449 5527181 545450E GL-17-082 0 -90 113 545399 5527168 545400E GL-17-083 0 -90 107 545402 5527149 545400E GL-17-084 0 -90 164 545399 5527124 545400E GL-17-085 0 -90 172 545400 5527097 545400E GL-17-093 0 -90 233 545350 5527085 545350E GL-17-094 0 -90 287 545350 5527059 545350E GL-17-095 0 -90 260 545351 5527033 545350E GL-17-105 0 -90 200 545401 5527072 545400E
• Hole GL-17-032 intersected 64.5 m of 3.25 g/t Au (including 0.5 m of 335.76 g/t Au);
• Hole GL-17-059 intersected 70.5 m of 2.50 g/t Au (including 0.5 m of 186.49 g/t Au);
• Hole GL-17-073 intersected 48.0 m of 2.34 g/t Au (including 2.0 m of 36.53 g/t Au); and
• Hole GL-17-014 intersected 6.0 m of 30.69 g/t Au (including 2.0 m of 91.63 g/t Au).
Hole ID From (m) To (m) Length (m) Au g/tGL-17-014 88.0 90.0 2.0 1.45
and 234.0 246.0 12.0 1.72 inc 234.0 236.0 2.0 8.79
GL-17-014 and 266.0 272.0 6.0 30.69 inc 270.0 272.0 2.0 91.63 and 288.0 290.0 2.0 2.45 and 338.0 348.0 10.0 0.56
GL-17-026 GL-17-026 144.0 146.0 2.0 2.07 GL-17-030 GL-17-030 no significant mineralisation
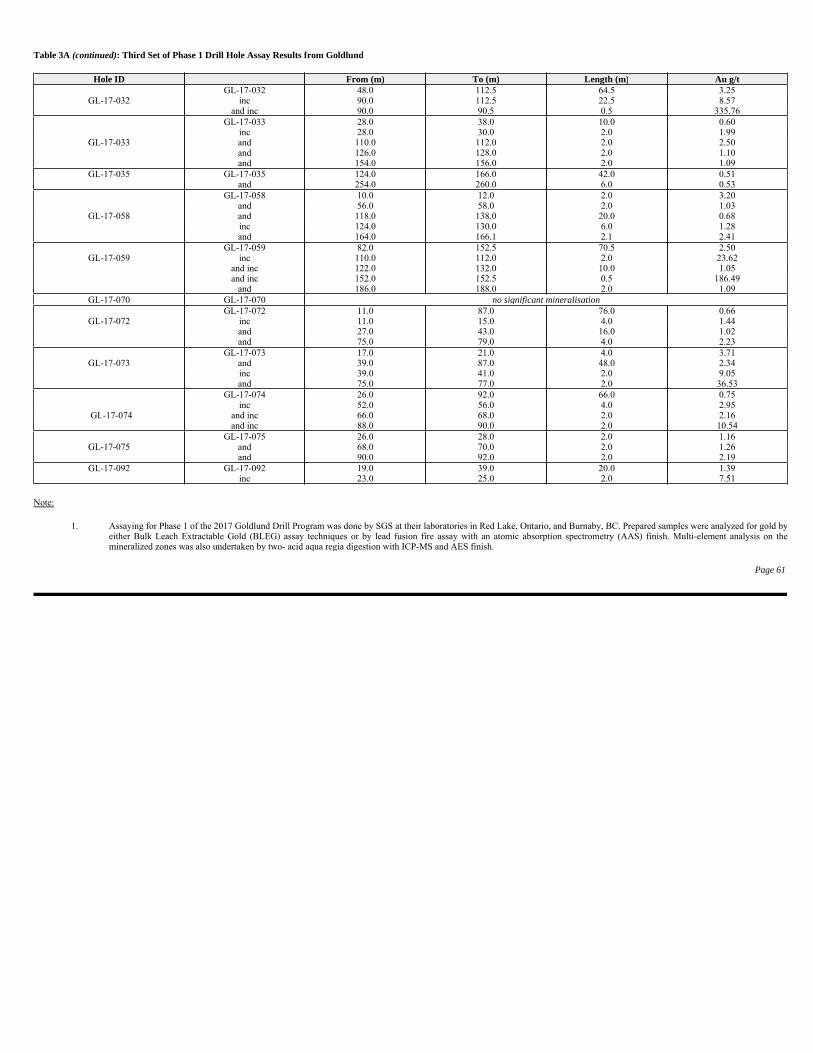
Table 3A (continued): Third Set of Phase 1 Drill Hole Assay Results from Goldlund
Note:
Page 61
Hole ID From (m) To (m) Length (m) Au g/tGL-17-032 48.0 112.5 64.5 3.25
GL-17-032 inc 90.0 112.5 22.5 8.57 and inc 90.0 90.5 0.5 335.76
GL-17-033 28.0 38.0 10.0 0.60 inc 28.0 30.0 2.0 1.99
GL-17-033 and 110.0 112.0 2.0 2.50 and 126.0 128.0 2.0 1.10 and 154.0 156.0 2.0 1.09
GL-17-035 GL-17-035 124.0 166.0 42.0 0.51 and 254.0 260.0 6.0 0.53
GL-17-058 10.0 12.0 2.0 3.20 and 56.0 58.0 2.0 1.03
GL-17-058 and 118.0 138.0 20.0 0.68 inc 124.0 130.0 6.0 1.28 and 164.0 166.1 2.1 2.41
GL-17-059 82.0 152.5 70.5 2.50 GL-17-059 inc 110.0 112.0 2.0 23.62
and inc 122.0 132.0 10.0 1.05 and inc 152.0 152.5 0.5 186.49
and 186.0 188.0 2.0 1.09 GL-17-070 GL-17-070 no significant mineralisation
GL-17-072 11.0 87.0 76.0 0.66 GL-17-072 inc 11.0 15.0 4.0 1.44
and 27.0 43.0 16.0 1.02 and 75.0 79.0 4.0 2.23
GL-17-073 17.0 21.0 4.0 3.71 GL-17-073 and 39.0 87.0 48.0 2.34
inc 39.0 41.0 2.0 9.05 and 75.0 77.0 2.0 36.53
GL-17-074 26.0 92.0 66.0 0.75 inc 52.0 56.0 4.0 2.95
GL-17-074 and inc 66.0 68.0 2.0 2.16 and inc 88.0 90.0 2.0 10.54
GL-17-075 26.0 28.0 2.0 1.16 GL-17-075 and 68.0 70.0 2.0 1.26
and 90.0 92.0 2.0 2.19 GL-17-092 GL-17-092 19.0 39.0 20.0 1.39
inc 23.0 25.0 2.0 7.51
1. Assaying for Phase 1 of the 2017 Goldlund Drill Program was done by SGS at their laboratories in Red Lake, Ontario, and Burnaby, BC. Prepared samples were analyzed for gold byeither Bulk Leach Extractable Gold (BLEG) assay techniques or by lead fusion fire assay with an atomic absorption spectrometry (AAS) finish. Multi-element analysis on themineralized zones was also undertaken by two- acid aqua regia digestion with ICP-MS and AES finish.
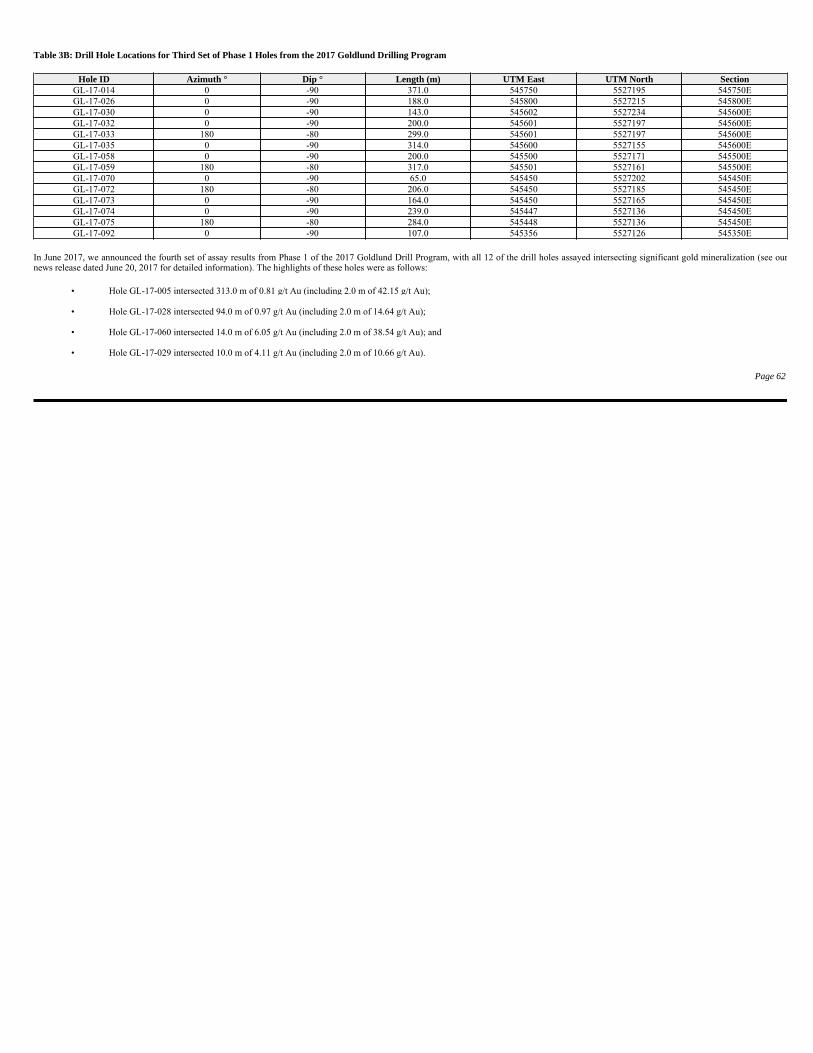
Table 3B: Drill Hole Locations for Third Set of Phase 1 Holes from the 2017 Goldlund Drilling Program
In June 2017, we announced the fourth set of assay results from Phase 1 of the 2017 Goldlund Drill Program, with all 12 of the drill holes assayed intersecting significant gold mineralization (see ournews release dated June 20, 2017 for detailed information). The highlights of these holes were as follows:
Page 62
Hole ID Azimuth ° Dip ° Length (m) UTM East UTM North SectionGL-17-014 0 -90 371.0 545750 5527195 545750E GL-17-026 0 -90 188.0 545800 5527215 545800E GL-17-030 0 -90 143.0 545602 5527234 545600E GL-17-032 0 -90 200.0 545601 5527197 545600E GL-17-033 180 -80 299.0 545601 5527197 545600E GL-17-035 0 -90 314.0 545600 5527155 545600E GL-17-058 0 -90 200.0 545500 5527171 545500E GL-17-059 180 -80 317.0 545501 5527161 545500E GL-17-070 0 -90 65.0 545450 5527202 545450E GL-17-072 180 -80 206.0 545450 5527185 545450E GL-17-073 0 -90 164.0 545450 5527165 545450E GL-17-074 0 -90 239.0 545447 5527136 545450E GL-17-075 180 -80 284.0 545448 5527136 545450E GL-17-092 0 -90 107.0 545356 5527126 545350E
• Hole GL-17-005 intersected 313.0 m of 0.81 g/t Au (including 2.0 m of 42.15 g/t Au);
• Hole GL-17-028 intersected 94.0 m of 0.97 g/t Au (including 2.0 m of 14.64 g/t Au);
• Hole GL-17-060 intersected 14.0 m of 6.05 g/t Au (including 2.0 m of 38.54 g/t Au); and
• Hole GL-17-029 intersected 10.0 m of 4.11 g/t Au (including 2.0 m of 10.66 g/t Au).
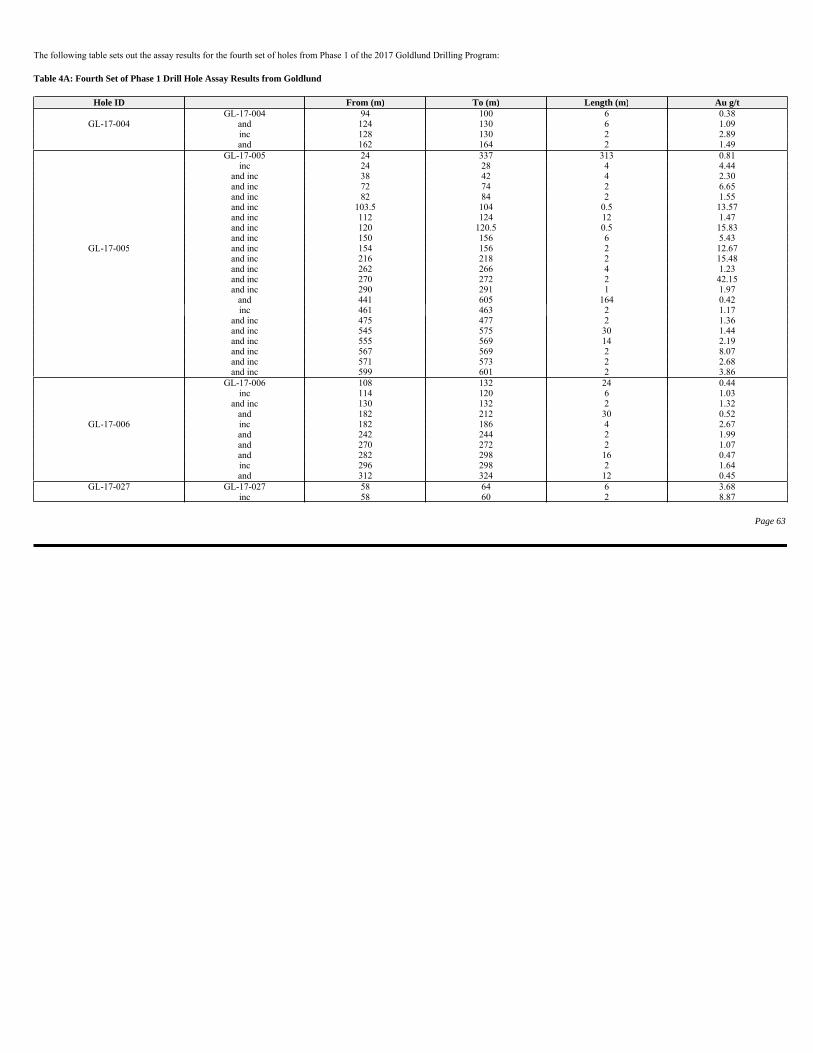
The following table sets out the assay results for the fourth set of holes from Phase 1 of the 2017 Goldlund Drilling Program:
Table 4A: Fourth Set of Phase 1 Drill Hole Assay Results from Goldlund
Page 63
Hole ID From (m) To (m) Length (m) Au g/tGL-17-004 94 100 6 0.38
GL-17-004 and 124 130 6 1.09 inc 128 130 2 2.89 and 162 164 2 1.49
GL-17-005 24 337 313 0.81 inc 24 28 4 4.44
and inc 38 42 4 2.30 and inc 72 74 2 6.65 and inc 82 84 2 1.55 and inc 103.5 104 0.5 13.57 and inc 112 124 12 1.47 and inc 120 120.5 0.5 15.83 and inc 150 156 6 5.43
GL-17-005 and inc 154 156 2 12.67 and inc 216 218 2 15.48 and inc 262 266 4 1.23 and inc 270 272 2 42.15 and inc 290 291 1 1.97
and 441 605 164 0.42 inc 461 463 2 1.17
and inc 475 477 2 1.36 and inc 545 575 30 1.44 and inc 555 569 14 2.19 and inc 567 569 2 8.07 and inc 571 573 2 2.68 and inc 599 601 2 3.86
GL-17-006 108 132 24 0.44 inc 114 120 6 1.03
and inc 130 132 2 1.32 and 182 212 30 0.52
GL-17-006 inc 182 186 4 2.67 and 242 244 2 1.99 and 270 272 2 1.07 and 282 298 16 0.47 inc 296 298 2 1.64 and 312 324 12 0.45
GL-17-027 GL-17-027 58 64 6 3.68 inc 58 60 2 8.87
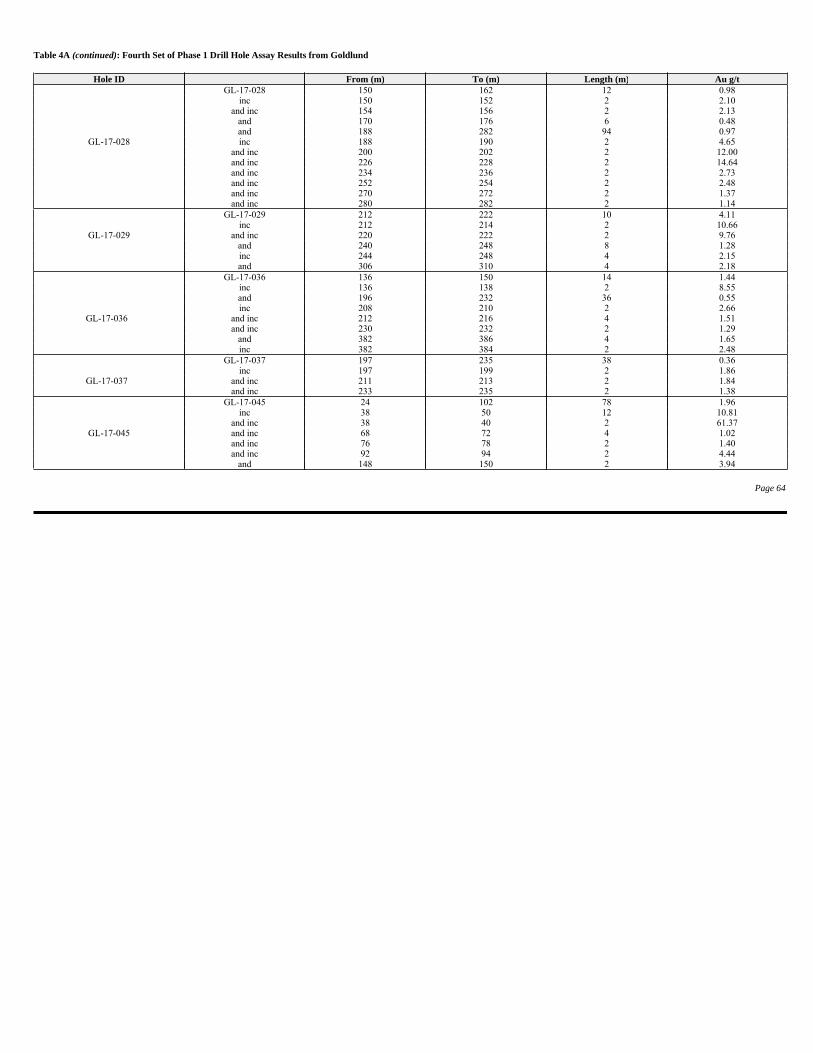
Table 4A (continued): Fourth Set of Phase 1 Drill Hole Assay Results from Goldlund
Page 64
Hole ID From (m) To (m) Length (m) Au g/tGL-17-028 150 162 12 0.98
inc 150 152 2 2.10 and inc 154 156 2 2.13
and 170 176 6 0.48 and 188 282 94 0.97
GL-17-028 inc 188 190 2 4.65 and inc 200 202 2 12.00 and inc 226 228 2 14.64 and inc 234 236 2 2.73 and inc 252 254 2 2.48 and inc 270 272 2 1.37 and inc 280 282 2 1.14
GL-17-029 212 222 10 4.11 inc 212 214 2 10.66
GL-17-029 and inc 220 222 2 9.76 and 240 248 8 1.28 inc 244 248 4 2.15 and 306 310 4 2.18
GL-17-036 136 150 14 1.44 inc 136 138 2 8.55 and 196 232 36 0.55 inc 208 210 2 2.66
GL-17-036 and inc 212 216 4 1.51 and inc 230 232 2 1.29
and 382 386 4 1.65 inc 382 384 2 2.48
GL-17-037 197 235 38 0.36 inc 197 199 2 1.86
GL-17-037 and inc 211 213 2 1.84 and inc 233 235 2 1.38
GL-17-045 24 102 78 1.96 inc 38 50 12 10.81
and inc 38 40 2 61.37 GL-17-045 and inc 68 72 4 1.02
and inc 76 78 2 1.40 and inc 92 94 2 4.44
and 148 150 2 3.94
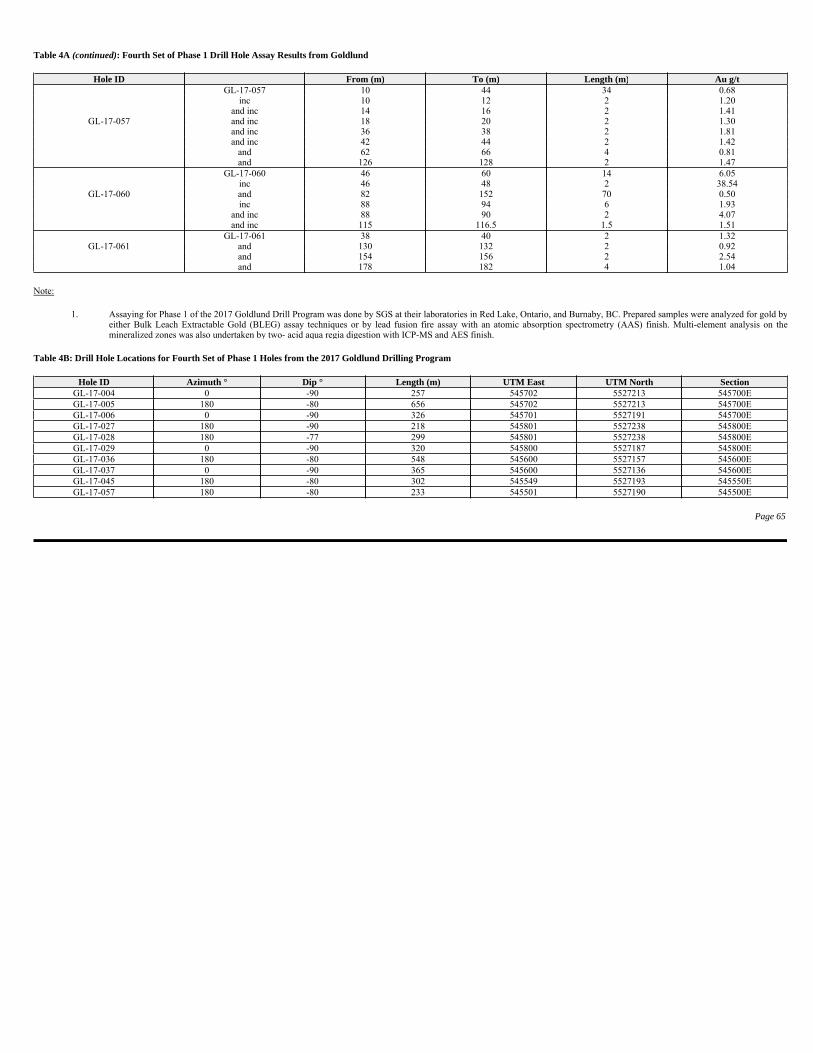
Table 4A (continued): Fourth Set of Phase 1 Drill Hole Assay Results from Goldlund
Note:
Table 4B: Drill Hole Locations for Fourth Set of Phase 1 Holes from the 2017 Goldlund Drilling Program
Page 65
Hole ID From (m) To (m) Length (m) Au g/tGL-17-057 10 44 34 0.68
inc 10 12 2 1.20 and inc 14 16 2 1.41
GL-17-057 and inc 18 20 2 1.30 and inc 36 38 2 1.81 and inc 42 44 2 1.42
and 62 66 4 0.81 and 126 128 2 1.47
GL-17-060 46 60 14 6.05 inc 46 48 2 38.54
GL-17-060 and 82 152 70 0.50 inc 88 94 6 1.93
and inc 88 90 2 4.07 and inc 115 116.5 1.5 1.51
GL-17-061 38 40 2 1.32 GL-17-061 and 130 132 2 0.92
and 154 156 2 2.54 and 178 182 4 1.04
1. Assaying for Phase 1 of the 2017 Goldlund Drill Program was done by SGS at their laboratories in Red Lake, Ontario, and Burnaby, BC. Prepared samples were analyzed for gold byeither Bulk Leach Extractable Gold (BLEG) assay techniques or by lead fusion fire assay with an atomic absorption spectrometry (AAS) finish. Multi-element analysis on themineralized zones was also undertaken by two- acid aqua regia digestion with ICP-MS and AES finish.
Hole ID Azimuth ° Dip ° Length (m) UTM East UTM North SectionGL-17-004 0 -90 257 545702 5527213 545700E GL-17-005 180 -80 656 545702 5527213 545700E GL-17-006 0 -90 326 545701 5527191 545700E GL-17-027 180 -90 218 545801 5527238 545800E GL-17-028 180 -77 299 545801 5527238 545800E GL-17-029 0 -90 320 545800 5527187 545800E GL-17-036 180 -80 548 545600 5527157 545600E GL-17-037 0 -90 365 545600 5527136 545600E GL-17-045 180 -80 302 545549 5527193 545550E GL-17-057 180 -80 233 545501 5527190 545500E
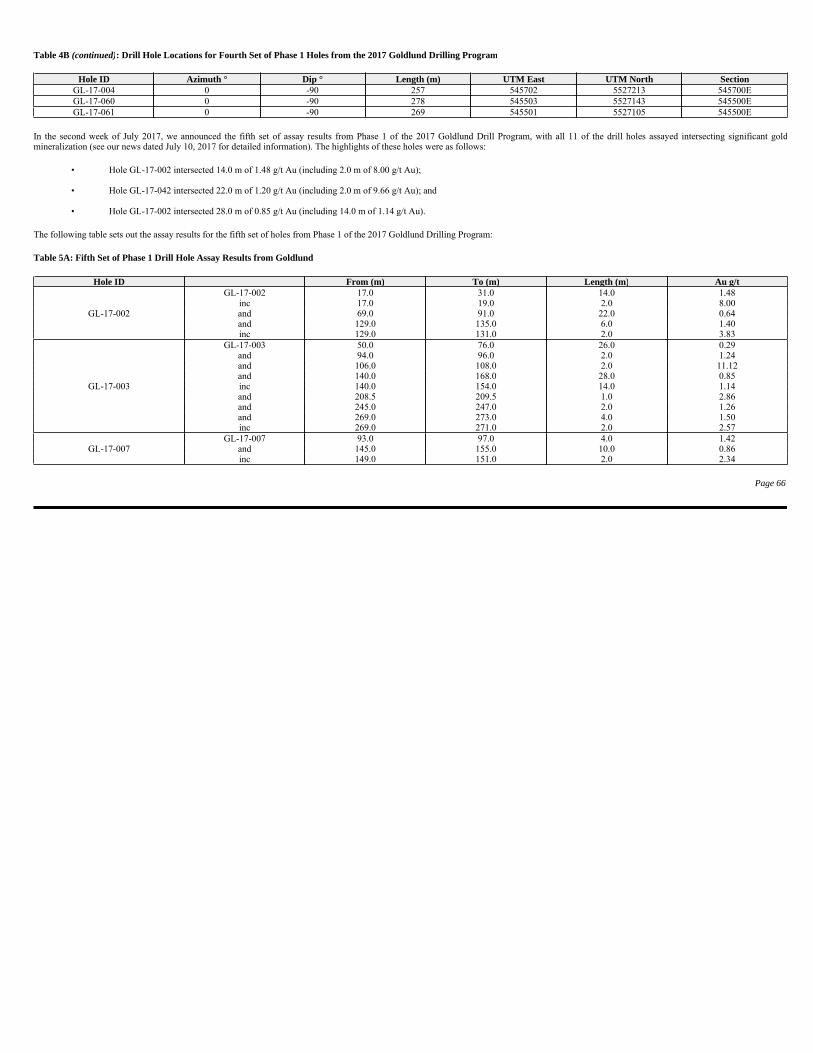
Table 4B (continued): Drill Hole Locations for Fourth Set of Phase 1 Holes from the 2017 Goldlund Drilling Program
In the second week of July 2017, we announced the fifth set of assay results from Phase 1 of the 2017 Goldlund Drill Program, with all 11 of the drill holes assayed intersecting significant goldmineralization (see our news dated July 10, 2017 for detailed information). The highlights of these holes were as follows:
The following table sets out the assay results for the fifth set of holes from Phase 1 of the 2017 Goldlund Drilling Program:
Table 5A: Fifth Set of Phase 1 Drill Hole Assay Results from Goldlund
Page 66
Hole ID Azimuth ° Dip ° Length (m) UTM East UTM North SectionGL-17-004 0 -90 257 545702 5527213 545700E GL-17-060 0 -90 278 545503 5527143 545500E GL-17-061 0 -90 269 545501 5527105 545500E
• Hole GL-17-002 intersected 14.0 m of 1.48 g/t Au (including 2.0 m of 8.00 g/t Au);
• Hole GL-17-042 intersected 22.0 m of 1.20 g/t Au (including 2.0 m of 9.66 g/t Au); and
• Hole GL-17-002 intersected 28.0 m of 0.85 g/t Au (including 14.0 m of 1.14 g/t Au).
Hole ID From (m) To (m) Length (m) Au g/tGL-17-002 17.0 31.0 14.0 1.48
inc 17.0 19.0 2.0 8.00 GL-17-002 and 69.0 91.0 22.0 0.64
and 129.0 135.0 6.0 1.40 inc 129.0 131.0 2.0 3.83
GL-17-003 50.0 76.0 26.0 0.29 and 94.0 96.0 2.0 1.24 and 106.0 108.0 2.0 11.12 and 140.0 168.0 28.0 0.85
GL-17-003 inc 140.0 154.0 14.0 1.14 and 208.5 209.5 1.0 2.86 and 245.0 247.0 2.0 1.26 and 269.0 273.0 4.0 1.50 inc 269.0 271.0 2.0 2.57
GL-17-007 93.0 97.0 4.0 1.42 GL-17-007 and 145.0 155.0 10.0 0.86
inc 149.0 151.0 2.0 2.34
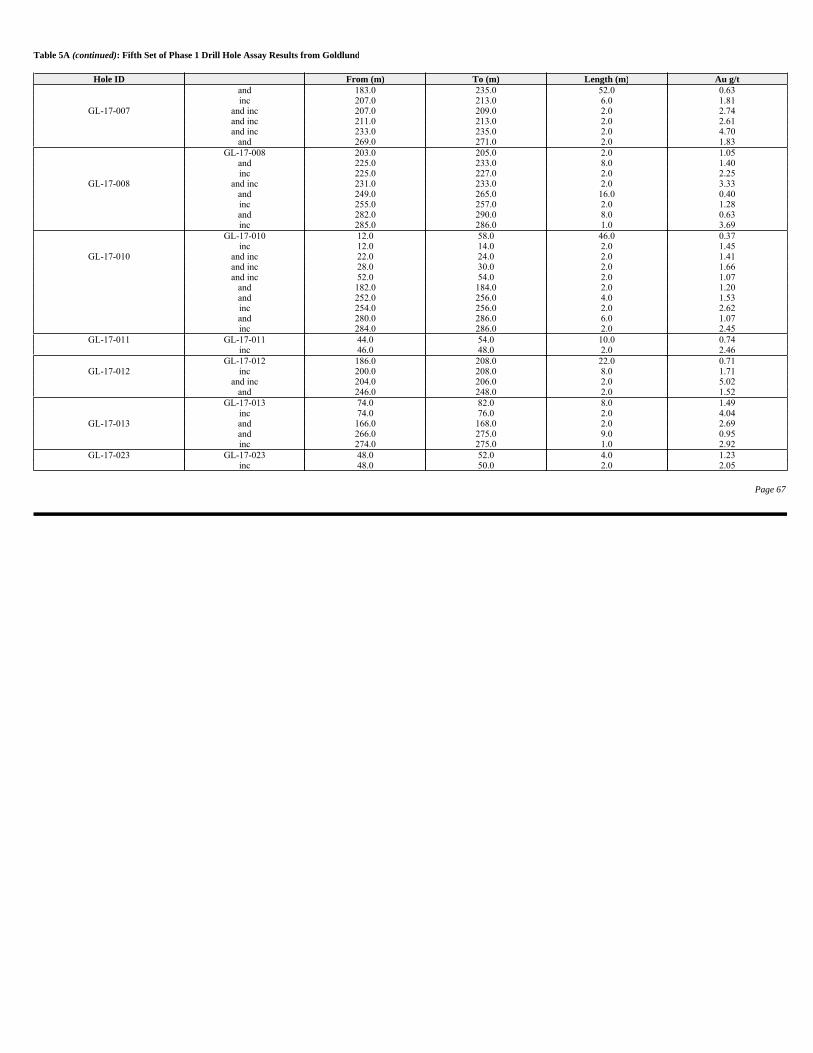
Table 5A (continued): Fifth Set of Phase 1 Drill Hole Assay Results from Goldlund
Page 67
Hole ID From (m) To (m) Length (m) Au g/tand 183.0 235.0 52.0 0.63 inc 207.0 213.0 6.0 1.81
GL-17-007 and inc 207.0 209.0 2.0 2.74 and inc 211.0 213.0 2.0 2.61 and inc 233.0 235.0 2.0 4.70
and 269.0 271.0 2.0 1.83 GL-17-008 203.0 205.0 2.0 1.05
and 225.0 233.0 8.0 1.40 inc 225.0 227.0 2.0 2.25
GL-17-008 and inc 231.0 233.0 2.0 3.33 and 249.0 265.0 16.0 0.40 inc 255.0 257.0 2.0 1.28 and 282.0 290.0 8.0 0.63 inc 285.0 286.0 1.0 3.69
GL-17-010 12.0 58.0 46.0 0.37 inc 12.0 14.0 2.0 1.45
GL-17-010 and inc 22.0 24.0 2.0 1.41 and inc 28.0 30.0 2.0 1.66 and inc 52.0 54.0 2.0 1.07
and 182.0 184.0 2.0 1.20 and 252.0 256.0 4.0 1.53 inc 254.0 256.0 2.0 2.62 and 280.0 286.0 6.0 1.07 inc 284.0 286.0 2.0 2.45
GL-17-011 GL-17-011 44.0 54.0 10.0 0.74 inc 46.0 48.0 2.0 2.46
GL-17-012 186.0 208.0 22.0 0.71 GL-17-012 inc 200.0 208.0 8.0 1.71
and inc 204.0 206.0 2.0 5.02 and 246.0 248.0 2.0 1.52
GL-17-013 74.0 82.0 8.0 1.49 inc 74.0 76.0 2.0 4.04
GL-17-013 and 166.0 168.0 2.0 2.69 and 266.0 275.0 9.0 0.95 inc 274.0 275.0 1.0 2.92
GL-17-023 GL-17-023 48.0 52.0 4.0 1.23 inc 48.0 50.0 2.0 2.05
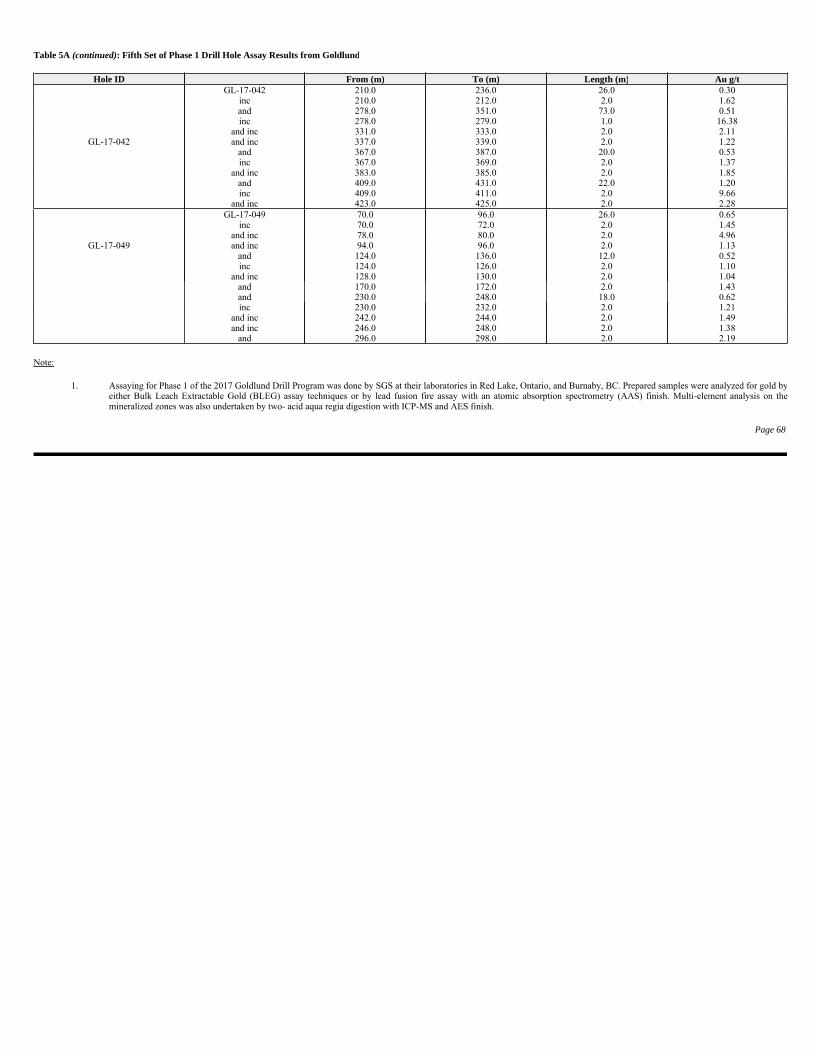
Table 5A (continued): Fifth Set of Phase 1 Drill Hole Assay Results from Goldlund
Note:
Page 68
Hole ID From (m) To (m) Length (m) Au g/tGL-17-042 210.0 236.0 26.0 0.30
inc 210.0 212.0 2.0 1.62 and 278.0 351.0 73.0 0.51 inc 278.0 279.0 1.0 16.38
and inc 331.0 333.0 2.0 2.11 GL-17-042 and inc 337.0 339.0 2.0 1.22
and 367.0 387.0 20.0 0.53 inc 367.0 369.0 2.0 1.37
and inc 383.0 385.0 2.0 1.85 and 409.0 431.0 22.0 1.20 inc 409.0 411.0 2.0 9.66
and inc 423.0 425.0 2.0 2.28 GL-17-049 70.0 96.0 26.0 0.65
inc 70.0 72.0 2.0 1.45 and inc 78.0 80.0 2.0 4.96
GL-17-049 and inc 94.0 96.0 2.0 1.13 and 124.0 136.0 12.0 0.52 inc 124.0 126.0 2.0 1.10
and inc 128.0 130.0 2.0 1.04 and 170.0 172.0 2.0 1.43 and 230.0 248.0 18.0 0.62 inc 230.0 232.0 2.0 1.21
and inc 242.0 244.0 2.0 1.49 and inc 246.0 248.0 2.0 1.38
and 296.0 298.0 2.0 2.19
1. Assaying for Phase 1 of the 2017 Goldlund Drill Program was done by SGS at their laboratories in Red Lake, Ontario, and Burnaby, BC. Prepared samples were analyzed for gold byeither Bulk Leach Extractable Gold (BLEG) assay techniques or by lead fusion fire assay with an atomic absorption spectrometry (AAS) finish. Multi-element analysis on themineralized zones was also undertaken by two- acid aqua regia digestion with ICP-MS and AES finish.
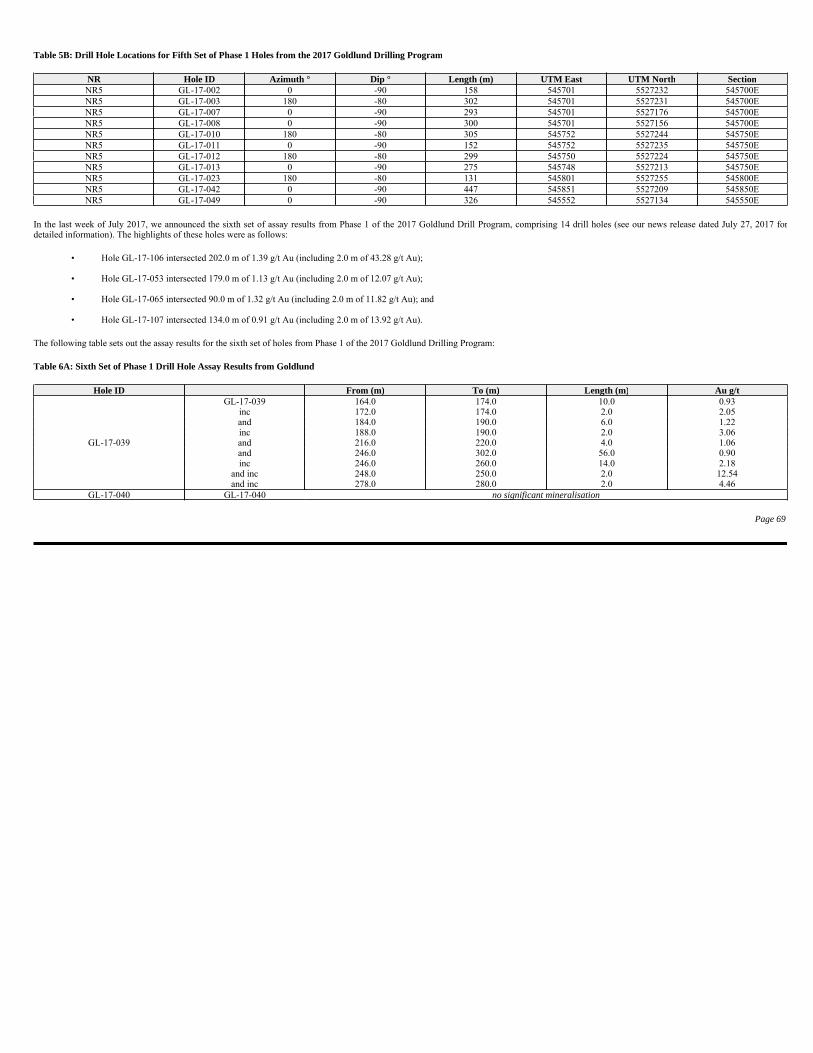
Table 5B: Drill Hole Locations for Fifth Set of Phase 1 Holes from the 2017 Goldlund Drilling Program
In the last week of July 2017, we announced the sixth set of assay results from Phase 1 of the 2017 Goldlund Drill Program, comprising 14 drill holes (see our news release dated July 27, 2017 fordetailed information). The highlights of these holes were as follows:
The following table sets out the assay results for the sixth set of holes from Phase 1 of the 2017 Goldlund Drilling Program:
Table 6A: Sixth Set of Phase 1 Drill Hole Assay Results from Goldlund
Page 69
NR Hole ID Azimuth ° Dip ° Length (m) UTM East UTM North SectionNR5 GL-17-002 0 -90 158 545701 5527232 545700E NR5 GL-17-003 180 -80 302 545701 5527231 545700E NR5 GL-17-007 0 -90 293 545701 5527176 545700E NR5 GL-17-008 0 -90 300 545701 5527156 545700E NR5 GL-17-010 180 -80 305 545752 5527244 545750E NR5 GL-17-011 0 -90 152 545752 5527235 545750E NR5 GL-17-012 180 -80 299 545750 5527224 545750E NR5 GL-17-013 0 -90 275 545748 5527213 545750E NR5 GL-17-023 180 -80 131 545801 5527255 545800E NR5 GL-17-042 0 -90 447 545851 5527209 545850E NR5 GL-17-049 0 -90 326 545552 5527134 545550E
• Hole GL-17-106 intersected 202.0 m of 1.39 g/t Au (including 2.0 m of 43.28 g/t Au);
• Hole GL-17-053 intersected 179.0 m of 1.13 g/t Au (including 2.0 m of 12.07 g/t Au);
• Hole GL-17-065 intersected 90.0 m of 1.32 g/t Au (including 2.0 m of 11.82 g/t Au); and
• Hole GL-17-107 intersected 134.0 m of 0.91 g/t Au (including 2.0 m of 13.92 g/t Au).
Hole ID From (m) To (m) Length (m) Au g/tGL-17-039 164.0 174.0 10.0 0.93
inc 172.0 174.0 2.0 2.05 and 184.0 190.0 6.0 1.22 inc 188.0 190.0 2.0 3.06
GL-17-039 and 216.0 220.0 4.0 1.06 and 246.0 302.0 56.0 0.90 inc 246.0 260.0 14.0 2.18
and inc 248.0 250.0 2.0 12.54 and inc 278.0 280.0 2.0 4.46
GL-17-040 GL-17-040 no significant mineralisation
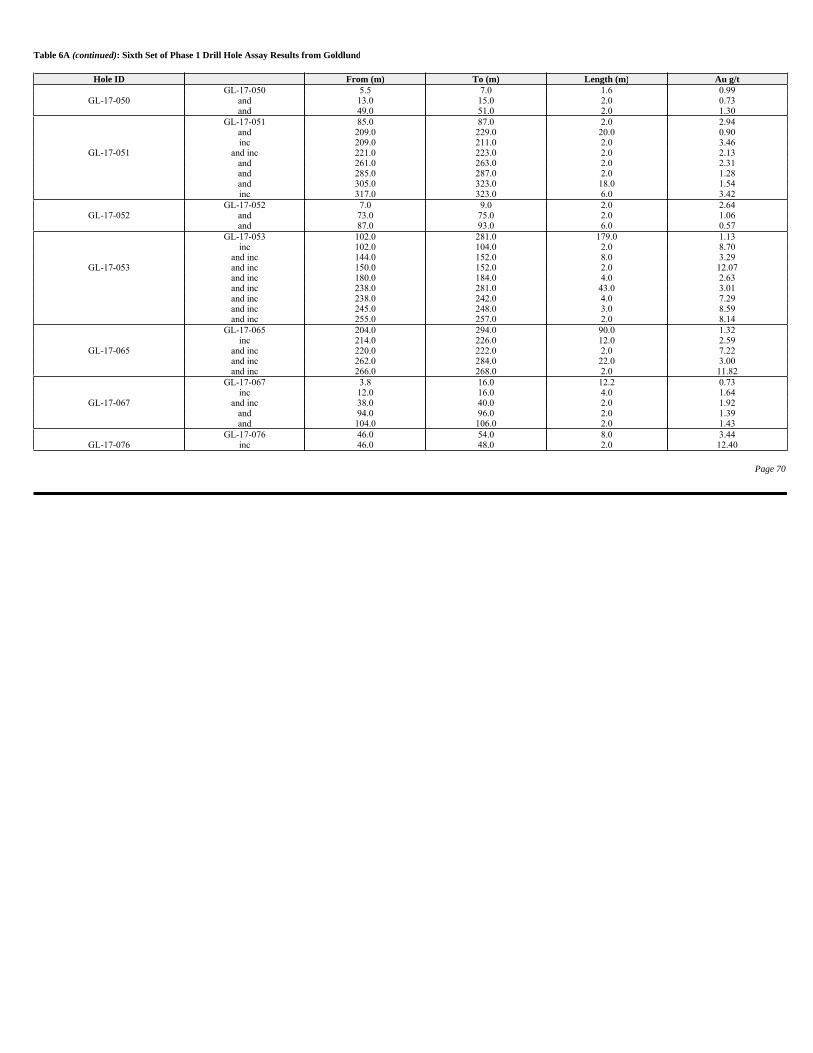
Table 6A (continued): Sixth Set of Phase 1 Drill Hole Assay Results from Goldlund
Page 70
Hole ID From (m) To (m) Length (m) Au g/tGL-17-050 5.5 7.0 1.6 0.99
GL-17-050 and 13.0 15.0 2.0 0.73 and 49.0 51.0 2.0 1.30
GL-17-051 85.0 87.0 2.0 2.94 and 209.0 229.0 20.0 0.90 inc 209.0 211.0 2.0 3.46
GL-17-051 and inc 221.0 223.0 2.0 2.13 and 261.0 263.0 2.0 2.31 and 285.0 287.0 2.0 1.28 and 305.0 323.0 18.0 1.54 inc 317.0 323.0 6.0 3.42
GL-17-052 7.0 9.0 2.0 2.64 GL-17-052 and 73.0 75.0 2.0 1.06
and 87.0 93.0 6.0 0.57 GL-17-053 102.0 281.0 179.0 1.13
inc 102.0 104.0 2.0 8.70 and inc 144.0 152.0 8.0 3.29
GL-17-053 and inc 150.0 152.0 2.0 12.07 and inc 180.0 184.0 4.0 2.63 and inc 238.0 281.0 43.0 3.01 and inc 238.0 242.0 4.0 7.29 and inc 245.0 248.0 3.0 8.59 and inc 255.0 257.0 2.0 8.14
GL-17-065 204.0 294.0 90.0 1.32 inc 214.0 226.0 12.0 2.59
GL-17-065 and inc 220.0 222.0 2.0 7.22 and inc 262.0 284.0 22.0 3.00 and inc 266.0 268.0 2.0 11.82
GL-17-067 3.8 16.0 12.2 0.73 inc 12.0 16.0 4.0 1.64
GL-17-067 and inc 38.0 40.0 2.0 1.92 and 94.0 96.0 2.0 1.39 and 104.0 106.0 2.0 1.43
GL-17-076 46.0 54.0 8.0 3.44 GL-17-076 inc 46.0 48.0 2.0 12.40
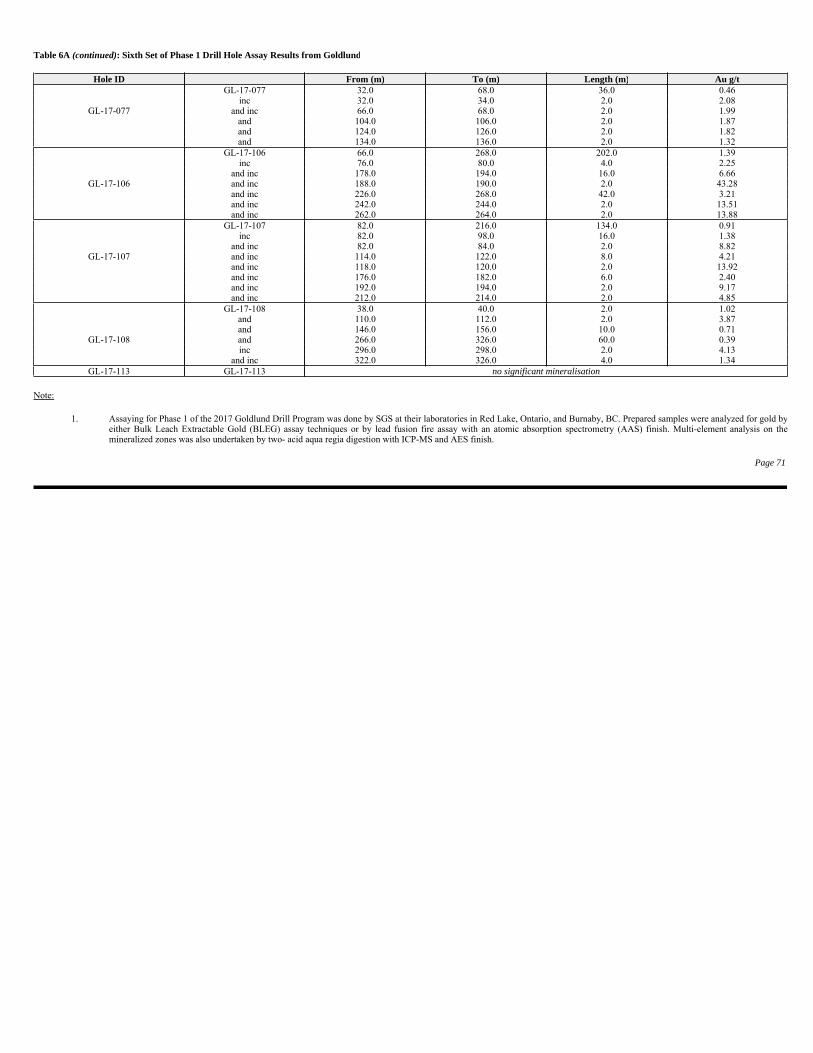
Table 6A (continued): Sixth Set of Phase 1 Drill Hole Assay Results from Goldlund
Note:
Page 71
Hole ID From (m) To (m) Length (m) Au g/tGL-17-077 32.0 68.0 36.0 0.46
inc 32.0 34.0 2.0 2.08 GL-17-077 and inc 66.0 68.0 2.0 1.99
and 104.0 106.0 2.0 1.87 and 124.0 126.0 2.0 1.82 and 134.0 136.0 2.0 1.32
GL-17-106 66.0 268.0 202.0 1.39 inc 76.0 80.0 4.0 2.25
and inc 178.0 194.0 16.0 6.66 GL-17-106 and inc 188.0 190.0 2.0 43.28
and inc 226.0 268.0 42.0 3.21 and inc 242.0 244.0 2.0 13.51 and inc 262.0 264.0 2.0 13.88
GL-17-107 82.0 216.0 134.0 0.91 inc 82.0 98.0 16.0 1.38
and inc 82.0 84.0 2.0 8.82 GL-17-107 and inc 114.0 122.0 8.0 4.21
and inc 118.0 120.0 2.0 13.92 and inc 176.0 182.0 6.0 2.40 and inc 192.0 194.0 2.0 9.17 and inc 212.0 214.0 2.0 4.85
GL-17-108 38.0 40.0 2.0 1.02 and 110.0 112.0 2.0 3.87 and 146.0 156.0 10.0 0.71
GL-17-108 and 266.0 326.0 60.0 0.39 inc 296.0 298.0 2.0 4.13
and inc 322.0 326.0 4.0 1.34 GL-17-113 GL-17-113 no significant mineralisation
1. Assaying for Phase 1 of the 2017 Goldlund Drill Program was done by SGS at their laboratories in Red Lake, Ontario, and Burnaby, BC. Prepared samples were analyzed for gold byeither Bulk Leach Extractable Gold (BLEG) assay techniques or by lead fusion fire assay with an atomic absorption spectrometry (AAS) finish. Multi-element analysis on themineralized zones was also undertaken by two- acid aqua regia digestion with ICP-MS and AES finish.
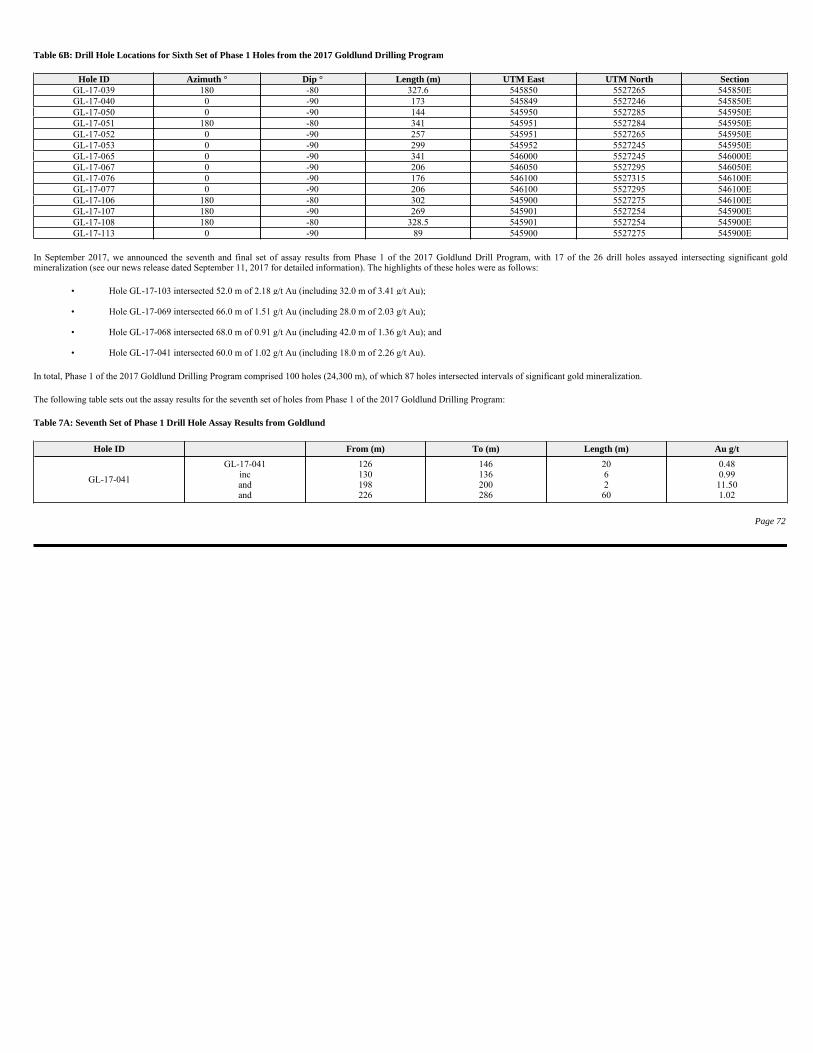
Table 6B: Drill Hole Locations for Sixth Set of Phase 1 Holes from the 2017 Goldlund Drilling Program
In September 2017, we announced the seventh and final set of assay results from Phase 1 of the 2017 Goldlund Drill Program, with 17 of the 26 drill holes assayed intersecting significant goldmineralization (see our news release dated September 11, 2017 for detailed information). The highlights of these holes were as follows:
In total, Phase 1 of the 2017 Goldlund Drilling Program comprised 100 holes (24,300 m), of which 87 holes intersected intervals of significant gold mineralization.
The following table sets out the assay results for the seventh set of holes from Phase 1 of the 2017 Goldlund Drilling Program:
Table 7A: Seventh Set of Phase 1 Drill Hole Assay Results from Goldlund
Page 72
Hole ID Azimuth ° Dip ° Length (m) UTM East UTM North SectionGL-17-039 180 -80 327.6 545850 5527265 545850E GL-17-040 0 -90 173 545849 5527246 545850E GL-17-050 0 -90 144 545950 5527285 545950E GL-17-051 180 -80 341 545951 5527284 545950E GL-17-052 0 -90 257 545951 5527265 545950E GL-17-053 0 -90 299 545952 5527245 545950E GL-17-065 0 -90 341 546000 5527245 546000E GL-17-067 0 -90 206 546050 5527295 546050E GL-17-076 0 -90 176 546100 5527315 546100E GL-17-077 0 -90 206 546100 5527295 546100E GL-17-106 180 -80 302 545900 5527275 546100E GL-17-107 180 -90 269 545901 5527254 545900E GL-17-108 180 -80 328.5 545901 5527254 545900E GL-17-113 0 -90 89 545900 5527275 545900E
• Hole GL-17-103 intersected 52.0 m of 2.18 g/t Au (including 32.0 m of 3.41 g/t Au);
• Hole GL-17-069 intersected 66.0 m of 1.51 g/t Au (including 28.0 m of 2.03 g/t Au);
• Hole GL-17-068 intersected 68.0 m of 0.91 g/t Au (including 42.0 m of 1.36 g/t Au); and
• Hole GL-17-041 intersected 60.0 m of 1.02 g/t Au (including 18.0 m of 2.26 g/t Au).
Hole ID From (m) To (m) Length (m) Au g/t
GL-17-041
GL-17-041 incandand
126 130 198 226
146 136 200 286
20 6 2 60
0.48 0.99 11.50 1.02
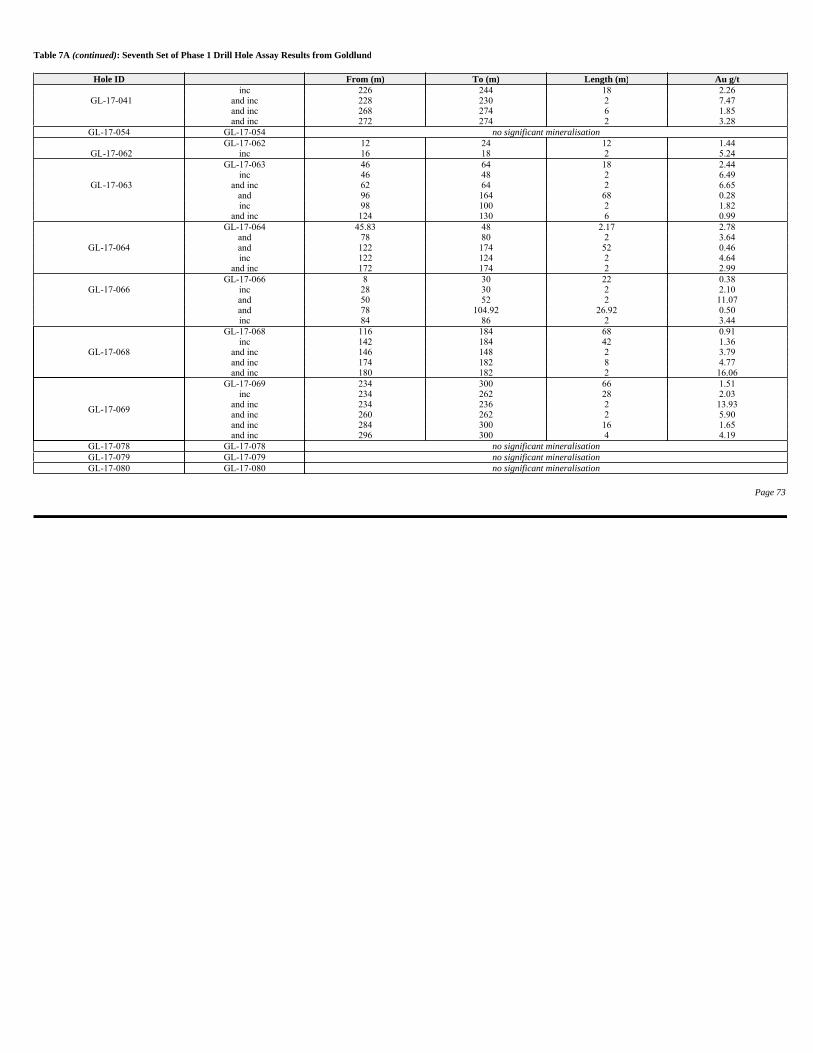
Table 7A (continued): Seventh Set of Phase 1 Drill Hole Assay Results from Goldlund
Page 73
Hole ID From (m) To (m) Length (m) Au g/tinc 226 244 18 2.26
GL-17-041 and inc 228 230 2 7.47 and inc 268 274 6 1.85 and inc 272 274 2 3.28
GL-17-054 GL-17-054 no significant mineralisationGL-17-062 12 24 12 1.44
GL-17-062 inc 16 18 2 5.24 GL-17-063 46 64 18 2.44
inc 46 48 2 6.49 GL-17-063 and inc 62 64 2 6.65
and 96 164 68 0.28 inc 98 100 2 1.82
and inc 124 130 6 0.99 GL-17-064 45.83 48 2.17 2.78
and 78 80 2 3.64 GL-17-064 and 122 174 52 0.46
inc 122 124 2 4.64 and inc 172 174 2 2.99
GL-17-066 8 30 22 0.38 GL-17-066 inc 28 30 2 2.10
and 50 52 2 11.07 and 78 104.92 26.92 0.50 inc 84 86 2 3.44
GL-17-068
GL-17-068 116 184 68 0.91 inc 142 184 42 1.36
and inc 146 148 2 3.79 and inc 174 182 8 4.77 and inc 180 182 2 16.06
GL-17-069
GL-17-069 234 300 66 1.51 inc 234 262 28 2.03
and inc 234 236 2 13.93 and inc 260 262 2 5.90 and inc 284 300 16 1.65 and inc 296 300 4 4.19
GL-17-078 GL-17-078 no significant mineralisationGL-17-079 GL-17-079 no significant mineralisationGL-17-080 GL-17-080 no significant mineralisation
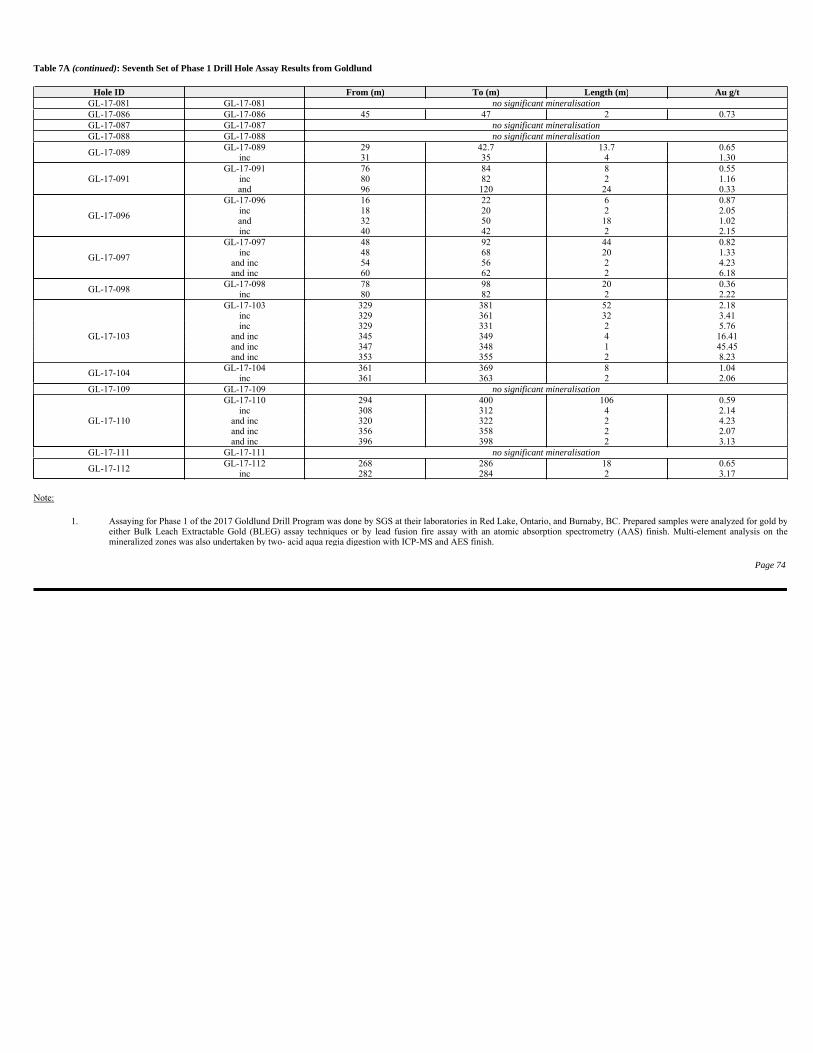
Table 7A (continued): Seventh Set of Phase 1 Drill Hole Assay Results from Goldlund
Note:
Page 74
Hole ID From (m) To (m) Length (m) Au g/tGL-17-081 GL-17-081 no significant mineralisationGL-17-086 GL-17-086 45 47 2 0.73 GL-17-087 GL-17-087 no significant mineralisationGL-17-088 GL-17-088 no significant mineralisation
GL-17-089 GL-17-089 29 42.7 13.7 0.65
inc 31 35 4 1.30
GL-17-091 GL-17-091 76 84 8 0.55
inc 80 82 2 1.16 and 96 120 24 0.33
GL-17-096
GL-17-096 16 22 6 0.87 inc 18 20 2 2.05 and 32 50 18 1.02 inc 40 42 2 2.15
GL-17-097
GL-17-097 48 92 44 0.82 inc 48 68 20 1.33
and inc 54 56 2 4.23 and inc 60 62 2 6.18
GL-17-098 GL-17-098 78 98 20 0.36
inc 80 82 2 2.22 GL-17-103 329 381 52 2.18
inc 329 361 32 3.41 inc 329 331 2 5.76
GL-17-103 and inc 345 349 4 16.41 and inc 347 348 1 45.45 and inc 353 355 2 8.23
GL-17-104 GL-17-104 361 369 8 1.04 inc 361 363 2 2.06
GL-17-109 GL-17-109 no significant mineralisation
GL-17-110
GL-17-110 294 400 106 0.59 inc 308 312 4 2.14
and inc 320 322 2 4.23 and inc 356 358 2 2.07 and inc 396 398 2 3.13
GL-17-111 GL-17-111 no significant mineralisation
GL-17-112 GL-17-112 268 286 18 0.65 inc 282 284 2 3.17
1. Assaying for Phase 1 of the 2017 Goldlund Drill Program was done by SGS at their laboratories in Red Lake, Ontario, and Burnaby, BC. Prepared samples were analyzed for gold byeither Bulk Leach Extractable Gold (BLEG) assay techniques or by lead fusion fire assay with an atomic absorption spectrometry (AAS) finish. Multi-element analysis on themineralized zones was also undertaken by two- acid aqua regia digestion with ICP-MS and AES finish.
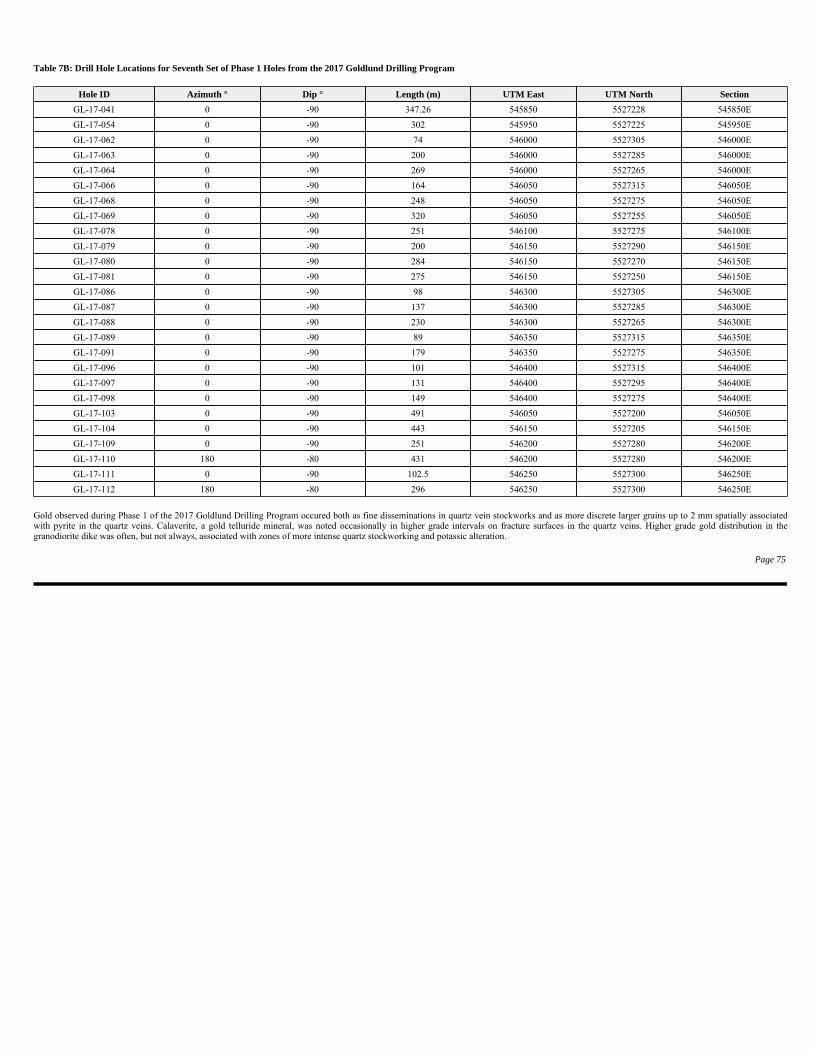
Table 7B: Drill Hole Locations for Seventh Set of Phase 1 Holes from the 2017 Goldlund Drilling Program
Gold observed during Phase 1 of the 2017 Goldlund Drilling Program occured both as fine disseminations in quartz vein stockworks and as more discrete larger grains up to 2 mm spatially associatedwith pyrite in the quartz veins. Calaverite, a gold telluride mineral, was noted occasionally in higher grade intervals on fracture surfaces in the quartz veins. Higher grade gold distribution in thegranodiorite dike was often, but not always, associated with zones of more intense quartz stockworking and potassic alteration.
Page 75
Hole ID Azimuth ° Dip ° Length (m) UTM East UTM North Section
GL-17-041 0 -90 347.26 545850 5527228 545850E
GL-17-054 0 -90 302 545950 5527225 545950E
GL-17-062 0 -90 74 546000 5527305 546000E
GL-17-063 0 -90 200 546000 5527285 546000E
GL-17-064 0 -90 269 546000 5527265 546000E
GL-17-066 0 -90 164 546050 5527315 546050E
GL-17-068 0 -90 248 546050 5527275 546050E
GL-17-069 0 -90 320 546050 5527255 546050E
GL-17-078 0 -90 251 546100 5527275 546100E
GL-17-079 0 -90 200 546150 5527290 546150E
GL-17-080 0 -90 284 546150 5527270 546150E
GL-17-081 0 -90 275 546150 5527250 546150E
GL-17-086 0 -90 98 546300 5527305 546300E
GL-17-087 0 -90 137 546300 5527285 546300E
GL-17-088 0 -90 230 546300 5527265 546300E
GL-17-089 0 -90 89 546350 5527315 546350E
GL-17-091 0 -90 179 546350 5527275 546350E
GL-17-096 0 -90 101 546400 5527315 546400E
GL-17-097 0 -90 131 546400 5527295 546400E
GL-17-098 0 -90 149 546400 5527275 546400E
GL-17-103 0 -90 491 546050 5527200 546050E
GL-17-104 0 -90 443 546150 5527205 546150E
GL-17-109 0 -90 251 546200 5527280 546200E
GL-17-110 180 -80 431 546200 5527280 546200E
GL-17-111 0 -90 102.5 546250 5527300 546250E
GL-17-112 180 -80 296 546250 5527300 546250E
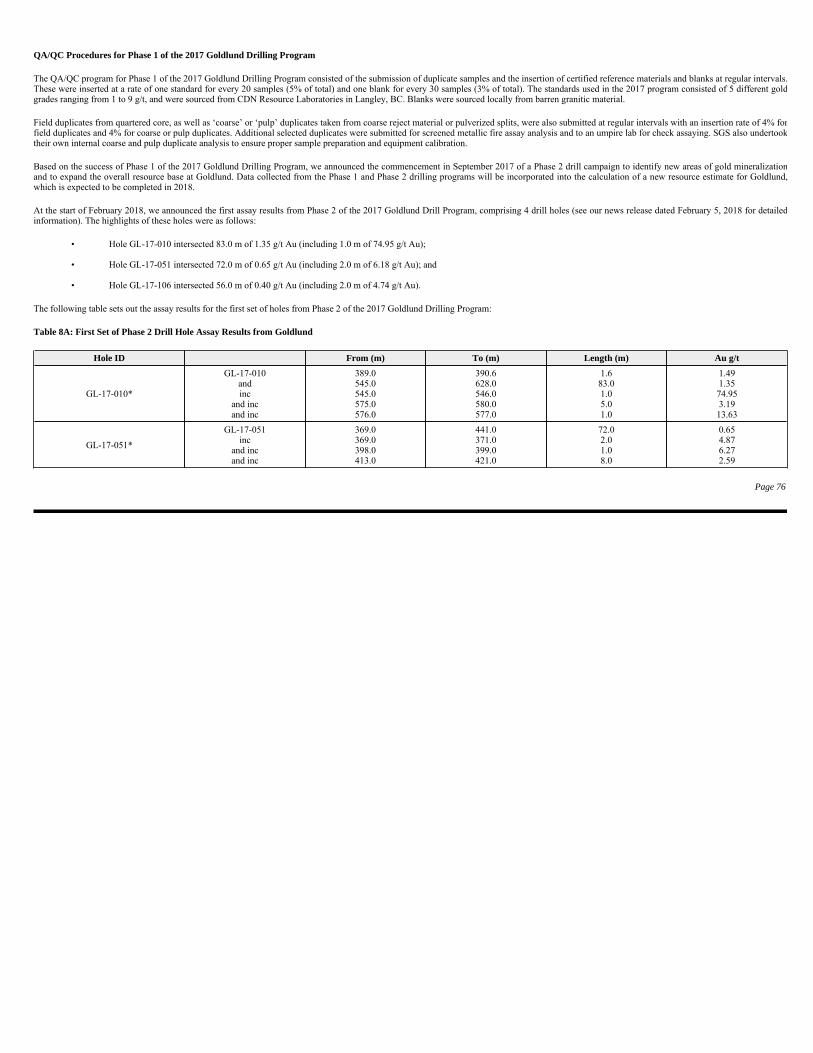
QA/QC Procedures for Phase 1 of the 2017 Goldlund Drilling Program
The QA/QC program for Phase 1 of the 2017 Goldlund Drilling Program consisted of the submission of duplicate samples and the insertion of certified reference materials and blanks at regular intervals.These were inserted at a rate of one standard for every 20 samples (5% of total) and one blank for every 30 samples (3% of total). The standards used in the 2017 program consisted of 5 different goldgrades ranging from 1 to 9 g/t, and were sourced from CDN Resource Laboratories in Langley, BC. Blanks were sourced locally from barren granitic material.
Field duplicates from quartered core, as well as ‘coarse’ or ‘pulp’ duplicates taken from coarse reject material or pulverized splits, were also submitted at regular intervals with an insertion rate of 4% forfield duplicates and 4% for coarse or pulp duplicates. Additional selected duplicates were submitted for screened metallic fire assay analysis and to an umpire lab for check assaying. SGS also undertooktheir own internal coarse and pulp duplicate analysis to ensure proper sample preparation and equipment calibration.
Based on the success of Phase 1 of the 2017 Goldlund Drilling Program, we announced the commencement in September 2017 of a Phase 2 drill campaign to identify new areas of gold mineralizationand to expand the overall resource base at Goldlund. Data collected from the Phase 1 and Phase 2 drilling programs will be incorporated into the calculation of a new resource estimate for Goldlund,which is expected to be completed in 2018.
At the start of February 2018, we announced the first assay results from Phase 2 of the 2017 Goldlund Drill Program, comprising 4 drill holes (see our news release dated February 5, 2018 for detailedinformation). The highlights of these holes were as follows:
The following table sets out the assay results for the first set of holes from Phase 2 of the 2017 Goldlund Drilling Program:
Table 8A: First Set of Phase 2 Drill Hole Assay Results from Goldlund
Page 76
• Hole GL-17-010 intersected 83.0 m of 1.35 g/t Au (including 1.0 m of 74.95 g/t Au);
• Hole GL-17-051 intersected 72.0 m of 0.65 g/t Au (including 2.0 m of 6.18 g/t Au); and
• Hole GL-17-106 intersected 56.0 m of 0.40 g/t Au (including 2.0 m of 4.74 g/t Au).
Hole ID From (m) To (m) Length (m) Au g/t
GL-17-010*
GL-17-010 and inc
and inc and inc
389.0 545.0 545.0 575.0 576.0
390.6 628.0 546.0 580.0 577.0
1.6 83.0 1.0 5.0 1.0
1.49 1.35 74.95 3.19 13.63
GL-17-051*
GL-17-051 inc
and inc and inc
369.0 369.0 398.0 413.0
441.0 371.0 399.0 421.0
72.0 2.0 1.0 8.0
0.65 4.87 6.27 2.59
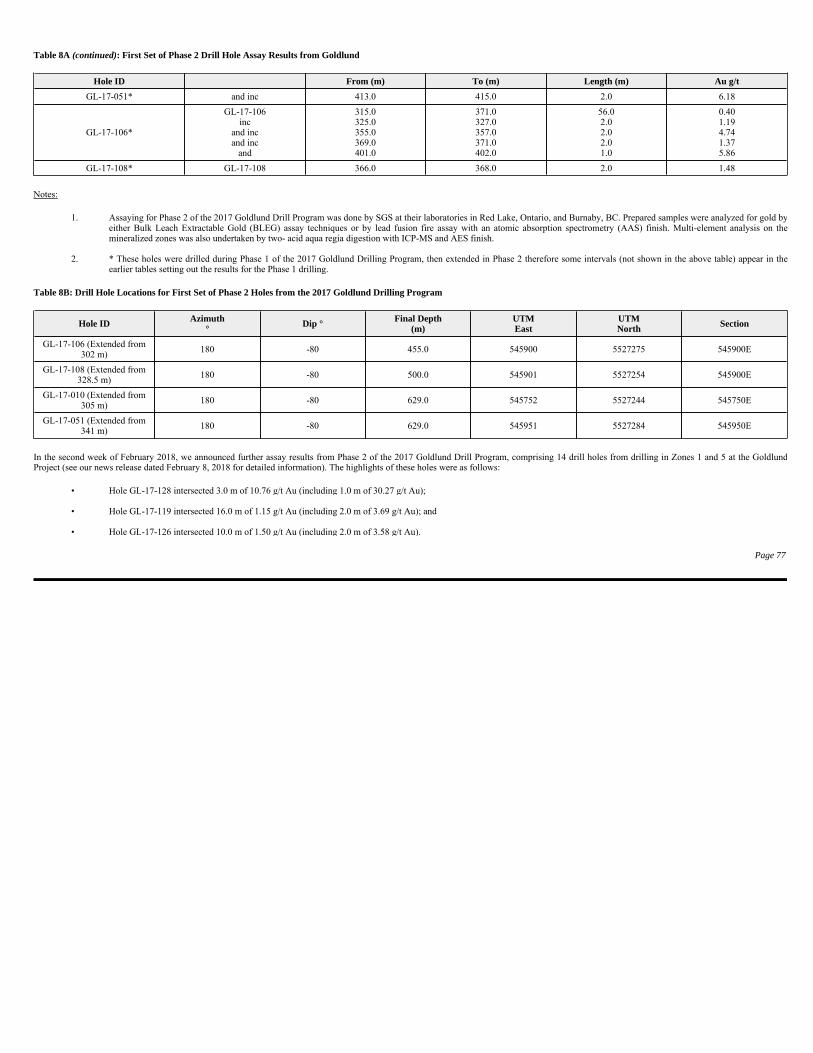
Table 8A (continued): First Set of Phase 2 Drill Hole Assay Results from Goldlund
Notes:
Table 8B: Drill Hole Locations for First Set of Phase 2 Holes from the 2017 Goldlund Drilling Program
In the second week of February 2018, we announced further assay results from Phase 2 of the 2017 Goldlund Drill Program, comprising 14 drill holes from drilling in Zones 1 and 5 at the GoldlundProject (see our news release dated February 8, 2018 for detailed information). The highlights of these holes were as follows:
Page 77
Hole ID From (m) To (m) Length (m) Au g/t
GL-17-051* and inc 413.0 415.0 2.0 6.18
GL-17-106*
GL-17-106 inc
and inc and inc
and
315.0 325.0 355.0 369.0 401.0
371.0 327.0 357.0 371.0 402.0
56.0 2.0 2.0 2.0 1.0
0.40 1.19 4.74 1.37 5.86
GL-17-108* GL-17-108 366.0 368.0 2.0 1.48
1. Assaying for Phase 2 of the 2017 Goldlund Drill Program was done by SGS at their laboratories in Red Lake, Ontario, and Burnaby, BC. Prepared samples were analyzed for gold byeither Bulk Leach Extractable Gold (BLEG) assay techniques or by lead fusion fire assay with an atomic absorption spectrometry (AAS) finish. Multi-element analysis on themineralized zones was also undertaken by two- acid aqua regia digestion with ICP-MS and AES finish.
2. * These holes were drilled during Phase 1 of the 2017 Goldlund Drilling Program, then extended in Phase 2 therefore some intervals (not shown in the above table) appear in theearlier tables setting out the results for the Phase 1 drilling.
Hole ID Azimuth°
Dip ° Final Depth(m)
UTMEast
UTMNorth
Section
GL-17-106 (Extended from 302 m)
180 -80 455.0 545900 5527275 545900E
GL-17-108 (Extended from 328.5 m) 180 -80 500.0 545901 5527254 545900E
GL-17-010 (Extended from 305 m)
180 -80 629.0 545752 5527244 545750E
GL-17-051 (Extended from 341 m) 180 -80 629.0 545951 5527284 545950E
• Hole GL-17-128 intersected 3.0 m of 10.76 g/t Au (including 1.0 m of 30.27 g/t Au);
• Hole GL-17-119 intersected 16.0 m of 1.15 g/t Au (including 2.0 m of 3.69 g/t Au); and
• Hole GL-17-126 intersected 10.0 m of 1.50 g/t Au (including 2.0 m of 3.58 g/t Au).
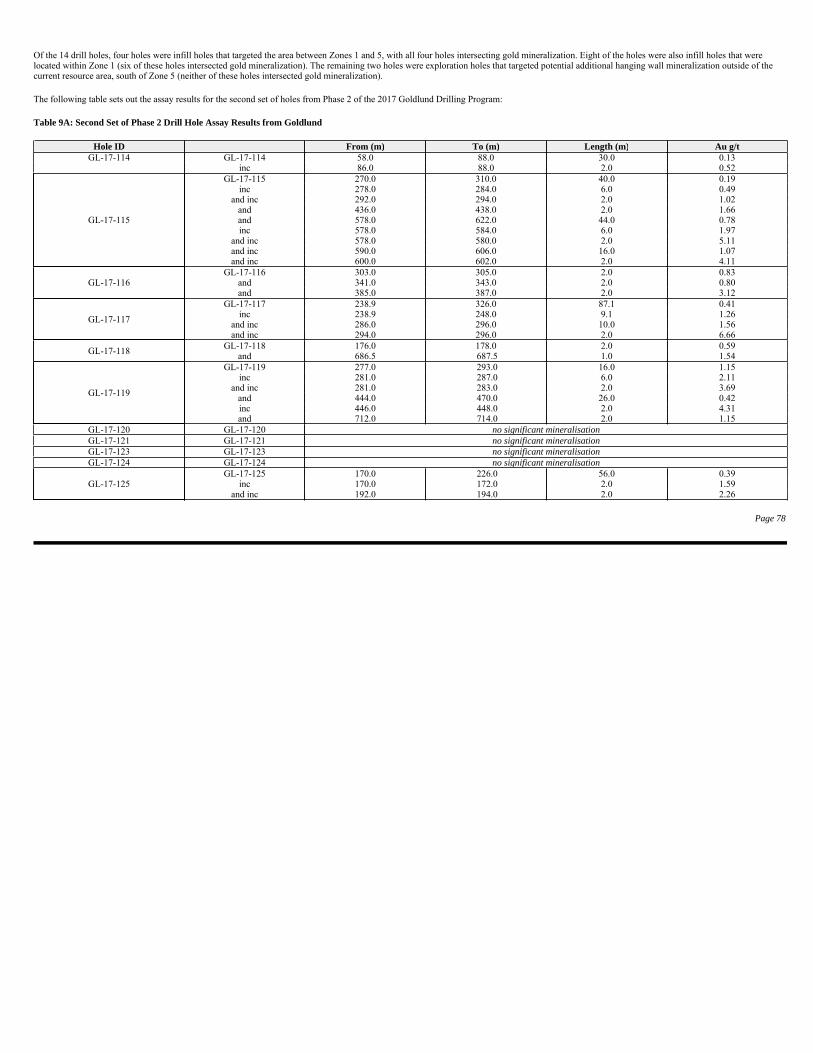
Of the 14 drill holes, four holes were infill holes that targeted the area between Zones 1 and 5, with all four holes intersecting gold mineralization. Eight of the holes were also infill holes that were located within Zone 1 (six of these holes intersected gold mineralization). The remaining two holes were exploration holes that targeted potential additional hanging wall mineralization outside of the current resource area, south of Zone 5 (neither of these holes intersected gold mineralization).
The following table sets out the assay results for the second set of holes from Phase 2 of the 2017 Goldlund Drilling Program:
Table 9A: Second Set of Phase 2 Drill Hole Assay Results from Goldlund
Page 78
Hole ID From (m) To (m) Length (m) Au g/tGL-17-114 GL-17-114 58.0 88.0 30.0 0.13
inc 86.0 88.0 2.0 0.52
GL-17-115
GL-17-115 270.0 310.0 40.0 0.19 inc 278.0 284.0 6.0 0.49
and inc 292.0 294.0 2.0 1.02 and 436.0 438.0 2.0 1.66 and 578.0 622.0 44.0 0.78 inc 578.0 584.0 6.0 1.97
and inc 578.0 580.0 2.0 5.11 and inc 590.0 606.0 16.0 1.07 and inc 600.0 602.0 2.0 4.11
GL-17-116 GL-17-116 303.0 305.0 2.0 0.83
and 341.0 343.0 2.0 0.80 and 385.0 387.0 2.0 3.12
GL-17-117
GL-17-117 238.9 326.0 87.1 0.41 inc 238.9 248.0 9.1 1.26
and inc 286.0 296.0 10.0 1.56 and inc 294.0 296.0 2.0 6.66
GL-17-118 GL-17-118 176.0 178.0 2.0 0.59
and 686.5 687.5 1.0 1.54
GL-17-119
GL-17-119 277.0 293.0 16.0 1.15 inc 281.0 287.0 6.0 2.11
and inc 281.0 283.0 2.0 3.69 and 444.0 470.0 26.0 0.42 inc 446.0 448.0 2.0 4.31 and 712.0 714.0 2.0 1.15
GL-17-120 GL-17-120 no significant mineralisationGL-17-121 GL-17-121 no significant mineralisationGL-17-123 GL-17-123 no significant mineralisationGL-17-124 GL-17-124 no significant mineralisation
GL-17-125 GL-17-125 170.0 226.0 56.0 0.39
inc 170.0 172.0 2.0 1.59 and inc 192.0 194.0 2.0 2.26
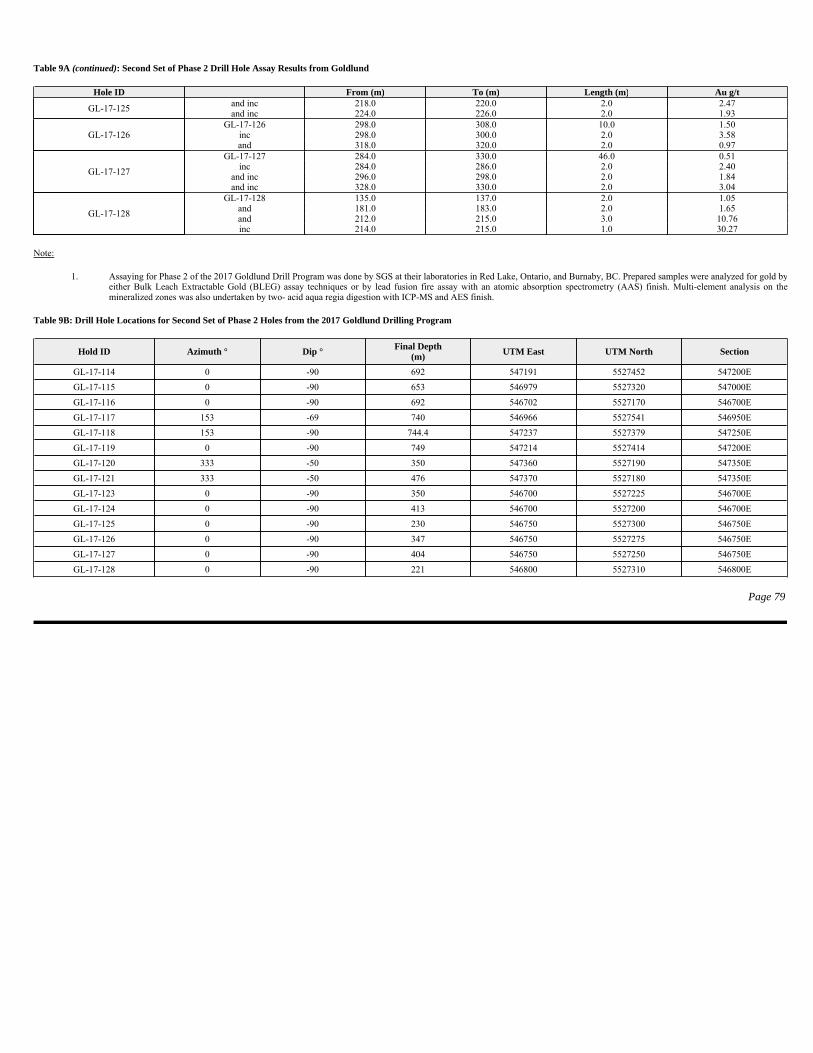
Table 9A (continued): Second Set of Phase 2 Drill Hole Assay Results from Goldlund
Note:
Table 9B: Drill Hole Locations for Second Set of Phase 2 Holes from the 2017 Goldlund Drilling Program
Page 79
Hole ID From (m) To (m) Length (m) Au g/t
GL-17-125 and inc 218.0 220.0 2.0 2.47 and inc 224.0 226.0 2.0 1.93
GL-17-126 GL-17-126 298.0 308.0 10.0 1.50
inc 298.0 300.0 2.0 3.58 and 318.0 320.0 2.0 0.97
GL-17-127
GL-17-127 284.0 330.0 46.0 0.51 inc 284.0 286.0 2.0 2.40
and inc 296.0 298.0 2.0 1.84 and inc 328.0 330.0 2.0 3.04
GL-17-128
GL-17-128 135.0 137.0 2.0 1.05 and 181.0 183.0 2.0 1.65 and 212.0 215.0 3.0 10.76 inc 214.0 215.0 1.0 30.27
1. Assaying for Phase 2 of the 2017 Goldlund Drill Program was done by SGS at their laboratories in Red Lake, Ontario, and Burnaby, BC. Prepared samples were analyzed for gold byeither Bulk Leach Extractable Gold (BLEG) assay techniques or by lead fusion fire assay with an atomic absorption spectrometry (AAS) finish. Multi-element analysis on themineralized zones was also undertaken by two- acid aqua regia digestion with ICP-MS and AES finish.
Hold ID Azimuth ° Dip °Final Depth
(m)UTM East UTM North Section
GL-17-114 0 -90 692 547191 5527452 547200E
GL-17-115 0 -90 653 546979 5527320 547000E
GL-17-116 0 -90 692 546702 5527170 546700E
GL-17-117 153 -69 740 546966 5527541 546950E
GL-17-118 153 -90 744.4 547237 5527379 547250E
GL-17-119 0 -90 749 547214 5527414 547200E
GL-17-120 333 -50 350 547360 5527190 547350E
GL-17-121 333 -50 476 547370 5527180 547350E
GL-17-123 0 -90 350 546700 5527225 546700E
GL-17-124 0 -90 413 546700 5527200 546700E
GL-17-125 0 -90 230 546750 5527300 546750E
GL-17-126 0 -90 347 546750 5527275 546750E
GL-17-127 0 -90 404 546750 5527250 546750E
GL-17-128 0 -90 221 546800 5527310 546800E

QA/QC Procedures for the Phase 2 of the 2017 Goldlund Drilling Program
The QA/QC program for Phase 2 of the 2017 Goldlund Drilling Program was the same as the program that was carried out for Phase 1, and consisted of the submissionof duplicate samples and the insertion of certified reference materials and blanks at regular intervals. These were inserted at a rate of one standard for every 20 samples(5% of total) and one blank for every 30 samples (3% of total). The standards used in the 2017 program consisted of 5 different gold grades ranging from 1 to 9 g/t, andwere sourced from CDN Resource Laboratories in Langley, BC. Blanks were sourced locally from barren granitic material.
Field duplicates from quartered core, as well as ‘coarse’ or ‘pulp’ duplicates taken from coarse reject material or pulverized splits, were also submitted at regularintervals with an insertion rate of 4% for field duplicates and 4% for coarse or pulp duplicates. Additional selected duplicates were submitted for screened metallic fireassay analysis and to an umpire lab for check assaying. SGS also undertook their own internal coarse and pulp duplicate analysis to ensure proper sample preparationand equipment calibration.
Page 80

Cameron
Technical report
The Cameron Property project (the “Cameron Project”) description is based on the project’s technical report: Technical Report on the Cameron Gold Deposit,Ontario, Canada (effective date January 17, 2017) (the “Cameron Gold Technical Report”). The report was prepared for us in accordance with NI 43-101, by orunder the supervision of Mark Drabble, B. App. Sci. (Geology), MAIG, MAusIMM; and Kahan Cervoi, B. App. Sci (Geology), MAIG, MAusIMM; each qualifiedpersons within the meaning of NI 43-101. The following description has been prepared under the supervision of Dr. Chris Osterman, Ph.D., P.Geo., who is a qualifiedperson within the meaning of NI 43-101, but is not independent of us.
The conclusions, projections and estimates included in this description are subject to the qualifications, assumptions and exclusions set out in the Cameron GoldTechnical Report, except as such qualifications, assumptions and exclusions may be modified in this AIF. We recommend you read the Cameron Gold Technical Reportin its entirety to fully understand the project. You can download a copy from our SEDAR profile (www.sedar.com), or from our website (www.firstmininggold.com).
Project description, location and access
The Cameron Gold Project is wholly-owned by us through our wholly-owned subsidiary, Cameron Gold. The Cameron Gold Project comprises 226 unpatented claims,24 patented claims (mineral rights only), seven mining licences of occupation (“MLO”) and four mining leases. All of the claims are located within unsurveyed crownlands, mainly within the Rowan Lake area, though some claims are situated in the Tadpole Lake, Brooks Lake and Lawrence Lake areas.
The total area of the project is approximately 448.53 km2 (44,853.2 ha).
The Cameron Gold Project currently consists of two project areas; namely Cameron (which includes the Cameron deposit) (the “Cameron Deposit”) and WestCedartree (which includes the Dubenski and Dogpaw deposits). The Cameron Gold Technical Report covers only the Cameron Deposit and Mineral Resource Estimatewithin the broader Cameron Project. The property comprising the Cameron Project consists of 128 unpatented claims, four patented claims, six MLOs and two miningleases. The West Cedartree property comprises nine unpatented claims, 20 patented claims, one MLO and two mining leases.
The Cameron Gold Project is located in the southern part of western Ontario, Canada approximately 80 km southeast of Kenora and 80 km northwest of Fort Frances.The nearest towns are Sioux Narrows and Nestor Falls, 30 km and 25 km away respectively. The Cameron Gold Project is on unsurveyed crown lands accessed bysealed and all weather gravel roads. From Kenora via Highway 17, Hwy 71 and the Cameron Lake road the distance is around 123 km. From Fort Frances via Hwy 11,Hwy 71 and the Cameron Lake road the distance is 168 km.
Page 81
Underlying royalties which affect the Cameron Deposit are:
In order to maintain the title to an unpatented mining claim indefinitely, the recorded holder of the claim is required to undertake approved work expenditure in excessof $400 per claim within two years of the granting of the claim. Work programmes and expenditure commitments can be grouped across a contiguous series ofunpatented mining claims. To maintain the unpatented claims comprising the Cameron Project in good standing, we are required to incur an aggregate expenditure of$750,800 per year and to file annual assessment reports of the work that has been undertaken. The duration of a mining lease is 21 years from the date of grant. Themining leases within the Cameron Project were initially granted in 1988 and were subsequently renewed for a further 21 years in July 2009, except one mining leasewhich was renewed in May 2006.
History
Exploration in the area commenced in the 1940s and numerous companies have carried out prospecting, line cutting, geological mapping, trenching, soil and outcropsampling and ground magnetic and electromagnetic geophysical surveys.
On the Cameron Gold Project there have been numerous exploration and drilling programmes. On the Cameron Deposit itself, the first drilling was undertaken in July1960. Prior to 2010, there were 836 holes comprising in excess of 90 km of diamond drill core drilled by six companies.
In 1987 at the Cameron Gold Deposit, underground development for an extensive sampling programme was undertaken. Some 65,000 m3 of material was excavatedwith some bulk sampling, diamond drilling and rock chip sampling completed. The excavated material was placed on surface at site in three separate stockpiles: one forunmineralised access development material, one for “low-grade” mineralized material; and one for “mineralized” material. The unmineralised stockpile has been usedfrom time to time for access road maintenance. The mineralized material stockpiles have been surveyed and sampled for the purpose of reconciliation against depletioncalculations but no estimate has been prepared that would permit inclusion of the material in a disclosure of resources.
Between 2010 and 2012, 242 surface diamond holes were drilled totalling 36,000 m, the majority on the Cameron Deposit.
Since 2010, the following exploration work has been carried out throughout the Cameron Gold Project consisting of:
Page 82
• 1.5% NSR payable to Rubicon Minerals Corp. for 47 unpatented claims. We have the option to repurchase 0.75% of the NSR for $750,000;
• 1% NSR payable to Orion Resource Partners for 20 unpatented claims, 4 patented claims, 6 MLOs and 2 mining leases;
• 2% NSR payable to Mr. Sherridon Johnson and Mr. Edward Antony Barkauskas for one unpatented claim. We have the right to repurchase 1% of the NSR for $500,000
• $0.30 per ton on all ore mined payable to the estate of W. Moorhouse and D. Petrunka for one mining lease;
• 3% NSR payable to Lasir Gold Inc. We have the right to reduce the NSR to 1.5% by payment of $1,500,000; and
• 1% NSR payable to Chalice on 133 unpatented mining claims, all of which are not encumbered by pre-existing royalties. We have the right to repurchase 0.5% of the NSR for $1,000,000.
• Airborne magnetic gradiometers survey of the project area in 2010.
• 250 km of line cutting over the property
• 142 line km of Pole-Dipole Induced Polarisation surveys (July 2010 to February 2011)
• Orientation geochemical sampling programme of surface pits around the Cameron deposit in late 2011. A total of 19 samples of around 12 kg were collected from the base of till over an area of about 900 m x 600 m.
• Excavation of 94 pits in 2013 on gold-in-till anomalies.
• Outcrop mapping and prospecting
• Heli-borne magnetics and Versatile Time-domain Electromagnetic (VTEM) over the western portion of the project in 2014. A total of 1457 line km of VTEM was flown at 200 m spacings.
• Several historical mineral resource estimates have been done for the Cameron Deposit.

In May 2014, 15 holes for 2,599.5 m were diamond drilled at the Jupiter, Ajax, Juno and Hermione prospects that are proximal to the Cameron Deposit.
Geological setting, mineralization and deposit type
The mineralisation at the Cameron Gold Project is mainly hosted in mafic volcanic rocks within a northwest trending shear zone (“Cameron Lake Shear Zone” or“CLSZ”) which dips steeply to the northeast. In the south-eastern part of the deposit where the greatest amount of gold has been delineated, the shear zone forms thecontact between the mafic volcanic rocks and diabase/dolerite rocks of the footwall.
Gold mineralisation occurs within quartz breccia veins, associated with intense silica]sericite carbonate pyrite alteration in a series of zones that dip moderately tosteeply to the northeast within and adjacent to the shear zone. Gold is associated with disseminated pyrite with high sulphide concentration generally correspondingwith higher gold grade. Visible gold is rare. The mineralisation is open at depth and along strike to the northwest with potential to expand the Mineral Resource in thesedirections.
The Cameron Deposit is a greenstone hosted gold deposit. While the deposit can generally be considered to be part of the orogenic family of gold deposits, it bearsmany characteristics atypical of the largest gold deposits of this style. These features include:
Exploration
Exploration at the Cameron Gold Project commenced in 1960 and has been conducted intermittently until the present day.
Page 83
• mineralisation dominated by disseminated sulphide replacement and quartz sulphide stockwork and quartz breccia veins;
• spatial and temporal association of mineralisation with porphyry intrusive bodies that have similar alteration assemblages (taking into account primary lithological variations);
• relatively minor amounts of auriferous quartz carbonate vein material comprising the mineralisation, which is likely temporally late compared to the disseminated sulphide replacement and quartz breccia veins;
• high grade mineralisation is largely deformed and the disseminated sulphide replacement zones that constitute the bulk of the mineralisation are commonly foliated; and
• the alteration assemblage of the mineralisation (sericite albite carbonate pyrite) is atypical.

Drilling
A number of diamond drillhole programmes have been carried out across the Cameron Gold Project area by a number of explorers: Noranda Exploration CompanyLimited (“Noranda”) from 1960 to 1961; Zahevy Mines Limited and Noranda from 1972 to 1974; Nuinsco in 1981; Nuinsco and Lockwood Petroleum Inc. from 1983to 1984; Nuinsco and Echo Bay Mines Limited from 1985 to 1989; Nuinsco and Deak International Resources Holding Limited in 1989; Cambior Inc. in 1996; Nuinscofrom 2003 to 2005; and Coventry Resources Inc. (“Coventry”) from 2010 to 2012. In addition, an RC drilling programme was completed by Nuinsco from 1985 to1986 to sample the overlying glacial till and the bottom of hole in bedrock to test for geochemical anomalism associated with gold mineralisation.
From 1960 through to 2012, 981 diamond drillholes were drilled for a total of 120,813 m. An additional 83 RC holes were drilled during the mid-1980s for a total of862 m.
Underground exploration of the Cameron Deposit commenced in October 1986 and was undertaken in two phases until July 1988 to verify the surface drilling results.Overall, 457 underground diamond drillholes were completed for a total of more than 21,707 m. An additional 55 diamond drillholes were drilled from underground fora total of 4,887 m between 1989 and 1990.
Sampling, analysis and data verification
Documentation regarding historic field procedures applied by previous explorers at the Cameron Gold Deposit, including details regarding sample collection,preparation, transportation and security, and analytical techniques, is poor or non existent. Prior to 1988, core was manually split, with half core sent for analysis. Post1988, drill core was cut using a masonry saw. The inclusion of control samples is assumed and is sometimes referenced in documentation but details regarding this arenot documented. For the 2010 to 2012 drill programmes, drill core was cut on site with wet masonry core saws by geotechnical personnel who are supervised byCoventry site based geologists. The selection of intervals for cutting and the length of these intervals was based on lithological, alteration or mineralisation boundariesas defined by the supervising geologist with 1 m intervals used in zones of similar lithology. Within mineralisation the sampling intervals vary from 0.06 m to 2 m.
Samples were received at the laboratory and checked against accompanying sample dispatch sheets to ensure all samples are delivered. Any discrepancies were notedand Coventry notified that resolution was required before the samples advanced through the preparation process.
Sample preparation comprised standard laboratory techniques of (i) drying for a minimum of 8 hours, (ii) mill crushing to greater than 70% passing 2 mm, (iii) rifflesplitting (using a Jones Splitter) to approximately 250 gm and (iv) disk pulverising to 85% passing 75 microns. The sample was then split to 30 g for analysis with theremainder retained as a pulp residue. The coarse remainder was put aside as a bulk residue (reject).
Overweight samples (>2.5 kg) were crushed and split into two samples, treating each as above and recombining after pulverising.
All samples were analysed for gold by accredited and independent Activation Laboratories Ltd. (“ActLabs”) at their Thunder Bay facility using method ‘1A3 Tbay Au– Fire Assay Gravimetric’. The 30 g assay sample was combined with fire assay fluxes (borax, soda ash, silica and a lead oxide litharge) and silver added as a collector.The mixture was placed in a fire clay crucible, preheated at 850°C, intermediate at 950°C and finished at 1060°C over approximately 60 minutes. The crucibles werethen removed from the assay furnace and the molten slag (lighter material) is carefully poured from the crucible into a mould, leaving a lead button at the base of themould. The lead button is then placed in a preheated cupel which absorbs the lead when cupelled at 950°C to recover the silver and gold doré bead.
Page 84
The gold was separated from the silver in the doré bead by parting with nitric acid. The resulting gold flake is annealed using a torch. The gold flake remaining isweighed gravimetrically on a microbalance. The detection limits are 0.03 ppm Au (lower) and 10,000 ppm Au (upper).
All drillcore from the 2010 and 2011 drilling programs is stored in covered steel core racks at the Cameron Gold Project. Every core box is labelled with Dymo tags,recording hole ID, box number and ‘from’ and ‘to’ depths.
All samples were individually bagged and labelled with unique sample numbers. Corresponding laboratory specific assay tags were included in each sample bag, whichwere then sealed with plastic zip ties and batched in woven nylon bags. Samples were transported via commercial road transport on a weekly basis during drillingprogrammes. The samples were taken to ActLabs in Thunder Bay or to the ActLabs sample preparation facility in Dryden before being transferred to Thunder Bay foranalysis.
Drill core was logged in the exploration camp at Cameron Lake. The core was logged for geology, alteration, mineralisation, structure and other geological featuressuch as veining. The core was photographed in wet and dry condition and stored in racks prior to sampling by core cutting. The drill core was marked up with thesample intervals and the core was cut using a diamond blade saw. Sample tickets were stapled into the wooden core trays and the other half put into the sample bag. Thesample number was also written on the outside of the calico sample bag for identification and sorting purposes. The core is stored in the exploration facility at theCameron Property. This has dedicated covered racks for storing drill core, wooden crates for sample residues, and sea containers for sample pulps.
All samples were individually bagged and labelled with unique sample numbers. Corresponding laboratory specific assay tags were included in each sample bag, whichwere then sealed with plastic zip ties and batched in woven nylon bags. Samples were transported via Gardewine North commercial road transport of Kenora. Thesamples were taken to ActLabs in Thunder Bay. Confirmation was sent to Chalice that the security tags were intact, and that the numbers match the sample despatchrequest.
As part of its QA/QC review, Optiro Pty Ltd. (“Optiro”) was provided a Microsoft access database containing two QA/QC tables. One table comprised standards andblanks and one table comprised duplicates assay results. Optiro exported these tables into CSV format and imported the QA/QC results into data analysis spread sheetsto review the Cameron QA/QC results.
The underground drilling data collected between 1987 and 1989 was considered critical to the quantity and quality of the 2014 Mineral Resource Estimate, and as noQA/QC information was available, Coventry undertook a re sampling program in order to establish confidence in the assay results. The Coventry re samplingprogramme targeted mineralisation in and around the underground development. Remaining core was quartered either using a core saw or manually (depending on corecondition) over the same sample intervals as currently recorded in the database. The re samples were prepared and assayed in exactly the same manner that samplesfrom Coventry’s diamond drilling programme were processed with sample preparation and analysis carried out at ActLabs in Thunder Bay. This re sample programmeprovided 816 directly comparable assay results, from a total of 1,904.6 m of drill core. The comparison is between half core (original sample) and quarter core(resample).
Page 85
Optiro only managed to identify 101 samples recorded in the QA/QC database to be duplicate samples and that were submitted by Coventry in 2010 and 2011. Optiro’sanalysis of the 101 identified quarter core duplicate samples indicates a poor repeatability of grades between paired samples with a correlation coefficient of 0.24. Theresults suggest that the duplicate samples are under reporting compared to the original grades at gold grades of less than 1 g/t Au, and over reporting compared to theoriginal grades at gold grades of greater than 2 g/t Au.
Results from the scatter plot, precision plot and relative difference plots highlight a moderate to poor precision and poor repeatability of duplicates from this resampleprogramme. In Optiro’s opinion the repeatability and precision of these duplicates does not demonstrate a high level of confidence. However, the small number ofsamples does not in Optiro’s opinion provide definitive evidence of issues with the duplicate repeatability. Optiro notes that consideration for differing sample volumesi.e. manually split half core (versus) sawn quarter core needs to be taken into account when reviewing duplicate analysis results. As such, whilst Optiro recommendsthat First Mining needs to review the performance of the Coventry resample programme further, Optiro considers these results to be adequate for resource estimation.
Optiro has identified 249 blanks submitted by Coventry as part of its resample programmes in 2010 and 2011. Of the 249 blanks submitted four returned grades above0.03 g /t Au. This represents a failure rate of less than 2%. Optiro considers these results to be adequate for resource estimation.
Optiro identified 236 standards submitted by Coventry as part of its resample programmes in 2010 and 2011. Of the 236 standards submitted, 10 different CertifiedReference Material (“CRM”) standards with gold grades ranging from 0.38 g/t to 7.97 g/t Au were used during the Coventry resample programme. A total of 55 goldstandards fall outside three standard deviations which represents a failure rate of approximately 23%. When graphed, it is evident that a large number of the standardfailures are potential sample swaps (i.e. incorrect standard labelling or blanks labelled as a standard). However, due to the close gold grades of a number of standards, itis not possible to determine with 100% accuracy what the actual standard ID might be.
Optiro does not know whether Coventry resubmitted all failed batches for re-analysis.
Optiro considers that the sample swaps should be rectified in the database so that the QA/QC performance is representative of the performance of the standards. Intaking these into account, Optiro considers that the CRM assay performance is adequate for estimation As part of their 2010 to 2012 drilling programmes, Coventrysubmitted standards, duplicates and blanks as part of their quality control program.
The blank material was obtained from a granite quarry and whilst not certified, was considered by Coventry to be sufficiently homogenous and unmineralised to act asbarren material. Of the 921 blanks submitted eight (8) returned grades above 0.03 g /t Au. This represents a failure rate of less than 2%. These failures were reviewed atthe time by Coventry and were considered to be potential laboratory contamination issues. Optiro considers these results adequate for resource estimation.
Of the 921 standards submitted, six were recorded as have grades of -99. Optiro removed these standards from the database prior to any further analysis. A total of 12different CRM standards with gold grades ranging from 0.69 g/t Au to 7.97 g/t Au were used during the Coventry drill programs.
Page 86
The provided database contained 901 quarter core duplicate samples collected by Coventry during the 2010 to 2012 drilling programmes. The duplicates demonstrate amoderate correlation coefficient (0.83) indicating moderate repeatability of grades between paired samples.
The relative precision of a field duplicate dataset is determined by calculating the absolute difference between the two sample’s grades divided by the mean of thesample pairs. Good or high precision suggests that the paired samples are consistent with each other, both samples have been well homogenised and that sample size(weight) is adequate to be representative of the material collected from the drillhole. Poor or low precision suggests that the samples have been poorly prepared, have ahigh inherent nugget, poor assaying, or are not large enough to be representative. Of the duplicates submitted to Actlabs, 74% of assays were within 5% precision, 76%within 10% precision, and 78% within 15% precision.
Results from the scatter plot, precision plot, and relative difference plots highlight a moderate to poor precision and moderate to poor repeatability of duplicates fromthese phases of drilling. Part of this could be due to the use of chisel vs. saw splitting, or the use of quarter vs. half core samples, which Optiro does not consider to be atrue representative duplicate sample when dealing with gold mineralisation. As previously stated, taking into account consideration for differing sample volumes (i.e.half core versus quarter core), Optiro considers these results to be adequate for resource estimation.
In 2014, Chalice undertook a resampling program to provide additional confidence in the underlying drillhole sample assays results used for Mineral Resourceestimation. The samples selected were considered to be spatially representative of the majority of the Cameron Gold Deposit with an emphasis on near surfacelocations. A total of 492 pulps and 325 coarse rejects were selected from the existing drillholes within the following series:
The following is an overview of the pulp sampling program taken from the Chalice 2014 Report.
The selected samples were renumbered (for disguise) and re submitted to ActLabs to preparation and analysis by the method adopted by Coventry and described inprevious reports.
Standards and Blanks were included with these samples positioned in the same location sequence as in the original submission; a new Standard was placed in theposition of the original Standard (the original Standard sample being exhausted by the analytical process) whilst the Blanks were retained from the original submissions.
Page 87
• Historical holes – resample of pulp samples only
• Coventry 2010 holes – pulps and rejects
• Coventry 2011 holes – pulps and rejects.
• Selected pulp samples were sent to AGAT Laboratories of Mississauga, Ontario – the Umpire Laboratory
• The samples were not re numbered given the sample sequence had never been seen by this laboratory
• The laboratory was requested to place an “A” prefix to the start of the sample number to distinguish these results from the original results.
• Standards and Blanks were included with these samples positioned in the same location sequence as in the original submission; a new Standard was placed in the position of theoriginal Standard (the original Standard sample being exhausted by the analytical process) whilst the Blanks were retained from the original submissions.
Results from the pulp duplicate analysis indicates a good repeatability of pulps, while results from the coarse reject analysis illustrates that the average grade of therejects is 4% lower than the original sample. Optiro was not provided with this data and as such has not been able to replicate these results.
Optiro considers the assay performance of the pulp and reject samples to provide good support for the representivity of the analytical results and for mineral resourceestimation.
In 2015, Chalice undertook two resampling programs of unsampled intervals within the Cameron Shear Zone. Optiro has based the following analysis of standards,duplicates and blanks submitted as part of the 2015 resampling programs based on the coding in the provided database.
Of 1,608 blanks submitted during the 2015 resample program, 10 returned grades above 0.03 g/t Au. This represents a failure rate of less than 1%. Optiro considersthese results to be a good measure of the sample preparation process and acceptable for resource estimation.
Of 1,644 standards submitted, 10 were recorded as ‘sample consumed’. Optiro removed these standards from the database prior to any further analysis. A total of 9different CRM standards with gold grades ranging from 0.34 g/t Au to 7.97 g/t Au were used during the Chalice resample programmes.
A total of 144 gold standards fell outside of three standard deviations, which represents a failure rate of approximately 9%. The majority (but not all) of the failuresappear to be sample swaps (i.e. incorrect standard labelling or blanks labelled as a standard). In this program, Chalice did not resubmit failed batches for re-analysis butOptiro recommends implementation of this protocol for future programs. In addition, Optiro notes the presence of what appears to be cyclic trends in the standardresults. Further investigation into these trends is recommended.
Of 1,629 quarter core duplicates submitted, one was recorded as having a grade of -99. Optiro removed this sample from the database prior to any further analysis. Theduplicates demonstrate a moderate correlation coefficient (0.79) indicating a moderate repeatability of grades between paired samples. Optiro notes there are a numberof original samples (43) with barren grade (<0.03 g/t Au) where the duplicate has returned gold grades ranging from 0.1 g/t Au to 2.42 g/t Au. Furthermore, there anumber of duplicate samples (47) of barren grade with an original grade ranging from 0.1 g/t Au to 3.1 g/t Au, suggesting that there are potentially sample swaps.
The relative precision of a field duplicate dataset is determined by calculating the absolute difference between the two sample’s grades divided by the mean of thesample pairs. Good or high precision suggests that the paired samples are consistent with each other, both samples have been well homogenised and that sample size(weight) is adequate to be representative of the material collected from the drillhole. Poor or low precision suggests that the samples have been poorly prepared, have ahigh inherent nugget, poor assaying, or are not large enough to be representative. Of the duplicates submitted to Actlabs 86% of assays were within 5% precision, 87%within 10% precision, and 88% within 15% precision.
Results from the scatter plot, precision plot, and relative difference plots highlight a moderate precision and a moderate repeatability of duplicates from theseresampling programs.
Page 88

Based on the good correlation coefficient and moderate repeatability performance of the duplicate samples Optiro considers the results from the Chalice 2015resampling program to be acceptable for use in a mineral resource estimate.
Aside from the pulp resample programme undertaken by Chalice in 2014, Optiro is unaware of any additional umpire duplicate sampling that has taken place atCameron Gold Project.
Data verification has been carried out by the author to verify the following elements:
Primary source data (surveys, downhole survey information, assay certificates) checked against database for errors and no material issues identified.
The results of the data validation process have verified the accuracy and integrity of the information provided by Chalice. It is Optiro’s opinion that the Camerondatabase is acceptable for the purpose of mineral resource estimation.
Mineral processing and metallurgical testing
A number of preliminary metallurgical studies have been carried out on samples from the Cameron Property from 1985 to the present. Multi-element geochemicalassays of the samples from the drillholes drilled between 2010 and 2012 have indicated that concentrations of deleterious elements (such as sulphur) are not significant.
Metallurgical test work carried out on samples representative of the style of mineralization at the Cameron Gold deposit showed that recoveries of 92% to 93% werereturned from direct cyanidation of samples ground to 75 μm. The results also showed that the recoveries were grind sensitive with maximum recoveries at a P80 grindsize in the range 53 to 75 μm. An alternative processing regime of sulphide flotation (mainly pyrite), regrind of flotation concentrate followed by intensive cyanidationof flotation concentrate and flotation tailings provided gold recoveries marginally higher than direct cyanidation. At a grind size of 75 μm the optimum leach time wasapproximately 24 hours.
Test work completed in 2013 by the Vancouver branch of SGS used a composite sample taken from 17 drillhole intersections from 14 separate drillholes at theCameron Project. Comminution tests indicated that:
Page 89
• Deposit location and geology confirmed by site visit to view outcrop exposures, drill core samples and photographs of drillcore
• Drill collar locations and grid co-ordinates verified by GPS check of randomly selected drill hole co-ordinates
• Downhole survey deviation compared on an random selection of drill holes
• Quantum of stated mineralisation supported by independent sampling of mineralisation
• Assay integrity verified by sample QA/QC analysis, no significant bias identified
• rod and ball mill bond work indices are low;
• moderate abrasion index within typical ranges for dolerite-basalt material; and
• JK breakage parameters indicating the material is highly competent.
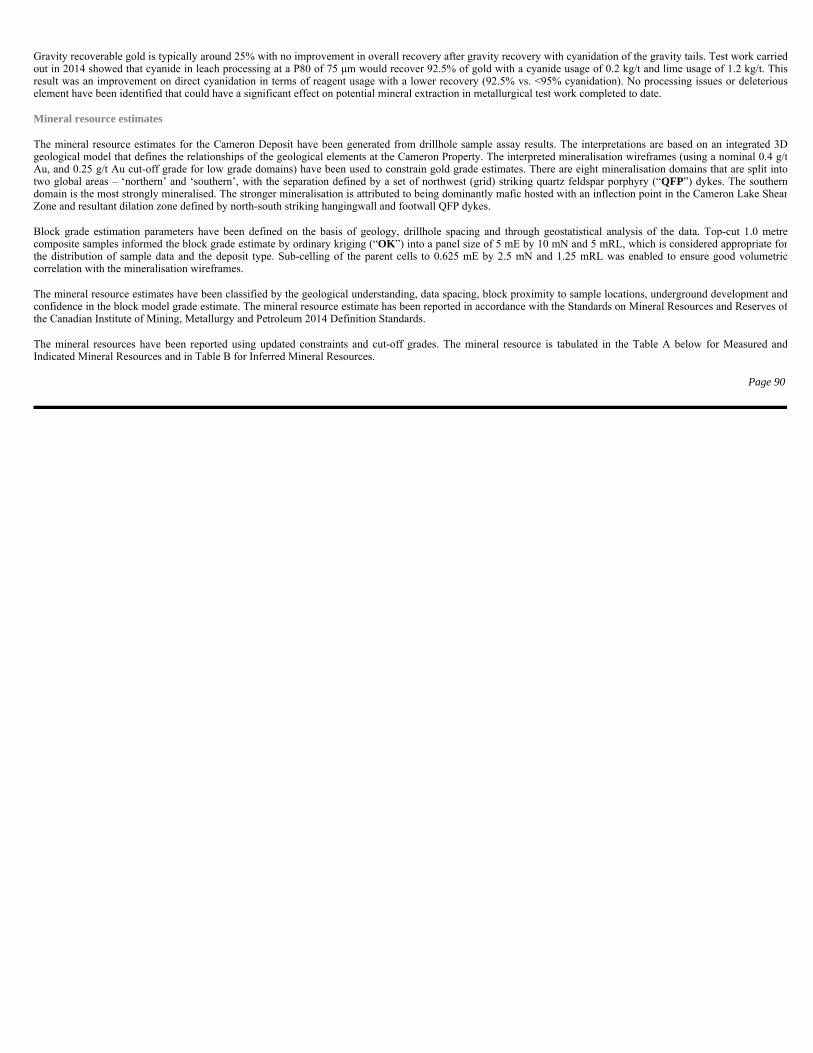
Gravity recoverable gold is typically around 25% with no improvement in overall recovery after gravity recovery with cyanidation of the gravity tails. Test work carriedout in 2014 showed that cyanide in leach processing at a P80 of 75 μm would recover 92.5% of gold with a cyanide usage of 0.2 kg/t and lime usage of 1.2 kg/t. Thisresult was an improvement on direct cyanidation in terms of reagent usage with a lower recovery (92.5% vs. <95% cyanidation). No processing issues or deleteriouselement have been identified that could have a significant effect on potential mineral extraction in metallurgical test work completed to date.
Mineral resource estimates
The mineral resource estimates for the Cameron Deposit have been generated from drillhole sample assay results. The interpretations are based on an integrated 3Dgeological model that defines the relationships of the geological elements at the Cameron Property. The interpreted mineralisation wireframes (using a nominal 0.4 g/tAu, and 0.25 g/t Au cut-off grade for low grade domains) have been used to constrain gold grade estimates. There are eight mineralisation domains that are split intotwo global areas – ‘northern’ and ‘southern’, with the separation defined by a set of northwest (grid) striking quartz feldspar porphyry (“QFP”) dykes. The southerndomain is the most strongly mineralised. The stronger mineralisation is attributed to being dominantly mafic hosted with an inflection point in the Cameron Lake ShearZone and resultant dilation zone defined by north-south striking hangingwall and footwall QFP dykes.
Block grade estimation parameters have been defined on the basis of geology, drillhole spacing and through geostatistical analysis of the data. Top-cut 1.0 metrecomposite samples informed the block grade estimate by ordinary kriging (“OK”) into a panel size of 5 mE by 10 mN and 5 mRL, which is considered appropriate forthe distribution of sample data and the deposit type. Sub-celling of the parent cells to 0.625 mE by 2.5 mN and 1.25 mRL was enabled to ensure good volumetriccorrelation with the mineralisation wireframes.
The mineral resource estimates have been classified by the geological understanding, data spacing, block proximity to sample locations, underground development andconfidence in the block model grade estimate. The mineral resource estimate has been reported in accordance with the Standards on Mineral Resources and Reserves ofthe Canadian Institute of Mining, Metallurgy and Petroleum 2014 Definition Standards.
The mineral resources have been reported using updated constraints and cut-off grades. The mineral resource is tabulated in the Table A below for Measured andIndicated Mineral Resources and in Table B for Inferred Mineral Resources.
Page 90
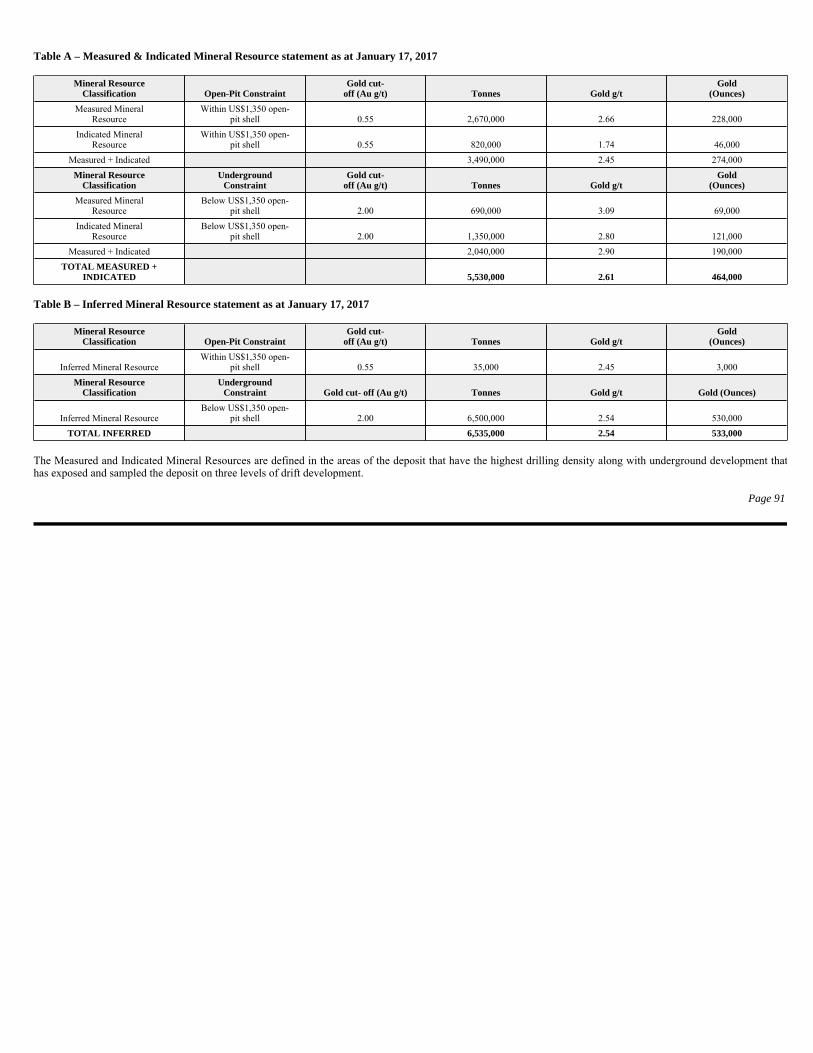
Table A – Measured & Indicated Mineral Resource statement as at January 17, 2017
Table B – Inferred Mineral Resource statement as at January 17, 2017
The Measured and Indicated Mineral Resources are defined in the areas of the deposit that have the highest drilling density along with underground development thathas exposed and sampled the deposit on three levels of drift development.
Page 91
Mineral ResourceClassification Open-Pit Constraint
Gold cut-off (Au g/t) Tonnes Gold g/t
Gold(Ounces)
Measured Mineral Resource
Within US$1,350 open-pit shell 0.55 2,670,000 2.66 228,000
Indicated Mineral Resource
Within US$1,350 open-pit shell 0.55 820,000 1.74 46,000
Measured + Indicated 3,490,000 2.45 274,000
Mineral ResourceClassification
UndergroundConstraint
Gold cut-off (Au g/t) Tonnes Gold g/t
Gold(Ounces)
Measured Mineral Resource
Below US$1,350 open-pit shell 2.00 690,000 3.09 69,000
Indicated Mineral Resource
Below US$1,350 open-pit shell 2.00 1,350,000 2.80 121,000
Measured + Indicated 2,040,000 2.90 190,000
TOTAL MEASURED +INDICATED 5,530,000 2.61 464,000
Mineral ResourceClassification Open-Pit Constraint
Gold cut-off (Au g/t) Tonnes Gold g/t
Gold(Ounces)
Inferred Mineral Resource Within US$1,350 open-
pit shell 0.55 35,000 2.45 3,000
Mineral ResourceClassification
UndergroundConstraint Gold cut- off (Au g/t) Tonnes Gold g/t Gold (Ounces)
Inferred Mineral Resource Below US$1,350 open-
pit shell 2.00 6,500,000 2.54 530,000
TOTAL INFERRED 6,535,000 2.54 533,000
Pickle Crow
Technical report
The Pickle Crow Property project (the “Pickle Crow Project”) description is based on the project’s technical report: A Mineral Resource Estimate for the Pickle CrowProperty, Patricia Division, Northwestern Ontario, Canada (dated June 2, 2011) (the “Pickle Crow Technical Report”). The report was prepared for us in accordancewith NI 43-101, by or under the supervision of B. Terrence Hennessey, P.Geo.; Alan J. San Martin, MAusIMM(CP); and Sam J. Shoemaker, B.Sc. MAuIMM, Reg.Mem. SME; all qualified persons within the meaning of NI 43-101. The following description has been prepared under the supervision of Dr. Chris Osterman, Ph.D.,P.Geo., who is a qualified person within the meaning of NI 43-101, but is not independent of us.
The conclusions, projections and estimates included in this description are subject to the qualifications, assumptions and exclusions set out in the Pickle Crow TechnicalReport, except as such qualifications, assumptions and exclusions may be modified in this AIF. We recommend you read the Pickle Crow Technical Report in itsentirety to fully understand the project. You can download a copy from our SEDAR profile (www.sedar.com), or from our website (www.firstmininggold.com).
Project description, location and access
The Pickle Crow Property is located in northwestern Ontario about 400 km north of Thunder Bay and approximately 11 km east of the town of Pickle Lake. The PickleCrow Property is centred at approximately 51º 31’ North latitude and 90º West longitude in NTS map area 52O/11.
The Pickle Crow Property can be reached from the city of Thunder Bay by proceeding westerly on the paved TransCanada Highway (Highway 17) for approximately245 km to the town of Ignace and then northward on paved Provincial Highway 599 approximately 290 km to the town of Pickle Lake. From Pickle Lake, access to thePickle Crow Property is along a good gravel road that connects to Highway 599 near the village of Central Patricia. The western boundary of the Pickle Crow Propertyis 6.5 km from the turn off at Highway 599. The total road distance to the Pickle Crow Property from Thunder Bay is approximately 545 km.
The Pickle Crow Property consists of 98 contiguous patented mining claims covering a surveyed area of 1,582.9 ha and 19 unpatented mining claims comprised of 166units covering an unsurveyed area of approximately 2,656 ha for a total of 117 claims comprised of 264 units totalling approximately 4,239 ha. Through our wholly-owned subsidiary, PC Gold, we are party to a 99 year mining lease (the “Mining Lease”) with Teck Resources Limited (“Teck”) which expires July 31, 2067. TheMining Lease requires payment of $1.00 per year which has been prepaid in full in advance. Registered ownership of mineral rights and surface rights for the PickleCrow patented claims is held by Teck as ‘fee simple, absolute’, the highest level possible.
Our leasehold interest in the patented claims is additionally subject to two NSRs totalling 1.25% . These royalties would be payable only upon commencement ofcommercial production. We have the option of purchasing these royalties. There are no other royalties, back-in rights or encumbrances on the Pickle Crow Property.
The unpatented portion of the Pickle Crow Property is subject to assessment work requirements.
Page 92
All phases of our exploration activities on the Pickle Crow Property are subject to environmental regulation. These regulations mandate, among other things, themaintenance of air and water quality standards and land reclamation and provide for restrictions and prohibitions on spills, releases or emissions of various substancesproduced in association with certain exploration and mining industry activities and operations. They also set forth limitations on the generation, transportation, storageand disposal of hazardous waste. A breach of such regulations may result in the imposition of fines and penalties. In addition, certain types of exploration and miningactivities require the submission and approval of environmental impact assessments.
The Pickle Crow Property has, over the course of the past two decades, been subject to several environmental studies which examined, among other things, waterquality and its impact, if any, on the health of aquatic populations in the watershed encompassing it. These preliminary studies indicate that in spite of the history ofmining on the Pickle Crow Property, including a significant volume of historical tailings sitting in four tailings basins on surface and extensive areas of flooded mineworkings, water quality samples generally meet provincial water quality standards. This appears to be due in part to the generally low sulphide content and naturalbuffering effect of the carbonate minerals found in the vein ore historically mined.
History
The Pickle Crow deposit was originally discovered in the early 1930s and commercial production at the mine began in 1935. The Pickle Crow mine operated until 1966during which time it produced 1,446,214 troy ounces of gold and 168,757 troy ounces of silver from 3,070,475 tons of ore milled (at an average grade of 0.47 oz./t or16.14 g/t). The Pickle Crow Property sat dormant from 1966 to the late 1970s.
In 1979, a VLF-EM (very low frequency-electromagnetic) geophysical survey of the Pickle Crow Property was performed and 47 surface diamond drill holes for 7,356m were drilled. The only known soil geochemical survey done on the Pickle Crow Property was completed in 1983. The samples were collected along the same cut gridlines as used for the VLF-EM survey. Soil values ranged from 10 to 12,000 ppb, with the high values attributed to the mine tailings and thought to be culturalanomalies.
Between 1985 and 1987, the most extensive exploration program on the Pickle Crow Property since its closure and up to that time was completed. The programconsisted of line-cutting, magnetometer and induced polarization geophysical surveying, geological mapping, surface trenching, diamond drilling and environmentalbaseline studies. In total, 286 surface diamond drill holes drilled for 46,189 m and 79 underground diamond drill holes for 9,341 m which were completed between1985 and 1988. Following completion of the program, all shafts, ventilation raises and other surface openings were capped with concrete in 1989 after an estimated $9.2million was spent on the Pickle Crow Property. Two historic (non-NI 43-101 compliant) resource estimates were commissioned, one in April of 1988 and a second inDecember of 1988.
A total of four surface diamond drill holes for 2,287 m were drilled in the fall of 1998. An additional 18 surface diamond drill holes were completed in 1999 for 2,173.5m.
Between 1999 and 2001, two bulk samples were taken from the No. 5 Vein and No. 1 Vein crown pillars respectively.
In 2002, the building of a 225 t/d extreme gravity mill was commenced on the site, a partially complete production closure plan was submitted to the then MNDM andconstruction of a tailings management facility within the historic Pickle Crow tailings area began. Stockpiling of material mined from the historic No. 1 Vein shaft andcrown pillar area in the summer of 2002 also commenced.
Page 93
On May 13, 2008, PC Gold acquired its interests in the Pickle Crow Property. It then launched the current exploration program in conjunction with the staking ofsurrounding unpatented claims which now define the boundaries of the current Pickle Crow Property.
Geological setting, mineralization and deposit types
The Pickle Crow Property lies within the Pickle Lake greenstone belt, part of the Uchi Subprovince, which is within the Superior Province of the Canadian Shield. ThePickle Lake greenstone belt comprises an approximately 70-km long by 25-km wide area of supracrustal rocks and internal granitoid plutons surrounded by largegranitoid batholiths.
The supracrustal rocks have been deformed and metamorphosed to greenschist facies with amphibolite facies occurring in the thermal aureoles of younger plutonicbodies. The Pickle Lake greenstone belt is subdivided into four tectono-stratigraphic assemblages including:
On the Pickle Crow Property, the Pickle Crow assemblage is dominated by tholeiitic basalts with intercalated sediments (primarily banded iron-formation, sometimesreferred to as BIF), and rare calc-alkaline volcanic and volcaniclastic units. The assemblage occupies the northwestern part of the greenstone belt and is interpreted to beunconformably overlain by the Confederation assemblage.
Gold mineralization on the Pickle Crow Property is orogenic in nature and occurs in complexly folded and sheared, mainly tholeiitic, volcanic rocks of the Pickle Crowassemblage near its contact with calc-alkaline volcanic/volcaniclastic rocks of the Confederation assemblage. Host rocks for the mineralization include tholeiitic lavas,banded iron formation, intermediate volcanic/volcaniclastic rocks and quartz feldspar porphyry. Gold occurrences on the Pickle Crow Property are associated with fourstyles of mineralization:
Page 94
• The Pickle Crow assemblage.
• The Kaminiskag assemblage (not present on the Pickle Crow Property).
• Unnamed Temiskaming-like assemblage.
• The Confederation assemblage.
• Narrow, high-grade gold-scheelite-bearing quartz veins, which were the main source of gold produced at the Pickle Crow mine from 1935 to 1966.
• Iron formation-hosted gold mineralization adjacent to vein structures. The iron formation contains stringers and discontinuous lenses of quartz and the iron-bearing minerals havebeen replaced by sulphides. Both quartz and sulphides are gold- mineralized. Only a limited amount of this type of material was processed at the Pickle Crow mine. However, ironformation-hosted gold was the main ore type at the adjacent Central Patricia mine to the southwest.
• Shear zone-hosted gold mineralization consisting of complex wide zones of intense shearing and alteration which are intimately associated with the intrusion of the Albany porphyryand characterized by disseminated pyrite, discontinuous quartz veining and sulphidation of interflow iron formation.
• Arsenopyrite-associated gold mineralization which typically occurs as disseminated to semi- massive arsenopyrite and quartz-arsenopyrite stockworks hosted by iron formation butcan be also found, to a lesser extent, in shear zones and/or quartz veins in volcanic rocks. Similar arsenopyrite-rich iron formation-hosted gold was the main ore type at the adjacentCentral Patricia mine.
We consider the gold occurrences in the Pickle Lake mining camp to be classical examples of deposits grouped under the descriptive model of Archean low-sulphidegold- quartz veins. This deposit type is also known as shear- zone-hosted gold, Archean quartz-carbonate vein gold deposits, Archean lode gold, Archean mesothermalgold or orogenic gold.
Exploration
In 2007, sourcing and compilation of available historical data was started.
In October 2007, a total of nine samples from the Pickle Crow Property. Two types of samples were obtained on a spontaneous and random basis : eight field duplicatesplit core samples from a series of drill holes that are stored at two locations on the Pickle Crow Property and one composite chip channel sample taken from theoutcropping one vein in its bulk sample pit.
Starting in the spring of 2008 PC Gold commenced an extensive exploration program consisting of locating historical drill collars with a differential GPS; surveyinghistorical shafts; reconnaissance geological mapping and relocating historical trenches; limited channel sampling and mapping of historical trenches and diamonddrilling of 33 holes with up to 2 rigs totalling 8,638 m in the core mine trend to confirm historical holes. This program confirmed the results of historical drill holes andprovided confidence in the digital database.
Field exploration was renewed in the spring of 2009 with a focus continuing on the core mine trend. This exploration program consisted of diamond drilling of 34 holeswith up to 3 rigs totalling 14,308 m; shallow drilling targeting; U-Pb age dating of detrital zircons from two samples; line cutting (114.9 km) on the core mine andCohen-MacArthur trends; a Titan IP (71.45 line-km, 80.25 km with current extensions) and ground magnetometer survey (110 line-km); and prospecting with a focuson the Cohen-MacArthur trend. The most significant results of the 2009 program were the discovery of Conduit Zone 1, the discovery of Pickle Crow type high-gradeveins hosted in intermediate volcanic rocks and gabbro of the Confederation assemblage (Confederation veins), possibly representing surface expression of a vein, theidentification of Temiskaming-like sediments in the core mine trend, and the identification of the Cohen-MacArthur trend by geophysics.
In 2010, exploration continued with the focus remaining on the core mine trend but expanding to include the Cohen-MacArthur trend. The exploration programconsisted of diamond drilling of 106 holes with up to 4 rigs totalling 35,545 m, including helicopter supported drilling; and trenching program consisting of 9 trenchestotalling approximately 32,000 m2 including 1,707 channel samples. The most significant results of the 2010 program were the discovery of the no. 19 vein, theKawinogans Zone and the Central Pat East Zone and the extension of the No. 1 Vein 700 m below the historical workings. The No. 20 and 21 Veins were alsodiscovered.
As of March 12, 2011, the exploration program continued with drill testing of the core mine but with a focus on regional targets along the Cohen-MacArthur trend. Theexploration program consisted of diamond drilling of 11 holes with up to 3 rigs, totalling 4,476 m; 881.4 line-km of 50-m spaced helicopter borne AeroTEM andmagnetometer surveys; and completion of baseline water sampling and sampling of stockpiled high and low grade ore for finalizing the closure plan. Significant resultsof the 2011 exploration program to date include the expansion of the Central Pat East Zone as a possible near surface, bulk tonnage target and the continued expansionof the No. 19 Vein.
Page 95
On April 18, 2011, PC Gold announced a 1.26 million ounce NI 43-101-compliant inferred mineral resource, audited by Micon International Limited (“Micon”), whichtriggered the preparation of the Pickle Crow Technical Report.
Drilling
Since acquiring the Pickle Crow Property in early May 2008, PC Gold has conducted an aggressive diamond drill program designed to confirm and expand the historicresources and make new discoveries. The most prominent of these new discoveries was the No. 19 Vein with 15.95 g/t Au over 0.70 m. Follow-up intercepts of the zoneincluded 43.28 g/t Au over 13.13 m and are considered by PC Gold to represent the most significant discovery since the closure of the mine in 1966. Other discoveriesinclude the Conduit Zones in the Albany Shaft area and the Central Pat East Zone along the Cohen-MacArthur trend.
A total of 184 holes totalling 62,968 m have been drilling on the Pickle Crow Property between June 2008 and March 12, 2011. Drilling was completed in three phasesas described above.
All holes were drilled with NQ-sized core (47.6 mm) with the exception of 9 BQ Thin Wall holes (40.7 mm) drilled.
The bulk of the PC Gold holes were drilled in the core mine trend with the second largest concentration along the Cohen-MacArthur trend. Several new mineralizedzones were intersected. Other newly discovered zones include the No. 20 and 21 Veins, the Confederation Veins, and the Kawinogans Zone. Significant extensions toknown zones include extending the No. 1 Vein at Shaft 1 to 1,500 m depth and the intersection of abundant quartz veining beneath the workings of Shaft 3 which isinterpreted to be the extension of the No. 6 and 7 Veins.
The drilling program has extended several known zones and outlined new discoveries. These include high grade, narrow vein targets and more disseminated bulktonnage targets which may be amenable to open pit or underground bulk mining.
Sampling, analysis and data verification
Two types of sample collected by PC Gold during exploration of the Pickle Crow Property were used in the preparation of the mineral resource estimate presented inthe Pickle Crow Technical Report, channel samples from trenches and diamond drill core.
Channel Samples – Collection of the trench channel samples was completed after the trenches were excavated, washed and mapped. Channel sampling was performedutilizing a Stihl ‘quick-cut’ rock saw. Two continuous parallel cuts were sawn approximately 5 cm apart and approximately 5 cm deep, with the rock in between thenchipped out using a chisel. Sample lengths varied between 0.3 and 2.0 m averaging 0.90 m. Each sample was placed in a thick plastic bag with the sample numberclearly written on the outside of the bag with permanent marker and with one portion of a three part sampling ticket placed inside. Each sample was sealed with a cablestrap. The location of the samples was noted in the sample book and on the trench map. Aluminum tags with etched sample numbers were hammered into the cross cuts,using cement nails, at the beginning of each sample interval for a permanent record on the trench. Once collected, the samples were bagged and shipped as per thesample shipment procedures described below, with the exception that all channel samples were shipped to AGAT Laboratories Ltd. (“AGAT”) of Mississauga, Ontario.
Page 96
Diamond Core Logging and Sampling – NQ diameter (47.6 mm) drill core was logged, then sawn in half using diamond bladed saws at the secure logging/core-cuttingbuildings onsite, under the overall supervision of the logging geologists. The core was sawn in half following a sample cutting line determined by the geologists duringlogging. After cutting, one half of the core was bagged, labelled and sealed with a zip tie or staples after one part of the three part sample tag was placed inside. Thesecond part of the sample tag was stapled into the core box at the beginning of each sample. The third part of the tag was kept in the sample tag book as a permanentrecord. The remaining half core was placed in core boxes to serve as a permanent record and stored in a secure onsite facility. All samples were shipped from the site ina locked wooden crate with security tags. The samples were transported via Manitoulin Transport to laboratory preparation facilities in Thunder Bay, Ontario forcrushing, pulverization and pulp preparation. In 2008, samples were shipped to ALS Chemex’s (“ALS”) facility in Thunder Bay. In 2009 and 2010, samples were sentto Accurassay in Thunder Bay.
Once the core/channel samples were cut, bagged and sealed with zip ties or staples, ten samples were put into a larger rice bag, which was then sealed with a secure,numbered security tag. The security tag numbers were recorded along with the corresponding samples within the bag, and then shipped in the locked wooden crates tothe laboratory. Once they arrived at the laboratory, the security tags and corresponding samples were recorded again by the laboratory and emailed back to the PC Goldfield site for confirmation. Prior to shipment the sample bags were stored in a locked building onsite. The site is always occupied. No samples were left at the projectsite during field breaks.
A total of 5,797 drill samples, which include QA/QC samples (i.e. duplicates, standards and blanks) were submitted to ALS in 2008 for analysis. A total of 42,392 drillsamples, including QA/QC samples, were submitted to Accurassay in 2009 and 2010 for analysis. A total of 1,577 channel samples, including QA/QC samples, weresubmitted to AGAT in 2010 for analyses.
For the analysis of Pickle Crow Property drill core samples, ALS was chosen as the primary laboratory in 2008. Accurassay was chosen as the primary laboratory fordrill core samples in 2009 and going forward.
In 2008, samples were crushed and prepared at ALS’ facilities in Thunder Bay, Ontario and sample pulps were shipped to its North Vancouver, British Columbialaboratory for analysis. ALS’ facilities in Thunder Bay are certified to ISO 9001. The laboratory in North Vancouver is accredited to ISO 17025 for gold fire assay byatomic absorption and gravimetric finish as well as four-acid multi-element analysis by ICP and MS. In 2009 and 2010, samples were crushed, prepared and analyzed atthe Accurassay facility in Thunder Bay, Ontario. Accurassay is accredited to ISO 17025 for gold by fire assay with atomic absorption finish. The trench channelsamples were assayed at AGAT in Mississauga, Ontario. AGAT is accredited to ISO 17025.
All samples sent to ALS for analysis were prepared using a jaw crusher, which was cleaned with compressed air between samples, resulting in 70% of the samplepassing through a 10 mesh screen. A 1,000 g split of the crushed sample was then pulverized to 85% passing a 200 mesh screen. All samples sent to Accurassay foranalyses were prepared using a jaw crusher, which was cleaned with a silica abrasive between samples, resulting in 90% of the sample passing through an 8 meshscreen. A split of the crushed sample weighing 1,000 g was then pulverized to 90% passing a 150 mesh screen. AGAT’s sample preparation procedures includecrushing to 75% passing 2 mm and pulverizing to 85% passing 75 µm.
Page 97
For all three laboratories, the prepared sample pulps were analyzed for gold by fire assay using 50-g sample charge with AAS finish. If the returned assay result wasequal to or greater than 5 g/t then the sample was reassayed by fire assay with gravimetric finish. All samples greater than 10 g/t, and any samples suspected of nuggetgold (quartz veins) were additionally sent for pulp metallics analysis using the remainder of the pulp (~950 g of sample).
PC Gold has completed bulk density measurements on 2,602 samples of mineralized and unmineralized diamond drill core, and select grab samples from “ore”stockpiles onsite from the Pickle Crow mine. Of these, 1,918 measurements were used in the calculation of average specific gravity for the Pickle Crow Property.During a review of the data, 684 measurements were discarded due to laboratory errors that produced unrealistic specific gravity values.
Diamond drill hole data and trench data in stored in Excel spreadsheets. These can easily be imported into Microsoft Access database software and used in manyresource estimation/mine planning software packages. We also use Gemcom software to evaluate drill results and has the finalized data stored in Microsoft Access.Excel is used to manage the data and QA/QC program.
The Pickle Crow Project QA/QC program includes the use of crush duplicates, ¼-split drill core (field duplicates), the insertion of certified reference materialsincluding low, medium and high grade standards and coarse blanks. This is accomplished by inserting the QA/QC samples sequentially in the drill core samplenumbering system. One set of the four QA/QC types were inserted every 30 samples, consisting of 1 crush duplicate, 1 quarter-split field duplicate, 1 standard(alternating between a low, medium and high standard), and 1 blank. This resulted in approximately every seventh sample being a QA/QC sample.
Sample assay results are evaluated through control charts, log sheets, sample logbook and signed assay certificates to determine the nature of any anomaly or failure.Identified failures are re-assayed by the laboratory at which the failure occurred until a cause of the failure and correct analysis is obtained. Check assaying is alsoconducted on approximately 1 in every 20 samples. The pulps are re-numbered with new, sequentially-inserted QA/QC samples and sent to a second ISO certifiedlaboratory (Actlabs of Ancaster, Ontario).
Approximately 1 out of every 20 samples for the Pickle Crow Project were submitted to a second laboratory, Actlabs, an ISO 17025 certified laboratory with a samplepreparation and analytical facility in Ancaster, Ontario. The assaying protocol used is similar to ALS and Accurassay’s using fire assaying with a 50-g charge and AASfinish. Samples above 3 g/t Au are re-assayed using a gravimetric finish, and above 10 g/t by pulp metallic methods. A total of 2,117 check samples were sent toActlabs. Check assays generally matched the value obtained by the original laboratory and the overall variation between laboratories was well within the naturalvariation of the sample material as indicated by the field and crush duplicates.
During the October, 2011 site visit, Micon did not complete any check sampling. Micon did examine surface exposures and stockpiles of mineralization from the No. 1Vein and No. 5 Vein. Visible gold was noted in the samples on the No. 1 Vein stockpile.
The final database was sent to Micon in early March, 2011 for validation. Micon performed a thorough validation of the database and specifically performed a cross-check validation of the assay table against assay results received directly from the laboratories in electronic form. The cross-check validation of the assay tabledescribed above was possible only for the newer PC Gold-generated data which contained laboratory sample identification numbers.
Page 98

Several minor problems were found and corrected, most of them located out of the modelled zones. The problems were related to the fact that the majority of thedatabase was collected from historical data digitized from old paper logs.
It is Micon’s opinion that PC Gold is running an industry standard QA/QC program for its database and insertion of control samples into the stream of core and channelsamples for the Pickle Crow project exploration program.
While certain minor discrepancies in survey data of old workings have been noted it has been determined they will only affect the precise location in space of theworkings and are not likely to materially affect the estimate of remaining volumes of mineralization. As such they are suitable for use in an inferred resource estimate.Determination of measured and indicated resources or reserves in the future will require resolution of these minor discrepancies, likely by dewatering and reaccessingthe workings.
The historic drill data have been shown to be acceptable for use in a mineral resource estimate with appropriate application of assay top cuts as discussed above.
Mineral processing and metallurgical testing
The historic ore produced at the Pickle Crow mine presented no major milling problems.
Pickle Crow Mill, 1935-1966: The long since removed process plant for the Pickle Crow mine ran from 1935 to 1966. The 400 ton/day (360 t/d) mill recovered gold bya combination of gravity/amalgamation and cyanidation. Overall gold recovery averaged slightly over 98%. When the mine closed in 1966 efficiency in the gravitysection had been improved to achieve as much as 60% of the total recovery.
1999-2002: In October 1999, prior to mining the first of two bulk samples, grab samples were collected from the surface exposures of the No. 5 Vein. These sampleswere sent to ORTECH Inc. of Mississauga, Ontario for bottle roll leach tests. The bottle roll tests were conducted on minus 8 material assaying 53.2 g/t Au, and minus100 mesh material assaying 40.04 g/t Au. After 48 hours, 53.5% and 95.4% recoveries were achieved for the minus 8 and minus 100 mesh fractions respectively.
No. 5 Vein Crown Pillar Bulk Sample: In December 1999, a bulk sample from the No. 5 Vein crown pillar was mined and sampled, estimated to contain 9,500 tons(8,600 tonnes) averaging 0.38 oz./t Au (13.02 g/t Au) assuming a 3.0 ft. (0.91 metre) minimum mining width; cut to 1 oz./t and 25% diluted. The average grade of theresource block was determined using a weighted average 9 drill hole and channel samples located inside the block. The bulk sample was carefully mined from a smallopen pit, with vein material comprising an estimated 95% and wall rock dilution only 5% of the sample. The bulk sample was shipped to the St. Andrews GoldfieldsLtd. 1,300 t/day CIP (carbon-in-pulp) gold process plant located at Stock Township near Timmins, Ontario for custom milling. The shipment was processed onDecember 21, 1999. The commercial settlement was agreed upon at a recovered grade of 16.72 g/t Au (0.49 oz./t Au).
No. 1 Vein Crown Pillar Bulk Sample: A second phase of bulk sampling was initiated in 2000. 4,427 tonnes of material (over 90% from the No. 1 Vein) were trucked tothe Golden Giant mill near Hemlo, Ontario for custom milling. The custom milling flowsheet included secondary crushing, grinding, gravity concentration, leaching,CIP, stripping, electrowinning and refining. The shipment was processed between December 4 and 10, 2000. The commercial settlement was agreed upon at arecovered grade of 16.72 g/t Au (0.49 oz./t Au). Prior to accepting the Pickle Crow Property bulk sample, laboratory metallurgical tests were completed to determine ifthe material could be treated at the mill and if the tailings produced would have a negative environmental impact on the tailings basin. No environmental problems werenoted. The test work indicated that about 40% of the gold was recoverable with a single pass gravity Knelson concentrator. The remaining gold could be easily leachedwith cyanidation with an optimum grind of 75% passing 200 mesh. Test work indicated that higher grinds could result in lower gold recoveries. Leach retention timesof greater than 48 hours might be required. An overall recovery of 98.4% was achieved in the tests.
Page 99
No. 1 Vein Crown Pillar Bench Scale GRG & Leaching Test work: A set of five approximately 20 kg samples from the No. 1 Vein Crown Pillar bulk sample weresubmitted to the Knelson Research and Testing Centre (“KRTC”) in Langley, British Columbia for gravity-recoverable-gold (“GRG”) and leaching testwork. Thesesamples were sent from the Golden Giant mine. The samples were received at the KRTC facility on July 3, 2001. The samples were weighed and logged prior to anyprocessing. The primary objective of this test work was to quantify the gravity recoverable gold content of the ore using a standard test. The secondary objectives wereto determine the average head grade of the sample and to perform cyanide leach tests on sub-samples of the final tails. A KC-MD3 laboratory scale KnelsonConcentrator was utilized for the GRG test work.
The procedure used for the KC-MD3 stage test was as follows:
This testing scheme is based on the philosophy that progressive size reduction allows the determination of gold liberated at finer grinds without over-grinding andsmearing coarse gold present in the initial sample.
Page 100
• The samples were sorted by time and date into lots of approximately 20 kg.
• Each sample was screened at 10 mesh prior to the first pass through the KC-MD3 in order to prevent plugging. The oversize was saved and subsequently added into the first grind.
• The ~20 kg test samples were processed through a 3” Laboratory Knelson Concentrator at a fluidization water flow rate of ~3.5 litres/min and at 60Gs.
• During the test, sub-samples of the tailings stream were collected for assays.
• At the end of the concentration stage, the concentrate was washed from the inner cone of the KC- MD3.
• The concentrate was panned to produce a pan concentrate and pan tailings (middlings) sample.
• The concentrate and tailings samples were labelled, dried, weighed and sent to an independent local lab for assaying.
• The tailings were re-ground two more times and steps 3 to 6 were repeated after each grind.
• During the final stage, an additional 2 kg sample of the tails was sub-sampled, dried and sent for cyanide leach test work.
• The remaining tails samples are being stored at the test facility.
Results indicate that the No. 1 Vein crown pillar samples have a very high gravity-recoverable gold content of 91.2% with a back-calculated head grade of 20.0 g/t Au.The overall mass pull to the concentrate was 1.4% . The results indicate that the gold is fairly liberated in this particular material and is readily recoverable. Visible goldwas observed in all final concentrate samples.
Cyanide leaching was performed on sub-samples of the final GRG test tails.
The gold recoveries from leaching ranged from 93.5% to 95.4% . When the leach recoveries are combined with the gravity stage recoveries, the overall recoveriesexceed 99% for all samples. The final tailings assays were very low ranging from 0.09 to 0.11 g/t Au. Based on the encouraging bench scale GRG test results on the No.1 Vein crown pillar it was decided to commission the construction of a 225 tonne per day (~250 t/d) extreme gravity gold mill at Pickle Crow.
The concept of “extreme gravity” is a series of innovations that have resulted in a reintroduction of gravity recovery systems into the milling operations of most goldmines. Traditionally, most gold milling circuits are designed around flotation and cyanidation requirements, with the gravity circuit being fit in where possible. Extremegravity takes the approach of optimizing the circuit in order to maximize recovery by gravity. In some cases gravity systems can achieve high enough recoveries toeliminate the need for chemical systems such as cyanidation and flotation.
The benefits of extreme gravity include relatively low capital costs compared to conventional gold mills, reduced permitting, short project lead time, and much reducedenvironmental issues with no use of cyanide or other chemicals. In addition small plants can be modular and easily moved between locations.
Pickle Crow Tailings Bench Scale GRG & Leaching Test work: In September 2001, a composite sample from Tailings Area 1 was submitted to Lakefield Research ofLakefield, Ontario for cyanide leach test work. The sample, a blend of oxidized (10%) and unoxidized (90%) tailings, was leached for 48 hours. In May-June, 2002, aset of two approximately 8 kg composite samples from Tailings Area 3 were subjected to ‘gravity recoverable gold’ and cyanide leach test work. Composite A wasmade up of auger drill hole sample material assaying >0.3 g/t Au and composite B material assaying <0.3 g/t Au. The GRG test work was performed by the KnelsonResearch and Testing Centre in Langley, British Columbia and leach tests were conducted at Accurassay of Thunder Bay, Ontario.
We have completed no additional metallurgical test work as of this date.
Mineral resource estimates
The resource estimate in the Pickle Crow Technical Report represents the first mineral resource estimate on the Pickle Crow Property that was completed in accordancewith NI 43-101. The Pickle Crow project resource estimate is divided into three distinct areas within the core mine trend comprising three mineralization styles, highgrade narrow veins, iron formation-hosted and alteration-shear zone-hosted gold mineralisation.
The mineral resources were estimated using kriging, where variograms could be modelled, and inverse distance cubed interpolation elsewhere. Based on the use ofhistoric drilling and the somewhat imprecise modelling of the underground workings, the resources have been classified as inferred under the CIM guidelines. Theresources were reported using a Whittle optimized pit shell or at underground cut-off grades.
Page 101
The resulting estimate of inferred mineral resources for the Pickle Crow project is presented in Table A below.
Table A – Estimated Inferred Mineral Resources for the Pickle Crow Project
* Represents a combination of potentially bulk mineable underground resources (2.0 g/t Au cut-off) and cut-and-fill underground resources (2.8 g/t Au cut-off, withvein intersections diluted to a minimum of 1 m).
Notes:
Considering that a combination of current drilling, historic drilling and underground chip samples were used in the resource estimation, no particular common sample grid exists. There also exists a known minor error in terms of sample location and the accuracy of the digitized underground workings. However, even though these known inaccuracies exist, the grade and tonnage discrepancy caused by this margin of error is within reasonable doubt for an inferred resource and the estimate is reported as such.
Recent activities
In November 2016 we commenced a diamond drilling program at our Pickle Crow Project with a focus on identifying new high-grade vein gold mineralization. InFebruary 2017, we announced the results of this exploration drilling program. A total of nine holes comprising approximately 1,300 m were drilled. The drill programtargeted several shallow, high-grade vein and banded iron formation hosted targets in the core mine trend. The objective of the program was to test extensions of knownvein zones and discover new high-grade gold mineralization.
Page 102
Pickle Crow Mine Category
Grade (g/t Au) Tonnes
Contained Ounces
Cut-off Grade (g/t
Au)
Percentage of Total Ounces
Total Underground 5.4 6,522,000 1,136,000 2.25* 90
Total Open Pit 1.1 3,628,000 126,000 0.35 10
Grand Total
3.9 10,150,000 1,262,000
1. The mineral resource estimate is entirely classified as inferred mineral resources. 2. CIM Definition Standards were followed for mineral resources. 3. The cut-and-fill (high-grade vein) underground component of the mineral resource has been estimated at a cut-off grade of 2.8 g/t Au over a minimum width of 1 m. Vein widths less
than 1 m were diluted to 1 m prior to application of the 2.8 g/t Au cut-off grade. Grade and tonnes for the cut-and-fill component of the mineral resource are reported as diluted gradeand tonnes.
4. The long-hole bulk underground (moderate-grade) component of the mineral resource has been estimated at a cut-off grade of 2.0 g/t Au. 5. The open pit (low-grade) component of the mineral resource has been estimated at a pit discard cut-off grade of approximately 0.35 g/t Au, using a preliminary Whittle pit shell to
constrain the resource estimate and other assumed pit parameters. 6. The open pittable mineral resource extends to a depth of approximately 150 m below surface. Only mineralization located within the pit shell has been reported at open pit cut-off
grades. 7. The mineral resource has been estimated using a gold price of US$1,100/oz. 8. High-grade assays have been capped. Each domain was capped with respect to their unique geology and statistics. Caps for cut and fill (high-grade vein) underground resources
range from 35 g/t to 145 g/t Au. 9. Specific Gravity (bulk density) of 3.14 t/m3 was used for BIF and 2.70 t/m3 was used for veins. 10. The mineral resource was calculated via block model. Three dimensional wireframes were generated using geological information. A combination of kriging and inverse distance
estimation methods were used to interpolate grades into blocks of varying dimensions depending on geology and spatial distribution of sampling.11. Mineral resources that are not mineral reserves do not have demonstrated economic viability. There is currently insufficient exploration to define these inferred resources as an
indicated or measured resources and it is uncertain if further exploration will result in upgrading them to an indicated or measured resource category. 12. Mineral resources have been adjusted for mined out areas. Small rib and sill pillars around old stopes have not been considered.13. Numbers may not add due to rounding.
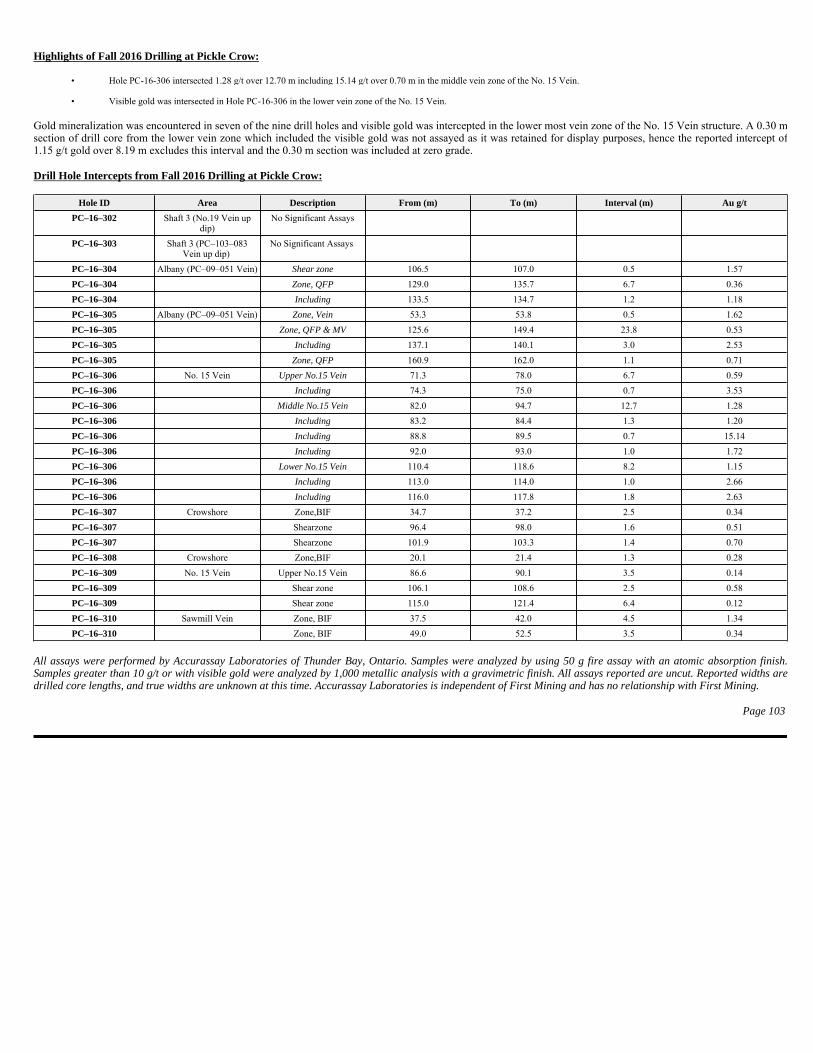
Highlights of Fall 2016 Drilling at Pickle Crow:
Gold mineralization was encountered in seven of the nine drill holes and visible gold was intercepted in the lower most vein zone of the No. 15 Vein structure. A 0.30 msection of drill core from the lower vein zone which included the visible gold was not assayed as it was retained for display purposes, hence the reported intercept of1.15 g/t gold over 8.19 m excludes this interval and the 0.30 m section was included at zero grade.
Drill Hole Intercepts from Fall 2016 Drilling at Pickle Crow:
All assays were performed by Accurassay Laboratories of Thunder Bay, Ontario. Samples were analyzed by using 50 g fire assay with an atomic absorption finish.Samples greater than 10 g/t or with visible gold were analyzed by 1,000 metallic analysis with a gravimetric finish. All assays reported are uncut. Reported widths aredrilled core lengths, and true widths are unknown at this time. Accurassay Laboratories is independent of First Mining and has no relationship with First Mining.
Page 103
• Hole PC-16-306 intersected 1.28 g/t over 12.70 m including 15.14 g/t over 0.70 m in the middle vein zone of the No. 15 Vein.
• Visible gold was intersected in Hole PC-16-306 in the lower vein zone of the No. 15 Vein.
Hole ID Area Description From (m) To (m) Interval (m) Au g/t
PC–16–302 Shaft 3 (No.19 Vein up dip)
No Significant Assays
PC–16–303 Shaft 3 (PC–103–083 Vein up dip)
No Significant Assays
PC–16–304 Albany (PC–09–051 Vein) Shear zone 106.5 107.0 0.5 1.57
PC–16–304 Zone, QFP 129.0 135.7 6.7 0.36
PC–16–304 Including 133.5 134.7 1.2 1.18
PC–16–305 Albany (PC–09–051 Vein) Zone, Vein 53.3 53.8 0.5 1.62
PC–16–305 Zone, QFP & MV 125.6 149.4 23.8 0.53
PC–16–305 Including 137.1 140.1 3.0 2.53
PC–16–305 Zone, QFP 160.9 162.0 1.1 0.71
PC–16–306 No. 15 Vein Upper No.15 Vein 71.3 78.0 6.7 0.59
PC–16–306 Including 74.3 75.0 0.7 3.53
PC–16–306 Middle No.15 Vein 82.0 94.7 12.7 1.28
PC–16–306 Including 83.2 84.4 1.3 1.20
PC–16–306 Including 88.8 89.5 0.7 15.14
PC–16–306 Including 92.0 93.0 1.0 1.72
PC–16–306 Lower No.15 Vein 110.4 118.6 8.2 1.15
PC–16–306 Including 113.0 114.0 1.0 2.66
PC–16–306 Including 116.0 117.8 1.8 2.63
PC–16–307 Crowshore Zone,BIF 34.7 37.2 2.5 0.34
PC–16–307 Shearzone 96.4 98.0 1.6 0.51
PC–16–307 Shearzone 101.9 103.3 1.4 0.70
PC–16–308 Crowshore Zone,BIF 20.1 21.4 1.3 0.28
PC–16–309 No. 15 Vein Upper No.15 Vein 86.6 90.1 3.5 0.14
PC–16–309 Shear zone 106.1 108.6 2.5 0.58
PC–16–309 Shear zone 115.0 121.4 6.4 0.12
PC–16–310 Sawmill Vein Zone, BIF 37.5 42.0 4.5 1.34
PC–16–310 Zone, BIF 49.0 52.5 3.5 0.34

QA/QC Procedures
NQ diameter (47.6 mm) drill core was logged then sawn in half on-site, with one half bagged and labelled and the other half placed in core boxes to serve as apermanent record and stored in a secure on-site facility. All samples were shipped from the site via Manitoulin Transport to the Accurassay Laboratories facility inThunder Bay, Ontario, for crushing, pulverization and pulp preparation. Accurassay Laboratories is independent of First Mining and has no relationship with FirstMining.
All samples sent for analyses were prepared using a jaw crusher, which is cleaned with compressed air between samples, resulting in 70% of the sample passing througha 10 mesh screen. A 1,000 g split of the crushed sample was then pulverized with 85% passing through a 200 mesh screen. Fire assays were performed using 50 g ofsample with assays equal to or greater than 5 g/t calculated gravimetrically, and lower grade samples measured by atomic absorption (AA). All samples greater than 10g/t were additionally sent for screen metallics analysis using the remainder of the pulp (~950 grams of sample). Blanks, standards (one high-grade, one mid-grade, andone low-grade), field duplicates (1/4 split cores), and crush duplicates were inserted into the drill core samples sequentially, at least every 8th sample, before shipment.Standards consisted of a high-grade (~13 g/t Au), a mid-grade (~5 g/t Au), and a low-grade (~1 g/t Au) gold standard from Geostats Pty. Ltd. of Fremantle, WesternAustralia, as well as blanks from Nelson Granite of Kenora, Ontario.
Page 104
Hope Brook
Technical report
This description of the Hope Brook Property project (the “Hope Brook Project”) is based on the project’s technical report: 2015 Mineral Resource Estimate TechnicalReport for the Hope Brook Gold Project, Newfoundland and Labrador, Canada (effective date January 12, 2015, report date November 20, 2015) (the “Hope BrookTechnical Report”). The report was prepared for us in accordance with NI 43-101, by or under the supervision of Michael P Cullen, P.Geo.; a qualified person withinthe meaning of NI 43-101. The following description has been prepared under the supervision of Dr. Chris Osterman, Ph.D., P.Geo., who is a qualified person withinthe meaning of NI 43-101, but is not independent of us.
The conclusions, projections and estimates included in this description are subject to the qualifications, assumptions and exclusions set out in the Hope Brook TechnicalReport, except as such qualifications, assumptions and exclusions may be modified in this AIF. We recommend you read the Hope Brook Technical Report in itsentirety to fully understand the project. You can download a copy from our SEDAR profile (www.sedar.com), or from our website (www.firstmininggold.com).
Property description, location and access
The Hope Brook Project is located on the southwest coast of the island of Newfoundland, in the province of Newfoundland and Labrador, Canada. It is comprised of acore holding of 993 contiguous exploration claims acquired through map staking and issued in 2003 and 2008. This main property covers 24,825 ha of surface area andmeasures approximately 32 km by 12 km in maximum east-west and north-south dimensions, respectively. Constituent claims are held under 7 separate licenses and theproperty is approximately centered on the past-producing Hope Brook gold mine, located at Latitude 47.738° north and Longitude 58.095° west. An additional 63claims (1,575 ha) are held by us in the Peter Snout area, approximately 25 km northeast of the Hope Brook deposit and 10 claims (250 ha) in the Cross Gulch area,approximately 6 km north of the deposit. These were staked in late 2013 and early 2015, respectively, to cover areas of exploration potential defined through review ofgovernment assessment reporting records. The Hope Brook Project is located approximately 85 km by water east of the community of Port aux Basques and is notaccessible by any form of highway transportation at this time. Direct site access to the Hope Brook Project can be gained by chartered boat from either the Burgeo orPort aux Basques areas and could also be gained through small boat charter from La Poile, after travel to that community on the coastal service vessel. The mostefficient means of current access to the property is by charter fixed wing aircraft or helicopter from commercial bases in the Deer Lake- Pasadena area, approximately120 km to the north.
Coastal Gold earned a 100% interest in 993 claims of the original Hope Brook Project property by fulfilling requirements of an option to purchase agreement datedJanuary 25, 2010.
As of the date of the Hope Brook Technical Report, two exploration permits by the government of Newfoundland and Labrador were required for bedrock core drillingand vibracore tailings drilling programs as well as geochemical and geophysical surveys, valid until April 15, 2015 and June 17, 2015, respectively. It is anticipated thatnew permits will be required if we chose to initiate certain site-based aspects of the Phase I or Phase II work programs recommended in the Hope Brook TechnicalReport. In addition, the License to Occupy for the Hope Brook exploration camp was being reviewed by government at the effective date of the Hope Brook TechnicalReport, with timely issuance expected. No substantive difficulties have been encountered to date with respect to procurement of required Exploration Permits and campoccupancy permissions.
Page 105
A 2% net smelter returns royalty payable applies under terms of a royalty pre-payment schedule of $20,000 per year. All royalty pre-payment funds provided under theagreement are to be accounted for against future production. We retain a right during the term of the agreement to purchase one half of the 2% NSR royalty for$1,000,000.
Annual work requirements for each claim are set out under the province’s Mineral Act and range from $200 per claim in year one to $1,200 per claim in years 16through 20. In addition, a renewal fee of $25 – $100 is payable for each claim on a five year basis.
As part of the 2011 work program a screening level assessment of baseline environmental conditions was carried out at the Hope Brook Property. Results of this studyshowed that a number of chemical impacts that are residual to the former mining operation are present locally. These include elevated metal levels in soil, sediment andwater as well as elevated petroleum hydrocarbon levels in soil. The most significant liabilities were deemed to be associated with subsurface conditions whereimpairment to both soil and groundwater had occurred around existing landfill sites, the heap leach pad, and within the underground mine workings. All of theseconditions pre-date Coastal Gold site activities and therefore we are excluded from associated liability. However, if a new mining venture is established at this site itwill be necessary to fully quantify the potential impacts of such conditions on site development, mining and site decommissioning and reclamation plans for the newoperation. All such issues would be dealt with under the mine permitting and associated environmental approval processes.
History
Documentation of Hope Brook Project area’s history of exploration and mining spans the period between 1923 and the present day, but modern programs directedtoward assessment of gold potential and related mining have only occurred since discovery of the Hope Brook gold deposit in 1983.
Programs of deposit definition drilling, resource estimation, metallurgical assessment and feasibility assessment were completed for the Hope Brook deposit between1984 and 1986 and a production decision was announced in 1986. The deposit was subsequently developed and mined during the period of 1987 through 1991. Theproduction decision appears to have been supported by initial resources of 11.2 million tonnes grading 4.54 g/t Au above a 2.5 g/t Au cut-off (~1.6 million troy ounces)that were reported. Additionally, the same tonnage and gold grade was separately reported for the deposit but additionally specified a 0.3% copper parameter.
Mining from both open pit and underground operations was ultimately carried out between 1987 and 1997. Provincial government records document production of304,732 ounces of gold during the 1987-1991 period from all operations. Difficulties with elevated cyanide and copper levels were encountered in processing planteffluent during the operating period and this may have contributed to cessation of mining and milling in early 1991.
During the 1987-1991 mining period, detailed exploration focus was largely restricted to the mine area and adjoining advanced argillic alteration zone (“AAZ”) areas tothe southwest, with particular attention paid to assessment of possible strike and dip extensions of the main deposit.
From 1991 to mid-1997, underground mining at the site was carried out. Operations ceased in mid-1997. Production of 447,431 ounces of gold was recorded during the1992-1997 period. Re-assessments of past exploration programs was carried out in both the mine area and surrounding district and follow-up exploration on severalpromising areas not associated with the AAZ and the Hope Brook deposit trend was completed. No substantial new discoveries were made during this period.
Page 106
During the period 2002 through 2007 the provincial government carried out environmental assessment and reclamation programs at the Hope Brook mine site. Nomining activities have been carried out subsequent to those of carried out from 1991 to 1997.
No drilling-based exploration programs were completed on the Hope Brook Project through the period 1997 through 2007. However, in 2003 mine area explorationholdings were staked by related entities.
Beginning in 2008, an airborne magnetometer and electromagnetic survey of the entire property was carried out, past drilling results were compiled, prospecting wascarried out and an extensive bedrock sampling program was completed. Sampling was substantially focused in an area immediately northwest of the Hope Brook openpit where alteration zone and silicified zone units occurring structurally below the mined Hope Brook deposit had been exposed during removal of acid generatingwaste rock during the site reclamation program. No substantial new discoveries resulted from any of this work.
Since the start of exploration work in 2010, Coastal Gold carried out programs of drill core physical properties investigation, ground geophysics, environmentalscreening, data compilation, data validation, core drilling, vibracore tailings drilling, bedrock and tailings mineral resource estimation, metallurgical assessment andgeneral property evaluation.
From April 2010 through December 2014, Coastal Gold completed systematic gold exploration programs, primarily focused in the area surrounding the past producingHope Brook mine.
Geological setting, mineralization and deposit types
The Hope Brook Property occurs within a tectonically complex zone that has been interpreted by some to occur within the Avalon Zone of the Appalachian Orogen (ora related Avalon Composite Terrane), near its generally east-west trending tectonic contact with adjacent rocks of the Dunnage Zone. The Avalon Zone represents a lateNeo-Proterozoic assemblage of active plate margin sequences that accumulated prior to development and closure of the Lower Paleozoic Iapetan Oceanic system.Sequences of Avalonian affinity occur throughout much of the Appalachian Orogen, and extend from the Avalon Peninsula and southwest coast areas ofNewfoundland, through Nova Scotia, New Brunswick and northern New England. From that point southward, more discontinuously distributed outcropping segmentsoccur as far as northern Georgia and subsurface extensions are interpreted to be present in Florida. Onshore exposures of confirmed Avalon Zone affinity are limited incomparison with its interpreted width of at least 600 km in the eastern offshore area of Newfoundland and Labrador.
The geological aspects of the Avalon Zone, particularly in context of magmatic history represented in the Newfoundland, consist of four major tectono- stratigraphicevents. Most significant of these from the perspective of magmatic activity is the period when substantial volumes of volcanic and plutonic rocks evolved under back-arc or continental arc settings, sometimes in broad association with terrestrial or marine siliciclastic sequences. These are related in time with development ofauriferous, high level hydrothermal alteration systems along the entire length of the Avalon Zone and the Hope Brook gold deposit may be an example of thismetallogenic association.
The Hope Brook gold deposit and associated AAZ are of primary importance with respect to the Hope Brook Project. However, several other bedrock gold occurrencesare present within the Hope Brook Project that differ from Hope Brook. The most prominent examples of such are those in the Old Mans Pond, Phillips Brook andCross Gulch areas. Each of these areas has been investigated through historic exploration programs that typically included geological, geophysical and geochemicalsurveys, surface trenching and limited amounts of core drilling. Drilling has locally confirmed subsurface gold-bearing intervals in each area but mineralized zones ofeconomically significant proportions have not been defined to date. The Hope Brook style of mineralization is considered to be most important. The Hope Brook golddeposit is a large, disseminated gold-chalcopyrite-pyrite deposit hosted by highly altered sedimentary and volcano-sedimentary rocks of the late Proterozoic Whittle HillSandstone and Third Pond Tuff successions, similarly altered felsic porphyry dikes and sills related to the Roti Intrusive Suite and variably altered later mafic dikes andsills. Zones hosting gold mineralization of economic interest typically bear evidence of intense silicification and occur within the AAZ, a broad envelope of advancedargillic alteration that can be traced for up to 8 km southwest of the deposit.
Page 107

The Hope Brook gold deposit is currently one of the largest gold deposits in the Canadian Appalachians, based on historic resources and production. As noted earlier, itoccurs within a zone of extensive AAZ hosted by late Proterozoic sedimentary, volcanic and intrusive rocks. Recent work by Coastal Gold has added to the technicaldocumentation of alteration and mineralization that characterize the deposit. Intense hydrothermal alteration and spatially associated silicification have been identifiedas key components of the mineralizing system that gave rise to the deposit. However, differences exist with respect to interpreted placement of the Hope Brookmineralizing system in the time/space context of the orogeny and some of these bear directly on deposit classification.
In addition to the Hope Brook deposit, several gold occurrences associated with Silurian or younger sericitic alteration, quartz veining and silicification have also beendocumented within the Hope Brook Project area. None of these is substantial in size or gold grade as presently defined, but spatial association with the large Bay d’EstFault or its secondary splays, and possibly with Silurian magmatic activity, indicates that potential for more significant mineralization is present.
Exploration
No new exploration work has been undertaken to date by us on the Hope Brook property. The Hope Brook Technical Report and associated mineral resource estimatereview reflect the first NI 43-101 technical reporting by us for the Hope Brook property.
Drilling
Between September 2010 and October 2013, Coastal Gold completed in five separate drilling programs 139 diamond drill holes and drill hole extensions on the HopeBrook Property that total 39,320.4 m of drilling. Coastal Gold completed 10 surface diamond holes totalling 3,421.9 m in length between September 2010 and January2011 which successfully confirmed the presence of disseminated gold-chalcopyrite-pyrite mineralization hosted by highly silicified sedimentary and volcano-sedimentary rocks both at depth, below the 4800 level of historic mining, and at surface to the southwest of the historic open-pit. An exploratory drill hole targetingmineralization along the northeast extension of the mine at depth returned no significant results and an exploratory drill hole targeting the 240 Zone caved short of thetarget.
Another surface drilling campaign was completed between February 2011 and December 2011 that consisted of 67 holes totalling 21,350.5 m. The program wassuccessful in demonstrating continuity of disseminated gold-chalcopyrite-pyrite mineralization hosted by highly silicified volcano-sedimentary rocks in all threetargeted areas of drilling and provided the drill hole density required for resource estimation.
Between February 2012 and May 2012 Coastal Gold completed a surface drill program that consisted of 15 holes, re-drills and hole extensions totalling 4,549 m inlength. This program focused on confirming the locations of workings and major pillars in the mine area, further testing of the Southwest Extension target area andpreliminary testing of the Northeast target area.
The fourth Hope Brook drilling program by Coastal Gold began on November 3, 2012 and was completed on December 21, 2012. A total of 5,923.9 m of drilling intwenty-one drill holes were completed. Six separate targets areas, along a 3.4 km long mineralized trend, were drilled during the program including the Stope 4960-150,the 240 Zone – Mine Zone Connector Target, the Chetwynd Prospect and the Chetwynd South Prospects, the Chetwynd to 240 Connector Target and the NW TargetArea. The drilling was completed in these areas in order to continue to expend on the area of known gold mineralization outside of the current Hope Brook Depositarea.
Page 108

The fifth drill program at the Hope Brook Property began on August 9, 2013 and was completed on October 10, 2013. A total of 4,075.2 m of drilling in twenty-six drillholes were completed. The drill program was designed to test two major target areas; the Footwall Target and SW Pit Extension Target.
A systematic vibracore tailings drilling program on two tailing ponds at the Hope Brook site was carried out during the September through October period of 2013 and atotal of 73 vibracore drill holes totalling 155 m were completed on an approximate 100 m square grid over the two tailings ponds. The purpose of the program was toevaluate the thickness and gold grade of the tailings and to provide sufficient data to support a NI 43-101 compliant mineral resource estimate of the contained gold andcopper. Of the holes completed, 51 successfully sampled tailings, with thicknesses of the tailings sections ranging from 0.3 to 6.0 m. Average thickness of cored tailingswas 3.0 m.
Sampling, analyses and data verification
Coastal Gold staff members were responsible for arranging transport of core boxes from the drilling sites to the company’s secure core storage and logging facilitylocated at the Hope Brook camp. The core was initially examined by core technicians and all measurements are confirmed. Core was then aligned and repositioned inthe core box where possible and individual depth marks are recorded to facilitate logging. Core technicians photographed all core, measured core recovery between coremeterage blocks, carried out water immersion specific gravity measurements as required and recorded information on hard copy data record sheets that were thenentered into the project drilling database.
All paper copy and digital information for each hole, including quick logs, sample record sheets and assay certificates were maintained in a secure filing system at thesite to provide a complete archival record for each drill hole. Digital information was stored on a local server as well as on the company’s secure off-site server that wasaccessible by satellite link from the camp facility. Subsequent to logging and processing, down hole lithocoded intervals, sample intervals and drill hole collar andsurvey information that were entered into the digital database were checked for completeness before being uploaded to the project database upon which drilling sectiongeneration and three dimension deposit modeling were based.
The secured plastic sample bags were grouped in batches 40 to which QA/QC program samples were added prior to final packing for shipment to the ALS preparationlaboratory in Sudbury, ON. Samples were transported from the site by aircraft or chartered boat and then delivered to a commercial transport service for final deliveryto the laboratory. Sample shipment change of custody forms were used to list all samples in each shipment and laboratory personnel crosschecked samples receivedagainst this list and reported any irregularities by fax or email to Coastal Gold.
Primary project analytical work was completed by ALS with preparation taking place at ALS’ Sudbury, ON facility and subsequent analysis at the facility inVancouver, BC. ALS is an internationally accredited laboratory with National Association of Testing Authorities certification and also complies with standards of ISO9001:2000 and ISO 17025:1999. The laboratory utilizes industry standard analytical methodologies and rigorous internal Quality Assurance and Quality Control(“QA/QC”) procedures for self-testing.
All Hope Brook Project core samples were weighed upon receipt at the ALS preparation laboratory and prepared using ALS preparation procedure PREP-31B thatconsists of crushing the entire sample to >70% -2 mm, then splitting off 1 kg and pulverizing it to better than 85% passing 75 microns size. The coarse reject materialsfrom this processing were stored for future use.
Page 109

Gold concentrations for submitted core and rock samples were determined by ALS using a 50 g sample split and fire assay pre-concentration methods followed byatomic absorption spectroscopy finish (FA-AAS). This is reflected in ALS code Au-AA24. A 33 element analysis was also completed on selected samples by methodcode ME-ICP61 which denotes four acid digestion followed by inductively coupled plasma – atomic emission spectroscopy (ICP-AES) analysis.
Drill core sampling carried out by Coastal Gold during the September 2010 through July 2012 period on the Hope Brook Property was subject to a QA/QC programadministered by Coastal Gold. This included submissions of blank samples, use of certified reference materials and analysis of pulp and coarse reject check samplesplits at a third party commercial laboratory.
The 2012 piston sampling program and 2013 vibracore drilling program of historic Hope Brook Property mine tailings deposits were also subject to a systematicQA/QC program carried out by Coastal Gold.
All of the drill core programs for the period from October 2012 through to November 2013 were subject to essentially the same QA/QC protocols as had been applied tothe earlier core drilling campaigns referred to above. This included systematic submission of blank samples, use of certified reference materials and analysis of pulpand, for core, coarse reject check sample splits at a third party commercial laboratory. Results of both the in-house and laboratory quality control and assurance analyseswere monitored by Coastal Gold on an on-going basis and were also made available for review by Mercator Geological Services Limited (“Mercator”). A QA/QCprotocol was also established for the vibracore drilling program and this included systematic analysis of certified reference materials, duplicate sample splits, blanksample materials and analysis of third party pulp split check samples.
The drill core samples were packaged in batches of 40 samples, which included one blank sample (10th sample), one pulp duplicate (20th sample), one certifiedreference material sample (30th sample) and one coarse reject duplicate sample (40th sample). ALS provided primary analytical services for the project while pulpduplicate (20th sample) and coarse reject duplicate (40th sample) splits were analyzed at SGS to provide independent laboratory check sample data sets. SGS is acommercial, ISO certified laboratory independent of Coastal Gold.
After standard crushing and pulverization of bedrock core samples, gold analysis was by atomic absorption methods after fire assay pre-concentration and multi-element determinations were by inductively couple plasma - optical emission spectroscopy methods after four acid total digestion. One certified reference materialsample and one blank sample were included in the core sample shipment. The tailings samples were separately processed from the core samples and were alsoaccompanied by one certified reference material sample and a blank sample. Results of the QA/QC program for these samples were acceptable.
Core sample records, lithologic logs, laboratory reports and associated drill hole information for all drill programs completed were digitally compiled by Coastal Goldstaff and made available for previous resource estimation purposes. Information pertaining to the exploration history in the property area had already been compiled byMercator and was reviewed in conjunction with newly generated records to assess completeness, consistency and validity of compiled results. This progressivelycompiled and validated information is acceptable for resource estimation purposes.
Database records for previously validated historic drill holes were modified by Coastal during 2013 through addition of copper analytical data recovered from archivalrecords. All such amendments were checked against source documents by Mercator and through spot checks by AGP prior to use in the current resource estimationprogram and no errors were noted.
In addition to the above, records for 47 new diamond drill holes completed by Coastal Gold during 2012 and 2013 were reviewed and validated by Mercator foraddition to the project database and used in the previous and current resource estimation programs. Digital records were checked against original source documentsprovided by Coastal Gold and both consistency and accuracy of such records were assessed. Parameters reviewed in detail include collar coordinates, down hole surveyvalues, hole depths, sample intervals, assay values and lithocodes. All 47 of the 2012 and 2013 holes completed by Coastal Gold were checked for correlation of sampleinterval, assay value and lithocode information against source documents. This review showed consistently good agreement between original records and digitaldatabase values for all data sets.
Page 110

In 2013, Coastal added 152 historical short core holes (“OP” series holes) to the project database. These holes have not been validated by Mercator and were excludedfrom use in the previous and current resource estimates. After completion of manual checking procedures, all drill hole database records were further assessed throughdigital error identification methods available through the Gemcom-Surpac Version 6.2.1® software. This provided a check on items such as sample record duplications,end of hole errors, survey and collar file inconsistencies and some potential lithocode file errors. The digital review and import of the manually checked datasetsprovided a validated drill hole database to support the resource estimation program described in the Hope Brook Technical Report.
Coastal Gold completed several core drilling holes during the 2010-2011 drilling programs to serve as twins to historic holes. These were typically planned to providemore complete lithological and assay information for associated historic holes and to provide a basis for comparison of the historic datasets with Coastal Gold data. Forthe purposes of the Hope Brook Technical Report, 12 Coastal Gold holes that were completed in sufficiently close proximity to historic holes to provide suchassessment were selected for comparison with the Coastal Gold data.
For assessment purposes, Mercator reviewed drill log lithocodes and gold assay entries for hole pairs to determine the level of consistency between the two datasets.Assessment of lithocodes focused primarily on identification of important silicified zone intervals associated with gold mineralization and secondarily on loggedintervals of mafic dike material. Comparison of the assay data on a sample by sample basis was not typically possible due to either spatial separation of hole traces,differing sample lengths or presence of non-sampled intervals in some holes. Comparison of lithocoded intervals between hole pairs showed that good correlationbetween data sets exists. However, greater detail in silicic lithocoding characterises the historic dataset prior to re-coding by Coastal Gold.
As noted above, comparison of assay values between hole pairs was affected in some instances by presence of un-sampled intervals within the historic holes thatcontrast to continuously sampled Coastal Gold intervals, by differing mafic material percentages and by differing interpreted assay zone widths. Mercator focused ongold assay data within the gold-bearing silicified zone lithologic units and created weighted average intervals to support comparison. Results of this program for the 12holes considered showed that spatial definition of the gold zones based on assay boundaries is typically consistent between hole pairs and this is reflected in generallycomparable intercept lengths selected.
The weighted average Coastal Gold data set results are typically higher than equivalent intervals in historic holes but the reverse is also seen in some cases. Mercatorbelieves that several factors contribute to this result, including changes in mafic dike dilution between holes, higher overall core quality of the NQ and BQTK sizeCoastal Gold core relative to the historic BQ core, and higher overall core recovery for Coastal Gold holes in fractured intervals of the mineralized zone. Heterogeneityof primary gold distribution is also a potential contributor.
Based on results of the twin hole comparison originally carried out in support of earlier resource estimates, at the effective date of the Hope Brook Technical ReportMercator remains of the opinion that acceptable consistency exists between these hole pairs with respect to gold assay value and lithocode data sets.
Page 111
Mineral processing and metallurgical testing
Scoping level metallurgical test work on mineralized samples was first carried out for Coastal by G&T Metallurgical Services Ltd. (“G&T”) in Kamloops, BC in 2012.The objectives of that program were to evaluate potential processing routes for maximizing gold recovery and to identify operating parameters for the preliminarycircuit design. Flotation test work was successful at generating a concentrate grading 28% Cu from flotation of cyanidation residue in a process similar to the historicalflowsheet at Hope Brook. Gravity concentration tests indicated that between 16 and 41% of the contained gold was recoverable to concentrate by this method.Combined gold recoveries of ~86% were achieved using a flowsheet consisting of gravity concentration followed by cyanidation of the gravity tailings. Directcyanidation of tailings resulted in up to 49% extraction of contained gold.
Additional metallurgical testing was carried out by G&T in the fall of 2013 to further advance the understanding of the metallurgy of the Hope Brook deposit. Thisincluded batch flotation test work focused on the opportunity to recover a saleable grade copper concentrate after the grinding and gravity recovery step. Scoping leveltest work was also carried out at Tomra Sorting Solutions in Surrey, BC to evaluate the potential of rejecting dilution material before the grinding area using sensor-based sorting. Sorting program results indicated that the mafic dyke dilution was readily distinguished from the mineralized rock using four separate detector systems,indicating that this material is highly amenable to rejection by sorting.
Mineral resource estimates
The mineral resource estimate for the Hope Brook Project is based on a three dimensional block model developed using Geovia – Surpac Version 6.1.1® depositmodeling software and a matrix size of 10 m (X) by 5 m (Z) by 3 m (Y). Grade interpolation utilized multiple pass ordinary kriging methodology with an inversedistance squared check model used for validation. Classification of the resource followed the approach used in the 2014 NI 43-101 mineral resource estimate and wasbased primarily on interpolation pass number, distance to the closest informing assay composite and kriged variance. The 3 g/t Au cut-off value used is substantiallyhigher than cut off values of Coastal Gold’s previous mineral resource estimates that were focused on optimization of open pit mining scenarios. Current mineralresources are considered to have reasonable potential for economic viability based on application of underground mining methods, historic gold recovery levels thatrange between 80% and 91% percent for past production (86% for Coastal Gold testing) and a long term gold price of US$1,200 per ounce. This estimate of mineralresources may be materially affected by environmental, permitting, legal, title, taxation, socio-political, metal pricing, marketing, or other relevant issues.
Page 112

Hope Brook Deposit Mineral Resource Estimate – Effective January 12, 2015
Page 113
Gold Grade Cut-off
(g/t) Resource CategoryRound Tonnes
(Rounded)Gold Grade
(g/t)Gold Ounces(Rounded)
3.00 Indicated 5,500,000 4.77 844,000
Inferred 836,000 4.11 110,000
Notes: 1. Includes only Mine Zone and 240 Zone areas. 2. The above mineral resource estimate is based on a partial percentage block model with dike material removed. Dike percent is estimated at 18% for the Mine Zone and 0 % for the 240 Zone. 3. Gold grades reflect application of domain-specific raw assay capping factors that range between 55 g/t Au and 3 g/t Au. 4. Rounding of tonnes as may result in apparent differences between tonnes, grade and contained ounces. 5. Mineral resources that are not mineral reserves do not have demonstrated economic viability. The estimate of mineral resources may be materially affected by environmental permitting, legal,
title, taxation, sociopolitical, metal pricing, marketing, or other relevant issues. 6. The gold cut-off value of 3.00 g/t reflects a reasonable expectation of economic viability based on application of underground mining methods, historic gold recovery levels that range between
80% and 91% percent for past production (86% for Coastal Gold testing) and a long term gold price of US$1,200 per oz.

Non-material properties
We also hold a number of non-material mineral properties as part of our mineral bank portfolio. Some of these properties are resource-stage assets which have NI 43-101 technical reports that support resources of less than one million ounces of attributable gold. Others are grassroots exploration projects that host mineralization buthave not had sufficient drilling on them to classify resources under the CIM definition standards. A brief summary of these properties is set out in this section.
Canada
Duquesne Gold Project, Québec
We acquired a 100% interest in the Duquesne Gold project located in the Abitibi Region of Québec (the “Duquesne Project”) through our acquisition of Clifton Star inApril 2016. The Abitibi Region of Québec is one of the most prospective and productive mineral regions in Canada with more than 100 years of continuous mininghistory and hosts a number of major Canadian mines.
The property, which comprises 55 contiguous mining claims and one mining concession, covers an area of 936 ha and is situated along the Destor-Porcupine Break,which boasts historical production of 192 million oz. Au. It is approximately 30 km northwest of the city of Rouyn-Noranda, and approximately 16 km east of the townof Duparquet, so it has excellent access to infrastructure and a skilled labour pool.
The Duquesne Project hosts an NI 43-101 Indicated Resource of 1.9 Mt grading 3.33 g/t Au, containing 199,000 oz. Au, and an Inferred Resource of 1.6 Mt grading5.58 g/t Au, containing 281,000 oz. Au. The technical report in support of these resources, entitled “43-101 Technical Report Resource Estimate of the Duquesne GoldProperty”, was prepared in accordance with NI 43-101 and was filed on SEDAR by Clifton Star on October 28, 2011 under its SEDAR profile.
Pitt Gold Project, Québec
We purchased a 100% interest in the Pitt Gold project located in the Abitibi Region of Québec (the “Pitt Project”) from Brionor in April 2016. The property, whichcomprises 24 contiguous mineral claims, covers an area of 384 ha.
The Pitt Project is close to our Duquesne Project, and to the Duparquet Gold Project located in the Abitibi Region of Québec (in which we hold an indirect 10%interest). It is approximately 35 km north of the city of Rouyn-Noranda, and approximately 7 km east of the town of Duparquet, so it has excellent access toinfrastructure and a skilled labour pool.
The Pitt Project hosts an NI 43-101 Inferred Resource of 1,076,000 tonnes grading 7.42 g/t Au (at a cutoff grade of 3.0 g/t Au), containing 257,000 oz. Au. Thetechnical report in support of these resources, entitled “NI 43-101 Technical Report and Audit of the Preliminary Mineral Resource Estimate for the Pitt Gold ProjectDuparquet Township Abitibi Region, Quebec, Canada”, was prepared in accordance with NI 43-101 and was filed by us on SEDAR on January 6, 2017 under ourSEDAR profile at www.sedar.com.
Page 114
Duparquet Gold Project, Québec
We have a 10% indirect interest in the Duparquet Gold Project which has a large open-pittable resource.
Lac Virot Iron Ore Project, Newfoundland
Acquired through our acquisition of Coastal Gold, the Lac Virot property is located near the town of Labrador City in western Labrador. We own a 100% interest in 4map-staked licenses with a combined 225 claims covering a total area of 5,625 ha. The Lake Superior-type iron formation occurrences of the Lac Virot area lie in theLabrador-Quebec Fold Belt or Labrador Trough, within the Sokoman Formation of the Lower Proterozoic (Aphebian) Knob Lake Group. The project is in a strategiclocation surrounded by four iron ore mines in the Southern Labrador Trough, and is close in proximity to power, a multi-use railway and a deep sea port. A total of11,713 m was drilled in 42 holes during 2012 which focused on high priority targets previously outlined by a 882 km gravity survey.
Horseshoe Island Gold Project, Ontario
Acquired through our acquisition of Gold Canyon, we hold a 100% interest in the Horseshoe Island Gold Project, situated in the Archean Birch-Uchi greenstone belt,and within the prolific Red Lake Mining District of northwestern Ontario. The project is comprised of 14 claims covering an area of 2,088 ha. Gold Canyon previouslycompleted an extensive MMI survey which displayed that elongate, shear-related gold anomalies are widespread and may be scattered along the entire 7 km length ofthe property. The surveys also produced copper and zinc anomalies in VMS favorable environments. Historic drilling has indicated the presence of nickel, platinum, andpalladium in a layered gabbro intrusive. The project has a long exploration history during which time 24,138 m of drilling has been completed.
Mexico
Miranda, Sonora
The Miranda gold property consists of three claims; Miranda, Miranda 1 and La Arena covering 16,035 ha in the Sonoran Desert within a structural corridor called theSonora- Mojave megashear (“SMM trend”).
The SMM trend hosts several operating gold mines and deposits, some of which exceed 10 million ounces of gold such as Herradura-Dipolos in western Sonora,Mexico, and other smaller deposits: Mesquite (7 Moz. Au) and Picacho in Arizona; Chanate in San Francisco; and La Choya in Sonora, Mexico. The Miranda propertylies in the south-central part of the SMM trend, adjacent to the San Felix and El Antimonio mining districts on the south and east respectively. Miranda covers multipleprospects and gold occurrences including the inactive mines La Fortuna and El Gigio (internal claims which do not belong to First Mining). Additionally, the propertyexhibits structures and lithologies favourable for the development of large orogenic (mesothermal) ore deposits similar to those occurring along the SMM trend. During2015, 151 rock chip samples were taken and analyzed with values ranging between nil and 7.29 g/t Au. Additionally, 3,486 soil samples were collected and analyzed.
Page 115
Socorro, Sonora
The Socorro property was reduced and separated into fractions in 2015 subject to government approval and now consists of four claims: El Socorro Frac 1, El SocorroFrac 2, El Socorro Frac 3 and Tizoc R1 covering an area of 35,654 ha. It is a regional gold exploration play with dozens of pits and placer deposits with excellentpotential to host both bulk open-pit, heap-leachable deposits as well as high-grade gold in high-angle structures. The southern part of the concession covers the northernextension of the El Chanate mine, while the central and northern portion cover mesothermal gold veins within a regional structure over 10 km long.
Work to date on the property includes interpretation of ASTER images mapping and initial surface reconnaissance.
During 2015, we took 53 rock chip samples on the property with values ranging from nil to 41.0 g/t Au. Additionally, 7,737 soil samples were taken and analyzed.
San Ricardo, Sonora
The San Ricardo property consists of nine claims, two of which, San Ricardo and San Ricardo 2, collectively cover an area of 50 ha and an existing small mine. Theremaining seven claims: Teocuitla, Teocuitla 2, Teocuitla 4, Angel, Tlaloc, Tlaloc 2 and Aztlan together cover an area of 37,350 ha, and were staked by us between2009 and 2011. Mineralization on the property is epithermal in nature and has not been constrained along strike or depth by drilling.
All underground workings on the San Ricardo vein system were opened up and saw sampled, and several hundred metres of trenches were excavated and sampled.Subsequently, 14 diamond drill-holes were drilled on the property to test two veins, the Santa Cruz and Mina Antigua, at shallow levels. Drill results in the Santa Cruzvein varied from minor precious metal mineralization to 2.3 m at 23.1 g/t Au, whereas the Mina Antigua vein contained 4.5 m at 100.4 g/t Ag.
During 2015, the Company took 59 reconnaissance rock samples with values ranging from nil to 33.7 g/t Au and completed a 4,993 soil samples geochemical survey.
Puertecitos, Sonora
The Puertecitos property consists of two claims, Puertecitos and Puertecitos 2, covering an area of 9,060 ha staked by the Company in 2009. Located 32 km southwestof the Sasabe border crossing between the US and Mexico, Puertecitos is 40 km west of our Los Tamales property and 32 km northeast of the Peñoles Los Humosdeposit, a 625 Mt porphyry copper system grading 0.32% Cu. Widespread copper oxides outcrop at Puertecitos and the presence of sericite and secondary biotite inbreccia fragments from dikes and pipes suggest that a porphyry system may exist under the extensive rhyolite flows on the property. In 2015, First Mining entered intoan option agreement with Peñoles under which the Puertecitos property may be acquired. On August 8, 2016, Peñoles notified us of its decision to discontinueexploration on the project and consequently the option agreement was terminated.
Los Tamales, Sonora
The Los Tamales property consists of two claims, Teocuitla 5 and Teocuitla 8, which cover an area of 3,851 ha staked by us in 2010. Los Tamales is a porphyry copper-molybdenum system located 125 km southwest of Tucson, Arizona and 28 km south of the US-Mexican border. The property was discovered by a water well samplingprogram during a joint United States Geological Survey and Servicio Geologico Mexicano reconnaissance effort in the 1970s, and was the subject of two USGS open-file reports: 94-685 and 84-289. Five diamond drill holes tested copper and molybdenum soil geochemical anomalies in 2013 along a five km strike length with all holesshowing low grade chalcopyrite and molybdenite mineralization. The deposit as currently interpreted suggests it is the deep level of a large system dissected by lowangle faulting. In 2015, we entered into an option agreement with Peñoles under which the Los Tamales property may be acquired. On August 8, 2016, Peñoles notifiedus of its decision to discontinue exploration on the project and consequently the option agreement was terminated.
Page 116
El Apache, Sonora
The El Apache property covers an area of 11,417 ha in two claims; El Apache and Tlahuac, both staked by us in 2011.
El Apache is largely covered by wind-blown sand of the western Sonoran Desert and lies in a highly prospective area within the prolific Sonora-Mojave megashear goldbelt. The property lies 10 km east of the largest gold-only mine in Mexico, Fresnillo’s Herradura complex and 10 km south of La Choya mine.
Work to date includes partial surface reconnaissance, interpretation of the government’s magnetic data and limited surface sampling in two small outcropping hills.Future work will entail ZTEM, detailed magnetometry, bleg sampling, and enzyme leach-type geochemical surveys to identify drill targets under sand cover.
Batacosa, Sonora
The Batacosa property consists of one claim covering an area of 3,600 ha staked by us in 2011. Batacosa is a porphyry copper-molybdenum system located 55 kmnortheast of Ciudad Obregon and 220 km southeast of Hermosillo, the capital of the state. Batacosa was discovered by Cominco in the 1970s and subsequently drilledby them and other companies between 1970 and 2000. A total of 8,000 m were drilled in 47 drill holes. First Mining has delineated two untested targets within theproperty.
Montana Negra, Sonora
The Montana Negra property consists of one claim, Montana Negra, covering an area of 852 ha. The property covers Proterozoic rocks that we believe may befavourable for gold mineralization and is located in North Central Sonora, 20 km southeast of Cananea. The Orogenic gold system targets are open-pit leachablemineralization in granitic and metamorphic rocks (similar to the La Choya and San Francisco mines). Additional field work is required to fully evaluate the propertyfollowing preliminary surface samples that reported from nil to 9.5 g/t Au.
Las Margaritas, Durango
The Las Margaritas property covers an area of 500 ha consisting of two mining concessions approximately 150 km from Durango City. The property was acquiredthrough an Assignments of Rights Agreement signed July 6, 2011 and is subject to a 1% NSR royalty payable to the vendor which may be purchased at any time beforeJuly 6, 2016 for US$500,000. The project is located in the Barrancas subprovince of the Sierra Madre Occidental. Some limited gold mining by artisanal prospectors isknown to have taken place on the project in the early 20th century and the project contains a known vein with quartz, argillic alteration striking for at least 1.8 km. In2016, a two-year extension was negotiated with the vendor which granted First Mining the option to purchase the 1% NSR royalty by November 2018 in considerationfor an additional US$100,000, payable over two years, of which $50,000 has been paid. We are currently seeking to negotiate a further extension with the vendor.
Page 117
Geranio, Oaxaca
The Geranio property consists of six claims: La Ramita, Geranio, Violeta, Azucena, El Jilguero and La Orquidea, which combined, cover an area of 540 ha.Additionally, we have also staked a much larger block of ground to the north, east and south of the Natividad system.
The Geranio project lies adjacent and directly north of the historic Natividad Mining District, 70 km north of the city of Oaxaca in southern Mexico. Natividad is aseries of five bonanza grade gold and silver veins in a black shale host rock which, over the last 70 years, has produced 1.5 million ounces of gold equivalent. Theproperty covers approximately 1,200 m of strike length of the northern extension of the Natividad vein system.
Two ASARCO exploration diamond drill holes were drilled on the Geranio property in 1992; hole N-20 intersected 0.6 m at 36 g/t Au and 315 g/t Ag, whereas hole N-24 intersected 0.7 m at 45 g/t Au and 120 g/t Ag. Our objective is to delineate another Natividad mineralized system with comparable precious metal contents.
El Roble, Oaxaca
The El Roble property, located in the Natividad mining district, consists of two claims staked by the Company, El Roble and El Roble 2, which together cover an areaof 9,666 hectares. The property covers the northern extension of Natividad veins and other historic bonanza producers such as El Banco mine. Relevant explorationfeatures include a 15 km strike length of a large magnetic high representing an intrusive body at depth believed to be associated with high-grade gold mineralization inveins. Work to date includes regional geology, airborne magnetics and reconnaissance sampling of selected areas. Lachatao, Oaxaca The Lachatao property, located inOaxaca Mexico, consists of three claims that were staked by us and are known as Lizi 1, Lizi 1 Fraccion 2, and Lizi 1 Fraccion 3. These three claims together cover anarea of 5,126 hectares. Targets in the property include high-grade gold bonanza veins in black shales as well as stockworks and disseminated gold in volcanic rocks.
United States
Turquoise Canyon, Nevada
The Turquoise Canyon property (formerly the Bald Mountain property) located in Nevada is wholly-owned by First Mining. The property covers an area of 1,562hectares and is located along the Battle Mountain-Eureka Trend, 16 km south of Barrick Gold Corp.'s Cortez Mine Complex (23 Moz. Au), and 9 km west of its newlydiscovered Gold Rush deposit (7 Moz. Au) and 1.5 km east of the Toiyabe Mine, a Carlin type gold deposit that produced 89,000 oz. of gold in the 1990s.
Page 118
Results of an airborne ZTEM survey commissioned by the Company show an antiformal structure in the underlying Roberts Mountain Thrust which will be the focus offuture exploration. A gravity high and anomalous conductive/polarizable anomalies at the southwest corner of the property are high priority drill targets. Six otherpotential drill targets were interpreted from two induced polarization/resistivity lines run over the property.
Risks that can affect our business
There are risks in every business.
The nature of our business means we face many kinds of risks and hazards – some that relate to the mineral exploration industry in general, and others that apply tospecific properties, operations or planned operations. These risks could have a significant impact on our business, earnings, cash flows, financial condition, results ofoperations or prospects.
The following section describes the risks that are most material to our business. This is not, however, a complete list of the potential risks we face – there may be otherswe are not aware of, or risks we believe are not material today that could become material in the future. We have in place systems and procedures appropriate for acompany at our stage of development to manage these risks, but there is no assurance that we will be successful in preventing the harm that any of these risks couldcause.
Types of risk
Page 119
• Exploration, development, production and operational risks....... p. 120
• Financial risks...... p. 124
• Political risks...... p. 127
• Regulatory risks...... p. 128
• Environmental risks...... p. 129
• Industry risks...... p. 131
• Other risks...... p. 132
Exploration, development, production and operational risks
Exploration and development risks
The exploration for and development of minerals involves significant risks, which even a combination of careful evaluation, experience and knowledge may noteliminate. These risks include:
Unsuccessful exploration or development programs could have a material adverse impact on our operations and financial condition.
Operational hazards and risks
Our operations will be subject to all of the hazards and risks normally encountered in the exploration and development of minerals. To the extent that we take a propertyto production, we will be subject to all of the hazards and risks associated with the production of minerals. These risks include:
Substantial expenditures
Substantial expenditures are required to establish resources and reserves through drilling, to develop metallurgical processes to extract the metal from the ore and, incertain cases, to develop infrastructure at any site chosen for exploration. Although substantial benefits may be derived from the discovery of a major mineralizeddeposit, no assurance can be given that minerals will be discovered in sufficient quantities to justify commercial operations or that funds required for development canbe obtained on a timely basis.
Page 120
• few properties that are explored are ultimately developed into producing mines;
• there can be no guarantee that the estimates of quantities and qualities of minerals disclosed will be economically recoverable;
• with all mining operations there is uncertainty and, therefore, risk associated with operating parameters and costs resulting from the scaling up of extraction methods tested in pilotconditions; and
• mineral exploration is speculative in nature and there can be no assurance that any minerals discovered will result in an increase in our resource base.
• unusual and unexpected geological formations;
• rock falls;
• seismic activity;
• flooding and other conditions involved in the extraction of material, any of which could result in damage to, or destruction of, mines and other producing facilities, damage to life orproperty, environmental damage and possible legal liability;
• environmental pollution, and consequent liability that could have a material adverse impact on our business, operations and financial performance;
• mechanical equipment and facility performance problems; and
• periodic disruptions due to inclement or hazardous weather conditions.
The economics of developing mineral properties is affected by many factors including:
The remoteness and restrictions on access of properties in which we have an interest will have an adverse effect on expenditures as a result of higher infrastructurecosts. There are also physical risks to the exploration personnel working in the terrain in which our properties are located, occasionally in poor climate conditions.
No history of mineral production
First Mining has no history of commercially producing metals from its mineral exploration properties. There can be no assurance that we will successfully establishmining operations or profitably produce gold or other precious metals on any our properties. The development of mineral properties involves a high degree of risk andfew properties that are explored are ultimately developed into producing mines. The commercial viability of a mineral deposit is dependent upon a number of factorswhich are beyond our control, including the attributes of the deposit, commodity prices, government policies and regulation and environmental protection. Fluctuationsin the market prices of minerals may render reserves and deposits containing relatively lower grades of mineralization uneconomic.
None of our properties are currently under development or production. The future development of any properties found to be economically feasible will requireapplicable licenses and permits and will require the construction and operation of mines, processing plants and related infrastructure. As a result, the development ofany property will be subject to all of the risks associated with establishing new mining operations and business enterprises, including, but not limited to:
It is common in new mining operations to experience unexpected problems and delays during development, construction and mine start-up. In addition, delays in thecommencement of mineral production often occur. Accordingly, there are no assurances that our activities will result in profitable mining operations or that miningoperations will be established at any of our properties.
Title risks
Title to mineral properties, as well as the location of boundaries on the grounds may be disputed. Moreover, additional amounts may be required to be paid to surfaceright owners in connection with any mineral exploration or development activities. At all properties where we have current or planned exploration activities, we believethat we have either contractual, statutory, or common law rights to make such use of the surface as is reasonably necessary in connection with those activities.
Page 121
• the cost of operations;
• variations in the grade of mineralized material mined;
• fluctuations in metal markets; and
• such other factors as government regulations, including regulations relating to royalties, allowable production, importing and exporting of minerals and environmental protection.
• the timing and cost of the construction of mining and processing facilities;
• the availability and costs of skilled labour and mining equipment;
• the availability and cost of appropriate smelting and/or refining arrangements;
• the need to obtain necessary environmental and other governmental approvals and permits and the timing of those approvals and permits; and
• the availability of funds to finance construction and development activities.
Title insurance generally is not available for mining claims in Canada, and our ability to ensure that we have obtained secure claims to individual mineral properties ormining concessions may be severely constrained. We have not conducted surveys of all our claims; therefore, the precise area and location of such claims may be indoubt. In addition, all of our mineral properties have had previous owners, and third parties may have valid claims (known or unknown) underlying our interests therein.Accordingly, our properties may be subject to prior unregistered liens, agreements, royalties, transfers or claims, including First Nations land claims, and title may beaffected by, among other things, undetected defects. In addition, we may be unable to explore our properties as permitted or to enforce our rights with respect to ourproperties. An impairment to or defect in our title to our properties could have a material adverse effect on our business, financial condition or results of operation.
Mineral reserves/mineral resources
The properties in which we hold an interest are currently considered to be in the early exploration stage only and do not contain a known body of commercial mineralsbeyond the PEA level. Mineral resources and mineral reserves are, in large part, estimates and no assurance can be given that the anticipated tonnages and grades willbe achieved or that the particular level of recovery will be realized.
Mineral resources on our properties have been determined based upon assumed metal prices and operating costs at the time of calculation, as set out in the applicabletechnical reports. Future production could differ dramatically from resource and reserve estimates because, among other reasons:
Estimated mineral resources may require downward revisions based on changes in metal prices, further exploration or development activity, increased production costsor actual production experience. This could materially and adversely affect estimates of the tonnage or grade of mineralization, estimated recovery rates or otherimportant factors that influence mineral resource and mineral reserve estimates.
Any reduction in estimated mineral resources as a result could require material write downs in investment in the affected mining property and increased amortization,reclamation and closure charges, which could have a material and adverse effect on future cash flows for the property and on our earnings, results of operations andfinancial condition.
Because we do not currently have any producing properties, mineralization estimates for our properties may require adjustments or downward revisions based uponfurther exploration or development work or actual future production experience. In addition, the grade of mineralized material ultimately mined, if any, may differ fromthat indicated by drilling results. There can be no assurance that minerals recovered in small-scale tests will be duplicated in large-scale tests under on- site conditions orin production scale.
Page 122
• mineralization or formations could be different from those predicted by drilling, sampling and similar examinations;
• calculation errors could be made in estimating mineral resources and mineral reserves;
• increases in operating mining costs and processing costs could adversely affect mineral resources and mineral reserves;
• the grade of the mineral resources and mineral reserves may vary significantly from time to time and there is no assurance that any particular level of metals may be recovered fromthe ore; and
• declines in the market price of the metals may render the mining of some or all of the mineral reserves uneconomic.

The mineral resource estimates contained in this AIF have been determined and valued based on assumed future prices, cut-off grades and operating costs that mayprove to be inaccurate. Extended declines in market prices for gold or other metals may render portions of our mineralization uneconomic and result in reduced reportedmineralization. Any material reductions in mineralization estimates, or of the ability to extract mineralized material from our properties, could (directly or indirectly)have a material adverse effect on our results of operations or financial condition.
Capital costs, operating costs, production and economic returns
Actual capital costs, operating costs, production and economic returns with respect to our properties may differ significantly from those we have anticipated and thereare no assurances that any future development activities will result in profitable mining operations. The capital costs required to develop or take our projects intoproduction may be significantly higher than anticipated. To the extent that such risks impact upon any such properties, there may be a material adverse effect on resultsof operations on such properties which may in turn have a material adverse effect on our financial condition.
None of our mineral properties have sufficient operating history upon which we can base estimates of future operating costs. Decisions about the development of theseand other mineral properties will ultimately be based upon feasibility studies. Feasibility studies derive estimates of cash operating costs based upon, among otherthings:
Cash operating costs, production and economic returns, and other estimates contained in studies or estimates prepared by or for us, may differ significantly from thoseanticipated by our current studies and estimates, and there can be no assurance that our actual operating costs will not be higher than currently anticipated.
Property interests
The agreements pursuant to which we hold rights to certain of our properties provide that we must make a series of cash payments over certain time periods or makeminimum exploration expenditures. If we fail to make such payments or expenditures in a timely manner, we may lose interest in those projects.
Availability of supplies
As with other mineral exploration companies, certain raw materials, supplies and other critical resources used in connection with our operations are obtained from a soleor limited group of suppliers. Due to an increase in activity in the global mining sector, there has been an increase in global demand for such resources. A decrease inthe supplier’s inventory could cause unanticipated cost increases, an inability to obtain adequate supplies and delays in delivery times, thereby impacting operatingcosts, and timing of exploration and development programs.
Page 123
• anticipated tonnage, grades and metallurgical characteristics of the mineralized material to be mined and processed;
• anticipated recovery rates metals from the mineralized material;
• cash operating costs of comparable facilities and equipment; and
• anticipated climatic conditions.
Lack of infrastructure
The completion of the development of our development projects is subject to various requirements, including the availability and timing of acceptable arrangements forelectricity or other sources of power, water and transportation facilities. The lack of availability on acceptable terms or the delay in the availability of any one or moreof these items could prevent or delay the development of our exploration projects. If adequate infrastructure is not available in a timely manner, there can be noassurance that: the development of our projects will be completed on a timely basis, if at all; any resulting operations will achieve the anticipated production volume; orthe ongoing operating costs associated with the development of our projects will not be higher than anticipated.
Personnel recruitment and retention
The success of our operations and development projects depend in part on our ability to attract and retain geologists, engineers, metallurgists and other personnel withspecialized skill and knowledge about the mining industry in the geographic areas in which we operate. The number of persons skilled in exploration and developmentof mining properties is limited and competition for such persons is intense. As our business grows, we may require additional key financial, administrative, and miningpersonnel as well as additional operations staff. There can be no assurance that we will be successful in attracting, training, and retaining qualified personnel ascompetition for persons with these skill sets increases. If we are unable to attract and retain sufficiently trained, skilled or experienced personnel, our business maysuffer and we may experience significantly higher staff or contractor costs, which could have a material adverse effect on our operations and financial condition.
Uninsured losses
Despite efforts to attract and retain qualified personnel, as well as the retention of qualified consultants, to manage our interests, even when those efforts are successful,people are fallible and human error and mistakes could result in significant uninsured losses to us. These could include, but are not limited to, loss or forfeiture ofmineral claims or other assets for non–payment of fees or taxes, erroneous or incomplete filings or non–fulfillment of other obligations, significant tax liabilities inconnection with any tax planning effort we might undertake or mistakes in interpretation and implementation of tax laws and practices, and legal claims for errors ormistakes by our personnel.
Financial risks
Substantial capital requirements
Our management team anticipates that we may make substantial capital expenditures for the exploration and development of our properties, in the future. As we are inthe exploration stage with no revenue being generated from the exploration activities on our mineral properties, we have limited ability to raise the capital necessary toundertake or complete future exploration work, including drilling programs. There can be no assurance that debt or equity financing will be available or sufficient tomeet these requirements or for other corporate purposes or, if debt or equity financing is available, that it will be on terms acceptable to us and any such financing mayresult in substantial dilution to existing shareholders. Moreover, future activities may require us to alter our capitalization significantly. Our inability to access sufficientcapital for our operations could have a material adverse effect on our financial condition, results of operations or prospects. In particular, failure to obtain such financingon a timely basis could cause us to forfeit our interest in certain properties, miss certain acquisition opportunities and reduce or terminate our operations.
Page 124
History of net losses
We have received no revenue to date from activities on our properties, and there is no assurance that any of our properties will generate earnings, operate profitably orprovide a return on investment in the future. We have not determined that production activity is warranted on any of our mineral properties. Even if we (alone or inconjunction with a third party) undertake development and production activities on any of our mineral properties, there is no certainty that we will produce revenue,operate profitably or provide a return on investment in the future.
We are subject to all of the risks associated with new mining operations and business enterprises including, but not limited to:
It is common in new mining operations to experience unexpected problems and delays during construction, development, and mine start-up. In addition, delays inmineral production often occur. Accordingly, there are no assurances that our activities will result in sustainable profitable mining operations or that we willsuccessfully establish mining operations or profitably produce metals at any of our other properties.
Potential volatility of share price
In recent years, the securities markets in Canada have experienced a high level of price and volume volatility, and the market price of securities of many juniorcompanies have experienced wide fluctuations in price. The market price of our shares may be volatile and could be subject to wide fluctuations due to a number offactors, including but not limited to: actual or anticipated fluctuations in the results of our operations; changes in estimates of our future results of operations bymanagement or securities analysts; and general industry changes. In addition, the financial markets have in the recent past experienced significant price and valuefluctuations that have particularly affected the market prices of equity securities of many venture issuers and that sometimes have been unrelated to the operatingperformance of these companies. Broad market fluctuations, as well as economic conditions generally and in the mining industry specifically, may adversely affect themarket price of our shares.
Page 125
• the timing and cost, which can be considerable, for the further construction of mining and processing facilities;
• the availability and costs of skilled labour, consultants, mining equipment and supplies;
• the availability and cost of appropriate smelting and/or refining arrangements;
• the need to obtain necessary environmental and other governmental approvals, licenses and permits, and the timing of those approvals, licenses and permits; and
• the availability of funds to finance construction and development activities.
Non-Canadian investors
We are a public Canadian corporation, with our principal place of business in Canada. A majority of our directors and officers are residents of Canada and a significantportion of our assets and the assets of a majority of our directors and officers are located outside the United States. Consequently, it may be difficult for US or foreigninvestors to effect service of process within their local jurisdiction upon First Mining or its directors or officers or such experts who are residents of Canada, or torealize in their local jurisdiction upon judgments of local courts (including, but not limited to, judgments predicated upon civil liabilities under the United StatesSecurities Act of 1933, as amended). Investors should not assume that Canadian courts: (i) would enforce judgments of foreign courts obtained in actions against FirstMining or such directors, officers or experts (including, but not limited to, judgments predicated upon the civil liability provisions of the US federal securities laws orthe securities or “blue sky” laws of any state within the United States); or (ii) would enforce, in original actions, liabilities against First Mining or such directors,officers or experts predicated upon foreign securities laws (including, but not limited to, the US federal securities laws or any state securities or “blue sky” laws). Inaddition, the protections afforded by Canadian securities laws may not be available to foreign investors.
Currency fluctuations
We maintain our accounts in Canadian dollars. Our operations in Mexico and the United States make us subject to foreign currency fluctuations and such fluctuationsmay affect our financial position and results. We do not plan to engage in currency hedging activities.
Volatility of mineral prices
Metal prices are affected by numerous factors beyond our control, such as industrial demand, inflation and expectations with respect to the rate of inflation, the strengthof the US dollar and of other currencies, interest rates, forward sales by producers, production and cost levels, changes in investment trends, global and regional levelsof supply and demand, metal stock levels maintained by producers, inventory carrying costs, availability, demand and costs of metal substitutes, international economicand political conditions, reduced demand resulting from obsolescence of technologies and processes utilizing silver and other metals and increased production due tonew mine developments and improved mining and production levels. Gold prices are sometimes subject to rapid short-term changes because of speculative activities,and the market price of gold and other metals may not remain at current levels. If these prices were to decline significantly or for an extended period of time, we mightbe unable to continue our operations, develop our properties or fulfill our obligations under agreements with our partners or under our permits and licenses. As a result,we might lose our interest in, or be forced to sell, some of our properties. In the event of a sustained, significant drop in gold prices, we may be required to re-evaluateour assets, resulting in reduced estimates of mineral resources and mineral reserves and in material write-downs of our investment in mining properties. Furthermore,since gold prices are established in US dollars, a significant decrease in the value of the Canadian dollar relative to the US dollar coupled with stable or declining goldprices could adversely affect our results with respect to development of and eventual sale of gold.
Global financial conditions
Global financial conditions continue to be characterized by volatility. Many industries, including the mining industry, are impacted by volatile market conditions.Global financial conditions remain subject to sudden and rapid destabilizations in response to economic shocks. A slowdown in the financial markets or other economicconditions, including but not limited to consumer spending, employment rates, business conditions, inflation, fluctuations in fuel and energy costs, consumer debtlevels, lack of available credit, the state of the financial markets, interest rates and tax rates, may adversely affect our growth and financial condition. Future economicshocks may be precipitated by a number of causes, including the government debt levels, fluctuations in the price of oil and other commodities, the volatility of metalprices, geopolitical instability, terrorism, the volatility of currency exchanges, the devaluation and volatility of global stock markets and natural disasters. Any sudden orrapid destabilization of global economic conditions could impact our ability to obtain equity or debt financing in the future on terms favourable to us or at all. In such anevent, our operations and financial condition could be adversely impacted.
Page 126
Dividends
To date, we have not paid any dividends on our outstanding common shares and we have no plans to declare or pay dividends in the near future. Any decision to paydividends on our shares will be made by our Board on the basis of our earnings, financial requirements and other conditions.
Dilution
The number of common shares we are authorized to issue is unlimited. We may, in our sole discretion, issue additional common shares from time to time, and theinterests of the shareholders may be diluted thereby.
Political risks
Foreign operations
While our principal exploration properties are located in Canada, we continue to hold properties in Mexico. Our operations in Mexico or in other countries wedetermine to operate in may be exposed to various levels of political, economic, and other risks and uncertainties depending on the country or countries in which weoperate. These risks and uncertainties include, but are not limited to, terrorism; hostage taking; military repression; fluctuations in currency exchange rates; high rates ofinflation; labour unrest; the risks of civil unrest; expropriation and nationalization; renegotiation or nullification of existing concessions, licenses, permits and contracts;illegal mining; changes in taxation policies; restrictions on foreign exchange and repatriation; and changing political conditions, currency controls, and governmentalregulations that favour or require the awarding of contracts to local contractors, or require foreign contractors to employ citizens of, or purchase supplies from, aparticular jurisdiction.
Future political and economic conditions may result in a government adopting different policies with respect to foreign development and ownership of mineralresources. Any changes in policy may result in changes in laws affecting ownership of assets, foreign investment, taxation, rates of exchange, resource sales,environmental protection, labour relations, price controls, repatriation of income, and return of capital, which may affect both the ability to undertake exploration anddevelopment activities in respect of future properties in the manner currently contemplated, as well as our ability to continue to explore, develop, and operate thoseproperties to which we have rights relating to exploration, development, and operations.
Page 127
Indigenous peoples
Various international and national laws, codes, court decisions, resolutions, conventions, guidelines, and other materials relate to the rights of indigenous peoplesincluding the First Nations of Canada. We operate in some areas presently or previously inhabited or used by indigenous peoples including areas covered by treatiesamong the First Nations, the federal and applicable provincial governments. Many of these materials impose obligations on government to respect the rights ofindigenous people. Some mandate that government consult with indigenous people regarding government actions which may affect indigenous people, including actionsto approve or grant mining rights or exploration, development or production permits. The obligations of government and private parties under the various internationaland national materials pertaining to indigenous people continue to evolve and be defined. Our current and future exploration program may be subject to a risk that oneor more groups of indigenous people may oppose development on any of our properties or on properties in which we hold a direct or indirect interest. Such oppositionmay be directed through legal or administrative proceedings or expressed in manifestations such as protests, roadblocks or other forms of public expression against ouractivities. Opposition by indigenous people to our operations may require modification of or preclude development of our projects or may require us to enter intoagreements with indigenous people with respect to projects on such properties. Such agreements may have a material adverse effect on our business, financial conditionand results of operations.
Regulatory risks
Government approvals
Our activities are subject to government approvals, various laws governing prospecting, development, land resumptions, production taxes, labour standards andoccupational health, mine safety, toxic substances and other matters, including issues affecting local First Nations populations. The costs associated with compliancewith these laws and regulations can be substantial. Although we believe our activities are carried out in accordance with all applicable rules and regulations, noassurance can be given that new rules and regulations will not be enacted or that existing rules and regulations will not be applied in a manner which could limit orcurtail production or development, or cause additional expense, capital expenditures, restrictions or delays in the development of our properties. Amendments to currentlaws and regulations governing operations and activities of exploration and mining, or more stringent implementation thereof, could have a material adverse impact onour business, operations and financial performance. Further, the mining licenses and permits issued in respect of our projects may be subject to conditions which, if notsatisfied, may lead to the revocation of such licenses. In the event of revocation, the value of our investments in such projects may decline.
Mineral claims, licenses and permitting
Our mineral claims, licenses and permits are subject to periodic renewal and may only be renewed a limited number of times for a limited period of time. While weanticipate that renewals will be given as and when sought, there is no assurance that such renewals will be given as a matter of course and there is no assurance that newconditions will not be imposed in connection therewith. Our business objectives may also be impeded by the costs of holding and/or renewing the mineral claims,licenses and permits. In addition, the duration and success of efforts to obtain and renew mineral claims, licenses and permits are contingent upon many variables notwithin our control.
Page 128
Our current and anticipated future operations, including further exploration, development activities and commencement of production on our properties, require licensesand permits from various governmental authorities. We cannot be certain that all licenses and permits that we may require for our operations will be obtainable onreasonable terms or at all. Delays or a failure to obtain such licenses and permits, or a failure to comply with the terms of any such licenses and permits that we haveobtained, could have a material adverse impact on First Mining.
Anti-bribery legislation
Our activities are subject to a number of laws that prohibit various forms of corruption, including domestic laws, that prohibit both commercial and official bribery andanti-bribery laws that have a global reach such as the Corruption of Foreign Public Officials Act. The increasing number and severity of enforcement actions in recentyears present particular risks with respect to our business activities, to the degree that any employee or other person acting on our behalf might offer, authorize, or makean improper payment to a government official, party official, candidate for political office, or political party, an employee of a state-owned or state-controlledenterprise, or an employee of a public international organization.
Transparency in the extractive industry
In its 2014–2015 Budget, the Federal Government of Canada had announced it would be putting new standards in place to require companies in the extractive sector todisclose their payments to local and foreign governments.
The Canadian Extractive Sector Transparency Measures Act (“ESTMA”) came into force on June 1, 2015 and applies to fiscal periods which commenced after thatdate. As a result, as a Canadian publicly listed corporation we must report annually on payments of $100,000 or more made to any level of government in Canada orabroad related to a single project. The reporting applies to taxes, licences, fees, royalties, production entitlements, bonuses, dividends, fines and infrastructure payments.We filed our first report under ESTMA on May 29, 2017 which reported the amount we paid to governmental agencies in Mexico for annual mineral propertyconcession taxes. This report is publicly available on the Department of Natural Resources website (www.nrcan.gc.ca).
Environmental risks
Environmental laws and regulations
All phases of the mining business present environmental risks and hazards and are subject to environmental regulation pursuant to a variety of international conventionsand state and municipal laws and regulations. Environmental legislation provides for, among other things, restrictions and prohibitions on spills, releases or emissions ofvarious substances produced in association with mining operations. The legislation also requires that mines and exploration sites be operated, maintained, abandonedand reclaimed to the satisfaction of applicable regulatory authorities. Compliance with such legislation can require significant expenditures and a breach may result inthe imposition of fines and penalties, some of which may be material. Environmental legislation is evolving in a manner expected to result in stricter standards andenforcement, larger fines and liability and potentially increased capital expenditures and operating costs. Environmental assessments of proposed projects carry aheightened degree of responsibility for companies and directors, officers and employees. The cost of compliance with changes in governmental regulations has apotential to reduce the profitability of operations.
Page 129

We believe we are in substantial compliance with all material laws and regulations which currently apply to our activities. We cannot give any assurance that,notwithstanding our precautions and limited history of activities, breaches of environmental laws (whether inadvertent or not) or environmental pollution will not resultin additional costs or curtailment of planned activities and investments, which could have a material and adverse effect on our future cash flows, earnings, results ofoperations and financial condition. Failure to comply with applicable laws, regulations, and permitting requirements may result in enforcement actions thereunder,including orders issued by regulatory or judicial authorities causing operations to cease or be curtailed, and may include corrective measures requiring capitalexpenditures, installation of additional equipment, or remedial actions. Companies engaged in mining operations may be required to compensate those suffering loss ordamage by reason of the mining activities and may have civil or criminal fines or penalties imposed for violations of applicable laws or regulations and, in particular,environmental laws.
Amendments to current laws, regulations and permits governing operations and activities of mining companies, or more stringent implementation thereof, could have amaterial adverse impact on us and cause increases in capital expenditures or any future production costs or require abandonment or delays in the development of newmining properties.
Companies engaged exploration and development of mineral properties may from time to time experience increased costs and delays in exploration and production as aresult of the need to comply with applicable laws, regulations and permits. We believe we are in substantial compliance with all material laws and regulations whichcurrently apply to our activities. We cannot give any assurance that, notwithstanding our precautions and limited history of activities, breaches of environmental laws(whether inadvertent or not) or environmental pollution will not result in additional costs or curtailment of planned activities and investments, which could have amaterial and adverse effect on our future cash flows, earnings, results of operations and financial condition.
Compliance with emerging climate change regulations
Governments at all levels may be moving towards enacting legislation to address climate change concerns, such as requirements to reduce emission levels and increaseenergy efficiency, and political and economic events may significantly affect the scope and timing of climate change measures that are ultimately put in place. Wherelegislation has already been enacted, such regulations may become more stringent, which may result in increased costs of compliance. There is no assurance thatcompliance with such regulations will not have an adverse effect on our results of operations and financial condition. Furthermore, given the evolving nature of thedebate related to climate change and resulting requirements, it is not possible to predict the impact on our results of operations and financial condition.
Climate change may result in an increasing frequency of extreme weather events (such as increased periods of snow and increased frequency and intensity of storms)which have the potential to disrupt our exploration and development plans. Our emergency plans for managing extreme weather conditions may not be sufficient andextended disruptions could have adverse effects on our results of operations and financial condition.
Page 130
Industry risks
Speculative nature of mineral development activities
Resource exploration and development is a speculative business, characterized by a number of significant risks including, among other things, unprofitable effortsresulting not only from the failure to discover mineral deposits but from finding mineral deposits which, though present, may, for a variety of factors not be economic toproduce.
The marketability of minerals acquired or discovered by us may be affected by numerous factors which are beyond our control and which cannot be accuratelypredicted, such as:
Estimates of mineral resources, mineral reserves, mineral deposits and production costs can also be affected by such factors as:
In addition, the grade of mineralized material ultimately mined may differ from that indicated by drilling results.
Short term factors relating to mineral reserves, such as the need for orderly development of mineralized bodies or the processing of new or different grades, may alsohave an adverse effect on mining operations and on the results of operations. Material changes in mineralized material reserves, grades, stripping ratios or recovery ratesmay affect the economic viability of any project.
Our mineral properties are all in the exploration stage only and are without known bodies of commercial mineralized material. Few properties which are explored areultimately developed into producing mines. Major expenses may be required to establish mineral reserves, develop metallurgical processes and construct mining andprocessing facilities at a particular site. There is no assurance that our mineral exploration activities will result in any discoveries of new commercial bodies ofmineralized material. There are no reassurances that commercial production activities will commence on any of our properties.
Page 131
• market fluctuations;
• the proximity and capacity of milling facilities;
• mineral markets;
• processing equipment; and
• government regulations, including regulations relating to royalties, allowable production, importing and exporting of minerals and environmental protection.
• environmental permitting regulations and requirements;
• weather;
• environmental factors;
• unforeseen technical difficulties;
• unusual or unexpected geological formations; and
• work interruptions.
Competition
The mining industry is highly competitive. We compete with companies for the acquisition, exploration and development of gold and other precious and base metals,and for capital to finance such activities, and such companies may have similar or greater financial, technical and personnel resources available to them.
Other risks
Reliance on key employees
We manage our business with a number of key personnel, including key contractors, the loss of a number of whom could have a material adverse effect on us. Inaddition, as our business develops and expands, we believe that our future success will depend greatly on our continued ability to attract and retain highly-skilled andqualified personnel and contractors. In assessing the risk of an investment in our shares, potential investors should realize that they are relying on the experience,judgment, discretion, integrity and good faith of our management team and board of directors. We cannot be certain that key personnel will continue to be employed byus or that we will be able to attract and retain qualified personnel and contractors in the future. Failure to retain or attract key personnel could have a material adverseeffect on us. We do not maintain “key person” insurance policies in respect of our key personnel.
Conflicts of interest
Certain directors and officers will be engaged in, and will continue to engage in, other business activities on their own behalf and on behalf of other companies(including mineral companies) and, as a result of these and other activities, such directors and officers may become subject to conflicts of interest. The BCBCAprovides that if a director has a material interest in a contract or proposed contract or agreement that is material to the issuer, the director must disclose his interest insuch contract or agreement and must refrain from voting on any matter in respect of such contract or agreement, subject to and in accordance with the BCBCA. To theextent that conflicts of interest arise, such conflicts will be resolved in accordance with the provisions of the BCBCA and in accordance with our Code of BusinessConduct and Ethics.
Uninsured risks
Our business is subject to a number of risks and hazards, including adverse environmental conditions, industrial accidents, labour disputes, unusual or unexpectedgeological conditions, ground or slope failures, cave-ins, changes in the regulatory environment and natural phenomena, such as inclement weather conditions, floodsand earthquakes. Such occurrences could result in damage to our properties, personal injury or death, delays in program development, monetary losses and possiblelegal liability.
Although we maintain insurance to protect against certain risks in amounts that we consider reasonable, our insurance will not cover all the potential risks associatedwith our operations. We may also be unable to maintain insurance to cover these risks at economically feasible premiums. Insurance coverage may not continue to beavailable or may not be adequate to cover any resulting liability. Moreover, insurance against certain risks, such as environmental pollution or other hazards as a resultof exploration and production, is not generally available to us or to other companies in the mining industry on acceptable terms. We may also become subject to liabilityfor pollution or other hazards which may not be insured against or which we may elect not to insure against because of premium costs or other reasons. Losses fromthese events may cause us to incur significant costs that could have a material adverse effect upon our financial performance, results of operations and business outlook.
Page 132
Litigation and regulatory proceedings
We may be subject to civil claims (including class action claims) based on allegations of negligence, breach of statutory duty, public nuisance or private nuisance orotherwise in connection with our operations, or investigations relating thereto. While we are presently unable to quantify any potential liability under any of the aboveheads of damage, such liability may be material to us and may materially adversely affect our ability to continue operations. In addition, we may be subject to actions orrelated investigations by governmental or regulatory authorities in connection with our business activities, including, but not limited to, current and historic activities atour mineral properties. Such actions may include prosecution for breach of relevant legislation or failure to comply with the terms of our licenses and permits and mayresult in liability for pollution, other fines or penalties, revocations of consents, permits, approvals or licenses or similar actions, which could be material and mayimpact the results of our operations. Our current insurance coverage may not be adequate to cover any or all the potential losses, liabilities and damages that could resultfrom the civil and/or regulatory actions referred to above.
Future Acquisitions and Dispositions
We evaluate growth opportunities and may consider the acquisition and disposition of exploration and development properties and mineral assets. From time to time,we may engage in discussions in respect of both acquisitions and dispositions, and other business opportunities, but there can be no assurance that any such discussionswill result in a successfully completed transaction.
Acquisition or business arrangements
As part of our business strategy, we have sought and may continue to seek new mining and exploration opportunities in the mining industry. In pursuit of suchopportunities, we may fail to select appropriate acquisition targets or negotiate acceptable arrangements, including arrangements to finance acquisitions or integrate theacquired businesses into us. Ultimately, any acquisitions would be accompanied by risks, which could include:
Any material issues that we encounter in connection with an acquisition could have a material adverse effect on our business, results of operations and financialposition.
Page 133
• a significant change in commodity prices after we have committed to complete the transaction and established the purchase price or exchange ratio;
• a material ore body could prove to be below expectations;
• difficulty in integrating and assimilating the operations and workforce of any acquired companies;
• realizing anticipated synergies and maximizing the financial and strategic position of the combined enterprise;
• the bankruptcy of parties with whom we have arrangements;
• maintaining uniform standards, policies and controls across the organization;
• disruption of our ongoing business and its relationships with employees, suppliers, contractors and other stakeholders as we integrate the acquired business or assets;
• the acquired business or assets may have unknown liabilities which may be significant;
• delays as a result of regulatory approvals; and
• exposure to litigation (including actions commenced by shareholders) in connection with the transaction.
Joint ventures
If we dispose of any of our mineral properties, we may consider retaining interest in such properties and that interest may be in the form of a joint venture. Theexistence or occurrence of one or more of the following circumstances and events could have a material adverse impact on our profitability or the viability of ourinterests that may be held through joint ventures, which could have a material adverse impact on our future cash flows, earnings, results of operations and financialcondition:
Future Sales of Shares
Sales of a substantial number of our shares in the public market could occur at any time following, or in connection with, the completion of any offering. These sales, orthe market perception that the holders of a large number of our shareholders intend to sell our shares, could reduce the market price of our shares. A decline in themarket price of the shares could impair our ability to raise additional capital through the sale of securities should we desire to do so.
The issuance of shares to shareholders whose investment profile may not be consistent with the our business may lead to significant sales of our shares or a perceptionthat such sales may occur, either of which could have a material adverse effect on the market for and market price of our shares. We are unable to predict the effect thatsales may have on the then prevailing market price of our shares.
Shares Owned by a Single Shareholder
A significant percentage of our outstanding shares are owned by an exchange traded fund (an “ETF”). As such, the ETF is in a position to exercise influence overmatters requiring shareholder approval, including the determination of significant corporate actions that could otherwise be beneficial to our other shareholders,including the election and removal of directors, amendments to our corporate governing documents and business combinations. Our interests and those of the ETF’smay at times conflict, and this conflict might be resolved against our interests. The concentration of control by a single shareholder may practically preclude anunsolicited take-over bid for our shares, and this may adversely impact the value and trading price of our shares.
Page 134
• disagreements with joint venture partners on how to develop and operate mines efficiently;
• inability to exert influence over certain strategic decisions made in respect of joint venture properties;
• inability of joint venture partners to meet their obligations to the joint venture or third parties; and
• litigation between joint venture partners regarding joint venture matters.
Reputation Loss
Reputation loss may result in decreased investor confidence, increased challenges in developing and maintaining community relations and an impediment to our overallability to advance our projects, thereby having a material adverse impact on our financial performance, financial condition and growth prospects. Damage to ourreputation can be the result of the actual or perceived occurrence of any number of events, and could include any negative publicity (for example, with respect to ourhandling of environmental matters or our dealings with community groups), whether true or not. The increased usage of social media and other web-based tools used togenerate, publish and discuss user-generated content and to connect with other users has made it increasingly easier for individuals and groups to communicate andshare opinions and views in regards to us and our activities, whether true or not. We do not ultimately have direct control over how we are perceived by others andreputational loss could have a material adverse impact on our financial performance, financial condition and growth prospects.
Other risks
Our business and operations are subject to a number of risks and hazards including:
Such risks could result in damage to, or destruction of, properties or equipment, personal injury or death, loss of key employees, environmental damage, delays indevelopment programs, monetary losses and possible legal liability. Satisfying such liabilities may be very costly and could have a material adverse effect on futurecash flow, results of operations and financial condition.
Page 135
• environmental hazards;
• discharge of pollutants or hazardous chemicals;
• industrial accidents;
• failure of processing and mining equipment;
• labour disputes;
• supply problems and delays;
• changes in regulatory environment;
• encountering unusual or unexpected geologic formations or other geological or grade problems;
• encountering unanticipated ground or water conditions;
• cave-ins, pit-wall failures, flooding, rock bursts and fire;
• periodic interruptions due to inclement or hazardous weather conditions;
• uncertainties relating to the interpretation of drill results;
• inherent uncertainty of production and cost estimates and the potential for unexpected costs and expenses;
• results of initial feasibility, pre-feasibility and feasibility studies, and the possibility that future exploration or development results will not be consistent with our expectations;
• the potential for delays in exploration or the completion of feasibility studies; and
• other acts of God or unfavourable operating conditions.
Legal proceedings
On June 16, 2016, First Mining assumed control of the business and assets of Tamaka as a result of the amalgamation between Tamaka and a wholly owned subsidiaryof First Mining. Tamaka was a party to three debentures with an aggregate principal amount of approximately $2.1 million (collectively, the “Debentures”), payable toKesselrun Resources Ltd. (“Kesselrun”). Kesselrun commenced an action before the Ontario Superior Court alleging that the Debentures were required to be convertedinto common shares of First Mining as a result of the amalgamation transaction with Tamaka, seeking an order for, among other things, the issuance to Kesselrun ofshares of First Mining or, in the alternative, damages. First Mining disagreed with this position, and took the position that the Debentures had not been converted andremained outstanding.
On June 30, 2017, we settled the Debentures by issuing to Kesselrun 4,700,000 common shares of First Mining common (which were valued at $3,102,000 using theclosing price as at June 30, 2017), and paying Kesselrun $200,000 in cash.
For further information about this, see note 16 to our audited consolidated annual financial statements for the year ended December 31, 2017.
Investor information
Share capital
Our authorized share capital consists of:
Common shares
We can issue an unlimited number of common shares with no nominal or par value. As of December 31, 2017, we had 552,547,616 common shares outstanding(557,471,616 outstanding as of the date of this AIF). All of our outstanding common shares are fully paid and non-assessable.
The following is a summary of the principal attributes of our common shares:
Voting rights
Holders of our common shares are entitled to vote on all matters that are to be voted on at any shareholder meeting, other than meetings that are only for holders ofanother class or series of shares. Each common share you own represents one vote. There are no cumulative voting rights, and directors do not stand for re-election atstaggered intervals.
Dividends
Holders of our common shares are entitled to share pro rata in any profits of First Mining to the extent that such profits are distributed either through the declaration ofdividends by our Board or otherwise distributed to shareholders. There are no indentures or agreements limiting the payment of dividends.
Page 136
• an unlimited number of common shares; and
• an unlimited number of preferred shares, issuable in series.
Rights on dissolution
In the event of the liquidation, dissolution or winding up of First Mining, the holders of our common shares will be entitled to receive, on a pro rata basis, all of ourassets remaining after payment of all of our liabilities.
Pre-emptive, conversion and other rights
Holders of our common shares have no pre-emptive, redemption, purchase or conversion rights attaching to their shares, and our common shares, when fully paid, willnot be liable to further call or assessment. No other class of shares may be created without the approval of the holders of our common shares. There are no provisionsdiscriminating against any existing or prospective holder of our common shares as a result of such shareholder owning a substantial number of common shares. Inaddition, non-residents of Canada who hold our common shares have the same rights as shareholders who are residents of Canada.
Preferred shares
We can issue an unlimited number of preferred shares with no nominal or par value. As of the date of this AIF, we did not have any preferred shares outstanding.
The preferred shares are issuable in series. The preferred shares of each series rank in parity with the preferred shares of every other series with respect to dividends andreturn of capital and are entitled to a preference over the common shares and any other shares ranking junior to the preferred shares with respect to priority in thepayment of dividends and the distribution of assets in the event of the liquidation, dissolution or winding-up of First Mining.
Our Board of Directors is empowered to fix the number of shares and the rights to be attached to the preferred shares of each series, including the amount of dividendsand any conversion, voting and redemption rights. Subject to our articles of incorporation and to applicable law, the preferred shares as a class are not entitled to receivenotice of or attend or vote at meetings of the Company’s shareholders.
Security-based compensation and convertible securities
Stock options
Our shareholders most recently approved the Company’s existing stock option plan (the “Option Plan”) on June 16, 2016. The Option Plan allows for the issuance ofup to 10% of our issued and outstanding shares as incentive share options (“Options”) to our directors, officers, employees and consultants of the Company.
Options granted under the Option Plan may be subject to vesting provisions as determined by our Board of Directors. All of our outstanding Options are fully vestedand exercisable, with the exception of Options that have been granted to employees who carry out investor relations functions, as their Options are subject to certainvesting periods required under the rules and policies of the TSX.
As of December 31, 2017 and as of the date of this AIF, there were 30,608,000 Options and 40,019,000 Options, respectively, outstanding with exercise prices rangingfrom $0.15 to $2.50, and expiry dates ranging from April 8, 2018 to January 15, 2023.
Page 137
Warrants
In addition to the outstanding Options noted above, as of December 31, 2017 and as of the date of this AIF, there were 49,693,409 share purchase warrants and44,933,409 share purchase warrants, respectively, outstanding to acquire common shares of First Mining at exercise prices ranging from $0.17 to $1.10, and with expirydates ranging from February 5, 2018 to June 16, 2021.
Escrowed securities
The following table shows the number and percentage of common shares held, to First Mining’s knowledge, in escrow or subject to a contractual restriction on transferas at December 31, 2017:
Notes:
Material contracts
Other than contracts made in the ordinary course of business, as of the date of this AIF, we have no material contracts.
Market for our securities
Our common shares are listed and traded on the TSX under the symbol “FF”, on the OTC-QX under the symbol “FFMGF”, and on the Frankfurt Stock Exchange underthe symbol “FMG”.
We have a registrar and transfer agent for our common shares:
Computershare Investor Services Inc. 510 Burrard Street, 2nd Floor, Vancouver, British Columbia V6C 3B9.
Page 138
Number of securities held in escrow orDesignation of class subject to a contractual restriction on Percentage of class
transfer
Common Shares 19,089,241 (1)(2)(3) 3.5%
1. Of this number, as of December 31, 2017, 1,099,842 common shares of First Mining were being held in escrow by Computershare Investor Services Inc. pursuant to an Escrow Value SecurityAgreement dated March 30, 2015 that was entered into in connection with the Sundance Acquisition. 15% of these shares will be released on March 30 and September 30 of each year, untilthe final release of shares on March 30, 2018.
2. Of this number, as of December 31, 2017, 194,425 common shares of First Mining were being held in escrow by Computershare Investor Services Inc. pursuant to a CPC Escrow Agreementdated August 2, 2005. 15% of these shares will be released on March 30 and September 30 of each year, until the final release of shares on March 30, 2018.
3. Of this number, as of December 31, 2017, 17,794,974 common shares of First Mining were being held in escrow by Computershare Trust Company of Canada pursuant to an escrowagreement dated June 16, 2016 that was entered into in connection with our acquisition of Tamaka. 5,931,658 of these escrowed shares will be released from escrow on June 17, 2018, andthereafter 5,931,658 shares will be released on December 17, 2018, and the final 5,931,658 shares will be released on June 17, 2019.
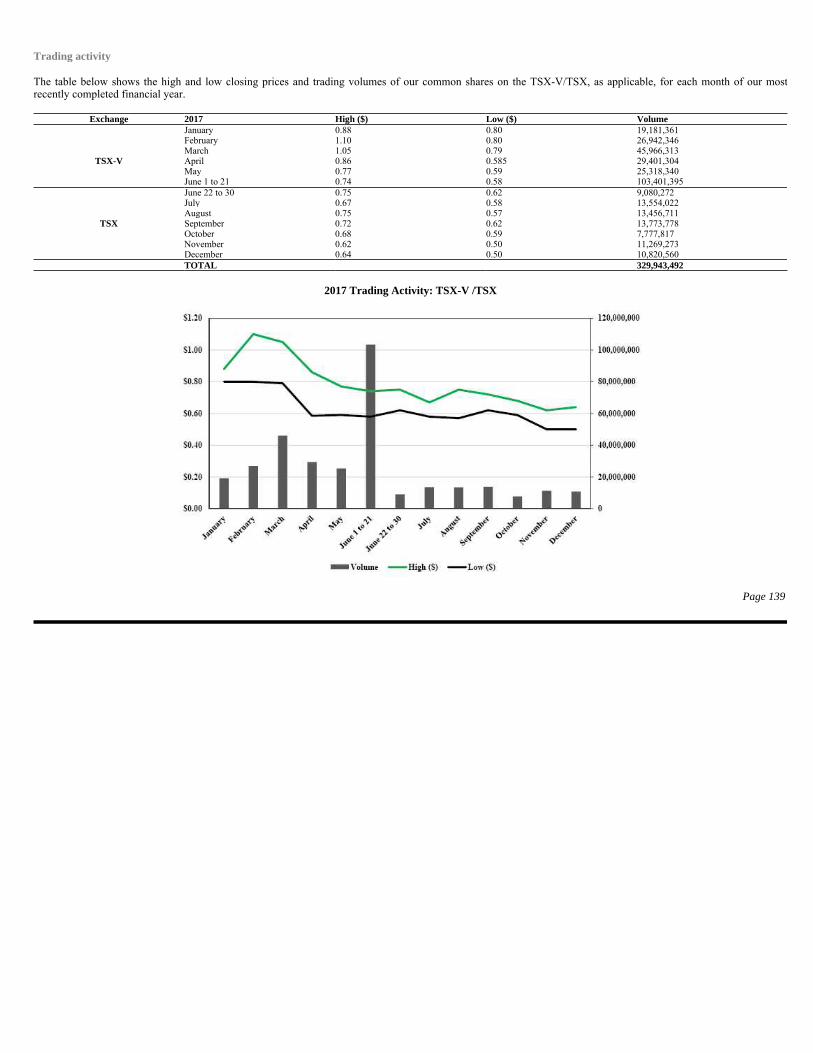
Trading activity
The table below shows the high and low closing prices and trading volumes of our common shares on the TSX-V/TSX, as applicable, for each month of our mostrecently completed financial year.
2017 Trading Activity: TSX-V /TSX
Page 139
Exchange 2017 High ($) Low ($) Volume January 0.88 0.80 19,181,361 February 1.10 0.80 26,942,346 March 1.05 0.79 45,966,313
TSX-V April 0.86 0.585 29,401,304 May 0.77 0.59 25,318,340 June 1 to 21 0.74 0.58 103,401,395 June 22 to 30 0.75 0.62 9,080,272 July 0.67 0.58 13,554,022 August 0.75 0.57 13,456,711
TSX September 0.72 0.62 13,773,778 October 0.68 0.59 7,777,817 November 0.62 0.50 11,269,273 December 0.64 0.50 10,820,560 TOTAL 329,943,492
Our team
Directors
All our directors are elected for a one year term, and hold office until our next annual shareholder meeting, unless he or she resigns before that time or steps down, asrequired by corporate law. The directors of First Mining as of the date of this AIF are as follows:
Page 140
Director Board committees Principal occupation or employment for past five years
Chairman of the Board Director and Chairman of First Mining since March 2015
Audit Committee
Compensation Committee November 2001 to present - Founder, President and Chief Executive Officer, First
Corporate Governance Majestic Silver Corp. (mining company) Committee
December 1998 to present - Director, First Majestic Silver Corp. (mining company)
Keith Neumeyer Zug, Switzerland
Director since March 30, 2015
Ownership of Securities: 10,955,313 shares 356,129 warrants 6,190,000 options
Director Board committees Principal occupation or employment for past five years
Compensation Director of First Mining since April 2016 Committee (chair) September 2016 to present - Director,
SIRIOS Resources Inc. (mining company)
July 2016 to present - Chairman, Monarques Gold Corp. (mining company)
May 2013 to present - Director, Cartier Resources Inc. (mining company)
November 2011 to April 2016 - President, Chief Executive Officer and a Director of Clifton Star Resources Inc. (mining company)
Michel Bouchard Québec, Canada May 2009 to November 2011 - Vice-
President, Exploration and Development at Director since North American Palladium Ltd. (mining April 8, 2016 company)
Ownership of Securities: 304,000 shares 15,000 warrants 1,849,000 options
Page 141
Director Board committeesPrincipal occupation or employmentfor past five years
None Director of First Mining since March 2015
Chief Operating Officer of First Mining since
January 2018
March 2015 to January 2018 - Chief
Executive Officer of First Mining
September 2011 to March 2015 - Chief
Executive Officer, Sundance Minerals Ltd.
(private mining company)
Chris Osterman, Ph.D. April 2007 to March 2015 - President, Tucson, Arizona Sundance Minerals Ltd. (private mining USA company)
Director since March 30, 2015
Ownership of Securities: 1,760,084 shares 8,500 warrants 6,265,000 options
Director Board committeesPrincipal occupation or employmentfor past five years
Audit Committee Director of First Mining since March 2015 (chair)
February 2007 to present - Chief Financial Compensation Officer of First Majestic Silver Corp. (mining Committee company)
Corporate Governance Committee
Raymond L. Polman, CPA, CA Vancouver, British Columbia, Canada
Director since March 30, 2015
Ownership of Securities: 358,333 shares NIL warrants 1,625,000 options
Page 142
Director Board committeesPrincipal occupation or employmentfor past five years
Audit Committee Director of First Mining since March 2015
Compensation Committee June 2014 to present - Director of Medallion Resources Ltd. (mining company)
Corporate Governance Committee (chair) December 2010 to present - Director of Great
Quest Fertilizer Ltd. (mining company)
January 2005 to present - Director, First Majestic Silver Corp. (mining company)
David Shaw, Ph.D. June 2000 to present - President of Vancouver, British Duckmanton Partners Ltd. (consulting Columbia, Canada business)
Director since November 2013 to July 2014 - Director of March 30, 2015 Global Strategic Metals NL (capital pool (Director of the predecessor company) company, Albion Petroleum Ltd., since April 5, 2005) September 2010 to March 2013 - Director of
Talison Lithium Inc. (mining company)
April 2005 to March 2015 - President and Director of Albion Petroleum Ltd. (capital pool company)
Ownership of Securities: 713,250 shares 50,000 warrants 1,525,000 options
Page 143
Director Board committeesPrincipal occupation or employmentfor past five years
None Director of First Mining since March 2018
President and Chief Executive Officer and a
Director of First Mining since March 22,
2018.
January 2018 to March 2018 - Chief
Executive Officer of First Mining
May 2017 to present - Director of First Cobalt
Corp. (mining company) Jeff Swinoga
Toronto, Ontario, April 2014 to January 2018 - Chief Financial Canada Officer, Torex Gold Resources Inc. (mining
company) Director since March 22, 2018 January 2013 to April 2014 - Executive Vice
President and Chief Financial Officer, Golden Star Resources Ltd. (mining company)
July 2009 to January 2013 - Vice President, Finance and Chief Financial Officer, North American Palladium Ltd. (mining company)
Ownership of Securities: 142,000 shares NIL warrants 1,000,000 options
Officers
The officers of our Company as of the date of this AIF are as follows:
Page 144
Officer Principal occupation or employment for past five years
President and Chief Executive Officer and a Director of First Mining since March 22, 2018.
January 2018 to March 2018 - Chief Executive Officer of First Mining
May 2017 to present ? Director of First Cobalt Corp. (mining company)
April 2014 to January 2018 - Chief Financial Officer, Torex Gold Resources Inc. (mining company)
January 2013 to April 2014 - Executive Vice President and Chief Financial Officer, Golden Star Resources Ltd. (mining company)
Jeff SwinogaPresident and July 2009 to January 2013 - Vice President, Finance and Chief Chief Executive Officer Financial Officer, North American Palladium Ltd. (mining company)
Toronto, Ontario Canada
Ownership of Securities: 142,000 shares NIL warrants 1,000,000 options
Officer Principal occupation or employment for past five years
Chief Operating Officer of First Mining since January 2018
Director of First Mining since March 2015
March 2015 to January 2018 - Chief Executive Officer of First Mining
September 2011 to March 2015 - Chief Executive Officer, Sundance
Minerals Ltd. (private mining company)
April 2007 to March 2015 - President, Sundance Minerals Ltd. (private
mining company) Chris Osterman, Ph.D.Chief Operating Officer
Tucson, Arizona USA
Ownership of Securities: 1,760,084 shares 8,500 warrants 6,265,000 options
Page 145
Officer Principal occupation or employment for past five years
Chief Financial Officer of First Mining since September 2016
June 2015 to September 2016 - Controller of First Mining
June 2013 to June 2015 - Director of Finance, Great Panther Silver Ltd.
(mining company)
October 2011 to June 2013 - Controller, Alexco Resource Corp. (mining
company)
Andrew MarshallChief Financial Officer
Vancouver, British Columbia Canada
Ownership of Securities: 140,800 shares 18,750 warrants 1,600,000 options
Officer Principal occupation or employment for past five years
Vice President, Investor Relations of First Mining since July 2015
February 2010 to July 2015 - Manager, Investor Relations, Uranerz
Energy Corp. (uranium production company)
Derek IwanakaVice President,Investor Relations
Coquitlam, British Columbia, Canada
Ownership of Securities: 125,000 shares 62,500 warrants 1,700,000 options
To our knowledge, the total number of common shares that the directors and officers as a group either: (i) beneficially owned; or (ii) exercised direction or control over,directly or indirectly, as at the date of this AIF was 14,606,780 common shares. This represents approximately 2.6% of our outstanding common shares as at the date ofthis AIF (on an undiluted basis).
Interest of management and others in material transactions
To the best of our knowledge, none of the directors, executive officers or shareholders that either: (i) beneficially own; or (ii) control or direct, directly or indirectly,over 10% of any class of our outstanding securities, nor their associates or affiliates, have or have had within the three most recently completed financial years, anymaterial interests, direct or indirect, in transactions which have materially affected, or are reasonably expected to materially affect, our Company.
Other information about our directors and officers
None of our directors or officers, or a shareholder holding a sufficient number of securities of First Mining to affect materially the control of our Company, is or was adirector or executive officer of another company (including our Company) in the past 10 years that:
Page 146
Officer Principal occupation or employment for past five years
Corporate Counsel and Corporate Secretary of First Mining since June 2016
November 2012 to May 2016 - Corporate Counsel and Corporate Secretary of Wellgreen Platinum Ltd. (mining company)
November 2012 to February 2013 - Corporate Counsel and Corporate Secretary, Prophecy Coal Corp. (mining company)
September 2009 to November 2012 - Associate, Securities & Capital Markets group, Borden Ladner Gervais LLP (law firm)
Samir Patel, LL.B. (Hons)Corporate Counsel andCorporate Secretary
Vancouver, British Columbia, Canada
Ownership of Securities: 108,000 shares 37,700 warrants 1,200,000 options
• was subject to a cease trade or similar order, or an order denying that company any exemption under securities legislation that was in effect for more than 30 consecutive days, whilethe director or executive officer held that role with the company;
• was involved in an event while the director or executive officer was acting in that capacity that resulted in the company being subject to one of the above orders after the director orexecutive officer no longer held that role with the company; or
• while acting in that capacity, or within a year of acting in that capacity, became bankrupt, made a proposal under any legislation relating to bankruptcy or insolvency or was subjectto or instituted any proceedings, arrangement or compromise with creditors or had a receiver, receiver manager or trustee appointed to hold the assets of that company.
None of them in the past 10 years:
None of them has ever been subject to:
Audit Committee information
National Instrument 52-110 Audit Committees (“NI 52-110”) requires us to have an audit committee (the “Audit Committee”) comprised of not less than threedirectors all of whom are “independent” and “financially literate” (as such terms are defined in NI 52-110). NI 52-110 also requires us to disclose in this AIF certaininformation regarding the Audit Committee. That disclosure is set out below.
Overview
The Company’s Audit Committee is principally responsible for:
Committee charter
A copy of the Audit Committee’s charter is attached as Appendix “A” to this AIF.
Page 147
• became bankrupt;
• made a proposal under any legislation relating to bankruptcy or insolvency;
• has been subject to or launched any proceedings, arrangement or compromise with any creditors; or
• had a receiver, receiver manager or trustee appointed to hold any of their assets.
• penalties or sanctions imposed by a court relating to securities legislation or by a securities regulatory authority or has entered into a settlement agreement with a securities regulatory authority; or
• any other penalties or sanctions imposed by a court or regulatory body that would likely be considered important to a reasonable investor in making an investment decision.
• recommending to our Board the external auditor to be nominated for election by the shareholders at each annual general meeting and negotiating the compensation of such externalauditor;
• overseeing the work of the external auditor;
• reviewing our annual and interim financial statements, MD&A and press releases regarding earnings before they are reviewed and approved by our Board and publicly disseminated;and
• reviewing our financial reporting procedures and internal controls to ensure adequate procedures are in place for our public disclosure of financial information extracted or derivedfrom our financial statements.
Composition of the Audit Committee
Our current Audit Committee consists of Raymond Polman (current chairman of the Audit Committee), Keith Neumeyer and David Shaw.
NI 52-110 provides that a member of an audit committee is “independent” if the member has no direct or indirect material relationship with the Company, which could,in the view of our Board, reasonably interfere with the exercise of the member’s independent judgment. All of the members of our Audit Committee are “independent”within the meaning of NI 52-110.
NI 52-110 provides that an individual is “financially literate” if he or she has the ability to read and understand a set of financial statements that present a breadth andlevel of complexity of accounting issues that are generally comparable to the breadth and complexity of the issues that can reasonably be expected to be raised by theCompany’s financial statements. All of the members of our Audit Committee are “financially literate” as that term is defined in NI 52-110.
Relevant education and experience
The following is a description of the skills and experience of each member of the Audit Committee that is relevant to the performance of their responsibilities as amember of the Audit Committee:
Raymond Polman (Chairman of Audit Committee)
Mr. Polman has over 30 years of public accounting and corporate finance experience in the Canadian and US financial markets and has been Chief Financial Officer ofFirst Majestic Silver Corp. since February 2007. Prior to First Majestic, Mr. Polman had been a Chief Financial Officer for six years with a number of publicly tradedhigh technology companies, prior to which he served several years as the Director of Finance for Rescan Environmental, a large privately owned company serving theglobal mining community. Mr. Polman has a Bachelor of Science (Economics) Degree from the University of Victoria and he is a member of the Institute of CharteredAccountants of British Columbia. Mr. Polman also brings eight years of prior public accounting experience with Deloitte LLP.
Keith Neumeyer
Mr. Neumeyer has worked in the investment community for over 30 years. He began his career at a number of Canadian national brokerage firms. Mr. Neumeyermoved on to work with several publically traded companies in the resource and high technology sectors. His roles have included senior management positions anddirectorships responsible in areas of finance, business development, strategic planning and corporate restructuring. Mr. Neumeyer was the original and foundingPresident of First Quantum Minerals Ltd. He also founded and is currently the Chief Executive Officer of First Majestic Silver Corp. Mr. Neumeyer has also listed anumber of companies on the Toronto Stock Exchange and as such has extensive experience dealing with the financial, regulatory, legal and accounting issues that arerelevant in the investment community.
David Shaw
Since completing his doctorate over 35 years ago, Dr. Shaw has worked both in the technical and financial communities within the resource industry. Seven years werespent with Chevron Resources in Calgary and Vancouver, employed initially as an in-house structural consultant on both metal and hydrocarbon exploration programsand then as a member of a hydrocarbon project financial evaluation team. Upon leaving Chevron, he initiated and developed the Resource Research Group at CharltonSecurities Ltd., Calgary before assuming the position of Senior Mining Analyst, Corporate Finance, at Yorkton Securities Inc. in Vancouver.
Page 148
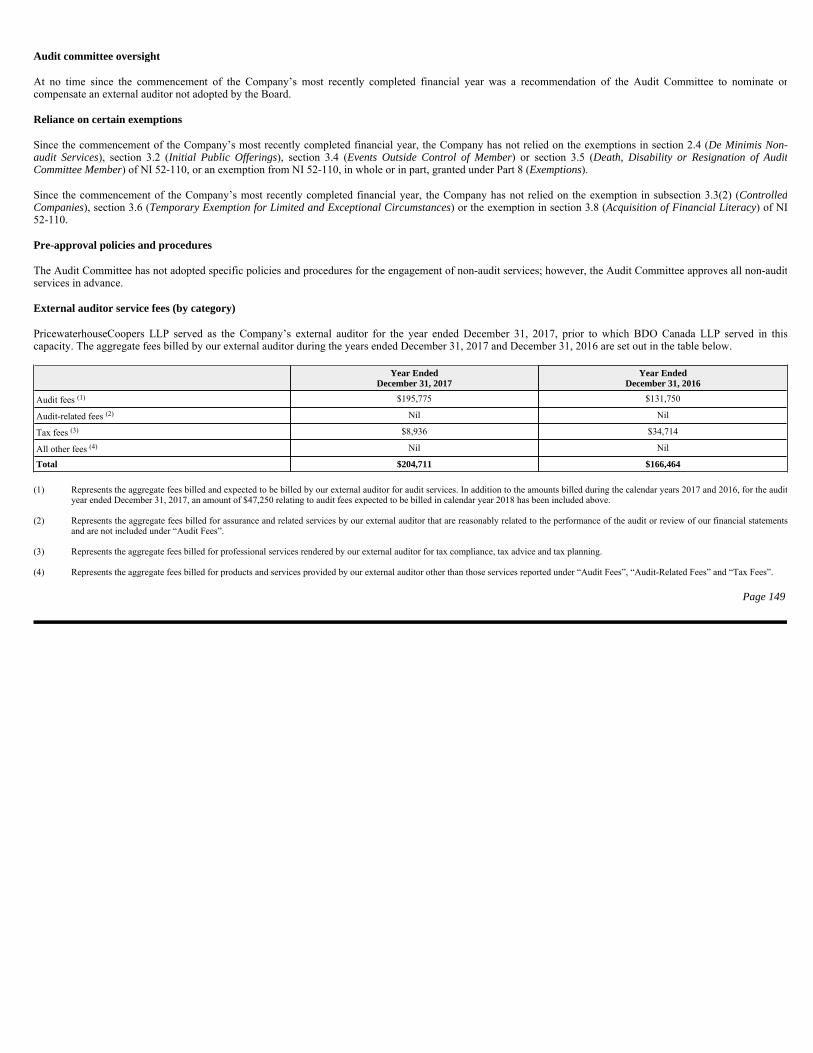
Audit committee oversight
At no time since the commencement of the Company’s most recently completed financial year was a recommendation of the Audit Committee to nominate orcompensate an external auditor not adopted by the Board.
Reliance on certain exemptions
Since the commencement of the Company’s most recently completed financial year, the Company has not relied on the exemptions in section 2.4 (De Minimis Non-audit Services), section 3.2 (Initial Public Offerings), section 3.4 (Events Outside Control of Member) or section 3.5 (Death, Disability or Resignation of AuditCommittee Member) of NI 52-110, or an exemption from NI 52-110, in whole or in part, granted under Part 8 (Exemptions).
Since the commencement of the Company’s most recently completed financial year, the Company has not relied on the exemption in subsection 3.3(2) (ControlledCompanies), section 3.6 (Temporary Exemption for Limited and Exceptional Circumstances) or the exemption in section 3.8 (Acquisition of Financial Literacy) of NI52-110.
Pre-approval policies and procedures
The Audit Committee has not adopted specific policies and procedures for the engagement of non-audit services; however, the Audit Committee approves all non-auditservices in advance.
External auditor service fees (by category)
PricewaterhouseCoopers LLP served as the Company’s external auditor for the year ended December 31, 2017, prior to which BDO Canada LLP served in thiscapacity. The aggregate fees billed by our external auditor during the years ended December 31, 2017 and December 31, 2016 are set out in the table below.
Page 149
Year Ended December 31, 2017
Year Ended December 31, 2016
Audit fees (1) $195,775 $131,750
Audit-related fees (2) Nil Nil
Tax fees (3) $8,936 $34,714
All other fees (4) Nil Nil
Total $204,711 $166,464
(1) Represents the aggregate fees billed and expected to be billed by our external auditor for audit services. In addition to the amounts billed during the calendar years 2017 and 2016, for the audityear ended December 31, 2017, an amount of $47,250 relating to audit fees expected to be billed in calendar year 2018 has been included above.
(2) Represents the aggregate fees billed for assurance and related services by our external auditor that are reasonably related to the performance of the audit or review of our financial statementsand are not included under “Audit Fees”.
(3) Represents the aggregate fees billed for professional services rendered by our external auditor for tax compliance, tax advice and tax planning.
(4) Represents the aggregate fees billed for products and services provided by our external auditor other than those services reported under “Audit Fees”, “Audit-Related Fees” and “Tax Fees”.
Interests of experts
Auditor
Our auditor is PricewaterhouseCoopers LLP, Chartered Professional Accountants, who have prepared an independent auditor’s report dated March 21, 2018 in respectof the Company’s consolidated financial statements as at December 31, 2017 and for the year then ended. PricewaterhouseCoopers LLP has advised that they areindependent within the meaning of the Chartered Professional Accountants of British Columbia Code of Professional Conduct. They are located at Suite 1400 – 250Howe Street, Vancouver, British Columbia V6C 3S7.
Qualified persons
All technical and scientific information discussed in this AIF, including mineral resource estimates for our material properties, and all technical and scientificinformation for our other non-material projects, has been reviewed and approved by our Chief Operating Officer and Director, Dr. Chris Osterman, Ph.D., P.Geo., whois a qualified person for the purposes of NI 43-101.
The following individuals prepared the Springpole Technical Report with reference to the requirements of NI 43-101:
Page 150
• Dr. Gilles Arseneau, Ph.D., P.Geo., Associate Consultant (Geology), of SRK Consulting (Canada) Inc.;
• Dr. Adrian Dance, Ph.D., P.Eng., Principal Consultant (Metallurgy), of SRK Consulting (Canada) Inc.;
• Victor Munoz, P.Eng., M.Eng., Senior Consultant (Water Resources Engineering), of SRK Consulting (Canada) Inc.;
• Grant Carlson, P.Eng, Senior Consultant (Mining), of SRK Consulting (Canada) Inc.;
• Neil Winkelmann, FAusIMM, Principal Consultant (Mining), of SRK Consulting (Canada) Inc.;
• Bruce Andrew Murphy, P.Eng, Principal Consultant (Geotechnical), of SRK Consulting (Canada) Inc.;
• Michael Royle, M.App.Sci., P.Geo., Principal Consultant (Hydrogeology), of SRK Consulting (Canada) Inc.;
• Dr. Ewoud Maritz Rykaart, Ph.D., P.Eng., Principal Consultant (Geotechnical Engineering), of SRK Consulting (Canada) Inc.; and
• Mark Liskowich, P.Geo., Principal Consultant (Environmental), of SRK Consulting (Canada), Inc.

Todd McCracken, P.Geo., Manger – Mining of WSP Canada Inc., prepared the Goldlund Technical Report with reference to the requirements of NI 43-101.
Mark Drabble, B.App.Sci (Geology), MAIG, MAusIMM, and Kahan Cervoj, B.App.Sci (Geology), MAIG, MAusIMM, Principal Consultants of Optiro Pty Limited,prepared the Cameron Gold Technical Report with reference to the requirements of NI 43-101.
B. Terrence Hennessey, P.Geo., Alan J. San Martin, MAusIMM(CP), and Sam J. Shoemaker, Jr., B.Sc., Reg’d Mem SME, of Micon International Limited, prepared thePickle Crow Technical Report with reference to the requirements of NI 43-101.
Michael P. Cullen, M.Sc., P.Geo., of Mercator Geological Services Limited, prepared the Hope Brook Technical Report with reference to the requirements of NI 43-101.
Each of the abovementioned firms or persons hold, as either a registered or beneficial holder, less than one percent of the outstanding securities of First Mining or ofany associate or affiliate of First Mining. None of the aforementioned firms or persons received any direct or indirect interest in any securities of First Mining or of anyassociate or affiliate of First Mining in connection with the preparation and review of any technical report or this AIF. None of the aforementioned firms or persons, norany directors, officers or employees of such firms or persons, are currently expected to be elected, appointed or employed as a director, officer or employee of theCompany or of any associate or affiliate of the Company, other than Dr. Chris Osterman, our Chief Operating Officer and a Director of First Mining.
Legal counsel
Our external legal counsel is McCullough O’Connor Irwin LLP, and they are located at Suite 2600, Oceanic Plaza, 1066 West Hastings Street, Vancouver, BritishColumbia V6E 3X1.
Additional information
You can find more information about First Mining under our SEDAR profile at www.sedar.com and on our website at www.firstmininggold.com.
Our most recent management information circular dated May 10, 2017 contains additional information on how our directors and officers are compensated, the principalholders of our securities, and the securities that are authorized for issuance under our equity compensation plans, and is available under our SEDAR profile atwww.sedar.com.
For additional financial information about First Mining, see our audited consolidated annual financial statements and management’s discussion and analysis for thefinancial year ended December 31, 2017, which are also available under our SEDAR profile at www.sedar.com. and on our website at www.firstmininggold.com.
Copies of the above documents may be obtained from First Mining by contacting us at Suite 1800 – 925 West Georgia Street, Vancouver, British Columbia V6C 3L2,telephone: 1.844.306.8827.
Page 151
Appendix A
FIRST MINING GOLD CORP.
AUDIT COMMITTEE CHARTER
The Committee has the responsibility to:
Page 152
1. INTRODUCTION
(a) The audit committee (the “Committee”) is appointed by the board of directors (the “Board”) of First Mining Gold Corp. (the “Company”) to be responsible for the oversight of theaccounting and financial reporting process and financial statement audits of the Company.
(b) This charter is prepared to assist the Committee, the Board and management in clarifying responsibilities and ensuring effective communication between the Committee, the Board andmanagement.
2. COMPOSITION
(a) The Committee will be composed of three directors from the Board, a majority of whom will be independent (as defined in National Instrument 58-101 – Disclosure of Corporate GovernancePractices).
(b) All members of the Committee will be financially literate as defined by applicable legislation. If, upon appointment, a member of the Committee is not financially literate as required, theperson will be provided a three month period in which to achieve the required level of literacy.
3. RESPONSIBILITIES
(i) review and report to the board of directors of the Company on the following before they are publicly disclosed:
(A) the financial statements and MD&A (management discussion and analysis) (as defined in National Instrument 51-102 – Continuous Disclosure Obligations) of theCompany;
(B) the auditor’s report, if any, prepared in relation to those financial statements,
Page 153
(ii) review the Company’s annual and interim earnings press releases before the Company publicly discloses this information;
(iii) satisfy itself that adequate procedures are in place for the review of the Company’s public disclosure of financial information extracted or derived from the Company’s financialstatements and periodically assess the adequacy of those procedures;
(iv) recommend to the Board:
(A) the external auditor to be nominated for the purpose of preparing or issuing an auditor’s report or performing other audit, review or attest services for the Company; and
(B) the compensation of the external auditor,
(v) oversee the work of the external auditor engaged for the purpose of preparing or issuing an auditor’s report or performing other audit, review or attest services for the Company,including the resolution of disagreements between management and the external auditor regarding financial reporting;
(vi) monitor, evaluate and report to the board of directors on the integrity of the financial reporting process and the system of internal controls that management and the board of directorshave established;
(vii) monitor the management of the principal risks that could impact the financial reporting of the Company;
(viii) establish procedures for the receipt, retention and treatment of complaints received by the Company regarding accounting, internal accounting controls, or auditing matters;
(ix) pre-approve all non-audit services to be provided to the Company or its subsidiary entities by the Company’s external auditor;
(x) review and approve the Company’s hiring policies regarding partners, employees and former partners and employees of the present and former external auditor of the Company;
(xi) with respect to ensuring the integrity of disclosure controls and internal controls over financial reporting, understand the process utilized by the Chief Executive Officer and the ChiefFinancial Officer to comply with National Instrument 52-109 - Certification of Disclosure in Issuers’ Annual and Interim Filings; and
(xii) review, and report to the Board on its concurrence with the disclosure required by Form 52-110F2 – Disclosure by Venture Issuers in any management information circular preparedby the Company.

Page 154
4. AUTHORITY
(a) The Committee has the authority to engage independent counsel and other advisors as it deems necessary to carry out its duties and the Committee will set the compensation for such advisors.
(b) The Committee has the authority to communicate directly with and to meet with the external auditor, without management involvement. This extends to requiring the external auditor to reportdirectly to the Committee.
5. REPORTING
(a) The Committee will report to the Board on the proceedings of each Committee meeting and on the Committee’s recommendations at the next regularly scheduled Board meeting.
6. EFFECTIVE DATE
(a) This Charter was implemented by the Board on May 19, 2015.

First Mining Gold Corp. (formerly known as First Mining Finance Corp.)
Consolidated Annual Financial Statements For the years ended December 31, 2017 and 2016
(Expressed in Canadian dollars)
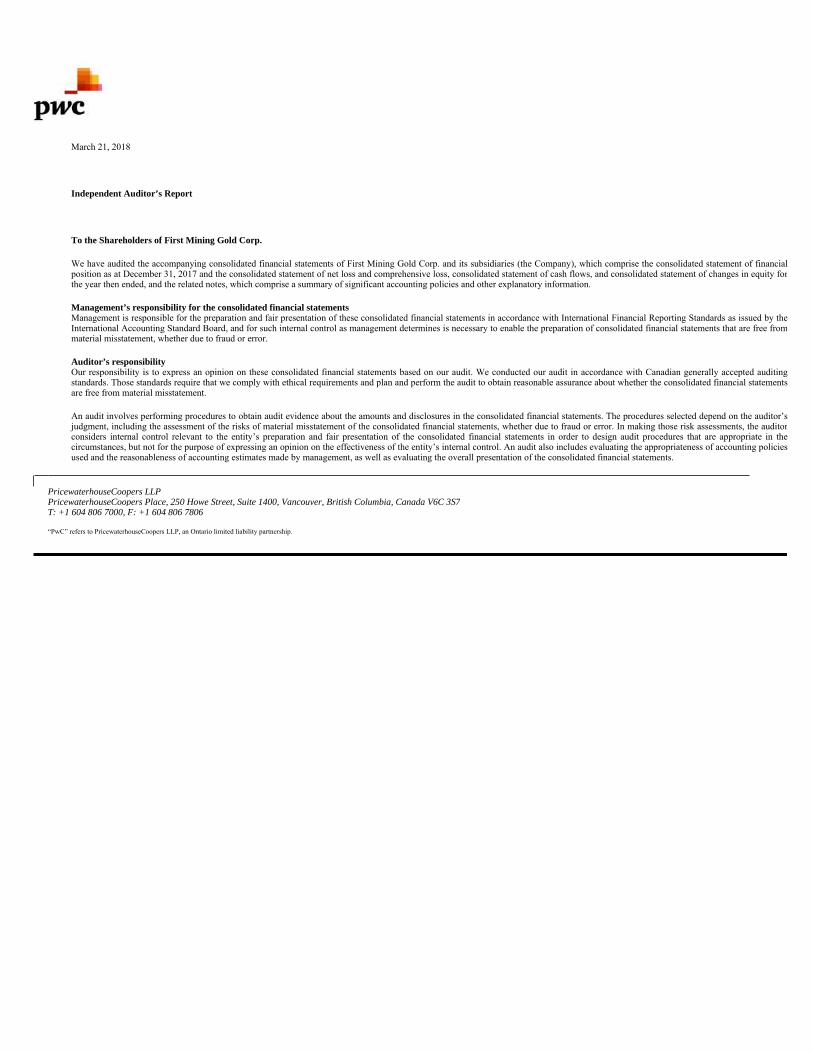
March 21, 2018
Independent Auditor’s Report
To the Shareholders of First Mining Gold Corp.
We have audited the accompanying consolidated financial statements of First Mining Gold Corp. and its subsidiaries (the Company), which comprise the consolidated statement of financialposition as at December 31, 2017 and the consolidated statement of net loss and comprehensive loss, consolidated statement of cash flows, and consolidated statement of changes in equity forthe year then ended, and the related notes, which comprise a summary of significant accounting policies and other explanatory information.
Management’s responsibility for the consolidated financial statements Management is responsible for the preparation and fair presentation of these consolidated financial statements in accordance with International Financial Reporting Standards as issued by theInternational Accounting Standard Board, and for such internal control as management determines is necessary to enable the preparation of consolidated financial statements that are free frommaterial misstatement, whether due to fraud or error.
Auditor’s responsibility Our responsibility is to express an opinion on these consolidated financial statements based on our audit. We conducted our audit in accordance with Canadian generally accepted auditingstandards. Those standards require that we comply with ethical requirements and plan and perform the audit to obtain reasonable assurance about whether the consolidated financial statementsare free from material misstatement.
An audit involves performing procedures to obtain audit evidence about the amounts and disclosures in the consolidated financial statements. The procedures selected depend on the auditor’sjudgment, including the assessment of the risks of material misstatement of the consolidated financial statements, whether due to fraud or error. In making those risk assessments, the auditorconsiders internal control relevant to the entity’s preparation and fair presentation of the consolidated financial statements in order to design audit procedures that are appropriate in thecircumstances, but not for the purpose of expressing an opinion on the effectiveness of the entity’s internal control. An audit also includes evaluating the appropriateness of accounting policiesused and the reasonableness of accounting estimates made by management, as well as evaluating the overall presentation of the consolidated financial statements.
PricewaterhouseCoopers LLP PricewaterhouseCoopers Place, 250 Howe Street, Suite 1400, Vancouver, British Columbia, Canada V6C 3S7 T: +1 604 806 7000, F: +1 604 806 7806
“PwC” refers to PricewaterhouseCoopers LLP, an Ontario limited liability partnership.

We believe that the audit evidence we have obtained is sufficient and appropriate to provide a basis for our audit opinion.
Opinion In our opinion, the consolidated financial statements present fairly, in all material respects, the financial position of First Mining Gold Corp. and its subsidiaries as at December 31, 2017 andtheir financial performance and their cash flows for the year then ended in accordance with International Financial Reporting Standards.
Emphasis of matterAs discussed in Note 3 (a) to the consolidated financial statements, the Company has changed its method of accounting for financial instruments in 2017 due to the early adoption of IFRS 9,Financial instruments.
Other matter The financial statements as at December 31, 2016 and for the year then ended, were audited by other auditors who expressed an opinion without reservation in their report dated March 27,2017.
(Signed) “PricewaterhouseCoopers LLP”
Chartered Professional Accountants
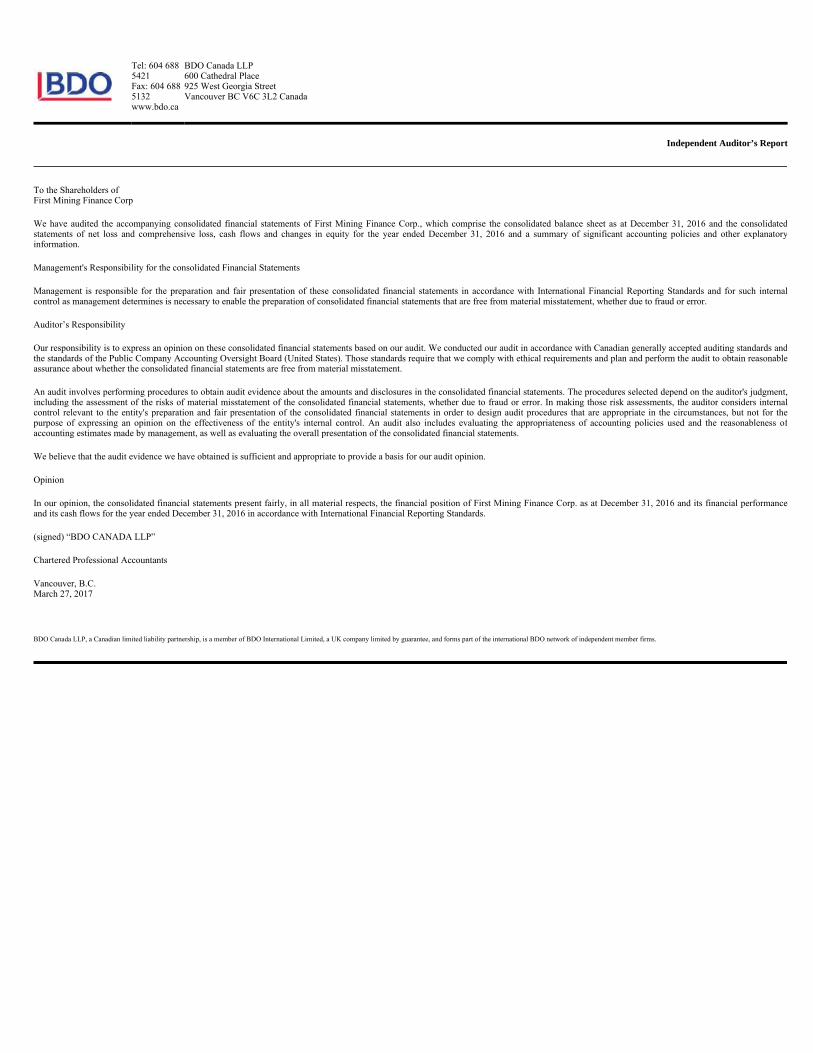
Independent Auditor’s Report
To the Shareholders of First Mining Finance Corp
We have audited the accompanying consolidated financial statements of First Mining Finance Corp., which comprise the consolidated balance sheet as at December 31, 2016 and the consolidatedstatements of net loss and comprehensive loss, cash flows and changes in equity for the year ended December 31, 2016 and a summary of significant accounting policies and other explanatoryinformation.
Management's Responsibility for the consolidated Financial Statements
Management is responsible for the preparation and fair presentation of these consolidated financial statements in accordance with International Financial Reporting Standards and for such internalcontrol as management determines is necessary to enable the preparation of consolidated financial statements that are free from material misstatement, whether due to fraud or error.
Auditor’s Responsibility
Our responsibility is to express an opinion on these consolidated financial statements based on our audit. We conducted our audit in accordance with Canadian generally accepted auditing standards andthe standards of the Public Company Accounting Oversight Board (United States). Those standards require that we comply with ethical requirements and plan and perform the audit to obtain reasonableassurance about whether the consolidated financial statements are free from material misstatement.
An audit involves performing procedures to obtain audit evidence about the amounts and disclosures in the consolidated financial statements. The procedures selected depend on the auditor's judgment,including the assessment of the risks of material misstatement of the consolidated financial statements, whether due to fraud or error. In making those risk assessments, the auditor considers internalcontrol relevant to the entity's preparation and fair presentation of the consolidated financial statements in order to design audit procedures that are appropriate in the circumstances, but not for thepurpose of expressing an opinion on the effectiveness of the entity's internal control. An audit also includes evaluating the appropriateness of accounting policies used and the reasonableness ofaccounting estimates made by management, as well as evaluating the overall presentation of the consolidated financial statements.
We believe that the audit evidence we have obtained is sufficient and appropriate to provide a basis for our audit opinion.
Opinion
In our opinion, the consolidated financial statements present fairly, in all material respects, the financial position of First Mining Finance Corp. as at December 31, 2016 and its financial performanceand its cash flows for the year ended December 31, 2016 in accordance with International Financial Reporting Standards.
(signed) “BDO CANADA LLP”
Chartered Professional Accountants
Vancouver, B.C. March 27, 2017
BDO Canada LLP, a Canadian limited liability partnership, is a member of BDO International Limited, a UK company limited by guarantee, and forms part of the international BDO network of independent member firms.
Tel: 604 688 5421 Fax: 604 688 5132 www.bdo.ca
BDO Canada LLP 600 Cathedral Place925 West Georgia Street Vancouver BC V6C 3L2 Canada
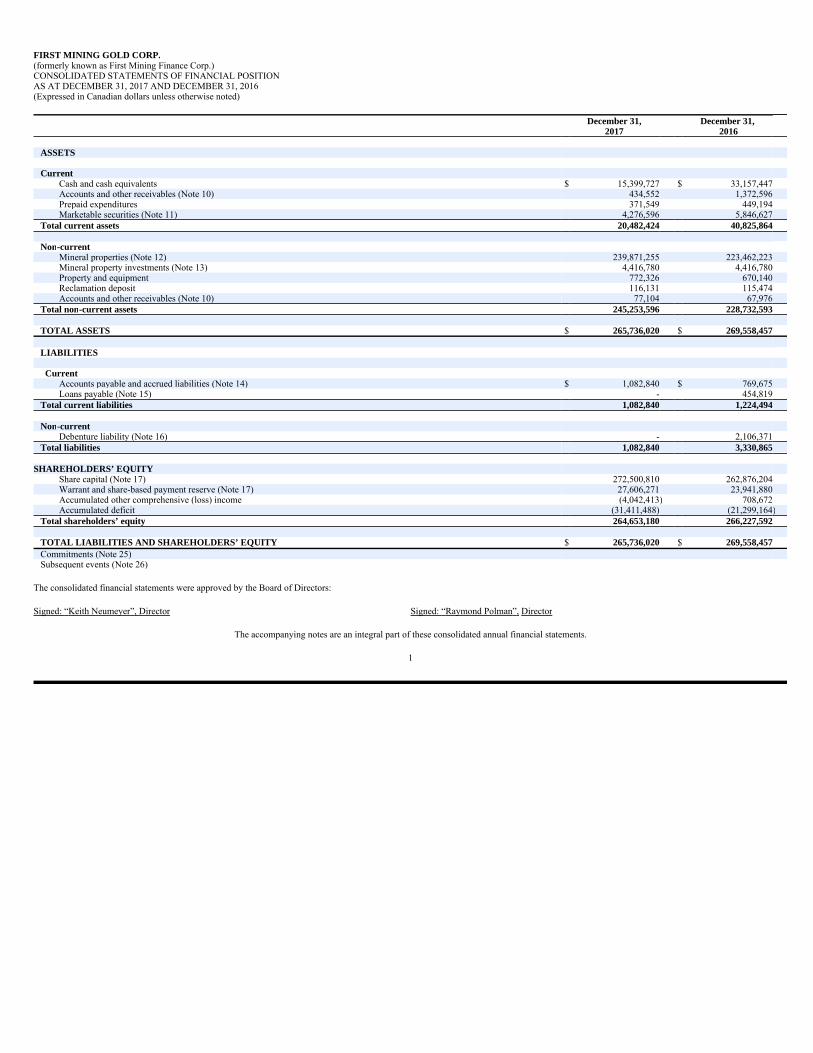
FIRST MINING GOLD CORP.(formerly known as First Mining Finance Corp.) CONSOLIDATED STATEMENTS OF FINANCIAL POSITIONAS AT DECEMBER 31, 2017 AND DECEMBER 31, 2016 (Expressed in Canadian dollars unless otherwise noted)
The consolidated financial statements were approved by the Board of Directors:
The accompanying notes are an integral part of these consolidated annual financial statements.
1
December 31, December 31,2017 2016
ASSETS
Current Cash and cash equivalents $ 15,399,727 $ 33,157,447 Accounts and other receivables (Note 10) 434,552 1,372,596 Prepaid expenditures 371,549 449,194 Marketable securities (Note 11) 4,276,596 5,846,627
Total current assets 20,482,424 40,825,864
Non-current Mineral properties (Note 12) 239,871,255 223,462,223 Mineral property investments (Note 13) 4,416,780 4,416,780 Property and equipment 772,326 670,140 Reclamation deposit 116,131 115,474 Accounts and other receivables (Note 10) 77,104 67,976
Total non-current assets 245,253,596 228,732,593
TOTAL ASSETS $ 265,736,020 $ 269,558,457
LIABILITIES
Current Accounts payable and accrued liabilities (Note 14) $ 1,082,840 $ 769,675 Loans payable (Note 15) - 454,819
Total current liabilities 1,082,840 1,224,494
Non-current Debenture liability (Note 16) - 2,106,371
Total liabilities 1,082,840 3,330,865
SHAREHOLDERS’ EQUITY Share capital (Note 17) 272,500,810 262,876,204 Warrant and share-based payment reserve (Note 17) 27,606,271 23,941,880 Accumulated other comprehensive (loss) income (4,042,413 ) 708,672 Accumulated deficit (31,411,488) (21,299,164 )
Total shareholders’ equity 264,653,180 266,227,592
TOTAL LIABILITIES AND SHAREHOLDERS’ EQUITY $ 265,736,020 $ 269,558,457 Commitments (Note 25) Subsequent events (Note 26)
Signed: “Keith Neumeyer”, Director Signed: “Raymond Polman”, Director
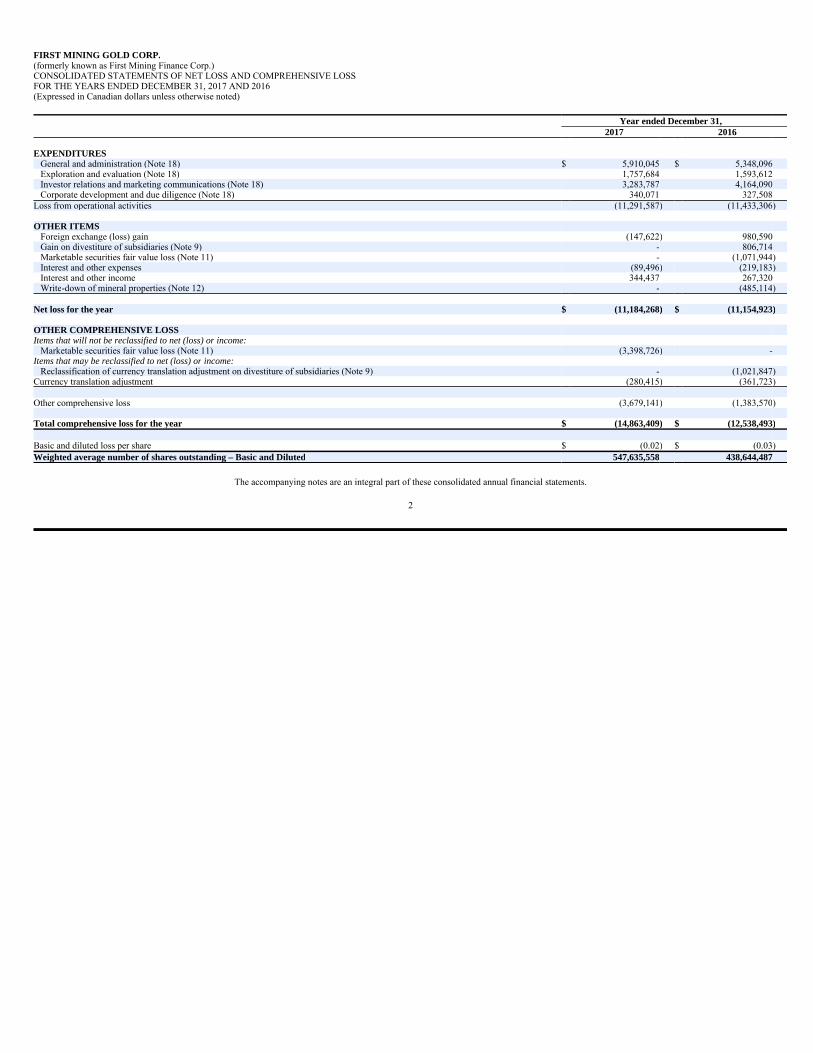
FIRST MINING GOLD CORP.(formerly known as First Mining Finance Corp.) CONSOLIDATED STATEMENTS OF NET LOSS AND COMPREHENSIVE LOSS FOR THE YEARS ENDED DECEMBER 31, 2017 AND 2016 (Expressed in Canadian dollars unless otherwise noted)
The accompanying notes are an integral part of these consolidated annual financial statements.
2
Year ended December 31,2017 2016
EXPENDITURES General and administration (Note 18) $ 5,910,045 $ 5,348,096 Exploration and evaluation (Note 18) 1,757,684 1,593,612 Investor relations and marketing communications (Note 18) 3,283,787 4,164,090 Corporate development and due diligence (Note 18) 340,071 327,508 Loss from operational activities (11,291,587) (11,433,306)
OTHER ITEMS Foreign exchange (loss) gain (147,622) 980,590 Gain on divestiture of subsidiaries (Note 9) - 806,714 Marketable securities fair value loss (Note 11) - (1,071,944) Interest and other expenses (89,496) (219,183) Interest and other income 344,437 267,320 Write-down of mineral properties (Note 12) - (485,114)
Net loss for the year $ (11,184,268) $ (11,154,923)
OTHER COMPREHENSIVE LOSSItems that will not be reclassified to net (loss) or income: Marketable securities fair value loss (Note 11) (3,398,726 ) -Items that may be reclassified to net (loss) or income: Reclassification of currency translation adjustment on divestiture of subsidiaries (Note 9) - (1,021,847) Currency translation adjustment (280,415) (361,723)
Other comprehensive loss (3,679,141) (1,383,570)
Total comprehensive loss for the year $ (14,863,409) $ (12,538,493)
Basic and diluted loss per share $ (0.02) $ (0.03) Weighted average number of shares outstanding – Basic and Diluted 547,635,558 438,644,487
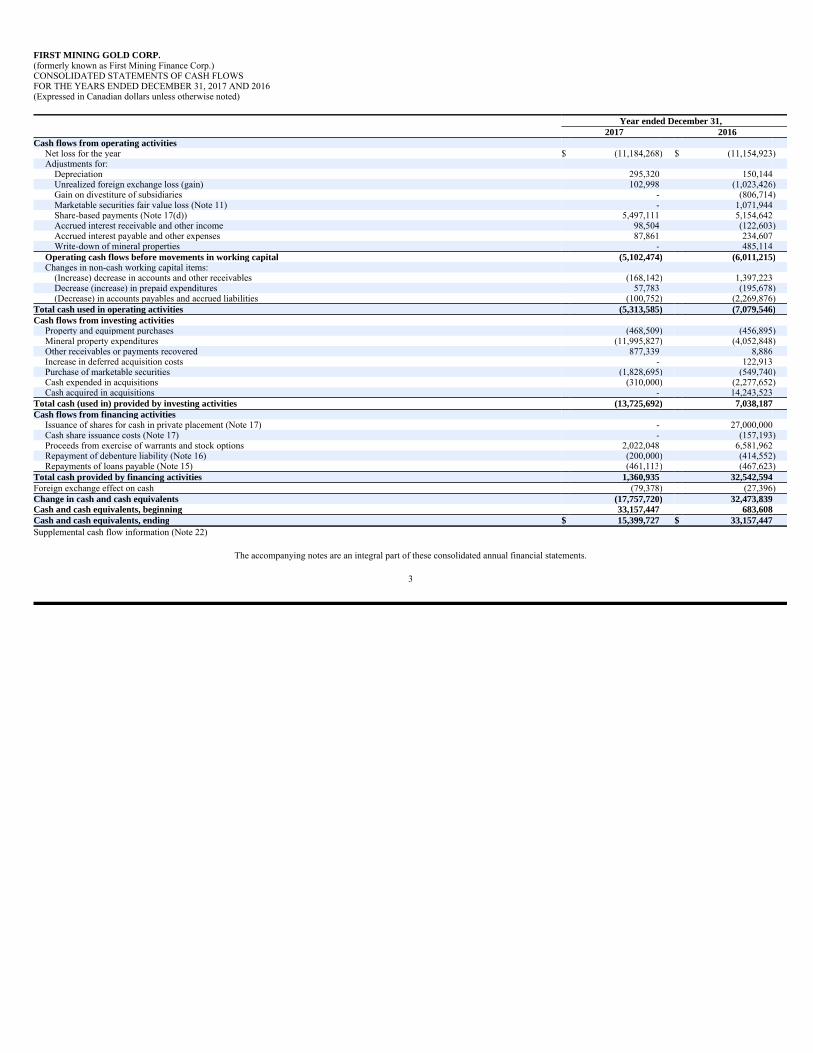
FIRST MINING GOLD CORP.(formerly known as First Mining Finance Corp.) CONSOLIDATED STATEMENTS OF CASH FLOWS FOR THE YEARS ENDED DECEMBER 31, 2017 AND 2016 (Expressed in Canadian dollars unless otherwise noted)
The accompanying notes are an integral part of these consolidated annual financial statements.
3
Year ended December 31,2017 2016
Cash flows from operating activities Net loss for the year $ (11,184,268) $ (11,154,923) Adjustments for: Depreciation 295,320 150,144 Unrealized foreign exchange loss (gain) 102,998 (1,023,426) Gain on divestiture of subsidiaries - (806,714) Marketable securities fair value loss (Note 11) - 1,071,944 Share-based payments (Note 17(d)) 5,497,111 5,154,642 Accrued interest receivable and other income 98,504 (122,603) Accrued interest payable and other expenses 87,861 234,607 Write-down of mineral properties - 485,114
Operating cash flows before movements in working capital (5,102,474) (6,011,215) Changes in non-cash working capital items: (Increase) decrease in accounts and other receivables (168,142) 1,397,223 Decrease (increase) in prepaid expenditures 57,783 (195,678) (Decrease) in accounts payables and accrued liabilities (100,752) (2,269,876) Total cash used in operating activities (5,313,585) (7,079,546)Cash flows from investing activities Property and equipment purchases (468,509) (456,895) Mineral property expenditures (11,995,827) (4,052,848) Other receivables or payments recovered 877,339 8,886 Increase in deferred acquisition costs - 122,913 Purchase of marketable securities (1,828,695) (549,740) Cash expended in acquisitions (310,000) (2,277,652) Cash acquired in acquisitions - 14,243,523 Total cash (used in) provided by investing activities (13,725,692) 7,038,187Cash flows from financing activities Issuance of shares for cash in private placement (Note 17) - 27,000,000 Cash share issuance costs (Note 17) - (157,193) Proceeds from exercise of warrants and stock options 2,022,048 6,581,962 Repayment of debenture liability (Note 16) (200,000) (414,552) Repayments of loans payable (Note 15) (461,113) (467,623) Total cash provided by financing activities 1,360,935 32,542,594Foreign exchange effect on cash (79,378) (27,396) Change in cash and cash equivalents (17,757,720) 32,473,839Cash and cash equivalents, beginning 33,157,447 683,608Cash and cash equivalents, ending $ 15,399,727 $ 33,157,447Supplemental cash flow information (Note 22)
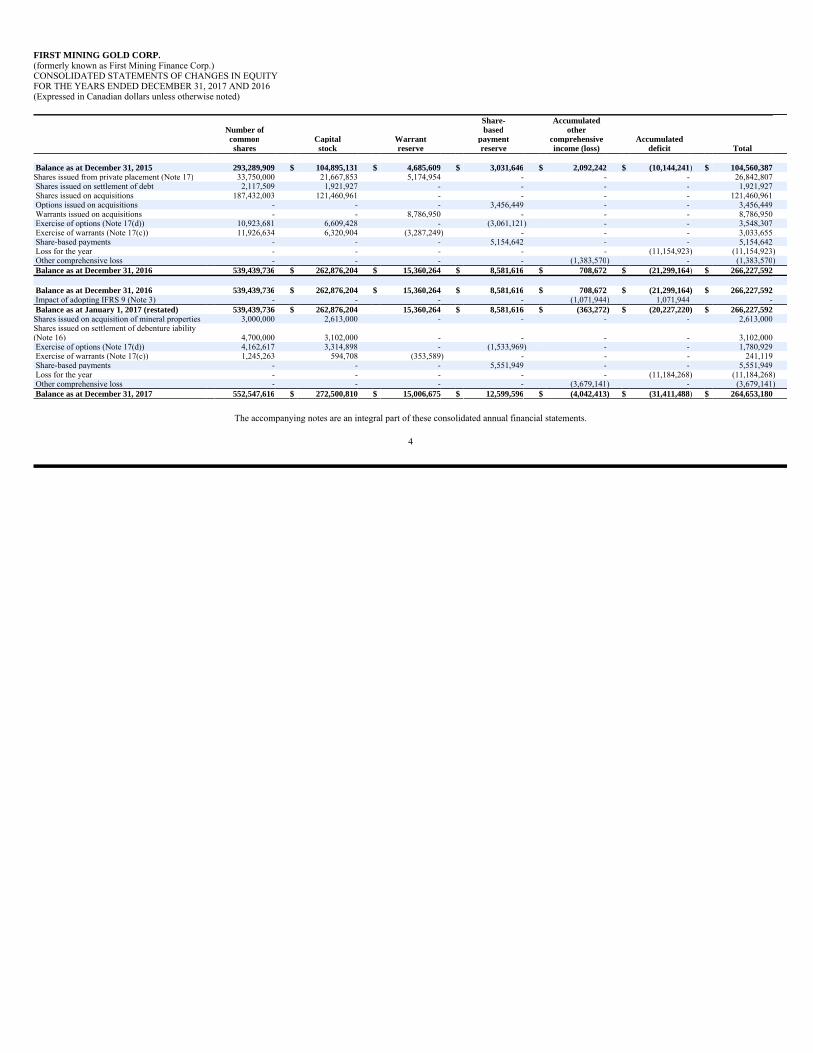
FIRST MINING GOLD CORP.(formerly known as First Mining Finance Corp.) CONSOLIDATED STATEMENTS OF CHANGES IN EQUITY FOR THE YEARS ENDED DECEMBER 31, 2017 AND 2016 (Expressed in Canadian dollars unless otherwise noted)
The accompanying notes are an integral part of these consolidated annual financial statements.
4
Share- AccumulatedNumber of based othercommon Capital Warrant payment comprehensive Accumulatedshares stock reserve reserve income (loss) deficit Total
Balance as at December 31, 2015 293,289,909 $ 104,895,131 $ 4,685,609 $ 3,031,646 $ 2,092,242 $ (10,144,241) $ 104,560,387Shares issued from private placement (Note 17) 33,750,000 21,667,853 5,174,954 - - - 26,842,807 Shares issued on settlement of debt 2,117,509 1,921,927 - - - - 1,921,927 Shares issued on acquisitions 187,432,003 121,460,961 - - - - 121,460,961 Options issued on acquisitions - - - 3,456,449 - - 3,456,449 Warrants issued on acquisitions - - 8,786,950 - - - 8,786,950 Exercise of options (Note 17(d)) 10,923,681 6,609,428 - (3,061,121) - - 3,548,307 Exercise of warrants (Note 17(c)) 11,926,634 6,320,904 (3,287,249) - - - 3,033,655 Share-based payments - - - 5,154,642 - - 5,154,642 Loss for the year - - - - - (11,154,923) (11,154,923) Other comprehensive loss - - - - (1,383,570) - (1,383,570) Balance as at December 31, 2016 539,439,736 $ 262,876,204 $ 15,360,264 $ 8,581,616 $ 708,672 $ (21,299,164) $ 266,227,592
Balance as at December 31, 2016 539,439,736 $ 262,876,204 $ 15,360,264 $ 8,581,616 $ 708,672 $ (21,299,164) $ 266,227,592 Impact of adopting IFRS 9 (Note 3) - - - - (1,071,944) 1,071,944 -Balance as at January 1, 2017 (restated) 539,439,736 $ 262,876,204 15,360,264 $ 8,581,616 $ (363,272) $ (20,227,220) $ 266,227,592Shares issued on acquisition of mineral properties 3,000,000 2,613,000 - - - - 2,613,000 Shares issued on settlement of debenture iability (Note 16) 4,700,000 3,102,000 - - - - 3,102,000 Exercise of options (Note 17(d)) 4,162,617 3,314,898 - (1,533,969) - - 1,780,929 Exercise of warrants (Note 17(c)) 1,245,263 594,708 (353,589) - - - 241,119 Share-based payments - - - 5,551,949 - - 5,551,949 Loss for the year - - - - - (11,184,268) (11,184,268) Other comprehensive loss - - - - (3,679,141) - (3,679,141) Balance as at December 31, 2017 552,547,616 $ 272,500,810 $ 15,006,675 $ 12,599,596 $ (4,042,413) $ (31,411,488) $ 264,653,180
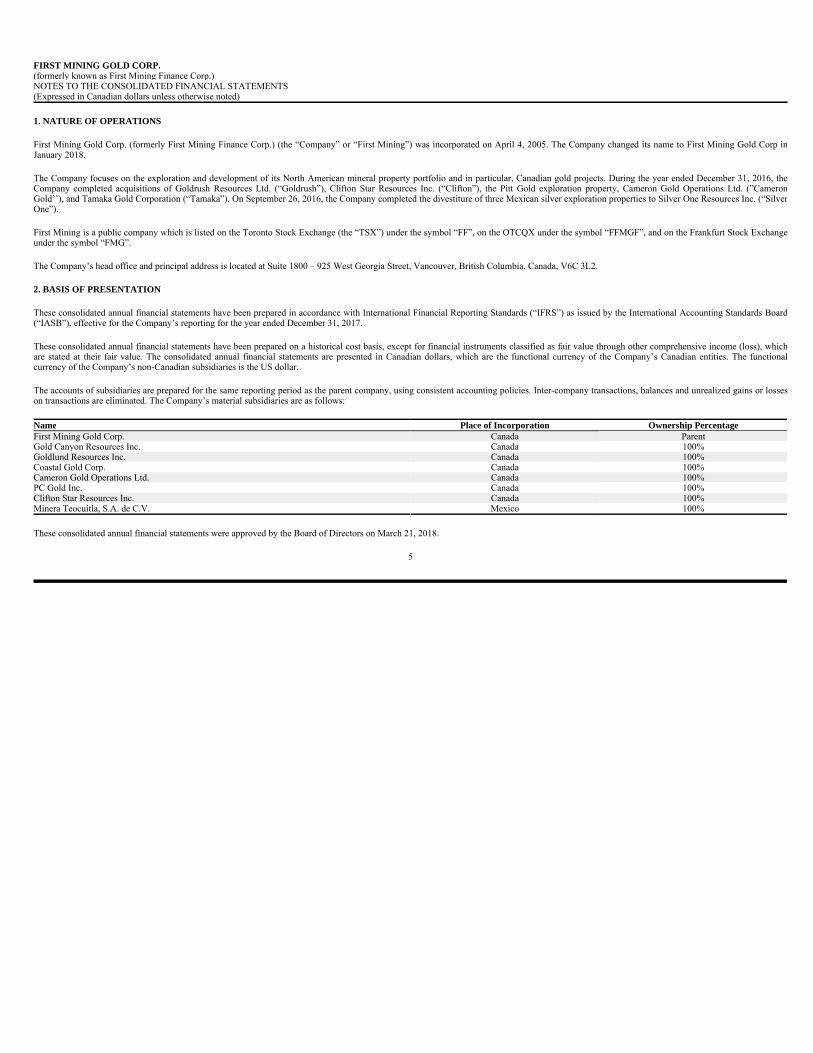
1. NATURE OF OPERATIONS
First Mining Gold Corp. (formerly First Mining Finance Corp.) (the “Company” or “First Mining”) was incorporated on April 4, 2005. The Company changed its name to First Mining Gold Corp inJanuary 2018.
The Company focuses on the exploration and development of its North American mineral property portfolio and in particular, Canadian gold projects. During the year ended December 31, 2016, theCompany completed acquisitions of Goldrush Resources Ltd. (“Goldrush”), Clifton Star Resources Inc. (“Clifton”), the Pitt Gold exploration property, Cameron Gold Operations Ltd. (”CameronGold’’), and Tamaka Gold Corporation (“Tamaka”). On September 26, 2016, the Company completed the divestiture of three Mexican silver exploration properties to Silver One Resources Inc. (“SilverOne”).
First Mining is a public company which is listed on the Toronto Stock Exchange (the “TSX”) under the symbol “FF”, on the OTCQX under the symbol “FFMGF”, and on the Frankfurt Stock Exchangeunder the symbol “FMG”.
The Company’s head office and principal address is located at Suite 1800 – 925 West Georgia Street, Vancouver, British Columbia, Canada, V6C 3L2.
2. BASIS OF PRESENTATION
These consolidated annual financial statements have been prepared in accordance with International Financial Reporting Standards (“IFRS”) as issued by the International Accounting Standards Board(“IASB”), effective for the Company’s reporting for the year ended December 31, 2017.
These consolidated annual financial statements have been prepared on a historical cost basis, except for financial instruments classified as fair value through other comprehensive income (loss), whichare stated at their fair value. The consolidated annual financial statements are presented in Canadian dollars, which are the functional currency of the Company’s Canadian entities. The functionalcurrency of the Company’s non-Canadian subsidiaries is the US dollar.
The accounts of subsidiaries are prepared for the same reporting period as the parent company, using consistent accounting policies. Inter-company transactions, balances and unrealized gains or losseson transactions are eliminated. The Company’s material subsidiaries are as follows:
These consolidated annual financial statements were approved by the Board of Directors on March 21, 2018.
5
FIRST MINING GOLD CORP.(formerly known as First Mining Finance Corp.) NOTES TO THE CONSOLIDATED FINANCIAL STATEMENTS (Expressed in Canadian dollars unless otherwise noted)
Name Place of Incorporation Ownership PercentageFirst Mining Gold Corp. Canada Parent Gold Canyon Resources Inc. Canada 100% Goldlund Resources Inc. Canada 100% Coastal Gold Corp. Canada 100% Cameron Gold Operations Ltd. Canada 100% PC Gold Inc. Canada 100% Clifton Star Resources Inc. Canada 100% Minera Teocuitla, S.A. de C.V. Mexico 100%
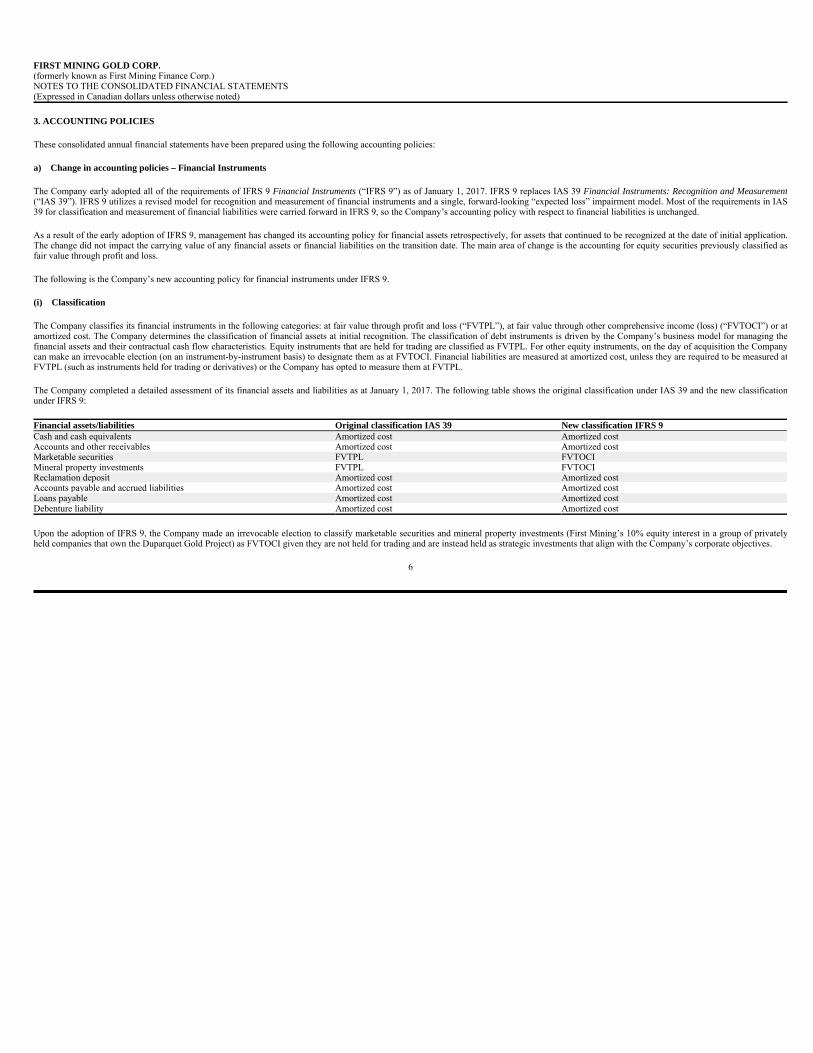
3. ACCOUNTING POLICIES
These consolidated annual financial statements have been prepared using the following accounting policies:
a) Change in accounting policies – Financial Instruments
The Company early adopted all of the requirements of IFRS 9 Financial Instruments (“IFRS 9”) as of January 1, 2017. IFRS 9 replaces IAS 39 Financial Instruments: Recognition and Measurement(“IAS 39”). IFRS 9 utilizes a revised model for recognition and measurement of financial instruments and a single, forward-looking “expected loss” impairment model. Most of the requirements in IAS39 for classification and measurement of financial liabilities were carried forward in IFRS 9, so the Company’s accounting policy with respect to financial liabilities is unchanged.
As a result of the early adoption of IFRS 9, management has changed its accounting policy for financial assets retrospectively, for assets that continued to be recognized at the date of initial application.The change did not impact the carrying value of any financial assets or financial liabilities on the transition date. The main area of change is the accounting for equity securities previously classified asfair value through profit and loss.
The following is the Company’s new accounting policy for financial instruments under IFRS 9.
(i) Classification
The Company classifies its financial instruments in the following categories: at fair value through profit and loss (“FVTPL”), at fair value through other comprehensive income (loss) (“FVTOCI”) or atamortized cost. The Company determines the classification of financial assets at initial recognition. The classification of debt instruments is driven by the Company’s business model for managing thefinancial assets and their contractual cash flow characteristics. Equity instruments that are held for trading are classified as FVTPL. For other equity instruments, on the day of acquisition the Companycan make an irrevocable election (on an instrument-by-instrument basis) to designate them as at FVTOCI. Financial liabilities are measured at amortized cost, unless they are required to be measured atFVTPL (such as instruments held for trading or derivatives) or the Company has opted to measure them at FVTPL.
The Company completed a detailed assessment of its financial assets and liabilities as at January 1, 2017. The following table shows the original classification under IAS 39 and the new classificationunder IFRS 9:
Upon the adoption of IFRS 9, the Company made an irrevocable election to classify marketable securities and mineral property investments (First Mining’s 10% equity interest in a group of privatelyheld companies that own the Duparquet Gold Project) as FVTOCI given they are not held for trading and are instead held as strategic investments that align with the Company’s corporate objectives.
6
FIRST MINING GOLD CORP.(formerly known as First Mining Finance Corp.) NOTES TO THE CONSOLIDATED FINANCIAL STATEMENTS (Expressed in Canadian dollars unless otherwise noted)
Financial assets/liabilities Original classification IAS 39 New classification IFRS 9Cash and cash equivalents Amortized cost Amortized cost Accounts and other receivables Amortized cost Amortized cost Marketable securities FVTPL FVTOCI Mineral property investments FVTPL FVTOCI Reclamation deposit Amortized cost Amortized cost Accounts payable and accrued liabilities Amortized cost Amortized cost Loans payable Amortized cost Amortized cost Debenture liability Amortized cost Amortized cost
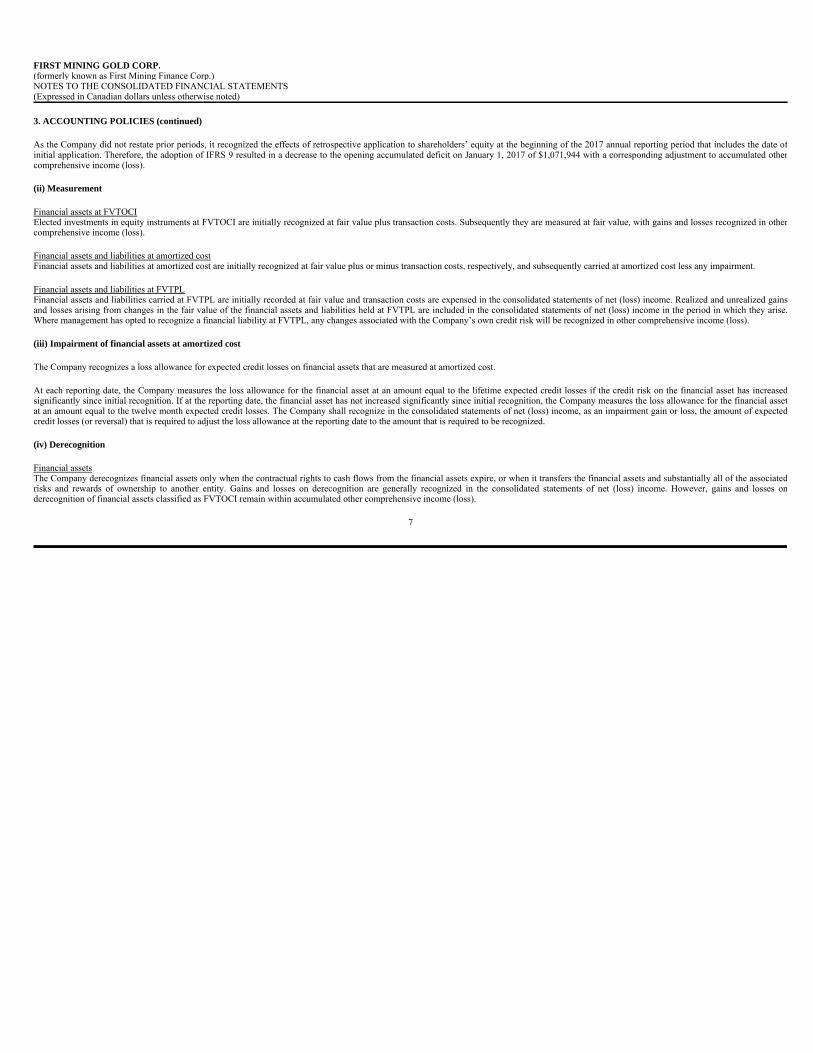
3. ACCOUNTING POLICIES (continued)
As the Company did not restate prior periods, it recognized the effects of retrospective application to shareholders’ equity at the beginning of the 2017 annual reporting period that includes the date ofinitial application. Therefore, the adoption of IFRS 9 resulted in a decrease to the opening accumulated deficit on January 1, 2017 of $1,071,944 with a corresponding adjustment to accumulated othercomprehensive income (loss).
(ii) Measurement
Financial assets at FVTOCIElected investments in equity instruments at FVTOCI are initially recognized at fair value plus transaction costs. Subsequently they are measured at fair value, with gains and losses recognized in othercomprehensive income (loss).
Financial assets and liabilities at amortized costFinancial assets and liabilities at amortized cost are initially recognized at fair value plus or minus transaction costs, respectively, and subsequently carried at amortized cost less any impairment.
Financial assets and liabilities at FVTPLFinancial assets and liabilities carried at FVTPL are initially recorded at fair value and transaction costs are expensed in the consolidated statements of net (loss) income. Realized and unrealized gainsand losses arising from changes in the fair value of the financial assets and liabilities held at FVTPL are included in the consolidated statements of net (loss) income in the period in which they arise.Where management has opted to recognize a financial liability at FVTPL, any changes associated with the Company’s own credit risk will be recognized in other comprehensive income (loss).
(iii) Impairment of financial assets at amortized cost
The Company recognizes a loss allowance for expected credit losses on financial assets that are measured at amortized cost.
At each reporting date, the Company measures the loss allowance for the financial asset at an amount equal to the lifetime expected credit losses if the credit risk on the financial asset has increasedsignificantly since initial recognition. If at the reporting date, the financial asset has not increased significantly since initial recognition, the Company measures the loss allowance for the financial assetat an amount equal to the twelve month expected credit losses. The Company shall recognize in the consolidated statements of net (loss) income, as an impairment gain or loss, the amount of expectedcredit losses (or reversal) that is required to adjust the loss allowance at the reporting date to the amount that is required to be recognized.
(iv) Derecognition
Financial assetsThe Company derecognizes financial assets only when the contractual rights to cash flows from the financial assets expire, or when it transfers the financial assets and substantially all of the associatedrisks and rewards of ownership to another entity. Gains and losses on derecognition are generally recognized in the consolidated statements of net (loss) income. However, gains and losses onderecognition of financial assets classified as FVTOCI remain within accumulated other comprehensive income (loss).
7
FIRST MINING GOLD CORP.(formerly known as First Mining Finance Corp.) NOTES TO THE CONSOLIDATED FINANCIAL STATEMENTS (Expressed in Canadian dollars unless otherwise noted)
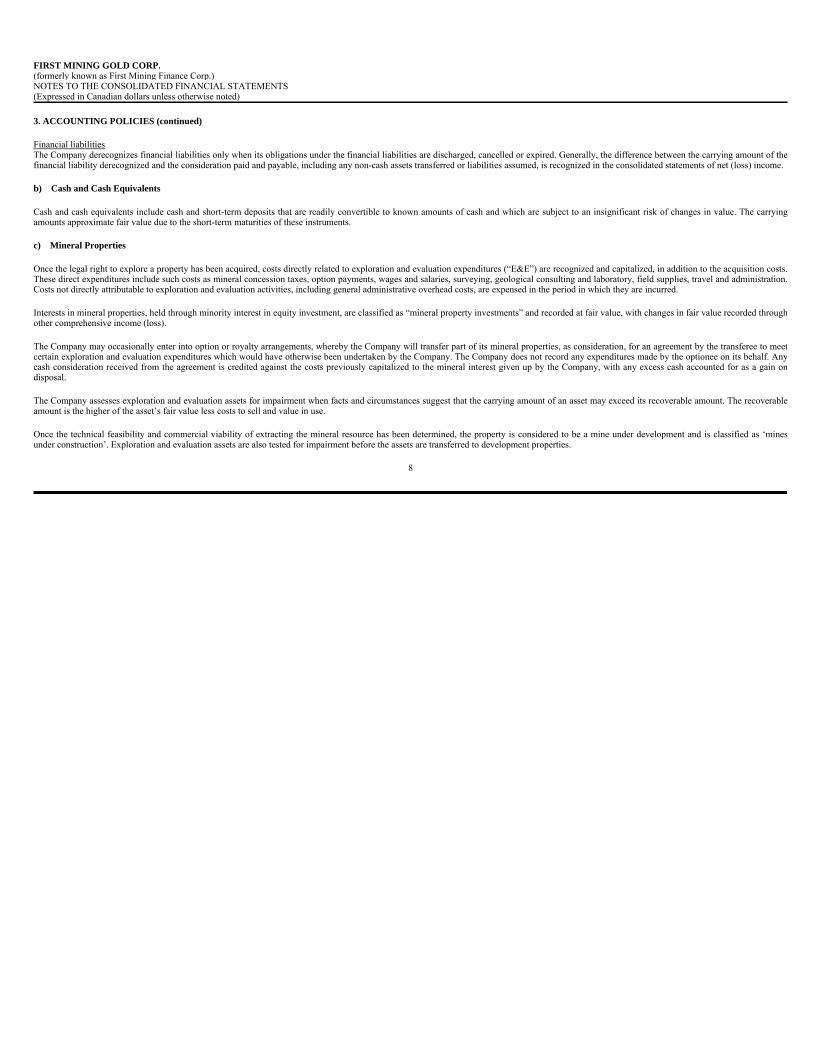
3. ACCOUNTING POLICIES (continued)
Financial liabilitiesThe Company derecognizes financial liabilities only when its obligations under the financial liabilities are discharged, cancelled or expired. Generally, the difference between the carrying amount of thefinancial liability derecognized and the consideration paid and payable, including any non-cash assets transferred or liabilities assumed, is recognized in the consolidated statements of net (loss) income.
b) Cash and Cash Equivalents
Cash and cash equivalents include cash and short-term deposits that are readily convertible to known amounts of cash and which are subject to an insignificant risk of changes in value. The carryingamounts approximate fair value due to the short-term maturities of these instruments.
c) Mineral Properties
Once the legal right to explore a property has been acquired, costs directly related to exploration and evaluation expenditures (“E&E”) are recognized and capitalized, in addition to the acquisition costs.These direct expenditures include such costs as mineral concession taxes, option payments, wages and salaries, surveying, geological consulting and laboratory, field supplies, travel and administration.Costs not directly attributable to exploration and evaluation activities, including general administrative overhead costs, are expensed in the period in which they are incurred.
Interests in mineral properties, held through minority interest in equity investment, are classified as “mineral property investments” and recorded at fair value, with changes in fair value recorded throughother comprehensive income (loss).
The Company may occasionally enter into option or royalty arrangements, whereby the Company will transfer part of its mineral properties, as consideration, for an agreement by the transferee to meetcertain exploration and evaluation expenditures which would have otherwise been undertaken by the Company. The Company does not record any expenditures made by the optionee on its behalf. Anycash consideration received from the agreement is credited against the costs previously capitalized to the mineral interest given up by the Company, with any excess cash accounted for as a gain ondisposal.
The Company assesses exploration and evaluation assets for impairment when facts and circumstances suggest that the carrying amount of an asset may exceed its recoverable amount. The recoverableamount is the higher of the asset’s fair value less costs to sell and value in use.
Once the technical feasibility and commercial viability of extracting the mineral resource has been determined, the property is considered to be a mine under development and is classified as ‘minesunder construction’. Exploration and evaluation assets are also tested for impairment before the assets are transferred to development properties.
8
FIRST MINING GOLD CORP.(formerly known as First Mining Finance Corp.) NOTES TO THE CONSOLIDATED FINANCIAL STATEMENTS (Expressed in Canadian dollars unless otherwise noted)
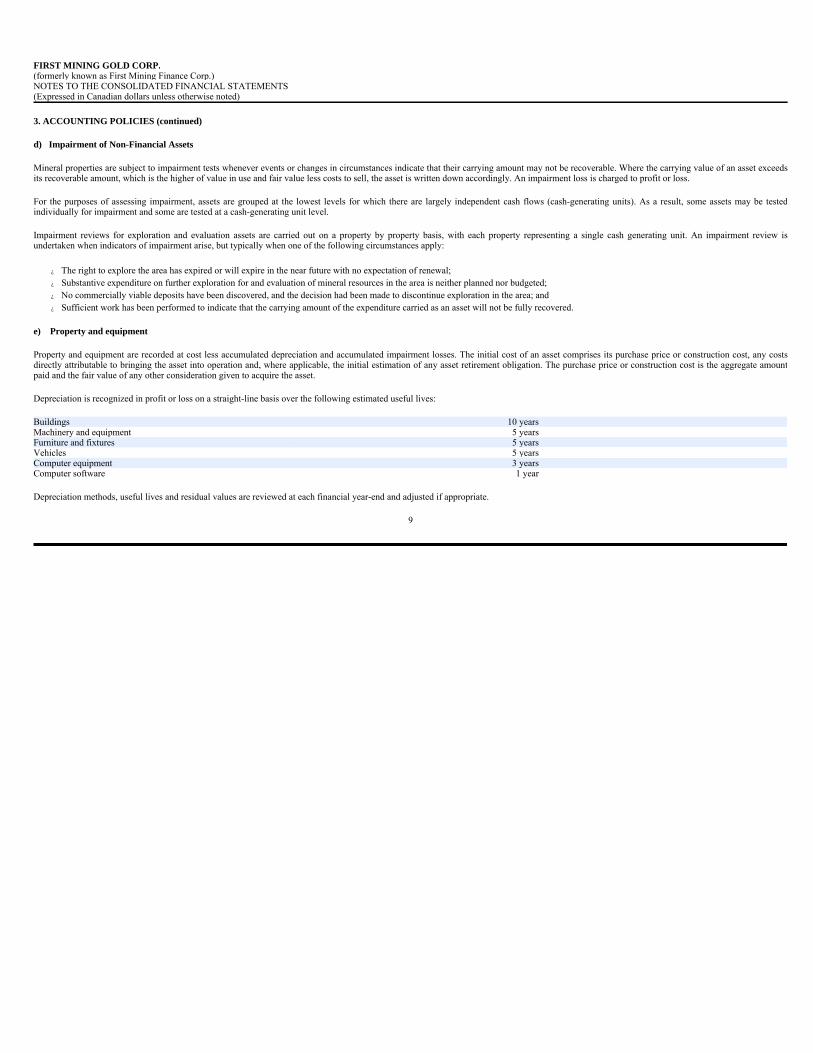
3. ACCOUNTING POLICIES (continued)
d) Impairment of Non-Financial Assets
Mineral properties are subject to impairment tests whenever events or changes in circumstances indicate that their carrying amount may not be recoverable. Where the carrying value of an asset exceedsits recoverable amount, which is the higher of value in use and fair value less costs to sell, the asset is written down accordingly. An impairment loss is charged to profit or loss.
For the purposes of assessing impairment, assets are grouped at the lowest levels for which there are largely independent cash flows (cash-generating units). As a result, some assets may be testedindividually for impairment and some are tested at a cash-generating unit level.
Impairment reviews for exploration and evaluation assets are carried out on a property by property basis, with each property representing a single cash generating unit. An impairment review isundertaken when indicators of impairment arise, but typically when one of the following circumstances apply:
� The right to explore the area has expired or will expire in the near future with no expectation of renewal; � Substantive expenditure on further exploration for and evaluation of mineral resources in the area is neither planned nor budgeted; � No commercially viable deposits have been discovered, and the decision had been made to discontinue exploration in the area; and � Sufficient work has been performed to indicate that the carrying amount of the expenditure carried as an asset will not be fully recovered.
e) Property and equipment
Property and equipment are recorded at cost less accumulated depreciation and accumulated impairment losses. The initial cost of an asset comprises its purchase price or construction cost, any costsdirectly attributable to bringing the asset into operation and, where applicable, the initial estimation of any asset retirement obligation. The purchase price or construction cost is the aggregate amountpaid and the fair value of any other consideration given to acquire the asset.
Depreciation is recognized in profit or loss on a straight-line basis over the following estimated useful lives:
Depreciation methods, useful lives and residual values are reviewed at each financial year-end and adjusted if appropriate.
9
FIRST MINING GOLD CORP.(formerly known as First Mining Finance Corp.) NOTES TO THE CONSOLIDATED FINANCIAL STATEMENTS (Expressed in Canadian dollars unless otherwise noted)
Buildings 10 years Machinery and equipment 5 years Furniture and fixtures 5 years Vehicles 5 years Computer equipment 3 years Computer software 1 year
3. ACCOUNTING POLICIES (continued)
f) Environmental Reclamation Provision
The Company is subject to various government laws and regulations relating to environmental disturbances caused by exploration and evaluation activities. The present value of the estimated costs oflegal and constructive obligations required to restore the exploration sites is recognized in the year in which the obligation is incurred. The nature of the reclamation activities includes restoration andrevegetation of the affected exploration sites.
A reclamation provision generally arises when the environmental disturbance is subject to government laws and regulations. When a liability is recognized, the present value of the estimated costs iscapitalized by increasing the carrying amount of the related exploration properties. Over time, the discounted liability is increased for the changes in present value based on current market discount ratesand liability specific risks.
Additional environment disturbances or changes in reclamation costs will be recognized as additions to the corresponding assets and reclamation provision in the year in which they occur.
g) Income Taxes
Income tax expense comprises current and deferred tax. Current tax and deferred tax are recognized in net income except to the extent that it relates to a business combination or items recognizeddirectly in equity or in other comprehensive loss.
Current income taxes are recognized for the estimated income taxes payable or receivable on taxable income or loss for the current year and any adjustment to income taxes payable in respect ofprevious years. Current income taxes are determined using tax rates and tax laws that have been enacted or substantively enacted by the year-end date.
Deferred tax assets and liabilities are recognized where the carrying amount of an asset or liability differs from its tax base, except for taxable temporary differences arising on the initial recognition ofgoodwill and temporary differences arising on the initial recognition of an asset or liability in a transaction which is not a business combination and at the time of the transaction affects neitheraccounting nor taxable profit or loss.
Recognition of deferred tax assets for unused tax losses, tax credits and deductible temporary differences is restricted to those instances where it is probable that future taxable profit will be availableagainst which the deferred tax asset can be utilized. At the end of each reporting year the Company reassesses unrecognized deferred tax assets. The Company recognizes a previously unrecognizeddeferred tax asset to the extent that it has become probable that future taxable profit will allow the deferred tax asset to be recovered.
h) Share Capital
Equity instruments are contracts that give a residual interest in the net assets of the Company. Financial instruments issued by the Company are classified as equity only to the extent that they do notmeet the definition of a financial liability or financial asset. The Company’s common shares are classified as equity instruments.
Incremental costs directly attributable to the issue of new shares or options are shown in equity as a deduction, net of tax, from the proceeds.
10
FIRST MINING GOLD CORP.(formerly known as First Mining Finance Corp.) NOTES TO THE CONSOLIDATED FINANCIAL STATEMENTS (Expressed in Canadian dollars unless otherwise noted)
3. ACCOUNTING POLICIES (continued)
i) Loss per Share
Basic loss per share is calculated by dividing the net loss for the year by the weighted average number of shares outstanding during the year. Diluted loss per share is calculated using the treasury stockmethod. Under the treasury stock method, the weighted average number of shares outstanding used in the calculation of diluted income or loss per share assumes that the deemed proceeds received fromthe exercise of stock options, share purchase warrants and their equivalents would be used to repurchase common shares of the Company at the average market price during the year, if they aredetermined to have a dilutive effect. Existing stock options and share purchase warrants have not been included in the current year computation of diluted loss per share as to do so would be anti-dilutive. Accordingly, the current year basic and diluted losses per share are the same.
j) Share-based Payments
Where equity-settled share options are granted to employees, the fair value of the options at the date of grant, measured using the Black-Scholes option pricing model, is charged to the statement ofcomprehensive loss or capitalized to mineral properties over the vesting period.
Where equity-settled share options are granted to non-employees, they are measured at the fair value of the goods or services received. However, if the value of goods or services received in exchangefor the options cannot be reliably estimated, the options are measured using the Black-Scholes option pricing model.
All equity-settled share-based payments are reflected in share-based payment reserve, until exercised. Upon exercise, shares are issued from treasury and the amount reflected in share-based paymentreserve is credited to share capital, together with any consideration received.
k) Segment Reporting
Operating segments are reported in a manner consistent with the internal reporting provided to the chief operating decision-maker. The chief operating decision-maker is responsible for allocatingresources and assessing performance of the operating segment.
l) Critical Accounting Judgments and Estimates
The preparation of financial statements requires the use of accounting estimates. It also requires management to exercise judgment in the process of applying its accounting policies. Estimates andjudgments are regularly evaluated and are based on management’s experience and other factors, including expectations about future events that are believed to be reasonable under the circumstances.The following discusses the accounting judgments and estimates that the Company has made in the preparation of the audited consolidated financial statements for the year ended December 31, 2017,which could result in a material adjustment to the carrying amounts of assets and liabilities:
11
FIRST MINING GOLD CORP.(formerly known as First Mining Finance Corp.) NOTES TO THE CONSOLIDATED FINANCIAL STATEMENTS (Expressed in Canadian dollars unless otherwise noted)
3. ACCOUNTING POLICIES (continued)
(i) Impairment of Mineral Properties
In accordance with the Company’s accounting policy for its mineral properties, exploration and evaluation expenditures on mineral properties are capitalized. There is no certainty that the expendituresmade by the Company in the exploration of its property interests will result in discoveries of commercial quantities of minerals. The Company applies judgment to determine whether indicators ofimpairment exist for these capitalized costs.
Management uses several criteria in making this assessment, including the period for which the Company has the right to explore, expected renewals of exploration rights, whether substantiveexpenditures on further exploration and evaluation of mineral properties are budgeted, and evaluation of the results of exploration and evaluation activities up to the reporting date.
(ii) Determining Amount and Timing of Reclamation Provisions
A reclamation provision represents the present value of estimated future costs for the reclamation of the Company’s mineral properties. These estimates include assumptions as to the future activities,cost of services, timing of the reclamation work to be performed, inflation rates, exchange rates and interest rates. The actual cost to reclaim a mine may vary from the estimated amounts because thereare uncertainties in factors used to estimate the cost and potential changes in regulations or laws governing the reclamation of a mineral property. Management periodically reviews the reclamationrequirements and adjusts the liability as new information becomes available and will assess the impact of new regulations and laws as they are enacted.
(iii) Mineral Property Investments
The Company makes estimates and assumptions that affect the carrying value of its mineral property investments, which are comprised of equity interests in the shares of private companies. Thesefinancial assets are designated as fair value through other comprehensive income (loss), and management needs to determine the fair value as at each period end. As there is no observable market datawhich can be used to determine this fair value, management applies judgment in determining whether a significant change in the fair value of this investment may have occurred. Factors that areconsidered include a change in the performance of the investee, a change in the market for the investee’s future products, a change in the performance of comparable entities, a change in the economicenvironment, or evidence from external transactions in the investee’s equity. Changes to these variables could result in the fair value being less than or greater than the amount recorded.
m) Accounting Standards Issued but Not Yet Applied
The following are accounting standards anticipated to be effective January 1, 2018 or later:
(i) IFRS 15 Revenue from Contracts with Customers
IFRS 15 will replace IAS 18 Revenue, IAS 11 Construction Contracts, and related interpretations on revenue. IFRS 15 establishes a single five-step model for determining the nature, amount, timing anduncertainty of revenue and cash flows arising from a contract with a customer. Application of the standard is mandatory for annual periods beginning on or after January 1, 2018, with early applicationpermitted. As the Company has no revenue, no impact on the Company’s consolidated financial statements is expected.
12
FIRST MINING GOLD CORP.(formerly known as First Mining Finance Corp.) NOTES TO THE CONSOLIDATED FINANCIAL STATEMENTS (Expressed in Canadian dollars unless otherwise noted)
3. ACCOUNTING POLICIES (continued)
(ii) IFRS 16 Leases
IFRS 16 will replace IAS 17 Leases. IFRS 16 specifies how to recognize, measure, present and disclose leases. The standard provides a single lessee accounting model, requiring lessees to recognizeassets and liabilities for all leases unless the lease term is 12 months or less or the underlying asset has a low value. Application of the standard is mandatory for annual periods beginning on or afterJanuary 1, 2019, with early application permitted. IFRS 16 will result in an increase in assets and liabilities as fewer lease payments will be expensed. Management expects an increase in depreciationexpenses and also an increase in cash flow from operating activities as these lease payments will be recorded as financing outflows in the consolidated statements of cash flows. Currently, these impactsare not expected to be material.
There are no other IFRS or International Financial Reporting Interpretations Committee interpretations that are not yet effective that would be expected to have a material impact on the Company’sconsolidated financial statements.
4. ACQUISITION OF GOLDRUSH RESOURCES LTD.
On January 7, 2016, the Company completed the acquisition of all the outstanding common shares of Goldrush Resources Ltd. (“Goldrush”) on the basis of 0.0714 common shares in the capital of FirstMining for each Goldrush share by way of a plan of arrangement under the Business Corporations Act (British Columbia) (the ”Goldrush Transaction”). The Goldrush Transaction was conducted byway of a court-approved plan of arrangement, which resulted in Goldrush becoming a wholly-owned subsidiary of First Mining. No replacement options or warrants were required as part of theGoldrush Transaction.
For accounting purposes, the acquisition of Goldrush has been recorded as an asset acquisition as Goldrush is not considered to be a business when applying the guidance within IFRS 3 BusinessCombinations (“IFRS 3”).
Consideration paid:
The fair value of identifiable assets acquired and liabilities assumed from Goldrush were as follows:
13
FIRST MINING GOLD CORP.(formerly known as First Mining Finance Corp.) NOTES TO THE CONSOLIDATED FINANCIAL STATEMENTS (Expressed in Canadian dollars unless otherwise noted)
Fair value of 11,950,223 common shares issued $ 4,780,089 Transaction costs incurred by the Company 101,515 Total consideration paid $ 4,881,604
Cash $ 3,446,574 Accounts and other receivables 1,077,817 Prepaid expenditures 22,745 Mineral properties (Note 12) 361,894 Accounts payable and accrued liabilities (27,426) Net identifiable assets acquired $ 4,881,604
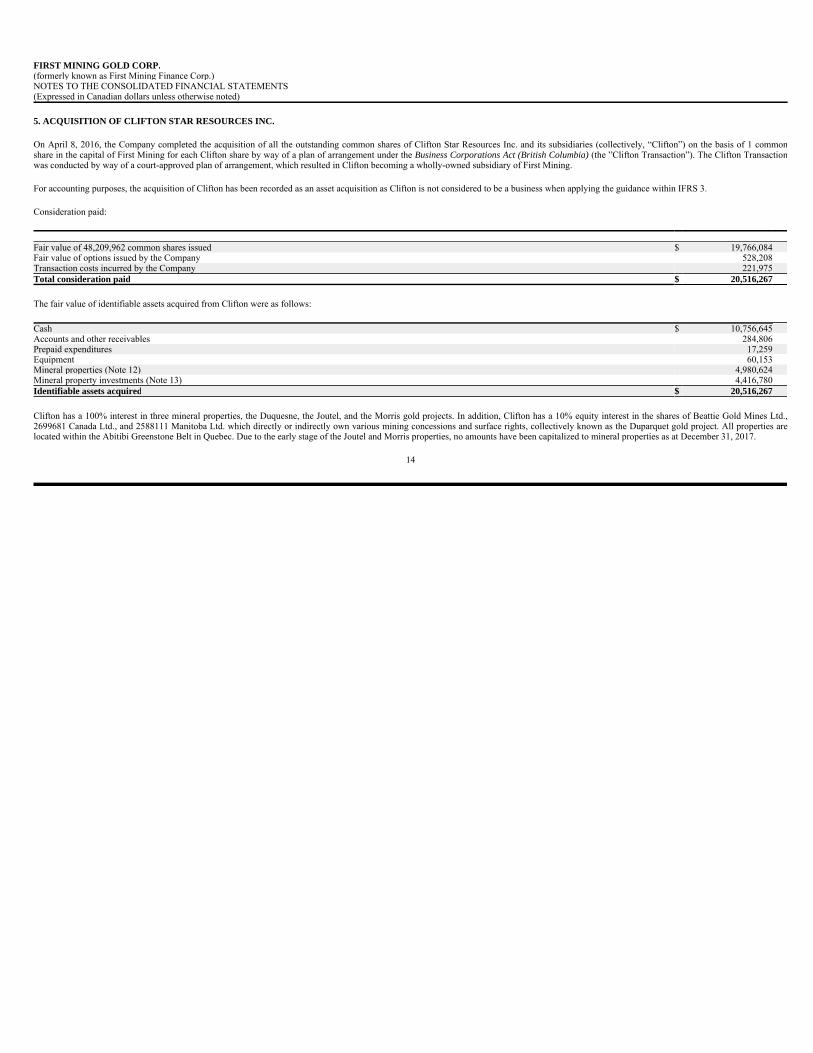
5. ACQUISITION OF CLIFTON STAR RESOURCES INC.
On April 8, 2016, the Company completed the acquisition of all the outstanding common shares of Clifton Star Resources Inc. and its subsidiaries (collectively, “Clifton”) on the basis of 1 commonshare in the capital of First Mining for each Clifton share by way of a plan of arrangement under the Business Corporations Act (British Columbia) (the ”Clifton Transaction”). The Clifton Transactionwas conducted by way of a court-approved plan of arrangement, which resulted in Clifton becoming a wholly-owned subsidiary of First Mining.
For accounting purposes, the acquisition of Clifton has been recorded as an asset acquisition as Clifton is not considered to be a business when applying the guidance within IFRS 3.
Consideration paid:
The fair value of identifiable assets acquired from Clifton were as follows:
Clifton has a 100% interest in three mineral properties, the Duquesne, the Joutel, and the Morris gold projects. In addition, Clifton has a 10% equity interest in the shares of Beattie Gold Mines Ltd.,2699681 Canada Ltd., and 2588111 Manitoba Ltd. which directly or indirectly own various mining concessions and surface rights, collectively known as the Duparquet gold project. All properties arelocated within the Abitibi Greenstone Belt in Quebec. Due to the early stage of the Joutel and Morris properties, no amounts have been capitalized to mineral properties as at December 31, 2017.
14
FIRST MINING GOLD CORP.(formerly known as First Mining Finance Corp.) NOTES TO THE CONSOLIDATED FINANCIAL STATEMENTS (Expressed in Canadian dollars unless otherwise noted)
Fair value of 48,209,962 common shares issued $ 19,766,084 Fair value of options issued by the Company 528,208 Transaction costs incurred by the Company 221,975 Total consideration paid $ 20,516,267
Cash $ 10,756,645 Accounts and other receivables 284,806 Prepaid expenditures 17,259 Equipment 60,153 Mineral properties (Note 12) 4,980,624 Mineral property investments (Note 13) 4,416,780 Identifiable assets acquired $ 20,516,267
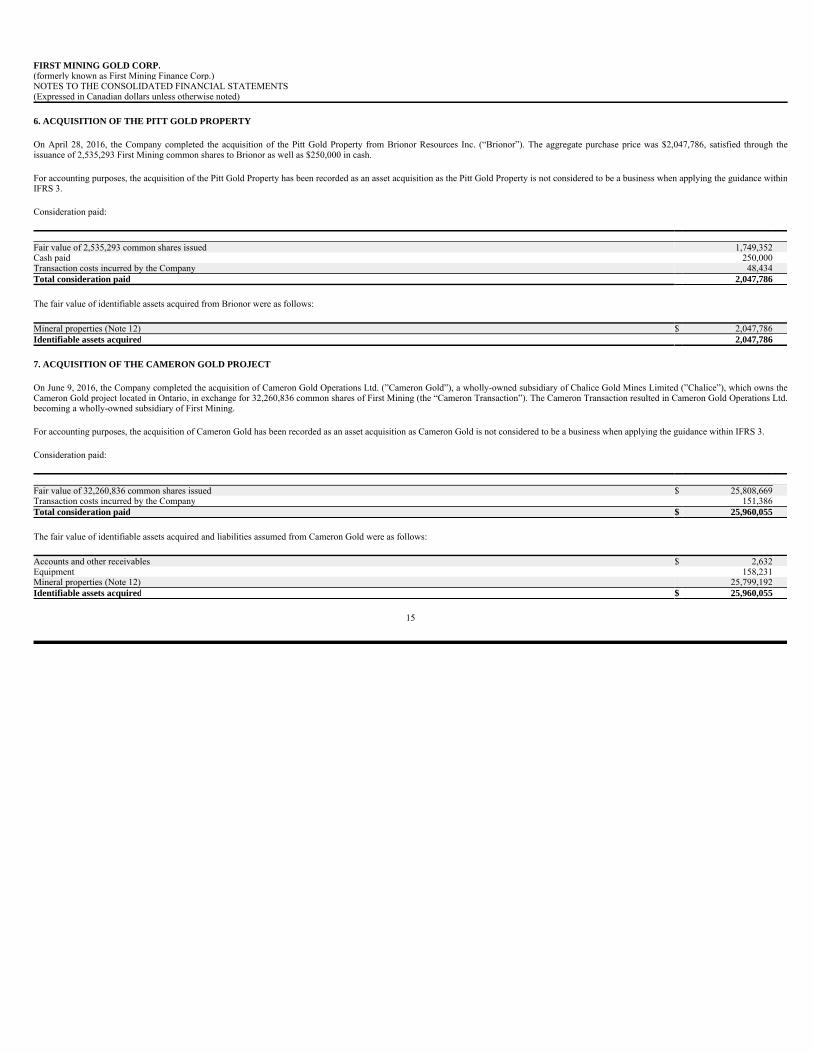
6. ACQUISITION OF THE PITT GOLD PROPERTY
On April 28, 2016, the Company completed the acquisition of the Pitt Gold Property from Brionor Resources Inc. (“Brionor”). The aggregate purchase price was $2,047,786, satisfied through theissuance of 2,535,293 First Mining common shares to Brionor as well as $250,000 in cash.
For accounting purposes, the acquisition of the Pitt Gold Property has been recorded as an asset acquisition as the Pitt Gold Property is not considered to be a business when applying the guidance withinIFRS 3.
Consideration paid:
The fair value of identifiable assets acquired from Brionor were as follows:
7. ACQUISITION OF THE CAMERON GOLD PROJECT
On June 9, 2016, the Company completed the acquisition of Cameron Gold Operations Ltd. (”Cameron Gold”), a wholly-owned subsidiary of Chalice Gold Mines Limited (”Chalice”), which owns theCameron Gold project located in Ontario, in exchange for 32,260,836 common shares of First Mining (the “Cameron Transaction”). The Cameron Transaction resulted in Cameron Gold Operations Ltd.becoming a wholly-owned subsidiary of First Mining.
For accounting purposes, the acquisition of Cameron Gold has been recorded as an asset acquisition as Cameron Gold is not considered to be a business when applying the guidance within IFRS 3.
Consideration paid:
The fair value of identifiable assets acquired and liabilities assumed from Cameron Gold were as follows:
15
FIRST MINING GOLD CORP.(formerly known as First Mining Finance Corp.) NOTES TO THE CONSOLIDATED FINANCIAL STATEMENTS (Expressed in Canadian dollars unless otherwise noted)
Fair value of 2,535,293 common shares issued 1,749,352 Cash paid 250,000 Transaction costs incurred by the Company 48,434 Total consideration paid 2,047,786
Mineral properties (Note 12) $ 2,047,786 Identifiable assets acquired 2,047,786
Fair value of 32,260,836 common shares issued $ 25,808,669 Transaction costs incurred by the Company 151,386 Total consideration paid $ 25,960,055
Accounts and other receivables $ 2,632 Equipment 158,231 Mineral properties (Note 12) 25,799,192 Identifiable assets acquired $ 25,960,055
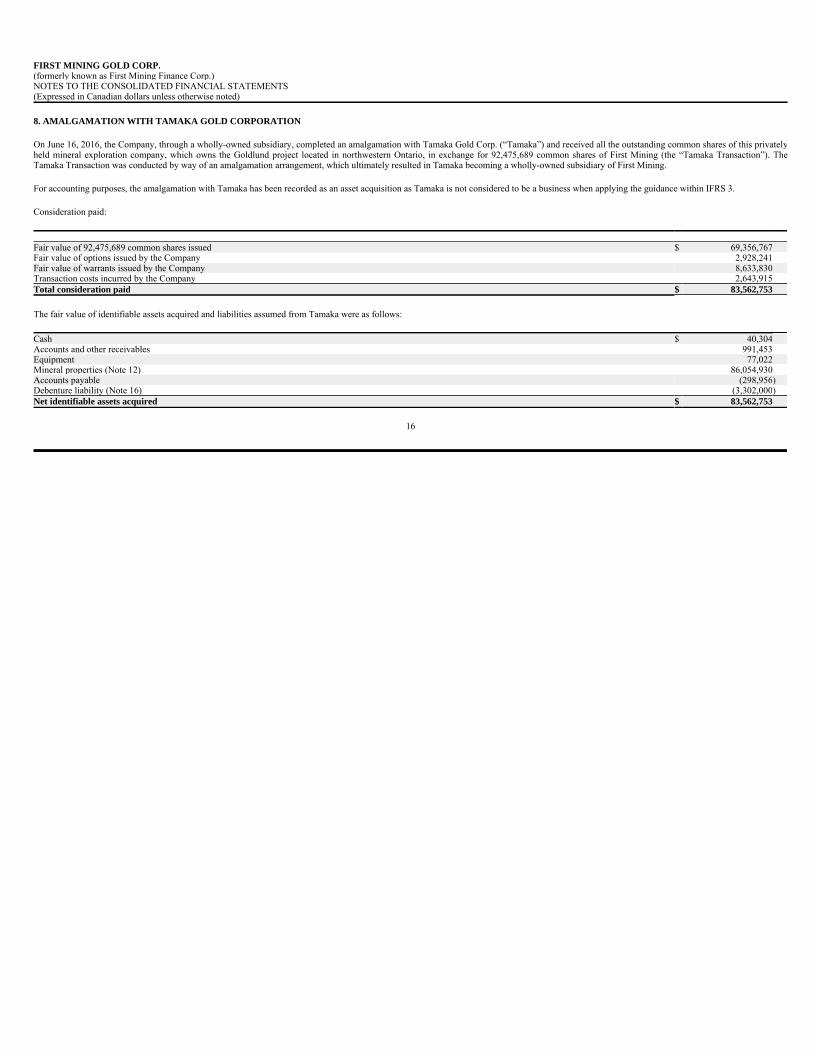
8. AMALGAMATION WITH TAMAKA GOLD CORPORATION
On June 16, 2016, the Company, through a wholly-owned subsidiary, completed an amalgamation with Tamaka Gold Corp. (“Tamaka”) and received all the outstanding common shares of this privatelyheld mineral exploration company, which owns the Goldlund project located in northwestern Ontario, in exchange for 92,475,689 common shares of First Mining (the “Tamaka Transaction”). TheTamaka Transaction was conducted by way of an amalgamation arrangement, which ultimately resulted in Tamaka becoming a wholly-owned subsidiary of First Mining.
For accounting purposes, the amalgamation with Tamaka has been recorded as an asset acquisition as Tamaka is not considered to be a business when applying the guidance within IFRS 3.
Consideration paid:
The fair value of identifiable assets acquired and liabilities assumed from Tamaka were as follows:
16
FIRST MINING GOLD CORP.(formerly known as First Mining Finance Corp.) NOTES TO THE CONSOLIDATED FINANCIAL STATEMENTS (Expressed in Canadian dollars unless otherwise noted)
Fair value of 92,475,689 common shares issued $ 69,356,767 Fair value of options issued by the Company 2,928,241 Fair value of warrants issued by the Company 8,633,830 Transaction costs incurred by the Company 2,643,915 Total consideration paid $ 83,562,753
Cash $ 40,304 Accounts and other receivables 991,453 Equipment 77,022 Mineral properties (Note 12) 86,054,930 Accounts payable (298,956) Debenture liability (Note 16) (3,302,000) Net identifiable assets acquired $ 83,562,753
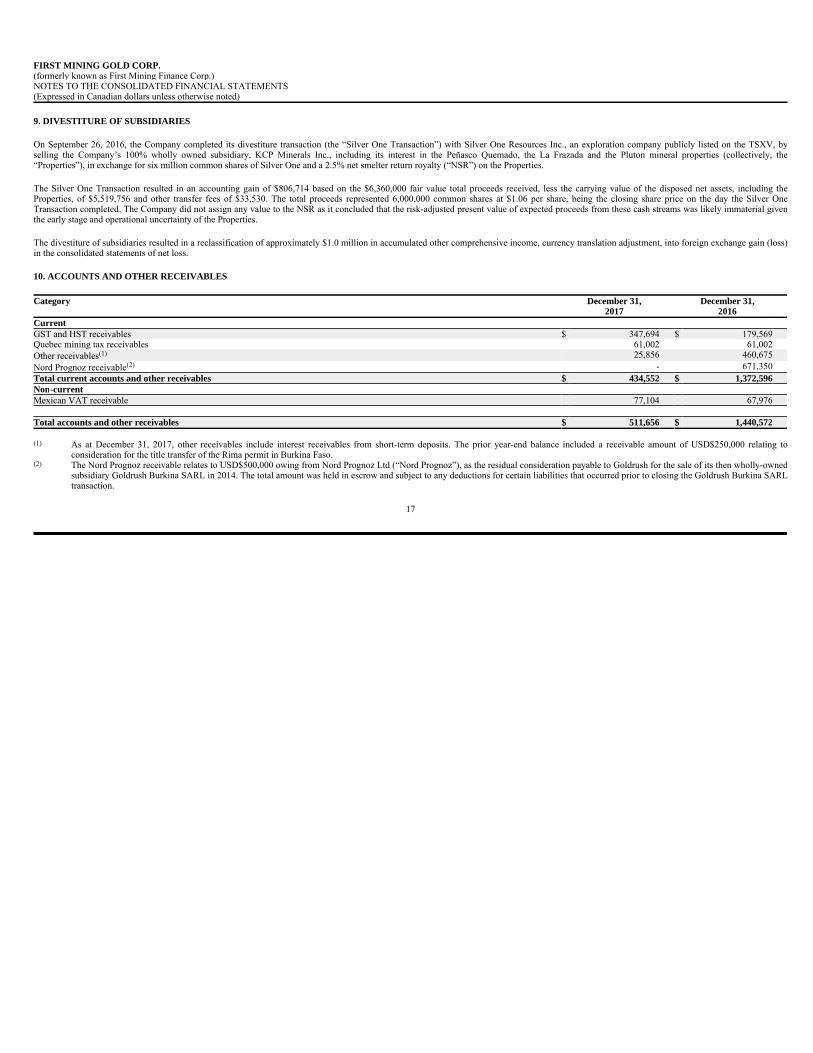
9. DIVESTITURE OF SUBSIDIARIES
On September 26, 2016, the Company completed its divestiture transaction (the “Silver One Transaction”) with Silver One Resources Inc., an exploration company publicly listed on the TSXV, byselling the Company’s 100% wholly owned subsidiary, KCP Minerals Inc., including its interest in the Peñasco Quemado, the La Frazada and the Pluton mineral properties (collectively, the“Properties”), in exchange for six million common shares of Silver One and a 2.5% net smelter return royalty (“NSR”) on the Properties.
The Silver One Transaction resulted in an accounting gain of $806,714 based on the $6,360,000 fair value total proceeds received, less the carrying value of the disposed net assets, including theProperties, of $5,519,756 and other transfer fees of $33,530. The total proceeds represented 6,000,000 common shares at $1.06 per share, being the closing share price on the day the Silver OneTransaction completed. The Company did not assign any value to the NSR as it concluded that the risk-adjusted present value of expected proceeds from these cash streams was likely immaterial giventhe early stage and operational uncertainty of the Properties.
The divestiture of subsidiaries resulted in a reclassification of approximately $1.0 million in accumulated other comprehensive income, currency translation adjustment, into foreign exchange gain (loss)in the consolidated statements of net loss.
10. ACCOUNTS AND OTHER RECEIVABLES
17
FIRST MINING GOLD CORP.(formerly known as First Mining Finance Corp.) NOTES TO THE CONSOLIDATED FINANCIAL STATEMENTS (Expressed in Canadian dollars unless otherwise noted)
Category December 31, December 31,2017 2016
CurrentGST and HST receivables $ 347,694 $ 179,569 Quebec mining tax receivables 61,002 61,002 Other receivables(1) 25,856 460,675 Nord Prognoz receivable(2) - 671,350 Total current accounts and other receivables $ 434,552 $ 1,372,596Non-currentMexican VAT receivable 77,104 67,976
Total accounts and other receivables $ 511,656 $ 1,440,572
(1) As at December 31, 2017, other receivables include interest receivables from short-term deposits. The prior year-end balance included a receivable amount of USD$250,000 relating toconsideration for the title transfer of the Rima permit in Burkina Faso.
(2) The Nord Prognoz receivable relates to USD$500,000 owing from Nord Prognoz Ltd (“Nord Prognoz”), as the residual consideration payable to Goldrush for the sale of its then wholly-ownedsubsidiary Goldrush Burkina SARL in 2014. The total amount was held in escrow and subject to any deductions for certain liabilities that occurred prior to closing the Goldrush Burkina SARLtransaction.
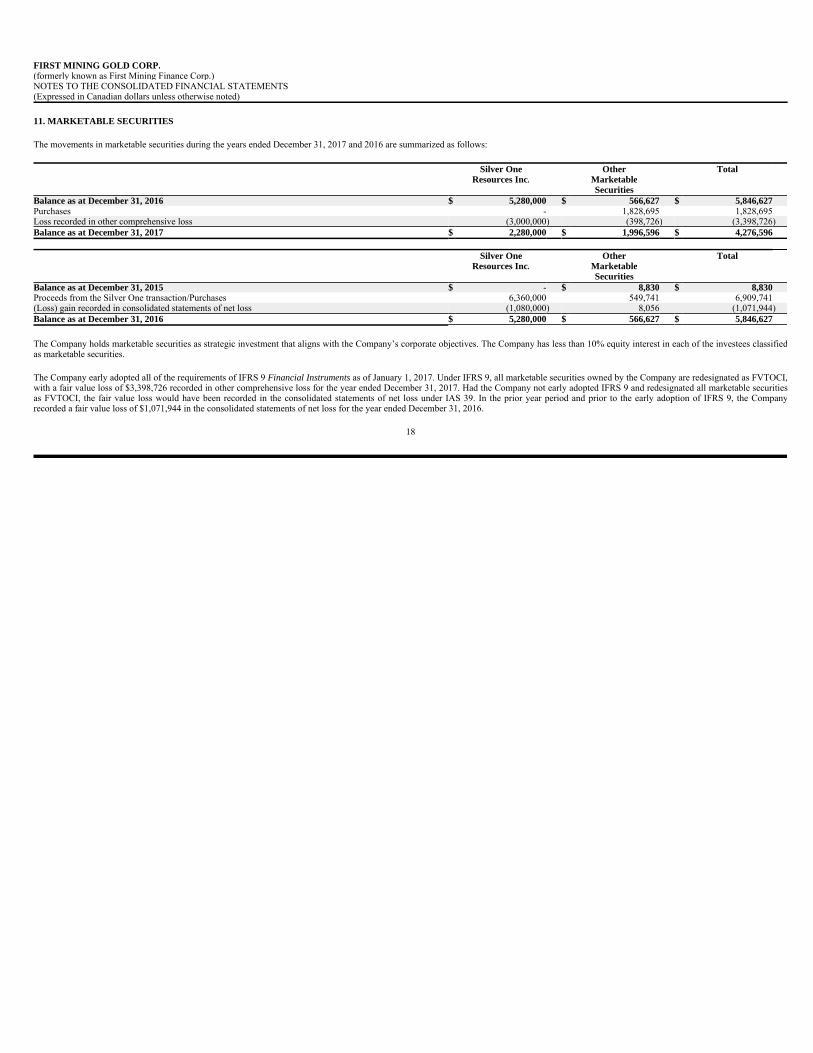
11. MARKETABLE SECURITIES
The movements in marketable securities during the years ended December 31, 2017 and 2016 are summarized as follows:
The Company holds marketable securities as strategic investment that aligns with the Company’s corporate objectives. The Company has less than 10% equity interest in each of the investees classifiedas marketable securities.
The Company early adopted all of the requirements of IFRS 9 Financial Instruments as of January 1, 2017. Under IFRS 9, all marketable securities owned by the Company are redesignated as FVTOCI,with a fair value loss of $3,398,726 recorded in other comprehensive loss for the year ended December 31, 2017. Had the Company not early adopted IFRS 9 and redesignated all marketable securitiesas FVTOCI, the fair value loss would have been recorded in the consolidated statements of net loss under IAS 39. In the prior year period and prior to the early adoption of IFRS 9, the Companyrecorded a fair value loss of $1,071,944 in the consolidated statements of net loss for the year ended December 31, 2016.
18
FIRST MINING GOLD CORP.(formerly known as First Mining Finance Corp.) NOTES TO THE CONSOLIDATED FINANCIAL STATEMENTS (Expressed in Canadian dollars unless otherwise noted)
Silver One Other TotalResources Inc. Marketable
SecuritiesBalance as at December 31, 2016 $ 5,280,000 $ 566,627 $ 5,846,627Purchases - 1,828,695 1,828,695 Loss recorded in other comprehensive loss (3,000,000) (398,726) (3,398,726) Balance as at December 31, 2017 $ 2,280,000 $ 1,996,596 $ 4,276,596
Silver One Other TotalResources Inc. Marketable
SecuritiesBalance as at December 31, 2015 $ - $ 8,830 $ 8,830Proceeds from the Silver One transaction/Purchases 6,360,000 549,741 6,909,741 (Loss) gain recorded in consolidated statements of net loss (1,080,000) 8,056 (1,071,944) Balance as at December 31, 2016 $ 5,280,000 $ 566,627 $ 5,846,627
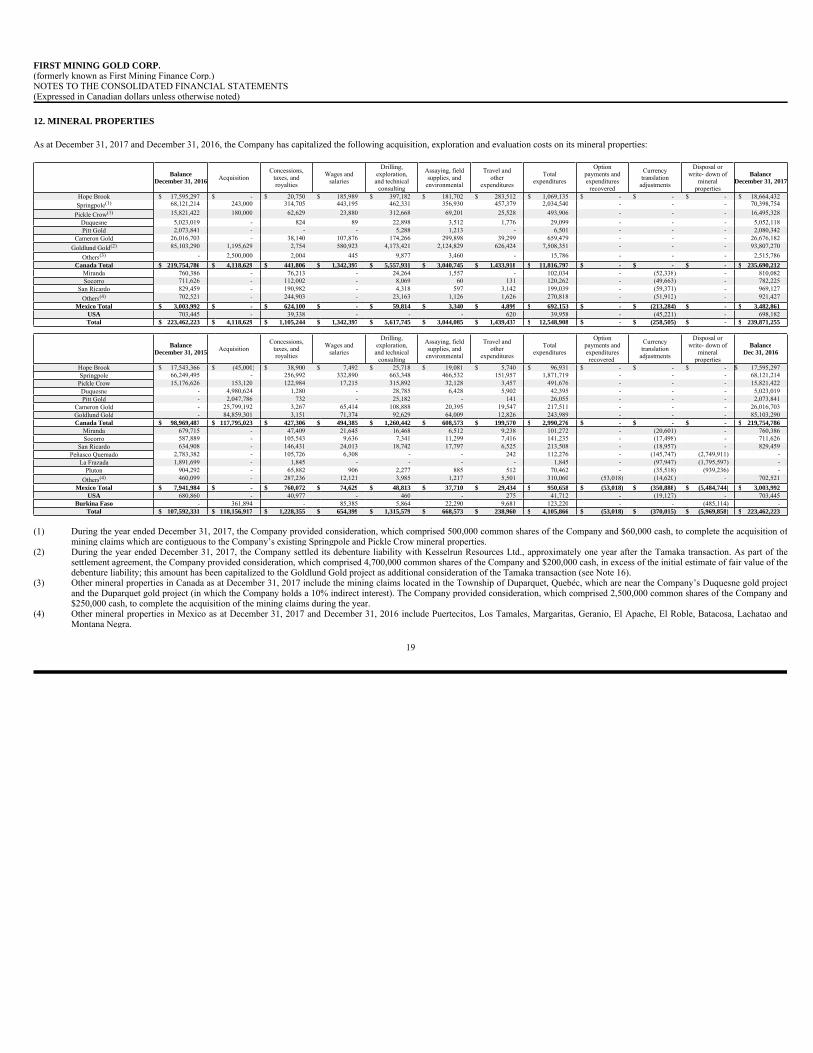
12. MINERAL PROPERTIES
As at December 31, 2017 and December 31, 2016, the Company has capitalized the following acquisition, exploration and evaluation costs on its mineral properties:
19
FIRST MINING GOLD CORP.(formerly known as First Mining Finance Corp.) NOTES TO THE CONSOLIDATED FINANCIAL STATEMENTS (Expressed in Canadian dollars unless otherwise noted)
Balance December 31, 2016 Acquisition
Concessions, taxes, and royalties
Wages and salaries
Drilling, exploration, and technical
consulting
Assaying, field supplies, and
environmental
Travel and other
expenditures
Total expenditures
Option payments and expenditures
recovered
Currency translation
adjustments
Disposal or write- down of
mineral properties
BalanceDecember 31, 2017
Hope Brook $ 17,595,297 $ - $ 20,750 $ 185,989 $ 397,182 $ 181,702 $ 283,512 $ 1,069,135 $ - $ - $ - $ 18,664,432Springpole(1) 68,121,214 243,000 314,705 443,195 462,331 356,930 457,379 2,034,540 - - - 70,398,754
Pickle Crow(1) 15,821,422 180,000 62,629 23,880 312,668 69,201 25,528 493,906 - - - 16,495,328
Duquesne 5,023,019 - 824 89 22,898 3,512 1,776 29,099 - - - 5,052,118Pitt Gold 2,073,841 - - - 5,288 1,213 - 6,501 - - - 2,080,342
Cameron Gold 26,016,703 - 38,140 107,876 174,266 299,898 39,299 659,479 - - - 26,676,182
Goldlund Gold(2) 85,103,290 1,195,629 2,754 580,923 4,173,421 2,124,829 626,424 7,508,351 - - - 93,807,270
Others(3) - 2,500,000 2,004 445 9,877 3,460 - 15,786 - - - 2,515,786
Canada Total $ 219,754,786 $ 4,118,629 $ 441,806 $ 1,342,397 $ 5,557,931 $ 3,040,745 $ 1,433,918 $ 11,816,797 $ - $ - $ - $ 235,690,212Miranda 760,386 - 76,213 - 24,264 1,557 - 102,034 - (52,338) - 810,082Socorro 711,626 - 112,002 - 8,069 60 131 120,262 - (49,663) - 782,225
San Ricardo 829,459 - 190,982 - 4,318 597 3,142 199,039 - (59,371) - 969,127
Others(4) 702,521 - 244,903 - 23,163 1,126 1,626 270,818 - (51,912) - 921,427
Mexico Total $ 3,003,992 $ - $ 624,100 $ - $ 59,814 $ 3,340 $ 4,899 $ 692,153 $ - $ (213,284) $ - $ 3,482,861USA 703,445 - 39,338 - - - 620 39,958 - (45,221) - 698,182Total $ 223,462,223 $ 4,118,629 $ 1,105,244 $ 1,342,397 $ 5,617,745 $ 3,044,085 $ 1,439,437 $ 12,548,908 $ - $ (258,505) $ - $ 239,871,255
Balance December 31, 2015 Acquisition
Concessions, taxes, and royalties
Wages and salaries
Drilling, exploration, and technical
consulting
Assaying, field supplies, and
environmental
Travel and other
expenditures
Total expenditures
Option payments and expenditures recovered
Currency translation
adjustments
Disposal or write- down of
mineral properties
BalanceDec 31, 2016
Hope Brook $ 17,543,366 $ (45,000) $ 38,900 $ 7,492 $ 25,718 $ 19,081 $ 5,740 $ 96,931 $ - $ - $ - $ 17,595,297Springpole 66,249,495 - 256,992 332,890 663,348 466,532 151,957 1,871,719 - - - 68,121,214
Pickle Crow 15,176,626 153,120 122,984 17,215 315,892 32,128 3,457 491,676 - - - 15,821,422Duquesne - 4,980,624 1,280 - 28,785 6,428 5,902 42,395 - - - 5,023,019Pitt Gold - 2,047,786 732 - 25,182 - 141 26,055 - - - 2,073,841
Cameron Gold - 25,799,192 3,267 65,414 108,888 20,395 19,547 217,511 - - - 26,016,703Goldlund Gold - 84,859,301 3,151 71,374 92,629 64,009 12,826 243,989 - - - 85,103,290Canada Total $ 98,969,487 $ 117,795,023 $ 427,306 $ 494,385 $ 1,260,442 $ 608,573 $ 199,570 $ 2,990,276 $ - $ - $ - $ 219,754,786
Miranda 679,715 - 47,409 21,645 16,468 6,512 9,238 101,272 - (20,601) - 760,386Socorro 587,889 - 105,543 9,636 7,341 11,299 7,416 141,235 - (17,498) - 711,626
San Ricardo 634,908 - 146,431 24,013 18,742 17,797 6,525 213,508 - (18,957) - 829,459Peñasco Quemado 2,783,382 - 105,726 6,308 - - 242 112,276 - (145,747) (2,749,911) -
La Frazada 1,891,699 - 1,845 - - - - 1,845 - (97,947) (1,795,597) -Pluton 904,292 - 65,882 906 2,277 885 512 70,462 - (35,518) (939,236) -
Others(4) 460,099 - 287,236 12,121 3,985 1,217 5,501 310,060 (53,018) (14,620) - 702,521
Mexico Total $ 7,941,984 $ - $ 760,072 $ 74,629 $ 48,813 $ 37,710 $ 29,434 $ 950,658 $ (53,018) $ (350,888) $ (5,484,744) $ 3,003,992USA 680,860 - 40,977 - 460 - 275 41,712 - (19,127) - 703,445
Burkina Faso - 361,894 - 85,385 5,864 22,290 9,681 123,220 - - (485,114) -Total $ 107,592,331 $ 118,156,917 $ 1,228,355 $ 654,399 $ 1,315,579 $ 668,573 $ 238,960 $ 4,105,866 $ (53,018) $ (370,015) $ (5,969,858) $ 223,462,223
(1) During the year ended December 31, 2017, the Company provided consideration, which comprised 500,000 common shares of the Company and $60,000 cash, to complete the acquisition ofmining claims which are contiguous to the Company’s existing Springpole and Pickle Crow mineral properties.
(2) During the year ended December 31, 2017, the Company settled its debenture liability with Kesselrun Resources Ltd., approximately one year after the Tamaka transaction. As part of thesettlement agreement, the Company provided consideration, which comprised 4,700,000 common shares of the Company and $200,000 cash, in excess of the initial estimate of fair value of thedebenture liability; this amount has been capitalized to the Goldlund Gold project as additional consideration of the Tamaka transaction (see Note 16).
(3) Other mineral properties in Canada as at December 31, 2017 include the mining claims located in the Township of Duparquet, Quebéc, which are near the Company’s Duquesne gold projectand the Duparquet gold project (in which the Company holds a 10% indirect interest). The Company provided consideration, which comprised 2,500,000 common shares of the Company and$250,000 cash, to complete the acquisition of the mining claims during the year.
(4) Other mineral properties in Mexico as at December 31, 2017 and December 31, 2016 include Puertecitos, Los Tamales, Margaritas, Geranio, El Apache, El Roble, Batacosa, Lachatao andMontana Negra.
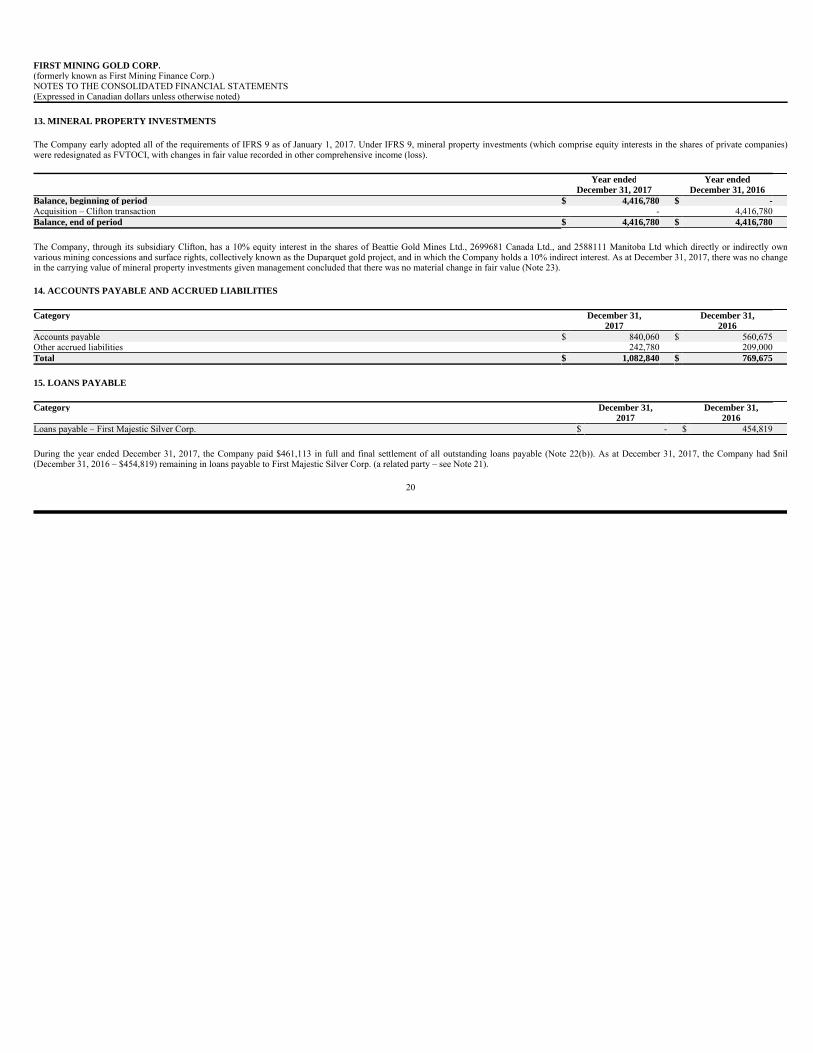
13. MINERAL PROPERTY INVESTMENTS
The Company early adopted all of the requirements of IFRS 9 as of January 1, 2017. Under IFRS 9, mineral property investments (which comprise equity interests in the shares of private companies)were redesignated as FVTOCI, with changes in fair value recorded in other comprehensive income (loss).
The Company, through its subsidiary Clifton, has a 10% equity interest in the shares of Beattie Gold Mines Ltd., 2699681 Canada Ltd., and 2588111 Manitoba Ltd which directly or indirectly ownvarious mining concessions and surface rights, collectively known as the Duparquet gold project, and in which the Company holds a 10% indirect interest. As at December 31, 2017, there was no changein the carrying value of mineral property investments given management concluded that there was no material change in fair value (Note 23).
14. ACCOUNTS PAYABLE AND ACCRUED LIABILITIES
15. LOANS PAYABLE
During the year ended December 31, 2017, the Company paid $461,113 in full and final settlement of all outstanding loans payable (Note 22(b)). As at December 31, 2017, the Company had $nil(December 31, 2016 – $454,819) remaining in loans payable to First Majestic Silver Corp. (a related party – see Note 21).
20
FIRST MINING GOLD CORP.(formerly known as First Mining Finance Corp.) NOTES TO THE CONSOLIDATED FINANCIAL STATEMENTS (Expressed in Canadian dollars unless otherwise noted)
Year ended Year endedDecember 31, 2017 December 31, 2016
Balance, beginning of period $ 4,416,780 $ -Acquisition – Clifton transaction - 4,416,780 Balance, end of period $ 4,416,780 $ 4,416,780
Category December 31, December 31,2017 2016
Accounts payable $ 840,060 $ 560,675 Other accrued liabilities 242,780 209,000 Total $ 1,082,840 $ 769,675
Category December 31, December 31,2017 2016
Loans payable – First Majestic Silver Corp. $ - $ 454,819
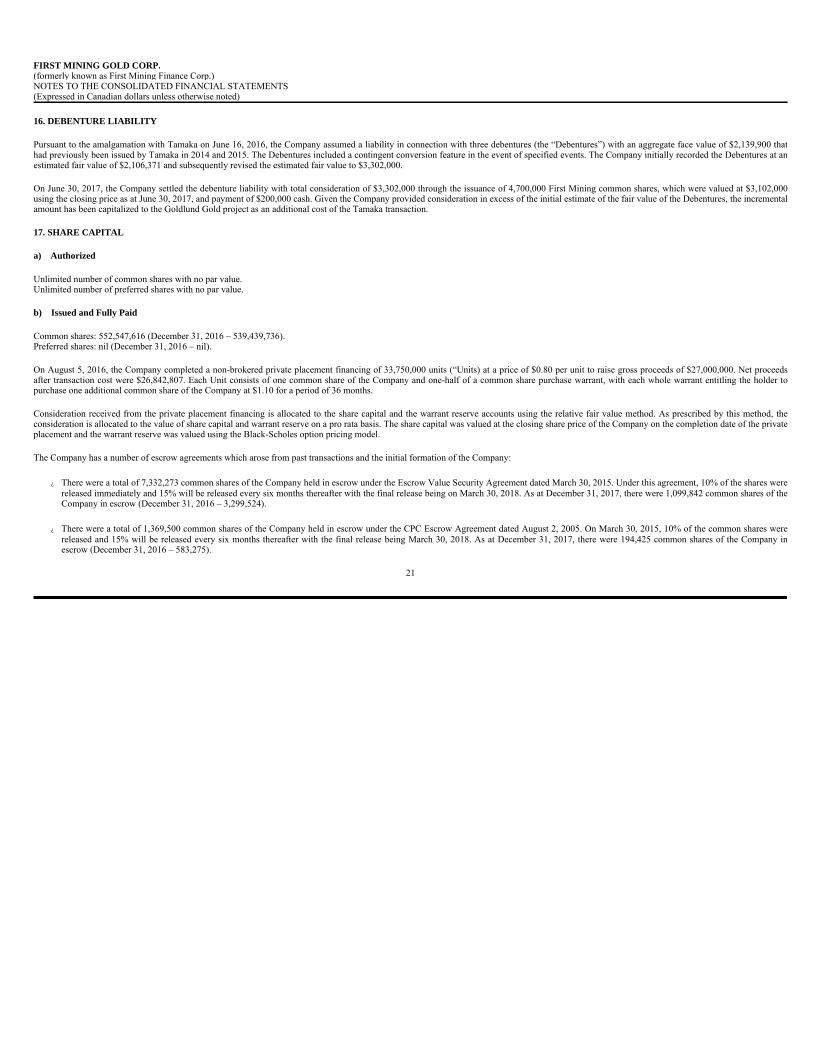
16. DEBENTURE LIABILITY
Pursuant to the amalgamation with Tamaka on June 16, 2016, the Company assumed a liability in connection with three debentures (the “Debentures”) with an aggregate face value of $2,139,900 thathad previously been issued by Tamaka in 2014 and 2015. The Debentures included a contingent conversion feature in the event of specified events. The Company initially recorded the Debentures at anestimated fair value of $2,106,371 and subsequently revised the estimated fair value to $3,302,000.
On June 30, 2017, the Company settled the debenture liability with total consideration of $3,302,000 through the issuance of 4,700,000 First Mining common shares, which were valued at $3,102,000using the closing price as at June 30, 2017, and payment of $200,000 cash. Given the Company provided consideration in excess of the initial estimate of the fair value of the Debentures, the incrementalamount has been capitalized to the Goldlund Gold project as an additional cost of the Tamaka transaction.
17. SHARE CAPITAL
a) Authorized
Unlimited number of common shares with no par value. Unlimited number of preferred shares with no par value.
b) Issued and Fully Paid
Common shares: 552,547,616 (December 31, 2016 – 539,439,736).Preferred shares: nil (December 31, 2016 – nil).
On August 5, 2016, the Company completed a non-brokered private placement financing of 33,750,000 units (“Units) at a price of $0.80 per unit to raise gross proceeds of $27,000,000. Net proceedsafter transaction cost were $26,842,807. Each Unit consists of one common share of the Company and one-half of a common share purchase warrant, with each whole warrant entitling the holder topurchase one additional common share of the Company at $1.10 for a period of 36 months.
Consideration received from the private placement financing is allocated to the share capital and the warrant reserve accounts using the relative fair value method. As prescribed by this method, theconsideration is allocated to the value of share capital and warrant reserve on a pro rata basis. The share capital was valued at the closing share price of the Company on the completion date of the privateplacement and the warrant reserve was valued using the Black-Scholes option pricing model.
The Company has a number of escrow agreements which arose from past transactions and the initial formation of the Company:
� There were a total of 7,332,273 common shares of the Company held in escrow under the Escrow Value Security Agreement dated March 30, 2015. Under this agreement, 10% of the shares werereleased immediately and 15% will be released every six months thereafter with the final release being on March 30, 2018. As at December 31, 2017, there were 1,099,842 common shares of theCompany in escrow (December 31, 2016 – 3,299,524).
� There were a total of 1,369,500 common shares of the Company held in escrow under the CPC Escrow Agreement dated August 2, 2005. On March 30, 2015, 10% of the common shares werereleased and 15% will be released every six months thereafter with the final release being March 30, 2018. As at December 31, 2017, there were 194,425 common shares of the Company inescrow (December 31, 2016 – 583,275).
21
FIRST MINING GOLD CORP.(formerly known as First Mining Finance Corp.) NOTES TO THE CONSOLIDATED FINANCIAL STATEMENTS (Expressed in Canadian dollars unless otherwise noted)
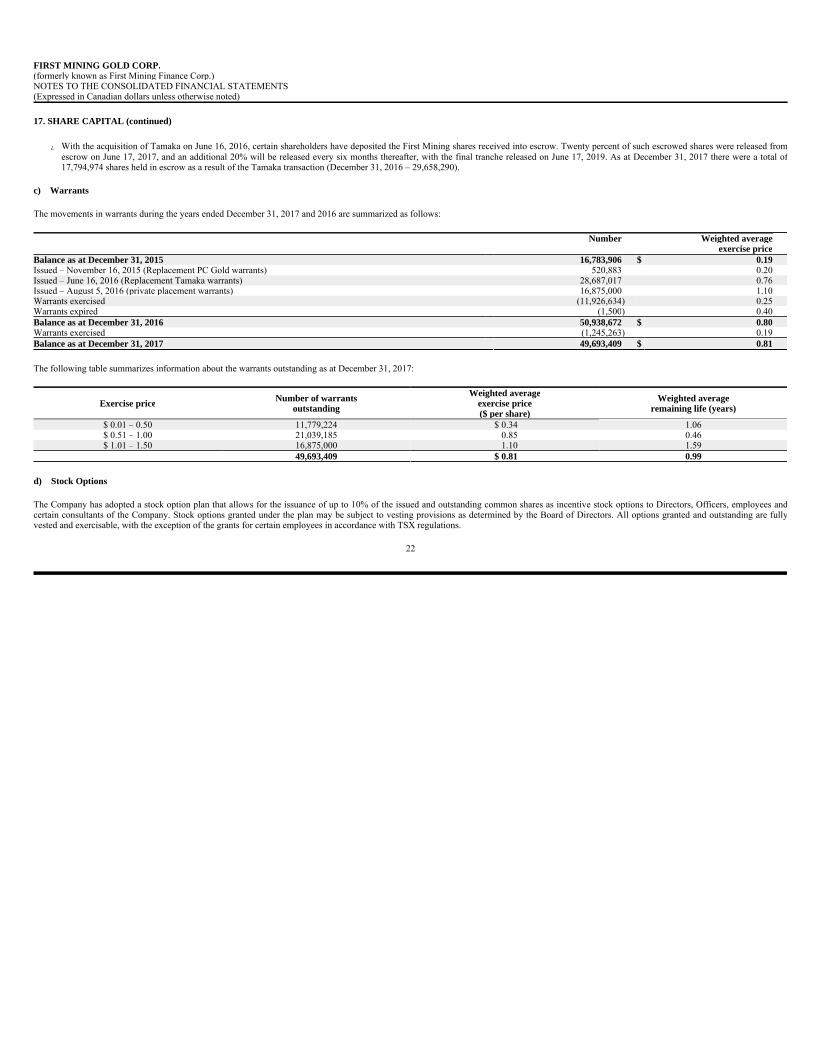
17. SHARE CAPITAL (continued)
� With the acquisition of Tamaka on June 16, 2016, certain shareholders have deposited the First Mining shares received into escrow. Twenty percent of such escrowed shares were released fromescrow on June 17, 2017, and an additional 20% will be released every six months thereafter, with the final tranche released on June 17, 2019. As at December 31, 2017 there were a total of17,794,974 shares held in escrow as a result of the Tamaka transaction (December 31, 2016 – 29,658,290).
c) Warrants
The movements in warrants during the years ended December 31, 2017 and 2016 are summarized as follows:
The following table summarizes information about the warrants outstanding as at December 31, 2017:
d) Stock Options
The Company has adopted a stock option plan that allows for the issuance of up to 10% of the issued and outstanding common shares as incentive stock options to Directors, Officers, employees andcertain consultants of the Company. Stock options granted under the plan may be subject to vesting provisions as determined by the Board of Directors. All options granted and outstanding are fullyvested and exercisable, with the exception of the grants for certain employees in accordance with TSX regulations.
22
FIRST MINING GOLD CORP.(formerly known as First Mining Finance Corp.) NOTES TO THE CONSOLIDATED FINANCIAL STATEMENTS (Expressed in Canadian dollars unless otherwise noted)
Number Weighted average exercise price
Balance as at December 31, 2015 16,783,906 $ 0.19Issued – November 16, 2015 (Replacement PC Gold warrants) 520,883 0.20 Issued – June 16, 2016 (Replacement Tamaka warrants) 28,687,017 0.76 Issued – August 5, 2016 (private placement warrants) 16,875,000 1.10 Warrants exercised (11,926,634) 0.25 Warrants expired (1,500) 0.40 Balance as at December 31, 2016 50,938,672 $ 0.80Warrants exercised (1,245,263) 0.19 Balance as at December 31, 2017 49,693,409 $ 0.81
Exercise priceNumber of warrants
outstanding
Weighted averageexercise price($ per share)
Weighted averageremaining life (years)
$ 0.01 – 0.50 11,779,224 $ 0.34 1.06 $ 0.51 – 1.00 21,039,185 0.85 0.46 $ 1.01 – 1.50 16,875,000 1.10 1.59
49,693,409 $ 0.81 0.99

17. SHARE CAPITAL (continued)
The movements in stock options during the years ended December 31, 2017 and 2016 are summarized as follows:
The following table summarizes information about the stock options outstanding as at December 31, 2017:
23
FIRST MINING GOLD CORP.(formerly known as First Mining Finance Corp.) NOTES TO THE CONSOLIDATED FINANCIAL STATEMENTS (Expressed in Canadian dollars unless otherwise noted)
Number Weighted averageexercise price
Balance as at December 31, 2015 13,616,504 $ 0.39Issued – April 8, 2016 (Replacement Clifton options) 4,150,000 0.95 Issued – June 16, 2016 10,770,000 0.75 Issued – June 16, 2016 (Replacement Tamaka options) 7,517,779 0.44 Issued – September 6, 2016 250,000 0.91 Issued – November 17, 2016 450,000 0.73 Issued – December 5, 2016 50,000 0.91 Options exercised (10,923,681 ) 0.32 Options expired (1,439,985) 0.89 Balance as at December 31, 2016 24,440,617 $ 0.67Issued – February 10, 2017 10,630,000 0.85 Issued – March 13, 2017 250,000 0.95 Issued – September 25, 2017 150,000 0.66 Issued – October 16, 2017 150,000 0.62 Options exercised (4,162,617) 0.43 Options expired (850,000) 1.65 Balance as at December 31, 2017 30,608,000 $ 0.74
Options Outstanding Options ExercisableWeighted Weighted
Weighted average Weighted averageExercise Number of average remaining Number of average remaining
price options exercise price life (Years) options exercise price life (years)($ per Share) ($ per share)
$ 0.01 – 0.50 6,208,000 $ 0.36 2.41 6,208,000 $ 0.36 2.41 $ 0.51 – 1.00 23,125,000 0.80 3.70 23,015,000 0.80 3.70 $ 1.01 – 1.50 1,075,000 1.32 0.27 1,075,000 1.32 0.27 $ 1.51 – 2.00 - - - - - -$ 2.01 – 2.50 200,000 2.50 0.27 200,000 2.50 0.27
30,608,00 $ 0.74 3.30 30,498,000 $ 0.74 3.29
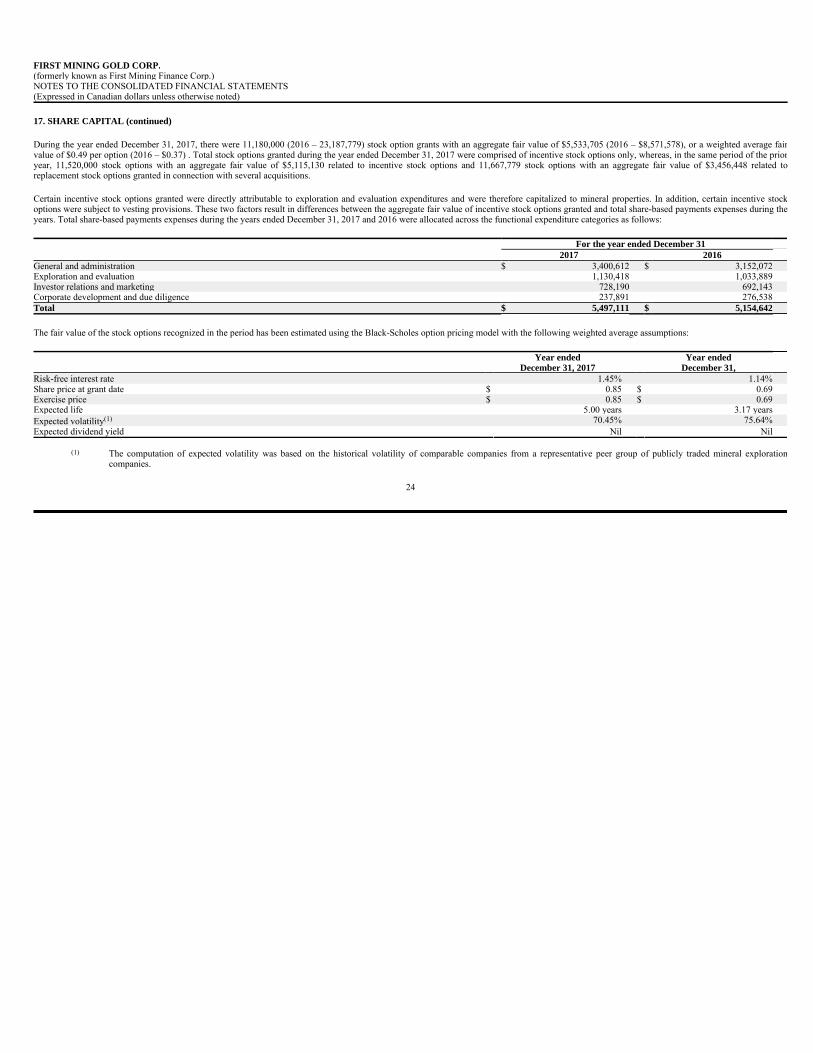
17. SHARE CAPITAL (continued)
During the year ended December 31, 2017, there were 11,180,000 (2016 – 23,187,779) stock option grants with an aggregate fair value of $5,533,705 (2016 – $8,571,578), or a weighted average fairvalue of $0.49 per option (2016 – $0.37) . Total stock options granted during the year ended December 31, 2017 were comprised of incentive stock options only, whereas, in the same period of the prioryear, 11,520,000 stock options with an aggregate fair value of $5,115,130 related to incentive stock options and 11,667,779 stock options with an aggregate fair value of $3,456,448 related toreplacement stock options granted in connection with several acquisitions.
Certain incentive stock options granted were directly attributable to exploration and evaluation expenditures and were therefore capitalized to mineral properties. In addition, certain incentive stockoptions were subject to vesting provisions. These two factors result in differences between the aggregate fair value of incentive stock options granted and total share-based payments expenses during theyears. Total share-based payments expenses during the years ended December 31, 2017 and 2016 were allocated across the functional expenditure categories as follows:
The fair value of the stock options recognized in the period has been estimated using the Black-Scholes option pricing model with the following weighted average assumptions:
24
FIRST MINING GOLD CORP.(formerly known as First Mining Finance Corp.) NOTES TO THE CONSOLIDATED FINANCIAL STATEMENTS (Expressed in Canadian dollars unless otherwise noted)
For the year ended December 31 2017 2016
General and administration $ 3,400,612 $ 3,152,072 Exploration and evaluation 1,130,418 1,033,889 Investor relations and marketing 728,190 692,143 Corporate development and due diligence 237,891 276,538 Total $ 5,497,111 $ 5,154,642
Year ended Year ended December 31, 2017 December 31,
Risk-free interest rate 1.45% 1.14% Share price at grant date $ 0.85 $ 0.69 Exercise price $ 0.85 $ 0.69 Expected life 5.00 years 3.17 years Expected volatility(1) 70.45% 75.64% Expected dividend yield Nil Nil
(1) The computation of expected volatility was based on the historical volatility of comparable companies from a representative peer group of publicly traded mineral explorationcompanies.
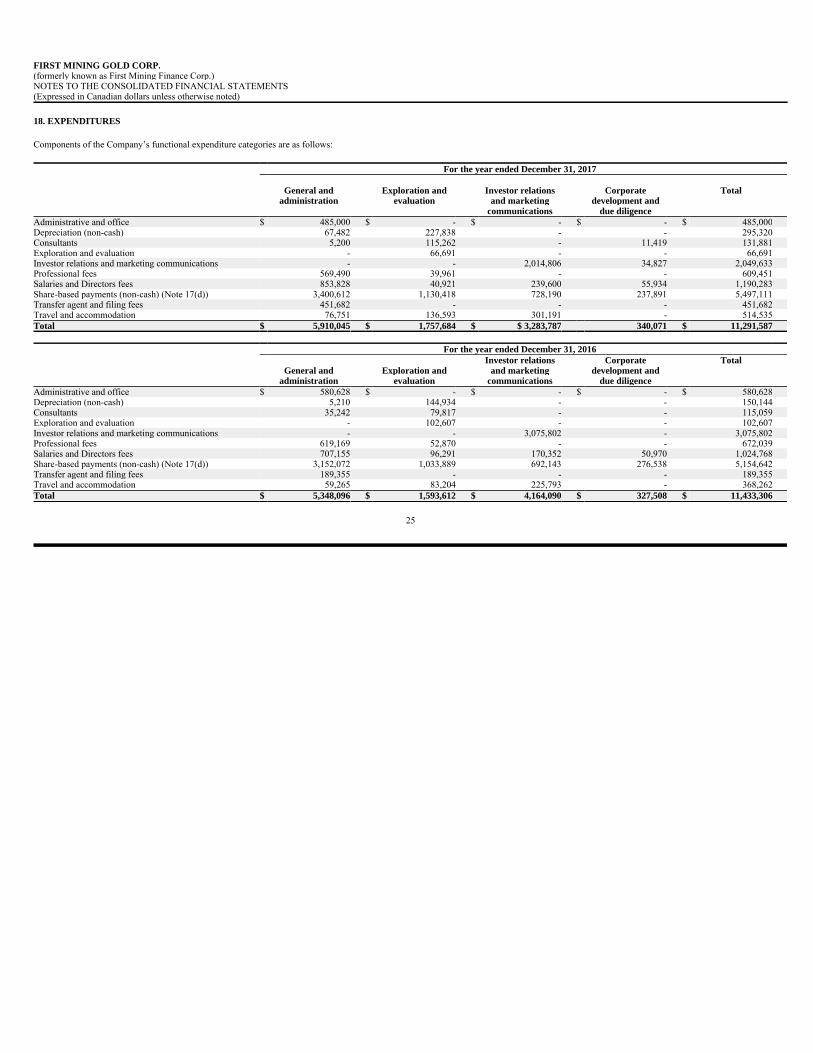
18. EXPENDITURES
Components of the Company’s functional expenditure categories are as follows:
25
FIRST MINING GOLD CORP.(formerly known as First Mining Finance Corp.) NOTES TO THE CONSOLIDATED FINANCIAL STATEMENTS (Expressed in Canadian dollars unless otherwise noted)
For the year ended December 31, 2017
General and Exploration and Investor relations Corporate Total administration evaluation and marketing development and
communications due diligence Administrative and office $ 485,000 $ - $ - $ - $ 485,000Depreciation (non-cash) 67,482 227,838 - - 295,320 Consultants 5,200 115,262 - 11,419 131,881 Exploration and evaluation - 66,691 - - 66,691 Investor relations and marketing communications - - 2,014,806 34,827 2,049,633 Professional fees 569,490 39,961 - - 609,451 Salaries and Directors fees 853,828 40,921 239,600 55,934 1,190,283 Share-based payments (non-cash) (Note 17(d)) 3,400,612 1,130,418 728,190 237,891 5,497,111 Transfer agent and filing fees 451,682 - - - 451,682 Travel and accommodation 76,751 136,593 301,191 - 514,535 Total $ 5,910,045 $ 1,757,684 $ $ 3,283,787 340,071 $ 11,291,587
For the year ended December 31, 2016 Investor relations Corporate Total
General and Exploration and and marketing development and administration evaluation communications due diligence
Administrative and office $ 580,628 $ - $ - $ - $ 580,628Depreciation (non-cash) 5,210 144,934 - - 150,144 Consultants 35,242 79,817 - - 115,059 Exploration and evaluation - 102,607 - - 102,607 Investor relations and marketing communications - - 3,075,802 - 3,075,802 Professional fees 619,169 52,870 - - 672,039 Salaries and Directors fees 707,155 96,291 170,352 50,970 1,024,768 Share-based payments (non-cash) (Note 17(d)) 3,152,072 1,033,889 692,143 276,538 5,154,642 Transfer agent and filing fees 189,355 - - - 189,355 Travel and accommodation 59,265 83,204 225,793 - 368,262 Total $ 5,348,096 $ 1,593,612 $ 4,164,090 $ 327,508 $ 11,433,306
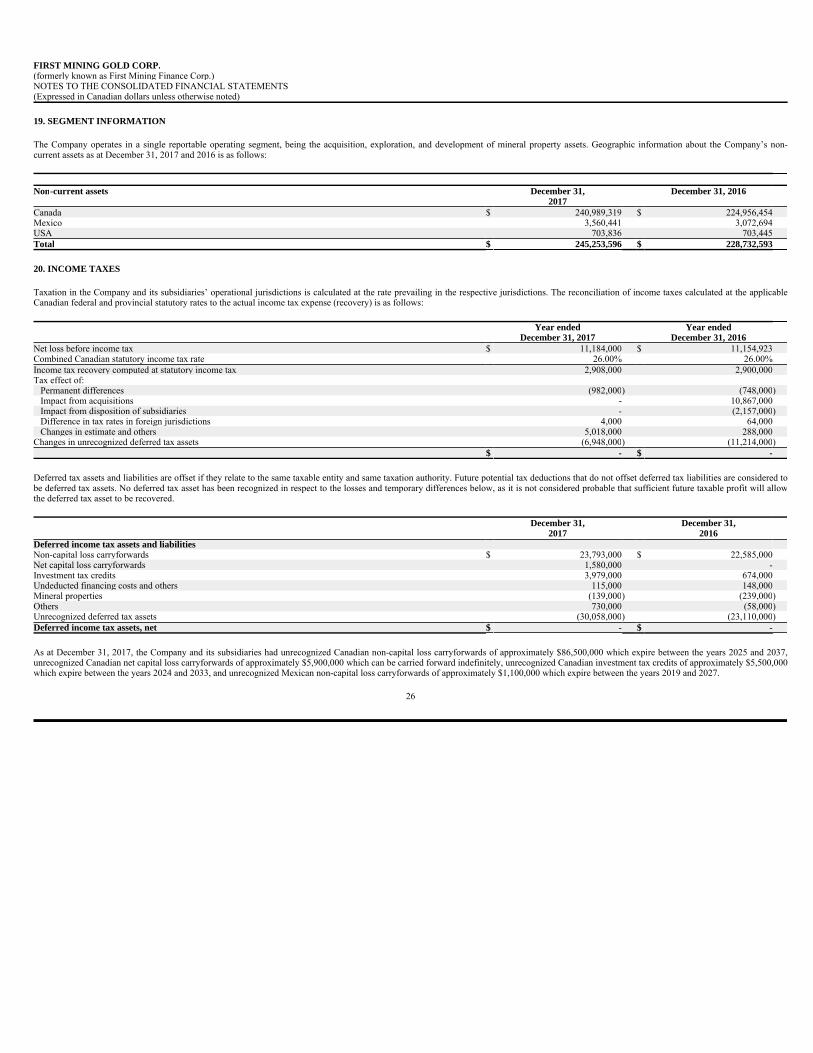
19. SEGMENT INFORMATION
The Company operates in a single reportable operating segment, being the acquisition, exploration, and development of mineral property assets. Geographic information about the Company’s non-current assets as at December 31, 2017 and 2016 is as follows:
20. INCOME TAXES
Taxation in the Company and its subsidiaries’ operational jurisdictions is calculated at the rate prevailing in the respective jurisdictions. The reconciliation of income taxes calculated at the applicableCanadian federal and provincial statutory rates to the actual income tax expense (recovery) is as follows:
Deferred tax assets and liabilities are offset if they relate to the same taxable entity and same taxation authority. Future potential tax deductions that do not offset deferred tax liabilities are considered tobe deferred tax assets. No deferred tax asset has been recognized in respect to the losses and temporary differences below, as it is not considered probable that sufficient future taxable profit will allowthe deferred tax asset to be recovered.
As at December 31, 2017, the Company and its subsidiaries had unrecognized Canadian non-capital loss carryforwards of approximately $86,500,000 which expire between the years 2025 and 2037,unrecognized Canadian net capital loss carryforwards of approximately $5,900,000 which can be carried forward indefinitely, unrecognized Canadian investment tax credits of approximately $5,500,000which expire between the years 2024 and 2033, and unrecognized Mexican non-capital loss carryforwards of approximately $1,100,000 which expire between the years 2019 and 2027.
26
FIRST MINING GOLD CORP.(formerly known as First Mining Finance Corp.) NOTES TO THE CONSOLIDATED FINANCIAL STATEMENTS (Expressed in Canadian dollars unless otherwise noted)
Non-current assets December 31, December 31, 20162017
Canada $ 240,989,319 $ 224,956,454 Mexico 3,560,441 3,072,694 USA 703,836 703,445 Total $ 245,253,596 $ 228,732,593
Year ended Year endedDecember 31, 2017 December 31, 2016
Net loss before income tax $ 11,184,000 $ 11,154,923 Combined Canadian statutory income tax rate 26.00% 26.00% Income tax recovery computed at statutory income tax 2,908,000 2,900,000 Tax effect of: Permanent differences (982,000) (748,000) Impact from acquisitions - 10,867,000 Impact from disposition of subsidiaries - (2,157,000) Difference in tax rates in foreign jurisdictions 4,000 64,000 Changes in estimate and others 5,018,000 288,000 Changes in unrecognized deferred tax assets (6,948,000) (11,214,000)
$ - $ -
December 31, December 31,2017 2016
Deferred income tax assets and liabilitiesNon-capital loss carryforwards $ 23,793,000 $ 22,585,000 Net capital loss carryforwards 1,580,000 -Investment tax credits 3,979,000 674,000 Undeducted financing costs and others 115,000 148,000 Mineral properties (139,000) (239,000) Others 730,000 (58,000) Unrecognized deferred tax assets (30,058,000) (23,110,000) Deferred income tax assets, net $ - $ -
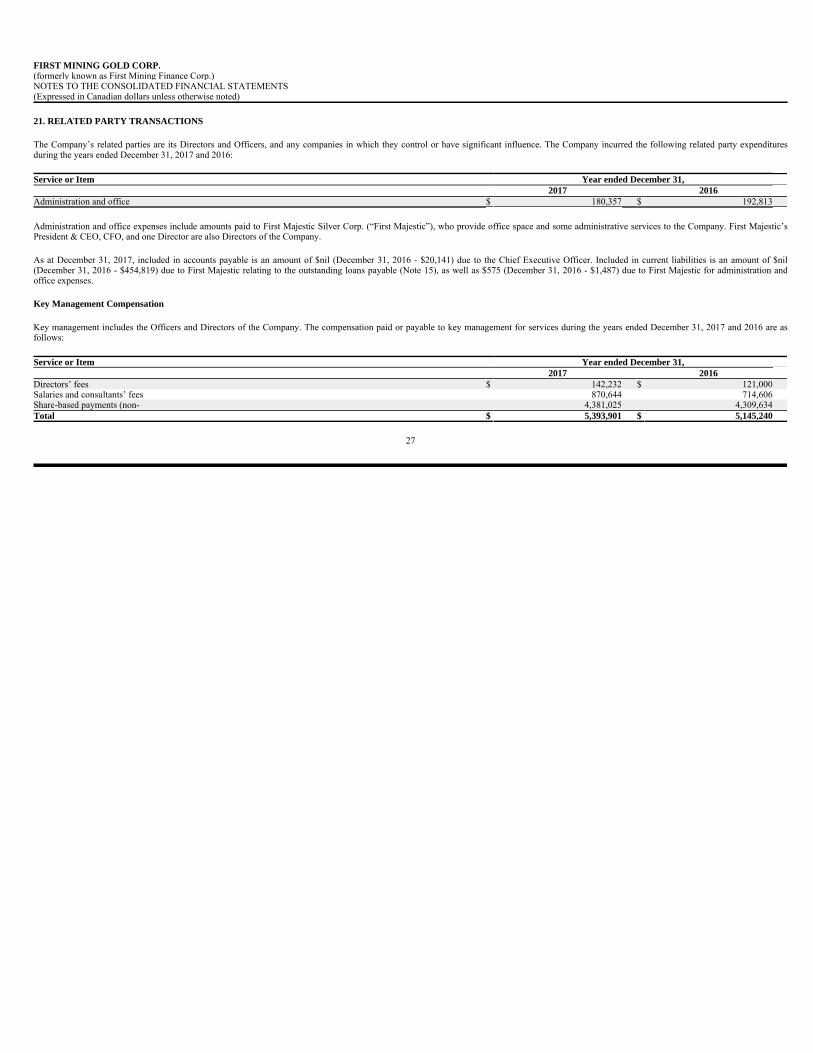
21. RELATED PARTY TRANSACTIONS
The Company’s related parties are its Directors and Officers, and any companies in which they control or have significant influence. The Company incurred the following related party expendituresduring the years ended December 31, 2017 and 2016:
Administration and office expenses include amounts paid to First Majestic Silver Corp. (“First Majestic”), who provide office space and some administrative services to the Company. First Majestic’sPresident & CEO, CFO, and one Director are also Directors of the Company.
As at December 31, 2017, included in accounts payable is an amount of $nil (December 31, 2016 - $20,141) due to the Chief Executive Officer. Included in current liabilities is an amount of $nil(December 31, 2016 - $454,819) due to First Majestic relating to the outstanding loans payable (Note 15), as well as $575 (December 31, 2016 - $1,487) due to First Majestic for administration andoffice expenses.
Key Management Compensation
Key management includes the Officers and Directors of the Company. The compensation paid or payable to key management for services during the years ended December 31, 2017 and 2016 are asfollows:
27
FIRST MINING GOLD CORP.(formerly known as First Mining Finance Corp.) NOTES TO THE CONSOLIDATED FINANCIAL STATEMENTS (Expressed in Canadian dollars unless otherwise noted)
Service or Item Year ended December 31,2017 2016
Administration and office $ 180,357 $ 192,813
Service or Item Year ended December 31,2017 2016
Directors’ fees $ 142,232 $ 121,000 Salaries and consultants’ fees 870,644 714,606 Share-based payments (non- 4,381,025 4,309,634 Total $ 5,393,901 $ 5,145,240
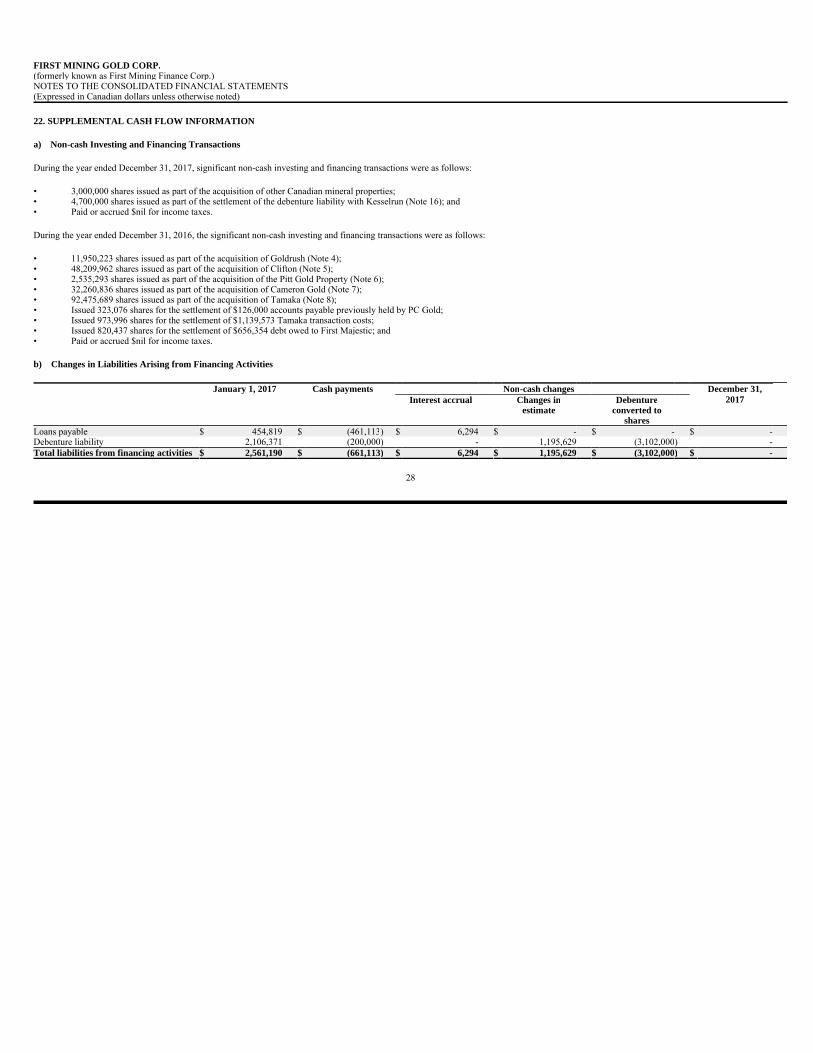
22. SUPPLEMENTAL CASH FLOW INFORMATION
a) Non-cash Investing and Financing Transactions
During the year ended December 31, 2017, significant non-cash investing and financing transactions were as follows:
During the year ended December 31, 2016, the significant non-cash investing and financing transactions were as follows:
b) Changes in Liabilities Arising from Financing Activities
28
FIRST MINING GOLD CORP.(formerly known as First Mining Finance Corp.) NOTES TO THE CONSOLIDATED FINANCIAL STATEMENTS (Expressed in Canadian dollars unless otherwise noted)
• 3,000,000 shares issued as part of the acquisition of other Canadian mineral properties; • 4,700,000 shares issued as part of the settlement of the debenture liability with Kesselrun (Note 16); and • Paid or accrued $nil for income taxes.
• 11,950,223 shares issued as part of the acquisition of Goldrush (Note 4); • 48,209,962 shares issued as part of the acquisition of Clifton (Note 5); • 2,535,293 shares issued as part of the acquisition of the Pitt Gold Property (Note 6); • 32,260,836 shares issued as part of the acquisition of Cameron Gold (Note 7); • 92,475,689 shares issued as part of the acquisition of Tamaka (Note 8); • Issued 323,076 shares for the settlement of $126,000 accounts payable previously held by PC Gold; • Issued 973,996 shares for the settlement of $1,139,573 Tamaka transaction costs; • Issued 820,437 shares for the settlement of $656,354 debt owed to First Majestic; and • Paid or accrued $nil for income taxes.
January 1, 2017 Cash payments Non-cash changes December 31, Interest accrual Changes in Debenture 2017
estimate converted toshares
Loans payable $ 454,819 $ (461,113) $ 6,294 $ - $ - $ -Debenture liability 2,106,371 (200,000) - 1,195,629 (3,102,000) -Total liabilities from financing activities $ 2,561,190 $ (661,113) $ 6,294 $ 1,195,629 $ (3,102,000) $ -
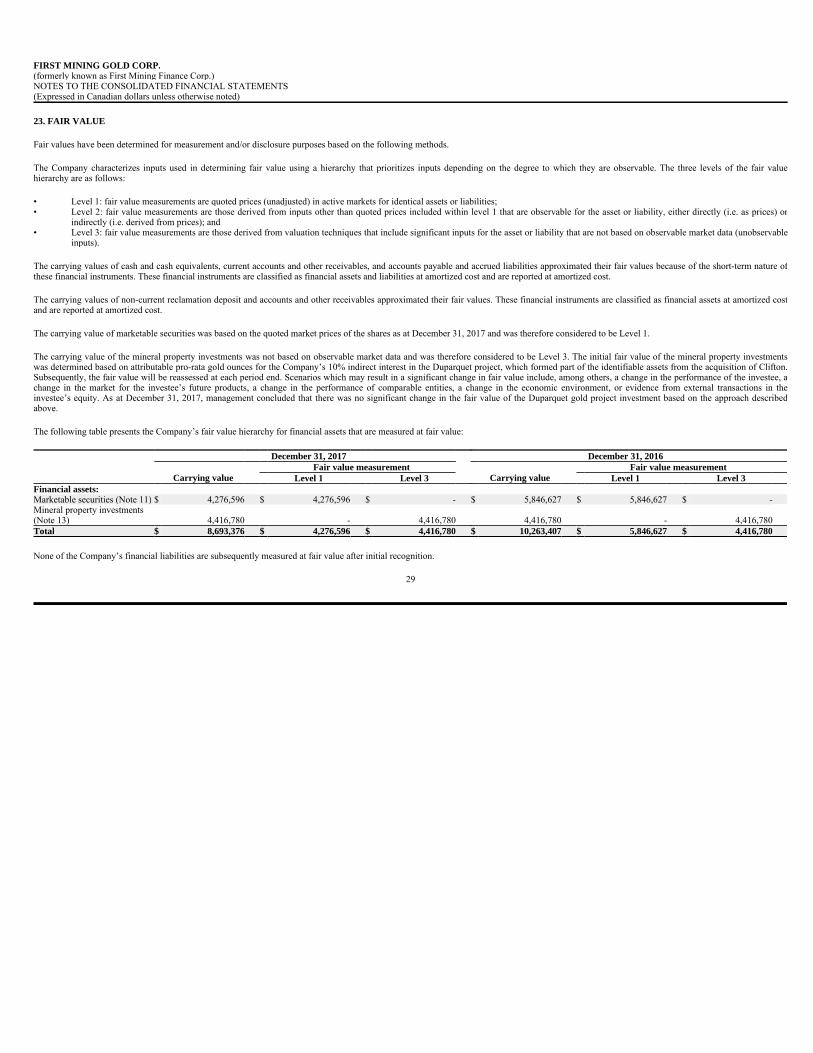
23. FAIR VALUE
Fair values have been determined for measurement and/or disclosure purposes based on the following methods.
The Company characterizes inputs used in determining fair value using a hierarchy that prioritizes inputs depending on the degree to which they are observable. The three levels of the fair valuehierarchy are as follows:
The carrying values of cash and cash equivalents, current accounts and other receivables, and accounts payable and accrued liabilities approximated their fair values because of the short-term nature ofthese financial instruments. These financial instruments are classified as financial assets and liabilities at amortized cost and are reported at amortized cost.
The carrying values of non-current reclamation deposit and accounts and other receivables approximated their fair values. These financial instruments are classified as financial assets at amortized costand are reported at amortized cost.
The carrying value of marketable securities was based on the quoted market prices of the shares as at December 31, 2017 and was therefore considered to be Level 1.
The carrying value of the mineral property investments was not based on observable market data and was therefore considered to be Level 3. The initial fair value of the mineral property investmentswas determined based on attributable pro-rata gold ounces for the Company’s 10% indirect interest in the Duparquet project, which formed part of the identifiable assets from the acquisition of Clifton.Subsequently, the fair value will be reassessed at each period end. Scenarios which may result in a significant change in fair value include, among others, a change in the performance of the investee, achange in the market for the investee’s future products, a change in the performance of comparable entities, a change in the economic environment, or evidence from external transactions in theinvestee’s equity. As at December 31, 2017, management concluded that there was no significant change in the fair value of the Duparquet gold project investment based on the approach describedabove.
The following table presents the Company’s fair value hierarchy for financial assets that are measured at fair value:
None of the Company’s financial liabilities are subsequently measured at fair value after initial recognition.
29
FIRST MINING GOLD CORP.(formerly known as First Mining Finance Corp.) NOTES TO THE CONSOLIDATED FINANCIAL STATEMENTS (Expressed in Canadian dollars unless otherwise noted)
• Level 1: fair value measurements are quoted prices (unadjusted) in active markets for identical assets or liabilities; • Level 2: fair value measurements are those derived from inputs other than quoted prices included within level 1 that are observable for the asset or liability, either directly (i.e. as prices) or
indirectly (i.e. derived from prices); and • Level 3: fair value measurements are those derived from valuation techniques that include significant inputs for the asset or liability that are not based on observable market data (unobservable
inputs).
December 31, 2017 December 31, 2016Fair value measurement Fair value measurement
Carrying value Level 1 Level 3 Carrying value Level 1 Level 3Financial assets:Marketable securities (Note 11) $ 4,276,596 $ 4,276,596 $ - $ 5,846,627 $ 5,846,627 $ -Mineral property investments (Note 13) 4,416,780 - 4,416,780 4,416,780 - 4,416,780 Total $ 8,693,376 $ 4,276,596 $ 4,416,780 $ 10,263,407 $ 5,846,627 $ 4,416,780
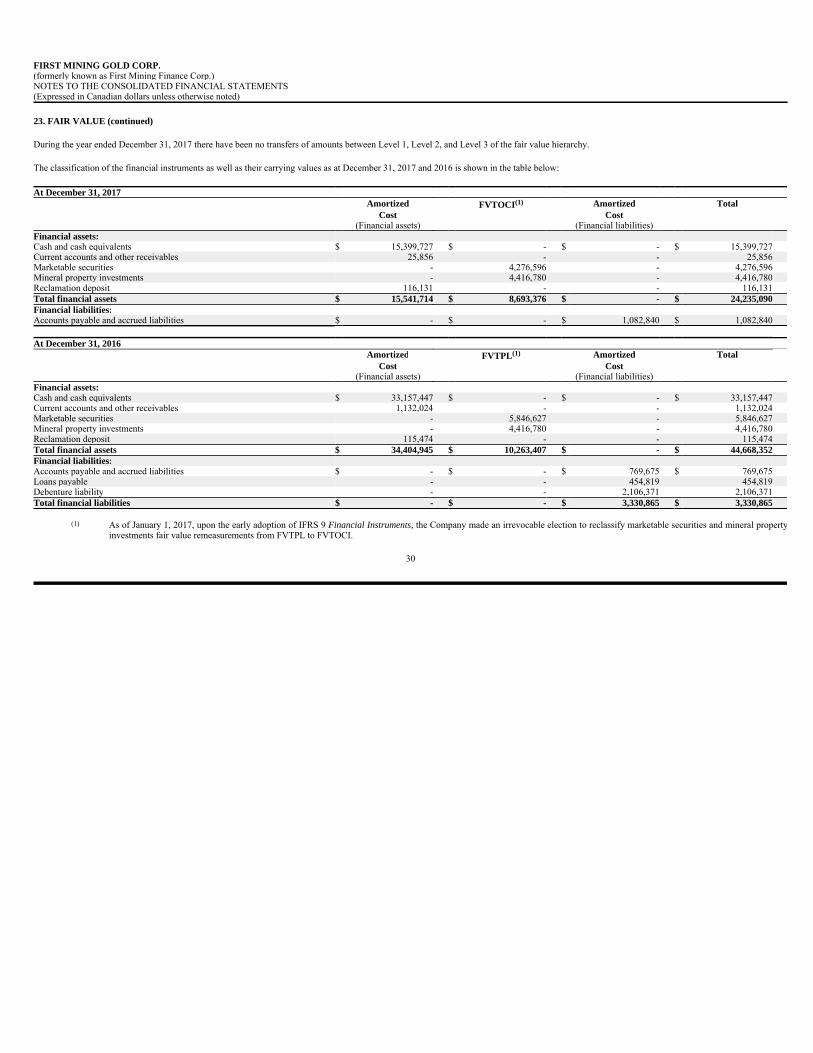
23. FAIR VALUE (continued)
During the year ended December 31, 2017 there have been no transfers of amounts between Level 1, Level 2, and Level 3 of the fair value hierarchy.
The classification of the financial instruments as well as their carrying values as at December 31, 2017 and 2016 is shown in the table below:
30
FIRST MINING GOLD CORP.(formerly known as First Mining Finance Corp.) NOTES TO THE CONSOLIDATED FINANCIAL STATEMENTS (Expressed in Canadian dollars unless otherwise noted)
At December 31, 2017Amortized FVTOCI(1) Amortized Total
Cost Cost(Financial assets) (Financial liabilities)
Financial assets:Cash and cash equivalents $ 15,399,727 $ - $ - $ 15,399,727 Current accounts and other receivables 25,856 - - 25,856 Marketable securities - 4,276,596 - 4,276,596 Mineral property investments - 4,416,780 - 4,416,780 Reclamation deposit 116,131 - - 116,131 Total financial assets $ 15,541,714 $ 8,693,376 $ - $ 24,235,090Financial liabilities:Accounts payable and accrued liabilities $ - $ - $ 1,082,840 $ 1,082,840
At December 31, 2016Amortized FVTPL(1) Amortized Total
Cost Cost(Financial assets) (Financial liabilities)
Financial assets:Cash and cash equivalents $ 33,157,447 $ - $ - $ 33,157,447 Current accounts and other receivables 1,132,024 - - 1,132,024 Marketable securities - 5,846,627 - 5,846,627 Mineral property investments - 4,416,780 - 4,416,780 Reclamation deposit 115,474 - - 115,474 Total financial assets $ 34,404,945 $ 10,263,407 $ - $ 44,668,352Financial liabilities:Accounts payable and accrued liabilities $ - $ - $ 769,675 $ 769,675 Loans payable - - 454,819 454,819 Debenture liability - - 2,106,371 2,106,371 Total financial liabilities $ - $ - $ 3,330,865 $ 3,330,865
(1) As of January 1, 2017, upon the early adoption of IFRS 9 Financial Instruments, the Company made an irrevocable election to reclassify marketable securities and mineral propertyinvestments fair value remeasurements from FVTPL to FVTOCI.
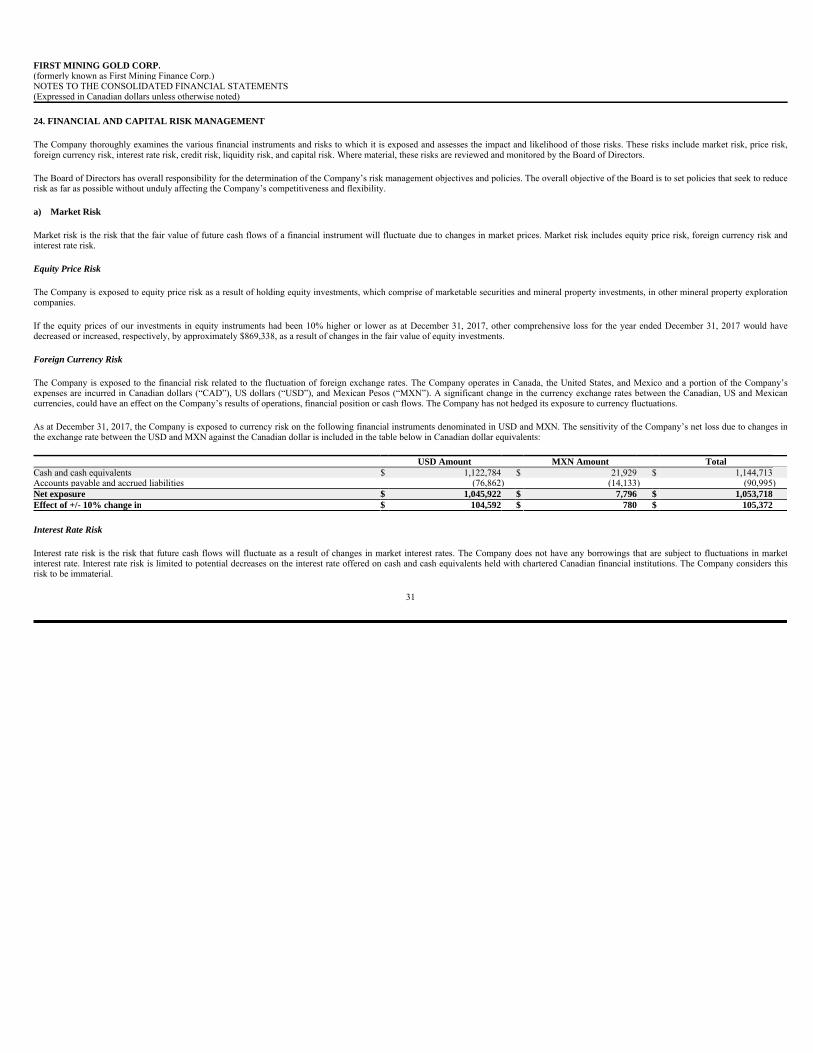
24. FINANCIAL AND CAPITAL RISK MANAGEMENT
The Company thoroughly examines the various financial instruments and risks to which it is exposed and assesses the impact and likelihood of those risks. These risks include market risk, price risk,foreign currency risk, interest rate risk, credit risk, liquidity risk, and capital risk. Where material, these risks are reviewed and monitored by the Board of Directors.
The Board of Directors has overall responsibility for the determination of the Company’s risk management objectives and policies. The overall objective of the Board is to set policies that seek to reducerisk as far as possible without unduly affecting the Company’s competitiveness and flexibility.
a) Market Risk
Market risk is the risk that the fair value of future cash flows of a financial instrument will fluctuate due to changes in market prices. Market risk includes equity price risk, foreign currency risk andinterest rate risk.
Equity Price Risk
The Company is exposed to equity price risk as a result of holding equity investments, which comprise of marketable securities and mineral property investments, in other mineral property explorationcompanies.
If the equity prices of our investments in equity instruments had been 10% higher or lower as at December 31, 2017, other comprehensive loss for the year ended December 31, 2017 would havedecreased or increased, respectively, by approximately $869,338, as a result of changes in the fair value of equity investments.
Foreign Currency Risk
The Company is exposed to the financial risk related to the fluctuation of foreign exchange rates. The Company operates in Canada, the United States, and Mexico and a portion of the Company’sexpenses are incurred in Canadian dollars (“CAD”), US dollars (“USD”), and Mexican Pesos (“MXN”). A significant change in the currency exchange rates between the Canadian, US and Mexicancurrencies, could have an effect on the Company’s results of operations, financial position or cash flows. The Company has not hedged its exposure to currency fluctuations.
As at December 31, 2017, the Company is exposed to currency risk on the following financial instruments denominated in USD and MXN. The sensitivity of the Company’s net loss due to changes inthe exchange rate between the USD and MXN against the Canadian dollar is included in the table below in Canadian dollar equivalents:
Interest Rate Risk
Interest rate risk is the risk that future cash flows will fluctuate as a result of changes in market interest rates. The Company does not have any borrowings that are subject to fluctuations in marketinterest rate. Interest rate risk is limited to potential decreases on the interest rate offered on cash and cash equivalents held with chartered Canadian financial institutions. The Company considers thisrisk to be immaterial.
31
FIRST MINING GOLD CORP.(formerly known as First Mining Finance Corp.) NOTES TO THE CONSOLIDATED FINANCIAL STATEMENTS (Expressed in Canadian dollars unless otherwise noted)
USD Amount MXN Amount TotalCash and cash equivalents $ 1,122,784 $ 21,929 $ 1,144,713 Accounts payable and accrued liabilities (76,862) (14,133) (90,995) Net exposure $ 1,045,922 $ 7,796 $ 1,053,718Effect of +/- 10% change in $ 104,592 $ 780 $ 105,372
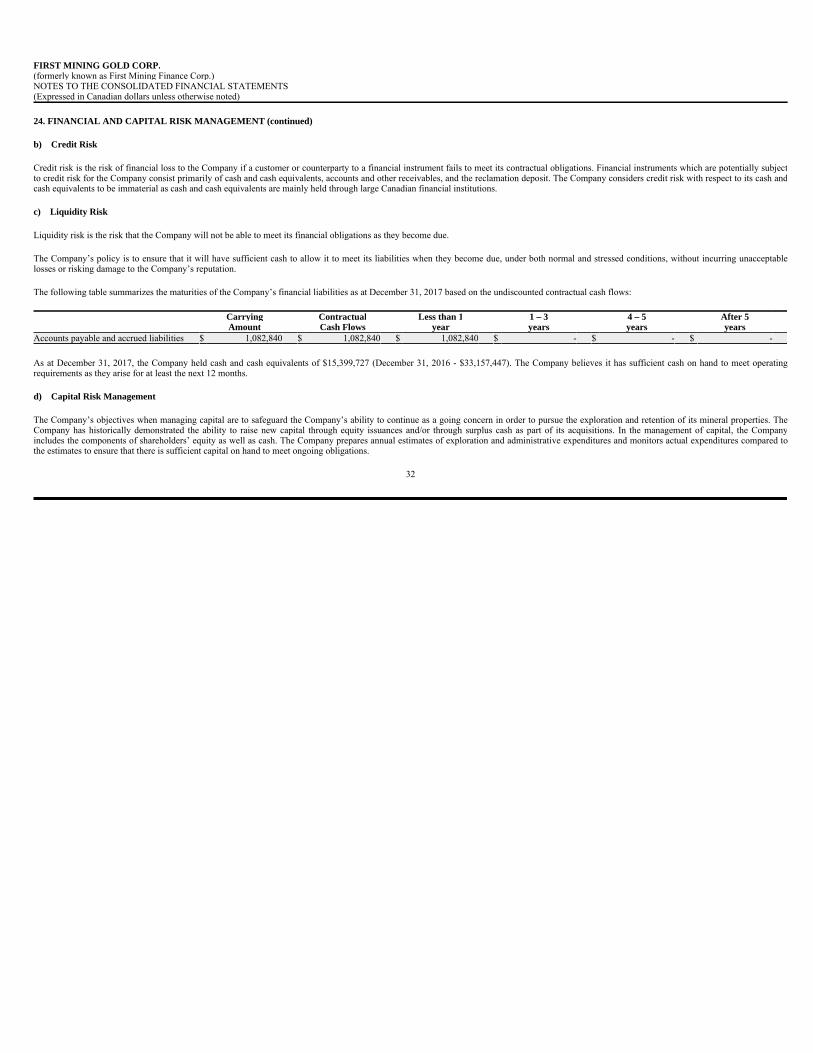
24. FINANCIAL AND CAPITAL RISK MANAGEMENT (continued)
b) Credit Risk
Credit risk is the risk of financial loss to the Company if a customer or counterparty to a financial instrument fails to meet its contractual obligations. Financial instruments which are potentially subjectto credit risk for the Company consist primarily of cash and cash equivalents, accounts and other receivables, and the reclamation deposit. The Company considers credit risk with respect to its cash andcash equivalents to be immaterial as cash and cash equivalents are mainly held through large Canadian financial institutions.
c) Liquidity Risk
Liquidity risk is the risk that the Company will not be able to meet its financial obligations as they become due.
The Company’s policy is to ensure that it will have sufficient cash to allow it to meet its liabilities when they become due, under both normal and stressed conditions, without incurring unacceptablelosses or risking damage to the Company’s reputation.
The following table summarizes the maturities of the Company’s financial liabilities as at December 31, 2017 based on the undiscounted contractual cash flows:
As at December 31, 2017, the Company held cash and cash equivalents of $15,399,727 (December 31, 2016 - $33,157,447). The Company believes it has sufficient cash on hand to meet operatingrequirements as they arise for at least the next 12 months.
d) Capital Risk Management
The Company’s objectives when managing capital are to safeguard the Company’s ability to continue as a going concern in order to pursue the exploration and retention of its mineral properties. TheCompany has historically demonstrated the ability to raise new capital through equity issuances and/or through surplus cash as part of its acquisitions. In the management of capital, the Companyincludes the components of shareholders’ equity as well as cash. The Company prepares annual estimates of exploration and administrative expenditures and monitors actual expenditures compared tothe estimates to ensure that there is sufficient capital on hand to meet ongoing obligations.
32
FIRST MINING GOLD CORP.(formerly known as First Mining Finance Corp.) NOTES TO THE CONSOLIDATED FINANCIAL STATEMENTS (Expressed in Canadian dollars unless otherwise noted)
Carrying Contractual Less than 1 1 – 3 4 – 5 After 5Amount Cash Flows year years years years
Accounts payable and accrued liabilities $ 1,082,840 $ 1,082,840 $ 1,082,840 $ - $ - $ -
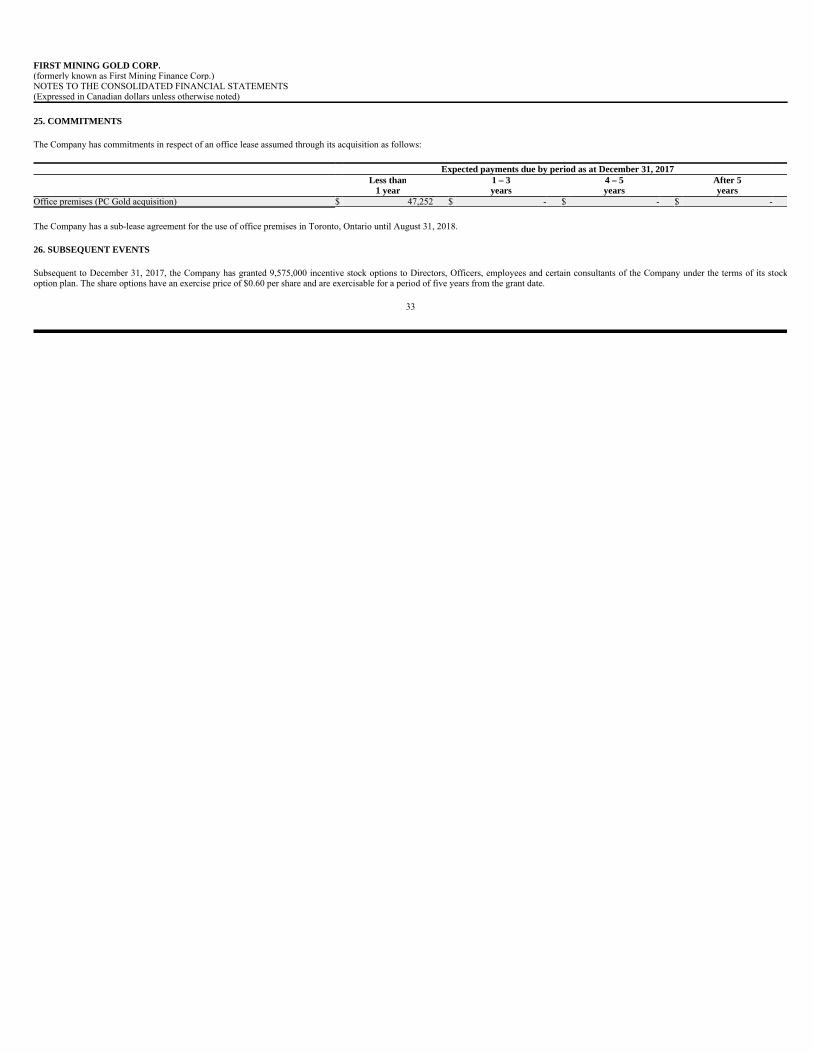
25. COMMITMENTS
The Company has commitments in respect of an office lease assumed through its acquisition as follows:
The Company has a sub-lease agreement for the use of office premises in Toronto, Ontario until August 31, 2018.
26. SUBSEQUENT EVENTS
Subsequent to December 31, 2017, the Company has granted 9,575,000 incentive stock options to Directors, Officers, employees and certain consultants of the Company under the terms of its stockoption plan. The share options have an exercise price of $0.60 per share and are exercisable for a period of five years from the grant date.
33
FIRST MINING GOLD CORP.(formerly known as First Mining Finance Corp.) NOTES TO THE CONSOLIDATED FINANCIAL STATEMENTS (Expressed in Canadian dollars unless otherwise noted)
Expected payments due by period as at December 31, 2017Less than 1 – 3 4 – 5 After 5
1 year years years yearsOffice premises (PC Gold acquisition) $ 47,252 $ - $ - $ -
FIRST MINING GOLD CORP. (formerly known as First Mining Finance Corp.)
MANAGEMENT’S DISCUSSION AND ANALYSIS FOR THE YEAR ENDED DECEMBER 31, 2017
GENERAL
This Management’s Discussion and Analysis (“MD&A”) should be read in conjunction with the audited consolidated financial statements of First Mining Gold Corp. (the “Company” or “FirstMining”) for the years ended December 31, 2017 and 2016, which are prepared in accordance with International Financial Reporting Standards (“IFRS”). These documents along with additionalinformation on the Company, including the Company’s Annual Information Form for the year ended December 31, 2017, are available on SEDAR at www.sedar.com, on EDGAR at www.sec.gov., andon the Company’s website at www.firstmininggold.com.
In this MD&A, unless the context otherwise requires, references to the “Company”, “First Mining”, “we”, us”, and “our” refer to First Mining Gold Corp. and its subsidiaries.
All dollar amounts included in this MD&A are expressed in Canadian dollars unless otherwise noted. This MD&A is dated as of March 22, 2018 and all information contained in this MD&A is currentas of March 21, 2018.
FORWARD LOOKING INFORMATION
This MD&A is based on a review of the Company’s operations, financial position and plans for the future based on facts and circumstances as of December 31, 2017. Except for historical information orstatements of fact relating to the Company, this MD&A contains “forward-looking statements” within the meaning of applicable Canadian securities regulations (collectively, “forward-lookingstatements”). Any statements that express or involve discussions with respect to predictions, expectations, beliefs, plans, projections, objectives, assumptions or future events or performance (often, butnot always, using words or phrases such as “seek”, “anticipate”, “plan”, “continue”, “estimate”, “expect”, “may”, “will”, “project”, “predict”, “forecast”, “potential”, “targeting”, “intend”, “could”,“might”, “should”, “believe” and similar expressions) are not statements of historical fact and may be “forward-looking statements”. These statements relate to future events or the Company’s futureperformance, business prospects or opportunities. Forward-looking statements include, but are not limited to: statements regarding future acquisitions of mineral properties; statements regarding theCompany’s ability to retain professionals with the necessary specialized skills and knowledge; statements regarding the Company’s intentions and expectations regarding exploration at any of its mineralproperties; forecasts relating to mining, development and other activities at the Company’s operations; forecasts relating to market developments and trends in global supply and demand for gold; futurework on the Company’s non-material properties; and the Company’s mineral reserve and mineral resource estimates.
There can be no assurance that such statements will prove to be accurate, and future events and actual results could differ materially from those anticipated in such statements. Important factors thatcould cause actual results to differ materially from the Company’s expectations as disclosed in the Company’s continuous disclosure documents filed from time to time via SEDAR with the Canadiansecurities regulators to whose policies the Company is bound. Forward-looking statements are based on the estimates and opinions of management on the date the statements are made, and the Companydoes not undertake any obligation to update forward-looking statements should conditions or our estimates or opinions change, except as required by applicable laws. Actual results may differ materiallyfrom those expressed or implied by such forward-looking statements. These statements involve known and unknown risks, uncertainties, and other factors that may cause the Company’s actual results,levels of activity, performance or achievements to be materially different from any future results, levels of activity, performance or achievement expressed or implied by these forward-lookingstatements.
Page 1
The Company believes that the expectations reflected in any such forward-looking statements are reasonable, but no assurance can be given that these expectations will prove to be correct and suchforward-looking statements included herein this MD&A should not be unduly relied upon.
CAUTIONARY NOTE TO U.S. INVESTORS REGARDING MINERAL RESOURCE AND MINERAL RESERVE ESTIMATES
This MD&A has been prepared in accordance with the requirements of Canadian securities laws, which differ in certain material respects from the disclosure requirements of United States securitieslaws. The terms “mineral reserve”, “proven mineral reserve” and “probable mineral reserve” are Canadian mining terms as defined in accordance with National Instrument 43-101 Standards ofDisclosure for Mineral Projects (“NI 43-101”) and the Canadian Institute of Mining, Metallurgy and Petroleum (“CIM”) 2014 Definition Standards on Mineral Resources and Mineral Reserves,adopted by the CIM Council, as amended. These definitions differ from the definitions in the disclosure requirements promulgated by the United States Securities and Exchange Commission (the“SEC”) and contained in SEC Industry Guide 7 (“Industry Guide 7”). Under Industry Guide 7 standards, a “final” or “bankable” feasibility study is required to report mineral reserves, the three-yearhistorical average price is used in any mineral reserve or cash flow analysis to designate mineral reserves and the primary environmental analysis or report must be filed with the appropriategovernmental authority.
In addition, the terms “mineral resource”, “measured mineral resource”, “indicated mineral resource” and “inferred mineral resource” are defined under the 2014 CIM definition standards, andare required to be disclosed by NI 43-101. However, these terms are not defined under Industry Guide 7 and are not permitted to be used in reports and registration statements of United States companiesfiled with the SEC. Investors are cautioned not to assume that any part or all of the mineral deposits in these categories will ever be converted into mineral reserves. “Inferred mineral resources” have agreat amount of uncertainty as to their existence, and great uncertainty as to their economic and legal feasibility. It cannot be assumed that all or any part of an inferred mineral resource will ever beupgraded to a higher category. Under Canadian rules, estimates of inferred mineral resources may not form the basis of feasibility or pre-feasibility studies, except in rare cases. Investors are cautionednot to assume that all or any part of an inferred mineral resource exists or is economically or legally mineable. Disclosure of “contained ounces” in a mineral resource is permitted disclosure underCanadian regulations. In contrast, the SEC only permits U.S. companies to report mineralization that does not constitute “mineral reserves” by SEC standards as in place tonnage and grade withoutreference to unit measures.
Accordingly, information contained in this MD&A may not be comparable to similar information made public by U.S. companies subject to the reporting and disclosure requirements under the UnitedStates federal securities laws and the rules and regulations of the SEC thereunder.
Page 2
FIRST MINING GOLD CORP. (formerly known as First Mining Finance Corp.) Management Discussion & Analysis(Expressed in Canadian dollars, unless otherwise indicated) For the three months and year ended December 31, 2017
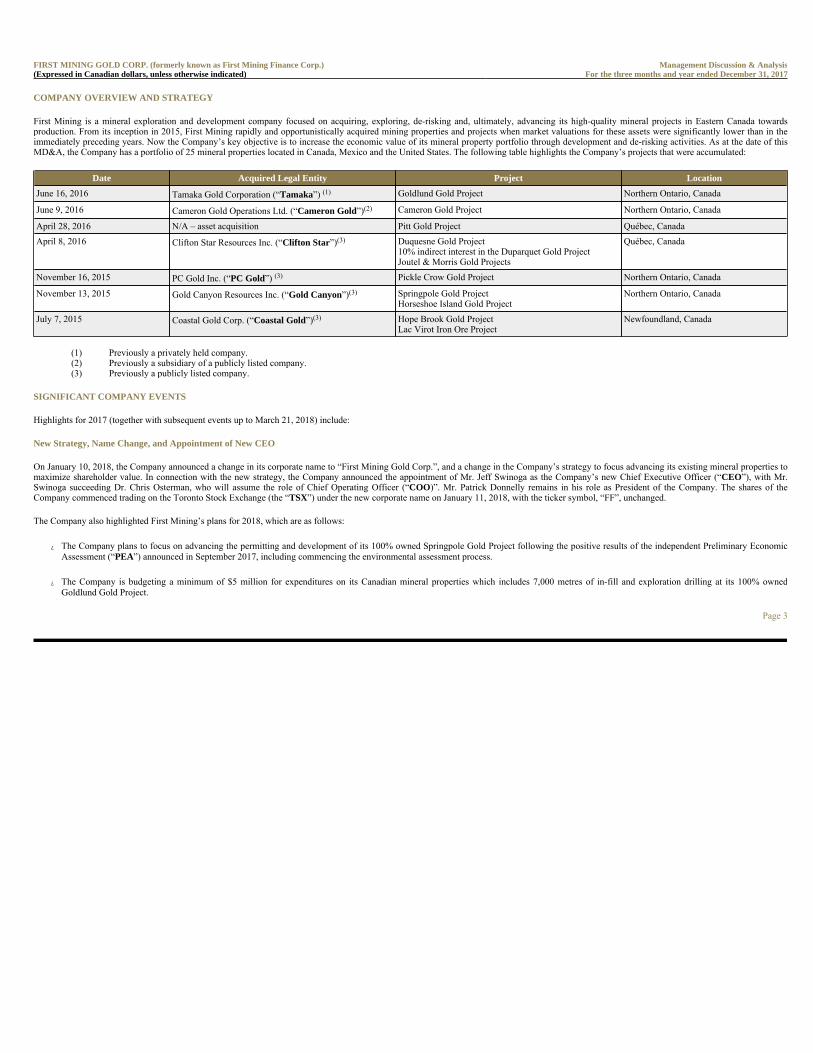
COMPANY OVERVIEW AND STRATEGY
First Mining is a mineral exploration and development company focused on acquiring, exploring, de-risking and, ultimately, advancing its high-quality mineral projects in Eastern Canada towardsproduction. From its inception in 2015, First Mining rapidly and opportunistically acquired mining properties and projects when market valuations for these assets were significantly lower than in theimmediately preceding years. Now the Company’s key objective is to increase the economic value of its mineral property portfolio through development and de-risking activities. As at the date of thisMD&A, the Company has a portfolio of 25 mineral properties located in Canada, Mexico and the United States. The following table highlights the Company’s projects that were accumulated:
SIGNIFICANT COMPANY EVENTS
Highlights for 2017 (together with subsequent events up to March 21, 2018) include:
New Strategy, Name Change, and Appointment of New CEO
On January 10, 2018, the Company announced a change in its corporate name to “First Mining Gold Corp.”, and a change in the Company’s strategy to focus advancing its existing mineral properties tomaximize shareholder value. In connection with the new strategy, the Company announced the appointment of Mr. Jeff Swinoga as the Company’s new Chief Executive Officer (“CEO”), with Mr.Swinoga succeeding Dr. Chris Osterman, who will assume the role of Chief Operating Officer (“COO)”. Mr. Patrick Donnelly remains in his role as President of the Company. The shares of theCompany commenced trading on the Toronto Stock Exchange (the “TSX”) under the new corporate name on January 11, 2018, with the ticker symbol, “FF”, unchanged.
The Company also highlighted First Mining’s plans for 2018, which are as follows:
� The Company plans to focus on advancing the permitting and development of its 100% owned Springpole Gold Project following the positive results of the independent Preliminary EconomicAssessment (“PEA”) announced in September 2017, including commencing the environmental assessment process.
� The Company is budgeting a minimum of $5 million for expenditures on its Canadian mineral properties which includes 7,000 metres of in-fill and exploration drilling at its 100% ownedGoldlund Gold Project.
Page 3
FIRST MINING GOLD CORP. (formerly known as First Mining Finance Corp.) Management Discussion & Analysis(Expressed in Canadian dollars, unless otherwise indicated) For the three months and year ended December 31, 2017
Date Acquired Legal Entity Project Location
June 16, 2016 Tamaka Gold Corporation (“Tamaka”) (1) Goldlund Gold Project Northern Ontario, Canada
June 9, 2016 Cameron Gold Operations Ltd. (“Cameron Gold”)(2) Cameron Gold Project Northern Ontario, Canada
April 28, 2016 N/A – asset acquisition Pitt Gold Project Québec, Canada
April 8, 2016 Clifton Star Resources Inc. (“Clifton Star”)(3) Duquesne Gold Project 10% indirect interest in the Duparquet Gold Project Joutel & Morris Gold Projects
Québec, Canada
November 16, 2015 PC Gold Inc. (“PC Gold”) (3) Pickle Crow Gold Project Northern Ontario, Canada
November 13, 2015 Gold Canyon Resources Inc. (“Gold Canyon”)(3) Springpole Gold Project Horseshoe Island Gold Project
Northern Ontario, Canada
July 7, 2015 Coastal Gold Corp. (“Coastal Gold”)(3) Hope Brook Gold Project Lac Virot Iron Ore Project
Newfoundland, Canada
(1) Previously a privately held company.(2) Previously a subsidiary of a publicly listed company.(3) Previously a publicly listed company.
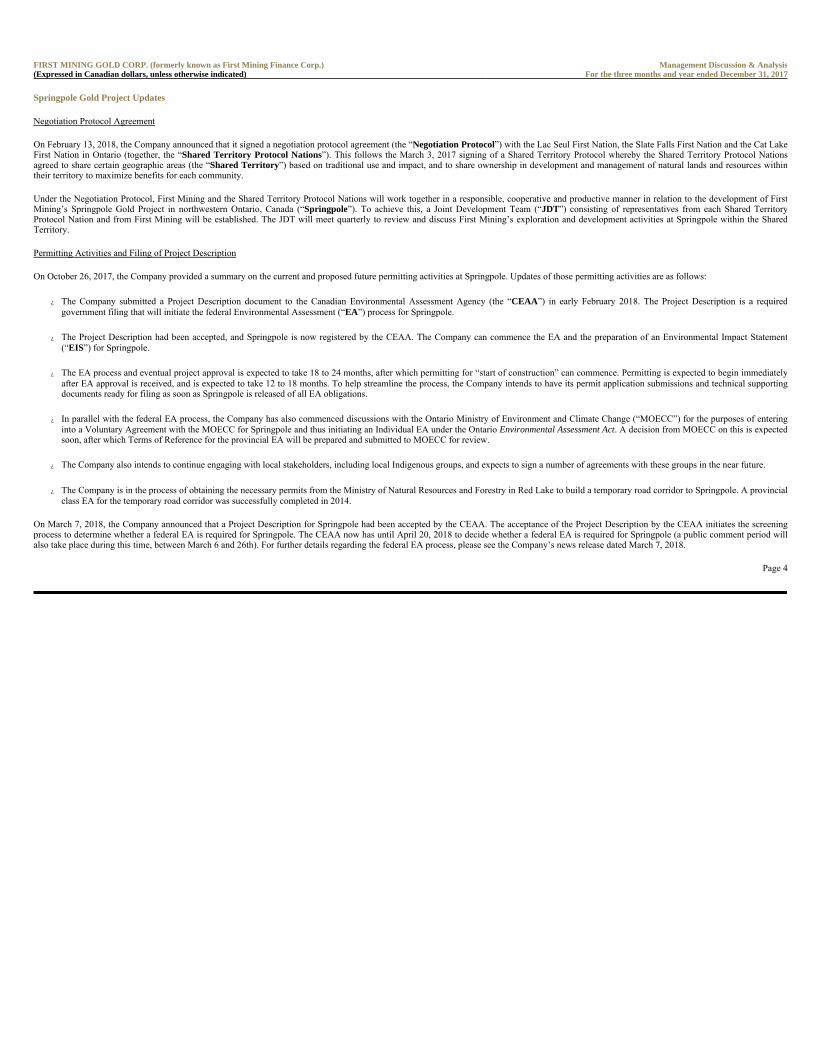
Springpole Gold Project Updates
Negotiation Protocol Agreement
On February 13, 2018, the Company announced that it signed a negotiation protocol agreement (the “Negotiation Protocol”) with the Lac Seul First Nation, the Slate Falls First Nation and the Cat LakeFirst Nation in Ontario (together, the “Shared Territory Protocol Nations”). This follows the March 3, 2017 signing of a Shared Territory Protocol whereby the Shared Territory Protocol Nationsagreed to share certain geographic areas (the “Shared Territory”) based on traditional use and impact, and to share ownership in development and management of natural lands and resources withintheir territory to maximize benefits for each community.
Under the Negotiation Protocol, First Mining and the Shared Territory Protocol Nations will work together in a responsible, cooperative and productive manner in relation to the development of FirstMining’s Springpole Gold Project in northwestern Ontario, Canada (“Springpole”). To achieve this, a Joint Development Team (“JDT”) consisting of representatives from each Shared TerritoryProtocol Nation and from First Mining will be established. The JDT will meet quarterly to review and discuss First Mining’s exploration and development activities at Springpole within the SharedTerritory.
Permitting Activities and Filing of Project Description
On October 26, 2017, the Company provided a summary on the current and proposed future permitting activities at Springpole. Updates of those permitting activities are as follows:
� The Company submitted a Project Description document to the Canadian Environmental Assessment Agency (the “CEAA”) in early February 2018. The Project Description is a requiredgovernment filing that will initiate the federal Environmental Assessment (“EA”) process for Springpole.
� The Project Description had been accepted, and Springpole is now registered by the CEAA. The Company can commence the EA and the preparation of an Environmental Impact Statement(“EIS”) for Springpole.
� The EA process and eventual project approval is expected to take 18 to 24 months, after which permitting for “start of construction” can commence. Permitting is expected to begin immediatelyafter EA approval is received, and is expected to take 12 to 18 months. To help streamline the process, the Company intends to have its permit application submissions and technical supportingdocuments ready for filing as soon as Springpole is released of all EA obligations.
� In parallel with the federal EA process, the Company has also commenced discussions with the Ontario Ministry of Environment and Climate Change (“MOECC”) for the purposes of enteringinto a Voluntary Agreement with the MOECC for Springpole and thus initiating an Individual EA under the Ontario Environmental Assessment Act. A decision from MOECC on this is expectedsoon, after which Terms of Reference for the provincial EA will be prepared and submitted to MOECC for review.
� The Company also intends to continue engaging with local stakeholders, including local Indigenous groups, and expects to sign a number of agreements with these groups in the near future.
� The Company is in the process of obtaining the necessary permits from the Ministry of Natural Resources and Forestry in Red Lake to build a temporary road corridor to Springpole. A provincialclass EA for the temporary road corridor was successfully completed in 2014.
On March 7, 2018, the Company announced that a Project Description for Springpole had been accepted by the CEAA. The acceptance of the Project Description by the CEAA initiates the screeningprocess to determine whether a federal EA is required for Springpole. The CEAA now has until April 20, 2018 to decide whether a federal EA is required for Springpole (a public comment period willalso take place during this time, between March 6 and 26th). For further details regarding the federal EA process, please see the Company’s news release dated March 7, 2018.
Page 4
FIRST MINING GOLD CORP. (formerly known as First Mining Finance Corp.) Management Discussion & Analysis(Expressed in Canadian dollars, unless otherwise indicated) For the three months and year ended December 31, 2017
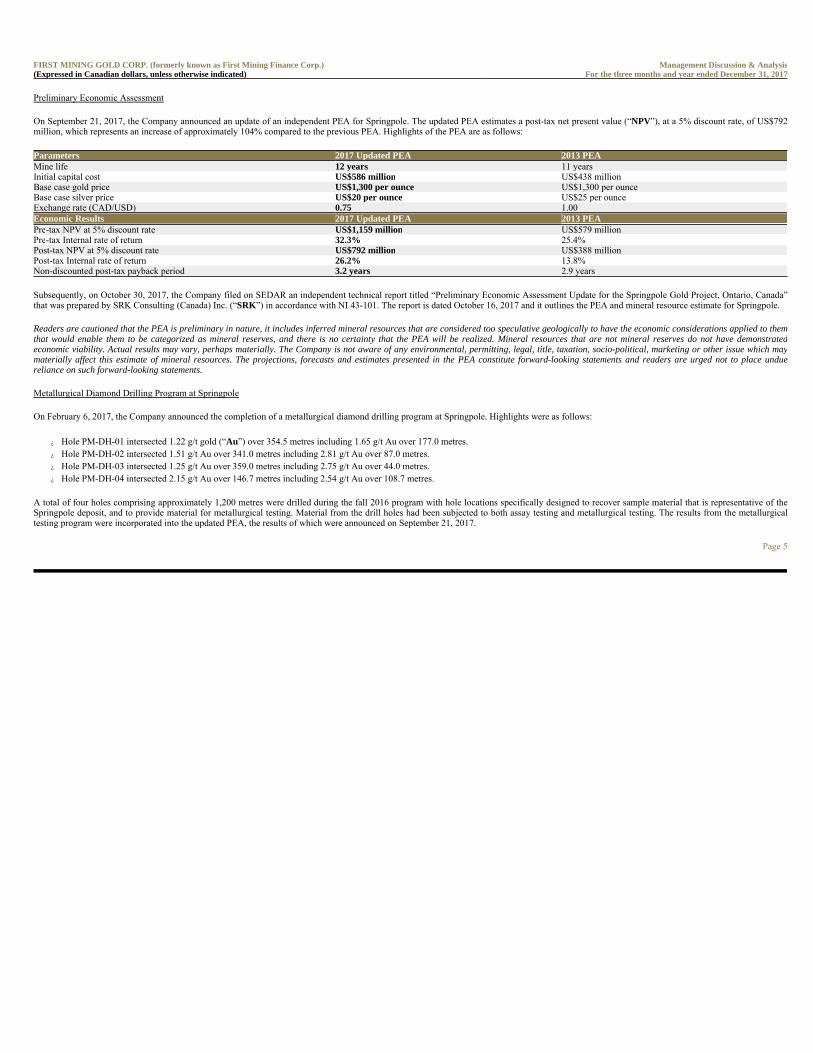
Preliminary Economic Assessment
On September 21, 2017, the Company announced an update of an independent PEA for Springpole. The updated PEA estimates a post-tax net present value (“NPV”), at a 5% discount rate, of US$792million, which represents an increase of approximately 104% compared to the previous PEA. Highlights of the PEA are as follows:
Subsequently, on October 30, 2017, the Company filed on SEDAR an independent technical report titled “Preliminary Economic Assessment Update for the Springpole Gold Project, Ontario, Canada”that was prepared by SRK Consulting (Canada) Inc. (“SRK”) in accordance with NI 43-101. The report is dated October 16, 2017 and it outlines the PEA and mineral resource estimate for Springpole.
Readers are cautioned that the PEA is preliminary in nature, it includes inferred mineral resources that are considered too speculative geologically to have the economic considerations applied to themthat would enable them to be categorized as mineral reserves, and there is no certainty that the PEA will be realized. Mineral resources that are not mineral reserves do not have demonstratedeconomic viability. Actual results may vary, perhaps materially. The Company is not aware of any environmental, permitting, legal, title, taxation, socio-political, marketing or other issue which maymaterially affect this estimate of mineral resources. The projections, forecasts and estimates presented in the PEA constitute forward-looking statements and readers are urged not to place unduereliance on such forward-looking statements.
Metallurgical Diamond Drilling Program at Springpole
On February 6, 2017, the Company announced the completion of a metallurgical diamond drilling program at Springpole. Highlights were as follows:
� Hole PM-DH-01 intersected 1.22 g/t gold (“Au”) over 354.5 metres including 1.65 g/t Au over 177.0 metres. � Hole PM-DH-02 intersected 1.51 g/t Au over 341.0 metres including 2.81 g/t Au over 87.0 metres. � Hole PM-DH-03 intersected 1.25 g/t Au over 359.0 metres including 2.75 g/t Au over 44.0 metres. � Hole PM-DH-04 intersected 2.15 g/t Au over 146.7 metres including 2.54 g/t Au over 108.7 metres.
A total of four holes comprising approximately 1,200 metres were drilled during the fall 2016 program with hole locations specifically designed to recover sample material that is representative of theSpringpole deposit, and to provide material for metallurgical testing. Material from the drill holes had been subjected to both assay testing and metallurgical testing. The results from the metallurgicaltesting program were incorporated into the updated PEA, the results of which were announced on September 21, 2017.
Page 5
FIRST MINING GOLD CORP. (formerly known as First Mining Finance Corp.) Management Discussion & Analysis(Expressed in Canadian dollars, unless otherwise indicated) For the three months and year ended December 31, 2017
Parameters 2017 Updated PEA 2013 PEAMine life 12 years 11 years Initial capital cost US$586 million US$438 million Base case gold price US$1,300 per ounce US$1,300 per ounce Base case silver price US$20 per ounce US$25 per ounce Exchange rate (CAD/USD) 0.75 1.00 Economic Results 2017 Updated PEA 2013 PEAPre-tax NPV at 5% discount rate US$1,159 million US$579 million Pre-tax Internal rate of return 32.3% 25.4% Post-tax NPV at 5% discount rate US$792 million US$388 million Post-tax Internal rate of return 26.2% 13.8% Non-discounted post-tax payback period 3.2 years 2.9 years
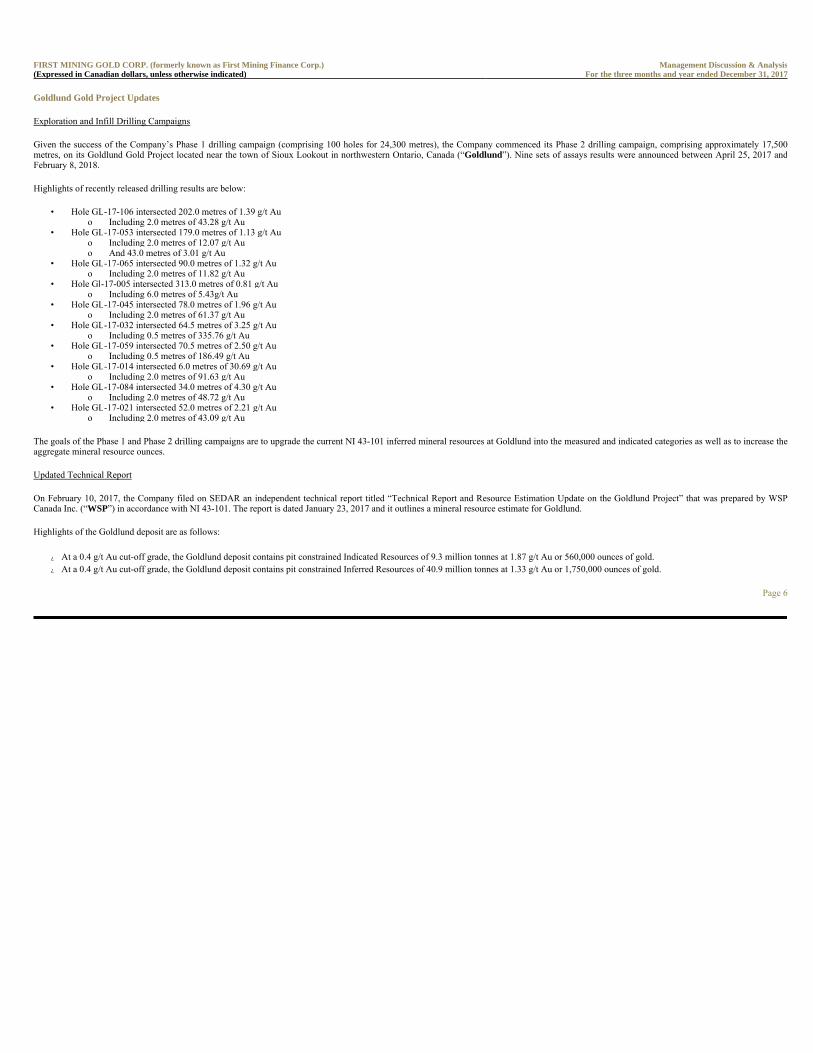
Goldlund Gold Project Updates
Exploration and Infill Drilling Campaigns
Given the success of the Company’s Phase 1 drilling campaign (comprising 100 holes for 24,300 metres), the Company commenced its Phase 2 drilling campaign, comprising approximately 17,500metres, on its Goldlund Gold Project located near the town of Sioux Lookout in northwestern Ontario, Canada (“Goldlund”). Nine sets of assays results were announced between April 25, 2017 andFebruary 8, 2018.
Highlights of recently released drilling results are below:
The goals of the Phase 1 and Phase 2 drilling campaigns are to upgrade the current NI 43-101 inferred mineral resources at Goldlund into the measured and indicated categories as well as to increase theaggregate mineral resource ounces.
Updated Technical Report
On February 10, 2017, the Company filed on SEDAR an independent technical report titled “Technical Report and Resource Estimation Update on the Goldlund Project” that was prepared by WSPCanada Inc. (“WSP”) in accordance with NI 43-101. The report is dated January 23, 2017 and it outlines a mineral resource estimate for Goldlund.
Highlights of the Goldlund deposit are as follows:
� At a 0.4 g/t Au cut-off grade, the Goldlund deposit contains pit constrained Indicated Resources of 9.3 million tonnes at 1.87 g/t Au or 560,000 ounces of gold. � At a 0.4 g/t Au cut-off grade, the Goldlund deposit contains pit constrained Inferred Resources of 40.9 million tonnes at 1.33 g/t Au or 1,750,000 ounces of gold.
Page 6
FIRST MINING GOLD CORP. (formerly known as First Mining Finance Corp.) Management Discussion & Analysis(Expressed in Canadian dollars, unless otherwise indicated) For the three months and year ended December 31, 2017
• Hole GL-17-106 intersected 202.0 metres of 1.39 g/t Au o Including 2.0 metres of 43.28 g/t Au
• Hole GL-17-053 intersected 179.0 metres of 1.13 g/t Au o Including 2.0 metres of 12.07 g/t Au o And 43.0 metres of 3.01 g/t Au
• Hole GL-17-065 intersected 90.0 metres of 1.32 g/t Au o Including 2.0 metres of 11.82 g/t Au
• Hole Gl-17-005 intersected 313.0 metres of 0.81 g/t Au o Including 6.0 metres of 5.43g/t Au
• Hole GL-17-045 intersected 78.0 metres of 1.96 g/t Au o Including 2.0 metres of 61.37 g/t Au
• Hole GL-17-032 intersected 64.5 metres of 3.25 g/t Au o Including 0.5 metres of 335.76 g/t Au
• Hole GL-17-059 intersected 70.5 metres of 2.50 g/t Au o Including 0.5 metres of 186.49 g/t Au
• Hole GL-17-014 intersected 6.0 metres of 30.69 g/t Au o Including 2.0 metres of 91.63 g/t Au
• Hole GL-17-084 intersected 34.0 metres of 4.30 g/t Au o Including 2.0 metres of 48.72 g/t Au
• Hole GL-17-021 intersected 52.0 metres of 2.21 g/t Au o Including 2.0 metres of 43.09 g/t Au
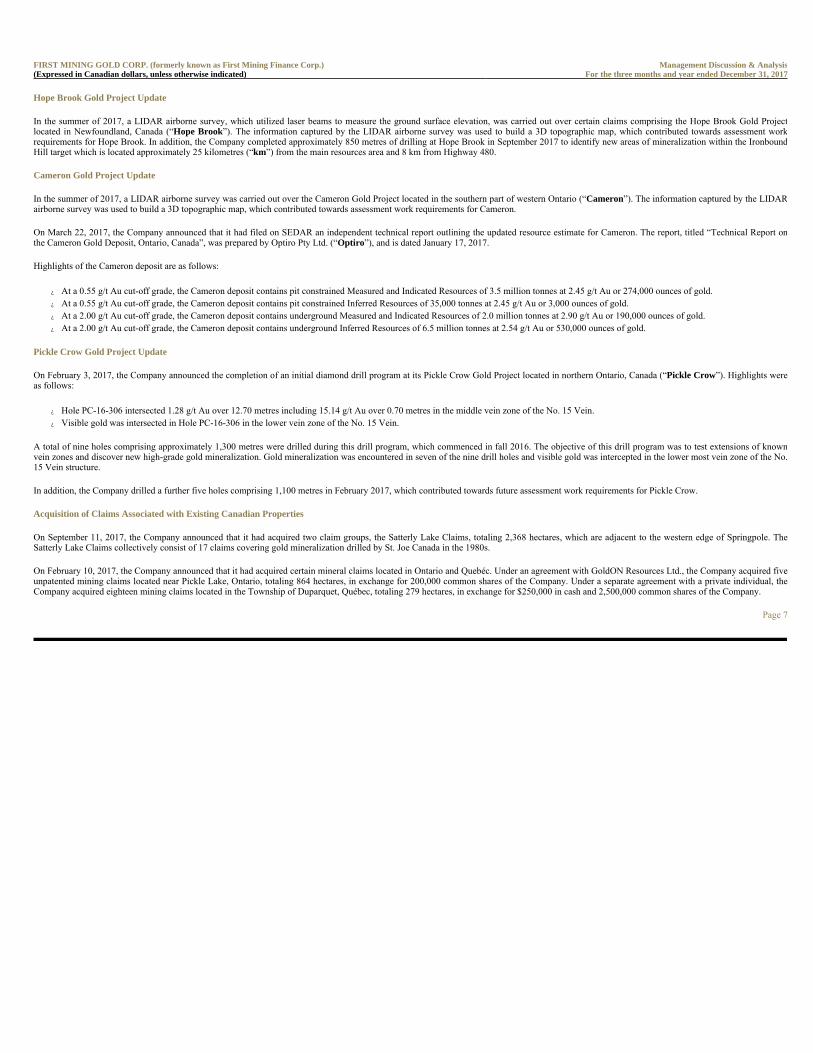
Hope Brook Gold Project Update
In the summer of 2017, a LIDAR airborne survey, which utilized laser beams to measure the ground surface elevation, was carried out over certain claims comprising the Hope Brook Gold Projectlocated in Newfoundland, Canada (“Hope Brook”). The information captured by the LIDAR airborne survey was used to build a 3D topographic map, which contributed towards assessment workrequirements for Hope Brook. In addition, the Company completed approximately 850 metres of drilling at Hope Brook in September 2017 to identify new areas of mineralization within the IronboundHill target which is located approximately 25 kilometres (“km”) from the main resources area and 8 km from Highway 480.
Cameron Gold Project Update
In the summer of 2017, a LIDAR airborne survey was carried out over the Cameron Gold Project located in the southern part of western Ontario (“Cameron”). The information captured by the LIDARairborne survey was used to build a 3D topographic map, which contributed towards assessment work requirements for Cameron.
On March 22, 2017, the Company announced that it had filed on SEDAR an independent technical report outlining the updated resource estimate for Cameron. The report, titled “Technical Report onthe Cameron Gold Deposit, Ontario, Canada”, was prepared by Optiro Pty Ltd. (“Optiro”), and is dated January 17, 2017.
Highlights of the Cameron deposit are as follows:
� At a 0.55 g/t Au cut-off grade, the Cameron deposit contains pit constrained Measured and Indicated Resources of 3.5 million tonnes at 2.45 g/t Au or 274,000 ounces of gold. � At a 0.55 g/t Au cut-off grade, the Cameron deposit contains pit constrained Inferred Resources of 35,000 tonnes at 2.45 g/t Au or 3,000 ounces of gold. � At a 2.00 g/t Au cut-off grade, the Cameron deposit contains underground Measured and Indicated Resources of 2.0 million tonnes at 2.90 g/t Au or 190,000 ounces of gold. � At a 2.00 g/t Au cut-off grade, the Cameron deposit contains underground Inferred Resources of 6.5 million tonnes at 2.54 g/t Au or 530,000 ounces of gold.
Pickle Crow Gold Project Update
On February 3, 2017, the Company announced the completion of an initial diamond drill program at its Pickle Crow Gold Project located in northern Ontario, Canada (“Pickle Crow”). Highlights wereas follows:
� Hole PC-16-306 intersected 1.28 g/t Au over 12.70 metres including 15.14 g/t Au over 0.70 metres in the middle vein zone of the No. 15 Vein. � Visible gold was intersected in Hole PC-16-306 in the lower vein zone of the No. 15 Vein.
A total of nine holes comprising approximately 1,300 metres were drilled during this drill program, which commenced in fall 2016. The objective of this drill program was to test extensions of knownvein zones and discover new high-grade gold mineralization. Gold mineralization was encountered in seven of the nine drill holes and visible gold was intercepted in the lower most vein zone of the No.15 Vein structure.
In addition, the Company drilled a further five holes comprising 1,100 metres in February 2017, which contributed towards future assessment work requirements for Pickle Crow.
Acquisition of Claims Associated with Existing Canadian Properties
On September 11, 2017, the Company announced that it had acquired two claim groups, the Satterly Lake Claims, totaling 2,368 hectares, which are adjacent to the western edge of Springpole. TheSatterly Lake Claims collectively consist of 17 claims covering gold mineralization drilled by St. Joe Canada in the 1980s.
On February 10, 2017, the Company announced that it had acquired certain mineral claims located in Ontario and Quebéc. Under an agreement with GoldON Resources Ltd., the Company acquired fiveunpatented mining claims located near Pickle Lake, Ontario, totaling 864 hectares, in exchange for 200,000 common shares of the Company. Under a separate agreement with a private individual, theCompany acquired eighteen mining claims located in the Township of Duparquet, Québec, totaling 279 hectares, in exchange for $250,000 in cash and 2,500,000 common shares of the Company.
Page 7
FIRST MINING GOLD CORP. (formerly known as First Mining Finance Corp.) Management Discussion & Analysis(Expressed in Canadian dollars, unless otherwise indicated) For the three months and year ended December 31, 2017

Graduation to the TSX
First Mining's common shares commenced trading on the TSX at the market open on June 22, 2017. First Mining's common shares continue to trade under the symbol "FF" on the TSX. In conjunctionwith the graduated listing to the TSX, the Company's common shares were voluntarily delisted from the TSX Venture Exchange (“TSXV”) prior to their commencement of trading on the TSX.
Settlement of Debenture Liability
Pursuant to the amalgamation with Tamaka on June 16, 2016, the Company assumed a liability of $2,139,900 in connection with three debentures (the “Debentures”) that had previously been issued byTamaka to Kesselrun Resources Ltd. (“Kesselrun”).
On June 30, 2017, the Company settled the Debentures through the issuance to Kesselrun of 4,700,000 First Mining common shares, which were valued at $3,102,000 based on the closing price as atJune 30, 2017, and payment to Kesselrun of $200,000 cash. Given that the Company provided consideration in excess of the carrying value of the liability for the Debentures, the excess amount has beencapitalized to Goldlund as additional consideration in respect of the Tamaka transaction. Following the settlement of the Debentures and the loans payable to First Majestic Silver Corp. (“FirstMajestic”) in the year ended December 31, 2017, the Company has been debt free since June 30, 2017, and remains debt free (other than trade payables in the ordinary course of business).
Page 8
FIRST MINING GOLD CORP. (formerly known as First Mining Finance Corp.) Management Discussion & Analysis(Expressed in Canadian dollars, unless otherwise indicated) For the three months and year ended December 31, 2017
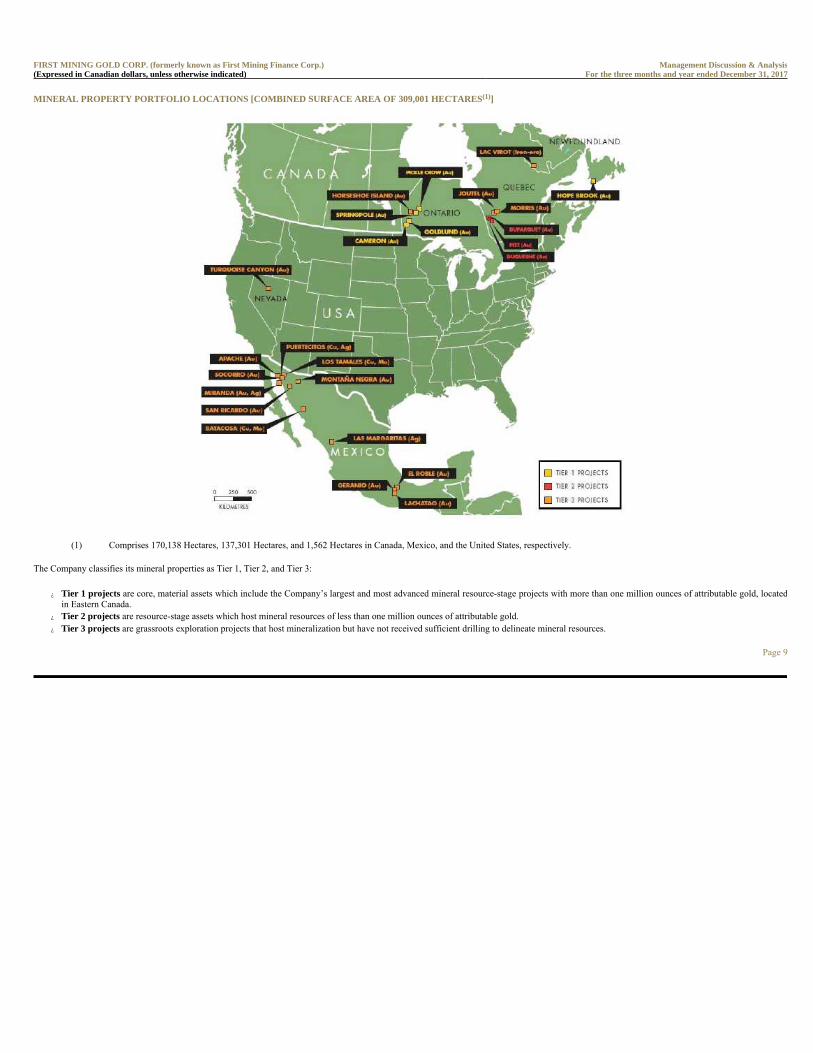
MINERAL PROPERTY PORTFOLIO LOCATIONS [COMBINED SURFACE AREA OF 309,001 HECTARES(1)]
The Company classifies its mineral properties as Tier 1, Tier 2, and Tier 3:
� Tier 1 projects are core, material assets which include the Company’s largest and most advanced mineral resource-stage projects with more than one million ounces of attributable gold, locatedin Eastern Canada.
� Tier 2 projects are resource-stage assets which host mineral resources of less than one million ounces of attributable gold. � Tier 3 projects are grassroots exploration projects that host mineralization but have not received sufficient drilling to delineate mineral resources.
Page 9
FIRST MINING GOLD CORP. (formerly known as First Mining Finance Corp.) Management Discussion & Analysis(Expressed in Canadian dollars, unless otherwise indicated) For the three months and year ended December 31, 2017
(1) Comprises 170,138 Hectares, 137,301 Hectares, and 1,562 Hectares in Canada, Mexico, and the United States, respectively.
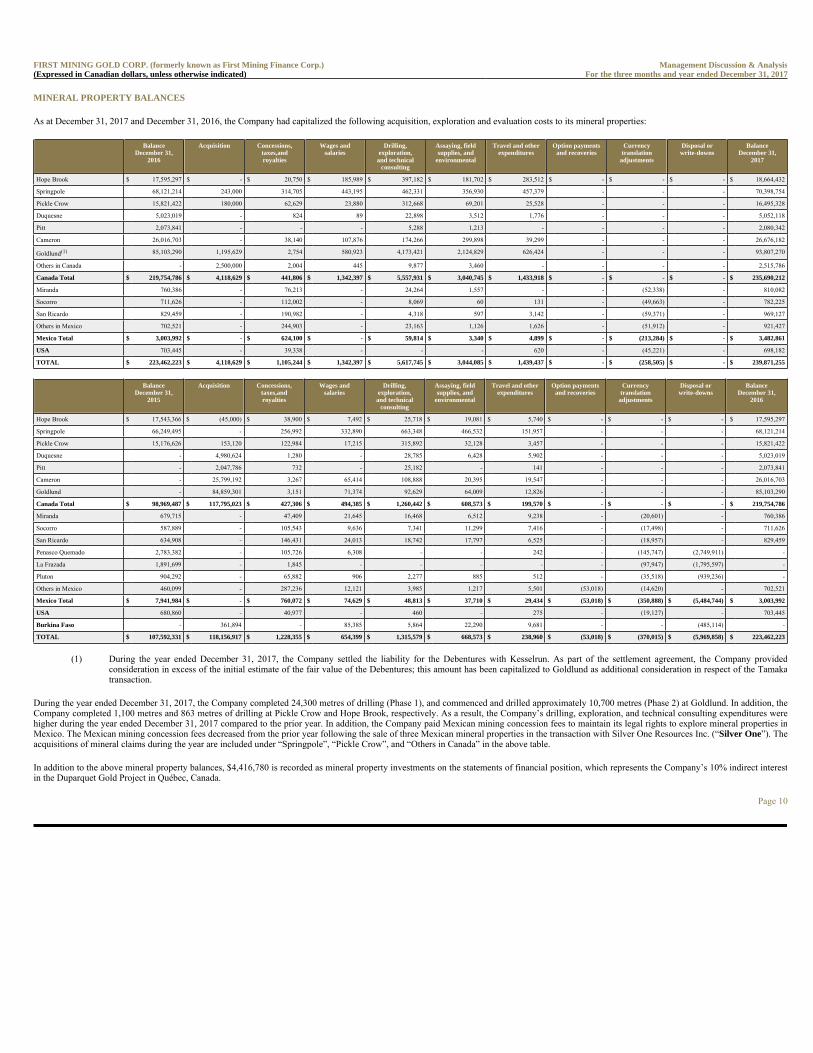
MINERAL PROPERTY BALANCES
As at December 31, 2017 and December 31, 2016, the Company had capitalized the following acquisition, exploration and evaluation costs to its mineral properties:
During the year ended December 31, 2017, the Company completed 24,300 metres of drilling (Phase 1), and commenced and drilled approximately 10,700 metres (Phase 2) at Goldlund. In addition, theCompany completed 1,100 metres and 863 metres of drilling at Pickle Crow and Hope Brook, respectively. As a result, the Company’s drilling, exploration, and technical consulting expenditures werehigher during the year ended December 31, 2017 compared to the prior year. In addition, the Company paid Mexican mining concession fees to maintain its legal rights to explore mineral properties inMexico. The Mexican mining concession fees decreased from the prior year following the sale of three Mexican mineral properties in the transaction with Silver One Resources Inc. (“Silver One”). Theacquisitions of mineral claims during the year are included under “Springpole”, “Pickle Crow”, and “Others in Canada” in the above table.
In addition to the above mineral property balances, $4,416,780 is recorded as mineral property investments on the statements of financial position, which represents the Company’s 10% indirect interestin the Duparquet Gold Project in Québec, Canada.
Page 10
FIRST MINING GOLD CORP. (formerly known as First Mining Finance Corp.) Management Discussion & Analysis(Expressed in Canadian dollars, unless otherwise indicated) For the three months and year ended December 31, 2017
BalanceDecember 31,
2016
Acquisition Concessions, taxes,androyalties
Wages andsalaries
Drilling,exploration,
and technicalconsulting
Assaying, fieldsupplies, and
environmental
Travel and otherexpenditures
Option paymentsand recoveries
Currencytranslation
adjustments
Disposal orwrite-downs
BalanceDecember 31,
2017
Hope Brook $ 17,595,297 $ - $ 20,750 $ 185,989 $ 397,182 $ 181,702 $ 283,512 $ - $ - $ - $ 18,664,432
Springpole 68,121,214 243,000 314,705 443,195 462,331 356,930 457,379 - - - 70,398,754
Pickle Crow 15,821,422 180,000 62,629 23,880 312,668 69,201 25,528 - - - 16,495,328
Duquesne 5,023,019 - 824 89 22,898 3,512 1,776 - - - 5,052,118
Pitt 2,073,841 - - - 5,288 1,213 - - - - 2,080,342
Cameron 26,016,703 - 38,140 107,876 174,266 299,898 39,299 - - - 26,676,182
Goldlund(1) 85,103,290 1,195,629 2,754 580,923 4,173,421 2,124,829 626,424 - - - 93,807,270
Others in Canada - 2,500,000 2,004 445 9,877 3,460 - - - - 2,515,786
Canada Total $ 219,754,786 $ 4,118,629 $ 441,806 $ 1,342,397 $ 5,557,931 $ 3,040,745 $ 1,433,918 $ - $ - $ - $ 235,690,212
Miranda 760,386 - 76,213 - 24,264 1,557 - - (52,338) - 810,082
Socorro 711,626 - 112,002 - 8,069 60 131 - (49,663) - 782,225
San Ricardo 829,459 - 190,982 - 4,318 597 3,142 - (59,371) - 969,127
Others in Mexico 702,521 - 244,903 - 23,163 1,126 1,626 - (51,912) - 921,427
Mexico Total $ 3,003,992 $ - $ 624,100 $ - $ 59,814 $ 3,340 $ 4,899 $ - $ (213,284) $ - $ 3,482,861
USA 703,445 - 39,338 - - - 620 - (45,221) - 698,182
TOTAL $ 223,462,223 $ 4,118,629 $ 1,105,244 $ 1,342,397 $ 5,617,745 $ 3,044,085 $ 1,439,437 $ - $ (258,505) $ - $ 239,871,255
BalanceDecember 31,
2015
Acquisition Concessions, taxes,androyalties
Wages andsalaries
Drilling,exploration,
and technicalconsulting
Assaying, fieldsupplies, and
environmental
Travel and other expenditures
Option paymentsand recoveries
Currencytranslation
adjustments
Disposal orwrite-downs
BalanceDecember 31,
2016
Hope Brook $ 17,543,366 $ (45,000) $ 38,900 $ 7,492 $ 25,718 $ 19,081 $ 5,740 $ - $ - $ - $ 17,595,297
Springpole 66,249,495 - 256,992 332,890 663,348 466,532 151,957 - - - 68,121,214
Pickle Crow 15,176,626 153,120 122,984 17,215 315,892 32,128 3,457 - - - 15,821,422
Duquesne - 4,980,624 1,280 - 28,785 6,428 5,902 - - - 5,023,019
Pitt - 2,047,786 732 - 25,182 - 141 - - - 2,073,841
Cameron - 25,799,192 3,267 65,414 108,888 20,395 19,547 - - - 26,016,703
Goldlund - 84,859,301 3,151 71,374 92,629 64,009 12,826 - - - 85,103,290
Canada Total $ 98,969,487 $ 117,795,023 $ 427,306 $ 494,385 $ 1,260,442 $ 608,573 $ 199,570 $ - $ - $ - $ 219,754,786
Miranda 679,715 - 47,409 21,645 16,468 6,512 9,238 - (20,601) - 760,386
Socorro 587,889 - 105,543 9,636 7,341 11,299 7,416 - (17,498) - 711,626
San Ricardo 634,908 - 146,431 24,013 18,742 17,797 6,525 - (18,957) - 829,459
Penasco Quemado 2,783,382 - 105,726 6,308 - - 242 - (145,747) (2,749,911) -
La Frazada 1,891,699 - 1,845 - - - - - (97,947) (1,795,597) -
Pluton 904,292 - 65,882 906 2,277 885 512 - (35,518) (939,236) -
Others in Mexico 460,099 - 287,236 12,121 3,985 1,217 5,501 (53,018) (14,620) - 702,521
Mexico Total $ 7,941,984 $ - $ 760,072 $ 74,629 $ 48,813 $ 37,710 $ 29,434 $ (53,018) $ (350,888) $ (5,484,744) $ 3,003,992
USA 680,860 - 40,977 - 460 - 275 - (19,127) - 703,445
Burkina Faso - 361,894 - 85,385 5,864 22,290 9,681 - - (485,114) -
TOTAL $ 107,592,331 $ 118,156,917 $ 1,228,355 $ 654,399 $ 1,315,579 $ 668,573 $ 238,960 $ (53,018) $ (370,015) $ (5,969,858) $ 223,462,223
(1) During the year ended December 31, 2017, the Company settled the liability for the Debentures with Kesselrun. As part of the settlement agreement, the Company providedconsideration in excess of the initial estimate of the fair value of the Debentures; this amount has been capitalized to Goldlund as additional consideration in respect of the Tamakatransaction.
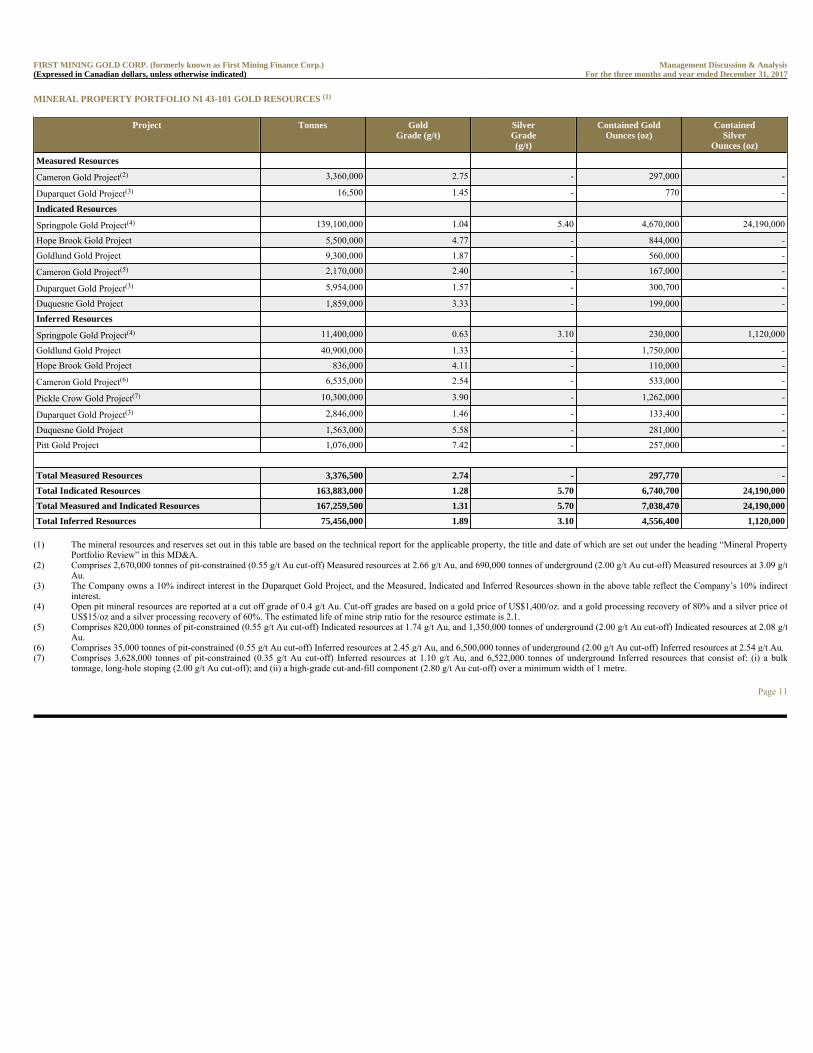
MINERAL PROPERTY PORTFOLIO NI 43-101 GOLD RESOURCES (1)
Page 11
FIRST MINING GOLD CORP. (formerly known as First Mining Finance Corp.) Management Discussion & Analysis(Expressed in Canadian dollars, unless otherwise indicated) For the three months and year ended December 31, 2017
Project Tonnes GoldGrade (g/t)
SilverGrade(g/t)
Contained GoldOunces (oz)
ContainedSilver
Ounces (oz)
Measured Resources
Cameron Gold Project(2) 3,360,000 2.75 - 297,000 -
Duparquet Gold Project(3) 16,500 1.45 - 770 -
Indicated Resources
Springpole Gold Project(4) 139,100,000 1.04 5.40 4,670,000 24,190,000
Hope Brook Gold Project 5,500,000 4.77 - 844,000 -
Goldlund Gold Project 9,300,000 1.87 - 560,000 -
Cameron Gold Project(5) 2,170,000 2.40 - 167,000 -
Duparquet Gold Project(3) 5,954,000 1.57 - 300,700 -
Duquesne Gold Project 1,859,000 3.33 - 199,000 -
Inferred Resources
Springpole Gold Project(4) 11,400,000 0.63 3.10 230,000 1,120,000
Goldlund Gold Project 40,900,000 1.33 - 1,750,000 -
Hope Brook Gold Project 836,000 4.11 - 110,000 -
Cameron Gold Project(6) 6,535,000 2.54 - 533,000 -
Pickle Crow Gold Project(7) 10,300,000 3.90 - 1,262,000 -
Duparquet Gold Project(3) 2,846,000 1.46 - 133,400 -
Duquesne Gold Project 1,563,000 5.58 - 281,000 -
Pitt Gold Project 1,076,000 7.42 - 257,000 -
Total Measured Resources 3,376,500 2.74 - 297,770 -
Total Indicated Resources 163,883,000 1.28 5.70 6,740,700 24,190,000
Total Measured and Indicated Resources 167,259,500 1.31 5.70 7,038,470 24,190,000
Total Inferred Resources 75,456,000 1.89 3.10 4,556,400 1,120,000
(1) The mineral resources and reserves set out in this table are based on the technical report for the applicable property, the title and date of which are set out under the heading “Mineral PropertyPortfolio Review” in this MD&A.
(2) Comprises 2,670,000 tonnes of pit-constrained (0.55 g/t Au cut-off) Measured resources at 2.66 g/t Au, and 690,000 tonnes of underground (2.00 g/t Au cut-off) Measured resources at 3.09 g/tAu.
(3) The Company owns a 10% indirect interest in the Duparquet Gold Project, and the Measured, Indicated and Inferred Resources shown in the above table reflect the Company’s 10% indirectinterest.
(4) Open pit mineral resources are reported at a cut off grade of 0.4 g/t Au. Cut-off grades are based on a gold price of US$1,400/oz. and a gold processing recovery of 80% and a silver price ofUS$15/oz and a silver processing recovery of 60%. The estimated life of mine strip ratio for the resource estimate is 2.1.
(5) Comprises 820,000 tonnes of pit-constrained (0.55 g/t Au cut-off) Indicated resources at 1.74 g/t Au, and 1,350,000 tonnes of underground (2.00 g/t Au cut-off) Indicated resources at 2.08 g/tAu.
(6) Comprises 35,000 tonnes of pit-constrained (0.55 g/t Au cut-off) Inferred resources at 2.45 g/t Au, and 6,500,000 tonnes of underground (2.00 g/t Au cut-off) Inferred resources at 2.54 g/t Au.(7) Comprises 3,628,000 tonnes of pit-constrained (0.35 g/t Au cut-off) Inferred resources at 1.10 g/t Au, and 6,522,000 tonnes of underground Inferred resources that consist of: (i) a bulk
tonnage, long-hole stoping (2.00 g/t Au cut-off); and (ii) a high-grade cut-and-fill component (2.80 g/t Au cut-off) over a minimum width of 1 metre.
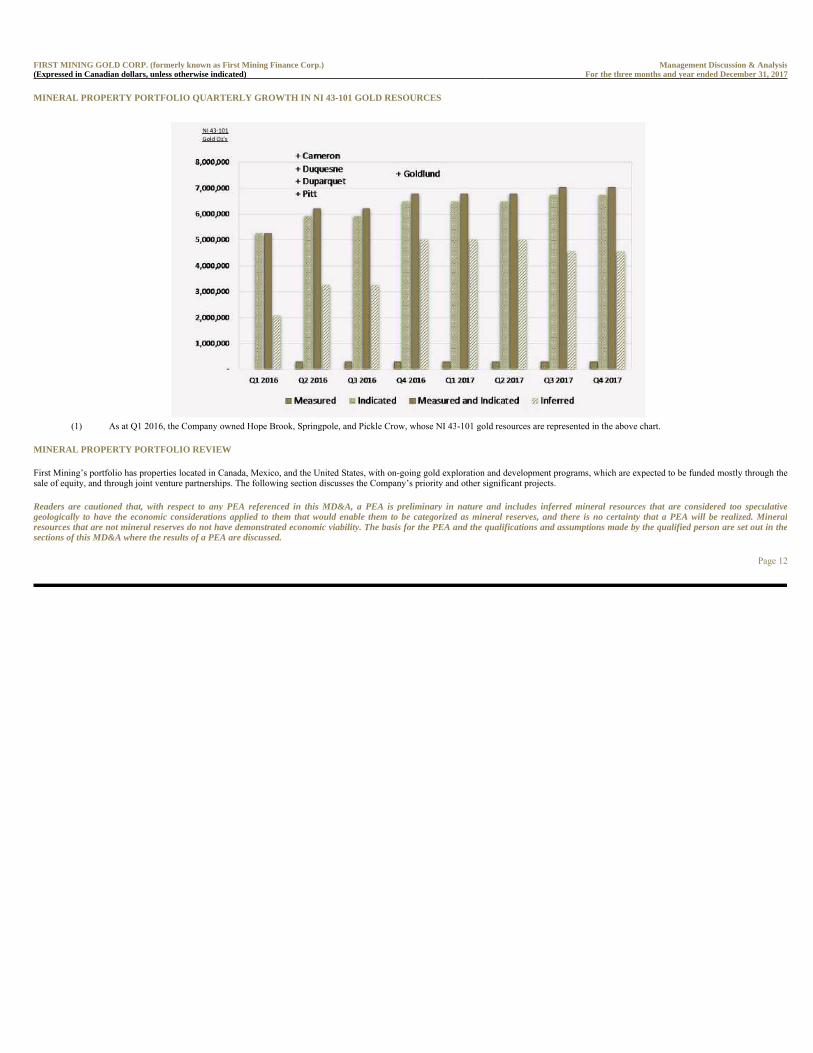
MINERAL PROPERTY PORTFOLIO QUARTERLY GROWTH IN NI 43-101 GOLD RESOURCES
MINERAL PROPERTY PORTFOLIO REVIEW
First Mining’s portfolio has properties located in Canada, Mexico, and the United States, with on-going gold exploration and development programs, which are expected to be funded mostly through thesale of equity, and through joint venture partnerships. The following section discusses the Company’s priority and other significant projects.
Readers are cautioned that, with respect to any PEA referenced in this MD&A, a PEA is preliminary in nature and includes inferred mineral resources that are considered too speculativegeologically to have the economic considerations applied to them that would enable them to be categorized as mineral reserves, and there is no certainty that a PEA will be realized. Mineralresources that are not mineral reserves do not have demonstrated economic viability. The basis for the PEA and the qualifications and assumptions made by the qualified person are set out in thesections of this MD&A where the results of a PEA are discussed.
Page 12
FIRST MINING GOLD CORP. (formerly known as First Mining Finance Corp.) Management Discussion & Analysis(Expressed in Canadian dollars, unless otherwise indicated) For the three months and year ended December 31, 2017
(1) As at Q1 2016, the Company owned Hope Brook, Springpole, and Pickle Crow, whose NI 43-101 gold resources are represented in the above chart.
Canadian Mineral Properties
Tier 1 Projects
Springpole, Ontario
Acquired through the acquisition of Gold Canyon in 2015, the Springpole property covers an area of 32,240 hectares, including 36 patented and 300 unpatented claims. The project is located innorthwestern Ontario, approximately 110 km northeast of the town of Red Lake and is situated within the Birch-Uchi Greenstone Belt. The large open pittable resource is supported by significantinfrastructure, including a 72 man onsite camp, winter road access, a logging road within 10 km and nearby power lines. The project contains indicated mineral resources of 139.1 Mt grading 1.04 g/t Auand 5.40 g/t silver (“Ag”), containing 4,670,000 oz Au and 24,190,000 oz Ag, and inferred mineral resources of 11.4 Mt grading 0.63 g/t Au and 3.10 g/t Ag, containing 230,000 oz Au and 1,120,000 ozAg. Springpole is located within a pro-mining jurisdiction that is covered by Treaty Three and Treaty Nine First Nations Agreements.
A technical report titled “Preliminary Economic Assessment Update for the Springpole Gold Project, Ontario, Canada”, that was prepared by SRK, was filed by the Company on SEDAR on October 30,2017, and is available under the Company’s SEDAR profile at www.sedar.com and on the Company’s website at www.firstmininggold.com. The PEA contemplates mining and processing material at36,000 tonnes per day at an average head grade of 1.00 g/t Au and 5.28 g/t Ag.
Goldlund, Ontario
Acquired through the amalgamation with Tamaka in 2016, the Goldlund property covers an area of 23,858 hectares in northwestern Ontario, and consists of 27 patented claims, 152 unpatented claims, 1mining lease, and 1 license of occupation. The area is underlain by sedimentary and volcanic rocks, numerous intermediate to mafic subvolcanic intrusive sheets, and is intruded by several granitoidstocks. The majority of identified mineralization is hosted within the Central and Southern Volcanic Belts and historic production demonstrates the presence of small zones of higher-grademineralization. A technical report titled “Technical Report and Resource Estimation Update on the Goldlund Project”, that was prepared by WSP, was filed on SEDAR on February 10, 2017, and isavailable under the Company’s SEDAR profile at www.sedar.com and on the Company’s website at www.firstmininggold.com.
Goldlund contains indicated mineral resources of 9.3 Mt grading 1.87 g/t Au, containing 560,000 oz Au, and inferred mineral resources of 40.9 Mt grading 1.33 g/t Au, containing 1,750,000 oz Au.Mining in the 1980s produced approximately 90,700 tonnes at 5.14 g/t Au from underground and 39,000 tonnes at 5.83 g/t from a small open pit. The project has excellent infrastructure with year-roundroad access to the property from Ontario Highway 72, which is 2 km to the south, and regional power lines which are 15 km to the north. There is a strong relationship with the towns and First Nationgroups in the local communities.
Hope Brook, Newfoundland
Acquired through the acquisition of Coastal Gold in 2015, the Hope Brook property covers an area of 26,650 hectares, including 7 mineral licenses, with a deposit hosted by pyritic silicified zonesoccurring within a deformed, strike-extensive advanced argillic alteration zone. A technical report titled “2015 Mineral Resource Estimate Technical Report for the Hope Brook Gold Project,Newfoundland and Labrador, Canada”, that was prepared by Mercator Geological Services Limited, was filed by the Company on SEDAR on November 27, 2015, and is available under the Company’sSEDAR at www.sedar.com profile and on the Company’s website at www.firstmininggold.com. The resource covers 1.5 km of an 8 km mineralized structure. The project hosts indicated mineralresources of 5.5 Mt grading 4.77 g/t Au, containing 844,000 oz Au, and inferred mineral resources of 836,000 t grading 4.11 g/t Au, containing 110,000 oz Au. Substantial infrastructure includes a rampto 350 metres below surface with vent raise, power, access by sea and air, and a strong local labour force. Drill targets with potential to significantly increase resources have already been outlined. HopeBrook was a former operating gold mine that produced 752,163 oz Au from 1987 to 1997 and there is strong support from the local community and the Province of Newfoundland for futuredevelopment.
Page 13
FIRST MINING GOLD CORP. (formerly known as First Mining Finance Corp.) Management Discussion & Analysis(Expressed in Canadian dollars, unless otherwise indicated) For the three months and year ended December 31, 2017
Cameron, Ontario
Acquired through the acquisition of Cameron Goldin 2016, the Cameron property covers an area of 44,853 hectares and comprises 24 patented claims, 226 unpatented claims, 4 mining leases, and 7licenses of occupation. The Cameron deposit is a greenstone-hosted gold deposit and the mineralization is mainly hosted in mafic volcanic rocks within a northwest trending shear zone (Cameron LakeShear Zone) which dips steeply to the north east. A technical report titled “Technical Report on the Cameron Gold Deposit, Ontario, Canada”, that was prepared by Optiro, was filed on SEDAR onMarch 22, 2017, and is available under the Company’s SEDAR profile at www.sedar.com and on the Company’s website at www.firstmininggold.com. The project hosts pit constrained (0.55 g/t Au cut-off) measured and indicated mineral resources of 3.5 million tonnes at 2.45 g/t Au or 274,000 ounces of gold and pit constrained (0.55 g/t Au cut-off) inferred mineral resources of 35,000 tonnes at 2.45g/t Au or 3,000 ounces of gold in addition to underground (2.00 g/t Au cut-off) measured and indicated mineral resources of 2.0 million tonnes at 2.90 g/t Au or 190,000 ounces of gold and underground(2.00 g/t Au cut-off) inferred mineral resources of 6.5 million tonnes at 2.54 g/t Au or 530,000 ounces of gold. There is excellent infrastructure with year round road access to the property from nearbyhighway and power lines within 20 km.
Pickle Crow, Ontario
Acquired through the acquisition of PC Gold in 2015, the Pickle Crow project covers an area of 13,184 hectares and comprises 114 patented claims and 83 unpatented claims. The area is located innorthwestern Ontario and is covered by the Treaty Nine First Nations Agreement. A technical report titled “A Mineral Resource Estimate for the Pickle Crow Property, Patricia Mining Division,Northwestern Ontario, Canada”, that was prepared by Micon International Limited, was filed by PC Gold on SEDAR on June 2, 2011, and is available under PC Gold’s SEDAR profile atwww.sedar.com and on the Company’s website at www.firstmininggold.com. The resource supports a high-grade underground and open pit operation. The project hosts inferred mineral resources of10.3 Mt grading 3.9 g/t Au, containing 1,262,000 oz Au. Extensive infrastructure in place or proximal to the Pickle Crow project includes a 200 tonne per day gravity mill on site, generators and fuelstorage and paved road access to the property, and the project is within 10 km of a regional airport at Pickle Lake. Pickle Crow was a former high-grade operating mine until the late 1960s.
Tier 2 Projects
Duquesne Gold Project, Québec
Acquired through the acquisition of Clifton Star in 2016, the Duquesne Gold Project located in the Abitibi Region of Québec (“Duquesne”) is situated on a property that covers an area of 2,323 hectares.The Company owns a 100% interest in Duquesne which hosts an NI 43-101 indicated mineral resource of 1.9 Mt grading 3.33 g/t Au, containing 199,000 oz Au, and an inferred mineral resource of 1.6Mt grading 5.58 g/t Au, containing 281,000 oz Au. A technical report titled “43-101 Technical Report Resource Estimate of the Duquesne Gold Property”, was filed by Clifton Star on SEDAR onOctober 28, 2011, and is available under Clifton Star’s SEDAR profile at www.sedar.com. The Duquesne project is situated along the Destor-Porcupine Break, which boasts historical production of 192million oz Au.
Pitt Gold Project, Québec
Purchased from Brionor Resources Inc. in 2016, the Pitt Gold Project located in the Abitibi Region of Québec (“Pitt Gold”) is situated on a property that covers an area of 384 hectares and is close toDuquesne and the Duparquet Gold Project (in which First Mining holds a 10% indirect interest). A technical report in support of these resources, titled “NI 43-101 Technical Report and Review of thePreliminary Mineral Resource Estimate for the Pitt Gold Project, Duparquet Township, Abitibi Region, Quebec, Canada”, was filed by the Company on SEDAR on January 6, 2017 under theCompany’s SEDAR profile at www.sedar.com. At a cut-off grade of 3.0 g/t Au, Pitt Gold is estimated to have inferred mineral resources of 1,076,000 tonnes grading 7.42 g/t Au, containing 257,000 ozAu.
Page 14
FIRST MINING GOLD CORP. (formerly known as First Mining Finance Corp.) Management Discussion & Analysis(Expressed in Canadian dollars, unless otherwise indicated) For the three months and year ended December 31, 2017
Tier 3 Projects
Lac Virot Iron Ore Project, Newfoundland
Acquired through the acquisition of Coastal Gold in 2015, the Lac Virot property is located near the town of Labrador City in western Labrador. The Company owns a 100% interest in 4 minerallicenses covering a total area of 13,109 hectares. The Lake Superior-type iron formation occurrences of the Lac Virot area lie in the Labrador-Québec Fold Belt or Labrador Trough, within the SokomanFormation of the Lower Proterozoic (Aphebian) Knob Lake Group. The project is in a strategic location surrounded by four iron ore mines in the Southern Labrador Trough. A total of 11,713 metreswere drilled in 42 holes during 2012 which focused on high priority targets previously outlined by an 882 km gravity survey.
Horseshoe Island Gold Project, Ontario
Acquired through the acquisition of Gold Canyon in 2015, the Company’s 100% interest in the Horseshoe Island Gold Project, situated in the Archean Birch-Uchi greenstone belt, and within the prolificRed Lake Mining District of northwestern Ontario, is comprised of 16 unpatented claims covering an area of 2,448 hectares. Gold Canyon previously completed an extensive Mobile Metal Ion surveywhich displayed that elongate, shear-related gold anomalies are widespread and may be scattered along the entire 7 km length of the property. The surveys also produced copper and zinc anomalies inVMS favorable environments. Historic drilling has indicated the presence of nickel, platinum, and palladium in a layered gabbro intrusive. The project has a long exploration history during which time24,138 metres of drilling has been completed.
Mexican Mineral Properties
Tier 3 Projects
Miranda, Sonora
The Miranda gold property consists of three claims; Miranda, Miranda 1 and La Arena, that together cover 16,035 hectares in the Sonoran Desert within a structural corridor called the Sonora-MojaveMegashear (the “SMM trend”).
The SMM trend hosts several operating gold mines and deposits, some of which exceed 10 million ounces of gold such as Herradura-Dipolos in western Sonora, Mexico, and other smaller depositsknown as Mesquite (7 M oz Au) and Picacho in Arizona, Mexico; Chanate in San Francisco, Mexico; and La Choya in Sonora, Mexico. The Miranda property lies in the south-central part of the SMMtrend, adjacent to the San Felix and El Antimonio mining districts on the south and east respectively. Miranda covers multiple prospects and gold occurrences including the inactive mines La Fortunaand El Gigio (claims that are not owned by the Company but are surrounded by the Miranda gold property concessions). Additionally, the property exhibits structures and lithologies favorable for thedevelopment of large orogenic (mesothermal) ore deposits similar to those occurring along the SMM trend. During 2015, 151 rock chip samples were taken and analyzed with values ranging between niland 7.29 g/t Au. Additionally, 3,486 soil samples were collected and analyzed. In September 2017, the Company conducted a structural analysis which is intended to prioritize drilling targets at theMiranda gold property.
Socorro, Sonora
The Socorro property was reduced and separated into fractions in 2015 subject to government approval and now consists of four claims: El Socorro Frac 1, El Socorro Frac 2, El Socorro Frac 3 andTizoc R1, together covering an area of 35,654 hectares. It is a regional gold exploration play with dozens of pits and placer deposits with excellent potential to host both bulk open-pit, heap-leachabledeposits as well as high-grade gold in high-angle structures. The southern part of the concession covers the northern extension of the El Chanate mine, while the central and northern portion covermesothermal gold veins within a regional structure over 10 km long.
Work to date on the property includes interpretation of ASTER images, mapping and initial surface reconnaissance.
During 2015, the Company took 53 rock chip samples on the property with values ranging from nil to 41.0 g/t Au. Additionally, 7,737 soil samples were taken and analyzed.
Page 15
FIRST MINING GOLD CORP. (formerly known as First Mining Finance Corp.) Management Discussion & Analysis(Expressed in Canadian dollars, unless otherwise indicated) For the three months and year ended December 31, 2017
San Ricardo, Sonora
The San Ricardo property consists of nine claims, two of which, San Ricardo and San Ricardo 2, cover an area of 50 hectares and an existing small mine. The remaining seven claims: Teocuitla,Teocuitla 2, Teocuitla 4, Angel, Tlaloc, Tlaloc 2 and Aztlan, together cover an area of 37,350 hectares, and were staked by the Company between 2009 and 2011. Mineralization on the property isepithermal in nature and has not been constrained along strike or depth by drilling.
All underground workings on the San Ricardo vein system were opened up and sampled between 2009 to 2011, and several hundred metres of trenches were excavated and sampled. Subsequently, 14diamond drill-holes were drilled on the property to test two veins, the Santa Cruz and Mina Antigua, at shallow levels. Drill results in the Santa Cruz vein varied from minor precious metalmineralization to 2.3 m at 23.1 g/t Au, whereas the Mina Antigua vein contained 4.5 m at 100.4 g/t Ag.
During 2015, the Company took 59 reconnaissance rock samples with values ranging from nil to 33.7 g/t Au and completed a 4,993 soil samples geochemical survey.
Puertecitos, Sonora
The Puertecitos property consists of two claims, Puertecitos and Puertecitos 2, covering an area of 9,060 hectares staked by the Company in 2009. Located 32 km southwest of the Sasabe border crossingbetween the US and Mexico, Puertecitos is 40 km west of the Company’s Los Tamales property and 32 km northeast of the Peñoles Los Humos deposit, a 625 Mt porphyry copper system grading 0.32%Cu. Widespread copper oxides outcrop at Puertecitos and the presence of sericite and secondary biotite in breccia fragments from dikes and pipes suggest that a porphyry system may exist under theextensive rhyolite flows on the property. In 2015, the Company entered into an option agreement with Peñoles under which Peñoles mapped and sampled the Puertecitos property. However, on August8, 2016, Peñoles notified the Company of its decision to discontinue exploration on the project and consequently the option agreement was terminated.
Los Tamales, Sonora
The Los Tamales property consists of two claims, Teocuitla 5 and Teocuitla 8, which together cover an area of 3,851 hectares staked by the Company in 2010. Los Tamales is a porphyry copper-molybdenum system located 125 km southwest of Tucson, Arizona and 28 km south of the US-Mexican border. The property was discovered by a water well sampling program during a joint UnitedStates Geological Survey and Servicio Geologico Mexicano reconnaissance effort in the 1970s, and was the subject of two USGS open-file reports: 94-685 and 84-289. Five diamond drill holes testedcopper and molybdenum soil geochemical anomalies in 2013 along a 5 km strike length with all holes showing low grade chalcopyrite and molybdenite mineralization. The deposit as currentlyinterpreted suggests it is the deep level of a large system dissected by low angle faulting. In 2015, the Company entered into an option agreement with Peñoles under which Peñoles mapped and sampledthe Los Tamales property in 2016. However, on August 8, 2016, Peñoles notified the Company of its decision to discontinue exploration on the project and consequently the option agreement wasterminated.
El Apache, Sonora
The El Apache property covers an area of 11,417 hectares in two claims: El Apache and Tlahuac; both staked by the Company in 2011.
El Apache is largely covered by wind-blown sand of the western Sonoran Desert and lies in a highly prospective area within the prolific Sonora-Mojave megashear gold belt. The property lies 10 kmeast of the largest gold-only mine in Mexico, Fresnillo’s Herradura complex and 10 km south of La Choya mine.
Work to date includes partial surface reconnaissance, interpretation of the government’s magnetic data and limited surface sampling in two small outcropping hills. Future work will entail ZTEM,detailed magnetometry, bleg sampling, and enzyme leach-type geochemical surveys to identify drill targets under sand cover.
Page 16
FIRST MINING GOLD CORP. (formerly known as First Mining Finance Corp.) Management Discussion & Analysis(Expressed in Canadian dollars, unless otherwise indicated) For the three months and year ended December 31, 2017
Batacosa, Sonora
The Batacosa property consists of one claim covering an area of 3,600 hectares staked by the Company in 2011. Batacosa is a porphyry copper-molybdenum system located 55 km northeast of CiudadObregon and 220 km southeast of Hermosillo, the capital of the state of Sonora. Batacosa was discovered by Cominco in the 1970s and subsequently drilled by them and other companies between 1970and 2000. A total of 8,000 metres were drilled in 47 drill holes. The Company has delineated two untested targets within the property.
Montana Negra, Sonora
The Montana Negra property consists of one claim, Montana Negra, covering an area of 852 hectares. The property covers Proterozoic rocks that the Company believe may be favorable for goldmineralization and is located in North Central Sonora, 20 km southeast of Cananea. In the Orogenic gold system targets are open-pit leachable mineralization in granitic and metamorphic rocks (similarto the La Choya and San Francisco mines). Additional field work is required to fully evaluate the property following preliminary surface samples that reported from nil to 9.5 g/t Au.
Las Margaritas, Durango
The Las Margaritas property covers an area of 500 hectares consisting of two mining concessions approximately 150 km from Durango City. The property was acquired through an Assignments ofRights Agreement signed July 6, 2011 and is subject to a 1% NSR royalty payable to the vendor which may be purchased at any time before July 6, 2016 for USD $500,000. The project is located in theBarrancas subprovince of the Sierra Madre Occidental. Some limited gold mining by artisanal prospectors is known to have taken place on the project in the early 20th century and the project contains aknown vein with quartz, argillic alteration striking for at least 1.8 km. In 2016, a two-year extension was negotiated with the vendor which granted the Company the option to purchase the 1% NSRroyalty by November 2018 in consideration for an additional USD $100,000 payable over two years, of which $50,000 has been paid. The Company is currently seeking to negotiate a further extensionwith the vendor.
Geranio, Oaxaca
The Geranio property consists of six claims: La Ramita, Geranio, Violeta, Azucena, El Jilguero and La Orquidea, which combined, cover an area of 540 hectares. Additionally, the Company has alsostaked a much larger block of ground to the north, east and south of the Natividad system.
The Geranio project lies adjacent and directly north of the historic Natividad Mining District, 70 km north of the city of Oaxaca in southern Mexico. Natividad is a series of five bonanza grade gold andsilver veins in a black shale host rock which, over the last 70 years, has produced 1.5 million ounces of gold equivalent. The property covers approximately 1,200 metres of strike length of the northernextension of the Natividad vein system.
Two ASARCO exploration diamond drill holes were drilled on the Geranio property in 1992; hole N-20 intersected 0.6 m at 36 g/t Au and 315 g/t Ag, whereas hole N-24 intersected 0.7 m at 45 g/t Auand 120 g/t Ag. The Company’s objective is to delineate another Natividad mineralized system with comparable precious metal contents.
El Roble, Oaxaca
The El Roble property, located in the Natividad mining district, consists of two claims staked by the Company, El Roble and El Roble 2, which together cover an area of 9,666 hectares. The propertycovers the northern extension of Natividad veins and other historic bonanza producers such as the El Banco mine. Relevant exploration features include a 15 km strike length of a large magnetic highrepresenting an intrusive body at depth believed to be associated with high-grade gold mineralization in veins. Work to date includes regional geology, airborne magnetics and reconnaissance samplingof selected areas.
Page 17
FIRST MINING GOLD CORP. (formerly known as First Mining Finance Corp.) Management Discussion & Analysis(Expressed in Canadian dollars, unless otherwise indicated) For the three months and year ended December 31, 2017
Lachatao, Oaxaca
The Lachatao property, located in Oaxaca Mexico, consists of three claims that were staked by the Company known as Lizi 1, Lizi 1 Fraccion 2, and Lizi 1 Fraccion 3, which together cover an area of5,126 hectares. Targets in the property include high-grade gold bonanza veins in black shales as well as stockworks and disseminated gold in volcanic rocks.
USA Mineral Property
Tier 3 Projects
Turquoise Canyon, Nevada
The Turquoise Canyon property (formerly the Bald Mountain property) located in Nevada is wholly-owned by First Mining. The property covers an area of 1,562 hectares and is located along the BattleMountain-Eureka Trend, 16 km south of Barrick Gold Corp.'s Cortez Mine Complex (23 million oz Au), 9 km west of its newly discovered Gold Rush deposit (7.0 million oz Au) and 1.5 km east of theToiyabe Mine, a Carlin type gold deposit that produced 89,000 ounces of gold in the 1990s.
Results of an airborne ZTEM survey commissioned by the Company show an antiformal structure in the underlying Roberts Mountain Thrust which will be the focus of future exploration. A gravityhigh and anomalous conductive/polarizable anomalies at the southwest corner of the property are high priority drill targets. Six other potential drill targets were interpreted from two inducedpolarization/resistivity lines run over the property.
SELECTED ANNUAL INFORMATION
The following is a summary of selected financial information which is derived from the audited financial statements for the last three completed fiscal years:
The Company had no revenues from its operating activities in 2017, 2016 or 2015 and the Company has never paid any distributions or cash dividends to its shareholders.
Net Loss
Net loss had increased from year 2015 to year 2016 and remained comparable between year 2016 and year 2017. During its acquisition phase from year 2015 to year 2016, the Company’s businessactivities experienced growth, resulting in increased expenditures. Following the acquisition phase, expenditures stabilized year-over-year from year 2016 to year 2017.
Cash and Cash Equivalents
Cash and cash equivalents increased by $32,473,839 from December 31, 2015 to December 31, 2016, and decreased by $17,757,720 from December 31, 2016 to December 31, 2017. During the year2016, the increase in cash and cash equivalents was primarily due to an equity private placement by the Company of $26,842,807 and $14,243,523 of cash acquired through acquisitions, partially offsetby cash used in operating and investing activities during the year. During the year 2017, the decrease in cash and cash equivalents was primarily attributable to cash used in operating activities andmineral property exploration activities, partially offset by cash flows from the exercise of warrants and stock options.
Page 18
FIRST MINING GOLD CORP. (formerly known as First Mining Finance Corp.) Management Discussion & Analysis(Expressed in Canadian dollars, unless otherwise indicated) For the three months and year ended December 31, 2017
Year ended December 31,2017 2016 2015
Net Loss $ (11,184,268) $ (11,154,923) $ (5,082,057) Net Loss Per Share (basic and diluted) (1) $ (0.02) $ (0.03) $ (0.05)
December 31, December 31, December 31,2017 2016 2015
Cash and Cash Equivalents $ 15,399,727 $ 33,157,447 $ 683,608 Mineral Properties 239,871,255 223,462,223 107,592,331 Total Assets 265,736,020 269,558,457 109,268,514 Total Non-current Liabilities $ - $ 2,106,371 $ -
(1) The basic and diluted loss per share calculations result in the same amount due to the anti-dilutive effect of outstanding stock options and warrants.
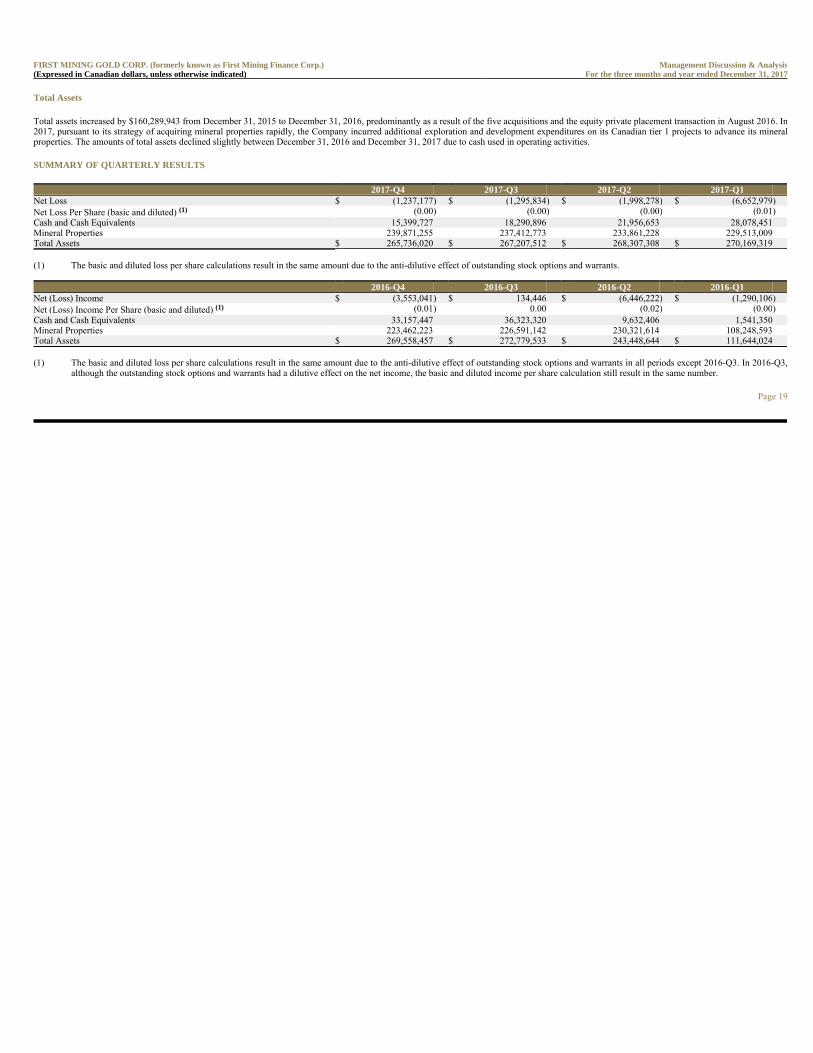
Total Assets
Total assets increased by $160,289,943 from December 31, 2015 to December 31, 2016, predominantly as a result of the five acquisitions and the equity private placement transaction in August 2016. In2017, pursuant to its strategy of acquiring mineral properties rapidly, the Company incurred additional exploration and development expenditures on its Canadian tier 1 projects to advance its mineralproperties. The amounts of total assets declined slightly between December 31, 2016 and December 31, 2017 due to cash used in operating activities.
SUMMARY OF QUARTERLY RESULTS
Page 19
FIRST MINING GOLD CORP. (formerly known as First Mining Finance Corp.) Management Discussion & Analysis(Expressed in Canadian dollars, unless otherwise indicated) For the three months and year ended December 31, 2017
2017-Q4 2017-Q3 2017-Q2 2017-Q1Net Loss $ (1,237,177) $ (1,295,834) $ (1,998,278) $ (6,652,979) Net Loss Per Share (basic and diluted) (1) (0.00) (0.00) (0.00) (0.01) Cash and Cash Equivalents 15,399,727 18,290,896 21,956,653 28,078,451 Mineral Properties 239,871,255 237,412,773 233,861,228 229,513,009 Total Assets $ 265,736,020 $ 267,207,512 $ 268,307,308 $ 270,169,319
(1) The basic and diluted loss per share calculations result in the same amount due to the anti-dilutive effect of outstanding stock options and warrants.
2016-Q4 2016-Q3 2016-Q2 2016-Q1Net (Loss) Income $ (3,553,041) $ 134,446 $ (6,446,222) $ (1,290,106) Net (Loss) Income Per Share (basic and diluted) (1) (0.01) 0.00 (0.02) (0.00) Cash and Cash Equivalents 33,157,447 36,323,320 9,632,406 1,541,350 Mineral Properties 223,462,223 226,591,142 230,321,614 108,248,593 Total Assets $ 269,558,457 $ 272,779,533 $ 243,448,644 $ 111,644,024
(1) The basic and diluted loss per share calculations result in the same amount due to the anti-dilutive effect of outstanding stock options and warrants in all periods except 2016-Q3. In 2016-Q3,although the outstanding stock options and warrants had a dilutive effect on the net income, the basic and diluted income per share calculation still result in the same number.

In the following paragraphs, quarterly results are discussed relative to the preceding quarter’s results.
Net loss in 2017-Q4 was comparable to the net loss in 2017-Q3. The decline in cash and cash equivalents from 2017-Q3 were primarily driven by cash used in operating and investing activities, whichincluded the Phase 2 drilling campaign at Goldlund.
In 2017-Q3, net loss decreased by 35% from 2017-Q2 mainly due to fewer marketing activities in 2017-Q3. In addition, transfer agent and filing fees decreased as the one-time TSX initial listing fee in2017-Q2 was a non-recurring expense. The Company primarily used its cash in operating and investing activities, which included the drilling campaign at Goldlund and technical consultation to updateits PEA study report for Springpole.
The net loss in 2017-Q2 was $4.7 million lower than the net loss in 2017-Q1. This decrease was primarily due to the timing of stock option grants as no stock options were granted in 2017-Q2, whereas,in 2017-Q1, the Company granted a total of 10,880,000 stock options to its Directors, Officers, employees, and consultants. The Company continued its drilling campaign at Goldlund and primarily usedits cash in operating and investing activities. In Q2-2017, the Company repaid its loans payable and settled its liability for the Debentures, and was therefore debt free as at June 30, 2017.
The net loss in 2017-Q1 was $3.1 million higher than the net loss in 2016-Q4 mainly due to the $5.3 million non-cash share-based payments expense from the 10,880,000 stock options granted duringthe period, partially offset by lower loss from other items as there was no write-down of mineral properties and no marketable securities fair value loss in the statements of net loss in 2017-Q1, followingthe early adoption of IFRS 9 Financial Instruments (“IFRS 9”). The Company primarily used its cash in operating and investing activities, including drilling expenditures which were capitalized tomineral properties. Furthermore, the Company completed the acquisition of mining claims located near Pickle Lake, Ontario and in the Township of Duparquet, Québec during 2017-Q1. Therefore, cashand cash equivalents declined while mineral properties increased during 2017-Q1.
In 2016-Q4, the Company’s marketable securities declined in value resulting in a $1.2 million mark-to-market fair value loss. The one-off $0.8 million gain on divestiture of subsidiaries and $1.0 millionforeign exchange gain in 2016-Q3 did not recur in 2016-Q4. As a result, the Company recorded a net loss in 2016-Q4 compared to a net income in 2016-Q3. The Company primarily used its cash inoperating and investing activities, including drilling expenditures which are capitalized to mineral properties. Therefore, cash and cash equivalents declined during 2016-Q4.
In 2016-Q3, the Company completed its divestiture transaction of three Mexican mineral properties, which resulted in a gain of $0.8 million and a realized foreign exchange gain of approximately $1.0million currency translation adjustment reclassification. These gains were partially offset by the Company’s expenditures, resulting in a net income in 2016-Q3. The increase in cash and cash equivalentswas primarily driven by the completion during 2016-Q3 of a $27.0 million non-brokered equity private placement.
The net loss in 2016-Q2 was $5.2 million higher than the net loss in 2016-Q1 mainly due to the $4.7 million non-cash share-based payments expense resulting from the 10,770,000 stock options grantedduring the period. In addition, salaries increased as a result of hiring additional employees due to the Company’s growth. The increase in cash and cash equivalents and total assets from 2016-Q1 wasprimarily due to the completion of the four mineral property acquisitions in 2016-Q2, and, in particular, the $10.8 million cash received from the acquisition of Clifton Star.
In 2016-Q1, net loss decreased by 31% from 2015-Q4. The net loss in 2015-Q4 was primarily due to the $0.6 million write-down of Mexican mineral properties. The increase in cash and cashequivalents and mineral properties from 2015-Q4 was primarily due to the completion of the Goldrush acquisition in 2016-Q1.
Page 20
FIRST MINING GOLD CORP. (formerly known as First Mining Finance Corp.) Management Discussion & Analysis(Expressed in Canadian dollars, unless otherwise indicated) For the three months and year ended December 31, 2017
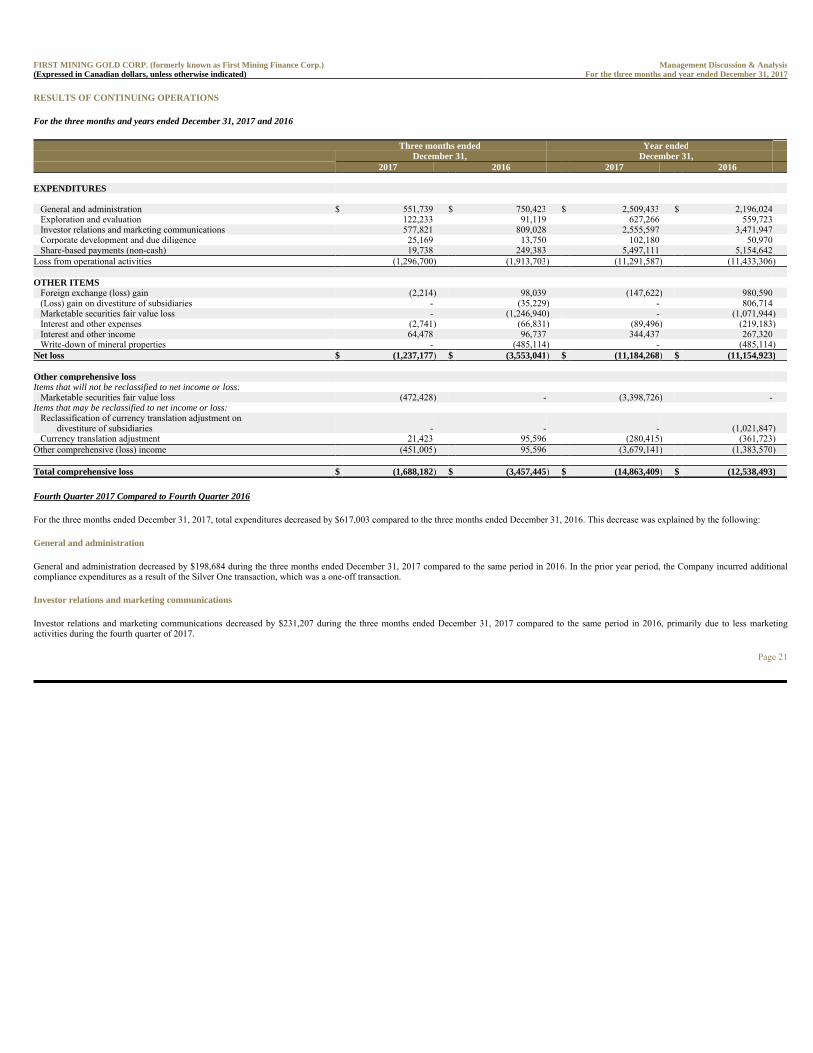
RESULTS OF CONTINUING OPERATIONS
For the three months and years ended December 31, 2017 and 2016
Fourth Quarter 2017 Compared to Fourth Quarter 2016
For the three months ended December 31, 2017, total expenditures decreased by $617,003 compared to the three months ended December 31, 2016. This decrease was explained by the following:
General and administration
General and administration decreased by $198,684 during the three months ended December 31, 2017 compared to the same period in 2016. In the prior year period, the Company incurred additionalcompliance expenditures as a result of the Silver One transaction, which was a one-off transaction.
Investor relations and marketing communications
Investor relations and marketing communications decreased by $231,207 during the three months ended December 31, 2017 compared to the same period in 2016, primarily due to less marketingactivities during the fourth quarter of 2017.
Page 21
FIRST MINING GOLD CORP. (formerly known as First Mining Finance Corp.) Management Discussion & Analysis(Expressed in Canadian dollars, unless otherwise indicated) For the three months and year ended December 31, 2017
Three months ended Year endedDecember 31, December 31,
2017 2016 2017 2016
EXPENDITURES
General and administration $ 551,739 $ 750,423 $ 2,509,433 $ 2,196,024 Exploration and evaluation 122,233 91,119 627,266 559,723 Investor relations and marketing communications 577,821 809,028 2,555,597 3,471,947 Corporate development and due diligence 25,169 13,750 102,180 50,970 Share-based payments (non-cash) 19,738 249,383 5,497,111 5,154,642 Loss from operational activities (1,296,700) (1,913,703) (11,291,587) (11,433,306)
OTHER ITEMS Foreign exchange (loss) gain (2,214) 98,039 (147,622) 980,590 (Loss) gain on divestiture of subsidiaries - (35,229) - 806,714 Marketable securities fair value loss - (1,246,940) - (1,071,944) Interest and other expenses (2,741) (66,831) (89,496) (219,183) Interest and other income 64,478 96,737 344,437 267,320 Write-down of mineral properties - (485,114) - (485,114) Net loss $ (1,237,177) $ (3,553,041) $ (11,184,268) $ (11,154,923)
Other comprehensive lossItems that will not be reclassified to net income or loss: Marketable securities fair value loss (472,428) - (3,398,726) -Items that may be reclassified to net income or loss: Reclassification of currency translation adjustment on divestiture of subsidiaries - - - (1,021,847) Currency translation adjustment 21,423 95,596 (280,415) (361,723) Other comprehensive (loss) income (451,005) 95,596 (3,679,141) (1,383,570)
Total comprehensive loss $ (1,688,182) $ (3,457,445) $ (14,863,409) $ (12,538,493)
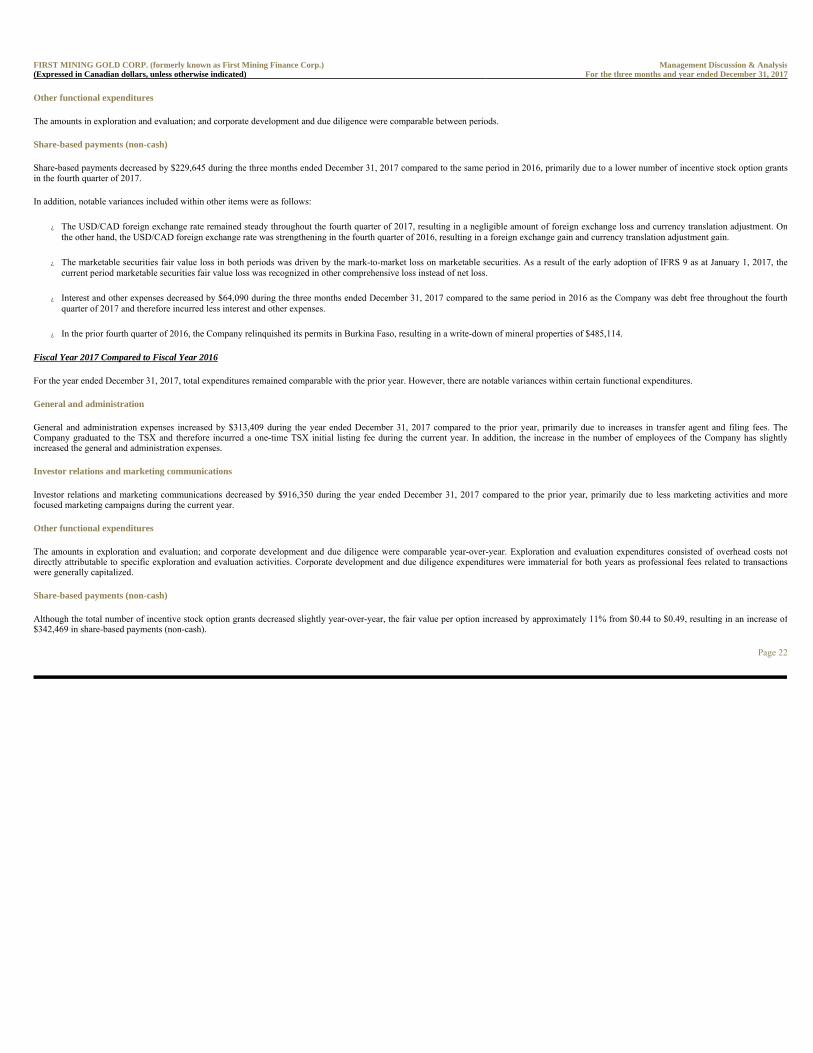
Other functional expenditures
The amounts in exploration and evaluation; and corporate development and due diligence were comparable between periods.
Share-based payments (non-cash)
Share-based payments decreased by $229,645 during the three months ended December 31, 2017 compared to the same period in 2016, primarily due to a lower number of incentive stock option grantsin the fourth quarter of 2017.
In addition, notable variances included within other items were as follows:
� The USD/CAD foreign exchange rate remained steady throughout the fourth quarter of 2017, resulting in a negligible amount of foreign exchange loss and currency translation adjustment. Onthe other hand, the USD/CAD foreign exchange rate was strengthening in the fourth quarter of 2016, resulting in a foreign exchange gain and currency translation adjustment gain.
� The marketable securities fair value loss in both periods was driven by the mark-to-market loss on marketable securities. As a result of the early adoption of IFRS 9 as at January 1, 2017, thecurrent period marketable securities fair value loss was recognized in other comprehensive loss instead of net loss.
� Interest and other expenses decreased by $64,090 during the three months ended December 31, 2017 compared to the same period in 2016 as the Company was debt free throughout the fourthquarter of 2017 and therefore incurred less interest and other expenses.
� In the prior fourth quarter of 2016, the Company relinquished its permits in Burkina Faso, resulting in a write-down of mineral properties of $485,114.
Fiscal Year 2017 Compared to Fiscal Year 2016
For the year ended December 31, 2017, total expenditures remained comparable with the prior year. However, there are notable variances within certain functional expenditures.
General and administration
General and administration expenses increased by $313,409 during the year ended December 31, 2017 compared to the prior year, primarily due to increases in transfer agent and filing fees. TheCompany graduated to the TSX and therefore incurred a one-time TSX initial listing fee during the current year. In addition, the increase in the number of employees of the Company has slightlyincreased the general and administration expenses.
Investor relations and marketing communications
Investor relations and marketing communications decreased by $916,350 during the year ended December 31, 2017 compared to the prior year, primarily due to less marketing activities and morefocused marketing campaigns during the current year.
Other functional expenditures
The amounts in exploration and evaluation; and corporate development and due diligence were comparable year-over-year. Exploration and evaluation expenditures consisted of overhead costs notdirectly attributable to specific exploration and evaluation activities. Corporate development and due diligence expenditures were immaterial for both years as professional fees related to transactionswere generally capitalized.
Share-based payments (non-cash)
Although the total number of incentive stock option grants decreased slightly year-over-year, the fair value per option increased by approximately 11% from $0.44 to $0.49, resulting in an increase of$342,469 in share-based payments (non-cash).
Page 22
FIRST MINING GOLD CORP. (formerly known as First Mining Finance Corp.) Management Discussion & Analysis(Expressed in Canadian dollars, unless otherwise indicated) For the three months and year ended December 31, 2017
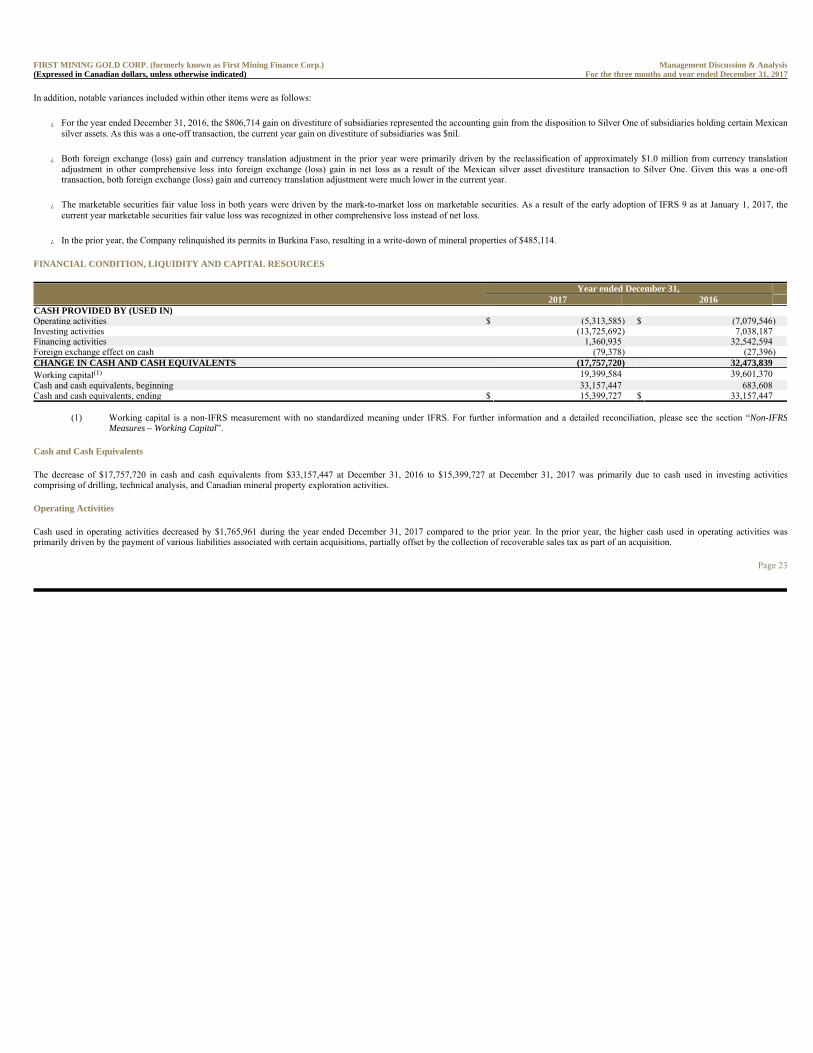
In addition, notable variances included within other items were as follows:
� For the year ended December 31, 2016, the $806,714 gain on divestiture of subsidiaries represented the accounting gain from the disposition to Silver One of subsidiaries holding certain Mexicansilver assets. As this was a one-off transaction, the current year gain on divestiture of subsidiaries was $nil.
� Both foreign exchange (loss) gain and currency translation adjustment in the prior year were primarily driven by the reclassification of approximately $1.0 million from currency translationadjustment in other comprehensive loss into foreign exchange (loss) gain in net loss as a result of the Mexican silver asset divestiture transaction to Silver One. Given this was a one-offtransaction, both foreign exchange (loss) gain and currency translation adjustment were much lower in the current year.
� The marketable securities fair value loss in both years were driven by the mark-to-market loss on marketable securities. As a result of the early adoption of IFRS 9 as at January 1, 2017, thecurrent year marketable securities fair value loss was recognized in other comprehensive loss instead of net loss.
� In the prior year, the Company relinquished its permits in Burkina Faso, resulting in a write-down of mineral properties of $485,114.
FINANCIAL CONDITION, LIQUIDITY AND CAPITAL RESOURCES
Cash and Cash Equivalents
The decrease of $17,757,720 in cash and cash equivalents from $33,157,447 at December 31, 2016 to $15,399,727 at December 31, 2017 was primarily due to cash used in investing activitiescomprising of drilling, technical analysis, and Canadian mineral property exploration activities.
Operating Activities
Cash used in operating activities decreased by $1,765,961 during the year ended December 31, 2017 compared to the prior year. In the prior year, the higher cash used in operating activities wasprimarily driven by the payment of various liabilities associated with certain acquisitions, partially offset by the collection of recoverable sales tax as part of an acquisition.
Page 23
FIRST MINING GOLD CORP. (formerly known as First Mining Finance Corp.) Management Discussion & Analysis(Expressed in Canadian dollars, unless otherwise indicated) For the three months and year ended December 31, 2017
Year ended December 31,2017 2016
CASH PROVIDED BY (USED IN)Operating activities $ (5,313,585) $ (7,079,546) Investing activities (13,725,692) 7,038,187 Financing activities 1,360,935 32,542,594 Foreign exchange effect on cash (79,378) (27,396) CHANGE IN CASH AND CASH EQUIVALENTS (17,757,720) 32,473,839Working capital(1) 19,399,584 39,601,370 Cash and cash equivalents, beginning 33,157,447 683,608 Cash and cash equivalents, ending $ 15,399,727 $ 33,157,447
(1) Working capital is a non-IFRS measurement with no standardized meaning under IFRS. For further information and a detailed reconciliation, please see the section “Non-IFRSMeasures – Working Capital”.
Investing Activities
For the year ended December 31, 2017, the cash used in investing activities was primarily a result of Canadian mineral property expenditures given the Phase 1 and 2 drilling campaigns at Goldlundthroughout the year. In addition, the Company purchased certain marketable securities as a strategic investment that aligns with the Company’s corporate objectives. In the prior year, the cash providedby investing activities was primarily related to the $14,243,523 of cash acquired from certain acquisitions during the year, partially offset by mineral property expenditures and transaction costs.
Financing Activities
Cash provided by financing activities was much higher in the prior year as the Company completed a private placement equity financing and raised total gross proceeds of $27,000,000 in August 2016.
Trends in Liquidity, Working Capital, and Capital Resources
As at December 31, 2017, the Company has working capital of $19,399,584. The Company has no history of revenues from its operating activities. The Company is not in commercial production on anyof its mineral properties and accordingly does not generate cash from operations. During the year ended December 31, 2017, the Company had negative cash flow from operating activities, and theCompany anticipates it will have negative cash flow from operating activities in future periods.
The Company has, in the past, financed its activities by raising capital through equity issuances. Until it can generate positive cash flow to finance its exploration and development programs, theCompany will remain reliant on the equity markets for raising capital, in addition to adjusting spending, disposing of assets and obtaining other non-equity sources of financing.
The Company believes it has sufficient cash resources to meet its exploration, development, and administrative overhead expenses and maintain its planned exploration and development activities for thenext twelve months. However, there is no guarantee that the Company will be able to maintain sufficient working capital in the future due to market, economic and commodity price fluctuations.
OUTLOOK
First Mining is an emerging development company focused on acquiring, exploring, de-risking and, ultimately, advancing its high-quality mineral projects in Eastern Canada towards production. TheCompany’s key objective is to increase the economic value of its mineral property portfolio through exploration and/or development activities. As at December 31, 2017, the Company holds a portfolioof 25 mineral properties located in Canada, Mexico and the United States.
Capital investments have been underway throughout 2017 at certain of the Company’s Canadian mineral properties to improve site and camp infrastructure, which include core tents to hold largequantities of drill core and support drill core logging activities. Given the Company’s healthy working capital position of $19.4 million and no debt, additional geotechnical drilling and in-fill drilling areplanned at Springpole and Goldlund, respectively. Finally, the Company is actively conducting environmental studies at all Tier 1 Canadian mineral properties, is continuing First Nations communityconsultations, and expects to prepare for a pre-feasibility study for Springpole at some point in the future.
The Company’s milestones in the first half of 2018 are summarized in the chart on the following page.
Page 24
FIRST MINING GOLD CORP. (formerly known as First Mining Finance Corp.) Management Discussion & Analysis(Expressed in Canadian dollars, unless otherwise indicated) For the three months and year ended December 31, 2017
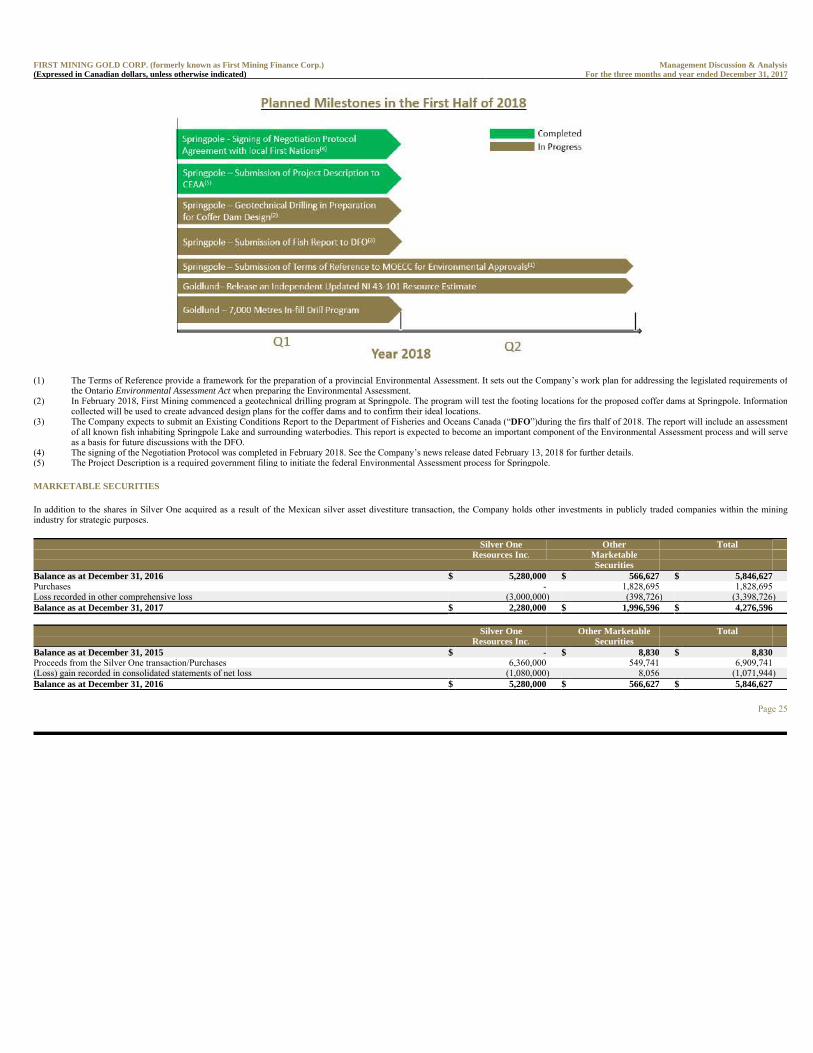
MARKETABLE SECURITIES
In addition to the shares in Silver One acquired as a result of the Mexican silver asset divestiture transaction, the Company holds other investments in publicly traded companies within the miningindustry for strategic purposes.
Page 25
FIRST MINING GOLD CORP. (formerly known as First Mining Finance Corp.) Management Discussion & Analysis(Expressed in Canadian dollars, unless otherwise indicated) For the three months and year ended December 31, 2017
(1) The Terms of Reference provide a framework for the preparation of a provincial Environmental Assessment. It sets out the Company’s work plan for addressing the legislated requirements ofthe Ontario Environmental Assessment Act when preparing the Environmental Assessment.
(2) In February 2018, First Mining commenced a geotechnical drilling program at Springpole. The program will test the footing locations for the proposed coffer dams at Springpole. Informationcollected will be used to create advanced design plans for the coffer dams and to confirm their ideal locations.
(3) The Company expects to submit an Existing Conditions Report to the Department of Fisheries and Oceans Canada (“DFO”)during the firs thalf of 2018. The report will include an assessmentof all known fish inhabiting Springpole Lake and surrounding waterbodies. This report is expected to become an important component of the Environmental Assessment process and will serveas a basis for future discussions with the DFO.
(4) The signing of the Negotiation Protocol was completed in February 2018. See the Company’s news release dated February 13, 2018 for further details. (5) The Project Description is a required government filing to initiate the federal Environmental Assessment process for Springpole.
Silver One Other TotalResources Inc. Marketable
SecuritiesBalance as at December 31, 2016 $ 5,280,000 $ 566,627 $ 5,846,627Purchases - 1,828,695 1,828,695 Loss recorded in other comprehensive loss (3,000,000) (398,726) (3,398,726) Balance as at December 31, 2017 $ 2,280,000 $ 1,996,596 $ 4,276,596
Silver One Other Marketable TotalResources Inc. Securities
Balance as at December 31, 2015 $ - $ 8,830 $ 8,830Proceeds from the Silver One transaction/Purchases 6,360,000 549,741 6,909,741 (Loss) gain recorded in consolidated statements of net loss (1,080,000) 8,056 (1,071,944) Balance as at December 31, 2016 $ 5,280,000 $ 566,627 $ 5,846,627
The marketable securities are classified as financial assets at fair value through other comprehensive income (loss) (“FVTOCI”), with a fair value loss of $3,398,726 recorded in other comprehensiveloss for the year ended December 31, 2017. Had the Company not early adopted IFRS 9 and redesignated all marketable securities as FVTOCI, the fair value loss would have been recorded in theconsolidated statements of net loss under IAS 39, as defined below. In the prior year, the Company recorded a fair value loss of $1,071,944 in the consolidated statements of net loss for the year endedDecember 31, 2016.
MINERAL PROPERTY INVESTMENTS
The Company, through its subsidiary Clifton Star, has a 10% equity interest in the shares of Beattie Gold Mines Ltd., 2699681 Canada Ltd., and 2588111 Manitoba Ltd., which directly or indirectly ownvarious mining concessions and surface rights, collectively known as the Duparquet Gold Project, and in which the Company holds a 10% indirect interest. As at December 31, 2017, the fair value ofmineral property investments was $4,416,780 (December 31, 2016 - $4,416,780).
The mineral property investments are classified as financial assets at FVTOCI. As at December 31, 2017, management concluded that there was no material change in the fair value of the mineralproperty investments.
Duparquet Gold Project, Québec
The Company’s 10% indirect interest in the Duparquet Gold Project was acquired through the acquisition of Clifton Star. The Duparquet Gold Project covers an area of 1,147 hectares and is located inthe Abitibi Region of Québec which is one of the world's most prolific gold producing regions. The Company owns a 10% indirect interest in the Duparquet Gold Project which, on a 100% basis, hostsmeasured mineral resources of 165,000 tonnes grading 1.45 g/t Au, containing 7,700 ounces Au, indicated mineral resources of 59.5 Mt grading 1.57 g/t Au, containing 3.0 million ounces Au andinferred mineral resources of 28.5 Mt grading 1.46 g/t Au, containing 1.3 million ounces Au. The technical report entitled “Technical Report and Prefeasibility Study for the Duparquet Project” was filedon SEDAR by Clifton Star on May 23, 2014. Infrastructure includes site roads, access to electrical power 15 km away, tailings storage facility and water management solutions and ancillary sitebuildings. The Duparquet Gold Project is currently comprised of three mineral properties: Beattie, Donchester and Dumico. The 2014 prefeasibility study includes pre-production capital costs of $394million, a pay-back period of 4.3 years and pre-tax NPV (5%) of $222 million at USD $1,300 per ounce of gold.
RELATED PARTY TRANSACTIONS
The Company’s related parties are its Directors and Officers, and any companies in which they control or have significant influence. The Company incurred the following related party expendituresduring the years ended December 31, 2017 and 2016:
Administration and office expenses include amounts paid to First Majestic, who provide office space and some administrative services to the Company. First Majestic’s President & CEO, CFO, and oneDirector are also Directors of the Company.
As at December 31, 2017, included in accounts payable is an amount of $nil (December 31, 2016 - $20,141) due to the Chief Executive Officer. Included in current liabilities is an amount of $nil(December 31, 2016 - $454,819) due to First Majestic relating to the outstanding loans payable, as well as $575 (December 31, 2016 - $1,487) due to First Majestic for administration and officeexpenses.
OFF-BALANCE SHEET ARRANGEMENTS
The Company has no off-balance sheet arrangements, as defined by applicable securities regulators in Canada or the United States that have, or are reasonably likely to have, a current or future materialeffect on our results of operations or financial condition.
Page 26
FIRST MINING GOLD CORP. (formerly known as First Mining Finance Corp.) Management Discussion & Analysis(Expressed in Canadian dollars, unless otherwise indicated) For the three months and year ended December 31, 2017
Service or Item Year ended December 31,2017 2016
Administration and office expenses $ 180,357 $ 192,813
NON-IFRS MEASURES – WORKING CAPITAL
The Company has included a non-IFRS measure for “working capital” in this MD&A to supplement its financial statements, which are presented in accordance with IFRS. The Company believes thatthis measure provides investors with an improved ability to evaluate the performance of the Company. Non-IFRS measures do not have any standardized meaning prescribed under IFRS. Therefore,such measures may not be comparable to similar measures employed by other companies. The data is intended to provide additional information and should not be considered in isolation or as asubstitute for measures of performance prepared in accordance with IFRS.
CHANGES IN ACCOUNTING POLICIES
The Company’s significant accounting policies and accounting estimates are contained in the consolidated annual financial statements for the year ended December 31, 2017. During the year endedDecember 31, 2017, the Company has adopted the following new accounting standards effective January 1, 2017:
IFRS 9 Financial Instruments
The Company early adopted all of the requirements of IFRS 9 Financial Instruments (“IFRS 9”) as of January 1, 2017. IFRS 9 replaces IAS 39 Financial Instruments: Recognition and Measurement(“IAS 39”). IFRS 9 utilizes a revised model for recognition and measurement of financial instruments and a single, forward-looking “expected loss” impairment model. Most of the requirements in IAS39 for classification and measurement of financial liabilities were carried forward in IFRS 9, so the Company’s accounting policy with respect to financial liabilities is unchanged.
As a result of the early adoption of IFRS 9, management has changed its accounting policy for financial assets retrospectively for assets that continued to be recognized at the date of initial application.The change did not impact the carrying value of any financial assets or financial liabilities on the transition date. The main area of change is the accounting for equity securities previously classified asfair value through profit and loss.
The following is the Company’s new accounting policy for financial instruments under IFRS 9.
(a) Classification
The Company classifies its financial instruments in the following categories: at fair value through profit and loss (“FVTPL”), at fair value through other comprehensive income (loss) (“FVTOCI”) or atamortized cost. The Company determines the classification of financial assets at initial recognition. The classification of debt instruments is driven by the Company’s business model for managing thefinancial assets and their contractual cash flow characteristics. Equity instruments that are held for trading are classified as FVTPL. For other equity instruments, on the day of acquisition the Companycan make an irrevocable election (on an instrument-by-instrument basis) to designate them as at FVTOCI. Financial liabilities are measured at amortized cost, unless they are required to be measured atFVTPL (such as instruments held for trading or derivatives) or the Company has opted to measure them at FVTPL.
Page 27
FIRST MINING GOLD CORP. (formerly known as First Mining Finance Corp.) Management Discussion & Analysis(Expressed in Canadian dollars, unless otherwise indicated) For the three months and year ended December 31, 2017
December December 31, 2017 2016
Current assets $ 20,482,424 $ 40,825,864 Less current liabilities 1,082,840 1,224,494 Working capital $ 19,399,584 $ 39,601,370
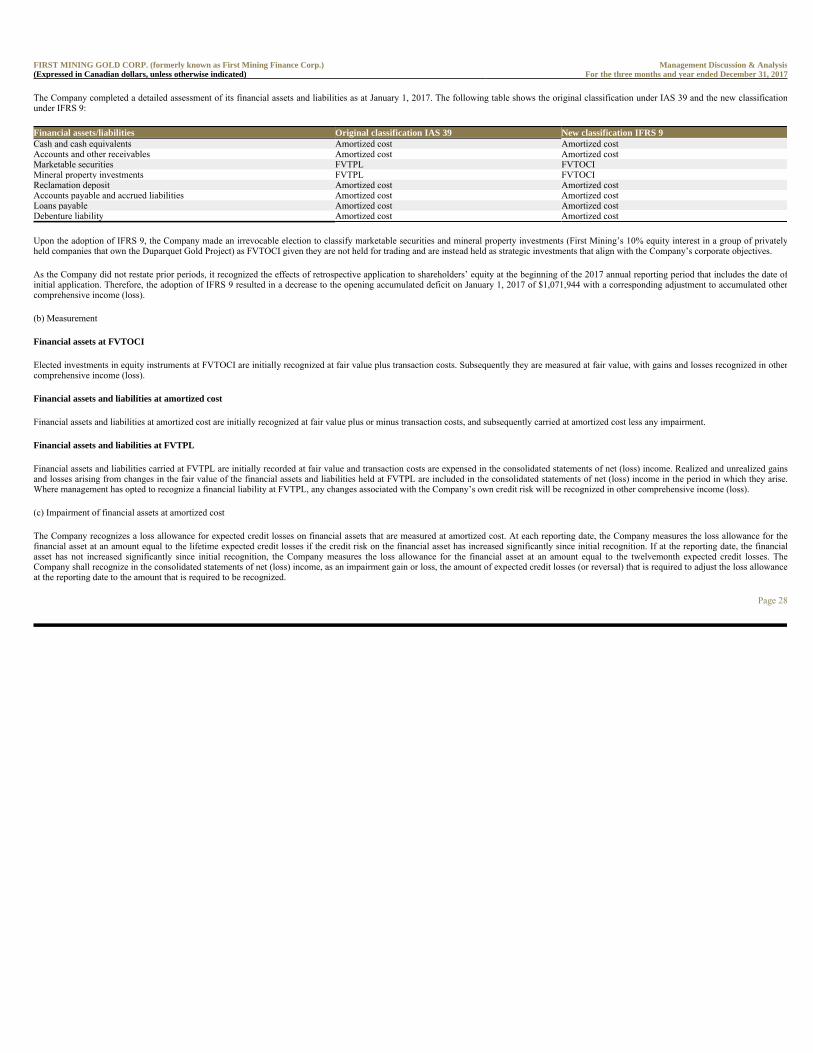
The Company completed a detailed assessment of its financial assets and liabilities as at January 1, 2017. The following table shows the original classification under IAS 39 and the new classificationunder IFRS 9:
Upon the adoption of IFRS 9, the Company made an irrevocable election to classify marketable securities and mineral property investments (First Mining’s 10% equity interest in a group of privatelyheld companies that own the Duparquet Gold Project) as FVTOCI given they are not held for trading and are instead held as strategic investments that align with the Company’s corporate objectives.
As the Company did not restate prior periods, it recognized the effects of retrospective application to shareholders’ equity at the beginning of the 2017 annual reporting period that includes the date ofinitial application. Therefore, the adoption of IFRS 9 resulted in a decrease to the opening accumulated deficit on January 1, 2017 of $1,071,944 with a corresponding adjustment to accumulated othercomprehensive income (loss).
(b) Measurement
Financial assets at FVTOCI
Elected investments in equity instruments at FVTOCI are initially recognized at fair value plus transaction costs. Subsequently they are measured at fair value, with gains and losses recognized in othercomprehensive income (loss).
Financial assets and liabilities at amortized cost
Financial assets and liabilities at amortized cost are initially recognized at fair value plus or minus transaction costs, and subsequently carried at amortized cost less any impairment.
Financial assets and liabilities at FVTPL
Financial assets and liabilities carried at FVTPL are initially recorded at fair value and transaction costs are expensed in the consolidated statements of net (loss) income. Realized and unrealized gainsand losses arising from changes in the fair value of the financial assets and liabilities held at FVTPL are included in the consolidated statements of net (loss) income in the period in which they arise.Where management has opted to recognize a financial liability at FVTPL, any changes associated with the Company’s own credit risk will be recognized in other comprehensive income (loss).
(c) Impairment of financial assets at amortized cost
The Company recognizes a loss allowance for expected credit losses on financial assets that are measured at amortized cost. At each reporting date, the Company measures the loss allowance for thefinancial asset at an amount equal to the lifetime expected credit losses if the credit risk on the financial asset has increased significantly since initial recognition. If at the reporting date, the financialasset has not increased significantly since initial recognition, the Company measures the loss allowance for the financial asset at an amount equal to the twelvemonth expected credit losses. TheCompany shall recognize in the consolidated statements of net (loss) income, as an impairment gain or loss, the amount of expected credit losses (or reversal) that is required to adjust the loss allowanceat the reporting date to the amount that is required to be recognized.
Page 28
FIRST MINING GOLD CORP. (formerly known as First Mining Finance Corp.) Management Discussion & Analysis(Expressed in Canadian dollars, unless otherwise indicated) For the three months and year ended December 31, 2017
Financial assets/liabilities Original classification IAS 39 New classification IFRS 9Cash and cash equivalents Amortized cost Amortized cost Accounts and other receivables Amortized cost Amortized cost Marketable securities FVTPL FVTOCI Mineral property investments FVTPL FVTOCI Reclamation deposit Amortized cost Amortized cost Accounts payable and accrued liabilities Amortized cost Amortized cost Loans payable Amortized cost Amortized cost Debenture liability Amortized cost Amortized cost
(d) Derecognition
Financial assets
The Company derecognizes financial assets only when the contractual rights to cash flows from the financial assets expire, or when it transfers the financial assets and substantially all of the associatedrisks and rewards of ownership to another entity. Gains and losses on derecognition are generally recognized in the consolidated statements of net (loss) income. However, gains and losses onderecognition of financial assets classified as FVTOCI remain within the accumulated other comprehensive income (loss).
Financial liabilities
The Company derecognizes financial liabilities only when its obligations under the financial liabilities are discharged, cancelled or expired. The difference between the carrying amount of the financialliability derecognized and the consideration paid and payable, including any non-cash assets transferred or liabilities assumed, is recognized in the consolidated statements of net (loss) income.
ACCOUNTING STANDARDS ISSUED BUT NOT YET APPLIED
The following are accounting standards anticipated to be effective January 1, 2018 or later:
IFRS 15 Revenue from Contracts with Customers
IFRS 15 will replace IAS 18 “Revenue”, IAS 11 “Construction Contracts”, and related interpretations on revenue. IFRS 15 establishes a single five-step model for determining the nature, amount,timing and uncertainty of revenue and cash flows arising from a contract with a customer. Application of the standard is mandatory for annual periods beginning on or after January 1, 2018, with earlyapplication permitted. As the Company has no revenue, no impact on the Company’s consolidated financial statements is expected.
IFRS 16 Leases
IFRS 16 will replace IAS 17 “Leases”. IFRS 16 specifies how to recognize, measure, present and disclose leases. The standard provides a single lessee accounting model, requiring lessees to recognizeassets and liabilities for all leases unless the lease term is 12 months or less or the underlying asset has a low value. Application of the standard is mandatory for annual periods beginning on or afterJanuary 1, 2019, with early application permitted. IFRS 16 will result in an increase in assets and liabilities as fewer lease payments will be expensed. Management expects an increase in depreciationexpenses and also an increase in cash flow from operating activities as these lease payments will be recorded as financing outflows in the consolidated statements of cash flows. Currently, these impactsare not expected to be material.
There are no other IFRS or International Financial Reporting Interpretations Committee interpretations that are not yet effective that would be expected to have a material impact on the Company’sconsolidated financial statements.
CRITICAL ACCOUNTING JUDGMENTS AND ESTIMATES
The preparation of financial statements requires the use of accounting estimates. It also requires management to exercise judgment in the process of applying its accounting policies. Estimates andjudgments are regularly evaluated and are based on management’s experience and other factors, including expectations about future events that are believed to be reasonable under the circumstances.The following discusses the accounting judgments and estimates that the Company has made in the preparation of the audited consolidated financial statements for the year ended December 31, 2017,which could result in a material adjustment to the carrying amounts of assets and liabilities:
Page 29
FIRST MINING GOLD CORP. (formerly known as First Mining Finance Corp.) Management Discussion & Analysis(Expressed in Canadian dollars, unless otherwise indicated) For the three months and year ended December 31, 2017
Impairment of mineral properties:
In accordance with the Company’s accounting policy for its mineral properties, exploration and evaluation expenditures on mineral properties are capitalized. There is no certainty that the expendituresmade by the Company in the exploration of its property interests will result in discoveries of commercial quantities of minerals. The Company applies judgment to determine whether indicators ofimpairment exist for these capitalized costs.
Management uses several criteria in making this assessment, including the period for which the Company has the right to explore, expected renewals of exploration rights, whether substantiveexpenditures on further exploration and evaluation of mineral properties are budgeted, and evaluation of the results of exploration and evaluation activities up to the reporting date.
Determining amount and timing of reclamation provisions:
A reclamation provision represents the present value of estimated future costs for the reclamation of the Company’s mineral properties. These estimates include assumptions as to the future activities,cost of services, timing of the reclamation work to be performed, inflation rates, exchange rates and interest rates. The actual cost to reclaim a mine may vary from the estimated amounts because thereare uncertainties in factors used to estimate the cost and potential changes in regulations or laws governing the reclamation of a mineral property. Management periodically reviews the reclamationrequirements and adjusts the liability as new information becomes available and will assess the impact of new regulations and laws as they are enacted.
Mineral Property Investments:
The Company makes estimates and assumptions that affect the carrying value of its mineral property investments, which are comprised of equity interests in the shares of private companies. Thesefinancial assets are designated as fair value through other comprehensive income (loss), and management needs to determine the fair value as at each period end. As there is no observable market datawhich can be used to determine this fair value, management applies judgment in determining whether a significant change in the fair value of this investment may have occurred. Factors that areconsidered include a change in the performance of the investee, a change in the market for the investee’s future products, a change in the performance of comparable entities, a change in the economicenvironment, or evidence from external transactions in the investee’s equity. Changes to these variables could result in the fair value being less than or greater than the amount recorded.
RISKS AND UNCERTAINTIES
The Company is subject to a number of risks and uncertainties, each of which could have an adverse effect on its business operation or financial results. Some of these risks and uncertainties are detailedbelow. For a comprehensive list of the Company’s risks and uncertainties, see the Company’s Annual Information Form for the year ended December 31, 2017 under the heading “Risks that can affectour business” which was filed on SEDAR and on EDGAR as an exhibit to Form 40-F.
Risks related to Financial Instruments
The Company thoroughly examines the various financial instruments and risks to which it is exposed and assesses the impact and likelihood of those risks. These risks include market risk, price risk,foreign currency risk, interest rate risk, credit risk, liquidity risk, and capital risk. Where material, these risks are reviewed and monitored by the Company’s Board of Directors (the “Board”).
The Board has overall responsibility for the determination of the Company’s risk management objectives and policies. The overall objective of the Board is to set policies that seek to reduce risk as faras possible without unduly affecting the Company’s competitiveness and flexibility.
Page 30
FIRST MINING GOLD CORP. (formerly known as First Mining Finance Corp.) Management Discussion & Analysis(Expressed in Canadian dollars, unless otherwise indicated) For the three months and year ended December 31, 2017
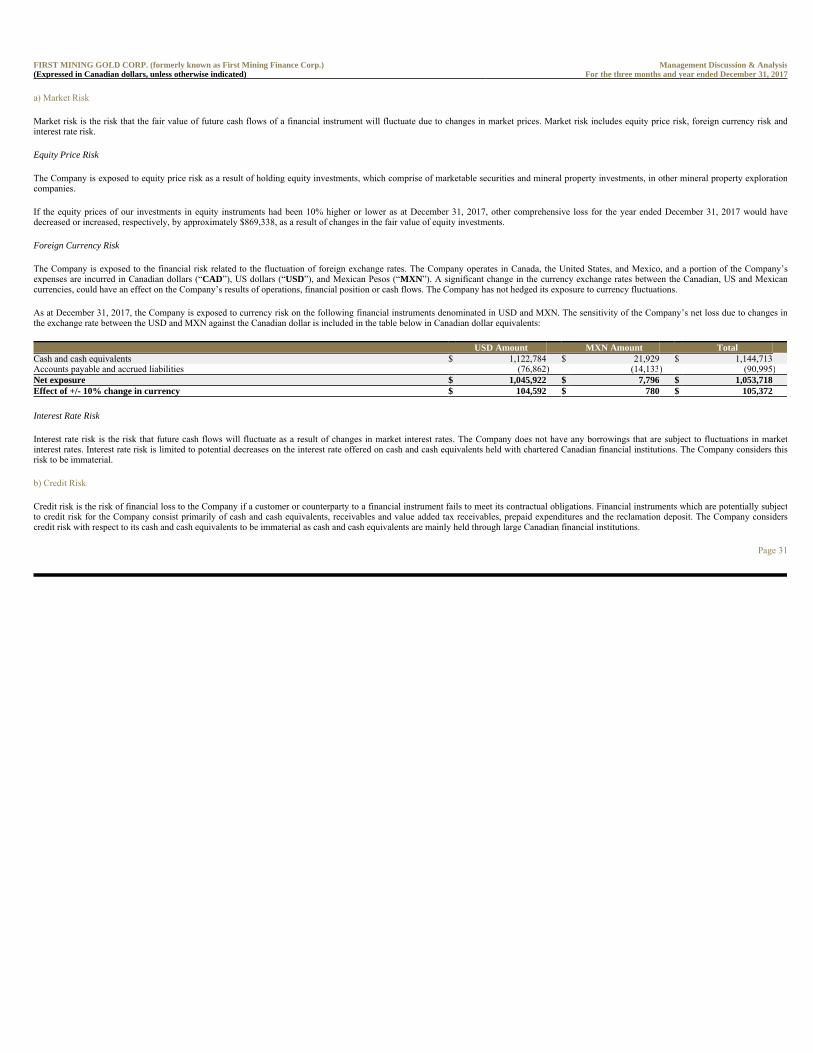
a) Market Risk
Market risk is the risk that the fair value of future cash flows of a financial instrument will fluctuate due to changes in market prices. Market risk includes equity price risk, foreign currency risk andinterest rate risk.
Equity Price Risk
The Company is exposed to equity price risk as a result of holding equity investments, which comprise of marketable securities and mineral property investments, in other mineral property explorationcompanies.
If the equity prices of our investments in equity instruments had been 10% higher or lower as at December 31, 2017, other comprehensive loss for the year ended December 31, 2017 would havedecreased or increased, respectively, by approximately $869,338, as a result of changes in the fair value of equity investments.
Foreign Currency Risk
The Company is exposed to the financial risk related to the fluctuation of foreign exchange rates. The Company operates in Canada, the United States, and Mexico, and a portion of the Company’sexpenses are incurred in Canadian dollars (“CAD”), US dollars (“USD”), and Mexican Pesos (“MXN”). A significant change in the currency exchange rates between the Canadian, US and Mexicancurrencies, could have an effect on the Company’s results of operations, financial position or cash flows. The Company has not hedged its exposure to currency fluctuations.
As at December 31, 2017, the Company is exposed to currency risk on the following financial instruments denominated in USD and MXN. The sensitivity of the Company’s net loss due to changes inthe exchange rate between the USD and MXN against the Canadian dollar is included in the table below in Canadian dollar equivalents:
Interest Rate Risk
Interest rate risk is the risk that future cash flows will fluctuate as a result of changes in market interest rates. The Company does not have any borrowings that are subject to fluctuations in marketinterest rates. Interest rate risk is limited to potential decreases on the interest rate offered on cash and cash equivalents held with chartered Canadian financial institutions. The Company considers thisrisk to be immaterial.
b) Credit Risk
Credit risk is the risk of financial loss to the Company if a customer or counterparty to a financial instrument fails to meet its contractual obligations. Financial instruments which are potentially subjectto credit risk for the Company consist primarily of cash and cash equivalents, receivables and value added tax receivables, prepaid expenditures and the reclamation deposit. The Company considerscredit risk with respect to its cash and cash equivalents to be immaterial as cash and cash equivalents are mainly held through large Canadian financial institutions.
Page 31
FIRST MINING GOLD CORP. (formerly known as First Mining Finance Corp.) Management Discussion & Analysis(Expressed in Canadian dollars, unless otherwise indicated) For the three months and year ended December 31, 2017
USD Amount MXN Amount TotalCash and cash equivalents $ 1,122,784 $ 21,929 $ 1,144,713 Accounts payable and accrued liabilities (76,862) (14,133) (90,995)Net exposure $ 1,045,922 $ 7,796 $ 1,053,718Effect of +/- 10% change in currency $ 104,592 $ 780 $ 105,372
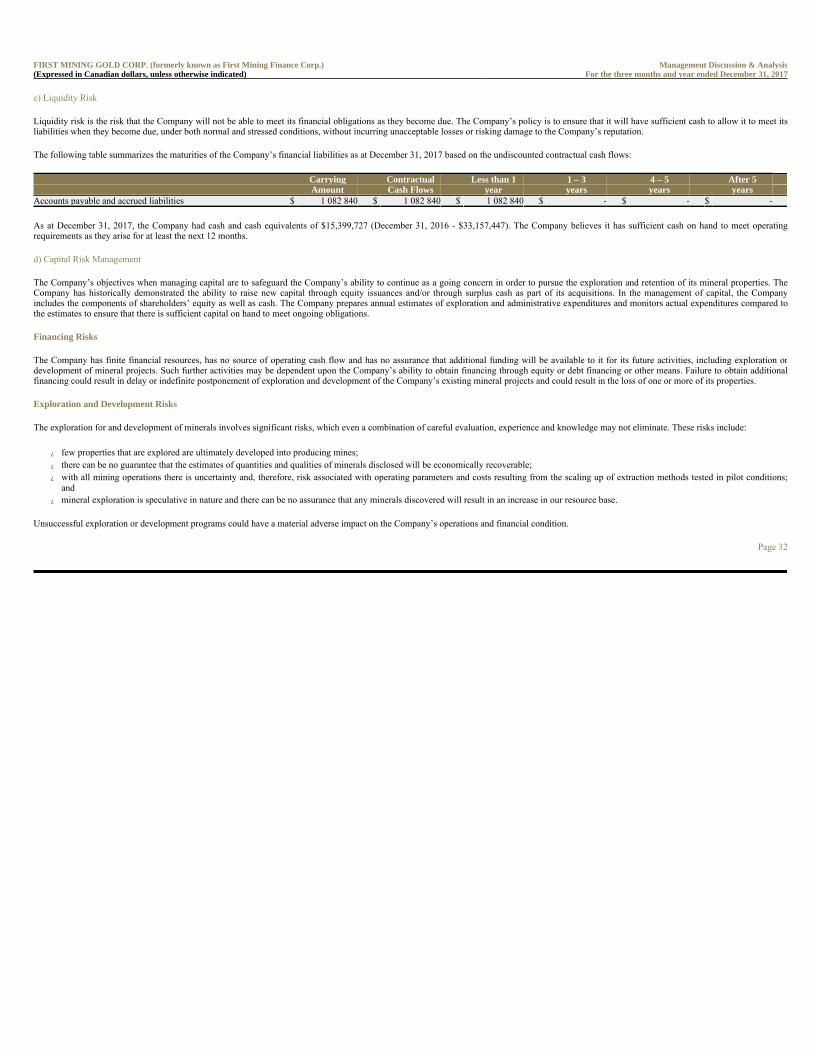
c) Liquidity Risk
Liquidity risk is the risk that the Company will not be able to meet its financial obligations as they become due. The Company’s policy is to ensure that it will have sufficient cash to allow it to meet itsliabilities when they become due, under both normal and stressed conditions, without incurring unacceptable losses or risking damage to the Company’s reputation.
The following table summarizes the maturities of the Company’s financial liabilities as at December 31, 2017 based on the undiscounted contractual cash flows:
As at December 31, 2017, the Company had cash and cash equivalents of $15,399,727 (December 31, 2016 - $33,157,447). The Company believes it has sufficient cash on hand to meet operatingrequirements as they arise for at least the next 12 months.
d) Capital Risk Management
The Company’s objectives when managing capital are to safeguard the Company’s ability to continue as a going concern in order to pursue the exploration and retention of its mineral properties. TheCompany has historically demonstrated the ability to raise new capital through equity issuances and/or through surplus cash as part of its acquisitions. In the management of capital, the Companyincludes the components of shareholders’ equity as well as cash. The Company prepares annual estimates of exploration and administrative expenditures and monitors actual expenditures compared tothe estimates to ensure that there is sufficient capital on hand to meet ongoing obligations.
Financing Risks
The Company has finite financial resources, has no source of operating cash flow and has no assurance that additional funding will be available to it for its future activities, including exploration ordevelopment of mineral projects. Such further activities may be dependent upon the Company’s ability to obtain financing through equity or debt financing or other means. Failure to obtain additionalfinancing could result in delay or indefinite postponement of exploration and development of the Company’s existing mineral projects and could result in the loss of one or more of its properties.
Exploration and Development Risks
The exploration for and development of minerals involves significant risks, which even a combination of careful evaluation, experience and knowledge may not eliminate. These risks include:
� few properties that are explored are ultimately developed into producing mines; � there can be no guarantee that the estimates of quantities and qualities of minerals disclosed will be economically recoverable; � with all mining operations there is uncertainty and, therefore, risk associated with operating parameters and costs resulting from the scaling up of extraction methods tested in pilot conditions;
and � mineral exploration is speculative in nature and there can be no assurance that any minerals discovered will result in an increase in our resource base.
Unsuccessful exploration or development programs could have a material adverse impact on the Company’s operations and financial condition.
Page 32
FIRST MINING GOLD CORP. (formerly known as First Mining Finance Corp.) Management Discussion & Analysis(Expressed in Canadian dollars, unless otherwise indicated) For the three months and year ended December 31, 2017
Carrying Contractual Less than 1 1 – 3 4 – 5 After 5Amount Cash Flows year years years years
Accounts payable and accrued liabilities $ 1 082 840 $ 1 082 840 $ 1 082 840 $ - $ - $ -
No History of Mineral Production
The Company has no history of commercially producing metals from its mineral exploration properties. There can be no assurance that the Company or any other party will successfully establish miningoperations or profitably produce gold or other precious metals on any of the Company’s properties. The development of mineral properties involves a high degree of risk and few properties that areexplored are ultimately developed into producing mines. The commercial viability of a mineral deposit is dependent upon a number of factors which are beyond the Company’s control, including theattributes of the deposit, commodity prices, government policies and regulation and environmental protection. Fluctuations in the market prices of minerals may render reserves and deposits containingrelatively lower grades of mineralization uneconomic.
None of the Company’s properties are currently under development or production. The future development of any properties found to be economically feasible will require applicable licenses andpermits and will require the construction and operation of mines, processing plants and related infrastructure. As a result, the development of any property will be subject to all of the risks associatedwith establishing new mining operations and business enterprises, including, but not limited to:
� the timing and cost of the construction of mining and processing facilities; � the availability and costs of skilled labour and mining equipment; � the availability and cost of appropriate smelting and/or refining arrangements; � the need to obtain necessary environmental and other governmental approvals and permits and the timing of those approvals and permits; and � the availability of funds to finance construction and development activities.
It is common in new mining operations to experience unexpected problems and delays during development, construction and mine start-up. In addition, delays in the commencement of mineralproduction often occur. Accordingly, there are no assurances that the Company’s activities will result in profitable mining operations or that mining operations will be established at any of theCompany’s properties.
Acquisition of Business Arrangements
As part of the Company’s business strategy, First Mining has sought and may continue to seek to acquire new mining and exploration opportunities. In pursuit of such opportunities, the Company mayfail to select appropriate acquisition targets or negotiate acceptable arrangements, including arrangements to finance acquisitions or integrate the acquired businesses into the Company. Ultimately, anyacquisitions would be accompanied by risks, which could include:
� a significant change in commodity prices after the Company has committed to complete the transaction and established the purchase price or exchange ratio; � a material ore body could prove to be below expectations; � difficulty in integrating and assimilating the operations and workforce of any acquired companies; � realizing anticipated synergies and maximizing the financial and strategic position of the combined enterprise; � the bankruptcy of parties with whom the Company has arrangements; � maintaining uniform standards, policies and controls across the organization; � disruption of our ongoing business and relationships with employees, suppliers, contractors and other stakeholders as the Company integrates the acquired business or assets; � the acquired business or assets may have unknown liabilities which may be significant; � delays as a result of regulatory approvals; and � exposure to litigation (including actions commenced by shareholders) in connection with the transaction.
Any material issues that the Company encounters in connection with an acquisition could have a material adverse effect on its business, results of operations and financial position.
Page 33
FIRST MINING GOLD CORP. (formerly known as First Mining Finance Corp.) Management Discussion & Analysis(Expressed in Canadian dollars, unless otherwise indicated) For the three months and year ended December 31, 2017
Mineral Reserves/Mineral Resources
The properties in which the Company holds an interest are currently considered to be in the exploration stage only and do not contain a known body of commercial minerals beyond the PEA level.Mineral resources and mineral reserves are, in large part, estimates and no assurance can be given that any anticipated tonnages and grades will be achieved or that a particular level of recovery will berealized.
Mineral resources on the Company’s properties have been determined based upon assumed metal prices and operating costs at the time of calculation, as set out in the applicable technical reports. Actualproduction could differ dramatically from resource and reserve estimates because, among other reasons:
� mineralization or formations could be different from those predicted by drilling, sampling and similar examinations; � calculation errors could be made in estimating mineral resources and mineral reserves; � increases in operating mining costs and processing costs could adversely affect mineral resources and mineral reserves; � the grade of the mineral resources and mineral reserves may vary significantly from time to time and there is no assurance that any particular level of metals may be recovered from the ore; and � declines in the market price of the metals may render the mining of some or all of the mineral reserves uneconomic.
Estimated mineral resources may require downward revisions based on changes in metal prices, further exploration or development activity, increased production costs or actual production experience.This could materially and adversely affect estimates of the tonnage or grade of mineralization, estimated recovery rates or other important factors that influence mineral resource and mineral reserveestimates.
Any reduction in estimated mineral resources as a result could require material write downs in investment in the affected mining property and increased amortization, reclamation and closure charges,which could have a material and adverse effect on future cash flows for the property and on the Company’s earnings, results of operations and financial condition.
Because the Company does not currently have any producing properties, mineralization estimates for its properties may require adjustments or downward revisions based upon further exploration ordevelopment work or actual future production experience. In addition, the grade of mineralized material ultimately mined, if any, may differ from that indicated by drilling results. There can be noassurance that minerals recovered in small-scale tests will be duplicated in large-scale tests under on- site conditions or in production scale.
The mineral resource estimates contained in this MD&A have been determined and valued based on assumed future prices, cut-off grades and operating costs that may prove to be inaccurate. Extendeddeclines in market prices for gold or other metals may render portions of our mineralization uneconomic and result in reduced reported mineralization. Any material reductions in mineralizationestimates, or of the ability to extract mineralized material from our properties, could (directly or indirectly) have a material adverse effect on the Company’s results of operations or financial condition.
Substantial Capital Requirements
The Company’s management team anticipates that it may make substantial capital expenditures for the exploration and development of properties in the future. As the Company is in the explorationstage with no revenue being generated from the exploration activities on its mineral properties, the Company has limited ability to raise the capital necessary to undertake or complete future explorationwork, including drilling programs. There can be no assurance that debt or equity financing will be available or sufficient to meet these requirements or for other corporate purposes or, if debt or equityfinancing is available, that it will be on terms acceptable to the Company and any such financing may result in substantial dilution to existing shareholders. Moreover, future activities may require theCompany to alter its capitalization significantly. The Company’s inability to access sufficient capital for its operations could have a material adverse effect on the Company’s financial condition, resultsof operations or prospects. In particular, failure to obtain such financing on a timely basis could cause the Company to forfeit its interest in certain properties, miss certain acquisition opportunities andreduce or terminate its operations.
Page 34
FIRST MINING GOLD CORP. (formerly known as First Mining Finance Corp.) Management Discussion & Analysis(Expressed in Canadian dollars, unless otherwise indicated) For the three months and year ended December 31, 2017
History of Net Losses
The Company hasn’t received any revenue to date from activities on its properties, and there is no assurance that any of its properties will generate earnings, operate profitably or provide a return oninvestment in the future. The Company has not determined that production activity is warranted on any of its mineral properties. Even if the Company (alone or in conjunction with a third party)undertakes development and production activities on any of its mineral properties, there is no certainty that the Company will produce revenue, operate profitably or provide a return on investment in thefuture. The Company is subject to all of the risks associated with new mining operations and business enterprises including, but not limited to:
� the timing and cost, which can be considerable, for the future construction of mining and processing facilities; � the availability and costs of skilled labour, consultants, mining equipment and supplies; � the availability and cost of appropriate smelting and/or refining arrangements; � the need to first obtain necessary environmental and other governmental approvals, licenses and permits, and the timing of those approvals, licenses and permits; and � the availability of funds to finance construction and development activities.
It is common in new mining operations to experience unexpected problems and delays during construction, development, and mine start-up. In addition, delays in mineral production often occur.Accordingly, there are no assurances that the Company’s activities will result in sustainable profitable mining operations or that we will successfully establish mining operations or profitably producemetals at any of its properties.
Global Financial Conditions
Global financial conditions continue to be characterized by volatility. Many industries, including the mining industry, are impacted by volatile market conditions. Global financial conditions remainsubject to sudden and rapid destabilizations in response to economic shocks. A slowdown in the financial markets or other economic conditions, including but not limited to consumer spending,employment rates, business conditions, inflation, fluctuations in fuel and energy costs, consumer debt levels, lack of available credit, the state of the financial markets, interest rates and tax rates, mayadversely affect the Company’s growth and financial condition. Future economic shocks may be precipitated by a number of causes, including government debt levels, fluctuations in the price of oil andother commodities, volatility of metal prices, geopolitical instability, terrorism, volatility of currency exchanges, devaluation and volatility of global stock markets and natural disasters. Any sudden orrapid destabilization of global economic conditions could impact the Company’s ability to obtain equity or debt financing in the future on terms favourable to the Company or at all. In such an event, theCompany’s operations and financial condition could be adversely impacted.
Indigenous Peoples
Various international and national laws, codes, court decisions, resolutions, conventions, guidelines, and other materials relate to the rights of Indigenous peoples including the First Nations of Canada.The Company operates in areas presently or previously inhabited or used by Indigenous peoples including areas covered by treaties among the First Nations, the federal and applicable provincialgovernments. Many of these materials impose obligations on government to respect the rights of Indigenous people. Some mandate that government consult with Indigenous people regardinggovernment actions which may affect Indigenous people, including actions to approve or grant mining rights or exploration, development or production permits. The obligations of government andprivate parties under the various international and national materials pertaining to Indigenous people continue to evolve and be defined. The Company’s current and future exploration program may besubject to a risk that one or more groups of Indigenous people may oppose development on any of its properties or on properties in which it holds a direct or indirect interest. Such opposition may bedirected through legal or administrative proceedings or expressed in manifestations such as protests, roadblocks or other forms of public expression against the Company’s activities. Opposition byIndigenous people to the Company’s operations may require modification of or preclude development of its projects or may require the Company to enter into agreements with Indigenous people withrespect to projects on such properties. Such agreements may have a material adverse effect on the Company’s business, financial condition and results of operations.
Page 35
FIRST MINING GOLD CORP. (formerly known as First Mining Finance Corp.) Management Discussion & Analysis(Expressed in Canadian dollars, unless otherwise indicated) For the three months and year ended December 31, 2017

Environmental Laws and Regulations
All phases of the mining business present environmental risks and hazards and are subject to environmental regulation pursuant to a variety of international conventions and federal, provincial and locallaws and regulations. Environmental legislation provides for, among other things, restrictions and prohibitions on spills, releases or emissions of various substances produced in association with miningoperations. The legislation also requires that mines and exploration sites be operated, maintained, abandoned and reclaimed to the satisfaction of applicable regulatory authorities. Compliance with suchlegislation can require significant expenditures and a breach may result in the imposition of fines and penalties, some of which may be material. Environmental legislation is evolving in a mannerexpected to result in stricter standards and enforcement, larger fines and liability and potentially increased capital expenditures and operating costs. Environmental Assessments of proposed projectscarry a heightened degree of responsibility for companies and Directors, Officers and employees. The cost of compliance with changes in governmental regulations has a potential to reduce theprofitability of operations.
The Company believes it is in substantial compliance with all material laws and regulations which currently apply to its activities. The Company cannot give any assurance that, notwithstanding itsprecautions and limited history of activities, breaches of environmental laws (whether inadvertent or not) or environmental pollution will not result in additional costs or curtailment of planned activitiesand investments, which could have a material adverse effect on the Company’s future cash flows, earnings, results of operations and financial condition. Failure to comply with applicable laws,regulations, and permitting requirements may result in enforcement actions thereunder, including orders issued by regulatory or judicial authorities causing operations to cease or be curtailed, and mayinclude corrective measures requiring capital expenditures, installation of additional equipment, or remedial actions. Companies engaged in mining operations may be required to compensate thosesuffering loss or damage by reason of the mining activities and may have civil or criminal fines or penalties imposed for violations of applicable laws or regulations and, in particular, environmentallaws.
Amendments to current laws, regulations and permits governing operations and activities of mining companies, or more stringent implementation thereof, could have a material adverse impact on theCompany and cause increases in capital expenditures or any future production costs or require abandonment or delays in the development of new mining properties.
Companies engaged in the exploration and development of mineral properties may from time to time experience increased costs and delays in exploration and production as a result of the need tocomply with applicable laws, regulations and permits. The Company believes it is in substantial compliance with all material laws and regulations which currently apply to its activities. First Miningcannot give any assurance that, notwithstanding our precautions and limited history of activities, breaches of environmental laws (whether inadvertent or not) or environmental pollution will not result inadditional costs or curtailment of planned activities and investments, which could have a material and adverse effect on our future cash flows, earnings, results of operations and financial condition.
Title Risks
Title to mineral properties, as well as the location of boundaries on the grounds may be disputed. Moreover, additional amounts may be required to be paid to surface right owners in connection with anymineral exploration or development activities. At all properties where the Company has current or planned exploration activities, it believes that it has either contractual, statutory, or common law rightsto make such use of the surface as is reasonably necessary in connection with those activities.
Title insurance generally is not available for mining claims in Canada, and the Company’s ability to ensure that it has obtained secure claims to individual mineral properties or mining concessions maybe severely constrained. The Company has not conducted surveys of all of its claims; therefore, the precise area and location of such claims may be in doubt. In addition, all of the Company’s mineralproperties have had previous owners, and third parties may have valid claims (known or unknown) underlying our interests therein. Accordingly, the Company’s properties may be subject to priorunregistered liens, agreements, royalties, transfers or claims, including First Nations land claims, and title may be affected by, among other things, undetected defects. In addition, the Company may beunable to explore our properties as permitted or to enforce our rights with respect to its properties. An impairment to or defect in the Company’s title to its properties could have a material adverse effecton its business, financial condition or results of operation.
Page 36
FIRST MINING GOLD CORP. (formerly known as First Mining Finance Corp.) Management Discussion & Analysis(Expressed in Canadian dollars, unless otherwise indicated) For the three months and year ended December 31, 2017
Compliance with Laws
The Company’s activities are subject to government approvals, various laws governing prospecting, development, land resumptions, production taxes, labour standards and occupational health, minesafety, toxic substances and other matters, including issues affecting local First Nations populations. The costs associated with compliance with these laws and regulations can be substantial. Althoughthe Company believes its activities are carried out in accordance with all applicable rules and regulations, no assurance can be given that new rules and regulations will not be enacted or that existingrules and regulations will not be applied in a manner which could limit or curtail production or development, or cause additional expense, capital expenditures, restrictions or delays in the developmentof its properties. Amendments to current laws and regulations governing operations and activities of exploration and mining, or more stringent implementation thereof, could have a material adverseimpact on our business, operations and financial performance. Further, the mining licenses and permits issued in respect of our projects may be subject to conditions which, if not satisfied, may lead tothe revocation of such licenses. In the event of revocation, the value of the Company’s investments in such projects may decline.
The Company’s mineral claims, licenses and permits are subject to periodic renewal and may only be renewed a limited number of times for a limited period of time. While the Company anticipates thatrenewals will be given as and when sought, there is no assurance that such renewals will be given as a matter of course and there is no assurance that new conditions will not be imposed in connectiontherewith. The Company’s business objectives may also be impeded by the costs of holding and/or renewing the mineral claims, licenses and permits. In addition, the duration and success of efforts toobtain and renew mineral claims, licenses and permits are contingent upon many variables not within the Company’s control.
The Company’s current and anticipated future operations, including further exploration, development activities and commencement of production on its properties, require licenses and permits fromvarious governmental authorities. The Company cannot be certain that all licenses and permits that it may require for its operations will be obtainable on reasonable terms or at all. Delays or a failure toobtain such licenses and permits, or a failure to comply with the terms of any such licenses and permits that we have obtained, could have a material adverse impact on First Mining.
Climate Change
Governments at all levels may be moving towards enacting legislation to address climate change concerns, such as requirements to reduce emission levels and increase energy efficiency, and politicaland economic events may significantly affect the scope and timing of climate change measures that are ultimately put in place. Where legislation has already been enacted, such regulations may becomemore stringent, which may result in increased costs of compliance. There is no assurance that compliance with such regulations will not have an adverse effect on the Company’s results of operationsand financial condition. Furthermore, given the evolving nature of the debate related to climate change and resulting requirements, it is not possible to predict the impact on the Company’s results ofoperations and financial condition.
Climate change may result in an increasing frequency of extreme weather events (such as increased periods of snow and increased frequency and intensity of storms) which have the potential to disruptour exploration and development plans. The Company’s emergency plans for managing extreme weather conditions may not be sufficient and extended disruptions could have adverse effects on ourresults of operations and financial condition.
Key Persons
The Company manages its business with a number of key personnel, including key contractors, the loss of a number of whom could have a material adverse effect on the Company. In addition, as itsbusiness develops and expands, the Company believes that its future success will depend greatly on our continued ability to attract and retain highly-skilled and qualified personnel and contractors. Inassessing the risk of an investment in the Company’s shares, potential investors should realize that they are relying on the experience, judgment, discretion, integrity and good faith of our managementteam and Board of Directors. The Company cannot be certain that key personnel will continue to be employed by it or that it will be able to attract and retain qualified personnel and contractors in thefuture. Failure to retain or attract key personnel could have a material adverse effect on the Company. The Company does not maintain “key person” insurance policies in respect of its key personnel.
Page 37
FIRST MINING GOLD CORP. (formerly known as First Mining Finance Corp.) Management Discussion & Analysis(Expressed in Canadian dollars, unless otherwise indicated) For the three months and year ended December 31, 2017
FINANCIAL LIABILITIES AND COMMITMENTS
The Company’s financial liabilities and commitments as at December 31, 2017 are summarized as follows:
Management is of the view that the above financial liabilities and commitments will be sufficiently funded by current working capital.
QUALIFIED PERSONS
Dr. Christopher Osterman, P.Geo, COO of First Mining, is a Qualified Person as defined by NI 43-101, and is responsible for the review and verification of the scientific and technical information in thisMD&A.
SECURITIES OUTSTANDING
Authorized share capital: The Company can issue an unlimited number of common shares with no par value and an unlimited number of preferred shares with no par value. No preferred shares havebeen issued as at March 21, 2018.
All share information in the following table is reported as of March 21, 2018.
There were a total of 7,332,273 common shares of the Company held in escrow under the Escrow Value Security Agreement dated March 30, 2015. Under this agreement, 10% of the shares werereleased immediately and 15% will be released every six months thereafter with the final release being on March 30, 2018. As at December 31, 2017, there were 1,099,842 common shares of theCompany in escrow (December 31, 2016 – 3,299,524).
There were a total of 1,369,500 common shares of the Company held in escrow under the CPC Escrow Agreement dated August 2, 2005. On March 30, 2015, 10% of the common shares were releasedand 15% will be released every six months thereafter with the final release being March 30, 2018. As at December 31, 2017, there were 194,425 common shares of the Company in escrow (December31, 2016 – 583,275).
With the acquisition of Tamaka on June 16, 2016, certain shareholders have deposited the First Mining shares received into escrow. Twenty percent of such escrowed shares were released from escrowon June 17, 2017, and an additional 20% will be released every six months thereafter, with the final tranche released on June 17, 2019. As at December 31, 2017 there were a total of 17,794,974 sharesheld in escrow as a result of the Tamaka transaction (December 31, 2016 – 29,658,290).
Page 38
FIRST MINING GOLD CORP. (formerly known as First Mining Finance Corp.) Management Discussion & Analysis(Expressed in Canadian dollars, unless otherwise indicated) For the three months and year ended December 31, 2017
Contractual Less than 1 1 – 3 4 – 5 After 5Cash Flows year years years years
Accounts payable and accrued liabilities $ 1,082,840 $ 1,082,840 $ - $ - $ -Commitments 47,252 47,252 - - -Total $ 1,130,092 $ 1,130,092 $ - $ - $ -
Number Weighted Average Expiry DateExercise Price
Common shares – issued 557,471,616Stock options(1) 40,019,000 $0.71 April 8, 2018 – January 15, 2023 Warrants(2) 44,933,409 $0.88 April 19, 2018 – June 16, 2021 Common shares - fully diluted 642,424,025
(1) Each stock option is convertible into one common share of the Company.(2) Each warrant is convertible into one common share of the Company.
DISCLOSURE CONTROLS AND PROCEDURES
The Company’s management, with the participation of its CEO” and its Chief Financial Officer (“CFO”), have evaluated the effectiveness of the Company’s disclosure controls and procedures. Basedupon the results of that evaluation, the Company’s CEO and CFO have concluded that, as of December 31, 2017, the Company’s disclosure controls and procedures were effective to provide reasonableassurance that the information required to be disclosed by the Company in reports it files is recorded, processed, summarized and reported, within the appropriate time periods and is accumulated andcommunicated to management, including the CEO and CFO, as appropriate to allow timely decisions regarding required disclosure.
MANAGEMENT’S REPORT ON INTERNAL CONTROL OVER FINANCIAL REPORTING
The Company’s management, with the participation of its CEO and CFO, is responsible for establishing and maintaining adequate internal control over financial reporting as such term is defined in theSEC’s rules and the rules of the Canadian Securities Administrators. The Company’s internal control over financial reporting is a process designed to provide reasonable assurance regarding thereliability of financial reporting and the preparation of financial statements for external purposes in accordance with IFRS as issued by the IASB. The Company’s internal control over financial reportingincludes policies and procedures that:
� maintaining records that accurately and fairly reflect, in reasonable detail, the transactions and dispositions of assets of the Company; � provide reasonable assurance that transactions are recorded as necessary for preparation of financial statements in accordance with IFRS; � provide reasonable assurance that the Company’s receipts and expenditures are made only in accordance with authorizations of management and the Company’s Directors; and � provide reasonable assurance regarding prevention or timely detection of unauthorized acquisition, use, or disposition of the Company’s assets that could have a material effect on the Company’s
consolidated financial statements.
The Company’s internal control over financial reporting may not prevent or detect all misstatements because of inherent limitations. Additionally, projections of any evaluation of effectiveness for futureperiods are subject to the risk that controls may become inadequate because of changes in conditions or deterioration in the degree of compliance with the Company’s policies and procedures.
The Company's management evaluated the effectiveness of our ICFR based upon the Internal Control - Integrated Framework (2013) issued by the Committee of Sponsoring Organizations of theTreadway Commission. Based on management's evaluation, our CEO and CFO concluded that our ICFR was effective as of December 31, 2017.
There has been no change in the Company's internal control over financial reporting during the year ended December 31, 2017 that has materially affected, or is reasonably likely to materially affect, theCompany's internal control over financial reporting.
LIMITATIONS OF CONTROLS AND PROCEDURES
The Company’s management, including the Chief Executive Officer and Chief Financial Officer, believes that any disclosure controls and procedures or internal control over financial reporting, nomatter how well conceived and operated, may not prevent or detect all misstatements because of inherent limitations. Further, the design of a control system must reflect the fact that there are resourceconstraints, and the benefits of controls must be considered relative to their costs. Because of the inherent limitations in all control systems, they cannot provide absolute assurance that all control issuesand instances of fraud, if any, within the Company have been prevented or detected. These inherent limitations include the realities that judgments in decision-making can be faulty, and that breakdownscan occur because of a simple error or mistake. Additionally, controls can be circumvented by the individual acts of some persons, by collusion of two or more people, or by unauthorized override of thecontrol. The design of any control system is also based in part upon certain assumptions about the likelihood of future events, and there can be no assurance that any design will succeed in achieving itsstated goals under all potential future conditions. Accordingly, because of the inherent limitations in a cost effective control system, misstatements due to error or fraud may occur and may not bedetected.
Page 39
FIRST MINING GOLD CORP. (formerly known as First Mining Finance Corp.) Management Discussion & Analysis(Expressed in Canadian dollars, unless otherwise indicated) For the three months and year ended December 31, 2017

CERTIFICATION PURSUANT TO SECTION 302 OF THESARBANES-OXLEY ACT OF 2002
I, Jeff Swinoga, certify that:
1. I have reviewed this annual report on Form 40-F of First Mining Gold Corp.;
2. Based on my knowledge, this report does not contain any untrue statement of a material fact or omit to state a material fact necessary to make the statements made, in light of the circumstancesunder which such statements were made, not misleading with respect to the period covered by this report;
3. Based on my knowledge, the financial statements, and other financial information included in this report, fairly present in all material respects the financial condition, results of operations andcash flows of the issuer as of, and for, the periods presented in this report;
4. The issuer’s other certifying officer and I are responsible for establishing and maintaining disclosure controls and procedures (as defined in Exchange Act Rules 13a-15(e) and 15d-15(e)) andinternal control over financial reporting (as defined in Exchange Act Rules 13a-15(f) and 15d-15(f)) for the issuer and have:
(a) Designed such disclosure controls and procedures, or caused such disclosure controls and procedures to be designed under our supervision, to ensure that material informationrelating to the issuer, including its consolidated subsidiaries, is made known to us by others within those entities, particularly during the period in which this report is being prepared;
(b) Designed such internal control over financial reporting, or caused such internal control over financial reporting to be designed under our supervision, to provide reasonable assuranceregarding the reliability of financial reporting and the preparation of financial statements for external purposes in accordance with generally accepted accounting principles;
(c) Evaluated the effectiveness of the issuer’s disclosure controls and procedures and presented in this report our conclusions about the effectiveness of the disclosure controls andprocedures, as of the end of the period covered by this report based on such evaluation; and

Date: March 22, 2018
(d) Disclosed in this report any change in the issuer’s internal control over financial reporting that occurred during the period covered by the annual report that has materially affected, oris reasonably likely to materially affect, the issuer’s internal control over financial reporting; and
5. The issuer’s other certifying officer and I have disclosed, based on our most recent evaluation of internal control over financial reporting, to the issuer’s auditors and the audit committee of theissuer’s board of directors (or persons performing the equivalent functions):
(a) All significant deficiencies and material weaknesses in the design or operation of internal control over financial reporting which are reasonably likely to adversely affect the issuer’sability to record, process, summarize and report financial information; and
(b) Any fraud, whether or not material, that involves management or other employees who have a significant role in the issuer’s internal control over financial reporting.
/s/ Jeff SwinogaJeff Swinoga President and Chief Executive Officer (Principal Executive Officer)
CERTIFICATION PURSUANT TO SECTION 302 OF THESARBANES-OXLEY ACT OF 2002
I, Andrew Marshall, certify that:
1. I have reviewed this annual report on Form 40-F of First Mining Gold Corp.;
2. Based on my knowledge, this report does not contain any untrue statement of a material fact or omit to state a material fact necessary to make the statements made, in light of the circumstancesunder which such statements were made, not misleading with respect to the period covered by this report;
3. Based on my knowledge, the financial statements, and other financial information included in this report, fairly present in all material respects the financial condition, results of operations andcash flows of the issuer as of, and for, the periods presented in this report;
4. The issuer’s other certifying officer and I are responsible for establishing and maintaining disclosure controls and procedures (as defined in Exchange Act Rules 13a-15(e) and 15d-15(e)) andinternal control over financial reporting (as defined in Exchange Act Rules 13a-15(f) and 15d-15(f)) for the issuer and have:
(a) Designed such disclosure controls and procedures, or caused such disclosure controls and procedures to be designed under our supervision, to ensure that material informationrelating to the issuer, including its consolidated subsidiaries, is made known to us by others within those entities, particularly during the period in which this report is being prepared;
(b) Designed such internal control over financial reporting, or caused such internal control over financial reporting to be designed under our supervision, to provide reasonable assuranceregarding the reliability of financial reporting and the preparation of financial statements for external purposes in accordance with generally accepted accounting principles;
(c) Evaluated the effectiveness of the issuer’s disclosure controls and procedures and presented in this report our conclusions about the effectiveness of the disclosure controls andprocedures, as of the end of the period covered by this report based on such evaluation; and

Date: March 22, 2018
(d) Disclosed in this report any change in the issuer’s internal control over financial reporting that occurred during the period covered by the annual report that has materially affected, oris reasonably likely to materially affect, the issuer’s internal control over financial reporting; and
5. The issuer’s other certifying officer and I have disclosed, based on our most recent evaluation of internal control over financial reporting, to the issuer’s auditors and the audit committee of theissuer’s board of directors (or persons performing the equivalent functions):
(a) All significant deficiencies and material weaknesses in the design or operation of internal control over financial reporting which are reasonably likely to adversely affect the issuer’sability to record, process, summarize and report financial information; and
(b) Any fraud, whether or not material, that involves management or other employees who have a significant role in the issuer’s internal control over financial reporting.
/s/ Andrew MarshallAndrew Marshall Chief Financial Officer (Principal Financial Officer and) Principal Accounting Officer

CERTIFICATION PURSUANT TOSECTION 906 OF THE SARBANES-OXLEY ACT OF 2002
The undersigned, Jeff Swinoga, hereby certifies, pursuant to Section 906 of the Sarbanes-Oxley Act of 2002, that:
Date: March 22, 2018
(a) the annual report on Form 40-F of First Mining Gold Corp. for the year ended December 31, 2017 fully complies with the requirements of section 13(a) or 15(d) of the SecuritiesExchange Act of 1934; and
(b) information contained in the Form 40-F fairly presents, in all material respects, the financial condition and results of operations of First Mining Gold Corp.
/s/ Jeff SwinogaJeff Swinoga President and Chief Executive Officer (Principal Executive Officer)

CERTIFICATION PURSUANT TOSECTION 906 OF THE SARBANES-OXLEY ACT OF 2002
The undersigned, Andrew Marshall, hereby certifies, pursuant to Section 906 of the Sarbanes-Oxley Act of 2002, that:
Date: March 22, 2018
(a) the annual report on Form 40-F of First Mining Gold Corp. for the year ended December 31, 2017 fully complies with the requirements of section 13(a) or 15(d) of the SecuritiesExchange Act of 1934; and
(b) information contained in the Form 40-F fairly presents, in all material respects, the financial condition and results of operations of First Mining Gold Corp.
/s/ Andrew MarshallAndrew Marshall Chief Financial Officer (Principal Financial Officer and) Principal Accounting Officer
March 22, 2018
VIA EDGAR
United States Securities and Exchange Commission
This letter is provided in connection with the Company’s Form 40-F annual report for the year ended December 31, 2017 (the “Annual Report”) to be filed by the Company with the United StatesSecurities and Exchange Commission (the “SEC”). The Annual Report incorporates by reference the Annual Information Form of the Company for the year ended December 31, 2017.
I, Dr. Gilles Arseneau, Ph.D., P.Geo., of SRK Consulting (Canada) Inc., hereby consent to the use of my name in connection with reference to my involvement in the preparation of the followingtechnical report:
“Preliminary Economic Assessment Update for the Springpole Gold Project, Ontario, Canada” dated October 16, 2017 (the “Technical Report”).
and to references to the Technical Report, or portions thereof, in the Annual Report and to the inclusion and incorporation by reference of the information derived from the Technical Report in theAnnual Report.
Re: First Mining Gold Corp. (the “Company”) Annual Report on Form 40-F Consent of Expert
Yours truly,
/s/ Dr. Gilles Arseneau, Ph.D., P.Geo. Dr. Gilles Arseneau, Ph.D., P.Geo. Associate Consultant (Geology) SRK Consulting (Canada) Inc.

March 22, 2018
VIA EDGAR
United States Securities and Exchange Commission
This letter is provided in connection with the Company’s Form 40-F annual report for the year ended December 31, 2017 (the “Annual Report”) to be filed by the Company with the United StatesSecurities and Exchange Commission (the “SEC”). The Annual Report incorporates by reference the Annual Information Form of the Company for the year ended December 31, 2017.
I, Dr. Adrian Dance, Ph.D., P.Eng., of SRK Consulting (Canada) Inc., hereby consent to the use of my name in connection with reference to my involvement in the preparation of the following technicalreport:
“Preliminary Economic Assessment Update for the Springpole Gold Project, Ontario, Canada” dated October 16, 2017 (the “Technical Report”).
and to references to the Technical Report, or portions thereof, in the Annual Report and to the inclusion and incorporation by reference of the information derived from the Technical Report in theAnnual Report.
Re: First Mining Gold Corp. (the “Company”) Annual Report on Form 40-F Consent of Expert
Yours truly,
/s/ Dr. Adrian Dance, Ph.D., P.Eng. Dr. Adrian Dance, Ph.D., P.Eng. Principal Consultant (Metallurgy) SRK Consulting (Canada) Inc.
March 22, 2018
VIA EDGAR
United States Securities and Exchange Commission
This letter is provided in connection with the Company’s Form 40-F annual report for the year ended December 31, 2017 (the “Annual Report”) to be filed by the Company with the United StatesSecurities and Exchange Commission (the “SEC”). The Annual Report incorporates by reference the Annual Information Form of the Company for the year ended December 31, 2017.
I, Victor Munoz, P.Eng., M.Eng., of SRK Consulting (Canada) Inc., hereby consent to the use of my name in connection with reference to my involvement in the preparation of the following technicalreport:
“Preliminary Economic Assessment Update for the Springpole Gold Project, Ontario, Canada” dated October 16, 2017 (the “Technical Report”).
and to references to the Technical Report, or portions thereof, in the Annual Report and to the inclusion and incorporation by reference of the information derived from the Technical Report in theAnnual Report.
Yours truly,
/s/ Victor Munoz, P.Eng., M.Eng. Victor Munoz, P.Eng., M.Eng. Senior Consultant (Water Resources Engineering) SRK Consulting (Canada) Inc.
Re: First Mining Gold Corp. (the “Company”) Annual Report on Form 40-F Consent of Expert
March 22, 2018
VIA EDGAR
United States Securities and Exchange Commission
This letter is provided in connection with the Company’s Form 40-F annual report for the year ended December 31, 2017 (the “Annual Report”) to be filed by the Company with the United StatesSecurities and Exchange Commission (the “SEC”). The Annual Report incorporates by reference the Annual Information Form of the Company for the year ended December 31, 2017.
I, Grant Carlson, P.Eng., of SRK Consulting (Canada) Inc., hereby consent to the use of my name in connection with reference to my involvement in the preparation of the following technical report:
“Preliminary Economic Assessment Update for the Springpole Gold Project, Ontario, Canada” dated October 16, 2017 (the “Technical Report”).
and to references to the Technical Report, or portions thereof, in the Annual Report and to the inclusion and incorporation by reference of the information derived from the Technical Report in theAnnual Report.
Yours truly,
/s/ Grant Carlson, P.Eng. Grant Carlson, P.Eng. Senior Consultant (Mining) SRK Consulting (Canada) Inc.
Re: First Mining Gold Corp. (the “Company”) Annual Report on Form 40-F Consent of Expert
March 22, 2018
VIA EDGAR
United States Securities and Exchange Commission
This letter is provided in connection with the Company’s Form 40-F annual report for the year ended December 31, 2017 (the “Annual Report”) to be filed by the Company with the United StatesSecurities and Exchange Commission (the “SEC”). The Annual Report incorporates by reference the Annual Information Form of the Company for the year ended December 31, 2017.
I, Neil Winkelmann, FAusIMM, of SRK Consulting (Canada) Inc., hereby consent to the use of my name in connection with reference to my involvement in the preparation of the following technicalreport:
“Preliminary Economic Assessment Update for the Springpole Gold Project, Ontario, Canada” dated October 16, 2017 (the “Technical Report”).
and to references to the Technical Report, or portions thereof, in the Annual Report and to the inclusion and incorporation by reference of the information derived from the Technical Report in theAnnual Report.
Re: First Mining Gold Corp. (the “Company”) Annual Report on Form 40-F Consent of Expert
Yours truly,
/s/ Neil Winkelmann, FAusIMMNeil Winkelmann, FAusIMM Principal Consultant (Mining) SRK Consulting (Canada) Inc.

March 22, 2018
VIA EDGAR
United States Securities and Exchange Commission
This letter is provided in connection with the Company’s Form 40-F annual report for the year ended December 31, 2017 (the “Annual Report”) to be filed by the Company with the United StatesSecurities and Exchange Commission (the “SEC”). The Annual Report incorporates by reference the Annual Information Form of the Company for the year ended December 31, 2017.
I, Bruce Andrew Murphy, P.Eng., of SRK Consulting (Canada) Inc., hereby consent to the use of my name in connection with reference to my involvement in the preparation of the following technicalreport:
“Preliminary Economic Assessment Update for the Springpole Gold Project, Ontario, Canada” dated October 16, 2017 (the “Technical Report”).
and to references to the Technical Report, or portions thereof, in the Annual Report and to the inclusion and incorporation by reference of the information derived from the Technical Report in theAnnual Report.
Re: First Mining Gold Corp. (the “Company”) Annual Report on Form 40-F Consent of Expert
Yours truly,
/s/ Bruce Andrew Murphy, P.Eng.Bruce Andrew Murphy, P.Eng. Principal Consultant (Geotechnical) SRK Consulting (Canada) Inc.
March 22, 2018
VIA EDGAR
United States Securities and Exchange Commission
This letter is provided in connection with the Company’s Form 40-F annual report for the year ended December 31, 2017 (the “Annual Report”) to be filed by the Company with the United StatesSecurities and Exchange Commission (the “SEC”). The Annual Report incorporates by reference the Annual Information Form of the Company for the year ended December 31, 2017.
I, Michael Royle, M.App.Sci., P.Geo., of SRK Consulting (Canada) Inc., hereby consent to the use of my name in connection with reference to my involvement in the preparation of the followingtechnical report:
“Preliminary Economic Assessment Update for the Springpole Gold Project, Ontario, Canada” dated October 16, 2017 (the “Technical Report”).
and to references to the Technical Report, or portions thereof, in the Annual Report and to the inclusion and incorporation by reference of the information derived from the Technical Report in theAnnual Report.
Re: First Mining Gold Corp. (the “Company”) Annual Report on Form 40-F Consent of Expert
Yours truly,
/s/ Michael Royle, M.App.Sci., P.Geo.Michael Royle, M.App.Sci., P.Geo. Principal Consultant (Hydrogeology) SRK Consulting (Canada) Inc.

March 22, 2018
VIA EDGAR
United States Securities and Exchange Commission
This letter is provided in connection with the Company’s Form 40-F annual report for the year ended December 31, 2017 (the “Annual Report”) to be filed by the Company with the United StatesSecurities and Exchange Commission (the “SEC”). The Annual Report incorporates by reference the Annual Information Form of the Company for the year ended December 31, 2017.
I, Dr. Ewoud Maritz Rykaart, Ph.D., P.Eng., of SRK Consulting (Canada) Inc., hereby consent to the use of my name in connection with reference to my involvement in the preparation of the followingtechnical report:
“Preliminary Economic Assessment Update for the Springpole Gold Project, Ontario, Canada” dated October 16, 2017 (the “Technical Report”).
and to references to the Technical Report, or portions thereof, in the Annual Report and to the inclusion and incorporation by reference of the information derived from the Technical Report in theAnnual Report.
Re: First Mining Gold Corp. (the “Company”) Annual Report on Form 40-F Consent of Expert
Yours truly,
/s/ Dr. EM Rykaart, Ph.D., P.Eng.Dr. EM Rykaart, Ph.D., P.Eng. Principal Consultant (Geotechnical Engineering) SRK Consulting (Canada) Inc.
March 22, 2018
VIA EDGAR
United States Securities and Exchange Commission
This letter is provided in connection with the Company’s Form 40-F annual report for the year ended December 31, 2017 (the “Annual Report”) to be filed by the Company with the United StatesSecurities and Exchange Commission (the “SEC”). The Annual Report incorporates by reference the Annual Information Form of the Company for the year ended December 31, 2017.
I, Mark Liskowich, P.Geo., of SRK Consulting (Canada) Inc., hereby consent to the use of my name in connection with reference to my involvement in the preparation of the following technical report:
“Preliminary Economic Assessment Update for the Springpole Gold Project, Ontario, Canada” dated October 16, 2017 (the “Technical Report”).
and to references to the Technical Report, or portions thereof, in the Annual Report and to the inclusion and incorporation by reference of the information derived from the Technical Report in theAnnual Report.
Re: First Mining Gold Corp. (the “Company”) Annual Report on Form 40-F Consent of Expert
Yours truly,
/s/ Mark Liskowich, P.Geo.Mark Liskowich, P.Geo. Principal Consultant (Environmental) SRK Consulting (Canada) Inc.
March 22, 2018
VIA EDGAR
United States Securities and Exchange Commission
This letter is provided in connection with the Company’s Form 40-F annual report for the year ended December 31, 2017 (the “Annual Report”) to be filed by the Company with the United StatesSecurities and Exchange Commission (the “SEC”). The Annual Report incorporates by reference the Annual Information Form of the Company for the year ended December 31, 2017.
I, Todd McCracken, P.Geo., of WSP Canada Inc., hereby consent to the use of my name in connection with reference to my involvement in the preparation of the following technical report:
“Technical Report and Resource Estimation Update on the Goldlund Project”, with an effective date of September 20, 2016 (the “Technical Report”).
and to references to the Technical Report, or portions thereof, in the Annual Report and to the inclusion and incorporation by reference of the information derived from the Technical Report in theAnnual Report.
Re: First Mining Gold Corp. (the “Company”) Annual Report on Form 40-F Consent of Expert
Yours truly,
/s/ Todd McCracken, P.Geo.Todd McCracken, P.Geo. Manager – Mining WSP Canada Inc.

March 22, 2018
VIA EDGAR
United States Securities and Exchange Commission
This letter is provided in connection with the Company’s Form 40-F annual report for the year ended December 31, 2017 (the “Annual Report”) to be filed by the Company with the United StatesSecurities and Exchange Commission (the “SEC”). The Annual Report incorporates by reference the Annual Information Form of the Company for the year ended December 31, 2017.
I, Mark Drabble, B.App.Sci (Geology), MAIG, MAusIMM, of Optiro Pty Limited, hereby consent to the use of my name in connection with reference to my involvement in the preparation of thefollowing technical report:
“Technical Report on the Cameron Gold Deposit, Ontario, Canada”, with an effective date of January 17, 2017 (the “Technical Report”).
and to references to the Technical Report, or portions thereof, in the Annual Report and to the inclusion and incorporation by reference of the information derived from the Technical Report in theAnnual Report.
Re: First Mining Gold Corp. (the “Company”) Annual Report on Form 40-F Consent of Expert
Yours truly,
/s/ Mark Drabble, B.App.Sci (Geology), MAIG, MAusIMMMark Drabble, B.App.Sci (Geology), MAIG, MAusIMM Principal Consultant Optiro Pty Limited
March 22, 2018
VIA EDGAR
United States Securities and Exchange Commission
This letter is provided in connection with the Company’s Form 40-F annual report for the year ended December 31, 2017 (the “Annual Report”) to be filed by the Company with the United StatesSecurities and Exchange Commission (the “SEC”). The Annual Report incorporates by reference the Annual Information Form of the Company for the year ended December 31, 2017.
I, Kahan Cervoj, B.App.Sci (Geology), MAIG, MAusIMM, of Optiro Pty Limited, hereby consent to the use of my name in connection with reference to my involvement in the preparation of thefollowing technical report:
“Technical Report on the Cameron Gold Deposit, Ontario, Canada”, with an effective date of January 17, 2017 (the “Technical Report”).
and to references to the Technical Report, or portions thereof, in the Annual Report and to the inclusion and incorporation by reference of the information derived from the Technical Report in theAnnual Report.
Re: First Mining Gold Corp. (the “Company”) Annual Report on Form 40-F Consent of Expert
Yours truly,
/s/ Kahan Cervoj, B.App.Sci (Geology), MAIG, MAusIMMKahan Cervoj, B.App.Sci (Geology), MAIG, MAusIMM Principal Consultant Optiro Pty Limited
March 22, 2018
VIA EDGAR
United States Securities and Exchange Commission
This letter is provided in connection with the Company’s Form 40-F annual report for the year ended December 31, 2017 (the “Annual Report”) to be filed by the Company with the United StatesSecurities and Exchange Commission (the “SEC”). The Annual Report incorporates by reference the Annual Information Form of the Company for the year ended December 31, 2017.
I, B. Terrence Hennessey, P.Geo., of Micon International Limited, hereby consent to the use of my name in connection with reference to my involvement in the preparation of the following technicalreport:
“A Mineral Resource Estimate For The Pickle Crow Property, Patricia Mining Division, Northwestern Ontario, Canada”, dated June 2, 2011 (the “Technical Report”).
and to references to the Technical Report, or portions thereof, in the Annual Report and to the inclusion and incorporation by reference of the information derived from the Technical Report in theAnnual Report.
Re: First Mining Gold Corp. (the “Company”) Annual Report on Form 40-F Consent of Expert
Yours truly,
/s/ B. Terrence Hennessey, P.Geo. B. Terrence Hennessey, P.Geo. Micon International Limited
March 22, 2018
VIA EDGAR
United States Securities and Exchange Commission
This letter is provided in connection with the Company’s Form 40-F annual report for the year ended December 31, 2017 (the “Annual Report”) to be filed by the Company with the United StatesSecurities and Exchange Commission (the “SEC”). The Annual Report incorporates by reference the Annual Information Form of the Company for the year ended December 31, 2017.
I, Alan J. San Martin, MAusIMM(CP), of Micon International Limited, hereby consent to the use of my name in connection with reference to my involvement in the preparation of the followingtechnical report:
“A Mineral Resource Estimate For The Pickle Crow Property, Patricia Mining Division, Northwestern Ontario, Canada”, dated June 2, 2011 (the “Technical Report”).
and to references to the Technical Report, or portions thereof, in the Annual Report and to the inclusion and incorporation by reference of the information derived from the Technical Report in theAnnual Report.
Re: First Mining Gold Corp. (the “Company”) Annual Report on Form 40-F Consent of Expert
Yours truly,
/s/ Alan J. San Martin, MAusIMM(CP)Alan J. San Martin, MAusIMM(CP) Micon International Limited
March 22, 2018
VIA EDGAR
United States Securities and Exchange Commission
This letter is provided in connection with the Company’s Form 40-F annual report for the year ended December 31, 2017 (the “Annual Report”) to be filed by the Company with the United StatesSecurities and Exchange Commission (the “SEC”). The Annual Report incorporates by reference the Annual Information Form of the Company for the year ended December 31, 2017.
I, Sam J. Shoemaker, Jr., B.Sc., Registered Member SME, hereby consent to the use of my name in connection with reference to my involvement in the preparation of the following technical report:
“A Mineral Resource Estimate For The Pickle Crow Property, Patricia Mining Division, Northwestern Ontario, Canada”, dated June 2, 2011 (the “Technical Report”).
and to references to the Technical Report, or portions thereof, in the Annual Report and to the inclusion and incorporation by reference of the information derived from the Technical Report in theAnnual Report.
Re: First Mining Gold Corp. (the “Company”) Annual Report on Form 40-F Consent of Expert
Yours truly,
/s/ Sam J. Shoemaker, Jr., B.Sc., Reg’d Mem SMESam J. Shoemaker, Jr., B.Sc., Reg’d Mem SME

March 22, 2018
VIA EDGAR
United States Securities and Exchange Commission
This letter is provided in connection with the Company’s Form 40-F annual report for the year ended December 31, 2017 (the “Annual Report”) to be filed by the Company with the United StatesSecurities and Exchange Commission (the “SEC”). The Annual Report incorporates by reference the Annual Information Form of the Company for the year ended December 31, 2017.
I, Michael P. Cullen, M.Sc., P.Geo., of Mercator Geological Services Limited, hereby consent to the use of my name in connection with reference to my involvement in the preparation of the followingtechnical report:
“2015 Mineral Resource Estimate Technical Report for the Hope Brook Gold Project, Newfoundland and Labrador, Canada (the “Technical Report”).
and to references to the Technical Report, or portions thereof, in the Annual Report and to the inclusion and incorporation by reference of the information derived from the Technical Report in theAnnual Report.
Re: First Mining Gold Corp. (the “Company”) Annual Report on Form 40-F Consent of Expert
Yours truly,
/s/ Michael P. Cullen, M.Sc., P.Geo.Michael P. Cullen, M.Sc., P.Geo. Mercator Geological Services Limited

Consent of Independent Auditor
We hereby consent to the incorporation by reference in this Annual Report on Form 40-F for the year ended December 31, 2017 of First Mining Gold Corp. of our report dated March 21, 2018, relatingto the consolidated financial statements which appear in the Exhibit incorporated by reference in this Annual Report.
(Signed) “PricewaterhouseCoopers LLP”
PricewaterhouseCoopers LLP Chartered Professional Accountants
Vancouver, Canada March 21, 2018
CONSENT OF INDEPENDENT REGISTERED PUBLIC ACCOUNTING FIRM
We consent to the use of our report dated March 27, 2017 relating to the consolidated financial statements of First Mining Gold Corp. (formerly First Mining Finance Corp.) and its subsidiaries (“FirstMining”) appearing in this Annual Report on Form 40-F of First Mining for the year ended December 31, 2017.
/s/ “BDO Canada LLP”
Chartered Professional Accountants Vancouver, Canada
March 21, 2018
BDO Canada LLP, a Canadian limited liability partnership, is a member of BDO International Limited, a UK company limited by guarantee, and forms part of the international BDO network of independent member firms.
Tel: 604 688 5421 Fax: 604 688 5132 www.bdo.ca
BDO Canada LLP 600 Cathedral Place 925 West Georgia Street Vancouver BC V6C 3L2 Canada
FIRST MINING GOLD CORP.
AUDIT COMMITTEE CHARTER
The Committee has the responsibility to:
1. INTRODUCTION
(a) The audit committee (the “Committee”) is appointed by the board of directors (the “Board”) of First Mining Gold Corp. (the “Company”) to be responsible for the oversight of theaccounting and financial reporting process and financial statement audits of the Company.
(b) This charter is prepared to assist the Committee, the Board and management in clarifying responsibilities and ensuring effective communication between the Committee, the Board andmanagement.
2. COMPOSITION
(a) The Committee will be composed of three directors from the Board, a majority of whom will be independent (as defined in National Instrument 58-101 Disclosure of Corporate Governance Practices).
(b) All members of the Committee will be financially literate as defined by applicable legislation. If, upon appointment, a member of the Committee is not financially literate as required, the person will be provided a three month period in which to achieve the required level of literacy.
3. RESPONSIBILITIES
(i) review and report to the board of directors of the Company on the following before they are publicly disclosed:
(A) the financial statements and MD&A (management discussion and analysis) (as defined in National Instrument 51-102 - Continuous Disclosure Obligations) of theCompany;
(B) the auditor’s report, if any, prepared in relation to those financial statements,
(ii) review the Company’s annual and interim earnings press releases before the Company publicly discloses this information;
(iii) satisfy itself that adequate procedures are in place for the review of the Company’s public disclosure of financial information extracted or derived from the Company’s financialstatements and periodically assess the adequacy of those procedures;
(iv) recommend to the board of directors:
(A) the external auditor to be nominated for the purpose of preparing or issuing an auditor’s report or performing other audit, review or attest services for the Company; and
(B) the compensation of the external auditor,
(v) oversee the work of the external auditor engaged for the purpose of preparing or issuing an auditor’s report or performing other audit, review or attest services for the Company,including the resolution of disagreements between management and the external auditor regarding financial reporting;
(vi) monitor, evaluate and report to the board of directors on the integrity of the financial reporting process and the system of internal controls that management and the board of directorshave established;
(vii) monitor the management of the principal risks that could impact the financial reporting of the Company;
(viii) establish procedures for the receipt, retention and treatment of complaints received by the Company regarding accounting, internal accounting controls, or auditing matters;
(ix) pre-approve all non-audit services to be provided to the Company or its subsidiary entities by the Company’s external auditor;
(x) review and approve the Company’s hiring policies regarding partners, employees and former partners and employees of the present and former external auditor of the Company;
(xi) with respect to ensuring the integrity of disclosure controls and internal controls over financial reporting, understand the process utilized by the Chief Executive Officer and the ChiefFinancial Officer to comply with National Instrument 52-109 - Certification of Disclosure in Issuers’ Annual and Interim Filings; and
(xii) review, and report to the Board on its concurrence with the disclosure required by Form 52-110F2 - Disclosure by Venture Issuers in any management information circular preparedby the Company.
4. AUTHORITY
(a) The Committee has the authority to engage independent counsel and other advisors as it deems necessary to carry out its duties and the Committee will set the compensation for such advisors.
(b) The Committee has the authority to communicate directly with and to meet with the external auditor, without management involvement. This extends to requiring the external auditor to reportdirectly to the Committee.

5. REPORTING
(a) The Committee will report to the Board on the proceedings of each Committee meeting and on the Committee’s recommendations at the next regularly scheduled Board meeting.
6. EFFECTIVE DATE
(a) This Charter was implemented by the Board on May 19, 2015.