DESCARTES SYSTEMS GROUP INC Form 40-F Filed 2018 ...
206
Business Address 120 RANDALL ST WATERLOO A6 N2V 1C6 519-746-8110 Mailing Address 120 RANDALL DRIVE WATERLOO, ONTARIO, CANADA XX N2V 1C6 SECURITIES AND EXCHANGE COMMISSION FORM 40-F Annual reports filed by certain Canadian issuers pursuant to Section 15(d) and Rule 15d-4 Filing Date: 2018-04-30 | Period of Report: 2018-04-30 SEC Accession No. 0000929638-18-000475 (HTML Version on secdatabase.com) FILER DESCARTES SYSTEMS GROUP INC CIK:1050140| IRS No.: 000000000 | State of Incorp.:A6 | Fiscal Year End: 0131 Type: 40-F | Act: 34 | File No.: 000-29970 | Film No.: 18791013 SIC: 7372 Prepackaged software Copyright © 2018 www.secdatabase.com . All Rights Reserved. Please Consider the Environment Before Printing This Document
-
Upload
khangminh22 -
Category
Documents
-
view
3 -
download
0
Transcript of DESCARTES SYSTEMS GROUP INC Form 40-F Filed 2018 ...
Business Address120 RANDALL STWATERLOO A6 N2V 1C6519-746-8110
Mailing Address120 RANDALL DRIVEWATERLOO, ONTARIO,CANADA XX N2V 1C6
SECURITIES AND EXCHANGE COMMISSION
FORM 40-FAnnual reports filed by certain Canadian issuers pursuant to Section 15(d) and Rule 15d-4
Filing Date: 2018-04-30 | Period of Report: 2018-04-30SEC Accession No. 0000929638-18-000475
(HTML Version on secdatabase.com)
FILERDESCARTES SYSTEMS GROUP INCCIK:1050140| IRS No.: 000000000 | State of Incorp.:A6 | Fiscal Year End: 0131Type: 40-F | Act: 34 | File No.: 000-29970 | Film No.: 18791013SIC: 7372 Prepackaged software
Copyright © 2018 www.secdatabase.com. All Rights Reserved.Please Consider the Environment Before Printing This Document
UNITED STATESSECURITIES AND EXCHANGE COMMISSION
WASHINGTON, D.C. 20549
FORM 40-F
☐☐ REGISTRATION STATEMENT PURSUANT TO SECTION 12 OF THE SECURITIESEXCHANGE ACT OF 1934
OR
☒☒ ANNUAL REPORT PURSUANT TO SECTION 13(a) OR 15(d) OF THE SECURITIESEXCHANGE ACT OF 1934
For the fiscal year ended January 31, 2018
Commission File Number: 000-29970
THE DESCARTES SYSTEMS GROUP INC.(Exact name of Registrant as specified in its charter)
N/A(Translation of Registrant's name into English (if applicable))
Canada(Province or other jurisdiction of incorporation or organization)
N/A(Primary Standard Industrial Classification Code Number (if applicable))
N/A(I.R.S. Employer Identification Number (if applicable))
120 Randall Drive, Waterloo, Ontario, Canada N2V 1C6Tel: (519) 746-8110
(Address and telephone number of Registrant's principal executive offices)
Descartes Systems (USA) LLCPowers Ferry Business Park2030 Powers Ferry Road SE
Suite 350Atlanta, GA 30339-5066
Tel: (678) 247-0400(Name, address (including zip code) and telephone number
(including area code) of agent for service in the United States)
Securities registered or to be registered pursuant to Section 12(b) of the Act.Title of each class: Name of each exchange on which registered:
Copyright © 2018 www.secdatabase.com. All Rights Reserved.Please Consider the Environment Before Printing This Document
Common Shares, no par value NasdaqRights to purchase Common Shares, no par value Nasdaq
Securities registered or to be registered pursuant to Section 12(g) of the Act.
None(Title of Class)
Copyright © 2018 www.secdatabase.com. All Rights Reserved.Please Consider the Environment Before Printing This Document
Securities for which there is a reporting obligation pursuant to Section 15(d) of the Act.
N/A(Title of Class)
For annual reports, indicate by check mark the information filed with this Form:
☒ Annual information form ☒ Audited annual financial statements
Indicate the number of outstanding shares of each of the issuer's classes of capital or common stock as of the close of the period coveredby the annual report.
76,773,497 as of January 31, 2018
Indicate by check mark whether the Registrant by filing the information contained in this Form is also thereby furnishing theinformation to the Commission pursuant to Rule 12g3-2(b) under the Securities Exchange Act of 1934 (the "Exchange Act"). If "Yes" ismarked, indicate the file number assigned to the Registrant in connection with such Rule.
Yes ☐ No ☒
Indicate by check mark whether the Registrant (1) has filed all reports required to be filed by Section 13 or 15(d) of the Exchange Actduring the preceding 12 months (or for such shorter period that the Registrant was required to file such reports) and (2) has been subjectto such filing requirements for the past 90 days.
Yes ☒ No ☐
Indicate by check mark whether the registrant is an emerging growth company as defined in Rule 12b-2 of the Exchange Act.Emerging growth company ☐
If an emerging growth company that prepares its financial statements in accordance with U.S. GAAP, indicate by check mark if theregistrant has elected not to use the extended transition period for complying with any new or revised financial accounting standards*provided pursuant to Section 13(a) of the Exchange Act. ☐
Indicate by check mark whether the Registrant has submitted electronically and posted on its corporate Web site, if any, everyInteractive Data File required to be submitted and posted pursuant to Rule 405 of Regulation S-T (Sec. 232.405 of this chapter) duringthe preceding 12 months (or for such shorter period that the Registrant was required to submit and post such files).
Yes ☒ No ☐
2
Copyright © 2018 www.secdatabase.com. All Rights Reserved.Please Consider the Environment Before Printing This Document
CERTIFICATIONS
See Exhibits 99.5, 99.6 and 99.7 to this Annual Report on Form 40-F.
CONTROLS AND PROCEDURES
DISCLOSURE CONTROLS AND PROCEDURES
The Registrant, under the supervision and with the participation of the Registrant's management, including the Registrant's ChiefExecutive Officer (principal executive officer) and Chief Financial Officer (principal financial officer), evaluated the effectiveness ofthe Registrant's disclosure controls and procedures as of January 31, 2018 (the "Evaluation Date"), pursuant toRule 13a-15(b) promulgated under the Securities Exchange Act of 1934, as amended (the "Exchange Act"). Based upon that evaluation,the Registrant's Chief Executive Officer and Chief Financial Officer concluded that, as of the Evaluation Date, the Registrant'sdisclosure controls and procedures were effective.
INTERNAL CONTROL OVER FINANCIAL REPORTING
Management's Report on Financial Statements and Internal Control Over Financial Reporting
Management's Report on Financial Statements and Internal Control Over Financial Reporting is contained in the Registrant's2018 Annual Report filed herewith as Exhibit 99.2 and incorporated herein by reference.
Report of Independent Registered Public Accounting Firm
The report of KPMG LLP with respect to the effectiveness of the Registrant's internal control over financial reporting iscontained in the Registrant's 2018 Annual Report filed herewith as Exhibit 99.2 and incorporated herein by reference.
Changes in Internal Control Over Financial Reporting
During the period covered by this Annual Report on Form 40-F, there have been no changes in the Registrant's internal controlover financial reporting that have materially affected, or are reasonably likely to materially affect, the Registrant's internal control overfinancial reporting.
NOTICES PURSUANT TO RULE 104 OF REGULATION BTR
None.
AUDIT COMMITTEE FINANCIAL EXPERT
The Registrant's Audit Committee of the Board of Directors currently consists of three members. The Registrant's Board ofDirectors has determined that John J. Walker and Eric Demirian are "audit committee financial experts" (as defined in paragraph 8(b) ofGeneral Instruction B to Form 40-F). All members of the Audit Committee are independent within the meaning of the Nasdaq StockMarket's ("Nasdaq") director independence standards.
CODE OF ETHICS
The Registrant has adopted a Code of Business Conduct and Ethics (the "Code of Ethics") that applies to the Registrant'sprincipal executive officer, principal financial officer, principal accounting officer or controller, or persons performing similar functions.A copy of the Code of Ethics is posted on the Registrant's corporate website at www.descartes.com and is also available atwww.sedar.com. The Registrant intends to disclose through its website any waivers or amendments to its Code of Ethics that apply toany principal executive officer, principal financial officer, principal accounting officer or controller, or persons performing similarfunctions.
3
Copyright © 2018 www.secdatabase.com. All Rights Reserved.Please Consider the Environment Before Printing This Document
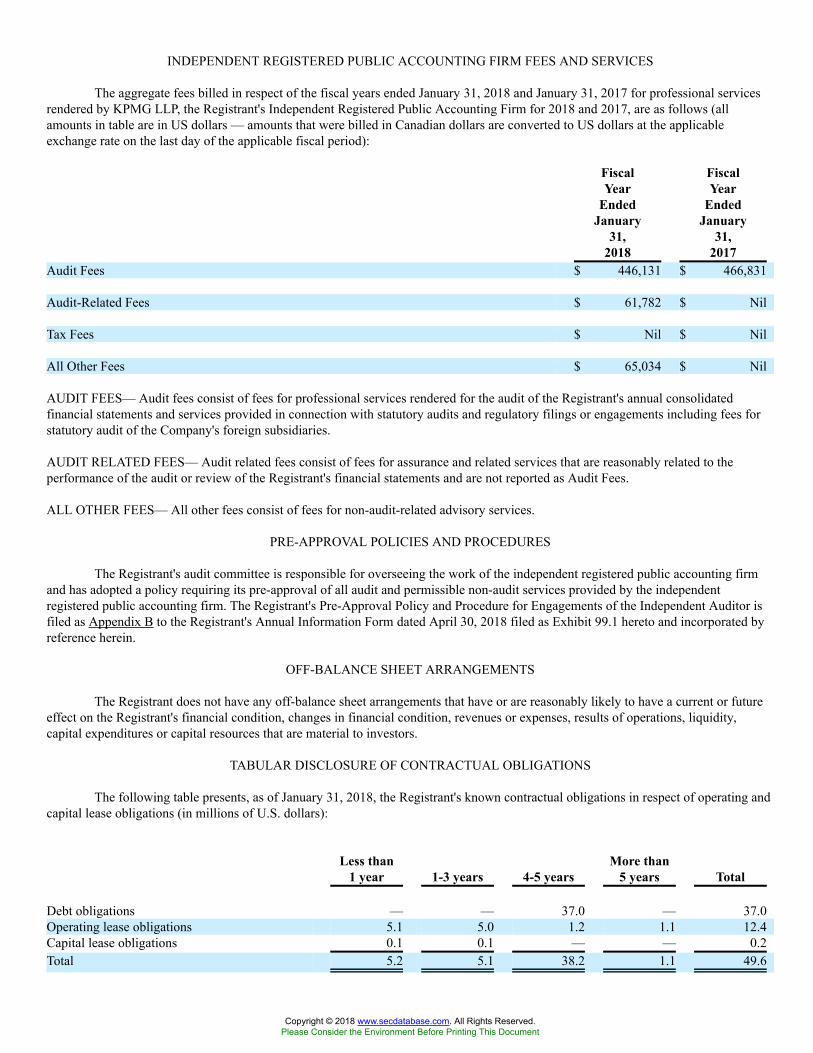
INDEPENDENT REGISTERED PUBLIC ACCOUNTING FIRM FEES AND SERVICES
The aggregate fees billed in respect of the fiscal years ended January 31, 2018 and January 31, 2017 for professional servicesrendered by KPMG LLP, the Registrant's Independent Registered Public Accounting Firm for 2018 and 2017, are as follows (allamounts in table are in US dollars — amounts that were billed in Canadian dollars are converted to US dollars at the applicableexchange rate on the last day of the applicable fiscal period):
FiscalYear
EndedJanuary
31,2018
FiscalYear
EndedJanuary
31,2017
Audit Fees $ 446,131 $ 466,831
Audit-Related Fees $ 61,782 $ Nil
Tax Fees $ Nil $ Nil
All Other Fees $ 65,034 $ Nil
AUDIT FEES— Audit fees consist of fees for professional services rendered for the audit of the Registrant's annual consolidatedfinancial statements and services provided in connection with statutory audits and regulatory filings or engagements including fees forstatutory audit of the Company's foreign subsidiaries.
AUDIT RELATED FEES— Audit related fees consist of fees for assurance and related services that are reasonably related to theperformance of the audit or review of the Registrant's financial statements and are not reported as Audit Fees.
ALL OTHER FEES— All other fees consist of fees for non-audit-related advisory services.
PRE-APPROVAL POLICIES AND PROCEDURES
The Registrant's audit committee is responsible for overseeing the work of the independent registered public accounting firmand has adopted a policy requiring its pre-approval of all audit and permissible non-audit services provided by the independentregistered public accounting firm. The Registrant's Pre-Approval Policy and Procedure for Engagements of the Independent Auditor isfiled as Appendix B to the Registrant's Annual Information Form dated April 30, 2018 filed as Exhibit 99.1 hereto and incorporated byreference herein.
OFF-BALANCE SHEET ARRANGEMENTS
The Registrant does not have any off-balance sheet arrangements that have or are reasonably likely to have a current or futureeffect on the Registrant's financial condition, changes in financial condition, revenues or expenses, results of operations, liquidity,capital expenditures or capital resources that are material to investors.
TABULAR DISCLOSURE OF CONTRACTUAL OBLIGATIONS
The following table presents, as of January 31, 2018, the Registrant's known contractual obligations in respect of operating andcapital lease obligations (in millions of U.S. dollars):
Less than1 year 1-3 years 4-5 years
More than5 years Total
Debt obligations — — 37.0 — 37.0Operating lease obligations 5.1 5.0 1.2 1.1 12.4Capital lease obligations 0.1 0.1 — — 0.2Total 5.2 5.1 38.2 1.1 49.6
Copyright © 2018 www.secdatabase.com. All Rights Reserved.Please Consider the Environment Before Printing This Document

4
Copyright © 2018 www.secdatabase.com. All Rights Reserved.Please Consider the Environment Before Printing This Document
Lease Obligations
The Registrant is committed under non-cancelable operating leases for business premises, computer equipment and vehicles with termsexpiring at various dates through 2027. The Registrant also is committed under non-cancelable capital leases for computer equipmentexpiring at various dates through 2021. The future minimum amounts payable under these lease agreements are outlined in the tableabove.
Other Obligations
Deferred Share Unit and Cash-Settled Restricted Share Unit Plans
As described in Note 2 to the Registrant's consolidated financial statements, the Registrant maintains Deferred Share Unit ("DSU") andCash-Settled Restricted Share Units ("CRSU") plans for its directors and employees. Any payments made pursuant to these plans aresettled in cash. For DSUs and CRSUs, the units vest over time and the liability recognized at any given consolidated balance sheet datereflects only those units vested at that date that have not yet been settled in cash. As such, the Registrant had an unrecognized aggregateamount for unvested CRSUs and unearned DSUs of $0.9 million and nil, respectively, at January 31, 2018. The ultimate liability for anypayment of DSUs and CRSUs is dependent on the trading price of the Registrant's common shares.
IDENTIFICATION OF THE AUDIT COMMITTEE
The Registrant has a separately designated standing audit committee established in accordance with Section 3(a)(58)(A) of theExchange Act. The members of the audit committee as of the date of the filing of this 40-F are: Mr. John J. Walker (Chair),Ms. Deborah Close and Mr. Eric Demirian.
MINE SAFETY DISCLOSURE
Not applicable.
DISCLOSURE PURSUANT TO THE REQUIREMENTS OF NASDAQ
The Registrant was granted an exemption from Nasdaq Stock Market Rules requiring each issuer to provide for a quorum atany meeting of the holders of common stock of no less than 331/3% of the outstanding shares of the issuer's common voting stock. Thisexemption was granted because Nasdaq's requirements regarding the quorum required for meetings of the holders of common stock arecontrary to generally accepted business practices in Canada. In particular, Section 139(1) of the Canada Business Corporations Actprovides that a company's by-laws may set the quorum requirements for a meeting of shareholders. The relevant provisions of theRegistrant's by-laws state that "Subject to the Act in respect of a majority shareholder, a quorum for the transaction of business at anymeeting of shareholders shall be persons not being less than two in number and holding or representing by proxy not less than 20percent of the issued and outstanding shares of the Corporation for the time being enjoying voting rights at such meeting. If a quorum ispresent at the opening of any meeting of shareholders, the shareholders present or represented may proceed with the business of themeeting notwithstanding that a quorum is not present throughout the meeting. If a quorum is not present at the opening of any meetingof shareholders, the shareholders present or represented may adjourn the meeting to a fixed time and place but may not transact anyother business."
UNDERTAKING
Registrant undertakes to make available, in person or by telephone, representatives to respond to inquiries made by theCommission staff, and to furnish promptly, when requested to do so by the Commission staff, information relating to: the securities inrelation to which the obligation to file an annual report on Form 40-F arises; or transactions in said securities.
5
Copyright © 2018 www.secdatabase.com. All Rights Reserved.Please Consider the Environment Before Printing This Document
SIGNATURES
Pursuant to the requirements of the Exchange Act, the Registrant certifies that it meets all of the requirements for filing onForm 40-F and has duly caused this annual report to be signed on its behalf by the undersigned, thereto duly authorized.
THE DESCARTES SYSTEMS GROUP INC.
By: /s/ Michael VerhoeveName: Michael VerhoeveTitle: EVP Legal, General Counsel and Corporate
Secretary
Date: April 30, 2018
6
Copyright © 2018 www.secdatabase.com. All Rights Reserved.Please Consider the Environment Before Printing This Document
EXHIBIT INDEX
ExhibitNumber Description99.1 Annual Information Form for the fiscal year ended January 31, 2018
99.2 2018 Annual Report (incorporated herein by reference to Exhibit 99.1 of the Registrant's Form 6-K furnished with theSEC on March 6, 2018)
99.3 Consent of KPMG LLP
99.4 Certification of the Chief Executive Officer pursuant to Rule 13a-14 or 15d-14 of the Securities Exchange Act of 1934, asadopted pursuant to Section 302 of the Sarbanes-Oxley Act of 2002
99.5 Certification of the Chief Financial Officer pursuant to Rule 13a-14 or 15d-14 of the Securities Exchange Act of 1934, asadopted pursuant to Section 302 of the Sarbanes-Oxley Act of 2002
99.6 Certifications of the Chief Executive Officer and Chief Financial Officer pursuant to 18 U.S.C. Section 1350, as adoptedpursuant to Section 906 of the Sarbanes-Oxley Act of 2002
101 XBRL Financial Statements
7
Copyright © 2018 www.secdatabase.com. All Rights Reserved.Please Consider the Environment Before Printing This Document
EXHIBIT 99.1
APRIL 30th, 2018
Copyright © 2018 www.secdatabase.com. All Rights Reserved.Please Consider the Environment Before Printing This Document
Table of Contents
ITEM 1 GENERAL 3
ITEM 2 CORPORATE STRUCTURE 42.1 The Company 42.2 Intercorporate Relationships 4
ITEM 3 GENERAL DEVELOPMENT OF THE BUSINESS 53.1 Profile 53.2 History and General Development 73.3 Trends / Business Outlook 10
ITEM 4 NARRATIVE DESCRIPTION OF THE BUSINESS 134.1 Company Overview 134.2 Principal Products & Services 134.3 Revenue Sources 234.4 Customer Base 244.5 Sales and Marketing 244.6 Research and Development 254.7 Competition 264.8 Intellectual Property and Other Proprietary Rights 274.9 Contracts 284.10 Employees 284.11 Risks Associated with Foreign Sales and Exchange Rate Fluctuations 294.12 Risks Associated with Cyclical or Seasonal Aspects of Business 294.13 Reorganizations 294.14 Material Contracts 294.15 Code of Business Conduct and Ethics 30
ITEM 5 RISK FACTORS 30
ITEM 6 MARKET FOR SECURITIES AND RELATED SECURITYHOLDER MATTERS 306.1 Common Shares 306.2 Transfer Agent and Registrar 306.3 Dividend Policy 306.4 Market for Common Shares 316.5 Shareholder Rights Plan 31
ITEM 7 DIRECTORS AND EXECUTIVE OFFICERS 327.1 Summary Information 327.2 Committees of the Board of Directors 367.3 Certain Relationships and Related Transactions 37
ITEM 8 EXTERNAL AUDITORS 38
ITEM 9 LEGAL PROCEEDINGS 38
ITEM 10 ADDITIONAL INFORMATION 39
Appendix A – Audit Committee Charter 40
Appendix B – Audit Committee Pre-Approval Policy 53
2
Copyright © 2018 www.secdatabase.com. All Rights Reserved.Please Consider the Environment Before Printing This Document
ITEM 1 GENERAL
Information contained herein is provided as at January 31, 2018 and is in United States ("US") dollars, unless otherwiseindicated.
Our Annual Information Form ("AIF") contains references to The Descartes Systems Group Inc. using the words "Descartes," "we,""us," "our" and similar words and the reader is referred to using the words "you," "your" and similar words.
This AIF also refers to our fiscal years. Our fiscal year commences on February 1st of each year and ends on January 31st of thefollowing year. Our fiscal year, which ended on January 31, 2018, is referred to as "fiscal 2018," "2018" or using similar words. Ourfiscal year, which ended on January 31, 2017, is referred to as "fiscal 2017," "2017" or using similar words. Other fiscal periods arereferenced by the applicable year during which the fiscal period ends. For example, 2019 refers to the annual period ending January31, 2019 and the "fourth quarter of 2019" refers to the quarter ending January 31, 2019.
You should read the AIF in conjunction with our audited consolidated financial statements for 2018 and the management's discussionand analysis thereon ("MD&A"). We prepare and file our consolidated financial statements and MD&A in US dollars and in accordancewith US generally accepted accounting principles ("GAAP").
We have prepared the AIF with reference to Form 51-102F2, which sets out the AIF disclosure requirements and which was establishedunder National Instrument 51-102 "Continuous Disclosure Obligations" ("NI 51-102") of the Canadian Securities Administrators.
Additional information about us, including copies of our continuous disclosure materials such as our MD&A, is available on ourwebsite at http://www.descartes.com, through the EDGAR website at http://www.sec.gov or through the SEDAR website athttp://www.sedar.com.
Certain statements made in this AIF, as well as the MD&A referenced herein, including, but not limited to, statements in the "Trends/ Business Outlook" section and statements regarding our expectations concerning future revenues and earnings, including potentialvariances from period to period; our expectations regarding the cyclical nature of our business; mix of revenues between servicesrevenues and license revenues and potential variances from period to period; our plans to focus on generating services revenues yetto continue to allow customers to elect to license technology in lieu of subscribing to services; our expected loss of revenues andcustomers; our baseline calibration; our ability to keep our operating expenses at a level below our baseline revenues; our futurebusiness plans and business planning process; allocation of purchase price for completed acquisitions; our expectations regardingfuture restructuring charges and cost-reduction activities; expenses, including amortization of intangible assets and stock-basedcompensation; goodwill impairment tests and the possibility of future impairment adjustments; capital expenditures; acquisition-related costs; our liability with respect to various claims and suits arising in the ordinary course; any commitments referred to in the"Commitments, Contingencies and Guarantees" section of the MD&A; our intention to actively explore future business combinationsand other strategic transactions; our liability under indemnification obligations; our reinvestment of earnings of subsidiaries backinto such subsidiaries; our dividend policy; the sufficiency of capital to meet working capital, capital expenditure, debt repaymentrequirements and our anticipated growth strategy; our ability to raise capital; our adoption of certain accounting standards andother matters related thereto constitute forward-looking information for the purposes of applicable securities laws ("forward-lookingstatements"). When used in this document, the words "believe," "plan," "expect," "anticipate," "intend," "continue," "may," "will,""should" or the negative of such terms and similar expressions are intended to identify forward-looking statements. These forward-looking statements are subject to risks and uncertainties and are based on assumptions that may cause future results to differmaterially from those expected. The material assumptions made in making these forward-looking statements include the following:global shipment volumes continuing to increase at levels consistent with the average growth rates of the global economy; countriescontinuing to implement and enforce existing and additional customs and security regulations relating to the provision of electronicinformation for imports and exports; countries continuing
3
Copyright © 2018 www.secdatabase.com. All Rights Reserved.Please Consider the Environment Before Printing This Document
to implement and enforce existing and additional trade restrictions and sanctioned party lists with respect to doing business withcertain countries, organizations, entities and individuals; our continued operation of a secure and reliable business network; thecontinued availability to us of the data and content that is utilized in the delivery of services made available over our network; thestability of general economic and market conditions, currency exchange rates, and interest rates; equity and debt markets continuingto provide us with access to capital; our continued ability to identify and source attractive and executable business combinationopportunities; our ability to develop solutions that keep pace with the continuing changes in technology, and our continued compliancewith third party intellectual property rights. While management believes these assumptions to be reasonable under the circumstances,they may prove to be inaccurate. Such forward-looking statements also involve known and unknown risks, uncertainties and otherfactors that may cause our actual results, performance or achievements of, or developments in our business or industry, to differmaterially from the anticipated results, performance or achievements or developments expressed or implied by such forward-lookingstatements. Such factors include, but are not limited to, the factors discussed under the heading "Certain Factors That May AffectFuture Results" in the MD&A which is included in our Annual Report to the Shareholders for fiscal 2018, and in other documents filedwith the Securities and Exchange Commission, the Ontario Securities Commission and other securities commissions across Canadafrom time to time. If any of such risks actually occur, they could materially adversely affect our business, financial condition or resultsof operations. In that case, the trading price of our common shares could decline, perhaps materially. Readers are cautioned not toplace undue reliance upon any such forward-looking statements, which speak only as of the date made. Forward-looking statementsare provided for the purpose of providing information about management's current expectations and plans relating to the future.Readers are cautioned that such information may not be appropriate for other purposes. Except as required by applicable law, we donot undertake or accept any obligation or undertaking to release publicly any updates or revisions to any forward-looking statementsto reflect any change in our expectations or any change in events, conditions, assumptions or circumstances on which any suchstatements are based.
ITEM 2 CORPORATE STRUCTURE
2.1 The CompanyDescartes was continued under the Canada Business Corporations Act on July 5, 2006. On July 31, 2006, Descartes was amalgamatedunder the Canada Business Corporations Act pursuant to an amalgamation between Descartes and ViaSafe Inc. On February 1, 2010,Descartes was amalgamated under the Canada Business Corporations Act pursuant to an amalgamation between Descartes andScancode Systems Inc. ("Scancode"). On February 1, 2010, Descartes was amalgamated under the Canada Business Corporations Actpursuant to an amalgamation between Descartes and 7322267 Canada Inc. On February 1, 2012, Descartes was amalgamated underthe Canada Business Corporations Act pursuant to an amalgamation between Descartes and 882976 Ontario Inc.
The Descartes Systems Group Inc. head office and registered office is located at 120 Randall Drive, Waterloo, Ontario, N2V 1C6 andour general corporate phone number is (519) 746-8110.
2.2 Intercorporate RelationshipsWe beneficially own, control and/or direct 100% of all voting, share or membership interests in our material subsidiaries. Our materialsubsidiaries, determined as at January 31, 2018, are as follows:
· Descartes U.S. Holdings, Inc., a Delaware subsidiary;· Descartes Systems (USA) LLC, a Delaware subsidiary;· MacroPoint, LLC, an Ohio subsidiary;· Descartes Systems (Germany) GmbH, a German subsidiary;· InterCommIT BV, a Netherlands subsidiary;· Descartes Systems (Belgium) NV, a Belgian subsidiary; and· KSD Software Norway AS, a Norwegian subsidiary.
4
Copyright © 2018 www.secdatabase.com. All Rights Reserved.Please Consider the Environment Before Printing This Document
ITEM 3 GENERAL DEVELOPMENT OF THE BUSINESS
3.1 Profile
We use technology and networks to simplify complex business processes. We are primarily focused on logistics and supply chainmanagement business processes. Our solutions are predominantly cloud-based and are focused on improving the productivity,performance and security of logistics-intensive businesses. Customers use our modular, software-as-a-service ("SaaS") and datacontent solutions to route, schedule, track and measure delivery resources; plan, allocate and execute shipments; rate, audit and paytransportation invoices; access and analyze global trade data; research and perform trade tariff and duty calculations; file customs andsecurity documents for imports and exports; and complete numerous other logistics processes by participating in a large, collaborativemulti-modal logistics community. Our pricing model provides our customers with flexibility in purchasing our solutions either on asubscription, transactional or perpetual license basis. Our primary focus is on serving transportation providers (air, ocean and truckmodes), logistics service providers (including third-party logistics providers, freight forwarders and customs brokers) and distribution-intensive companies for which logistics is either a key or a defining part of their own product or service offering, or for which oursolutions can provide an opportunity to reduce costs, improve service levels or support growth by optimizing the use of assets andinformation.
The MarketLogistics is the management of the flow of resources between a point of origin and a point of destination – processes that move items(such as goods, people, information) from point A to point B. Supply chain management is broader than logistics and includes thesourcing, procurement, conversion and storage of resources for consumption by an enterprise. Logistics and supply chain managementhave been evolving over the past several years as companies are increasingly seeking automation and real-time control of their supplychain activities. We believe companies are looking for integrated solutions for managing inventory in transit, conveyance units, people,data and business documents.
We believe logistics-intensive organizations are seeking to reduce operating costs, differentiate themselves, improve margins andbetter serve customers. Global trade and transportation processes are often manual and complex to manage. This is a consequenceof the growing number of business partners participating in companies' global supply chains and a lack of standardized businessprocesses.
Additionally, global sourcing, logistics outsourcing, imposition of additional customs and regulatory requirements and the increased rateof change in day-to-day business requirements are adding to the overall complexities that companies face in planning and executingin their supply chains. Whether a shipment is delayed at the border, a customer changes an order or a breakdown occurs on the road,there are increasingly more issues that can significantly impact the execution of fulfillment schedules and associated costs.
These challenges are heightened for suppliers that have end-customers frequently demanding narrower order-to-fulfillment periods,lower prices and greater flexibility in scheduling and rescheduling deliveries. End-customers also want real-time updates on deliverystatus, adding considerable burden to supply chain management as process efficiency is balanced with affordable service.
In this market, the movement and sharing of data between parties involved in the logistics process is equally important to the physicalmovement of goods. Manual, fragmented and distributed logistics solutions are often proving inadequate to address the needs ofoperators. Connecting manufacturers and suppliers to carriers on an individual, one-off basis is too costly, complex and risky fororganizations dealing with many trading partners. Further, many of these solutions do not provide the flexibility required to efficientlyaccommodate varied processes for organizations to remain competitive. We believe this presents an opportunity for logistics technologyproviders to unite this highly fragmented community and help customers improve efficiencies in their operations.
5
Copyright © 2018 www.secdatabase.com. All Rights Reserved.Please Consider the Environment Before Printing This Document
As the market continues to change, we have been evolving to meet our customers' needs. While the rate of adoption of newer logisticsand supply chain management technologies is increasing, a large number of organizations still have manual business processes.We have been educating our prospects and customers on the value of connecting to trading partners through our Global LogisticsNetwork ("GLN") and automating, as well as standardizing, multi-party business processes. We believe that our target customers areincreasingly looking for a single source, neutral, network-based solution provider who can help them manage the end-to-end shipment– from researching global trade information, to the booking of a shipment, to the tracking of that shipment as it moves, to theregulatory compliance filings to be made during the move and, finally, to the settlement and audit of the invoice.
Additionally, regulatory initiatives mandating electronic filing of shipment information with customs authorities require companies toautomate aspects of their shipping processes to remain compliant and competitive. Our customs compliance technology helps shippers,transportation providers, freight forwarders and other logistics intermediaries to securely and electronically file shipment and tariff/duty information with customs authorities and self-audit their own efforts. Our technology also helps carriers and freight forwardersefficiently coordinate with customs brokers and agencies to expedite cross-border shipments. While many compliance initiatives startedin the US, compliance has now become a global issue with significantly more international shipments crossing several borders on theway to their final destinations.
Increasingly, data and content have become central to supply chain planning and execution. Complex international supply chains areaffected by logistics service provider performance, capacity, and productivity, as well as regulatory frameworks such as free tradeagreements. We believe our Global Trade Data, Trade Regulations and Free-Trade Agreement and duty rate and calculation solutionshelp customers improve their sourcing, landed cost, and transportation lane and provider selection processes.
SolutionsDescartes' Logistics Technology Platform unites a growing global community of logistics-focused parties, allowing them to transactbusiness while leveraging a broad array of applications designed to help logistics-intensive businesses thrive. Descartes' LogisticsTechnology Platform is the simple, elegant synthesis of a network, applications, content and a community.
The Logistics Technology Platform fuses our GLN, an extensive logistics network covering multiple transportation modes, with a broadarray of modular, interoperable web and wireless logistics management solutions. Designed to help accelerate time-to-value andincrease productivity and performance for businesses of all sizes, the Logistics Technology Platform leverages the GLN's multimodallogistics community to enable companies to quickly and cost-effectively connect and collaborate.
Descartes' GLN, the underlying foundation of the Logistics Technology Platform, manages the flow of data and documents that trackand control inventory, assets and people in motion. Designed expressly for logistics operations, it is native to the particularitiesof different transportation modes and country borders. As a state-of-the-art messaging network with wireless capabilities, the GLNhelps manage business processes in real-time and in-motion. Its capabilities go beyond logistics, supporting common commercialtransactions, regulatory compliance documents, and customer specific needs.
The GLN extends its reach using interconnect agreements with other general and logistics-specific networks, to offer companies accessto a wide array of trading partners. With the flexibility to connect and collaborate in unique ways, companies can effectively route ortransform data to and from partners and deploy additional Descartes solutions on the GLN. The GLN allows "low tech" partners to actand respond with "high tech" capabilities and connect to the transient partners that exist in many logistics operations. This inherentadaptability creates opportunities to develop logistics business processes that can help customers differentiate themselves from theircompetitors.
Descartes' Logistics Application Suite offers a wide array of modular, cloud-based, interoperable web and wireless logistics managementapplications. These solutions embody Descartes' deep domain expertise, not merely "check box" functionality. These solutions delivervalue for a broad range of logistics intensive organizations, whether they purchase transportation, run their own fleet, operate globallyor
6
Copyright © 2018 www.secdatabase.com. All Rights Reserved.Please Consider the Environment Before Printing This Document
locally, or work across air, ocean or ground transportation. Descartes' comprehensive suite of solutions includes:· Routing, Mobile and Telematics;· Transportation Management and e-commerce fulfillment;· Customs & Regulatory Compliance;· Trade Data;· Global Logistics Network Services; and· Broker & Forwarder Enterprise Systems.
The Descartes applications forming part of the Logistics Technology Platform are modular and interoperable to allow organizations theflexibility to deploy them quickly within an existing portfolio of solutions. Implementation is streamlined because these solutions useweb-native or wireless user interfaces and are pre-integrated with the GLN. With interoperable and multi-party solutions, Descartes'solutions are designed to deliver functionality that can enhance a logistics operation's performance and productivity both within theorganization and across a complex network of partners.
Descartes' expanding global trade content offering unites systems and people with trade information to enable organizations to worksmarter by making more informed supply chain and logistics decisions. Our content solutions can help customers research and analyzeglobal trade movements, regulations and trends; reduce the risk of transacting with denied parties; increase trade compliance rates;optimize sourcing, procurement, and business development strategies; and minimize duty spend.
Descartes' GLN community members enjoy extended command of operations and accelerated time-to-value relative to manyalternative logistics solutions. Given the inter-enterprise nature of logistics, quickly gaining access to partners is paramount. For thisreason, Descartes has focused on growing a community that strategically attracts and retains relevant logistics parties. Upon joiningthe GLN community, many companies find that a number of their trading partners are already members, with an existing connectionto the GLN. This helps to minimize the time required to integrate Descartes' logistics management applications and to begin realizingresults. Descartes is committed to continuing to expand community membership. Companies that join the GLN community or extendtheir participation find a single place where their entire logistics network can exist regardless of the range of transportation modes, thenumber of trading partners or the variety of regulatory agencies.
3.2 History and General DevelopmentOur origins were in providing logistics-focused software designed to optimally plan and manage routes for direct delivery and retailcustomers with private fleets. Supply chain management has evolved as companies across industry verticals have increasingly soughtreal-time control over their supply chain. We have established a network-based business model and are consolidating technology toprovide our customers with a shared-services environment that assists our customers in gathering and exchanging source data forlogistics. We have also designed value-added services that enable shippers, transportation companies and logistics intermediaries touse that information to make better business decisions and deliver better service to their own customers.
Key developments in our business over the last three fiscal years, described beginning with the most recent, are as follows:
Fiscal 2018 and 2019 through to April 30th, 2018
On February 2, 2018, we acquired Aljex Software, Inc. ("Aljex"), a leading US-based provider of cloud based back-office transportationmanagement solutions for freight brokers and transportation providers. Aljex serves approximately 400 customers in North Americaand supports the execution of nearly 3 million freight moves per year. The Aljex solution helps customers automate business processesand create electronic documents used in executing freight movements. The solution allows customers to manage the lifecycle of ashipment from order creation through execution. The total purchase price for the acquisition was approximately $32.4 million, net ofcash acquired, which was funded from Descartes' existing acquisition line of credit.
7
Copyright © 2018 www.secdatabase.com. All Rights Reserved.Please Consider the Environment Before Printing This Document
On August 15, 2017, we acquired MacroPoint, LLC ("MacroPoint"), the leading provider in North America of location-based truckloadshipment visibility and predictive freight capacity data. MacroPoint operates a network of over two million connected trucking assetsand drivers to provide data that helps transportation brokers, logistics services providers and shippers track the location and statusof deliveries in trucks. MacroPoint connects to on-board electronic logging devices (ELDs), transportation management systems, GPS-enabled smart phone applications and location-based mobile phone triangulation to provide up-to-date and accurate status informationon truck locations. The total purchase price for the acquisition was approximately $107 million, of which $87 million was satisfied incash and $20 million was satisfied in common shares of Descartes. Of the $87 million cash component, $7 million was satisfied fromcash on hand and the balance from Descartes' existing acquisition line of credit.
On June 2, 2017, we acquired substantially all of the assets of PCSTrac, Inc. and certain assets of a related company, ProgressiveComputer Services Inc., dba PCS Technologies (collectively "PCSTrac"). PCSTrac is a US based provider of carton-level shipmentvisibility and management solutions for speciality retailers and their logistics services providers to manage shipments from distributioncenters to retail stores. The PCSTrac acquisition complements Descartes's 2015 acquisition of BearWare Inc. and builds upon Descartes'expertise and footprint in the field of pooled distribution, which assists retailers in reducing logistics costs and minimizing storedisruptions through consolidated deliveries. The total purchase price for the acquisition was approximately $11.25 million, which wassatisfied from cash on hand.
At our annual and special meeting of shareholders on June 1, 2017, our shareholders elected all proposed nominees to our board ofdirectors, which included the election of a new board member, Dennis Maple. Our shareholders also re-appointed KPMG as our auditors,approved the adoption of an amended and restated shareholder rights plan, approved the adoption of an amended and restatedperformance and restricted share unit plan and approved the proposed "say on pay" resolution that was put before the meeting.
On May 19, 2017, we acquired Z-Firm LLC dba ShipRush ("ShipRush"), a US based provider of e-commerce multi-carrier parcelshipping management solutions for small to medium sized businesses. ShipRush helps e-commerce businesses and omni-channelretailers execute parcel shipments for last-mile delivery to customers. With existing integrations to over 60 different business systems,including ERP, e-commerce and supply chain platforms, the ShipRush platform helps customers streamline the shipping processby automatically importing orders from those systems, comparing carrier rates, printing shipping labels for all major carriers andsupporting tracking through final delivery. The ShipRush acquisition added to the breadth of solutions Descartes can provide to omni-channel retailers and small to medium sized business customers to address their parcel shipping needs. The total purchase price forthe acquisition was approximately $14 million, which was satisfied from cash on hand, plus potential performance-based considerationof up to an additional $3 million.
Fiscal 2017
On December 23, 2016, we acquired The Datamyne, Inc. ("Datamyne"), a leading US-based provider of cloud-based trade data contentsolutions used by customers to analyze import and export trade activity across certain markets, commodities, trade lanes and otherparameters. Datamyne, which operates primarily in the US and South America, collects, cleanses and commercializes logistics tradedata from over 50 nations across five continents, including key markets in North America, Latin America, Asia, Africa and the EuropeanUnion ("EU"). More than 100 million records are gathered each year from official filings with various customs authorities and tradeministries and subscribers can then use Datamyne's web-based solutions and business intelligence tools to augment, speed-up andsimplify trade data research and to shape global marketing, prospecting and sourcing strategies. The total purchase price for theacquisition was approximately $52.7 million, net of cash acquired, which was funded with cash on hand.
On November 11, 2016, we acquired 4Solutions Information Technology Pty Ltd. ("4Solutions"), a leading Australian-based providerof cloud-based business-to-business ("B2B") supply chain integration solutions that delivers B2B integration as a cloud service forthe healthcare sector in Australia. 4Solutions operates the Health Supply Network, Australia's foremost electronic document exchangenetwork for the healthcare community. As part of this community, large multi-national, local pharmaceutical manufacturers and
8
Copyright © 2018 www.secdatabase.com. All Rights Reserved.Please Consider the Environment Before Printing This Document
wholesalers can connect and collaborate to automate a wide array of supply chain processes spanning sourcing to delivery. The totalpurchase price for the acquisition was AUD $3.5 million (approximately $2.7 million as of November 11, 2016), net of cash acquired,which was funded with cash on hand.
On October 12, 2016, we acquired Appterra LLC ("Appterra"), a leading US-based provider of cloud based B2B supply chain integrationsolutions that delivers B2B integration as a cloud service to help customers automate supply chain processes and enhance collaborationand visibility among global trading partners. The solutions help manage and streamline a wide array of complex, mission criticalbusiness documents found in typical procure-to-pay and order-to-cash processes. The total purchase price for the acquisition consistedof approximately $5.8 million paid at closing with cash on hand plus potential performance-based cash consideration of up to anadditional $1.6 million.
At our annual and special meeting of shareholders on May 26, 2016, our shareholders re-elected all current directors, re-appointedKPMG as our auditors, approved the adoption of an amended and restated stock option plan and approved the proposed "say on pay"resolution that was put before the meeting.
On April 29, 2016, we acquired all outstanding shares of privately-held pixi Software GmbH ("pixi"), a leading German-based providerof technology solutions for e-commerce order fulfillment and warehouse management. The pixi system helps its customers automatee-commerce processes originating from on-line orders by collecting information from an e-commerce webfront and translating that into a scanner enabled pick and pack process within a warehouse, initiating shipment to the customer and synchronizing the informationwith the customer's financial system for invoicing and shipment tracking. The total purchase price for the acquisition was EUR 9.2million (approximately USD $10.4 million as of April 29, 2016), net of cash acquired, which was paid on closing.
On April 18, 2016, we filed a final short-form base shelf prospectus, allowing us to offer and issue the following securities: (i) commonshares; (ii) preferred shares; (iii) senior or subordinated unsecured debt securities; (iv) subscription receipts; (v) warrants; and (vi)securities comprised of more than one of the common shares, preferred shares, debt securities, subscription receipts and/or warrantsoffered together as a unit. These securities may be offered separately or together, in separate series, in amounts, at prices and onterms to be set forth in one or more shelf prospectus supplements. The aggregate initial offering price of securities that could be soldby us (or certain of our current or future shareholders) pursuant to this base shelf prospectus during the 25-month period that thebase shelf prospectus, including any amendments thereto, remains valid was limited to $500 million.
On March 2, 2016, we amended our $77.0 million revolving debt facility with a new senior secured credit facility ("Credit Facility"). TheCredit Facility consists of a $150.0 million revolving operating credit facility to be available for general corporate purposes, including thefinancing of ongoing working capital needs and acquisitions. The Credit Facility also provides for an additional $7.5 million available tosupport foreign exchange and interest rate hedging. Further, the Credit Facility may be increased by an additional $75 million to a totalof $225 million at any time during its term, subject to the approval of the existing and any additional lenders. The Credit Facility has afive-year maturity, expiring on March 2, 2021, with no fixed repayment dates prior to the end of the five-year term. Borrowings underthe facility are secured by a first charge over substantially all of our assets. Depending on the type of advance, interest rates underthe Credit Facility are based on the Canada or US prime rate, Bankers' Acceptance (BA) or London Interbank Offered Rate ("LIBOR")plus an additional 0 to 200 basis points based on the ratio of net debt to adjusted earnings before interest, taxes, depreciation andamortization, as defined in the credit agreement. A standby fee of between 20 to 28 basis points will be charged on all undrawnamounts. The Credit Facility contains certain customary representations, warranties and guarantees, and covenants.
Fiscal 2016
On November 25, 2015, we acquired Oz Development Inc. ("Oz"), a leading US-based provider of application integration solutionsthat help small-to-medium sized businesses ("SMBs") automate a number of logistics and supply chain processes. The solutions helpa growing SMB community connect to, and integrate with, leading SMB Enterprise Resource Planning ("ERP"), Customer RelationshipManagement ("CRM") and e-commerce platforms. The total purchase price for the acquisition was approximately $29.5 million, net ofcash acquired, which was funded with cash on hand.
On July 22, 2015, we acquired all outstanding shares of privately-held BearWare Inc. ("BearWare"), a leading US-based provider ofmobile solutions to improve collaboration between retailers and their logistics service providers. BearWare's system leverages mobiletechnologies to scan cartons at each point from the distribution centers through to the store front, helping retailers and their logisticsservice providers collaborate on store shipments. The total purchase price for the acquisition was $11.2 million, net of cash acquired,which was funded with cash on hand.
9
Copyright © 2018 www.secdatabase.com. All Rights Reserved.Please Consider the Environment Before Printing This Document
On July 20, 2015, we acquired all outstanding shares of privately-held MK Data Services LLC ("MK Data"), a leading US-basedprovider of denied party screening trade data and solutions. MK Data's technology screens shipments against a comprehensive,frequently updated, international database of restricted parties helping more than 900 businesses comply with denied party screeningrequirements. The total purchase price for the acquisition was $80.2 million, net of cash acquired, which was funded with cash onhand.
At our annual meeting of shareholders on May 28, 2015, our shareholders elected one new director, Deborah Close, a senior executivewith many years of experience in the software and oil and gas industries.
3.3 Trends / Business OutlookIndustry consolidation, rapid technological change and frequent new product introductions and enhancements continue to characterizethe software, content and network services industries – particularly for logistics management technology companies. Organizationsare increasingly requiring greater levels of functionality, more sophisticated product offerings and access to industry specific data fromtheir software and services providers.
Increased importance is being placed on leveraging cloud-based technology to better manage logistics processes and to connect andcollaborate with trading partners on a global basis, as well as to reuse and share supply chain data in order to accelerate time-to-value. Cloud-based technology also enables business networks to more easily unite and integrate services provided by a broad rangeof partners and technology alliances to extend functionality and further enhance collaboration between business communities. As aresult, we believe there is a trend away from using manual and paper-based supply chain and logistics processes and on-premisessolution deployments towards electronic processes powered by the exchange of cloud-based electronic information between logisticsand supply chain participants.
Accordingly, we expect that our future success will be dependent upon our ability to enhance current products or develop and introducenew products offering enhanced performance and new functionality at competitive prices. In particular, we believe customers arelooking for end-to-end solutions that combine a multi-modal, multi-process network with business document exchange and wirelessmobile resource management ("MRM") applications with end-to-end global trade compliance and collaborative supply chain executionapplications. These applications include freight bookings, contract and rate management, content solutions for trade research andclassification of goods for tariff and duty purposes, sanctioned party screening, customs filings and electronic shipment manifestprocesses, transportation management, routing and scheduling, purchase order to dock door processes, e-commerce fulfilment,warehouse management and inventory visibility. Further, customers are increasingly seeking "big data" content and insight solutionsfor analyzing global logistics trends and activity.
We believe that there continues to be a growing acceptance of subscription pricing and SaaS business models in the markets we servethat provide lower up-front cost and easier-to-maintain alternatives than may be available through traditional perpetual license pricingmodels.
TRENDS IN GLOBAL TRADE
With both global trade and counter-terrorism efforts on the rise, the role of many customs agencies around the world has evolved farbeyond statistical reporting and collection of import duties and excise taxes to a growing focus on the protection of society throughaugmented border security and much deeper cargo security. To that end, the World Customs Organization ("WCO") is playing a leadingrole in helping member agencies enhance the efficiency and effectiveness of their operations through the development, promotionand implementation of modern customs systems and procedures. One of the WCO's principal instruments is the SAFE Framework ofStandards to Secure and Facilitate Global Trade ("SAFE Framework") which the WCO adopted in 2005.
The SAFE Framework is a non-binding instrument that contains supply chain security and facilitation standards for goods being tradedinternationally. Its goal is to enable better visibility, improve capabilities to detect high-risk shipments, and facilitate more integratedsupply chain management across all modes
10
Copyright © 2018 www.secdatabase.com. All Rights Reserved.Please Consider the Environment Before Printing This Document
of transport through enhanced technology and data transmission practices, networking arrangements between customsadministrations, and better cooperation between customs and the business community.
As more countries adopt and enhance SAFE Framework initiatives, importers, exporters and their trading partners must comply withnew and stricter security and customs regulations, which often mandate the use of electronic logistics messaging. Descartes' customsand regulatory compliance solutions connect importers, exporters, logistics providers and regulatory authorities to enable efficientdata transmission, cargo security screening, customs declaration filings and compliance across multiple regulatory requirements andindustry-sponsored initiatives affecting international transportation. As such, our business may be impacted as regulations affectingdomestic and international trade are introduced, modified or repealed.
USA: The Automated Commercial Environment ("ACE") was designed by US Customs and Border Protection ("CBP") to enhance USnational security through more accurate, readily available data to promote seamless trade processing. ACE is the "single window"or the primary system through which the trade community will electronically report all imports and exports and the government willdetermine admissibility and duties. The current ACE modernization effort is also helping to connect CBP and Participating GovernmentAgencies ("PGAs") such as the Food and Drug Administration. CBP is working to complete the final deployment of the program andwrap up core trade processing capabilities in ACE for customs entries.
The Air Cargo Advance Screening ("ACAS") pilot initiative was extended through July 26, 2018. Portions of the program are nowmandatory, for example, ACAS data is required to be submitted for cargo loaded onto flights where the last point of departure wasany one of five airports in the Middle East.
Under the ACE initiative, export manifest filing requirements are underway. The goal of the program is to help close the loop betweenimport and export process and bring more modernized standards to labor-intensive export procedures. An electronic export manifestwill also enable CBP to better identify potential security concerns earlier in the supply chain while speeding the flow of compliantshipments.
Canada: The Canada Border Services Agency's ("CBSA") Single Window Initiative ("SWI") streamlines the sharing of commercial databetween the government of Canada and the trade community. The Advanced Commercial Information ("ACI") electronic manifest ("e-Manifest") program has been launched to provide more effective risk management processes and tools to identify threats to health,safety, and security prior to the arrival of cargo and conveyances in Canada. Now in its final phases of deployment, enforcement of ACIeManifest for Forwarders is anticipated by the end of 2018 or in early 2019. When fully implemented, e-Manifest will require freightforwarders and importers in all modes of transportation (air, marine, highway and rail) to electronically transmit cargo, conveyance,house bill / supplementary cargo and importer data to the Canadian Border Security Authority ("CBSA").
The CBSA will also be decommissioning select legacy Participating Government Department (PGD) release service options, meaningthat the long-standing Pre-Arrival Review System ("PARS") and Release on Minimum Documentation ("RMD") connectivity to PGAs willno longer be operational when the requirements go into effect. This change will make the use of the Integrated Import Declaration("IID") to submit PGA shipment information mandatory for importers and/or their brokers to obtain electronic release for PGA regulatedgoods.
European Union: In 2011, the EU launched advance manifest compliance initiatives similar to the US regime, called the ImportControl System ("ICS") and Export Control System ("ECS"). In May 2016, updates to the Union Customs Code (UCC) were launchedaffecting customs legislation across the EU which introduced significant changes to long-established procedures. The UCC wasformalized with Regulation (EU) No 952/2013, and will be implemented via numerous phases extending through 2020. Businessesinvolved in the import and/or export of goods into and within the EU will be impacted including: warehouse operators, third-partylogistics service providers (3PLs), freight forwarders, customs brokers, shippers, agents, intermediaries and others.
11
Copyright © 2018 www.secdatabase.com. All Rights Reserved.Please Consider the Environment Before Printing This Document
Mexico: Similar to other single window initiatives, Ventanilla Unica de Comercio Exterior Mexicano, also called "VUCEM", serves as acentral system for the international trade community to submit information to Mexican customs and other agencies. Import Manifestfunctionality for the air and ocean modes of transport is available with export functionality in queue.
Japan: As part of the worldwide trend to adopt the SAFE Framework, beginning in April 2019 Japan will require air carriers to disclosethe contents of air cargo shipments inbound to Japan three hours in advance of arrival into the country.
Other Countries Around the World: Many nations are continuing to adopt various forms of advance filing requirements in respect ofshipments destined for a port of that country, including, Argentina, Abu Dhabi, Bahrain, Colombia, Cuba, Ghana, India, Israel, Jamaica,Kenya, Lebanon, Nicaragua, Nigeria, Paraguay, Peru, and Oman.
Another key trend is the growing importance of global trade data content to minimize duty spend, reduce the risk of transacting withdenied parties, and utilize market research to better compete. Trade departments within international shippers and/or their brokers arebeing required to manage import/export compliance for a growing number of countries, covering everything from import (harmonizedtariff) classifications, export classifications, Other Government Agency information and requirements, sanctioned party screening, andspecial trade programs and valuation methodologies going into the destination countries. Importers, exporters, and their logisticsproviders are using global trade data to better manage supply chain sourcing and risk, track products, monitor competitors, anddiscover new market opportunities.
TRENDS IN MOBILE RESOURCE MANAGEMENT
The mobile resource management ("MRM") market is also impacted by changing regulatory trends and limited driver availability.A number of countries have adopted legislation that requires automated reporting on various information related to the operationof vehicle fleets, including hours of service, distance travelled, speed and equipment inspections. We believe that these types ofinitiatives will continue to evolve and that customers in this field are increasingly looking for technology service providers to helpthem manage these complex compliance requirements. With aging driver workforces in North America and Europe, companies arelooking for solutions that can improve their existing workforce productivity while complying with the increasing number of regulatorymandates.
We also believe there is a trend in the MRM market towards adoption of solutions that specialize in enabling home delivery, deliveryreservations and delivery route optimization that leverages GPS and other real-time available information about a delivery resource inmotion. With firms such as Amazon, Home Depot and Wayfair making home delivery a differentiating feature of the buying experience,more retailers and distributors are focusing on re-engineering their logistics processes to provide customers with cost-effective deliveryalternatives, including home/job site delivery and value-added services, with tight delivery time windows. In addition, we believethere is an increased proliferation of real-time information that is available about delivery resources in motion and that customers areseeking delivery resource management solutions that can leverage this information for their customers' benefit.
GENERAL TRENDS
Our business may be impacted from time to time by the general cyclical and seasonal nature of particular modes of transportation andthe freight market in general, as well as the cyclical and seasonal nature of the industries that such markets serve. Factors which maycreate cyclical fluctuations in such modes of transportation or the freight market in general include legal and regulatory requirements,timing of contract renewals between our customers and their own customers, seasonal-based tariffs, vacation periods applicable toparticular shipping or receiving nations, weather-related events that impact shipping in particular geographies and amendments tointernational trade agreements. Since some of our revenues from particular products and services are tied to the volume of shipmentsbeing processed, adverse
12
Copyright © 2018 www.secdatabase.com. All Rights Reserved.Please Consider the Environment Before Printing This Document
fluctuations in the volume of global shipments or shipments in any particular mode of transportation may adversely affect ourrevenues. Declines in shipment volumes in the US or internationally likely would have a material adverse effect on our business.
ITEM 4 NARRATIVE DESCRIPTION OF THE BUSINESS
4.1 Company OverviewWe are a global provider of on-demand, cloud-based SaaS and data content solutions focused on improving the productivity,performance and security of logistics-intensive businesses. Customers use our modular, SaaS and data content solutions to route,schedule, track and measure delivery resources; plan, allocate and execute shipments; rate, audit and pay transportation invoices;access global trade data; file customs and security documents for imports and exports; and complete numerous other logisticsprocesses by participating in a large, collaborative multi-modal logistics community.
Our pricing models provide our customers with flexibility in purchasing our solutions either on subscription, transactional or perpetuallicense basis. Our solutions help transportation providers (air, ocean, rail and truck modes), logistics service providers (including third-party logistics providers, freight forwarders and customs brokers) and logistics-intensive manufacturers, retailers, distributors andmobile service providers reduce costs, improve operational performance, save time, comply with regulatory requirements and enhancethe service that they deliver to their own customers.
4.2 Principal Products & ServicesWe believe that our customers prefer a technology provider that understands the unique requirements of logistics organizations andcan provide a comprehensive set of solutions. Our customers are looking for collaborative solutions that help connect their enterpriseto the multiple trading partners, logistics services providers and carriers that work with them. The Logistics Technology Platform helpsour customers address those needs and provide a base for continuous innovation.
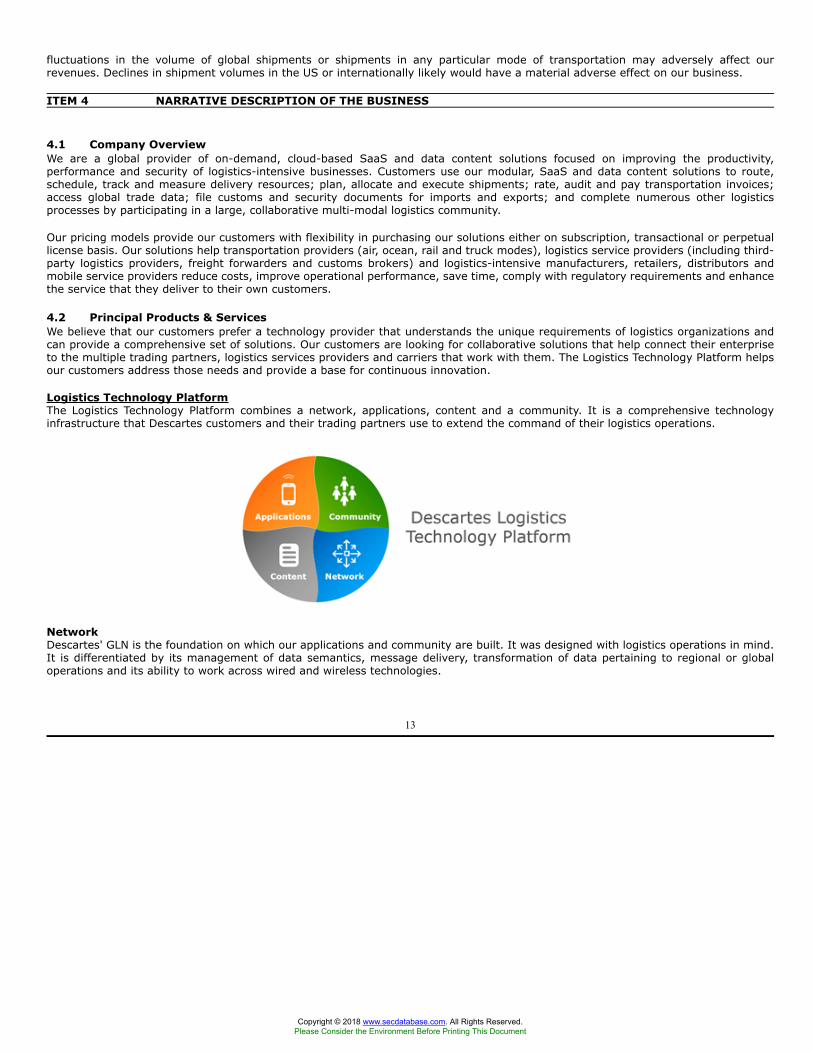
Logistics Technology PlatformThe Logistics Technology Platform combines a network, applications, content and a community. It is a comprehensive technologyinfrastructure that Descartes customers and their trading partners use to extend the command of their logistics operations.
NetworkDescartes' GLN is the foundation on which our applications and community are built. It was designed with logistics operations in mind.It is differentiated by its management of data semantics, message delivery, transformation of data pertaining to regional or globaloperations and its ability to work across wired and wireless technologies.
13
Copyright © 2018 www.secdatabase.com. All Rights Reserved.Please Consider the Environment Before Printing This Document
ContentDescartes' global trade content solutions offer comprehensive access to market leading data and tools to research, analyze and acton import/export movements, trade regulations and market trends; avoid the risk of transacting with denied or sanctioned parties;increase trade compliance rates; optimize sourcing, procurement, and business development strategies; and minimize duty spend.
CommunityOur global logistics community is a large, multi-modal network of logistics-intensive companies. We have historically enhanced ourcurrent solutions and added additional applications and community members through organic growth and acquisitions to strengthenour Logistics Technology Platform.
ApplicationsWith the GLN as the connectivity foundation, we have been expanding our logistics application functional footprint to offer a broadarray of modular interoperable web and wireless logistics management solutions.
We provide applications that help companies better manage their logistics book-to-bill process and purchase order-to-dock process,track inventory, meet regulatory requirements, optimize fleet performance, manage deliveries, and effectively communicate andcollaborate with their logistics partners. These applications can be principally categorized as: (i) Routing, Mobile & Telematics; (ii)Transportation Management; (iii) Customs & Regulatory Compliance; (iv) GLN Services; and (v) Broker & Forwarder EnterpriseSystems.
(i) Routing, Mobile & TelematicsDescartes' Routing, Mobile & Telematics suite supports the closed-loop process associated with planning, tracking, measuring,delegating and optimizing the use of assets and people that are involved in the movement of goods. These solutions can improveproductivity and reduce fuel, vehicle and labor costs. The suite helps address business challenges including the following: (1)strategic planning; (2) daily planning; (3) pickup/delivery reservations; (4) dispatch and vertical specific mobile solutions; (5)commercial fleet navigation; (6) reporting and measuring; (7) sales and merchandiser management; and (8) telematics andcompliance.
(1) Strategic Planning: Descartes Sales & Territory Planner™ and Descartes Area Planner™For strategic planning of recurring pickups or deliveries, Descartes Sales & Territory Planner performs complex servicescheduling that simultaneously considers daily, weekly and multi-week deliveries, as well as holidays and other non-working days. It also evaluates geographic distribution and sales potential for each customer to help establish optimalterritories and routes. Factors considered include minimizing travel time and related costs, and balancing opportunitiesacross members of the sales team. Additional parameters such as stops, distance and sales volume can also be used tohelp determine routes and route schedules for sales, delivery or both.
For strategic planning of highly variable pickups and deliveries, Descartes Area Planner utilizes historical demand withalgorithms to create models of demand density patterns. Those patterns are used to create territory and route plans.Descartes Area Planner takes into account service levels and delivery product types and is able to test the territory androute plan's resilience to change. Descartes Area Planner typically is used to generate multiple plans to fit daily, seasonalor business cycle driven demand variability.
(2) Daily Planning: Descartes Route Planner™, Descartes Route Planner RS™, Descartes Route PlannerOn-demand™ and Winroute™
Descartes provides a number of daily planning solutions to address the range of customer requirements from the mostcomplex to simple needs. Descartes Route PlannerTM takes in new orders as they are placed, optimizes them in real-time,allocating resources to help maximize operating efficiencies, deliver priority service to the most profitable accounts androutes, and maintain overall customer service objectives. Our other daily planning solutions optimize orders in groups,balancing service with costs and operational constraints. Our daily planning
14
Copyright © 2018 www.secdatabase.com. All Rights Reserved.Please Consider the Environment Before Printing This Document
solutions are designed to integrate with existing order management or transportation planning systems and can helpcompanies reduce costs as a result of shorter routes, reduced fuel consumption and enhanced fleet utilization. Descartes'comprehensive offering addresses a broad range of operational environments that can vary across different industries.
(3) Pickup/Delivery Reservations: Descartes Reservations™Descartes Reservations facilitates on-line scheduling of deliveries or service — either for self-service or as a decisionsupport tool for customer service agents. It helps companies to effectively tailor service to the demands of key customerswhile helping to achieve internal profitability goals. Descartes Reservations also confirms that requests can be met andschedules in the appointment, making Descartes Reservations an effective capable-to-promise tool.
(4) Descartes Execution and Mobile Solutions: Descartes Route Planner Dispatch™, Descartes RoutePlanner OnDemand Dispatch, Descartes Route Planner Automated Vehicle Locator™, Descartes RoutePlanner OnDemand AVLTM, Descartes MobileLink™, Descartes Food Perform™, Descartes DistributionPerform™, and Descartes Transport Perform™
Descartes Execution solutions (Descartes Route Planner OnDemand Dispatch, Descartes Route Planner Automated VehicleLocator™, Descartes Route Planner OnDemand AVL™) manage routes in progress, tracking their performance, addressingroute exceptions as they occur and capturing delivery and pickup status updates. Descartes Execution Solutions facilitatethe assignment and execution of pre-planned and same-day pick-ups and deliveries. Descartes Mobile solutions (DescartesMobileLink™, Descartes Food Perform™, Descartes Distribution Perform™, and Descartes Transport Perform™) provideintegrated two-way wireless communication and supports active and passive monitoring capabilities for enhanced logisticsexecution. By combining route planning and a free flow of information between dispatchers and the field, Descartes Mobilesolutions extend the traditional route planning process and provide real-time visibility into the execution of the plan. Thecombination of Descartes' Daily Planning solutions with Descartes Execution and Descartes Mobile solutions form the coreof plan versus actual performance evaluation and continuous logistics improvement.
Descartes Food Perform, Distribution Perform, and Transport Perform are cloud-based mobile solutions that automatetraditional paper-based processes and help streamline complex 'last mile' logistics processes. These solutions have beentailored to support 'last mile' commercial processes unique to each industry. They provide configurable, feature-rich mobiletechnology and advanced electronic proof of delivery operating on a hand-held device carried by drivers and other fieldpersonnel.
(5) Commercial Fleet Navigation: Descartes Mobium GPS Navigation™Descartes' Mobium GPS Navigation™ solution was specifically designed for businesses. Unlike navigation systems for theconsumer market, Descartes Mobium GPS Navigation features centralized real-time fleet management, automated licenseprovisioning, over-the-air updates, and easy integration with business applications already on a mobile device.
(6) Reporting and Measuring: Descartes Reporting Services™Descartes Reporting Services helps companies create and distribute reports within an organization or to suppliers, vendors,sub-contractors or carriers. It provides a simple, secure way to create customized delivery statistics and metrics. It canhelp simplify the creation and management of supply chain scorecards and, as a byproduct, can help identify best practices.
(7) Sales and Merchandiser Management: Descartes Sales and Merchandiser Management™Descartes Sales and Merchandiser Management enables resource planning, route building and optimization, and trackingacross delivery operations and mobile workforces, including sales representatives, territory managers and merchandisers.Descartes Sales and Merchandiser Management facilitates weekly activity planning, delivery status visibility formerchandisers
15
Copyright © 2018 www.secdatabase.com. All Rights Reserved.Please Consider the Environment Before Printing This Document
and sales representatives, actual distance driven, in-store time calculation and work data collection, and consolidatedperformance reporting. Performance data can be uploaded to corporate payroll and expense reporting systems to ensureappropriate payments are being made for resource performance. Descartes Sales and Merchandiser Management helpsour customers improve sales and merchandising productivity, cut costs and improve customer service.
(8) Telematics and Compliance: Descartes Telematics and Compliance™, Descartes Smartanalysis™ andDescartes SmartLicence™
Descartes' Telematics and Compliance solutions offer next generation mobile handheld devices that can continuouslymonitor performance of vehicles and drivers. Robust functionality for tracking vehicles, monitoring and scoring drivingbehavior and automation of driver logs and reporting on driver hours for "hours of service" regulatory compliancehelps increase workforce productivity and safety, prevents "hours of service" violations and reduces or eliminates excesspaperwork and processing times. In Europe, Descartes' Smartanalysis™ product is a leading tachograph analysis andcompliance management solution. It is used by road transport operators of all sizes to meet legal obligations and complywith Europe's complex driver working time regulations. Descartes SmartLicence is a comprehensive online tool for fleetoperators in the UK for electronically managing driving licenses and verifying license details with the UK's Driver andVehicle Licensing Agency.
(ii) Transportation ManagementDescartes' Transportation Management provides robust, network-based, modular, end-to-end multimodal functionality that spansthe entire shipment lifecycle. We streamline and support our customers' ability to turn purchase or sales order fulfillmentinto transport orders, manage carrier contracts, optimize and execute transportation plans, execute cross-docked and pooledshipments, connect to trading partners, control the flow of prepaid freight, track shipments and inventory, audit freight and managesupplier/carrier performance. The suite addresses unique requirements across truck, air, ocean and parcel modes.
Descartes Transportation Manager™Descartes Transportation Manager facilitates efficient planning and execution of shipping across air, ocean, truck andparcel modes at multiple touch-points in the distribution process. It helps logistics managers, shippers and third partiessimultaneously evaluate shipment alternatives to find efficient shipping methods. It is a solution that scales from theloading dock to the enterprise, providing up-to-date rates that allow the customer to both make efficient shipmentdecisions and comply with carrier communications, manifesting and labeling requirements. The pick, pack and shipcapability helps our customers manage small parcel shipments with postal services, a variety of small-package deliverycarriers and over 150 less-than-truckload carriers. It evaluates and optimizes transportation purchases across modes forboth operational effectiveness and cost efficiency, and helps answer tough questions such as: "How can I effectively use allof my carrier contracts?"; "Who is the most suitable carrier in this mode to handle my shipment?"; "What shipments can Icombine to lower my costs?"; and, "What shipment consolidation should I use - aggregation, multi-stop routes or poolingto reduce costs while meeting service requirements?".
Descartes Dock Appointment Scheduling™Descartes Dock Appointment Scheduling is a collaborative solution that enables shippers, carriers and consignees toschedule dock door appointments. It streamlines the dock appointment process by distributing the responsibility forscheduling from the warehouse to carriers and suppliers. By ensuring all supply chain partners are involved in the processand have visibility into requested, scheduled and rescheduled dock orders and appointments, this solution is designed tooptimize shipping and receiving operations at a warehouse.
Descartes Yard Management™A module of Descartes Transportation Manager, Descartes Yard Management enables shipping and receiving staff, gateguards and yard jockeys to more effectively manage the movement
16
Copyright © 2018 www.secdatabase.com. All Rights Reserved.Please Consider the Environment Before Printing This Document
of trailers and identify inventory in the yard. Designed to work seamlessly with Descartes Transportation Manager,Descartes Yard Management provides command and control of yards of all sizes.
Descartes Rate Builder™Descartes Rate Builder is a solution that helps carriers and non-vessel owning common carriers ("NVOCCs") manage globalrates, contracts and rate agreements more efficiently and meet regulatory obligations. Descartes Rate Builder enablescompanies to create, revise, store and distribute rates via the Internet. Once they are generated, Descartes Rate Builderstores all rates in a central database with controlled access privileges. Carriers can designate a "contract owner" who canallow multiple users to contribute during the drafting of a new contract or amendment. NVOCCs can effectively manage aglobal rate network and help enable logistics service providers ("LSPs") to create and manage both buy-side and sell-siderates digitally, enforce a standardized global pricing policy and implement a global rate request process. Descartes RateBuilder also supports the audit of ocean bills of lading.
Descartes Pool Distribution™The Descartes Pool Distribution portfolio provides visibility, reduces cost and removes bottlenecks as a retailer's productsmove from a shipper's Distribution Center (DC), consolidation point, or DC bypass facility through third-partytransportation provider networks and ultimately to its stores. The portfolio includes:
(1) Descartes PCSTrac™ is an inventory control and management solution for retail distributors designed tomanage multiple retailer accounts, varying label types, and specific requirements of each retailer – such ascustom delivery bills of lading (BOL), pallet scanning, out-of-area return processes, store-to-store transfersand EDI overage, shortage and damage (OS&D) files.
(2) Descartes Retail Distribution System™ is a carton-level freight tracking system used by third-partyspecialty retail pool distributors for receiving, sorting, scanning, and delivering retail freight to a shipper'sstores.
(3) Descartes Retail Claims System™ is a claims management system integrated with the retail distributiontracking solution and the visibility tools in Descartes WebTMS. It also works in tandem with the payment cyclesof the retail payment solution.
(4) Descartes Retail Payment System™ is a freight payment system for shippers to pay linehaul and pooldistribution transportation providers.
(5) Descartes ScanTrac™ enables "smart scanning" at delivery with any mobile device. Drivers use a Bluetoothattachment or their mobile phone camera to scan against the delivery manifest. If no cellular or WiFi connectionis available, the data is transmitted as soon as a connection is restored.
(6) Descartes StoreTrac™ allows users to create and maintain visibility, down to the item level, from the momentthe inventory leaves the DC all the way through to receipt at the store.
(7) Descartes WebTMS™ is a web-based visibility tool that allows a retailer to see its entire outbound distributionsupply chain and reverse logistics operations.
Descartes Bookings and Reservations™Descartes' centralized booking portals provide visibility into rates, contracts, and shipment details from global locations toenable more informed decision-making and contract development. Carriers can distribute product, routing, capacity andrate information to forwarders 24/7 in real-time, while forwarders can access carrier information and make
17
Copyright © 2018 www.secdatabase.com. All Rights Reserved.Please Consider the Environment Before Printing This Document
electronic bookings via a simple web browser. Integration of cost tables with contracts also allows for deeper analysis toimprove asset utilization and overall margins. Additionally, our host-to-host service enables forwarders to execute bookingsfrom within their own in-house systems. Descartes Bookings and Reservations services include the Descartes Global FreightExchange and Descartes CargoBooker.
Descartes OzLink™Descartes OzLink is a platform for integrating and extending ERP, accounting, e-commerce, and WMS systems to streamlineorder management, inventory control, and shipping. The solution functions as a complement to core business systemswhere gaps exist in the flow of data and/or system automation. Descartes OzLink's standard integration modules andbusiness process extensions can help seamlessly move data between systems and automate tasks to eliminate labor-intensive clerical work, error-prone data entry, lead time delays, and compromised customer service. The solution canflexibly connect systems that run in the cloud, operate on premise or within a hosted environment to address an extensiverange of e-Commerce, warehousing, and shipping processes.
Descartes pixi eCommerce Fulfillment/ Warehouse ManagementDescartes pixi eCommerce Fulfillment/Warehouse Management helps customers automate ecommerce processesoriginating from online orders. Integrated with hundreds of ecommerce sites in Europe, the solution enables small-to-medium sized businesses and large retailers looking to enhance their online presence to support the growing consumerdemand for omnichannel deliveries. The solution collects order information from ecommerce websites, translates it into ascanner-driven pick and pack process within the warehouse, initiates the shipment to the customer, and synchronizes allof this information with the customer's financial system for invoicing and shipment tracking.
Descartes ShipRush™Descartes ShipRush helps customers ship efficiently and cost-effectively by integrating with front-end commerce systemsand parcel shipping providers for seamless package labelling, rating, tracking and postage processing. With integrationsto over 70 business systems, including leading ERP, ecommerce and supply chain platforms, the ShipRush platformhelps customers to streamline their supply chain and reduce transportation costs. Using the solution, companies canautomatically import orders; compare carrier rates in real-time to get the best options every time; print shipping labels forFedEx, UPS, USPS, and other major U.S. and global carriers; and track shipments through to final delivery.
Descartes MacroPoint™Descartes MacroPoint is a multimodal freight visibility platform for shippers, brokers and 3PLs to get real-time visibilityand predictive analytics for in-transit freight. Our industry-leading visibility network is connected to over 100,000 carriersand millions of assets and drivers through integrations with on-board ELDs, GPS telematics devices, carrier transportationmanagement systems (TMS), GPS-enabled smartphone applications and location-based mobile phone triangulation.
Descartes Aljex™The Descartes Aljex solution provides back-office transportation management for freight brokers and transportationproviders. These solutions help customers automate business processes and create electronic documents critical forexecuting transportation moves. In addition, customers can manage the lifecycle of a shipment from order creation throughexecution, including real-time tracking with connectivity to the Descartes MacroPoint network.
(iii) Customs & Regulatory ComplianceOur Customs & Regulatory Compliance solutions help companies meet regulatory requirements for international shipmentsand the necessary customs declarations and security initiatives. We offer different methods to transmit shipment informationdirectly to customs authorities or to the carriers
18
Copyright © 2018 www.secdatabase.com. All Rights Reserved.Please Consider the Environment Before Printing This Document
who may be compiling data for security filing, which helps to ensure the smooth delivery of cargo as it moves through ports andairports, and ultimately to the end customer.
Descartes Global Cargo Security ™For carriers, freight forwarders, NVOCCs and shippers, Descartes Global Cargo Security Suite (formerly, Advanced ManifestService) offers solutions which help customers comply with electronic manifest filing initiatives across a broad numberof countries that have adopted various advance security filing requirements spanning different modes of transportation.To accommodate customers' varying technical capabilities, we offer options that range from user-friendly web portalsthat permit manual entry of cargo manifest information through to tightly integrated system-to-system electronic datainterchange ("EDI") connections. Descartes' offerings in this area include the Descartes Importer Security Filing™,Descartes ACI eManifest™, Descartes Advance Electronic Information (AEI)™, Descartes ACAS Solution™ and others.
Descartes Export Compliance™Descartes Export Compliance suite offers denied party screening, license validation and audit for all international tradingpartners. Screening parties for acceptability for receipt of product and the proper use of export licenses is essentialto support compliance with the US and EU requirements for export.
Descartes Border Compliance™Descartes Border Compliance provides customs compliance services to assist transportation providers and LSPs withimports and/or exports to Canada, the US, India and the Netherlands. Through our Viatrade Service, the GLN offers anenhanced range of services to help carriers and LSPs negotiate increasingly complex document exchange requirementsbrought about by international security initiatives and tightened borders. In addition, Descartes Border Complianceservices enable customs brokers to receive electronic manifests and invoices from transportation carriers so that themanifest can be mapped to the Canadian and US customs release systems.
Descartes Ocean Tariff Compliance™Descartes Ocean Tariff Compliance helps ocean carriers comply with US Federal Maritime Commission requirements, andalso helps manage the rate information for cargo that moves according to the terms of a privately-negotiated servicecontract or NVOCC Service Arrangement rather than the public rates of a tariff.
Descartes Electronic In-Bond™Specifically designed for transportation carriers, Descartes Electronic In-Bond helps transmit the necessary advanceelectronic cargo information to CBP regarding inbound shipments prior to their arrival in the US. Using approved EDIprotocols for the transmission of advance cargo information, we help carriers complete the requirements for filing, andreceive in-bond movement authorization within minutes instead of hours or even days.
Descartes Customs Warehouse Management™Descartes Customs Warehouse Management solution can play an integral role in simplifying procedures associated withcustoms warehousing, while taking advantage of the maximum available benefits. This on-demand solution is specificallydesigned to allow users to manage goods stored under the customs warehouse procedure, by storing information onimported goods and accounts, tracking all movement and activity, and enabling more accurate and timely electronicdeclaration processing. Customs warehousing is used by many organizations as a means to suspend/defer import dutiesand/or value-added tax on goods entering the EU. It is an effective and efficient means of enabling importers to choose anoptimum time to clear goods and pay duties or re-export them outside of the EU.
Descartes Global Customs & Transport™
19
Copyright © 2018 www.secdatabase.com. All Rights Reserved.Please Consider the Environment Before Printing This Document
Descartes' Global Customs & Transport ("GCT") suite provides its customers with European-centric customs declaration,security filing, transportation management and freight forwarding technology solutions on both a SaaS basis and adeployed model. The GCT platform supports fiscal customs filings in 18 countries and security filings in all 27 EU memberstates.
Descartes Pentant™Descartes Pentant™ is a Community System Provider ("CSP") in the UK providing manufacturers, retailers, distributorsand logistics service provider customers with a reliable and secure connection to both CHIEF (the central UK Revenue &Customs system) and the EU's ICS to streamline declaration, cargo security and clearance processes. Pentant also helpscustomers meet UK Revenue & Customs requirements for imports and exports to be managed through a fully approvedinventory control system for the ports of Dover, Portland, Poole, Plymouth, Teignmouth, Bideford, Scrabster, as well asLondon City and Warton airports.
Descartes e-customs™Descartes e-customs™ is a modular, cloud-based solution offering that helps manufacturers, retailers, distributors andlogistics service providers to cost-effectively comply with UK and fiscal security filing requirements. It is designed to reducecomplexity, increase automation, and facilitate the end-to-end customs declaration process. Importers and exporterscan leverage default and client-specific standing data, declaration templates, historical filings, on-screen tips and systemvalidations to increase speed and accuracy in the filing process.
(iv) Global Logistics Network ServicesGLN services simplify cargo and freight management by providing electronic services to the cargo industry and to companieswho engage in international and domestic transportation activities. GLN provides a secure and reliable transaction exchange plusconnectivity services that include trading partner on-boarding programs, data standards and protocol conversion, transportation-specific document compliance, audit and error checking, and archiving. We offer several document management, connectivity andcommunity services, including:
Descartes CargoAssist™Freight forwarders use Descartes CargoAssist to improve freight booking, send electronic waybills and ensure thatconsignments are handled quickly and efficiently at freight terminals around the world. We provide freight forwarders withaccess that connects them with their customers and logistics partners.
Descartes e-Pouch™As part of the Descartes air cargo solution suite, Descartes e-Pouch integrates with applications for bookings, shipmentmonitoring, quality performance reporting and customs filing to provide a central repository that enhances electronicdocument exchange connections between back-office system and trading partners. Descartes e-Pouch provides users withthe functionality to facilitate the sharing of information with approved parties, automate routine interactions, help flagproblems at an early stage and provide a repository for retrieval of completed deliveries.
Descartes webDocs™Freight forwarders use Descartes webDocs web forms to help improve air freight booking processes, send electronicwaybills and distribute freight messages with the required information directly to the air carriers. Descartes webDocsgives forwarders access to electronic web forms that enables quick and easy creation of the various documents andelectronic messages that are dictated by the industry, such as the International Air Transport Association's ("IATA") e-freight requirements. The solution also provides forwarders with the ability to easily create messaging documents such asmaster airway bill, house airway bill and labels and transmit these documents electronically to the air carrier.
20
Copyright © 2018 www.secdatabase.com. All Rights Reserved.Please Consider the Environment Before Printing This Document
Descartes Message Quality Monitor™Descartes Message Quality Monitor uses the power of the GLN to connect to major airlines and monitor the message flowto and from back-office systems. We display error messages and received status events, enabling users to take immediateaction for any discrepancies.
Descartes Data Integrity Services™Descartes Data Integrity Services continuously monitors messages and their delivery to trading partners to identify andreport errors. Once an error is identified, we contact trading partners and coordinate the correction of inaccuracies andre-submission of corrected data. The service also provides periodic summary reports by trading partner, message type anderror type.
Descartes Cargo iQ™ (formerly Cargo 2000™)Descartes Cargo iQ allows customers to monitor shipments at a master air waybill level from airport to airport, assistingcustomers in complying with IATA Cargo 2000 certification process. Information provided by the system includes qualityreport compilation, shipment status, exception alerts, route map creation, and departure time reporting. This informationenables better decision-making for fulfilling customer expectations and ensures standardized processes for improvedservice levels.
Descartes Carrier Portal™Descartes Carrier Portal is a cost-effective and efficient solution designed to help carriers without EDI capabilities,shippers, and freight payment agencies ("FPAs") realize all the benefits of EDI capabilities without the complexity of in-house solutions. The solution is a web-based information service that facilitates the collaboration and automation of loadtendering and freight payment between highway carriers and shippers (or FPAs representing them). The carrier portalbridges the gap between EDI-enabled back office systems of shippers and FPAs and less automated carriers.
Descartes GLN eArchiving™Descartes GLN eArchiving enables customers to store and archive electronic documents in an "electronic safe". Thiselectronic safe is accessible from the GLN via which relevant documents can be forwarded to customer's data warehouseto comply with standards and document retention policies.
Descartes Port Community Services™Descartes Port Community Services assist in improving cargo clearance and management operations for local portcommunities and their trading partners by connecting and streamlining information exchange between ocean carriers,inland carriers, forwarders, shippers, terminal operators, and port and customs authorities.
Descartes Global Data Catalog Connect™Descartes' Global Data Catalog Connect provides retail/supplier collaboration, product catalog management and electronicbusiness-to-business messaging. It is a web-based application that helps in the upload, management and exchange ofdata. It offers the ability to integrate with industry standard data pools like GS1DAS for automation of electronic productcatalogue functionality.
Descartes B2B Integration™Descartes B2B Integration™ solution provides cloud-based supply chain connectivity capabilities to a wide range of systemsand platforms using most any protocol or method. Our advanced solutions automate supply chain processes, enhancecollaboration and add visibility among global trading partners. Customers are able to electronically manage and streamlinea wide array of complex, mission-critical documents found in typical procure-to-pay and order-to-cash processes. Froma central hub, users can benefit from cost-effective transaction management, automated purchase to pay capabilities,connectivity to multiple ERP systems and more.
21
Copyright © 2018 www.secdatabase.com. All Rights Reserved.Please Consider the Environment Before Printing This Document
(v) Broker & Forwarder Enterprise SystemsDescartes' Broker & Forwarder Enterprise Systems are designed to help brokers and forwarders more efficiently run complexinternational operations. Our on-demand solutions enable large and small organizations to take advantage of robust capabilities forbookings, security filings and customs entries, shipment and financial management. They automate the collection of shared dataand multi-party shipment processes as well as help brokers and forwarders extend the command of operations with their logisticspartners to help meet their delivery performance objectives.
Descartes ITMR4™ Canadian Customs Brokerage SuiteDescartes ITMR4 Canadian Customs Brokerage Suite is an on-demand, enterprise level software solution that handlesfunctions that a customs broker, freight forwarder or self-filing importer typically uses to manage its operations. Thoseoperations include documentation filing, accounting, financial reports, imaging, e-billing and web tools for tracking andtracing, reporting and data entry related to Canadian customs declarations.
Descartes EDItrade™ Customs LinkDescartes EDItrade Customs Link allows custom brokers and self-filing importers to collect data and prepare it for UScustoms ACE entries, including cargo release, remote location filing and post-entry compliance and supportive modulesand the range of Partner Government Agency documentation and data requirements to streamline the customs processand create accurate declarations.
Descartes European Brokerage and DeclarationDescartes European Brokerage & Declaration helps simplify the complexities of customs clearance in the European market.Descartes' solution is Authorized Economic Operator compliant. It has a variety of modules to handle export management,import management, creation of the Single Administrative Document for normal or simplified procedures, incoming andoutgoing transit declarations, connectivity to the New Computerized Transit System and facilitates compliance with differentmember state customs authorities' requirements.
Descartes OneView™ Forwarder Enterprise & Customs House Brokerage SolutionDescartes OneView Forwarder Enterprise & Customs House Brokerage Solution allows freight forwarders, NVOCCs andthird-party logistics service providers to effectively coordinate air, truck and ocean import/export shipments. It supportsend-to-end planning and execution of international shipments, including leveraging system data to prepare and submitcustoms entries and cargo security filings to CBP.
Descartes ForwarderLogic™Descartes ForwarderLogic is a cloud-based solution that provides comprehensive back-office functionality and real-timeinformation exchange for LSPs handling all modes (air, ocean and land), inland/international import and export shipmentsfrom purchase orders all the way through to final delivery.
Descartes Forwarder Portal™Descartes Forwarder Portal™ is a web-based portal that helps forwarders and shippers collaborate for shipment creationand status tracking throughout the shipment's lifecycle. Powered by the Descartes GLN with industry-leading EDIconnectivity, the solution aggregates information from all of these parties and enables forwarders and their customers tobuild dashboard views of their transportation portfolio for up-to-the minute information on a wide range of data points. Thesolution also features purchase order management tools that support extensive collaboration between shippers, suppliersand transportation providers, and centralizes transportation request processes so forwarders can offer their customers asingle point for up-to-date information on their global shipments.
(vi) Global Trade ContentDescartes' global trade content solutions help customers research and make informed supply chain decisions; monitor and evaluatepotential growth opportunities, logistics partners, and competitors;
22
Copyright © 2018 www.secdatabase.com. All Rights Reserved.Please Consider the Environment Before Printing This Document
classify goods appropriately to ensure compliance while minimizing duties and tariffs; and reduce the risk of transacting businesswith denied parties while establishing an audit trail of reasonable care practices. Global trade content from Descartes can also beused on a service basis, to directly populate ERP and global trade management systems to enhance automation and complianceprocesses.
Descartes Customs Info™Descartes Customs Info helps customers research and make better classification decisions while providing a record ofthe process to support classification determinations. This robust global trade content offering provides various levelsof access to millions of reference documents, including cross-referenced and searchable duty rates, customs rulings,regulations, WCO Explanatory Notes, WCO Opinions, Commodity Export Codes, Other Government Agency information,Customs Directives, Export Control Classification Number locators and more.
Descartes Datamyne™With a comprehensive database of accurate, up-to-date import-export information, Descartes Datamyne deliversactionable intelligence for market research, sales insight, supply chain management, enhanced security and competitivestrategy. The Descartes Datamyne solution includes one of the largest searchable resources of trade activity. With datafrom 50 countries, our warehouse of information continues to grow by 100 million records per year with data aggregatedfrom global customs authorities and trade ministries. Manufacturers, shippers, wholesalers, transport and logistics serviceproviders, management consultants, legal practitioners, industry analysts and others use this data and the analysis toolsto evaluate growth strategies, explore new markets, benchmark performance, monitor commodity volumes and values,simplify trade data research, discover buyer-seller relationships and refine sourcing strategies.
Descartes MK Denied Party Screening™Descartes MK Denied Party Screening™ provides organizations of all sizes with easy-to-use options that quickly andefficiently screen customers, suppliers and trading partners against a comprehensive database of international restrictedand denied party lists. Customers can tailor screening processes to fit their unique risk parameters and flag potentialcompliance issues for prompt resolution.
Consulting, Implementation and Training Services
Our consultants provide a variety of professional services to customers. These services include project management and consultingservices to assist in configuration, implementation and deployment of our solutions. We offer a variety of site-specific technical andconsulting services to assist in all phases of the implementation process. We also provide assistance in integrating our products withthe customer's existing software. In addition, we offer training services that provide customers with a formalized program to ensurethat applications are implemented and utilized in an efficient and cost-effective manner.
Customer Service and Support and Maintenance
We provide worldwide support to our customers through our central support system. Our customer support program is conducted viatelephone, online customer portal and/or email and with our extended support options can be available 24-hours-a-day, 7-days-per-week.
4.3 Revenue SourcesWe generate our revenues from sales of each of the services and products identified in the previous section, which are sometimessold on a stand-alone basis and sometimes sold as bundles of services and products. As such, we do not measure our revenues bythe particular services or products referenced above. Instead, we measure our revenue performance based on whether the customeris buying a license to our technology or is buying technology services or other services from us. Based on this, our revenues aremeasured in two categories: services revenues and license revenues. Services revenues are principally comprised of the following: (i)ongoing transactional fees for use of our services and products by our
23
Copyright © 2018 www.secdatabase.com. All Rights Reserved.Please Consider the Environment Before Printing This Document
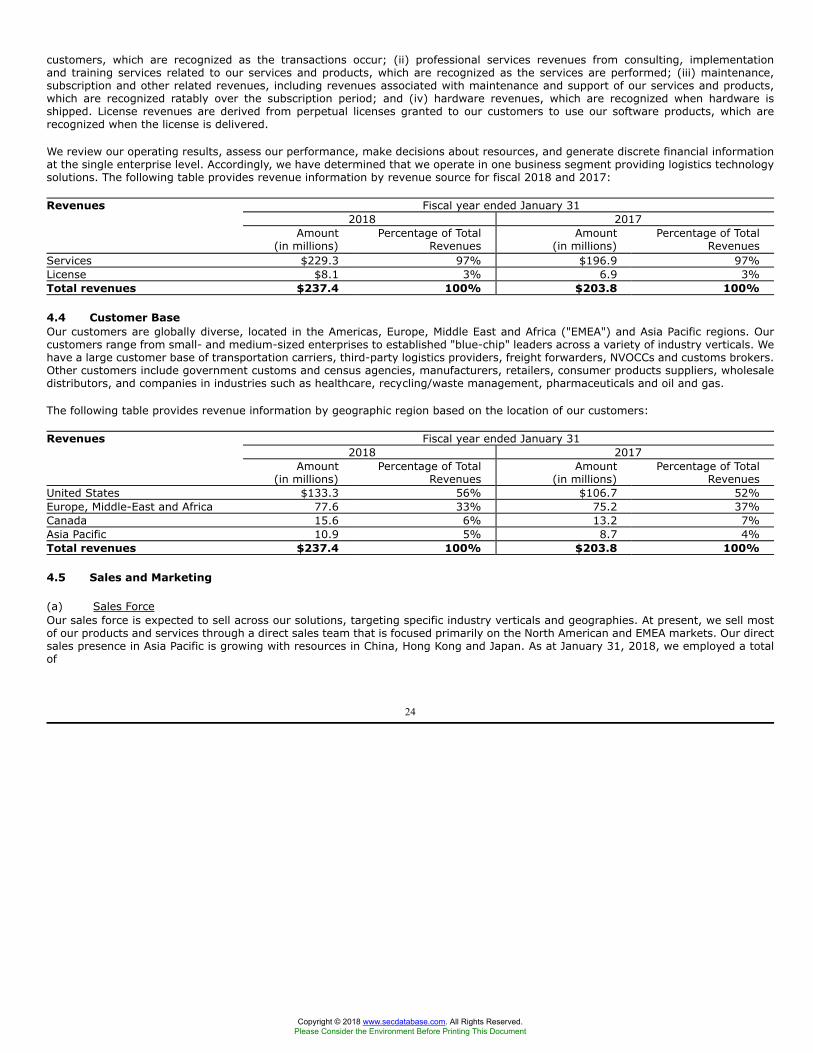
customers, which are recognized as the transactions occur; (ii) professional services revenues from consulting, implementationand training services related to our services and products, which are recognized as the services are performed; (iii) maintenance,subscription and other related revenues, including revenues associated with maintenance and support of our services and products,which are recognized ratably over the subscription period; and (iv) hardware revenues, which are recognized when hardware isshipped. License revenues are derived from perpetual licenses granted to our customers to use our software products, which arerecognized when the license is delivered.
We review our operating results, assess our performance, make decisions about resources, and generate discrete financial informationat the single enterprise level. Accordingly, we have determined that we operate in one business segment providing logistics technologysolutions. The following table provides revenue information by revenue source for fiscal 2018 and 2017:
Fiscal year ended January 312018 2017
Revenues
Amount(in millions)
Percentage of TotalRevenues
Amount(in millions)
Percentage of TotalRevenues
Services $229.3 97% $196.9 97%License $8.1 3% 6.9 3%Total revenues $237.4 100% $203.8 100%
4.4 Customer BaseOur customers are globally diverse, located in the Americas, Europe, Middle East and Africa ("EMEA") and Asia Pacific regions. Ourcustomers range from small- and medium-sized enterprises to established "blue-chip" leaders across a variety of industry verticals. Wehave a large customer base of transportation carriers, third-party logistics providers, freight forwarders, NVOCCs and customs brokers.Other customers include government customs and census agencies, manufacturers, retailers, consumer products suppliers, wholesaledistributors, and companies in industries such as healthcare, recycling/waste management, pharmaceuticals and oil and gas.
The following table provides revenue information by geographic region based on the location of our customers:
Fiscal year ended January 312018 2017
Revenues
Amount(in millions)
Percentage of TotalRevenues
Amount(in millions)
Percentage of TotalRevenues
United States $133.3 56% $106.7 52%Europe, Middle-East and Africa 77.6 33% 75.2 37%Canada 15.6 6% 13.2 7%Asia Pacific 10.9 5% 8.7 4%Total revenues $237.4 100% $203.8 100%
4.5 Sales and Marketing
(a) Sales ForceOur sales force is expected to sell across our solutions, targeting specific industry verticals and geographies. At present, we sell mostof our products and services through a direct sales team that is focused primarily on the North American and EMEA markets. Our directsales presence in Asia Pacific is growing with resources in China, Hong Kong and Japan. As at January 31, 2018, we employed a totalof
24
Copyright © 2018 www.secdatabase.com. All Rights Reserved.Please Consider the Environment Before Printing This Document
158 individuals in sales and marketing roles and had relationships with approximately 55 distributors and resellers.
We are headquartered in Waterloo, Ontario, Canada, with additional representative offices in Canada in Ottawa, Ontario; Toronto,Ontario; Windsor, Ontario; and Montreal, Quebec. Our primary representative offices in the United States are in Irvine, California;Boulder, Colorado; Miami, Florida; Atlanta, Georgia; Owing Mills, Maryland; Silver Spring, Maryland; Westborough, Massachusetts;Minneapolis, Minnesota, Midland Park, New Jersey; Cleveland, Ohio; Pittsburgh, Pennsylvania; Trevose, Pennsylvania; and Seattle,Washington. In Europe, our primary representative offices are in Ghent, Belgium; Lier, Belgium; Glostrup, Denmark; Antony,France; Munich, Germany; Leipzig, Germany; Amersfoort, Netherlands; Woerden, Netherlands; Oslo, Norway; Fredrikstaad, Norway;Zilina, Slovakia; Ljubljana, Slovenia; Madrid, Spain; Stockholm, Sweden; Malmo, Sweden; Goteborg, Sweden; Murten, Switzerland;Chippenham, UK; Aylesbury, UK; Reading, UK; and Totton, UK. In South America, our primary representative offices are in Montevideo,Uruguay; Buenos Aires, Argentina; and Sao Paulo, Brazil. In Asia Pacific, our primary representative offices are in Wollongong,Australia; Makati City, Philippines; Hong Kong; Tokyo, Japan; Suzhou, China; and Shanghai, China.
(b) Strategic Marketing AlliancesThrough our United by Design alliance program, we also form strategic partnerships with various companies in different geographicmarkets, in different industries and for different products with the goal of expanding our market base. Typically, an allianceparticipant will market our products in certain geographic and vertical markets and refer customers to us, in exchange for a fee inrespect of new customers generated by the alliance participant. Additionally, we have established several working relationships withtelecommunication companies, management consulting firms, and complementary hardware and software firms.
Channel partners, such as distributors and value-added resellers, play a central role in our strategy to address global customers,particularly in the Asia Pacific region and in Latin America with our delivery management solutions.
4.6 Research and Development
We believe that our future success depends in large part on our ability to maintain and continually enhance our current product linesand form tight integrations with our applications on our logistics technology platform. Accordingly, we invest in product developmentto ensure that sufficient resources are focused on developing new products or enhancing our existing products. We also believe thatit is important that our technology keeps pace with evolutions in hardware, applications and services that enable us to operate anddeliver our own services at lower cost. In 2018, we incurred research and development expenses of approximately $41.8 million, orapproximately 18% of our annual consolidated revenues for 2018.
We continue to make substantial investments in research and development based on our belief that our ability to enhanceexisting applications, develop and introduce new applications that keep pace with technological advances, meet changing customerrequirements, respond to competitive products and achieve market acceptance is important to our growth and future financialperformance.
Our research and development program requires in-depth knowledge of logistics, supply chain and customer know-how from businessanalysis, network operations and design, technical design, and quality assurance. Particular expertise in solving operations researchor logistics problems is a benefit to us, as is practical experience in dealing with the day-to-day challenges that our customers face indealing with logistics providers and deliveries in general. We believe that we are well positioned to address our customers' requirementswith our existing complement of resources; however, we evaluate our staffing levels on an ongoing basis particularly in those areaswhere we see ways we might expand or expedite our development processes as necessary to meet market opportunities or changes.
To build applications, we have implemented an application development process based on size, deployment mode and complexity. Forour smaller, less complex applications as well as for our network services and SaaS solutions, we have adopted an approach centeredon frequent, smaller application
25
Copyright © 2018 www.secdatabase.com. All Rights Reserved.Please Consider the Environment Before Printing This Document
updates. With the applications and solutions being deployed in our own, known environment and technology infrastructure, we areable to minimize development time otherwise needed to accommodate the myriad of platforms that an application may be used over.Using this approach, the majority of these applications, network services and SaaS solutions were updated in fiscal 2018.
For our larger more complex applications and solutions, we have adopted a six- to twelve-month release cycle. While we generally usethe same underlying development methodology, building in smaller incremental blocks, we apply a more traditional process for reviewand quality assurance testing as well as bundling of several of these incremental blocks into each generally available release. Usingthis six- to twelve-month release schedule, most of our larger and more complex generally available applications and solutions wereenhanced in fiscal 2018.
We currently plan to provide one or more major or minor releases for our generally available applications and solutions in fiscal2019 in alignment with the release schedules outlined above. Enhancements not yet generally commercially available are in internalpreproduction releases and systems. Once our internal testing is complete and, where applicable, additional testing is conducted withselect customers, we will release the enhancements for general commercial use. We estimate that the costs for the research anddevelopment activities for these enhancements will not result in any significant increase relative to our historical expenditures onresearch and development activities.
We continue to build and develop our network infrastructure to enhance our delivery of services to our customers. We are activelyexecuting our internal 'One Networked Enterprise' initiative whereby we are consolidating legacy network infrastructure acquiredas part of previous acquisition activities. We anticipate continuing this initiative through fiscal 2019, including the advancement ofadditional integration activities resulting from new acquisitions. To facilitate these advancements in integration activities, we continueto invest in our integration platform with a specific focus on decoupling business logic from the presentation layer.
4.7 Competition
Although we have experienced limited competition to-date from companies with broad application suites with comparable capabilities,the market for our applications is nevertheless highly competitive and subject to rapid technological change. As such, we expectcompetition to increase in the future. On an application-by-application basis, especially in markets where similar technology has beenavailable for some time, such as routing software and value-added networks, we do experience competition from established vendors.However, we have found that our particular expertise in solving complex logistics problems on a network basis has enabled us to remaincompetitive. On a geographic basis, we experience competition from both multinational companies and local competitors. We facesome disadvantage in entering new markets where competitors may have existing solutions with user interfaces that are advanced inlocal language presentation. To maintain and improve our competitive position on a global basis, we continue to develop and introducenew applications with the functionality to be easily adapted to local user interface needs (either by Descartes or its distributors in aparticular region).
We compete or may compete, directly or indirectly, with the following: (i) application software vendors, including supply chain planningand execution software vendors, that may broaden their product offerings by internally developing, or by acquiring or partnering with,independent developers of supply chain network solutions, particularly on the execution (rather than planning) side, such as ManhattanAssociates, Roadnet Technologies, Verizon (formerly, Telogis) and Ortec; (ii) enterprise resource planning software vendors who mayexpand their current offerings into supply chain network service offerings, some of whom may from time to time jointly market ourproducts as a complement to their own systems, such as SAP AG, Oracle and Infor Global Solutions; (iii) internal development effortsby corporate information technology departments; (iv) middleware software and service vendors that provide integration software,such as Software AG and SPS Commerce.; (v) telematics solution providers, such as Verizon (formerly, Fleetmatics), Omnitracs andTrimble Navigation; (vi) other value-added messaging networks, such as those offered by Kleinschmidt, OpenText GXS and CHAMPCargosystems; (vii) other cargo booking portals, such as Cargo Portal Services operated by Unisys Corporation and INTTRA; (viii) othercustoms compliance and forwarder back-office solution providers, such as Blu-Jay Solutions (formerly, Kewill) and WiseTech;
26
Copyright © 2018 www.secdatabase.com. All Rights Reserved.Please Consider the Environment Before Printing This Document
(ix) other customs and security declaration providers, often specialized in particular domestic markets, such as AEB GmbH and MICDatenverabeitung GmbH; and (x) other trade data providers who may either bundle their data with a global trade management system,such as Amber Road, or sell trade data content on a standalone basis, such as Thomson Reuters. We also expect to face additionalcompetition as other established and emerging companies enter the market for logistics technology solutions and new products andtechnologies are introduced and as we expand to new businesses. In addition, current and potential competitors may make strategicacquisitions or establish co-operative relationships among themselves or with third parties, thereby increasing the ability of theirproducts to address the needs of our prospective customers.
We believe the principal competitive factors affecting the market for our solutions include vendor and product reputation; expertiseand experience in implementing products in the customer's industry sector; product architecture, functionality and features; cost ofownership; ease and speed of implementation; customer support; product quality, price and performance; and product attributessuch as flexibility, scalability, compatibility, functionality and ease of use. In order to be successful in the future, we believe we mustcontinue to respond promptly and effectively to technological change and competitors' innovations.
4.8 Intellectual Property and Other Proprietary Rights
We believe our success depends significantly on our proprietary technology. With our recent acquisitions we have continued to enhancethe breadth of our intellectual property portfolio. We continue to rely primarily on a combination of patent, copyright, trademark andtrade secret laws, license agreements, non-disclosure agreements and other contractual provisions to establish, maintain and protectour proprietary rights in our products and technology. Some registered forms of protection, such as patents, copyright and trademarkregistrations, have a limited period of protection determined by the applicable law governing the registration. Other contractual formsof protection, such as license and non-disclosure agreements, have a limited contractual period of protection. The source codes androuting algorithms for our applications and technology are protected both as trade secrets and as unregistered copyrighted workswith indefinite periods of protection. We have several patents, both granted and pending, in the field of mobile data management.We also hold a patent for technology used in our dynamic vehicle routing application and have rights in one US patent for certaintechnological processes contained in our network architecture. Each of these patents offer a limited period of protection determined bythe applicable laws governing the patents. We have registered or applied for registration of certain trademarks and service marks withlimited periods of protection and will continue to evaluate the registration of additional trademarks and service marks as appropriate.
We also utilize certain other software technologies, such as geographic data, shipping rate data, shipping mile data, sailing scheduledata and global tariff and duty data, translation applications and business intelligence applications that we license from third parties,generally on a non-exclusive basis, including software that is integrated with internally developed software and used in our productsto perform key functions. These third-party licenses generally require the payment of royalties based on sales of the product in whichthe technology is used.
Our network customers may use electronic logistics information generated by the customer, or by third parties on behalf of thecustomer, in connection with the customer's use of our network services. Our customers are responsible for procuring and paying forthe generation of such electronic logistics information and the right to use such electronic logistics information in connection with ournetwork services.
Many of our data content solutions rely on data being available to us from various public sources. This data is available on a non-exclusive basis and generally available without the payment of fees except in certain cases where we may choose to obtain the datathrough third party data providers who may have pre-processed or aggregated the data in a manner that is more efficient or effectivefor our purposes. This data is similarly available to other parties and may allow other parties to develop competitive offerings. Ourability to maintain our market position is dependent upon our continued innovation in the ability to
27
Copyright © 2018 www.secdatabase.com. All Rights Reserved.Please Consider the Environment Before Printing This Document
organize the data and provision of tools that facilitate the use of the data while continuing to expand and enhance the data.
4.9 Contracts
(a) Customer ContractsWe provide our GLN services and access to our data content services to our customers primarily by way of written subscriptionagreement. The subscription agreement sets out the applicable terms and restrictions on use of the service, the length of time thecustomer can use the service, and the applicable fees to be paid by the customer. Typically, these subscription agreements renew at acustomer's option and, in some cases, are subject to earlier termination by the customer on appropriate notice.
We license our software products to our customers primarily by way of written license agreements. The license agreements specify theapplicable terms and restrictions on use of the software, the terms and conditions of any enrolment by the customer in our softwaremaintenance program, and the applicable fees to be paid by the customer.
We depend on our installed customer base for a significant portion of our revenues. We have significant contracts with our licensecustomers for ongoing support and maintenance, as well as significant service contracts that provide recurring services revenues tous. In addition, our installed customer base has historically generated additional new license and services revenues for us. Servicecontracts are generally renewable at a customer's option, and there are generally no mandatory payment obligations or obligations tolicense additional software or subscribe for additional services.
If our customers terminate their subscription agreements, fail to renew their service contracts, fail to purchase or license additionalservices or products, or consolidate contracts with acquired companies, then our revenues could decrease and our operating resultscould be adversely affected. Factors influencing such contract terminations and non-renewals could include changes in the financialcircumstances of our customers, dissatisfaction with our products or services, our retirement or lack of support for our legacy productsand services, our customers selecting or building alternate technologies to replace ours, and changes in our customers' business orin regulation impacting our customers' business that may no longer necessitate the use of our products or services, general economicor market conditions, or other reasons. Further, our customers could delay or terminate implementations or use of our services andproducts or be reluctant to migrate to new products. Such customers will not generate the revenues we may have anticipated withinthe timelines anticipated, if at all, and may be less likely to invest in additional services or products from us in the future. We may notbe able to adjust our expense levels quickly enough to account for any such revenues losses. Our business may also be unfavorablyaffected by market trends impacting our customer base, such as consolidation activity.
(b) Outsourcing ContractsWe deliver some of our GLN services over our proprietary networks, which are hosted by commercial hosting and co-locationproviders such as, Q9 Networks Inc., Level 3 Communications and Evry AS. These hosting and co-location contracts, on which we aresubstantially dependent as they relate to the delivery of our network services, typically contemplate services to be provided for a termat a defined service level, with applicable rights of termination and renewal. We typically pay monthly fees under these contracts, someof which are based on the volume of network activity flowing through the hosting provider. If any of these contracts were terminatedwithout our consent, we could incur substantial costs in migrating to an alternate hosting provider. In such an event, the costs andrelated management effort could materially adversely affect our operating results and the services that we provide to our customers.
4.10 EmployeesAs at January 31, 2018, the Company employed 1,270 employees including 1,235 full-time staff. Of the 1,235 full-time staff, 359 ofthe individuals were engaged in customer service roles (which includes customer support, activations and implementation services),393 were in research and development roles, 158 were engaged in sales and marketing roles, 215 in network and product supportroles and 110 were
28
Copyright © 2018 www.secdatabase.com. All Rights Reserved.Please Consider the Environment Before Printing This Document
in general administration roles. Geographically, 660 employees were located in North America, 459 were located in Europe, 62 werelocated in the Asia Pacific region and 54 were located in South America.
4.11 Risks Associated with Foreign Sales and Exchange Rate Fluctuations
In fiscal 2018, sales outside of the Americas accounted for approximately 38% of our total revenues. Our international revenues aresubject to risks associated with foreign sales, including longer collection times from foreign customers, difficulty in repatriating cashfrom foreign jurisdictions, unexpected changes in legal and regulatory requirements, export restrictions, changes in tariffs, exchangerates and other trade barriers, political and economic instability, difficulties in accounts receivable collection, difficulties in managementof distributors or representatives, difficulties in staffing and managing foreign operations, difficulties in protecting our intellectualproperty, seasonality of sales, language issues and potentially adverse tax consequences. There can be no assurance that any of thesefactors will not have a material adverse effect on our business, results of operations and financial condition.
During fiscal 2018, 65% of our revenues were denominated in US dollars, and historically the majority of our revenues have beendenominated in US dollars. However, a significant portion of our expenses, including the wages of our non-US employees andobligations under certain key supply agreements, have been denominated in Canadian dollars, euros and other foreign currencies.Therefore, changes in the value of the US dollar as compared to the Canadian dollar, the euro, British pound sterling and otherforeign currencies may materially affect our operating results. We generally have not implemented hedging programs to mitigate ourexposure to currency fluctuations affecting international accounts receivable, cash balances and inter-company accounts. We alsohave not hedged our exposure to currency fluctuations affecting future international revenues and expenses and other commitments.Accordingly, currency exchange rate fluctuations have caused, and may continue to cause, variability in our foreign currencydenominated revenue streams, expenses, and our cost to settle foreign currency denominated liabilities.
4.12 Risks Associated with Cyclical or Seasonal Aspects of Business
Our business may be impacted from time to time by the general cyclical and seasonal nature of particular modes of transportation andthe freight market in general, as well as the cyclical and seasonal nature of the industries that such markets serve. Factors which maycreate cyclical fluctuations in such modes of transportation or the freight market in general include legal and regulatory requirements,timing of contract renewals between our customers and their own customers, seasonal-based tariffs, vacation periods applicable toparticular shipping or receiving nations, weather-related events that impact shipping in particular geographies and amendments tointernational trade agreements. Since some of our revenues from particular products and services are tied to the volume of shipmentsbeing processed, adverse fluctuations in the volume of global shipments or shipments in any particular mode of transportation mayadversely affect our revenues. Declines in shipment volumes in the US or internationally likely would have a material adverse effect onour business.
4.13 Reorganizations
In 2018, 2017 and 2016, we completed various integration and reorganization activities in connection with our acquisitions of Aljex,MacroPoint, PCSTrac, ShipRush, Datamyne, 4Solutions, Appterra, Pixi, Oz, MK Data and Bearware, including merging or consolidatingvarious legal entities and operations, eliminating redundant management positions and canceling certain ongoing operating contracts.
4.14 Material ContractsThe Company has not entered into any material contracts, other than contracts entered into in the ordinary course of business, withinthe past year or entered into before the most recently completed fiscal year that are still in effect.
29
Copyright © 2018 www.secdatabase.com. All Rights Reserved.Please Consider the Environment Before Printing This Document
4.15 Code of Business Conduct and EthicsOur Board of Directors has adopted our Code of Business Conduct and Ethics ("the Code") applicable to our directors, officers andemployees. The Code is reviewed on a regular basis by our Board of Directors and may be updated from time to time. The mostrecent version of the Code is available on our website at http://www.descartes.com and has been filed on and is accessible through theSEDAR website at http://www.sedar.com. The Code sets out in detail the core values and principles by which the Company is governedand addresses topics such as: honest and ethical conduct; conflicts of interest; compliance with applicable laws and our policiesand procedures; public disclosure and books and records; use of corporate assets and opportunities; confidentiality of corporateinformation; reporting responsibilities and procedures; health and safety; anti-corruption; and non-retaliation.
ITEM 5 RISK FACTORS
Reference is made to the section entitled "Certain Factors That May Affect Future Results" in the "Management's Discussion andAnalysis of Financial Condition and Results of Operations" contained in our 2018 Annual Report for the year ended January 31,2018, made available to all of our shareholders and filed with various securities regulators, which section is incorporated hereinby reference. This information is available through the EDGAR website at http://www.sec.gov or through the SEDAR website athttp://www.sedar.com.
ITEM 6 MARKET FOR SECURITIES AND RELATED SECURITYHOLDER MATTERS
6.1 Common SharesWe are authorized to issue an unlimited number of common shares for unlimited consideration. The common shares are notredeemable or convertible. Each common share carries the right to receive notice of and one vote at a meeting of shareholders; theright to participate in any distribution of our assets on liquidation, dissolution or winding up; and the right to receive dividends if, asand when declared by the Board of Directors. As at April 30th, 2018, there were 76,814,800 common shares outstanding. The commonshares are listed on the TSX under the symbol "DSG" and listed on NASDAQ under the symbol "DSGX".
6.2 Transfer Agent and RegistrarThe register of transfers of common shares is located in the offices of our stock transfer agent: Computershare Investor Services Inc.,100 University Avenue, Toronto, Ontario, Canada, M5J 2Y1.
6.3 Dividend PolicyWe have not paid any dividends on our common shares to date. We may consider paying dividends on our common shares in the futurewhen operational circumstances permit, having regard to, among other things, our earnings, cash flow and financial requirements aswell as relevant legal and business considerations. We are prohibited by the Credit Facility from making a distribution (which includesa dividend) when there is an uncured event of default pursuant to the Credit Facility. At present there is no such event of default.
30
Copyright © 2018 www.secdatabase.com. All Rights Reserved.Please Consider the Environment Before Printing This Document
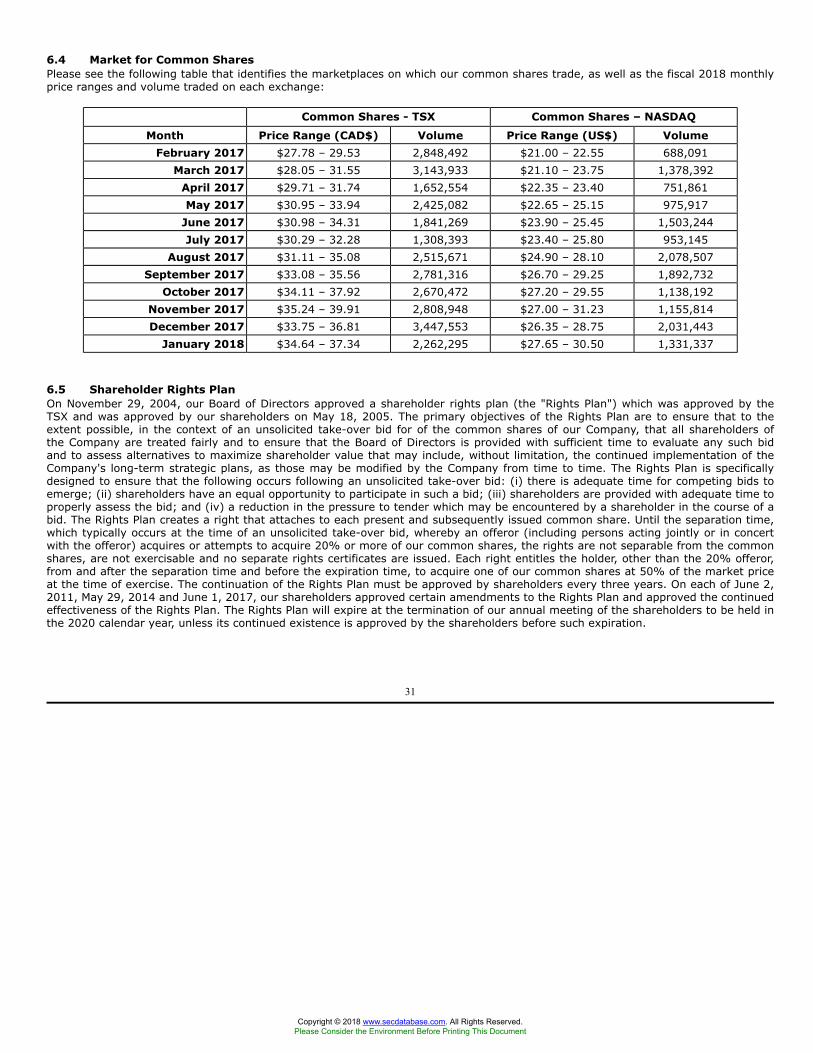
6.4 Market for Common SharesPlease see the following table that identifies the marketplaces on which our common shares trade, as well as the fiscal 2018 monthlyprice ranges and volume traded on each exchange:
Common Shares - TSX Common Shares – NASDAQ
Month Price Range (CAD$) Volume Price Range (US$) VolumeFebruary 2017 $27.78 – 29.53 2,848,492 $21.00 – 22.55 688,091
March 2017 $28.05 – 31.55 3,143,933 $21.10 – 23.75 1,378,392April 2017 $29.71 – 31.74 1,652,554 $22.35 – 23.40 751,861May 2017 $30.95 – 33.94 2,425,082 $22.65 – 25.15 975,917
June 2017 $30.98 – 34.31 1,841,269 $23.90 – 25.45 1,503,244July 2017 $30.29 – 32.28 1,308,393 $23.40 – 25.80 953,145
August 2017 $31.11 – 35.08 2,515,671 $24.90 – 28.10 2,078,507September 2017 $33.08 – 35.56 2,781,316 $26.70 – 29.25 1,892,732
October 2017 $34.11 – 37.92 2,670,472 $27.20 – 29.55 1,138,192November 2017 $35.24 – 39.91 2,808,948 $27.00 – 31.23 1,155,814December 2017 $33.75 – 36.81 3,447,553 $26.35 – 28.75 2,031,443
January 2018 $34.64 – 37.34 2,262,295 $27.65 – 30.50 1,331,337
6.5 Shareholder Rights PlanOn November 29, 2004, our Board of Directors approved a shareholder rights plan (the "Rights Plan") which was approved by theTSX and was approved by our shareholders on May 18, 2005. The primary objectives of the Rights Plan are to ensure that to theextent possible, in the context of an unsolicited take-over bid for of the common shares of our Company, that all shareholders ofthe Company are treated fairly and to ensure that the Board of Directors is provided with sufficient time to evaluate any such bidand to assess alternatives to maximize shareholder value that may include, without limitation, the continued implementation of theCompany's long-term strategic plans, as those may be modified by the Company from time to time. The Rights Plan is specificallydesigned to ensure that the following occurs following an unsolicited take-over bid: (i) there is adequate time for competing bids toemerge; (ii) shareholders have an equal opportunity to participate in such a bid; (iii) shareholders are provided with adequate time toproperly assess the bid; and (iv) a reduction in the pressure to tender which may be encountered by a shareholder in the course of abid. The Rights Plan creates a right that attaches to each present and subsequently issued common share. Until the separation time,which typically occurs at the time of an unsolicited take-over bid, whereby an offeror (including persons acting jointly or in concertwith the offeror) acquires or attempts to acquire 20% or more of our common shares, the rights are not separable from the commonshares, are not exercisable and no separate rights certificates are issued. Each right entitles the holder, other than the 20% offeror,from and after the separation time and before the expiration time, to acquire one of our common shares at 50% of the market priceat the time of exercise. The continuation of the Rights Plan must be approved by shareholders every three years. On each of June 2,2011, May 29, 2014 and June 1, 2017, our shareholders approved certain amendments to the Rights Plan and approved the continuedeffectiveness of the Rights Plan. The Rights Plan will expire at the termination of our annual meeting of the shareholders to be held inthe 2020 calendar year, unless its continued existence is approved by the shareholders before such expiration.
31
Copyright © 2018 www.secdatabase.com. All Rights Reserved.Please Consider the Environment Before Printing This Document
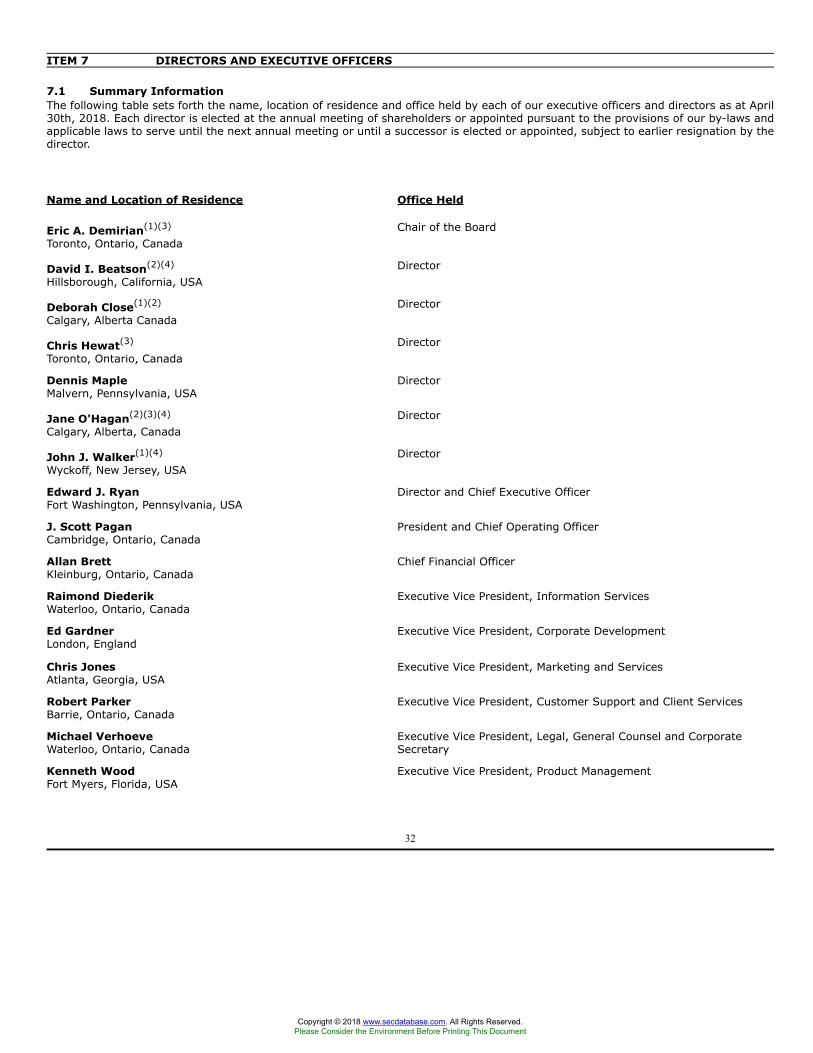
ITEM 7 DIRECTORS AND EXECUTIVE OFFICERS
7.1 Summary InformationThe following table sets forth the name, location of residence and office held by each of our executive officers and directors as at April30th, 2018. Each director is elected at the annual meeting of shareholders or appointed pursuant to the provisions of our by-laws andapplicable laws to serve until the next annual meeting or until a successor is elected or appointed, subject to earlier resignation by thedirector.
Name and Location of Residence Office Held
Eric A. Demirian(1)(3)
Toronto, Ontario, CanadaChair of the Board
David I. Beatson(2)(4)
Hillsborough, California, USADirector
Deborah Close(1)(2)
Calgary, Alberta CanadaDirector
Chris Hewat(3)
Toronto, Ontario, CanadaDirector
Dennis MapleMalvern, Pennsylvania, USA
Director
Jane O'Hagan(2)(3)(4)
Calgary, Alberta, CanadaDirector
John J. Walker(1)(4)
Wyckoff, New Jersey, USADirector
Edward J. RyanFort Washington, Pennsylvania, USA
Director and Chief Executive Officer
J. Scott PaganCambridge, Ontario, Canada
President and Chief Operating Officer
Allan BrettKleinburg, Ontario, Canada
Chief Financial Officer
Raimond DiederikWaterloo, Ontario, Canada
Executive Vice President, Information Services
Ed GardnerLondon, England
Executive Vice President, Corporate Development
Chris JonesAtlanta, Georgia, USA
Executive Vice President, Marketing and Services
Robert ParkerBarrie, Ontario, Canada
Executive Vice President, Customer Support and Client Services
Michael VerhoeveWaterloo, Ontario, Canada
Executive Vice President, Legal, General Counsel and CorporateSecretary
Kenneth WoodFort Myers, Florida, USA
Executive Vice President, Product Management
32
Copyright © 2018 www.secdatabase.com. All Rights Reserved.Please Consider the Environment Before Printing This Document
Notes:(1) Member of the Audit Committee.(2) Member of the Compensation Committee.(3) Member of the Corporate Governance Committee.(4) Member of the Nominating Committee
Information about each of our directors and executive officers, including his or her respective principal occupation during at least thefive years preceding January 31, 2018, is as follows:
Eric A. Demirian has been a member of our Board of Directors since June 2011. Mr. Demirian was appointed Chairman of the Boardin May 2014 and previously acted as Chair of the Corporation's audit committee. Mr. Demirian is a Chartered Professional Accountant,Certified General Accountant and a Chartered Accountant. Since 2003, Mr. Demirian has served as president of Parklea Capital, Inc.("Parklea"), a boutique financial and strategy advisory firm providing services to small- and mid-market public and private companies,and President of Demicap Inc., a private investment firm. Prior to Mr. Demirian's position at Parklea, he held the position of ExecutiveVice President of Group Telecom, Inc. from 2000 to 2003. From 1983 to 2000, Mr. Demirian was with PricewaterhouseCoopers LLP("PwC") where he was a partner and head of the Information and Communications Practice. Mr. Demirian serves on the boards ofEnghouse Systems Ltd. (TSX:ENGH), Redline Communications Inc. (TSX:RDL), and Imax Corporation (NYSE:IMAX). Mr. Demirian is aformer director and chair of the audit committees of a number of public companies, including Menu Foods Income Fund (2005-2010)and Keystone North America Inc. (2007-2010). Mr. Demirian holds a Bachelor of Business Management degree from RyersonUniversity.
David I. Beatson has been a member of our Board of Directors since March 2006. Since August 2001, Mr. Beatson has beenhead of Ascent Advisors, LLC, a San Francisco Bay-Area consulting firm focusing on strategic planning and mergers and acquisitions.From December 2006 to October 2012, Mr. Beatson was Chief Executive Officer of GlobalWare Solutions, a full-service provider ofe-commerce services along with digital and physical supply chain management solutions with operations in North America, Europeand Asia. From June 2003 to April 2005, Mr. Beatson was President and Chief Executive Officer of North America for Panalpina, Inc.,a world-leading global transportation and logistics supplier based in Basel, Switzerland. Previously, Mr. Beatson served as Chairman,President and Chief Executive Officer of Circle International Group, Inc., a global transportation and logistics company, and as Presidentand Chief Executive Officer of US-based air and ocean freight forwarder Emery Worldwide. Mr. Beatson serves on the board of directors,chair of the audit committee and member of the compensation committee of PFSweb, Inc. (NASDAQ: PFSW), on the Executive Board ofATL Partners, a Private Equity Fund based in New York City, and on several other corporate and industry boards. Mr. Beatson receivedhis BS in Business Administration from The Ohio State University and his MBA from The University of Cincinnati.
Deborah Close has been a member of our Board of Directors since May 2015. Ms. Close held the position of President of theProduction Services division of Tervita Corporation from 2010 until 2016. Tervita Production Services, now High Artic Energy Services(TSX:HWO), delivers engineering and field-based services to the oil and gas industry. From 2002 to 2010, Ms. Close was the ExecutiveVice President of DO2 Technologies (now Transzap, Inc.), a software company providing electronic invoicing to the oil and gas industry.During Ms. Close's tenure, DO2 grew from a start-up to the leading provider of e-invoicing to oil and gas companies and their suppliers.Prior to DO2, Ms. Close served in a number of Regional Vice President roles in Halliburton Corporation's software division, LandmarkGraphics. She held executive roles in several of Landmark's largest regions, including VP of Strategic Accounts, Regional VP of NorthAmerica and Regional VP of Europe and the Former Soviet Union. During Ms. Close's 12 years at Halliburton, she worked in Canada,the US and Europe. Ms. Close also currently serves on the board of directors of a private oil and gas company. Ms. Close holds aBachelor of Arts from the University of Calgary and the ICD.D designation from the Institute of Corporate Directors and Rotman Schoolof Management.
Chris Hewat has been a member of our Board of Directors since June 2000. Mr. Hewat has been a partner at the law firm of Blake,Cassels & Graydon LLP ("Blakes") since 1993, having joined the firm in 1987. Mr. Hewat's practice consists of advising on securitiesand business law matters, with focus on mergers
33
Copyright © 2018 www.secdatabase.com. All Rights Reserved.Please Consider the Environment Before Printing This Document
and acquisitions, corporate finance and private equity transactions. He has particular expertise in advising issuers, investment dealersand investors in the technology sector. Mr. Hewat has served as a director of a number of private and public companies and wasformerly a member of the Securities Advisory Committee to the Ontario Securities Commission. Mr. Hewat has Juris Doctor and Mastersof Business Administration degrees from Western University, and a Bachelor of Arts degree from Queen's University. Blakes providedlegal services to us during the fiscal year ended January 31, 2018 and has been providing, and is expected to continue to provide,legal services to us in the fiscal year ending January 31, 2019.
Dennis Maple was elected to our Board of Directors on June 1, 2017. Since January 2014, Mr. Maple has been the President of FirstStudent, Inc., a subsidiary of United Kingdom based publicly-traded First Group plc. First Group plc is the leading transport operatorin the United Kingdom and North America, providing solutions encompassing student bus transportation and public rail. Mr. Maple'sportfolio at First Student includes 57,000 employees focused on providing more than 6 million passenger journeys daily across the USand Canada. Prior to serving as President of First Group, from 2006 to January 2014, Mr. Maple was President of Aramark Educationwhere he had responsibility for more than 15,000 employees serving more than 4,500 US schools with food preparation, facilitiesmanagement and related services. Prior to his role as President of Aramark Education, from 2003 to 2006, Mr. Maple held seniorexecutive management positions at Aramark. Prior to serving in an executive role at Aramark, from 1994 to 2003, Mr. Maple served asan Area Vice President at Coors Brewing and in several other management roles. Prior to 1994, Mr. Maple held roles at Kraft-GeneralFoods, PepsiCola and The Quaker Oats Company. Mr. Maple has a Bachelor of Science, Business Administration, Accounting from theUniversity of Tennessee. Mr. Maple has served on numerous charitable and community-based boards and has been an active participantin organizations supporting primary and secondary schools and communities across North America.
Jane O'Hagan has been a member of our Board of Directors since May 2014. From 2010 until 2014, Ms. O'Hagan was the ExecutiveVice President and Chief Marketing Officer of Canadian Pacific Railway Limited ("CP Rail"). Ms. O'Hagan also held various rolesat CP including Senior Vice President, Strategy and Yield, Vice President Strategy and External Affairs and Assistant Vice President,Strategy and Research. Ms. O'Hagan also serves as a director of USD Partners GP LCC, the general partner of USD Partners LP(NYSE:USDP), an acquirer, developer and operator of energy-related rail terminals and other complementary mid-stream assets sinceOctober 2014. Ms. O'Hagan serves as the Chair of the USD Partners GP LLC board's conflicts committee and as a member of the auditcommittee. In 2018, Ms. O'Hagan joined the board of Pinnacle Renewable Holdings, a supplier of industrial wood pellets (TSX:PL)based in Richmond, BC and serves as a member of the audit and risk committees. Ms. O'Hagan has a Bachelor of Arts (Hons.) anda Bachelor of Administrative and Commercial Studies from the University of Western Ontario (London, Ontario, Canada) and hascompleted graduate studies in Program and Policy Studies from the University of Western Ontario. In December, 2012, Ms. O'Haganwas named one of Canada's Top 100 Most Powerful Women by the Women's Executive Network. Ms. O'Hagan is also a holder of theICD.D designation from the Institute of Corporate Directors, which she achieved in June 2016 and earned the CERT Certificate in CyberRisk Oversight issued by Carnegie Mellon University and the National Association of Corporate Directors in February 2018.
John J. Walker has been a member of our Board of Directors since September 2011. Mr. Walker is a Certified Public Accountantand a Chartered Global Management Accountant with 37 years overall financial and executive management experience includingtwenty-one years of experience as a Chief Financial Officer with both public and private companies. Most recently, he served as ChiefFinancial Officer, and Senior Vice President of Bowne & Company, a New York Stock Exchange-listed provider of services to helpcompanies produce and manage their shareholder, investor and marketing & business communications, from 2006 until its acquisitionby R.R. Donnelley & Sons in 2010. Prior to Bowne & Company, from 1988 to 2006, Mr. Walker was an executive with Loews CineplexEntertainment Corporation a motion picture theatre exhibition chain, including sixteen years as Chief Financial Officer. Prior thereto,Mr. Walker served for six years as Controller and Principal Accounting Officer of Corporate Property Investors, then one of
34
Copyright © 2018 www.secdatabase.com. All Rights Reserved.Please Consider the Environment Before Printing This Document
the largest real estate investment trusts in the United States. Mr. Walker also served for six years as Treasurer and Assistant CorporateController of Princess Hotels International a company involved in the ownership and operation of luxury resort hotels, real estate andtimesharing developments. Mr. Walker started his career in the New York office of then-Price Waterhouse. Mr. Walker is a member ofthe American Institute of Certified Public Accountants and the New York State Society of CPAs.
Edward J. Ryan is our Chief Executive Officer and has been a member of our Board of Directors since May 2014. Mr. Ryan joinedDescartes in February 2000 in connection with our acquisition of E-Transport Incorporated. Since then, Mr. Ryan has occupied varioussenior management positions within Descartes, with particular focus on our network and recurring business. Mr. Ryan was appointedGeneral Manager, Global Logistics Network in June 2004 and then appointed Executive Vice President, Global Field Operations in July2007. He was appointed Chief Commercial Officer in June 2011 and appointed Chief Executive Officer in November 2013.
J. Scott Pagan is our President and Chief Operating Officer. Mr. Pagan joined our legal department in May 2000. Mr. Pagan wasappointed Corporate Secretary in May 2003, General Counsel & Corporate Secretary in June 2004, and Executive Vice President,Corporate Development in July 2007. He was appointed Chief Corporate Officer in June 2011 and appointed President and ChiefOperating Officer in November 2013. Prior to joining Descartes, Mr. Pagan was in private legal practice.
Allan Brett is our Chief Financial Officer. Mr. Brett is a Chartered Professional Accountant and is an experienced public companyexecutive, who served as Chief Financial Officer of Aastra Technologies Limited from June 1996 through to its January 2014 sale toMitel Networks Corporation. Mr. Brett was appointed Chief Financial Officer of Descartes in May 2014.
Raimond Diederik is our Executive Vice President, Information Services. Mr. Diederik joined Descartes in July 1998 in connectionwith our acquisition of Calixon N.V. Since then, Mr. Diederik has occupied various senior management positions within Descartes, withparticular focus on our information technology infrastructure and technology development activities. Mr. Diederik was appointed SVP,Network Operations & Information Technology in June 2006 and then appointed Executive Vice President, Information Services inSeptember 2009.
Ed Gardner is our Executive Vice President, Corporate Development. Mr. Gardner joined Descartes in 2003 where he first helda number of senior roles within our corporate finance organization. In his current role as Executive Vice President, CorporateDevelopment, Mr. Gardner is responsible for the development and execution of our M&A strategy. Mr. Gardner's previous experienceincludes both practical logistics experience where he worked in a senior leadership position at a third-party logistics provider as wellas deal execution and integration experience as part of Ernst & Young's Transaction Advisory Services practice in London, England.
Chris Jones is our Executive Vice President, Marketing & Services. Mr. Jones joined Descartes in May 2005 and served as ExecutiveVice President, Solutions & Markets until his appointment to Executive Vice President, Solutions & Services in September 2006. Mr.Jones was appointed Executive Vice President, Services in February 2011 and Executive Vice-President, Marketing & Services in June2011. From November 2003 until he joined Descartes, Mr. Jones was Senior Vice President in Aberdeen Group's Value Chain Researchdivision where he was responsible for creating a market-leading supply chain and manufacturing research and advisory researchpractice. Prior to Aberdeen, from September 1998 to January 2003, Mr. Jones was Executive Vice President of Marketing and CorporateDevelopment for SynQuest, Inc., a provider of supply chain planning solutions. Before joining SynQuest, from May 1994 to September1998, Mr. Jones was Vice President and Research Director for Enterprise Resource Planning Solutions at the Gartner Group.
Robert Parker is our Executive Vice President, Customer Support and Client Services. Mr. Parker joined Descartes in 2009 aspart of the acquisition of Scancode where he had held the role of VP, Operations for 10 years. Mr. Parker leads Descartes' globalcustomer support and client services organization and brings over 20 years of senior management and logistics consulting experienceto Descartes.
35
Copyright © 2018 www.secdatabase.com. All Rights Reserved.Please Consider the Environment Before Printing This Document
Michael Verhoeve is our Executive Vice President, Legal, General Counsel and Corporate Secretary. Mr. Verhoeve was previously ourAssociate General Counsel from 1998 through to 2003, following which, from 2003 to 2014, he acted as General Counsel and CorporateSecretary at two other Canadian-based international publicly traded technology companies: ATS Automation Tooling Systems Inc.(TSX:ATA) and Sandvine Corporation (TSX: SVC). Mr. Verhoeve re-joined Descartes in May 2014 in his current role.
Kenneth Wood is our Executive Vice President of Product Management. Mr. Wood joined Descartes in July 2001 in connection withour acquisition of Centricity. Mr. Wood provides leadership in defining our product strategy, developing roadmaps, and working withall aspects of product delivery. He brings deep domain expertise in supply chain management, transportation management, fleetmanagement, mobile solutions and supply chain planning. Mr. Wood's previous experience included leadership roles in development,consulting and product management with leading supply chain software providers such as CAPS Logistics, i2 Technologies, andCentricity.
To our knowledge, as at April 30th, 2018, our directors and executive officers as a group beneficially owned, or controlled or directed,directly or indirectly, 282,633 of our common shares, representing approximately 0.4% of the common shares then outstanding.
7.2 Committees of the Board of DirectorsOur Board of Directors currently has four committees: the Audit Committee; the Compensation Committee; the Corporate GovernanceCommittee; and the Nominating Committee. The committees, their mandates and membership are discussed below.
Audit CommitteeThe primary functions of the Audit Committee are to oversee the accounting and financial reporting practices of the Companyand the audits of the Company's financial statements, including assisting the Board in fulfilling its responsibilities in reviewing:financial disclosures and internal controls over financial reporting; monitoring the system of internal control and overall enterpriserisk management; monitoring the Company's compliance with Applicable Requirements (as defined in Descartes' Audit Committeecharter); selecting the auditors for shareholder approval; reviewing the qualifications, independence and performance of the auditors;and reviewing the qualifications, independence and performance of the Company's financial management.
The Board of Directors has adopted an amended Audit Committee charter setting out the scope of the Audit Committee's functions,responsibilities and membership requirements. A copy of that charter is attached as Appendix "A" to this AIF.
The Audit Committee is currently composed of three outside and independent directors: Mr. John J. Walker (Chair), Ms. Deborah Closeand Mr. Eric Demirian. The Board of Directors has resolved that Mr. Walker and Mr. Demirian are each an "audit committee financialexpert" as defined in paragraph 8(b) of General Instruction B to Form 40-F promulgated by the Securities and Exchange Commissionand is financially sophisticated for the purposes of NASDAQ Rule 5605(c)(2)(A).
The following sets out the education and experience of the members of the Audit Committee, each of whom is independent andfinancially literate:
John J. Walker C.P.A., C.G.M.A., B.S. – Mr. Walker is a Certified Public Accountant and a Chartered Global ManagementAccountant with experience as a Chief Financial Officer with public companies, including Bowne & Company, a New York StockExchange-listed company and Loews Cineplex Entertainment Corporation. Prior to Loews, Mr. Walker served as Controller ofCorporate Property Investors. Mr. Walker received his B.S. in Accounting from the University of Scranton. Mr. Walker startedhis career in the New York office of then Price Waterhouse. Mr. Walker is a member of the American Institute of Certified PublicAccountants and the New York State Society of CPA's.
Deborah Close B.A., ICD.D – Ms. Close is formerly the President of the Production Services division of
36
Copyright © 2018 www.secdatabase.com. All Rights Reserved.Please Consider the Environment Before Printing This Document
Tervita Corporation, a position she held for five years during which she held full P&L responsibility for a division with 1,000employees; represented the division in financial disclosure and reporting reviews for the corporation; and sat on the executiverisk management committee. Ms. Close has held numerous senior executive positions in the oil and gas industry over thecourse of her 40-year career, including 12 years with Halliburton Corporation in various capacities across Canada, the US andEurope. Ms. Close holds a Bachelor of Arts from the University of Calgary and the ICD.D designation from the Institute ofCorporate Directors and Rotman School of Management.
Eric A. Demirian BBM., C.P.A., C.G.A, C.A.– Mr. Demirian is the Chair of the Corporation's Board of Directors and waspreviously the Chair of the Corporation's audit committee. Mr. Demirian is a Chartered Professional Accountant, CertifiedGeneral Accountant and a Chartered Accountant. Mr. Demirian is a seasoned business executive with a unique blend offinancial, operational and board governance experience. Since 2003, Mr. Demirian has served as president of Parklea Capital,Inc. ("Parklea"), a boutique financial and strategy advisory firm providing services to small- and mid-market public and privatecompanies, and President of Demicap Inc., a private investment firm. Prior to Mr. Demirian's position at Parklea, he heldthe position of Executive Vice President of Group Telecom, Inc. from 2000 to 2003. From 1983 to 2000, Mr. Demirian waswith PricewaterhouseCoopers LLP ("PwC") where he was a partner and head of the Information and Communications Practice.Mr. Demirian serves on the boards of Enghouse Systems Ltd. (TSX:ESL), Redline Communications Inc. (TSX:RDL), and ImaxCorporation (NYSE:IMAX). Mr. Demirian is a former director and chair of the audit committees of a number of public companies,including Menu Foods Income Fund (2005-2010) and Keystone North America Inc. (2007-2010). Mr. Demirian holds a Bachelorof Business Management degree from Ryerson University.
The Audit Committee has adopted specific policies and procedures for the engagement of non-audit services from our independentauditor. Those procedures are attached at Appendix "B" to this AIF.
Compensation CommitteeThe Compensation Committee is appointed by the Board of Directors to discharge the Board's duties and responsibilities relating to thecompensation of the Company's Chief Executive Officer and senior management, as well as to review the human resource policies andpractices that cover the Company's employees. The Compensation Committee is currently composed of three outside and independentdirectors: Ms. Deborah Close (Chair), Mr. David Beatson and Ms. Jane O'Hagan.
Corporate Governance CommitteeThe Corporate Governance Committee is primarily responsible for overseeing Descartes' corporate governance policies and activities.The Corporate Governance Committee reviews and maintains the Board of Directors governing documents in compliance with the Codeof Business Conduct and Ethics. The Corporate Governance Committee is currently composed of three outside directors: Ms. JaneO'Hagan (Chair), Mr. Eric Demirian, and Mr. Chris Hewat, of whom Ms. Jane O'Hagan and Mr. Eric Demirian are considered independent.
Nominating CommitteeThe primary function of the Nominating Committee is to assist the Board of Directors in identifying, recruiting and nominating suitablecandidates to serve on the Board of Directors. The Nominating Committee is currently composed of three outside and independentdirectors: Mr. David Beatson (Chair), Ms. Jane O'Hagan and Mr. John Walker.
7.3 Certain Relationships and Related TransactionsBlake, Cassels & Graydon LLP, of which Mr. Hewat is a partner, provided legal services to us during fiscal 2018 and has beenproviding, and is expected to continue to provide, legal services to us in fiscal 2019. For fiscal 2018, we incurred fees of approximatelyCAD$157,891 for legal services rendered by Blake, Cassels & Graydon LLP. For fiscal 2017, we incurred fees of approximatelyCAD$390,253 for legal services rendered by Blake, Cassels & Graydon LLP. For fiscal 2016, we incurred fees of approximatelyCAD$175,952 for legal services rendered by Blake, Cassels & Graydon LLP.
37
Copyright © 2018 www.secdatabase.com. All Rights Reserved.Please Consider the Environment Before Printing This Document
ITEM 8 EXTERNAL AUDITORS
For the fiscal year ended January 31, 2018, our external auditors were KPMG LLP, Independent Registered Public Accounting Firm.KPMG LLP has been our external auditors since April 16, 2015. KPMG LLP have confirmed that they are independent with respect to theCompany with the meaning of the relevant rules and related interpretations prescribed by the relevant professional bodies in Canadaand any applicable legislation or regulations and also that they are independent accountants with respect to the Company under allrelevant US professional and regulatory standards.
The following table sets forth the fees we have incurred in using the services of KPMG LLP in respect of the applicable fiscal years noted(all amounts in the table are in US dollars – amounts that were billed in Canadian dollars are converted to US dollars at the applicableexchange rate on the last day of the applicable fiscal period):
Fiscal Year Ended Audit Fees Audit-Related Fees Tax Fees All Other Fees TotalJanuary 31, 2018 $446,131 $61,782 Nil $65,034 $572,947January 31, 2017 $466,831 Nil Nil Nil $466,831
"Audit Fees" relate to professional services rendered for the audit of the Company's annual consolidated financial statements andreviews of our interim consolidated financial statements for the first three quarters of the year, fees associated with a statutory auditof two of our subsidiaries in a foreign jurisdiction and fees associated with the audit of our base-shelf prospectus.
"Audit-Related Fees" consist of fees for assurance and related services that are reasonably related to the performance of the audit orreview of the Corporation's financial statements and are not reported as "Audit Fees".
"All Other Fees" consist of fees for non-audit-related advisory services. The above amounts are exclusive of any disbursements andrelated taxes.
ITEM 9 LEGAL PROCEEDINGS
The Company and its subsidiaries are subject to a variety of claims and suits that arise from time to time in the ordinary course ofour business and are typical in our industry. The consequences of these matters are not presently determinable but, in the opinion ofmanagement, the ultimate liability is not expected to have a material effect on our annual results of operations, financial position orcapital resources. None of these proceedings involves a claim for damages, exclusive of interest and costs, that exceeds 10% of ourcurrent assets.
38
Copyright © 2018 www.secdatabase.com. All Rights Reserved.Please Consider the Environment Before Printing This Document
ITEM 10 ADDITIONAL INFORMATION
Additional information about us is available at our website at http://www.descartes.com, on SEDAR at http://www.sedar.com andon EDGAR at http://www.sec.gov. Additional information, including directors' and officers' remuneration and indebtedness, principalholders of our securities and securities authorized for issuance under equity compensation plans, where applicable, is contained inour Management Information Circular for our annual meeting of shareholders held on June 1, 2017. Additional financial informationis provided in the section entitled "Management's Discussion and Analysis of Financial Condition and Results of Operations" and theconsolidated financial statements, the notes thereto and the report of independent registered public accounting firm thereon containedin our Annual Report to the Shareholders for the year ended January 31, 2018.
39
Copyright © 2018 www.secdatabase.com. All Rights Reserved.Please Consider the Environment Before Printing This Document
Appendix A to Annual Information Form
THE DESCARTES SYSTEMS GROUP INC.
CHARTER FORTHE AUDIT COMMITTEE OFTHE BOARD OF DIRECTORS
1. PURPOSE1. The primary functions of the Audit Committee are to oversee the accounting and financial reporting practices of The Descartes Systems Group
Inc. (the "Company") and the audits of the Company's financial statements and to exercise the responsibilities and duties set forth below,including, but not limited to, assisting the Board of Directors (the "Board") in fulfilling its responsibilities in reviewing the following:financial disclosures and internal controls over financial reporting; monitoring the system of internal control and compliance with ApplicableRequirements (as defined below); selecting the auditors for shareholder approval; and reviewing the qualifications, independence andperformance of the auditors and the qualifications, independence and performance of the Company's financial management.
2. MEMBERSHIP AND ORGANIZATION1. Composition - The Audit Committee shall consist of not less than three independent members of the Board. At the invitation of the Audit
Committee, members of the Company's management and others may attend Audit Committee meetings as the Audit Committee considersnecessary or desirable.
2. Appointment and Removal of Audit Committee Members - Each member of the Audit Committee shall be appointed by the Board on anannual basis and shall serve at the pleasure of the Board, or until the earlier of (a) the close of the next annual meeting of the Company'sshareholders at which the member's term of office expires, (b) the death of the member, or (c) the resignation, disqualification or removal ofthe member from the Audit Committee or from the Board. The Board may fill a vacancy in the membership of the Audit Committee.
3. Chair - At the time of the annual appointment of the members of the Audit Committee, the Board shall appoint a Chair of the AuditCommittee. The Chair
40
Copyright © 2018 www.secdatabase.com. All Rights Reserved.Please Consider the Environment Before Printing This Document
Appendix A to Annual Information Form
shall: be a member of the Audit Committee, preside over all Audit Committee meetings that he or she attends, coordinate the AuditCommittee's compliance with this mandate, work with management to develop the Audit Committee's annual work-plan and provide reports ofthe Audit Committee to the Board.
4. Independence - Each member of the Audit Committee shall meet the requirements of applicable law and any applicable requirementspromulgated by any exchange upon which securities of the Company are traded, or any governmental or regulatory body exercising authorityover the Company, as are in effect from time to time (collectively, the "Applicable Requirements") related to independence and auditcommittee composition.
5. Financial Expertise - At the time of his or her appointment to the Audit Committee, each member of the Audit Committee shall be able toread and understand fundamental financial statements, including a balance sheet, cash flow statement and income statement, be "financiallyliterate" as defined under Applicable Requirements, and shall not have participated in the preparation of the financial statements of theCompany or any current subsidiary of the Company at any time during the preceding three years. At least one member of the AuditCommittee shall have past employment experience in financing or accounting, requisite professional certification in accounting, or othercomparable experience or background which results in the individual's financial sophistication, including being or having been a ChiefExecutive Officer, Chief Operating Officer, Chief Financial Officer or other senior officer with financial oversight responsibilities. Further, atleast one member of the Audit Committee shall qualify as an "audit committee financial expert" (as such term is defined under the Securitiesand Exchange Commission's rules).
3. MEETINGS1. Meetings - The members of the Audit Committee shall hold meetings as are required to carry out this mandate, and in any case no less than
four meetings annually. The external auditors are entitled to attend and be heard at each quarterly Audit Committee meeting scheduled toconsider the Company's financial statements. The Chair, any member of the Audit Committee, the external auditors, the Chairman of theBoard, the Lead Director, the Chief Executive
41
Copyright © 2018 www.secdatabase.com. All Rights Reserved.Please Consider the Environment Before Printing This Document
Appendix A to Annual Information Form
Officer or the Chief Financial Officer may call a meeting of the Audit Committee by notifying the Company's Corporate Secretary who willnotify the members of the Audit Committee. The Chair shall chair all Audit Committee meetings that he or she attends, and in the absence ofthe Chair, the members of the Audit Committee present may appoint a chair from their number for a meeting.
2. Secretary and Minutes - The Corporate Secretary, his or her designate or any other person the Audit Committee requests, shall act assecretary at Audit Committee meetings. Minutes of Audit Committee meetings shall be recorded and maintained by the Corporate Secretaryand subsequently presented to the Audit Committee for approval.
3. Quorum - A majority of the members of the Audit Committee shall constitute a quorum.
4. Access to Management and Outside Advisors - The Audit Committee shall have unrestricted access to the Company's management andemployees and the books and records of the Company, and, from time to time may hold unscheduled or regularly scheduled meetings orportions of regularly scheduled meetings with the auditor, the Chief Financial Officer, the Chief Operating Officer, President or the ChiefExecutive Officer. The Audit Committee shall have the authority to conduct investigations into any matters within its scope of responsibilities,retain external legal counsel, consultants or other advisors to assist it in fulfilling its responsibilities and to set and pay the respectivecompensation for these advisors without consulting or obtaining the approval of the Board or any Company officer. The Company shallprovide appropriate funding, as determined by the Audit Committee, for the services of these advisors.
5. Meetings Without Management - The Audit Committee shall hold unscheduled or regularly scheduled meetings, or portions of regularlyscheduled meetings, at which management is not present.
4. FUNCTIONS AND RESPONSIBILITIESThe Audit Committee shall have the functions and responsibilities set out below as well as any other functions that are specifically delegated to theAudit Committee by the Board and that the Board is authorized to delegate by applicable laws and regulations. In
42
Copyright © 2018 www.secdatabase.com. All Rights Reserved.Please Consider the Environment Before Printing This Document
Appendix A to Annual Information Form
addition to these functions and responsibilities, the Audit Committee shall perform the duties required of an audit committee by the ApplicableRequirements.
1. Financial Reportsa. General - The Audit Committee is responsible for overseeing the Company's accounting and financial reporting practices and the
audits of the Company's financial statements. Management is responsible for the preparation, presentation and integrity of theCompany's financial statements and financial disclosures and for the appropriateness of the accounting principles and the reportingpolicies used by the Company. The auditors are responsible for auditing the Company's annual consolidated financial statements andfor reviewing the Company's unaudited interim financial statements.
b. Review of Annual Financial Reports - The Audit Committee shall review the annual consolidated audited financial statements of theCompany prepared by management, the auditors' report thereon and the related management's discussion and analysis of theCompany's financial condition and results of operation ("MD&A"). After completing its review, if advisable, the Audit Committeeshall approve and recommend for Board approval the annual financial statements and the related MD&A.
c. Review of Interim Financial Reports - The Audit Committee shall review the interim consolidated financial statements of theCompany prepared by management, the auditors' review report thereon and the related MD&A. After completing its review, ifadvisable, the Audit Committee shall approve and recommend for Board approval the interim financial statements and the relatedMD&A.
d. Review Considerations - In conducting its review of the annual financial statements or the interim financial statements, the AuditCommittee shall:
i. meet with management and the auditors to discuss the financial statements and MD&A;
ii. review the disclosures in the financial statements;
43
Copyright © 2018 www.secdatabase.com. All Rights Reserved.Please Consider the Environment Before Printing This Document
Appendix A to Annual Information Form
iii. review the audit report or review report prepared by the auditors;
iv. review the qualitative judgments of the auditors about the appropriateness, not just the acceptability, of accounting principlesand financial disclosure practices used or proposed to be adopted by the Company;
v. discuss with management, the auditors and internal legal counsel, as requested, any litigation claim or other contingency thatcould have a material effect on the financial statements;
vi. review the accounting policies followed and critical accounting and other significant estimates and judgments underlying thefinancial statements as presented by management;
vii. review any material effects of regulatory accounting initiatives or off-balance sheet structures on the financial statements aspresented by management;
viii. review any material changes in accounting policies and any significant changes in accounting practices and their impact onthe financial statements as presented by management;
ix. review the methods used to account for significant unusual transactions;
x. review the effect of significant accounting policies in controversial or emerging areas for which there is a lack ofauthoritative guidance or consensus;
xi. review significant recorded and unrecorded audit adjustments;
xii. review any material accounting issues among management and the auditors;
xiii. review management's report on the effectiveness of internal controls over financial reporting;
xiv. review the factors identified by management as factors that may affect future financial results;
44
Copyright © 2018 www.secdatabase.com. All Rights Reserved.Please Consider the Environment Before Printing This Document
Appendix A to Annual Information Form
xv. review results of the Company's audit committee hotline program; and
xvi. review any other matters, related to the financial statements, that are brought forward by the auditors, management or whichare required to be communicated to the Audit Committee under accounting policies, auditing standards or ApplicableRequirements.
e. Approval of Other Financial Disclosures - The Audit Committee shall review and, if advisable, approve and recommend for Boardapproval financial disclosure in a prospectus or other securities offering document of the Company, press releases disclosing financialresults of the Company and any other material financial disclosure, including financial guidance provided to analysts, rating agenciesor otherwise publicly disseminated.
2. Independent Auditorsa. General -The Audit Committee shall be responsible for oversight of the work of the auditors, including the auditors' work in
preparing or issuing an audit report, performing other audit, review or attest services or any other related work.
b. Appointment and Compensation - The Audit Committee shall review and, if advisable, select and recommend for Board andshareholder approval the appointment of the auditors. The Audit Committee shall have ultimate authority to approve all auditengagement terms and fees, including the auditors' audit plan.
c. Resolution of Disagreements – Review all reportable events, including any disagreements, unresolved issues and consultations (asthose terms are defined by Applicable Requirements), with the Company's auditors, whether or not there is to be a change of auditors.
d. Change of Auditors – When the Audit Committee determines to recommend a change of auditors or the auditors are otherwiseterminated or resign, the Audit Committee shall review all issues related to the
45
Copyright © 2018 www.secdatabase.com. All Rights Reserved.Please Consider the Environment Before Printing This Document
Appendix A to Annual Information Form
change of auditors, including the information required to be disclosed by applicable legal requirements and the planned steps for anorderly transition.
e. Discussions with Auditors – At least annually, the Audit Committee shall discuss with the auditors such matters as are required byapplicable auditing standards to be discussed by the auditors with the audit committee, including the matters required to be discussedby applicable auditing standards.
f. Audit Plan - At least annually, the Audit Committee shall review a summary of the auditors' annual audit plan. The Audit Committeeshall consider and review with the auditors any material changes to the scope of the plan.
g. Quarterly Review Report - The Audit Committee shall review a report prepared by the auditors in respect of each of the interimfinancial statements of the Company.
h. Independence of Auditors - At least annually, and before the auditors issue their report on the annual financial statements, the AuditCommittee shall: obtain from the auditors a formal written statement describing all relationships between the auditors and theCompany; discuss with the auditors any disclosed relationships or services that may impact the objectivity and independence of theauditors; and obtain written confirmation from the auditors that they are objective and independent within the meaning of theapplicable Rules of Professional Conduct/Code of Ethics adopted by the provincial institute or order of chartered accountants towhich it belongs and other Applicable Requirements. The Audit Committee shall take appropriate action to oversee the independenceof the auditors.
i. Evaluation and Rotation of Lead Partner - At least annually, the Audit Committee shall review the qualifications and performance ofthe lead partner(s) of the auditors. The Audit Committee shall obtain a report from the auditors annually verifying that the leadpartner of the auditors has
46
Copyright © 2018 www.secdatabase.com. All Rights Reserved.Please Consider the Environment Before Printing This Document
Appendix A to Annual Information Form
served in that capacity for no more than five fiscal years of the Company and that the engagement team collectively possesses theexperience and competence to perform an appropriate audit.
j. Evaluation of performance and audit quality – the Audit Committee shall review and evaluate the performance of the external auditorto assess the quality of the audit and the services performed by the external auditor.
k. Requirement for Pre-Approval of Non-Audit Services - The Audit Committee shall approve in advance any retainer of the auditors toperform any non-audit service to the Company that it deems advisable in accordance with Applicable Requirements, and Boardapproved policies and procedures. The Audit Committee may delegate pre-approval authority to a member of the Audit Committee.The decisions of any member of the Audit Committee to whom this authority has been delegated must be presented to the full AuditCommittee at its next scheduled Audit Committee meeting.
l. Review of Professional Services - The Audit Committee shall review reports from management at each quarterly Audit Committeemeeting scheduled to consider the Company's financial statements concerning expenses incurred in the quarter for the services of anyaccounting firm (other than the appointed auditor) engaged to provide services to the Company, in each case to the extent that theamount of such expenses in respect of any such firm exceeds $100,000.
m. Approval of Hiring Policies - The Audit Committee shall review and approve the Company's hiring policies regarding partners,employees and former partners and employees of the present and former external auditors of the Company.
3. Internal Controlsa. General - The Audit Committee shall review reports from management on the nature, establishment, monitoring and effectiveness of
the Company's system of internal control over financial reporting and disclosure controls and procedures (as those terms are definedin the Applicable
47
Copyright © 2018 www.secdatabase.com. All Rights Reserved.Please Consider the Environment Before Printing This Document
Appendix A to Annual Information Form
Requirements).
b. Establishment, Review and Approval - The Audit Committee shall require management to establish and maintain appropriate systemsof internal control over financial reporting and disclosure controls and procedures in accordance with Applicable Requirements andguidance and to review, evaluate and approve these controls and procedures. At least annually, the Audit Committee shall considerand review with management and the auditors:
i. the effectiveness of, or weaknesses or deficiencies in the design or operation of the Company's internal control over financialreporting and disclosure controls and procedures, and the impact of any identified weaknesses in these controls andprocedures on management's conclusions;
ii. any significant changes in internal control over financial reporting that are disclosed, or considered for disclosure, includingthose in the Company's periodic regulatory filings;
iii. the auditors' report on the Company's internal control over financial reporting;
iv. any material issues raised by any inquiry or investigation by the Company's regulators;
v. the Company's fraud prevention and detection program, including deficiencies in internal controls that may impact theintegrity of financial information, or may expose the Company to other significant internal or external fraud losses and theextent of those losses and any disciplinary action in respect of fraud taken against management or other employees who havea significant role in financial reporting; and
vi. any related significant issues and recommendations of the auditors together with management's responses thereto, includingthe timetable for implementation of recommendations to correct weaknesses in internal controls over financial reporting and
48
Copyright © 2018 www.secdatabase.com. All Rights Reserved.Please Consider the Environment Before Printing This Document
Appendix A to Annual Information Form
disclosure controls.
4. Risk Managementa. General – In addition to being responsible for overseeing risks related to the Company's accounting, financial statements, financial
reporting process and internal controls related to financial reporting, the Audit Committee is also responsible for overseeingmanagement's implementation and operation of the enterprise risk management program, as documented in the Risk ManagementPolicy established by the Board of Directors. The risk oversight process is the means by which the Board of Directors determinesthat the Company has in place an effective process for identifying, assessing, managing and monitoring key risks in the business on acontinuous basis as the business evolves.
b. Management Responsibilities - Management is responsible for:i. ensuring the development and implementation of the Risk Management process. Risk Management is the framework
required to identify, assess and develop strategies to manage and monitor control risks;ii. the design and implementation of the actions, measures and/or processes to mitigate to an appropriate level all material risks
in the business (the "Risk Controls") including the design and implementation of appropriate crisis preparedness, businesscontinuity and disaster recovery plans; and
iii. monitoring overall compliance with and adherence to the Risk Management Policy as established by the Board of Directors.c. Audit Committee Responsibilities - The Audit Committee is responsible for:
i. at least annually, reviewing the effectiveness of the Risk Management program that is in place. As part of its review, theAudit Committee will review reports prepared by management that
49
Copyright © 2018 www.secdatabase.com. All Rights Reserved.Please Consider the Environment Before Printing This Document
Appendix A to Annual Information Form
assess the risks in the business, identifies the Risk Controls that are in place to mitigate and manage these risks to anappropriate level, and evaluate the residual risk in the business (the risk that remains after implementation of the RiskControls);
ii. periodically monitor risk and risk management capabilities within the Company including crisis preparedness, businesscontinuity and disaster recovery plans; and
iii. reporting to the Board of Directors on its oversight of the Company's Risk Management program, including an assessmentof whether the program is being followed and is effective.
d. Computerized Information Systems - The Audit Committee shall review reports from the Company's management containing itsassessment of the adequacy of the Company's computerized information system controls and security and related risks, includingcybersecurity risk.
5. Internal Audit – the Audit Committee may choose to establish and maintain an Internal Audit function from time to time. If so established,the internal audit function will report directly to the Chair of the Audit Committee and administratively to the Chief Financial Officer. Inrelation to the internal audit function, if so established and maintained, the Audit Committee shall:
a. Establish an internal audit charter and review and approve any necessary revisions to such charter on an annual basis;
b. review and evaluate the effectiveness of the internal audit function;
c. review the operating budget for the internal audit function including staffing levels and resources; and
d. On a regular basis, meet with the head of the internal audit function without other members of management present.
6. Compliance with Legal and Regulatory Requirements - The Audit Committee shall review reports from the Company's CorporateSecretary and other management members on: legal or compliance matters that may have a material
50
Copyright © 2018 www.secdatabase.com. All Rights Reserved.Please Consider the Environment Before Printing This Document
Appendix A to Annual Information Form
impact on the Company; the effectiveness of the Company's compliance policies; and any material communications received from regulators.The Audit Committee shall review management's evaluation of and representations relating to compliance with specific ApplicableRequirements, and management's plans to remediate any deficiencies identified.
7. Audit Committee Hotline Procedures - The Audit Committee shall establish procedures for (a) the receipt, retention, and treatment ofcomplaints received by the Company regarding accounting, internal accounting controls, or auditing matters; and (b) the confidential,anonymous submission by employees of the Company of concerns regarding questionable accounting or auditing matters. Any suchcomplaints or concerns that are received shall be reviewed by the Audit Committee and, if the Audit Committee determines that the matterrequires further investigation, it will direct the Chair of the Audit Committee to engage outside advisors, as it deems necessary or appropriate,to investigate the matter and will work with management and the Company's general counsel to reach a satisfactory conclusion.
8. Audit Committee Disclosure - The Audit Committee shall prepare, review and approve any audit committee disclosures required byApplicable Requirements in the Company's disclosure documents.
9. Requirement for Review and Approval of the CEO Business Expenses - The Chair of the Audit Committee shall review and approve thereimbursable business expenses incurred by the Chief Executive Officer of the Company in connection with the performance of his duties.Such approval may be provided subsequent to reimbursement of such expenses.
10. Review of Audit Committee Charter - On at least an annual basis, the Audit Committee shall, in conjunction with the Corporate GovernanceCommittee, review and reassess the adequacy of this Audit Committee Charter.
11. Delegation - The Audit Committee may, to the extent permissible by Applicable Requirements, designate a sub-committee to review anymatter within this mandate as the Audit Committee deems appropriate.
51
Copyright © 2018 www.secdatabase.com. All Rights Reserved.Please Consider the Environment Before Printing This Document
Appendix A to Annual Information Form
6. REPORTING TO THE BOARD1. The Chair shall report to the Board, as required by Applicable Requirements or as deemed necessary by the Audit Committee or as requested
by the Board, on matters arising at Audit Committee meetings and, where applicable, shall present the Audit Committee's recommendation tothe Board for its approval.
7. GENERAL1. The Audit Committee shall, to the extent permissible by Applicable Requirements, have such additional authority as may be reasonably
necessary or desirable, in the Audit Committee's discretion, to exercise its powers and fulfill the duties under this mandate.
8. CURRENCY OF THE AUDIT COMMITTEE CHARTER1. This charter was last approved by the Audit Committee and Board on March 4, 2018.
52
Copyright © 2018 www.secdatabase.com. All Rights Reserved.Please Consider the Environment Before Printing This Document
Appendix B to Annual Information Form
PRE-APPROVAL POLICY AND PROCEDURE FOR ENGAGEMENTS OF THE INDEPENDENT AUDITOR
The responsibilities of the Company's audit committee are set out in the Company's Audit Committee Charter, which responsibilities include pre-approving audit and non-audit services provided by the independent auditors in order to ensure the services do not impair the auditors' independence.Applicable securities commissions and accounting standards boards have issued rules specifying the permissible services independent auditors mayprovide to audit clients, as well as the pre-approval of fees. Accordingly, the Company's Audit Committee has adopted the following Pre-ApprovalPolicy and Procedure.
Under the Audit Committee's approach, an annual program of work will be approved each year for the following categories of services: Audit, Audit-Related, and Tax. Each engagement or category of service will be presented in appropriate detail by business function and geographic area to providethe Audit Committee sufficient understanding of the services provided. Additional engagements may be brought forward from time to time for pre-approval by the Audit Committee.
The Audit Committee will consider whether any service to be obtained from the independent auditors is consistent with applicable rules on auditorindependence. Also, the Audit Committee will consider the level of Audit and Audit-Related fees in relation to all other fees paid to the independentauditors, and will review such level each year. In carrying out this responsibility, the Audit Committee may obtain input from Company management onthe general level of fees, and the process for determining and reporting fees from the numerous locations where the Company operates and theindependent auditors provide services.
The term of any pre-approval applies to the Company's financial year. Thus, Audit fees for the financial year may include work performed after theclose of the calendar year. The pre-approval for Audit-Related and Tax fees is on a calendar-year basis. Unused pre-approval amounts will not becarried forward to the next financial year. Pre-approvals will apply to engagements within a category of service, and cannot be transferred betweencategories. If fees might otherwise exceed pre-approved amounts for any category of permissible services, then time will be scheduled so thatincremental amounts can be reviewed and pre-approved prior to commitment.
Audit Services
Audit services include the annual financial statement audit engagement (including required quarterly reviews), affiliate and subsidiary statutory audits,and other procedures required to be performed by the independent auditors to render an opinion on the Company's consolidated financial statements.Audit services also include information systems reviews, tests performed on the system of internal controls, and other procedures necessary to supportthe independent auditors' attestation of management's report on
53
Copyright © 2018 www.secdatabase.com. All Rights Reserved.Please Consider the Environment Before Printing This Document
Appendix B to Annual Information Form
internal controls for financial reporting consistent with applicable securities legislation, as applicable.
The independent auditors are responsible for cost-effectively providing audit services and confirming that audit services are not undertaken prior toreview and pre-approval by the Audit Committee. The independent auditors and Company management will jointly manage a process for collecting andreporting Audit fees billed by the independent auditors to Company each year.
Audit-Related Services
Audit-Related services include services that are reasonably related to the review of the Company's financial statements. These services include benefitplan and joint venture audits, attestation procedures related to cost certifications and government compliance, consultations on accounting issues, anddue diligence procedures. Each year the Audit Committee will review the proposed services to ensure the independence of the independent auditors isnot impaired.
Pre-approval will occur each year coincident with pre-approval of Audit services. Company management will monitor the engagement of theindependent auditors for Audit-Related services using designated process owners. This process will help provide assurance that the aggregate dollaramount of services obtained does not exceed pre-approval amounts at any time, and that new engagements not initially identified are pre-approved priorto commitment.
Tax Services
The Audit Committee concurs that the independent auditors may provide certain Tax services without impairing independence. These services includepreparing local tax filings and related tax services, tax planning, preparing individual employee expatriate tax returns, and other services permitted byapplicable securities regulations. The Audit Committee will not permit engaging the independent auditors (1) in connection with a transaction, the solepurpose of which may be impermissible tax avoidance, or (2) for any tax services that may be prohibited by applicable securities rules now or in thefuture. Company management will monitor the engagement of the independent auditors or other firms for such Tax services to help provide assurancethat aggregate dollar amounts of services obtained from the independent auditors do not exceed pre-approval amounts at any time.
All Other Services
The Company does not envision obtaining other services from the independent auditors, except for the Audit, Audit-Related, and Tax servicesdescribed previously. If permissible other services are requested by the Company, each engagement must be pre-approved by the Audit Committee.Such requests should be supported by endorsement of the Chief Financial Officer prior to review with the Audit Committee.
54
Copyright © 2018 www.secdatabase.com. All Rights Reserved.Please Consider the Environment Before Printing This Document
Appendix B to Annual Information Form
Prohibited Services
Current securities regulations specify that independent auditors may not provide the following prohibited services: Bookkeeping, Financial InformationSystems Design and Implementation, Appraisals or Valuation (other than Tax), Fairness Opinions, Actuarial Services, Internal Audit Outsourcing,Management Functions, Human Resources such as Executive Recruiting, Broker-Dealer Services, Legal Services, or Expert Services such as providingexpert testimony or opinions where the purpose of the engagement is to advocate the client's position in an adversarial proceeding. Company personnelmay not under any circumstances engage the independent auditors for prohibited services. Potential engagements not clearly permissible should bereferred to the Chief Financial Officer.
Delegation
The Audit Committee may delegate pre-approval authority to one or more of its members. The member or members to whom such authority isdelegated shall report any pre-approval decisions to the Audit Committee at its next scheduled meeting. The Audit Committee may not delegate tomanagement the Audit Committee's responsibilities to pre-approve services performed by the independent auditor.
55
Copyright © 2018 www.secdatabase.com. All Rights Reserved.Please Consider the Environment Before Printing This Document
EXHIBIT 99.3
Consent of Independent Registered Public Accounting Firm
We consent to the incorporation by reference in the Registration Statement (No. 333-210685) on Form F-10 of The Descartes SystemsGroup Inc. of our report dated March 5, 2018 on the consolidated financial statements of The Descartes Systems Group Inc. as ofJanuary 31, 2018 and January 31, 2017 and for the years then ended and our report dated March 5, 2018 on the effectiveness of internalcontrol over financial reporting as of January 31, 2018, which reports appear in the 2018 Annual Report of The Descartes SystemsGroup Inc., incorporated by reference in this annual report on Form 40-F, for the fiscal year ended January 31, 2018, and for the consentto the use of such reports in this annual report on Form 40-F.
/s/ KPMG LLP
Chartered Professional Accountants, Licensed Public AccountantsToronto, CanadaApril 30, 2018
Copyright © 2018 www.secdatabase.com. All Rights Reserved.Please Consider the Environment Before Printing This Document
EXHIBIT 99.4CERTIFICATION PURSUANT TO RULE 13a-14 or 15d-14 OF THE
SECURITIES EXCHANGE ACT OF 1934, AS ADOPTED PURSUANT TOSECTION 302 OF THE SARBANES-OXLEY ACT OF 2002
I, Edward J. Ryan, certify that:
1. I have reviewed this annual report on Form 40-F of The Descartes Systems Group Inc.;
2. Based on my knowledge, this report does not contain any untrue statement of a material fact or omit to state a material factnecessary to make the statements made, in light of the circumstances under which such statements were made, not misleadingwith respect to the period covered by this report;
3. Based on my knowledge, the financial statements and other financial information included in this report, fairly present in allmaterial respects the financial condition, results of operations and cash flows of the registrant as of, and for, the periodspresented in this report;
4. The registrant's other certifying officer(s) and I are responsible for establishing and maintaining disclosure controls andprocedures (as defined in Exchange Act Rules 13a-15(e) and 15d-15(e)) and internal control over financial reporting (asdefined in Exchange Act Rules 13a-15(f) and 15d-15(f)) for the registrant and have:
(a) Designed such disclosure controls and procedures, or caused such disclosure controls and procedures to be designedunder our supervision, to ensure that material information relating to the registrant, including its consolidatedsubsidiaries, is made known to us by others within those entities, particularly during the period in which this report isbeing prepared;
(b) Designed such internal control over financial reporting, or caused such internal control over financial reporting to bedesigned under our supervision, to provide reasonable assurance regarding the reliability of financial reporting and thepreparation of financial statements for external purposes in accordance with generally accepted accounting principles;
(c) Evaluated the effectiveness of the registrant's disclosure controls and procedures and presented in this report ourconclusions about the effectiveness of the disclosure controls and procedures, as of the end of the period covered bythis report based on such evaluation; and
(d) Disclosed in this report any change in the registrant's internal control over financial reporting that occurred during theperiod covered by this report that has materially affected, or is reasonably likely to materially affect, the registrant'sinternal control over financial reporting; and
5. The registrant's other certifying officer(s) and I have disclosed, based on our most recent evaluation of internal control overfinancial reporting, to the registrant's auditors and the audit committee of the registrant's board of directors (or personsperforming the equivalent functions):
(a) All significant deficiencies and material weaknesses in the design or operation of internal control over financialreporting which are reasonably likely to adversely affect the registrant's ability to record, process, summarize andreport financial information; and
(b) Any fraud, whether or not material, that involves management or other employees who have a significant role in theregistrant's internal control over financial reporting.
Dated: April 30, 2018By: /s/ Edward J. Ryan
Name: Edward J. RyanTitle: Chief Executive Officer
Copyright © 2018 www.secdatabase.com. All Rights Reserved.Please Consider the Environment Before Printing This Document
EXHIBIT 99.5CERTIFICATION PURSUANT TO RULE 13a-14 or 15d-14 OF THE
SECURITIES EXCHANGE ACT OF 1934, AS ADOPTED PURSUANT TOSECTION 302 OF THE SARBANES-OXLEY ACT OF 2002
I, Allan Brett, certify that:
1 I have reviewed this annual report on Form 40-F of The Descartes Systems Group Inc.;
2. Based on my knowledge, this report does not contain any untrue statement of a material fact or omit to state a material factnecessary to make the statements made, in light of the circumstances under which such statements were made, not misleadingwith respect to the period covered by this report;
3. Based on my knowledge, the financial statements and other financial information included in this report, fairly present in allmaterial respects the financial condition, results of operations and cash flows of the registrant as of, and for, the periodspresented in this report;
4. The registrant's other certifying officer(s) and I are responsible for establishing and maintaining disclosure controls andprocedures (as defined in Exchange Act Rules 13a-15(e) and 15d-15(e)) and internal control over financial reporting (asdefined in Exchange Act Rules 13a-15(f) and 15d-15(f)) for the registrant and have:
(a) Designed such disclosure controls and procedures, or caused such disclosure controls and procedures to be designedunder our supervision, to ensure that material information relating to the registrant, including its consolidatedsubsidiaries, is made known to us by others within those entities, particularly during the period in which this report isbeing prepared;
(b) Designed such internal control over financial reporting, or caused such internal control over financial reporting to bedesigned under our supervision, to provide reasonable assurance regarding the reliability of financial reporting and thepreparation of financial statements for external purposes in accordance with generally accepted accounting principles;
(c) Evaluated the effectiveness of the registrant's disclosure controls and procedures and presented in this report ourconclusions about the effectiveness of the disclosure controls and procedures, as of the end of the period covered bythis report based on such evaluation; and
(d) Disclosed in this report any change in the registrant's internal control over financial reporting that occurred during theperiod covered by this report that has materially affected, or is reasonably likely to materially affect, the registrant'sinternal control over financial reporting; and
5. The registrant's other certifying officer(s) and I have disclosed, based on our most recent evaluation of internal control overfinancial reporting, to the registrant's auditors and the audit committee of the registrant's board of directors (or personsperforming the equivalent functions):
(a) All significant deficiencies and material weaknesses in the design or operation of internal control over financialreporting which are reasonably likely to adversely affect the registrant's ability to record, process, summarize andreport financial information; and
(b) Any fraud, whether or not material, that involves management or other employees who have a significant role in theregistrant's internal control over financial reporting.
Dated: April 30, 2018By: /s/ Allan Brett
Name: Allan BrettTitle: Chief Financial Officer
Copyright © 2018 www.secdatabase.com. All Rights Reserved.Please Consider the Environment Before Printing This Document
EXHIBIT 99.6
CERTIFICATION PURSUANT TO18 U.S.C. SECTION 1350,
AS ADOPTED PURSUANT TOSECTION 906 OF THE SARBANES-OXLEY ACT OF 2002
In connection with the annual report of The Descartes Systems Group Inc., a Canadian company and foreign private issuer (the"Company"), on Form 40-F for the fiscal year ended January 31, 2018, as filed with the Securities and Exchange Commission on thedate hereof (the "Report"), we, Edward J. Ryan and Allan Brett, do hereby certify, pursuant to 18 U.S.C. Section 1350, as adoptedpursuant to Section 906 of the Sarbanes-Oxley Act of 2002, to our knowledge, that:
1. This Report fully complies with the requirements of Section 13(a) or 15(d) of the Securities Exchange Act of 1934; and
2. The information contained in this Report fairly presents, in all material respects, the financial condition and results ofoperations of the Company.
/s/ Edward J. RyanEdward J. RyanChief Executive Officer
/s/ Allan BrettAllan BrettChief Financial Officer
April 30, 2018
This certification is being submitted solely for the purpose of complying with Section 1350 of Chapter 63 of Title 18 of the UnitedStates Code. This certification is not to be deemed "filed" for purposes of Section 18 of the Securities Exchange Act of 1934 orotherwise subject to the liability of that section, nor will the certification be deemed incorporated by reference into any filing under theSecurities Act of 1933 or the Securities Exchange Act of 1934, except to the extent that the registrant specifically incorporates it byreference.
Copyright © 2018 www.secdatabase.com. All Rights Reserved.Please Consider the Environment Before Printing This Document
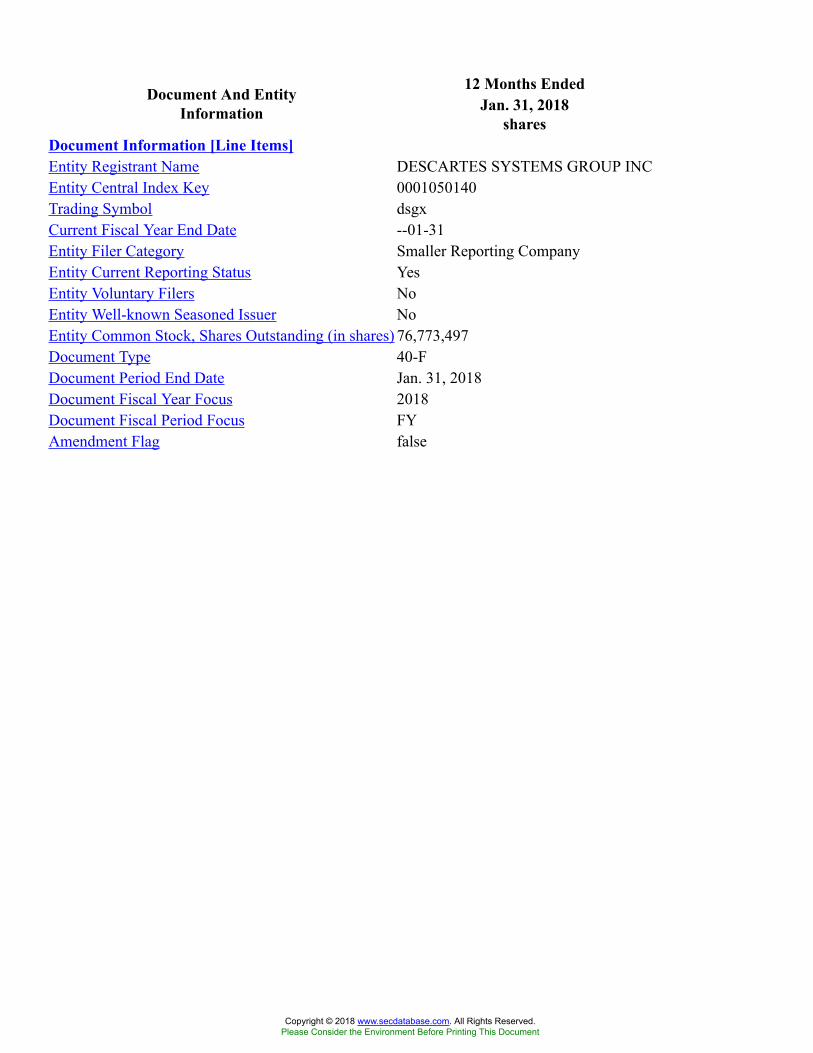
12 Months EndedDocument And EntityInformation Jan. 31, 2018
sharesDocument Information [Line Items]Entity Registrant Name DESCARTES SYSTEMS GROUP INCEntity Central Index Key 0001050140Trading Symbol dsgxCurrent Fiscal Year End Date --01-31Entity Filer Category Smaller Reporting CompanyEntity Current Reporting Status YesEntity Voluntary Filers NoEntity Well-known Seasoned Issuer NoEntity Common Stock, Shares Outstanding (in shares) 76,773,497Document Type 40-FDocument Period End Date Jan. 31, 2018Document Fiscal Year Focus 2018Document Fiscal Period Focus FYAmendment Flag false
Copyright © 2018 www.secdatabase.com. All Rights Reserved.Please Consider the Environment Before Printing This Document
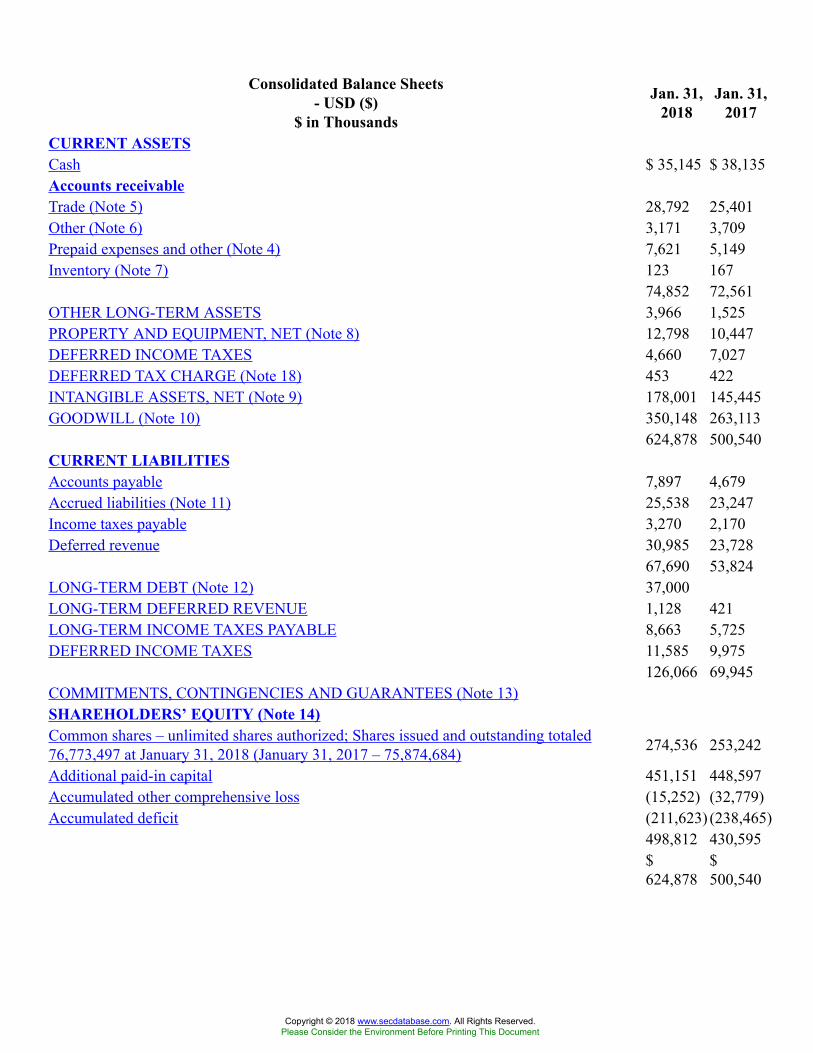
Consolidated Balance Sheets- USD ($)
$ in Thousands
Jan. 31,2018
Jan. 31,2017
CURRENT ASSETSCash $ 35,145 $ 38,135Accounts receivableTrade (Note 5) 28,792 25,401Other (Note 6) 3,171 3,709Prepaid expenses and other (Note 4) 7,621 5,149Inventory (Note 7) 123 167
74,852 72,561OTHER LONG-TERM ASSETS 3,966 1,525PROPERTY AND EQUIPMENT, NET (Note 8) 12,798 10,447DEFERRED INCOME TAXES 4,660 7,027DEFERRED TAX CHARGE (Note 18) 453 422INTANGIBLE ASSETS, NET (Note 9) 178,001 145,445GOODWILL (Note 10) 350,148 263,113
624,878 500,540CURRENT LIABILITIESAccounts payable 7,897 4,679Accrued liabilities (Note 11) 25,538 23,247Income taxes payable 3,270 2,170Deferred revenue 30,985 23,728
67,690 53,824LONG-TERM DEBT (Note 12) 37,000LONG-TERM DEFERRED REVENUE 1,128 421LONG-TERM INCOME TAXES PAYABLE 8,663 5,725DEFERRED INCOME TAXES 11,585 9,975
126,066 69,945COMMITMENTS, CONTINGENCIES AND GUARANTEES (Note 13)SHAREHOLDERS’ EQUITY (Note 14)Common shares – unlimited shares authorized; Shares issued and outstanding totaled76,773,497 at January 31, 2018 (January 31, 2017 – 75,874,684) 274,536 253,242
Additional paid-in capital 451,151 448,597Accumulated other comprehensive loss (15,252) (32,779)Accumulated deficit (211,623) (238,465)
498,812 430,595$624,878
$500,540
Copyright © 2018 www.secdatabase.com. All Rights Reserved.Please Consider the Environment Before Printing This Document

Consolidated Balance Sheets(Parentheticals) - shares Jan. 31, 2018 Jan. 31, 2017
Common shares, shares issued (in shares) 76,773,497 75,874,684Common shares, shares outstanding (in shares) 76,773,497 75,874,684
Copyright © 2018 www.secdatabase.com. All Rights Reserved.Please Consider the Environment Before Printing This Document
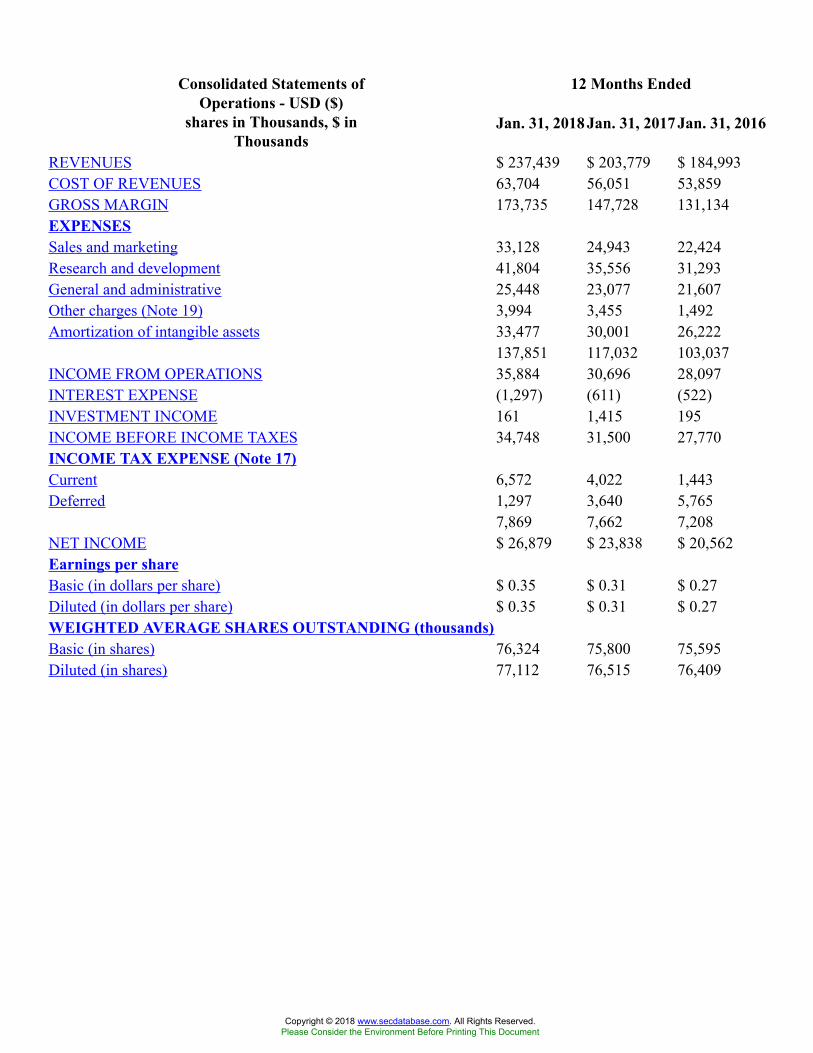
12 Months EndedConsolidated Statements ofOperations - USD ($)
shares in Thousands, $ inThousands
Jan. 31, 2018 Jan. 31, 2017 Jan. 31, 2016
REVENUES $ 237,439 $ 203,779 $ 184,993COST OF REVENUES 63,704 56,051 53,859GROSS MARGIN 173,735 147,728 131,134EXPENSESSales and marketing 33,128 24,943 22,424Research and development 41,804 35,556 31,293General and administrative 25,448 23,077 21,607Other charges (Note 19) 3,994 3,455 1,492Amortization of intangible assets 33,477 30,001 26,222
137,851 117,032 103,037INCOME FROM OPERATIONS 35,884 30,696 28,097INTEREST EXPENSE (1,297) (611) (522)INVESTMENT INCOME 161 1,415 195INCOME BEFORE INCOME TAXES 34,748 31,500 27,770INCOME TAX EXPENSE (Note 17)Current 6,572 4,022 1,443Deferred 1,297 3,640 5,765
7,869 7,662 7,208NET INCOME $ 26,879 $ 23,838 $ 20,562Earnings per shareBasic (in dollars per share) $ 0.35 $ 0.31 $ 0.27Diluted (in dollars per share) $ 0.35 $ 0.31 $ 0.27WEIGHTED AVERAGE SHARES OUTSTANDING (thousands)Basic (in shares) 76,324 75,800 75,595Diluted (in shares) 77,112 76,515 76,409
Copyright © 2018 www.secdatabase.com. All Rights Reserved.Please Consider the Environment Before Printing This Document
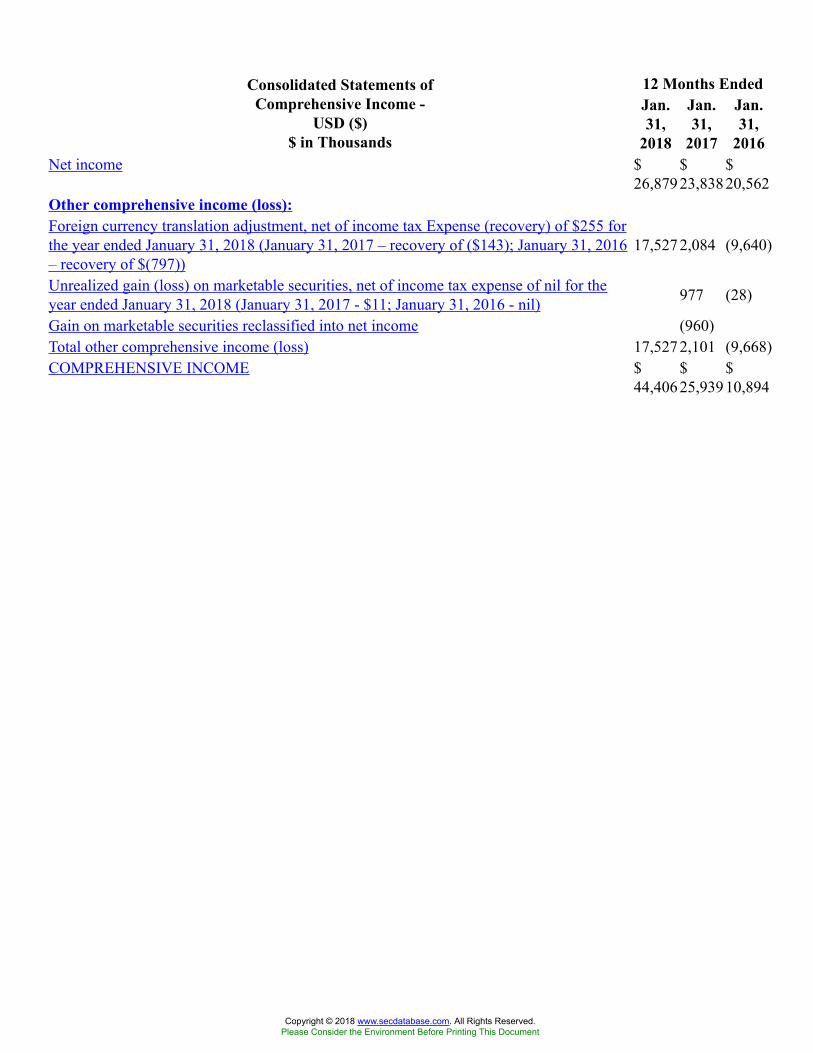
12 Months EndedConsolidated Statements ofComprehensive Income -
USD ($)$ in Thousands
Jan.31,
2018
Jan.31,
2017
Jan.31,
2016Net income $
26,879$23,838
$20,562
Other comprehensive income (loss):Foreign currency translation adjustment, net of income tax Expense (recovery) of $255 forthe year ended January 31, 2018 (January 31, 2017 – recovery of ($143); January 31, 2016– recovery of $(797))
17,5272,084 (9,640)
Unrealized gain (loss) on marketable securities, net of income tax expense of nil for theyear ended January 31, 2018 (January 31, 2017 - $11; January 31, 2016 - nil) 977 (28)
Gain on marketable securities reclassified into net income (960)Total other comprehensive income (loss) 17,5272,101 (9,668)COMPREHENSIVE INCOME $
44,406$25,939
$10,894
Copyright © 2018 www.secdatabase.com. All Rights Reserved.Please Consider the Environment Before Printing This Document
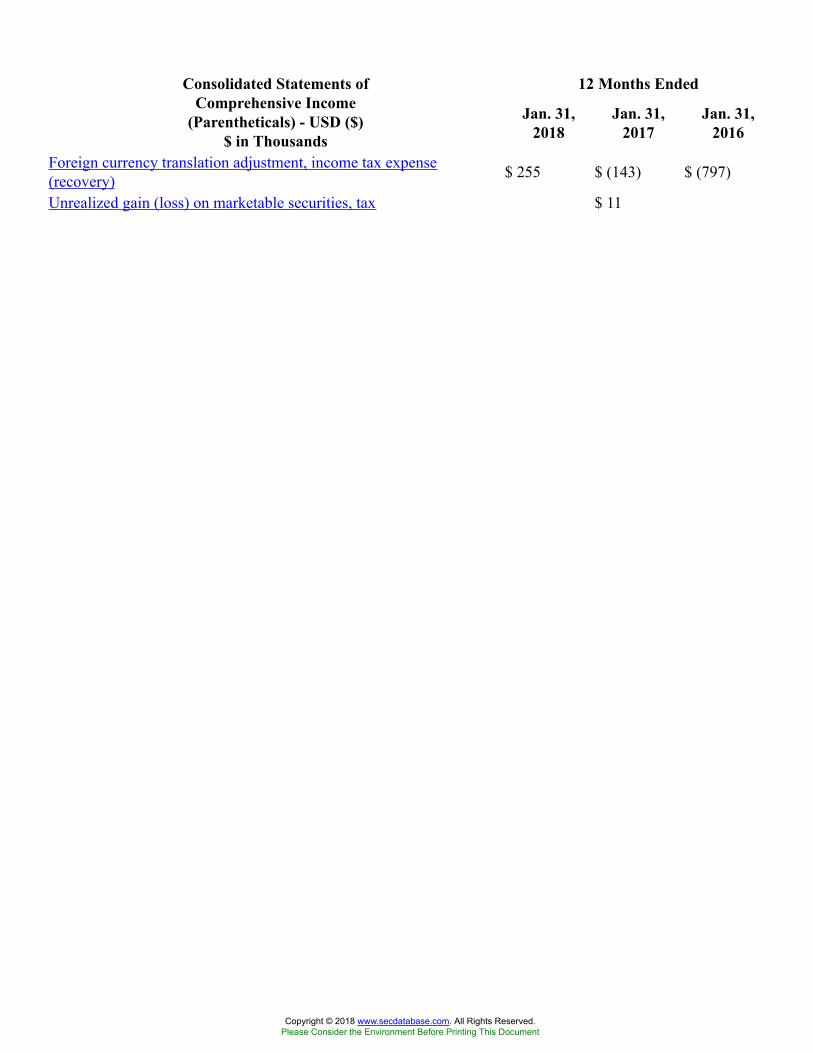
12 Months EndedConsolidated Statements ofComprehensive Income
(Parentheticals) - USD ($)$ in Thousands
Jan. 31,2018
Jan. 31,2017
Jan. 31,2016
Foreign currency translation adjustment, income tax expense(recovery) $ 255 $ (143) $ (797)
Unrealized gain (loss) on marketable securities, tax $ 11
Copyright © 2018 www.secdatabase.com. All Rights Reserved.Please Consider the Environment Before Printing This Document
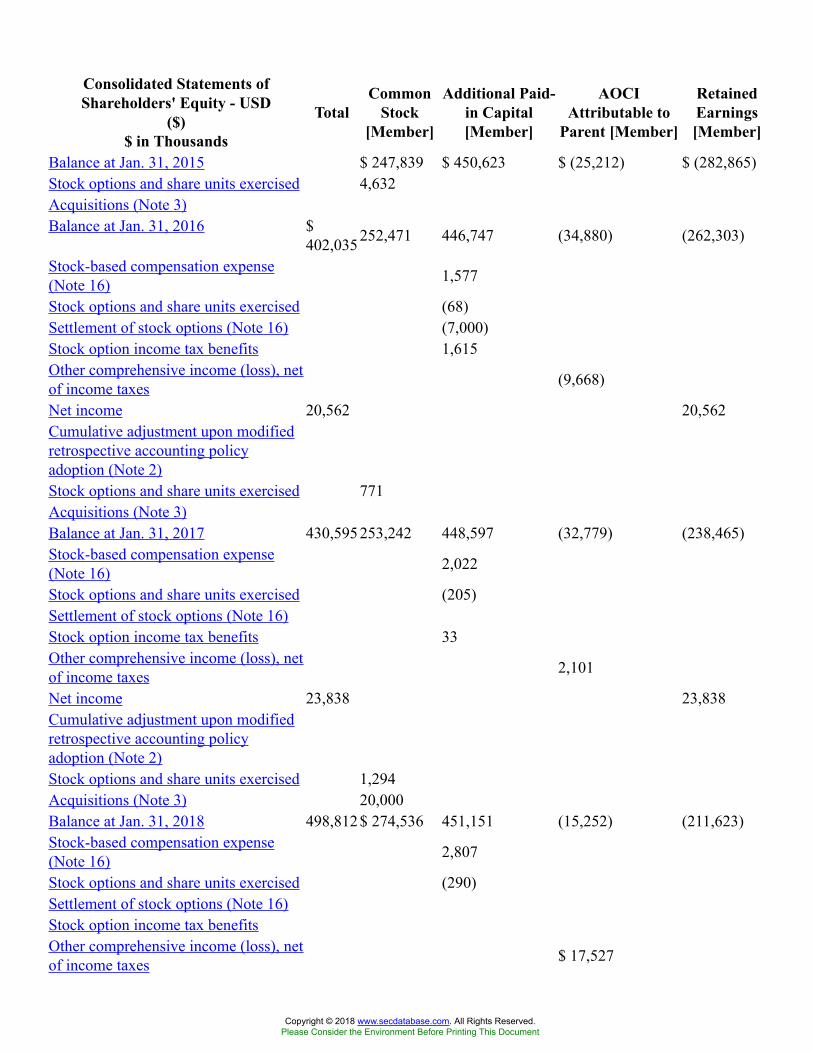
Consolidated Statements ofShareholders' Equity - USD
($)$ in Thousands
TotalCommon
Stock[Member]
Additional Paid-in Capital[Member]
AOCIAttributable to
Parent [Member]
RetainedEarnings[Member]
Balance at Jan. 31, 2015 $ 247,839 $ 450,623 $ (25,212) $ (282,865)Stock options and share units exercised 4,632Acquisitions (Note 3)Balance at Jan. 31, 2016 $
402,035252,471 446,747 (34,880) (262,303)
Stock-based compensation expense(Note 16) 1,577
Stock options and share units exercised (68)Settlement of stock options (Note 16) (7,000)Stock option income tax benefits 1,615Other comprehensive income (loss), netof income taxes (9,668)
Net income 20,562 20,562Cumulative adjustment upon modifiedretrospective accounting policyadoption (Note 2)Stock options and share units exercised 771Acquisitions (Note 3)Balance at Jan. 31, 2017 430,595253,242 448,597 (32,779) (238,465)Stock-based compensation expense(Note 16) 2,022
Stock options and share units exercised (205)Settlement of stock options (Note 16)Stock option income tax benefits 33Other comprehensive income (loss), netof income taxes 2,101
Net income 23,838 23,838Cumulative adjustment upon modifiedretrospective accounting policyadoption (Note 2)Stock options and share units exercised 1,294Acquisitions (Note 3) 20,000Balance at Jan. 31, 2018 498,812$ 274,536 451,151 (15,252) (211,623)Stock-based compensation expense(Note 16) 2,807
Stock options and share units exercised (290)Settlement of stock options (Note 16)Stock option income tax benefitsOther comprehensive income (loss), netof income taxes $ 17,527
Copyright © 2018 www.secdatabase.com. All Rights Reserved.Please Consider the Environment Before Printing This Document
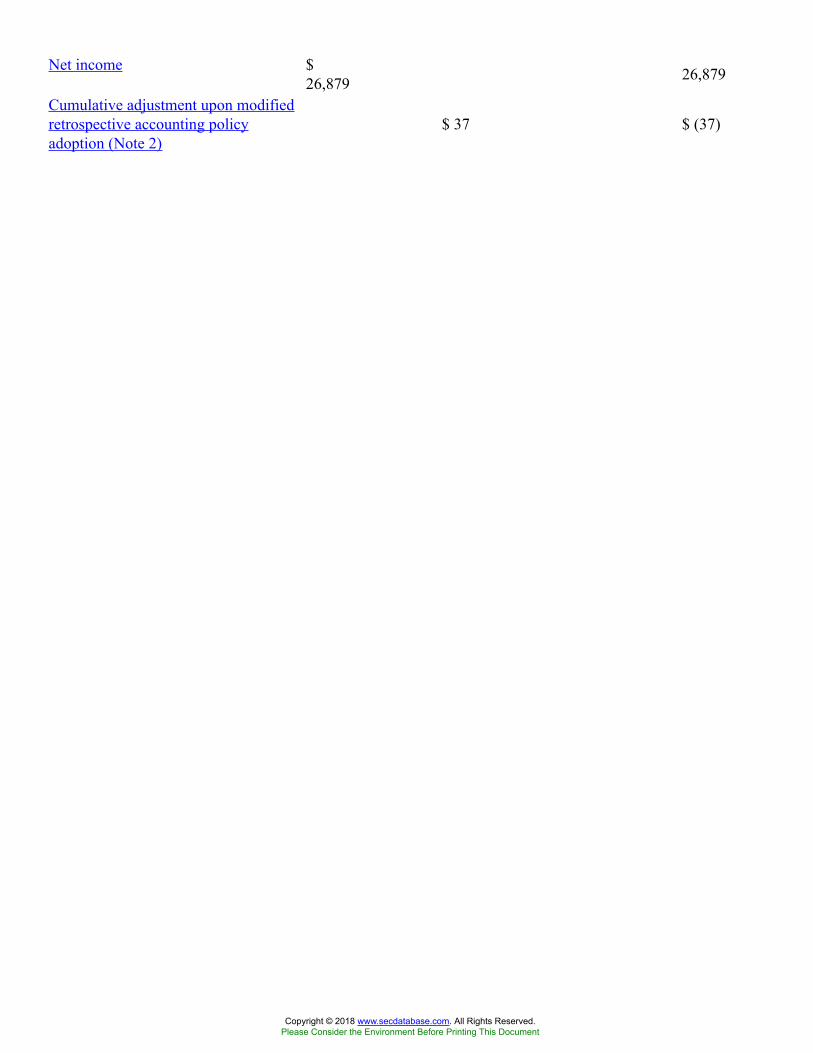
Net income $26,879 26,879
Cumulative adjustment upon modifiedretrospective accounting policyadoption (Note 2)
$ 37 $ (37)
Copyright © 2018 www.secdatabase.com. All Rights Reserved.Please Consider the Environment Before Printing This Document
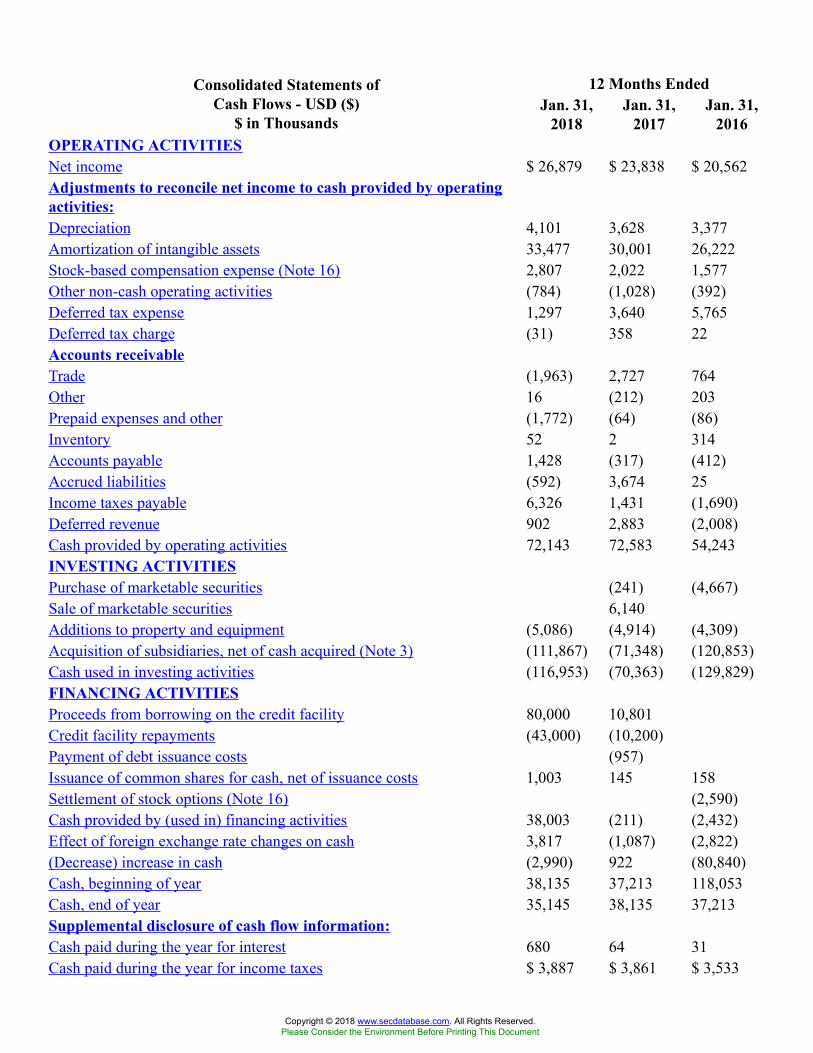
12 Months EndedConsolidated Statements ofCash Flows - USD ($)
$ in ThousandsJan. 31,
2018Jan. 31,
2017Jan. 31,
2016OPERATING ACTIVITIESNet income $ 26,879 $ 23,838 $ 20,562Adjustments to reconcile net income to cash provided by operatingactivities:Depreciation 4,101 3,628 3,377Amortization of intangible assets 33,477 30,001 26,222Stock-based compensation expense (Note 16) 2,807 2,022 1,577Other non-cash operating activities (784) (1,028) (392)Deferred tax expense 1,297 3,640 5,765Deferred tax charge (31) 358 22Accounts receivableTrade (1,963) 2,727 764Other 16 (212) 203Prepaid expenses and other (1,772) (64) (86)Inventory 52 2 314Accounts payable 1,428 (317) (412)Accrued liabilities (592) 3,674 25Income taxes payable 6,326 1,431 (1,690)Deferred revenue 902 2,883 (2,008)Cash provided by operating activities 72,143 72,583 54,243INVESTING ACTIVITIESPurchase of marketable securities (241) (4,667)Sale of marketable securities 6,140Additions to property and equipment (5,086) (4,914) (4,309)Acquisition of subsidiaries, net of cash acquired (Note 3) (111,867) (71,348) (120,853)Cash used in investing activities (116,953) (70,363) (129,829)FINANCING ACTIVITIESProceeds from borrowing on the credit facility 80,000 10,801Credit facility repayments (43,000) (10,200)Payment of debt issuance costs (957)Issuance of common shares for cash, net of issuance costs 1,003 145 158Settlement of stock options (Note 16) (2,590)Cash provided by (used in) financing activities 38,003 (211) (2,432)Effect of foreign exchange rate changes on cash 3,817 (1,087) (2,822)(Decrease) increase in cash (2,990) 922 (80,840)Cash, beginning of year 38,135 37,213 118,053Cash, end of year 35,145 38,135 37,213Supplemental disclosure of cash flow information:Cash paid during the year for interest 680 64 31Cash paid during the year for income taxes $ 3,887 $ 3,861 $ 3,533
Copyright © 2018 www.secdatabase.com. All Rights Reserved.Please Consider the Environment Before Printing This Document

12 Months EndedNote 1 - Description of theBusiness Jan. 31, 2018
Notes to FinancialStatementsBusiness Description andBasis of Presentation [TextBlock]
Note 1 - Description of the Business
The Descartes Systems Group Inc. (“Descartes,” “Company,” “our” or “we”) is a provider ofglobal logistics technology solutions. Customers use our modular, software-as-a-service (“SaaS”)and data solutions to route, schedule, track and measure delivery resources; plan, allocate andexecute shipments; rate, audit and pay transportation invoices; access and analyze global tradedata; research and perform trade tariff and duty calculations; file customs and security documentsfor imports and exports; and complete numerous other logistics processes by participating in alarge, collaborative multi-modal logistics community. Our pricing model provides our customerswith flexibility in purchasing our solutions either on a subscription, transactional or perpetuallicense basis. Our primary focus is on serving transportation providers (air, ocean and truckmodes), logistics service providers (including third-party logistics providers, freight forwardersand customs brokers) and distribution-intensive companies for which logistics is either a key or adefining part of their own product or service offering, or for which our solutions can provide anopportunity to reduce costs, improve service levels, or support growth by optimizing the use ofassets and information.
Copyright © 2018 www.secdatabase.com. All Rights Reserved.Please Consider the Environment Before Printing This Document
12 Months EndedNote 2 - Basis ofPresentation Jan. 31, 2018
Notes to FinancialStatementsSignificant AccountingPolicies [Text Block]
Note 2 –Basis of Presentation
The accompanying consolidated financial statements are presented in United States (“US”) dollars and are prepared in accordancewith generally accepted accounting principles in the US (“GAAP”) and the rules and regulations of the Canadian SecuritiesAdministrators and the US Securities and Exchange Commission (“SEC”) for the preparation of consolidated financial statements.
Our fiscal year commences on February 1st of each year and ends on January 31st of the following year. Our fiscal year, which endson January 31, 2018, is referred to as the “current fiscal year”, “fiscal 2018”, “2018” or using similar words. Our previous fiscalyear, which ended on January 31, 2017, is referred to as the “previous fiscal year”, “fiscal 2017”, “2017” or using similar words.Other fiscal years are referenced by the applicable year during which the fiscal year ends. For example, “2019” refers to the annualperiod ending January 31, 2019 and the “fourth quarter of 2019” refers to the quarter ending January 31, 2019.
Basis of consolidationThe consolidated financial statements include the financial statements of Descartes and our wholly-owned subsidiaries. We do nothave any variable interests in variable interest entities. All intercompany accounts and transactions have been eliminated duringconsolidation.
Foreign currency translationThe US dollar is the presentation currency of the Company. Assets and liabilities of our subsidiaries are translated into USdollars at the exchange rate in effect at the balance sheet date. Revenues and expenses are translated into US dollars using dailyexchange rates. Translation adjustments resulting from this process are accumulated in other comprehensive income (loss) as aseparate component of shareholders’ equity. On substantial liquidation of a foreign operation, the component of accumulated othercomprehensive income relating to that particular foreign operation is recognized in the consolidated statements of operations.
The functional currency of each of our entities is the local currency in which they operate. Transactions incurred in currenciesother than the local currency of an entity are converted to the local currency at the transaction date. Monetary assets and liabilitiesdenominated in foreign currencies are re-measured into the local currency at the exchange rate in effect at the balance sheet date.All foreign currency re-measurement gains and losses are included in net income. For the year ended January 31, 2018, foreigncurrency re-measurement loss of $0.4 million was included in net income ( January 31, 2017 – loss of $0.1 million; January 31,2016 – loss of $0.2 million).
Use of estimatesPreparing financial statements in conformity with GAAP requires management to make estimates and assumptions that affect theamounts that are reported in the consolidated financial statements and accompanying note disclosures. Although these estimatesand assumptions are based on management’s best knowledge of current events, actual results may be different from the estimates.These estimates, judgments and assumptions are evaluated on an ongoing basis. We base our estimates on historical experience andon various other assumptions that we believe are reasonable at that time, the results of which form the basis for making judgmentsabout the carrying values of assets and liabilities that are not readily apparent from other sources.
Estimates and assumptions are used when accounting for items such as allocations of the purchase price and the fair value ofnet assets acquired in business combination transactions, useful lives of intangible assets and property and equipment, allowancefor doubtful accounts, collectability of other receivables, provisions for excess or obsolete inventory, restructuring accruals,revenue related estimates including vendor-specific objective evidence (“VSOE”) of selling price and best estimate of selling price(“BESP”), fair value of stock-based compensation, assumptions embodied in the valuation of assets for impairment assessment,accounting for income taxes, valuation allowances for deferred income tax assets, realization of investment tax credits, uncertaintax positions and recognition of contingencies.
CashCash included highly liquid short-term deposits with original maturities of three months or less.
Financial instrumentsFair value of financial instrumentsIn accordance with Financial Accounting Standards Board (“FASB”), Accounting Standards Codification (“ASC”) Topic 320"Investments - Debt and Equity Securities" (Topic 320) related to accounting for certain investments in equity securities, and basedon our intentions regarding these instruments, we classify our marketable securities as available for sale and account for theseinvestments at fair value.
The carrying amounts of the Company’s cash, accounts receivable (net), accounts payable, accrued liabilities and income taxespayable approximate their fair value due to their short maturities.
Derivative instrumentsWe use derivative instruments to manage equity risk relating to our share-based compensation. We account for these instrumentsin accordance with ASC Topic 815 “Derivatives and Hedging” (Topic 815), which requires that every derivative instrument berecorded on the balance sheet as either an asset or a liability measured at its fair value as of the reporting date. We do not designateour derivative instruments as hedges and as such the changes in our derivative financial instruments' fair values are recognized inearnings. The fair value of equity contract derivatives is determined utilizing a valuation model based on the quoted market valueof our common shares at the balance sheet date.
Copyright © 2018 www.secdatabase.com. All Rights Reserved.Please Consider the Environment Before Printing This Document
Foreign exchange riskWe are exposed to foreign exchange risk because the Company transacts business in currencies other than the US dollar.Accordingly, our results are affected, and may be affected in the future, by exchange rate fluctuations of the US dollar relative tothe Canadian dollar, euro, British pound sterling and various other foreign currencies.
Interest rate riskWe are exposed to interest rate fluctuations to the extent that we borrow on our credit facility, which depending on the type ofadvance under the available facilities, interest will be charged based on either i) Canada or US prime rate; or ii) Banker’s Acceptance(BA); or iii) LIBOR.
Credit riskWe are exposed to credit risk through our invested cash and accounts receivable. We hold our cash with reputable financialinstitutions. The lack of concentration of accounts receivable from a single customer and the dispersion of customers amongindustries and geographical locations mitigate our credit risk.
We do not use any type of speculative financial instruments, including but not limited to foreign exchange contracts, futures,swaps and option agreements, to manage our foreign exchange or interest rate risks. In addition, we do not hold or issue financialinstruments for trading purposes.
Equity riskWe are exposed to equity risk through certain share-based compensation expenses that are fair valued at the balance sheet date. TheCompany enters into equity derivative contracts including floating-rate equity forwards to partially offset the potential fluctuationsof certain future share-based compensation expenses. The Company does not hold derivatives for speculative purposes.
Allowance for doubtful accountsWe maintain an allowance for doubtful accounts for estimated losses resulting from the inability of customers to make theirrequired payments. Specifically, we consider the age of the receivables, customers’ payment history, historical write-offs, thecreditworthiness of the customer, and current economic trends among other factors. Accounts receivable are written off, and theassociated allowance is eliminated, if it is determined that the specific balance is no longer collectible. The allowance is maintainedfor 100% of all accounts deemed to be uncollectible and, for those receivables not specifically identified as uncollectible, anallowance is maintained for a specific percentage of those receivables based upon the aging of accounts, our historical collectionexperience and current economic expectations. To date, the actual losses have been within our expectations. No single customeraccounted for more than 10% of the accounts receivable balance as of January 31, 2018 and 2017.
InventoryFinished goods inventories are stated at the lower of cost and net realizable value. The cost of finished goods is determined on thebasis of average cost of units.
The valuation of inventory, including the determination of obsolete or excess inventory, requires management to estimate the futuredemand for our products within specified time horizons. We perform an assessment of inventory which includes a review of, amongother factors, demand requirements, product life cycle and development plans, product pricing and quality issues. If the demand forour products indicates we are no longer able to sell inventories above cost or at all, we write down inventory to market or excessinventory is written off.
Impairment of long-lived assetsWe test long-lived assets or asset groups, such as property and equipment and finite life intangible assets, for recoverability whenevents or changes in circumstances indicate that there may be impairment. Circumstances which could trigger a review include, butare not limited to: significant adverse changes in the business climate or legal factors; current period cash flow or operating lossescombined with a history of losses or a forecast of continuing losses associated with the use of the asset or asset group; and a currentexpectation that the asset or asset group will more likely than not be sold or disposed of before the end of its estimated useful life.An impairment loss is recognized when the estimate of undiscounted future cash flows generated by such asset or asset group isless than the carrying amount. Measurement of the impairment loss is based on the present value of the expected future cash flows.No impairment of long-lived assets has been identified or recorded in our consolidated statements of operations for any of the fiscalyears presented.
Goodwill and intangible assetsGoodwill represents the excess of the purchase price in a business combination over the fair value of net tangible and intangibleassets acquired. Goodwill is not subject to amortization.
We test for impairment of goodwill at least annually on October 31st of each year and at any other time if any event occursor circumstances change that would more likely than not reduce our fair value below our reporting unit’s carrying amount. Ouroperations are analyzed by management and our chief operating decision makers as being part of a single industry segmentproviding logistics technology solutions. Accordingly, our goodwill impairment assessment is based on the allocation of goodwillto a single reporting unit. We completed the qualitative assessment during our third quarter of 2018 and concluded that it was morelikely than not that the fair value of the goodwill was greater than the carrying value. As a result, no impairment of goodwill wasrecorded in fiscal 2018 (no impairments were recorded for fiscal 2017 or fiscal 2016).
We perform further quarterly analysis of whether any event has occurred that would more likely than not reduce our fair value belowour reporting unit’s carrying amount and, if so, we perform a goodwill impairment test between the annual date. Any impairmentadjustment is recognized as an expense in the period that the adjustment is identified.
Copyright © 2018 www.secdatabase.com. All Rights Reserved.Please Consider the Environment Before Printing This Document
Intangible assets related to our acquisitions are recorded at their fair value at the acquisition date. Intangible assets include customeragreements and relationships, non-compete covenants, existing technologies and trade names. Intangible assets are amortized on astraight-line basis over their estimated useful lives. We write down intangible asset or asset groups with a finite life to fair valuewhen the related undiscounted cash flows are not expected to allow for recovery of the carrying value. Fair value of intangible assetor asset groups is determined by discounting the expected related future cash flows.
Amortization of our intangible assets is generally recorded at the following rates:
Customer agreements and relationships Straight-line over three to twenty yearsExisting technologies Straight-line over two to twelve yearsTrade names Straight-line over one to fifteen yearsNon-compete covenants Straight-line over two to twelve years
Property and equipmentProperty and equipment is recorded at cost. Depreciation of our property and equipment is generally recorded at the following rates:
Computer equipment and software 30% declining balanceFurniture and fixtures 20% declining balanceLeasehold improvements Straight-line over lesser of useful life or term of lease
Fully depreciated property and equipment are removed from the balance sheet when they are no longer in use.
Revenue recognitionWe recognize revenue when it is realized or realizable and earned. We consider revenue realized or realizable and earned when thereexists persuasive evidence of an arrangement, the product has been delivered or the services have been provided to the customer,the sales price is fixed or determinable and collectability is reasonably assured. All revenue is recognized net of any related salestaxes. In addition to this general policy, the specific revenue recognition policies for each major category of revenue are includedbelow.
Services Revenues - Services revenues are principally comprised of the following: (i) ongoing transactional fees for use of ourservices and products by our customers, which are recognized as the transactions occur; (ii) professional services revenues fromconsulting, implementation and training services related to our services and products, which are recognized as the services areperformed; (iii) maintenance, subscription and other related revenues, including revenues associated with maintenance and supportof our services and products, which are recognized ratably over the subscription period; and (iv) hardware revenues, which arerecognized when hardware is shipped.
License Revenues - License revenues are derived from perpetual licenses granted to our customers to use our software products,which are recognized when the license is delivered.
We enter into arrangements from time to time that may consist of multiple deliverables which may include any combination ofservices and software licenses. Our typical multiple-element arrangements involve: (i) software with maintenance support services,(ii) professional services and (iii) hardware with services. For any arrangements involving multiple deliverables involving non-software elements (hardware, professional services, subscription, etc.) the consideration from the arrangement is allocated to eachrespective element based on its relative selling price, using VSOE of selling price. In instances when we are unable to establish theselling price using VSOE, we attempt to establish selling price of each element based on acceptable third-party evidence of sellingprice (“TPE”); however, we are generally unable to reliably determine the selling price of similar competitor products or services ona stand-alone basis. In these instances, we use our BESP in our allocation of the arrangement consideration. The objective of BESPis to determine the price at which we would transact a sale if the product or service was sold on a stand-alone basis. We determineBESP for each specific element in a multiple element arrangement considering multiple factors including, but not limited to, marketconditions, competitive landscape, internal costs, gross margin objectives and pricing practices.
For arrangements involving multiple deliverables of software with maintenance support services, the revenue is recognized basedon ASC Subtopic 985-605 “Software: Revenue Recognition”. If we are unable to determine VSOE of fair value for all of thedeliverables of the arrangement, but are able to obtain VSOE of fair value for all the undelivered elements, revenue is allocatedusing the residual method. Under the residual method, the amount of revenue allocated to the delivered elements equals the totalarrangement consideration less the aggregate fair value of any undelivered elements. If VSOE of fair value of any undeliveredsoftware items does not exist, revenue from the entire arrangement is initially deferred and recognized at the earlier of: (i) deliveryof those elements for which VSOE of fair value did not exist; or (ii) when VSOE of fair value can be established.
Research and development costsTo date, we have not capitalized any costs related to research and development of our computer software products. Costs incurredbetween the dates that the product is considered to be technologically feasible and is considered to be ready for general release tocustomers have historically been expensed as they have not been significant.
Stock-based compensation plansStock OptionsWe maintain stock option plans for non-employee directors, officers, employees and other service providers. Options to purchaseour common shares are granted at an exercise price equal to the fair market value of our common shares as of the date of grant. Thisfair market value is determined using the closing price of our common shares on the TSX on the day immediately preceding thedate of the grant.
Copyright © 2018 www.secdatabase.com. All Rights Reserved.Please Consider the Environment Before Printing This Document
Employee stock options generally vest over a five-year period starting from the grant date and expire seven years from the grantdate. Non-employee directors’ and officers’ stock options generally have quarterly vesting over a three- to five-year period. Weissue new shares from treasury upon the exercise of a stock option.
The fair value of employee stock option grants that are ultimately expected to vest are amortized to expense in our consolidatedstatement of operations based on the straight-line attribution method. The fair value of stock option grants is calculated using theBlack-Scholes Merton option-pricing model. Expected volatility is based on historical volatility of our common stock and otherfactors. The risk-free interest rates are based on Government of Canada average bond yields for a period consistent with the expectedlife of the option in effect at the time of the grant. The expected option life is based on the historical life of our granted options andother factors.
Effective as of February 1, 2017, the Company adopted a change in accounting policy in accordance with ASU 2016-09 to accountfor forfeitures as they occur. The change was applied on a modified retrospective basis, and no prior periods were restated as a resultof this change in accounting policy.
Performance & Restricted Share UnitsWe maintain a performance and restricted share unit plan pursuant to which certain of our officers are eligible to receive grants ofperformance share units (“PSUs”) and restricted share units (“RSUs”).
PSUs vest at the end of a three-year performance period. The ultimate number of PSUs that vest is based on the total shareholderreturn (“TSR”) of our Company relative to the TSR of companies comprising a peer index group. TSR is calculated based on theweighted-average closing price of shares for the five trading days preceding the beginning and end of the performance period. Thefair value of PSUs is expensed to stock-based compensation expense over the vesting period. PSUs expire ten years from the grantdate. New shares are issued from treasury upon the redemption of a PSU.
PSUs are measured at fair value estimated using a Monte Carlo Simulation approach. Expected volatility is based on historicalvolatility of our common stock and other factors. The risk-free interest rates are based on the Government of Canada average bondyields for a period consistent with the expected life of the PSUs at the time of the grant. The expected PSU life is based on thehistorical life of our stock options and other factors.
RSUs vest annually over a three-year period starting from the grant date and expire ten years from the grant date. We issue newshares from treasury upon the redemption of an RSU.
RSUs are measured at fair value based on the closing price of our common shares for the day preceding the date of the grant andwill be expensed to stock-based compensation expense over the vesting period.
Deferred Share Unit PlanOur board of directors adopted a deferred share unit plan effective as of June 28, 2004, pursuant to which non-employee directorsare eligible to receive grants of deferred share units (“DSUs”), each of which has an initial value equal to the weighted-averageclosing price of our common shares for the five trading days preceding the grant date. The plan allows each director to choose toreceive, in the form of DSUs, all, none or a percentage of the eligible director’s fees which would otherwise be payable in cash.If a director has invested less than the minimum amount of equity in Descartes, as prescribed from time to time by the board ofdirectors, then the director must take at least 50% of the base annual fee for serving as a director in the form of DSUs. Each DSUfully vests upon award but is distributed only when the director ceases to be a member of the board of directors. Vested units aresettled in cash based on our common share price when conversion takes place. Fair value of the liability is based on the closingprice of our common shares at the balance sheet date.
Cash-Settled Restricted Share Unit PlanOur board of directors adopted a cash-settled restricted share unit plan effective as of May 23, 2007, pursuant to which certain ofour employees and non-employee directors are eligible to receive grants of cash-settled restricted share units (“CRSUs”), each ofwhich has an initial value equal to the weighted-average closing price of our common shares for the five trading days precedingthe date of the grant. The CRSUs generally vest based on continued employment and have annual vesting over three- to five-yearperiods. Vested units are settled in cash based on our common share price when conversion takes place, which is within 30 daysfollowing a vesting date and in any event prior to December 31st of the calendar year in which a vesting date occurs. Fair value ofthe liability is based on the closing price of our common shares at the balance sheet date.
Business combinationsWe apply the provisions of ASC Topic 805, “Business Combinations” (Topic 805), in the accounting for our acquisitions. It requiresus to recognize separately from goodwill, the assets acquired and the liabilities assumed at their acquisition date fair values.Goodwill as of the acquisition date is measured as the excess of consideration transferred over the net of the acquisition date fairvalues of the assets acquired and the liabilities assumed. While we use our best estimates and assumptions to accurately valueassets acquired and liabilities assumed at the acquisition date as well as contingent consideration, where applicable, our estimatesare inherently uncertain and subject to refinement. As a result, during the measurement period, which may be up to one yearfrom the acquisition date, we may record adjustments to the assets acquired and liabilities assumed with the corresponding offsetto goodwill. Upon the conclusion of the measurement period or final determination of the values of assets acquired or liabilitiesassumed, whichever comes first, any subsequent adjustments would be recorded to our consolidated statement of operations.
Costs to exit or restructure certain activities of an acquired company or our internal operations are accounted for as termination andexit costs pursuant to ASC Topic 420, “Exit or Disposal Cost Obligations” (Topic 420) and are accounted for separately from thebusiness combination.
For a given acquisition, we generally identify certain pre-acquisition contingencies as of the acquisition date and may extendour review and evaluation of these pre-acquisition contingencies throughout the measurement period in order to obtain sufficient
Copyright © 2018 www.secdatabase.com. All Rights Reserved.Please Consider the Environment Before Printing This Document
information to assess whether we include these contingencies as a part of the purchase price allocation and, if so, to determine theestimated amounts.If we determine that a pre-acquisition contingency (non-income tax related) is probable in nature and estimable as of the acquisitiondate, we record our best estimate for such a contingency as a part of the preliminary purchase price allocation. We often continue togather information and evaluate our pre-acquisition contingencies throughout the measurement period and if we make changes tothe amounts recorded or if we identify additional pre-acquisition contingencies during the measurement period, such amounts willbe included in the purchase price allocation during the measurement period and, subsequently, in our results of operations.
Uncertain tax positions and tax related valuation allowances assumed in connection with a business combination are initiallyestimated as of the acquisition date. We review these items during the measurement period as we continue to actively seek andcollect information relating to facts and circumstances that existed at the acquisition date. Changes to these uncertain tax positionsand tax related valuation allowances made subsequent to the measurement period, or if they relate to facts and circumstances thatdid not exist at the acquisition date, are recorded in our provision for income taxes in our consolidated statement of operations.
Income taxesWe use the liability method of income tax allocation to account for income taxes. Deferred tax assets and liabilities arise fromtemporary differences between the tax bases of assets and liabilities and their reported amounts in the consolidated financialstatements that will result in taxable or deductible amounts in future years. These temporary differences are measured using enactedtax rates. A valuation allowance is recorded to reduce deferred tax assets to the extent that we consider it is more likely than not thata deferred tax asset will not be realized. In determining the valuation allowance, we consider factors such as the reversal of deferredincome tax liabilities, projected taxable income, our history of losses for tax purposes, and the character of income tax assets andtax planning strategies. A change to these factors could impact the estimated valuation allowance and income tax expense.
We evaluate our uncertain tax positions by using a two-step approach to recognize and measure uncertain tax positions andprovisions for income taxes. The first step is to evaluate the tax position for recognition by determining if the weight of availableevidence indicates it is more likely than not, based solely on the technical merits, that the position will be sustained on audit,including resolution of related appeals or litigation processes, if any. The second step is to measure the appropriate amount of thebenefit to recognize. The amount of benefit to recognize is measured as the maximum amount which is more likely than not to berealized. The tax position is derecognized when it is no longer more likely than not that the position will be sustained on audit. Wecontinually assess the likelihood and amount of potential adjustments and adjust the income tax provisions, income taxes payableand deferred income taxes in the period in which the facts that give rise to a revision become known.
Earnings per shareBasic earnings per share is calculated by dividing net income by the weighted average number of common shares outstandingduring the period. Diluted earnings per common share is calculated by dividing net income by the sum of the weighted averagenumber of common shares outstanding and all additional common shares that would have been outstanding if potentially dilutivecommon shares had been issued during the period. The treasury stock method is used to compute the dilutive effect of stock-basedcompensation.
Recently adopted accounting pronouncementsIn March 2016, the FASB issued Accounting Standards Update 2016-09, “Compensation – Stock Compensation (Topic 718):Improvements to Employee Share-Based Payment Accounting” (“ASU 2016-09”). ASU 2016-09 simplifies several areas ofaccounting for share-based compensation arrangements, including the income tax impact, classification on the statement of cashflows and forfeitures. ASU 2016-09 is effective for annual periods, and interim periods within those annual periods, beginningafter December 15, 2016, which was our fiscal year beginning February 1, 2017. As a result of adoption, excess tax benefits ordeficiencies related to stock-based compensation are reflected in the Consolidated Statement of Operations as a component of theprovision for income taxes and reported as operating activities in the Consolidated Statement of Cash Flows, on a prospective basis.Effective as of February 1, 2017, the Company adopted a change in accounting policy in accordance with ASU 2016-09 to accountfor forfeitures as they occur. The change was applied on a modified retrospective basis, and no prior periods were restated as a resultof this change in accounting policy. Accordingly, we have recognized a cumulative adjustment charge of less than $0.1 million inaccumulated deficit in the first quarter of fiscal 2018 as a result of the adoption of this change in accounting policy.
In July 2015, the FASB issued Accounting Standards Update 2015-11, “Inventory (Topic 330): Simplifying the Measurement ofInventory” (“ASU 2015-11”). ASU 2015-11 provides guidance to more clearly articulate the requirements for the measurement anddisclosure of inventory. ASU 2015-11 is effective for annual periods, and interim periods within those annual periods, beginningafter December 15, 2016, which was our fiscal year beginning February 1, 2017. The Company adopted this guidance in the firstquarter of fiscal 2018. The adoption of this standard did not have a material impact on our results of operations or disclosures.
Recently issued accounting pronouncementsIn May 2014, the FASB issued Accounting Standards Update 2014-09, “Revenue from Contracts with Customers” (“ASU2014-09”) and issued subsequent amendments to the initial guidance during 2015 and 2016, collectively referred to as “Topic 606”.These updates supersede the revenue recognition requirements in ASC Topic 605, "Revenue Recognition" and nearly all otherexisting revenue recognition guidance under US GAAP. The core principle of Topic 606 is to recognize revenues when promisedgoods or services are transferred to customers in an amount that reflects the consideration that is expected to be received for thosegoods or services. Topic 606 can be applied either (i) retrospectively to each prior reporting period presented with the option toelect certain practical expedients; or (ii) retrospectively with the cumulative effect recognized at the date of initial application andproviding certain additional disclosures (the “cumulative effect approach”). Topic 606 is effective for annual periods, and interimperiods within those annual periods, beginning after December 15, 2017, which will be our fiscal year beginning February 1, 2018(fiscal 2019). Early adoption is permitted. We anticipate that we will adopt Topic 606 using the cumulative effect approach whenthis guidance becomes effective for us, starting in the first quarter of fiscal 2019.
We are currently evaluating the effects that the adoption of Topic 606 will have on our results of operations, financial position anddisclosures. To date we have established a project team with the objective of evaluating the effect that Topic 606 will have on our
Copyright © 2018 www.secdatabase.com. All Rights Reserved.Please Consider the Environment Before Printing This Document
consolidated financial statements, related disclosures, business processes, systems and controls. We are analyzing the impact of thenew standard on our contracts by reviewing current accounting policies, practices and our revenue contracts to identify potentialdifferences that would result from applying the requirements of the new standard. In parallel, we are assessing the changes toour business processes, systems and controls in order to support recognition and disclosure under the new standard. While we arecontinuing to assess all potential impacts of the new revenue recognition standard, we currently believe the most significant impactwill relate to our accounting for costs to obtain a contract, on premise subscription offerings as well as expanded disclosures relatedto revenue, performance obligations and contract balances.
Under the new standard, we will defer all incremental commission costs to obtain customer contracts and amortize these costs overan expected period of benefit, which we have determined to be approximately five years. As a result, we expect an increase indeferred commission assets and a change in the timing of recognition of commission expense in future reporting periods under thenew standard. We anticipate a retained earnings adjustment of approximately $2.0 to $3.0 million, net of a tax impact of $0.8 to $1.1million, upon adoption related to contract costs. The ultimate impact is subject to actual commissions earned in fiscal 2018.
Under current GAAP, revenue attributable to subscription services related to on premise offerings is recognized ratably over theterm of the arrangement because Vendor Specific Objective Evidence (VSOE) does not exist for the undelivered maintenance andsupport element as it is not sold separately. The requirement to have VSOE for undelivered elements to enable the separation ofthe delivered software licenses is eliminated under the new revenue recognition standard. Accordingly, under this new standardwe will be required to recognize as revenue a portion of the arrangement fee upon delivery of the initial software at the outset ofthe arrangement. This difference will result in allocating a transaction price to the delivered software component of a subscriptionoffering and thus an earlier recognition of revenue related to that transaction price. The Company continues to evaluate the impactrelated to on premise subscription offerings.
In January 2016, the FASB issued Accounting Standards Update 2016-01, “Financial Instruments—Overall (Subtopic 825-10):Recognition and Measurement of Financial Assets and Financial Liabilities” (“ASU 2016-01”). ASU 2016-01 supersedes theguidance to classify equity securities with readily determinable fair values into different categories reducing the number of itemsthat are recognized in other comprehensive income as well as simplifying the impairment assessment of equity investments withoutreadily determinable fair values. ASU 2016-01 is effective for annual periods, and interim periods within those annual periods,beginning after December 15, 2017, which will be our fiscal year beginning February 1, 2018 (fiscal 2019). The Company willadopt this guidance in the first quarter of fiscal 2019. The adoption of this amendment is not expected to have a material impact onour results of operations or disclosures.
In February 2016, the FASB issued Accounting Standards Update 2016-02, “Leases (Topic 842)” (“ASU 2016-02”). ASU 2016-02supersedes the lease guidance in ASC Topic 840, “Leases” and requires the recognition of lease assets and lease liabilities by lesseesfor those leases classified as operating leases. ASU 2016-02 is effective for annual periods, and interim periods within those annualperiods, beginning after December 15, 2018, which will be our fiscal year beginning February 1, 2019 (fiscal 2020). The Companywill adopt this guidance in the first quarter of fiscal 2020. The adoption of this standard is expected to increase assets and liabilities,as we will be required to record a right-of-use asset and a corresponding lease liability in our consolidated financial statements,as well as a decrease to operating costs, an increase to finance costs (due to accretion of the lease liability) and an increase todepreciation and amortization (due to amortization of the right-of-use asset). The Company continues to evaluate the impact thatthe adoption will have on its results of operations, financial position and disclosures.
In June 2016, the FASB issued Accounting Standards Update 2016-13, “Financial Instruments – Credit Losses (Topic 326):Measurement of Credit Losses on Financial Instruments” (“ASU 2016-13”). ASU 2016-13 requires measurement and recognitionof expected credit losses for financial assets held. ASU 2016-13 is effective for annual periods, and interim periods within thoseannual periods, beginning after December 15, 2019, which will be our fiscal year beginning February 1, 2020 (fiscal 2021). Earlyadoption is permitted. The Company will adopt this guidance in the first quarter of fiscal 2021 and is currently evaluating the impactthat the adoption will have on its results of operations, financial position and disclosures.
In August 2016, the FASB issued Accounting Standards Update 2016-15, “Statement of Cash Flows (Topic 230): Classificationof Certain Cash Receipts and Cash Payments” (“ASU 2016-15”). ASU 2016-15 clarifies the presentation and classification in thestatement of cash flows. ASU 2016-15 is effective for annual periods, and interim periods within those annual periods, beginningafter December 15, 2017, which will be our fiscal year beginning February 1, 2018 (fiscal 2019). Early adoption is permitted. TheCompany will adopt this guidance in the first quarter of fiscal 2019. The adoption of this amendment is not expected to have amaterial impact on our results of operations or disclosures.
In October 2016, the FASB issued Accounting Standards Update 2016-16, “Income Taxes (Topic 740): Intra-Entity Transfers ofAssets Other Than Inventory” (“ASU 2016-16”). ASU 2016-16 requires the recognition of the income tax consequences of an intra-entity transfer of an asset other than inventory when the transfer occurs. ASU 2016-16 is effective for annual periods, and interimperiods within those annual periods, beginning after December 15, 2017, which will be our fiscal year beginning February 1, 2018(fiscal 2019). Early adoption is permitted. The Company will adopt this guidance in the first quarter of fiscal 2019. The adoptionof this standard will result in the write-off of the balance of unamortized deferred tax charges and the recognition of previouslyunrecognized deferred tax assets in certain jurisdictions. We anticipate an increase in retained earnings of up to $4.0 million uponadoption related to the unrecognized income tax effects of asset transfers that occurred prior to adoption.
In January 2017, the FASB issued Accounting Standards Update 2017-01, “Business Combinations (Topic 805): Clarifying theDefinition of a Business” (“ASU 2017-01”). ASU 2017-01 clarifies the definition of a business to assist entities with evaluatingwhether transactions should be accounted for as acquisitions of assets or businesses. ASU 2017-01 is effective for annual periods,and interim periods within those annual periods, beginning after December 15, 2017, which will be our fiscal year beginningFebruary 1, 2018 (fiscal 2019). Early adoption is not permitted. The Company will adopt this guidance in the first quarter of fiscal2019. The adoption of this amendment is not expected to have a material impact on our results of operations or disclosures.
Copyright © 2018 www.secdatabase.com. All Rights Reserved.Please Consider the Environment Before Printing This Document
In January 2017, the FASB issued Accounting Standards Update 2017-04, “Intangibles – Goodwill and Other (Topic 350):Simplifying the Test for Goodwill Impairment” (“ASU 2017-04”). ASU 2017-04 simplifies how an entity is required to testgoodwill for impairment. ASU 2017-04 is effective for annual periods, and interim periods within those annual periods, beginningafter December 15, 2019, which will be our fiscal year beginning February 1, 2020 (fiscal 2021). Early adoption is permitted. TheCompany will adopt this guidance in the first quarter of fiscal 2021. The adoption of this amendment is not expected to have amaterial impact on our results of operations or disclosures.
In May 2017, the FASB issued Accounting Standards Update 2017-09, “Compensation – Stock Compensation (Topic 718): Scopeof Modification Accounting” (“ASU 2017-09”). ASU 2017-09 clarifies the guidance on when to apply modification accountingfor share-based payment awards. ASU 2017-09 is effective for annual periods, and interim periods within those annual periods,beginning after December 15, 2017, which will be our fiscal year beginning February 1, 2018 (fiscal 2019). Early adoption ispermitted. The Company will adopt this guidance in the first quarter of fiscal 2019. The adoption of this amendment is not expectedto have a material impact on our results of operations or disclosures.
Copyright © 2018 www.secdatabase.com. All Rights Reserved.Please Consider the Environment Before Printing This Document
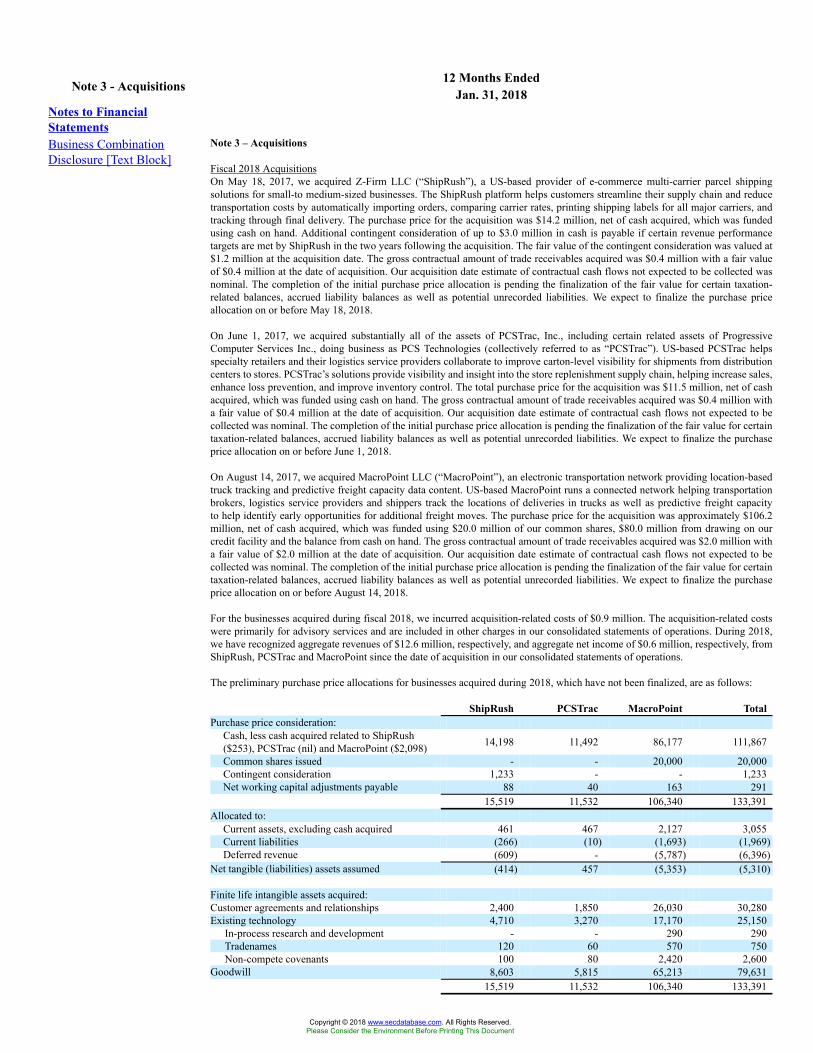
12 Months EndedNote 3 - Acquisitions Jan. 31, 2018Notes to FinancialStatementsBusiness CombinationDisclosure [Text Block]
Note 3 – Acquisitions
Fiscal 2018 AcquisitionsOn May 18, 2017, we acquired Z-Firm LLC (“ShipRush”), a US-based provider of e-commerce multi-carrier parcel shippingsolutions for small-to medium-sized businesses. The ShipRush platform helps customers streamline their supply chain and reducetransportation costs by automatically importing orders, comparing carrier rates, printing shipping labels for all major carriers, andtracking through final delivery. The purchase price for the acquisition was $14.2 million, net of cash acquired, which was fundedusing cash on hand. Additional contingent consideration of up to $3.0 million in cash is payable if certain revenue performancetargets are met by ShipRush in the two years following the acquisition. The fair value of the contingent consideration was valued at$1.2 million at the acquisition date. The gross contractual amount of trade receivables acquired was $0.4 million with a fair valueof $0.4 million at the date of acquisition. Our acquisition date estimate of contractual cash flows not expected to be collected wasnominal. The completion of the initial purchase price allocation is pending the finalization of the fair value for certain taxation-related balances, accrued liability balances as well as potential unrecorded liabilities. We expect to finalize the purchase priceallocation on or before May 18, 2018.
On June 1, 2017, we acquired substantially all of the assets of PCSTrac, Inc., including certain related assets of ProgressiveComputer Services Inc., doing business as PCS Technologies (collectively referred to as “PCSTrac”). US-based PCSTrac helpsspecialty retailers and their logistics service providers collaborate to improve carton-level visibility for shipments from distributioncenters to stores. PCSTrac’s solutions provide visibility and insight into the store replenishment supply chain, helping increase sales,enhance loss prevention, and improve inventory control. The total purchase price for the acquisition was $11.5 million, net of cashacquired, which was funded using cash on hand. The gross contractual amount of trade receivables acquired was $0.4 million witha fair value of $0.4 million at the date of acquisition. Our acquisition date estimate of contractual cash flows not expected to becollected was nominal. The completion of the initial purchase price allocation is pending the finalization of the fair value for certaintaxation-related balances, accrued liability balances as well as potential unrecorded liabilities. We expect to finalize the purchaseprice allocation on or before June 1, 2018.
On August 14, 2017, we acquired MacroPoint LLC (“MacroPoint”), an electronic transportation network providing location-basedtruck tracking and predictive freight capacity data content. US-based MacroPoint runs a connected network helping transportationbrokers, logistics service providers and shippers track the locations of deliveries in trucks as well as predictive freight capacityto help identify early opportunities for additional freight moves. The purchase price for the acquisition was approximately $106.2million, net of cash acquired, which was funded using $20.0 million of our common shares, $80.0 million from drawing on ourcredit facility and the balance from cash on hand. The gross contractual amount of trade receivables acquired was $2.0 million witha fair value of $2.0 million at the date of acquisition. Our acquisition date estimate of contractual cash flows not expected to becollected was nominal. The completion of the initial purchase price allocation is pending the finalization of the fair value for certaintaxation-related balances, accrued liability balances as well as potential unrecorded liabilities. We expect to finalize the purchaseprice allocation on or before August 14, 2018.
For the businesses acquired during fiscal 2018, we incurred acquisition-related costs of $0.9 million. The acquisition-related costswere primarily for advisory services and are included in other charges in our consolidated statements of operations. During 2018,we have recognized aggregate revenues of $12.6 million, respectively, and aggregate net income of $0.6 million, respectively, fromShipRush, PCSTrac and MacroPoint since the date of acquisition in our consolidated statements of operations.
The preliminary purchase price allocations for businesses acquired during 2018, which have not been finalized, are as follows:
ShipRush PCSTrac MacroPoint TotalPurchase price consideration:
Cash, less cash acquired related to ShipRush($253), PCSTrac (nil) and MacroPoint ($2,098) 14,198 11,492 86,177 111,867
Common shares issued - - 20,000 20,000Contingent consideration 1,233 - - 1,233Net working capital adjustments payable 88 40 163 291
15,519 11,532 106,340 133,391Allocated to:
Current assets, excluding cash acquired 461 467 2,127 3,055Current liabilities (266) (10) (1,693) (1,969)Deferred revenue (609) - (5,787) (6,396)
Net tangible (liabilities) assets assumed (414) 457 (5,353) (5,310)
Finite life intangible assets acquired:Customer agreements and relationships 2,400 1,850 26,030 30,280Existing technology 4,710 3,270 17,170 25,150
In-process research and development - - 290 290Tradenames 120 60 570 750Non-compete covenants 100 80 2,420 2,600
Goodwill 8,603 5,815 65,213 79,63115,519 11,532 106,340 133,391
Copyright © 2018 www.secdatabase.com. All Rights Reserved.Please Consider the Environment Before Printing This Document
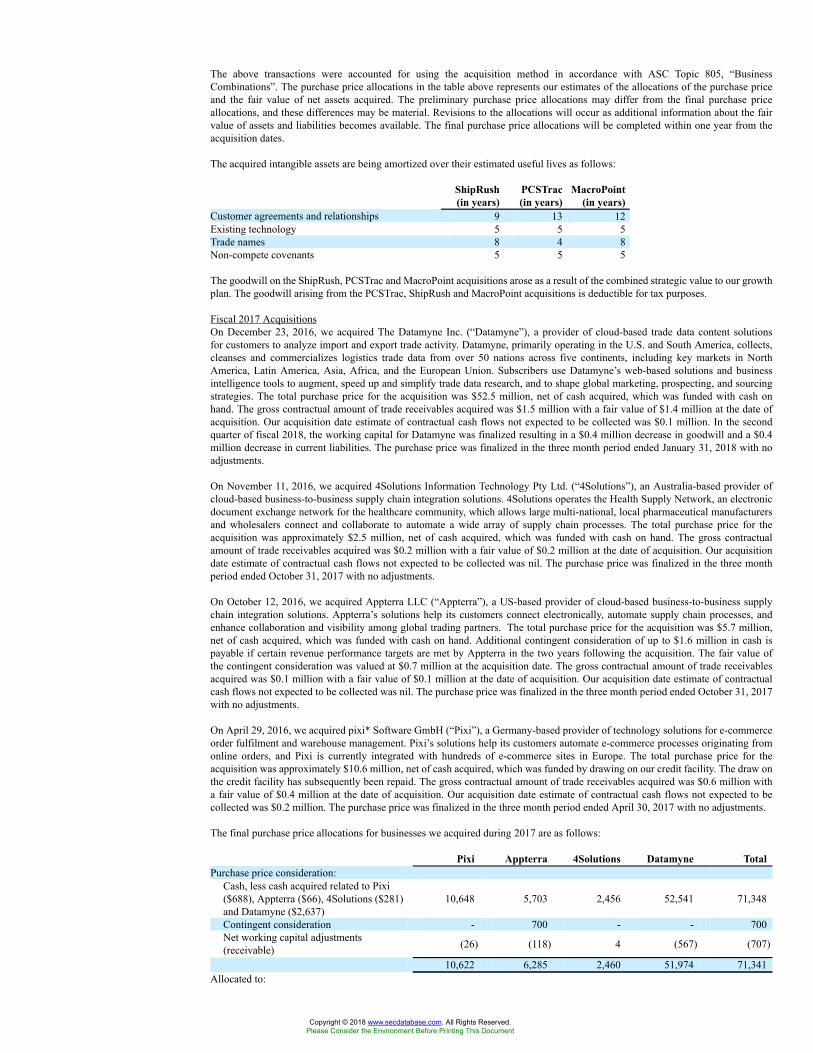
The above transactions were accounted for using the acquisition method in accordance with ASC Topic 805, “BusinessCombinations”. The purchase price allocations in the table above represents our estimates of the allocations of the purchase priceand the fair value of net assets acquired. The preliminary purchase price allocations may differ from the final purchase priceallocations, and these differences may be material. Revisions to the allocations will occur as additional information about the fairvalue of assets and liabilities becomes available. The final purchase price allocations will be completed within one year from theacquisition dates.
The acquired intangible assets are being amortized over their estimated useful lives as follows:
ShipRush(in years)
PCSTrac(in years)
MacroPoint(in years)
Customer agreements and relationships 9 13 12Existing technology 5 5 5Trade names 8 4 8Non-compete covenants 5 5 5
The goodwill on the ShipRush, PCSTrac and MacroPoint acquisitions arose as a result of the combined strategic value to our growthplan. The goodwill arising from the PCSTrac, ShipRush and MacroPoint acquisitions is deductible for tax purposes.
Fiscal 2017 AcquisitionsOn December 23, 2016, we acquired The Datamyne Inc. (“Datamyne”), a provider of cloud-based trade data content solutionsfor customers to analyze import and export trade activity. Datamyne, primarily operating in the U.S. and South America, collects,cleanses and commercializes logistics trade data from over 50 nations across five continents, including key markets in NorthAmerica, Latin America, Asia, Africa, and the European Union. Subscribers use Datamyne’s web-based solutions and businessintelligence tools to augment, speed up and simplify trade data research, and to shape global marketing, prospecting, and sourcingstrategies. The total purchase price for the acquisition was $52.5 million, net of cash acquired, which was funded with cash onhand. The gross contractual amount of trade receivables acquired was $1.5 million with a fair value of $1.4 million at the date ofacquisition. Our acquisition date estimate of contractual cash flows not expected to be collected was $0.1 million. In the secondquarter of fiscal 2018, the working capital for Datamyne was finalized resulting in a $0.4 million decrease in goodwill and a $0.4million decrease in current liabilities. The purchase price was finalized in the three month period ended January 31, 2018 with noadjustments.
On November 11, 2016, we acquired 4Solutions Information Technology Pty Ltd. (“4Solutions”), an Australia-based provider ofcloud-based business-to-business supply chain integration solutions. 4Solutions operates the Health Supply Network, an electronicdocument exchange network for the healthcare community, which allows large multi-national, local pharmaceutical manufacturersand wholesalers connect and collaborate to automate a wide array of supply chain processes. The total purchase price for theacquisition was approximately $2.5 million, net of cash acquired, which was funded with cash on hand. The gross contractualamount of trade receivables acquired was $0.2 million with a fair value of $0.2 million at the date of acquisition. Our acquisitiondate estimate of contractual cash flows not expected to be collected was nil. The purchase price was finalized in the three monthperiod ended October 31, 2017 with no adjustments.
On October 12, 2016, we acquired Appterra LLC (“Appterra”), a US-based provider of cloud-based business-to-business supplychain integration solutions. Appterra’s solutions help its customers connect electronically, automate supply chain processes, andenhance collaboration and visibility among global trading partners. The total purchase price for the acquisition was $5.7 million,net of cash acquired, which was funded with cash on hand. Additional contingent consideration of up to $1.6 million in cash ispayable if certain revenue performance targets are met by Appterra in the two years following the acquisition. The fair value ofthe contingent consideration was valued at $0.7 million at the acquisition date. The gross contractual amount of trade receivablesacquired was $0.1 million with a fair value of $0.1 million at the date of acquisition. Our acquisition date estimate of contractualcash flows not expected to be collected was nil. The purchase price was finalized in the three month period ended October 31, 2017with no adjustments.
On April 29, 2016, we acquired pixi* Software GmbH (“Pixi”), a Germany-based provider of technology solutions for e-commerceorder fulfilment and warehouse management. Pixi’s solutions help its customers automate e-commerce processes originating fromonline orders, and Pixi is currently integrated with hundreds of e-commerce sites in Europe. The total purchase price for theacquisition was approximately $10.6 million, net of cash acquired, which was funded by drawing on our credit facility. The draw onthe credit facility has subsequently been repaid. The gross contractual amount of trade receivables acquired was $0.6 million witha fair value of $0.4 million at the date of acquisition. Our acquisition date estimate of contractual cash flows not expected to becollected was $0.2 million. The purchase price was finalized in the three month period ended April 30, 2017 with no adjustments.
The final purchase price allocations for businesses we acquired during 2017 are as follows:
Pixi Appterra 4Solutions Datamyne TotalPurchase price consideration:
Cash, less cash acquired related to Pixi($688), Appterra ($66), 4Solutions ($281)and Datamyne ($2,637)
10,648 5,703 2,456 52,541 71,348
Contingent consideration - 700 - - 700Net working capital adjustments(receivable) (26) (118) 4 (567) (707)
10,622 6,285 2,460 51,974 71,341Allocated to:
Copyright © 2018 www.secdatabase.com. All Rights Reserved.Please Consider the Environment Before Printing This Document
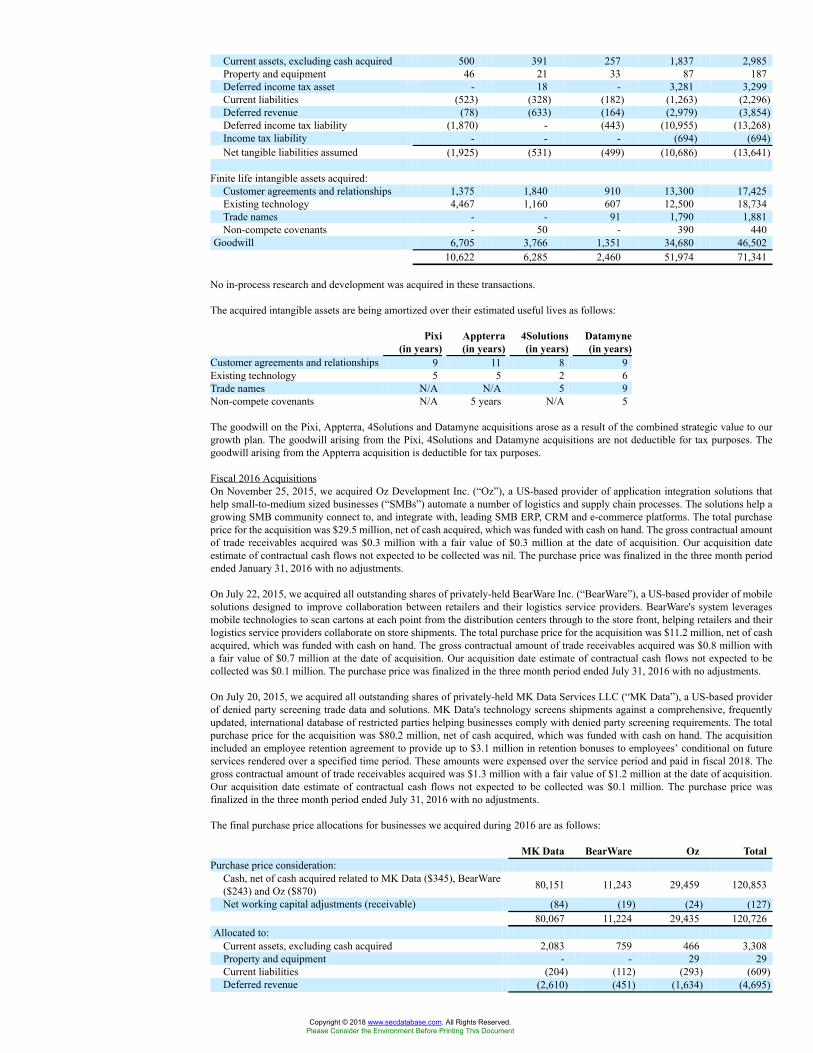
Current assets, excluding cash acquired 500 391 257 1,837 2,985Property and equipment 46 21 33 87 187Deferred income tax asset - 18 - 3,281 3,299Current liabilities (523) (328) (182) (1,263) (2,296)Deferred revenue (78) (633) (164) (2,979) (3,854)Deferred income tax liability (1,870) - (443) (10,955) (13,268)Income tax liability - - - (694) (694)Net tangible liabilities assumed (1,925) (531) (499) (10,686) (13,641)
Finite life intangible assets acquired:Customer agreements and relationships 1,375 1,840 910 13,300 17,425Existing technology 4,467 1,160 607 12,500 18,734Trade names - - 91 1,790 1,881Non-compete covenants - 50 - 390 440
Goodwill 6,705 3,766 1,351 34,680 46,50210,622 6,285 2,460 51,974 71,341
No in-process research and development was acquired in these transactions.
The acquired intangible assets are being amortized over their estimated useful lives as follows:
Pixi(in years)
Appterra(in years)
4Solutions(in years)
Datamyne(in years)
Customer agreements and relationships 9 11 8 9Existing technology 5 5 2 6Trade names N/A N/A 5 9Non-compete covenants N/A 5 years N/A 5
The goodwill on the Pixi, Appterra, 4Solutions and Datamyne acquisitions arose as a result of the combined strategic value to ourgrowth plan. The goodwill arising from the Pixi, 4Solutions and Datamyne acquisitions are not deductible for tax purposes. Thegoodwill arising from the Appterra acquisition is deductible for tax purposes.
Fiscal 2016 AcquisitionsOn November 25, 2015, we acquired Oz Development Inc. (“Oz”), a US-based provider of application integration solutions thathelp small-to-medium sized businesses (“SMBs”) automate a number of logistics and supply chain processes. The solutions help agrowing SMB community connect to, and integrate with, leading SMB ERP, CRM and e-commerce platforms. The total purchaseprice for the acquisition was $29.5 million, net of cash acquired, which was funded with cash on hand. The gross contractual amountof trade receivables acquired was $0.3 million with a fair value of $0.3 million at the date of acquisition. Our acquisition dateestimate of contractual cash flows not expected to be collected was nil. The purchase price was finalized in the three month periodended January 31, 2016 with no adjustments.
On July 22, 2015, we acquired all outstanding shares of privately-held BearWare Inc. (“BearWare”), a US-based provider of mobilesolutions designed to improve collaboration between retailers and their logistics service providers. BearWare's system leveragesmobile technologies to scan cartons at each point from the distribution centers through to the store front, helping retailers and theirlogistics service providers collaborate on store shipments. The total purchase price for the acquisition was $11.2 million, net of cashacquired, which was funded with cash on hand. The gross contractual amount of trade receivables acquired was $0.8 million witha fair value of $0.7 million at the date of acquisition. Our acquisition date estimate of contractual cash flows not expected to becollected was $0.1 million. The purchase price was finalized in the three month period ended July 31, 2016 with no adjustments.
On July 20, 2015, we acquired all outstanding shares of privately-held MK Data Services LLC (“MK Data”), a US-based providerof denied party screening trade data and solutions. MK Data's technology screens shipments against a comprehensive, frequentlyupdated, international database of restricted parties helping businesses comply with denied party screening requirements. The totalpurchase price for the acquisition was $80.2 million, net of cash acquired, which was funded with cash on hand. The acquisitionincluded an employee retention agreement to provide up to $3.1 million in retention bonuses to employees’ conditional on futureservices rendered over a specified time period. These amounts were expensed over the service period and paid in fiscal 2018. Thegross contractual amount of trade receivables acquired was $1.3 million with a fair value of $1.2 million at the date of acquisition.Our acquisition date estimate of contractual cash flows not expected to be collected was $0.1 million. The purchase price wasfinalized in the three month period ended July 31, 2016 with no adjustments.
The final purchase price allocations for businesses we acquired during 2016 are as follows:
MK Data BearWare Oz TotalPurchase price consideration:
Cash, net of cash acquired related to MK Data ($345), BearWare($243) and Oz ($870) 80,151 11,243 29,459 120,853
Net working capital adjustments (receivable) (84) (19) (24) (127)80,067 11,224 29,435 120,726
Allocated to:Current assets, excluding cash acquired 2,083 759 466 3,308Property and equipment - - 29 29Current liabilities (204) (112) (293) (609)Deferred revenue (2,610) (451) (1,634) (4,695)
Copyright © 2018 www.secdatabase.com. All Rights Reserved.Please Consider the Environment Before Printing This Document
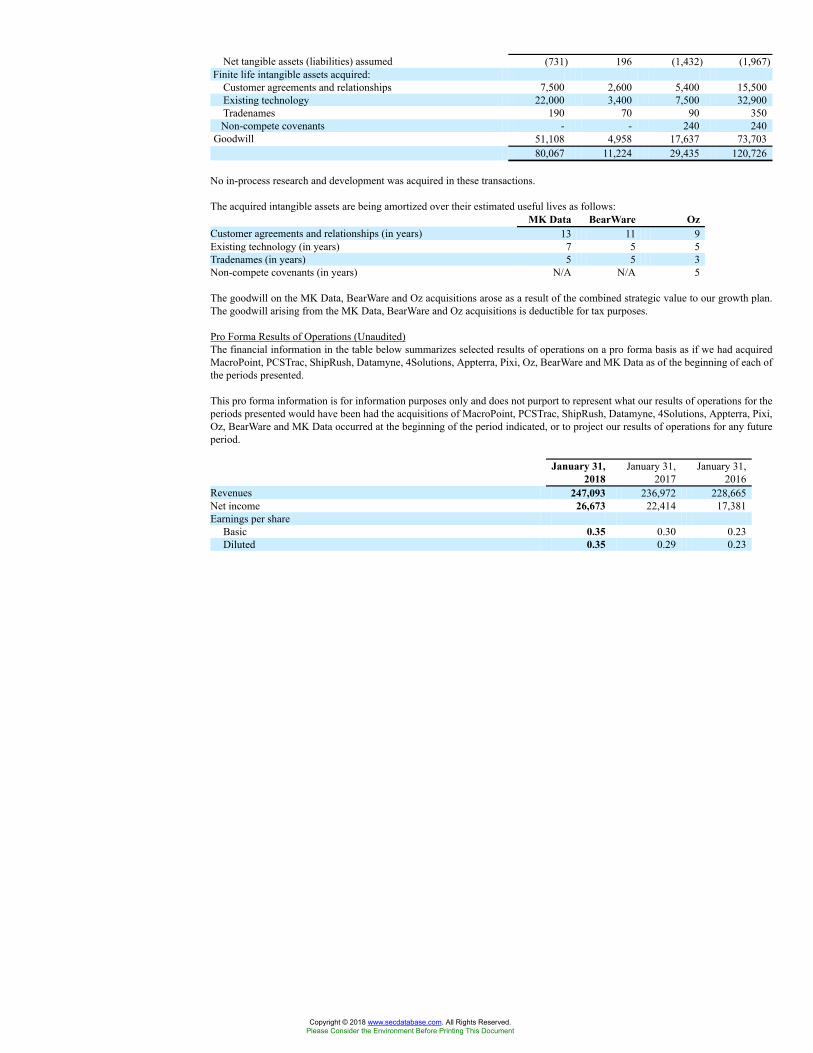
Net tangible assets (liabilities) assumed (731) 196 (1,432) (1,967)Finite life intangible assets acquired:
Customer agreements and relationships 7,500 2,600 5,400 15,500Existing technology 22,000 3,400 7,500 32,900Tradenames 190 70 90 350Non-compete covenants - - 240 240
Goodwill 51,108 4,958 17,637 73,70380,067 11,224 29,435 120,726
No in-process research and development was acquired in these transactions.
The acquired intangible assets are being amortized over their estimated useful lives as follows:MK Data BearWare Oz
Customer agreements and relationships (in years) 13 11 9Existing technology (in years) 7 5 5Tradenames (in years) 5 5 3Non-compete covenants (in years) N/A N/A 5
The goodwill on the MK Data, BearWare and Oz acquisitions arose as a result of the combined strategic value to our growth plan.The goodwill arising from the MK Data, BearWare and Oz acquisitions is deductible for tax purposes.
Pro Forma Results of Operations (Unaudited)The financial information in the table below summarizes selected results of operations on a pro forma basis as if we had acquiredMacroPoint, PCSTrac, ShipRush, Datamyne, 4Solutions, Appterra, Pixi, Oz, BearWare and MK Data as of the beginning of each ofthe periods presented.
This pro forma information is for information purposes only and does not purport to represent what our results of operations for theperiods presented would have been had the acquisitions of MacroPoint, PCSTrac, ShipRush, Datamyne, 4Solutions, Appterra, Pixi,Oz, BearWare and MK Data occurred at the beginning of the period indicated, or to project our results of operations for any futureperiod.
January 31,2018
January 31,2017
January 31,2016
Revenues 247,093 236,972 228,665Net income 26,673 22,414 17,381Earnings per share
Basic 0.35 0.30 0.23Diluted 0.35 0.29 0.23
Copyright © 2018 www.secdatabase.com. All Rights Reserved.Please Consider the Environment Before Printing This Document
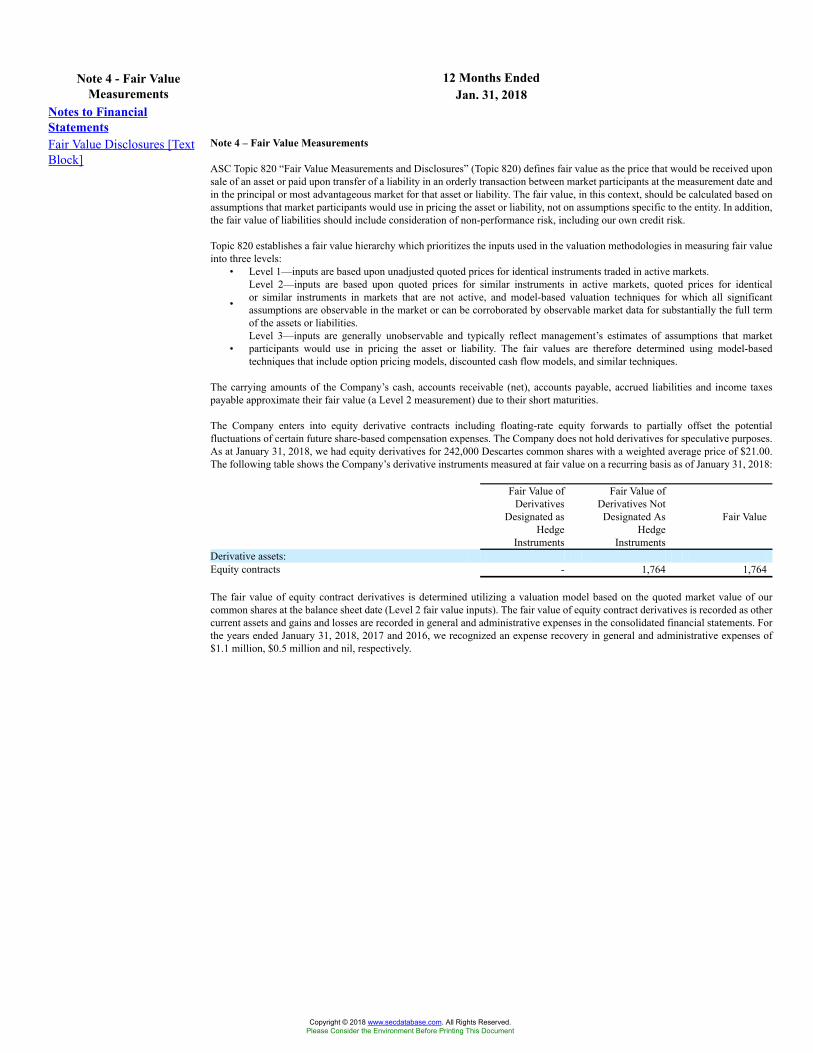
12 Months EndedNote 4 - Fair ValueMeasurements Jan. 31, 2018
Notes to FinancialStatementsFair Value Disclosures [TextBlock]
Note 4 – Fair Value Measurements
ASC Topic 820 “Fair Value Measurements and Disclosures” (Topic 820) defines fair value as the price that would be received uponsale of an asset or paid upon transfer of a liability in an orderly transaction between market participants at the measurement date andin the principal or most advantageous market for that asset or liability. The fair value, in this context, should be calculated based onassumptions that market participants would use in pricing the asset or liability, not on assumptions specific to the entity. In addition,the fair value of liabilities should include consideration of non-performance risk, including our own credit risk.
Topic 820 establishes a fair value hierarchy which prioritizes the inputs used in the valuation methodologies in measuring fair valueinto three levels:
• Level 1—inputs are based upon unadjusted quoted prices for identical instruments traded in active markets.
•
Level 2—inputs are based upon quoted prices for similar instruments in active markets, quoted prices for identicalor similar instruments in markets that are not active, and model-based valuation techniques for which all significantassumptions are observable in the market or can be corroborated by observable market data for substantially the full termof the assets or liabilities.
•Level 3—inputs are generally unobservable and typically reflect management’s estimates of assumptions that marketparticipants would use in pricing the asset or liability. The fair values are therefore determined using model-basedtechniques that include option pricing models, discounted cash flow models, and similar techniques.
The carrying amounts of the Company’s cash, accounts receivable (net), accounts payable, accrued liabilities and income taxespayable approximate their fair value (a Level 2 measurement) due to their short maturities.
The Company enters into equity derivative contracts including floating-rate equity forwards to partially offset the potentialfluctuations of certain future share-based compensation expenses. The Company does not hold derivatives for speculative purposes.As at January 31, 2018, we had equity derivatives for 242,000 Descartes common shares with a weighted average price of $21.00.The following table shows the Company’s derivative instruments measured at fair value on a recurring basis as of January 31, 2018:
Fair Value ofDerivatives
Designated asHedge
Instruments
Fair Value ofDerivatives NotDesignated As
HedgeInstruments
Fair Value
Derivative assets:Equity contracts - 1,764 1,764
The fair value of equity contract derivatives is determined utilizing a valuation model based on the quoted market value of ourcommon shares at the balance sheet date (Level 2 fair value inputs). The fair value of equity contract derivatives is recorded as othercurrent assets and gains and losses are recorded in general and administrative expenses in the consolidated financial statements. Forthe years ended January 31, 2018, 2017 and 2016, we recognized an expense recovery in general and administrative expenses of$1.1 million, $0.5 million and nil, respectively.
Copyright © 2018 www.secdatabase.com. All Rights Reserved.Please Consider the Environment Before Printing This Document
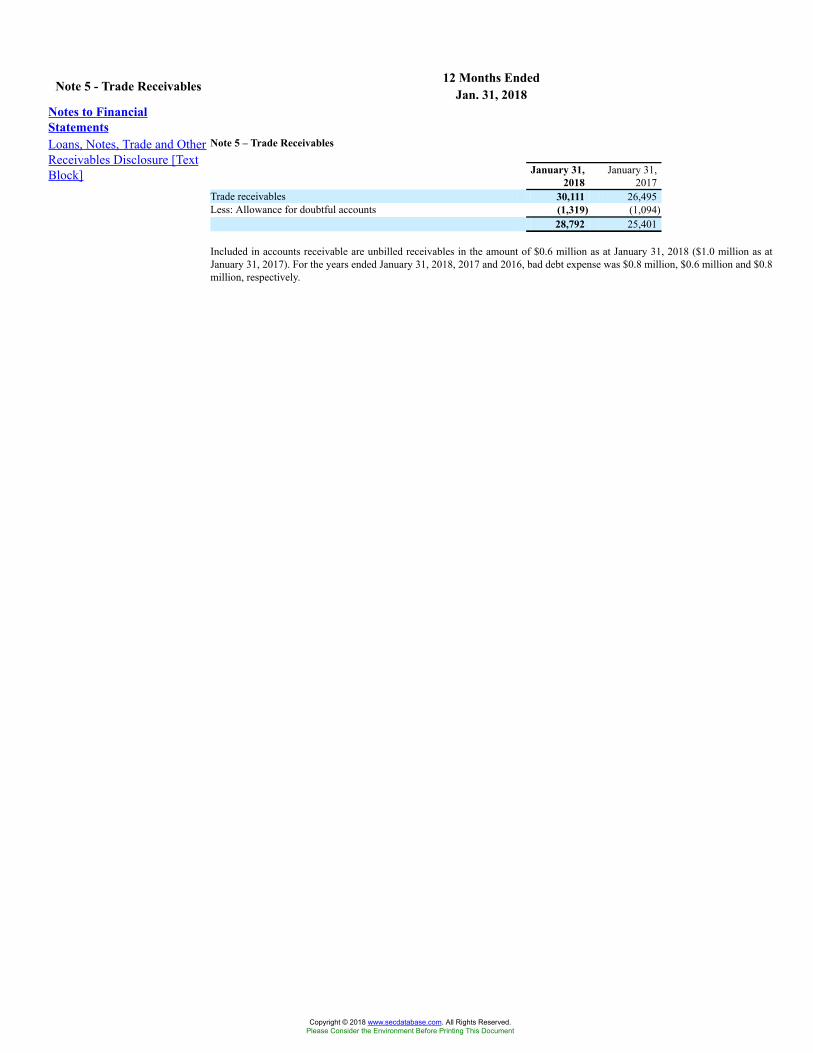
12 Months EndedNote 5 - Trade Receivables Jan. 31, 2018Notes to FinancialStatementsLoans, Notes, Trade and OtherReceivables Disclosure [TextBlock]
Note 5 – Trade Receivables
January 31,2018
January 31,2017
Trade receivables 30,111 26,495Less: Allowance for doubtful accounts (1,319) (1,094)
28,792 25,401
Included in accounts receivable are unbilled receivables in the amount of $0.6 million as at January 31, 2018 ($1.0 million as atJanuary 31, 2017). For the years ended January 31, 2018, 2017 and 2016, bad debt expense was $0.8 million, $0.6 million and $0.8million, respectively.
Copyright © 2018 www.secdatabase.com. All Rights Reserved.Please Consider the Environment Before Printing This Document
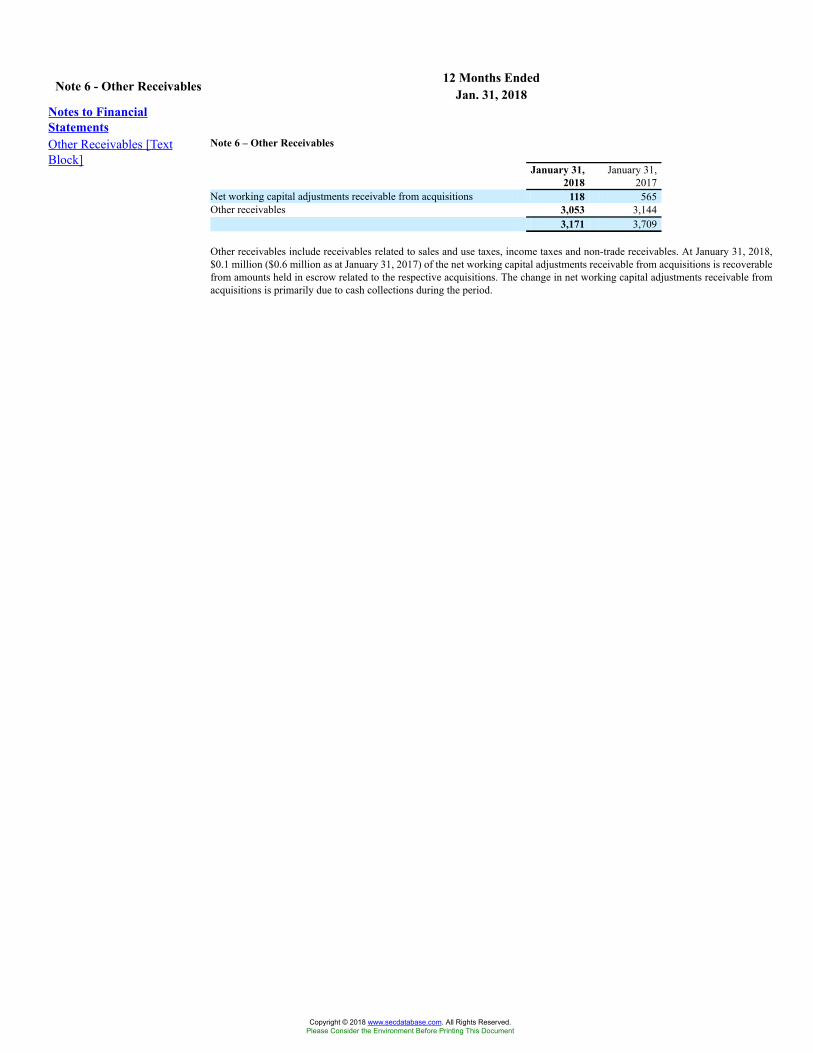
12 Months EndedNote 6 - Other Receivables Jan. 31, 2018Notes to FinancialStatementsOther Receivables [TextBlock]
Note 6 – Other Receivables
January 31,2018
January 31,2017
Net working capital adjustments receivable from acquisitions 118 565Other receivables 3,053 3,144
3,171 3,709
Other receivables include receivables related to sales and use taxes, income taxes and non-trade receivables. At January 31, 2018,$0.1 million ($0.6 million as at January 31, 2017) of the net working capital adjustments receivable from acquisitions is recoverablefrom amounts held in escrow related to the respective acquisitions. The change in net working capital adjustments receivable fromacquisitions is primarily due to cash collections during the period.
Copyright © 2018 www.secdatabase.com. All Rights Reserved.Please Consider the Environment Before Printing This Document
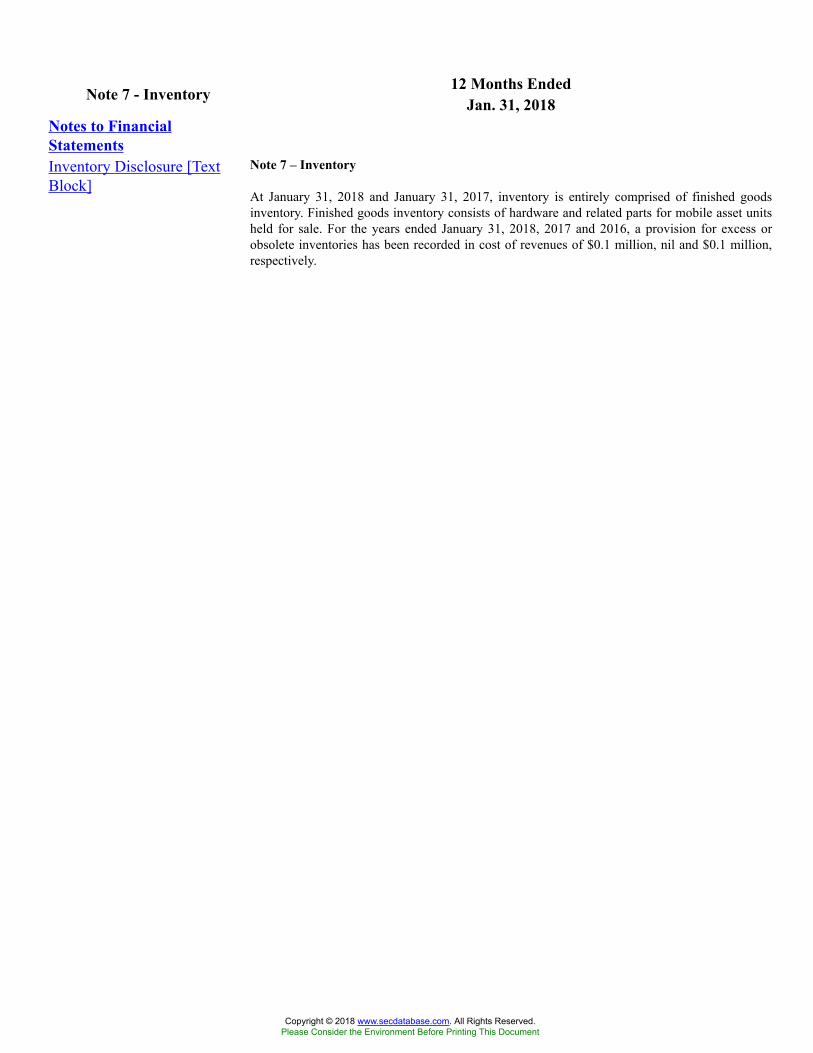
12 Months EndedNote 7 - Inventory Jan. 31, 2018Notes to FinancialStatementsInventory Disclosure [TextBlock]
Note 7 – Inventory
At January 31, 2018 and January 31, 2017, inventory is entirely comprised of finished goodsinventory. Finished goods inventory consists of hardware and related parts for mobile asset unitsheld for sale. For the years ended January 31, 2018, 2017 and 2016, a provision for excess orobsolete inventories has been recorded in cost of revenues of $0.1 million, nil and $0.1 million,respectively.
Copyright © 2018 www.secdatabase.com. All Rights Reserved.Please Consider the Environment Before Printing This Document
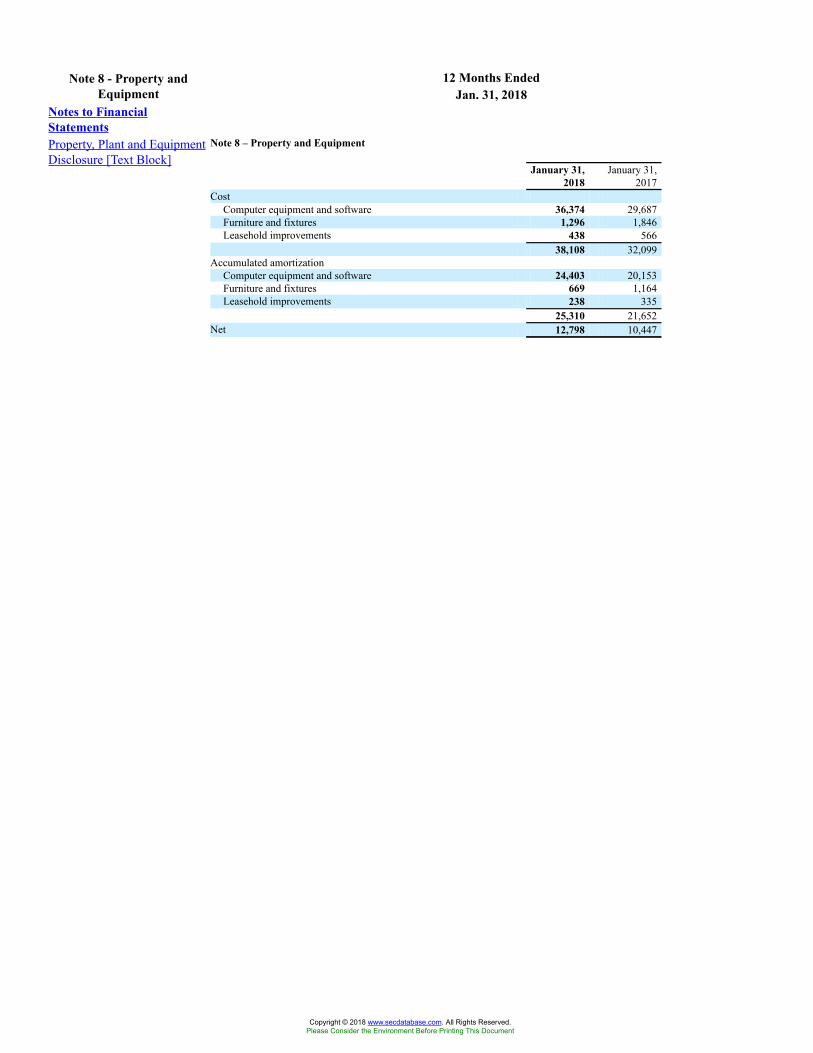
12 Months EndedNote 8 - Property andEquipment Jan. 31, 2018
Notes to FinancialStatementsProperty, Plant and EquipmentDisclosure [Text Block]
Note 8 – Property and Equipment
January 31,2018
January 31,2017
CostComputer equipment and software 36,374 29,687Furniture and fixtures 1,296 1,846Leasehold improvements 438 566
38,108 32,099Accumulated amortization
Computer equipment and software 24,403 20,153Furniture and fixtures 669 1,164Leasehold improvements 238 335
25,310 21,652Net 12,798 10,447
Copyright © 2018 www.secdatabase.com. All Rights Reserved.Please Consider the Environment Before Printing This Document
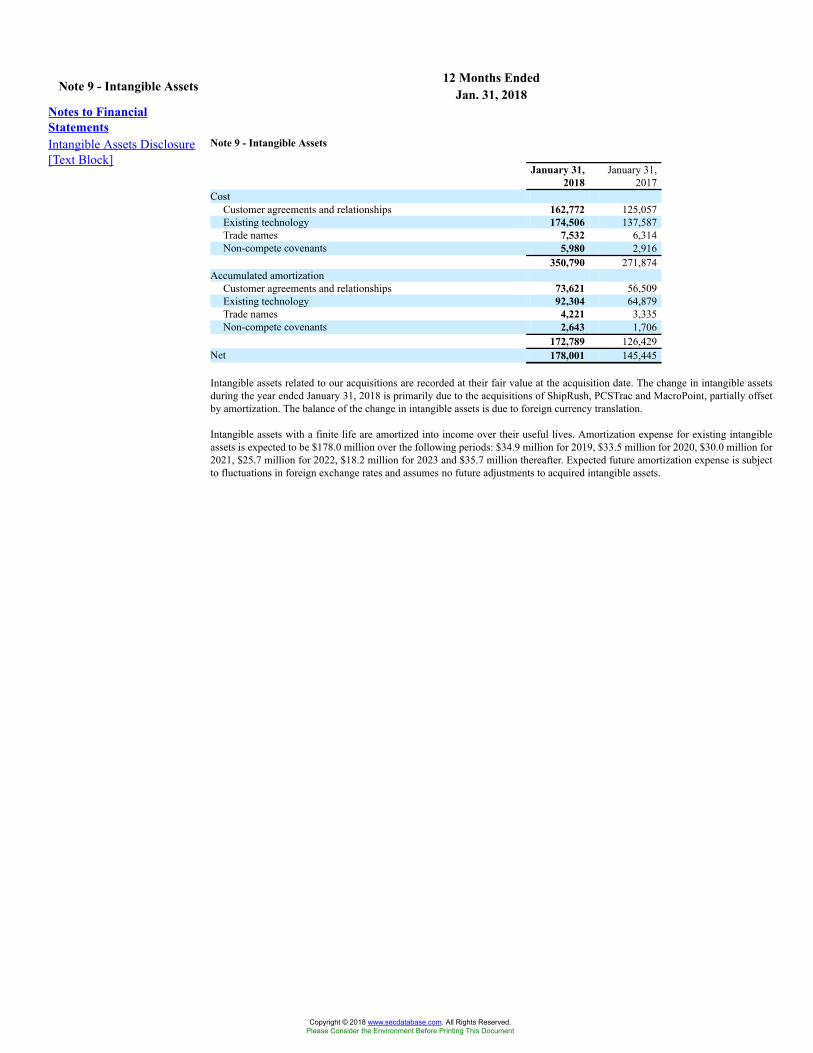
12 Months EndedNote 9 - Intangible Assets Jan. 31, 2018Notes to FinancialStatementsIntangible Assets Disclosure[Text Block]
Note 9 - Intangible Assets
January 31,2018
January 31,2017
CostCustomer agreements and relationships 162,772 125,057Existing technology 174,506 137,587Trade names 7,532 6,314Non-compete covenants 5,980 2,916
350,790 271,874Accumulated amortization
Customer agreements and relationships 73,621 56,509Existing technology 92,304 64,879Trade names 4,221 3,335Non-compete covenants 2,643 1,706
172,789 126,429Net 178,001 145,445
Intangible assets related to our acquisitions are recorded at their fair value at the acquisition date. The change in intangible assetsduring the year ended January 31, 2018 is primarily due to the acquisitions of ShipRush, PCSTrac and MacroPoint, partially offsetby amortization. The balance of the change in intangible assets is due to foreign currency translation.
Intangible assets with a finite life are amortized into income over their useful lives. Amortization expense for existing intangibleassets is expected to be $178.0 million over the following periods: $34.9 million for 2019, $33.5 million for 2020, $30.0 million for2021, $25.7 million for 2022, $18.2 million for 2023 and $35.7 million thereafter. Expected future amortization expense is subjectto fluctuations in foreign exchange rates and assumes no future adjustments to acquired intangible assets.
Copyright © 2018 www.secdatabase.com. All Rights Reserved.Please Consider the Environment Before Printing This Document
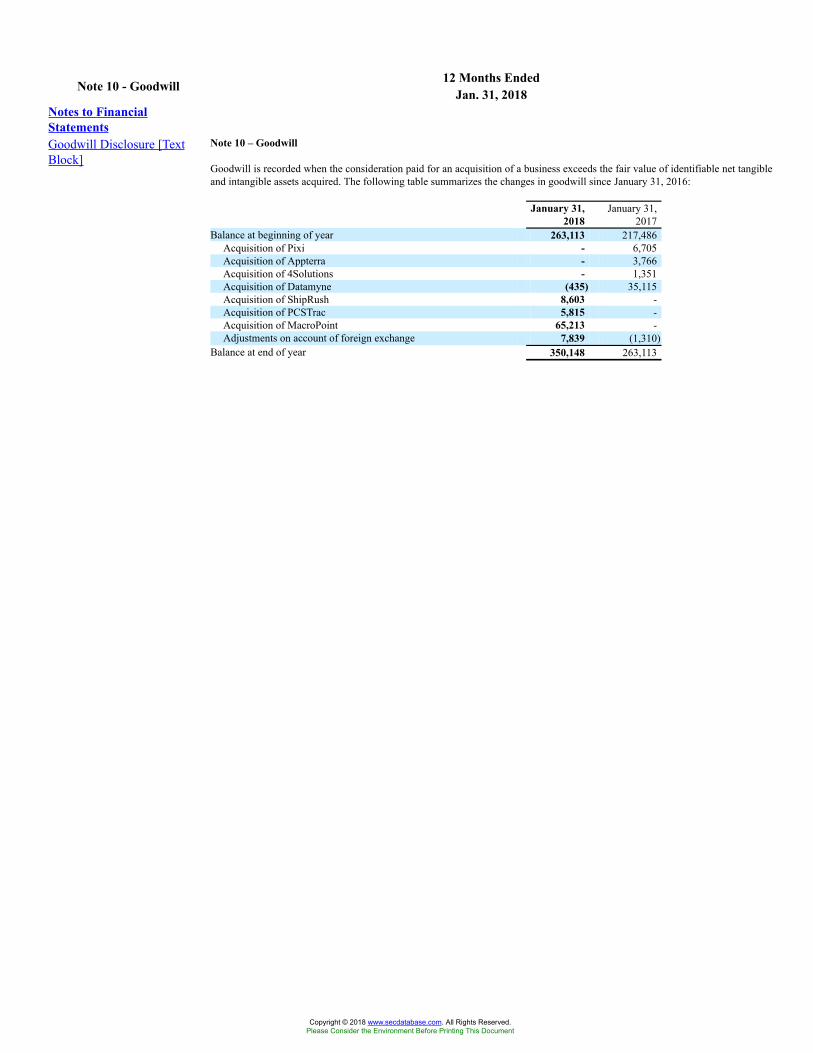
12 Months EndedNote 10 - Goodwill Jan. 31, 2018Notes to FinancialStatementsGoodwill Disclosure [TextBlock]
Note 10 – Goodwill
Goodwill is recorded when the consideration paid for an acquisition of a business exceeds the fair value of identifiable net tangibleand intangible assets acquired. The following table summarizes the changes in goodwill since January 31, 2016:
January 31,2018
January 31,2017
Balance at beginning of year 263,113 217,486Acquisition of Pixi - 6,705Acquisition of Appterra - 3,766Acquisition of 4Solutions - 1,351Acquisition of Datamyne (435) 35,115Acquisition of ShipRush 8,603 -Acquisition of PCSTrac 5,815 -Acquisition of MacroPoint 65,213 -Adjustments on account of foreign exchange 7,839 (1,310)
Balance at end of year 350,148 263,113
Copyright © 2018 www.secdatabase.com. All Rights Reserved.Please Consider the Environment Before Printing This Document
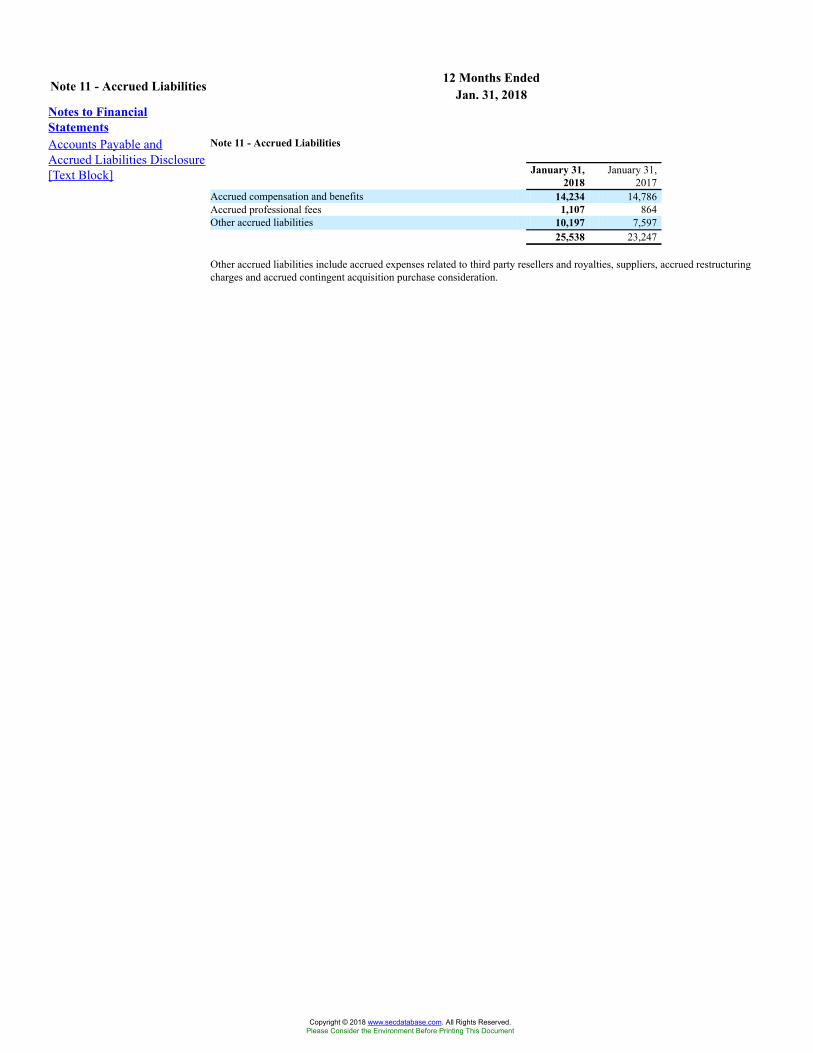
12 Months EndedNote 11 - Accrued Liabilities Jan. 31, 2018Notes to FinancialStatementsAccounts Payable andAccrued Liabilities Disclosure[Text Block]
Note 11 - Accrued Liabilities
January 31,2018
January 31,2017
Accrued compensation and benefits 14,234 14,786Accrued professional fees 1,107 864Other accrued liabilities 10,197 7,597
25,538 23,247
Other accrued liabilities include accrued expenses related to third party resellers and royalties, suppliers, accrued restructuringcharges and accrued contingent acquisition purchase consideration.
Copyright © 2018 www.secdatabase.com. All Rights Reserved.Please Consider the Environment Before Printing This Document
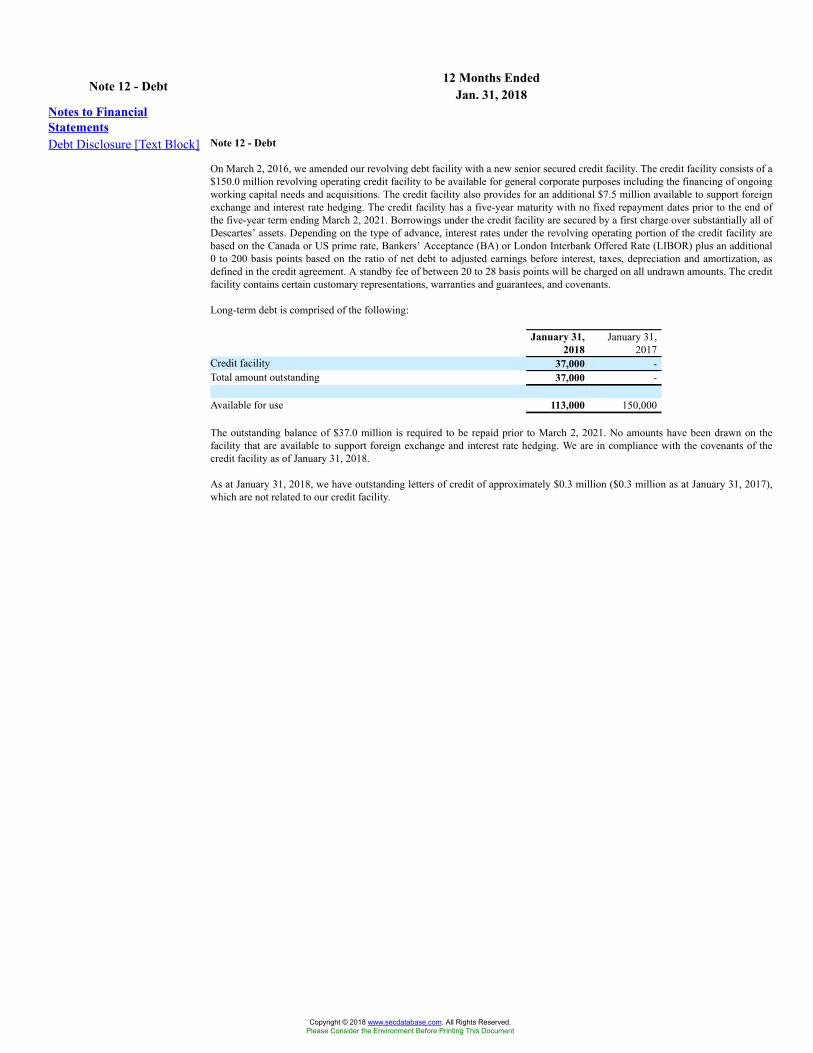
12 Months EndedNote 12 - Debt Jan. 31, 2018Notes to FinancialStatementsDebt Disclosure [Text Block] Note 12 - Debt
On March 2, 2016, we amended our revolving debt facility with a new senior secured credit facility. The credit facility consists of a$150.0 million revolving operating credit facility to be available for general corporate purposes including the financing of ongoingworking capital needs and acquisitions. The credit facility also provides for an additional $7.5 million available to support foreignexchange and interest rate hedging. The credit facility has a five-year maturity with no fixed repayment dates prior to the end ofthe five-year term ending March 2, 2021. Borrowings under the credit facility are secured by a first charge over substantially all ofDescartes’ assets. Depending on the type of advance, interest rates under the revolving operating portion of the credit facility arebased on the Canada or US prime rate, Bankers’ Acceptance (BA) or London Interbank Offered Rate (LIBOR) plus an additional0 to 200 basis points based on the ratio of net debt to adjusted earnings before interest, taxes, depreciation and amortization, asdefined in the credit agreement. A standby fee of between 20 to 28 basis points will be charged on all undrawn amounts. The creditfacility contains certain customary representations, warranties and guarantees, and covenants.
Long-term debt is comprised of the following:
January 31,2018
January 31,2017
Credit facility 37,000 -Total amount outstanding 37,000 -
Available for use 113,000 150,000
The outstanding balance of $37.0 million is required to be repaid prior to March 2, 2021. No amounts have been drawn on thefacility that are available to support foreign exchange and interest rate hedging. We are in compliance with the covenants of thecredit facility as of January 31, 2018.
As at January 31, 2018, we have outstanding letters of credit of approximately $0.3 million ($0.3 million as at January 31, 2017),which are not related to our credit facility.
Copyright © 2018 www.secdatabase.com. All Rights Reserved.Please Consider the Environment Before Printing This Document
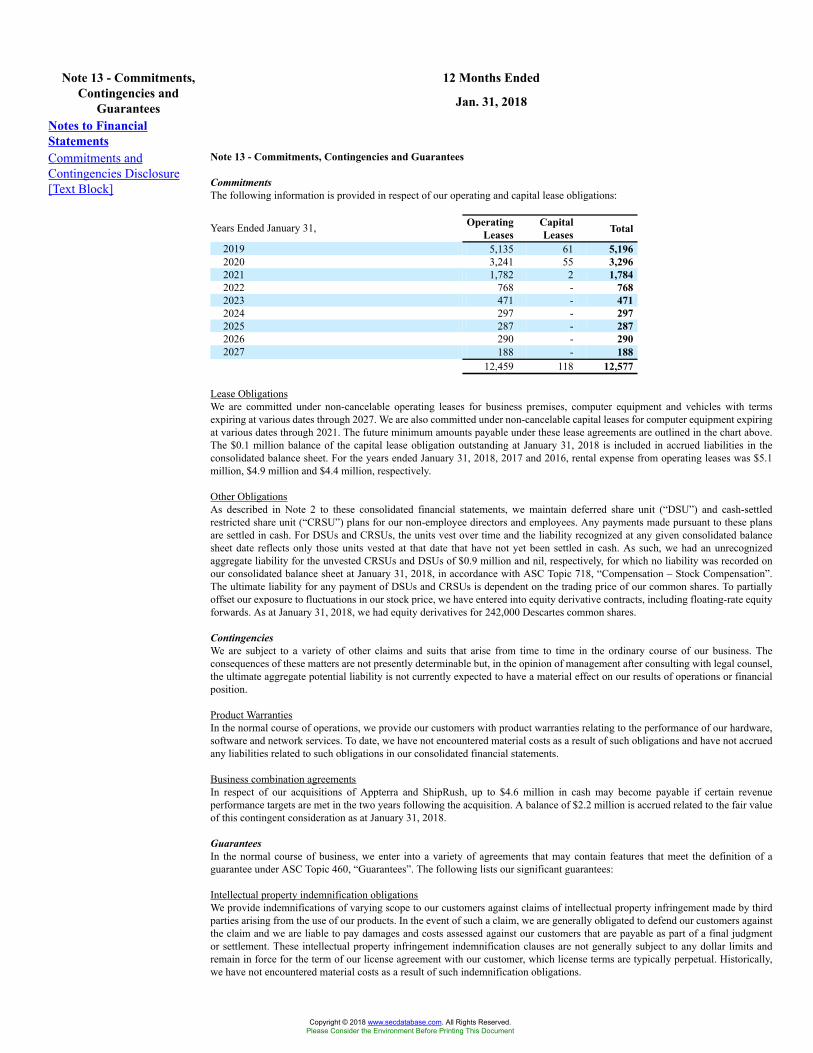
12 Months EndedNote 13 - Commitments,Contingencies and
Guarantees Jan. 31, 2018
Notes to FinancialStatementsCommitments andContingencies Disclosure[Text Block]
Note 13 - Commitments, Contingencies and Guarantees
CommitmentsThe following information is provided in respect of our operating and capital lease obligations:
Years Ended January 31, OperatingLeases
CapitalLeases Total
2019 5,135 61 5,1962020 3,241 55 3,2962021 1,782 2 1,7842022 768 - 7682023 471 - 4712024 297 - 2972025 287 - 2872026 290 - 2902027 188 - 188
12,459 118 12,577
Lease ObligationsWe are committed under non-cancelable operating leases for business premises, computer equipment and vehicles with termsexpiring at various dates through 2027. We are also committed under non-cancelable capital leases for computer equipment expiringat various dates through 2021. The future minimum amounts payable under these lease agreements are outlined in the chart above.The $0.1 million balance of the capital lease obligation outstanding at January 31, 2018 is included in accrued liabilities in theconsolidated balance sheet. For the years ended January 31, 2018, 2017 and 2016, rental expense from operating leases was $5.1million, $4.9 million and $4.4 million, respectively.
Other ObligationsAs described in Note 2 to these consolidated financial statements, we maintain deferred share unit (“DSU”) and cash-settledrestricted share unit (“CRSU”) plans for our non-employee directors and employees. Any payments made pursuant to these plansare settled in cash. For DSUs and CRSUs, the units vest over time and the liability recognized at any given consolidated balancesheet date reflects only those units vested at that date that have not yet been settled in cash. As such, we had an unrecognizedaggregate liability for the unvested CRSUs and DSUs of $0.9 million and nil, respectively, for which no liability was recorded onour consolidated balance sheet at January 31, 2018, in accordance with ASC Topic 718, “Compensation – Stock Compensation”.The ultimate liability for any payment of DSUs and CRSUs is dependent on the trading price of our common shares. To partiallyoffset our exposure to fluctuations in our stock price, we have entered into equity derivative contracts, including floating-rate equityforwards. As at January 31, 2018, we had equity derivatives for 242,000 Descartes common shares.
ContingenciesWe are subject to a variety of other claims and suits that arise from time to time in the ordinary course of our business. Theconsequences of these matters are not presently determinable but, in the opinion of management after consulting with legal counsel,the ultimate aggregate potential liability is not currently expected to have a material effect on our results of operations or financialposition.
Product WarrantiesIn the normal course of operations, we provide our customers with product warranties relating to the performance of our hardware,software and network services. To date, we have not encountered material costs as a result of such obligations and have not accruedany liabilities related to such obligations in our consolidated financial statements.
Business combination agreementsIn respect of our acquisitions of Appterra and ShipRush, up to $4.6 million in cash may become payable if certain revenueperformance targets are met in the two years following the acquisition. A balance of $2.2 million is accrued related to the fair valueof this contingent consideration as at January 31, 2018.
GuaranteesIn the normal course of business, we enter into a variety of agreements that may contain features that meet the definition of aguarantee under ASC Topic 460, “Guarantees”. The following lists our significant guarantees:
Intellectual property indemnification obligationsWe provide indemnifications of varying scope to our customers against claims of intellectual property infringement made by thirdparties arising from the use of our products. In the event of such a claim, we are generally obligated to defend our customers againstthe claim and we are liable to pay damages and costs assessed against our customers that are payable as part of a final judgmentor settlement. These intellectual property infringement indemnification clauses are not generally subject to any dollar limits andremain in force for the term of our license agreement with our customer, which license terms are typically perpetual. Historically,we have not encountered material costs as a result of such indemnification obligations.
Copyright © 2018 www.secdatabase.com. All Rights Reserved.Please Consider the Environment Before Printing This Document
Other indemnification agreementsIn the normal course of operations, we enter into various agreements that provide general indemnities. These indemnities typicallyarise in connection with purchases and sales of assets, securities offerings or buy-backs, service contracts, administration ofemployee benefit plans, retention of officers and directors, membership agreements, customer financing transactions, and leasingtransactions. In addition, our corporate by-laws provide for the indemnification of our directors and officers. Each of theseindemnities requires us, in certain circumstances, to compensate the counterparties for various costs resulting from breaches ofrepresentations or obligations under such arrangements, or as a result of third party claims that may be suffered by the counterpartyas a consequence of the transaction. We believe that the likelihood that we could incur significant liability under these obligationsis remote. Historically, we have not made any significant payments under such indemnities.
In evaluating estimated losses for the guarantees or indemnities described above, we consider such factors as the degree ofprobability of an unfavorable outcome and the ability to make a reasonable estimate of the amount of loss. We are unable to make areasonable estimate of the maximum potential amount payable under such guarantees or indemnities as many of these arrangementsdo not specify a maximum potential dollar exposure or time limitation. The amount also depends on the outcome of future eventsand conditions, which cannot be predicted. Given the foregoing, to date, we have not accrued any liability in our financial statementsfor the guarantees or indemnities described above.
Copyright © 2018 www.secdatabase.com. All Rights Reserved.Please Consider the Environment Before Printing This Document
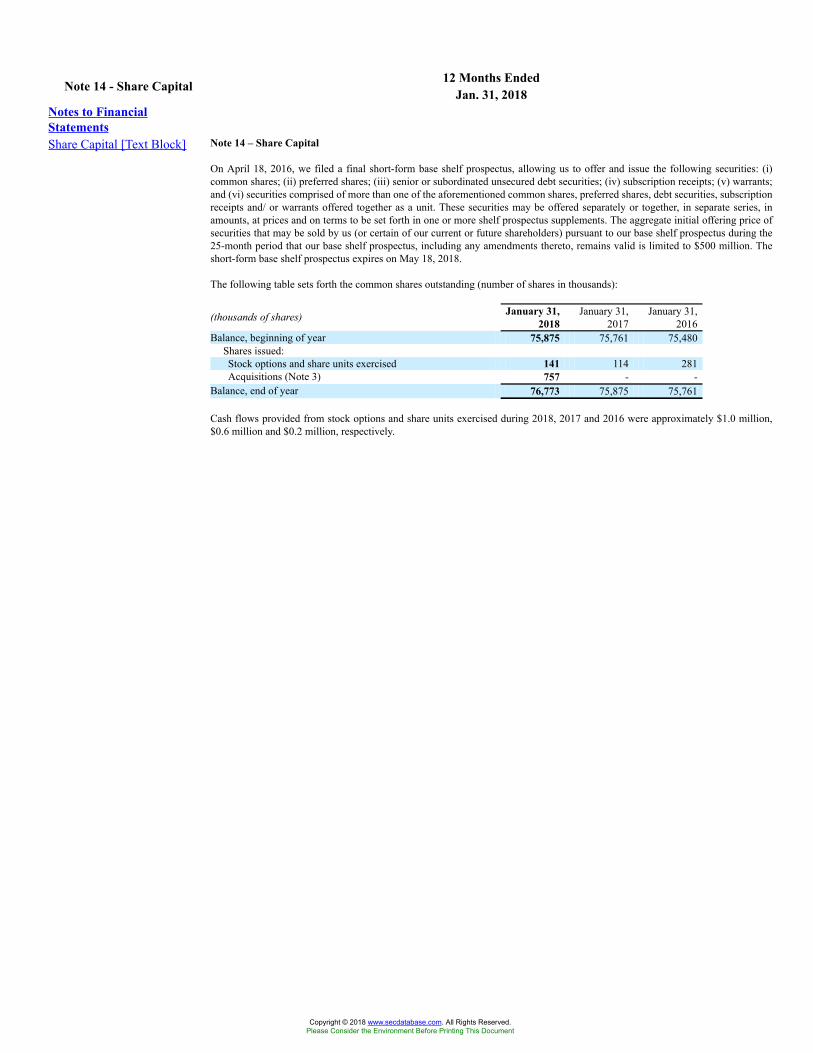
12 Months EndedNote 14 - Share Capital Jan. 31, 2018Notes to FinancialStatementsShare Capital [Text Block] Note 14 – Share Capital
On April 18, 2016, we filed a final short-form base shelf prospectus, allowing us to offer and issue the following securities: (i)common shares; (ii) preferred shares; (iii) senior or subordinated unsecured debt securities; (iv) subscription receipts; (v) warrants;and (vi) securities comprised of more than one of the aforementioned common shares, preferred shares, debt securities, subscriptionreceipts and/ or warrants offered together as a unit. These securities may be offered separately or together, in separate series, inamounts, at prices and on terms to be set forth in one or more shelf prospectus supplements. The aggregate initial offering price ofsecurities that may be sold by us (or certain of our current or future shareholders) pursuant to our base shelf prospectus during the25-month period that our base shelf prospectus, including any amendments thereto, remains valid is limited to $500 million. Theshort-form base shelf prospectus expires on May 18, 2018.
The following table sets forth the common shares outstanding (number of shares in thousands):
(thousands of shares) January 31,2018
January 31,2017
January 31,2016
Balance, beginning of year 75,875 75,761 75,480Shares issued:Stock options and share units exercised 141 114 281Acquisitions (Note 3) 757 - -
Balance, end of year 76,773 75,875 75,761
Cash flows provided from stock options and share units exercised during 2018, 2017 and 2016 were approximately $1.0 million,$0.6 million and $0.2 million, respectively.
Copyright © 2018 www.secdatabase.com. All Rights Reserved.Please Consider the Environment Before Printing This Document
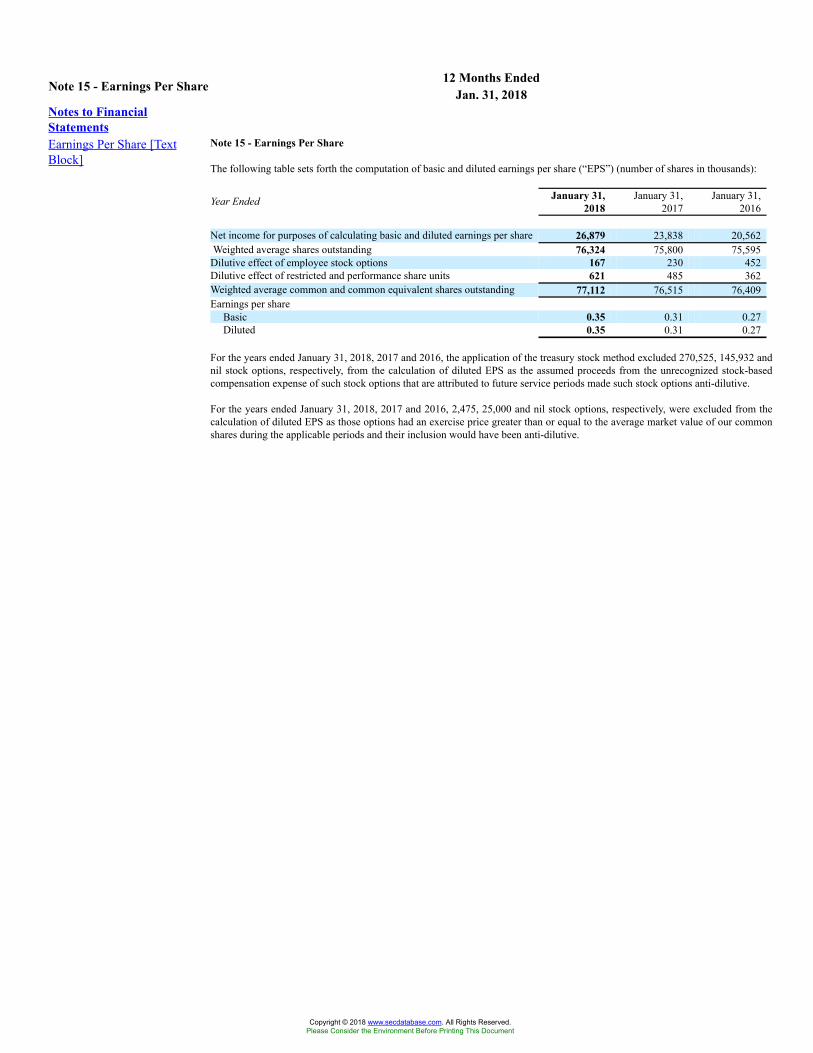
12 Months EndedNote 15 - Earnings Per Share Jan. 31, 2018Notes to FinancialStatementsEarnings Per Share [TextBlock]
Note 15 - Earnings Per Share
The following table sets forth the computation of basic and diluted earnings per share (“EPS”) (number of shares in thousands):
Year Ended January 31,2018
January 31,2017
January 31,2016
Net income for purposes of calculating basic and diluted earnings per share 26,879 23,838 20,562Weighted average shares outstanding 76,324 75,800 75,595Dilutive effect of employee stock options 167 230 452Dilutive effect of restricted and performance share units 621 485 362Weighted average common and common equivalent shares outstanding 77,112 76,515 76,409Earnings per share
Basic 0.35 0.31 0.27Diluted 0.35 0.31 0.27
For the years ended January 31, 2018, 2017 and 2016, the application of the treasury stock method excluded 270,525, 145,932 andnil stock options, respectively, from the calculation of diluted EPS as the assumed proceeds from the unrecognized stock-basedcompensation expense of such stock options that are attributed to future service periods made such stock options anti-dilutive.
For the years ended January 31, 2018, 2017 and 2016, 2,475, 25,000 and nil stock options, respectively, were excluded from thecalculation of diluted EPS as those options had an exercise price greater than or equal to the average market value of our commonshares during the applicable periods and their inclusion would have been anti-dilutive.
Copyright © 2018 www.secdatabase.com. All Rights Reserved.Please Consider the Environment Before Printing This Document
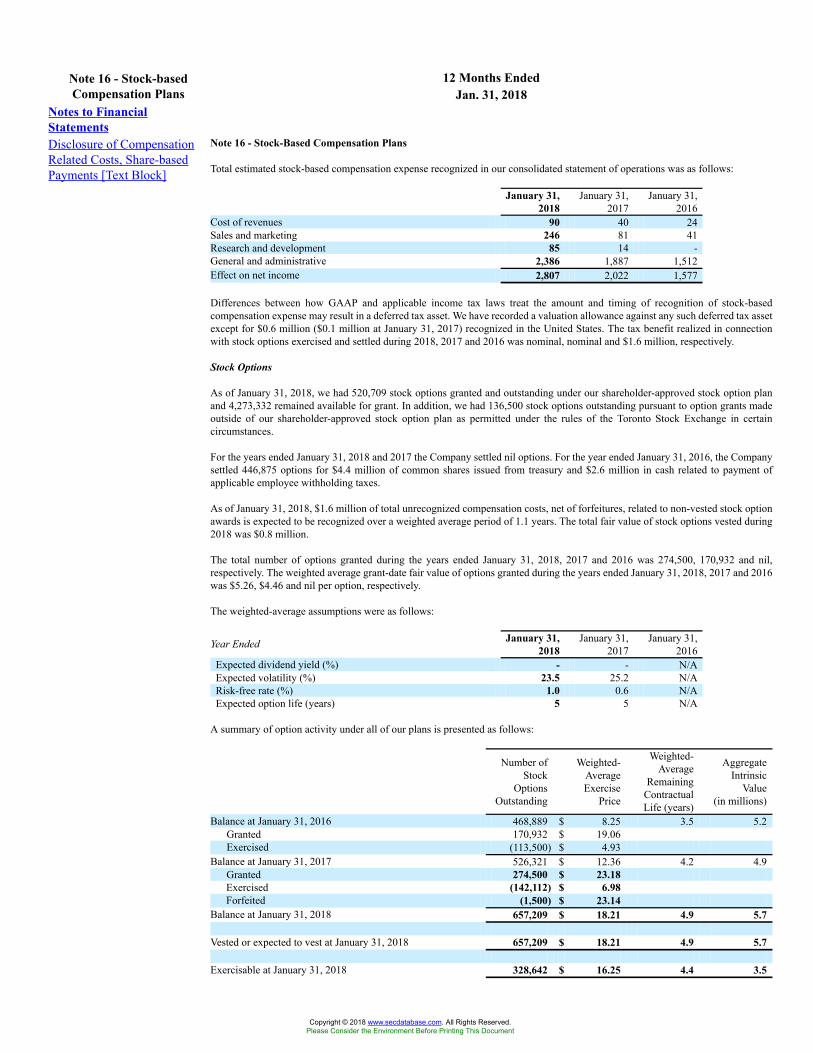
12 Months EndedNote 16 - Stock-basedCompensation Plans Jan. 31, 2018
Notes to FinancialStatementsDisclosure of CompensationRelated Costs, Share-basedPayments [Text Block]
Note 16 - Stock-Based Compensation Plans
Total estimated stock-based compensation expense recognized in our consolidated statement of operations was as follows:
January 31,2018
January 31,2017
January 31,2016
Cost of revenues 90 40 24Sales and marketing 246 81 41Research and development 85 14 -General and administrative 2,386 1,887 1,512Effect on net income 2,807 2,022 1,577
Differences between how GAAP and applicable income tax laws treat the amount and timing of recognition of stock-basedcompensation expense may result in a deferred tax asset. We have recorded a valuation allowance against any such deferred tax assetexcept for $0.6 million ($0.1 million at January 31, 2017) recognized in the United States. The tax benefit realized in connectionwith stock options exercised and settled during 2018, 2017 and 2016 was nominal, nominal and $1.6 million, respectively.
Stock Options
As of January 31, 2018, we had 520,709 stock options granted and outstanding under our shareholder-approved stock option planand 4,273,332 remained available for grant. In addition, we had 136,500 stock options outstanding pursuant to option grants madeoutside of our shareholder-approved stock option plan as permitted under the rules of the Toronto Stock Exchange in certaincircumstances.
For the years ended January 31, 2018 and 2017 the Company settled nil options. For the year ended January 31, 2016, the Companysettled 446,875 options for $4.4 million of common shares issued from treasury and $2.6 million in cash related to payment ofapplicable employee withholding taxes.
As of January 31, 2018, $1.6 million of total unrecognized compensation costs, net of forfeitures, related to non-vested stock optionawards is expected to be recognized over a weighted average period of 1.1 years. The total fair value of stock options vested during2018 was $0.8 million.
The total number of options granted during the years ended January 31, 2018, 2017 and 2016 was 274,500, 170,932 and nil,respectively. The weighted average grant-date fair value of options granted during the years ended January 31, 2018, 2017 and 2016was $5.26, $4.46 and nil per option, respectively.
The weighted-average assumptions were as follows:
Year Ended January 31,2018
January 31,2017
January 31,2016
Expected dividend yield (%) - - N/AExpected volatility (%) 23.5 25.2 N/ARisk-free rate (%) 1.0 0.6 N/AExpected option life (years) 5 5 N/A
A summary of option activity under all of our plans is presented as follows:
Number ofStock
OptionsOutstanding
Weighted-AverageExercise
Price
Weighted-Average
RemainingContractualLife (years)
AggregateIntrinsic
Value(in millions)
Balance at January 31, 2016 468,889 $ 8.25 3.5 5.2Granted 170,932 $ 19.06Exercised (113,500) $ 4.93
Balance at January 31, 2017 526,321 $ 12.36 4.2 4.9Granted 274,500 $ 23.18Exercised (142,112) $ 6.98Forfeited (1,500) $ 23.14
Balance at January 31, 2018 657,209 $ 18.21 4.9 5.7
Vested or expected to vest at January 31, 2018 657,209 $ 18.21 4.9 5.7
Exercisable at January 31, 2018 328,642 $ 16.25 4.4 3.5
Copyright © 2018 www.secdatabase.com. All Rights Reserved.Please Consider the Environment Before Printing This Document
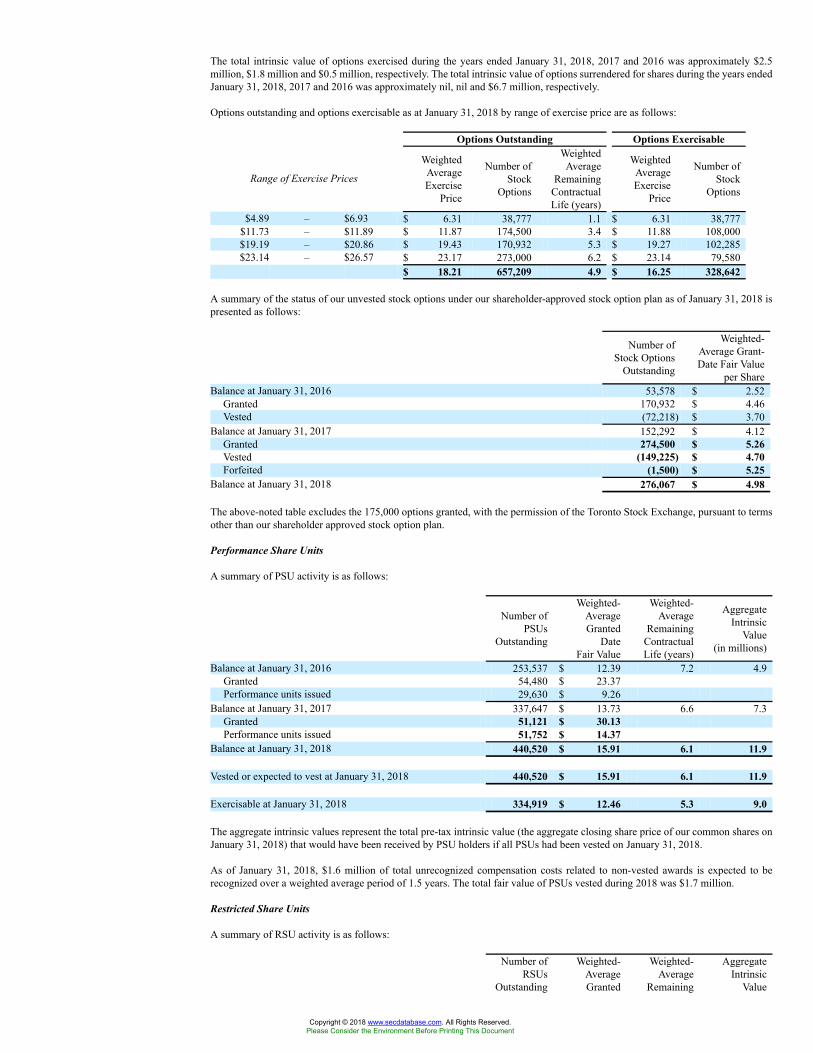
The total intrinsic value of options exercised during the years ended January 31, 2018, 2017 and 2016 was approximately $2.5million, $1.8 million and $0.5 million, respectively. The total intrinsic value of options surrendered for shares during the years endedJanuary 31, 2018, 2017 and 2016 was approximately nil, nil and $6.7 million, respectively.
Options outstanding and options exercisable as at January 31, 2018 by range of exercise price are as follows:
Options Outstanding Options Exercisable
Range of Exercise Prices
WeightedAverageExercise
Price
Number ofStock
Options
WeightedAverage
RemainingContractualLife (years)
WeightedAverageExercise
Price
Number ofStock
Options
$4.89 – $6.93 $ 6.31 38,777 1.1 $ 6.31 38,777$11.73 – $11.89 $ 11.87 174,500 3.4 $ 11.88 108,000$19.19 – $20.86 $ 19.43 170,932 5.3 $ 19.27 102,285$23.14 – $26.57 $ 23.17 273,000 6.2 $ 23.14 79,580
$ 18.21 657,209 4.9 $ 16.25 328,642
A summary of the status of our unvested stock options under our shareholder-approved stock option plan as of January 31, 2018 ispresented as follows:
Number ofStock Options
Outstanding
Weighted-Average Grant-Date Fair Value
per ShareBalance at January 31, 2016 53,578 $ 2.52
Granted 170,932 $ 4.46Vested (72,218) $ 3.70
Balance at January 31, 2017 152,292 $ 4.12Granted 274,500 $ 5.26Vested (149,225) $ 4.70Forfeited (1,500) $ 5.25
Balance at January 31, 2018 276,067 $ 4.98
The above-noted table excludes the 175,000 options granted, with the permission of the Toronto Stock Exchange, pursuant to termsother than our shareholder approved stock option plan.
Performance Share Units
A summary of PSU activity is as follows:
Number ofPSUs
Outstanding
Weighted-AverageGranted
DateFair Value
Weighted-Average
RemainingContractualLife (years)
AggregateIntrinsic
Value(in millions)
Balance at January 31, 2016 253,537 $ 12.39 7.2 4.9Granted 54,480 $ 23.37Performance units issued 29,630 $ 9.26
Balance at January 31, 2017 337,647 $ 13.73 6.6 7.3Granted 51,121 $ 30.13Performance units issued 51,752 $ 14.37
Balance at January 31, 2018 440,520 $ 15.91 6.1 11.9
Vested or expected to vest at January 31, 2018 440,520 $ 15.91 6.1 11.9
Exercisable at January 31, 2018 334,919 $ 12.46 5.3 9.0
The aggregate intrinsic values represent the total pre-tax intrinsic value (the aggregate closing share price of our common shares onJanuary 31, 2018) that would have been received by PSU holders if all PSUs had been vested on January 31, 2018.
As of January 31, 2018, $1.6 million of total unrecognized compensation costs related to non-vested awards is expected to berecognized over a weighted average period of 1.5 years. The total fair value of PSUs vested during 2018 was $1.7 million.
Restricted Share Units
A summary of RSU activity is as follows:
Number ofRSUs
Outstanding
Weighted-AverageGranted
Weighted-Average
Remaining
AggregateIntrinsic
Value
Copyright © 2018 www.secdatabase.com. All Rights Reserved.Please Consider the Environment Before Printing This Document
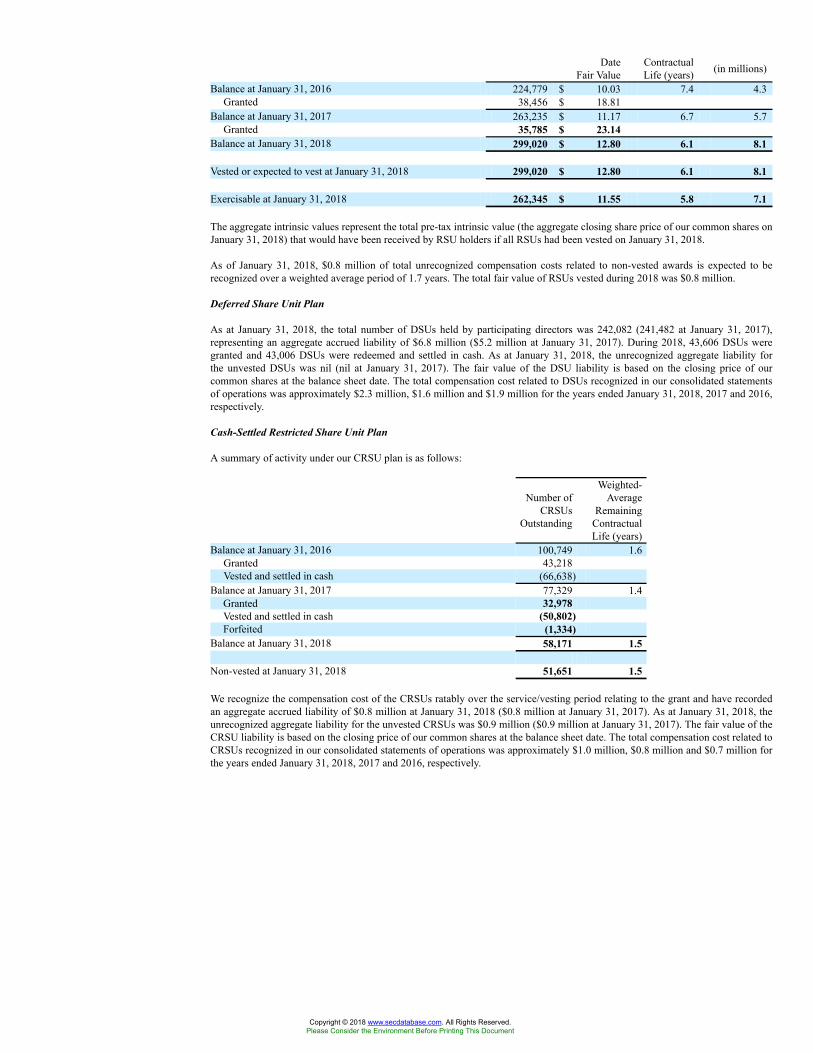
DateFair Value
ContractualLife (years) (in millions)
Balance at January 31, 2016 224,779 $ 10.03 7.4 4.3Granted 38,456 $ 18.81
Balance at January 31, 2017 263,235 $ 11.17 6.7 5.7Granted 35,785 $ 23.14
Balance at January 31, 2018 299,020 $ 12.80 6.1 8.1
Vested or expected to vest at January 31, 2018 299,020 $ 12.80 6.1 8.1
Exercisable at January 31, 2018 262,345 $ 11.55 5.8 7.1
The aggregate intrinsic values represent the total pre-tax intrinsic value (the aggregate closing share price of our common shares onJanuary 31, 2018) that would have been received by RSU holders if all RSUs had been vested on January 31, 2018.
As of January 31, 2018, $0.8 million of total unrecognized compensation costs related to non-vested awards is expected to berecognized over a weighted average period of 1.7 years. The total fair value of RSUs vested during 2018 was $0.8 million.
Deferred Share Unit Plan
As at January 31, 2018, the total number of DSUs held by participating directors was 242,082 (241,482 at January 31, 2017),representing an aggregate accrued liability of $6.8 million ($5.2 million at January 31, 2017). During 2018, 43,606 DSUs weregranted and 43,006 DSUs were redeemed and settled in cash. As at January 31, 2018, the unrecognized aggregate liability forthe unvested DSUs was nil (nil at January 31, 2017). The fair value of the DSU liability is based on the closing price of ourcommon shares at the balance sheet date. The total compensation cost related to DSUs recognized in our consolidated statementsof operations was approximately $2.3 million, $1.6 million and $1.9 million for the years ended January 31, 2018, 2017 and 2016,respectively.
Cash-Settled Restricted Share Unit Plan
A summary of activity under our CRSU plan is as follows:
Number ofCRSUs
Outstanding
Weighted-Average
RemainingContractualLife (years)
Balance at January 31, 2016 100,749 1.6Granted 43,218Vested and settled in cash (66,638)
Balance at January 31, 2017 77,329 1.4Granted 32,978Vested and settled in cash (50,802)Forfeited (1,334)
Balance at January 31, 2018 58,171 1.5
Non-vested at January 31, 2018 51,651 1.5
We recognize the compensation cost of the CRSUs ratably over the service/vesting period relating to the grant and have recordedan aggregate accrued liability of $0.8 million at January 31, 2018 ($0.8 million at January 31, 2017). As at January 31, 2018, theunrecognized aggregate liability for the unvested CRSUs was $0.9 million ($0.9 million at January 31, 2017). The fair value of theCRSU liability is based on the closing price of our common shares at the balance sheet date. The total compensation cost related toCRSUs recognized in our consolidated statements of operations was approximately $1.0 million, $0.8 million and $0.7 million forthe years ended January 31, 2018, 2017 and 2016, respectively.
Copyright © 2018 www.secdatabase.com. All Rights Reserved.Please Consider the Environment Before Printing This Document
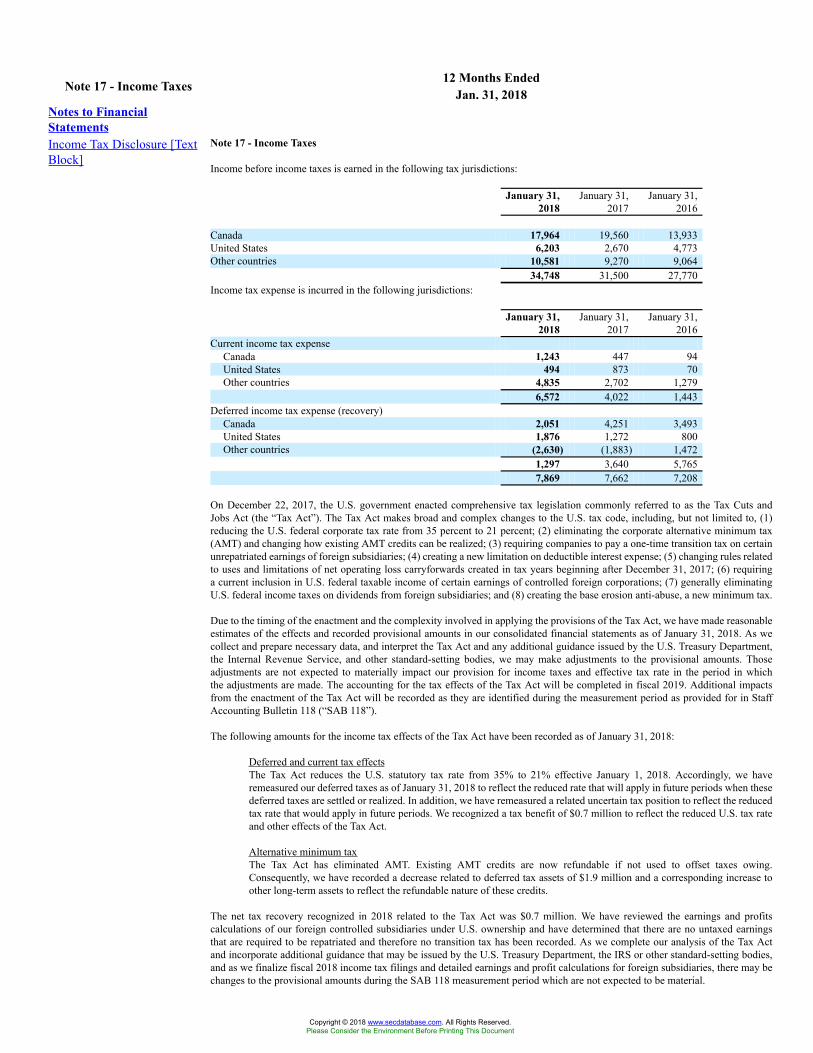
12 Months EndedNote 17 - Income Taxes Jan. 31, 2018Notes to FinancialStatementsIncome Tax Disclosure [TextBlock]
Note 17 - Income Taxes
Income before income taxes is earned in the following tax jurisdictions:
January 31,2018
January 31,2017
January 31,2016
Canada 17,964 19,560 13,933United States 6,203 2,670 4,773Other countries 10,581 9,270 9,064
34,748 31,500 27,770Income tax expense is incurred in the following jurisdictions:
January 31,2018
January 31,2017
January 31,2016
Current income tax expenseCanada 1,243 447 94United States 494 873 70Other countries 4,835 2,702 1,279
6,572 4,022 1,443Deferred income tax expense (recovery)
Canada 2,051 4,251 3,493United States 1,876 1,272 800Other countries (2,630) (1,883) 1,472
1,297 3,640 5,7657,869 7,662 7,208
On December 22, 2017, the U.S. government enacted comprehensive tax legislation commonly referred to as the Tax Cuts andJobs Act (the “Tax Act”). The Tax Act makes broad and complex changes to the U.S. tax code, including, but not limited to, (1)reducing the U.S. federal corporate tax rate from 35 percent to 21 percent; (2) eliminating the corporate alternative minimum tax(AMT) and changing how existing AMT credits can be realized; (3) requiring companies to pay a one-time transition tax on certainunrepatriated earnings of foreign subsidiaries; (4) creating a new limitation on deductible interest expense; (5) changing rules relatedto uses and limitations of net operating loss carryforwards created in tax years beginning after December 31, 2017; (6) requiringa current inclusion in U.S. federal taxable income of certain earnings of controlled foreign corporations; (7) generally eliminatingU.S. federal income taxes on dividends from foreign subsidiaries; and (8) creating the base erosion anti-abuse, a new minimum tax.
Due to the timing of the enactment and the complexity involved in applying the provisions of the Tax Act, we have made reasonableestimates of the effects and recorded provisional amounts in our consolidated financial statements as of January 31, 2018. As wecollect and prepare necessary data, and interpret the Tax Act and any additional guidance issued by the U.S. Treasury Department,the Internal Revenue Service, and other standard-setting bodies, we may make adjustments to the provisional amounts. Thoseadjustments are not expected to materially impact our provision for income taxes and effective tax rate in the period in whichthe adjustments are made. The accounting for the tax effects of the Tax Act will be completed in fiscal 2019. Additional impactsfrom the enactment of the Tax Act will be recorded as they are identified during the measurement period as provided for in StaffAccounting Bulletin 118 (“SAB 118”).
The following amounts for the income tax effects of the Tax Act have been recorded as of January 31, 2018:
Deferred and current tax effectsThe Tax Act reduces the U.S. statutory tax rate from 35% to 21% effective January 1, 2018. Accordingly, we haveremeasured our deferred taxes as of January 31, 2018 to reflect the reduced rate that will apply in future periods when thesedeferred taxes are settled or realized. In addition, we have remeasured a related uncertain tax position to reflect the reducedtax rate that would apply in future periods. We recognized a tax benefit of $0.7 million to reflect the reduced U.S. tax rateand other effects of the Tax Act.
Alternative minimum taxThe Tax Act has eliminated AMT. Existing AMT credits are now refundable if not used to offset taxes owing.Consequently, we have recorded a decrease related to deferred tax assets of $1.9 million and a corresponding increase toother long-term assets to reflect the refundable nature of these credits.
The net tax recovery recognized in 2018 related to the Tax Act was $0.7 million. We have reviewed the earnings and profitscalculations of our foreign controlled subsidiaries under U.S. ownership and have determined that there are no untaxed earningsthat are required to be repatriated and therefore no transition tax has been recorded. As we complete our analysis of the Tax Actand incorporate additional guidance that may be issued by the U.S. Treasury Department, the IRS or other standard-setting bodies,and as we finalize fiscal 2018 income tax filings and detailed earnings and profit calculations for foreign subsidiaries, there may bechanges to the provisional amounts during the SAB 118 measurement period which are not expected to be material.
Copyright © 2018 www.secdatabase.com. All Rights Reserved.Please Consider the Environment Before Printing This Document
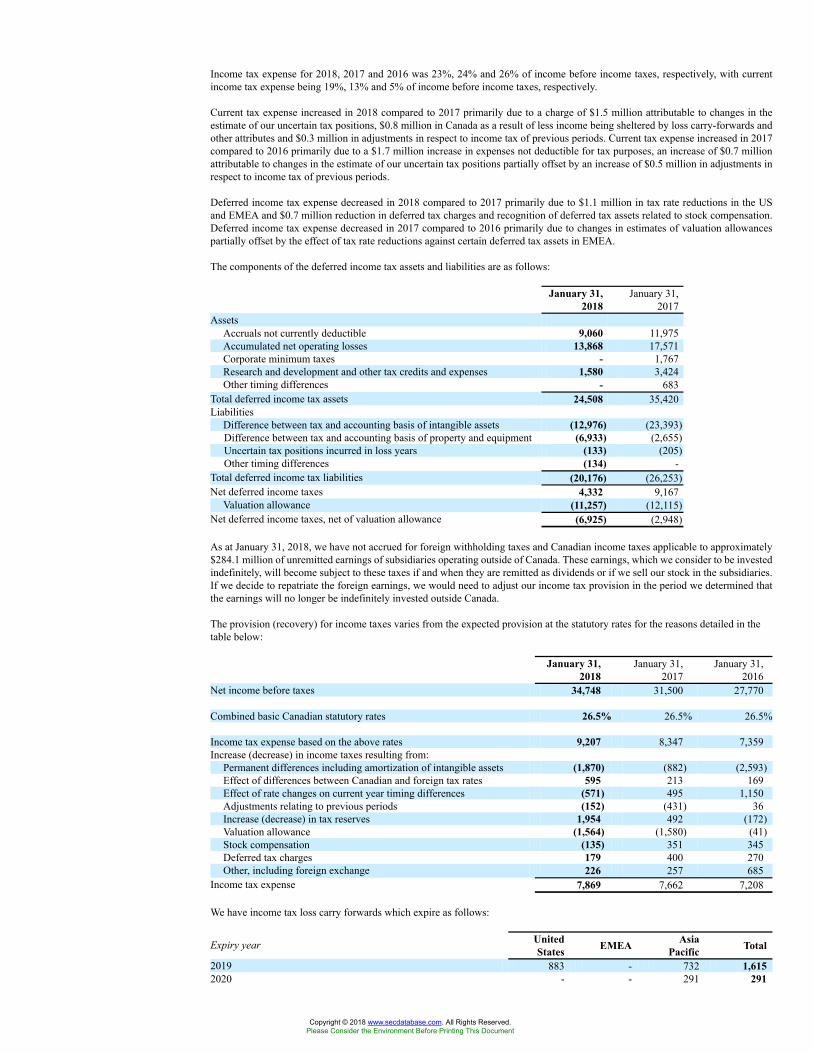
Income tax expense for 2018, 2017 and 2016 was 23%, 24% and 26% of income before income taxes, respectively, with currentincome tax expense being 19%, 13% and 5% of income before income taxes, respectively.
Current tax expense increased in 2018 compared to 2017 primarily due to a charge of $1.5 million attributable to changes in theestimate of our uncertain tax positions, $0.8 million in Canada as a result of less income being sheltered by loss carry-forwards andother attributes and $0.3 million in adjustments in respect to income tax of previous periods. Current tax expense increased in 2017compared to 2016 primarily due to a $1.7 million increase in expenses not deductible for tax purposes, an increase of $0.7 millionattributable to changes in the estimate of our uncertain tax positions partially offset by an increase of $0.5 million in adjustments inrespect to income tax of previous periods.
Deferred income tax expense decreased in 2018 compared to 2017 primarily due to $1.1 million in tax rate reductions in the USand EMEA and $0.7 million reduction in deferred tax charges and recognition of deferred tax assets related to stock compensation.Deferred income tax expense decreased in 2017 compared to 2016 primarily due to changes in estimates of valuation allowancespartially offset by the effect of tax rate reductions against certain deferred tax assets in EMEA.
The components of the deferred income tax assets and liabilities are as follows:
January 31,2018
January 31,2017
AssetsAccruals not currently deductible 9,060 11,975Accumulated net operating losses 13,868 17,571Corporate minimum taxes - 1,767Research and development and other tax credits and expenses 1,580 3,424Other timing differences - 683
Total deferred income tax assets 24,508 35,420Liabilities
Difference between tax and accounting basis of intangible assets (12,976) (23,393)Difference between tax and accounting basis of property and equipment (6,933) (2,655)Uncertain tax positions incurred in loss years (133) (205)Other timing differences (134) -
Total deferred income tax liabilities (20,176) (26,253)Net deferred income taxes 4,332 9,167
Valuation allowance (11,257) (12,115)Net deferred income taxes, net of valuation allowance (6,925) (2,948)
As at January 31, 2018, we have not accrued for foreign withholding taxes and Canadian income taxes applicable to approximately$284.1 million of unremitted earnings of subsidiaries operating outside of Canada. These earnings, which we consider to be investedindefinitely, will become subject to these taxes if and when they are remitted as dividends or if we sell our stock in the subsidiaries.If we decide to repatriate the foreign earnings, we would need to adjust our income tax provision in the period we determined thatthe earnings will no longer be indefinitely invested outside Canada.
The provision (recovery) for income taxes varies from the expected provision at the statutory rates for the reasons detailed in thetable below:
January 31,2018
January 31,2017
January 31,2016
Net income before taxes 34,748 31,500 27,770
Combined basic Canadian statutory rates 26.5% 26.5% 26.5%
Income tax expense based on the above rates 9,207 8,347 7,359Increase (decrease) in income taxes resulting from:
Permanent differences including amortization of intangible assets (1,870) (882) (2,593)Effect of differences between Canadian and foreign tax rates 595 213 169Effect of rate changes on current year timing differences (571) 495 1,150Adjustments relating to previous periods (152) (431) 36Increase (decrease) in tax reserves 1,954 492 (172)Valuation allowance (1,564) (1,580) (41)Stock compensation (135) 351 345Deferred tax charges 179 400 270Other, including foreign exchange 226 257 685
Income tax expense 7,869 7,662 7,208
We have income tax loss carry forwards which expire as follows:
Expiry year UnitedStates EMEA Asia
Pacific Total
2019 883 - 732 1,6152020 - - 291 291
Copyright © 2018 www.secdatabase.com. All Rights Reserved.Please Consider the Environment Before Printing This Document
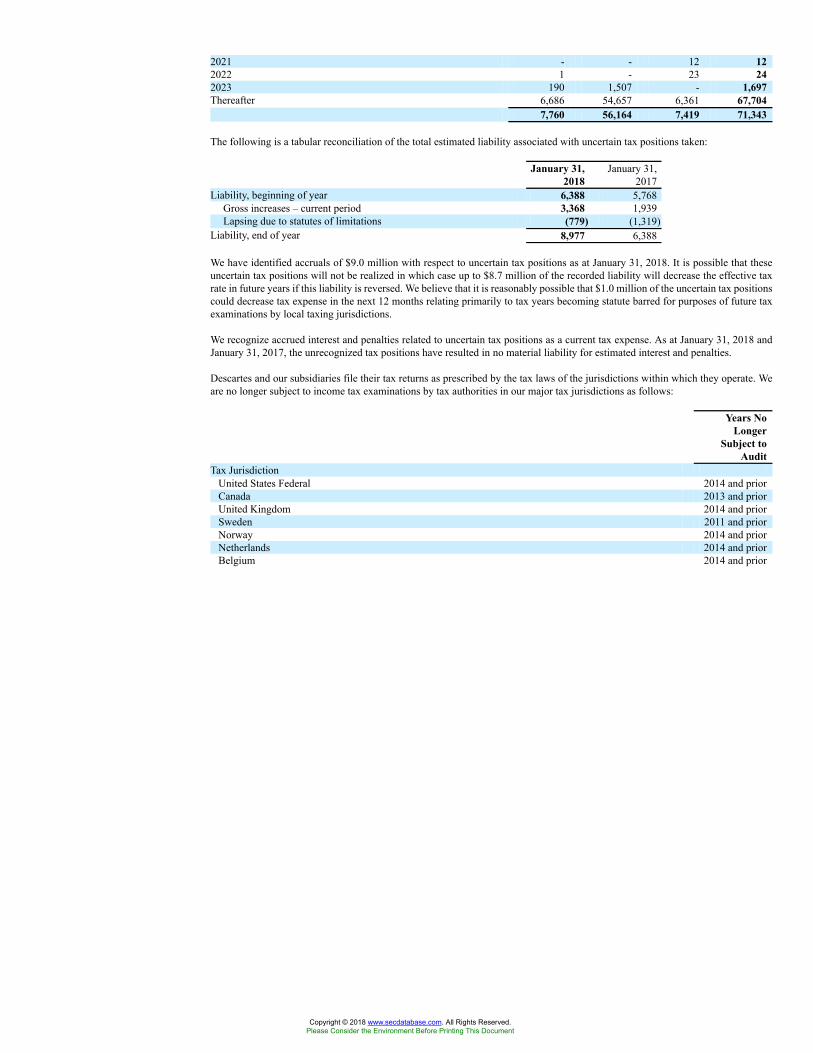
2021 - - 12 122022 1 - 23 242023 190 1,507 - 1,697Thereafter 6,686 54,657 6,361 67,704
7,760 56,164 7,419 71,343
The following is a tabular reconciliation of the total estimated liability associated with uncertain tax positions taken:
January 31,2018
January 31,2017
Liability, beginning of year 6,388 5,768Gross increases – current period 3,368 1,939Lapsing due to statutes of limitations (779) (1,319)
Liability, end of year 8,977 6,388
We have identified accruals of $9.0 million with respect to uncertain tax positions as at January 31, 2018. It is possible that theseuncertain tax positions will not be realized in which case up to $8.7 million of the recorded liability will decrease the effective taxrate in future years if this liability is reversed. We believe that it is reasonably possible that $1.0 million of the uncertain tax positionscould decrease tax expense in the next 12 months relating primarily to tax years becoming statute barred for purposes of future taxexaminations by local taxing jurisdictions.
We recognize accrued interest and penalties related to uncertain tax positions as a current tax expense. As at January 31, 2018 andJanuary 31, 2017, the unrecognized tax positions have resulted in no material liability for estimated interest and penalties.
Descartes and our subsidiaries file their tax returns as prescribed by the tax laws of the jurisdictions within which they operate. Weare no longer subject to income tax examinations by tax authorities in our major tax jurisdictions as follows:
Years NoLonger
Subject toAudit
Tax JurisdictionUnited States Federal 2014 and priorCanada 2013 and priorUnited Kingdom 2014 and priorSweden 2011 and priorNorway 2014 and priorNetherlands 2014 and priorBelgium 2014 and prior
Copyright © 2018 www.secdatabase.com. All Rights Reserved.Please Consider the Environment Before Printing This Document
12 Months EndedNote 18 - Deferred TaxCharge Jan. 31, 2018
Notes to FinancialStatementsDeferred Tax Charge [TextBlock]
Note 18 – Deferred Tax Charge
Deferred tax charges arise as a result of internal reorganizations of intellectual property betweencertain subsidiaries. The tax impact related to these reorganizations is amortized to tax expenseover the remaining estimated useful life of the intellectual property, which is between three to eightyears.
Copyright © 2018 www.secdatabase.com. All Rights Reserved.Please Consider the Environment Before Printing This Document
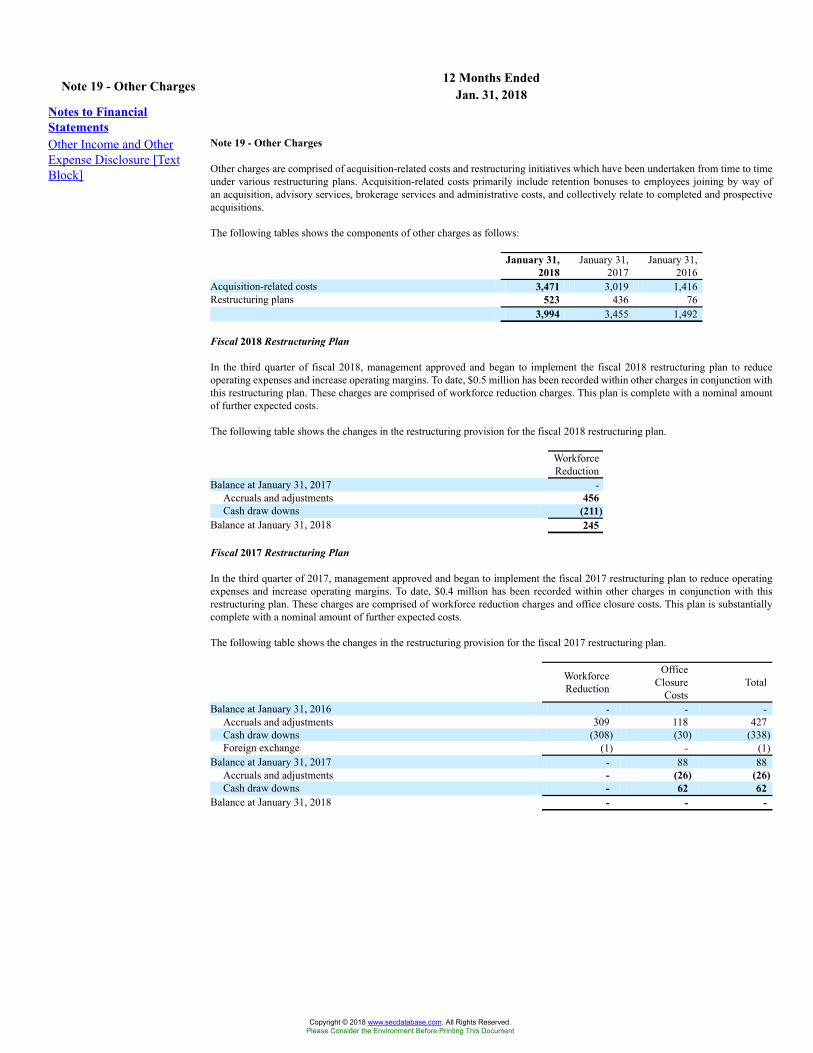
12 Months EndedNote 19 - Other Charges Jan. 31, 2018Notes to FinancialStatementsOther Income and OtherExpense Disclosure [TextBlock]
Note 19 - Other Charges
Other charges are comprised of acquisition-related costs and restructuring initiatives which have been undertaken from time to timeunder various restructuring plans. Acquisition-related costs primarily include retention bonuses to employees joining by way ofan acquisition, advisory services, brokerage services and administrative costs, and collectively relate to completed and prospectiveacquisitions.
The following tables shows the components of other charges as follows:
January 31,2018
January 31,2017
January 31,2016
Acquisition-related costs 3,471 3,019 1,416Restructuring plans 523 436 76
3,994 3,455 1,492
Fiscal 2018 Restructuring Plan
In the third quarter of fiscal 2018, management approved and began to implement the fiscal 2018 restructuring plan to reduceoperating expenses and increase operating margins. To date, $0.5 million has been recorded within other charges in conjunction withthis restructuring plan. These charges are comprised of workforce reduction charges. This plan is complete with a nominal amountof further expected costs.
The following table shows the changes in the restructuring provision for the fiscal 2018 restructuring plan.
WorkforceReduction
Balance at January 31, 2017 -Accruals and adjustments 456Cash draw downs (211)
Balance at January 31, 2018 245
Fiscal 2017 Restructuring Plan
In the third quarter of 2017, management approved and began to implement the fiscal 2017 restructuring plan to reduce operatingexpenses and increase operating margins. To date, $0.4 million has been recorded within other charges in conjunction with thisrestructuring plan. These charges are comprised of workforce reduction charges and office closure costs. This plan is substantiallycomplete with a nominal amount of further expected costs.
The following table shows the changes in the restructuring provision for the fiscal 2017 restructuring plan.
WorkforceReduction
OfficeClosure
CostsTotal
Balance at January 31, 2016 - - -Accruals and adjustments 309 118 427Cash draw downs (308) (30) (338)Foreign exchange (1) - (1)
Balance at January 31, 2017 - 88 88Accruals and adjustments - (26) (26)Cash draw downs - 62 62
Balance at January 31, 2018 - - -
Copyright © 2018 www.secdatabase.com. All Rights Reserved.Please Consider the Environment Before Printing This Document
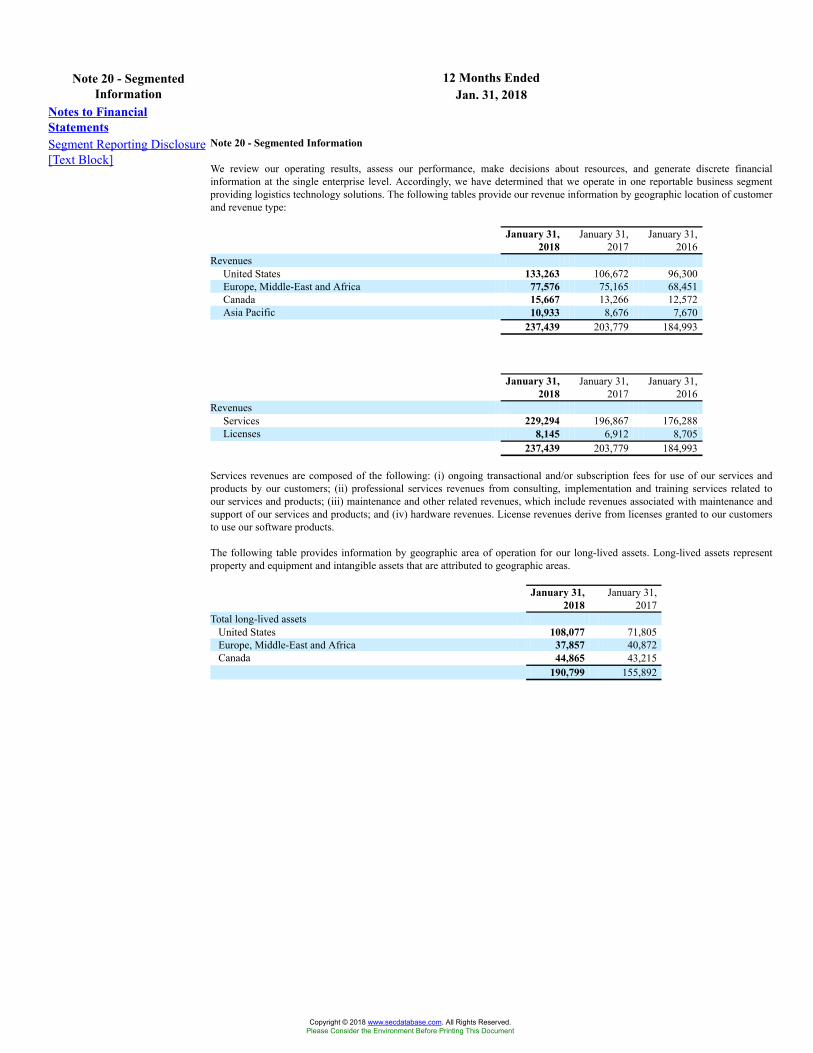
12 Months EndedNote 20 - SegmentedInformation Jan. 31, 2018
Notes to FinancialStatementsSegment Reporting Disclosure[Text Block]
Note 20 - Segmented Information
We review our operating results, assess our performance, make decisions about resources, and generate discrete financialinformation at the single enterprise level. Accordingly, we have determined that we operate in one reportable business segmentproviding logistics technology solutions. The following tables provide our revenue information by geographic location of customerand revenue type:
January 31,2018
January 31,2017
January 31,2016
RevenuesUnited States 133,263 106,672 96,300Europe, Middle-East and Africa 77,576 75,165 68,451Canada 15,667 13,266 12,572Asia Pacific 10,933 8,676 7,670
237,439 203,779 184,993
January 31,2018
January 31,2017
January 31,2016
RevenuesServices 229,294 196,867 176,288Licenses 8,145 6,912 8,705
237,439 203,779 184,993
Services revenues are composed of the following: (i) ongoing transactional and/or subscription fees for use of our services andproducts by our customers; (ii) professional services revenues from consulting, implementation and training services related toour services and products; (iii) maintenance and other related revenues, which include revenues associated with maintenance andsupport of our services and products; and (iv) hardware revenues. License revenues derive from licenses granted to our customersto use our software products.
The following table provides information by geographic area of operation for our long-lived assets. Long-lived assets representproperty and equipment and intangible assets that are attributed to geographic areas.
January 31,2018
January 31,2017
Total long-lived assetsUnited States 108,077 71,805Europe, Middle-East and Africa 37,857 40,872Canada 44,865 43,215
190,799 155,892
Copyright © 2018 www.secdatabase.com. All Rights Reserved.Please Consider the Environment Before Printing This Document
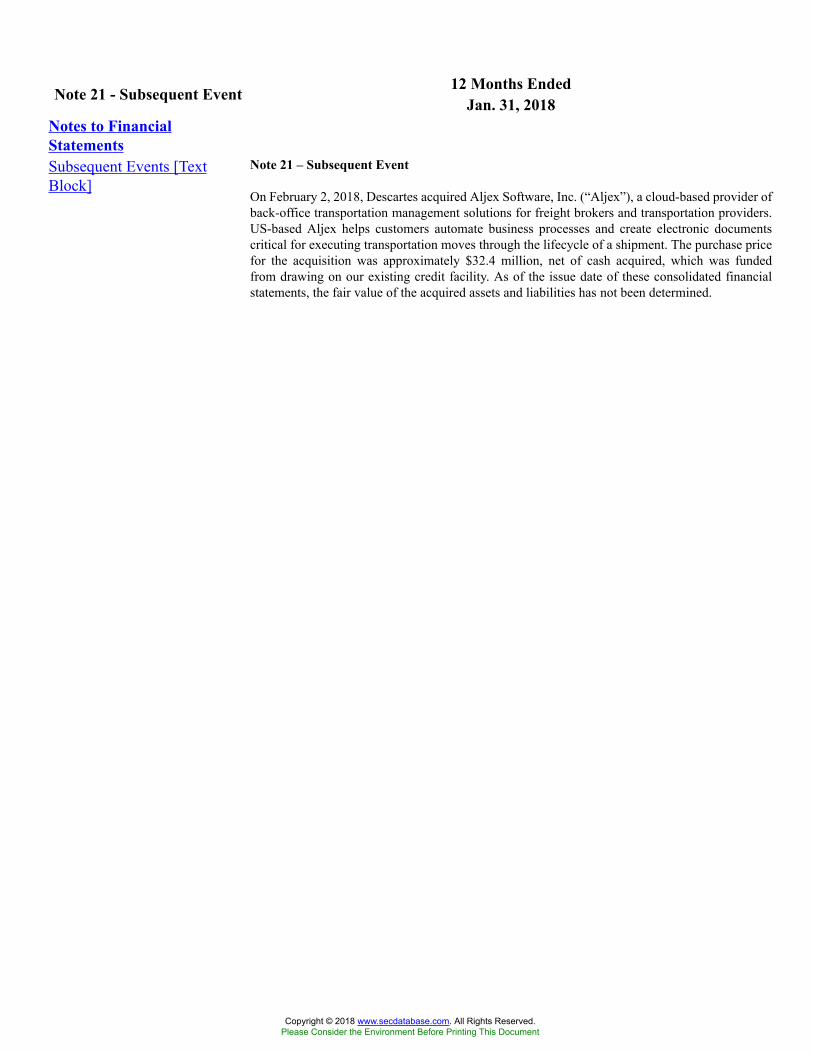
12 Months EndedNote 21 - Subsequent Event Jan. 31, 2018Notes to FinancialStatementsSubsequent Events [TextBlock]
Note 21 – Subsequent Event
On February 2, 2018, Descartes acquired Aljex Software, Inc. (“Aljex”), a cloud-based provider ofback-office transportation management solutions for freight brokers and transportation providers.US-based Aljex helps customers automate business processes and create electronic documentscritical for executing transportation moves through the lifecycle of a shipment. The purchase pricefor the acquisition was approximately $32.4 million, net of cash acquired, which was fundedfrom drawing on our existing credit facility. As of the issue date of these consolidated financialstatements, the fair value of the acquired assets and liabilities has not been determined.
Copyright © 2018 www.secdatabase.com. All Rights Reserved.Please Consider the Environment Before Printing This Document
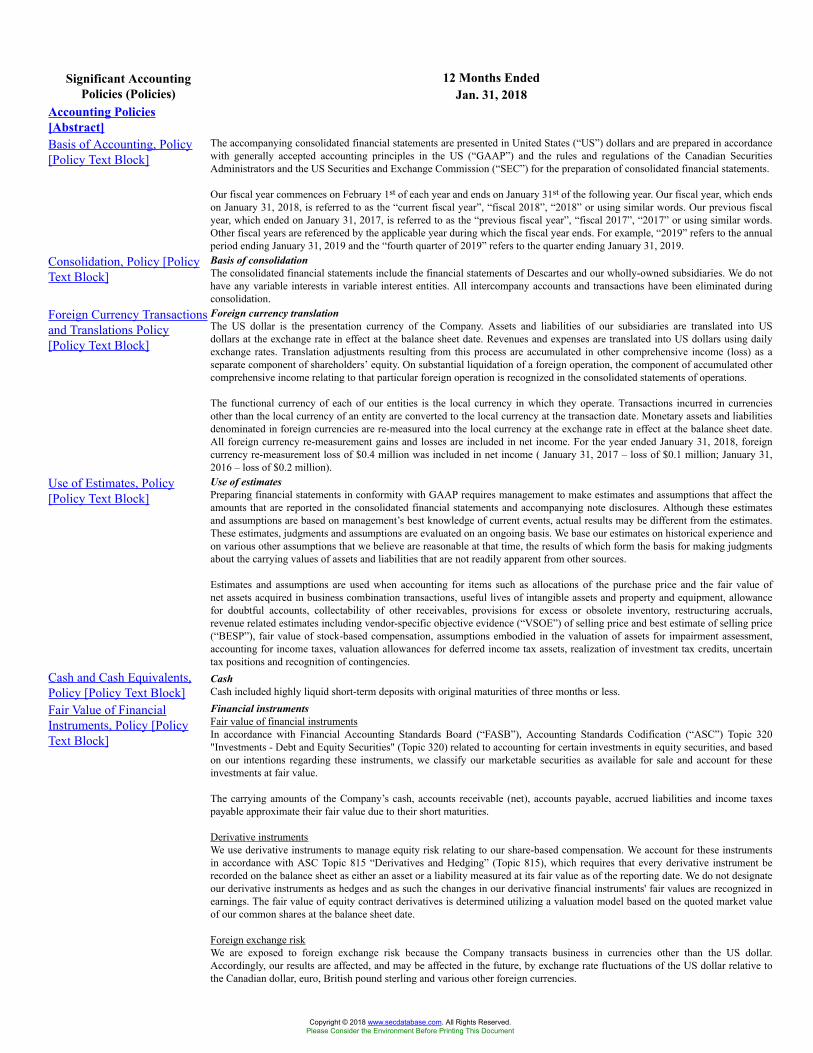
12 Months EndedSignificant AccountingPolicies (Policies) Jan. 31, 2018
Accounting Policies[Abstract]Basis of Accounting, Policy[Policy Text Block]
The accompanying consolidated financial statements are presented in United States (“US”) dollars and are prepared in accordancewith generally accepted accounting principles in the US (“GAAP”) and the rules and regulations of the Canadian SecuritiesAdministrators and the US Securities and Exchange Commission (“SEC”) for the preparation of consolidated financial statements.
Our fiscal year commences on February 1st of each year and ends on January 31st of the following year. Our fiscal year, which endson January 31, 2018, is referred to as the “current fiscal year”, “fiscal 2018”, “2018” or using similar words. Our previous fiscalyear, which ended on January 31, 2017, is referred to as the “previous fiscal year”, “fiscal 2017”, “2017” or using similar words.Other fiscal years are referenced by the applicable year during which the fiscal year ends. For example, “2019” refers to the annualperiod ending January 31, 2019 and the “fourth quarter of 2019” refers to the quarter ending January 31, 2019.
Consolidation, Policy [PolicyText Block]
Basis of consolidationThe consolidated financial statements include the financial statements of Descartes and our wholly-owned subsidiaries. We do nothave any variable interests in variable interest entities. All intercompany accounts and transactions have been eliminated duringconsolidation.
Foreign Currency Transactionsand Translations Policy[Policy Text Block]
Foreign currency translationThe US dollar is the presentation currency of the Company. Assets and liabilities of our subsidiaries are translated into USdollars at the exchange rate in effect at the balance sheet date. Revenues and expenses are translated into US dollars using dailyexchange rates. Translation adjustments resulting from this process are accumulated in other comprehensive income (loss) as aseparate component of shareholders’ equity. On substantial liquidation of a foreign operation, the component of accumulated othercomprehensive income relating to that particular foreign operation is recognized in the consolidated statements of operations.
The functional currency of each of our entities is the local currency in which they operate. Transactions incurred in currenciesother than the local currency of an entity are converted to the local currency at the transaction date. Monetary assets and liabilitiesdenominated in foreign currencies are re-measured into the local currency at the exchange rate in effect at the balance sheet date.All foreign currency re-measurement gains and losses are included in net income. For the year ended January 31, 2018, foreigncurrency re-measurement loss of $0.4 million was included in net income ( January 31, 2017 – loss of $0.1 million; January 31,2016 – loss of $0.2 million).
Use of Estimates, Policy[Policy Text Block]
Use of estimatesPreparing financial statements in conformity with GAAP requires management to make estimates and assumptions that affect theamounts that are reported in the consolidated financial statements and accompanying note disclosures. Although these estimatesand assumptions are based on management’s best knowledge of current events, actual results may be different from the estimates.These estimates, judgments and assumptions are evaluated on an ongoing basis. We base our estimates on historical experience andon various other assumptions that we believe are reasonable at that time, the results of which form the basis for making judgmentsabout the carrying values of assets and liabilities that are not readily apparent from other sources.
Estimates and assumptions are used when accounting for items such as allocations of the purchase price and the fair value ofnet assets acquired in business combination transactions, useful lives of intangible assets and property and equipment, allowancefor doubtful accounts, collectability of other receivables, provisions for excess or obsolete inventory, restructuring accruals,revenue related estimates including vendor-specific objective evidence (“VSOE”) of selling price and best estimate of selling price(“BESP”), fair value of stock-based compensation, assumptions embodied in the valuation of assets for impairment assessment,accounting for income taxes, valuation allowances for deferred income tax assets, realization of investment tax credits, uncertaintax positions and recognition of contingencies.
Cash and Cash Equivalents,Policy [Policy Text Block]
CashCash included highly liquid short-term deposits with original maturities of three months or less.
Fair Value of FinancialInstruments, Policy [PolicyText Block]
Financial instrumentsFair value of financial instrumentsIn accordance with Financial Accounting Standards Board (“FASB”), Accounting Standards Codification (“ASC”) Topic 320"Investments - Debt and Equity Securities" (Topic 320) related to accounting for certain investments in equity securities, and basedon our intentions regarding these instruments, we classify our marketable securities as available for sale and account for theseinvestments at fair value.
The carrying amounts of the Company’s cash, accounts receivable (net), accounts payable, accrued liabilities and income taxespayable approximate their fair value due to their short maturities.
Derivative instrumentsWe use derivative instruments to manage equity risk relating to our share-based compensation. We account for these instrumentsin accordance with ASC Topic 815 “Derivatives and Hedging” (Topic 815), which requires that every derivative instrument berecorded on the balance sheet as either an asset or a liability measured at its fair value as of the reporting date. We do not designateour derivative instruments as hedges and as such the changes in our derivative financial instruments' fair values are recognized inearnings. The fair value of equity contract derivatives is determined utilizing a valuation model based on the quoted market valueof our common shares at the balance sheet date.
Foreign exchange riskWe are exposed to foreign exchange risk because the Company transacts business in currencies other than the US dollar.Accordingly, our results are affected, and may be affected in the future, by exchange rate fluctuations of the US dollar relative tothe Canadian dollar, euro, British pound sterling and various other foreign currencies.
Copyright © 2018 www.secdatabase.com. All Rights Reserved.Please Consider the Environment Before Printing This Document
Interest rate riskWe are exposed to interest rate fluctuations to the extent that we borrow on our credit facility, which depending on the type ofadvance under the available facilities, interest will be charged based on either i) Canada or US prime rate; or ii) Banker’s Acceptance(BA); or iii) LIBOR.
Credit riskWe are exposed to credit risk through our invested cash and accounts receivable. We hold our cash with reputable financialinstitutions. The lack of concentration of accounts receivable from a single customer and the dispersion of customers amongindustries and geographical locations mitigate our credit risk.
We do not use any type of speculative financial instruments, including but not limited to foreign exchange contracts, futures,swaps and option agreements, to manage our foreign exchange or interest rate risks. In addition, we do not hold or issue financialinstruments for trading purposes.
Equity riskWe are exposed to equity risk through certain share-based compensation expenses that are fair valued at the balance sheet date. TheCompany enters into equity derivative contracts including floating-rate equity forwards to partially offset the potential fluctuationsof certain future share-based compensation expenses. The Company does not hold derivatives for speculative purposes.
Receivables, Trade and OtherAccounts Receivable,Allowance for DoubtfulAccounts, Policy [Policy TextBlock]
Allowance for doubtful accountsWe maintain an allowance for doubtful accounts for estimated losses resulting from the inability of customers to make theirrequired payments. Specifically, we consider the age of the receivables, customers’ payment history, historical write-offs, thecreditworthiness of the customer, and current economic trends among other factors. Accounts receivable are written off, and theassociated allowance is eliminated, if it is determined that the specific balance is no longer collectible. The allowance is maintainedfor 100% of all accounts deemed to be uncollectible and, for those receivables not specifically identified as uncollectible, anallowance is maintained for a specific percentage of those receivables based upon the aging of accounts, our historical collectionexperience and current economic expectations. To date, the actual losses have been within our expectations. No single customeraccounted for more than 10% of the accounts receivable balance as of January 31, 2018 and 2017.
Inventory, Policy [Policy TextBlock]
InventoryFinished goods inventories are stated at the lower of cost and net realizable value. The cost of finished goods is determined on thebasis of average cost of units.
The valuation of inventory, including the determination of obsolete or excess inventory, requires management to estimate the futuredemand for our products within specified time horizons. We perform an assessment of inventory which includes a review of, amongother factors, demand requirements, product life cycle and development plans, product pricing and quality issues. If the demand forour products indicates we are no longer able to sell inventories above cost or at all, we write down inventory to market or excessinventory is written off.
Impairment or Disposal ofLong-Lived Assets, IncludingIntangible Assets, Policy[Policy Text Block]
Impairment of long-lived assetsWe test long-lived assets or asset groups, such as property and equipment and finite life intangible assets, for recoverability whenevents or changes in circumstances indicate that there may be impairment. Circumstances which could trigger a review include, butare not limited to: significant adverse changes in the business climate or legal factors; current period cash flow or operating lossescombined with a history of losses or a forecast of continuing losses associated with the use of the asset or asset group; and a currentexpectation that the asset or asset group will more likely than not be sold or disposed of before the end of its estimated useful life.An impairment loss is recognized when the estimate of undiscounted future cash flows generated by such asset or asset group isless than the carrying amount. Measurement of the impairment loss is based on the present value of the expected future cash flows.No impairment of long-lived assets has been identified or recorded in our consolidated statements of operations for any of the fiscalyears presented.
Goodwill and IntangibleAssets, Policy [Policy TextBlock]
Goodwill and intangible assetsGoodwill represents the excess of the purchase price in a business combination over the fair value of net tangible and intangibleassets acquired. Goodwill is not subject to amortization.
We test for impairment of goodwill at least annually on October 31st of each year and at any other time if any event occursor circumstances change that would more likely than not reduce our fair value below our reporting unit’s carrying amount. Ouroperations are analyzed by management and our chief operating decision makers as being part of a single industry segmentproviding logistics technology solutions. Accordingly, our goodwill impairment assessment is based on the allocation of goodwillto a single reporting unit. We completed the qualitative assessment during our third quarter of 2018 and concluded that it was morelikely than not that the fair value of the goodwill was greater than the carrying value. As a result, no impairment of goodwill wasrecorded in fiscal 2018 (no impairments were recorded for fiscal 2017 or fiscal 2016).
We perform further quarterly analysis of whether any event has occurred that would more likely than not reduce our fair value belowour reporting unit’s carrying amount and, if so, we perform a goodwill impairment test between the annual date. Any impairmentadjustment is recognized as an expense in the period that the adjustment is identified.
Intangible assets related to our acquisitions are recorded at their fair value at the acquisition date. Intangible assets include customeragreements and relationships, non-compete covenants, existing technologies and trade names. Intangible assets are amortized on astraight-line basis over their estimated useful lives. We write down intangible asset or asset groups with a finite life to fair valuewhen the related undiscounted cash flows are not expected to allow for recovery of the carrying value. Fair value of intangible assetor asset groups is determined by discounting the expected related future cash flows.
Amortization of our intangible assets is generally recorded at the following rates:
Customer agreements and relationships Straight-line over three to twenty yearsExisting technologies Straight-line over two to twelve years
Copyright © 2018 www.secdatabase.com. All Rights Reserved.Please Consider the Environment Before Printing This Document
Trade names Straight-line over one to fifteen yearsNon-compete covenants Straight-line over two to twelve years
Property, Plant andEquipment, Policy [PolicyText Block]
Property and equipmentProperty and equipment is recorded at cost. Depreciation of our property and equipment is generally recorded at the following rates:
Computer equipment and software 30% declining balanceFurniture and fixtures 20% declining balanceLeasehold improvements Straight-line over lesser of useful life or term of lease
Fully depreciated property and equipment are removed from the balance sheet when they are no longer in use.Revenue Recognition, Policy[Policy Text Block]
Revenue recognitionWe recognize revenue when it is realized or realizable and earned. We consider revenue realized or realizable and earned when thereexists persuasive evidence of an arrangement, the product has been delivered or the services have been provided to the customer,the sales price is fixed or determinable and collectability is reasonably assured. All revenue is recognized net of any related salestaxes. In addition to this general policy, the specific revenue recognition policies for each major category of revenue are includedbelow.
Services Revenues - Services revenues are principally comprised of the following: (i) ongoing transactional fees for use of ourservices and products by our customers, which are recognized as the transactions occur; (ii) professional services revenues fromconsulting, implementation and training services related to our services and products, which are recognized as the services areperformed; (iii) maintenance, subscription and other related revenues, including revenues associated with maintenance and supportof our services and products, which are recognized ratably over the subscription period; and (iv) hardware revenues, which arerecognized when hardware is shipped.
License Revenues - License revenues are derived from perpetual licenses granted to our customers to use our software products,which are recognized when the license is delivered.
We enter into arrangements from time to time that may consist of multiple deliverables which may include any combination ofservices and software licenses. Our typical multiple-element arrangements involve: (i) software with maintenance support services,(ii) professional services and (iii) hardware with services. For any arrangements involving multiple deliverables involving non-software elements (hardware, professional services, subscription, etc.) the consideration from the arrangement is allocated to eachrespective element based on its relative selling price, using VSOE of selling price. In instances when we are unable to establish theselling price using VSOE, we attempt to establish selling price of each element based on acceptable third-party evidence of sellingprice (“TPE”); however, we are generally unable to reliably determine the selling price of similar competitor products or services ona stand-alone basis. In these instances, we use our BESP in our allocation of the arrangement consideration. The objective of BESPis to determine the price at which we would transact a sale if the product or service was sold on a stand-alone basis. We determineBESP for each specific element in a multiple element arrangement considering multiple factors including, but not limited to, marketconditions, competitive landscape, internal costs, gross margin objectives and pricing practices.
For arrangements involving multiple deliverables of software with maintenance support services, the revenue is recognized basedon ASC Subtopic 985-605 “Software: Revenue Recognition”. If we are unable to determine VSOE of fair value for all of thedeliverables of the arrangement, but are able to obtain VSOE of fair value for all the undelivered elements, revenue is allocatedusing the residual method. Under the residual method, the amount of revenue allocated to the delivered elements equals the totalarrangement consideration less the aggregate fair value of any undelivered elements. If VSOE of fair value of any undeliveredsoftware items does not exist, revenue from the entire arrangement is initially deferred and recognized at the earlier of: (i) deliveryof those elements for which VSOE of fair value did not exist; or (ii) when VSOE of fair value can be established.
Research, Development, andComputer Software, Policy[Policy Text Block]
Research and development costsTo date, we have not capitalized any costs related to research and development of our computer software products. Costs incurredbetween the dates that the product is considered to be technologically feasible and is considered to be ready for general release tocustomers have historically been expensed as they have not been significant.
Share-based Compensation,Option and Incentive PlansPolicy [Policy Text Block]
Stock-based compensation plansStock OptionsWe maintain stock option plans for non-employee directors, officers, employees and other service providers. Options to purchaseour common shares are granted at an exercise price equal to the fair market value of our common shares as of the date of grant. Thisfair market value is determined using the closing price of our common shares on the TSX on the day immediately preceding thedate of the grant.
Employee stock options generally vest over a five-year period starting from the grant date and expire seven years from the grantdate. Non-employee directors’ and officers’ stock options generally have quarterly vesting over a three- to five-year period. Weissue new shares from treasury upon the exercise of a stock option.
The fair value of employee stock option grants that are ultimately expected to vest are amortized to expense in our consolidatedstatement of operations based on the straight-line attribution method. The fair value of stock option grants is calculated using theBlack-Scholes Merton option-pricing model. Expected volatility is based on historical volatility of our common stock and otherfactors. The risk-free interest rates are based on Government of Canada average bond yields for a period consistent with the expectedlife of the option in effect at the time of the grant. The expected option life is based on the historical life of our granted options andother factors.
Effective as of February 1, 2017, the Company adopted a change in accounting policy in accordance with ASU 2016-09 to accountfor forfeitures as they occur. The change was applied on a modified retrospective basis, and no prior periods were restated as a resultof this change in accounting policy.
Copyright © 2018 www.secdatabase.com. All Rights Reserved.Please Consider the Environment Before Printing This Document
Performance & Restricted Share UnitsWe maintain a performance and restricted share unit plan pursuant to which certain of our officers are eligible to receive grants ofperformance share units (“PSUs”) and restricted share units (“RSUs”).
PSUs vest at the end of a three-year performance period. The ultimate number of PSUs that vest is based on the total shareholderreturn (“TSR”) of our Company relative to the TSR of companies comprising a peer index group. TSR is calculated based on theweighted-average closing price of shares for the five trading days preceding the beginning and end of the performance period. Thefair value of PSUs is expensed to stock-based compensation expense over the vesting period. PSUs expire ten years from the grantdate. New shares are issued from treasury upon the redemption of a PSU.
PSUs are measured at fair value estimated using a Monte Carlo Simulation approach. Expected volatility is based on historicalvolatility of our common stock and other factors. The risk-free interest rates are based on the Government of Canada average bondyields for a period consistent with the expected life of the PSUs at the time of the grant. The expected PSU life is based on thehistorical life of our stock options and other factors.
RSUs vest annually over a three-year period starting from the grant date and expire ten years from the grant date. We issue newshares from treasury upon the redemption of an RSU.
RSUs are measured at fair value based on the closing price of our common shares for the day preceding the date of the grant andwill be expensed to stock-based compensation expense over the vesting period.
Deferred Share Unit PlanOur board of directors adopted a deferred share unit plan effective as of June 28, 2004, pursuant to which non-employee directorsare eligible to receive grants of deferred share units (“DSUs”), each of which has an initial value equal to the weighted-averageclosing price of our common shares for the five trading days preceding the grant date. The plan allows each director to choose toreceive, in the form of DSUs, all, none or a percentage of the eligible director’s fees which would otherwise be payable in cash.If a director has invested less than the minimum amount of equity in Descartes, as prescribed from time to time by the board ofdirectors, then the director must take at least 50% of the base annual fee for serving as a director in the form of DSUs. Each DSUfully vests upon award but is distributed only when the director ceases to be a member of the board of directors. Vested units aresettled in cash based on our common share price when conversion takes place. Fair value of the liability is based on the closingprice of our common shares at the balance sheet date.
Cash-Settled Restricted Share Unit PlanOur board of directors adopted a cash-settled restricted share unit plan effective as of May 23, 2007, pursuant to which certain ofour employees and non-employee directors are eligible to receive grants of cash-settled restricted share units (“CRSUs”), each ofwhich has an initial value equal to the weighted-average closing price of our common shares for the five trading days precedingthe date of the grant. The CRSUs generally vest based on continued employment and have annual vesting over three- to five-yearperiods. Vested units are settled in cash based on our common share price when conversion takes place, which is within 30 daysfollowing a vesting date and in any event prior to December 31st of the calendar year in which a vesting date occurs. Fair value ofthe liability is based on the closing price of our common shares at the balance sheet date.
Business Combinations Policy[Policy Text Block]
Business combinationsWe apply the provisions of ASC Topic 805, “Business Combinations” (Topic 805), in the accounting for our acquisitions. It requiresus to recognize separately from goodwill, the assets acquired and the liabilities assumed at their acquisition date fair values.Goodwill as of the acquisition date is measured as the excess of consideration transferred over the net of the acquisition date fairvalues of the assets acquired and the liabilities assumed. While we use our best estimates and assumptions to accurately valueassets acquired and liabilities assumed at the acquisition date as well as contingent consideration, where applicable, our estimatesare inherently uncertain and subject to refinement. As a result, during the measurement period, which may be up to one yearfrom the acquisition date, we may record adjustments to the assets acquired and liabilities assumed with the corresponding offsetto goodwill. Upon the conclusion of the measurement period or final determination of the values of assets acquired or liabilitiesassumed, whichever comes first, any subsequent adjustments would be recorded to our consolidated statement of operations.
Costs to exit or restructure certain activities of an acquired company or our internal operations are accounted for as termination andexit costs pursuant to ASC Topic 420, “Exit or Disposal Cost Obligations” (Topic 420) and are accounted for separately from thebusiness combination.
For a given acquisition, we generally identify certain pre-acquisition contingencies as of the acquisition date and may extendour review and evaluation of these pre-acquisition contingencies throughout the measurement period in order to obtain sufficientinformation to assess whether we include these contingencies as a part of the purchase price allocation and, if so, to determine theestimated amounts.If we determine that a pre-acquisition contingency (non-income tax related) is probable in nature and estimable as of the acquisitiondate, we record our best estimate for such a contingency as a part of the preliminary purchase price allocation. We often continue togather information and evaluate our pre-acquisition contingencies throughout the measurement period and if we make changes tothe amounts recorded or if we identify additional pre-acquisition contingencies during the measurement period, such amounts willbe included in the purchase price allocation during the measurement period and, subsequently, in our results of operations.
Uncertain tax positions and tax related valuation allowances assumed in connection with a business combination are initiallyestimated as of the acquisition date. We review these items during the measurement period as we continue to actively seek andcollect information relating to facts and circumstances that existed at the acquisition date. Changes to these uncertain tax positionsand tax related valuation allowances made subsequent to the measurement period, or if they relate to facts and circumstances thatdid not exist at the acquisition date, are recorded in our provision for income taxes in our consolidated statement of operations.
Income Tax, Policy [PolicyText Block]
Income taxesWe use the liability method of income tax allocation to account for income taxes. Deferred tax assets and liabilities arise fromtemporary differences between the tax bases of assets and liabilities and their reported amounts in the consolidated financial
Copyright © 2018 www.secdatabase.com. All Rights Reserved.Please Consider the Environment Before Printing This Document
statements that will result in taxable or deductible amounts in future years. These temporary differences are measured using enactedtax rates. A valuation allowance is recorded to reduce deferred tax assets to the extent that we consider it is more likely than not thata deferred tax asset will not be realized. In determining the valuation allowance, we consider factors such as the reversal of deferredincome tax liabilities, projected taxable income, our history of losses for tax purposes, and the character of income tax assets andtax planning strategies. A change to these factors could impact the estimated valuation allowance and income tax expense.
We evaluate our uncertain tax positions by using a two-step approach to recognize and measure uncertain tax positions andprovisions for income taxes. The first step is to evaluate the tax position for recognition by determining if the weight of availableevidence indicates it is more likely than not, based solely on the technical merits, that the position will be sustained on audit,including resolution of related appeals or litigation processes, if any. The second step is to measure the appropriate amount of thebenefit to recognize. The amount of benefit to recognize is measured as the maximum amount which is more likely than not to berealized. The tax position is derecognized when it is no longer more likely than not that the position will be sustained on audit. Wecontinually assess the likelihood and amount of potential adjustments and adjust the income tax provisions, income taxes payableand deferred income taxes in the period in which the facts that give rise to a revision become known.
Earnings Per Share, Policy[Policy Text Block]
Earnings per shareBasic earnings per share is calculated by dividing net income by the weighted average number of common shares outstandingduring the period. Diluted earnings per common share is calculated by dividing net income by the sum of the weighted averagenumber of common shares outstanding and all additional common shares that would have been outstanding if potentially dilutivecommon shares had been issued during the period. The treasury stock method is used to compute the dilutive effect of stock-basedcompensation.
New AccountingPronouncements, Policy[Policy Text Block]
Recently adopted accounting pronouncementsIn March 2016, the FASB issued Accounting Standards Update 2016-09, “Compensation – Stock Compensation (Topic 718):Improvements to Employee Share-Based Payment Accounting” (“ASU 2016-09”). ASU 2016-09 simplifies several areas ofaccounting for share-based compensation arrangements, including the income tax impact, classification on the statement of cashflows and forfeitures. ASU 2016-09 is effective for annual periods, and interim periods within those annual periods, beginningafter December 15, 2016, which was our fiscal year beginning February 1, 2017. As a result of adoption, excess tax benefits ordeficiencies related to stock-based compensation are reflected in the Consolidated Statement of Operations as a component of theprovision for income taxes and reported as operating activities in the Consolidated Statement of Cash Flows, on a prospective basis.Effective as of February 1, 2017, the Company adopted a change in accounting policy in accordance with ASU 2016-09 to accountfor forfeitures as they occur. The change was applied on a modified retrospective basis, and no prior periods were restated as a resultof this change in accounting policy. Accordingly, we have recognized a cumulative adjustment charge of less than $0.1 million inaccumulated deficit in the first quarter of fiscal 2018 as a result of the adoption of this change in accounting policy.
In July 2015, the FASB issued Accounting Standards Update 2015-11, “Inventory (Topic 330): Simplifying the Measurement ofInventory” (“ASU 2015-11”). ASU 2015-11 provides guidance to more clearly articulate the requirements for the measurement anddisclosure of inventory. ASU 2015-11 is effective for annual periods, and interim periods within those annual periods, beginningafter December 15, 2016, which was our fiscal year beginning February 1, 2017. The Company adopted this guidance in the firstquarter of fiscal 2018. The adoption of this standard did not have a material impact on our results of operations or disclosures.
Recently issued accounting pronouncementsIn May 2014, the FASB issued Accounting Standards Update 2014-09, “Revenue from Contracts with Customers” (“ASU2014-09”) and issued subsequent amendments to the initial guidance during 2015 and 2016, collectively referred to as “Topic 606”.These updates supersede the revenue recognition requirements in ASC Topic 605, "Revenue Recognition" and nearly all otherexisting revenue recognition guidance under US GAAP. The core principle of Topic 606 is to recognize revenues when promisedgoods or services are transferred to customers in an amount that reflects the consideration that is expected to be received for thosegoods or services. Topic 606 can be applied either (i) retrospectively to each prior reporting period presented with the option toelect certain practical expedients; or (ii) retrospectively with the cumulative effect recognized at the date of initial application andproviding certain additional disclosures (the “cumulative effect approach”). Topic 606 is effective for annual periods, and interimperiods within those annual periods, beginning after December 15, 2017, which will be our fiscal year beginning February 1, 2018(fiscal 2019). Early adoption is permitted. We anticipate that we will adopt Topic 606 using the cumulative effect approach whenthis guidance becomes effective for us, starting in the first quarter of fiscal 2019.
We are currently evaluating the effects that the adoption of Topic 606 will have on our results of operations, financial position anddisclosures. To date we have established a project team with the objective of evaluating the effect that Topic 606 will have on ourconsolidated financial statements, related disclosures, business processes, systems and controls. We are analyzing the impact of thenew standard on our contracts by reviewing current accounting policies, practices and our revenue contracts to identify potentialdifferences that would result from applying the requirements of the new standard. In parallel, we are assessing the changes toour business processes, systems and controls in order to support recognition and disclosure under the new standard. While we arecontinuing to assess all potential impacts of the new revenue recognition standard, we currently believe the most significant impactwill relate to our accounting for costs to obtain a contract, on premise subscription offerings as well as expanded disclosures relatedto revenue, performance obligations and contract balances.
Under the new standard, we will defer all incremental commission costs to obtain customer contracts and amortize these costs overan expected period of benefit, which we have determined to be approximately five years. As a result, we expect an increase indeferred commission assets and a change in the timing of recognition of commission expense in future reporting periods under thenew standard. We anticipate a retained earnings adjustment of approximately $2.0 to $3.0 million, net of a tax impact of $0.8 to $1.1million, upon adoption related to contract costs. The ultimate impact is subject to actual commissions earned in fiscal 2018.
Under current GAAP, revenue attributable to subscription services related to on premise offerings is recognized ratably over theterm of the arrangement because Vendor Specific Objective Evidence (VSOE) does not exist for the undelivered maintenance andsupport element as it is not sold separately. The requirement to have VSOE for undelivered elements to enable the separation ofthe delivered software licenses is eliminated under the new revenue recognition standard. Accordingly, under this new standardwe will be required to recognize as revenue a portion of the arrangement fee upon delivery of the initial software at the outset of
Copyright © 2018 www.secdatabase.com. All Rights Reserved.Please Consider the Environment Before Printing This Document
the arrangement. This difference will result in allocating a transaction price to the delivered software component of a subscriptionoffering and thus an earlier recognition of revenue related to that transaction price. The Company continues to evaluate the impactrelated to on premise subscription offerings.
In January 2016, the FASB issued Accounting Standards Update 2016-01, “Financial Instruments—Overall (Subtopic 825-10):Recognition and Measurement of Financial Assets and Financial Liabilities” (“ASU 2016-01”). ASU 2016-01 supersedes theguidance to classify equity securities with readily determinable fair values into different categories reducing the number of itemsthat are recognized in other comprehensive income as well as simplifying the impairment assessment of equity investments withoutreadily determinable fair values. ASU 2016-01 is effective for annual periods, and interim periods within those annual periods,beginning after December 15, 2017, which will be our fiscal year beginning February 1, 2018 (fiscal 2019). The Company willadopt this guidance in the first quarter of fiscal 2019. The adoption of this amendment is not expected to have a material impact onour results of operations or disclosures.
In February 2016, the FASB issued Accounting Standards Update 2016-02, “Leases (Topic 842)” (“ASU 2016-02”). ASU 2016-02supersedes the lease guidance in ASC Topic 840, “Leases” and requires the recognition of lease assets and lease liabilities by lesseesfor those leases classified as operating leases. ASU 2016-02 is effective for annual periods, and interim periods within those annualperiods, beginning after December 15, 2018, which will be our fiscal year beginning February 1, 2019 (fiscal 2020). The Companywill adopt this guidance in the first quarter of fiscal 2020. The adoption of this standard is expected to increase assets and liabilities,as we will be required to record a right-of-use asset and a corresponding lease liability in our consolidated financial statements,as well as a decrease to operating costs, an increase to finance costs (due to accretion of the lease liability) and an increase todepreciation and amortization (due to amortization of the right-of-use asset). The Company continues to evaluate the impact thatthe adoption will have on its results of operations, financial position and disclosures.
In June 2016, the FASB issued Accounting Standards Update 2016-13, “Financial Instruments – Credit Losses (Topic 326):Measurement of Credit Losses on Financial Instruments” (“ASU 2016-13”). ASU 2016-13 requires measurement and recognitionof expected credit losses for financial assets held. ASU 2016-13 is effective for annual periods, and interim periods within thoseannual periods, beginning after December 15, 2019, which will be our fiscal year beginning February 1, 2020 (fiscal 2021). Earlyadoption is permitted. The Company will adopt this guidance in the first quarter of fiscal 2021 and is currently evaluating the impactthat the adoption will have on its results of operations, financial position and disclosures.
In August 2016, the FASB issued Accounting Standards Update 2016-15, “Statement of Cash Flows (Topic 230): Classificationof Certain Cash Receipts and Cash Payments” (“ASU 2016-15”). ASU 2016-15 clarifies the presentation and classification in thestatement of cash flows. ASU 2016-15 is effective for annual periods, and interim periods within those annual periods, beginningafter December 15, 2017, which will be our fiscal year beginning February 1, 2018 (fiscal 2019). Early adoption is permitted. TheCompany will adopt this guidance in the first quarter of fiscal 2019. The adoption of this amendment is not expected to have amaterial impact on our results of operations or disclosures.
In October 2016, the FASB issued Accounting Standards Update 2016-16, “Income Taxes (Topic 740): Intra-Entity Transfers ofAssets Other Than Inventory” (“ASU 2016-16”). ASU 2016-16 requires the recognition of the income tax consequences of an intra-entity transfer of an asset other than inventory when the transfer occurs. ASU 2016-16 is effective for annual periods, and interimperiods within those annual periods, beginning after December 15, 2017, which will be our fiscal year beginning February 1, 2018(fiscal 2019). Early adoption is permitted. The Company will adopt this guidance in the first quarter of fiscal 2019. The adoptionof this standard will result in the write-off of the balance of unamortized deferred tax charges and the recognition of previouslyunrecognized deferred tax assets in certain jurisdictions. We anticipate an increase in retained earnings of up to $4.0 million uponadoption related to the unrecognized income tax effects of asset transfers that occurred prior to adoption.
In January 2017, the FASB issued Accounting Standards Update 2017-01, “Business Combinations (Topic 805): Clarifying theDefinition of a Business” (“ASU 2017-01”). ASU 2017-01 clarifies the definition of a business to assist entities with evaluatingwhether transactions should be accounted for as acquisitions of assets or businesses. ASU 2017-01 is effective for annual periods,and interim periods within those annual periods, beginning after December 15, 2017, which will be our fiscal year beginningFebruary 1, 2018 (fiscal 2019). Early adoption is not permitted. The Company will adopt this guidance in the first quarter of fiscal2019. The adoption of this amendment is not expected to have a material impact on our results of operations or disclosures.
In January 2017, the FASB issued Accounting Standards Update 2017-04, “Intangibles – Goodwill and Other (Topic 350):Simplifying the Test for Goodwill Impairment” (“ASU 2017-04”). ASU 2017-04 simplifies how an entity is required to testgoodwill for impairment. ASU 2017-04 is effective for annual periods, and interim periods within those annual periods, beginningafter December 15, 2019, which will be our fiscal year beginning February 1, 2020 (fiscal 2021). Early adoption is permitted. TheCompany will adopt this guidance in the first quarter of fiscal 2021. The adoption of this amendment is not expected to have amaterial impact on our results of operations or disclosures.
In May 2017, the FASB issued Accounting Standards Update 2017-09, “Compensation – Stock Compensation (Topic 718): Scopeof Modification Accounting” (“ASU 2017-09”). ASU 2017-09 clarifies the guidance on when to apply modification accountingfor share-based payment awards. ASU 2017-09 is effective for annual periods, and interim periods within those annual periods,beginning after December 15, 2017, which will be our fiscal year beginning February 1, 2018 (fiscal 2019). Early adoption ispermitted. The Company will adopt this guidance in the first quarter of fiscal 2019. The adoption of this amendment is not expectedto have a material impact on our results of operations or disclosures.
Copyright © 2018 www.secdatabase.com. All Rights Reserved.Please Consider the Environment Before Printing This Document
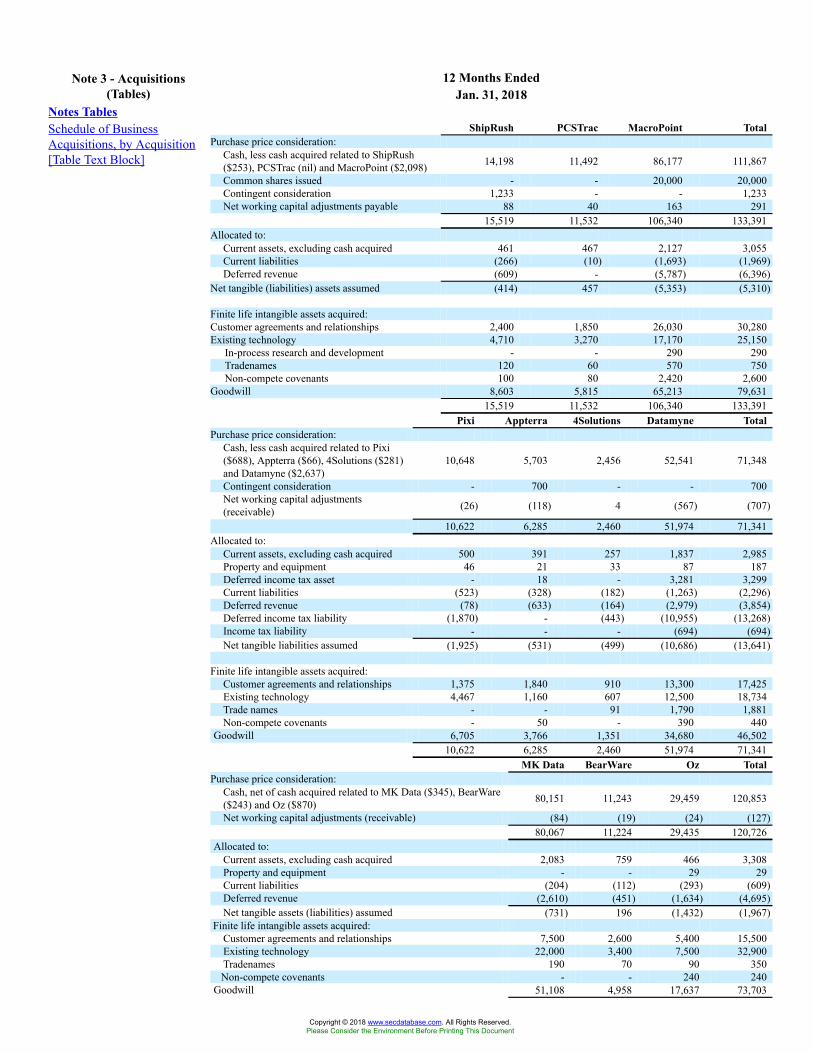
12 Months EndedNote 3 - Acquisitions(Tables) Jan. 31, 2018
Notes TablesSchedule of BusinessAcquisitions, by Acquisition[Table Text Block]
ShipRush PCSTrac MacroPoint TotalPurchase price consideration:
Cash, less cash acquired related to ShipRush($253), PCSTrac (nil) and MacroPoint ($2,098) 14,198 11,492 86,177 111,867
Common shares issued - - 20,000 20,000Contingent consideration 1,233 - - 1,233Net working capital adjustments payable 88 40 163 291
15,519 11,532 106,340 133,391Allocated to:
Current assets, excluding cash acquired 461 467 2,127 3,055Current liabilities (266) (10) (1,693) (1,969)Deferred revenue (609) - (5,787) (6,396)
Net tangible (liabilities) assets assumed (414) 457 (5,353) (5,310)
Finite life intangible assets acquired:Customer agreements and relationships 2,400 1,850 26,030 30,280Existing technology 4,710 3,270 17,170 25,150
In-process research and development - - 290 290Tradenames 120 60 570 750Non-compete covenants 100 80 2,420 2,600
Goodwill 8,603 5,815 65,213 79,63115,519 11,532 106,340 133,391
Pixi Appterra 4Solutions Datamyne TotalPurchase price consideration:
Cash, less cash acquired related to Pixi($688), Appterra ($66), 4Solutions ($281)and Datamyne ($2,637)
10,648 5,703 2,456 52,541 71,348
Contingent consideration - 700 - - 700Net working capital adjustments(receivable) (26) (118) 4 (567) (707)
10,622 6,285 2,460 51,974 71,341Allocated to:
Current assets, excluding cash acquired 500 391 257 1,837 2,985Property and equipment 46 21 33 87 187Deferred income tax asset - 18 - 3,281 3,299Current liabilities (523) (328) (182) (1,263) (2,296)Deferred revenue (78) (633) (164) (2,979) (3,854)Deferred income tax liability (1,870) - (443) (10,955) (13,268)Income tax liability - - - (694) (694)Net tangible liabilities assumed (1,925) (531) (499) (10,686) (13,641)
Finite life intangible assets acquired:Customer agreements and relationships 1,375 1,840 910 13,300 17,425Existing technology 4,467 1,160 607 12,500 18,734Trade names - - 91 1,790 1,881Non-compete covenants - 50 - 390 440
Goodwill 6,705 3,766 1,351 34,680 46,50210,622 6,285 2,460 51,974 71,341
MK Data BearWare Oz TotalPurchase price consideration:
Cash, net of cash acquired related to MK Data ($345), BearWare($243) and Oz ($870) 80,151 11,243 29,459 120,853
Net working capital adjustments (receivable) (84) (19) (24) (127)80,067 11,224 29,435 120,726
Allocated to:Current assets, excluding cash acquired 2,083 759 466 3,308Property and equipment - - 29 29Current liabilities (204) (112) (293) (609)Deferred revenue (2,610) (451) (1,634) (4,695)Net tangible assets (liabilities) assumed (731) 196 (1,432) (1,967)
Finite life intangible assets acquired:Customer agreements and relationships 7,500 2,600 5,400 15,500Existing technology 22,000 3,400 7,500 32,900Tradenames 190 70 90 350Non-compete covenants - - 240 240
Goodwill 51,108 4,958 17,637 73,703
Copyright © 2018 www.secdatabase.com. All Rights Reserved.Please Consider the Environment Before Printing This Document
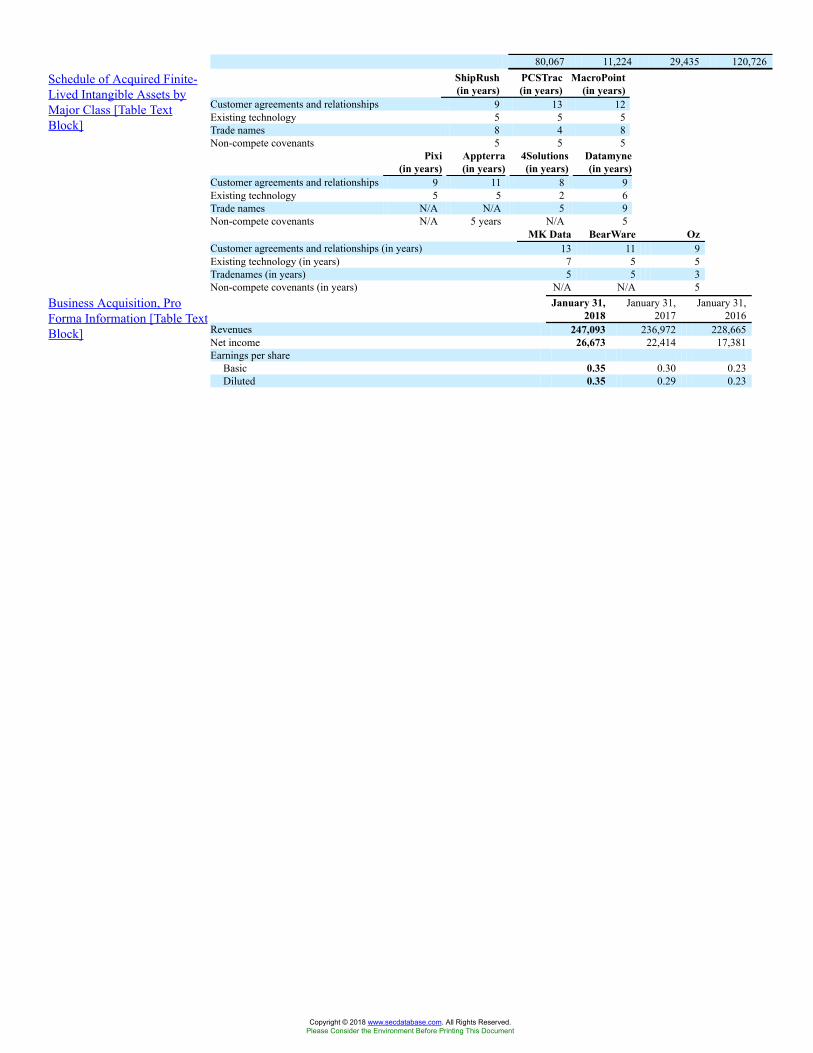
80,067 11,224 29,435 120,726
Schedule of Acquired Finite-Lived Intangible Assets byMajor Class [Table TextBlock]
ShipRush(in years)
PCSTrac(in years)
MacroPoint(in years)
Customer agreements and relationships 9 13 12Existing technology 5 5 5Trade names 8 4 8Non-compete covenants 5 5 5
Pixi(in years)
Appterra(in years)
4Solutions(in years)
Datamyne(in years)
Customer agreements and relationships 9 11 8 9Existing technology 5 5 2 6Trade names N/A N/A 5 9Non-compete covenants N/A 5 years N/A 5
MK Data BearWare OzCustomer agreements and relationships (in years) 13 11 9Existing technology (in years) 7 5 5Tradenames (in years) 5 5 3Non-compete covenants (in years) N/A N/A 5
Business Acquisition, ProForma Information [Table TextBlock]
January 31,2018
January 31,2017
January 31,2016
Revenues 247,093 236,972 228,665Net income 26,673 22,414 17,381Earnings per share
Basic 0.35 0.30 0.23Diluted 0.35 0.29 0.23
Copyright © 2018 www.secdatabase.com. All Rights Reserved.Please Consider the Environment Before Printing This Document
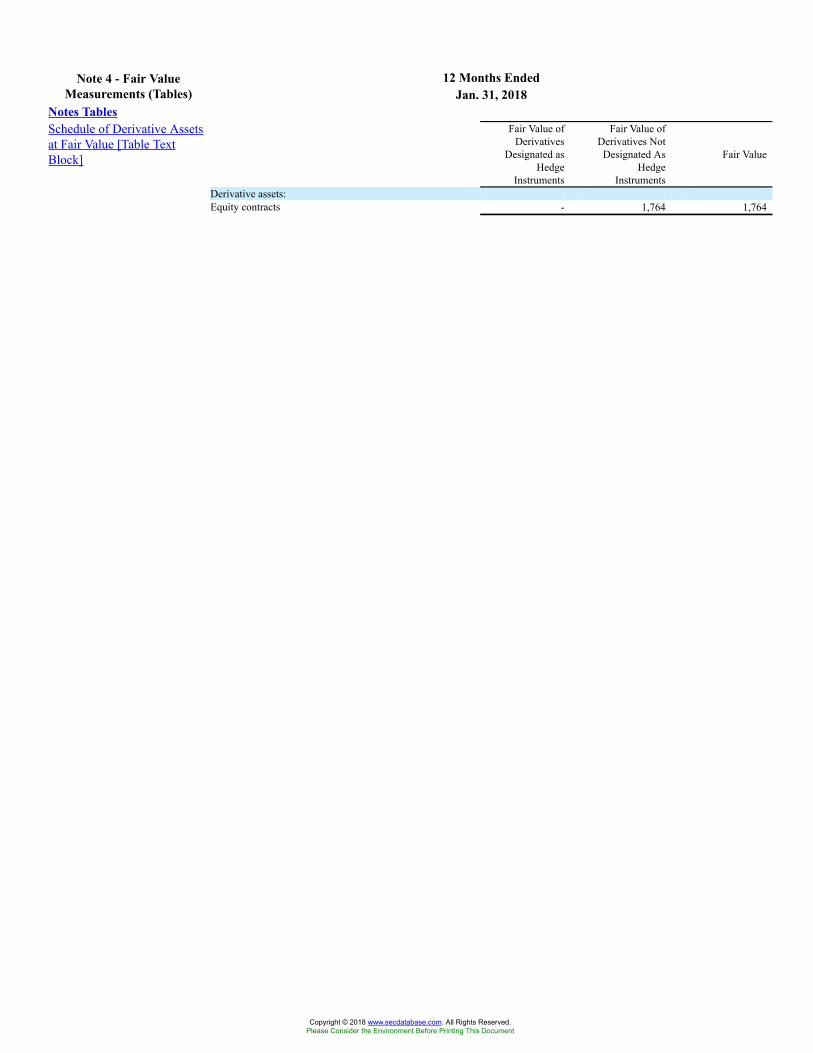
12 Months EndedNote 4 - Fair ValueMeasurements (Tables) Jan. 31, 2018
Notes TablesSchedule of Derivative Assetsat Fair Value [Table TextBlock]
Fair Value ofDerivatives
Designated asHedge
Instruments
Fair Value ofDerivatives NotDesignated As
HedgeInstruments
Fair Value
Derivative assets:Equity contracts - 1,764 1,764
Copyright © 2018 www.secdatabase.com. All Rights Reserved.Please Consider the Environment Before Printing This Document
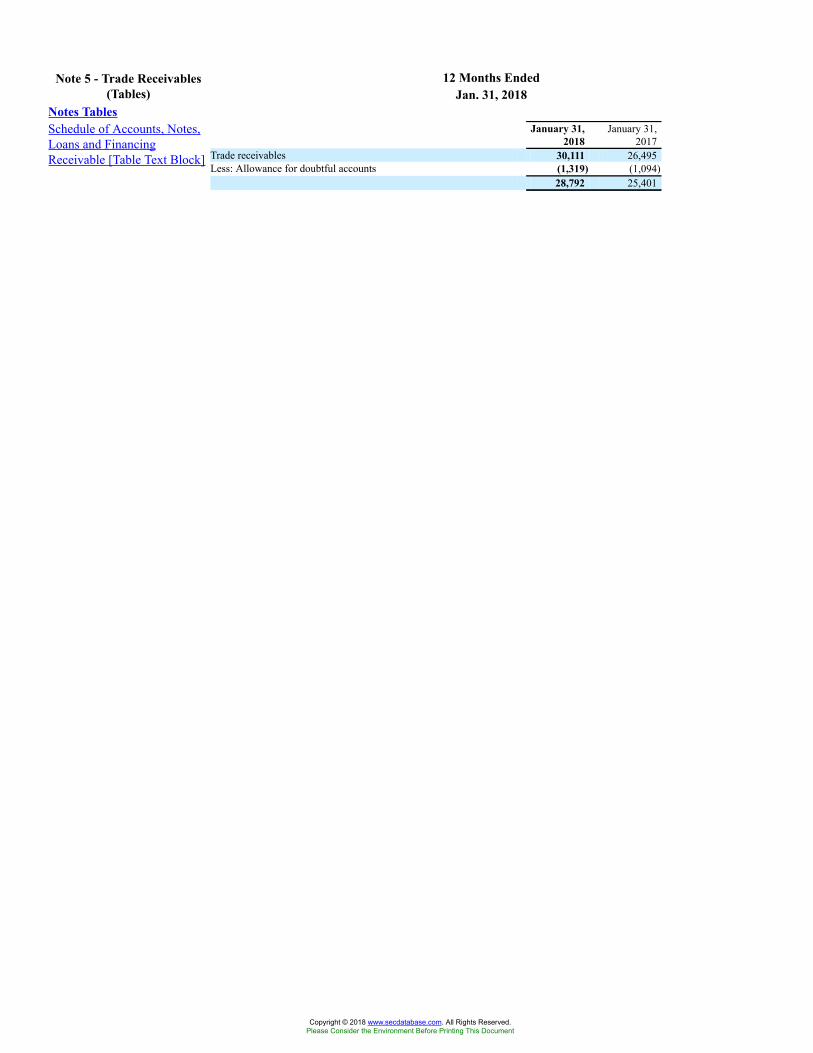
12 Months EndedNote 5 - Trade Receivables(Tables) Jan. 31, 2018
Notes TablesSchedule of Accounts, Notes,Loans and FinancingReceivable [Table Text Block]
January 31,2018
January 31,2017
Trade receivables 30,111 26,495Less: Allowance for doubtful accounts (1,319) (1,094)
28,792 25,401
Copyright © 2018 www.secdatabase.com. All Rights Reserved.Please Consider the Environment Before Printing This Document
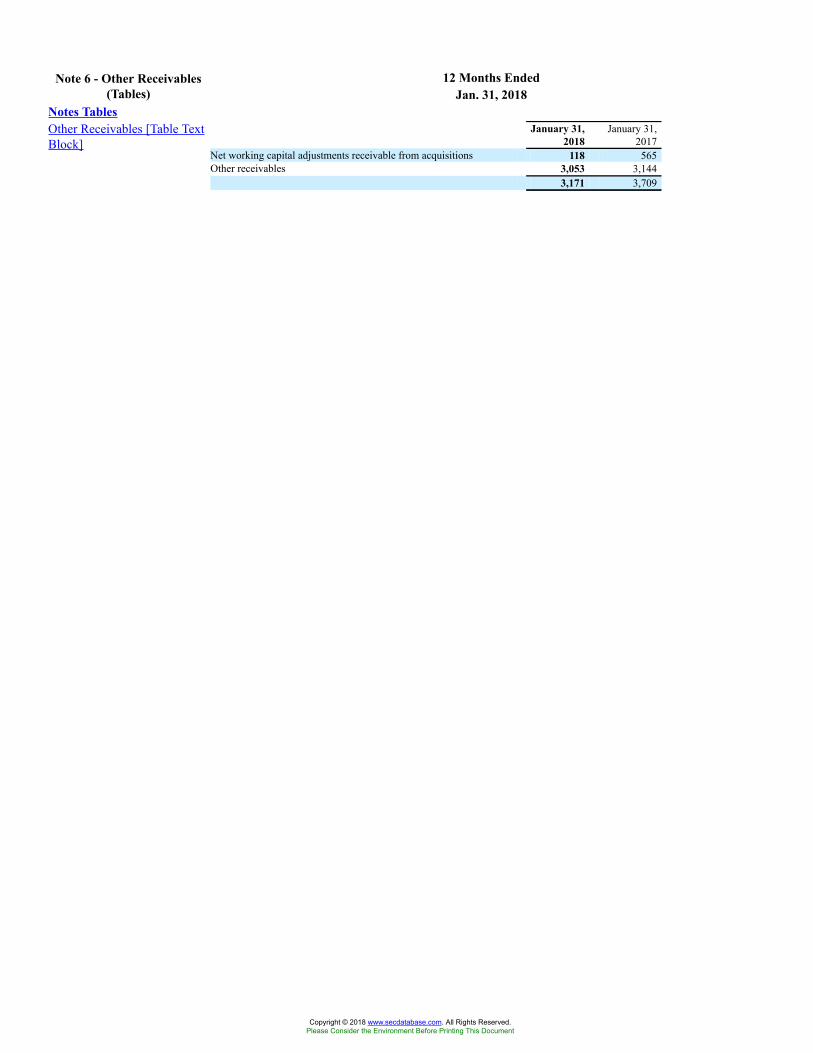
12 Months EndedNote 6 - Other Receivables(Tables) Jan. 31, 2018
Notes TablesOther Receivables [Table TextBlock]
January 31,2018
January 31,2017
Net working capital adjustments receivable from acquisitions 118 565Other receivables 3,053 3,144
3,171 3,709
Copyright © 2018 www.secdatabase.com. All Rights Reserved.Please Consider the Environment Before Printing This Document
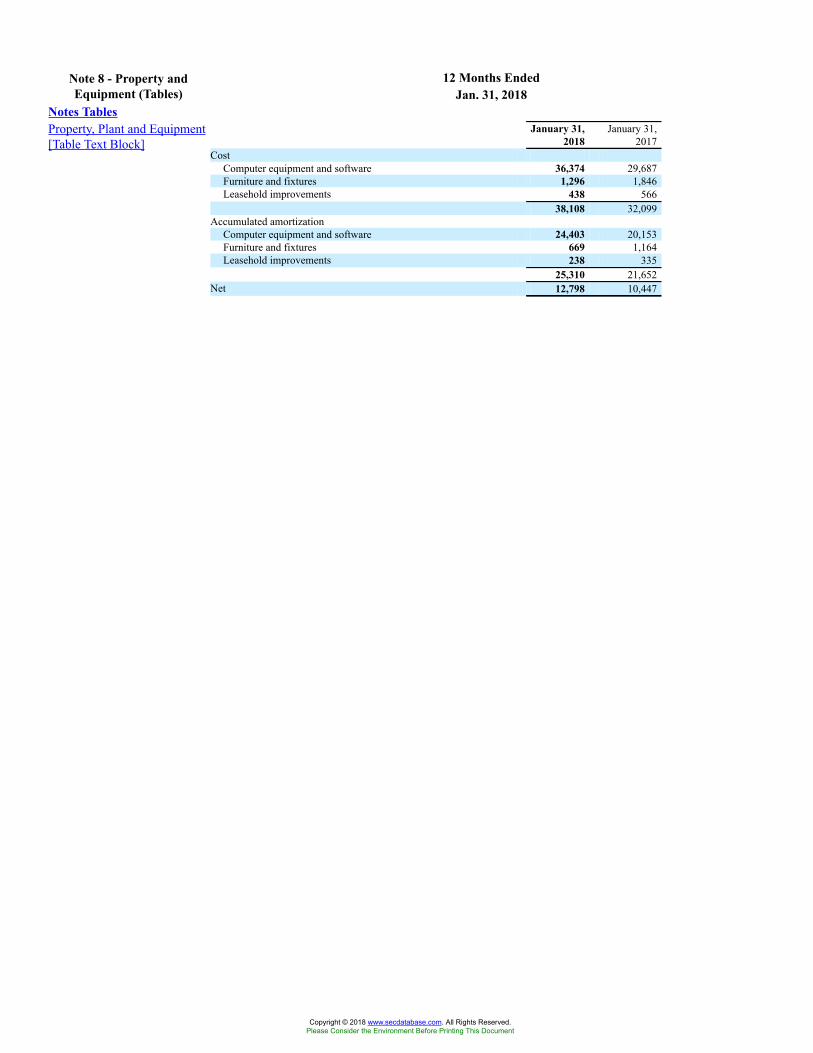
12 Months EndedNote 8 - Property andEquipment (Tables) Jan. 31, 2018
Notes TablesProperty, Plant and Equipment[Table Text Block]
January 31,2018
January 31,2017
CostComputer equipment and software 36,374 29,687Furniture and fixtures 1,296 1,846Leasehold improvements 438 566
38,108 32,099Accumulated amortization
Computer equipment and software 24,403 20,153Furniture and fixtures 669 1,164Leasehold improvements 238 335
25,310 21,652Net 12,798 10,447
Copyright © 2018 www.secdatabase.com. All Rights Reserved.Please Consider the Environment Before Printing This Document
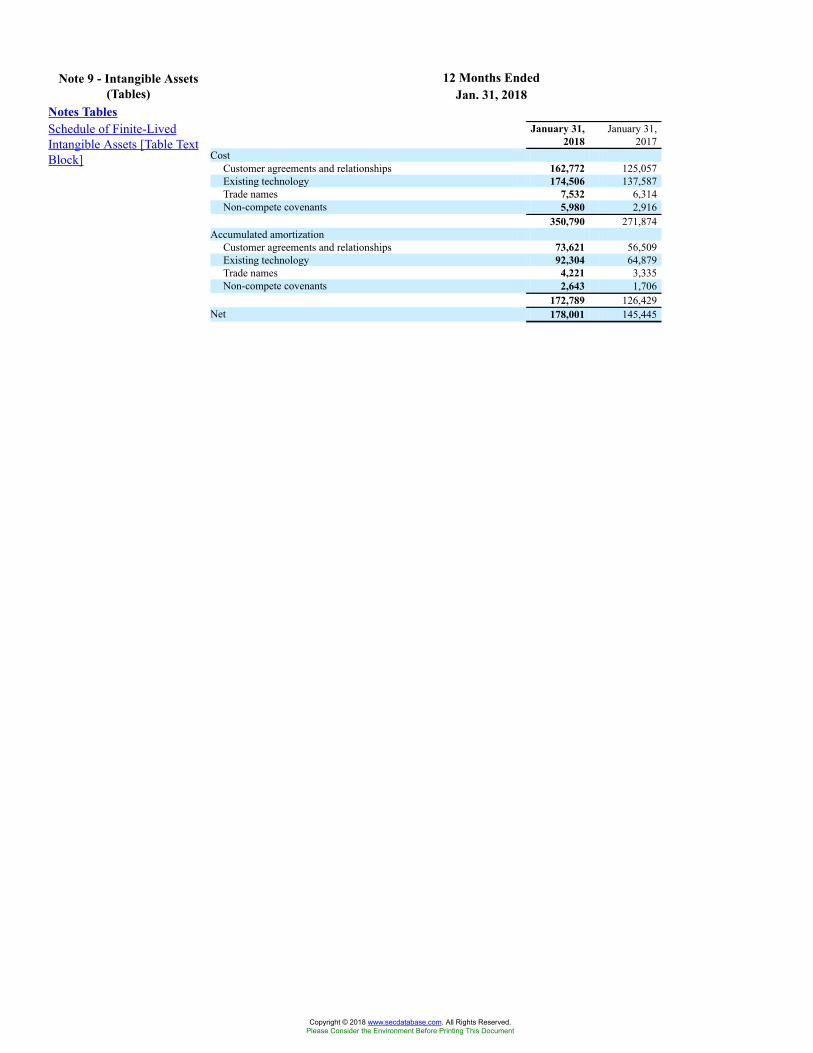
12 Months EndedNote 9 - Intangible Assets(Tables) Jan. 31, 2018
Notes TablesSchedule of Finite-LivedIntangible Assets [Table TextBlock]
January 31,2018
January 31,2017
CostCustomer agreements and relationships 162,772 125,057Existing technology 174,506 137,587Trade names 7,532 6,314Non-compete covenants 5,980 2,916
350,790 271,874Accumulated amortization
Customer agreements and relationships 73,621 56,509Existing technology 92,304 64,879Trade names 4,221 3,335Non-compete covenants 2,643 1,706
172,789 126,429Net 178,001 145,445
Copyright © 2018 www.secdatabase.com. All Rights Reserved.Please Consider the Environment Before Printing This Document
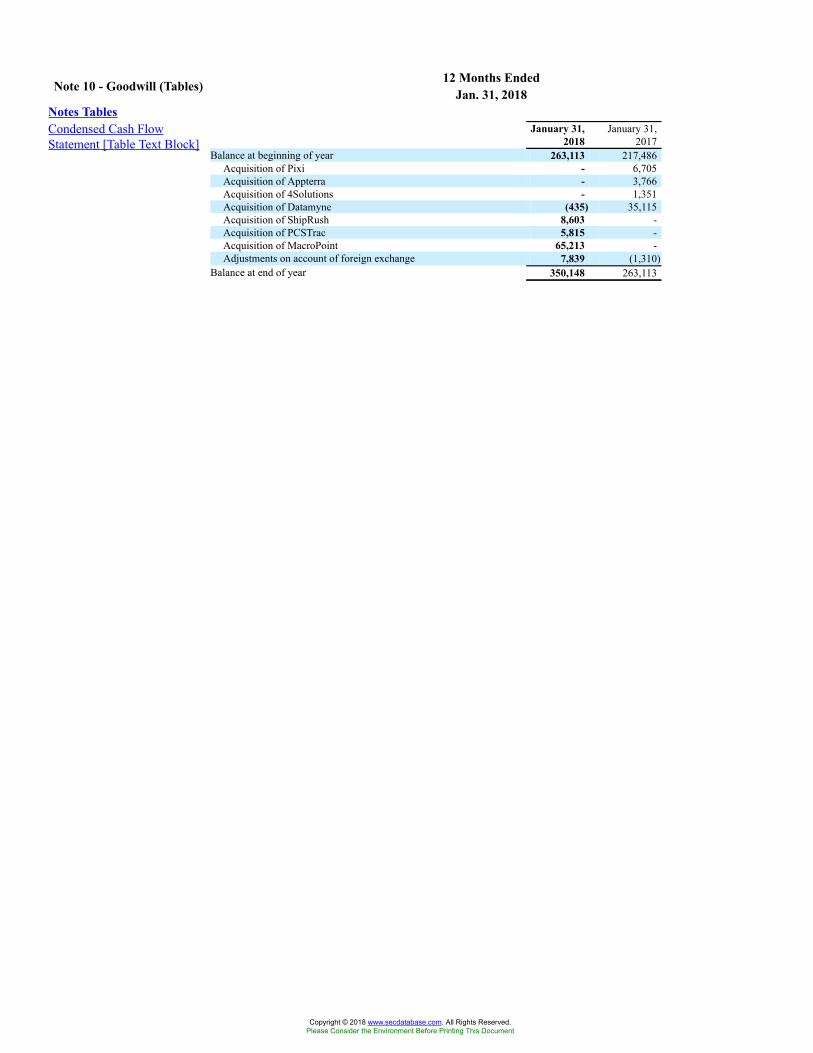
12 Months EndedNote 10 - Goodwill (Tables) Jan. 31, 2018Notes TablesCondensed Cash FlowStatement [Table Text Block]
January 31,2018
January 31,2017
Balance at beginning of year 263,113 217,486Acquisition of Pixi - 6,705Acquisition of Appterra - 3,766Acquisition of 4Solutions - 1,351Acquisition of Datamyne (435) 35,115Acquisition of ShipRush 8,603 -Acquisition of PCSTrac 5,815 -Acquisition of MacroPoint 65,213 -Adjustments on account of foreign exchange 7,839 (1,310)
Balance at end of year 350,148 263,113
Copyright © 2018 www.secdatabase.com. All Rights Reserved.Please Consider the Environment Before Printing This Document
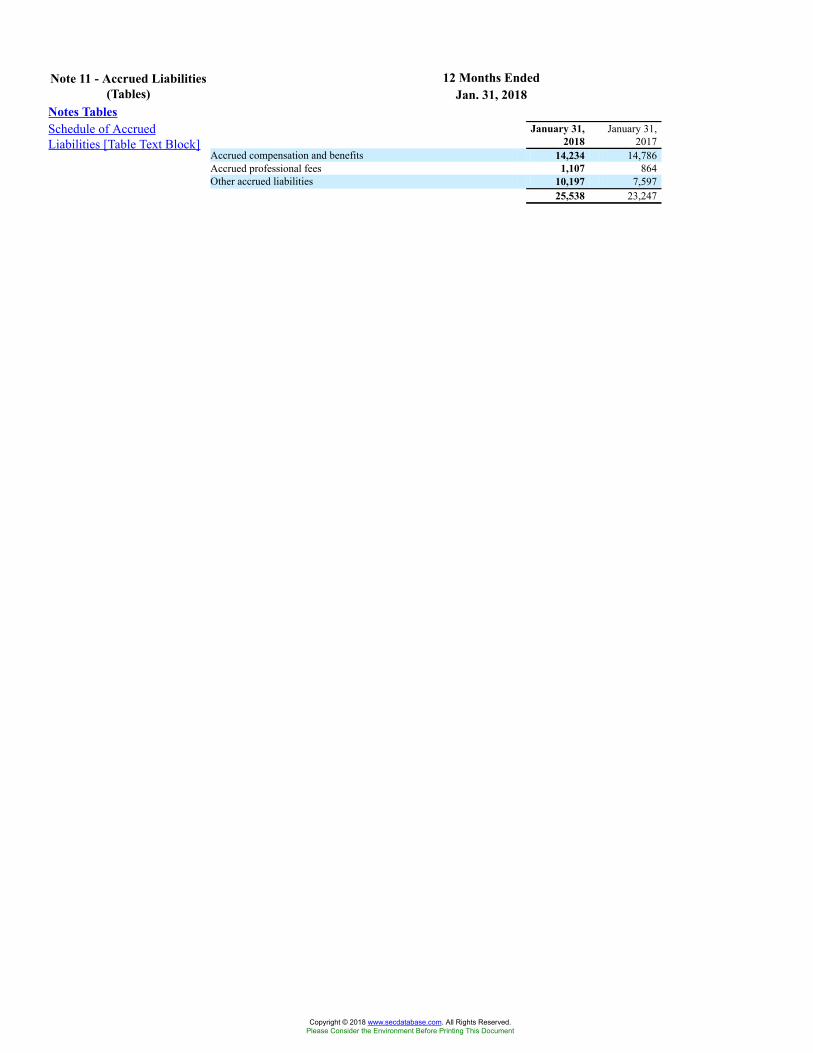
12 Months EndedNote 11 - Accrued Liabilities(Tables) Jan. 31, 2018
Notes TablesSchedule of AccruedLiabilities [Table Text Block]
January 31,2018
January 31,2017
Accrued compensation and benefits 14,234 14,786Accrued professional fees 1,107 864Other accrued liabilities 10,197 7,597
25,538 23,247
Copyright © 2018 www.secdatabase.com. All Rights Reserved.Please Consider the Environment Before Printing This Document
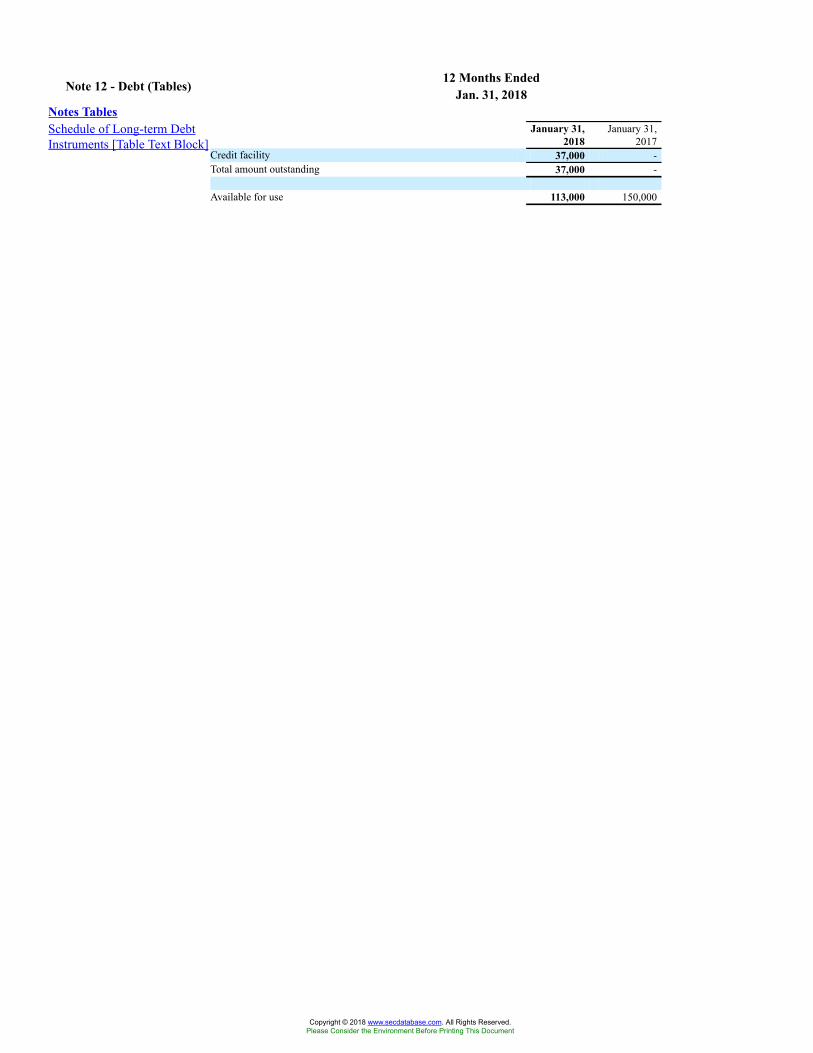
12 Months EndedNote 12 - Debt (Tables) Jan. 31, 2018Notes TablesSchedule of Long-term DebtInstruments [Table Text Block]
January 31,2018
January 31,2017
Credit facility 37,000 -Total amount outstanding 37,000 -
Available for use 113,000 150,000
Copyright © 2018 www.secdatabase.com. All Rights Reserved.Please Consider the Environment Before Printing This Document
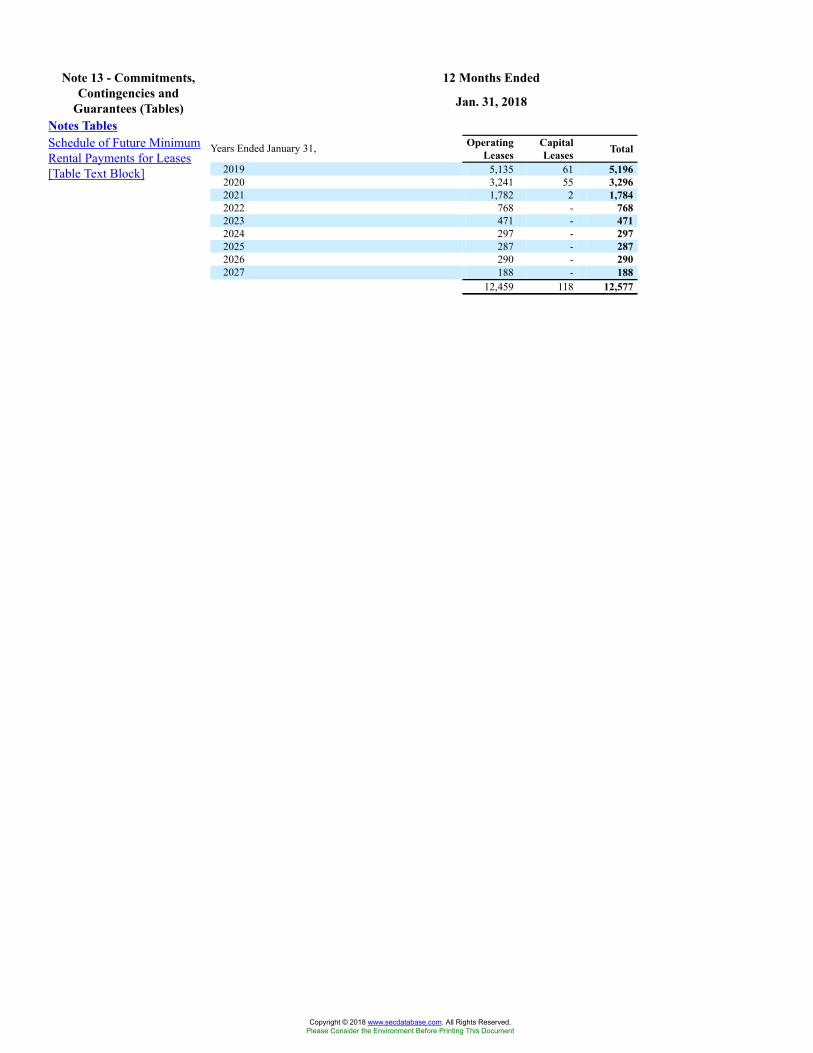
12 Months EndedNote 13 - Commitments,Contingencies and
Guarantees (Tables) Jan. 31, 2018
Notes TablesSchedule of Future MinimumRental Payments for Leases[Table Text Block]
Years Ended January 31, OperatingLeases
CapitalLeases Total
2019 5,135 61 5,1962020 3,241 55 3,2962021 1,782 2 1,7842022 768 - 7682023 471 - 4712024 297 - 2972025 287 - 2872026 290 - 2902027 188 - 188
12,459 118 12,577
Copyright © 2018 www.secdatabase.com. All Rights Reserved.Please Consider the Environment Before Printing This Document
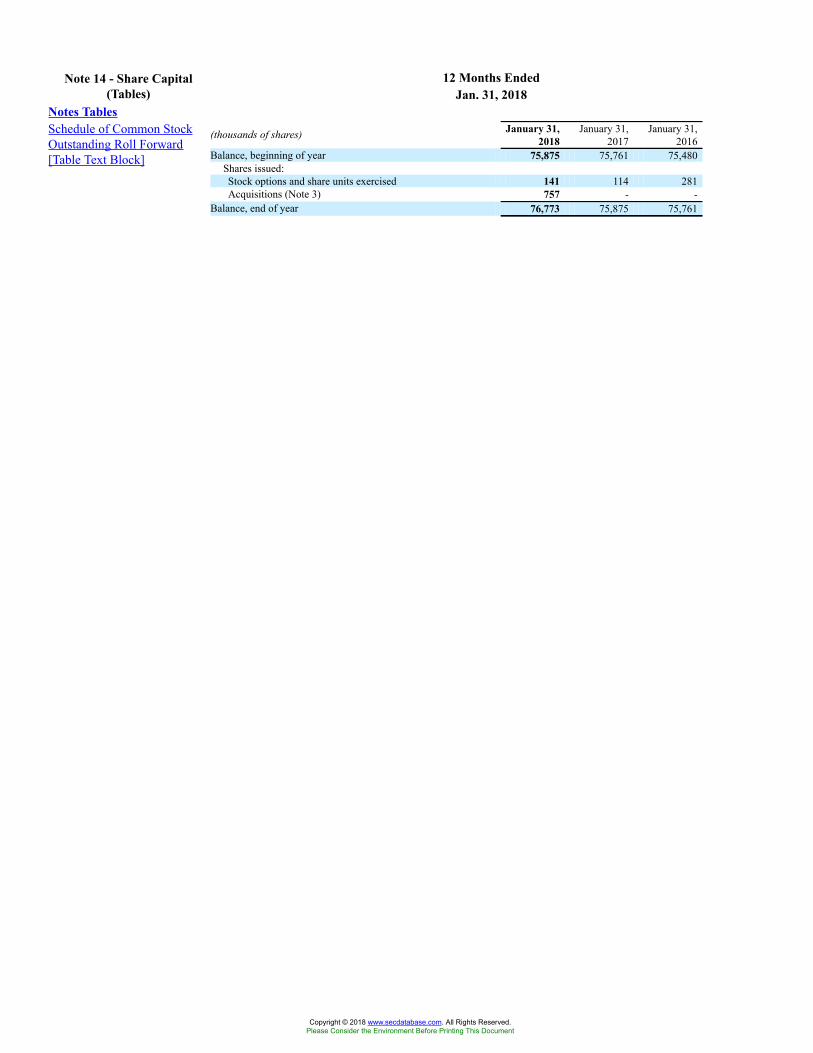
12 Months EndedNote 14 - Share Capital(Tables) Jan. 31, 2018
Notes TablesSchedule of Common StockOutstanding Roll Forward[Table Text Block]
(thousands of shares) January 31,2018
January 31,2017
January 31,2016
Balance, beginning of year 75,875 75,761 75,480Shares issued:Stock options and share units exercised 141 114 281Acquisitions (Note 3) 757 - -
Balance, end of year 76,773 75,875 75,761
Copyright © 2018 www.secdatabase.com. All Rights Reserved.Please Consider the Environment Before Printing This Document
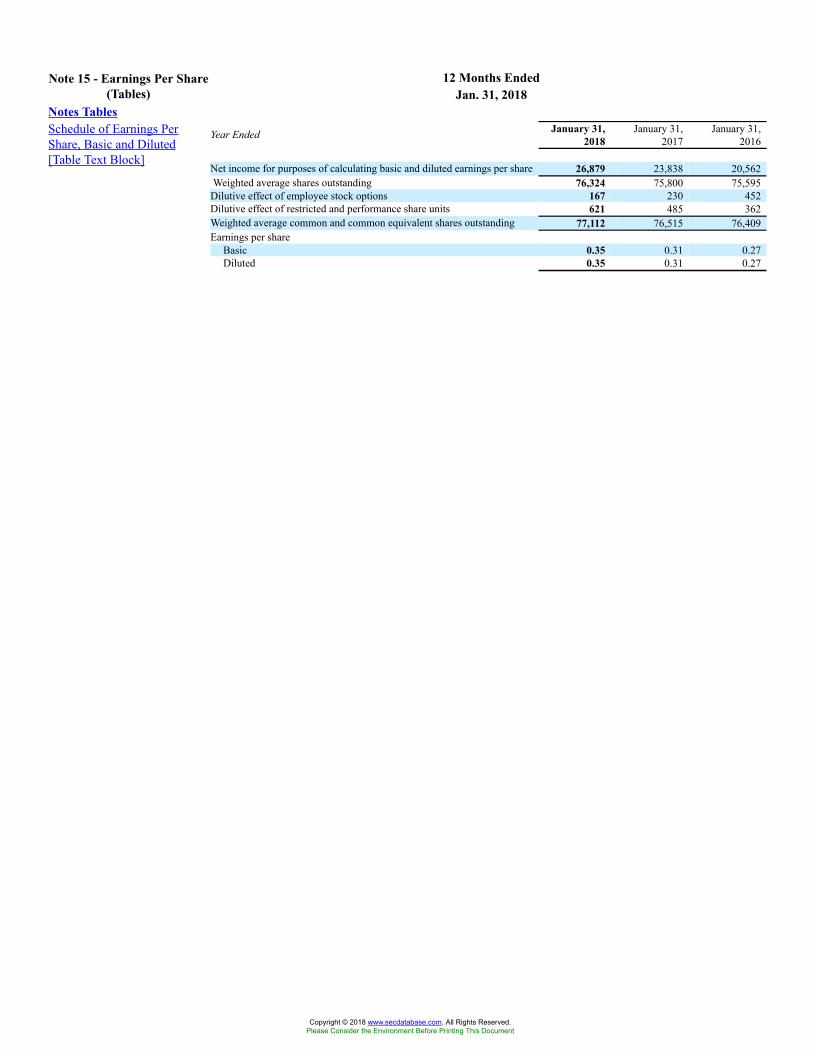
12 Months EndedNote 15 - Earnings Per Share(Tables) Jan. 31, 2018
Notes TablesSchedule of Earnings PerShare, Basic and Diluted[Table Text Block]
Year Ended January 31,2018
January 31,2017
January 31,2016
Net income for purposes of calculating basic and diluted earnings per share 26,879 23,838 20,562Weighted average shares outstanding 76,324 75,800 75,595Dilutive effect of employee stock options 167 230 452Dilutive effect of restricted and performance share units 621 485 362Weighted average common and common equivalent shares outstanding 77,112 76,515 76,409Earnings per share
Basic 0.35 0.31 0.27Diluted 0.35 0.31 0.27
Copyright © 2018 www.secdatabase.com. All Rights Reserved.Please Consider the Environment Before Printing This Document
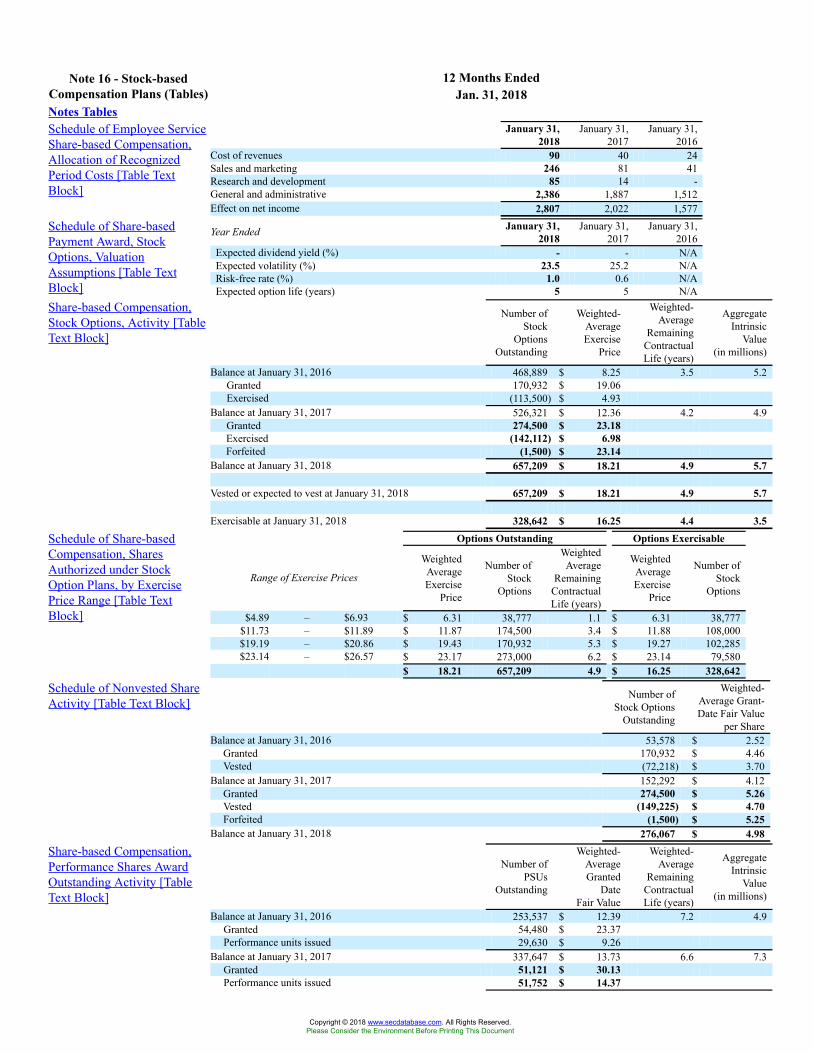
12 Months EndedNote 16 - Stock-basedCompensation Plans (Tables) Jan. 31, 2018Notes TablesSchedule of Employee ServiceShare-based Compensation,Allocation of RecognizedPeriod Costs [Table TextBlock]
January 31,2018
January 31,2017
January 31,2016
Cost of revenues 90 40 24Sales and marketing 246 81 41Research and development 85 14 -General and administrative 2,386 1,887 1,512Effect on net income 2,807 2,022 1,577
Schedule of Share-basedPayment Award, StockOptions, ValuationAssumptions [Table TextBlock]
Year Ended January 31,2018
January 31,2017
January 31,2016
Expected dividend yield (%) - - N/AExpected volatility (%) 23.5 25.2 N/ARisk-free rate (%) 1.0 0.6 N/AExpected option life (years) 5 5 N/A
Share-based Compensation,Stock Options, Activity [TableText Block]
Number ofStock
OptionsOutstanding
Weighted-AverageExercise
Price
Weighted-Average
RemainingContractualLife (years)
AggregateIntrinsic
Value(in millions)
Balance at January 31, 2016 468,889 $ 8.25 3.5 5.2Granted 170,932 $ 19.06Exercised (113,500) $ 4.93
Balance at January 31, 2017 526,321 $ 12.36 4.2 4.9Granted 274,500 $ 23.18Exercised (142,112) $ 6.98Forfeited (1,500) $ 23.14
Balance at January 31, 2018 657,209 $ 18.21 4.9 5.7
Vested or expected to vest at January 31, 2018 657,209 $ 18.21 4.9 5.7
Exercisable at January 31, 2018 328,642 $ 16.25 4.4 3.5Schedule of Share-basedCompensation, SharesAuthorized under StockOption Plans, by ExercisePrice Range [Table TextBlock]
Options Outstanding Options Exercisable
Range of Exercise Prices
WeightedAverageExercise
Price
Number ofStock
Options
WeightedAverage
RemainingContractualLife (years)
WeightedAverageExercise
Price
Number ofStock
Options
$4.89 – $6.93 $ 6.31 38,777 1.1 $ 6.31 38,777$11.73 – $11.89 $ 11.87 174,500 3.4 $ 11.88 108,000$19.19 – $20.86 $ 19.43 170,932 5.3 $ 19.27 102,285$23.14 – $26.57 $ 23.17 273,000 6.2 $ 23.14 79,580
$ 18.21 657,209 4.9 $ 16.25 328,642Schedule of Nonvested ShareActivity [Table Text Block]
Number ofStock Options
Outstanding
Weighted-Average Grant-Date Fair Value
per ShareBalance at January 31, 2016 53,578 $ 2.52
Granted 170,932 $ 4.46Vested (72,218) $ 3.70
Balance at January 31, 2017 152,292 $ 4.12Granted 274,500 $ 5.26Vested (149,225) $ 4.70Forfeited (1,500) $ 5.25
Balance at January 31, 2018 276,067 $ 4.98Share-based Compensation,Performance Shares AwardOutstanding Activity [TableText Block]
Number ofPSUs
Outstanding
Weighted-AverageGranted
DateFair Value
Weighted-Average
RemainingContractualLife (years)
AggregateIntrinsic
Value(in millions)
Balance at January 31, 2016 253,537 $ 12.39 7.2 4.9Granted 54,480 $ 23.37Performance units issued 29,630 $ 9.26
Balance at January 31, 2017 337,647 $ 13.73 6.6 7.3Granted 51,121 $ 30.13Performance units issued 51,752 $ 14.37
Copyright © 2018 www.secdatabase.com. All Rights Reserved.Please Consider the Environment Before Printing This Document
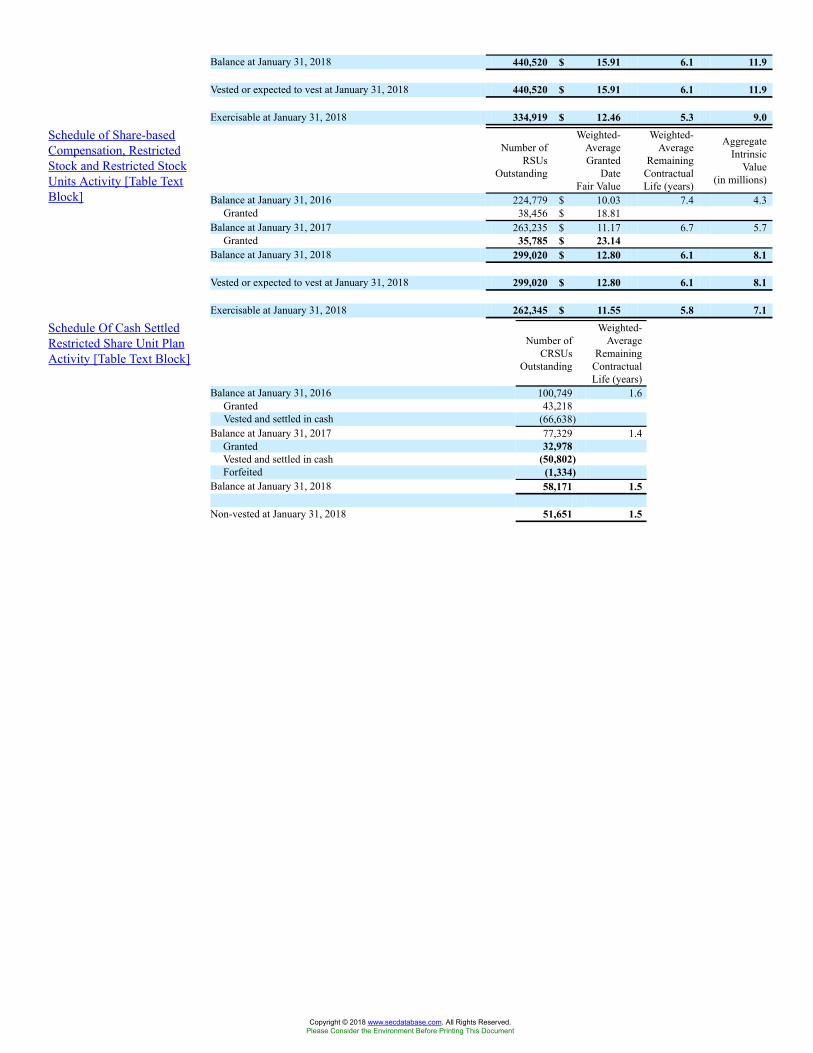
Balance at January 31, 2018 440,520 $ 15.91 6.1 11.9
Vested or expected to vest at January 31, 2018 440,520 $ 15.91 6.1 11.9
Exercisable at January 31, 2018 334,919 $ 12.46 5.3 9.0Schedule of Share-basedCompensation, RestrictedStock and Restricted StockUnits Activity [Table TextBlock]
Number ofRSUs
Outstanding
Weighted-AverageGranted
DateFair Value
Weighted-Average
RemainingContractualLife (years)
AggregateIntrinsic
Value(in millions)
Balance at January 31, 2016 224,779 $ 10.03 7.4 4.3Granted 38,456 $ 18.81
Balance at January 31, 2017 263,235 $ 11.17 6.7 5.7Granted 35,785 $ 23.14
Balance at January 31, 2018 299,020 $ 12.80 6.1 8.1
Vested or expected to vest at January 31, 2018 299,020 $ 12.80 6.1 8.1
Exercisable at January 31, 2018 262,345 $ 11.55 5.8 7.1Schedule Of Cash SettledRestricted Share Unit PlanActivity [Table Text Block]
Number ofCRSUs
Outstanding
Weighted-Average
RemainingContractualLife (years)
Balance at January 31, 2016 100,749 1.6Granted 43,218Vested and settled in cash (66,638)
Balance at January 31, 2017 77,329 1.4Granted 32,978Vested and settled in cash (50,802)Forfeited (1,334)
Balance at January 31, 2018 58,171 1.5
Non-vested at January 31, 2018 51,651 1.5
Copyright © 2018 www.secdatabase.com. All Rights Reserved.Please Consider the Environment Before Printing This Document
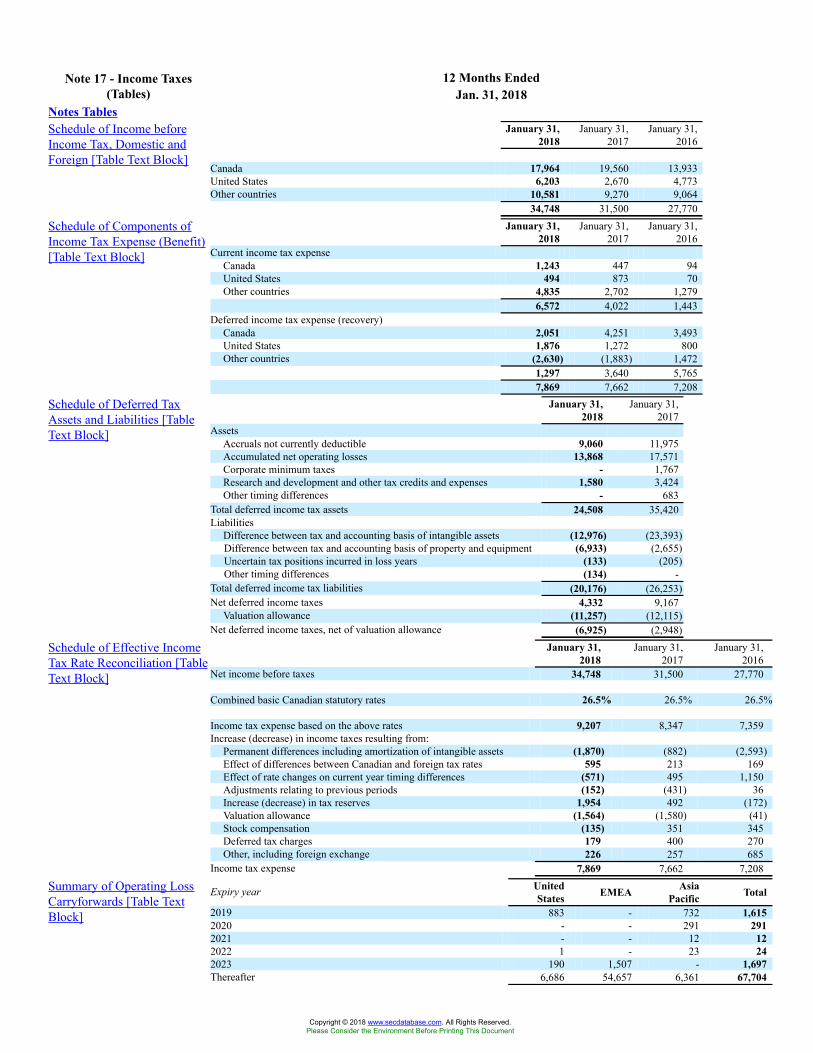
12 Months EndedNote 17 - Income Taxes(Tables) Jan. 31, 2018
Notes TablesSchedule of Income beforeIncome Tax, Domestic andForeign [Table Text Block]
January 31,2018
January 31,2017
January 31,2016
Canada 17,964 19,560 13,933United States 6,203 2,670 4,773Other countries 10,581 9,270 9,064
34,748 31,500 27,770
Schedule of Components ofIncome Tax Expense (Benefit)[Table Text Block]
January 31,2018
January 31,2017
January 31,2016
Current income tax expenseCanada 1,243 447 94United States 494 873 70Other countries 4,835 2,702 1,279
6,572 4,022 1,443Deferred income tax expense (recovery)
Canada 2,051 4,251 3,493United States 1,876 1,272 800Other countries (2,630) (1,883) 1,472
1,297 3,640 5,7657,869 7,662 7,208
Schedule of Deferred TaxAssets and Liabilities [TableText Block]
January 31,2018
January 31,2017
AssetsAccruals not currently deductible 9,060 11,975Accumulated net operating losses 13,868 17,571Corporate minimum taxes - 1,767Research and development and other tax credits and expenses 1,580 3,424Other timing differences - 683
Total deferred income tax assets 24,508 35,420Liabilities
Difference between tax and accounting basis of intangible assets (12,976) (23,393)Difference between tax and accounting basis of property and equipment (6,933) (2,655)Uncertain tax positions incurred in loss years (133) (205)Other timing differences (134) -
Total deferred income tax liabilities (20,176) (26,253)Net deferred income taxes 4,332 9,167
Valuation allowance (11,257) (12,115)Net deferred income taxes, net of valuation allowance (6,925) (2,948)
Schedule of Effective IncomeTax Rate Reconciliation [TableText Block]
January 31,2018
January 31,2017
January 31,2016
Net income before taxes 34,748 31,500 27,770
Combined basic Canadian statutory rates 26.5% 26.5% 26.5%
Income tax expense based on the above rates 9,207 8,347 7,359Increase (decrease) in income taxes resulting from:
Permanent differences including amortization of intangible assets (1,870) (882) (2,593)Effect of differences between Canadian and foreign tax rates 595 213 169Effect of rate changes on current year timing differences (571) 495 1,150Adjustments relating to previous periods (152) (431) 36Increase (decrease) in tax reserves 1,954 492 (172)Valuation allowance (1,564) (1,580) (41)Stock compensation (135) 351 345Deferred tax charges 179 400 270Other, including foreign exchange 226 257 685
Income tax expense 7,869 7,662 7,208
Summary of Operating LossCarryforwards [Table TextBlock]
Expiry year UnitedStates EMEA Asia
Pacific Total
2019 883 - 732 1,6152020 - - 291 2912021 - - 12 122022 1 - 23 242023 190 1,507 - 1,697Thereafter 6,686 54,657 6,361 67,704
Copyright © 2018 www.secdatabase.com. All Rights Reserved.Please Consider the Environment Before Printing This Document
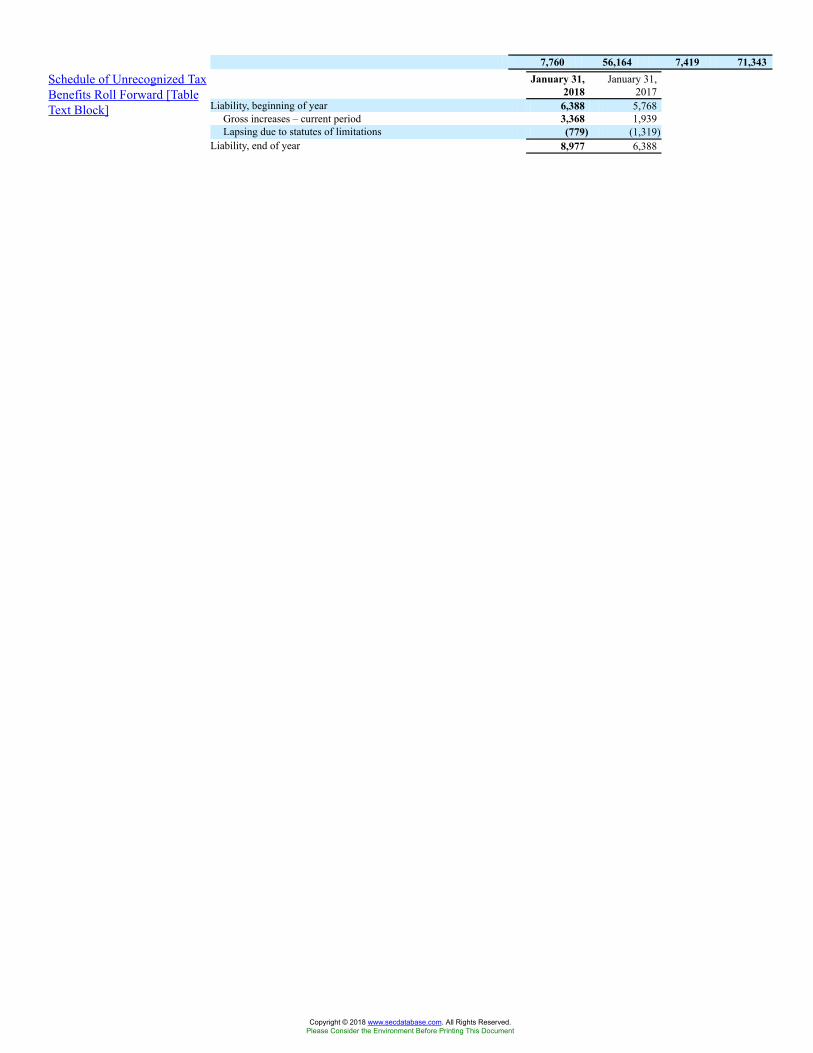
7,760 56,164 7,419 71,343Schedule of Unrecognized TaxBenefits Roll Forward [TableText Block]
January 31,2018
January 31,2017
Liability, beginning of year 6,388 5,768Gross increases – current period 3,368 1,939Lapsing due to statutes of limitations (779) (1,319)
Liability, end of year 8,977 6,388
Copyright © 2018 www.secdatabase.com. All Rights Reserved.Please Consider the Environment Before Printing This Document
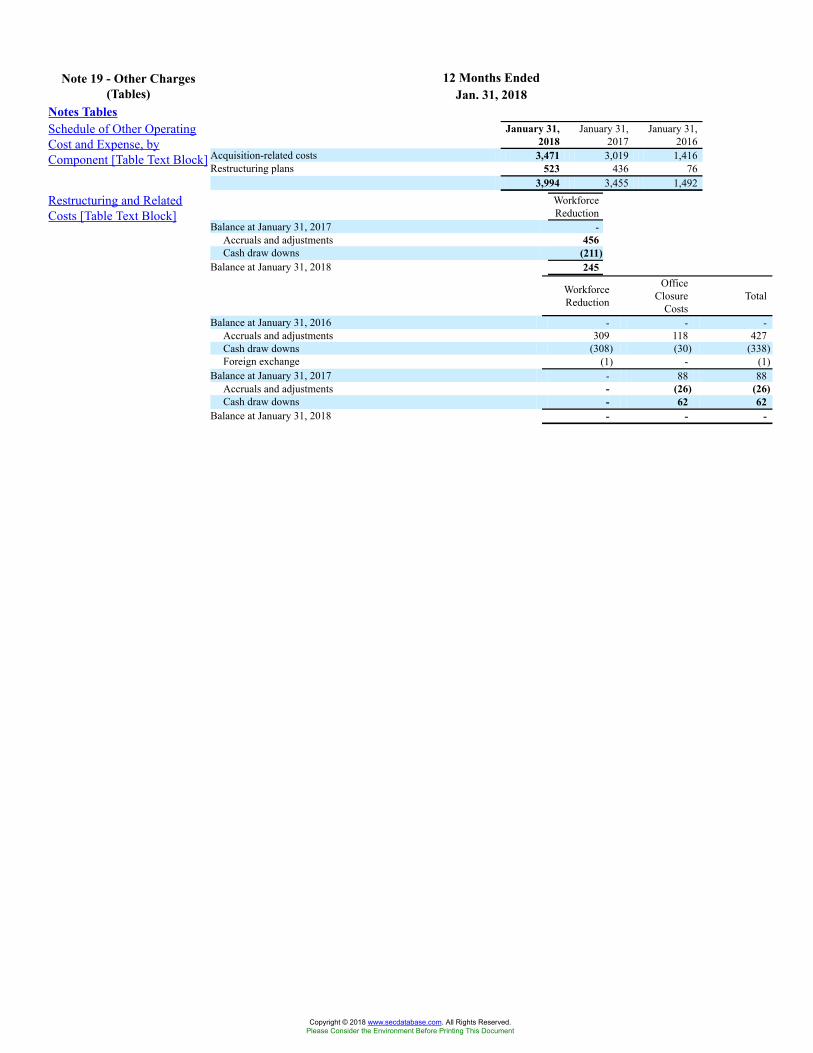
12 Months EndedNote 19 - Other Charges(Tables) Jan. 31, 2018
Notes TablesSchedule of Other OperatingCost and Expense, byComponent [Table Text Block]
January 31,2018
January 31,2017
January 31,2016
Acquisition-related costs 3,471 3,019 1,416Restructuring plans 523 436 76
3,994 3,455 1,492
Restructuring and RelatedCosts [Table Text Block]
WorkforceReduction
Balance at January 31, 2017 -Accruals and adjustments 456Cash draw downs (211)
Balance at January 31, 2018 245
WorkforceReduction
OfficeClosure
CostsTotal
Balance at January 31, 2016 - - -Accruals and adjustments 309 118 427Cash draw downs (308) (30) (338)Foreign exchange (1) - (1)
Balance at January 31, 2017 - 88 88Accruals and adjustments - (26) (26)Cash draw downs - 62 62
Balance at January 31, 2018 - - -
Copyright © 2018 www.secdatabase.com. All Rights Reserved.Please Consider the Environment Before Printing This Document
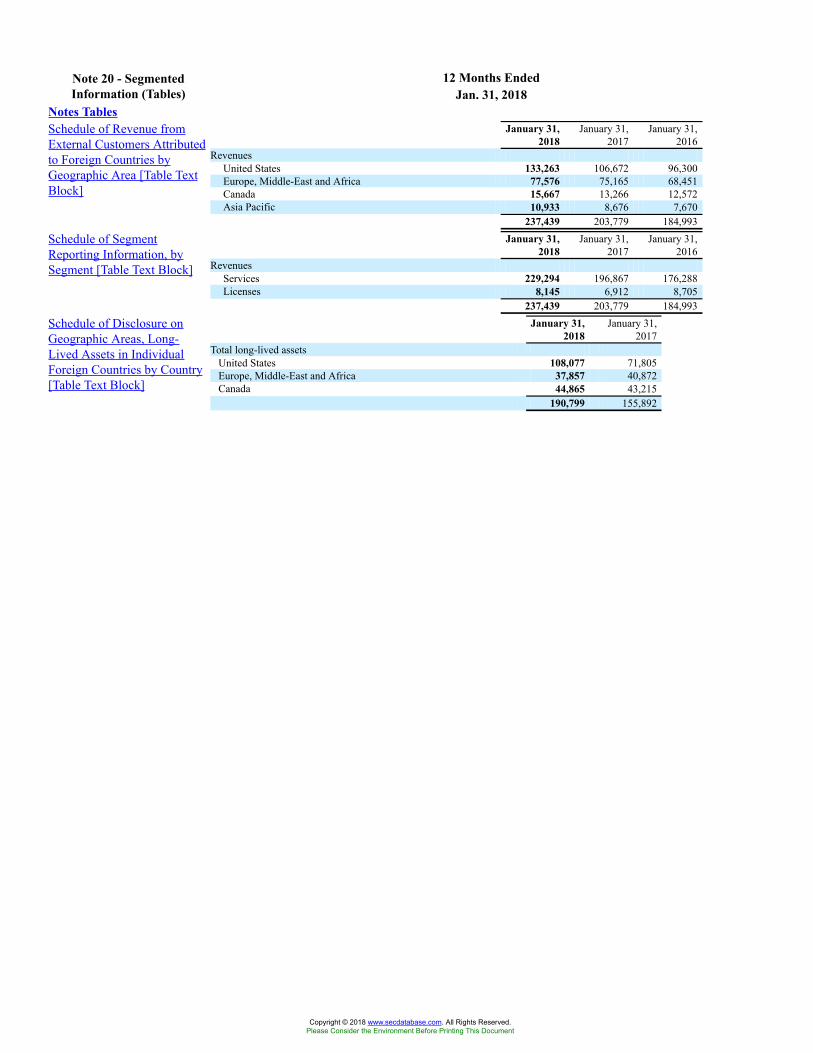
12 Months EndedNote 20 - SegmentedInformation (Tables) Jan. 31, 2018
Notes TablesSchedule of Revenue fromExternal Customers Attributedto Foreign Countries byGeographic Area [Table TextBlock]
January 31,2018
January 31,2017
January 31,2016
RevenuesUnited States 133,263 106,672 96,300Europe, Middle-East and Africa 77,576 75,165 68,451Canada 15,667 13,266 12,572Asia Pacific 10,933 8,676 7,670
237,439 203,779 184,993
Schedule of SegmentReporting Information, bySegment [Table Text Block]
January 31,2018
January 31,2017
January 31,2016
RevenuesServices 229,294 196,867 176,288Licenses 8,145 6,912 8,705
237,439 203,779 184,993
Schedule of Disclosure onGeographic Areas, Long-Lived Assets in IndividualForeign Countries by Country[Table Text Block]
January 31,2018
January 31,2017
Total long-lived assetsUnited States 108,077 71,805Europe, Middle-East and Africa 37,857 40,872Canada 44,865 43,215
190,799 155,892
Copyright © 2018 www.secdatabase.com. All Rights Reserved.Please Consider the Environment Before Printing This Document
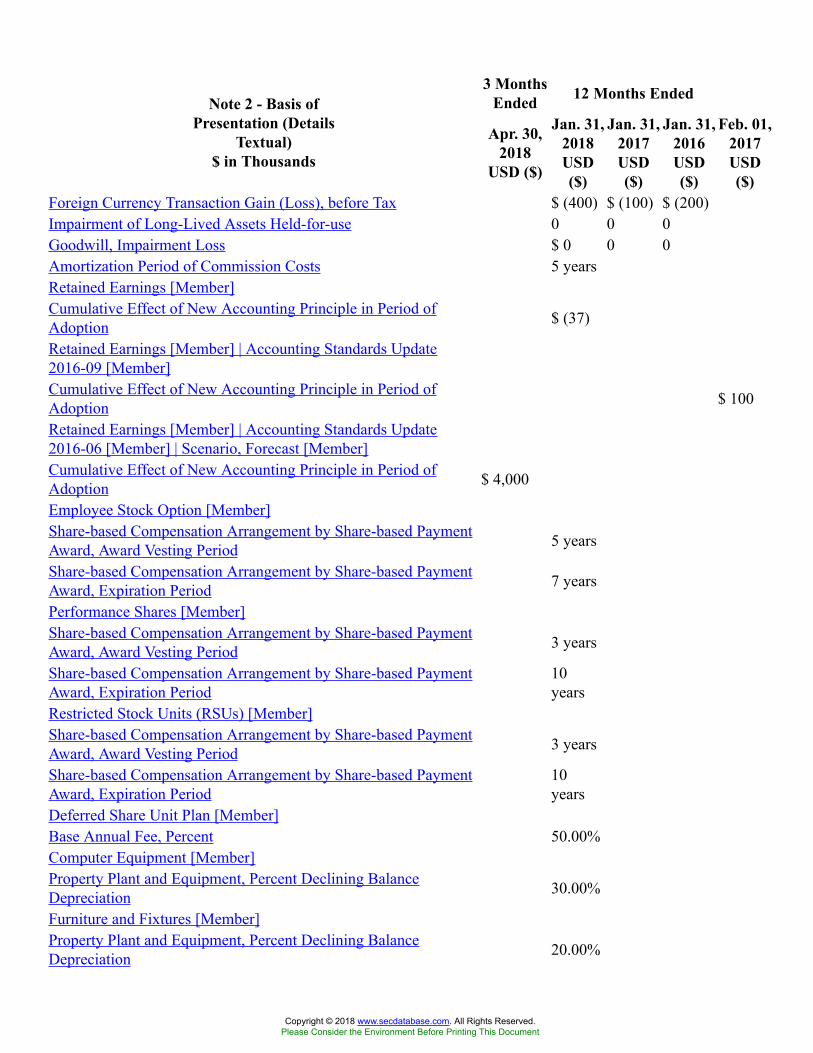
3 MonthsEnded 12 Months EndedNote 2 - Basis of
Presentation (DetailsTextual)
$ in Thousands
Apr. 30,2018
USD ($)
Jan. 31,2018USD($)
Jan. 31,2017USD($)
Jan. 31,2016USD($)
Feb. 01,2017USD($)
Foreign Currency Transaction Gain (Loss), before Tax $ (400) $ (100) $ (200)Impairment of Long-Lived Assets Held-for-use 0 0 0Goodwill, Impairment Loss $ 0 0 0Amortization Period of Commission Costs 5 yearsRetained Earnings [Member]Cumulative Effect of New Accounting Principle in Period ofAdoption $ (37)
Retained Earnings [Member] | Accounting Standards Update2016-09 [Member]Cumulative Effect of New Accounting Principle in Period ofAdoption $ 100
Retained Earnings [Member] | Accounting Standards Update2016-06 [Member] | Scenario, Forecast [Member]Cumulative Effect of New Accounting Principle in Period ofAdoption $ 4,000
Employee Stock Option [Member]Share-based Compensation Arrangement by Share-based PaymentAward, Award Vesting Period 5 years
Share-based Compensation Arrangement by Share-based PaymentAward, Expiration Period 7 years
Performance Shares [Member]Share-based Compensation Arrangement by Share-based PaymentAward, Award Vesting Period 3 years
Share-based Compensation Arrangement by Share-based PaymentAward, Expiration Period
10years
Restricted Stock Units (RSUs) [Member]Share-based Compensation Arrangement by Share-based PaymentAward, Award Vesting Period 3 years
Share-based Compensation Arrangement by Share-based PaymentAward, Expiration Period
10years
Deferred Share Unit Plan [Member]Base Annual Fee, Percent 50.00%Computer Equipment [Member]Property Plant and Equipment, Percent Declining BalanceDepreciation 30.00%
Furniture and Fixtures [Member]Property Plant and Equipment, Percent Declining BalanceDepreciation 20.00%
Copyright © 2018 www.secdatabase.com. All Rights Reserved.Please Consider the Environment Before Printing This Document
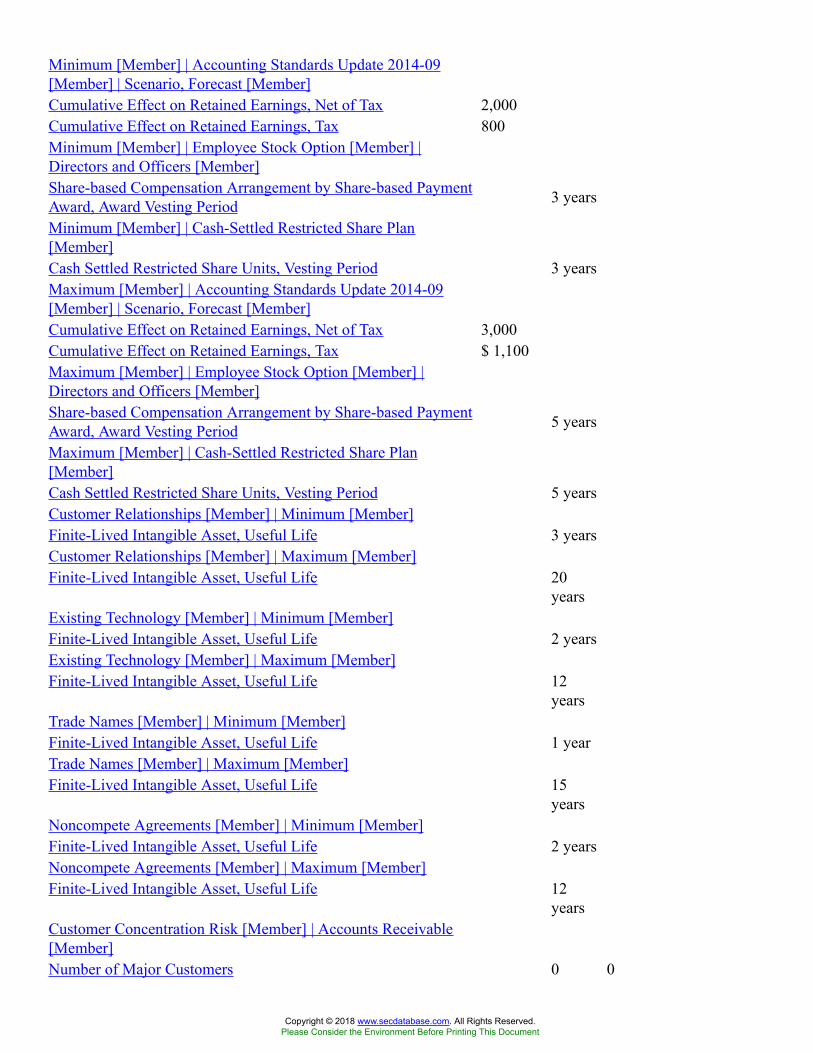
Minimum [Member] | Accounting Standards Update 2014-09[Member] | Scenario, Forecast [Member]Cumulative Effect on Retained Earnings, Net of Tax 2,000Cumulative Effect on Retained Earnings, Tax 800Minimum [Member] | Employee Stock Option [Member] |Directors and Officers [Member]Share-based Compensation Arrangement by Share-based PaymentAward, Award Vesting Period 3 years
Minimum [Member] | Cash-Settled Restricted Share Plan[Member]Cash Settled Restricted Share Units, Vesting Period 3 yearsMaximum [Member] | Accounting Standards Update 2014-09[Member] | Scenario, Forecast [Member]Cumulative Effect on Retained Earnings, Net of Tax 3,000Cumulative Effect on Retained Earnings, Tax $ 1,100Maximum [Member] | Employee Stock Option [Member] |Directors and Officers [Member]Share-based Compensation Arrangement by Share-based PaymentAward, Award Vesting Period 5 years
Maximum [Member] | Cash-Settled Restricted Share Plan[Member]Cash Settled Restricted Share Units, Vesting Period 5 yearsCustomer Relationships [Member] | Minimum [Member]Finite-Lived Intangible Asset, Useful Life 3 yearsCustomer Relationships [Member] | Maximum [Member]Finite-Lived Intangible Asset, Useful Life 20
yearsExisting Technology [Member] | Minimum [Member]Finite-Lived Intangible Asset, Useful Life 2 yearsExisting Technology [Member] | Maximum [Member]Finite-Lived Intangible Asset, Useful Life 12
yearsTrade Names [Member] | Minimum [Member]Finite-Lived Intangible Asset, Useful Life 1 yearTrade Names [Member] | Maximum [Member]Finite-Lived Intangible Asset, Useful Life 15
yearsNoncompete Agreements [Member] | Minimum [Member]Finite-Lived Intangible Asset, Useful Life 2 yearsNoncompete Agreements [Member] | Maximum [Member]Finite-Lived Intangible Asset, Useful Life 12
yearsCustomer Concentration Risk [Member] | Accounts Receivable[Member]Number of Major Customers 0 0
Copyright © 2018 www.secdatabase.com. All Rights Reserved.Please Consider the Environment Before Printing This Document
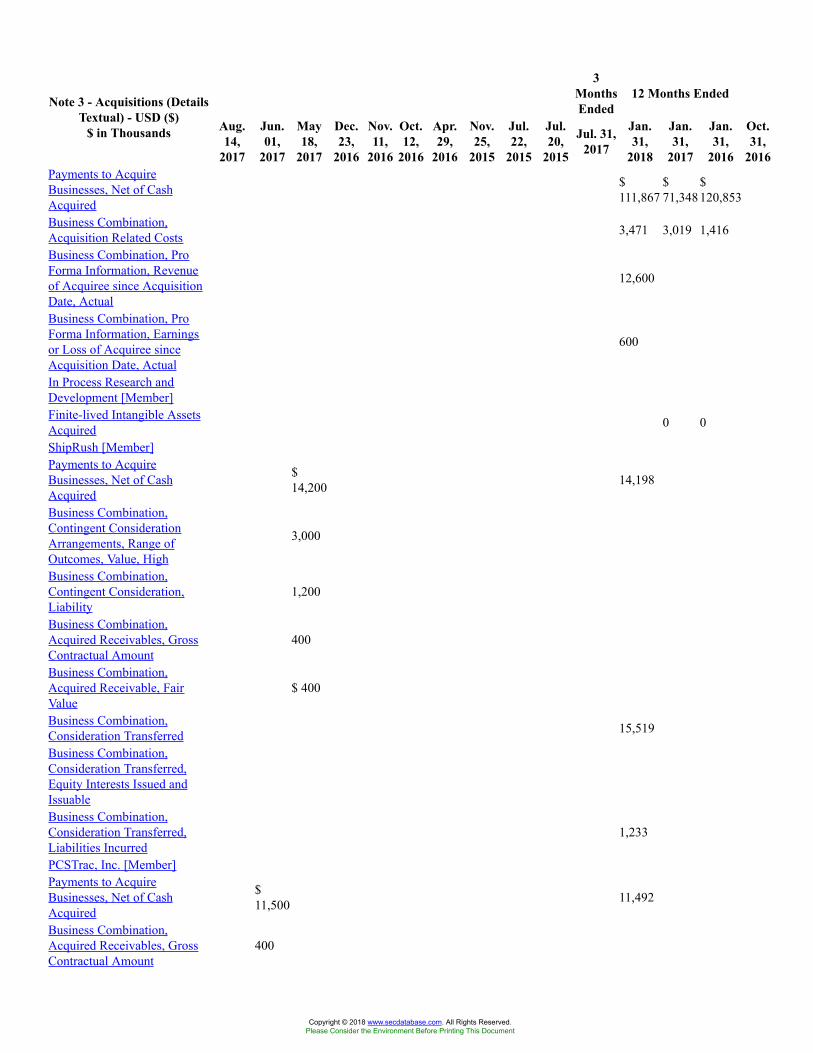
3MonthsEnded
12 Months EndedNote 3 - Acquisitions (DetailsTextual) - USD ($)
$ in Thousands Aug.14,
2017
Jun.01,
2017
May18,
2017
Dec.23,
2016
Nov.11,
2016
Oct.12,
2016
Apr.29,
2016
Nov.25,
2015
Jul.22,
2015
Jul.20,
2015
Jul. 31,2017
Jan.31,
2018
Jan.31,
2017
Jan.31,
2016
Oct.31,
2016Payments to AcquireBusinesses, Net of CashAcquired
$111,867
$71,348
$120,853
Business Combination,Acquisition Related Costs 3,471 3,019 1,416
Business Combination, ProForma Information, Revenueof Acquiree since AcquisitionDate, Actual
12,600
Business Combination, ProForma Information, Earningsor Loss of Acquiree sinceAcquisition Date, Actual
600
In Process Research andDevelopment [Member]Finite-lived Intangible AssetsAcquired 0 0
ShipRush [Member]Payments to AcquireBusinesses, Net of CashAcquired
$14,200 14,198
Business Combination,Contingent ConsiderationArrangements, Range ofOutcomes, Value, High
3,000
Business Combination,Contingent Consideration,Liability
1,200
Business Combination,Acquired Receivables, GrossContractual Amount
400
Business Combination,Acquired Receivable, FairValue
$ 400
Business Combination,Consideration Transferred 15,519
Business Combination,Consideration Transferred,Equity Interests Issued andIssuableBusiness Combination,Consideration Transferred,Liabilities Incurred
1,233
PCSTrac, Inc. [Member]Payments to AcquireBusinesses, Net of CashAcquired
$11,500 11,492
Business Combination,Acquired Receivables, GrossContractual Amount
400
Copyright © 2018 www.secdatabase.com. All Rights Reserved.Please Consider the Environment Before Printing This Document
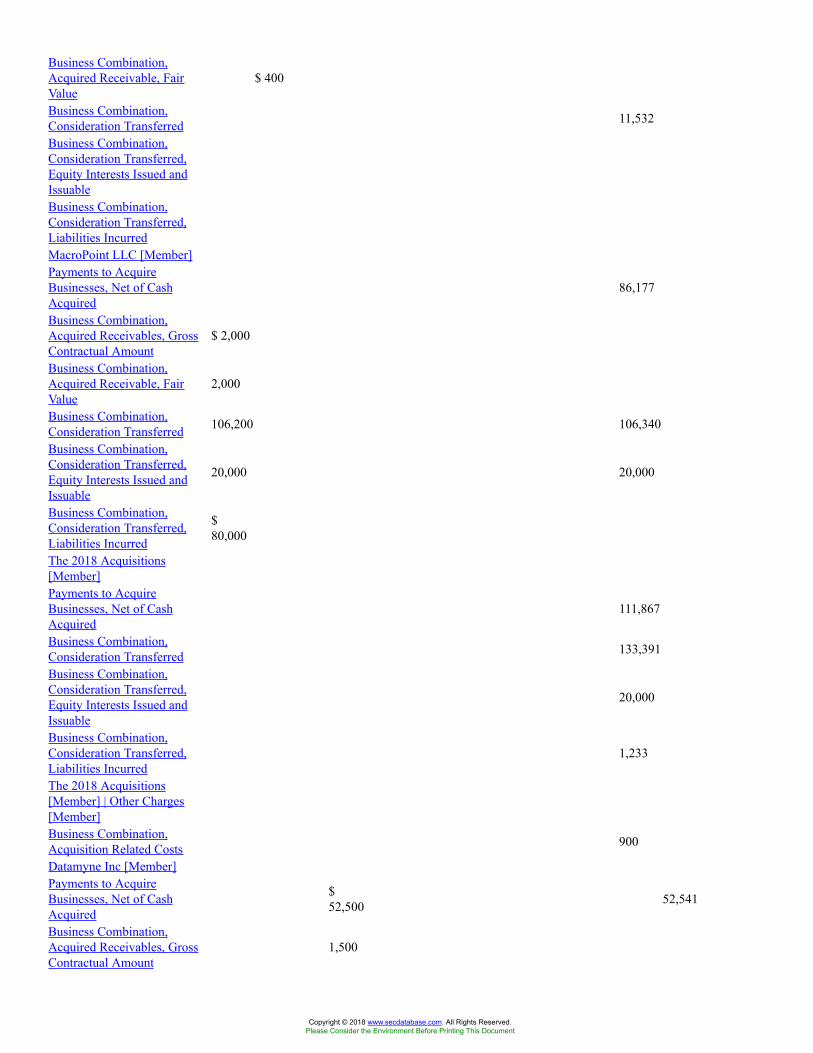
Business Combination,Acquired Receivable, FairValue
$ 400
Business Combination,Consideration Transferred 11,532
Business Combination,Consideration Transferred,Equity Interests Issued andIssuableBusiness Combination,Consideration Transferred,Liabilities IncurredMacroPoint LLC [Member]Payments to AcquireBusinesses, Net of CashAcquired
86,177
Business Combination,Acquired Receivables, GrossContractual Amount
$ 2,000
Business Combination,Acquired Receivable, FairValue
2,000
Business Combination,Consideration Transferred 106,200 106,340
Business Combination,Consideration Transferred,Equity Interests Issued andIssuable
20,000 20,000
Business Combination,Consideration Transferred,Liabilities Incurred
$80,000
The 2018 Acquisitions[Member]Payments to AcquireBusinesses, Net of CashAcquired
111,867
Business Combination,Consideration Transferred 133,391
Business Combination,Consideration Transferred,Equity Interests Issued andIssuable
20,000
Business Combination,Consideration Transferred,Liabilities Incurred
1,233
The 2018 Acquisitions[Member] | Other Charges[Member]Business Combination,Acquisition Related Costs 900
Datamyne Inc [Member]Payments to AcquireBusinesses, Net of CashAcquired
$52,500 52,541
Business Combination,Acquired Receivables, GrossContractual Amount
1,500
Copyright © 2018 www.secdatabase.com. All Rights Reserved.Please Consider the Environment Before Printing This Document
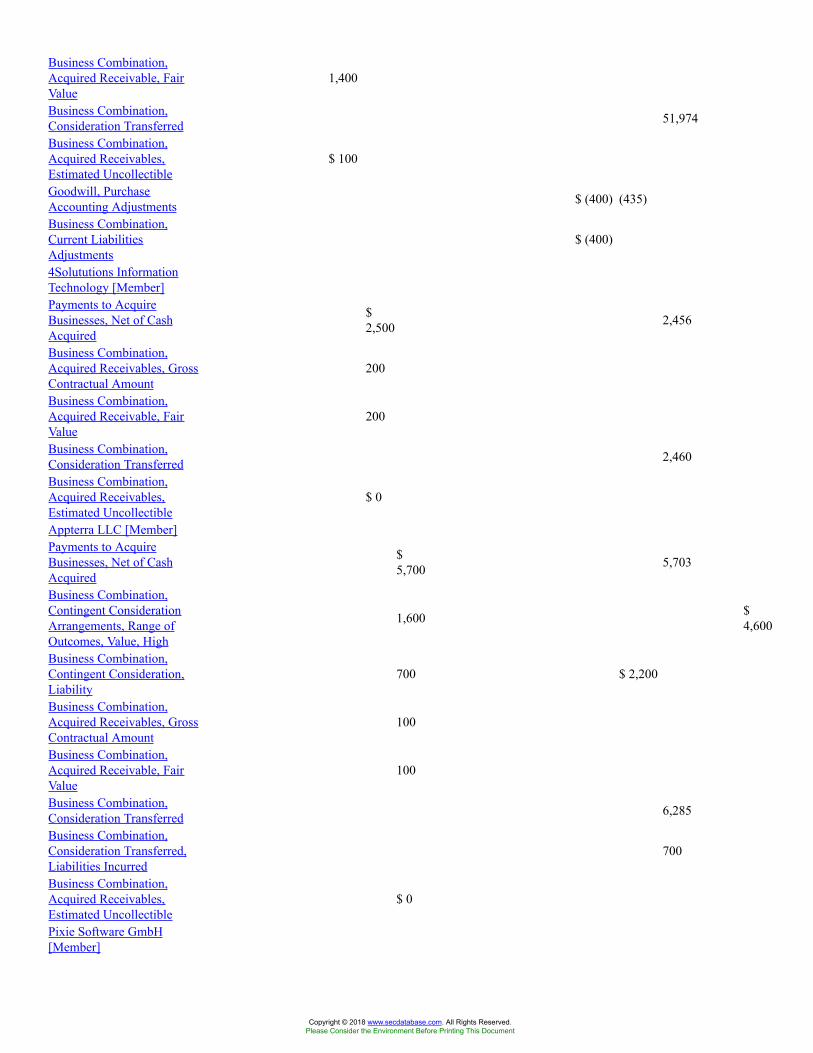
Business Combination,Acquired Receivable, FairValue
1,400
Business Combination,Consideration Transferred 51,974
Business Combination,Acquired Receivables,Estimated Uncollectible
$ 100
Goodwill, PurchaseAccounting Adjustments $ (400) (435)
Business Combination,Current LiabilitiesAdjustments
$ (400)
4Solututions InformationTechnology [Member]Payments to AcquireBusinesses, Net of CashAcquired
$2,500 2,456
Business Combination,Acquired Receivables, GrossContractual Amount
200
Business Combination,Acquired Receivable, FairValue
200
Business Combination,Consideration Transferred 2,460
Business Combination,Acquired Receivables,Estimated Uncollectible
$ 0
Appterra LLC [Member]Payments to AcquireBusinesses, Net of CashAcquired
$5,700 5,703
Business Combination,Contingent ConsiderationArrangements, Range ofOutcomes, Value, High
1,600 $4,600
Business Combination,Contingent Consideration,Liability
700 $ 2,200
Business Combination,Acquired Receivables, GrossContractual Amount
100
Business Combination,Acquired Receivable, FairValue
100
Business Combination,Consideration Transferred 6,285
Business Combination,Consideration Transferred,Liabilities Incurred
700
Business Combination,Acquired Receivables,Estimated Uncollectible
$ 0
Pixie Software GmbH[Member]
Copyright © 2018 www.secdatabase.com. All Rights Reserved.Please Consider the Environment Before Printing This Document
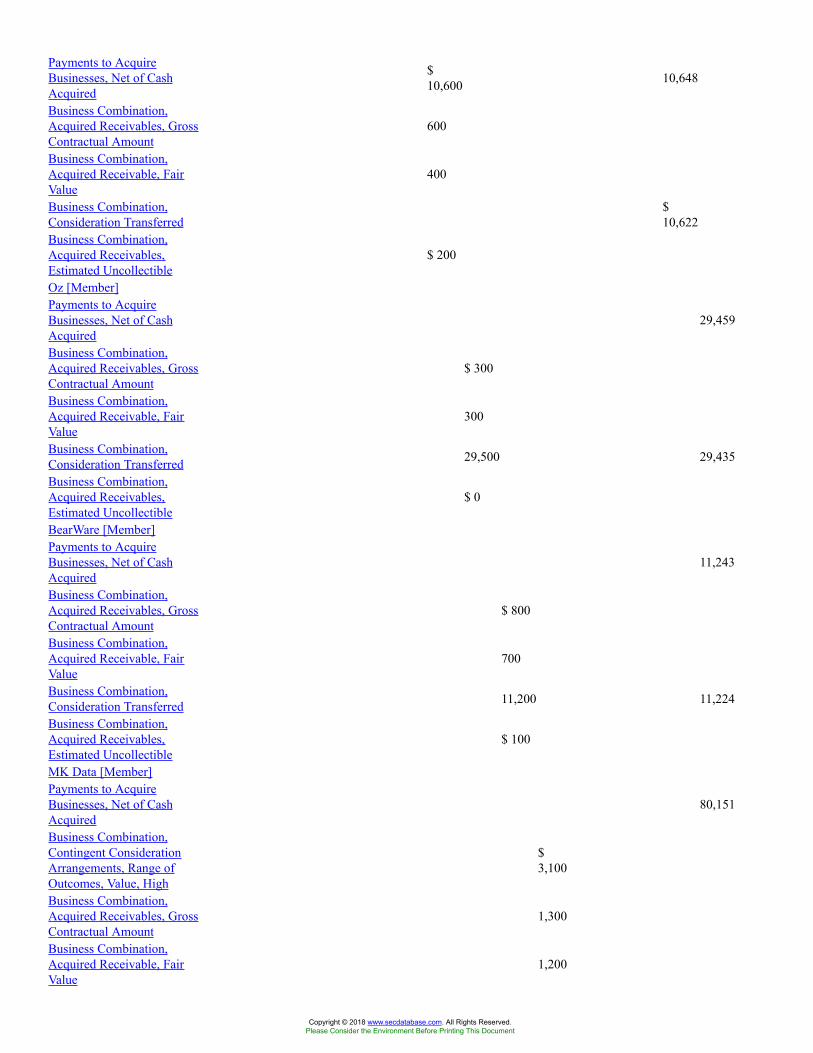
Payments to AcquireBusinesses, Net of CashAcquired
$10,600 10,648
Business Combination,Acquired Receivables, GrossContractual Amount
600
Business Combination,Acquired Receivable, FairValue
400
Business Combination,Consideration Transferred
$10,622
Business Combination,Acquired Receivables,Estimated Uncollectible
$ 200
Oz [Member]Payments to AcquireBusinesses, Net of CashAcquired
29,459
Business Combination,Acquired Receivables, GrossContractual Amount
$ 300
Business Combination,Acquired Receivable, FairValue
300
Business Combination,Consideration Transferred 29,500 29,435
Business Combination,Acquired Receivables,Estimated Uncollectible
$ 0
BearWare [Member]Payments to AcquireBusinesses, Net of CashAcquired
11,243
Business Combination,Acquired Receivables, GrossContractual Amount
$ 800
Business Combination,Acquired Receivable, FairValue
700
Business Combination,Consideration Transferred 11,200 11,224
Business Combination,Acquired Receivables,Estimated Uncollectible
$ 100
MK Data [Member]Payments to AcquireBusinesses, Net of CashAcquired
80,151
Business Combination,Contingent ConsiderationArrangements, Range ofOutcomes, Value, High
$3,100
Business Combination,Acquired Receivables, GrossContractual Amount
1,300
Business Combination,Acquired Receivable, FairValue
1,200
Copyright © 2018 www.secdatabase.com. All Rights Reserved.Please Consider the Environment Before Printing This Document
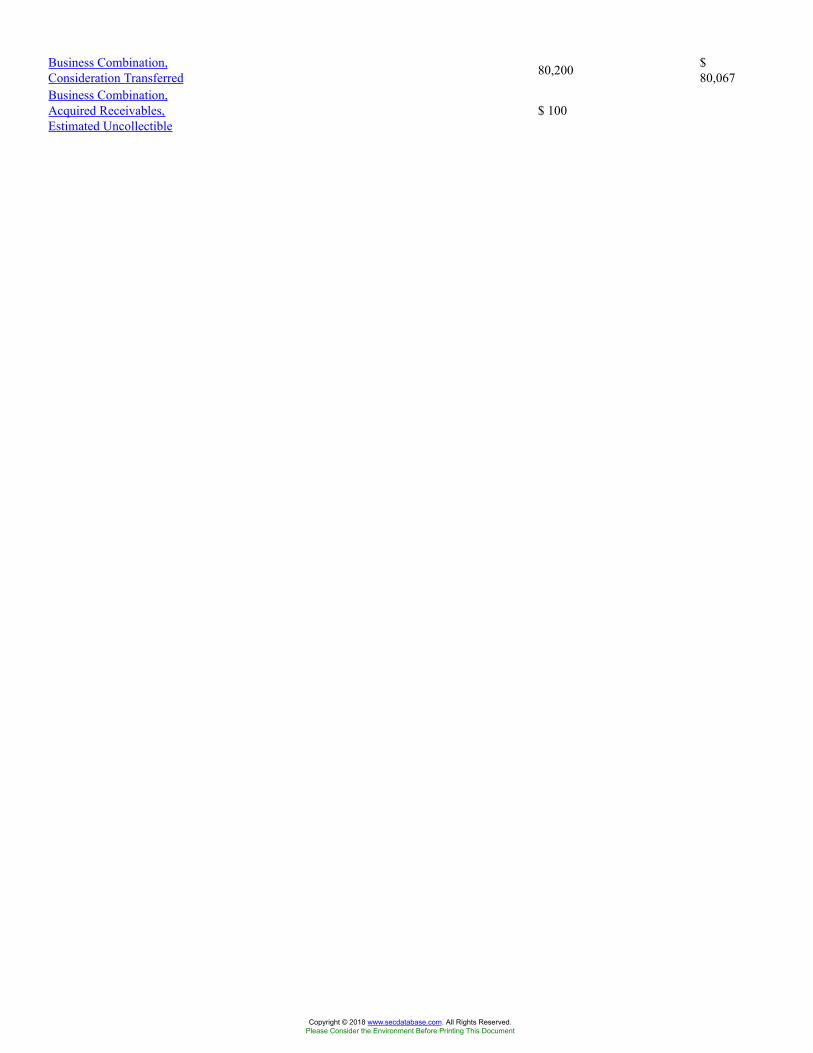
Business Combination,Consideration Transferred 80,200 $
80,067Business Combination,Acquired Receivables,Estimated Uncollectible
$ 100
Copyright © 2018 www.secdatabase.com. All Rights Reserved.Please Consider the Environment Before Printing This Document
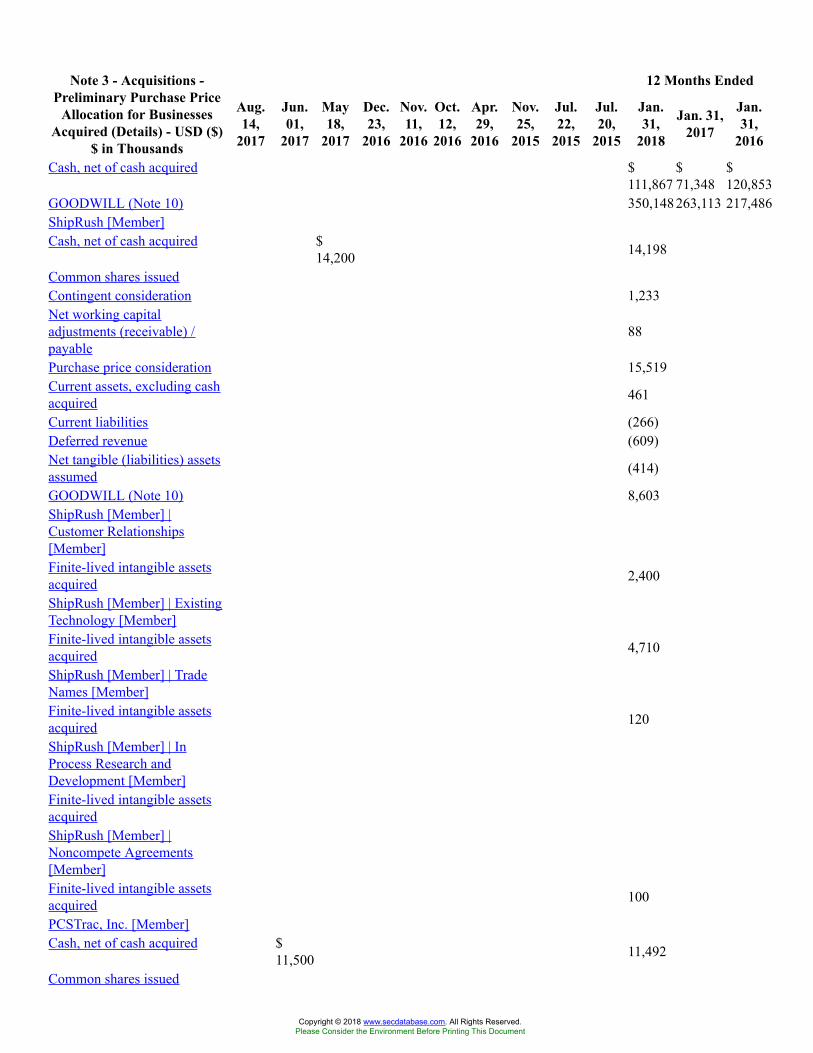
12 Months EndedNote 3 - Acquisitions -Preliminary Purchase Price
Allocation for BusinessesAcquired (Details) - USD ($)
$ in Thousands
Aug.14,
2017
Jun.01,
2017
May18,
2017
Dec.23,
2016
Nov.11,
2016
Oct.12,
2016
Apr.29,
2016
Nov.25,
2015
Jul.22,
2015
Jul.20,
2015
Jan.31,
2018
Jan. 31,2017
Jan.31,
2016
Cash, net of cash acquired $111,867
$71,348
$120,853
GOODWILL (Note 10) 350,148263,113 217,486ShipRush [Member]Cash, net of cash acquired $
14,200 14,198
Common shares issuedContingent consideration 1,233Net working capitaladjustments (receivable) /payable
88
Purchase price consideration 15,519Current assets, excluding cashacquired 461
Current liabilities (266)Deferred revenue (609)Net tangible (liabilities) assetsassumed (414)
GOODWILL (Note 10) 8,603ShipRush [Member] |Customer Relationships[Member]Finite-lived intangible assetsacquired 2,400
ShipRush [Member] | ExistingTechnology [Member]Finite-lived intangible assetsacquired 4,710
ShipRush [Member] | TradeNames [Member]Finite-lived intangible assetsacquired 120
ShipRush [Member] | InProcess Research andDevelopment [Member]Finite-lived intangible assetsacquiredShipRush [Member] |Noncompete Agreements[Member]Finite-lived intangible assetsacquired 100
PCSTrac, Inc. [Member]Cash, net of cash acquired $
11,500 11,492
Common shares issued
Copyright © 2018 www.secdatabase.com. All Rights Reserved.Please Consider the Environment Before Printing This Document
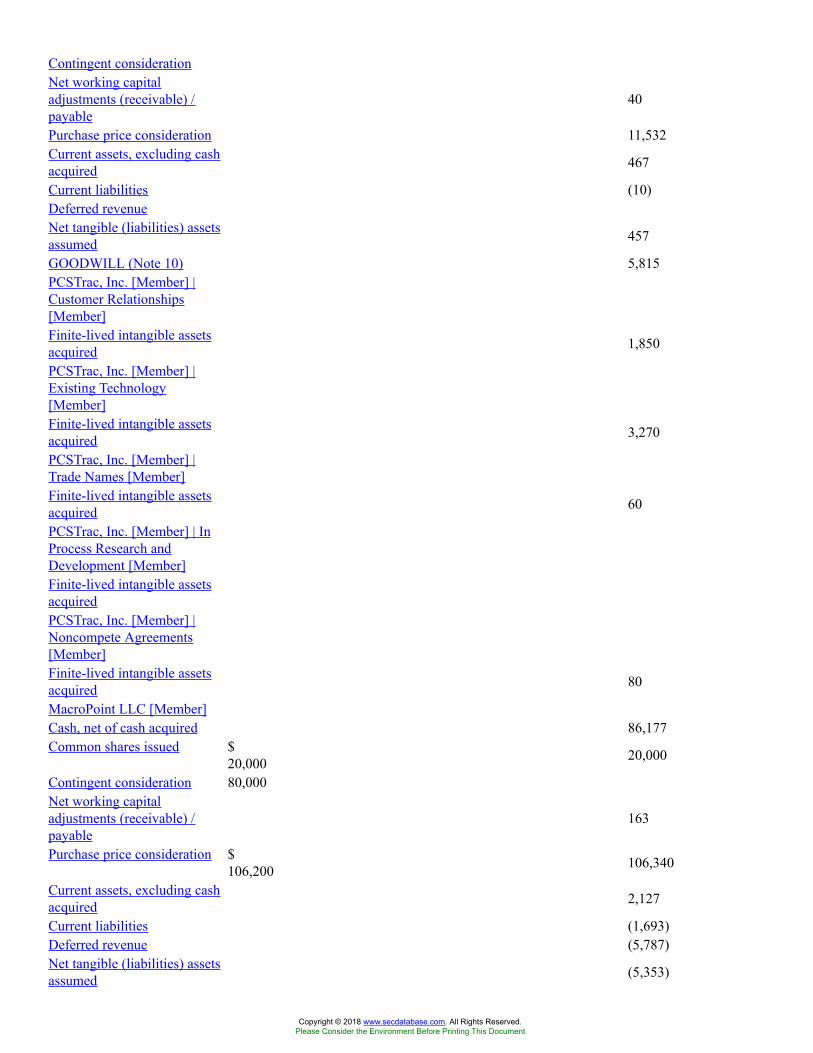
Contingent considerationNet working capitaladjustments (receivable) /payable
40
Purchase price consideration 11,532Current assets, excluding cashacquired 467
Current liabilities (10)Deferred revenueNet tangible (liabilities) assetsassumed 457
GOODWILL (Note 10) 5,815PCSTrac, Inc. [Member] |Customer Relationships[Member]Finite-lived intangible assetsacquired 1,850
PCSTrac, Inc. [Member] |Existing Technology[Member]Finite-lived intangible assetsacquired 3,270
PCSTrac, Inc. [Member] |Trade Names [Member]Finite-lived intangible assetsacquired 60
PCSTrac, Inc. [Member] | InProcess Research andDevelopment [Member]Finite-lived intangible assetsacquiredPCSTrac, Inc. [Member] |Noncompete Agreements[Member]Finite-lived intangible assetsacquired 80
MacroPoint LLC [Member]Cash, net of cash acquired 86,177Common shares issued $
20,000 20,000
Contingent consideration 80,000Net working capitaladjustments (receivable) /payable
163
Purchase price consideration $106,200 106,340
Current assets, excluding cashacquired 2,127
Current liabilities (1,693)Deferred revenue (5,787)Net tangible (liabilities) assetsassumed (5,353)
Copyright © 2018 www.secdatabase.com. All Rights Reserved.Please Consider the Environment Before Printing This Document
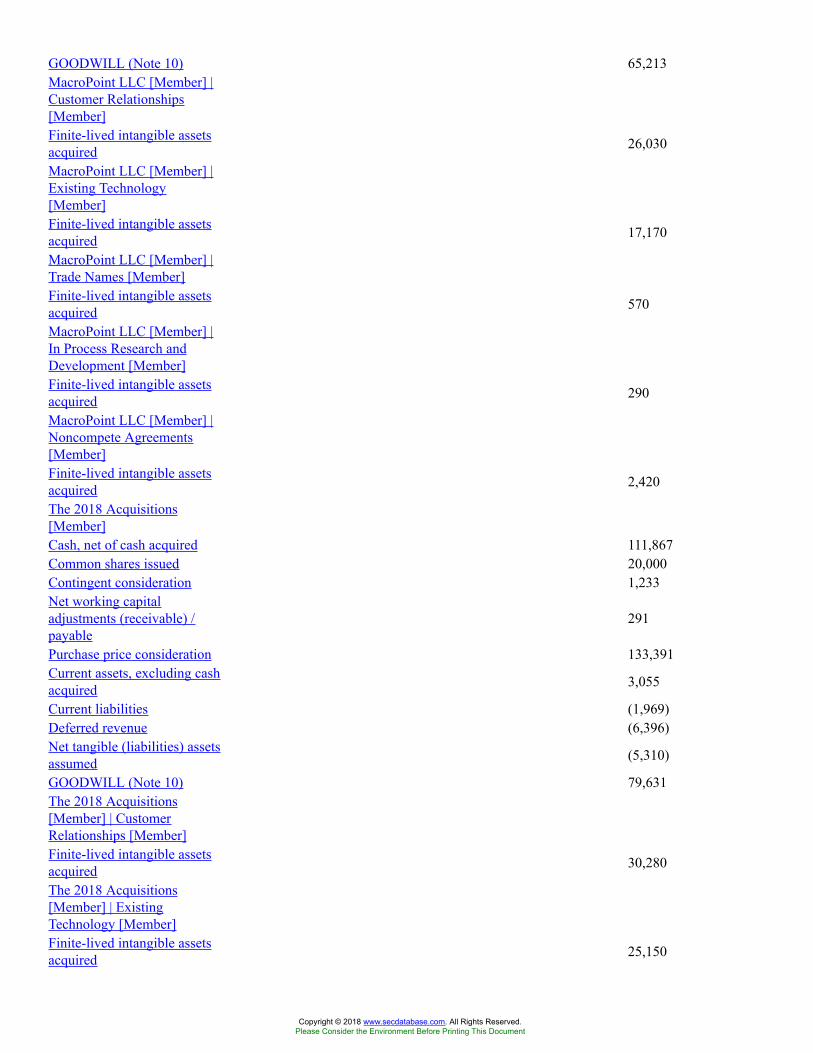
GOODWILL (Note 10) 65,213MacroPoint LLC [Member] |Customer Relationships[Member]Finite-lived intangible assetsacquired 26,030
MacroPoint LLC [Member] |Existing Technology[Member]Finite-lived intangible assetsacquired 17,170
MacroPoint LLC [Member] |Trade Names [Member]Finite-lived intangible assetsacquired 570
MacroPoint LLC [Member] |In Process Research andDevelopment [Member]Finite-lived intangible assetsacquired 290
MacroPoint LLC [Member] |Noncompete Agreements[Member]Finite-lived intangible assetsacquired 2,420
The 2018 Acquisitions[Member]Cash, net of cash acquired 111,867Common shares issued 20,000Contingent consideration 1,233Net working capitaladjustments (receivable) /payable
291
Purchase price consideration 133,391Current assets, excluding cashacquired 3,055
Current liabilities (1,969)Deferred revenue (6,396)Net tangible (liabilities) assetsassumed (5,310)
GOODWILL (Note 10) 79,631The 2018 Acquisitions[Member] | CustomerRelationships [Member]Finite-lived intangible assetsacquired 30,280
The 2018 Acquisitions[Member] | ExistingTechnology [Member]Finite-lived intangible assetsacquired 25,150
Copyright © 2018 www.secdatabase.com. All Rights Reserved.Please Consider the Environment Before Printing This Document
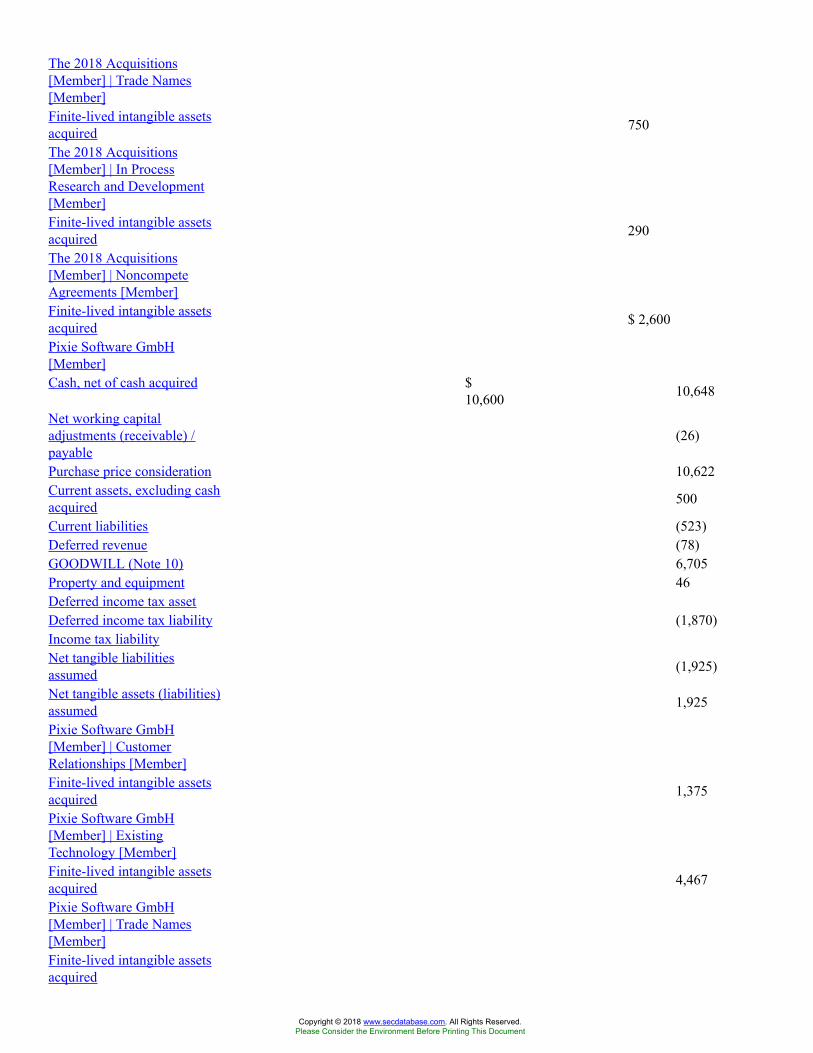
The 2018 Acquisitions[Member] | Trade Names[Member]Finite-lived intangible assetsacquired 750
The 2018 Acquisitions[Member] | In ProcessResearch and Development[Member]Finite-lived intangible assetsacquired 290
The 2018 Acquisitions[Member] | NoncompeteAgreements [Member]Finite-lived intangible assetsacquired $ 2,600
Pixie Software GmbH[Member]Cash, net of cash acquired $
10,600 10,648
Net working capitaladjustments (receivable) /payable
(26)
Purchase price consideration 10,622Current assets, excluding cashacquired 500
Current liabilities (523)Deferred revenue (78)GOODWILL (Note 10) 6,705Property and equipment 46Deferred income tax assetDeferred income tax liability (1,870)Income tax liabilityNet tangible liabilitiesassumed (1,925)
Net tangible assets (liabilities)assumed 1,925
Pixie Software GmbH[Member] | CustomerRelationships [Member]Finite-lived intangible assetsacquired 1,375
Pixie Software GmbH[Member] | ExistingTechnology [Member]Finite-lived intangible assetsacquired 4,467
Pixie Software GmbH[Member] | Trade Names[Member]Finite-lived intangible assetsacquired
Copyright © 2018 www.secdatabase.com. All Rights Reserved.Please Consider the Environment Before Printing This Document
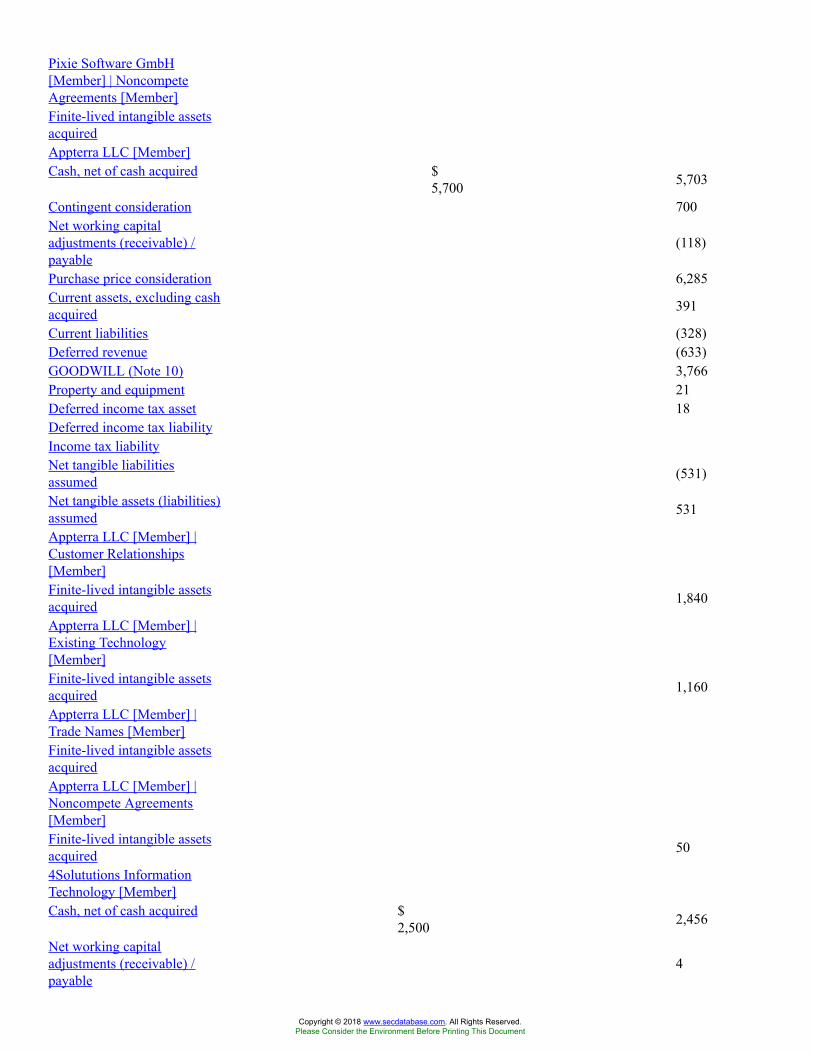
Pixie Software GmbH[Member] | NoncompeteAgreements [Member]Finite-lived intangible assetsacquiredAppterra LLC [Member]Cash, net of cash acquired $
5,700 5,703
Contingent consideration 700Net working capitaladjustments (receivable) /payable
(118)
Purchase price consideration 6,285Current assets, excluding cashacquired 391
Current liabilities (328)Deferred revenue (633)GOODWILL (Note 10) 3,766Property and equipment 21Deferred income tax asset 18Deferred income tax liabilityIncome tax liabilityNet tangible liabilitiesassumed (531)
Net tangible assets (liabilities)assumed 531
Appterra LLC [Member] |Customer Relationships[Member]Finite-lived intangible assetsacquired 1,840
Appterra LLC [Member] |Existing Technology[Member]Finite-lived intangible assetsacquired 1,160
Appterra LLC [Member] |Trade Names [Member]Finite-lived intangible assetsacquiredAppterra LLC [Member] |Noncompete Agreements[Member]Finite-lived intangible assetsacquired 50
4Solututions InformationTechnology [Member]Cash, net of cash acquired $
2,500 2,456
Net working capitaladjustments (receivable) /payable
4
Copyright © 2018 www.secdatabase.com. All Rights Reserved.Please Consider the Environment Before Printing This Document
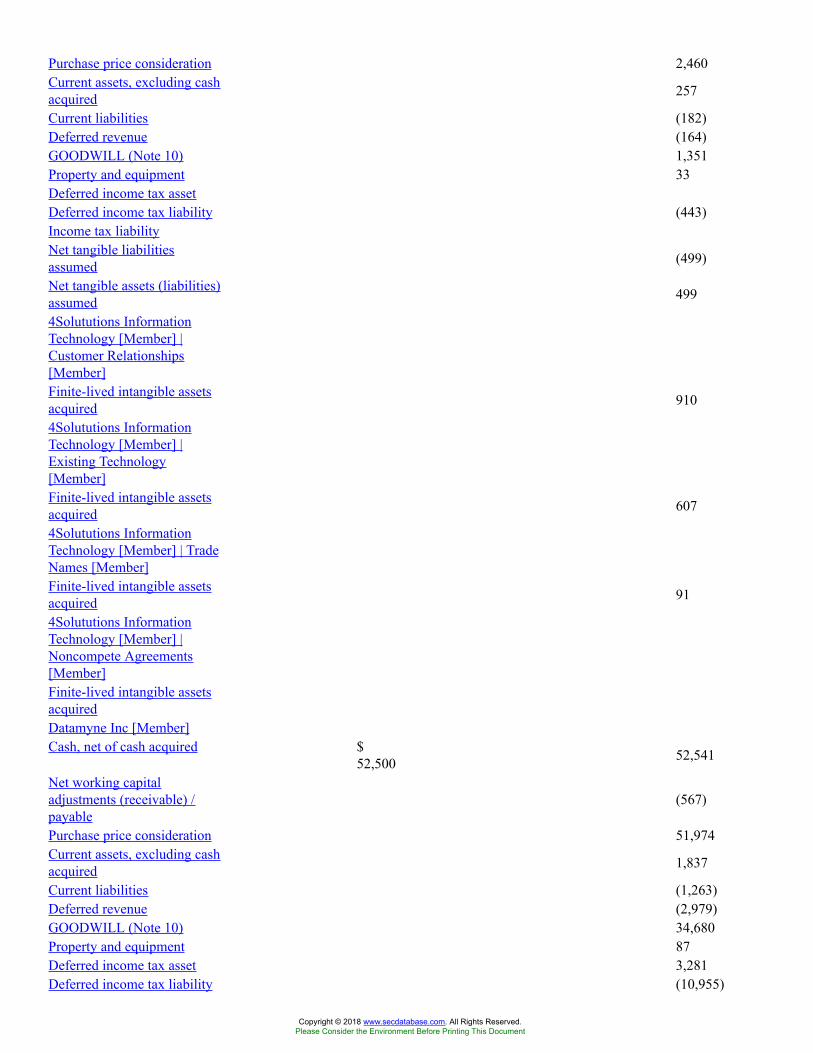
Purchase price consideration 2,460Current assets, excluding cashacquired 257
Current liabilities (182)Deferred revenue (164)GOODWILL (Note 10) 1,351Property and equipment 33Deferred income tax assetDeferred income tax liability (443)Income tax liabilityNet tangible liabilitiesassumed (499)
Net tangible assets (liabilities)assumed 499
4Solututions InformationTechnology [Member] |Customer Relationships[Member]Finite-lived intangible assetsacquired 910
4Solututions InformationTechnology [Member] |Existing Technology[Member]Finite-lived intangible assetsacquired 607
4Solututions InformationTechnology [Member] | TradeNames [Member]Finite-lived intangible assetsacquired 91
4Solututions InformationTechnology [Member] |Noncompete Agreements[Member]Finite-lived intangible assetsacquiredDatamyne Inc [Member]Cash, net of cash acquired $
52,500 52,541
Net working capitaladjustments (receivable) /payable
(567)
Purchase price consideration 51,974Current assets, excluding cashacquired 1,837
Current liabilities (1,263)Deferred revenue (2,979)GOODWILL (Note 10) 34,680Property and equipment 87Deferred income tax asset 3,281Deferred income tax liability (10,955)
Copyright © 2018 www.secdatabase.com. All Rights Reserved.Please Consider the Environment Before Printing This Document
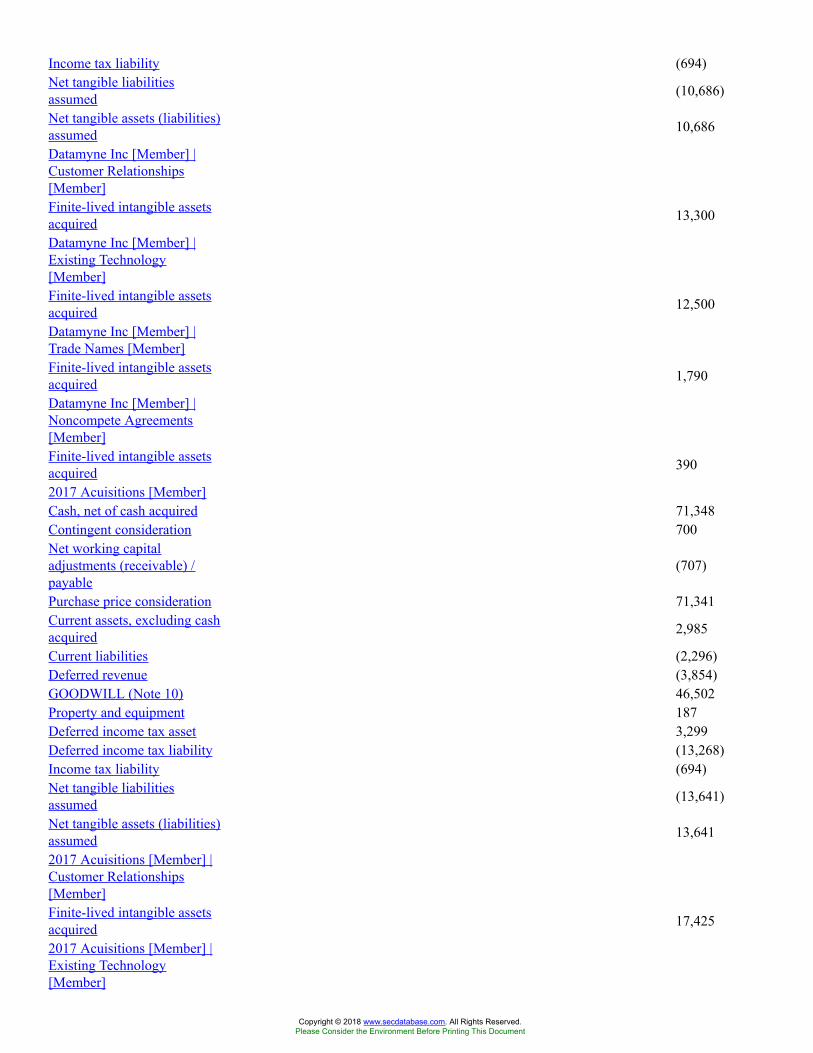
Income tax liability (694)Net tangible liabilitiesassumed (10,686)
Net tangible assets (liabilities)assumed 10,686
Datamyne Inc [Member] |Customer Relationships[Member]Finite-lived intangible assetsacquired 13,300
Datamyne Inc [Member] |Existing Technology[Member]Finite-lived intangible assetsacquired 12,500
Datamyne Inc [Member] |Trade Names [Member]Finite-lived intangible assetsacquired 1,790
Datamyne Inc [Member] |Noncompete Agreements[Member]Finite-lived intangible assetsacquired 390
2017 Acuisitions [Member]Cash, net of cash acquired 71,348Contingent consideration 700Net working capitaladjustments (receivable) /payable
(707)
Purchase price consideration 71,341Current assets, excluding cashacquired 2,985
Current liabilities (2,296)Deferred revenue (3,854)GOODWILL (Note 10) 46,502Property and equipment 187Deferred income tax asset 3,299Deferred income tax liability (13,268)Income tax liability (694)Net tangible liabilitiesassumed (13,641)
Net tangible assets (liabilities)assumed 13,641
2017 Acuisitions [Member] |Customer Relationships[Member]Finite-lived intangible assetsacquired 17,425
2017 Acuisitions [Member] |Existing Technology[Member]
Copyright © 2018 www.secdatabase.com. All Rights Reserved.Please Consider the Environment Before Printing This Document
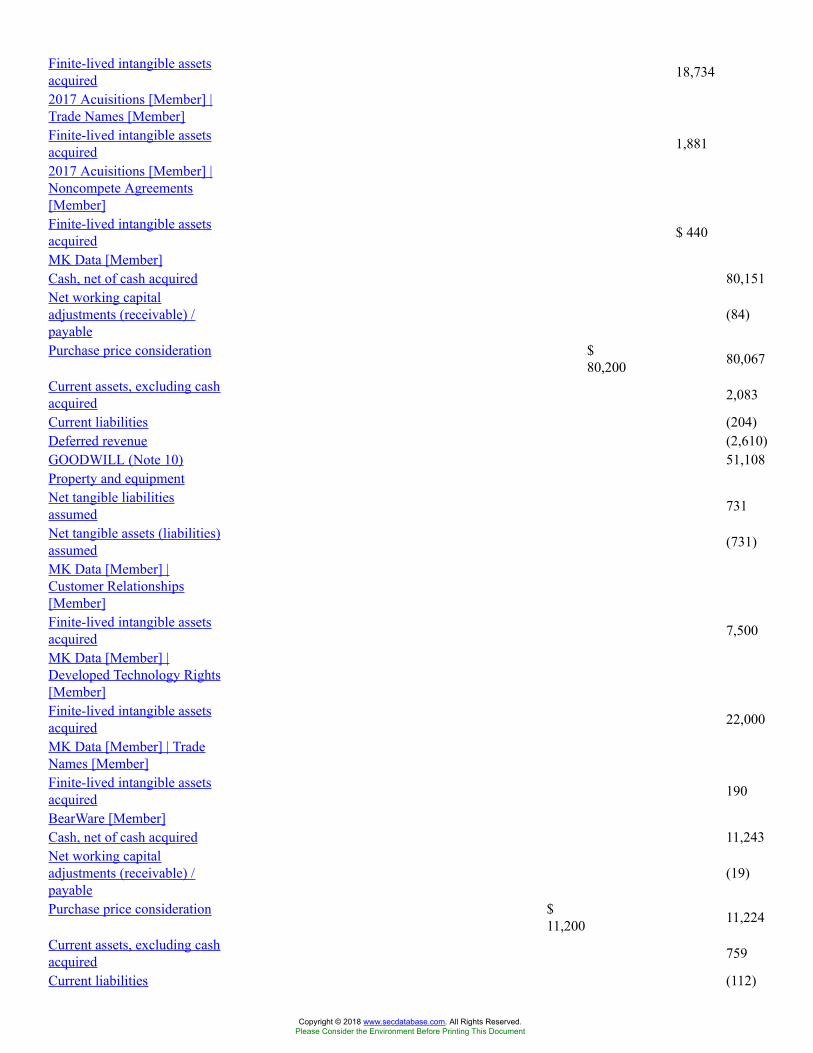
Finite-lived intangible assetsacquired 18,734
2017 Acuisitions [Member] |Trade Names [Member]Finite-lived intangible assetsacquired 1,881
2017 Acuisitions [Member] |Noncompete Agreements[Member]Finite-lived intangible assetsacquired $ 440
MK Data [Member]Cash, net of cash acquired 80,151Net working capitaladjustments (receivable) /payable
(84)
Purchase price consideration $80,200 80,067
Current assets, excluding cashacquired 2,083
Current liabilities (204)Deferred revenue (2,610)GOODWILL (Note 10) 51,108Property and equipmentNet tangible liabilitiesassumed 731
Net tangible assets (liabilities)assumed (731)
MK Data [Member] |Customer Relationships[Member]Finite-lived intangible assetsacquired 7,500
MK Data [Member] |Developed Technology Rights[Member]Finite-lived intangible assetsacquired 22,000
MK Data [Member] | TradeNames [Member]Finite-lived intangible assetsacquired 190
BearWare [Member]Cash, net of cash acquired 11,243Net working capitaladjustments (receivable) /payable
(19)
Purchase price consideration $11,200 11,224
Current assets, excluding cashacquired 759
Current liabilities (112)
Copyright © 2018 www.secdatabase.com. All Rights Reserved.Please Consider the Environment Before Printing This Document
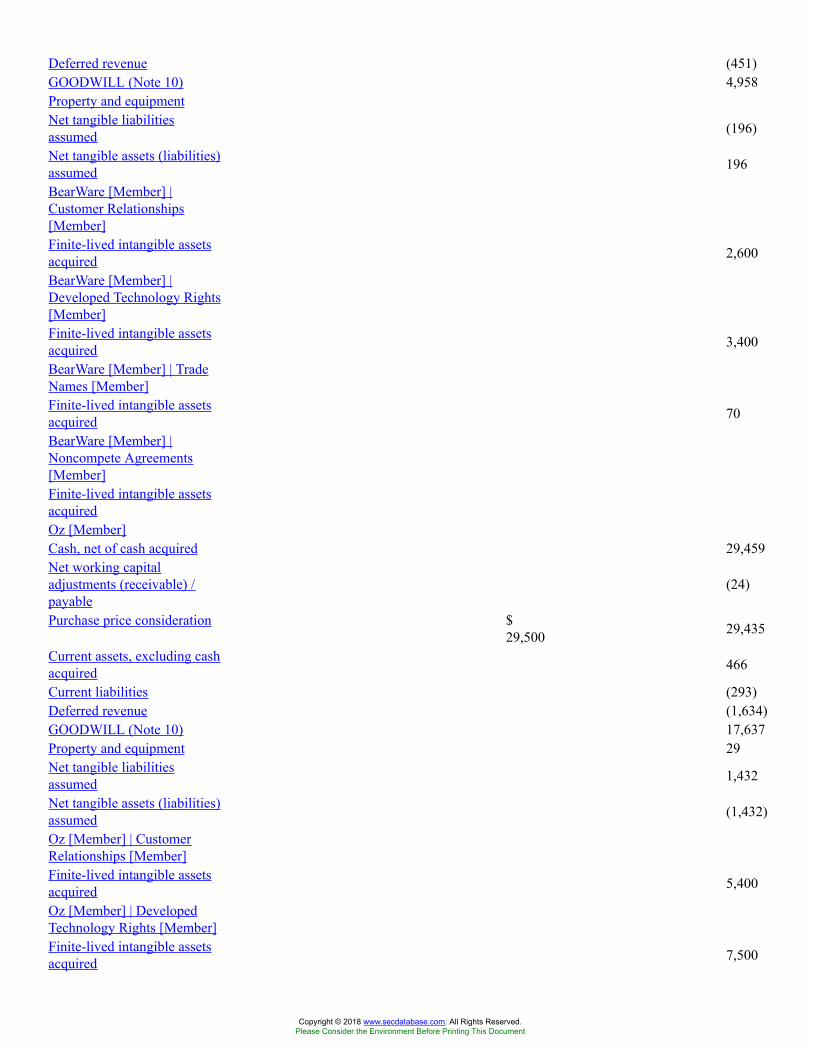
Deferred revenue (451)GOODWILL (Note 10) 4,958Property and equipmentNet tangible liabilitiesassumed (196)
Net tangible assets (liabilities)assumed 196
BearWare [Member] |Customer Relationships[Member]Finite-lived intangible assetsacquired 2,600
BearWare [Member] |Developed Technology Rights[Member]Finite-lived intangible assetsacquired 3,400
BearWare [Member] | TradeNames [Member]Finite-lived intangible assetsacquired 70
BearWare [Member] |Noncompete Agreements[Member]Finite-lived intangible assetsacquiredOz [Member]Cash, net of cash acquired 29,459Net working capitaladjustments (receivable) /payable
(24)
Purchase price consideration $29,500 29,435
Current assets, excluding cashacquired 466
Current liabilities (293)Deferred revenue (1,634)GOODWILL (Note 10) 17,637Property and equipment 29Net tangible liabilitiesassumed 1,432
Net tangible assets (liabilities)assumed (1,432)
Oz [Member] | CustomerRelationships [Member]Finite-lived intangible assetsacquired 5,400
Oz [Member] | DevelopedTechnology Rights [Member]Finite-lived intangible assetsacquired 7,500
Copyright © 2018 www.secdatabase.com. All Rights Reserved.Please Consider the Environment Before Printing This Document
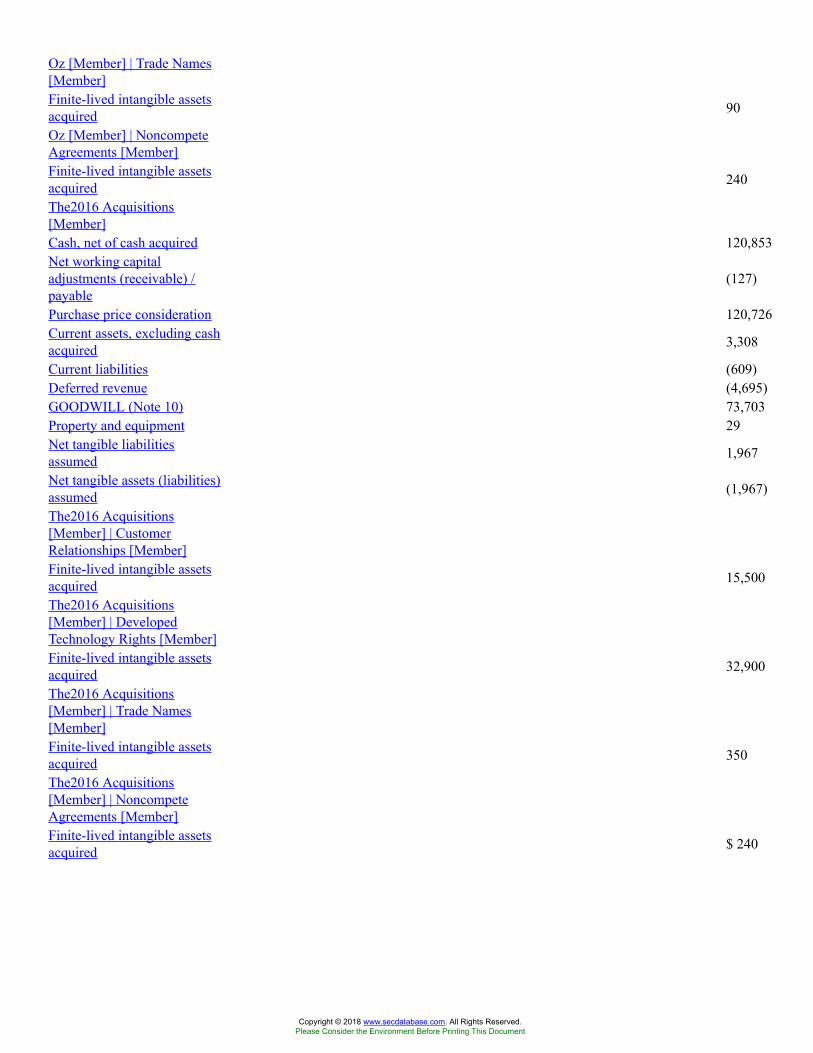
Oz [Member] | Trade Names[Member]Finite-lived intangible assetsacquired 90
Oz [Member] | NoncompeteAgreements [Member]Finite-lived intangible assetsacquired 240
The2016 Acquisitions[Member]Cash, net of cash acquired 120,853Net working capitaladjustments (receivable) /payable
(127)
Purchase price consideration 120,726Current assets, excluding cashacquired 3,308
Current liabilities (609)Deferred revenue (4,695)GOODWILL (Note 10) 73,703Property and equipment 29Net tangible liabilitiesassumed 1,967
Net tangible assets (liabilities)assumed (1,967)
The2016 Acquisitions[Member] | CustomerRelationships [Member]Finite-lived intangible assetsacquired 15,500
The2016 Acquisitions[Member] | DevelopedTechnology Rights [Member]Finite-lived intangible assetsacquired 32,900
The2016 Acquisitions[Member] | Trade Names[Member]Finite-lived intangible assetsacquired 350
The2016 Acquisitions[Member] | NoncompeteAgreements [Member]Finite-lived intangible assetsacquired $ 240
Copyright © 2018 www.secdatabase.com. All Rights Reserved.Please Consider the Environment Before Printing This Document
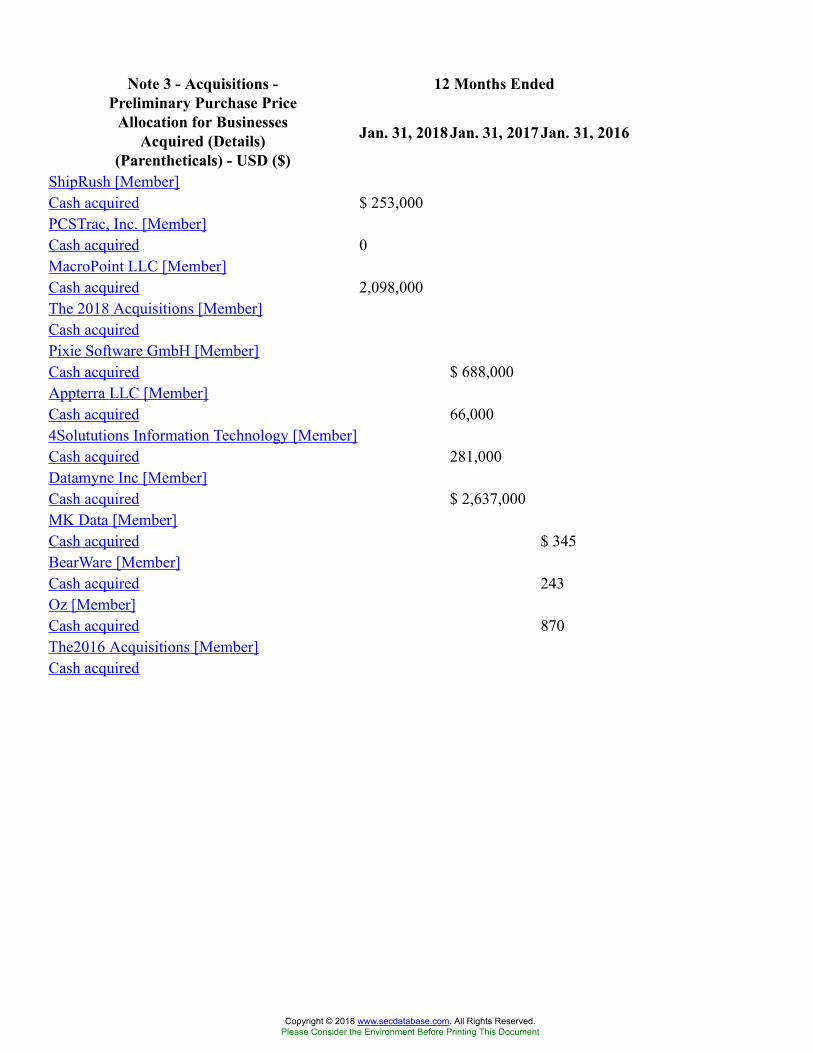
12 Months EndedNote 3 - Acquisitions -Preliminary Purchase Price
Allocation for BusinessesAcquired (Details)
(Parentheticals) - USD ($)
Jan. 31, 2018 Jan. 31, 2017 Jan. 31, 2016
ShipRush [Member]Cash acquired $ 253,000PCSTrac, Inc. [Member]Cash acquired 0MacroPoint LLC [Member]Cash acquired 2,098,000The 2018 Acquisitions [Member]Cash acquiredPixie Software GmbH [Member]Cash acquired $ 688,000Appterra LLC [Member]Cash acquired 66,0004Solututions Information Technology [Member]Cash acquired 281,000Datamyne Inc [Member]Cash acquired $ 2,637,000MK Data [Member]Cash acquired $ 345BearWare [Member]Cash acquired 243Oz [Member]Cash acquired 870The2016 Acquisitions [Member]Cash acquired
Copyright © 2018 www.secdatabase.com. All Rights Reserved.Please Consider the Environment Before Printing This Document
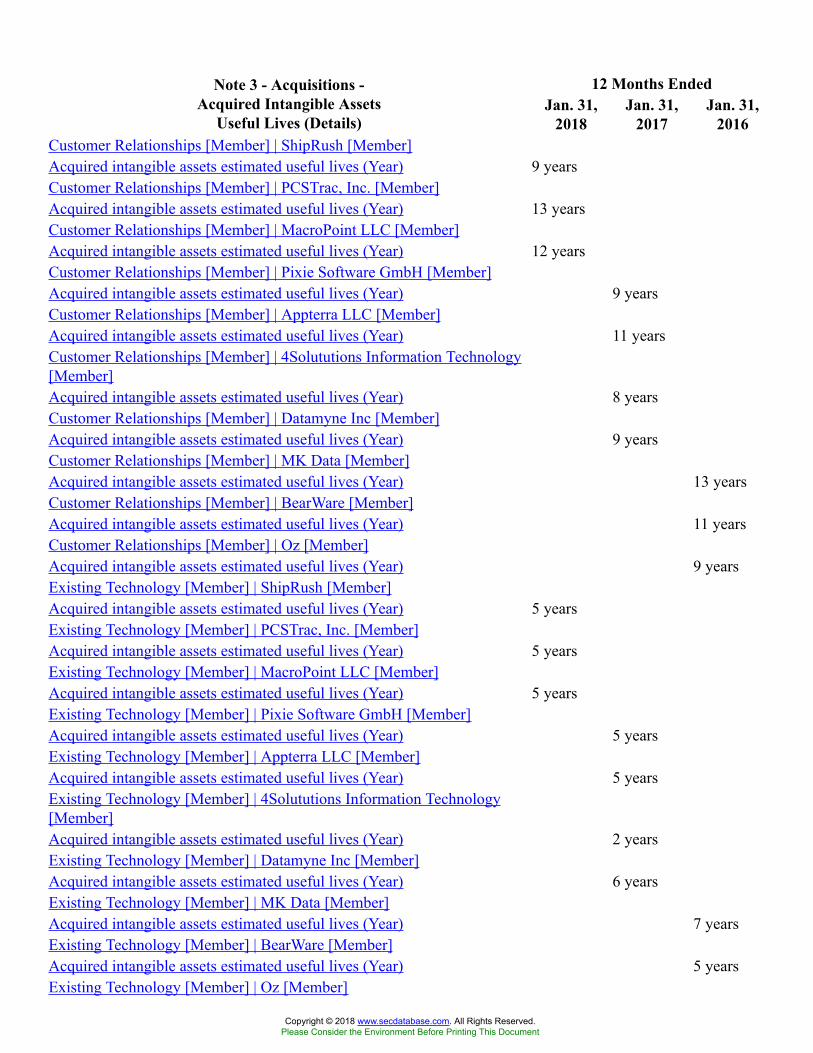
12 Months EndedNote 3 - Acquisitions -Acquired Intangible Assets
Useful Lives (Details)Jan. 31,
2018Jan. 31,
2017Jan. 31,
2016Customer Relationships [Member] | ShipRush [Member]Acquired intangible assets estimated useful lives (Year) 9 yearsCustomer Relationships [Member] | PCSTrac, Inc. [Member]Acquired intangible assets estimated useful lives (Year) 13 yearsCustomer Relationships [Member] | MacroPoint LLC [Member]Acquired intangible assets estimated useful lives (Year) 12 yearsCustomer Relationships [Member] | Pixie Software GmbH [Member]Acquired intangible assets estimated useful lives (Year) 9 yearsCustomer Relationships [Member] | Appterra LLC [Member]Acquired intangible assets estimated useful lives (Year) 11 yearsCustomer Relationships [Member] | 4Solututions Information Technology[Member]Acquired intangible assets estimated useful lives (Year) 8 yearsCustomer Relationships [Member] | Datamyne Inc [Member]Acquired intangible assets estimated useful lives (Year) 9 yearsCustomer Relationships [Member] | MK Data [Member]Acquired intangible assets estimated useful lives (Year) 13 yearsCustomer Relationships [Member] | BearWare [Member]Acquired intangible assets estimated useful lives (Year) 11 yearsCustomer Relationships [Member] | Oz [Member]Acquired intangible assets estimated useful lives (Year) 9 yearsExisting Technology [Member] | ShipRush [Member]Acquired intangible assets estimated useful lives (Year) 5 yearsExisting Technology [Member] | PCSTrac, Inc. [Member]Acquired intangible assets estimated useful lives (Year) 5 yearsExisting Technology [Member] | MacroPoint LLC [Member]Acquired intangible assets estimated useful lives (Year) 5 yearsExisting Technology [Member] | Pixie Software GmbH [Member]Acquired intangible assets estimated useful lives (Year) 5 yearsExisting Technology [Member] | Appterra LLC [Member]Acquired intangible assets estimated useful lives (Year) 5 yearsExisting Technology [Member] | 4Solututions Information Technology[Member]Acquired intangible assets estimated useful lives (Year) 2 yearsExisting Technology [Member] | Datamyne Inc [Member]Acquired intangible assets estimated useful lives (Year) 6 yearsExisting Technology [Member] | MK Data [Member]Acquired intangible assets estimated useful lives (Year) 7 yearsExisting Technology [Member] | BearWare [Member]Acquired intangible assets estimated useful lives (Year) 5 yearsExisting Technology [Member] | Oz [Member]
Copyright © 2018 www.secdatabase.com. All Rights Reserved.Please Consider the Environment Before Printing This Document
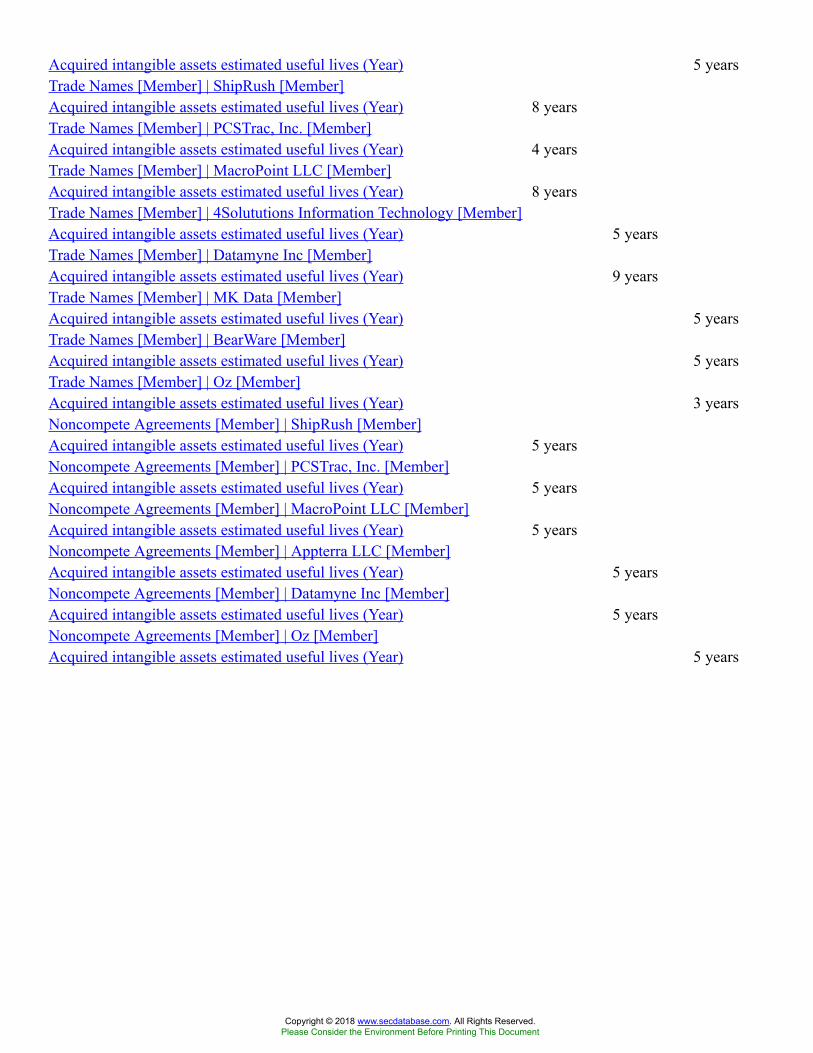
Acquired intangible assets estimated useful lives (Year) 5 yearsTrade Names [Member] | ShipRush [Member]Acquired intangible assets estimated useful lives (Year) 8 yearsTrade Names [Member] | PCSTrac, Inc. [Member]Acquired intangible assets estimated useful lives (Year) 4 yearsTrade Names [Member] | MacroPoint LLC [Member]Acquired intangible assets estimated useful lives (Year) 8 yearsTrade Names [Member] | 4Solututions Information Technology [Member]Acquired intangible assets estimated useful lives (Year) 5 yearsTrade Names [Member] | Datamyne Inc [Member]Acquired intangible assets estimated useful lives (Year) 9 yearsTrade Names [Member] | MK Data [Member]Acquired intangible assets estimated useful lives (Year) 5 yearsTrade Names [Member] | BearWare [Member]Acquired intangible assets estimated useful lives (Year) 5 yearsTrade Names [Member] | Oz [Member]Acquired intangible assets estimated useful lives (Year) 3 yearsNoncompete Agreements [Member] | ShipRush [Member]Acquired intangible assets estimated useful lives (Year) 5 yearsNoncompete Agreements [Member] | PCSTrac, Inc. [Member]Acquired intangible assets estimated useful lives (Year) 5 yearsNoncompete Agreements [Member] | MacroPoint LLC [Member]Acquired intangible assets estimated useful lives (Year) 5 yearsNoncompete Agreements [Member] | Appterra LLC [Member]Acquired intangible assets estimated useful lives (Year) 5 yearsNoncompete Agreements [Member] | Datamyne Inc [Member]Acquired intangible assets estimated useful lives (Year) 5 yearsNoncompete Agreements [Member] | Oz [Member]Acquired intangible assets estimated useful lives (Year) 5 years
Copyright © 2018 www.secdatabase.com. All Rights Reserved.Please Consider the Environment Before Printing This Document
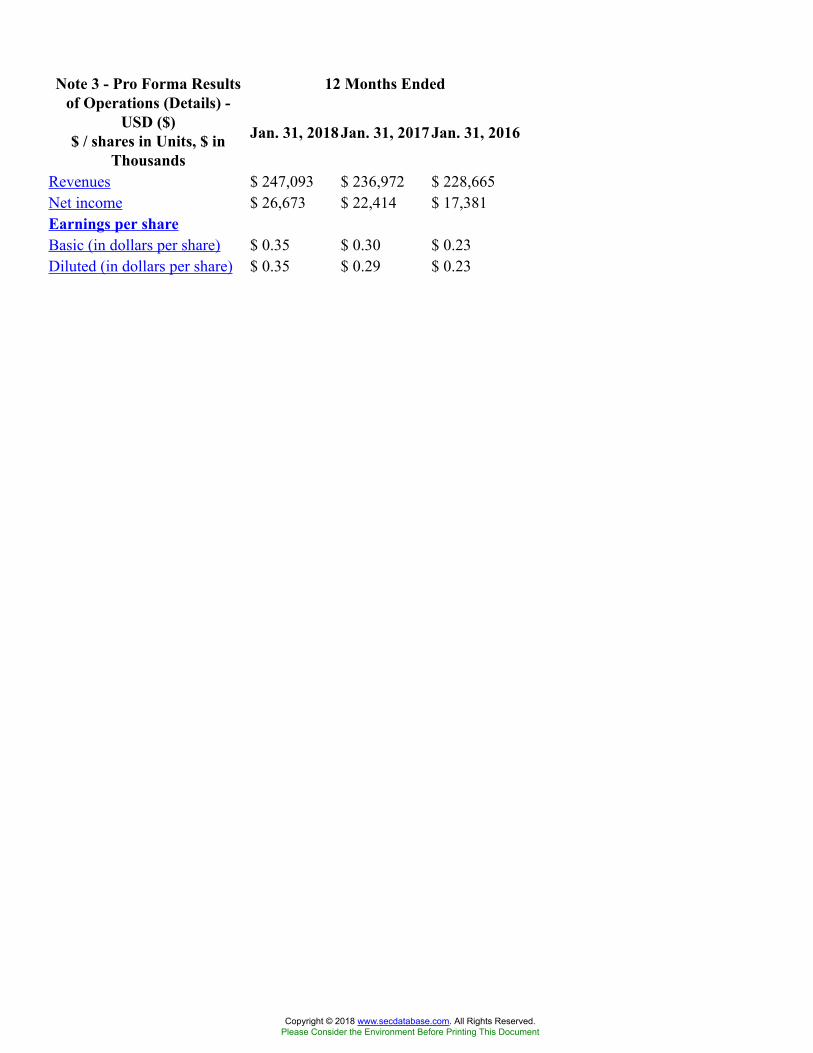
12 Months EndedNote 3 - Pro Forma Resultsof Operations (Details) -
USD ($)$ / shares in Units, $ in
Thousands
Jan. 31, 2018 Jan. 31, 2017 Jan. 31, 2016
Revenues $ 247,093 $ 236,972 $ 228,665Net income $ 26,673 $ 22,414 $ 17,381Earnings per shareBasic (in dollars per share) $ 0.35 $ 0.30 $ 0.23Diluted (in dollars per share) $ 0.35 $ 0.29 $ 0.23
Copyright © 2018 www.secdatabase.com. All Rights Reserved.Please Consider the Environment Before Printing This Document
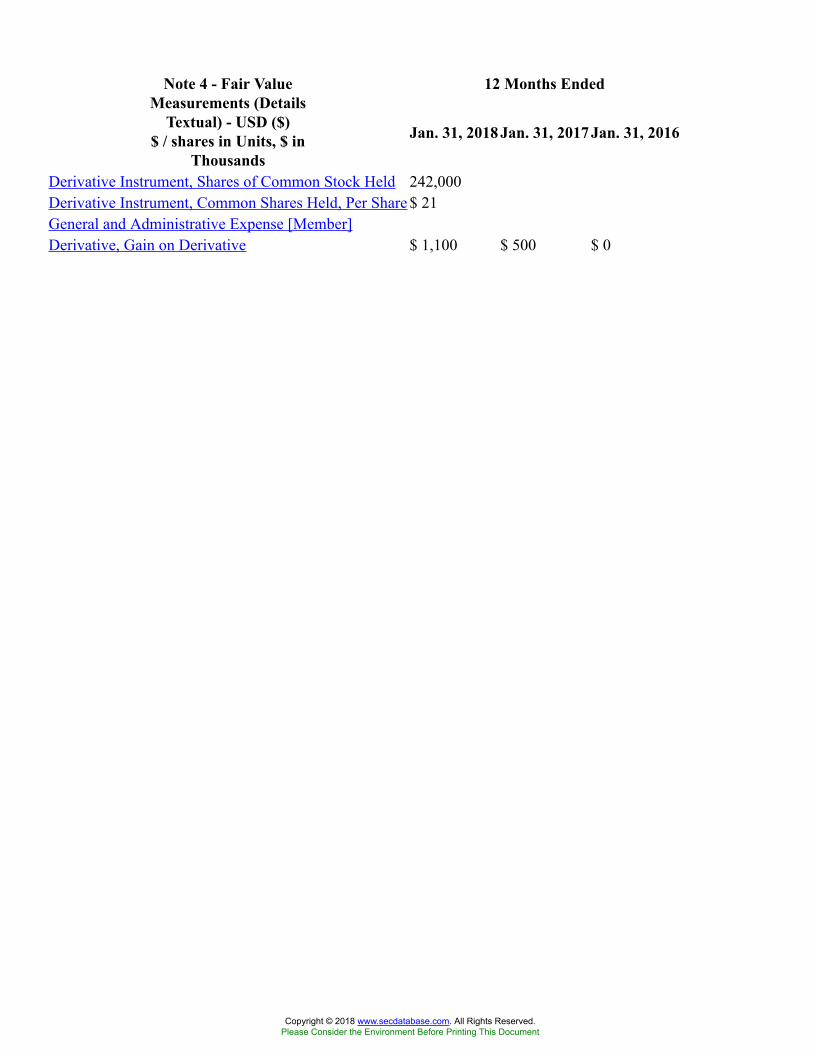
12 Months EndedNote 4 - Fair ValueMeasurements (Details
Textual) - USD ($)$ / shares in Units, $ in
Thousands
Jan. 31, 2018 Jan. 31, 2017 Jan. 31, 2016
Derivative Instrument, Shares of Common Stock Held 242,000Derivative Instrument, Common Shares Held, Per Share $ 21General and Administrative Expense [Member]Derivative, Gain on Derivative $ 1,100 $ 500 $ 0
Copyright © 2018 www.secdatabase.com. All Rights Reserved.Please Consider the Environment Before Printing This Document
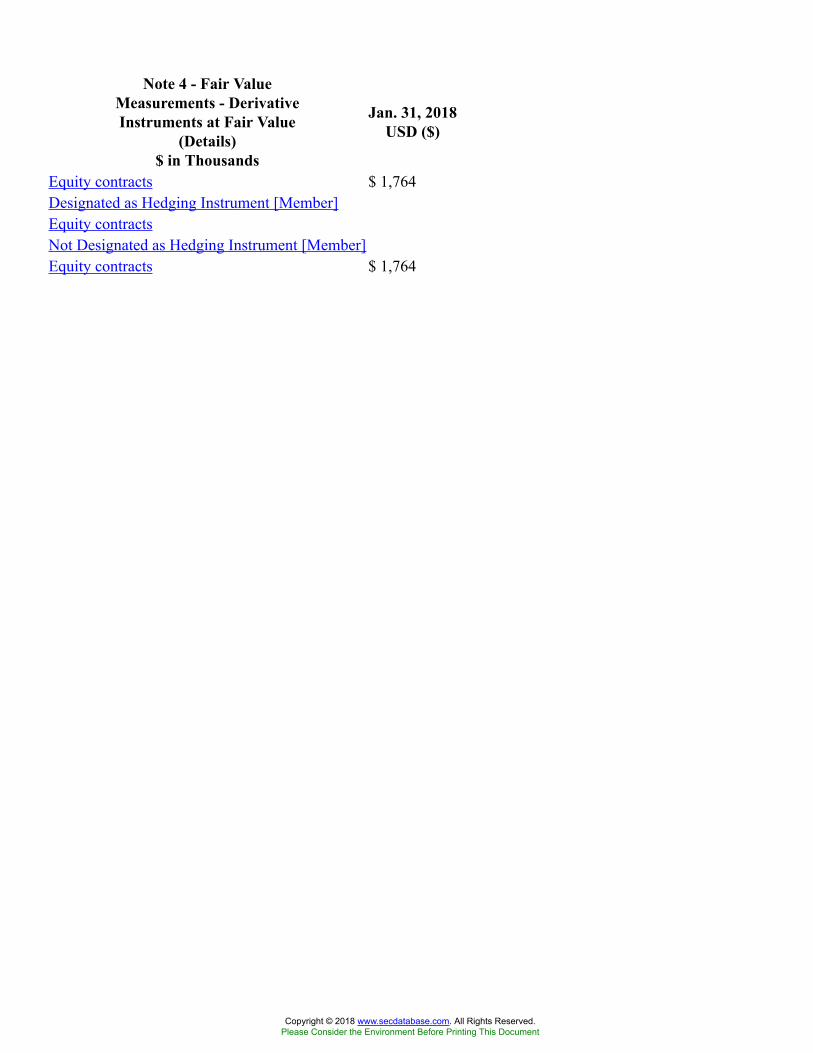
Note 4 - Fair ValueMeasurements - DerivativeInstruments at Fair Value
(Details)$ in Thousands
Jan. 31, 2018USD ($)
Equity contracts $ 1,764Designated as Hedging Instrument [Member]Equity contractsNot Designated as Hedging Instrument [Member]Equity contracts $ 1,764
Copyright © 2018 www.secdatabase.com. All Rights Reserved.Please Consider the Environment Before Printing This Document
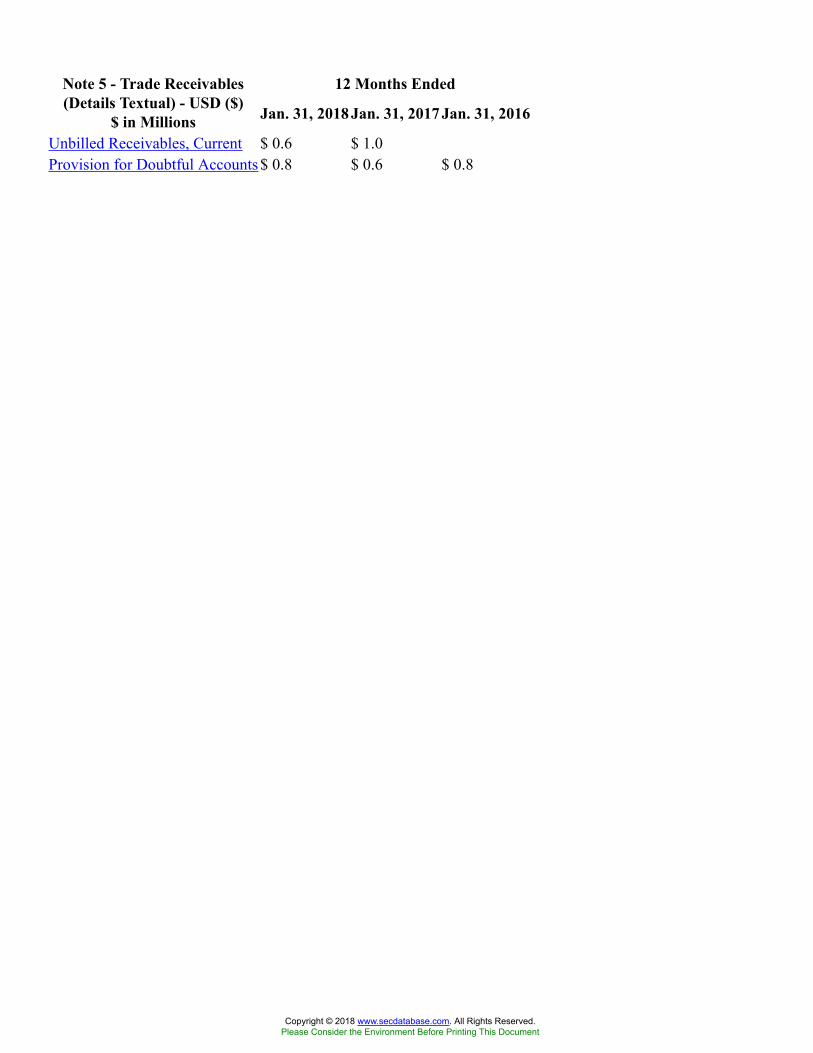
12 Months EndedNote 5 - Trade Receivables(Details Textual) - USD ($)
$ in Millions Jan. 31, 2018 Jan. 31, 2017 Jan. 31, 2016
Unbilled Receivables, Current $ 0.6 $ 1.0Provision for Doubtful Accounts $ 0.8 $ 0.6 $ 0.8
Copyright © 2018 www.secdatabase.com. All Rights Reserved.Please Consider the Environment Before Printing This Document
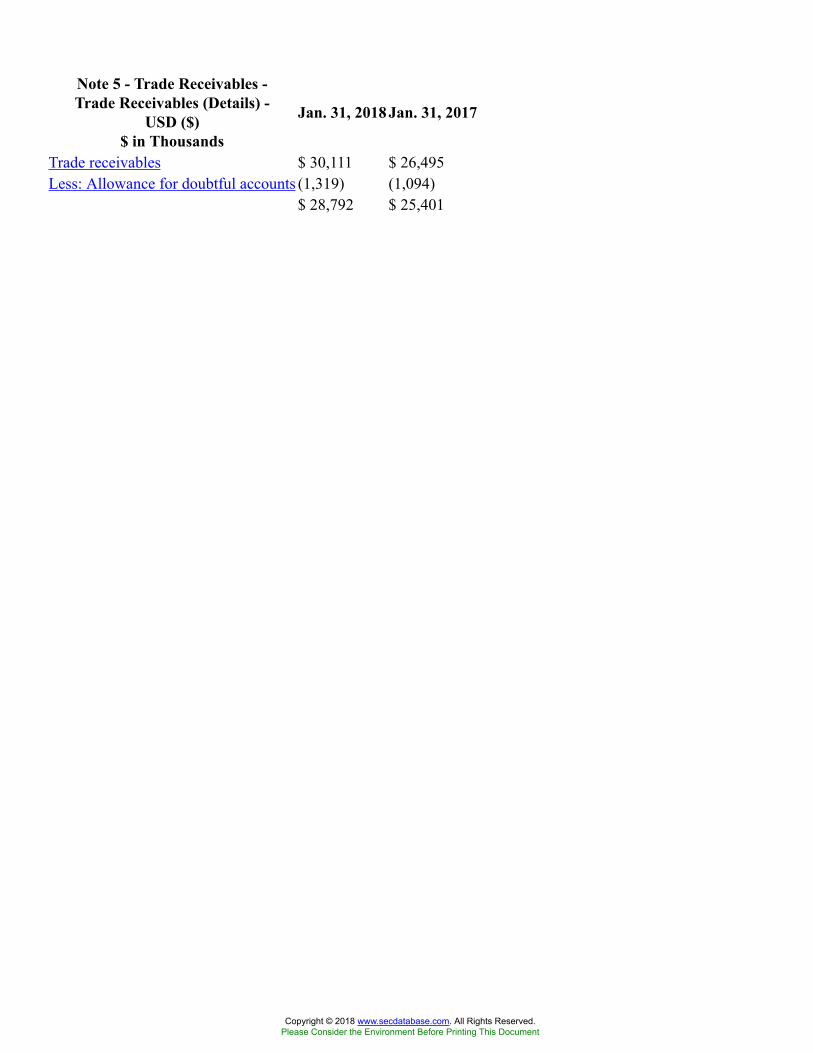
Note 5 - Trade Receivables -Trade Receivables (Details) -
USD ($)$ in Thousands
Jan. 31, 2018 Jan. 31, 2017
Trade receivables $ 30,111 $ 26,495Less: Allowance for doubtful accounts (1,319) (1,094)
$ 28,792 $ 25,401
Copyright © 2018 www.secdatabase.com. All Rights Reserved.Please Consider the Environment Before Printing This Document
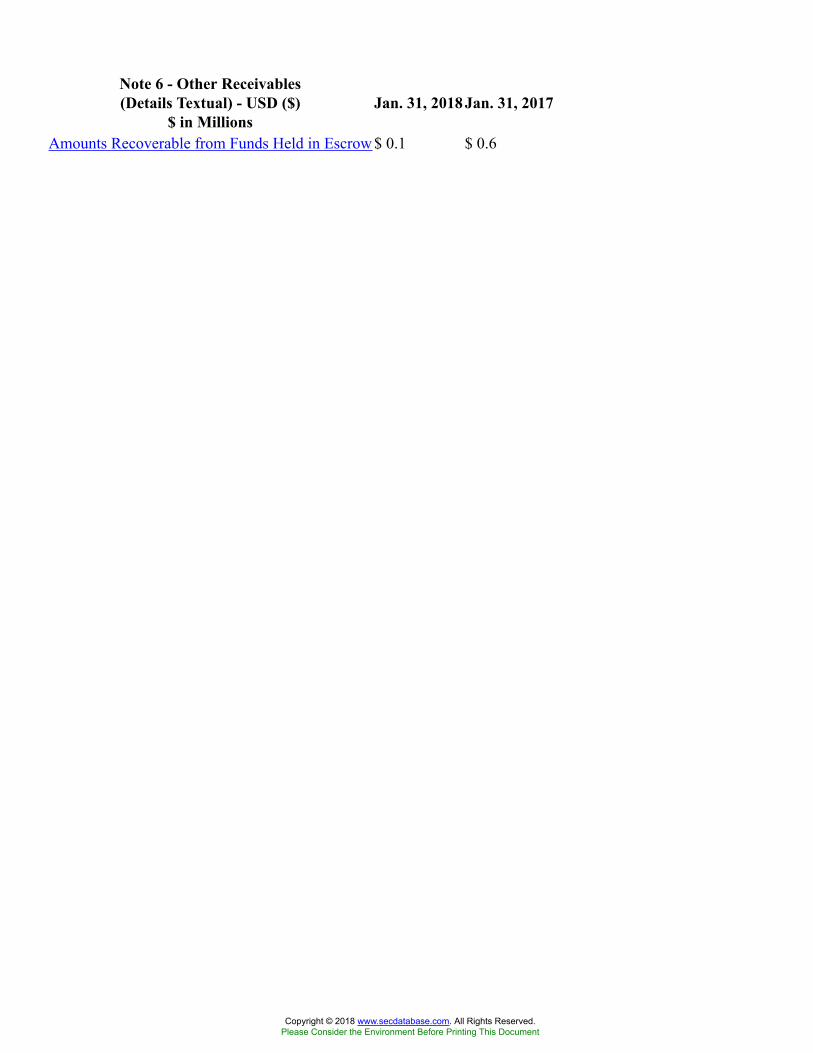
Note 6 - Other Receivables(Details Textual) - USD ($)
$ in MillionsJan. 31, 2018 Jan. 31, 2017
Amounts Recoverable from Funds Held in Escrow $ 0.1 $ 0.6
Copyright © 2018 www.secdatabase.com. All Rights Reserved.Please Consider the Environment Before Printing This Document
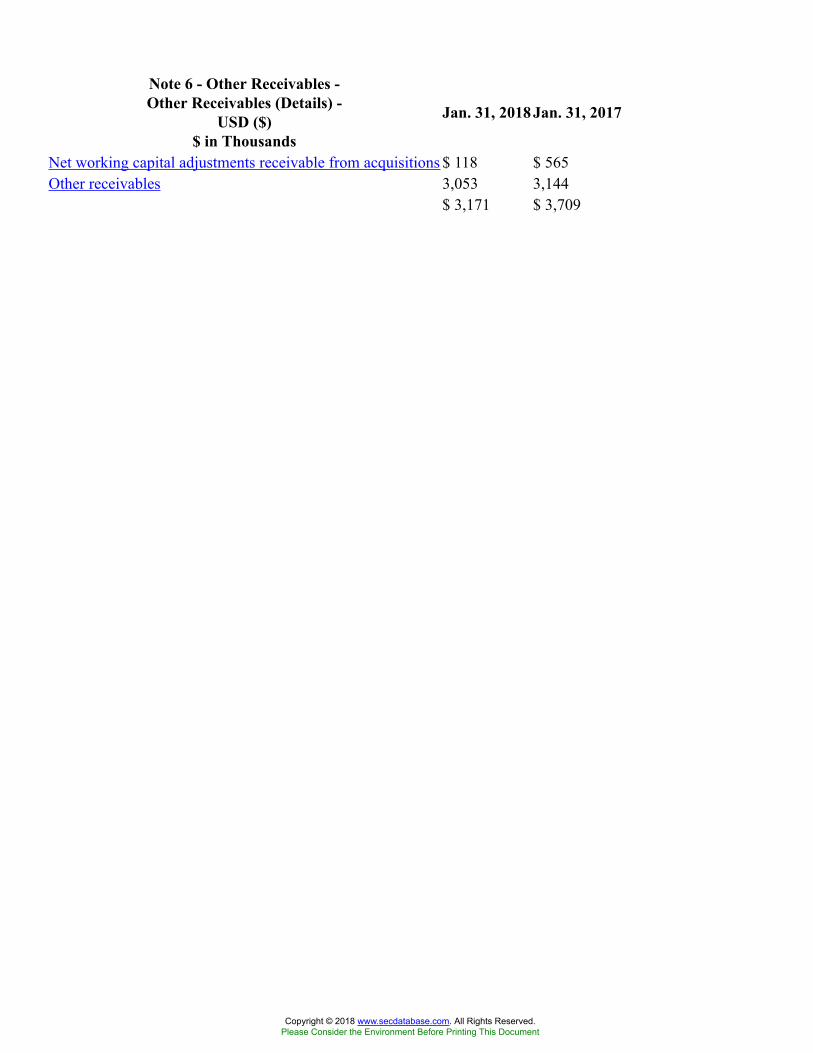
Note 6 - Other Receivables -Other Receivables (Details) -
USD ($)$ in Thousands
Jan. 31, 2018 Jan. 31, 2017
Net working capital adjustments receivable from acquisitions $ 118 $ 565Other receivables 3,053 3,144
$ 3,171 $ 3,709
Copyright © 2018 www.secdatabase.com. All Rights Reserved.Please Consider the Environment Before Printing This Document
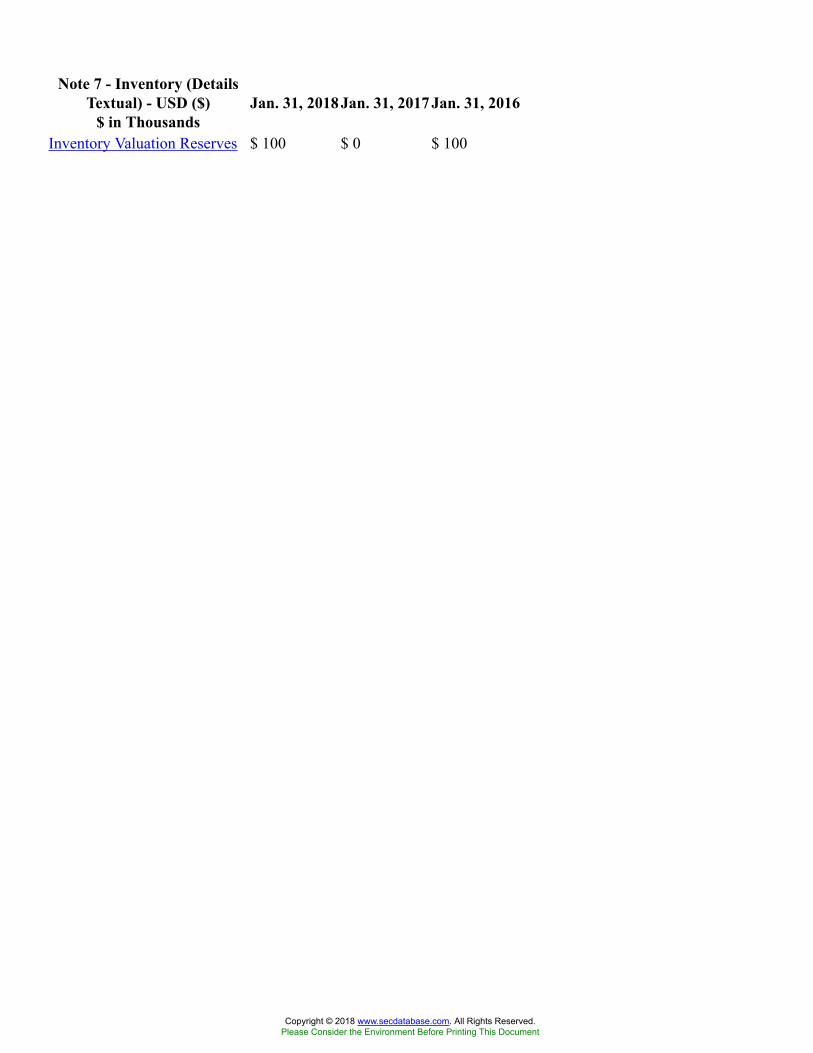
Note 7 - Inventory (DetailsTextual) - USD ($)
$ in ThousandsJan. 31, 2018 Jan. 31, 2017 Jan. 31, 2016
Inventory Valuation Reserves $ 100 $ 0 $ 100
Copyright © 2018 www.secdatabase.com. All Rights Reserved.Please Consider the Environment Before Printing This Document
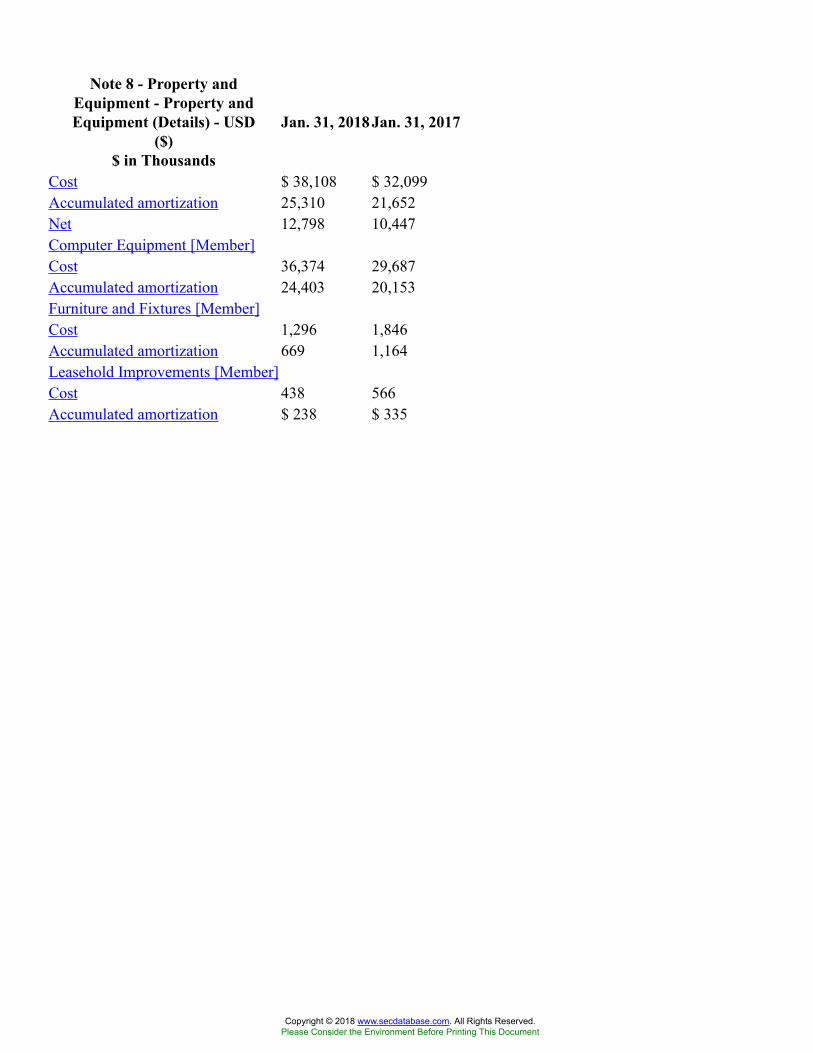
Note 8 - Property andEquipment - Property andEquipment (Details) - USD
($)$ in Thousands
Jan. 31, 2018 Jan. 31, 2017
Cost $ 38,108 $ 32,099Accumulated amortization 25,310 21,652Net 12,798 10,447Computer Equipment [Member]Cost 36,374 29,687Accumulated amortization 24,403 20,153Furniture and Fixtures [Member]Cost 1,296 1,846Accumulated amortization 669 1,164Leasehold Improvements [Member]Cost 438 566Accumulated amortization $ 238 $ 335
Copyright © 2018 www.secdatabase.com. All Rights Reserved.Please Consider the Environment Before Printing This Document
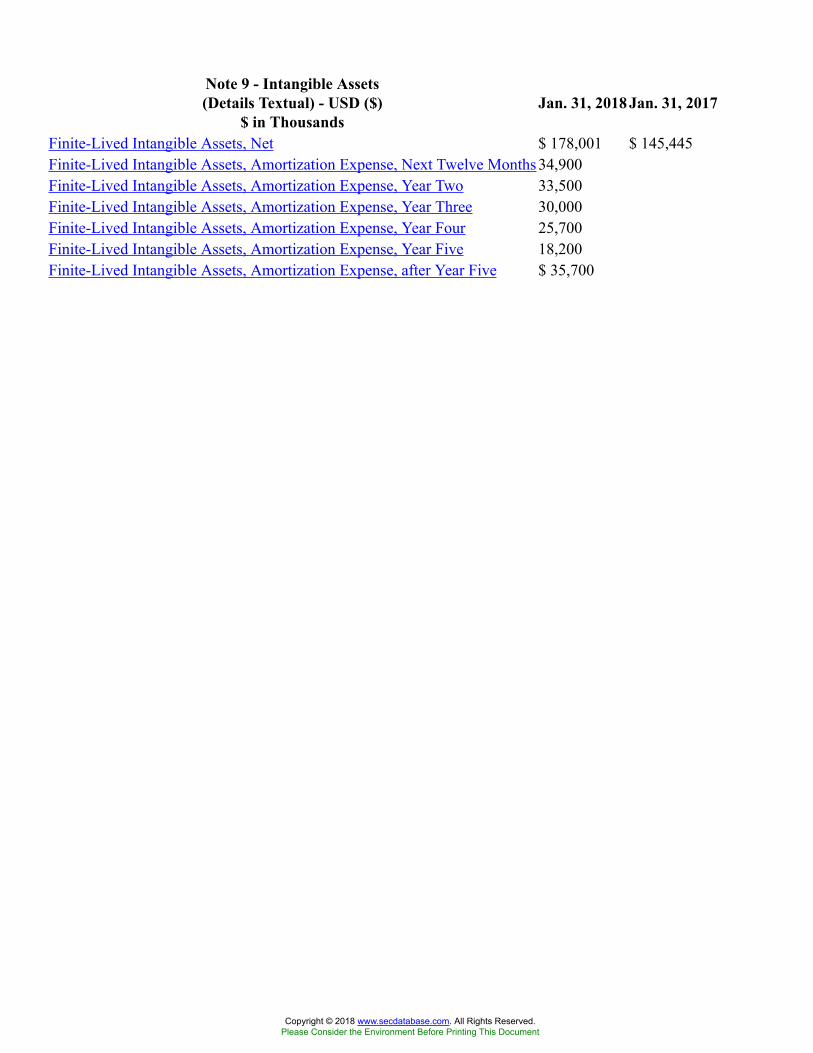
Note 9 - Intangible Assets(Details Textual) - USD ($)
$ in ThousandsJan. 31, 2018 Jan. 31, 2017
Finite-Lived Intangible Assets, Net $ 178,001 $ 145,445Finite-Lived Intangible Assets, Amortization Expense, Next Twelve Months 34,900Finite-Lived Intangible Assets, Amortization Expense, Year Two 33,500Finite-Lived Intangible Assets, Amortization Expense, Year Three 30,000Finite-Lived Intangible Assets, Amortization Expense, Year Four 25,700Finite-Lived Intangible Assets, Amortization Expense, Year Five 18,200Finite-Lived Intangible Assets, Amortization Expense, after Year Five $ 35,700
Copyright © 2018 www.secdatabase.com. All Rights Reserved.Please Consider the Environment Before Printing This Document
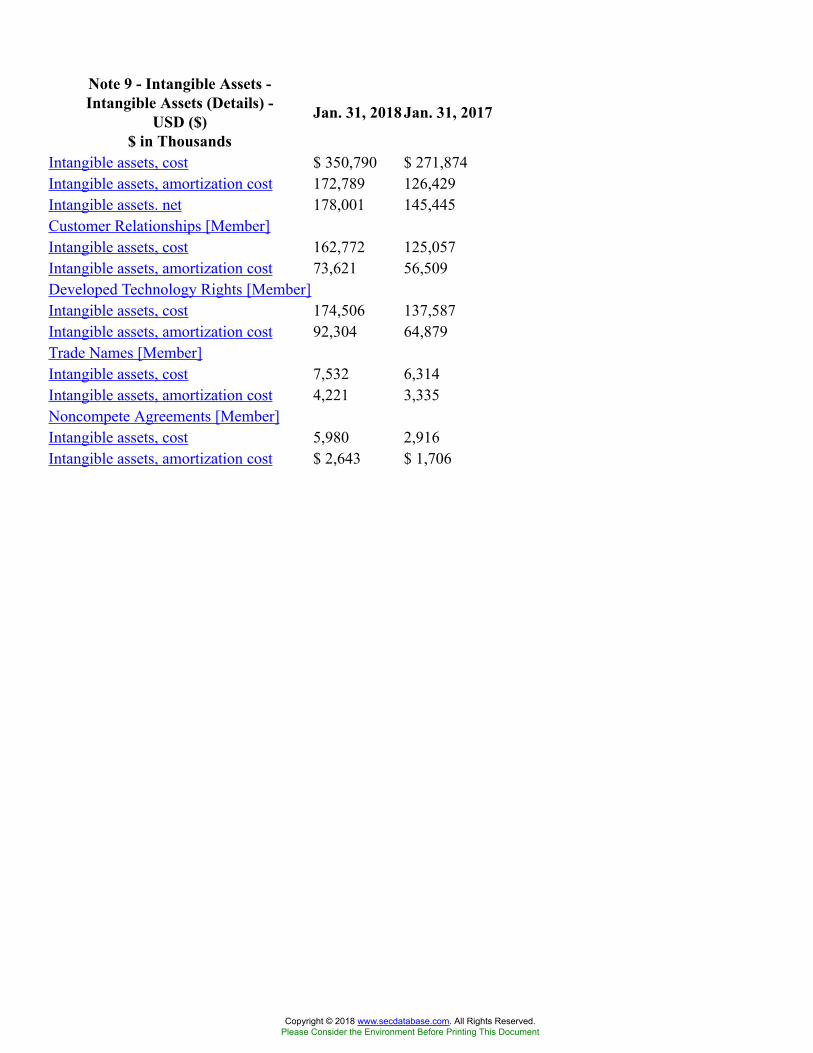
Note 9 - Intangible Assets -Intangible Assets (Details) -
USD ($)$ in Thousands
Jan. 31, 2018 Jan. 31, 2017
Intangible assets, cost $ 350,790 $ 271,874Intangible assets, amortization cost 172,789 126,429Intangible assets. net 178,001 145,445Customer Relationships [Member]Intangible assets, cost 162,772 125,057Intangible assets, amortization cost 73,621 56,509Developed Technology Rights [Member]Intangible assets, cost 174,506 137,587Intangible assets, amortization cost 92,304 64,879Trade Names [Member]Intangible assets, cost 7,532 6,314Intangible assets, amortization cost 4,221 3,335Noncompete Agreements [Member]Intangible assets, cost 5,980 2,916Intangible assets, amortization cost $ 2,643 $ 1,706
Copyright © 2018 www.secdatabase.com. All Rights Reserved.Please Consider the Environment Before Printing This Document
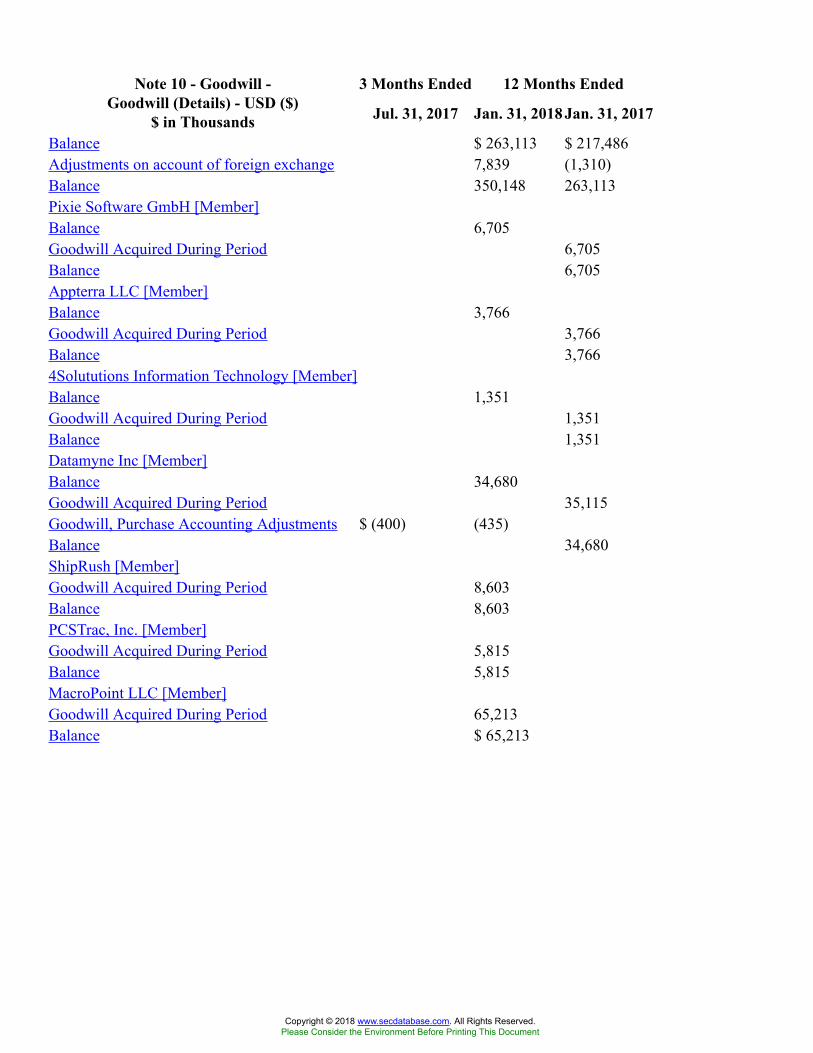
3 Months Ended 12 Months EndedNote 10 - Goodwill -Goodwill (Details) - USD ($)
$ in Thousands Jul. 31, 2017 Jan. 31, 2018 Jan. 31, 2017
Balance $ 263,113 $ 217,486Adjustments on account of foreign exchange 7,839 (1,310)Balance 350,148 263,113Pixie Software GmbH [Member]Balance 6,705Goodwill Acquired During Period 6,705Balance 6,705Appterra LLC [Member]Balance 3,766Goodwill Acquired During Period 3,766Balance 3,7664Solututions Information Technology [Member]Balance 1,351Goodwill Acquired During Period 1,351Balance 1,351Datamyne Inc [Member]Balance 34,680Goodwill Acquired During Period 35,115Goodwill, Purchase Accounting Adjustments $ (400) (435)Balance 34,680ShipRush [Member]Goodwill Acquired During Period 8,603Balance 8,603PCSTrac, Inc. [Member]Goodwill Acquired During Period 5,815Balance 5,815MacroPoint LLC [Member]Goodwill Acquired During Period 65,213Balance $ 65,213
Copyright © 2018 www.secdatabase.com. All Rights Reserved.Please Consider the Environment Before Printing This Document
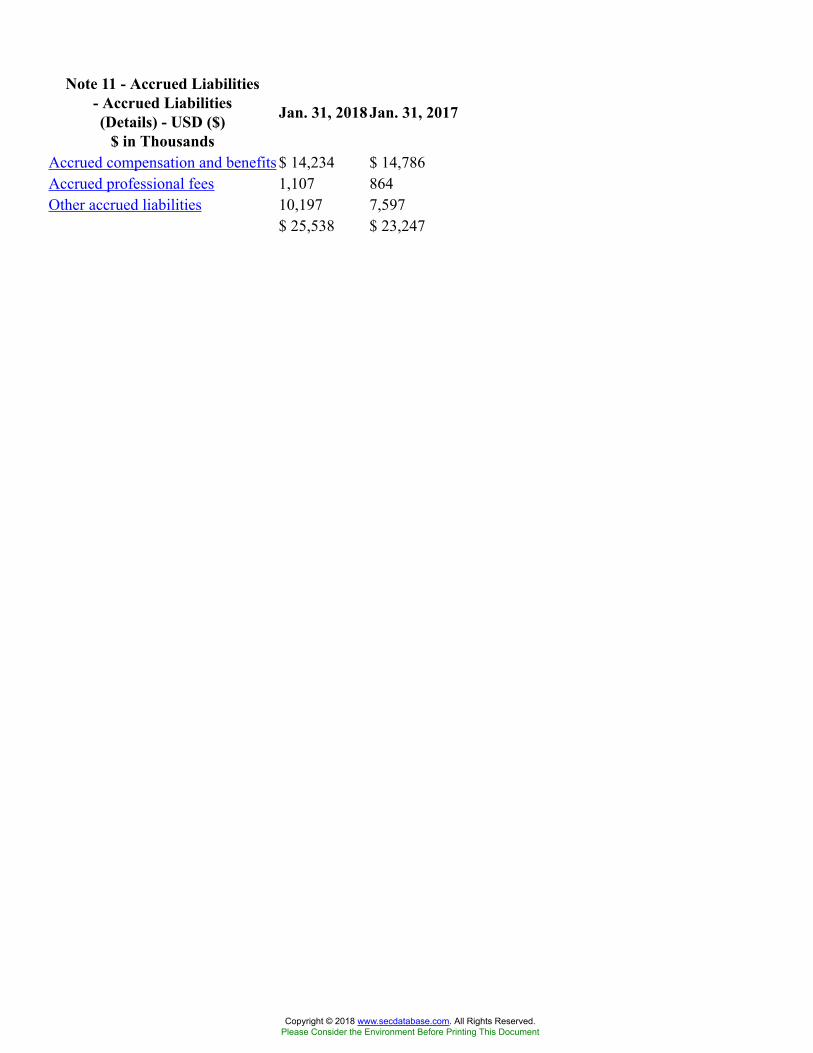
Note 11 - Accrued Liabilities- Accrued Liabilities(Details) - USD ($)
$ in Thousands
Jan. 31, 2018 Jan. 31, 2017
Accrued compensation and benefits $ 14,234 $ 14,786Accrued professional fees 1,107 864Other accrued liabilities 10,197 7,597
$ 25,538 $ 23,247
Copyright © 2018 www.secdatabase.com. All Rights Reserved.Please Consider the Environment Before Printing This Document
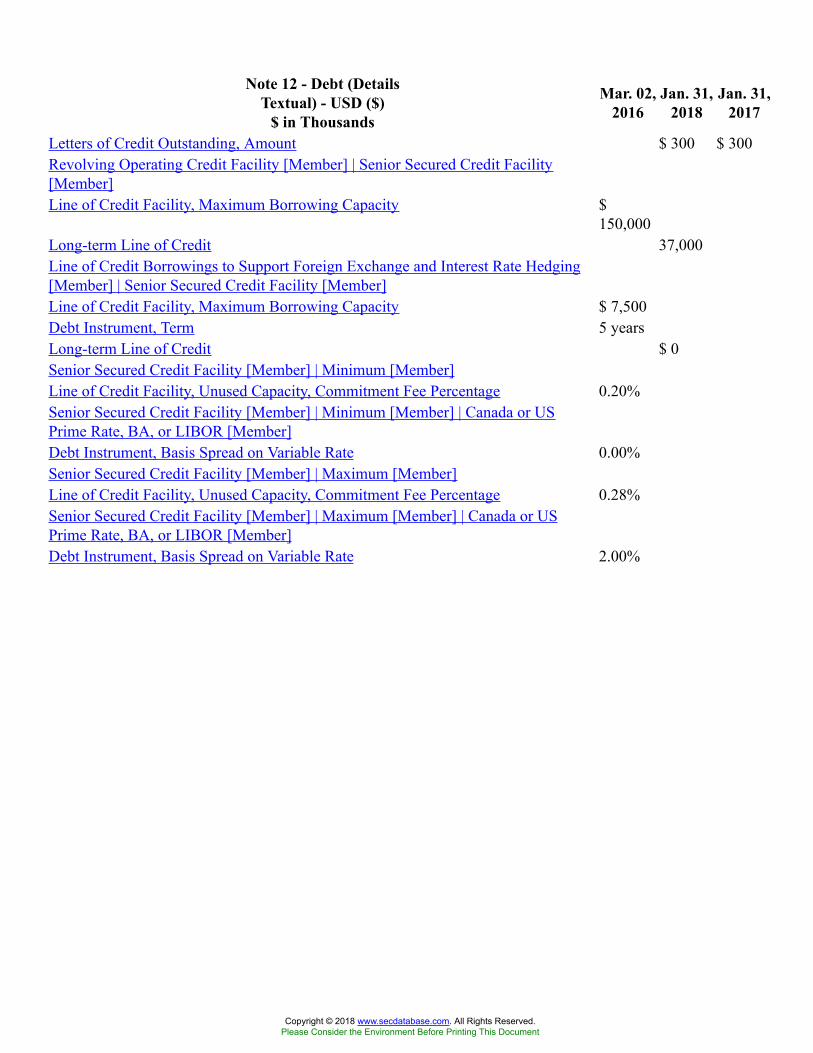
Note 12 - Debt (DetailsTextual) - USD ($)
$ in Thousands
Mar. 02,2016
Jan. 31,2018
Jan. 31,2017
Letters of Credit Outstanding, Amount $ 300 $ 300Revolving Operating Credit Facility [Member] | Senior Secured Credit Facility[Member]Line of Credit Facility, Maximum Borrowing Capacity $
150,000Long-term Line of Credit 37,000Line of Credit Borrowings to Support Foreign Exchange and Interest Rate Hedging[Member] | Senior Secured Credit Facility [Member]Line of Credit Facility, Maximum Borrowing Capacity $ 7,500Debt Instrument, Term 5 yearsLong-term Line of Credit $ 0Senior Secured Credit Facility [Member] | Minimum [Member]Line of Credit Facility, Unused Capacity, Commitment Fee Percentage 0.20%Senior Secured Credit Facility [Member] | Minimum [Member] | Canada or USPrime Rate, BA, or LIBOR [Member]Debt Instrument, Basis Spread on Variable Rate 0.00%Senior Secured Credit Facility [Member] | Maximum [Member]Line of Credit Facility, Unused Capacity, Commitment Fee Percentage 0.28%Senior Secured Credit Facility [Member] | Maximum [Member] | Canada or USPrime Rate, BA, or LIBOR [Member]Debt Instrument, Basis Spread on Variable Rate 2.00%
Copyright © 2018 www.secdatabase.com. All Rights Reserved.Please Consider the Environment Before Printing This Document
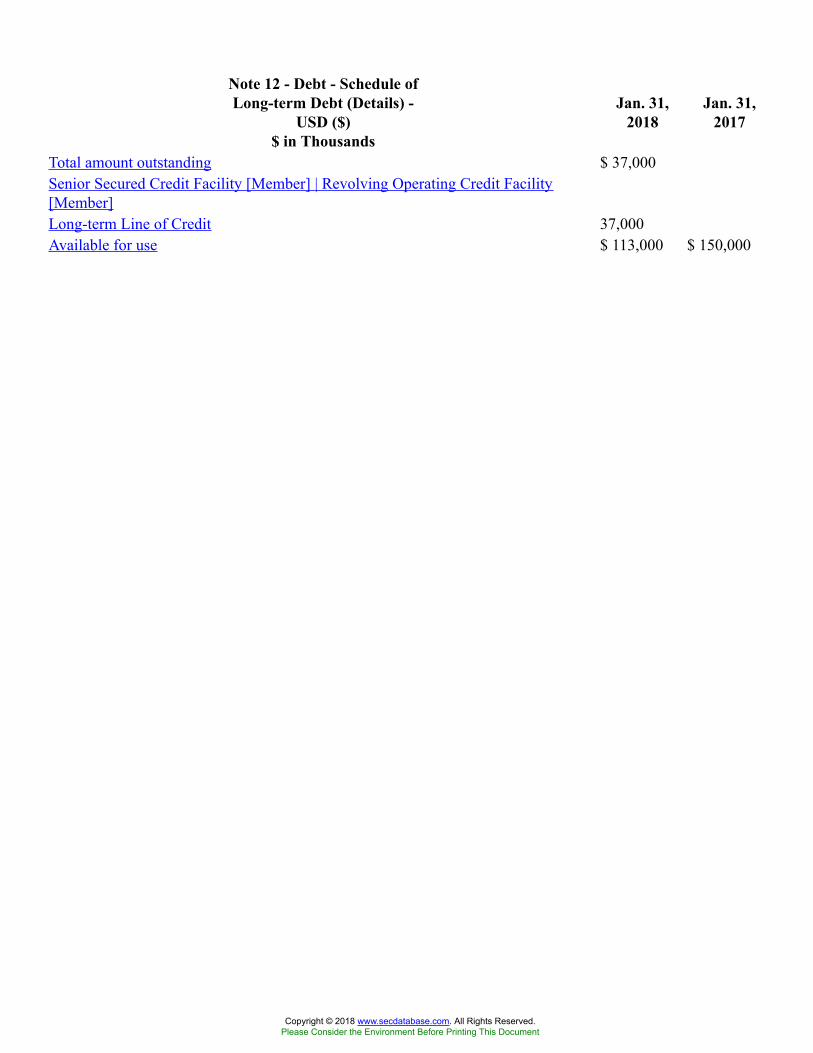
Note 12 - Debt - Schedule ofLong-term Debt (Details) -
USD ($)$ in Thousands
Jan. 31,2018
Jan. 31,2017
Total amount outstanding $ 37,000Senior Secured Credit Facility [Member] | Revolving Operating Credit Facility[Member]Long-term Line of Credit 37,000Available for use $ 113,000 $ 150,000
Copyright © 2018 www.secdatabase.com. All Rights Reserved.Please Consider the Environment Before Printing This Document
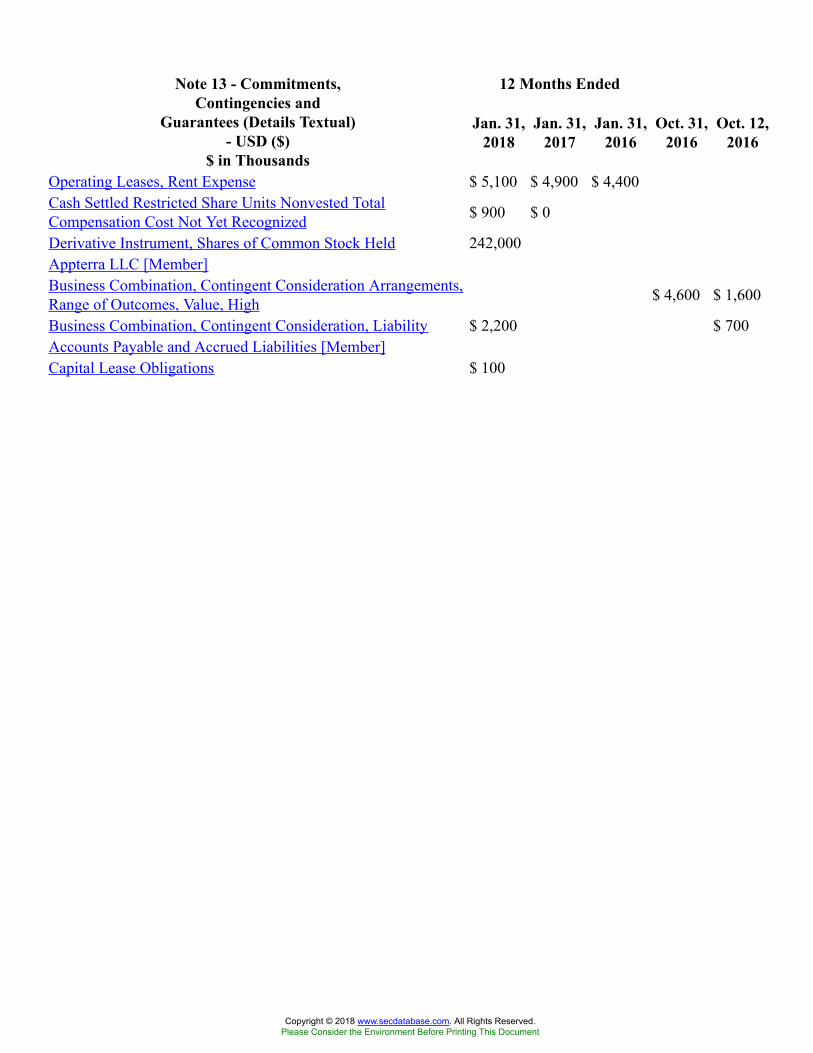
12 Months EndedNote 13 - Commitments,Contingencies and
Guarantees (Details Textual)- USD ($)
$ in Thousands
Jan. 31,2018
Jan. 31,2017
Jan. 31,2016
Oct. 31,2016
Oct. 12,2016
Operating Leases, Rent Expense $ 5,100 $ 4,900 $ 4,400Cash Settled Restricted Share Units Nonvested TotalCompensation Cost Not Yet Recognized $ 900 $ 0
Derivative Instrument, Shares of Common Stock Held 242,000Appterra LLC [Member]Business Combination, Contingent Consideration Arrangements,Range of Outcomes, Value, High $ 4,600 $ 1,600
Business Combination, Contingent Consideration, Liability $ 2,200 $ 700Accounts Payable and Accrued Liabilities [Member]Capital Lease Obligations $ 100
Copyright © 2018 www.secdatabase.com. All Rights Reserved.Please Consider the Environment Before Printing This Document
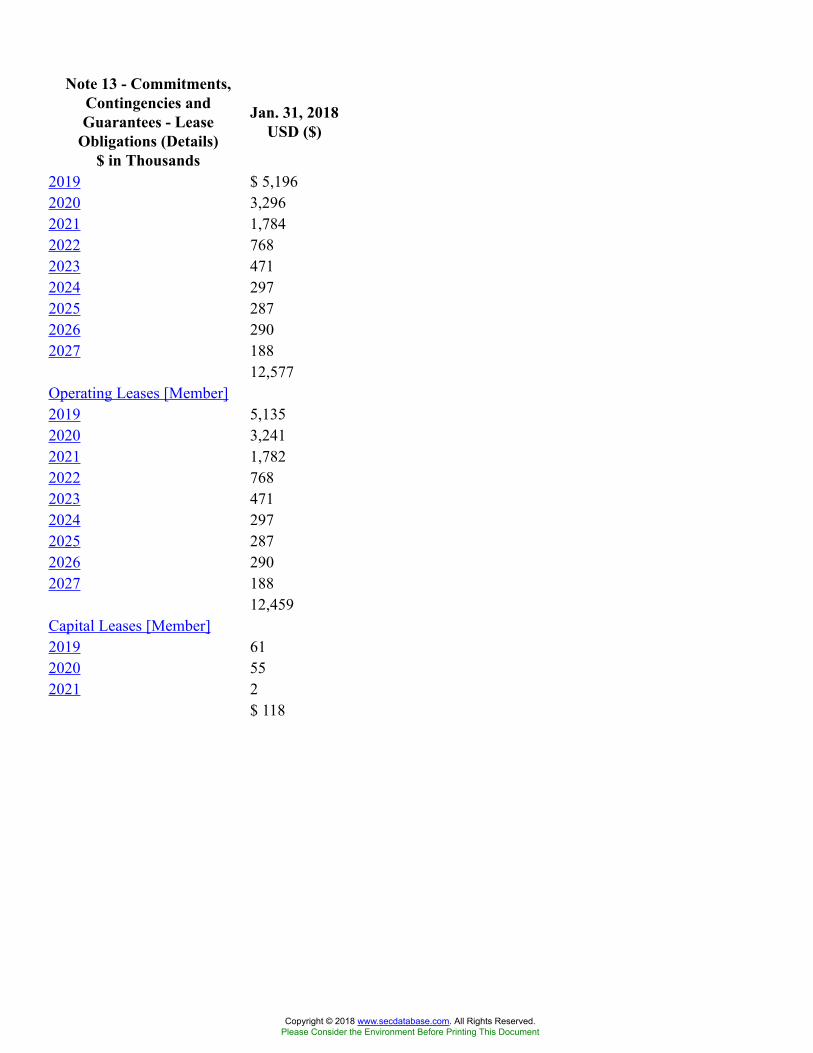
Note 13 - Commitments,Contingencies andGuarantees - Lease
Obligations (Details)$ in Thousands
Jan. 31, 2018USD ($)
2019 $ 5,1962020 3,2962021 1,7842022 7682023 4712024 2972025 2872026 2902027 188
12,577Operating Leases [Member]2019 5,1352020 3,2412021 1,7822022 7682023 4712024 2972025 2872026 2902027 188
12,459Capital Leases [Member]2019 612020 552021 2
$ 118
Copyright © 2018 www.secdatabase.com. All Rights Reserved.Please Consider the Environment Before Printing This Document
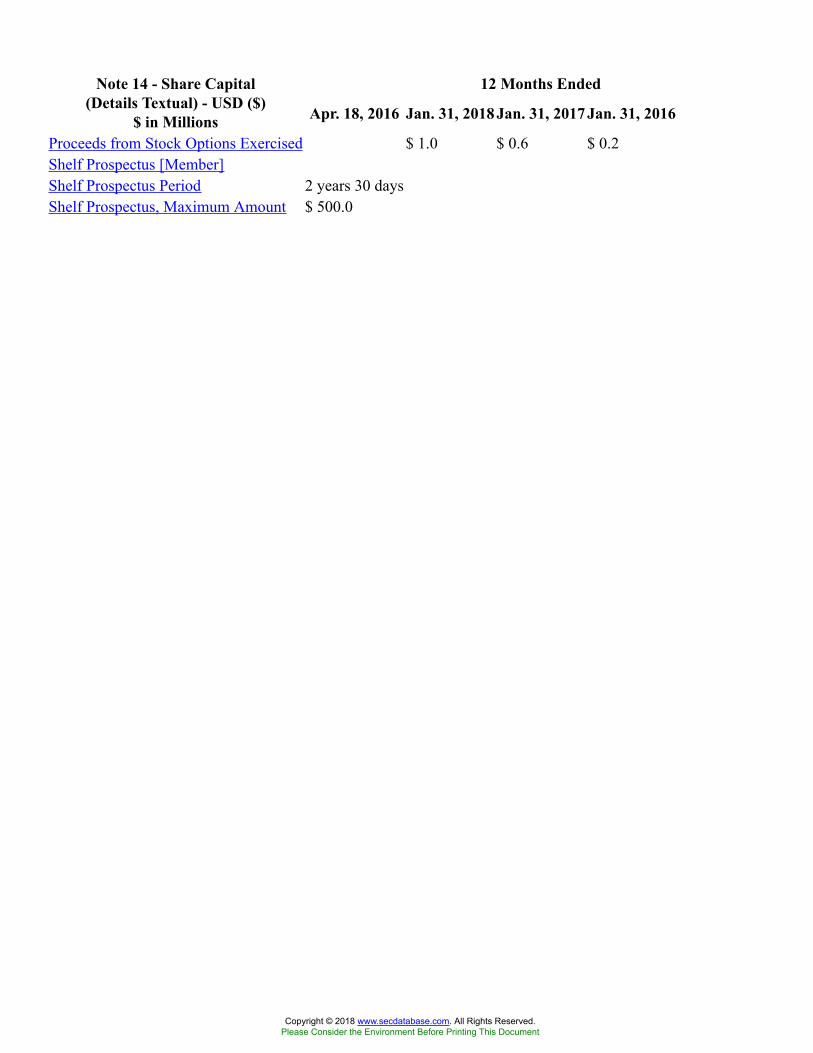
12 Months EndedNote 14 - Share Capital(Details Textual) - USD ($)
$ in Millions Apr. 18, 2016 Jan. 31, 2018 Jan. 31, 2017 Jan. 31, 2016
Proceeds from Stock Options Exercised $ 1.0 $ 0.6 $ 0.2Shelf Prospectus [Member]Shelf Prospectus Period 2 years 30 daysShelf Prospectus, Maximum Amount $ 500.0
Copyright © 2018 www.secdatabase.com. All Rights Reserved.Please Consider the Environment Before Printing This Document
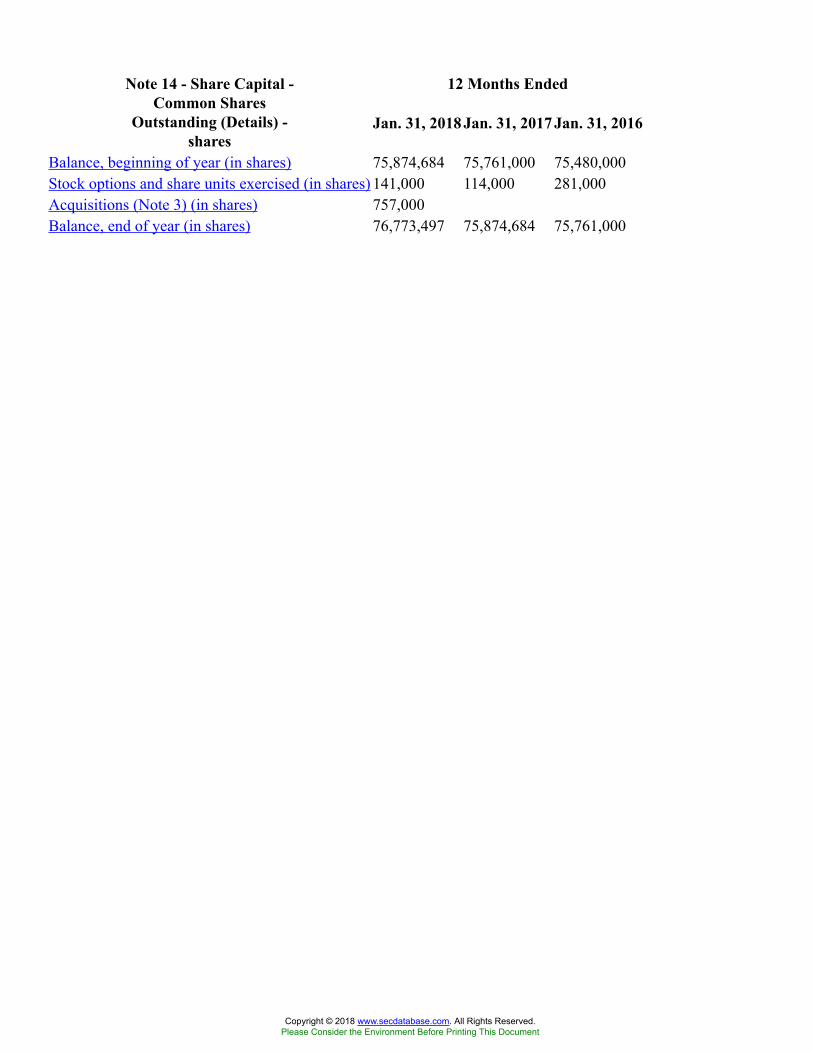
12 Months EndedNote 14 - Share Capital -Common Shares
Outstanding (Details) -shares
Jan. 31, 2018 Jan. 31, 2017 Jan. 31, 2016
Balance, beginning of year (in shares) 75,874,684 75,761,000 75,480,000Stock options and share units exercised (in shares) 141,000 114,000 281,000Acquisitions (Note 3) (in shares) 757,000Balance, end of year (in shares) 76,773,497 75,874,684 75,761,000
Copyright © 2018 www.secdatabase.com. All Rights Reserved.Please Consider the Environment Before Printing This Document
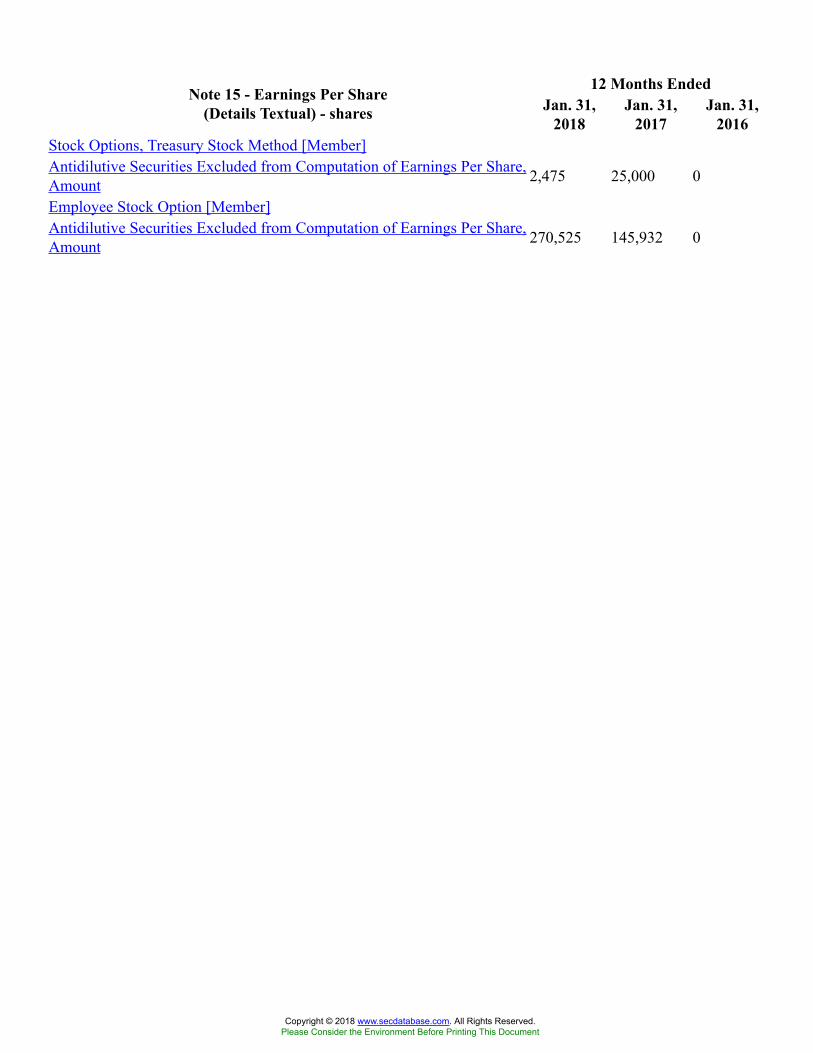
12 Months EndedNote 15 - Earnings Per Share(Details Textual) - shares Jan. 31,
2018Jan. 31,
2017Jan. 31,
2016Stock Options, Treasury Stock Method [Member]Antidilutive Securities Excluded from Computation of Earnings Per Share,Amount 2,475 25,000 0
Employee Stock Option [Member]Antidilutive Securities Excluded from Computation of Earnings Per Share,Amount 270,525 145,932 0
Copyright © 2018 www.secdatabase.com. All Rights Reserved.Please Consider the Environment Before Printing This Document
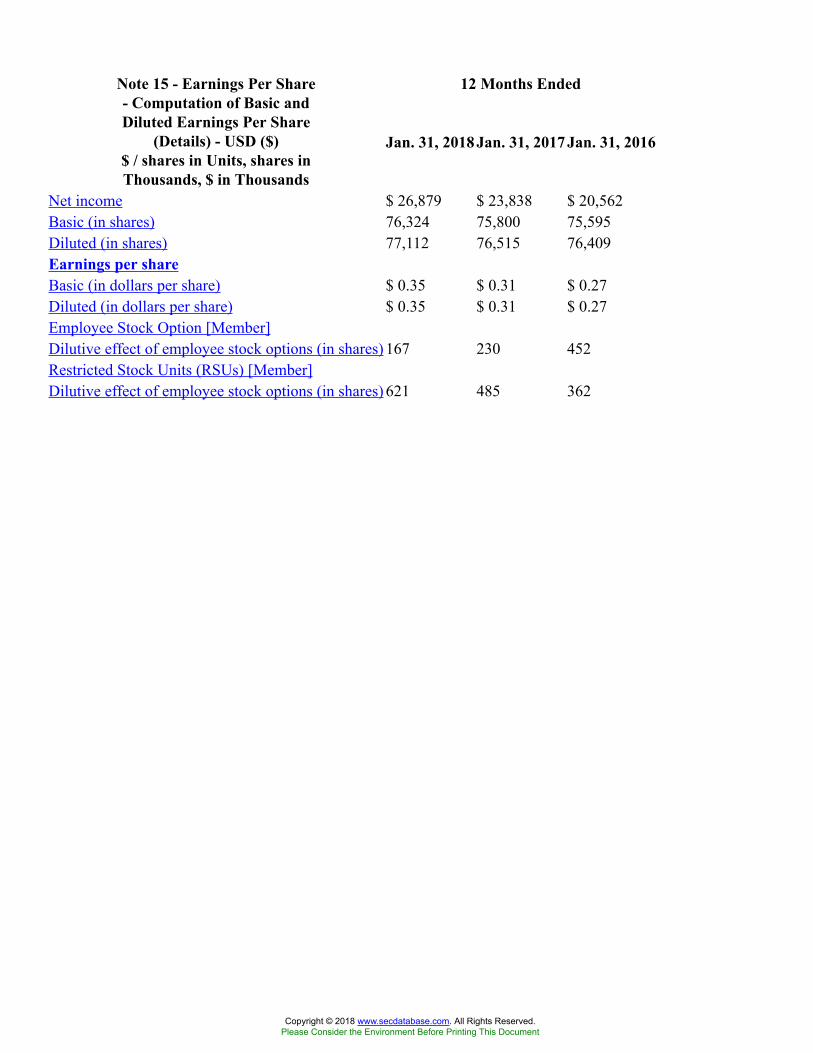
12 Months EndedNote 15 - Earnings Per Share- Computation of Basic andDiluted Earnings Per Share
(Details) - USD ($)$ / shares in Units, shares inThousands, $ in Thousands
Jan. 31, 2018 Jan. 31, 2017 Jan. 31, 2016
Net income $ 26,879 $ 23,838 $ 20,562Basic (in shares) 76,324 75,800 75,595Diluted (in shares) 77,112 76,515 76,409Earnings per shareBasic (in dollars per share) $ 0.35 $ 0.31 $ 0.27Diluted (in dollars per share) $ 0.35 $ 0.31 $ 0.27Employee Stock Option [Member]Dilutive effect of employee stock options (in shares) 167 230 452Restricted Stock Units (RSUs) [Member]Dilutive effect of employee stock options (in shares) 621 485 362
Copyright © 2018 www.secdatabase.com. All Rights Reserved.Please Consider the Environment Before Printing This Document
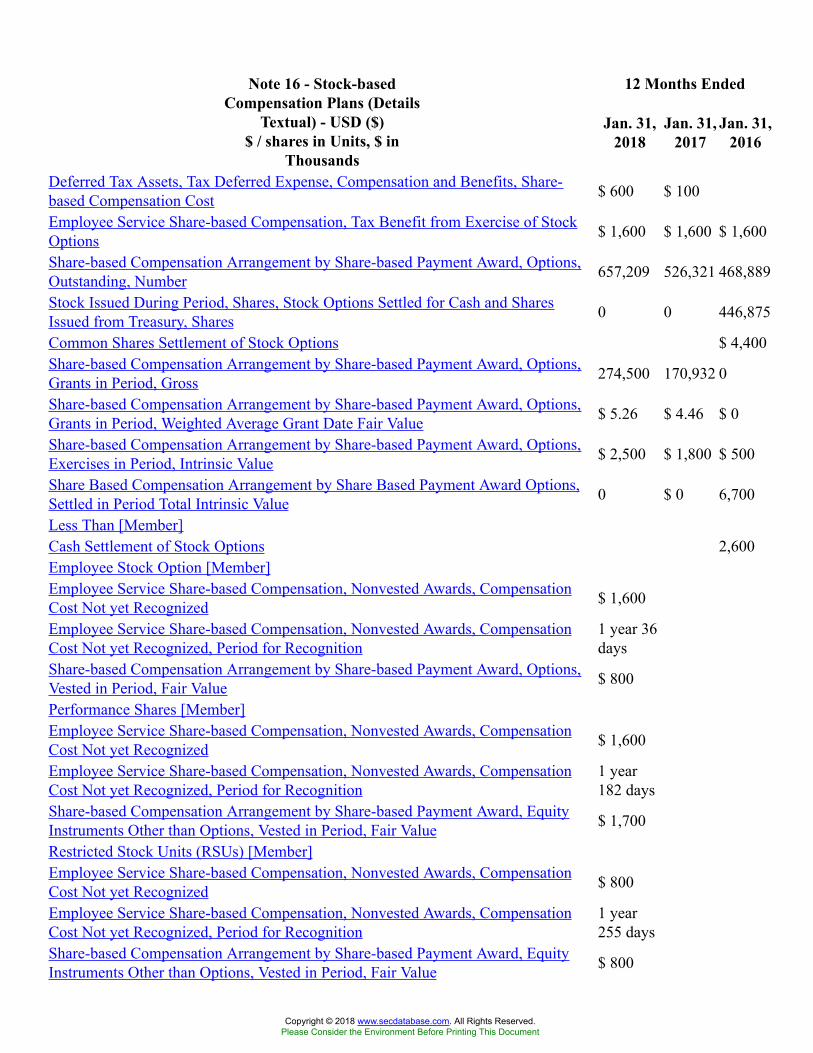
12 Months EndedNote 16 - Stock-basedCompensation Plans (Details
Textual) - USD ($)$ / shares in Units, $ in
Thousands
Jan. 31,2018
Jan. 31,2017
Jan. 31,2016
Deferred Tax Assets, Tax Deferred Expense, Compensation and Benefits, Share-based Compensation Cost $ 600 $ 100
Employee Service Share-based Compensation, Tax Benefit from Exercise of StockOptions $ 1,600 $ 1,600 $ 1,600
Share-based Compensation Arrangement by Share-based Payment Award, Options,Outstanding, Number 657,209 526,321 468,889
Stock Issued During Period, Shares, Stock Options Settled for Cash and SharesIssued from Treasury, Shares 0 0 446,875
Common Shares Settlement of Stock Options $ 4,400Share-based Compensation Arrangement by Share-based Payment Award, Options,Grants in Period, Gross 274,500 170,932 0
Share-based Compensation Arrangement by Share-based Payment Award, Options,Grants in Period, Weighted Average Grant Date Fair Value $ 5.26 $ 4.46 $ 0
Share-based Compensation Arrangement by Share-based Payment Award, Options,Exercises in Period, Intrinsic Value $ 2,500 $ 1,800 $ 500
Share Based Compensation Arrangement by Share Based Payment Award Options,Settled in Period Total Intrinsic Value 0 $ 0 6,700
Less Than [Member]Cash Settlement of Stock Options 2,600Employee Stock Option [Member]Employee Service Share-based Compensation, Nonvested Awards, CompensationCost Not yet Recognized $ 1,600
Employee Service Share-based Compensation, Nonvested Awards, CompensationCost Not yet Recognized, Period for Recognition
1 year 36days
Share-based Compensation Arrangement by Share-based Payment Award, Options,Vested in Period, Fair Value $ 800
Performance Shares [Member]Employee Service Share-based Compensation, Nonvested Awards, CompensationCost Not yet Recognized $ 1,600
Employee Service Share-based Compensation, Nonvested Awards, CompensationCost Not yet Recognized, Period for Recognition
1 year182 days
Share-based Compensation Arrangement by Share-based Payment Award, EquityInstruments Other than Options, Vested in Period, Fair Value $ 1,700
Restricted Stock Units (RSUs) [Member]Employee Service Share-based Compensation, Nonvested Awards, CompensationCost Not yet Recognized $ 800
Employee Service Share-based Compensation, Nonvested Awards, CompensationCost Not yet Recognized, Period for Recognition
1 year255 days
Share-based Compensation Arrangement by Share-based Payment Award, EquityInstruments Other than Options, Vested in Period, Fair Value $ 800
Copyright © 2018 www.secdatabase.com. All Rights Reserved.Please Consider the Environment Before Printing This Document
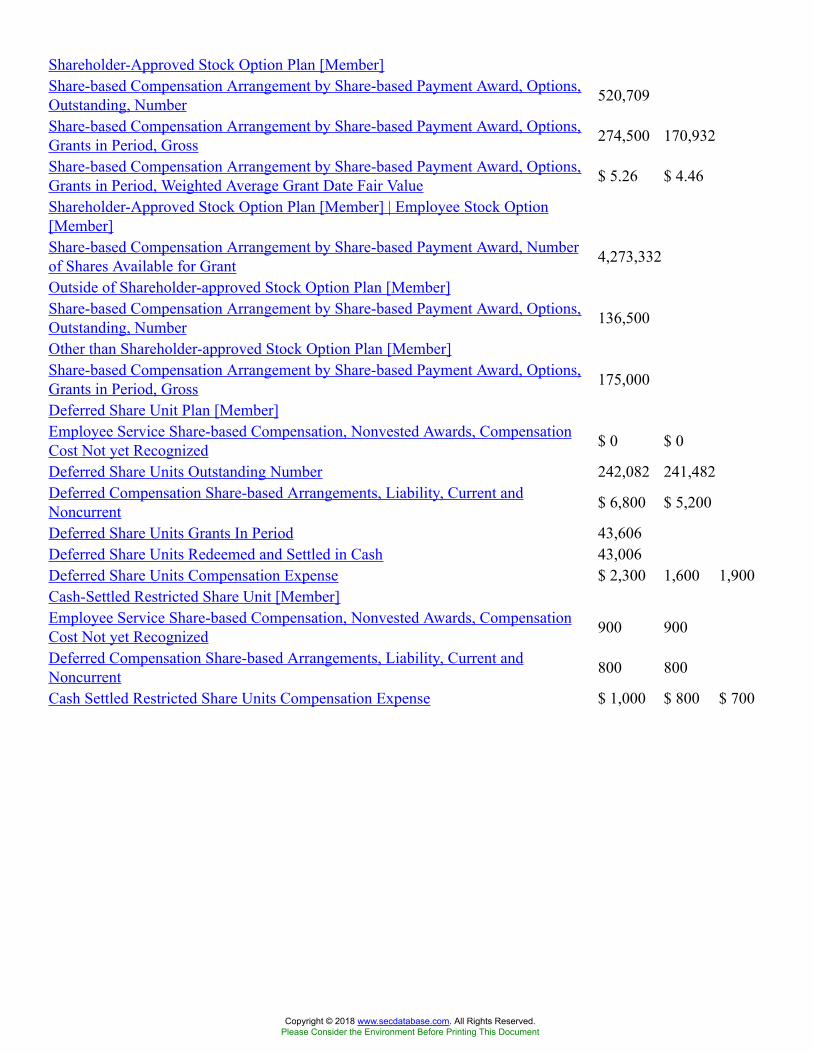
Shareholder-Approved Stock Option Plan [Member]Share-based Compensation Arrangement by Share-based Payment Award, Options,Outstanding, Number 520,709
Share-based Compensation Arrangement by Share-based Payment Award, Options,Grants in Period, Gross 274,500 170,932
Share-based Compensation Arrangement by Share-based Payment Award, Options,Grants in Period, Weighted Average Grant Date Fair Value $ 5.26 $ 4.46
Shareholder-Approved Stock Option Plan [Member] | Employee Stock Option[Member]Share-based Compensation Arrangement by Share-based Payment Award, Numberof Shares Available for Grant 4,273,332
Outside of Shareholder-approved Stock Option Plan [Member]Share-based Compensation Arrangement by Share-based Payment Award, Options,Outstanding, Number 136,500
Other than Shareholder-approved Stock Option Plan [Member]Share-based Compensation Arrangement by Share-based Payment Award, Options,Grants in Period, Gross 175,000
Deferred Share Unit Plan [Member]Employee Service Share-based Compensation, Nonvested Awards, CompensationCost Not yet Recognized $ 0 $ 0
Deferred Share Units Outstanding Number 242,082 241,482Deferred Compensation Share-based Arrangements, Liability, Current andNoncurrent $ 6,800 $ 5,200
Deferred Share Units Grants In Period 43,606Deferred Share Units Redeemed and Settled in Cash 43,006Deferred Share Units Compensation Expense $ 2,300 1,600 1,900Cash-Settled Restricted Share Unit [Member]Employee Service Share-based Compensation, Nonvested Awards, CompensationCost Not yet Recognized 900 900
Deferred Compensation Share-based Arrangements, Liability, Current andNoncurrent 800 800
Cash Settled Restricted Share Units Compensation Expense $ 1,000 $ 800 $ 700
Copyright © 2018 www.secdatabase.com. All Rights Reserved.Please Consider the Environment Before Printing This Document
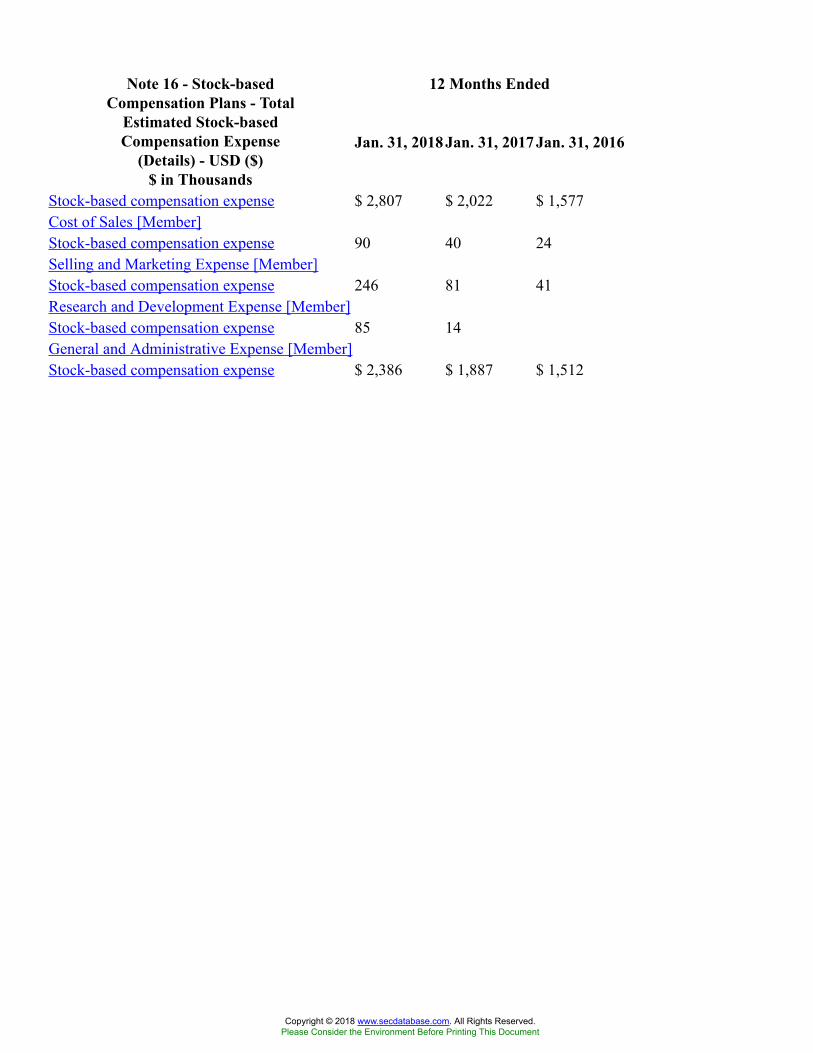
12 Months EndedNote 16 - Stock-basedCompensation Plans - Total
Estimated Stock-basedCompensation Expense
(Details) - USD ($)$ in Thousands
Jan. 31, 2018 Jan. 31, 2017 Jan. 31, 2016
Stock-based compensation expense $ 2,807 $ 2,022 $ 1,577Cost of Sales [Member]Stock-based compensation expense 90 40 24Selling and Marketing Expense [Member]Stock-based compensation expense 246 81 41Research and Development Expense [Member]Stock-based compensation expense 85 14General and Administrative Expense [Member]Stock-based compensation expense $ 2,386 $ 1,887 $ 1,512
Copyright © 2018 www.secdatabase.com. All Rights Reserved.Please Consider the Environment Before Printing This Document
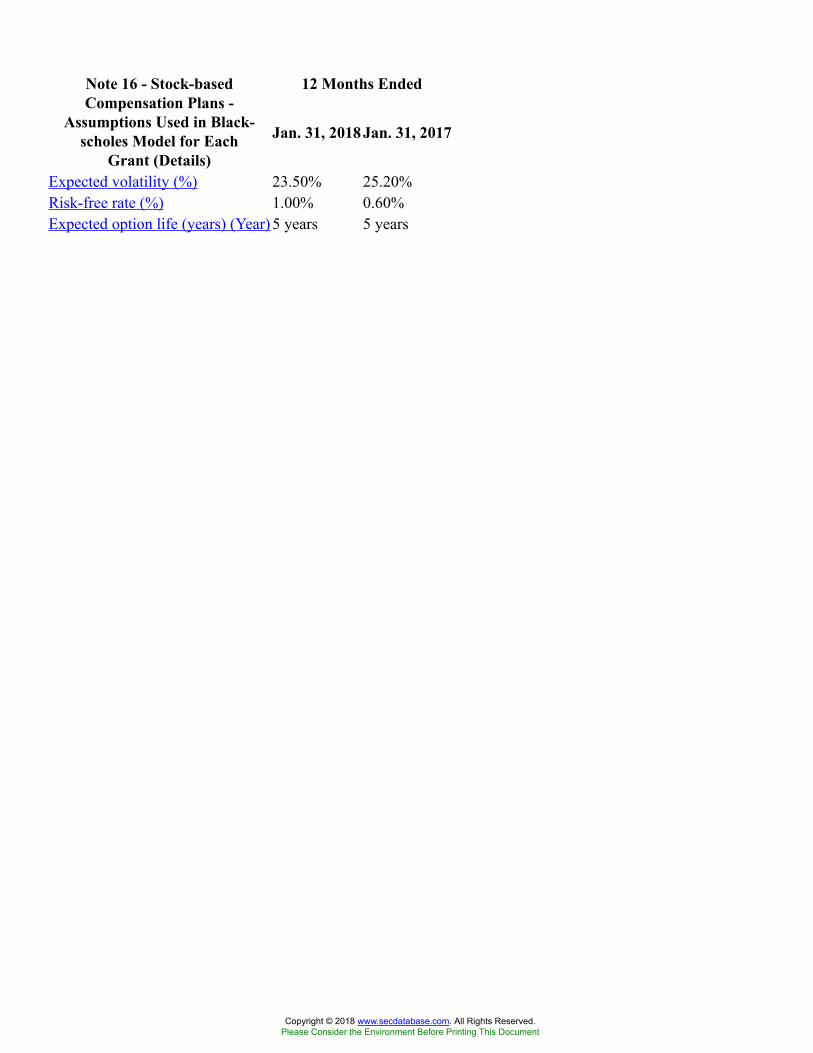
12 Months EndedNote 16 - Stock-basedCompensation Plans -
Assumptions Used in Black-scholes Model for Each
Grant (Details)
Jan. 31, 2018 Jan. 31, 2017
Expected volatility (%) 23.50% 25.20%Risk-free rate (%) 1.00% 0.60%Expected option life (years) (Year) 5 years 5 years
Copyright © 2018 www.secdatabase.com. All Rights Reserved.Please Consider the Environment Before Printing This Document
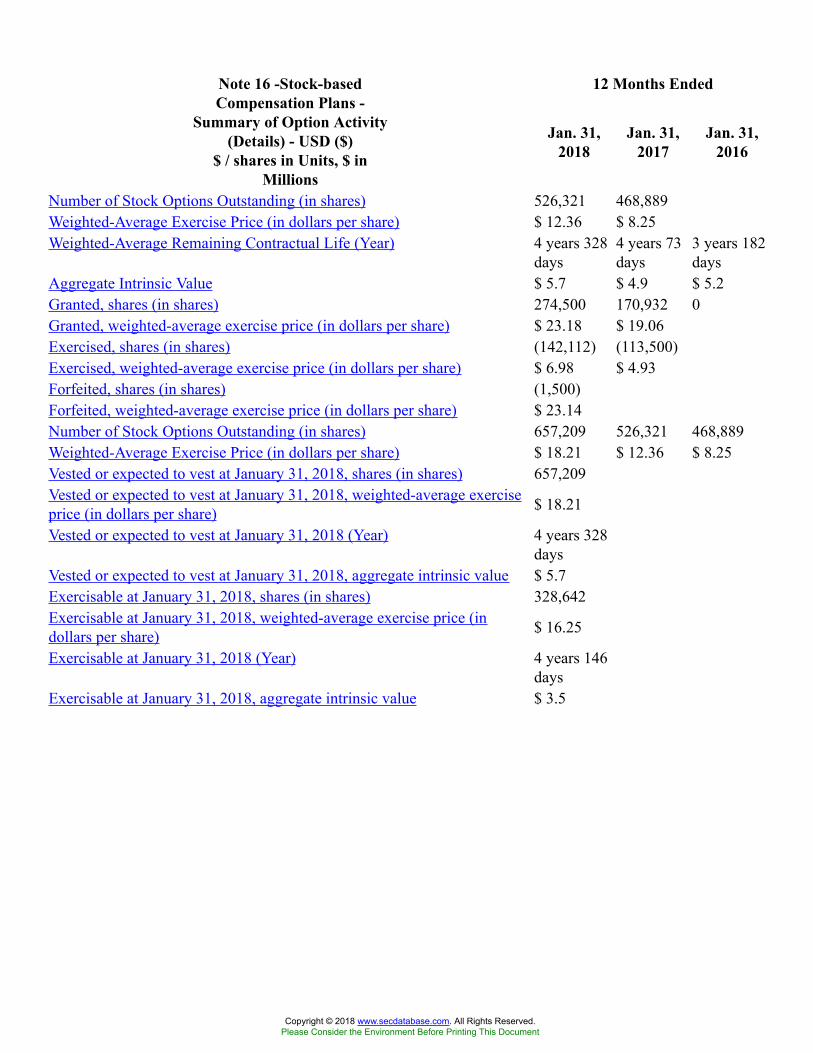
12 Months EndedNote 16 -Stock-basedCompensation Plans -
Summary of Option Activity(Details) - USD ($)
$ / shares in Units, $ inMillions
Jan. 31,2018
Jan. 31,2017
Jan. 31,2016
Number of Stock Options Outstanding (in shares) 526,321 468,889Weighted-Average Exercise Price (in dollars per share) $ 12.36 $ 8.25Weighted-Average Remaining Contractual Life (Year) 4 years 328
days4 years 73days
3 years 182days
Aggregate Intrinsic Value $ 5.7 $ 4.9 $ 5.2Granted, shares (in shares) 274,500 170,932 0Granted, weighted-average exercise price (in dollars per share) $ 23.18 $ 19.06Exercised, shares (in shares) (142,112) (113,500)Exercised, weighted-average exercise price (in dollars per share) $ 6.98 $ 4.93Forfeited, shares (in shares) (1,500)Forfeited, weighted-average exercise price (in dollars per share) $ 23.14Number of Stock Options Outstanding (in shares) 657,209 526,321 468,889Weighted-Average Exercise Price (in dollars per share) $ 18.21 $ 12.36 $ 8.25Vested or expected to vest at January 31, 2018, shares (in shares) 657,209Vested or expected to vest at January 31, 2018, weighted-average exerciseprice (in dollars per share) $ 18.21
Vested or expected to vest at January 31, 2018 (Year) 4 years 328days
Vested or expected to vest at January 31, 2018, aggregate intrinsic value $ 5.7Exercisable at January 31, 2018, shares (in shares) 328,642Exercisable at January 31, 2018, weighted-average exercise price (indollars per share) $ 16.25
Exercisable at January 31, 2018 (Year) 4 years 146days
Exercisable at January 31, 2018, aggregate intrinsic value $ 3.5
Copyright © 2018 www.secdatabase.com. All Rights Reserved.Please Consider the Environment Before Printing This Document
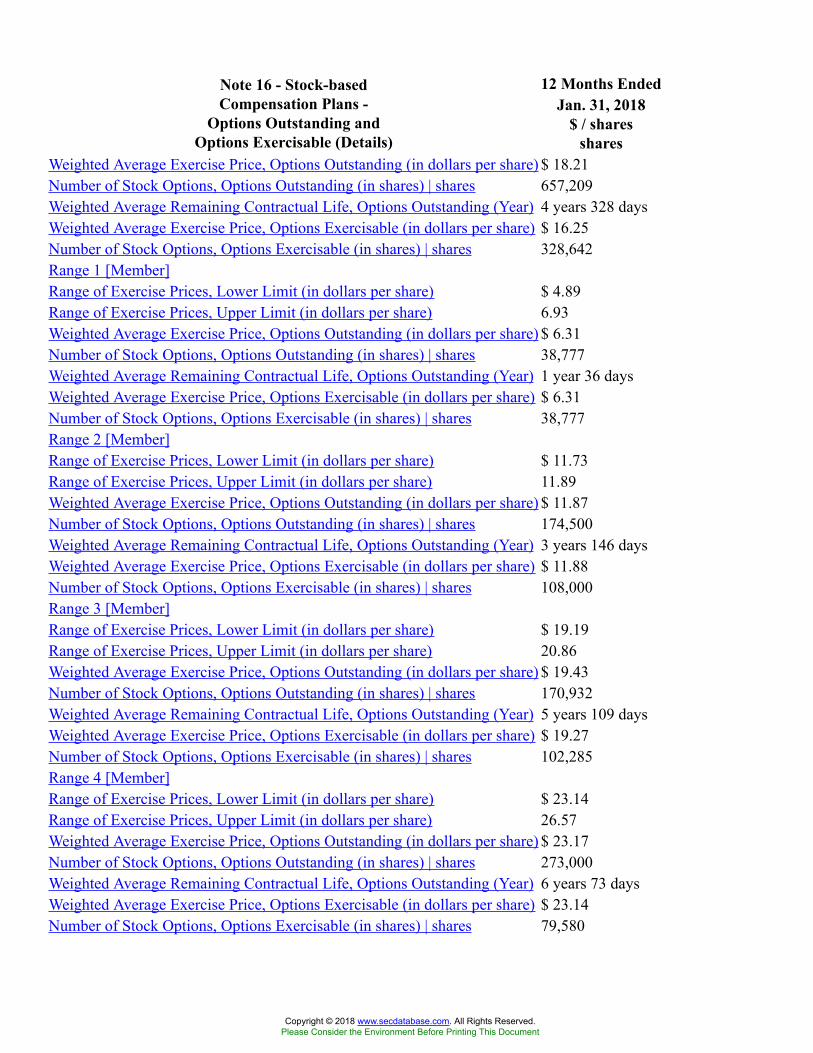
12 Months EndedNote 16 - Stock-basedCompensation Plans -
Options Outstanding andOptions Exercisable (Details)
Jan. 31, 2018$ / shares
sharesWeighted Average Exercise Price, Options Outstanding (in dollars per share) $ 18.21Number of Stock Options, Options Outstanding (in shares) | shares 657,209Weighted Average Remaining Contractual Life, Options Outstanding (Year) 4 years 328 daysWeighted Average Exercise Price, Options Exercisable (in dollars per share) $ 16.25Number of Stock Options, Options Exercisable (in shares) | shares 328,642Range 1 [Member]Range of Exercise Prices, Lower Limit (in dollars per share) $ 4.89Range of Exercise Prices, Upper Limit (in dollars per share) 6.93Weighted Average Exercise Price, Options Outstanding (in dollars per share) $ 6.31Number of Stock Options, Options Outstanding (in shares) | shares 38,777Weighted Average Remaining Contractual Life, Options Outstanding (Year) 1 year 36 daysWeighted Average Exercise Price, Options Exercisable (in dollars per share) $ 6.31Number of Stock Options, Options Exercisable (in shares) | shares 38,777Range 2 [Member]Range of Exercise Prices, Lower Limit (in dollars per share) $ 11.73Range of Exercise Prices, Upper Limit (in dollars per share) 11.89Weighted Average Exercise Price, Options Outstanding (in dollars per share) $ 11.87Number of Stock Options, Options Outstanding (in shares) | shares 174,500Weighted Average Remaining Contractual Life, Options Outstanding (Year) 3 years 146 daysWeighted Average Exercise Price, Options Exercisable (in dollars per share) $ 11.88Number of Stock Options, Options Exercisable (in shares) | shares 108,000Range 3 [Member]Range of Exercise Prices, Lower Limit (in dollars per share) $ 19.19Range of Exercise Prices, Upper Limit (in dollars per share) 20.86Weighted Average Exercise Price, Options Outstanding (in dollars per share) $ 19.43Number of Stock Options, Options Outstanding (in shares) | shares 170,932Weighted Average Remaining Contractual Life, Options Outstanding (Year) 5 years 109 daysWeighted Average Exercise Price, Options Exercisable (in dollars per share) $ 19.27Number of Stock Options, Options Exercisable (in shares) | shares 102,285Range 4 [Member]Range of Exercise Prices, Lower Limit (in dollars per share) $ 23.14Range of Exercise Prices, Upper Limit (in dollars per share) 26.57Weighted Average Exercise Price, Options Outstanding (in dollars per share) $ 23.17Number of Stock Options, Options Outstanding (in shares) | shares 273,000Weighted Average Remaining Contractual Life, Options Outstanding (Year) 6 years 73 daysWeighted Average Exercise Price, Options Exercisable (in dollars per share) $ 23.14Number of Stock Options, Options Exercisable (in shares) | shares 79,580
Copyright © 2018 www.secdatabase.com. All Rights Reserved.Please Consider the Environment Before Printing This Document
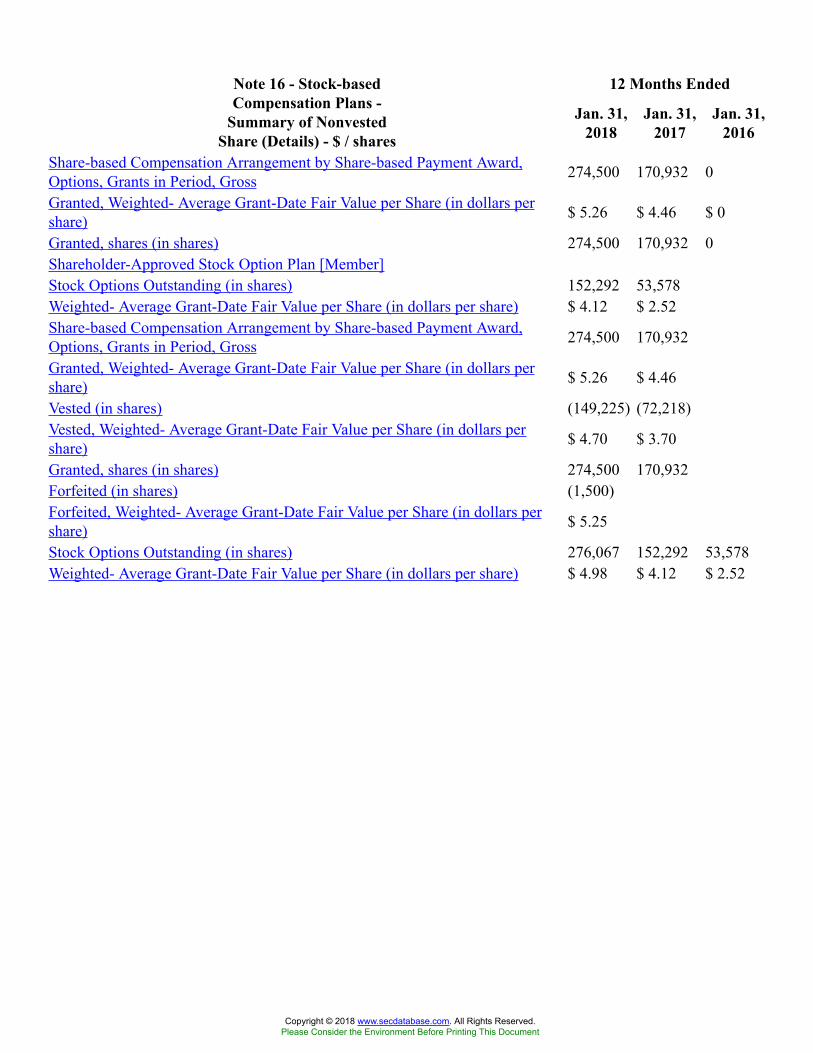
12 Months EndedNote 16 - Stock-basedCompensation Plans -
Summary of NonvestedShare (Details) - $ / shares
Jan. 31,2018
Jan. 31,2017
Jan. 31,2016
Share-based Compensation Arrangement by Share-based Payment Award,Options, Grants in Period, Gross 274,500 170,932 0
Granted, Weighted- Average Grant-Date Fair Value per Share (in dollars pershare) $ 5.26 $ 4.46 $ 0
Granted, shares (in shares) 274,500 170,932 0Shareholder-Approved Stock Option Plan [Member]Stock Options Outstanding (in shares) 152,292 53,578Weighted- Average Grant-Date Fair Value per Share (in dollars per share) $ 4.12 $ 2.52Share-based Compensation Arrangement by Share-based Payment Award,Options, Grants in Period, Gross 274,500 170,932
Granted, Weighted- Average Grant-Date Fair Value per Share (in dollars pershare) $ 5.26 $ 4.46
Vested (in shares) (149,225) (72,218)Vested, Weighted- Average Grant-Date Fair Value per Share (in dollars pershare) $ 4.70 $ 3.70
Granted, shares (in shares) 274,500 170,932Forfeited (in shares) (1,500)Forfeited, Weighted- Average Grant-Date Fair Value per Share (in dollars pershare) $ 5.25
Stock Options Outstanding (in shares) 276,067 152,292 53,578Weighted- Average Grant-Date Fair Value per Share (in dollars per share) $ 4.98 $ 4.12 $ 2.52
Copyright © 2018 www.secdatabase.com. All Rights Reserved.Please Consider the Environment Before Printing This Document
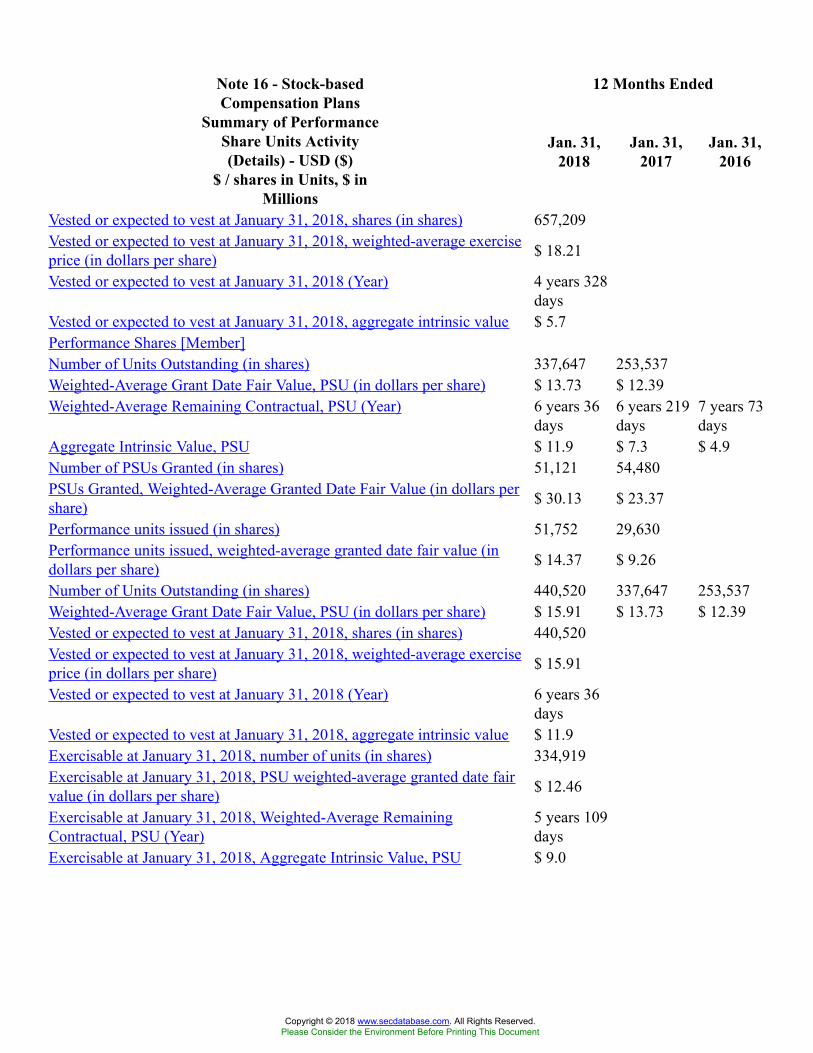
12 Months EndedNote 16 - Stock-basedCompensation Plans
Summary of PerformanceShare Units Activity(Details) - USD ($)
$ / shares in Units, $ inMillions
Jan. 31,2018
Jan. 31,2017
Jan. 31,2016
Vested or expected to vest at January 31, 2018, shares (in shares) 657,209Vested or expected to vest at January 31, 2018, weighted-average exerciseprice (in dollars per share) $ 18.21
Vested or expected to vest at January 31, 2018 (Year) 4 years 328days
Vested or expected to vest at January 31, 2018, aggregate intrinsic value $ 5.7Performance Shares [Member]Number of Units Outstanding (in shares) 337,647 253,537Weighted-Average Grant Date Fair Value, PSU (in dollars per share) $ 13.73 $ 12.39Weighted-Average Remaining Contractual, PSU (Year) 6 years 36
days6 years 219days
7 years 73days
Aggregate Intrinsic Value, PSU $ 11.9 $ 7.3 $ 4.9Number of PSUs Granted (in shares) 51,121 54,480PSUs Granted, Weighted-Average Granted Date Fair Value (in dollars pershare) $ 30.13 $ 23.37
Performance units issued (in shares) 51,752 29,630Performance units issued, weighted-average granted date fair value (indollars per share) $ 14.37 $ 9.26
Number of Units Outstanding (in shares) 440,520 337,647 253,537Weighted-Average Grant Date Fair Value, PSU (in dollars per share) $ 15.91 $ 13.73 $ 12.39Vested or expected to vest at January 31, 2018, shares (in shares) 440,520Vested or expected to vest at January 31, 2018, weighted-average exerciseprice (in dollars per share) $ 15.91
Vested or expected to vest at January 31, 2018 (Year) 6 years 36days
Vested or expected to vest at January 31, 2018, aggregate intrinsic value $ 11.9Exercisable at January 31, 2018, number of units (in shares) 334,919Exercisable at January 31, 2018, PSU weighted-average granted date fairvalue (in dollars per share) $ 12.46
Exercisable at January 31, 2018, Weighted-Average RemainingContractual, PSU (Year)
5 years 109days
Exercisable at January 31, 2018, Aggregate Intrinsic Value, PSU $ 9.0
Copyright © 2018 www.secdatabase.com. All Rights Reserved.Please Consider the Environment Before Printing This Document
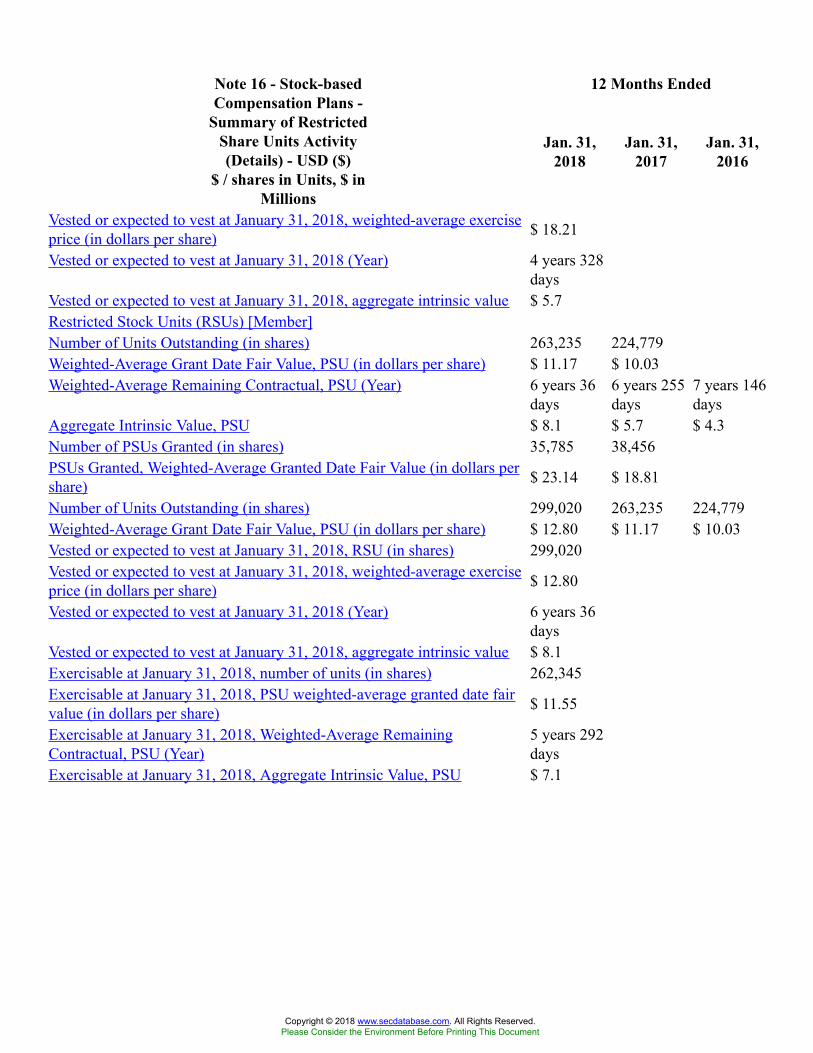
12 Months EndedNote 16 - Stock-basedCompensation Plans -
Summary of RestrictedShare Units Activity(Details) - USD ($)
$ / shares in Units, $ inMillions
Jan. 31,2018
Jan. 31,2017
Jan. 31,2016
Vested or expected to vest at January 31, 2018, weighted-average exerciseprice (in dollars per share) $ 18.21
Vested or expected to vest at January 31, 2018 (Year) 4 years 328days
Vested or expected to vest at January 31, 2018, aggregate intrinsic value $ 5.7Restricted Stock Units (RSUs) [Member]Number of Units Outstanding (in shares) 263,235 224,779Weighted-Average Grant Date Fair Value, PSU (in dollars per share) $ 11.17 $ 10.03Weighted-Average Remaining Contractual, PSU (Year) 6 years 36
days6 years 255days
7 years 146days
Aggregate Intrinsic Value, PSU $ 8.1 $ 5.7 $ 4.3Number of PSUs Granted (in shares) 35,785 38,456PSUs Granted, Weighted-Average Granted Date Fair Value (in dollars pershare) $ 23.14 $ 18.81
Number of Units Outstanding (in shares) 299,020 263,235 224,779Weighted-Average Grant Date Fair Value, PSU (in dollars per share) $ 12.80 $ 11.17 $ 10.03Vested or expected to vest at January 31, 2018, RSU (in shares) 299,020Vested or expected to vest at January 31, 2018, weighted-average exerciseprice (in dollars per share) $ 12.80
Vested or expected to vest at January 31, 2018 (Year) 6 years 36days
Vested or expected to vest at January 31, 2018, aggregate intrinsic value $ 8.1Exercisable at January 31, 2018, number of units (in shares) 262,345Exercisable at January 31, 2018, PSU weighted-average granted date fairvalue (in dollars per share) $ 11.55
Exercisable at January 31, 2018, Weighted-Average RemainingContractual, PSU (Year)
5 years 292days
Exercisable at January 31, 2018, Aggregate Intrinsic Value, PSU $ 7.1
Copyright © 2018 www.secdatabase.com. All Rights Reserved.Please Consider the Environment Before Printing This Document
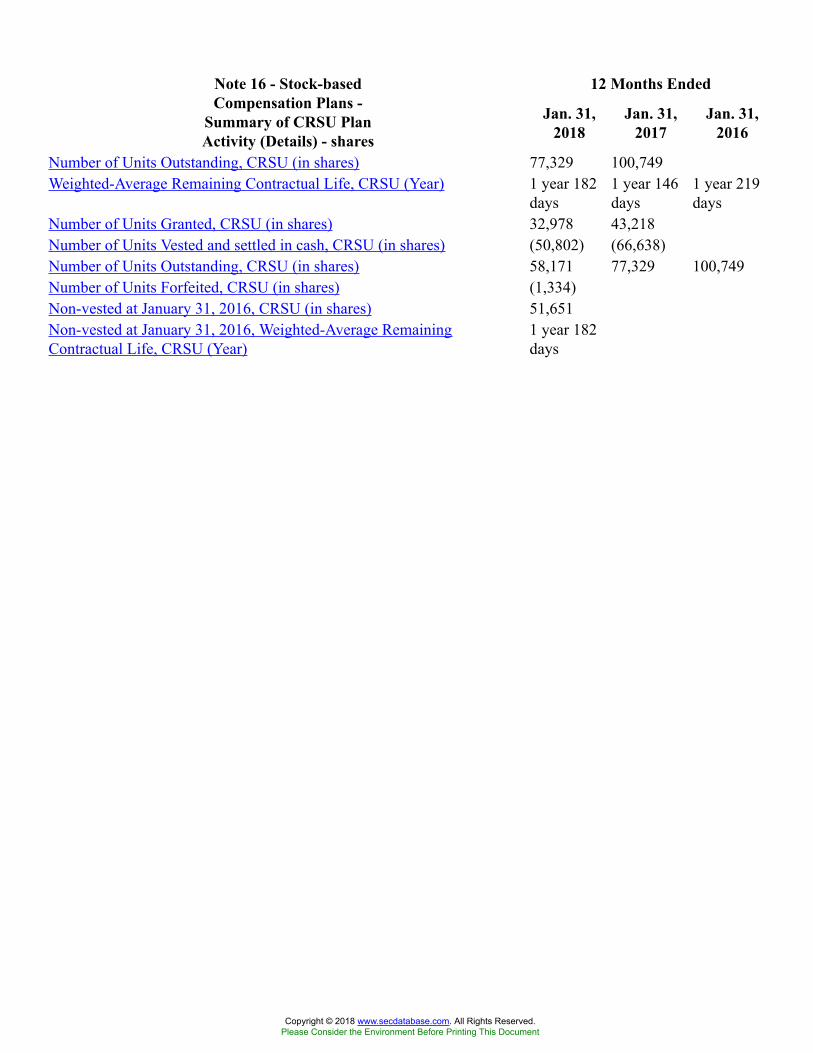
12 Months EndedNote 16 - Stock-basedCompensation Plans -
Summary of CRSU PlanActivity (Details) - shares
Jan. 31,2018
Jan. 31,2017
Jan. 31,2016
Number of Units Outstanding, CRSU (in shares) 77,329 100,749Weighted-Average Remaining Contractual Life, CRSU (Year) 1 year 182
days1 year 146days
1 year 219days
Number of Units Granted, CRSU (in shares) 32,978 43,218Number of Units Vested and settled in cash, CRSU (in shares) (50,802) (66,638)Number of Units Outstanding, CRSU (in shares) 58,171 77,329 100,749Number of Units Forfeited, CRSU (in shares) (1,334)Non-vested at January 31, 2016, CRSU (in shares) 51,651Non-vested at January 31, 2016, Weighted-Average RemainingContractual Life, CRSU (Year)
1 year 182days
Copyright © 2018 www.secdatabase.com. All Rights Reserved.Please Consider the Environment Before Printing This Document
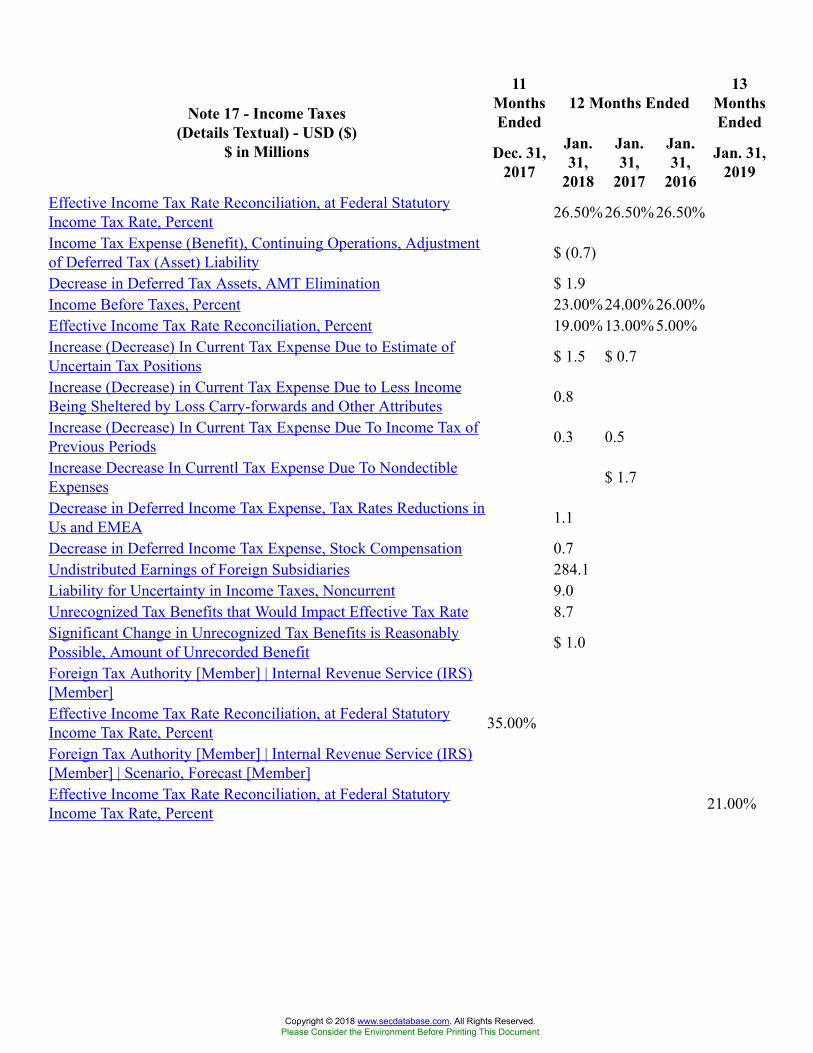
11MonthsEnded
12 Months Ended13
MonthsEndedNote 17 - Income Taxes
(Details Textual) - USD ($)$ in Millions Dec. 31,
2017
Jan.31,
2018
Jan.31,
2017
Jan.31,
2016
Jan. 31,2019
Effective Income Tax Rate Reconciliation, at Federal StatutoryIncome Tax Rate, Percent 26.50% 26.50% 26.50%
Income Tax Expense (Benefit), Continuing Operations, Adjustmentof Deferred Tax (Asset) Liability $ (0.7)
Decrease in Deferred Tax Assets, AMT Elimination $ 1.9Income Before Taxes, Percent 23.00% 24.00% 26.00%Effective Income Tax Rate Reconciliation, Percent 19.00% 13.00% 5.00%Increase (Decrease) In Current Tax Expense Due to Estimate ofUncertain Tax Positions $ 1.5 $ 0.7
Increase (Decrease) in Current Tax Expense Due to Less IncomeBeing Sheltered by Loss Carry-forwards and Other Attributes 0.8
Increase (Decrease) In Current Tax Expense Due To Income Tax ofPrevious Periods 0.3 0.5
Increase Decrease In Currentl Tax Expense Due To NondectibleExpenses $ 1.7
Decrease in Deferred Income Tax Expense, Tax Rates Reductions inUs and EMEA 1.1
Decrease in Deferred Income Tax Expense, Stock Compensation 0.7Undistributed Earnings of Foreign Subsidiaries 284.1Liability for Uncertainty in Income Taxes, Noncurrent 9.0Unrecognized Tax Benefits that Would Impact Effective Tax Rate 8.7Significant Change in Unrecognized Tax Benefits is ReasonablyPossible, Amount of Unrecorded Benefit $ 1.0
Foreign Tax Authority [Member] | Internal Revenue Service (IRS)[Member]Effective Income Tax Rate Reconciliation, at Federal StatutoryIncome Tax Rate, Percent 35.00%
Foreign Tax Authority [Member] | Internal Revenue Service (IRS)[Member] | Scenario, Forecast [Member]Effective Income Tax Rate Reconciliation, at Federal StatutoryIncome Tax Rate, Percent 21.00%
Copyright © 2018 www.secdatabase.com. All Rights Reserved.Please Consider the Environment Before Printing This Document
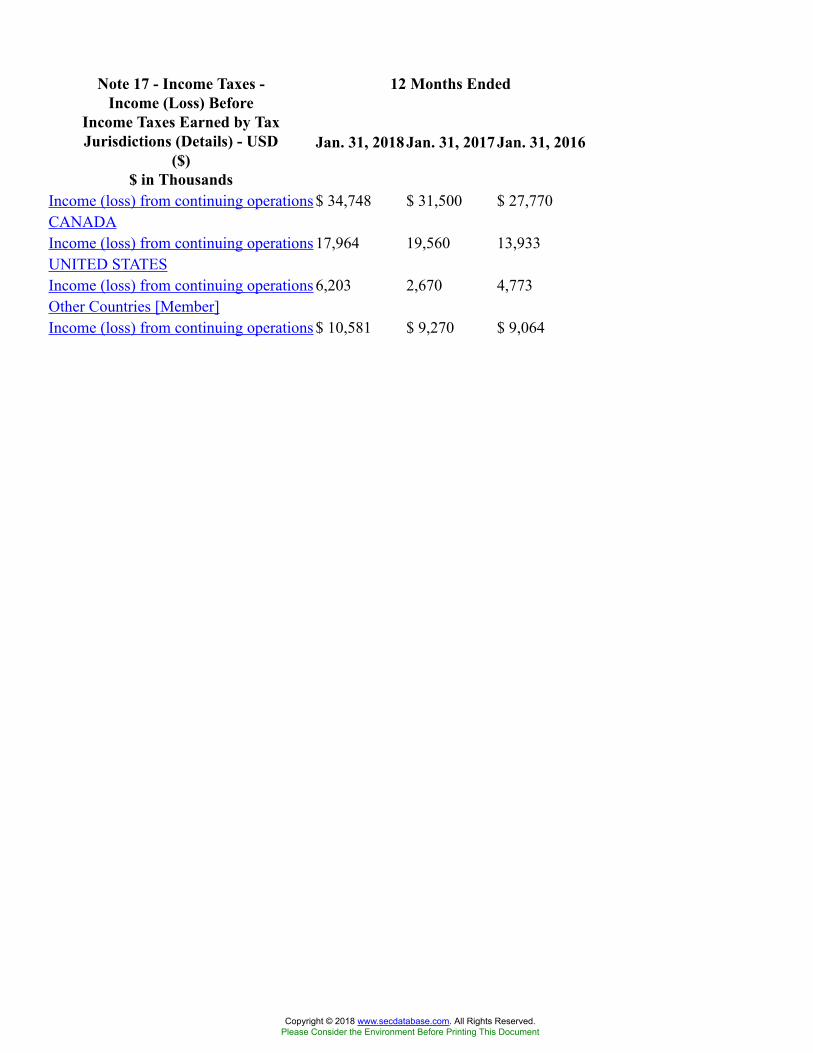
12 Months EndedNote 17 - Income Taxes -Income (Loss) Before
Income Taxes Earned by TaxJurisdictions (Details) - USD
($)$ in Thousands
Jan. 31, 2018 Jan. 31, 2017 Jan. 31, 2016
Income (loss) from continuing operations $ 34,748 $ 31,500 $ 27,770CANADAIncome (loss) from continuing operations 17,964 19,560 13,933UNITED STATESIncome (loss) from continuing operations 6,203 2,670 4,773Other Countries [Member]Income (loss) from continuing operations $ 10,581 $ 9,270 $ 9,064
Copyright © 2018 www.secdatabase.com. All Rights Reserved.Please Consider the Environment Before Printing This Document
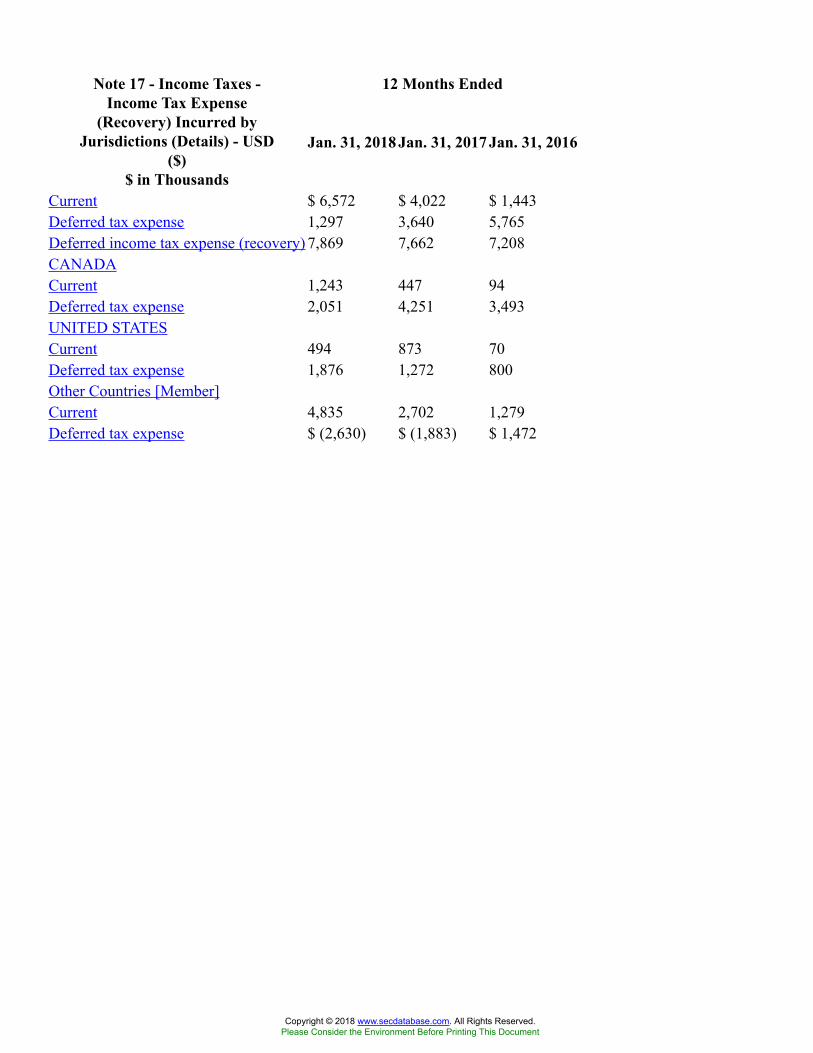
12 Months EndedNote 17 - Income Taxes -Income Tax Expense
(Recovery) Incurred byJurisdictions (Details) - USD
($)$ in Thousands
Jan. 31, 2018 Jan. 31, 2017 Jan. 31, 2016
Current $ 6,572 $ 4,022 $ 1,443Deferred tax expense 1,297 3,640 5,765Deferred income tax expense (recovery) 7,869 7,662 7,208CANADACurrent 1,243 447 94Deferred tax expense 2,051 4,251 3,493UNITED STATESCurrent 494 873 70Deferred tax expense 1,876 1,272 800Other Countries [Member]Current 4,835 2,702 1,279Deferred tax expense $ (2,630) $ (1,883) $ 1,472
Copyright © 2018 www.secdatabase.com. All Rights Reserved.Please Consider the Environment Before Printing This Document
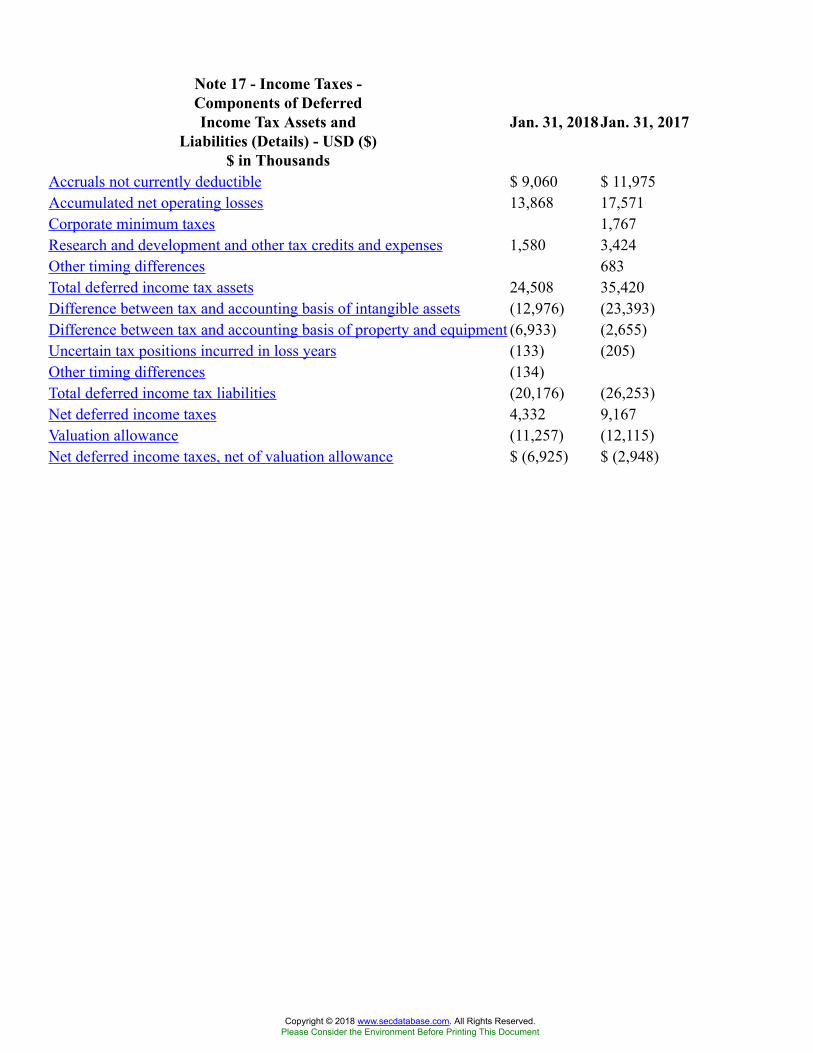
Note 17 - Income Taxes -Components of DeferredIncome Tax Assets and
Liabilities (Details) - USD ($)$ in Thousands
Jan. 31, 2018 Jan. 31, 2017
Accruals not currently deductible $ 9,060 $ 11,975Accumulated net operating losses 13,868 17,571Corporate minimum taxes 1,767Research and development and other tax credits and expenses 1,580 3,424Other timing differences 683Total deferred income tax assets 24,508 35,420Difference between tax and accounting basis of intangible assets (12,976) (23,393)Difference between tax and accounting basis of property and equipment (6,933) (2,655)Uncertain tax positions incurred in loss years (133) (205)Other timing differences (134)Total deferred income tax liabilities (20,176) (26,253)Net deferred income taxes 4,332 9,167Valuation allowance (11,257) (12,115)Net deferred income taxes, net of valuation allowance $ (6,925) $ (2,948)
Copyright © 2018 www.secdatabase.com. All Rights Reserved.Please Consider the Environment Before Printing This Document
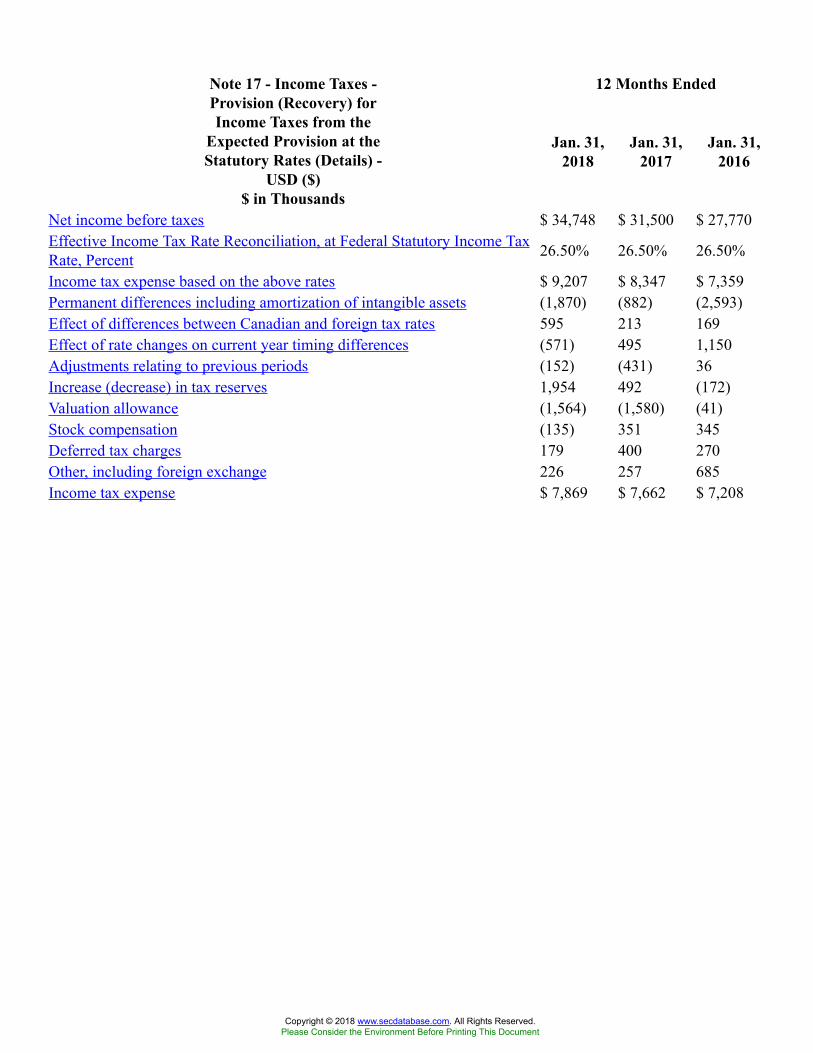
12 Months EndedNote 17 - Income Taxes -Provision (Recovery) forIncome Taxes from the
Expected Provision at theStatutory Rates (Details) -
USD ($)$ in Thousands
Jan. 31,2018
Jan. 31,2017
Jan. 31,2016
Net income before taxes $ 34,748 $ 31,500 $ 27,770Effective Income Tax Rate Reconciliation, at Federal Statutory Income TaxRate, Percent 26.50% 26.50% 26.50%
Income tax expense based on the above rates $ 9,207 $ 8,347 $ 7,359Permanent differences including amortization of intangible assets (1,870) (882) (2,593)Effect of differences between Canadian and foreign tax rates 595 213 169Effect of rate changes on current year timing differences (571) 495 1,150Adjustments relating to previous periods (152) (431) 36Increase (decrease) in tax reserves 1,954 492 (172)Valuation allowance (1,564) (1,580) (41)Stock compensation (135) 351 345Deferred tax charges 179 400 270Other, including foreign exchange 226 257 685Income tax expense $ 7,869 $ 7,662 $ 7,208
Copyright © 2018 www.secdatabase.com. All Rights Reserved.Please Consider the Environment Before Printing This Document
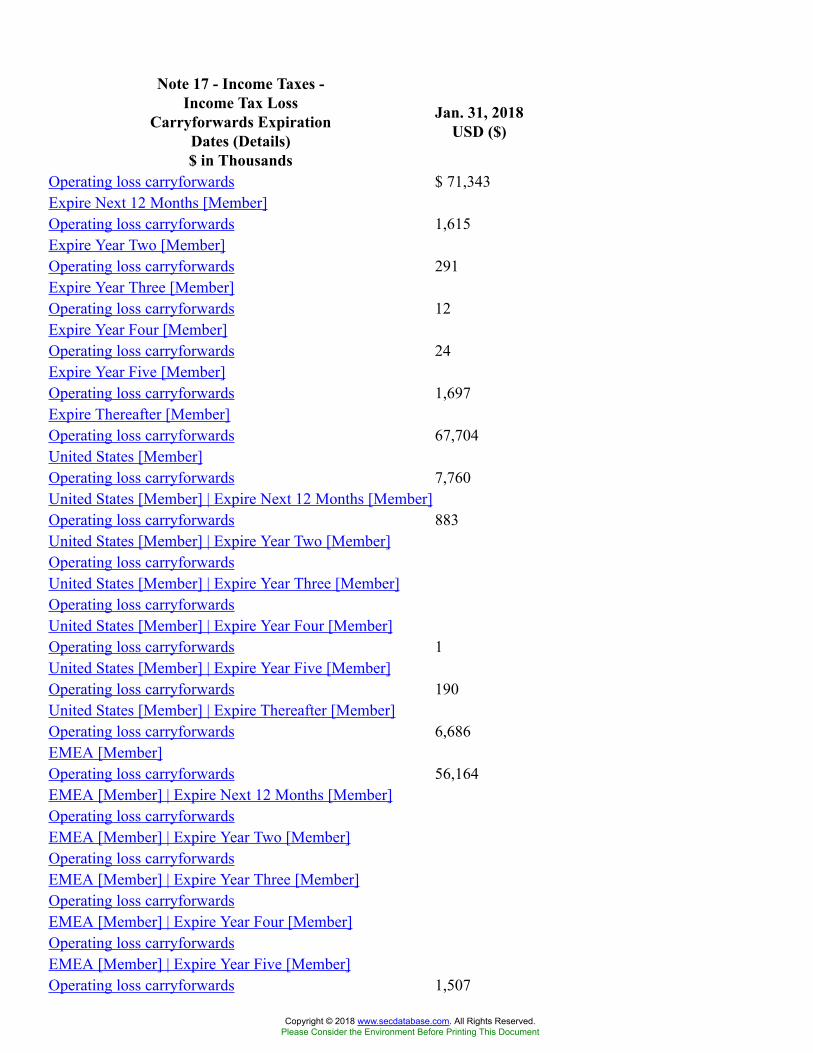
Note 17 - Income Taxes -Income Tax Loss
Carryforwards ExpirationDates (Details)$ in Thousands
Jan. 31, 2018USD ($)
Operating loss carryforwards $ 71,343Expire Next 12 Months [Member]Operating loss carryforwards 1,615Expire Year Two [Member]Operating loss carryforwards 291Expire Year Three [Member]Operating loss carryforwards 12Expire Year Four [Member]Operating loss carryforwards 24Expire Year Five [Member]Operating loss carryforwards 1,697Expire Thereafter [Member]Operating loss carryforwards 67,704United States [Member]Operating loss carryforwards 7,760United States [Member] | Expire Next 12 Months [Member]Operating loss carryforwards 883United States [Member] | Expire Year Two [Member]Operating loss carryforwardsUnited States [Member] | Expire Year Three [Member]Operating loss carryforwardsUnited States [Member] | Expire Year Four [Member]Operating loss carryforwards 1United States [Member] | Expire Year Five [Member]Operating loss carryforwards 190United States [Member] | Expire Thereafter [Member]Operating loss carryforwards 6,686EMEA [Member]Operating loss carryforwards 56,164EMEA [Member] | Expire Next 12 Months [Member]Operating loss carryforwardsEMEA [Member] | Expire Year Two [Member]Operating loss carryforwardsEMEA [Member] | Expire Year Three [Member]Operating loss carryforwardsEMEA [Member] | Expire Year Four [Member]Operating loss carryforwardsEMEA [Member] | Expire Year Five [Member]Operating loss carryforwards 1,507
Copyright © 2018 www.secdatabase.com. All Rights Reserved.Please Consider the Environment Before Printing This Document
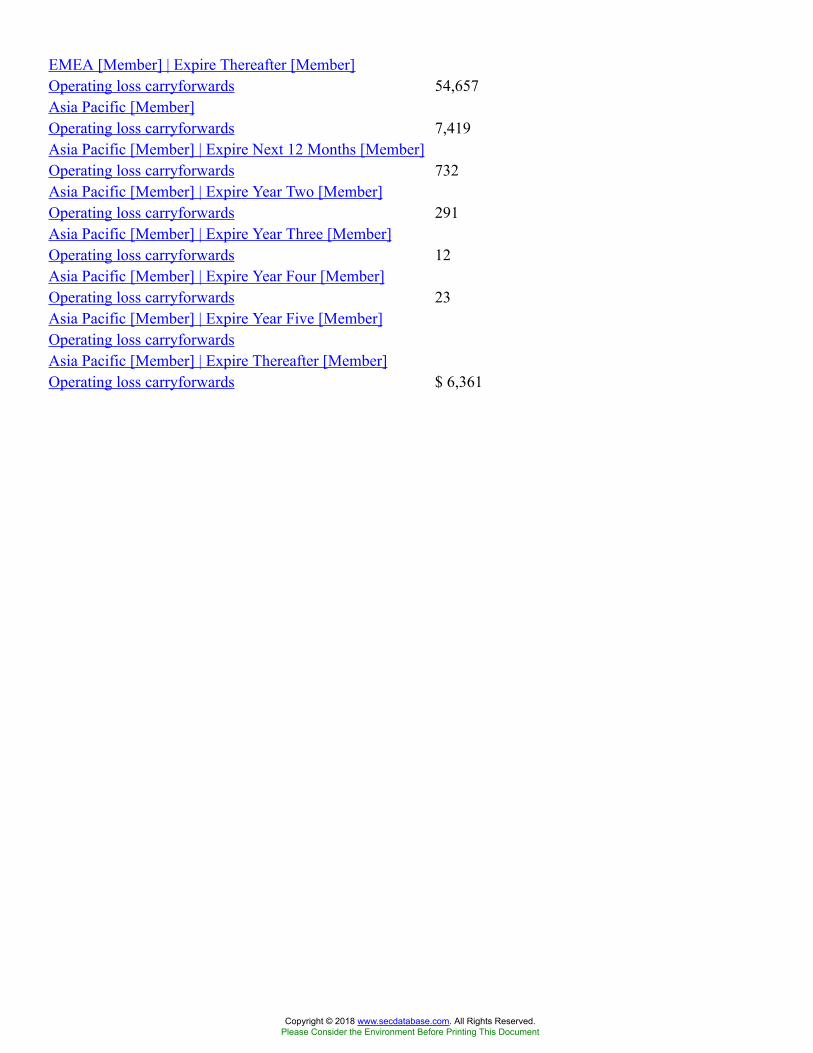
EMEA [Member] | Expire Thereafter [Member]Operating loss carryforwards 54,657Asia Pacific [Member]Operating loss carryforwards 7,419Asia Pacific [Member] | Expire Next 12 Months [Member]Operating loss carryforwards 732Asia Pacific [Member] | Expire Year Two [Member]Operating loss carryforwards 291Asia Pacific [Member] | Expire Year Three [Member]Operating loss carryforwards 12Asia Pacific [Member] | Expire Year Four [Member]Operating loss carryforwards 23Asia Pacific [Member] | Expire Year Five [Member]Operating loss carryforwardsAsia Pacific [Member] | Expire Thereafter [Member]Operating loss carryforwards $ 6,361
Copyright © 2018 www.secdatabase.com. All Rights Reserved.Please Consider the Environment Before Printing This Document
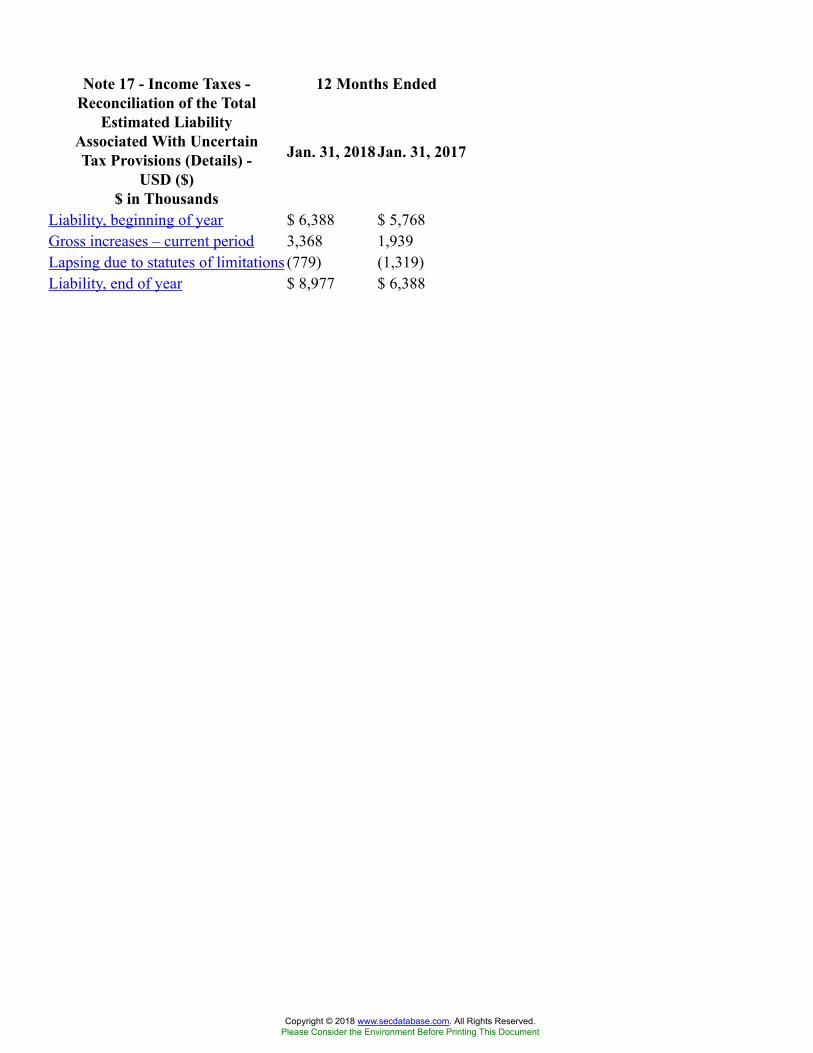
12 Months EndedNote 17 - Income Taxes -Reconciliation of the Total
Estimated LiabilityAssociated With UncertainTax Provisions (Details) -
USD ($)$ in Thousands
Jan. 31, 2018 Jan. 31, 2017
Liability, beginning of year $ 6,388 $ 5,768Gross increases – current period 3,368 1,939Lapsing due to statutes of limitations (779) (1,319)Liability, end of year $ 8,977 $ 6,388
Copyright © 2018 www.secdatabase.com. All Rights Reserved.Please Consider the Environment Before Printing This Document
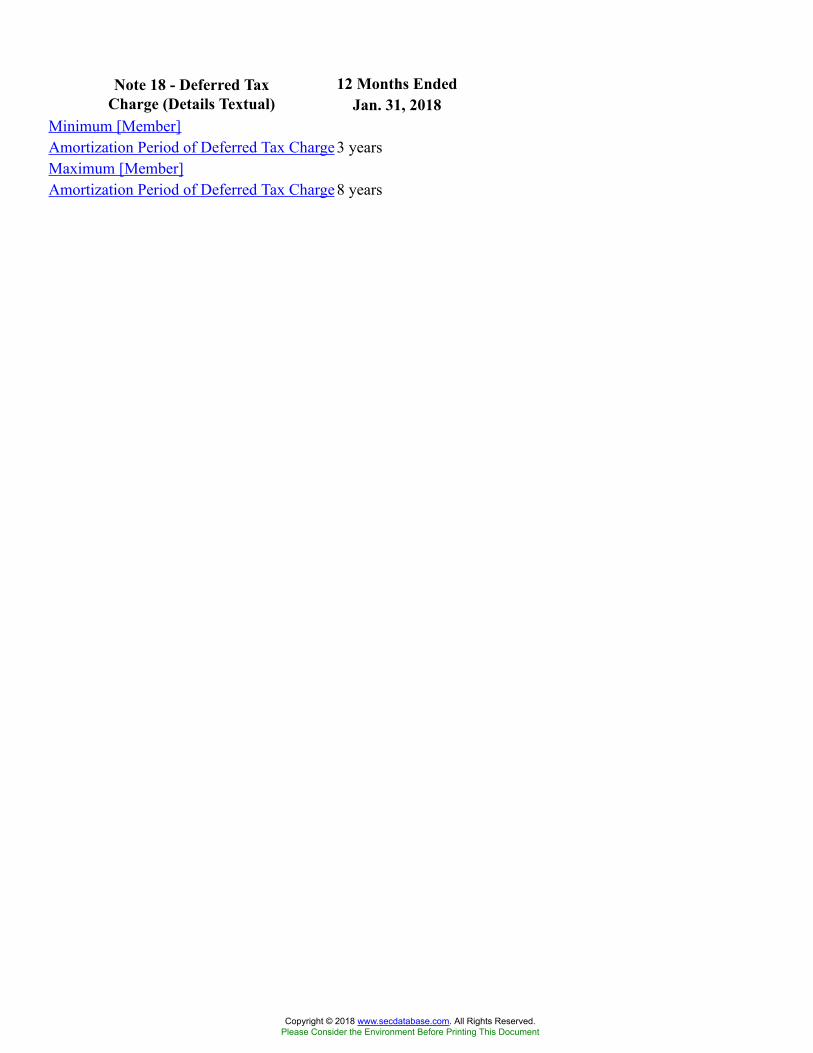
12 Months EndedNote 18 - Deferred TaxCharge (Details Textual) Jan. 31, 2018
Minimum [Member]Amortization Period of Deferred Tax Charge 3 yearsMaximum [Member]Amortization Period of Deferred Tax Charge 8 years
Copyright © 2018 www.secdatabase.com. All Rights Reserved.Please Consider the Environment Before Printing This Document
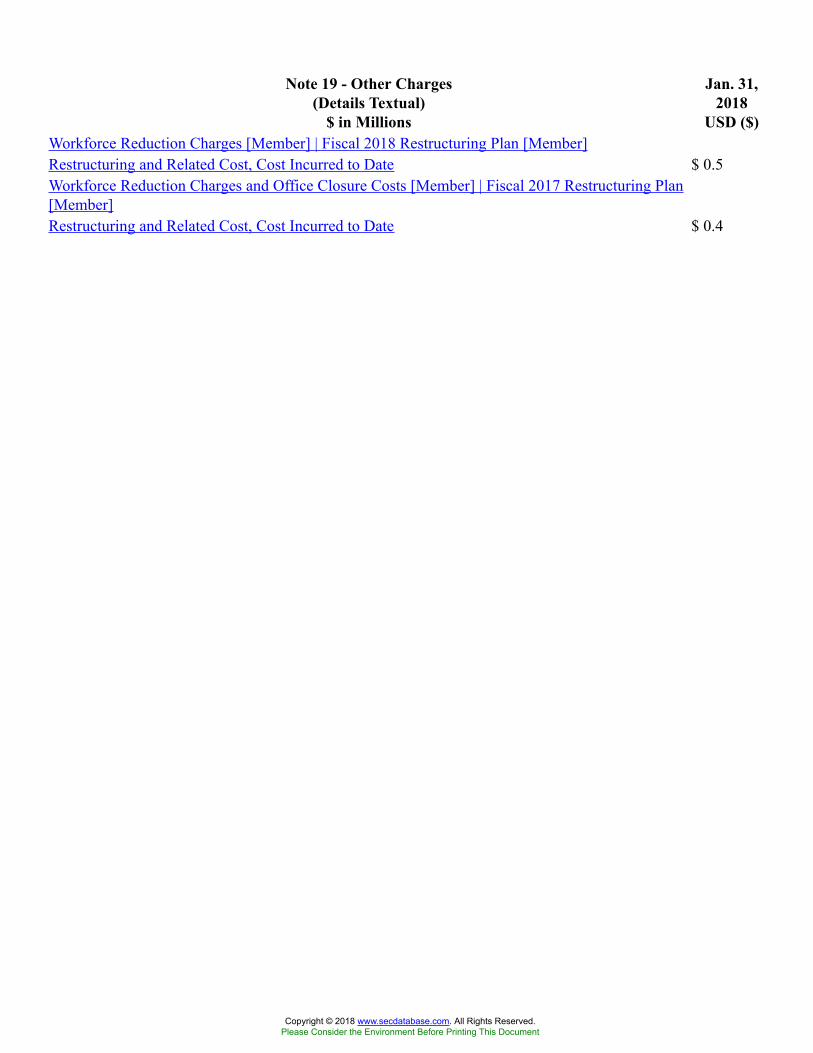
Note 19 - Other Charges(Details Textual)
$ in Millions
Jan. 31,2018
USD ($)Workforce Reduction Charges [Member] | Fiscal 2018 Restructuring Plan [Member]Restructuring and Related Cost, Cost Incurred to Date $ 0.5Workforce Reduction Charges and Office Closure Costs [Member] | Fiscal 2017 Restructuring Plan[Member]Restructuring and Related Cost, Cost Incurred to Date $ 0.4
Copyright © 2018 www.secdatabase.com. All Rights Reserved.Please Consider the Environment Before Printing This Document
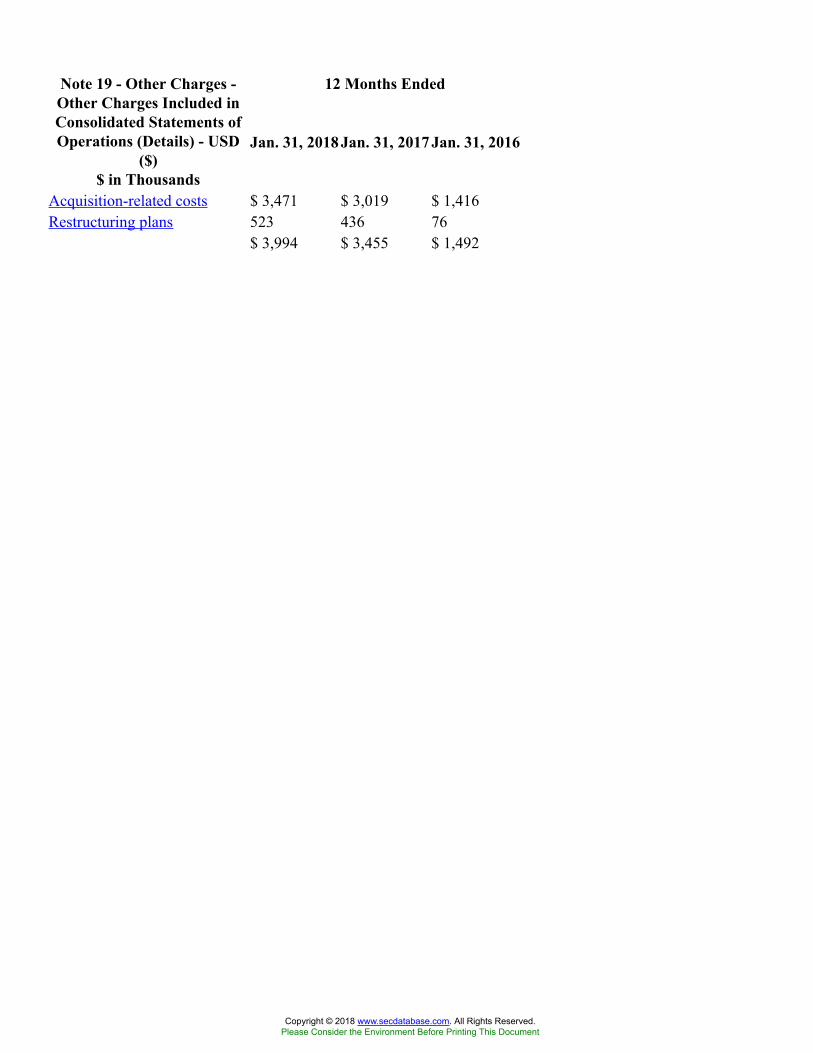
12 Months EndedNote 19 - Other Charges -Other Charges Included inConsolidated Statements ofOperations (Details) - USD
($)$ in Thousands
Jan. 31, 2018 Jan. 31, 2017 Jan. 31, 2016
Acquisition-related costs $ 3,471 $ 3,019 $ 1,416Restructuring plans 523 436 76
$ 3,994 $ 3,455 $ 1,492
Copyright © 2018 www.secdatabase.com. All Rights Reserved.Please Consider the Environment Before Printing This Document
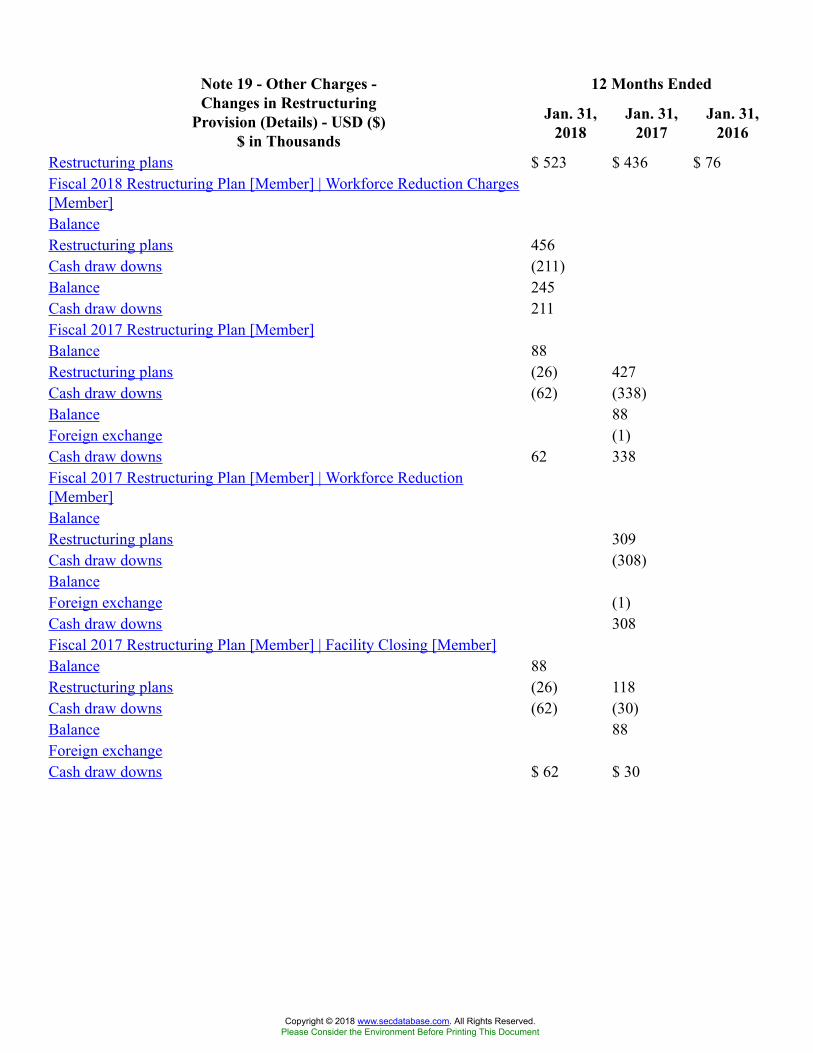
12 Months EndedNote 19 - Other Charges -Changes in Restructuring
Provision (Details) - USD ($)$ in Thousands
Jan. 31,2018
Jan. 31,2017
Jan. 31,2016
Restructuring plans $ 523 $ 436 $ 76Fiscal 2018 Restructuring Plan [Member] | Workforce Reduction Charges[Member]BalanceRestructuring plans 456Cash draw downs (211)Balance 245Cash draw downs 211Fiscal 2017 Restructuring Plan [Member]Balance 88Restructuring plans (26) 427Cash draw downs (62) (338)Balance 88Foreign exchange (1)Cash draw downs 62 338Fiscal 2017 Restructuring Plan [Member] | Workforce Reduction[Member]BalanceRestructuring plans 309Cash draw downs (308)BalanceForeign exchange (1)Cash draw downs 308Fiscal 2017 Restructuring Plan [Member] | Facility Closing [Member]Balance 88Restructuring plans (26) 118Cash draw downs (62) (30)Balance 88Foreign exchangeCash draw downs $ 62 $ 30
Copyright © 2018 www.secdatabase.com. All Rights Reserved.Please Consider the Environment Before Printing This Document

12 Months EndedNote 20 - SegmentedInformation (Details
Textual) Jan. 31, 2018
Number of Reportable Segments 1
Copyright © 2018 www.secdatabase.com. All Rights Reserved.Please Consider the Environment Before Printing This Document
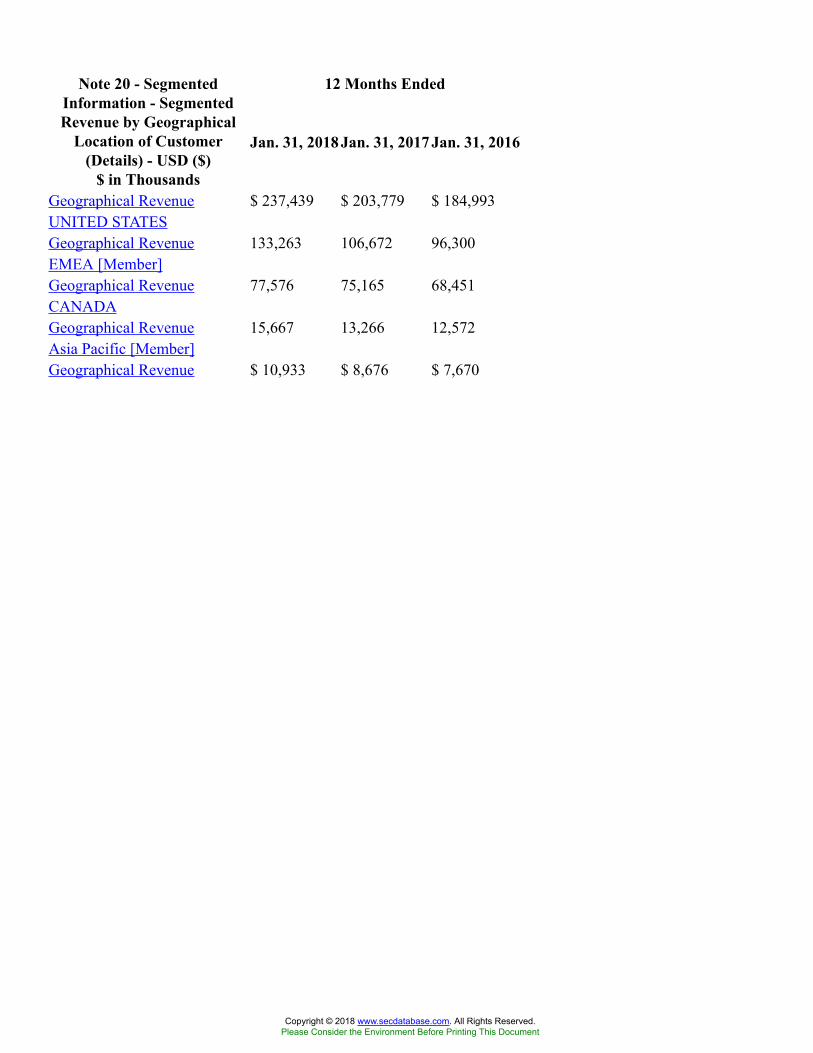
12 Months EndedNote 20 - SegmentedInformation - SegmentedRevenue by Geographical
Location of Customer(Details) - USD ($)
$ in Thousands
Jan. 31, 2018 Jan. 31, 2017 Jan. 31, 2016
Geographical Revenue $ 237,439 $ 203,779 $ 184,993UNITED STATESGeographical Revenue 133,263 106,672 96,300EMEA [Member]Geographical Revenue 77,576 75,165 68,451CANADAGeographical Revenue 15,667 13,266 12,572Asia Pacific [Member]Geographical Revenue $ 10,933 $ 8,676 $ 7,670
Copyright © 2018 www.secdatabase.com. All Rights Reserved.Please Consider the Environment Before Printing This Document
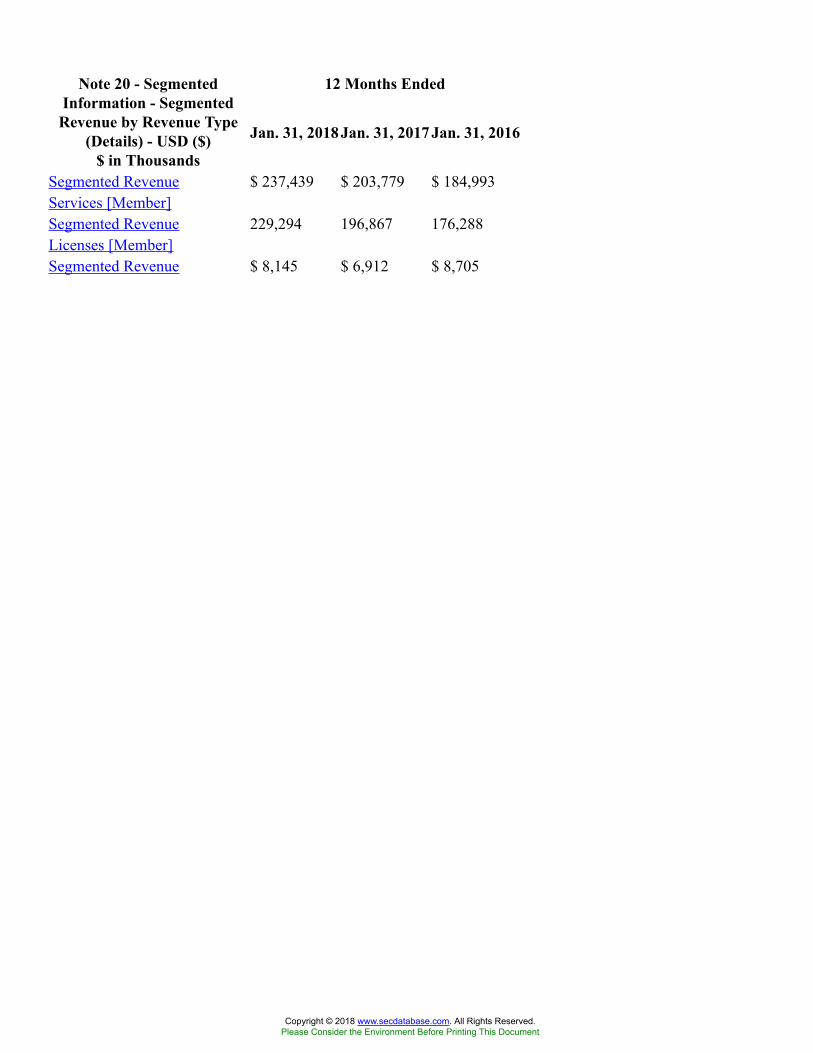
12 Months EndedNote 20 - SegmentedInformation - Segmented
Revenue by Revenue Type(Details) - USD ($)
$ in Thousands
Jan. 31, 2018 Jan. 31, 2017 Jan. 31, 2016
Segmented Revenue $ 237,439 $ 203,779 $ 184,993Services [Member]Segmented Revenue 229,294 196,867 176,288Licenses [Member]Segmented Revenue $ 8,145 $ 6,912 $ 8,705
Copyright © 2018 www.secdatabase.com. All Rights Reserved.Please Consider the Environment Before Printing This Document
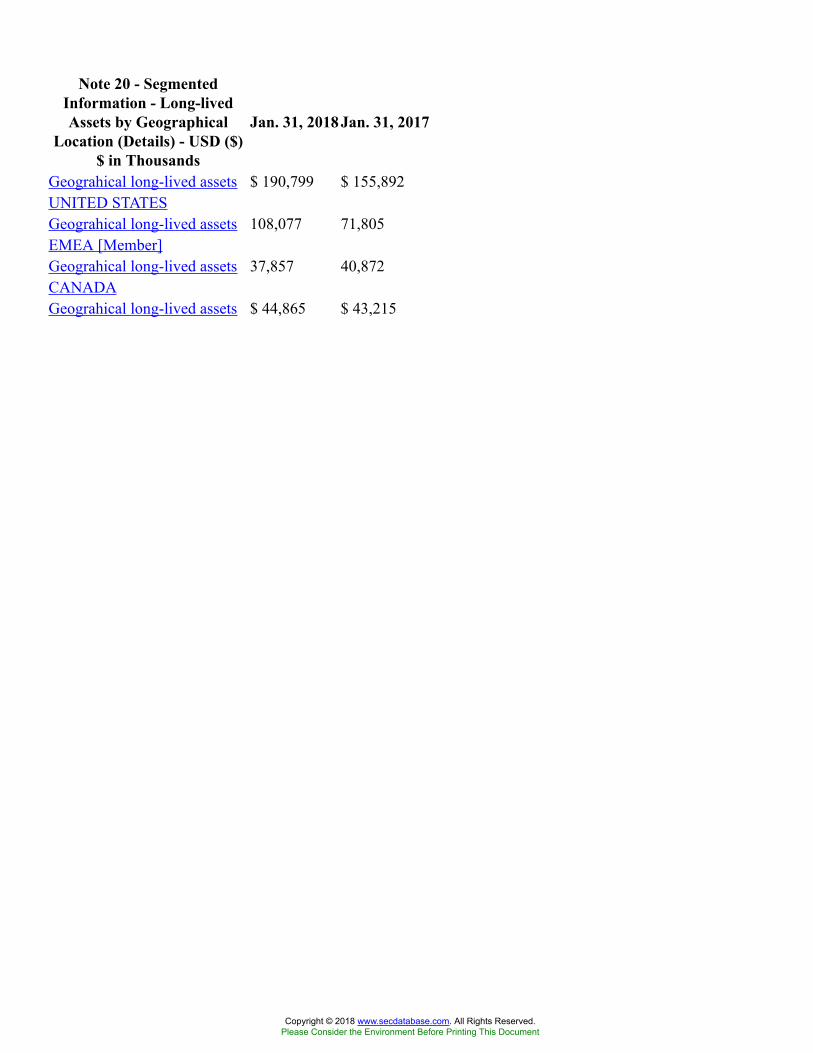
Note 20 - SegmentedInformation - Long-livedAssets by Geographical
Location (Details) - USD ($)$ in Thousands
Jan. 31, 2018 Jan. 31, 2017
Geograhical long-lived assets $ 190,799 $ 155,892UNITED STATESGeograhical long-lived assets 108,077 71,805EMEA [Member]Geograhical long-lived assets 37,857 40,872CANADAGeograhical long-lived assets $ 44,865 $ 43,215
Copyright © 2018 www.secdatabase.com. All Rights Reserved.Please Consider the Environment Before Printing This Document
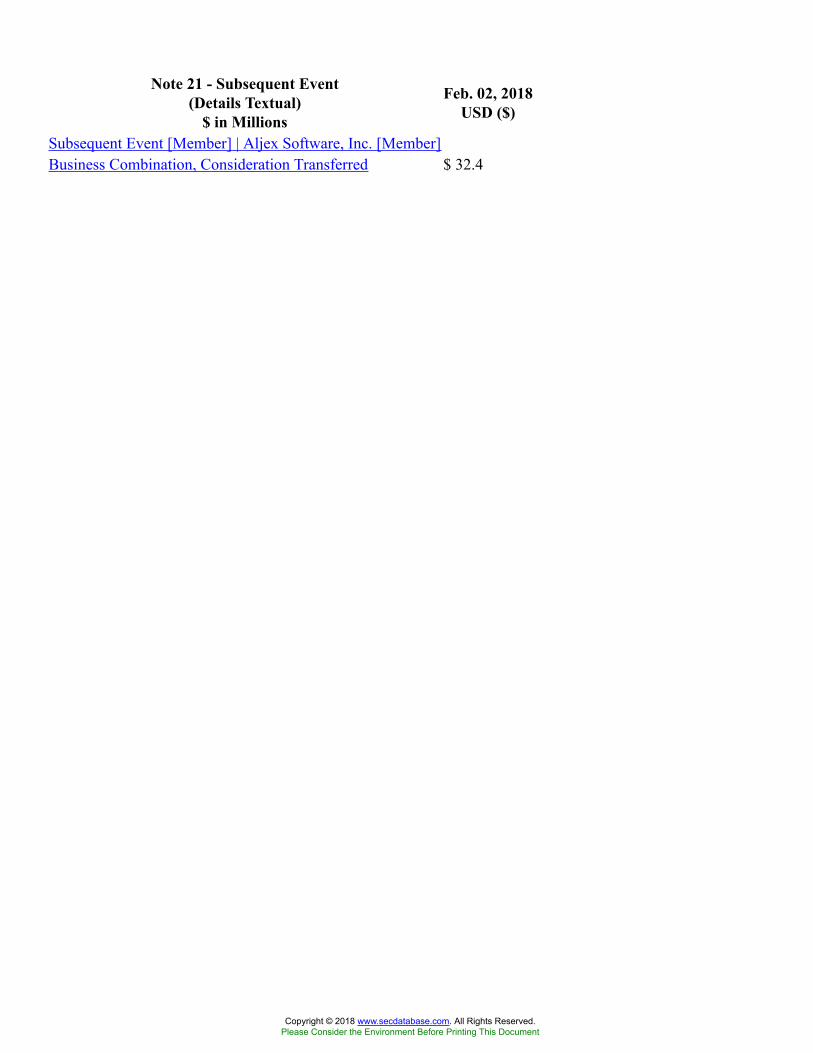
Note 21 - Subsequent Event(Details Textual)
$ in Millions
Feb. 02, 2018USD ($)
Subsequent Event [Member] | Aljex Software, Inc. [Member]Business Combination, Consideration Transferred $ 32.4
Copyright © 2018 www.secdatabase.com. All Rights Reserved.Please Consider the Environment Before Printing This Document