Foreword - PSA Central Visayas Website - Philippine Statistics ...
163
1
-
Upload
khangminh22 -
Category
Documents
-
view
7 -
download
0
Transcript of Foreword - PSA Central Visayas Website - Philippine Statistics ...
1
2
FOREWORD
The Philippine Statistics Authority (PSA) Cebu Provincial Statistical Office is
in great honor to present the Countryside in Figures of Cebu Province
for the current year 2021. Now on it’s 2nd Edition, this publication will be
very useful for planning and decision making and for setting our policies
towards effective governance and to improved service delivery at the local
level and in the province of Cebu.
This contains tables and figures on population and housing, agricultural
statistics, prices and indices, construction statistics and vital statistics on
civil registration. Data presented are disaggregated down to the
municipality/ city and barangays of Cebu province.
The office anticipates that this publication will greatly help our various
stakeholders in delivering timely, relevant and reliable statistical data that
are useful towards improvement of service delivery to its various
stakeholders. The office also acknowledges the valuable contributions and
support of our various data sources. We likewise appreciate our clients who
will used, recognized and support this publication.
PHILIPPINE STATISTICS AUTHORITY
CEBU PROVINCIAL STATISTICAL OFFICE
3
CONTENTS
Foreword 2
Contents 3
Overview of Cebu 4
Map of Cebu 5
Geography 6-7
Chapter 1 POPULATION and HOUSING 8-77
Chapter 2 PRICES and INDICES 78-85
Chapter 3 AGRICULTURE 86-114
Chapter 4 CONSTRUCTION STATISTICS 115-120
Chapter 5 VITAL STATISTICS 121-162
4
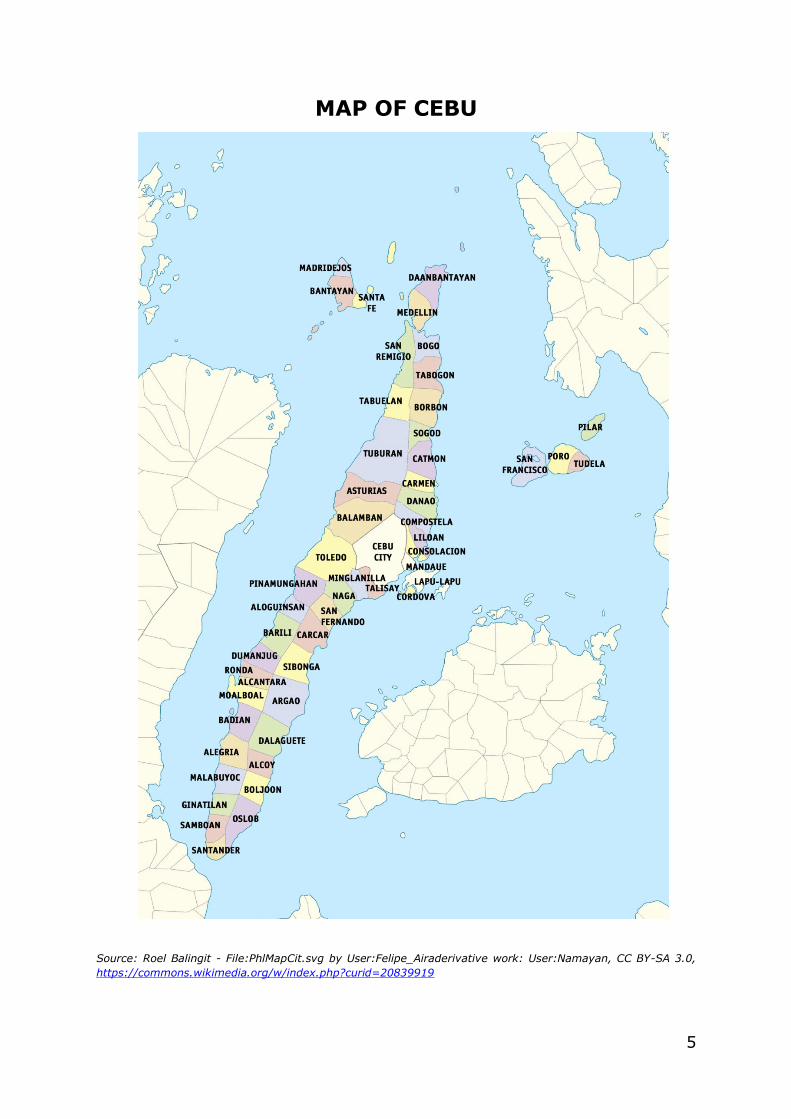
OVERVIEW OF CEBU
Cebu is located at the center of Central Visayas, to the east of Negros
and to the west of Leyte and Bohol. The province consists of Cebu Island
as well as smaller islands which include Mactan, Bantayan, Malapascua,
Olango and the Camotes Island. The province is characterized by narrow
coastlines, limestone plateaus and coastal plains but with predominant
rolling hills and rugged mountain ranges traversing then northern and
southern lengths of the island. Cebu City is the capital of the province and
nicknamed as the “Queen City of the Southern Philippines”. Cebu is one of
the most developed provinces in the Philippines, with Cebu City as the
main center of commerce, trade and industry in the Visayas.
5
MAP OF CEBU
Source: Roel Balingit - File:PhlMapCit.svg by User:Felipe_Airaderivative work: User:Namayan, CC BY-SA 3.0,
https://commons.wikimedia.org/w/index.php?curid=20839919
6
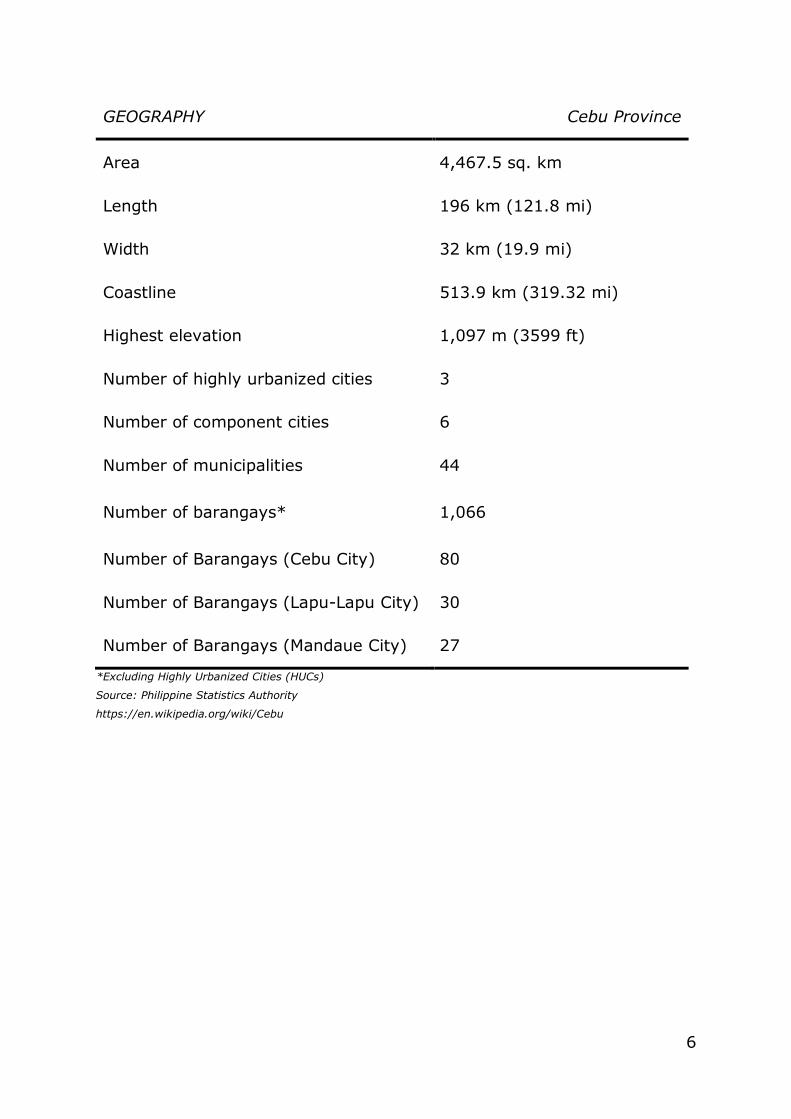
GEOGRAPHY Cebu Province
Area 4,467.5 sq. km
Length 196 km (121.8 mi)
Width 32 km (19.9 mi)
Coastline 513.9 km (319.32 mi)
Highest elevation 1,097 m (3599 ft)
Number of highly urbanized cities 3
Number of component cities 6
Number of municipalities 44
Number of barangays* 1,066
Number of Barangays (Cebu City) 80
Number of Barangays (Lapu-Lapu City) 30
Number of Barangays (Mandaue City) 27
*Excluding Highly Urbanized Cities (HUCs)
Source: Philippine Statistics Authority
https://en.wikipedia.org/wiki/Cebu
7
GEOGRAPHY Cebu Province
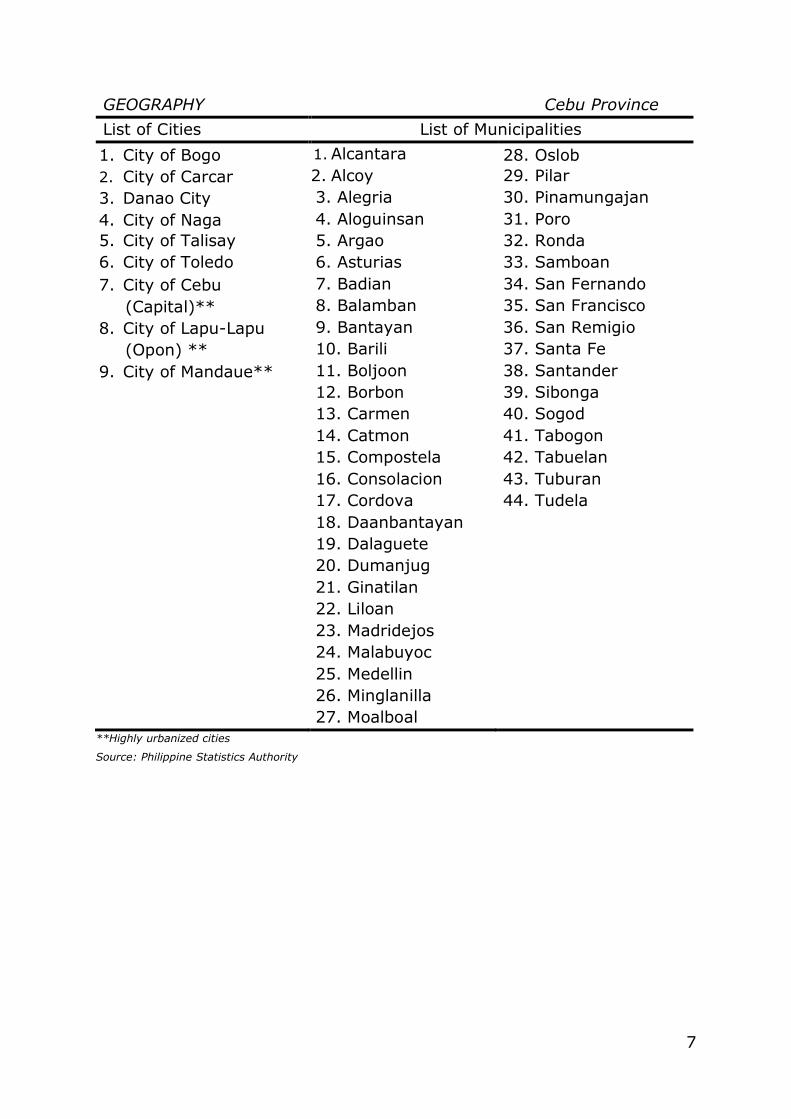
List of Cities List of Municipalities
1. City of Bogo 1. Alcantara 28. Oslob
2. City of Carcar 2. Alcoy 29. Pilar
3. Danao City 3. Alegria 30. Pinamungajan
4. City of Naga 4. Aloguinsan 31. Poro
5. City of Talisay 5. Argao 32. Ronda
6. City of Toledo 6. Asturias 33. Samboan
7. City of Cebu 7. Badian 34. San Fernando
(Capital)** 8. Balamban 35. San Francisco
8. City of Lapu-Lapu 9. Bantayan 36. San Remigio
(Opon) ** 10. Barili 37. Santa Fe
9. City of Mandaue** 11. Boljoon 38. Santander
12. Borbon 39. Sibonga
13. Carmen 40. Sogod
14. Catmon 41. Tabogon
15. Compostela 42. Tabuelan
16. Consolacion 43. Tuburan
17. Cordova 44. Tudela
18. Daanbantayan
19. Dalaguete
20. Dumanjug
21. Ginatilan
22. Liloan
23. Madridejos
24. Malabuyoc
25. Medellin
26. Minglanilla
27. Moalboal **Highly urbanized cities
Source: Philippine Statistics Authority
8
Chapter 1. POPULATION and HOUSING
This chapter presents the highlights of various statistical data series
of the result of the 2015 Census of Population (POPCEN) and the 2020
Census of Population and Housing (CPH) population counts and growth rate
in the province of Cebu as of 01 May 2020. Disaggregated data of the
population counts of the provinces are presented down to its highly
urbanized cities, component cities, municipalities and its barangays.
Highlights:
POPCEN 2015
In 2015, total population in Cebu province reached to 2,938,982 persons this is 319,620 persons higher than the population in 2010 at
2,619,362 persons. The household population of Cebu province reached
2,928,034 persons in 2015. This is 314,192 higher than the 2,613,842-
household population reported in 2010. The household population
comprised 99.6 percent of the total Cebu province population, while the
remaining 0.4 percent is comprised of the institutional population or those
residing in collective or institutional living quarters such as hospitals,
orphanages, and military camps; and Filipinos in Philippine embassies,
consulates, and missions abroad. Average household size in Cebu province
reached to 4.4 persons per household in 2015 and there were 669,322
number of households was recorded in Cebu province.
Among the highly urbanized cities in the province, Cebu City had the
highest population with 922,611 persons in 2015 this is higher by 6.52% than the population of 2010 with 866,171 persons. This was followed by
Lapu-Lapu City with 408,112 persons an increased by 16.45% of the
population in the city in 2010 at 350,467 persons. Next to Lapu-Lapu City
was Mandaue City with 362,654 persons with an increase of 9.46% of the
population in 2010.
Of the 6 component cities and 44 municipalities in Cebu province,
Talisay City was the most populous with 227,645 persons in 2015. This was
followed by Toledo City with 170,335 persons, Danao City with 136,471
persons, Minglanilla with 132,135 persons, Consolacion with 131,528
persons and Carcar City with 119,664 persons respectively. The least
populous city/municipality was in Tudela with 11,296 persons in 2015.
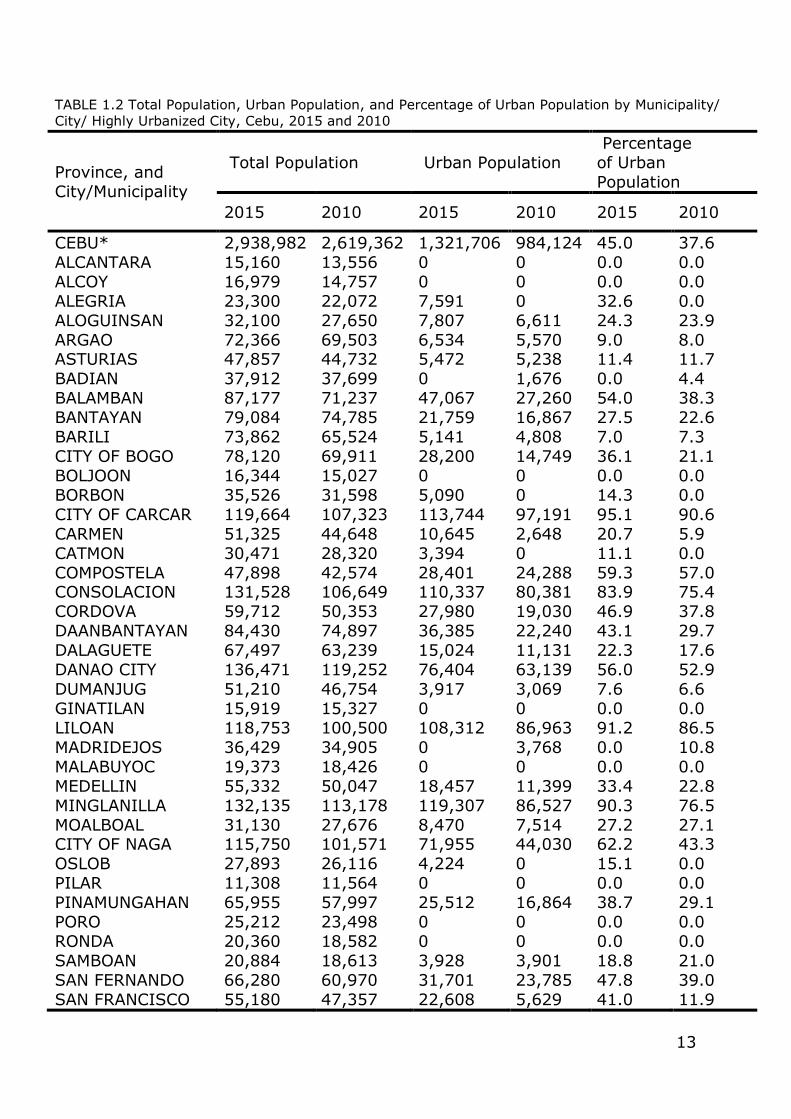
Urban population in Cebu province reached to 1,321,706 persons which comprises 45% of population from the total population in Cebu
province. Of the highly urbanized cities in Cebu province, Mandaue City had
the highest percentage in terms of urban population from the city’s total
population with 98.7% or 358,096 persons. This was followed by Lapu-
Lapu City with 94.3% or 384,827 persons and Cebu City with only 93.1%
of urban population from the city’s total population.
9
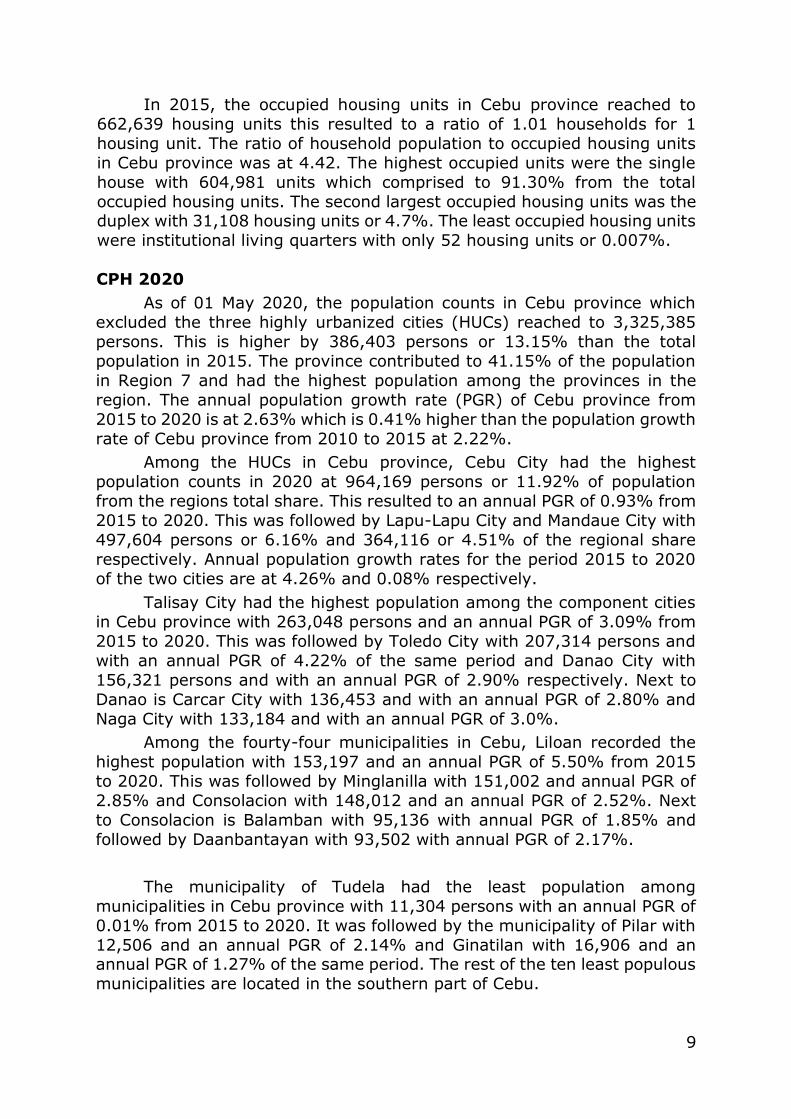
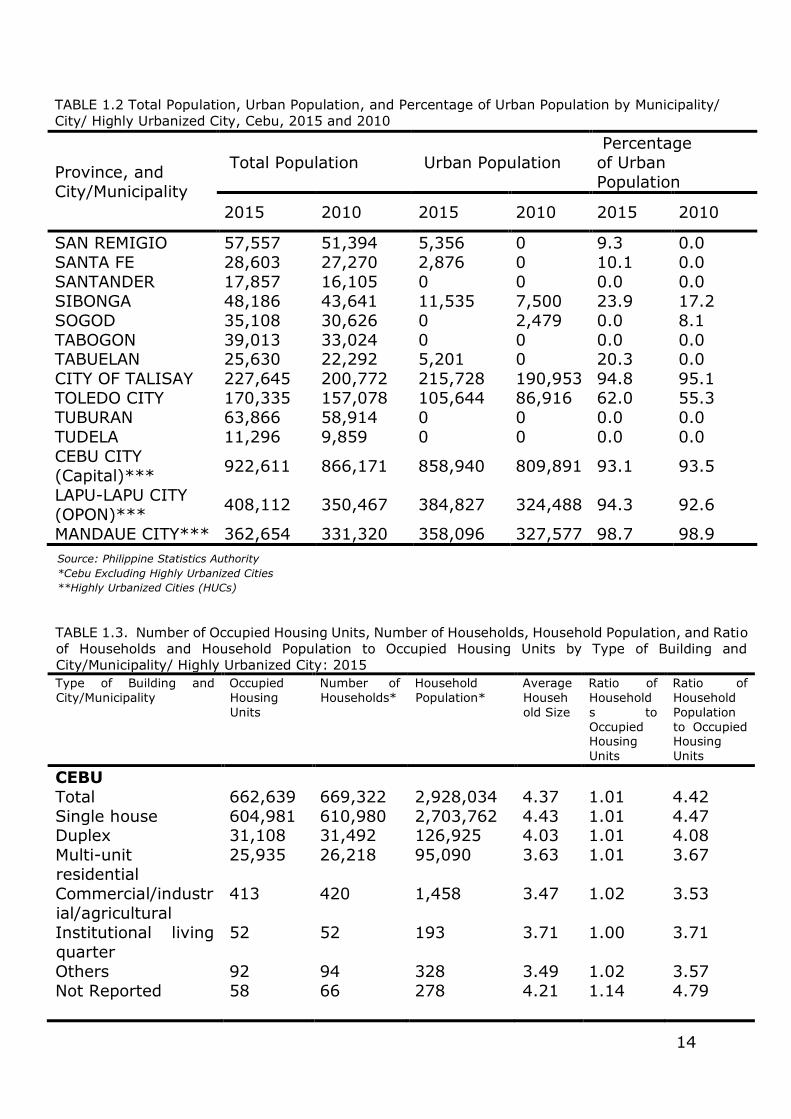
In 2015, the occupied housing units in Cebu province reached to
662,639 housing units this resulted to a ratio of 1.01 households for 1
housing unit. The ratio of household population to occupied housing units
in Cebu province was at 4.42. The highest occupied units were the single
house with 604,981 units which comprised to 91.30% from the total
occupied housing units. The second largest occupied housing units was the duplex with 31,108 housing units or 4.7%. The least occupied housing units
were institutional living quarters with only 52 housing units or 0.007%.
CPH 2020
As of 01 May 2020, the population counts in Cebu province which
excluded the three highly urbanized cities (HUCs) reached to 3,325,385
persons. This is higher by 386,403 persons or 13.15% than the total
population in 2015. The province contributed to 41.15% of the population
in Region 7 and had the highest population among the provinces in the
region. The annual population growth rate (PGR) of Cebu province from
2015 to 2020 is at 2.63% which is 0.41% higher than the population growth
rate of Cebu province from 2010 to 2015 at 2.22%.
Among the HUCs in Cebu province, Cebu City had the highest
population counts in 2020 at 964,169 persons or 11.92% of population
from the regions total share. This resulted to an annual PGR of 0.93% from
2015 to 2020. This was followed by Lapu-Lapu City and Mandaue City with
497,604 persons or 6.16% and 364,116 or 4.51% of the regional share
respectively. Annual population growth rates for the period 2015 to 2020
of the two cities are at 4.26% and 0.08% respectively.
Talisay City had the highest population among the component cities
in Cebu province with 263,048 persons and an annual PGR of 3.09% from
2015 to 2020. This was followed by Toledo City with 207,314 persons and
with an annual PGR of 4.22% of the same period and Danao City with
156,321 persons and with an annual PGR of 2.90% respectively. Next to
Danao is Carcar City with 136,453 and with an annual PGR of 2.80% and
Naga City with 133,184 and with an annual PGR of 3.0%.
Among the fourty-four municipalities in Cebu, Liloan recorded the
highest population with 153,197 and an annual PGR of 5.50% from 2015
to 2020. This was followed by Minglanilla with 151,002 and annual PGR of
2.85% and Consolacion with 148,012 and an annual PGR of 2.52%. Next
to Consolacion is Balamban with 95,136 with annual PGR of 1.85% and
followed by Daanbantayan with 93,502 with annual PGR of 2.17%.
The municipality of Tudela had the least population among
municipalities in Cebu province with 11,304 persons with an annual PGR of
0.01% from 2015 to 2020. It was followed by the municipality of Pilar with
12,506 and an annual PGR of 2.14% and Ginatilan with 16,906 and an annual PGR of 1.27% of the same period. The rest of the ten least populous
municipalities are located in the southern part of Cebu.
10
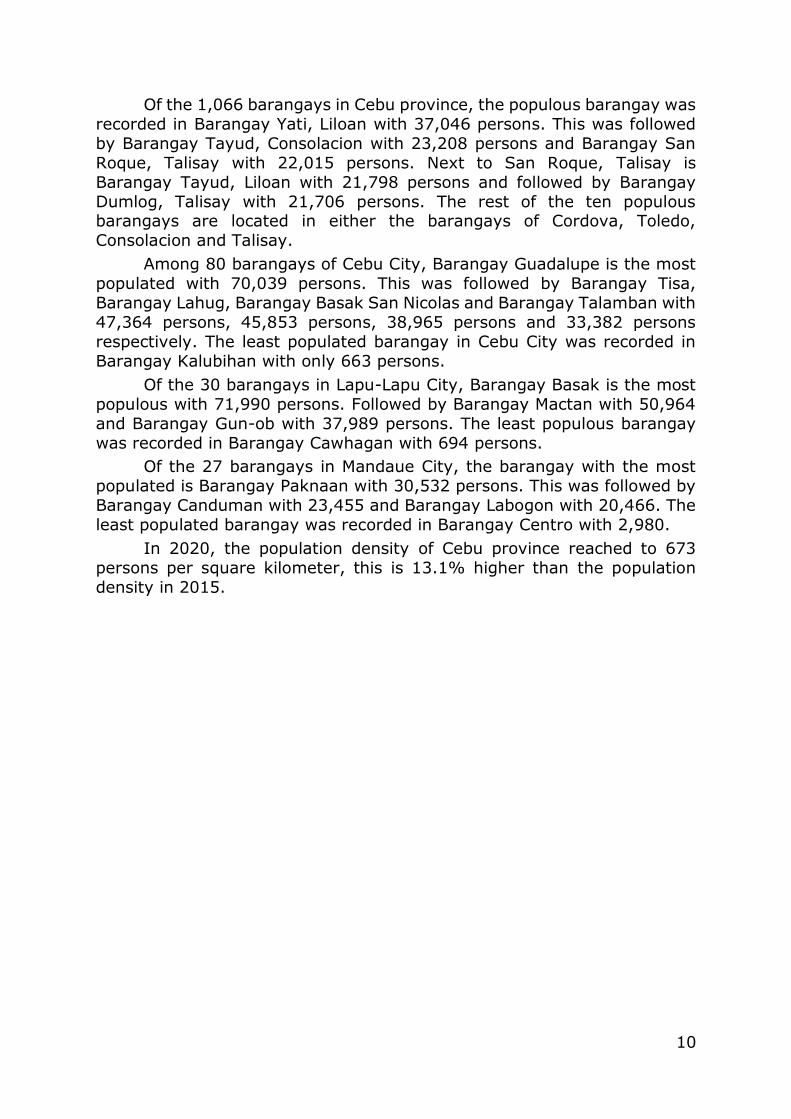
Of the 1,066 barangays in Cebu province, the populous barangay was
recorded in Barangay Yati, Liloan with 37,046 persons. This was followed
by Barangay Tayud, Consolacion with 23,208 persons and Barangay San
Roque, Talisay with 22,015 persons. Next to San Roque, Talisay is
Barangay Tayud, Liloan with 21,798 persons and followed by Barangay
Dumlog, Talisay with 21,706 persons. The rest of the ten populous barangays are located in either the barangays of Cordova, Toledo,
Consolacion and Talisay.
Among 80 barangays of Cebu City, Barangay Guadalupe is the most
populated with 70,039 persons. This was followed by Barangay Tisa,
Barangay Lahug, Barangay Basak San Nicolas and Barangay Talamban with
47,364 persons, 45,853 persons, 38,965 persons and 33,382 persons
respectively. The least populated barangay in Cebu City was recorded in
Barangay Kalubihan with only 663 persons.
Of the 30 barangays in Lapu-Lapu City, Barangay Basak is the most
populous with 71,990 persons. Followed by Barangay Mactan with 50,964
and Barangay Gun-ob with 37,989 persons. The least populous barangay
was recorded in Barangay Cawhagan with 694 persons.
Of the 27 barangays in Mandaue City, the barangay with the most
populated is Barangay Paknaan with 30,532 persons. This was followed by
Barangay Canduman with 23,455 and Barangay Labogon with 20,466. The
least populated barangay was recorded in Barangay Centro with 2,980.
In 2020, the population density of Cebu province reached to 673
persons per square kilometer, this is 13.1% higher than the population
density in 2015.
11
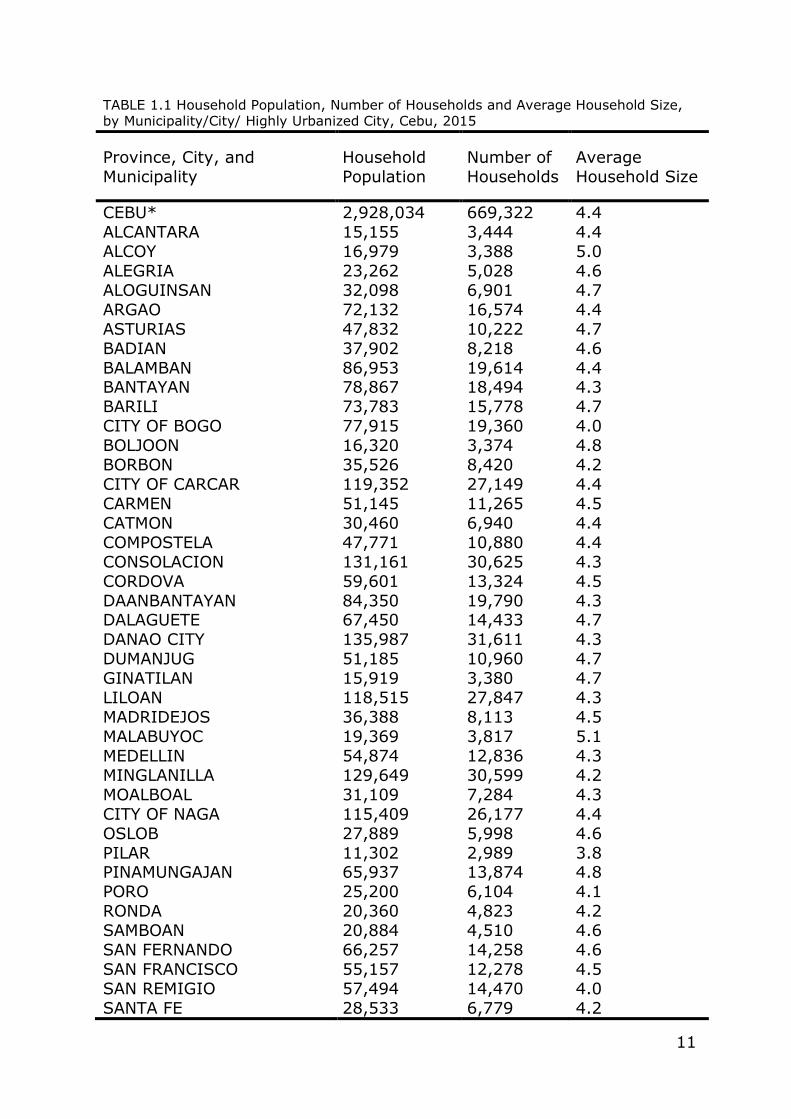
TABLE 1.1 Household Population, Number of Households and Average Household Size, by Municipality/City/ Highly Urbanized City, Cebu, 2015
Province, City, and
Municipality
Household
Population
Number of
Households
Average
Household Size
CEBU* 2,928,034 669,322 4.4
ALCANTARA 15,155 3,444 4.4
ALCOY 16,979 3,388 5.0
ALEGRIA 23,262 5,028 4.6
ALOGUINSAN 32,098 6,901 4.7
ARGAO 72,132 16,574 4.4
ASTURIAS 47,832 10,222 4.7
BADIAN 37,902 8,218 4.6
BALAMBAN 86,953 19,614 4.4 BANTAYAN 78,867 18,494 4.3
BARILI 73,783 15,778 4.7
CITY OF BOGO 77,915 19,360 4.0
BOLJOON 16,320 3,374 4.8
BORBON 35,526 8,420 4.2
CITY OF CARCAR 119,352 27,149 4.4
CARMEN 51,145 11,265 4.5
CATMON 30,460 6,940 4.4
COMPOSTELA 47,771 10,880 4.4
CONSOLACION 131,161 30,625 4.3
CORDOVA 59,601 13,324 4.5
DAANBANTAYAN 84,350 19,790 4.3 DALAGUETE 67,450 14,433 4.7
DANAO CITY 135,987 31,611 4.3
DUMANJUG 51,185 10,960 4.7
GINATILAN 15,919 3,380 4.7
LILOAN 118,515 27,847 4.3
MADRIDEJOS 36,388 8,113 4.5
MALABUYOC 19,369 3,817 5.1
MEDELLIN 54,874 12,836 4.3
MINGLANILLA 129,649 30,599 4.2
MOALBOAL 31,109 7,284 4.3
CITY OF NAGA 115,409 26,177 4.4
OSLOB 27,889 5,998 4.6
PILAR 11,302 2,989 3.8 PINAMUNGAJAN 65,937 13,874 4.8
PORO 25,200 6,104 4.1
RONDA 20,360 4,823 4.2
SAMBOAN 20,884 4,510 4.6
SAN FERNANDO 66,257 14,258 4.6
SAN FRANCISCO 55,157 12,278 4.5
SAN REMIGIO 57,494 14,470 4.0
SANTA FE 28,533 6,779 4.2
12
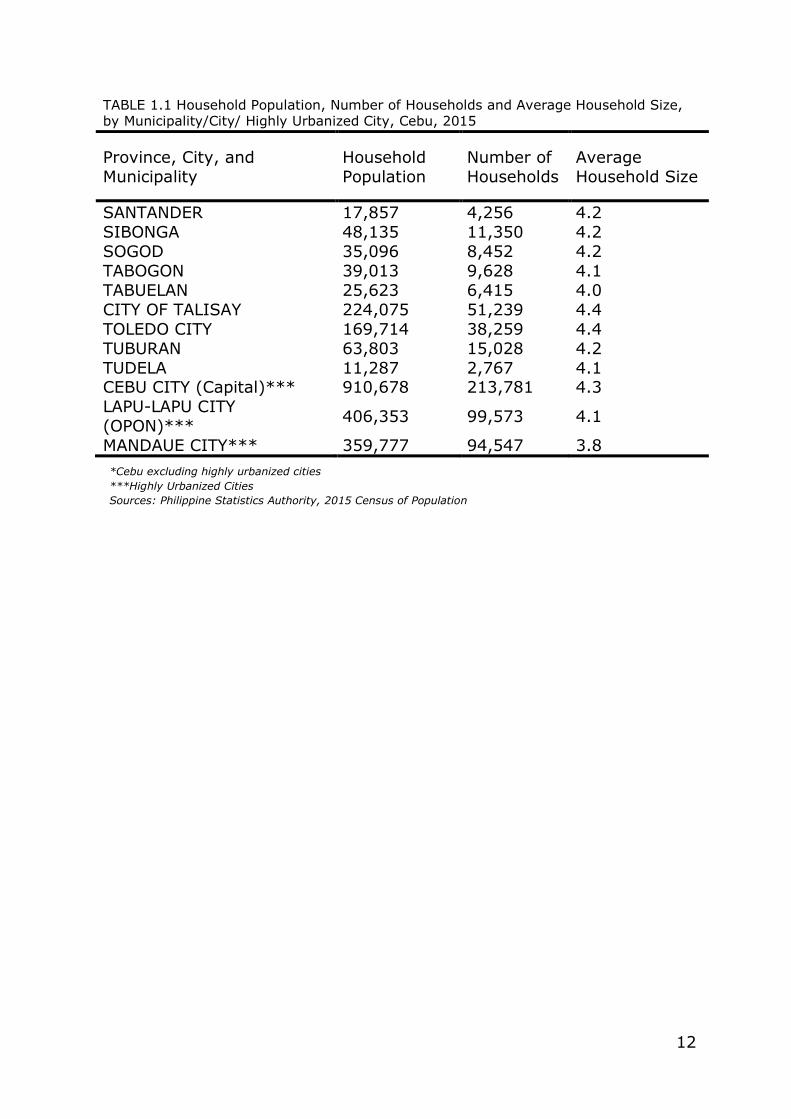
*Cebu excluding highly urbanized cities
***Highly Urbanized Cities
Sources: Philippine Statistics Authority, 2015 Census of Population
TABLE 1.1 Household Population, Number of Households and Average Household Size, by Municipality/City/ Highly Urbanized City, Cebu, 2015
Province, City, and
Municipality
Household
Population
Number of
Households
Average
Household Size
SANTANDER 17,857 4,256 4.2
SIBONGA 48,135 11,350 4.2
SOGOD 35,096 8,452 4.2
TABOGON 39,013 9,628 4.1
TABUELAN 25,623 6,415 4.0
CITY OF TALISAY 224,075 51,239 4.4
TOLEDO CITY 169,714 38,259 4.4
TUBURAN 63,803 15,028 4.2
TUDELA 11,287 2,767 4.1 CEBU CITY (Capital)*** 910,678 213,781 4.3
LAPU-LAPU CITY
(OPON)*** 406,353 99,573 4.1
MANDAUE CITY*** 359,777 94,547 3.8
13
TABLE 1.2 Total Population, Urban Population, and Percentage of Urban Population by Municipality/
City/ Highly Urbanized City, Cebu, 2015 and 2010
Province, and
City/Municipality
Total Population Urban Population
Percentage
of Urban
Population
2015 2010 2015 2010 2015 2010
CEBU* 2,938,982 2,619,362 1,321,706 984,124 45.0 37.6
ALCANTARA 15,160 13,556 0 0 0.0 0.0
ALCOY 16,979 14,757 0 0 0.0 0.0
ALEGRIA 23,300 22,072 7,591 0 32.6 0.0
ALOGUINSAN 32,100 27,650 7,807 6,611 24.3 23.9
ARGAO 72,366 69,503 6,534 5,570 9.0 8.0 ASTURIAS 47,857 44,732 5,472 5,238 11.4 11.7
BADIAN 37,912 37,699 0 1,676 0.0 4.4
BALAMBAN 87,177 71,237 47,067 27,260 54.0 38.3
BANTAYAN 79,084 74,785 21,759 16,867 27.5 22.6
BARILI 73,862 65,524 5,141 4,808 7.0 7.3
CITY OF BOGO 78,120 69,911 28,200 14,749 36.1 21.1
BOLJOON 16,344 15,027 0 0 0.0 0.0
BORBON 35,526 31,598 5,090 0 14.3 0.0
CITY OF CARCAR 119,664 107,323 113,744 97,191 95.1 90.6
CARMEN 51,325 44,648 10,645 2,648 20.7 5.9
CATMON 30,471 28,320 3,394 0 11.1 0.0
COMPOSTELA 47,898 42,574 28,401 24,288 59.3 57.0 CONSOLACION 131,528 106,649 110,337 80,381 83.9 75.4
CORDOVA 59,712 50,353 27,980 19,030 46.9 37.8
DAANBANTAYAN 84,430 74,897 36,385 22,240 43.1 29.7
DALAGUETE 67,497 63,239 15,024 11,131 22.3 17.6
DANAO CITY 136,471 119,252 76,404 63,139 56.0 52.9
DUMANJUG 51,210 46,754 3,917 3,069 7.6 6.6
GINATILAN 15,919 15,327 0 0 0.0 0.0
LILOAN 118,753 100,500 108,312 86,963 91.2 86.5
MADRIDEJOS 36,429 34,905 0 3,768 0.0 10.8
MALABUYOC 19,373 18,426 0 0 0.0 0.0
MEDELLIN 55,332 50,047 18,457 11,399 33.4 22.8
MINGLANILLA 132,135 113,178 119,307 86,527 90.3 76.5
MOALBOAL 31,130 27,676 8,470 7,514 27.2 27.1 CITY OF NAGA 115,750 101,571 71,955 44,030 62.2 43.3
OSLOB 27,893 26,116 4,224 0 15.1 0.0
PILAR 11,308 11,564 0 0 0.0 0.0
PINAMUNGAHAN 65,955 57,997 25,512 16,864 38.7 29.1
PORO 25,212 23,498 0 0 0.0 0.0
RONDA 20,360 18,582 0 0 0.0 0.0
SAMBOAN 20,884 18,613 3,928 3,901 18.8 21.0
SAN FERNANDO 66,280 60,970 31,701 23,785 47.8 39.0
SAN FRANCISCO 55,180 47,357 22,608 5,629 41.0 11.9
14
Source: Philippine Statistics Authority
*Cebu Excluding Highly Urbanized Cities
**Highly Urbanized Cities (HUCs)
TABLE 1.2 Total Population, Urban Population, and Percentage of Urban Population by Municipality/
City/ Highly Urbanized City, Cebu, 2015 and 2010
Province, and
City/Municipality
Total Population Urban Population
Percentage
of Urban
Population
2015 2010 2015 2010 2015 2010
SAN REMIGIO 57,557 51,394 5,356 0 9.3 0.0
SANTA FE 28,603 27,270 2,876 0 10.1 0.0
SANTANDER 17,857 16,105 0 0 0.0 0.0
SIBONGA 48,186 43,641 11,535 7,500 23.9 17.2
SOGOD 35,108 30,626 0 2,479 0.0 8.1
TABOGON 39,013 33,024 0 0 0.0 0.0 TABUELAN 25,630 22,292 5,201 0 20.3 0.0
CITY OF TALISAY 227,645 200,772 215,728 190,953 94.8 95.1
TOLEDO CITY 170,335 157,078 105,644 86,916 62.0 55.3
TUBURAN 63,866 58,914 0 0 0.0 0.0
TUDELA 11,296 9,859 0 0 0.0 0.0
CEBU CITY
(Capital)*** 922,611 866,171 858,940 809,891 93.1 93.5
LAPU-LAPU CITY
(OPON)*** 408,112 350,467 384,827 324,488 94.3 92.6
MANDAUE CITY*** 362,654 331,320 358,096 327,577 98.7 98.9
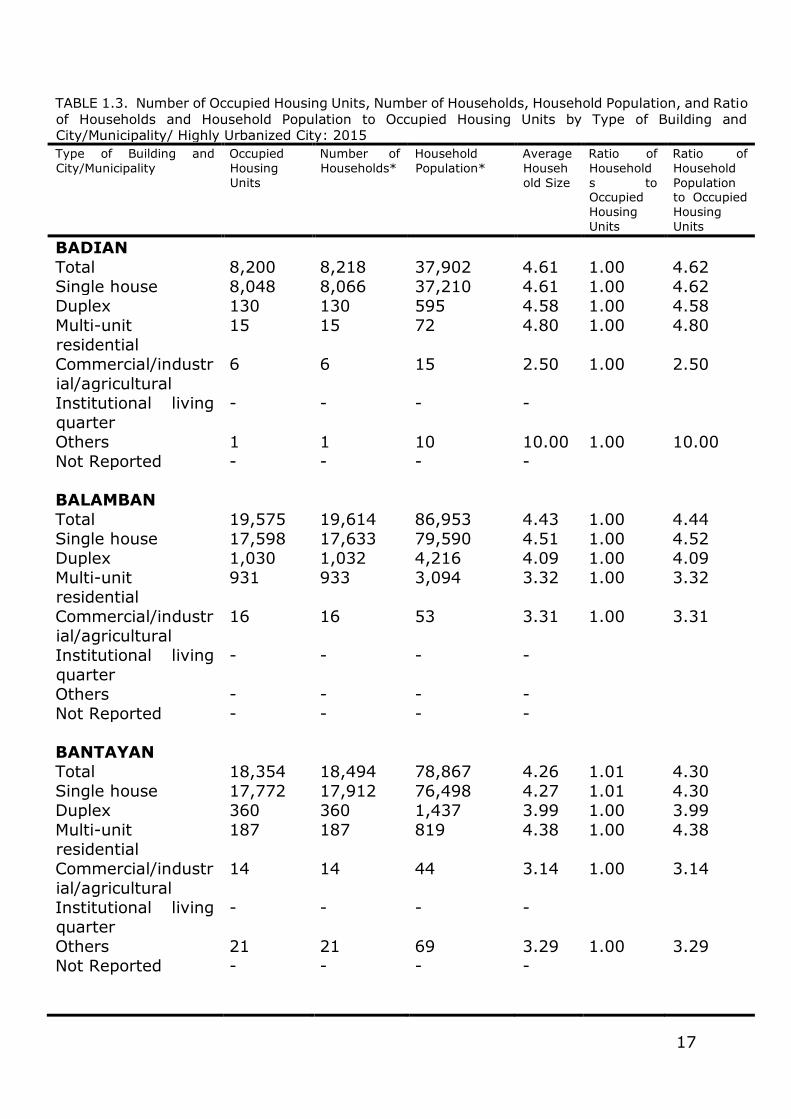
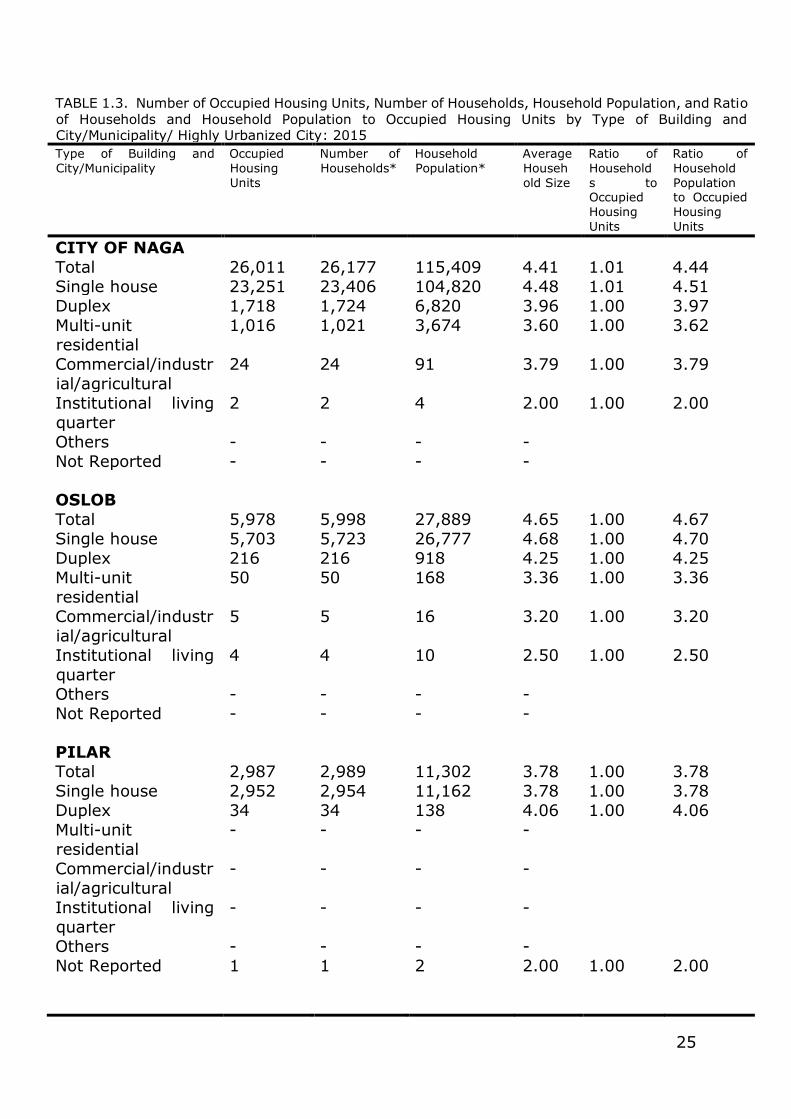
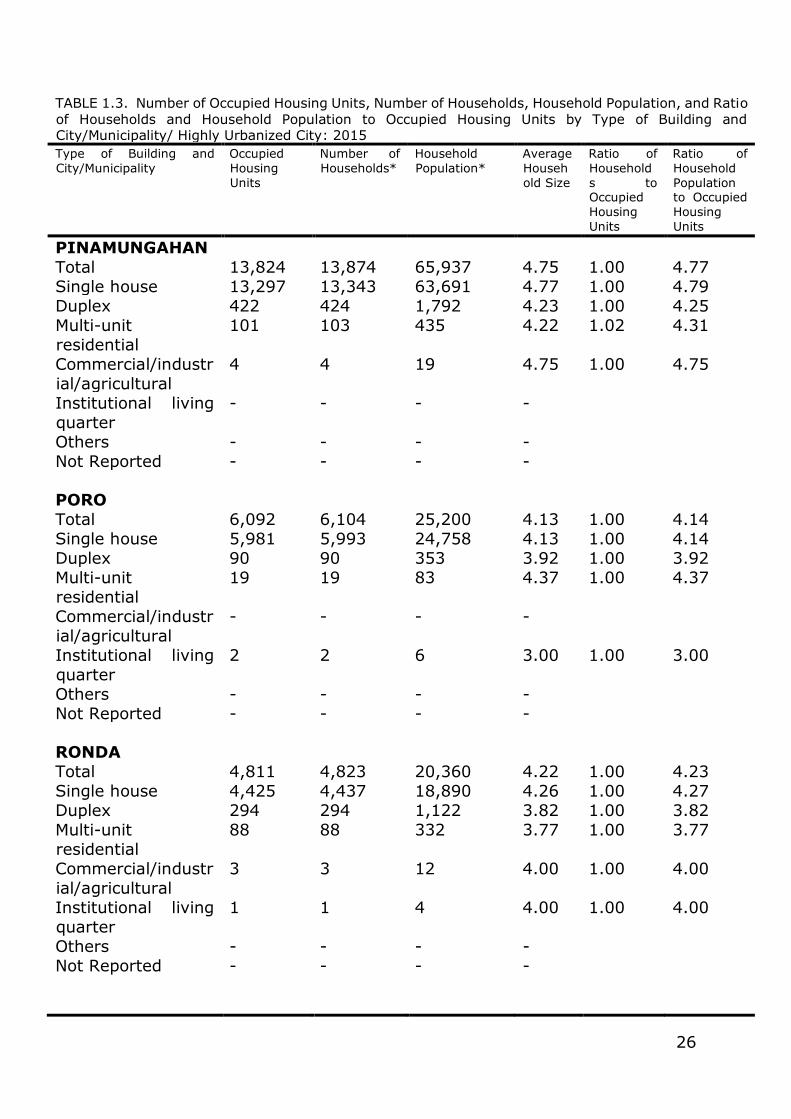
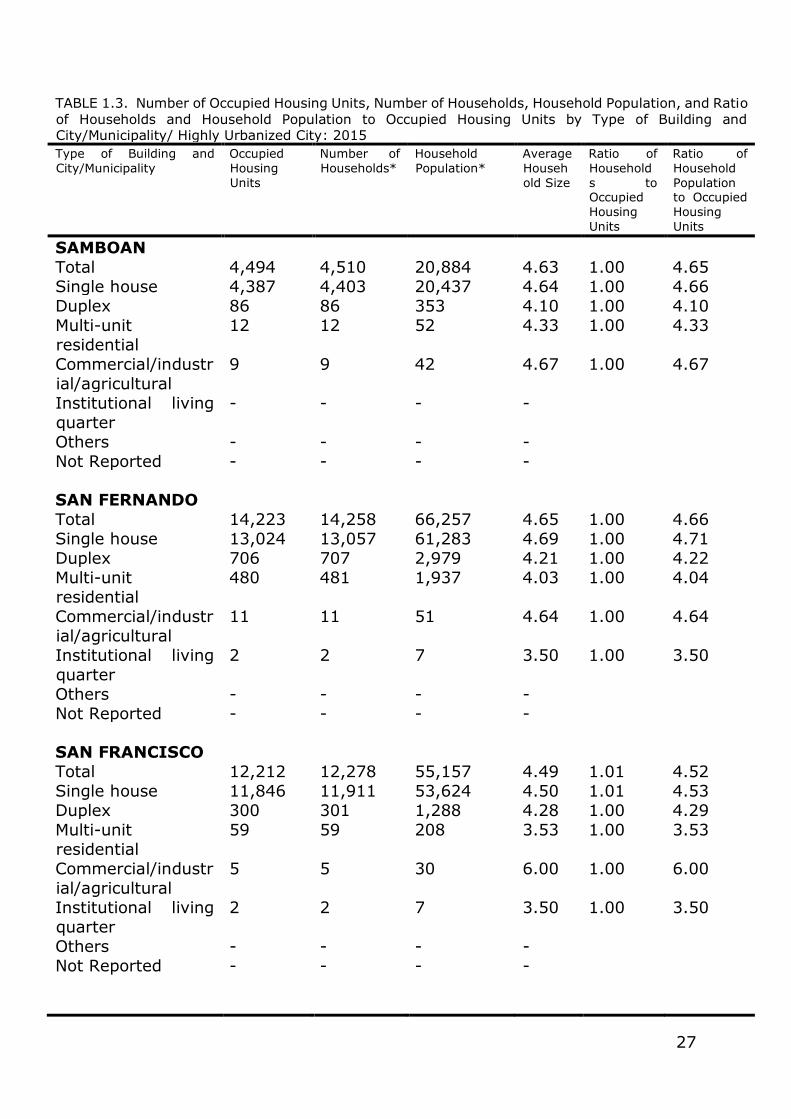
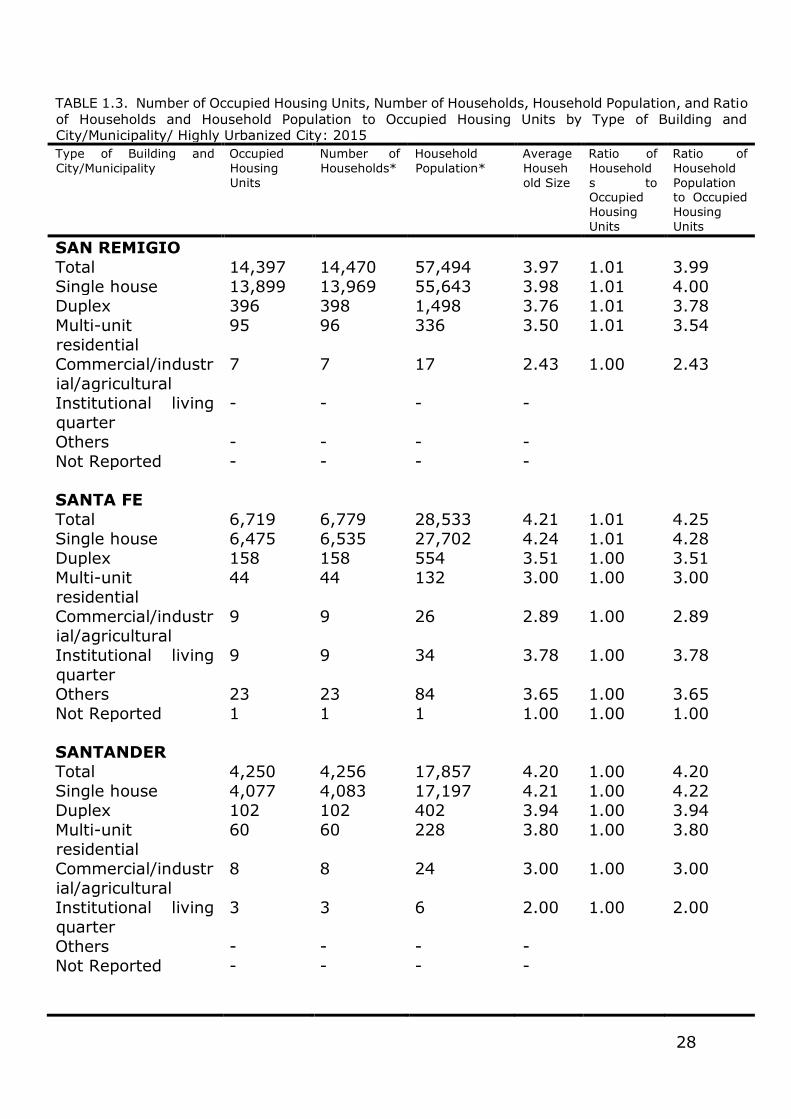
TABLE 1.3. Number of Occupied Housing Units, Number of Households, Household Population, and Ratio
of Households and Household Population to Occupied Housing Units by Type of Building and
City/Municipality/ Highly Urbanized City: 2015
Type of Building and
City/Municipality
Occupied
Housing
Units
Number of
Households*
Household
Population*
Average
Househ
old Size
Ratio of
Household
s to
Occupied Housing
Units
Ratio of
Household
Population
to Occupied Housing
Units
CEBU
Total 662,639 669,322 2,928,034 4.37 1.01 4.42
Single house 604,981 610,980 2,703,762 4.43 1.01 4.47 Duplex 31,108 31,492 126,925 4.03 1.01 4.08
Multi-unit
residential
25,935 26,218 95,090 3.63 1.01 3.67
Commercial/industr
ial/agricultural
413 420 1,458 3.47 1.02 3.53
Institutional living
quarter
52 52 193 3.71 1.00 3.71
Others 92 94 328 3.49 1.02 3.57
Not Reported 58 66 278 4.21 1.14 4.79
15
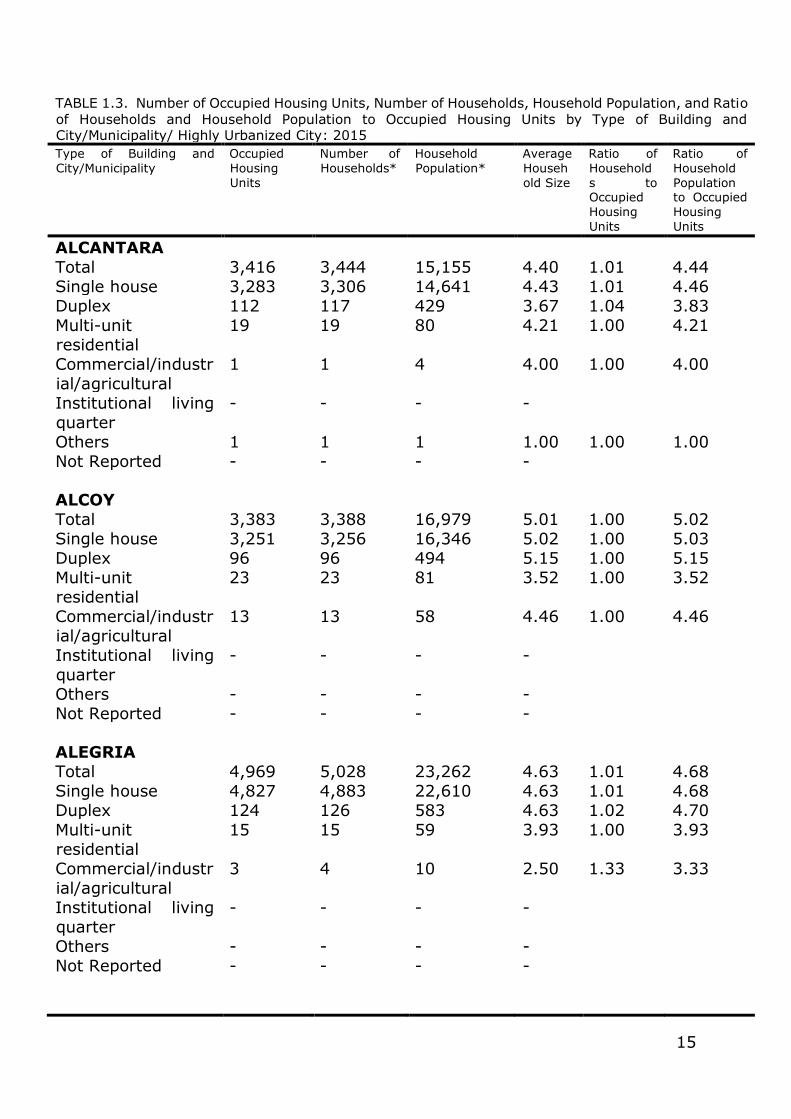
TABLE 1.3. Number of Occupied Housing Units, Number of Households, Household Population, and Ratio
of Households and Household Population to Occupied Housing Units by Type of Building and City/Municipality/ Highly Urbanized City: 2015
Type of Building and
City/Municipality
Occupied
Housing
Units
Number of
Households*
Household
Population*
Average
Househ
old Size
Ratio of
Household
s to Occupied
Housing
Units
Ratio of
Household
Population to Occupied
Housing
Units
ALCANTARA
Total 3,416 3,444 15,155 4.40 1.01 4.44
Single house 3,283 3,306 14,641 4.43 1.01 4.46
Duplex 112 117 429 3.67 1.04 3.83
Multi-unit
residential
19 19 80 4.21 1.00 4.21
Commercial/industr
ial/agricultural
1 1 4 4.00 1.00 4.00
Institutional living
quarter
- - - -
Others 1 1 1 1.00 1.00 1.00
Not Reported - - - -
ALCOY
Total 3,383 3,388 16,979 5.01 1.00 5.02
Single house 3,251 3,256 16,346 5.02 1.00 5.03
Duplex 96 96 494 5.15 1.00 5.15
Multi-unit
residential
23 23 81 3.52 1.00 3.52
Commercial/industr
ial/agricultural
13 13 58 4.46 1.00 4.46
Institutional living
quarter
- - - -
Others - - - -
Not Reported - - - -
ALEGRIA
Total 4,969 5,028 23,262 4.63 1.01 4.68
Single house 4,827 4,883 22,610 4.63 1.01 4.68
Duplex 124 126 583 4.63 1.02 4.70
Multi-unit
residential
15 15 59 3.93 1.00 3.93
Commercial/industr
ial/agricultural
3 4 10 2.50 1.33 3.33
Institutional living
quarter
- - - -
Others - - - -
Not Reported - - - -
16
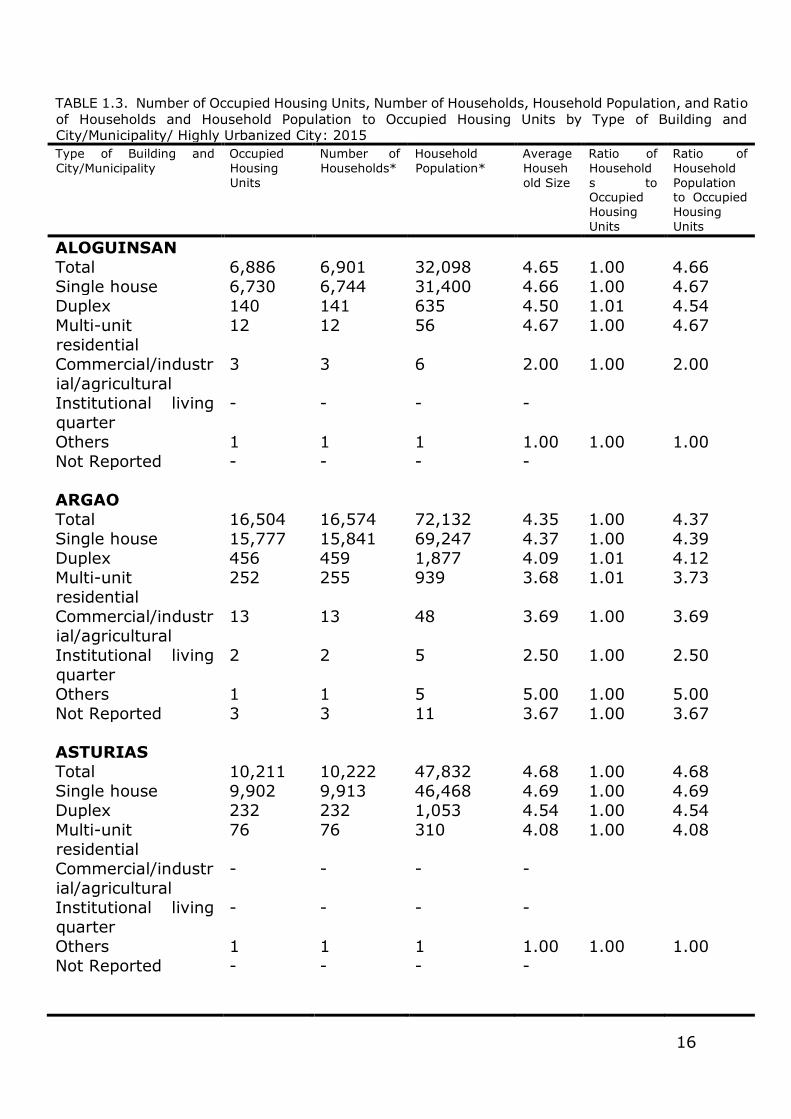
TABLE 1.3. Number of Occupied Housing Units, Number of Households, Household Population, and Ratio
of Households and Household Population to Occupied Housing Units by Type of Building and City/Municipality/ Highly Urbanized City: 2015
Type of Building and
City/Municipality
Occupied
Housing
Units
Number of
Households*
Household
Population*
Average
Househ
old Size
Ratio of
Household
s to Occupied
Housing
Units
Ratio of
Household
Population to Occupied
Housing
Units
ALOGUINSAN
Total 6,886 6,901 32,098 4.65 1.00 4.66
Single house 6,730 6,744 31,400 4.66 1.00 4.67
Duplex 140 141 635 4.50 1.01 4.54
Multi-unit
residential
12 12 56 4.67 1.00 4.67
Commercial/industr
ial/agricultural
3 3 6 2.00 1.00 2.00
Institutional living
quarter
- - - -
Others 1 1 1 1.00 1.00 1.00
Not Reported - - - -
ARGAO
Total 16,504 16,574 72,132 4.35 1.00 4.37
Single house 15,777 15,841 69,247 4.37 1.00 4.39
Duplex 456 459 1,877 4.09 1.01 4.12
Multi-unit
residential
252 255 939 3.68 1.01 3.73
Commercial/industr
ial/agricultural
13 13 48 3.69 1.00 3.69
Institutional living
quarter
2 2 5 2.50 1.00 2.50
Others 1 1 5 5.00 1.00 5.00
Not Reported 3 3 11 3.67 1.00 3.67
ASTURIAS
Total 10,211 10,222 47,832 4.68 1.00 4.68
Single house 9,902 9,913 46,468 4.69 1.00 4.69
Duplex 232 232 1,053 4.54 1.00 4.54
Multi-unit
residential
76 76 310 4.08 1.00 4.08
Commercial/industr
ial/agricultural
- - - -
Institutional living
quarter
- - - -
Others 1 1 1 1.00 1.00 1.00
Not Reported - - - -
17
TABLE 1.3. Number of Occupied Housing Units, Number of Households, Household Population, and Ratio
of Households and Household Population to Occupied Housing Units by Type of Building and City/Municipality/ Highly Urbanized City: 2015
Type of Building and
City/Municipality
Occupied
Housing
Units
Number of
Households*
Household
Population*
Average
Househ
old Size
Ratio of
Household
s to Occupied
Housing
Units
Ratio of
Household
Population to Occupied
Housing
Units
BADIAN
Total 8,200 8,218 37,902 4.61 1.00 4.62
Single house 8,048 8,066 37,210 4.61 1.00 4.62
Duplex 130 130 595 4.58 1.00 4.58
Multi-unit
residential
15 15 72 4.80 1.00 4.80
Commercial/industr
ial/agricultural
6 6 15 2.50 1.00 2.50
Institutional living
quarter
- - - -
Others 1 1 10 10.00 1.00 10.00
Not Reported - - - -
BALAMBAN
Total 19,575 19,614 86,953 4.43 1.00 4.44
Single house 17,598 17,633 79,590 4.51 1.00 4.52
Duplex 1,030 1,032 4,216 4.09 1.00 4.09
Multi-unit
residential
931 933 3,094 3.32 1.00 3.32
Commercial/industr
ial/agricultural
16 16 53 3.31 1.00 3.31
Institutional living
quarter
- - - -
Others - - - -
Not Reported - - - -
BANTAYAN
Total 18,354 18,494 78,867 4.26 1.01 4.30
Single house 17,772 17,912 76,498 4.27 1.01 4.30
Duplex 360 360 1,437 3.99 1.00 3.99
Multi-unit
residential
187 187 819 4.38 1.00 4.38
Commercial/industr
ial/agricultural
14 14 44 3.14 1.00 3.14
Institutional living
quarter
- - - -
Others 21 21 69 3.29 1.00 3.29
Not Reported - - - -
18
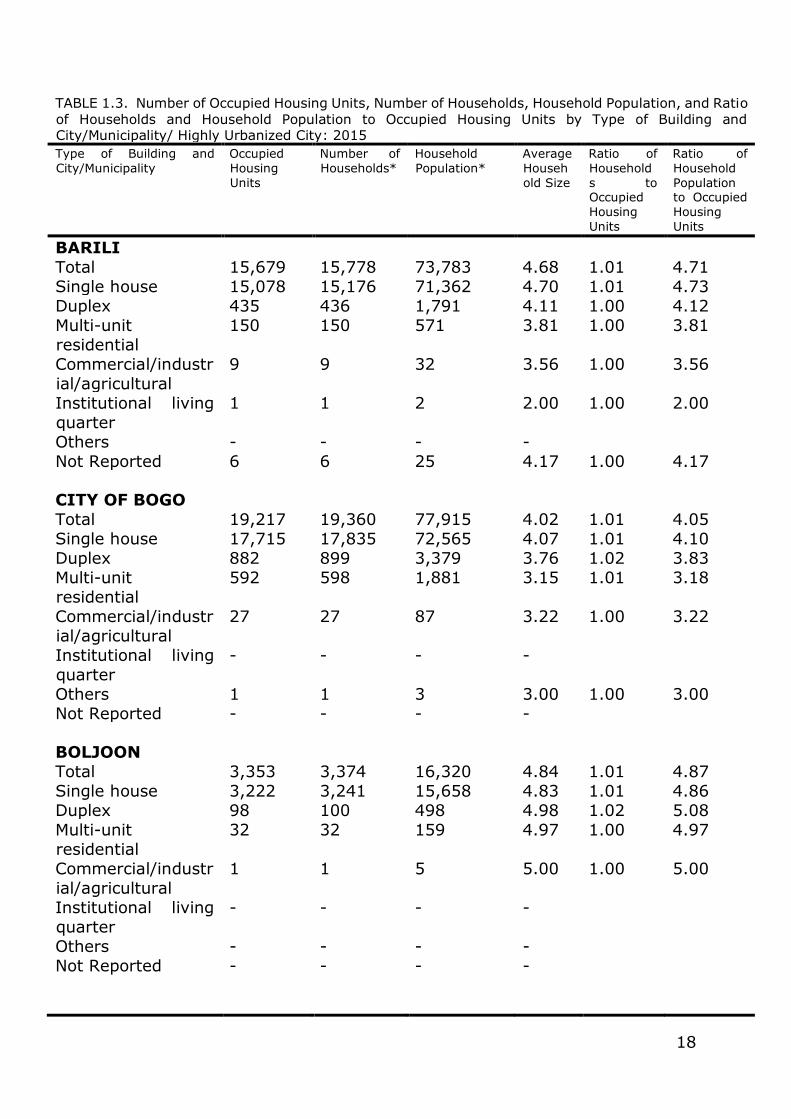
TABLE 1.3. Number of Occupied Housing Units, Number of Households, Household Population, and Ratio
of Households and Household Population to Occupied Housing Units by Type of Building and City/Municipality/ Highly Urbanized City: 2015
Type of Building and
City/Municipality
Occupied
Housing
Units
Number of
Households*
Household
Population*
Average
Househ
old Size
Ratio of
Household
s to Occupied
Housing
Units
Ratio of
Household
Population to Occupied
Housing
Units
BARILI
Total 15,679 15,778 73,783 4.68 1.01 4.71
Single house 15,078 15,176 71,362 4.70 1.01 4.73
Duplex 435 436 1,791 4.11 1.00 4.12
Multi-unit
residential
150 150 571 3.81 1.00 3.81
Commercial/industr
ial/agricultural
9 9 32 3.56 1.00 3.56
Institutional living
quarter
1 1 2 2.00 1.00 2.00
Others - - - -
Not Reported 6 6 25 4.17 1.00 4.17
CITY OF BOGO
Total 19,217 19,360 77,915 4.02 1.01 4.05
Single house 17,715 17,835 72,565 4.07 1.01 4.10
Duplex 882 899 3,379 3.76 1.02 3.83
Multi-unit
residential
592 598 1,881 3.15 1.01 3.18
Commercial/industr
ial/agricultural
27 27 87 3.22 1.00 3.22
Institutional living
quarter
- - - -
Others 1 1 3 3.00 1.00 3.00
Not Reported - - - -
BOLJOON
Total 3,353 3,374 16,320 4.84 1.01 4.87
Single house 3,222 3,241 15,658 4.83 1.01 4.86
Duplex 98 100 498 4.98 1.02 5.08
Multi-unit
residential
32 32 159 4.97 1.00 4.97
Commercial/industr
ial/agricultural
1 1 5 5.00 1.00 5.00
Institutional living
quarter
- - - -
Others - - - -
Not Reported - - - -
19
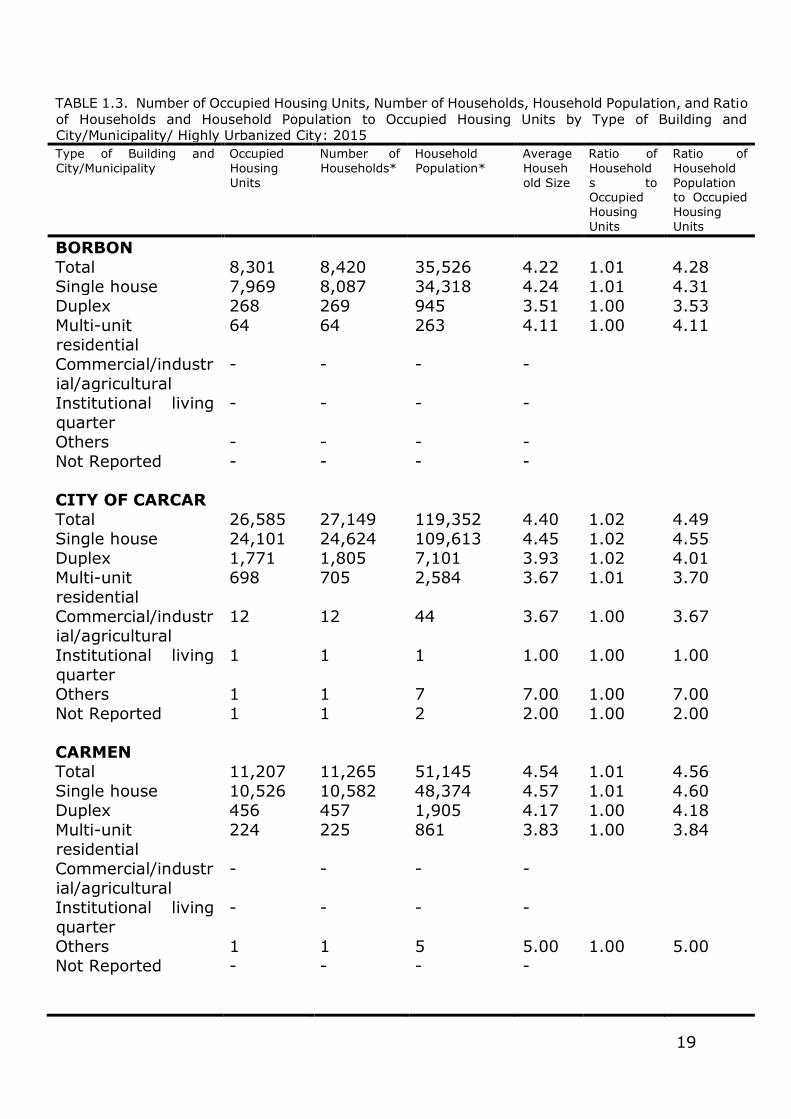
TABLE 1.3. Number of Occupied Housing Units, Number of Households, Household Population, and Ratio
of Households and Household Population to Occupied Housing Units by Type of Building and City/Municipality/ Highly Urbanized City: 2015
Type of Building and
City/Municipality
Occupied
Housing
Units
Number of
Households*
Household
Population*
Average
Househ
old Size
Ratio of
Household
s to Occupied
Housing
Units
Ratio of
Household
Population to Occupied
Housing
Units
BORBON
Total 8,301 8,420 35,526 4.22 1.01 4.28
Single house 7,969 8,087 34,318 4.24 1.01 4.31
Duplex 268 269 945 3.51 1.00 3.53
Multi-unit
residential
64 64 263 4.11 1.00 4.11
Commercial/industr
ial/agricultural
- - - -
Institutional living
quarter
- - - -
Others - - - -
Not Reported - - - -
CITY OF CARCAR
Total 26,585 27,149 119,352 4.40 1.02 4.49
Single house 24,101 24,624 109,613 4.45 1.02 4.55
Duplex 1,771 1,805 7,101 3.93 1.02 4.01
Multi-unit
residential
698 705 2,584 3.67 1.01 3.70
Commercial/industr
ial/agricultural
12 12 44 3.67 1.00 3.67
Institutional living
quarter
1 1 1 1.00 1.00 1.00
Others 1 1 7 7.00 1.00 7.00
Not Reported 1 1 2 2.00 1.00 2.00
CARMEN
Total 11,207 11,265 51,145 4.54 1.01 4.56
Single house 10,526 10,582 48,374 4.57 1.01 4.60
Duplex 456 457 1,905 4.17 1.00 4.18
Multi-unit
residential
224 225 861 3.83 1.00 3.84
Commercial/industr
ial/agricultural
- - - -
Institutional living
quarter
- - - -
Others 1 1 5 5.00 1.00 5.00
Not Reported - - - -
20
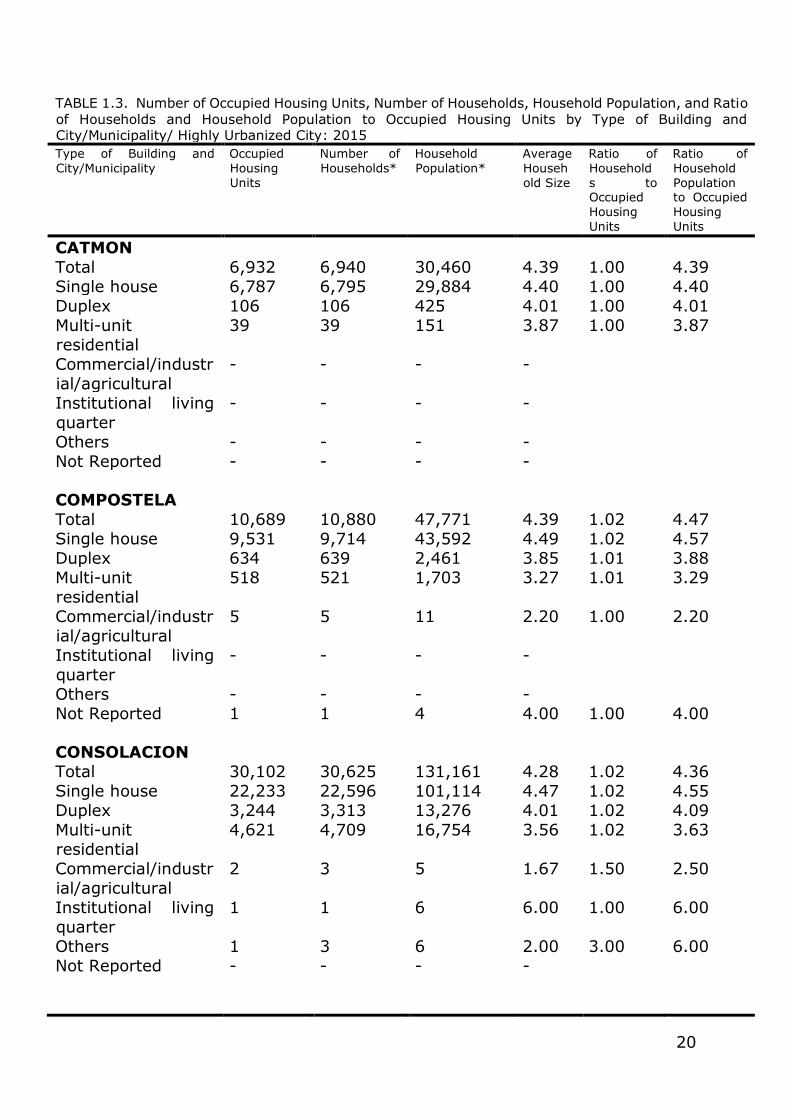
TABLE 1.3. Number of Occupied Housing Units, Number of Households, Household Population, and Ratio
of Households and Household Population to Occupied Housing Units by Type of Building and City/Municipality/ Highly Urbanized City: 2015
Type of Building and
City/Municipality
Occupied
Housing
Units
Number of
Households*
Household
Population*
Average
Househ
old Size
Ratio of
Household
s to Occupied
Housing
Units
Ratio of
Household
Population to Occupied
Housing
Units
CATMON
Total 6,932 6,940 30,460 4.39 1.00 4.39
Single house 6,787 6,795 29,884 4.40 1.00 4.40
Duplex 106 106 425 4.01 1.00 4.01
Multi-unit
residential
39 39 151 3.87 1.00 3.87
Commercial/industr
ial/agricultural
- - - -
Institutional living
quarter
- - - -
Others - - - -
Not Reported - - - -
COMPOSTELA
Total 10,689 10,880 47,771 4.39 1.02 4.47
Single house 9,531 9,714 43,592 4.49 1.02 4.57
Duplex 634 639 2,461 3.85 1.01 3.88
Multi-unit
residential
518 521 1,703 3.27 1.01 3.29
Commercial/industr
ial/agricultural
5 5 11 2.20 1.00 2.20
Institutional living
quarter
- - - -
Others - - - -
Not Reported 1 1 4 4.00 1.00 4.00
CONSOLACION
Total 30,102 30,625 131,161 4.28 1.02 4.36
Single house 22,233 22,596 101,114 4.47 1.02 4.55
Duplex 3,244 3,313 13,276 4.01 1.02 4.09
Multi-unit
residential
4,621 4,709 16,754 3.56 1.02 3.63
Commercial/industr
ial/agricultural
2 3 5 1.67 1.50 2.50
Institutional living
quarter
1 1 6 6.00 1.00 6.00
Others 1 3 6 2.00 3.00 6.00
Not Reported - - - -
21
TABLE 1.3. Number of Occupied Housing Units, Number of Households, Household Population, and Ratio
of Households and Household Population to Occupied Housing Units by Type of Building and City/Municipality/ Highly Urbanized City: 2015
Type of Building and
City/Municipality
Occupied
Housing
Units
Number of
Households*
Household
Population*
Average
Househ
old Size
Ratio of
Household
s to Occupied
Housing
Units
Ratio of
Household
Population to Occupied
Housing
Units
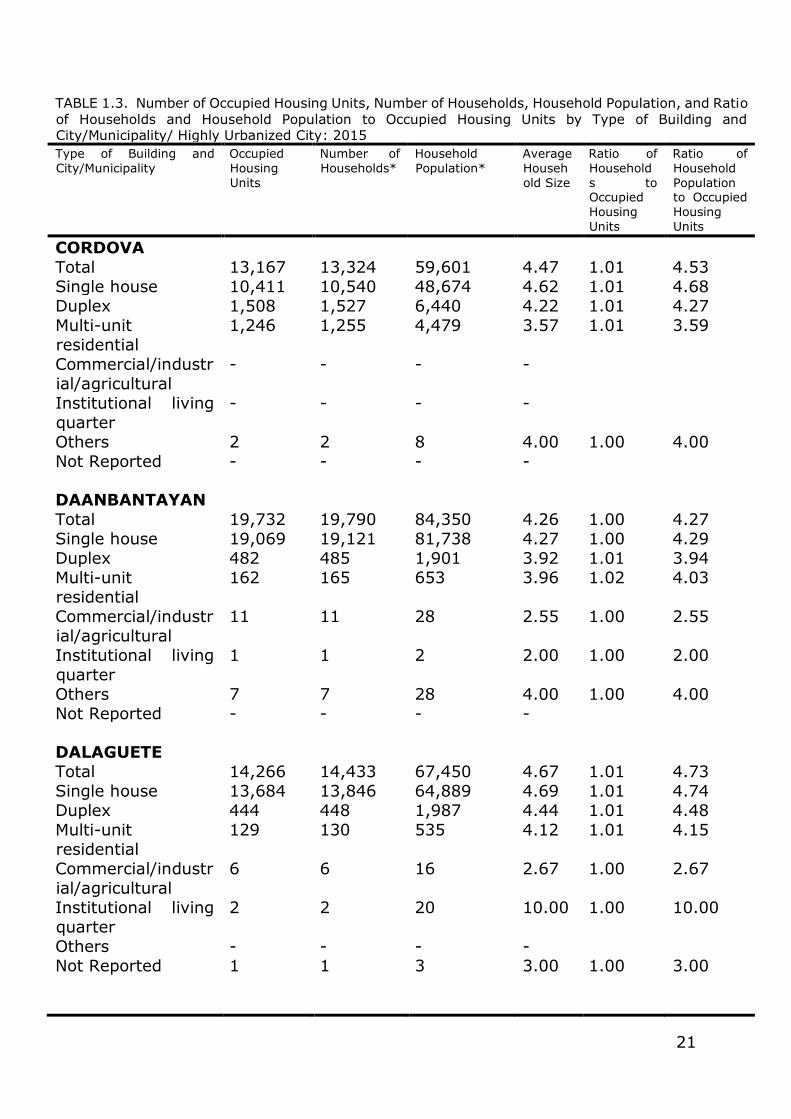
CORDOVA
Total 13,167 13,324 59,601 4.47 1.01 4.53
Single house 10,411 10,540 48,674 4.62 1.01 4.68
Duplex 1,508 1,527 6,440 4.22 1.01 4.27
Multi-unit
residential
1,246 1,255 4,479 3.57 1.01 3.59
Commercial/industr
ial/agricultural
- - - -
Institutional living
quarter
- - - -
Others 2 2 8 4.00 1.00 4.00
Not Reported - - - -
DAANBANTAYAN
Total 19,732 19,790 84,350 4.26 1.00 4.27
Single house 19,069 19,121 81,738 4.27 1.00 4.29
Duplex 482 485 1,901 3.92 1.01 3.94
Multi-unit
residential
162 165 653 3.96 1.02 4.03
Commercial/industr
ial/agricultural
11 11 28 2.55 1.00 2.55
Institutional living
quarter
1 1 2 2.00 1.00 2.00
Others 7 7 28 4.00 1.00 4.00
Not Reported - - - -
DALAGUETE
Total 14,266 14,433 67,450 4.67 1.01 4.73
Single house 13,684 13,846 64,889 4.69 1.01 4.74
Duplex 444 448 1,987 4.44 1.01 4.48
Multi-unit
residential
129 130 535 4.12 1.01 4.15
Commercial/industr
ial/agricultural
6 6 16 2.67 1.00 2.67
Institutional living
quarter
2 2 20 10.00 1.00 10.00
Others - - - -
Not Reported 1 1 3 3.00 1.00 3.00
22
TABLE 1.3. Number of Occupied Housing Units, Number of Households, Household Population, and Ratio
of Households and Household Population to Occupied Housing Units by Type of Building and City/Municipality/ Highly Urbanized City: 2015
Type of Building and
City/Municipality
Occupied
Housing
Units
Number of
Households*
Household
Population*
Average
Househ
old Size
Ratio of
Household
s to Occupied
Housing
Units
Ratio of
Household
Population to Occupied
Housing
Units
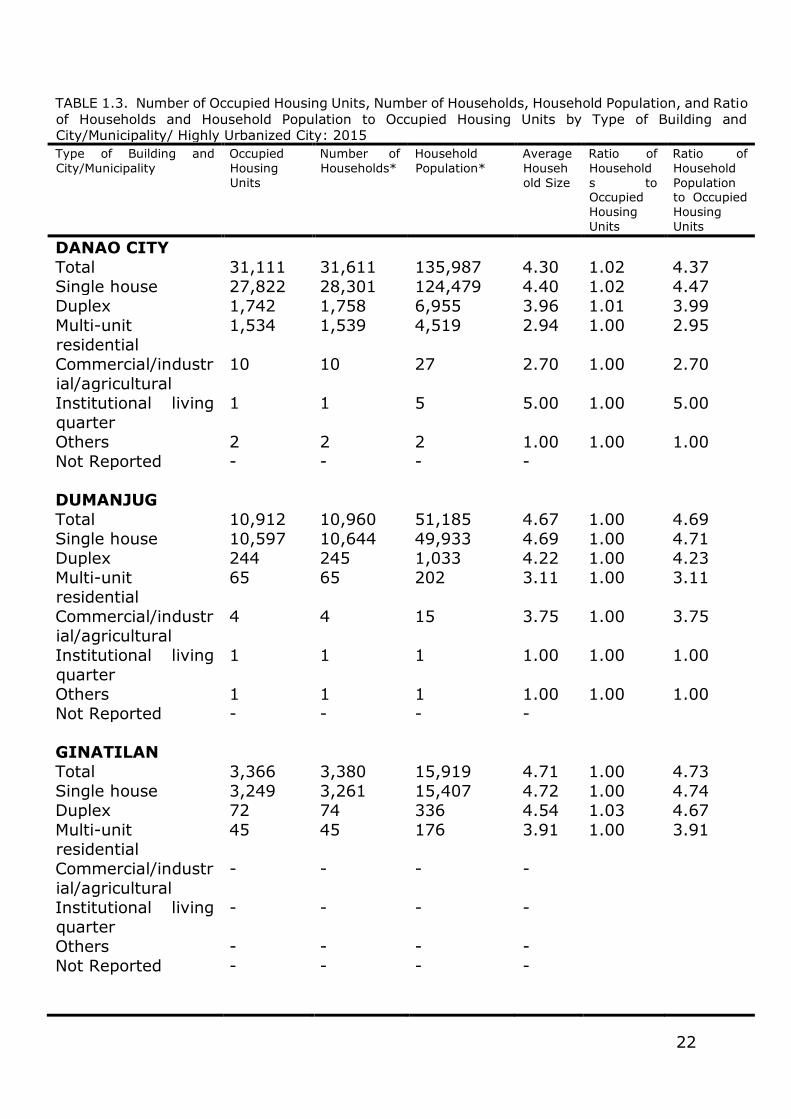
DANAO CITY
Total 31,111 31,611 135,987 4.30 1.02 4.37
Single house 27,822 28,301 124,479 4.40 1.02 4.47
Duplex 1,742 1,758 6,955 3.96 1.01 3.99
Multi-unit
residential
1,534 1,539 4,519 2.94 1.00 2.95
Commercial/industr
ial/agricultural
10 10 27 2.70 1.00 2.70
Institutional living
quarter
1 1 5 5.00 1.00 5.00
Others 2 2 2 1.00 1.00 1.00
Not Reported - - - -
DUMANJUG
Total 10,912 10,960 51,185 4.67 1.00 4.69
Single house 10,597 10,644 49,933 4.69 1.00 4.71
Duplex 244 245 1,033 4.22 1.00 4.23
Multi-unit
residential
65 65 202 3.11 1.00 3.11
Commercial/industr
ial/agricultural
4 4 15 3.75 1.00 3.75
Institutional living
quarter
1 1 1 1.00 1.00 1.00
Others 1 1 1 1.00 1.00 1.00
Not Reported - - - -
GINATILAN
Total 3,366 3,380 15,919 4.71 1.00 4.73
Single house 3,249 3,261 15,407 4.72 1.00 4.74
Duplex 72 74 336 4.54 1.03 4.67
Multi-unit
residential
45 45 176 3.91 1.00 3.91
Commercial/industr
ial/agricultural
- - - -
Institutional living
quarter
- - - -
Others - - - -
Not Reported - - - -
23
TABLE 1.3. Number of Occupied Housing Units, Number of Households, Household Population, and Ratio
of Households and Household Population to Occupied Housing Units by Type of Building and City/Municipality/ Highly Urbanized City: 2015
Type of Building and
City/Municipality
Occupied
Housing
Units
Number of
Households*
Household
Population*
Average
Househ
old Size
Ratio of
Household
s to Occupied
Housing
Units
Ratio of
Household
Population to Occupied
Housing
Units
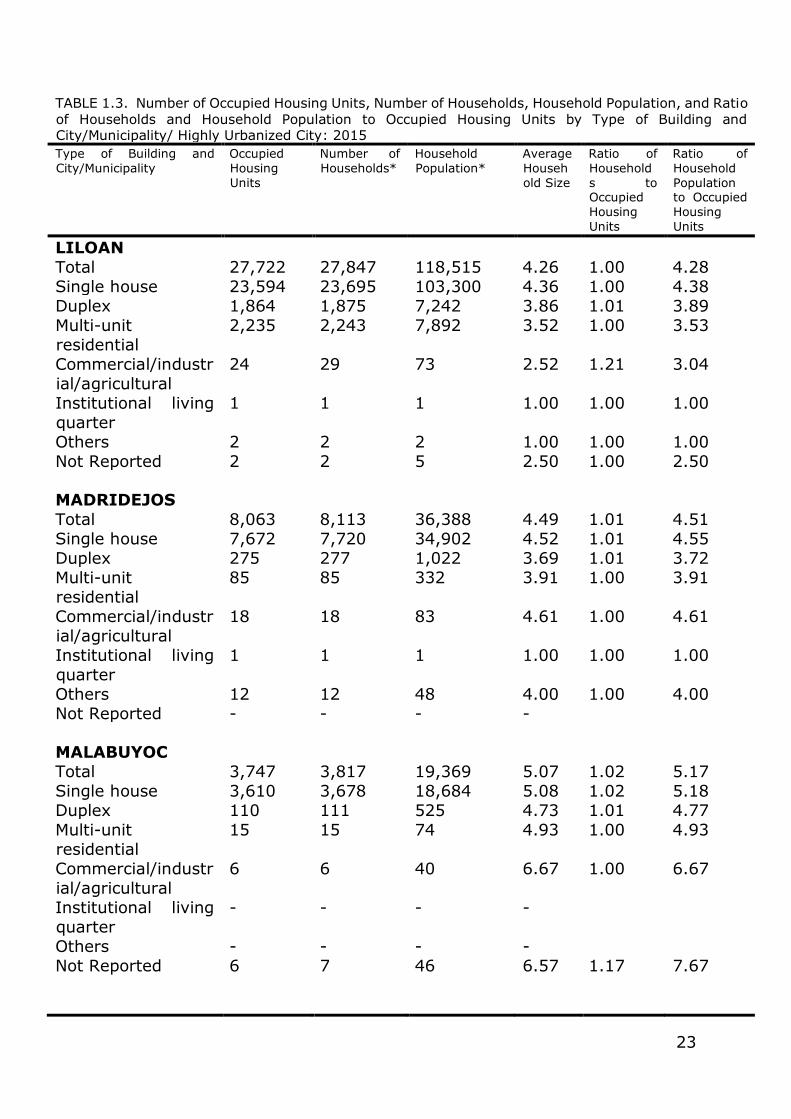
LILOAN
Total 27,722 27,847 118,515 4.26 1.00 4.28
Single house 23,594 23,695 103,300 4.36 1.00 4.38
Duplex 1,864 1,875 7,242 3.86 1.01 3.89
Multi-unit
residential
2,235 2,243 7,892 3.52 1.00 3.53
Commercial/industr
ial/agricultural
24 29 73 2.52 1.21 3.04
Institutional living
quarter
1 1 1 1.00 1.00 1.00
Others 2 2 2 1.00 1.00 1.00
Not Reported 2 2 5 2.50 1.00 2.50
MADRIDEJOS
Total 8,063 8,113 36,388 4.49 1.01 4.51
Single house 7,672 7,720 34,902 4.52 1.01 4.55
Duplex 275 277 1,022 3.69 1.01 3.72
Multi-unit
residential
85 85 332 3.91 1.00 3.91
Commercial/industr
ial/agricultural
18 18 83 4.61 1.00 4.61
Institutional living
quarter
1 1 1 1.00 1.00 1.00
Others 12 12 48 4.00 1.00 4.00
Not Reported - - - -
MALABUYOC
Total 3,747 3,817 19,369 5.07 1.02 5.17
Single house 3,610 3,678 18,684 5.08 1.02 5.18
Duplex 110 111 525 4.73 1.01 4.77
Multi-unit
residential
15 15 74 4.93 1.00 4.93
Commercial/industr
ial/agricultural
6 6 40 6.67 1.00 6.67
Institutional living
quarter
- - - -
Others - - - -
Not Reported 6 7 46 6.57 1.17 7.67
24
TABLE 1.3. Number of Occupied Housing Units, Number of Households, Household Population, and Ratio
of Households and Household Population to Occupied Housing Units by Type of Building and City/Municipality/ Highly Urbanized City: 2015
Type of Building and
City/Municipality
Occupied
Housing
Units
Number of
Households*
Household
Population*
Average
Househ
old Size
Ratio of
Household
s to Occupied
Housing
Units
Ratio of
Household
Population to Occupied
Housing
Units
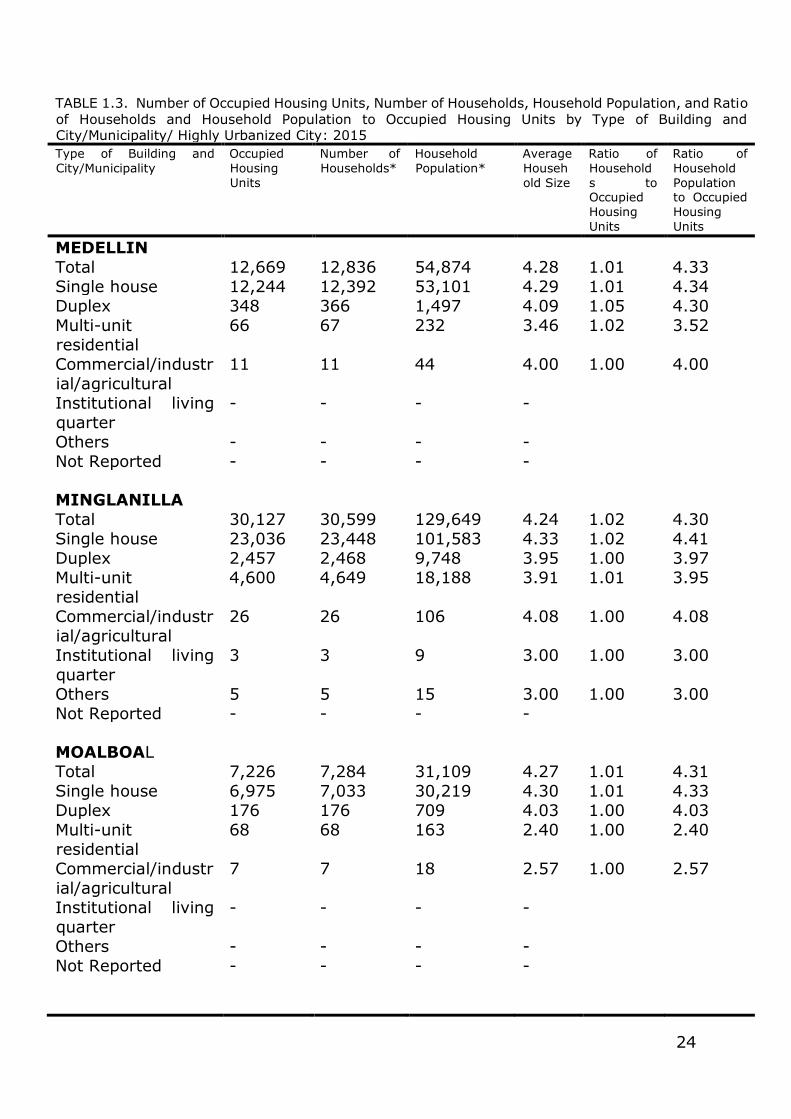
MEDELLIN
Total 12,669 12,836 54,874 4.28 1.01 4.33
Single house 12,244 12,392 53,101 4.29 1.01 4.34
Duplex 348 366 1,497 4.09 1.05 4.30
Multi-unit
residential
66 67 232 3.46 1.02 3.52
Commercial/industr
ial/agricultural
11 11 44 4.00 1.00 4.00
Institutional living
quarter
- - - -
Others - - - -
Not Reported - - - -
MINGLANILLA
Total 30,127 30,599 129,649 4.24 1.02 4.30
Single house 23,036 23,448 101,583 4.33 1.02 4.41
Duplex 2,457 2,468 9,748 3.95 1.00 3.97
Multi-unit
residential
4,600 4,649 18,188 3.91 1.01 3.95
Commercial/industr
ial/agricultural
26 26 106 4.08 1.00 4.08
Institutional living
quarter
3 3 9 3.00 1.00 3.00
Others 5 5 15 3.00 1.00 3.00
Not Reported - - - -
MOALBOAL
Total 7,226 7,284 31,109 4.27 1.01 4.31
Single house 6,975 7,033 30,219 4.30 1.01 4.33
Duplex 176 176 709 4.03 1.00 4.03
Multi-unit
residential
68 68 163 2.40 1.00 2.40
Commercial/industr
ial/agricultural
7 7 18 2.57 1.00 2.57
Institutional living
quarter
- - - -
Others - - - -
Not Reported - - - -
25
TABLE 1.3. Number of Occupied Housing Units, Number of Households, Household Population, and Ratio
of Households and Household Population to Occupied Housing Units by Type of Building and City/Municipality/ Highly Urbanized City: 2015
Type of Building and
City/Municipality
Occupied
Housing
Units
Number of
Households*
Household
Population*
Average
Househ
old Size
Ratio of
Household
s to Occupied
Housing
Units
Ratio of
Household
Population to Occupied
Housing
Units
CITY OF NAGA
Total 26,011 26,177 115,409 4.41 1.01 4.44
Single house 23,251 23,406 104,820 4.48 1.01 4.51
Duplex 1,718 1,724 6,820 3.96 1.00 3.97
Multi-unit
residential
1,016 1,021 3,674 3.60 1.00 3.62
Commercial/industr
ial/agricultural
24 24 91 3.79 1.00 3.79
Institutional living
quarter
2 2 4 2.00 1.00 2.00
Others - - - -
Not Reported - - - -
OSLOB
Total 5,978 5,998 27,889 4.65 1.00 4.67
Single house 5,703 5,723 26,777 4.68 1.00 4.70
Duplex 216 216 918 4.25 1.00 4.25
Multi-unit
residential
50 50 168 3.36 1.00 3.36
Commercial/industr
ial/agricultural
5 5 16 3.20 1.00 3.20
Institutional living
quarter
4 4 10 2.50 1.00 2.50
Others - - - -
Not Reported - - - -
PILAR
Total 2,987 2,989 11,302 3.78 1.00 3.78
Single house 2,952 2,954 11,162 3.78 1.00 3.78
Duplex 34 34 138 4.06 1.00 4.06
Multi-unit
residential
- - - -
Commercial/industr
ial/agricultural
- - - -
Institutional living
quarter
- - - -
Others - - - -
Not Reported 1 1 2 2.00 1.00 2.00
26
TABLE 1.3. Number of Occupied Housing Units, Number of Households, Household Population, and Ratio
of Households and Household Population to Occupied Housing Units by Type of Building and City/Municipality/ Highly Urbanized City: 2015
Type of Building and
City/Municipality
Occupied
Housing
Units
Number of
Households*
Household
Population*
Average
Househ
old Size
Ratio of
Household
s to Occupied
Housing
Units
Ratio of
Household
Population to Occupied
Housing
Units
PINAMUNGAHAN
Total 13,824 13,874 65,937 4.75 1.00 4.77
Single house 13,297 13,343 63,691 4.77 1.00 4.79
Duplex 422 424 1,792 4.23 1.00 4.25
Multi-unit
residential
101 103 435 4.22 1.02 4.31
Commercial/industr
ial/agricultural
4 4 19 4.75 1.00 4.75
Institutional living
quarter
- - - -
Others - - - -
Not Reported - - - -
PORO
Total 6,092 6,104 25,200 4.13 1.00 4.14
Single house 5,981 5,993 24,758 4.13 1.00 4.14
Duplex 90 90 353 3.92 1.00 3.92
Multi-unit
residential
19 19 83 4.37 1.00 4.37
Commercial/industr
ial/agricultural
- - - -
Institutional living
quarter
2 2 6 3.00 1.00 3.00
Others - - - -
Not Reported - - - -
RONDA
Total 4,811 4,823 20,360 4.22 1.00 4.23
Single house 4,425 4,437 18,890 4.26 1.00 4.27
Duplex 294 294 1,122 3.82 1.00 3.82
Multi-unit
residential
88 88 332 3.77 1.00 3.77
Commercial/industr
ial/agricultural
3 3 12 4.00 1.00 4.00
Institutional living
quarter
1 1 4 4.00 1.00 4.00
Others - - - -
Not Reported - - - -
27
TABLE 1.3. Number of Occupied Housing Units, Number of Households, Household Population, and Ratio
of Households and Household Population to Occupied Housing Units by Type of Building and City/Municipality/ Highly Urbanized City: 2015
Type of Building and
City/Municipality
Occupied
Housing
Units
Number of
Households*
Household
Population*
Average
Househ
old Size
Ratio of
Household
s to Occupied
Housing
Units
Ratio of
Household
Population to Occupied
Housing
Units
SAMBOAN
Total 4,494 4,510 20,884 4.63 1.00 4.65
Single house 4,387 4,403 20,437 4.64 1.00 4.66
Duplex 86 86 353 4.10 1.00 4.10
Multi-unit
residential
12 12 52 4.33 1.00 4.33
Commercial/industr
ial/agricultural
9 9 42 4.67 1.00 4.67
Institutional living
quarter
- - - -
Others - - - -
Not Reported - - - -
SAN FERNANDO
Total 14,223 14,258 66,257 4.65 1.00 4.66
Single house 13,024 13,057 61,283 4.69 1.00 4.71
Duplex 706 707 2,979 4.21 1.00 4.22
Multi-unit
residential
480 481 1,937 4.03 1.00 4.04
Commercial/industr
ial/agricultural
11 11 51 4.64 1.00 4.64
Institutional living
quarter
2 2 7 3.50 1.00 3.50
Others - - - -
Not Reported - - - -
SAN FRANCISCO
Total 12,212 12,278 55,157 4.49 1.01 4.52
Single house 11,846 11,911 53,624 4.50 1.01 4.53
Duplex 300 301 1,288 4.28 1.00 4.29
Multi-unit
residential
59 59 208 3.53 1.00 3.53
Commercial/industr
ial/agricultural
5 5 30 6.00 1.00 6.00
Institutional living
quarter
2 2 7 3.50 1.00 3.50
Others - - - -
Not Reported - - - -
28
TABLE 1.3. Number of Occupied Housing Units, Number of Households, Household Population, and Ratio
of Households and Household Population to Occupied Housing Units by Type of Building and City/Municipality/ Highly Urbanized City: 2015
Type of Building and
City/Municipality
Occupied
Housing
Units
Number of
Households*
Household
Population*
Average
Househ
old Size
Ratio of
Household
s to Occupied
Housing
Units
Ratio of
Household
Population to Occupied
Housing
Units
SAN REMIGIO
Total 14,397 14,470 57,494 3.97 1.01 3.99
Single house 13,899 13,969 55,643 3.98 1.01 4.00
Duplex 396 398 1,498 3.76 1.01 3.78
Multi-unit
residential
95 96 336 3.50 1.01 3.54
Commercial/industr
ial/agricultural
7 7 17 2.43 1.00 2.43
Institutional living
quarter
- - - -
Others - - - -
Not Reported - - - -
SANTA FE
Total 6,719 6,779 28,533 4.21 1.01 4.25
Single house 6,475 6,535 27,702 4.24 1.01 4.28
Duplex 158 158 554 3.51 1.00 3.51
Multi-unit
residential
44 44 132 3.00 1.00 3.00
Commercial/industr
ial/agricultural
9 9 26 2.89 1.00 2.89
Institutional living
quarter
9 9 34 3.78 1.00 3.78
Others 23 23 84 3.65 1.00 3.65
Not Reported 1 1 1 1.00 1.00 1.00
SANTANDER
Total 4,250 4,256 17,857 4.20 1.00 4.20
Single house 4,077 4,083 17,197 4.21 1.00 4.22
Duplex 102 102 402 3.94 1.00 3.94
Multi-unit
residential
60 60 228 3.80 1.00 3.80
Commercial/industr
ial/agricultural
8 8 24 3.00 1.00 3.00
Institutional living
quarter
3 3 6 2.00 1.00 2.00
Others - - - -
Not Reported - - - -
29
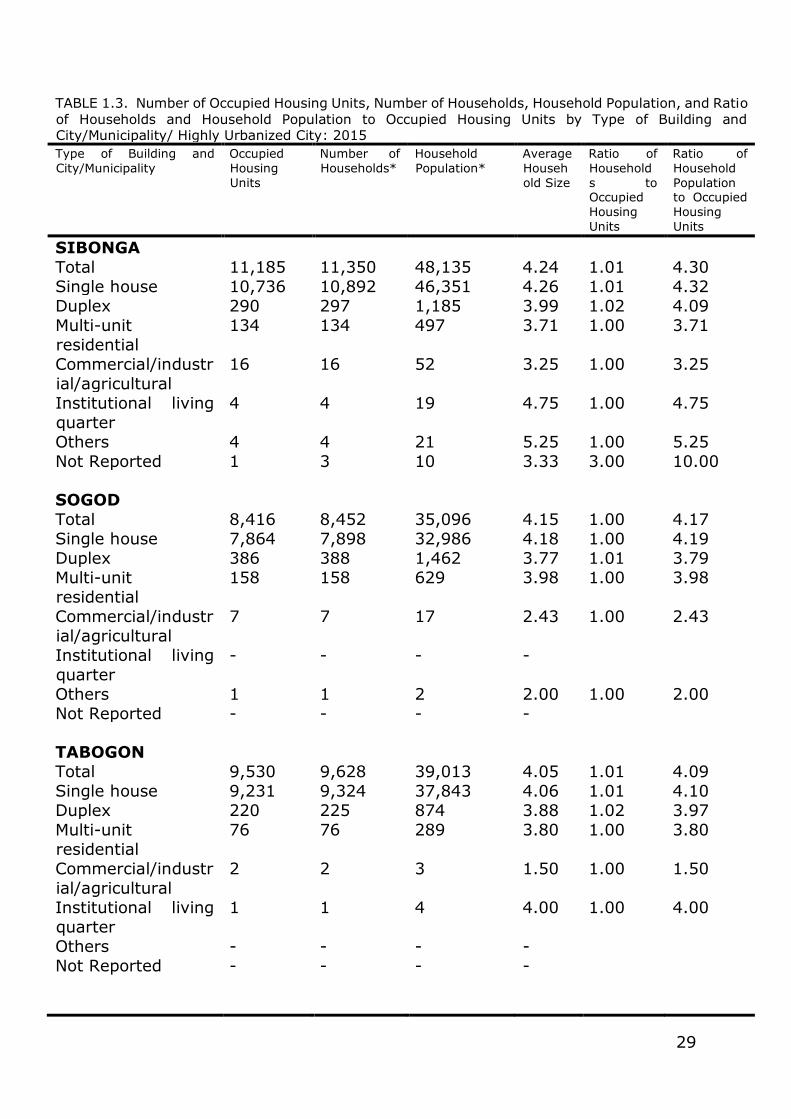
TABLE 1.3. Number of Occupied Housing Units, Number of Households, Household Population, and Ratio
of Households and Household Population to Occupied Housing Units by Type of Building and City/Municipality/ Highly Urbanized City: 2015
Type of Building and
City/Municipality
Occupied
Housing
Units
Number of
Households*
Household
Population*
Average
Househ
old Size
Ratio of
Household
s to Occupied
Housing
Units
Ratio of
Household
Population to Occupied
Housing
Units
SIBONGA
Total 11,185 11,350 48,135 4.24 1.01 4.30
Single house 10,736 10,892 46,351 4.26 1.01 4.32
Duplex 290 297 1,185 3.99 1.02 4.09
Multi-unit
residential
134 134 497 3.71 1.00 3.71
Commercial/industr
ial/agricultural
16 16 52 3.25 1.00 3.25
Institutional living
quarter
4 4 19 4.75 1.00 4.75
Others 4 4 21 5.25 1.00 5.25
Not Reported 1 3 10 3.33 3.00 10.00
SOGOD
Total 8,416 8,452 35,096 4.15 1.00 4.17
Single house 7,864 7,898 32,986 4.18 1.00 4.19
Duplex 386 388 1,462 3.77 1.01 3.79
Multi-unit
residential
158 158 629 3.98 1.00 3.98
Commercial/industr
ial/agricultural
7 7 17 2.43 1.00 2.43
Institutional living
quarter
- - - -
Others 1 1 2 2.00 1.00 2.00
Not Reported - - - -
TABOGON
Total 9,530 9,628 39,013 4.05 1.01 4.09
Single house 9,231 9,324 37,843 4.06 1.01 4.10
Duplex 220 225 874 3.88 1.02 3.97
Multi-unit
residential
76 76 289 3.80 1.00 3.80
Commercial/industr
ial/agricultural
2 2 3 1.50 1.00 1.50
Institutional living
quarter
1 1 4 4.00 1.00 4.00
Others - - - -
Not Reported - - - -
30
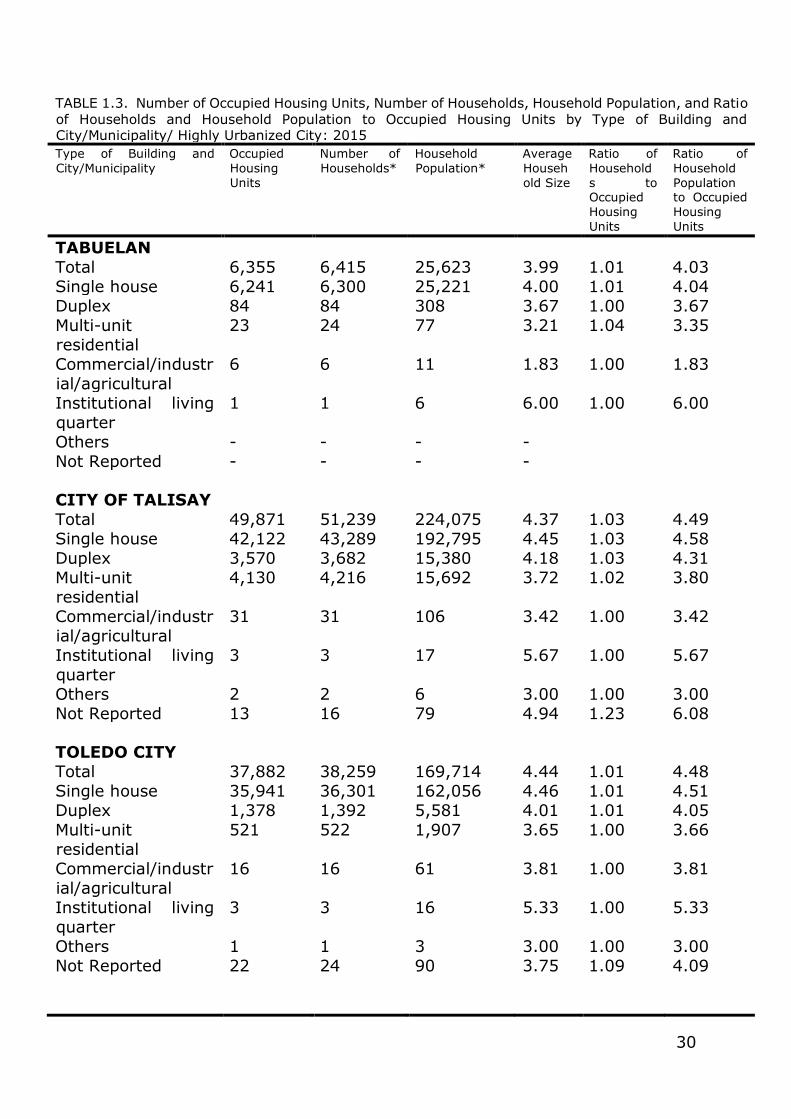
TABLE 1.3. Number of Occupied Housing Units, Number of Households, Household Population, and Ratio
of Households and Household Population to Occupied Housing Units by Type of Building and City/Municipality/ Highly Urbanized City: 2015
Type of Building and
City/Municipality
Occupied
Housing
Units
Number of
Households*
Household
Population*
Average
Househ
old Size
Ratio of
Household
s to Occupied
Housing
Units
Ratio of
Household
Population to Occupied
Housing
Units
TABUELAN
Total 6,355 6,415 25,623 3.99 1.01 4.03
Single house 6,241 6,300 25,221 4.00 1.01 4.04
Duplex 84 84 308 3.67 1.00 3.67
Multi-unit
residential
23 24 77 3.21 1.04 3.35
Commercial/industr
ial/agricultural
6 6 11 1.83 1.00 1.83
Institutional living
quarter
1 1 6 6.00 1.00 6.00
Others - - - -
Not Reported - - - -
CITY OF TALISAY
Total 49,871 51,239 224,075 4.37 1.03 4.49
Single house 42,122 43,289 192,795 4.45 1.03 4.58
Duplex 3,570 3,682 15,380 4.18 1.03 4.31
Multi-unit
residential
4,130 4,216 15,692 3.72 1.02 3.80
Commercial/industr
ial/agricultural
31 31 106 3.42 1.00 3.42
Institutional living
quarter
3 3 17 5.67 1.00 5.67
Others 2 2 6 3.00 1.00 3.00
Not Reported 13 16 79 4.94 1.23 6.08
TOLEDO CITY
Total 37,882 38,259 169,714 4.44 1.01 4.48
Single house 35,941 36,301 162,056 4.46 1.01 4.51
Duplex 1,378 1,392 5,581 4.01 1.01 4.05
Multi-unit
residential
521 522 1,907 3.65 1.00 3.66
Commercial/industr
ial/agricultural
16 16 61 3.81 1.00 3.81
Institutional living
quarter
3 3 16 5.33 1.00 5.33
Others 1 1 3 3.00 1.00 3.00
Not Reported 22 24 90 3.75 1.09 4.09
31
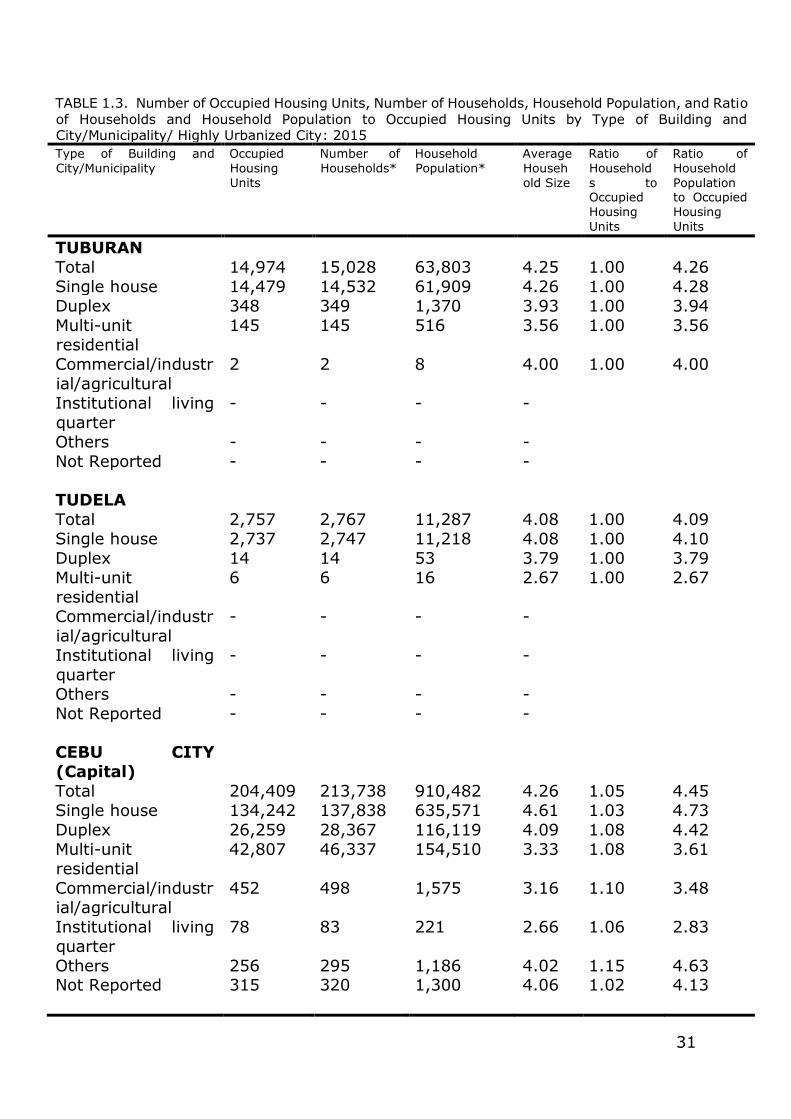
TABLE 1.3. Number of Occupied Housing Units, Number of Households, Household Population, and Ratio
of Households and Household Population to Occupied Housing Units by Type of Building and City/Municipality/ Highly Urbanized City: 2015
Type of Building and
City/Municipality
Occupied
Housing
Units
Number of
Households*
Household
Population*
Average
Househ
old Size
Ratio of
Household
s to Occupied
Housing
Units
Ratio of
Household
Population to Occupied
Housing
Units
TUBURAN
Total 14,974 15,028 63,803 4.25 1.00 4.26
Single house 14,479 14,532 61,909 4.26 1.00 4.28
Duplex 348 349 1,370 3.93 1.00 3.94
Multi-unit
residential
145 145 516 3.56 1.00 3.56
Commercial/industr
ial/agricultural
2 2 8 4.00 1.00 4.00
Institutional living
quarter
- - - -
Others - - - -
Not Reported - - - -
TUDELA
Total 2,757 2,767 11,287 4.08 1.00 4.09
Single house 2,737 2,747 11,218 4.08 1.00 4.10
Duplex 14 14 53 3.79 1.00 3.79
Multi-unit
residential
6 6 16 2.67 1.00 2.67
Commercial/industr
ial/agricultural
- - - -
Institutional living
quarter
- - - -
Others - - - -
Not Reported - - - -
CEBU CITY
(Capital)
Total 204,409 213,738 910,482 4.26 1.05 4.45
Single house 134,242 137,838 635,571 4.61 1.03 4.73
Duplex 26,259 28,367 116,119 4.09 1.08 4.42
Multi-unit
residential
42,807 46,337 154,510 3.33 1.08 3.61
Commercial/industr
ial/agricultural
452 498 1,575 3.16 1.10 3.48
Institutional living
quarter
78 83 221 2.66 1.06 2.83
Others 256 295 1,186 4.02 1.15 4.63 Not Reported 315 320 1,300 4.06 1.02 4.13
32
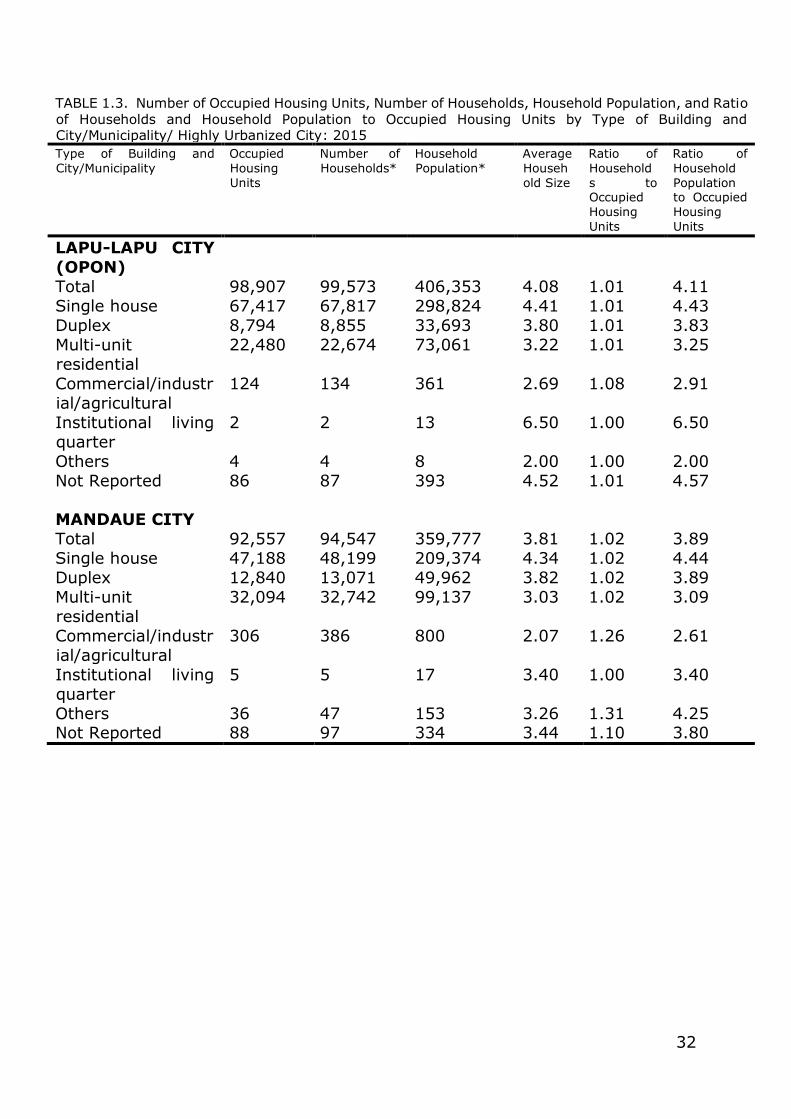
TABLE 1.3. Number of Occupied Housing Units, Number of Households, Household Population, and Ratio
of Households and Household Population to Occupied Housing Units by Type of Building and City/Municipality/ Highly Urbanized City: 2015
Type of Building and
City/Municipality
Occupied
Housing
Units
Number of
Households*
Household
Population*
Average
Househ
old Size
Ratio of
Household
s to Occupied
Housing
Units
Ratio of
Household
Population to Occupied
Housing
Units
LAPU-LAPU CITY
(OPON)
Total 98,907 99,573 406,353 4.08 1.01 4.11
Single house 67,417 67,817 298,824 4.41 1.01 4.43
Duplex 8,794 8,855 33,693 3.80 1.01 3.83
Multi-unit
residential
22,480 22,674 73,061 3.22 1.01 3.25
Commercial/industr
ial/agricultural
124 134 361 2.69 1.08 2.91
Institutional living
quarter
2 2 13 6.50 1.00 6.50
Others 4 4 8 2.00 1.00 2.00
Not Reported 86 87 393 4.52 1.01 4.57
MANDAUE CITY
Total 92,557 94,547 359,777 3.81 1.02 3.89
Single house 47,188 48,199 209,374 4.34 1.02 4.44
Duplex 12,840 13,071 49,962 3.82 1.02 3.89
Multi-unit
residential
32,094 32,742 99,137 3.03 1.02 3.09
Commercial/industr
ial/agricultural
306 386 800 2.07 1.26 2.61
Institutional living
quarter
5 5 17 3.40 1.00 3.40
Others 36 47 153 3.26 1.31 4.25 Not Reported 88 97 334 3.44 1.10 3.80
33
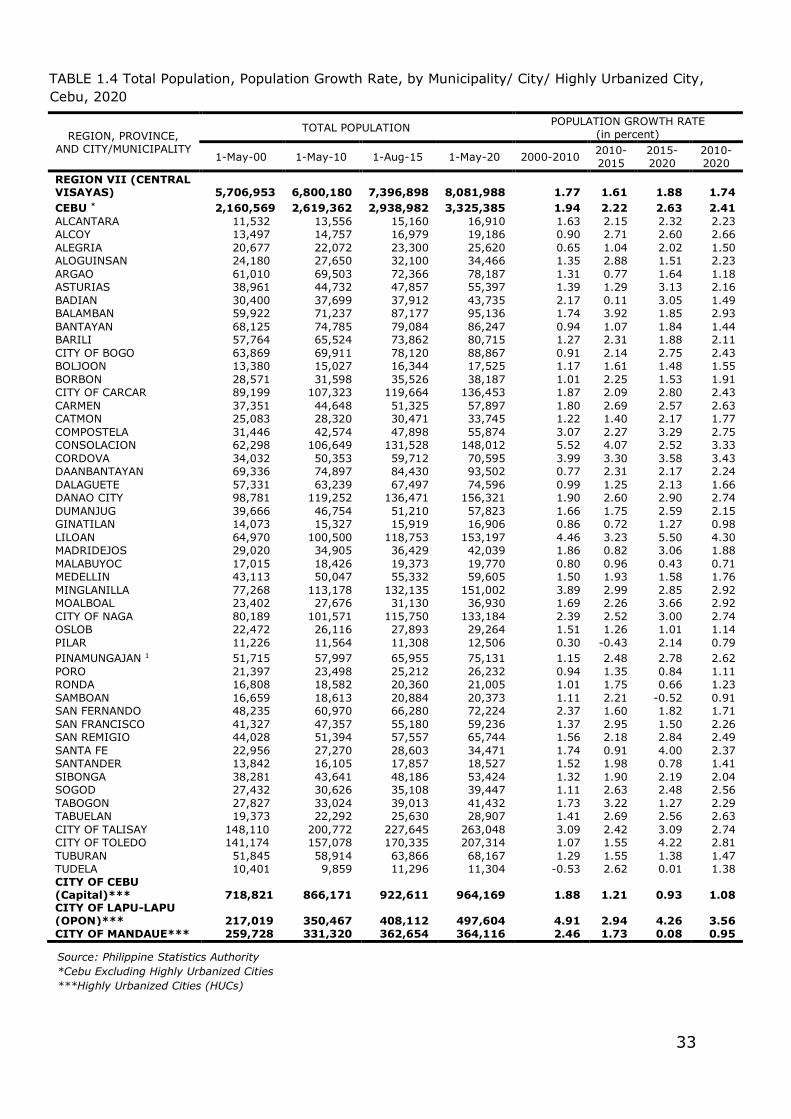
TABLE 1.4 Total Population, Population Growth Rate, by Municipality/ City/ Highly Urbanized City,
Cebu, 2020
Source: Philippine Statistics Authority
*Cebu Excluding Highly Urbanized Cities
***Highly Urbanized Cities (HUCs)
REGION, PROVINCE,
AND CITY/MUNICIPALITY
TOTAL POPULATION POPULATION GROWTH RATE
(in percent)
1-May-00 1-May-10 1-Aug-15 1-May-20 2000-2010 2010-
2015
2015-
2020
2010-
2020
REGION VII (CENTRAL VISAYAS) 5,706,953 6,800,180 7,396,898 8,081,988 1.77 1.61 1.88 1.74
CEBU * 2,160,569 2,619,362 2,938,982 3,325,385 1.94 2.22 2.63 2.41
ALCANTARA 11,532 13,556 15,160 16,910 1.63 2.15 2.32 2.23
ALCOY 13,497 14,757 16,979 19,186 0.90 2.71 2.60 2.66
ALEGRIA 20,677 22,072 23,300 25,620 0.65 1.04 2.02 1.50
ALOGUINSAN 24,180 27,650 32,100 34,466 1.35 2.88 1.51 2.23
ARGAO 61,010 69,503 72,366 78,187 1.31 0.77 1.64 1.18
ASTURIAS 38,961 44,732 47,857 55,397 1.39 1.29 3.13 2.16
BADIAN 30,400 37,699 37,912 43,735 2.17 0.11 3.05 1.49
BALAMBAN 59,922 71,237 87,177 95,136 1.74 3.92 1.85 2.93
BANTAYAN 68,125 74,785 79,084 86,247 0.94 1.07 1.84 1.44
BARILI 57,764 65,524 73,862 80,715 1.27 2.31 1.88 2.11
CITY OF BOGO 63,869 69,911 78,120 88,867 0.91 2.14 2.75 2.43
BOLJOON 13,380 15,027 16,344 17,525 1.17 1.61 1.48 1.55
BORBON 28,571 31,598 35,526 38,187 1.01 2.25 1.53 1.91
CITY OF CARCAR 89,199 107,323 119,664 136,453 1.87 2.09 2.80 2.43
CARMEN 37,351 44,648 51,325 57,897 1.80 2.69 2.57 2.63
CATMON 25,083 28,320 30,471 33,745 1.22 1.40 2.17 1.77
COMPOSTELA 31,446 42,574 47,898 55,874 3.07 2.27 3.29 2.75
CONSOLACION 62,298 106,649 131,528 148,012 5.52 4.07 2.52 3.33
CORDOVA 34,032 50,353 59,712 70,595 3.99 3.30 3.58 3.43
DAANBANTAYAN 69,336 74,897 84,430 93,502 0.77 2.31 2.17 2.24
DALAGUETE 57,331 63,239 67,497 74,596 0.99 1.25 2.13 1.66
DANAO CITY 98,781 119,252 136,471 156,321 1.90 2.60 2.90 2.74
DUMANJUG 39,666 46,754 51,210 57,823 1.66 1.75 2.59 2.15
GINATILAN 14,073 15,327 15,919 16,906 0.86 0.72 1.27 0.98
LILOAN 64,970 100,500 118,753 153,197 4.46 3.23 5.50 4.30
MADRIDEJOS 29,020 34,905 36,429 42,039 1.86 0.82 3.06 1.88
MALABUYOC 17,015 18,426 19,373 19,770 0.80 0.96 0.43 0.71
MEDELLIN 43,113 50,047 55,332 59,605 1.50 1.93 1.58 1.76
MINGLANILLA 77,268 113,178 132,135 151,002 3.89 2.99 2.85 2.92
MOALBOAL 23,402 27,676 31,130 36,930 1.69 2.26 3.66 2.92
CITY OF NAGA 80,189 101,571 115,750 133,184 2.39 2.52 3.00 2.74
OSLOB 22,472 26,116 27,893 29,264 1.51 1.26 1.01 1.14
PILAR 11,226 11,564 11,308 12,506 0.30 -0.43 2.14 0.79
PINAMUNGAJAN 1 51,715 57,997 65,955 75,131 1.15 2.48 2.78 2.62
PORO 21,397 23,498 25,212 26,232 0.94 1.35 0.84 1.11
RONDA 16,808 18,582 20,360 21,005 1.01 1.75 0.66 1.23
SAMBOAN 16,659 18,613 20,884 20,373 1.11 2.21 -0.52 0.91
SAN FERNANDO 48,235 60,970 66,280 72,224 2.37 1.60 1.82 1.71
SAN FRANCISCO 41,327 47,357 55,180 59,236 1.37 2.95 1.50 2.26
SAN REMIGIO 44,028 51,394 57,557 65,744 1.56 2.18 2.84 2.49
SANTA FE 22,956 27,270 28,603 34,471 1.74 0.91 4.00 2.37
SANTANDER 13,842 16,105 17,857 18,527 1.52 1.98 0.78 1.41
SIBONGA 38,281 43,641 48,186 53,424 1.32 1.90 2.19 2.04
SOGOD 27,432 30,626 35,108 39,447 1.11 2.63 2.48 2.56
TABOGON 27,827 33,024 39,013 41,432 1.73 3.22 1.27 2.29
TABUELAN 19,373 22,292 25,630 28,907 1.41 2.69 2.56 2.63
CITY OF TALISAY 148,110 200,772 227,645 263,048 3.09 2.42 3.09 2.74
CITY OF TOLEDO 141,174 157,078 170,335 207,314 1.07 1.55 4.22 2.81
TUBURAN 51,845 58,914 63,866 68,167 1.29 1.55 1.38 1.47
TUDELA 10,401 9,859 11,296 11,304 -0.53 2.62 0.01 1.38
CITY OF CEBU
(Capital)*** 718,821 866,171 922,611 964,169 1.88 1.21 0.93 1.08 CITY OF LAPU-LAPU
(OPON)*** 217,019 350,467 408,112 497,604 4.91 2.94 4.26 3.56
CITY OF MANDAUE*** 259,728 331,320 362,654 364,116 2.46 1.73 0.08 0.95
34
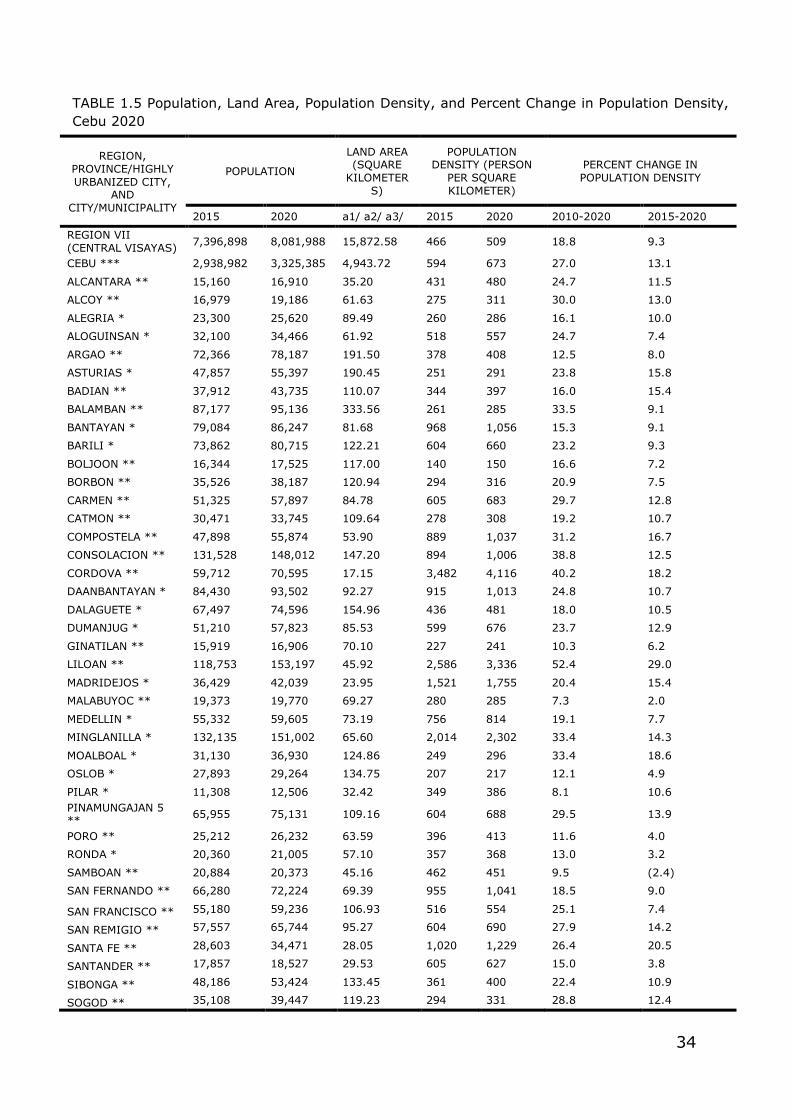
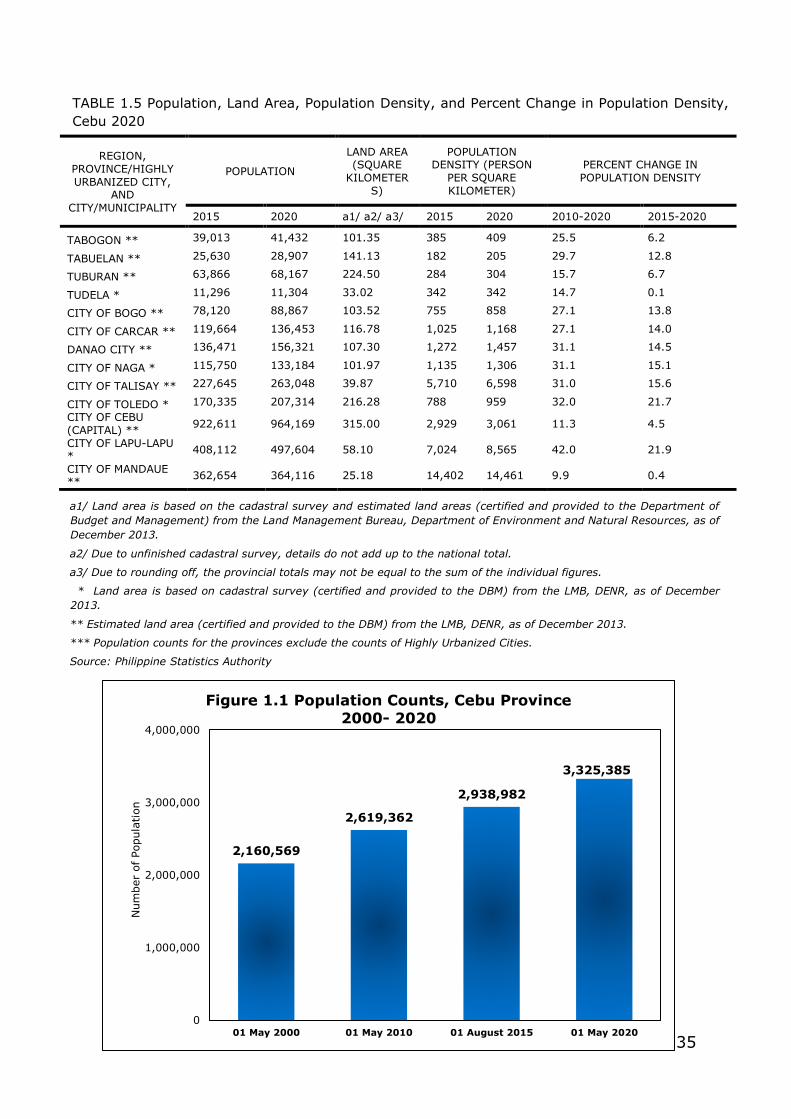
TABLE 1.5 Population, Land Area, Population Density, and Percent Change in Population Density,
Cebu 2020
REGION,
PROVINCE/HIGHLY
URBANIZED CITY, AND
CITY/MUNICIPALITY
POPULATION
LAND AREA (SQUARE
KILOMETER
S)
POPULATION DENSITY (PERSON
PER SQUARE
KILOMETER)
PERCENT CHANGE IN
POPULATION DENSITY
2015 2020 a1/ a2/ a3/ 2015 2020 2010-2020 2015-2020
REGION VII
(CENTRAL VISAYAS) 7,396,898 8,081,988 15,872.58 466 509 18.8 9.3
CEBU *** 2,938,982 3,325,385 4,943.72 594 673 27.0 13.1
ALCANTARA ** 15,160 16,910 35.20 431 480 24.7 11.5
ALCOY ** 16,979 19,186 61.63 275 311 30.0 13.0
ALEGRIA * 23,300 25,620 89.49 260 286 16.1 10.0
ALOGUINSAN * 32,100 34,466 61.92 518 557 24.7 7.4
ARGAO ** 72,366 78,187 191.50 378 408 12.5 8.0
ASTURIAS * 47,857 55,397 190.45 251 291 23.8 15.8
BADIAN ** 37,912 43,735 110.07 344 397 16.0 15.4
BALAMBAN ** 87,177 95,136 333.56 261 285 33.5 9.1
BANTAYAN * 79,084 86,247 81.68 968 1,056 15.3 9.1
BARILI * 73,862 80,715 122.21 604 660 23.2 9.3
BOLJOON ** 16,344 17,525 117.00 140 150 16.6 7.2
BORBON ** 35,526 38,187 120.94 294 316 20.9 7.5
CARMEN ** 51,325 57,897 84.78 605 683 29.7 12.8
CATMON ** 30,471 33,745 109.64 278 308 19.2 10.7
COMPOSTELA ** 47,898 55,874 53.90 889 1,037 31.2 16.7
CONSOLACION ** 131,528 148,012 147.20 894 1,006 38.8 12.5
CORDOVA ** 59,712 70,595 17.15 3,482 4,116 40.2 18.2
DAANBANTAYAN * 84,430 93,502 92.27 915 1,013 24.8 10.7
DALAGUETE * 67,497 74,596 154.96 436 481 18.0 10.5
DUMANJUG * 51,210 57,823 85.53 599 676 23.7 12.9
GINATILAN ** 15,919 16,906 70.10 227 241 10.3 6.2
LILOAN ** 118,753 153,197 45.92 2,586 3,336 52.4 29.0
MADRIDEJOS * 36,429 42,039 23.95 1,521 1,755 20.4 15.4
MALABUYOC ** 19,373 19,770 69.27 280 285 7.3 2.0
MEDELLIN * 55,332 59,605 73.19 756 814 19.1 7.7
MINGLANILLA * 132,135 151,002 65.60 2,014 2,302 33.4 14.3
MOALBOAL * 31,130 36,930 124.86 249 296 33.4 18.6
OSLOB * 27,893 29,264 134.75 207 217 12.1 4.9
PILAR * 11,308 12,506 32.42 349 386 8.1 10.6
PINAMUNGAJAN 5 **
65,955 75,131 109.16 604 688 29.5 13.9
PORO ** 25,212 26,232 63.59 396 413 11.6 4.0
RONDA * 20,360 21,005 57.10 357 368 13.0 3.2
SAMBOAN ** 20,884 20,373 45.16 462 451 9.5 (2.4)
SAN FERNANDO ** 66,280 72,224 69.39 955 1,041 18.5 9.0
SAN FRANCISCO ** 55,180 59,236 106.93 516 554 25.1 7.4
SAN REMIGIO ** 57,557 65,744 95.27 604 690 27.9 14.2
SANTA FE ** 28,603 34,471 28.05 1,020 1,229 26.4 20.5
SANTANDER ** 17,857 18,527 29.53 605 627 15.0 3.8
SIBONGA ** 48,186 53,424 133.45 361 400 22.4 10.9
SOGOD ** 35,108 39,447 119.23 294 331 28.8 12.4
35
a1/ Land area is based on the cadastral survey and estimated land areas (certified and provided to the Department of
Budget and Management) from the Land Management Bureau, Department of Environment and Natural Resources, as of
December 2013.
a2/ Due to unfinished cadastral survey, details do not add up to the national total.
a3/ Due to rounding off, the provincial totals may not be equal to the sum of the individual figures.
* Land area is based on cadastral survey (certified and provided to the DBM) from the LMB, DENR, as of December
2013.
** Estimated land area (certified and provided to the DBM) from the LMB, DENR, as of December 2013.
*** Population counts for the provinces exclude the counts of Highly Urbanized Cities.
Source: Philippine Statistics Authority
2,160,569
2,619,362
2,938,982
3,325,385
0
1,000,000
2,000,000
3,000,000
4,000,000
01 May 2000 01 May 2010 01 August 2015 01 May 2020
Num
ber
of Popula
tion
Figure 1.1 Population Counts, Cebu Province
2000- 2020
TABLE 1.5 Population, Land Area, Population Density, and Percent Change in Population Density,
Cebu 2020
REGION,
PROVINCE/HIGHLY
URBANIZED CITY, AND
CITY/MUNICIPALITY
POPULATION
LAND AREA (SQUARE
KILOMETER
S)
POPULATION DENSITY (PERSON
PER SQUARE
KILOMETER)
PERCENT CHANGE IN
POPULATION DENSITY
2015 2020 a1/ a2/ a3/ 2015 2020 2010-2020 2015-2020
TABOGON ** 39,013 41,432 101.35 385 409 25.5 6.2
TABUELAN ** 25,630 28,907 141.13 182 205 29.7 12.8
TUBURAN ** 63,866 68,167 224.50 284 304 15.7 6.7
TUDELA * 11,296 11,304 33.02 342 342 14.7 0.1
CITY OF BOGO ** 78,120 88,867 103.52 755 858 27.1 13.8
CITY OF CARCAR ** 119,664 136,453 116.78 1,025 1,168 27.1 14.0
DANAO CITY ** 136,471 156,321 107.30 1,272 1,457 31.1 14.5
CITY OF NAGA * 115,750 133,184 101.97 1,135 1,306 31.1 15.1
CITY OF TALISAY ** 227,645 263,048 39.87 5,710 6,598 31.0 15.6
CITY OF TOLEDO * 170,335 207,314 216.28 788 959 32.0 21.7
CITY OF CEBU
(CAPITAL) ** 922,611 964,169 315.00 2,929 3,061 11.3 4.5
CITY OF LAPU-LAPU *
408,112 497,604 58.10 7,024 8,565 42.0 21.9
CITY OF MANDAUE **
362,654 364,116 25.18 14,402 14,461 9.9 0.4
36
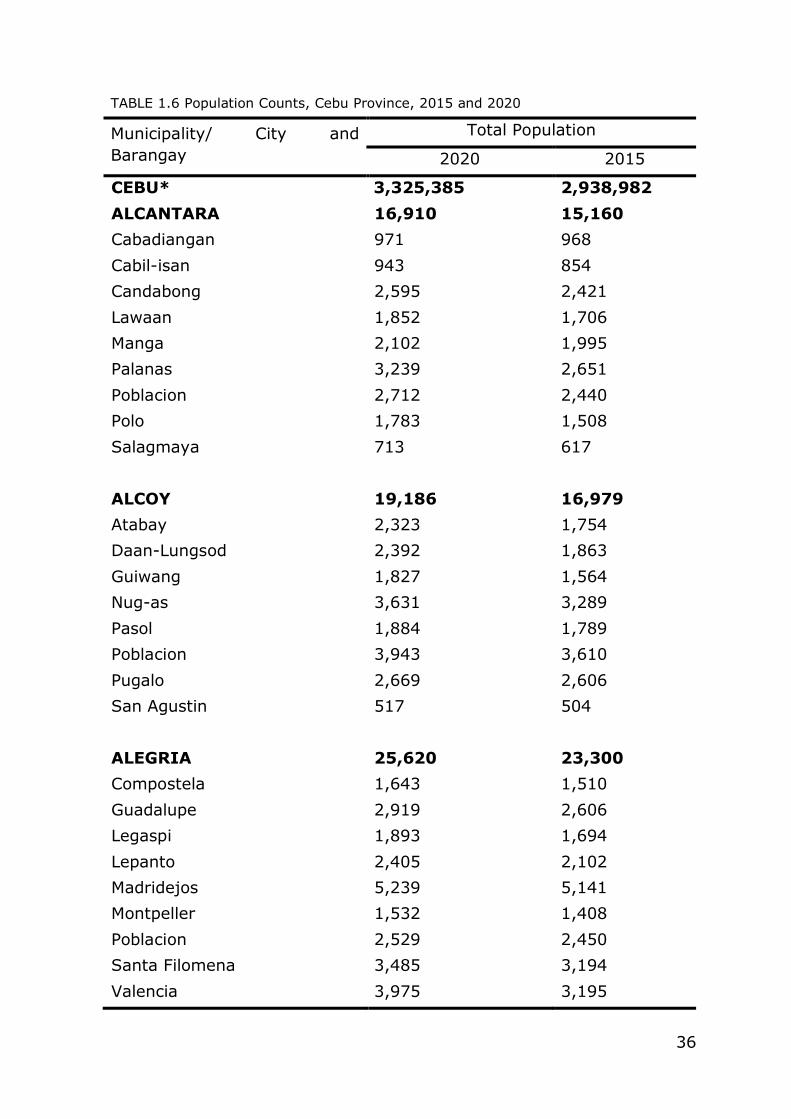
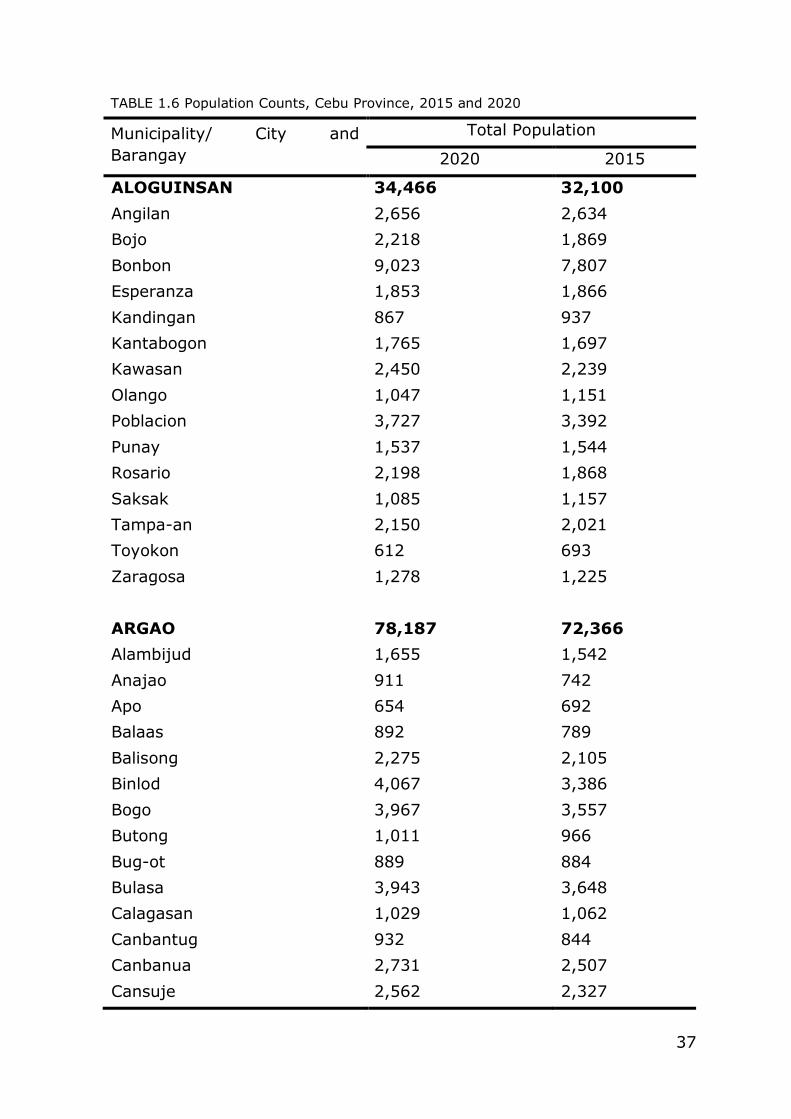
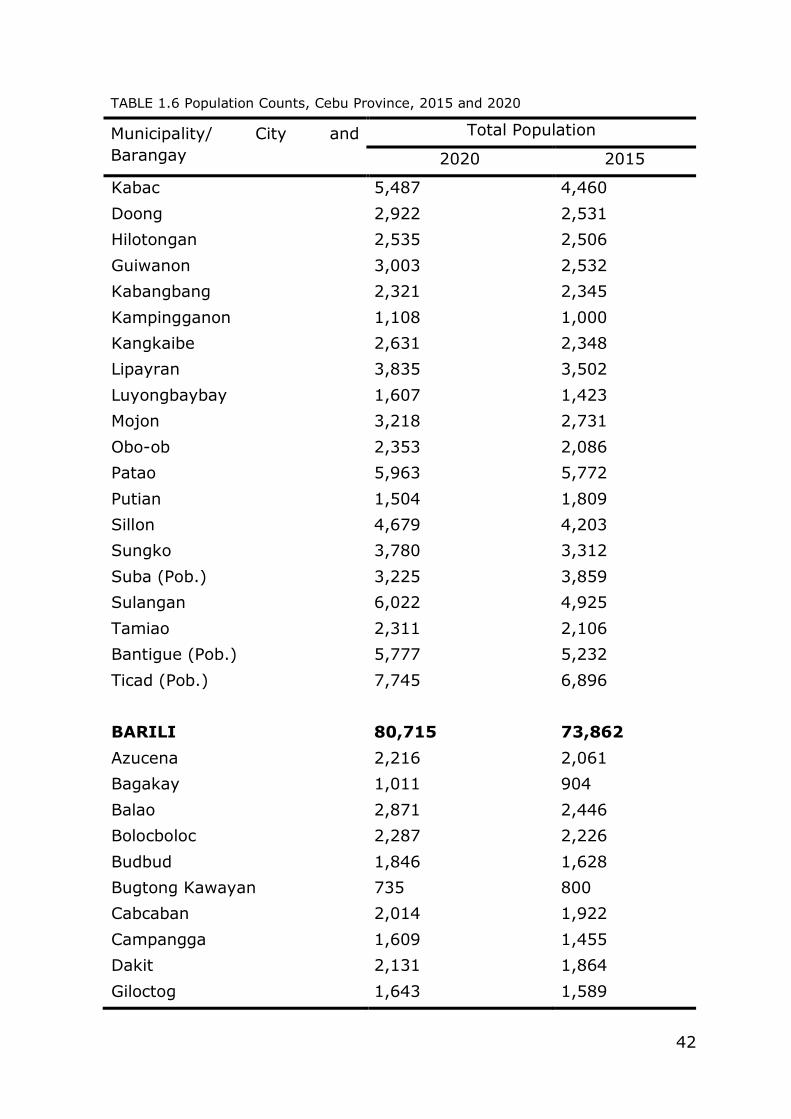
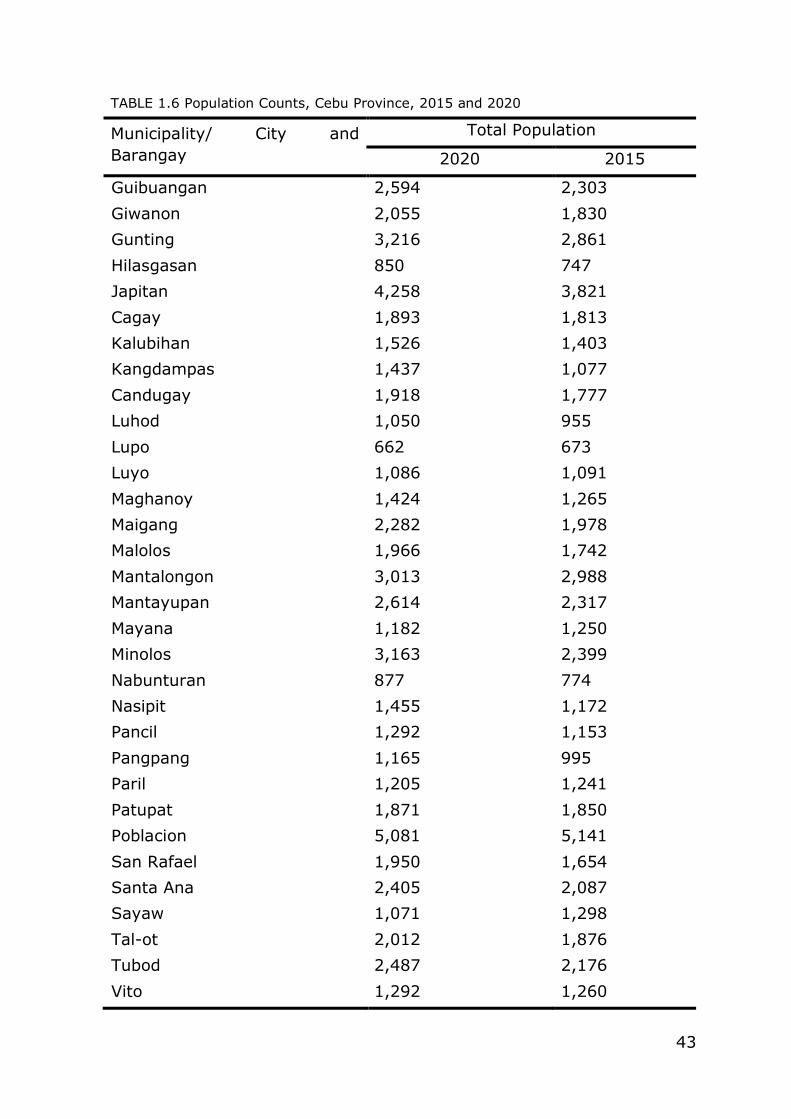
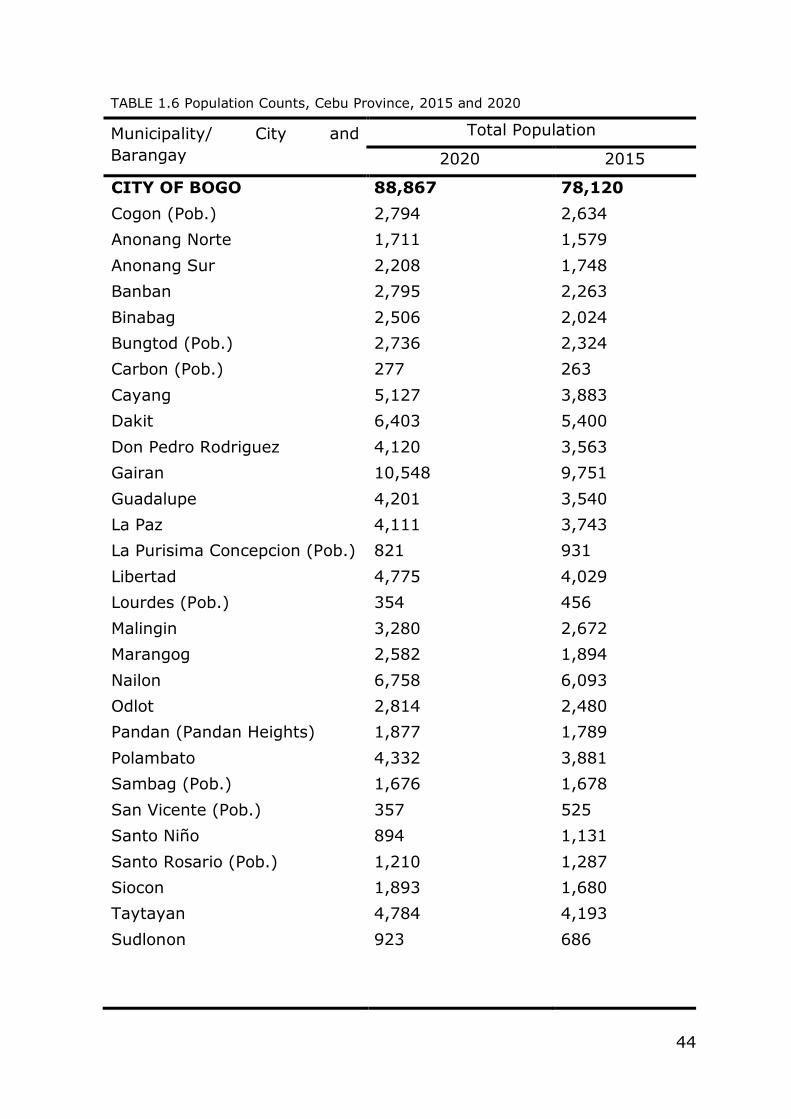
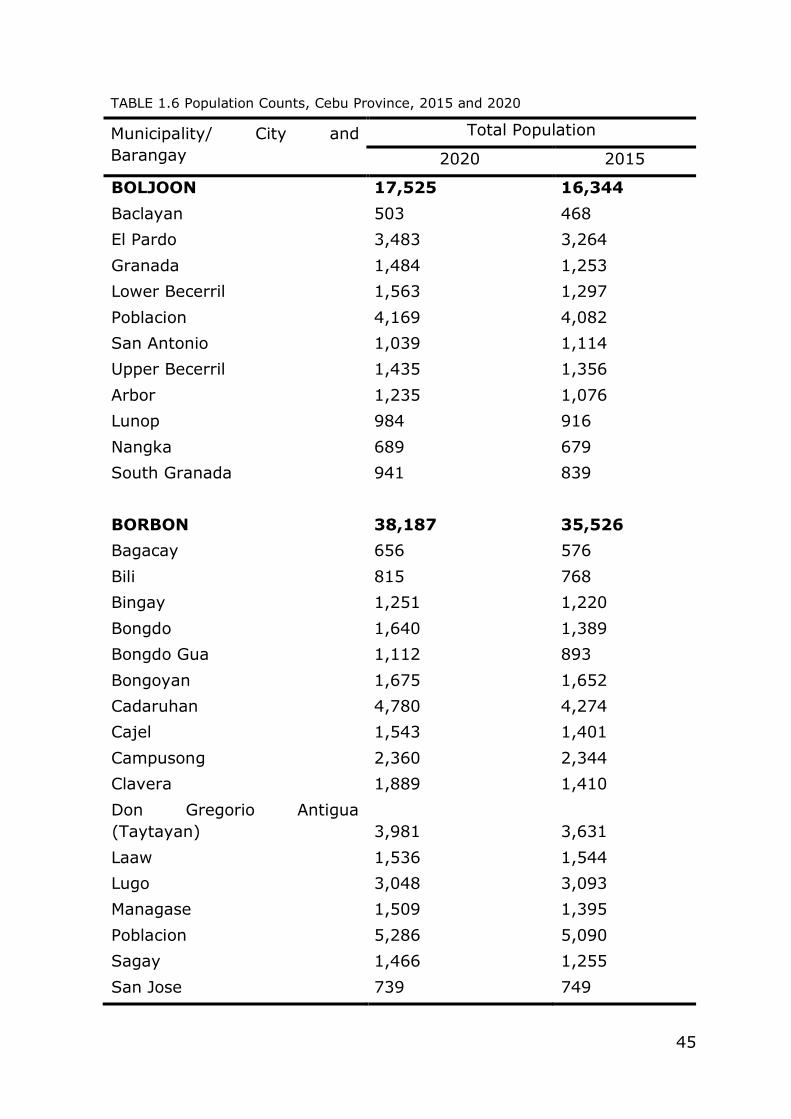
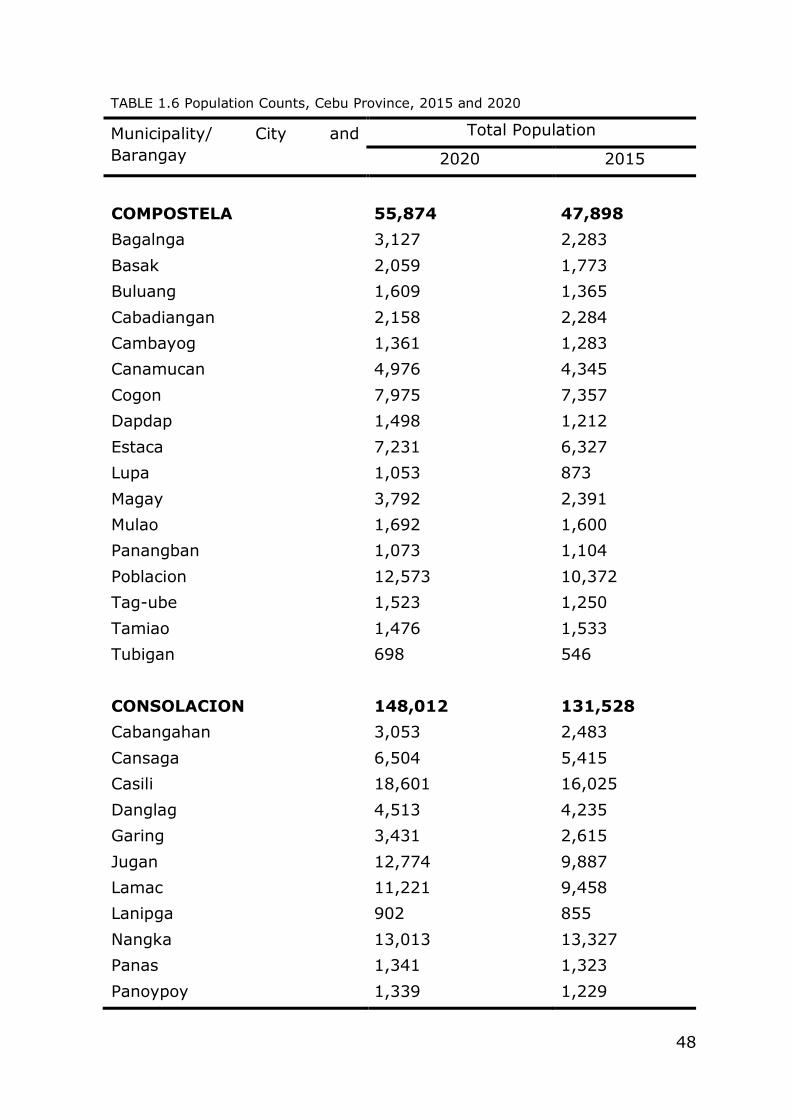
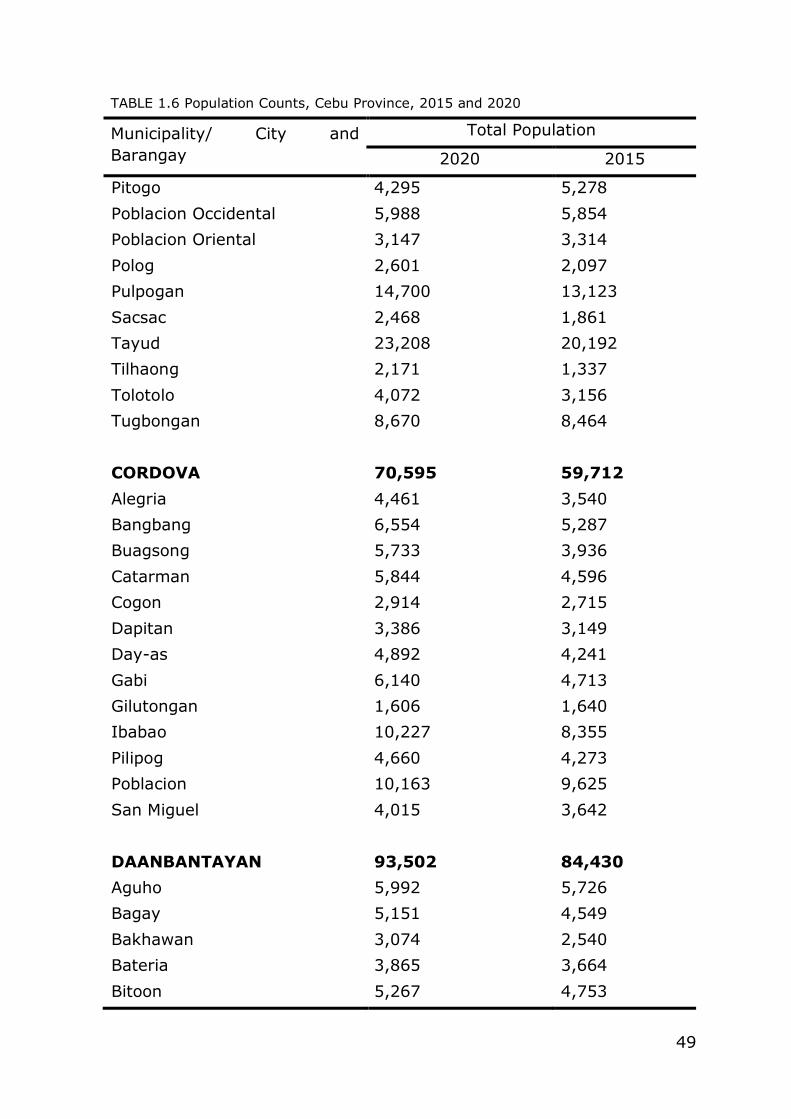
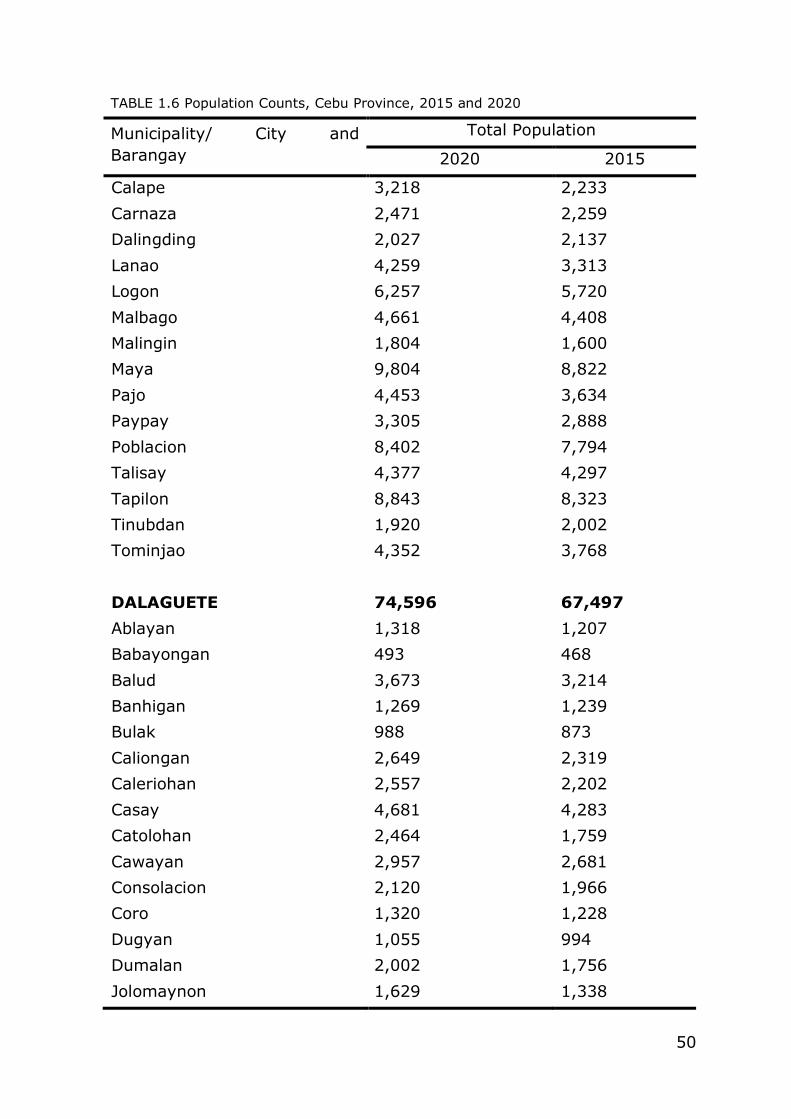
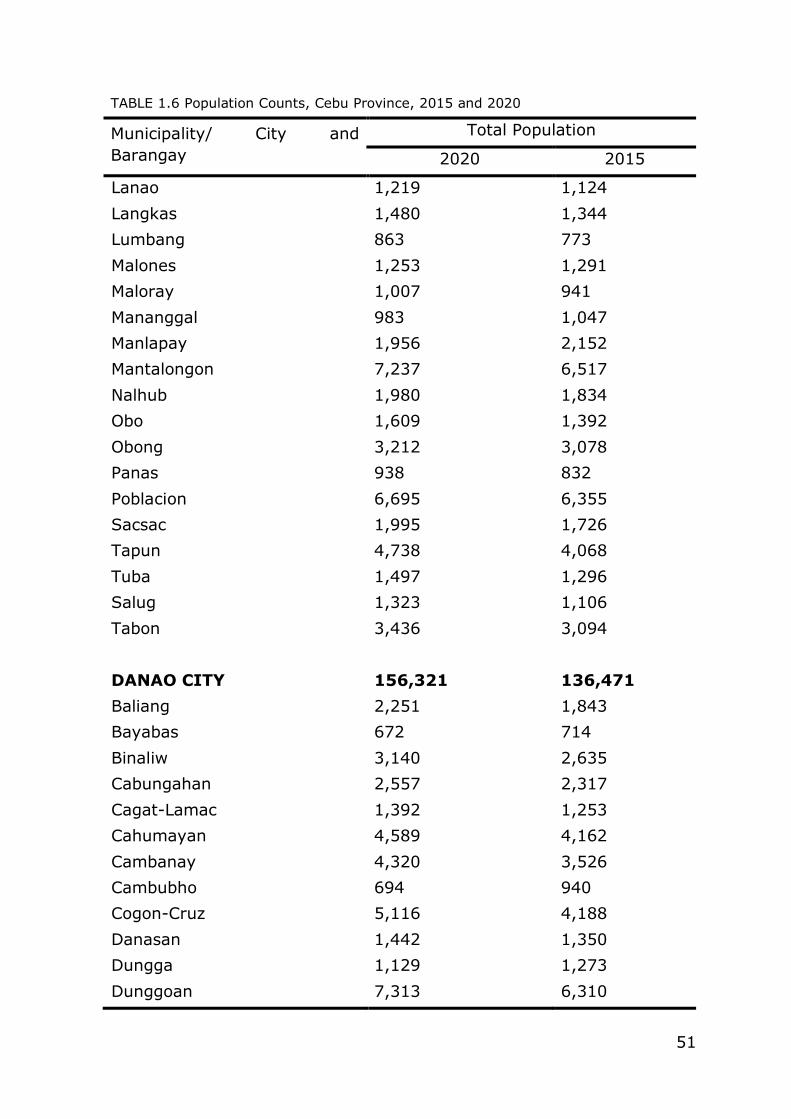
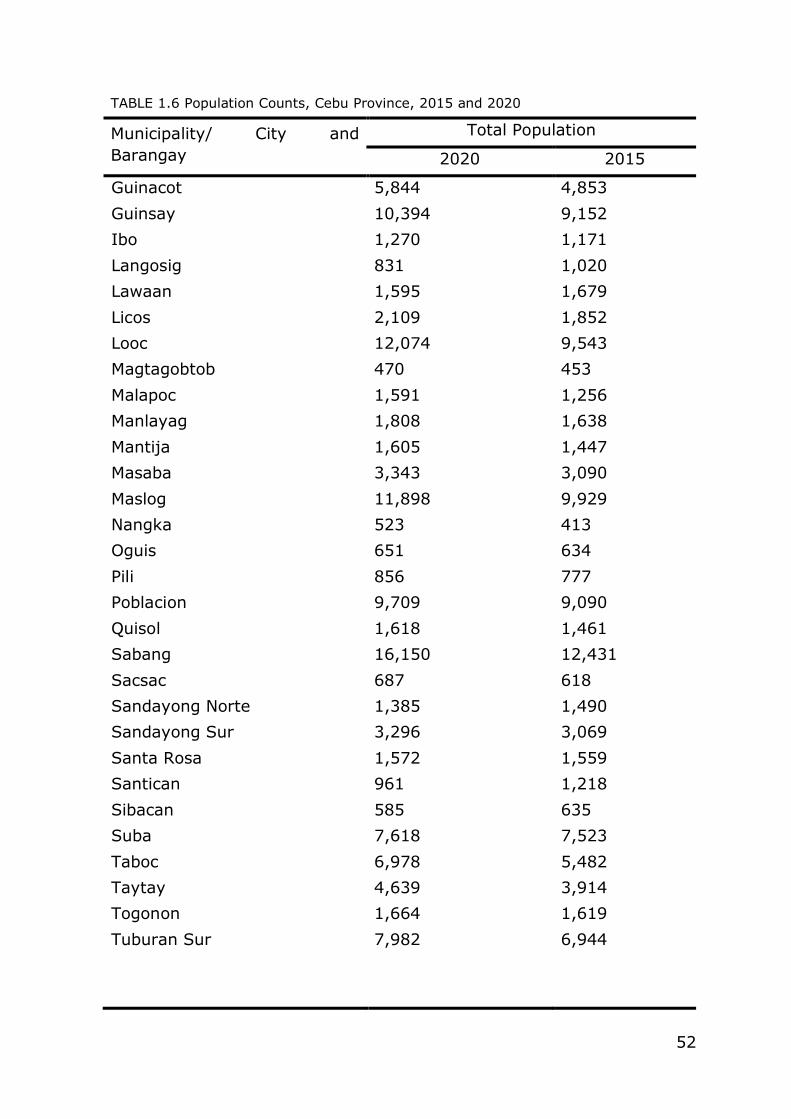
TABLE 1.6 Population Counts, Cebu Province, 2015 and 2020
Municipality/ City and
Barangay
Total Population
2020 2015
CEBU* 3,325,385 2,938,982
ALCANTARA 16,910 15,160
Cabadiangan 971 968
Cabil-isan 943 854
Candabong 2,595 2,421
Lawaan 1,852 1,706
Manga 2,102 1,995
Palanas 3,239 2,651
Poblacion 2,712 2,440
Polo 1,783 1,508
Salagmaya 713 617
ALCOY 19,186 16,979
Atabay 2,323 1,754
Daan-Lungsod 2,392 1,863
Guiwang 1,827 1,564
Nug-as 3,631 3,289
Pasol 1,884 1,789
Poblacion 3,943 3,610
Pugalo 2,669 2,606
San Agustin 517 504
ALEGRIA 25,620 23,300
Compostela 1,643 1,510
Guadalupe 2,919 2,606
Legaspi 1,893 1,694
Lepanto 2,405 2,102
Madridejos 5,239 5,141
Montpeller 1,532 1,408
Poblacion 2,529 2,450
Santa Filomena 3,485 3,194
Valencia 3,975 3,195
37
TABLE 1.6 Population Counts, Cebu Province, 2015 and 2020
Municipality/ City and
Barangay
Total Population
2020 2015
ALOGUINSAN 34,466 32,100
Angilan 2,656 2,634
Bojo 2,218 1,869
Bonbon 9,023 7,807
Esperanza 1,853 1,866
Kandingan 867 937
Kantabogon 1,765 1,697
Kawasan 2,450 2,239
Olango 1,047 1,151
Poblacion 3,727 3,392
Punay 1,537 1,544
Rosario 2,198 1,868
Saksak 1,085 1,157
Tampa-an 2,150 2,021
Toyokon 612 693
Zaragosa 1,278 1,225
ARGAO 78,187 72,366
Alambijud 1,655 1,542
Anajao 911 742
Apo 654 692
Balaas 892 789
Balisong 2,275 2,105
Binlod 4,067 3,386
Bogo 3,967 3,557
Butong 1,011 966
Bug-ot 889 884
Bulasa 3,943 3,648
Calagasan 1,029 1,062
Canbantug 932 844
Canbanua 2,731 2,507
Cansuje 2,562 2,327
38
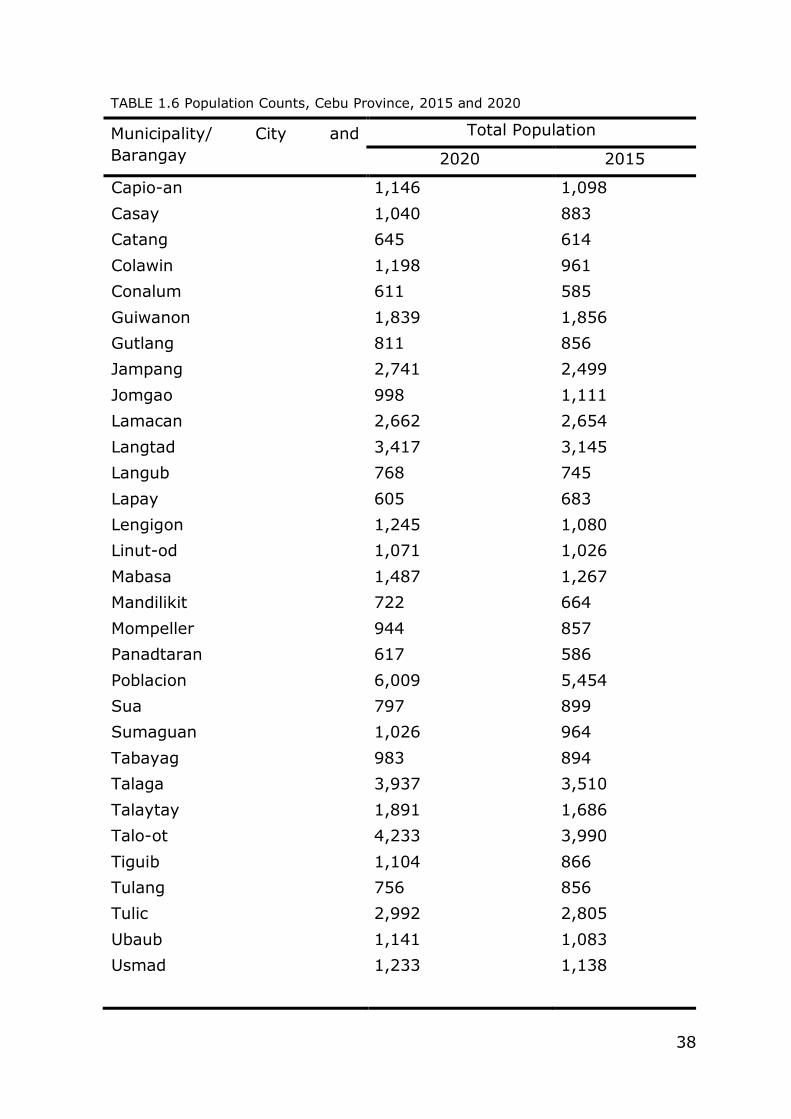
TABLE 1.6 Population Counts, Cebu Province, 2015 and 2020
Municipality/ City and
Barangay
Total Population
2020 2015
Capio-an 1,146 1,098
Casay 1,040 883
Catang 645 614
Colawin 1,198 961
Conalum 611 585
Guiwanon 1,839 1,856
Gutlang 811 856
Jampang 2,741 2,499
Jomgao 998 1,111
Lamacan 2,662 2,654
Langtad 3,417 3,145
Langub 768 745
Lapay 605 683
Lengigon 1,245 1,080
Linut-od 1,071 1,026
Mabasa 1,487 1,267
Mandilikit 722 664
Mompeller 944 857
Panadtaran 617 586
Poblacion 6,009 5,454
Sua 797 899
Sumaguan 1,026 964
Tabayag 983 894
Talaga 3,937 3,510
Talaytay 1,891 1,686
Talo-ot 4,233 3,990
Tiguib 1,104 866
Tulang 756 856
Tulic 2,992 2,805
Ubaub 1,141 1,083
Usmad 1,233 1,138
39
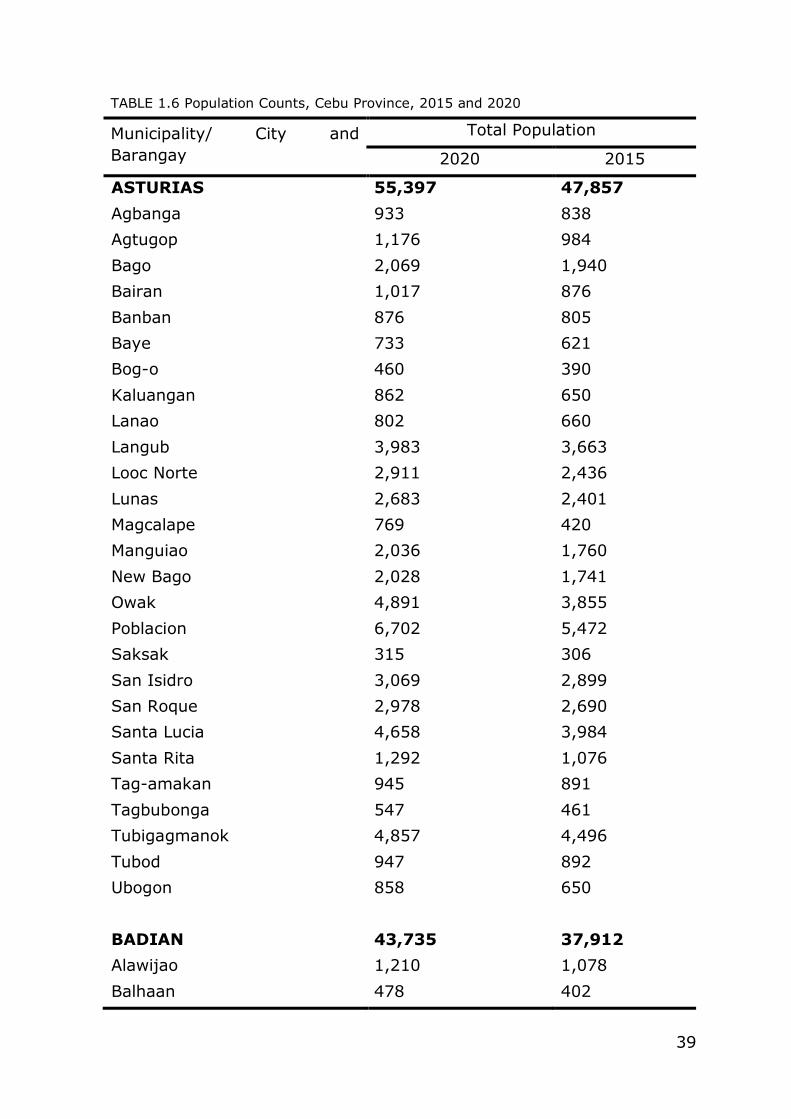
TABLE 1.6 Population Counts, Cebu Province, 2015 and 2020
Municipality/ City and
Barangay
Total Population
2020 2015
ASTURIAS 55,397 47,857
Agbanga 933 838
Agtugop 1,176 984
Bago 2,069 1,940
Bairan 1,017 876
Banban 876 805
Baye 733 621
Bog-o 460 390
Kaluangan 862 650
Lanao 802 660
Langub 3,983 3,663
Looc Norte 2,911 2,436
Lunas 2,683 2,401
Magcalape 769 420
Manguiao 2,036 1,760
New Bago 2,028 1,741
Owak 4,891 3,855
Poblacion 6,702 5,472
Saksak 315 306
San Isidro 3,069 2,899
San Roque 2,978 2,690
Santa Lucia 4,658 3,984
Santa Rita 1,292 1,076
Tag-amakan 945 891
Tagbubonga 547 461
Tubigagmanok 4,857 4,496
Tubod 947 892
Ubogon 858 650
BADIAN 43,735 37,912
Alawijao 1,210 1,078
Balhaan 478 402

40
TABLE 1.6 Population Counts, Cebu Province, 2015 and 2020
Municipality/ City and
Barangay
Total Population
2020 2015
Banhigan 3,041 2,596
Basak 1,704 1,487
Basiao 1,086 983
Bato 1,304 1,166
Bugas 3,199 2,666
Calangcang 624 521
Candiis 1,235 1,086
Dagatan 1,492 1,351
Dobdob 1,236 1,026
Ginablan 660 608
Lambug 1,707 1,469
Malabago 1,067 954
Malhiao 3,790 2,966
Manduyong 1,797 1,668
Matutinao 1,008 904
Patong 958 820
Poblacion 4,291 4,092
Sanlagan 985 782
Santicon 671 530
Sohoton 1,153 1,125
Sulsugan 575 417
Talayong 955 909
Taytay 2,544 2,099
Tigbao 1,016 874
Tiguib 560 487
Tubod 1,331 1,144
Zaragosa 2,058 1,702
BALAMBAN 95,136 87,177
Abucayan 6,111 5,315
Aliwanay 2,862 3,277
Arpili 6,977 6,312
41
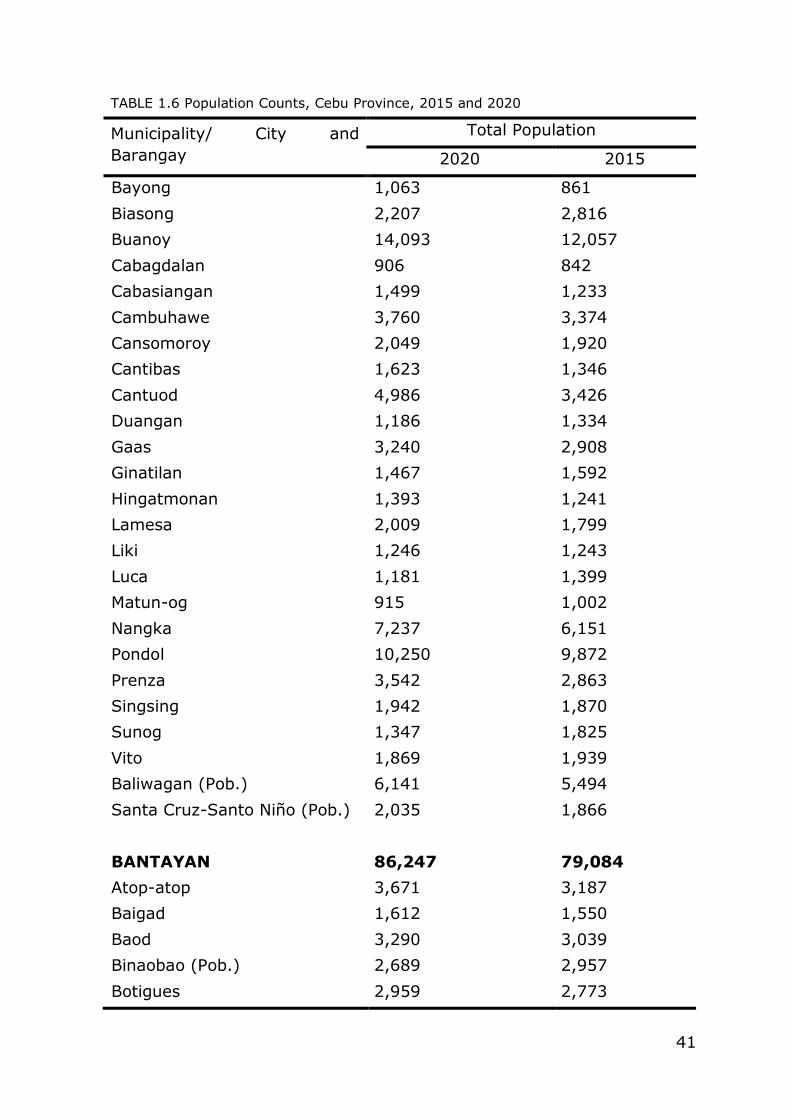
TABLE 1.6 Population Counts, Cebu Province, 2015 and 2020
Municipality/ City and
Barangay
Total Population
2020 2015
Bayong 1,063 861
Biasong 2,207 2,816
Buanoy 14,093 12,057
Cabagdalan 906 842
Cabasiangan 1,499 1,233
Cambuhawe 3,760 3,374
Cansomoroy 2,049 1,920
Cantibas 1,623 1,346
Cantuod 4,986 3,426
Duangan 1,186 1,334
Gaas 3,240 2,908
Ginatilan 1,467 1,592
Hingatmonan 1,393 1,241
Lamesa 2,009 1,799
Liki 1,246 1,243
Luca 1,181 1,399
Matun-og 915 1,002
Nangka 7,237 6,151
Pondol 10,250 9,872
Prenza 3,542 2,863
Singsing 1,942 1,870
Sunog 1,347 1,825
Vito 1,869 1,939
Baliwagan (Pob.) 6,141 5,494
Santa Cruz-Santo Niño (Pob.) 2,035 1,866
BANTAYAN 86,247 79,084
Atop-atop 3,671 3,187
Baigad 1,612 1,550
Baod 3,290 3,039
Binaobao (Pob.) 2,689 2,957
Botigues 2,959 2,773
42
TABLE 1.6 Population Counts, Cebu Province, 2015 and 2020
Municipality/ City and
Barangay
Total Population
2020 2015
Kabac 5,487 4,460
Doong 2,922 2,531
Hilotongan 2,535 2,506
Guiwanon 3,003 2,532
Kabangbang 2,321 2,345
Kampingganon 1,108 1,000
Kangkaibe 2,631 2,348
Lipayran 3,835 3,502
Luyongbaybay 1,607 1,423
Mojon 3,218 2,731
Obo-ob 2,353 2,086
Patao 5,963 5,772
Putian 1,504 1,809
Sillon 4,679 4,203
Sungko 3,780 3,312
Suba (Pob.) 3,225 3,859
Sulangan 6,022 4,925
Tamiao 2,311 2,106
Bantigue (Pob.) 5,777 5,232
Ticad (Pob.) 7,745 6,896
BARILI 80,715 73,862
Azucena 2,216 2,061
Bagakay 1,011 904
Balao 2,871 2,446
Bolocboloc 2,287 2,226
Budbud 1,846 1,628
Bugtong Kawayan 735 800
Cabcaban 2,014 1,922
Campangga 1,609 1,455
Dakit 2,131 1,864
Giloctog 1,643 1,589
43
TABLE 1.6 Population Counts, Cebu Province, 2015 and 2020
Municipality/ City and
Barangay
Total Population
2020 2015
Guibuangan 2,594 2,303
Giwanon 2,055 1,830
Gunting 3,216 2,861
Hilasgasan 850 747
Japitan 4,258 3,821
Cagay 1,893 1,813
Kalubihan 1,526 1,403
Kangdampas 1,437 1,077
Candugay 1,918 1,777
Luhod 1,050 955
Lupo 662 673
Luyo 1,086 1,091
Maghanoy 1,424 1,265
Maigang 2,282 1,978
Malolos 1,966 1,742
Mantalongon 3,013 2,988
Mantayupan 2,614 2,317
Mayana 1,182 1,250
Minolos 3,163 2,399
Nabunturan 877 774
Nasipit 1,455 1,172
Pancil 1,292 1,153
Pangpang 1,165 995
Paril 1,205 1,241
Patupat 1,871 1,850
Poblacion 5,081 5,141
San Rafael 1,950 1,654
Santa Ana 2,405 2,087
Sayaw 1,071 1,298
Tal-ot 2,012 1,876
Tubod 2,487 2,176
Vito 1,292 1,260
44
TABLE 1.6 Population Counts, Cebu Province, 2015 and 2020
Municipality/ City and
Barangay
Total Population
2020 2015
CITY OF BOGO 88,867 78,120
Cogon (Pob.) 2,794 2,634
Anonang Norte 1,711 1,579
Anonang Sur 2,208 1,748
Banban 2,795 2,263
Binabag 2,506 2,024
Bungtod (Pob.) 2,736 2,324
Carbon (Pob.) 277 263
Cayang 5,127 3,883
Dakit 6,403 5,400
Don Pedro Rodriguez 4,120 3,563
Gairan 10,548 9,751
Guadalupe 4,201 3,540
La Paz 4,111 3,743
La Purisima Concepcion (Pob.) 821 931
Libertad 4,775 4,029
Lourdes (Pob.) 354 456
Malingin 3,280 2,672
Marangog 2,582 1,894
Nailon 6,758 6,093
Odlot 2,814 2,480
Pandan (Pandan Heights) 1,877 1,789
Polambato 4,332 3,881
Sambag (Pob.) 1,676 1,678
San Vicente (Pob.) 357 525
Santo Niño 894 1,131
Santo Rosario (Pob.) 1,210 1,287
Siocon 1,893 1,680
Taytayan 4,784 4,193
Sudlonon 923 686
45
TABLE 1.6 Population Counts, Cebu Province, 2015 and 2020
Municipality/ City and
Barangay
Total Population
2020 2015
BOLJOON 17,525 16,344
Baclayan 503 468
El Pardo 3,483 3,264
Granada 1,484 1,253
Lower Becerril 1,563 1,297
Poblacion 4,169 4,082
San Antonio 1,039 1,114
Upper Becerril 1,435 1,356
Arbor 1,235 1,076
Lunop 984 916
Nangka 689 679
South Granada 941 839
BORBON 38,187 35,526
Bagacay 656 576
Bili 815 768
Bingay 1,251 1,220
Bongdo 1,640 1,389
Bongdo Gua 1,112 893
Bongoyan 1,675 1,652
Cadaruhan 4,780 4,274
Cajel 1,543 1,401
Campusong 2,360 2,344
Clavera 1,889 1,410
Don Gregorio Antigua
(Taytayan) 3,981 3,631
Laaw 1,536 1,544
Lugo 3,048 3,093
Managase 1,509 1,395
Poblacion 5,286 5,090
Sagay 1,466 1,255
San Jose 739 749
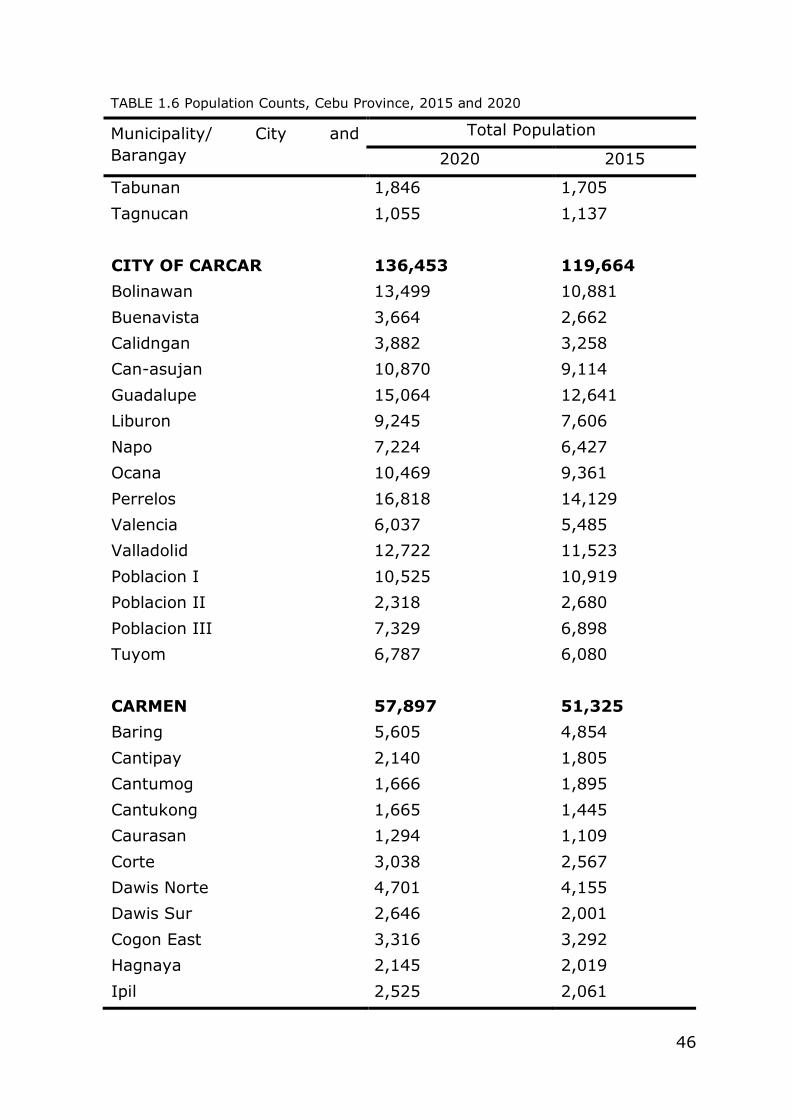
46
TABLE 1.6 Population Counts, Cebu Province, 2015 and 2020
Municipality/ City and
Barangay
Total Population
2020 2015
Tabunan 1,846 1,705
Tagnucan 1,055 1,137
CITY OF CARCAR 136,453 119,664
Bolinawan 13,499 10,881
Buenavista 3,664 2,662
Calidngan 3,882 3,258
Can-asujan 10,870 9,114
Guadalupe 15,064 12,641
Liburon 9,245 7,606
Napo 7,224 6,427
Ocana 10,469 9,361
Perrelos 16,818 14,129
Valencia 6,037 5,485
Valladolid 12,722 11,523
Poblacion I 10,525 10,919
Poblacion II 2,318 2,680
Poblacion III 7,329 6,898
Tuyom 6,787 6,080
CARMEN 57,897 51,325
Baring 5,605 4,854
Cantipay 2,140 1,805
Cantumog 1,666 1,895
Cantukong 1,665 1,445
Caurasan 1,294 1,109
Corte 3,038 2,567
Dawis Norte 4,701 4,155
Dawis Sur 2,646 2,001
Cogon East 3,316 3,292
Hagnaya 2,145 2,019
Ipil 2,525 2,061
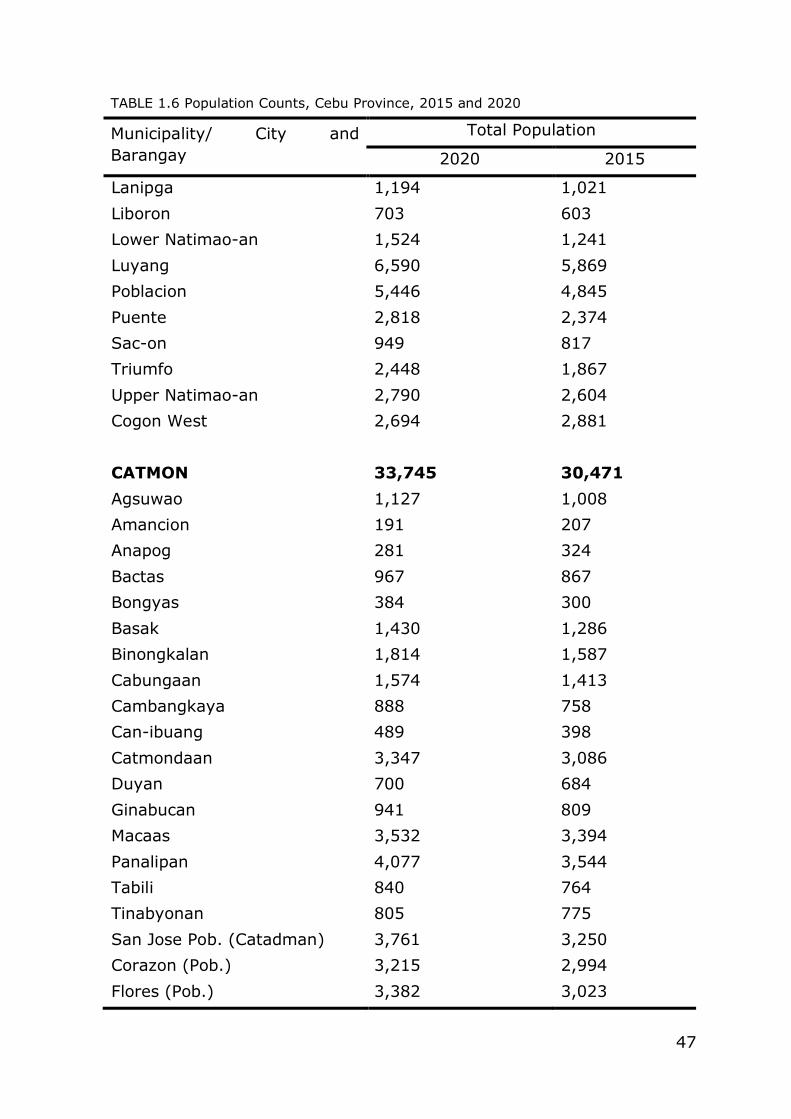
47
TABLE 1.6 Population Counts, Cebu Province, 2015 and 2020
Municipality/ City and
Barangay
Total Population
2020 2015
Lanipga 1,194 1,021
Liboron 703 603
Lower Natimao-an 1,524 1,241
Luyang 6,590 5,869
Poblacion 5,446 4,845
Puente 2,818 2,374
Sac-on 949 817
Triumfo 2,448 1,867
Upper Natimao-an 2,790 2,604
Cogon West 2,694 2,881
CATMON 33,745 30,471
Agsuwao 1,127 1,008
Amancion 191 207
Anapog 281 324
Bactas 967 867
Bongyas 384 300
Basak 1,430 1,286
Binongkalan 1,814 1,587
Cabungaan 1,574 1,413
Cambangkaya 888 758
Can-ibuang 489 398
Catmondaan 3,347 3,086
Duyan 700 684
Ginabucan 941 809
Macaas 3,532 3,394
Panalipan 4,077 3,544
Tabili 840 764
Tinabyonan 805 775
San Jose Pob. (Catadman) 3,761 3,250
Corazon (Pob.) 3,215 2,994
Flores (Pob.) 3,382 3,023
48
TABLE 1.6 Population Counts, Cebu Province, 2015 and 2020
Municipality/ City and
Barangay
Total Population
2020 2015
COMPOSTELA 55,874 47,898
Bagalnga 3,127 2,283
Basak 2,059 1,773
Buluang 1,609 1,365
Cabadiangan 2,158 2,284
Cambayog 1,361 1,283
Canamucan 4,976 4,345
Cogon 7,975 7,357
Dapdap 1,498 1,212
Estaca 7,231 6,327
Lupa 1,053 873
Magay 3,792 2,391
Mulao 1,692 1,600
Panangban 1,073 1,104
Poblacion 12,573 10,372
Tag-ube 1,523 1,250
Tamiao 1,476 1,533
Tubigan 698 546
CONSOLACION 148,012 131,528
Cabangahan 3,053 2,483
Cansaga 6,504 5,415
Casili 18,601 16,025
Danglag 4,513 4,235
Garing 3,431 2,615
Jugan 12,774 9,887
Lamac 11,221 9,458
Lanipga 902 855
Nangka 13,013 13,327
Panas 1,341 1,323
Panoypoy 1,339 1,229
49
TABLE 1.6 Population Counts, Cebu Province, 2015 and 2020
Municipality/ City and
Barangay
Total Population
2020 2015
Pitogo 4,295 5,278
Poblacion Occidental 5,988 5,854
Poblacion Oriental 3,147 3,314
Polog 2,601 2,097
Pulpogan 14,700 13,123
Sacsac 2,468 1,861
Tayud 23,208 20,192
Tilhaong 2,171 1,337
Tolotolo 4,072 3,156
Tugbongan 8,670 8,464
CORDOVA 70,595 59,712
Alegria 4,461 3,540
Bangbang 6,554 5,287
Buagsong 5,733 3,936
Catarman 5,844 4,596
Cogon 2,914 2,715
Dapitan 3,386 3,149
Day-as 4,892 4,241
Gabi 6,140 4,713
Gilutongan 1,606 1,640
Ibabao 10,227 8,355
Pilipog 4,660 4,273
Poblacion 10,163 9,625
San Miguel 4,015 3,642
DAANBANTAYAN 93,502 84,430
Aguho 5,992 5,726
Bagay 5,151 4,549
Bakhawan 3,074 2,540
Bateria 3,865 3,664
Bitoon 5,267 4,753
50
TABLE 1.6 Population Counts, Cebu Province, 2015 and 2020
Municipality/ City and
Barangay
Total Population
2020 2015
Calape 3,218 2,233
Carnaza 2,471 2,259
Dalingding 2,027 2,137
Lanao 4,259 3,313
Logon 6,257 5,720
Malbago 4,661 4,408
Malingin 1,804 1,600
Maya 9,804 8,822
Pajo 4,453 3,634
Paypay 3,305 2,888
Poblacion 8,402 7,794
Talisay 4,377 4,297
Tapilon 8,843 8,323
Tinubdan 1,920 2,002
Tominjao 4,352 3,768
DALAGUETE 74,596 67,497
Ablayan 1,318 1,207
Babayongan 493 468
Balud 3,673 3,214
Banhigan 1,269 1,239
Bulak 988 873
Caliongan 2,649 2,319
Caleriohan 2,557 2,202
Casay 4,681 4,283
Catolohan 2,464 1,759
Cawayan 2,957 2,681
Consolacion 2,120 1,966
Coro 1,320 1,228
Dugyan 1,055 994
Dumalan 2,002 1,756
Jolomaynon 1,629 1,338
51
TABLE 1.6 Population Counts, Cebu Province, 2015 and 2020
Municipality/ City and
Barangay
Total Population
2020 2015
Lanao 1,219 1,124
Langkas 1,480 1,344
Lumbang 863 773
Malones 1,253 1,291
Maloray 1,007 941
Mananggal 983 1,047
Manlapay 1,956 2,152
Mantalongon 7,237 6,517
Nalhub 1,980 1,834
Obo 1,609 1,392
Obong 3,212 3,078
Panas 938 832
Poblacion 6,695 6,355
Sacsac 1,995 1,726
Tapun 4,738 4,068
Tuba 1,497 1,296
Salug 1,323 1,106
Tabon 3,436 3,094
DANAO CITY 156,321 136,471
Baliang 2,251 1,843
Bayabas 672 714
Binaliw 3,140 2,635
Cabungahan 2,557 2,317
Cagat-Lamac 1,392 1,253
Cahumayan 4,589 4,162
Cambanay 4,320 3,526
Cambubho 694 940
Cogon-Cruz 5,116 4,188
Danasan 1,442 1,350
Dungga 1,129 1,273
Dunggoan 7,313 6,310
52
TABLE 1.6 Population Counts, Cebu Province, 2015 and 2020
Municipality/ City and
Barangay
Total Population
2020 2015
Guinacot 5,844 4,853
Guinsay 10,394 9,152
Ibo 1,270 1,171
Langosig 831 1,020
Lawaan 1,595 1,679
Licos 2,109 1,852
Looc 12,074 9,543
Magtagobtob 470 453
Malapoc 1,591 1,256
Manlayag 1,808 1,638
Mantija 1,605 1,447
Masaba 3,343 3,090
Maslog 11,898 9,929
Nangka 523 413
Oguis 651 634
Pili 856 777
Poblacion 9,709 9,090
Quisol 1,618 1,461
Sabang 16,150 12,431
Sacsac 687 618
Sandayong Norte 1,385 1,490
Sandayong Sur 3,296 3,069
Santa Rosa 1,572 1,559
Santican 961 1,218
Sibacan 585 635
Suba 7,618 7,523
Taboc 6,978 5,482
Taytay 4,639 3,914
Togonon 1,664 1,619
Tuburan Sur 7,982 6,944
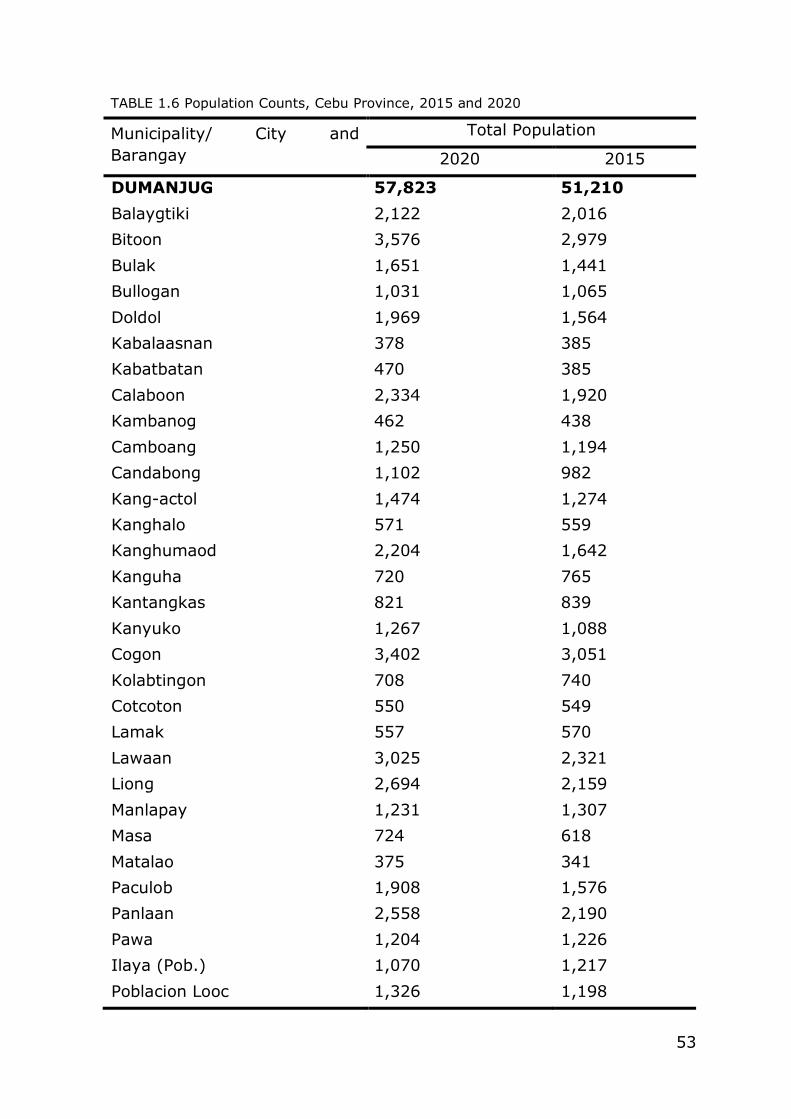
53
TABLE 1.6 Population Counts, Cebu Province, 2015 and 2020
Municipality/ City and
Barangay
Total Population
2020 2015
DUMANJUG 57,823 51,210
Balaygtiki 2,122 2,016
Bitoon 3,576 2,979
Bulak 1,651 1,441
Bullogan 1,031 1,065
Doldol 1,969 1,564
Kabalaasnan 378 385
Kabatbatan 470 385
Calaboon 2,334 1,920
Kambanog 462 438
Camboang 1,250 1,194
Candabong 1,102 982
Kang-actol 1,474 1,274
Kanghalo 571 559
Kanghumaod 2,204 1,642
Kanguha 720 765
Kantangkas 821 839
Kanyuko 1,267 1,088
Cogon 3,402 3,051
Kolabtingon 708 740
Cotcoton 550 549
Lamak 557 570
Lawaan 3,025 2,321
Liong 2,694 2,159
Manlapay 1,231 1,307
Masa 724 618
Matalao 375 341
Paculob 1,908 1,576
Panlaan 2,558 2,190
Pawa 1,204 1,226
Ilaya (Pob.) 1,070 1,217
Poblacion Looc 1,326 1,198
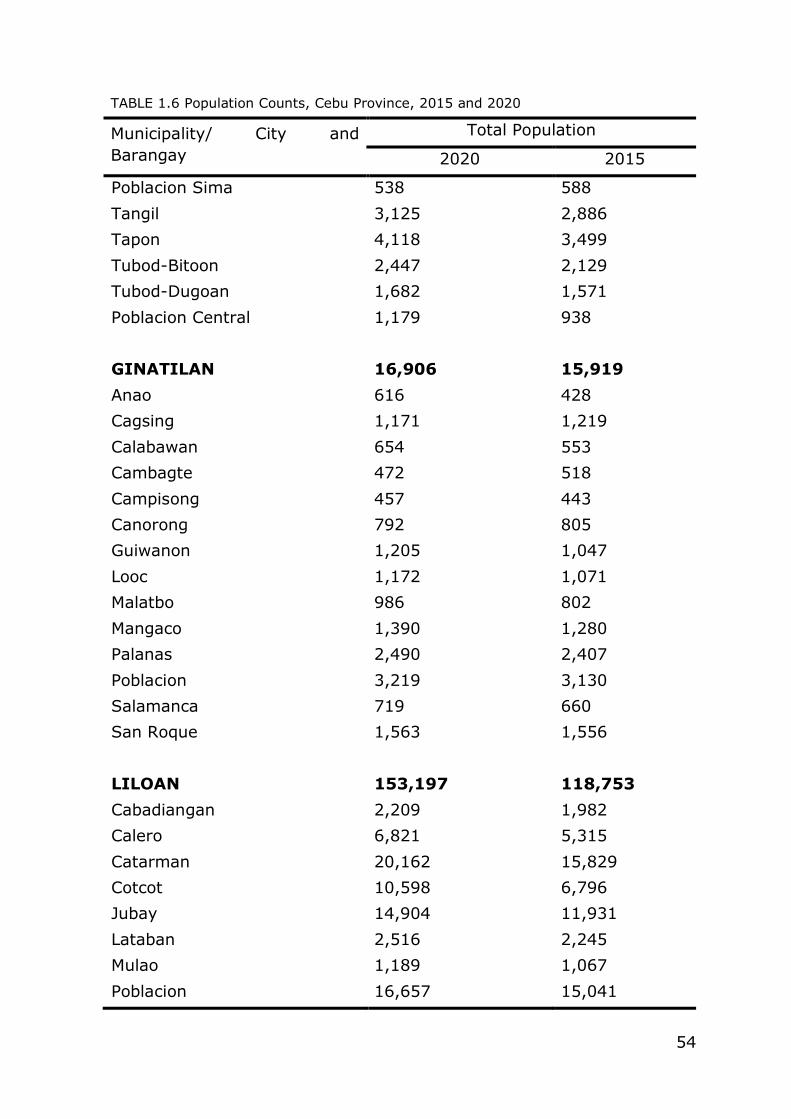
54
TABLE 1.6 Population Counts, Cebu Province, 2015 and 2020
Municipality/ City and
Barangay
Total Population
2020 2015
Poblacion Sima 538 588
Tangil 3,125 2,886
Tapon 4,118 3,499
Tubod-Bitoon 2,447 2,129
Tubod-Dugoan 1,682 1,571
Poblacion Central 1,179 938
GINATILAN 16,906 15,919
Anao 616 428
Cagsing 1,171 1,219
Calabawan 654 553
Cambagte 472 518
Campisong 457 443
Canorong 792 805
Guiwanon 1,205 1,047
Looc 1,172 1,071
Malatbo 986 802
Mangaco 1,390 1,280
Palanas 2,490 2,407
Poblacion 3,219 3,130
Salamanca 719 660
San Roque 1,563 1,556
LILOAN 153,197 118,753
Cabadiangan 2,209 1,982
Calero 6,821 5,315
Catarman 20,162 15,829
Cotcot 10,598 6,796
Jubay 14,904 11,931
Lataban 2,516 2,245
Mulao 1,189 1,067
Poblacion 16,657 15,041
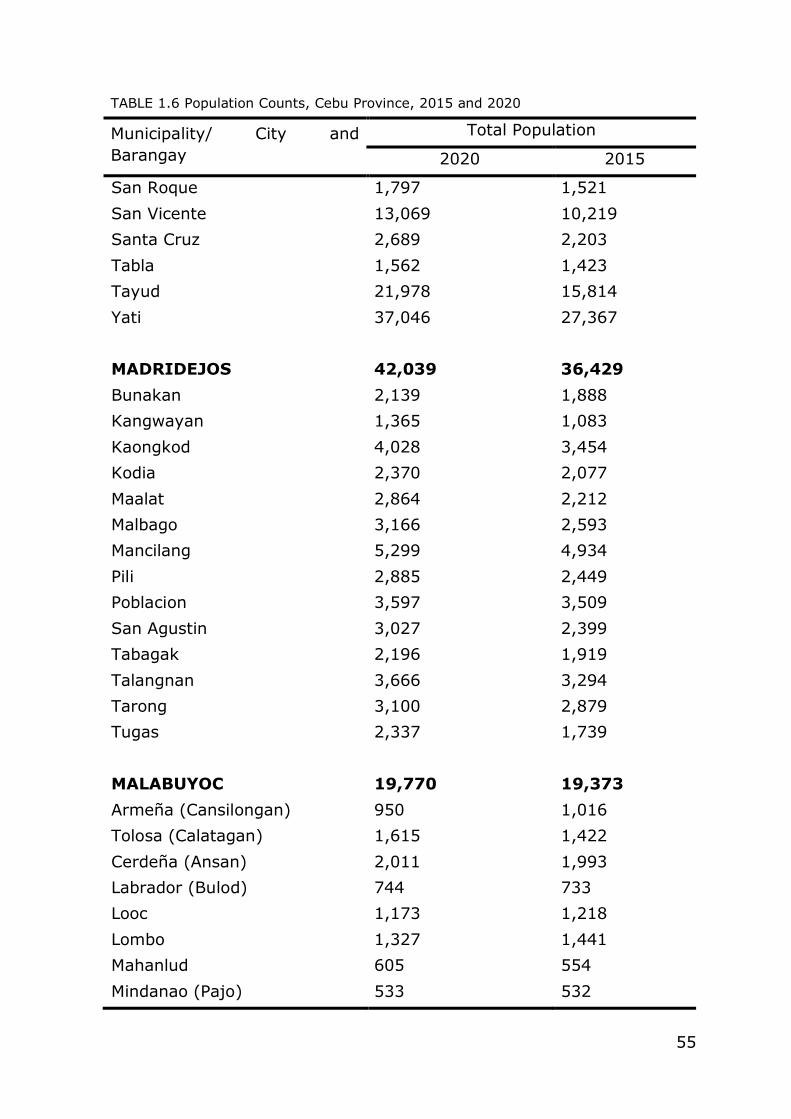
55
TABLE 1.6 Population Counts, Cebu Province, 2015 and 2020
Municipality/ City and
Barangay
Total Population
2020 2015
San Roque 1,797 1,521
San Vicente 13,069 10,219
Santa Cruz 2,689 2,203
Tabla 1,562 1,423
Tayud 21,978 15,814
Yati 37,046 27,367
MADRIDEJOS 42,039 36,429
Bunakan 2,139 1,888
Kangwayan 1,365 1,083
Kaongkod 4,028 3,454
Kodia 2,370 2,077
Maalat 2,864 2,212
Malbago 3,166 2,593
Mancilang 5,299 4,934
Pili 2,885 2,449
Poblacion 3,597 3,509
San Agustin 3,027 2,399
Tabagak 2,196 1,919
Talangnan 3,666 3,294
Tarong 3,100 2,879
Tugas 2,337 1,739
MALABUYOC 19,770 19,373
Armeña (Cansilongan) 950 1,016
Tolosa (Calatagan) 1,615 1,422
Cerdeña (Ansan) 2,011 1,993
Labrador (Bulod) 744 733
Looc 1,173 1,218
Lombo 1,327 1,441
Mahanlud 605 554
Mindanao (Pajo) 533 532
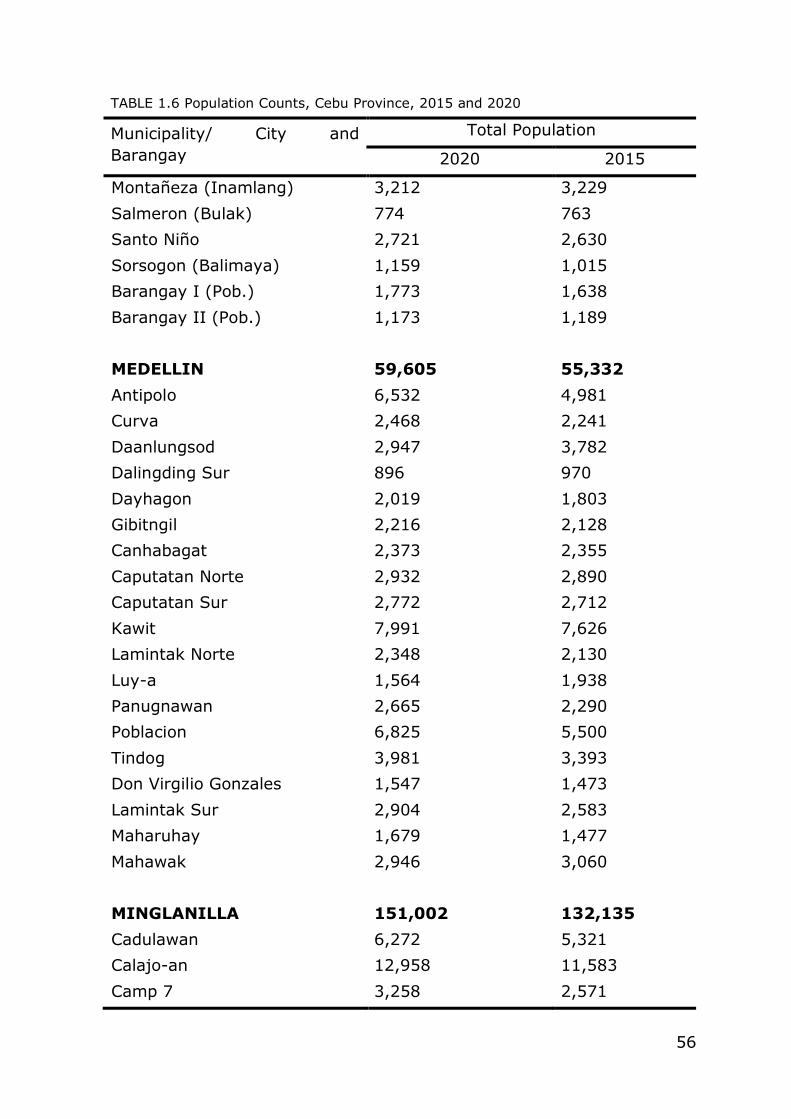
56
TABLE 1.6 Population Counts, Cebu Province, 2015 and 2020
Municipality/ City and
Barangay
Total Population
2020 2015
Montañeza (Inamlang) 3,212 3,229
Salmeron (Bulak) 774 763
Santo Niño 2,721 2,630
Sorsogon (Balimaya) 1,159 1,015
Barangay I (Pob.) 1,773 1,638
Barangay II (Pob.) 1,173 1,189
MEDELLIN 59,605 55,332
Antipolo 6,532 4,981
Curva 2,468 2,241
Daanlungsod 2,947 3,782
Dalingding Sur 896 970
Dayhagon 2,019 1,803
Gibitngil 2,216 2,128
Canhabagat 2,373 2,355
Caputatan Norte 2,932 2,890
Caputatan Sur 2,772 2,712
Kawit 7,991 7,626
Lamintak Norte 2,348 2,130
Luy-a 1,564 1,938
Panugnawan 2,665 2,290
Poblacion 6,825 5,500
Tindog 3,981 3,393
Don Virgilio Gonzales 1,547 1,473
Lamintak Sur 2,904 2,583
Maharuhay 1,679 1,477
Mahawak 2,946 3,060
MINGLANILLA 151,002 132,135
Cadulawan 6,272 5,321
Calajo-an 12,958 11,583
Camp 7 3,258 2,571
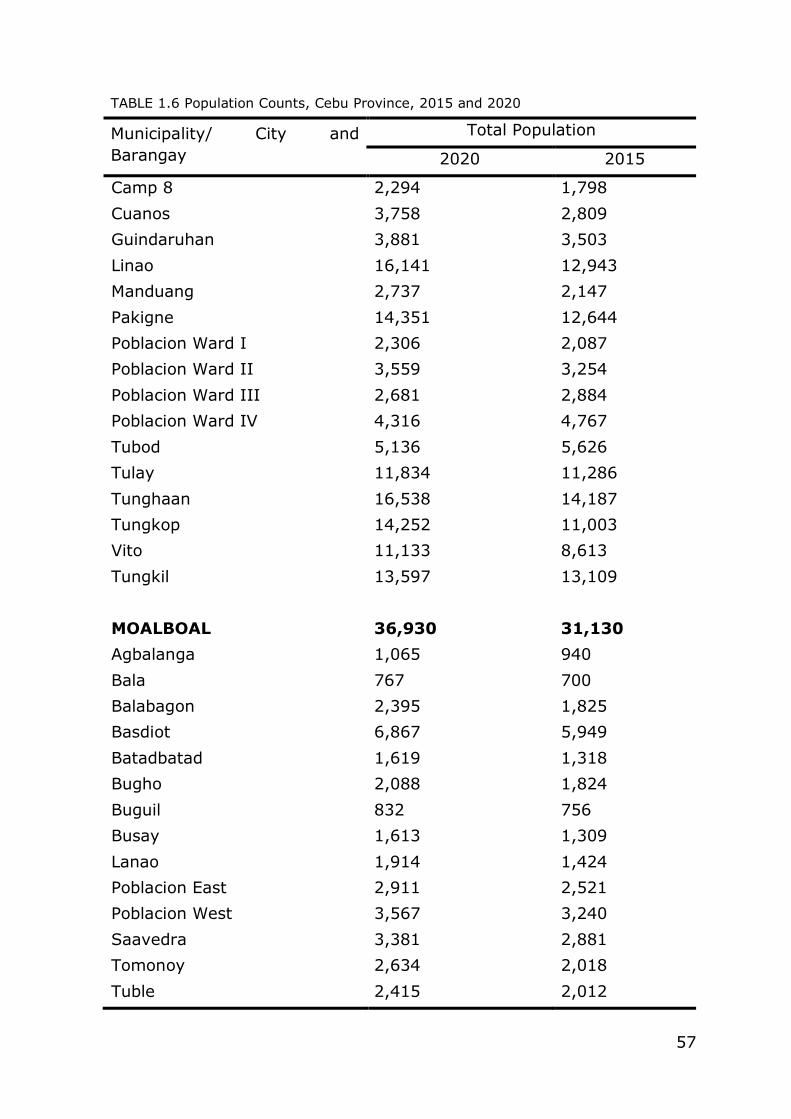
57
TABLE 1.6 Population Counts, Cebu Province, 2015 and 2020
Municipality/ City and
Barangay
Total Population
2020 2015
Camp 8 2,294 1,798
Cuanos 3,758 2,809
Guindaruhan 3,881 3,503
Linao 16,141 12,943
Manduang 2,737 2,147
Pakigne 14,351 12,644
Poblacion Ward I 2,306 2,087
Poblacion Ward II 3,559 3,254
Poblacion Ward III 2,681 2,884
Poblacion Ward IV 4,316 4,767
Tubod 5,136 5,626
Tulay 11,834 11,286
Tunghaan 16,538 14,187
Tungkop 14,252 11,003
Vito 11,133 8,613
Tungkil 13,597 13,109
MOALBOAL 36,930 31,130
Agbalanga 1,065 940
Bala 767 700
Balabagon 2,395 1,825
Basdiot 6,867 5,949
Batadbatad 1,619 1,318
Bugho 2,088 1,824
Buguil 832 756
Busay 1,613 1,309
Lanao 1,914 1,424
Poblacion East 2,911 2,521
Poblacion West 3,567 3,240
Saavedra 3,381 2,881
Tomonoy 2,634 2,018
Tuble 2,415 2,012
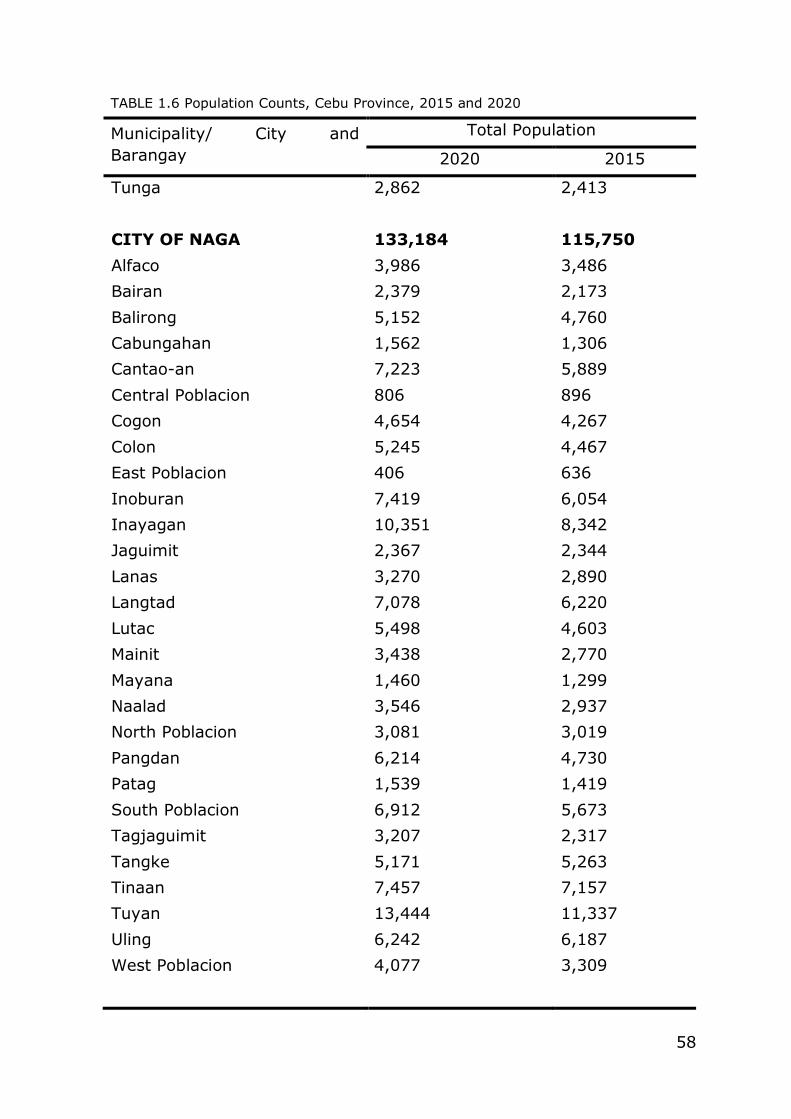
58
TABLE 1.6 Population Counts, Cebu Province, 2015 and 2020
Municipality/ City and
Barangay
Total Population
2020 2015
Tunga 2,862 2,413
CITY OF NAGA 133,184 115,750
Alfaco 3,986 3,486
Bairan 2,379 2,173
Balirong 5,152 4,760
Cabungahan 1,562 1,306
Cantao-an 7,223 5,889
Central Poblacion 806 896
Cogon 4,654 4,267
Colon 5,245 4,467
East Poblacion 406 636
Inoburan 7,419 6,054
Inayagan 10,351 8,342
Jaguimit 2,367 2,344
Lanas 3,270 2,890
Langtad 7,078 6,220
Lutac 5,498 4,603
Mainit 3,438 2,770
Mayana 1,460 1,299
Naalad 3,546 2,937
North Poblacion 3,081 3,019
Pangdan 6,214 4,730
Patag 1,539 1,419
South Poblacion 6,912 5,673
Tagjaguimit 3,207 2,317
Tangke 5,171 5,263
Tinaan 7,457 7,157
Tuyan 13,444 11,337
Uling 6,242 6,187
West Poblacion 4,077 3,309
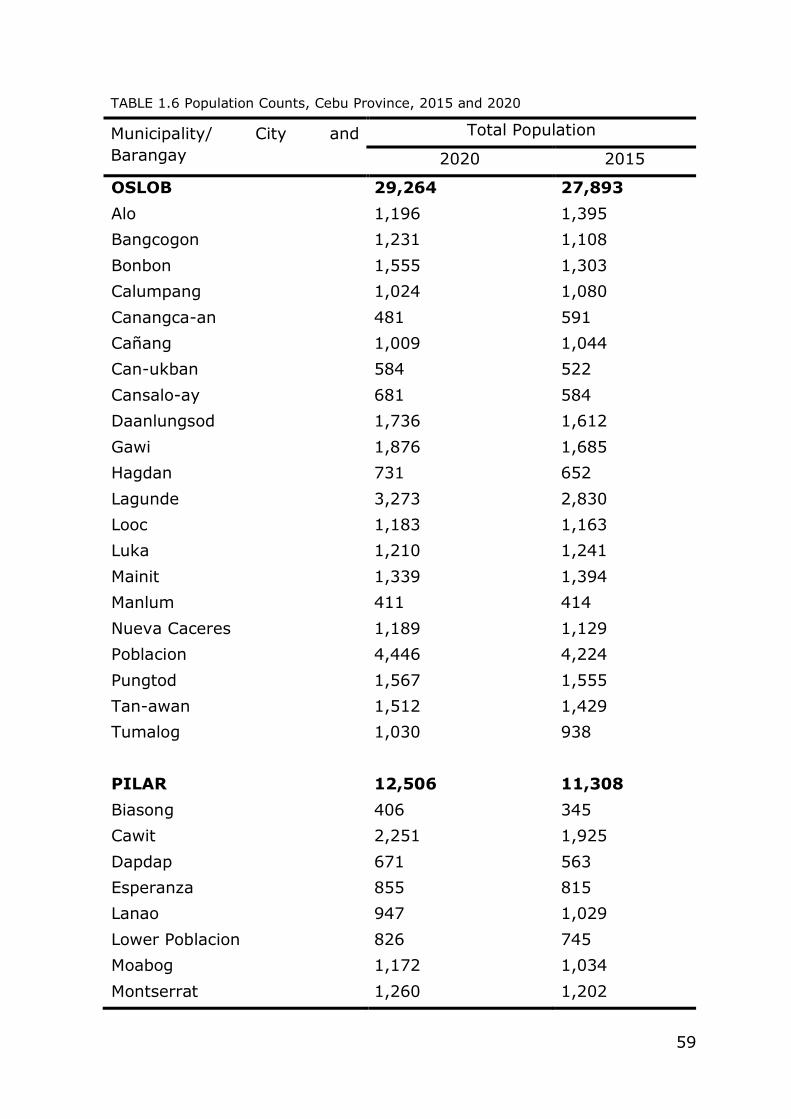
59
TABLE 1.6 Population Counts, Cebu Province, 2015 and 2020
Municipality/ City and
Barangay
Total Population
2020 2015
OSLOB 29,264 27,893
Alo 1,196 1,395
Bangcogon 1,231 1,108
Bonbon 1,555 1,303
Calumpang 1,024 1,080
Canangca-an 481 591
Cañang 1,009 1,044
Can-ukban 584 522
Cansalo-ay 681 584
Daanlungsod 1,736 1,612
Gawi 1,876 1,685
Hagdan 731 652
Lagunde 3,273 2,830
Looc 1,183 1,163
Luka 1,210 1,241
Mainit 1,339 1,394
Manlum 411 414
Nueva Caceres 1,189 1,129
Poblacion 4,446 4,224
Pungtod 1,567 1,555
Tan-awan 1,512 1,429
Tumalog 1,030 938
PILAR 12,506 11,308
Biasong 406 345
Cawit 2,251 1,925
Dapdap 671 563
Esperanza 855 815
Lanao 947 1,029
Lower Poblacion 826 745
Moabog 1,172 1,034
Montserrat 1,260 1,202
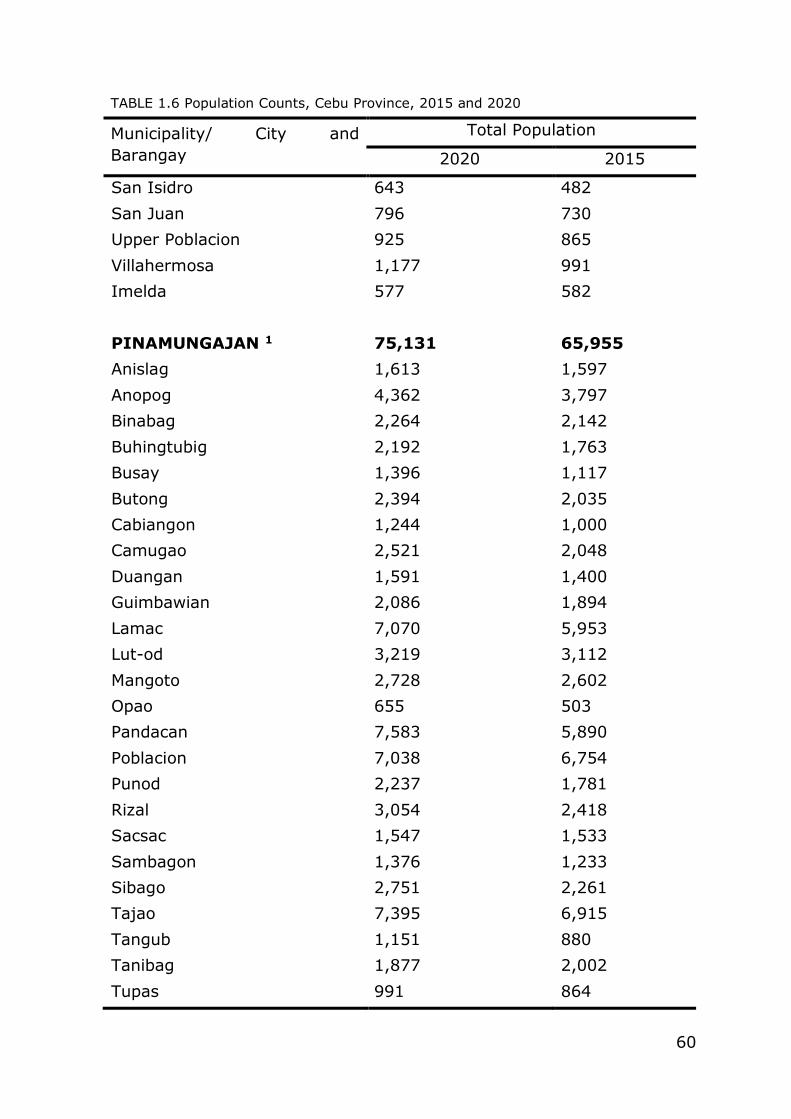
60
TABLE 1.6 Population Counts, Cebu Province, 2015 and 2020
Municipality/ City and
Barangay
Total Population
2020 2015
San Isidro 643 482
San Juan 796 730
Upper Poblacion 925 865
Villahermosa 1,177 991
Imelda 577 582
PINAMUNGAJAN 1 75,131 65,955
Anislag 1,613 1,597
Anopog 4,362 3,797
Binabag 2,264 2,142
Buhingtubig 2,192 1,763
Busay 1,396 1,117
Butong 2,394 2,035
Cabiangon 1,244 1,000
Camugao 2,521 2,048
Duangan 1,591 1,400
Guimbawian 2,086 1,894
Lamac 7,070 5,953
Lut-od 3,219 3,112
Mangoto 2,728 2,602
Opao 655 503
Pandacan 7,583 5,890
Poblacion 7,038 6,754
Punod 2,237 1,781
Rizal 3,054 2,418
Sacsac 1,547 1,533
Sambagon 1,376 1,233
Sibago 2,751 2,261
Tajao 7,395 6,915
Tangub 1,151 880
Tanibag 1,877 2,002
Tupas 991 864
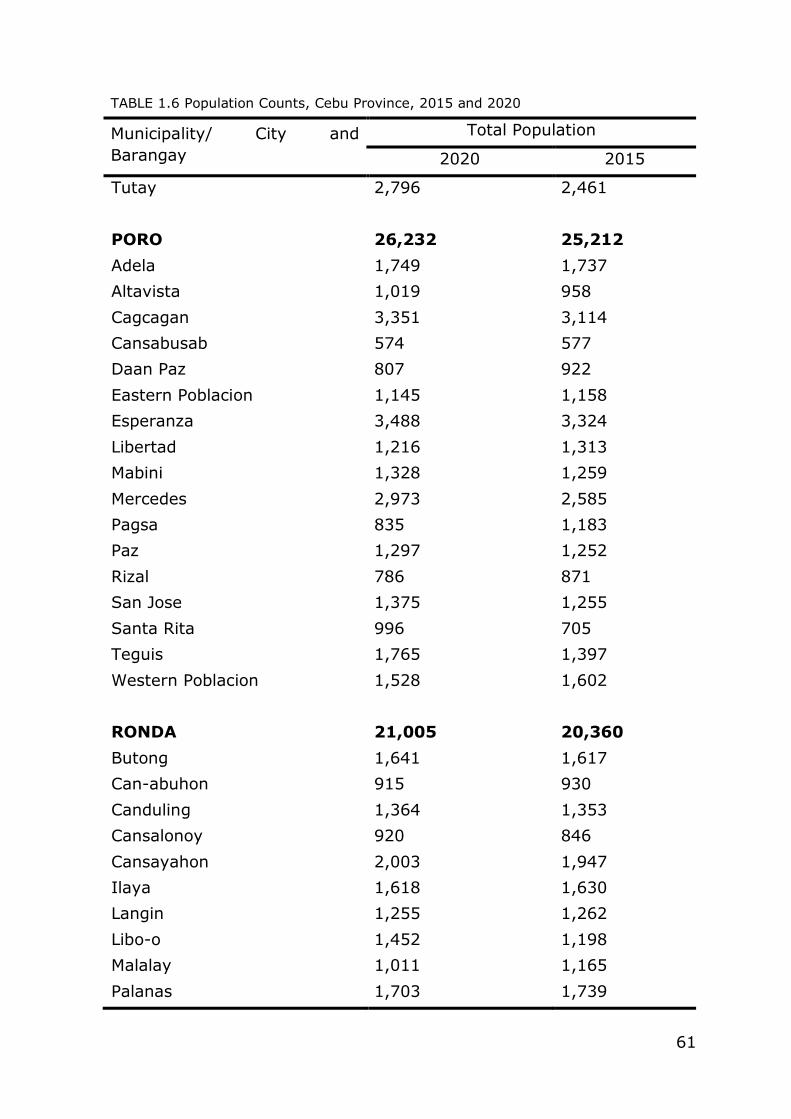
61
TABLE 1.6 Population Counts, Cebu Province, 2015 and 2020
Municipality/ City and
Barangay
Total Population
2020 2015
Tutay 2,796 2,461
PORO 26,232 25,212
Adela 1,749 1,737
Altavista 1,019 958
Cagcagan 3,351 3,114
Cansabusab 574 577
Daan Paz 807 922
Eastern Poblacion 1,145 1,158
Esperanza 3,488 3,324
Libertad 1,216 1,313
Mabini 1,328 1,259
Mercedes 2,973 2,585
Pagsa 835 1,183
Paz 1,297 1,252
Rizal 786 871
San Jose 1,375 1,255
Santa Rita 996 705
Teguis 1,765 1,397
Western Poblacion 1,528 1,602
RONDA 21,005 20,360
Butong 1,641 1,617
Can-abuhon 915 930
Canduling 1,364 1,353
Cansalonoy 920 846
Cansayahon 2,003 1,947
Ilaya 1,618 1,630
Langin 1,255 1,262
Libo-o 1,452 1,198
Malalay 1,011 1,165
Palanas 1,703 1,739
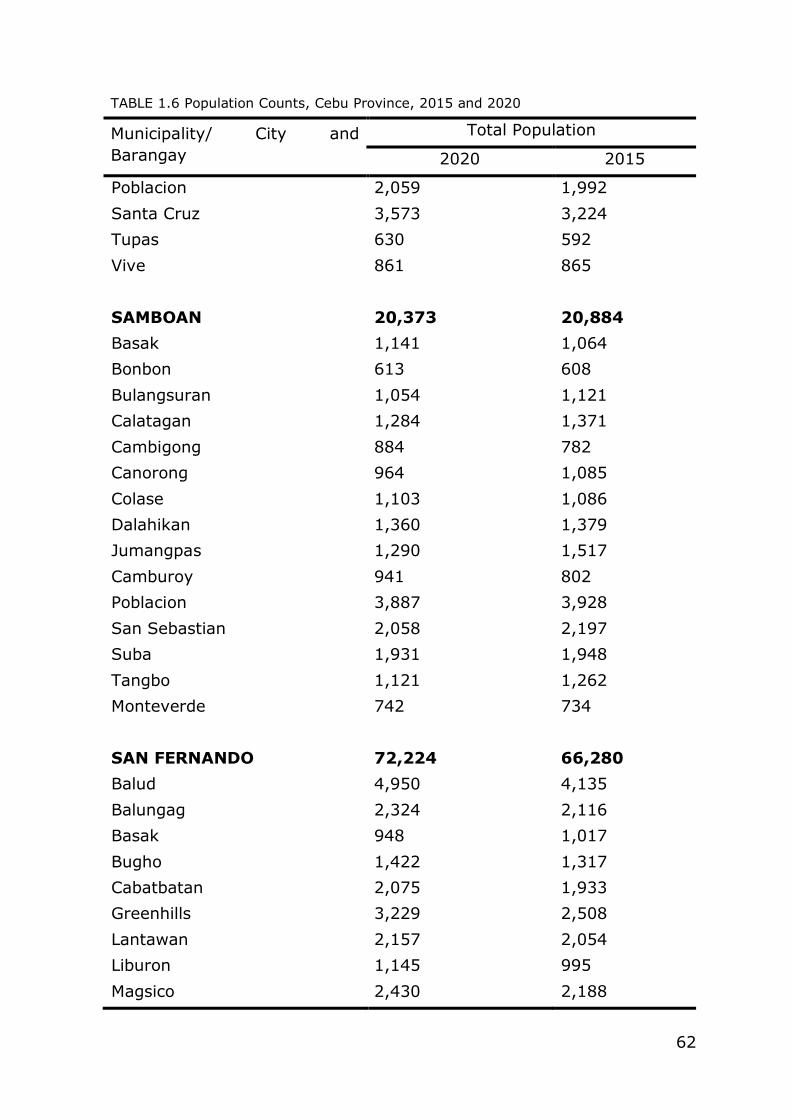
62
TABLE 1.6 Population Counts, Cebu Province, 2015 and 2020
Municipality/ City and
Barangay
Total Population
2020 2015
Poblacion 2,059 1,992
Santa Cruz 3,573 3,224
Tupas 630 592
Vive 861 865
SAMBOAN 20,373 20,884
Basak 1,141 1,064
Bonbon 613 608
Bulangsuran 1,054 1,121
Calatagan 1,284 1,371
Cambigong 884 782
Canorong 964 1,085
Colase 1,103 1,086
Dalahikan 1,360 1,379
Jumangpas 1,290 1,517
Camburoy 941 802
Poblacion 3,887 3,928
San Sebastian 2,058 2,197
Suba 1,931 1,948
Tangbo 1,121 1,262
Monteverde 742 734
SAN FERNANDO 72,224 66,280
Balud 4,950 4,135
Balungag 2,324 2,116
Basak 948 1,017
Bugho 1,422 1,317
Cabatbatan 2,075 1,933
Greenhills 3,229 2,508
Lantawan 2,157 2,054
Liburon 1,145 995
Magsico 2,430 2,188
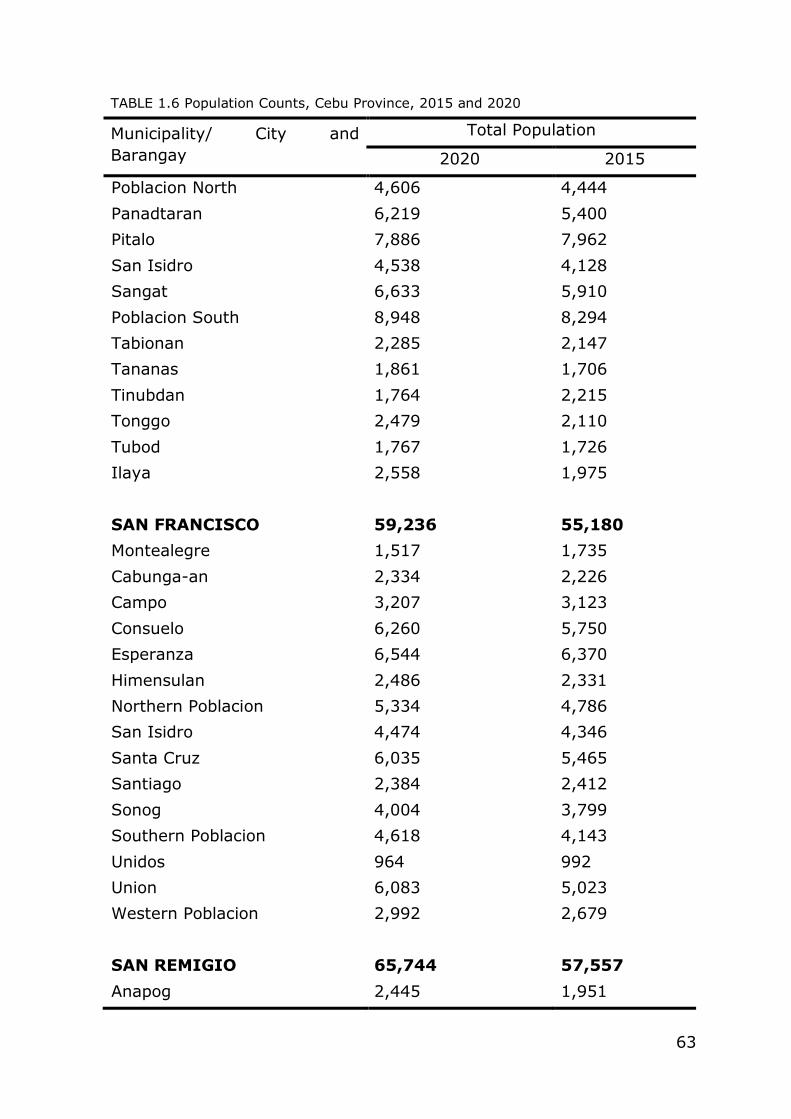
63
TABLE 1.6 Population Counts, Cebu Province, 2015 and 2020
Municipality/ City and
Barangay
Total Population
2020 2015
Poblacion North 4,606 4,444
Panadtaran 6,219 5,400
Pitalo 7,886 7,962
San Isidro 4,538 4,128
Sangat 6,633 5,910
Poblacion South 8,948 8,294
Tabionan 2,285 2,147
Tananas 1,861 1,706
Tinubdan 1,764 2,215
Tonggo 2,479 2,110
Tubod 1,767 1,726
Ilaya 2,558 1,975
SAN FRANCISCO 59,236 55,180
Montealegre 1,517 1,735
Cabunga-an 2,334 2,226
Campo 3,207 3,123
Consuelo 6,260 5,750
Esperanza 6,544 6,370
Himensulan 2,486 2,331
Northern Poblacion 5,334 4,786
San Isidro 4,474 4,346
Santa Cruz 6,035 5,465
Santiago 2,384 2,412
Sonog 4,004 3,799
Southern Poblacion 4,618 4,143
Unidos 964 992
Union 6,083 5,023
Western Poblacion 2,992 2,679
SAN REMIGIO 65,744 57,557
Anapog 2,445 1,951
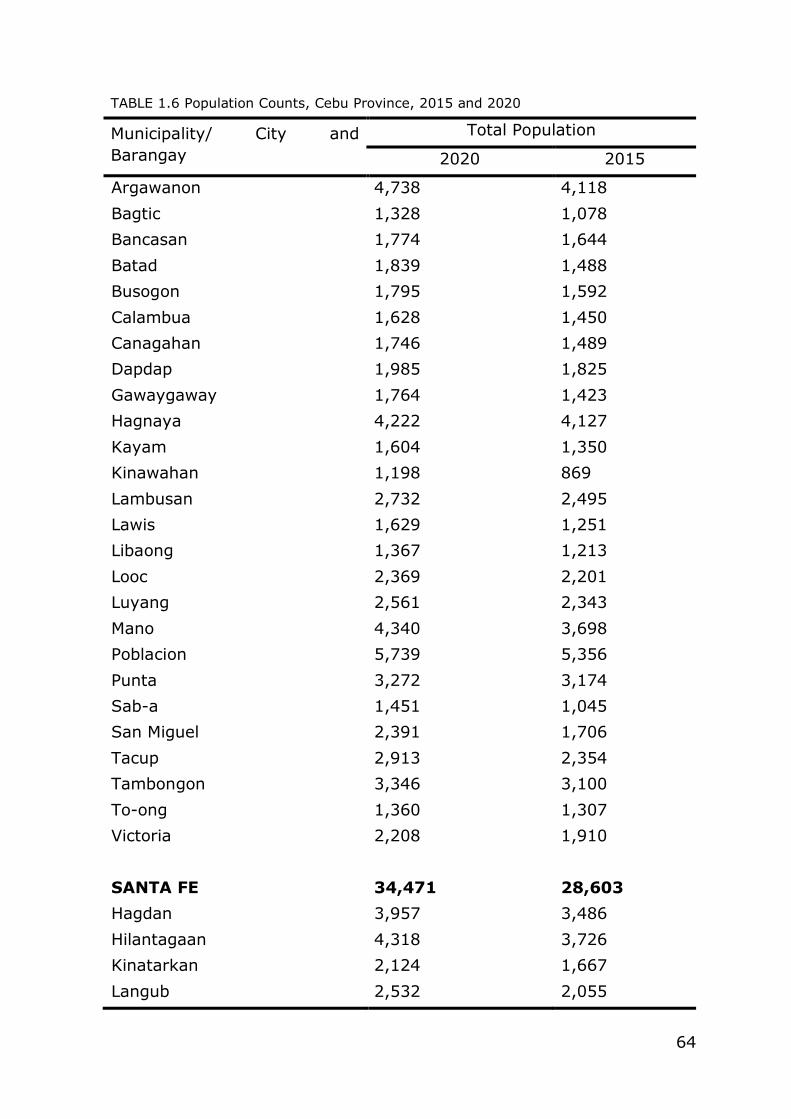
64
TABLE 1.6 Population Counts, Cebu Province, 2015 and 2020
Municipality/ City and
Barangay
Total Population
2020 2015
Argawanon 4,738 4,118
Bagtic 1,328 1,078
Bancasan 1,774 1,644
Batad 1,839 1,488
Busogon 1,795 1,592
Calambua 1,628 1,450
Canagahan 1,746 1,489
Dapdap 1,985 1,825
Gawaygaway 1,764 1,423
Hagnaya 4,222 4,127
Kayam 1,604 1,350
Kinawahan 1,198 869
Lambusan 2,732 2,495
Lawis 1,629 1,251
Libaong 1,367 1,213
Looc 2,369 2,201
Luyang 2,561 2,343
Mano 4,340 3,698
Poblacion 5,739 5,356
Punta 3,272 3,174
Sab-a 1,451 1,045
San Miguel 2,391 1,706
Tacup 2,913 2,354
Tambongon 3,346 3,100
To-ong 1,360 1,307
Victoria 2,208 1,910
SANTA FE 34,471 28,603
Hagdan 3,957 3,486
Hilantagaan 4,318 3,726
Kinatarkan 2,124 1,667
Langub 2,532 2,055
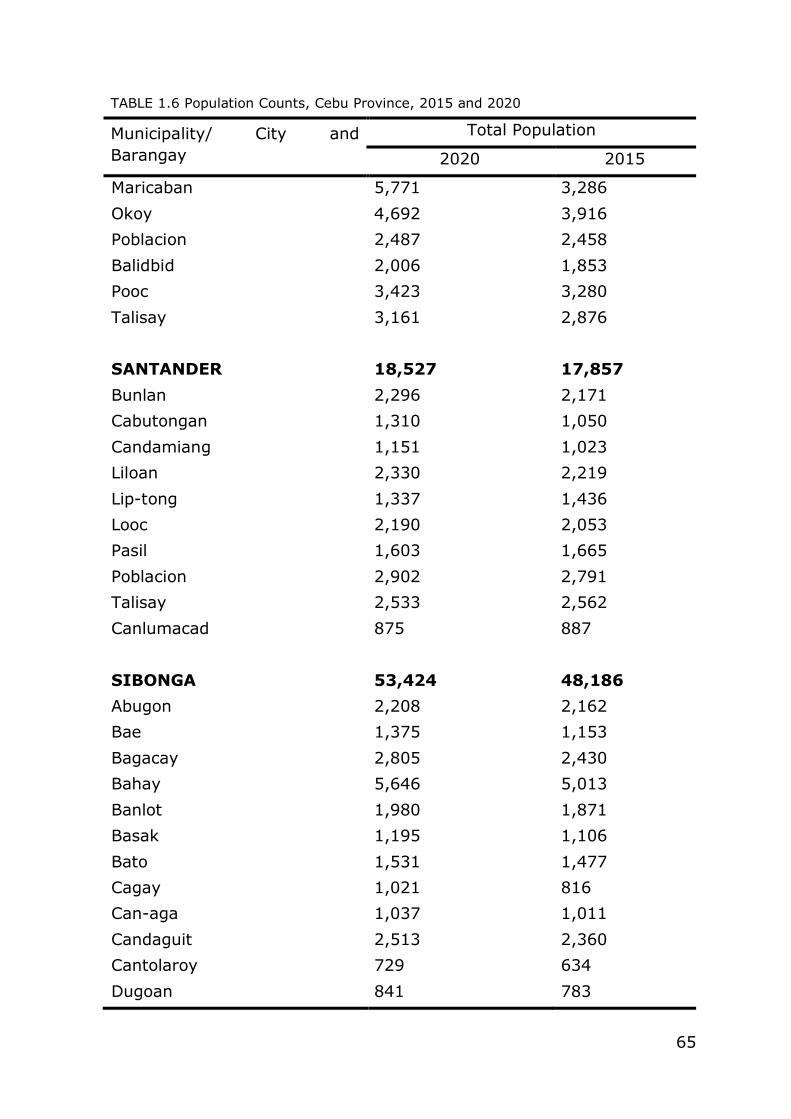
65
TABLE 1.6 Population Counts, Cebu Province, 2015 and 2020
Municipality/ City and
Barangay
Total Population
2020 2015
Maricaban 5,771 3,286
Okoy 4,692 3,916
Poblacion 2,487 2,458
Balidbid 2,006 1,853
Pooc 3,423 3,280
Talisay 3,161 2,876
SANTANDER 18,527 17,857
Bunlan 2,296 2,171
Cabutongan 1,310 1,050
Candamiang 1,151 1,023
Liloan 2,330 2,219
Lip-tong 1,337 1,436
Looc 2,190 2,053
Pasil 1,603 1,665
Poblacion 2,902 2,791
Talisay 2,533 2,562
Canlumacad 875 887
SIBONGA 53,424 48,186
Abugon 2,208 2,162
Bae 1,375 1,153
Bagacay 2,805 2,430
Bahay 5,646 5,013
Banlot 1,980 1,871
Basak 1,195 1,106
Bato 1,531 1,477
Cagay 1,021 816
Can-aga 1,037 1,011
Candaguit 2,513 2,360
Cantolaroy 729 634
Dugoan 841 783
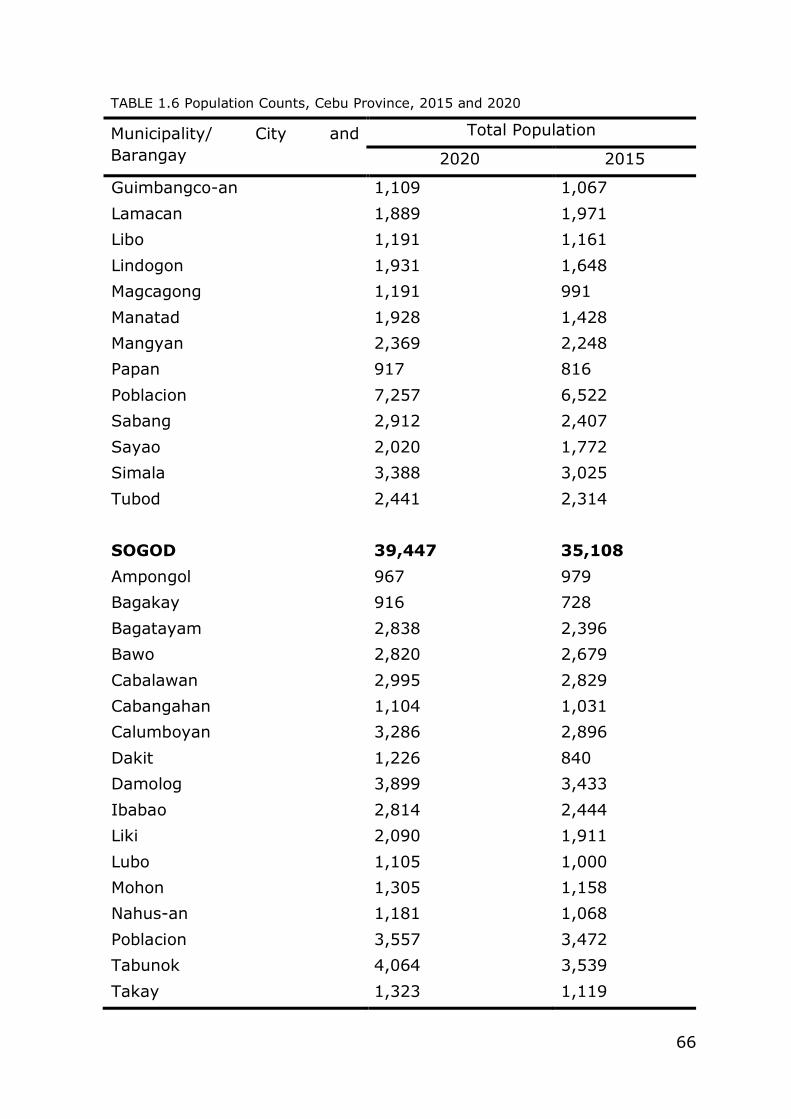
66
TABLE 1.6 Population Counts, Cebu Province, 2015 and 2020
Municipality/ City and
Barangay
Total Population
2020 2015
Guimbangco-an 1,109 1,067
Lamacan 1,889 1,971
Libo 1,191 1,161
Lindogon 1,931 1,648
Magcagong 1,191 991
Manatad 1,928 1,428
Mangyan 2,369 2,248
Papan 917 816
Poblacion 7,257 6,522
Sabang 2,912 2,407
Sayao 2,020 1,772
Simala 3,388 3,025
Tubod 2,441 2,314
SOGOD 39,447 35,108
Ampongol 967 979
Bagakay 916 728
Bagatayam 2,838 2,396
Bawo 2,820 2,679
Cabalawan 2,995 2,829
Cabangahan 1,104 1,031
Calumboyan 3,286 2,896
Dakit 1,226 840
Damolog 3,899 3,433
Ibabao 2,814 2,444
Liki 2,090 1,911
Lubo 1,105 1,000
Mohon 1,305 1,158
Nahus-an 1,181 1,068
Poblacion 3,557 3,472
Tabunok 4,064 3,539
Takay 1,323 1,119
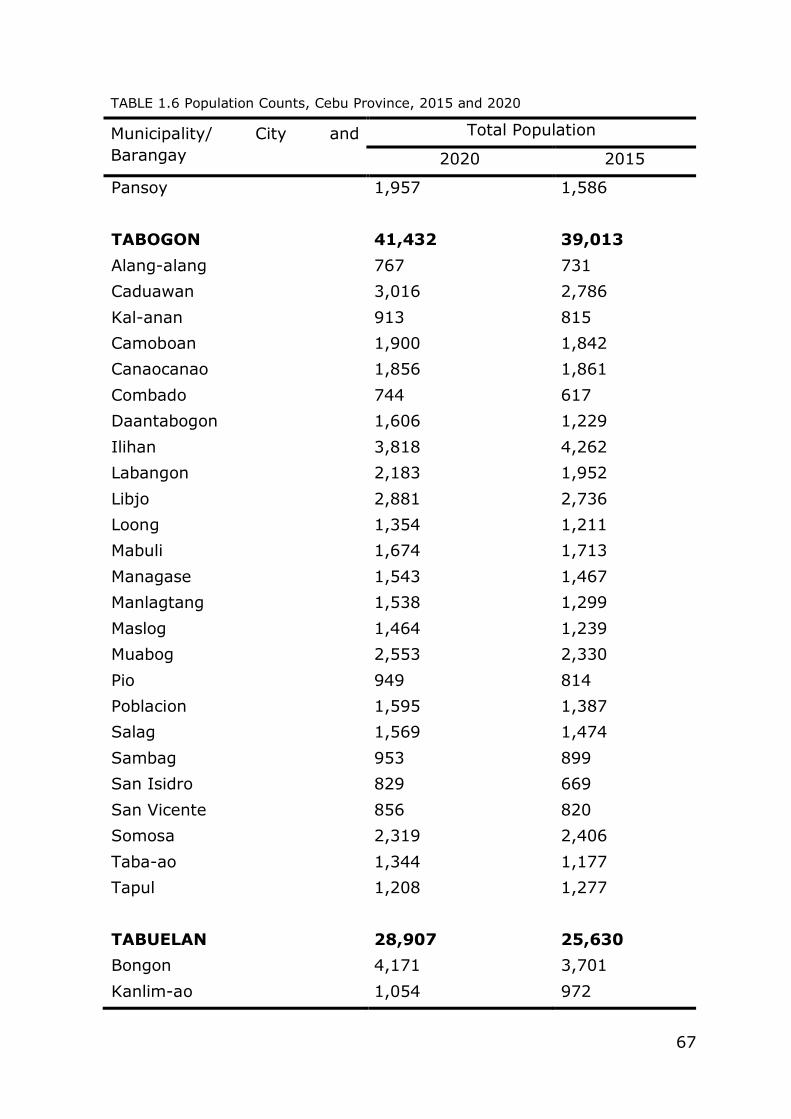
67
TABLE 1.6 Population Counts, Cebu Province, 2015 and 2020
Municipality/ City and
Barangay
Total Population
2020 2015
Pansoy 1,957 1,586
TABOGON 41,432 39,013
Alang-alang 767 731
Caduawan 3,016 2,786
Kal-anan 913 815
Camoboan 1,900 1,842
Canaocanao 1,856 1,861
Combado 744 617
Daantabogon 1,606 1,229
Ilihan 3,818 4,262
Labangon 2,183 1,952
Libjo 2,881 2,736
Loong 1,354 1,211
Mabuli 1,674 1,713
Managase 1,543 1,467
Manlagtang 1,538 1,299
Maslog 1,464 1,239
Muabog 2,553 2,330
Pio 949 814
Poblacion 1,595 1,387
Salag 1,569 1,474
Sambag 953 899
San Isidro 829 669
San Vicente 856 820
Somosa 2,319 2,406
Taba-ao 1,344 1,177
Tapul 1,208 1,277
TABUELAN 28,907 25,630
Bongon 4,171 3,701
Kanlim-ao 1,054 972
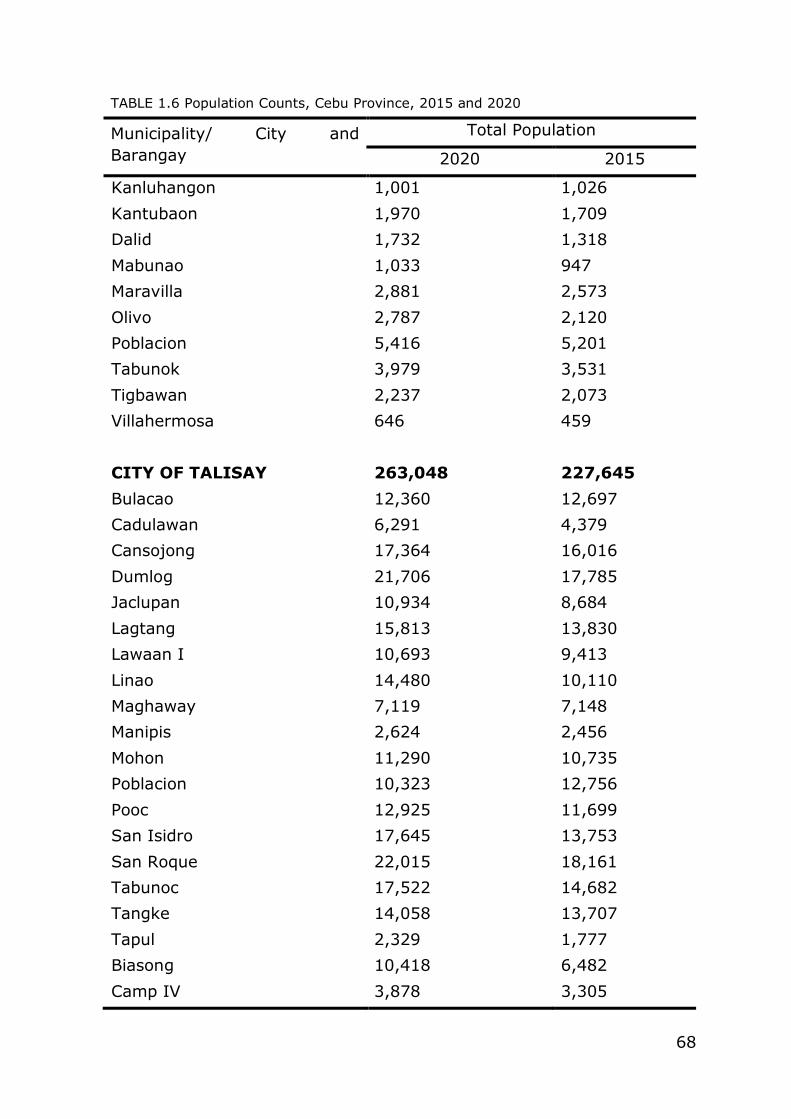
68
TABLE 1.6 Population Counts, Cebu Province, 2015 and 2020
Municipality/ City and
Barangay
Total Population
2020 2015
Kanluhangon 1,001 1,026
Kantubaon 1,970 1,709
Dalid 1,732 1,318
Mabunao 1,033 947
Maravilla 2,881 2,573
Olivo 2,787 2,120
Poblacion 5,416 5,201
Tabunok 3,979 3,531
Tigbawan 2,237 2,073
Villahermosa 646 459
CITY OF TALISAY 263,048 227,645
Bulacao 12,360 12,697
Cadulawan 6,291 4,379
Cansojong 17,364 16,016
Dumlog 21,706 17,785
Jaclupan 10,934 8,684
Lagtang 15,813 13,830
Lawaan I 10,693 9,413
Linao 14,480 10,110
Maghaway 7,119 7,148
Manipis 2,624 2,456
Mohon 11,290 10,735
Poblacion 10,323 12,756
Pooc 12,925 11,699
San Isidro 17,645 13,753
San Roque 22,015 18,161
Tabunoc 17,522 14,682
Tangke 14,058 13,707
Tapul 2,329 1,777
Biasong 10,418 6,482
Camp IV 3,878 3,305
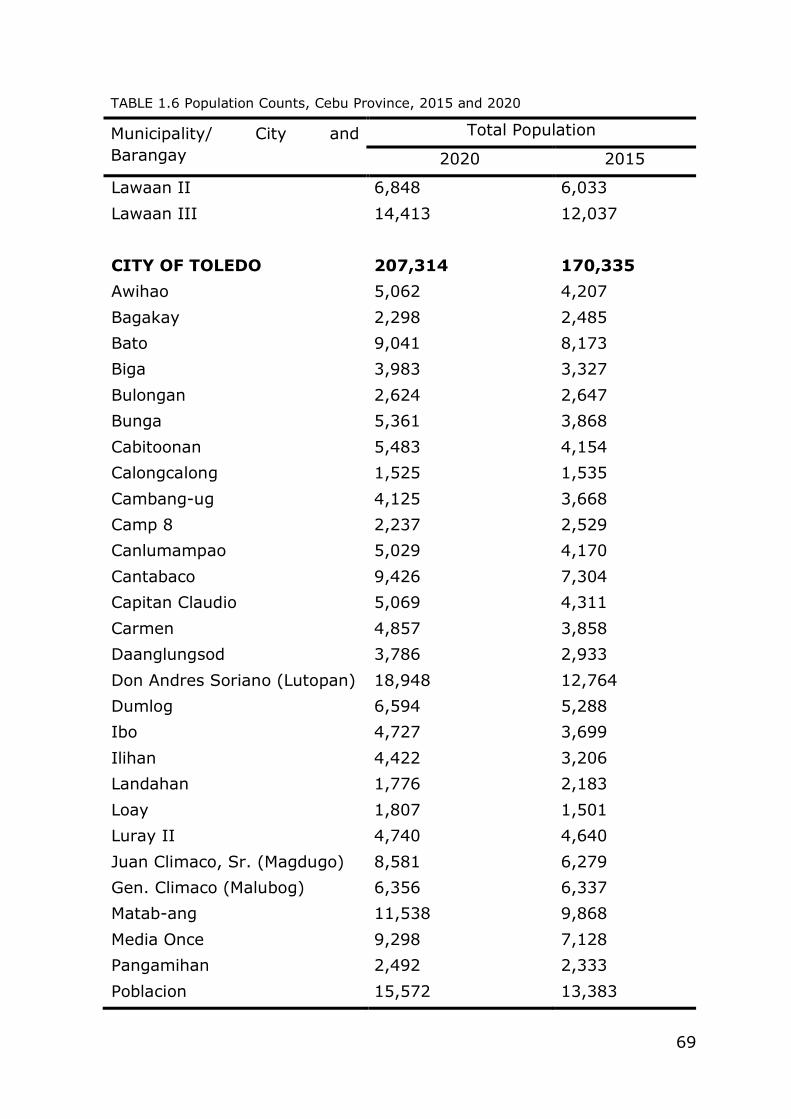
69
TABLE 1.6 Population Counts, Cebu Province, 2015 and 2020
Municipality/ City and
Barangay
Total Population
2020 2015
Lawaan II 6,848 6,033
Lawaan III 14,413 12,037
CITY OF TOLEDO 207,314 170,335
Awihao 5,062 4,207
Bagakay 2,298 2,485
Bato 9,041 8,173
Biga 3,983 3,327
Bulongan 2,624 2,647
Bunga 5,361 3,868
Cabitoonan 5,483 4,154
Calongcalong 1,525 1,535
Cambang-ug 4,125 3,668
Camp 8 2,237 2,529
Canlumampao 5,029 4,170
Cantabaco 9,426 7,304
Capitan Claudio 5,069 4,311
Carmen 4,857 3,858
Daanglungsod 3,786 2,933
Don Andres Soriano (Lutopan) 18,948 12,764
Dumlog 6,594 5,288
Ibo 4,727 3,699
Ilihan 4,422 3,206
Landahan 1,776 2,183
Loay 1,807 1,501
Luray II 4,740 4,640
Juan Climaco, Sr. (Magdugo) 8,581 6,279
Gen. Climaco (Malubog) 6,356 6,337
Matab-ang 11,538 9,868
Media Once 9,298 7,128
Pangamihan 2,492 2,333
Poblacion 15,572 13,383
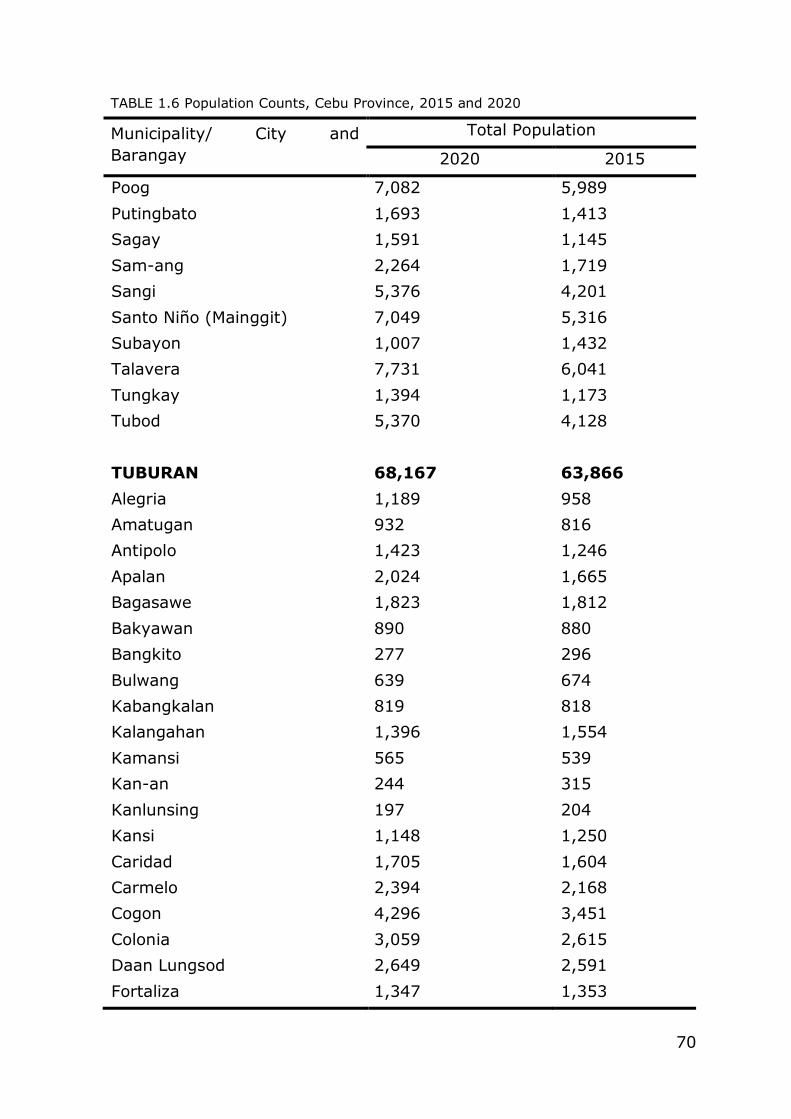
70
TABLE 1.6 Population Counts, Cebu Province, 2015 and 2020
Municipality/ City and
Barangay
Total Population
2020 2015
Poog 7,082 5,989
Putingbato 1,693 1,413
Sagay 1,591 1,145
Sam-ang 2,264 1,719
Sangi 5,376 4,201
Santo Niño (Mainggit) 7,049 5,316
Subayon 1,007 1,432
Talavera 7,731 6,041
Tungkay 1,394 1,173
Tubod 5,370 4,128
TUBURAN 68,167 63,866
Alegria 1,189 958
Amatugan 932 816
Antipolo 1,423 1,246
Apalan 2,024 1,665
Bagasawe 1,823 1,812
Bakyawan 890 880
Bangkito 277 296
Bulwang 639 674
Kabangkalan 819 818
Kalangahan 1,396 1,554
Kamansi 565 539
Kan-an 244 315
Kanlunsing 197 204
Kansi 1,148 1,250
Caridad 1,705 1,604
Carmelo 2,394 2,168
Cogon 4,296 3,451
Colonia 3,059 2,615
Daan Lungsod 2,649 2,591
Fortaliza 1,347 1,353
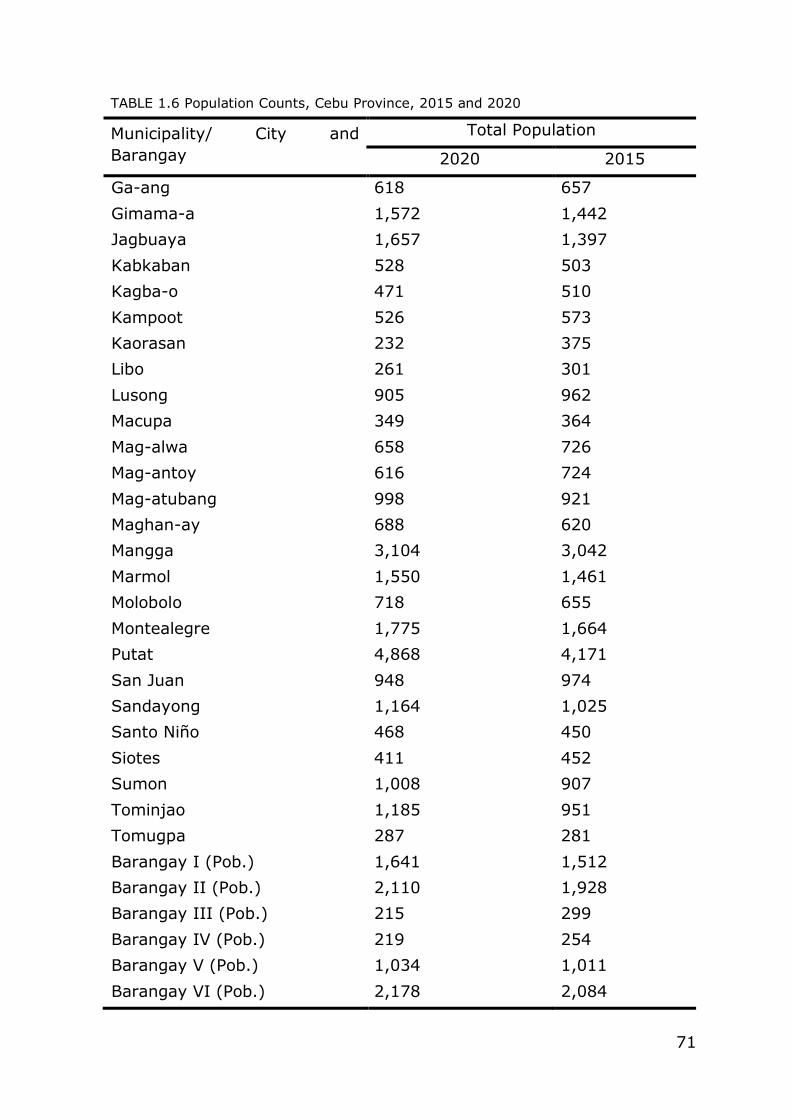
71
TABLE 1.6 Population Counts, Cebu Province, 2015 and 2020
Municipality/ City and
Barangay
Total Population
2020 2015
Ga-ang 618 657
Gimama-a 1,572 1,442
Jagbuaya 1,657 1,397
Kabkaban 528 503
Kagba-o 471 510
Kampoot 526 573
Kaorasan 232 375
Libo 261 301
Lusong 905 962
Macupa 349 364
Mag-alwa 658 726
Mag-antoy 616 724
Mag-atubang 998 921
Maghan-ay 688 620
Mangga 3,104 3,042
Marmol 1,550 1,461
Molobolo 718 655
Montealegre 1,775 1,664
Putat 4,868 4,171
San Juan 948 974
Sandayong 1,164 1,025
Santo Niño 468 450
Siotes 411 452
Sumon 1,008 907
Tominjao 1,185 951
Tomugpa 287 281
Barangay I (Pob.) 1,641 1,512
Barangay II (Pob.) 2,110 1,928
Barangay III (Pob.) 215 299
Barangay IV (Pob.) 219 254
Barangay V (Pob.) 1,034 1,011
Barangay VI (Pob.) 2,178 2,084
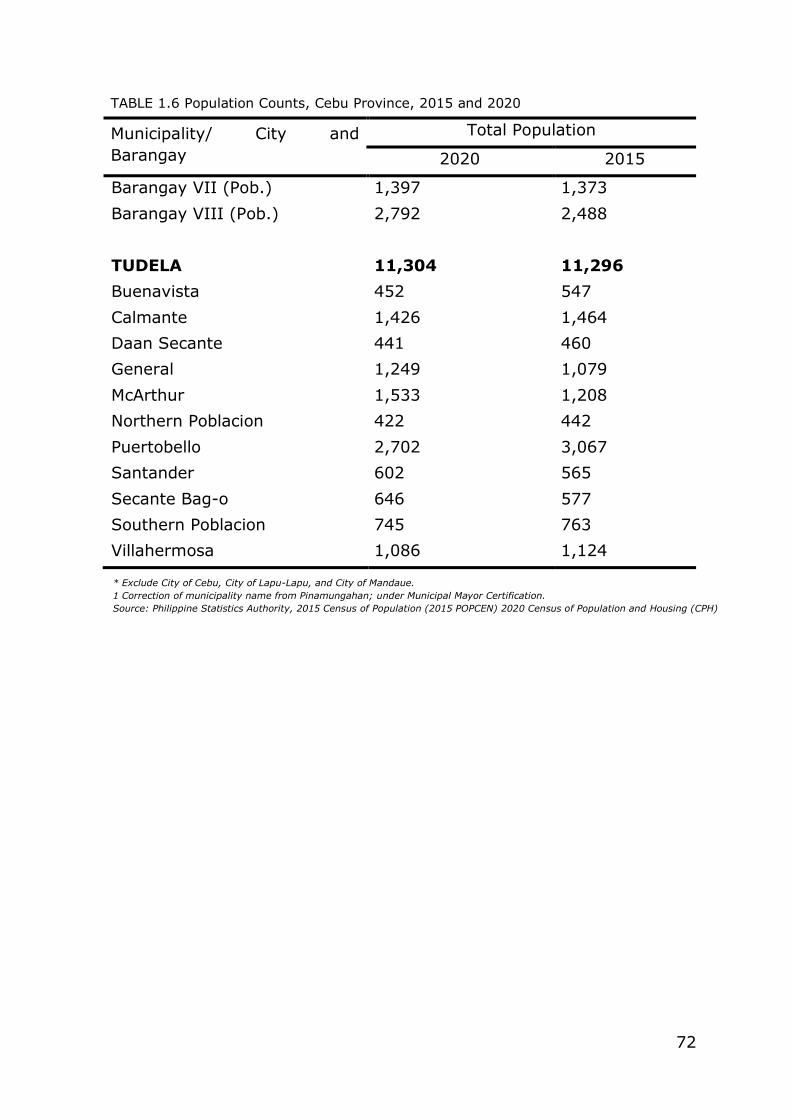
72
* Exclude City of Cebu, City of Lapu-Lapu, and City of Mandaue.
1 Correction of municipality name from Pinamungahan; under Municipal Mayor Certification.
Source: Philippine Statistics Authority, 2015 Census of Population (2015 POPCEN) 2020 Census of Population and Housing (CPH)
TABLE 1.6 Population Counts, Cebu Province, 2015 and 2020
Municipality/ City and
Barangay
Total Population
2020 2015
Barangay VII (Pob.) 1,397 1,373
Barangay VIII (Pob.) 2,792 2,488
TUDELA 11,304 11,296
Buenavista 452 547
Calmante 1,426 1,464
Daan Secante 441 460
General 1,249 1,079
McArthur 1,533 1,208
Northern Poblacion 422 442
Puertobello 2,702 3,067
Santander 602 565
Secante Bag-o 646 577
Southern Poblacion 745 763
Villahermosa 1,086 1,124
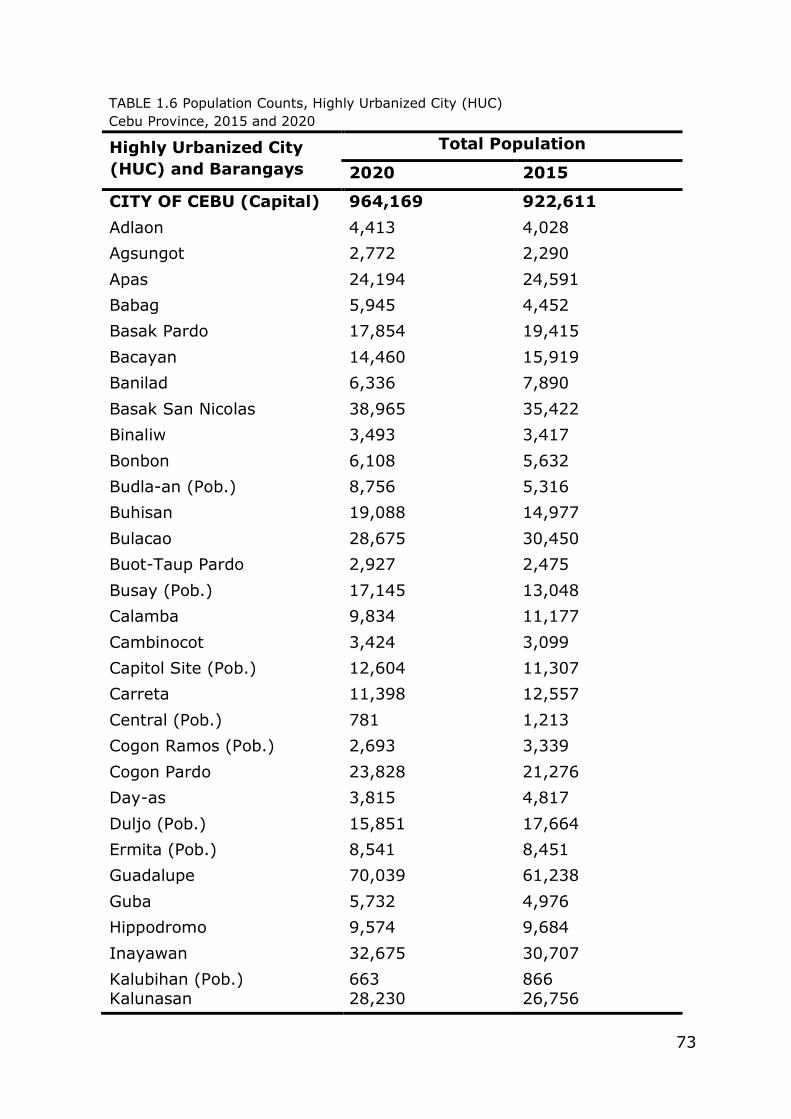
73
TABLE 1.6 Population Counts, Highly Urbanized City (HUC)
Cebu Province, 2015 and 2020
Highly Urbanized City
(HUC) and Barangays
Total Population
2020 2015
CITY OF CEBU (Capital) 964,169 922,611
Adlaon 4,413 4,028
Agsungot 2,772 2,290
Apas 24,194 24,591
Babag 5,945 4,452
Basak Pardo 17,854 19,415
Bacayan 14,460 15,919
Banilad 6,336 7,890
Basak San Nicolas 38,965 35,422
Binaliw 3,493 3,417
Bonbon 6,108 5,632
Budla-an (Pob.) 8,756 5,316
Buhisan 19,088 14,977
Bulacao 28,675 30,450
Buot-Taup Pardo 2,927 2,475
Busay (Pob.) 17,145 13,048
Calamba 9,834 11,177
Cambinocot 3,424 3,099
Capitol Site (Pob.) 12,604 11,307
Carreta 11,398 12,557
Central (Pob.) 781 1,213
Cogon Ramos (Pob.) 2,693 3,339
Cogon Pardo 23,828 21,276
Day-as 3,815 4,817
Duljo (Pob.) 15,851 17,664
Ermita (Pob.) 8,541 8,451
Guadalupe 70,039 61,238
Guba 5,732 4,976
Hippodromo 9,574 9,684
Inayawan 32,675 30,707
Kalubihan (Pob.) 663 866
Kalunasan 28,230 26,756
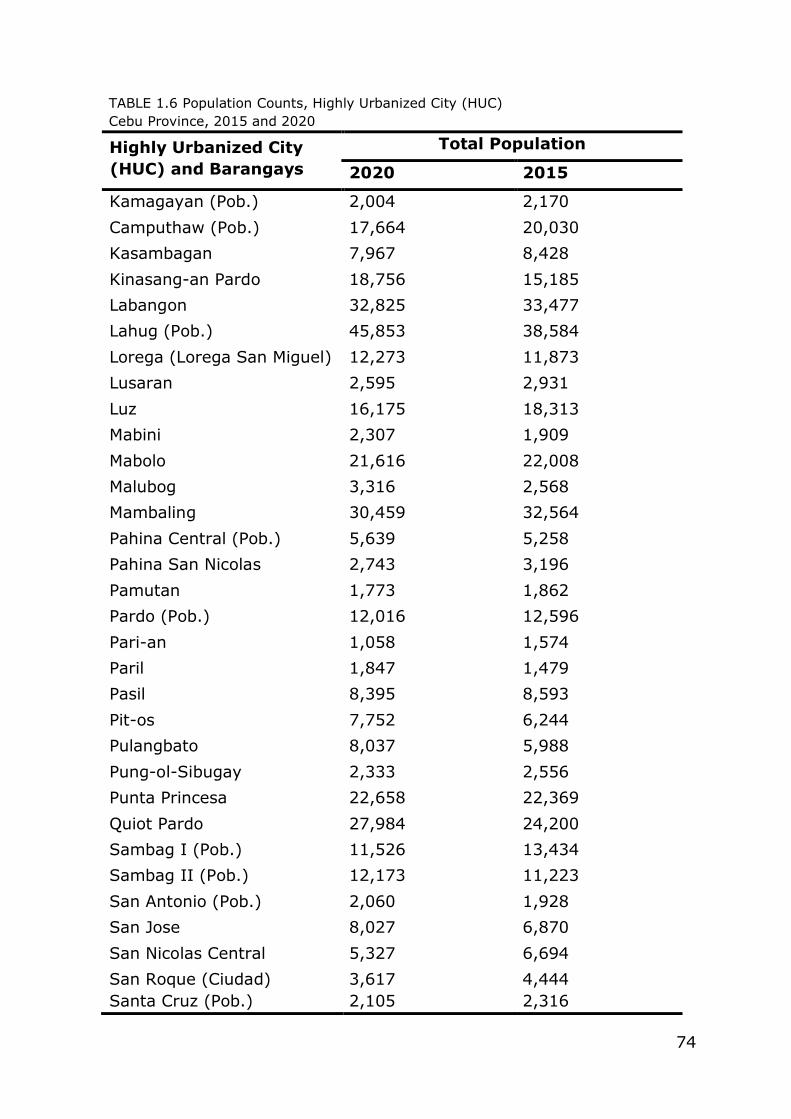
74
TABLE 1.6 Population Counts, Highly Urbanized City (HUC)
Cebu Province, 2015 and 2020
Highly Urbanized City
(HUC) and Barangays
Total Population
2020 2015
Kamagayan (Pob.) 2,004 2,170
Camputhaw (Pob.) 17,664 20,030
Kasambagan 7,967 8,428
Kinasang-an Pardo 18,756 15,185
Labangon 32,825 33,477
Lahug (Pob.) 45,853 38,584
Lorega (Lorega San Miguel) 12,273 11,873
Lusaran 2,595 2,931
Luz 16,175 18,313
Mabini 2,307 1,909
Mabolo 21,616 22,008
Malubog 3,316 2,568
Mambaling 30,459 32,564
Pahina Central (Pob.) 5,639 5,258
Pahina San Nicolas 2,743 3,196
Pamutan 1,773 1,862
Pardo (Pob.) 12,016 12,596
Pari-an 1,058 1,574
Paril 1,847 1,479
Pasil 8,395 8,593
Pit-os 7,752 6,244
Pulangbato 8,037 5,988
Pung-ol-Sibugay 2,333 2,556
Punta Princesa 22,658 22,369
Quiot Pardo 27,984 24,200
Sambag I (Pob.) 11,526 13,434
Sambag II (Pob.) 12,173 11,223
San Antonio (Pob.) 2,060 1,928
San Jose 8,027 6,870
San Nicolas Central 5,327 6,694
San Roque (Ciudad) 3,617 4,444
Santa Cruz (Pob.) 2,105 2,316
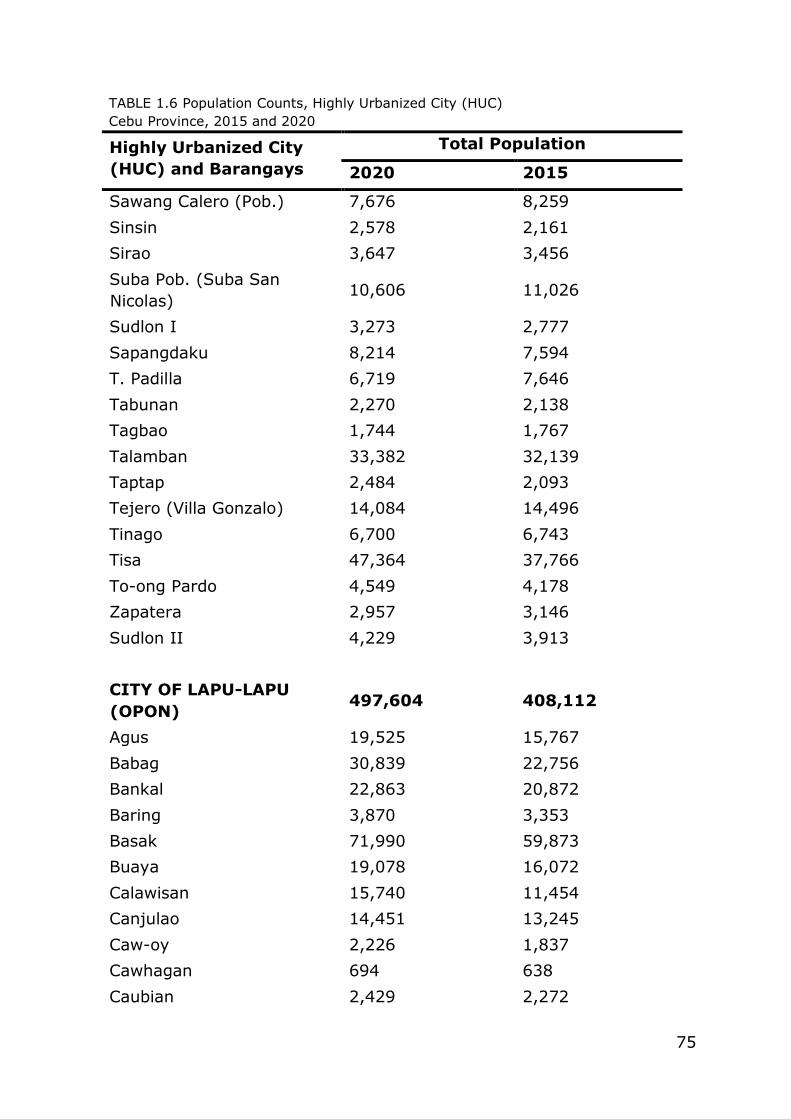
75
TABLE 1.6 Population Counts, Highly Urbanized City (HUC)
Cebu Province, 2015 and 2020
Highly Urbanized City
(HUC) and Barangays
Total Population
2020 2015
Sawang Calero (Pob.) 7,676 8,259
Sinsin 2,578 2,161
Sirao 3,647 3,456
Suba Pob. (Suba San
Nicolas) 10,606 11,026
Sudlon I 3,273 2,777
Sapangdaku 8,214 7,594
T. Padilla 6,719 7,646
Tabunan 2,270 2,138
Tagbao 1,744 1,767
Talamban 33,382 32,139
Taptap 2,484 2,093
Tejero (Villa Gonzalo) 14,084 14,496
Tinago 6,700 6,743
Tisa 47,364 37,766
To-ong Pardo 4,549 4,178
Zapatera 2,957 3,146
Sudlon II 4,229 3,913
CITY OF LAPU-LAPU
(OPON) 497,604 408,112
Agus 19,525 15,767
Babag 30,839 22,756
Bankal 22,863 20,872
Baring 3,870 3,353
Basak 71,990 59,873
Buaya 19,078 16,072
Calawisan 15,740 11,454
Canjulao 14,451 13,245
Caw-oy 2,226 1,837
Cawhagan 694 638
Caubian 2,429 2,272
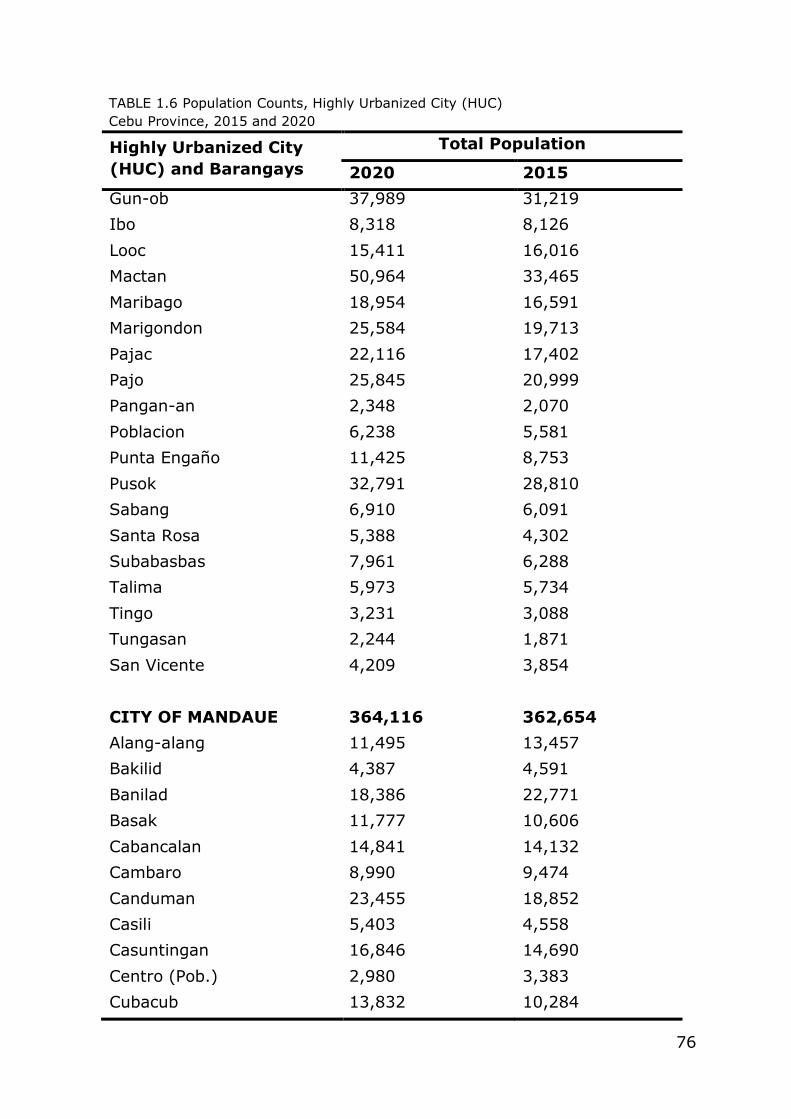
76
TABLE 1.6 Population Counts, Highly Urbanized City (HUC)
Cebu Province, 2015 and 2020
Highly Urbanized City
(HUC) and Barangays
Total Population
2020 2015
Gun-ob 37,989 31,219
Ibo 8,318 8,126
Looc 15,411 16,016
Mactan 50,964 33,465
Maribago 18,954 16,591
Marigondon 25,584 19,713
Pajac 22,116 17,402
Pajo 25,845 20,999
Pangan-an 2,348 2,070
Poblacion 6,238 5,581
Punta Engaño 11,425 8,753
Pusok 32,791 28,810
Sabang 6,910 6,091
Santa Rosa 5,388 4,302
Subabasbas 7,961 6,288
Talima 5,973 5,734
Tingo 3,231 3,088
Tungasan 2,244 1,871
San Vicente 4,209 3,854
CITY OF MANDAUE 364,116 362,654
Alang-alang 11,495 13,457
Bakilid 4,387 4,591
Banilad 18,386 22,771
Basak 11,777 10,606
Cabancalan 14,841 14,132
Cambaro 8,990 9,474
Canduman 23,455 18,852
Casili 5,403 4,558
Casuntingan 16,846 14,690
Centro (Pob.) 2,980 3,383
Cubacub 13,832 10,284
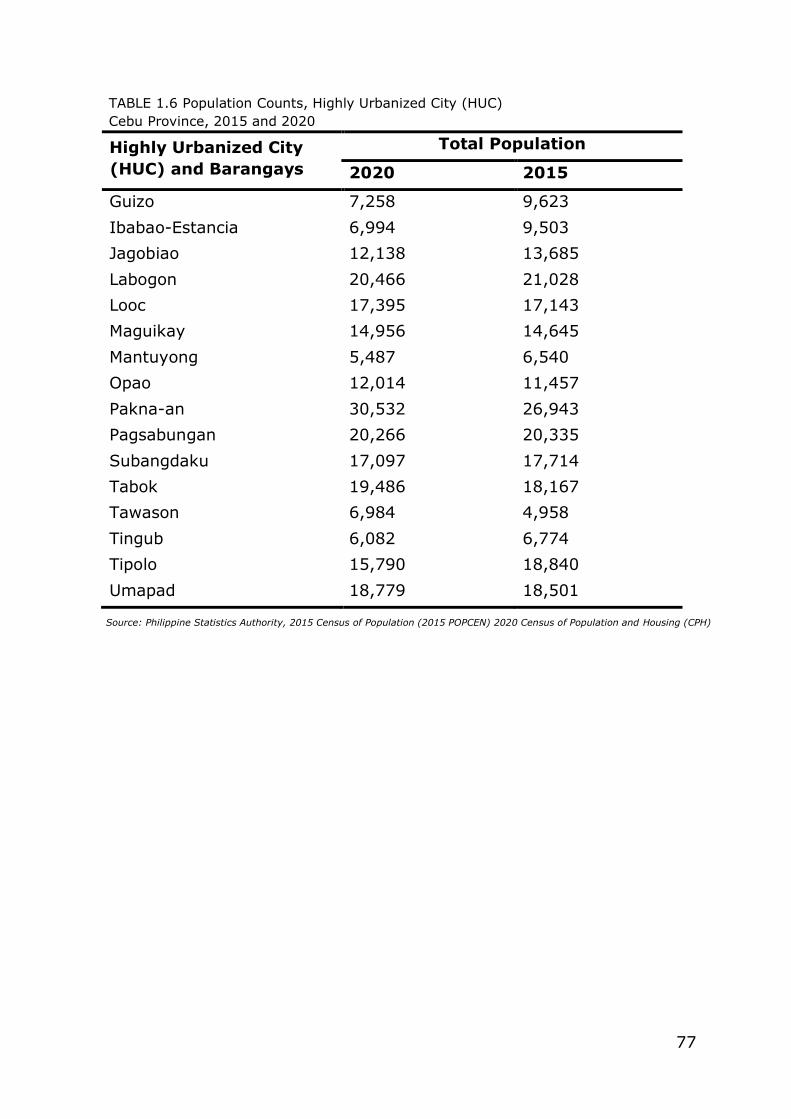
77
Source: Philippine Statistics Authority, 2015 Census of Population (2015 POPCEN) 2020 Census of Population and Housing (CPH)
TABLE 1.6 Population Counts, Highly Urbanized City (HUC)
Cebu Province, 2015 and 2020
Highly Urbanized City
(HUC) and Barangays
Total Population
2020 2015
Guizo 7,258 9,623
Ibabao-Estancia 6,994 9,503
Jagobiao 12,138 13,685
Labogon 20,466 21,028
Looc 17,395 17,143
Maguikay 14,956 14,645
Mantuyong 5,487 6,540
Opao 12,014 11,457
Pakna-an 30,532 26,943
Pagsabungan 20,266 20,335
Subangdaku 17,097 17,714
Tabok 19,486 18,167
Tawason 6,984 4,958
Tingub 6,082 6,774
Tipolo 15,790 18,840
Umapad 18,779 18,501
78
CHAPTER 2. PRICES AND INDICES
The Consumer Price Index (CPI) is most widely used in the calculation
of the inflation rate and purchasing power of the peso. It is a major
statistical series used for economic analysis and as a monitoring indicator
of government economic policy.
The inflation rate is the annual rate of change or the year on-year
change of the CPI expressed in percent. Inflation is interpreted in terms of
declining purchasing power of money
The purchasing power of the peso shows how much the peso in the
base period is worth in the current period. It is computed as the reciprocal
of the CPI for the period under review multiplied by 100.
This chapter presents the data pertaining to the consumer price index
(CPI) in all income family households, inflation rate (IR) and the purchasing
power of peso (PPP) in Cebu province for the year 2020.
Highlights:
CPI, IR and PPP
In 2020, the average Consumer Price Index in all income households
reached to 126.9 which was higher compared to 2019 at 124.4. An
increasing trend in the movement of CPI was noted from the base year
2012 which is equal to 100 until the year 2020.
In 2020, the highest CPI was recorded in the month of June at 127.9
in all income households which was higher compared to June 2019 at
124.1. The lowest CPI was recorded in the month of September and
October at 125.8.
Among commodity groups that contributed to the increased of the
CPI in Cebu province for the year 2020, the commodity group Alcoholic
Beverages and Tobacco recorded the highest CPI with 217.6. This was
followed by commodity group Food and Non-Alcoholic Beverages with
137.0 and Furnishings, Household Equipment and Routine Maintenance of
the House with 136.4. The lowest CPI among the commodity groups was
Communication with 102 in 2020.
The average inflation rate for the year 2020 was at 2.0% this is higher
compared to the average inflation rate in 2019 at 1.6%. Among the months
from January to December 2020, the highest inflation was recorded in the
month of March and June 2020 with 3.1% inflation. This is followed by the
months of January and February with 2.8% inflation. The average
Purchasing Power of Peso (PPP) of Cebu Province for the year 2020 was at
0.79 which is lower than the average PPP of Cebu Province in 2019 for the
year 2019 at 0.80.
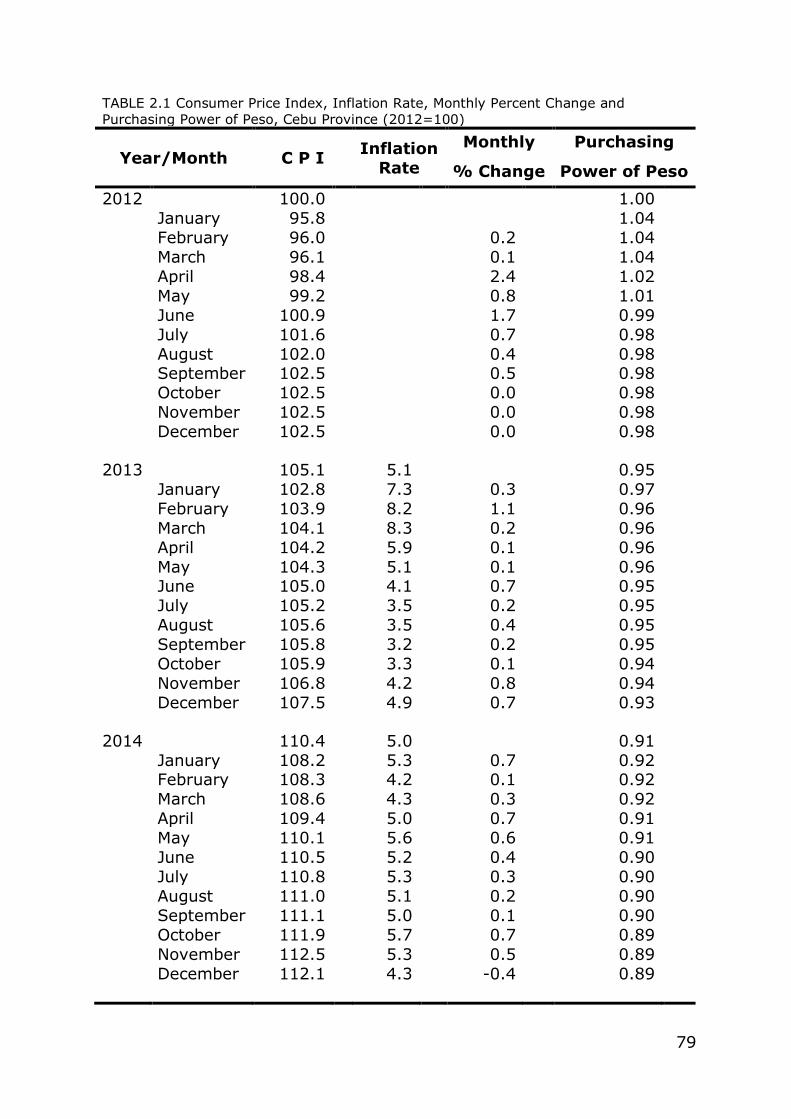
79
TABLE 2.1 Consumer Price Index, Inflation Rate, Monthly Percent Change and
Purchasing Power of Peso, Cebu Province (2012=100)
Year/Month C P I Inflation
Rate
Monthly Purchasing
% Change Power of Peso
2012 100.0 1.00
January 95.8 1.04
February 96.0 0.2 1.04
March 96.1 0.1 1.04
April 98.4 2.4 1.02
May 99.2 0.8 1.01
June 100.9 1.7 0.99
July 101.6 0.7 0.98
August 102.0 0.4 0.98 September 102.5 0.5 0.98
October 102.5 0.0 0.98
November 102.5 0.0 0.98
December 102.5 0.0 0.98 2013 105.1 5.1 0.95
January 102.8 7.3 0.3 0.97
February 103.9 8.2 1.1 0.96
March 104.1 8.3 0.2 0.96
April 104.2 5.9 0.1 0.96
May 104.3 5.1 0.1 0.96 June 105.0 4.1 0.7 0.95
July 105.2 3.5 0.2 0.95
August 105.6 3.5 0.4 0.95
September 105.8 3.2 0.2 0.95
October 105.9 3.3 0.1 0.94
November 106.8 4.2 0.8 0.94
December 107.5 4.9 0.7 0.93 2014 110.4 5.0 0.91
January 108.2 5.3 0.7 0.92 February 108.3 4.2 0.1 0.92
March 108.6 4.3 0.3 0.92
April 109.4 5.0 0.7 0.91
May 110.1 5.6 0.6 0.91
June 110.5 5.2 0.4 0.90
July 110.8 5.3 0.3 0.90
August 111.0 5.1 0.2 0.90
September 111.1 5.0 0.1 0.90
October 111.9 5.7 0.7 0.89
November 112.5 5.3 0.5 0.89
December 112.1 4.3 -0.4 0.89
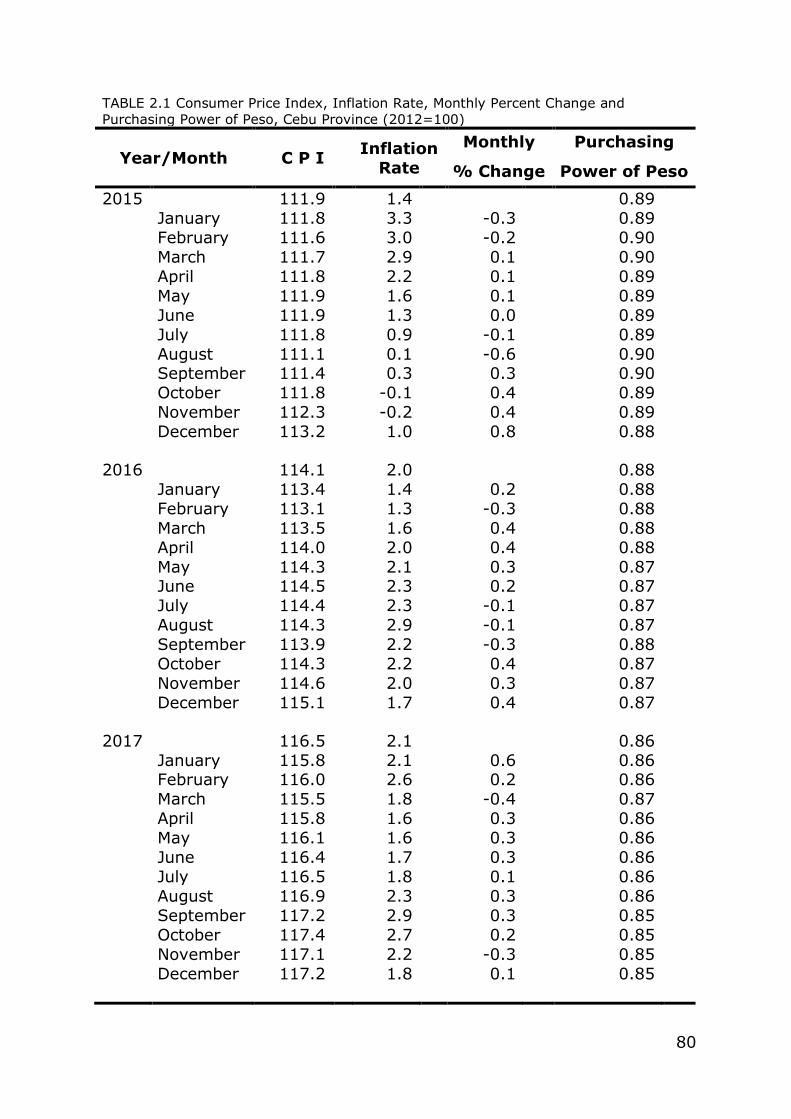
80
TABLE 2.1 Consumer Price Index, Inflation Rate, Monthly Percent Change and
Purchasing Power of Peso, Cebu Province (2012=100)
Year/Month C P I Inflation
Rate
Monthly Purchasing
% Change Power of Peso
2015 111.9 1.4 0.89
January 111.8 3.3 -0.3 0.89
February 111.6 3.0 -0.2 0.90
March 111.7 2.9 0.1 0.90
April 111.8 2.2 0.1 0.89
May 111.9 1.6 0.1 0.89
June 111.9 1.3 0.0 0.89
July 111.8 0.9 -0.1 0.89
August 111.1 0.1 -0.6 0.90 September 111.4 0.3 0.3 0.90
October 111.8 -0.1 0.4 0.89
November 112.3 -0.2 0.4 0.89
December 113.2 1.0 0.8 0.88 2016 114.1 2.0 0.88
January 113.4 1.4 0.2 0.88
February 113.1 1.3 -0.3 0.88
March 113.5 1.6 0.4 0.88
April 114.0 2.0 0.4 0.88
May 114.3 2.1 0.3 0.87 June 114.5 2.3 0.2 0.87
July 114.4 2.3 -0.1 0.87
August 114.3 2.9 -0.1 0.87
September 113.9 2.2 -0.3 0.88
October 114.3 2.2 0.4 0.87
November 114.6 2.0 0.3 0.87
December 115.1 1.7 0.4 0.87 2017 116.5 2.1 0.86
January 115.8 2.1 0.6 0.86 February 116.0 2.6 0.2 0.86
March 115.5 1.8 -0.4 0.87
April 115.8 1.6 0.3 0.86
May 116.1 1.6 0.3 0.86
June 116.4 1.7 0.3 0.86
July 116.5 1.8 0.1 0.86
August 116.9 2.3 0.3 0.86
September 117.2 2.9 0.3 0.85
October 117.4 2.7 0.2 0.85
November 117.1 2.2 -0.3 0.85
December 117.2 1.8 0.1 0.85
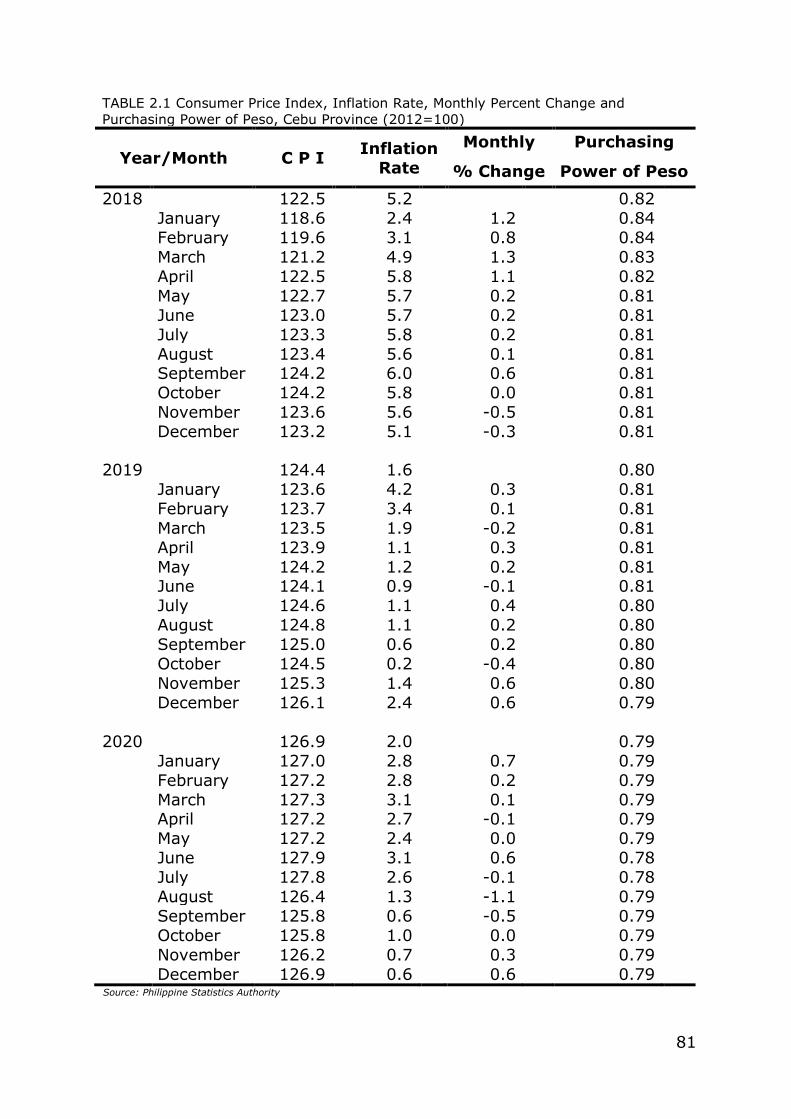
81
Source: Philippine Statistics Authority
TABLE 2.1 Consumer Price Index, Inflation Rate, Monthly Percent Change and
Purchasing Power of Peso, Cebu Province (2012=100)
Year/Month C P I Inflation
Rate
Monthly Purchasing
% Change Power of Peso
2018 122.5 5.2 0.82
January 118.6 2.4 1.2 0.84
February 119.6 3.1 0.8 0.84
March 121.2 4.9 1.3 0.83
April 122.5 5.8 1.1 0.82
May 122.7 5.7 0.2 0.81
June 123.0 5.7 0.2 0.81
July 123.3 5.8 0.2 0.81
August 123.4 5.6 0.1 0.81 September 124.2 6.0 0.6 0.81
October 124.2 5.8 0.0 0.81
November 123.6 5.6 -0.5 0.81
December 123.2 5.1 -0.3 0.81 2019 124.4 1.6 0.80
January 123.6 4.2 0.3 0.81
February 123.7 3.4 0.1 0.81
March 123.5 1.9 -0.2 0.81
April 123.9 1.1 0.3 0.81
May 124.2 1.2 0.2 0.81 June 124.1 0.9 -0.1 0.81
July 124.6 1.1 0.4 0.80
August 124.8 1.1 0.2 0.80
September 125.0 0.6 0.2 0.80
October 124.5 0.2 -0.4 0.80
November 125.3 1.4 0.6 0.80
December 126.1 2.4 0.6 0.79 2020 126.9 2.0 0.79
January 127.0 2.8 0.7 0.79
February 127.2 2.8 0.2 0.79
March 127.3 3.1 0.1 0.79 April 127.2 2.7 -0.1 0.79
May 127.2 2.4 0.0 0.79
June 127.9 3.1 0.6 0.78
July 127.8 2.6 -0.1 0.78
August 126.4 1.3 -1.1 0.79
September 125.8 0.6 -0.5 0.79
October 125.8 1.0 0.0 0.79
November 126.2 0.7 0.3 0.79
December 126.9 0.6 0.6 0.79
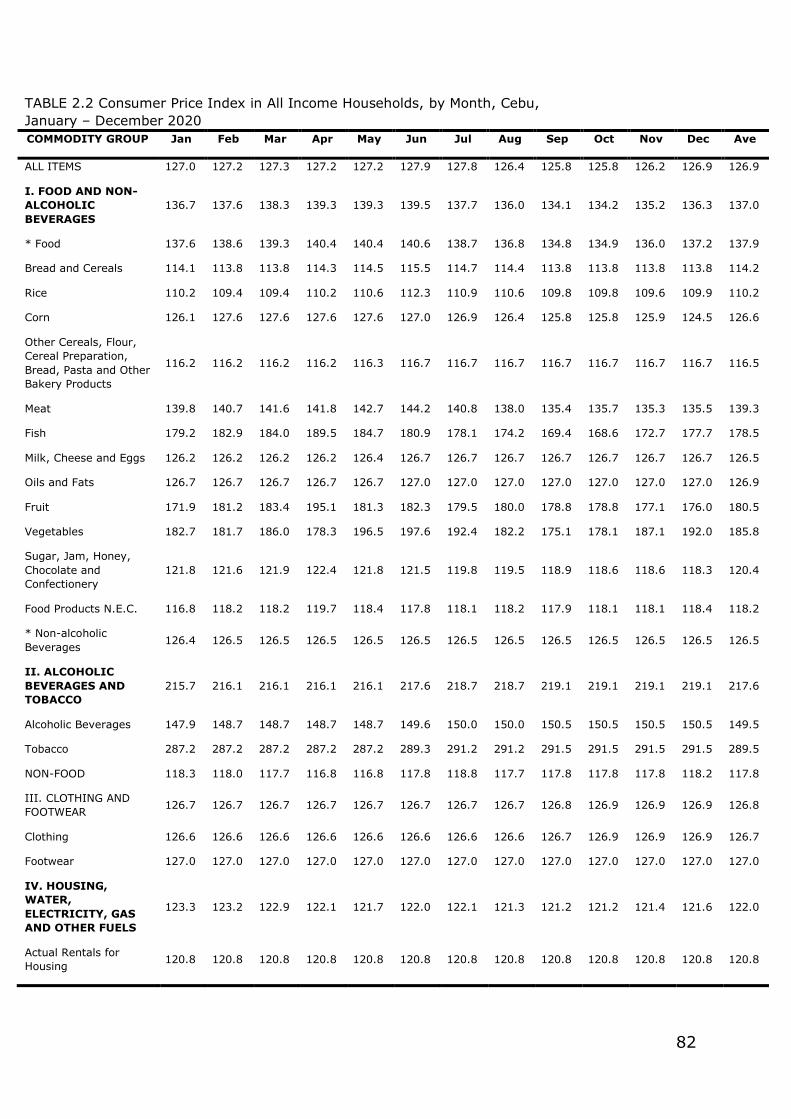
82
TABLE 2.2 Consumer Price Index in All Income Households, by Month, Cebu,
January – December 2020 COMMODITY GROUP Jan Feb Mar Apr May Jun Jul Aug Sep Oct Nov Dec Ave
ALL ITEMS 127.0 127.2 127.3 127.2 127.2 127.9 127.8 126.4 125.8 125.8 126.2 126.9 126.9
I. FOOD AND NON-
ALCOHOLIC
BEVERAGES
136.7 137.6 138.3 139.3 139.3 139.5 137.7 136.0 134.1 134.2 135.2 136.3 137.0
* Food 137.6 138.6 139.3 140.4 140.4 140.6 138.7 136.8 134.8 134.9 136.0 137.2 137.9
Bread and Cereals 114.1 113.8 113.8 114.3 114.5 115.5 114.7 114.4 113.8 113.8 113.8 113.8 114.2
Rice 110.2 109.4 109.4 110.2 110.6 112.3 110.9 110.6 109.8 109.8 109.6 109.9 110.2
Corn 126.1 127.6 127.6 127.6 127.6 127.0 126.9 126.4 125.8 125.8 125.9 124.5 126.6
Other Cereals, Flour,
Cereal Preparation,
Bread, Pasta and Other
Bakery Products
116.2 116.2 116.2 116.2 116.3 116.7 116.7 116.7 116.7 116.7 116.7 116.7 116.5
Meat 139.8 140.7 141.6 141.8 142.7 144.2 140.8 138.0 135.4 135.7 135.3 135.5 139.3
Fish 179.2 182.9 184.0 189.5 184.7 180.9 178.1 174.2 169.4 168.6 172.7 177.7 178.5
Milk, Cheese and Eggs 126.2 126.2 126.2 126.2 126.4 126.7 126.7 126.7 126.7 126.7 126.7 126.7 126.5
Oils and Fats 126.7 126.7 126.7 126.7 126.7 127.0 127.0 127.0 127.0 127.0 127.0 127.0 126.9
Fruit 171.9 181.2 183.4 195.1 181.3 182.3 179.5 180.0 178.8 178.8 177.1 176.0 180.5
Vegetables 182.7 181.7 186.0 178.3 196.5 197.6 192.4 182.2 175.1 178.1 187.1 192.0 185.8
Sugar, Jam, Honey,
Chocolate and
Confectionery
121.8 121.6 121.9 122.4 121.8 121.5 119.8 119.5 118.9 118.6 118.6 118.3 120.4
Food Products N.E.C. 116.8 118.2 118.2 119.7 118.4 117.8 118.1 118.2 117.9 118.1 118.1 118.4 118.2
* Non-alcoholic
Beverages 126.4 126.5 126.5 126.5 126.5 126.5 126.5 126.5 126.5 126.5 126.5 126.5 126.5
II. ALCOHOLIC
BEVERAGES AND
TOBACCO
215.7 216.1 216.1 216.1 216.1 217.6 218.7 218.7 219.1 219.1 219.1 219.1 217.6
Alcoholic Beverages 147.9 148.7 148.7 148.7 148.7 149.6 150.0 150.0 150.5 150.5 150.5 150.5 149.5
Tobacco 287.2 287.2 287.2 287.2 287.2 289.3 291.2 291.2 291.5 291.5 291.5 291.5 289.5
NON-FOOD 118.3 118.0 117.7 116.8 116.8 117.8 118.8 117.7 117.8 117.8 117.8 118.2 117.8
III. CLOTHING AND
FOOTWEAR 126.7 126.7 126.7 126.7 126.7 126.7 126.7 126.7 126.8 126.9 126.9 126.9 126.8
Clothing 126.6 126.6 126.6 126.6 126.6 126.6 126.6 126.6 126.7 126.9 126.9 126.9 126.7
Footwear 127.0 127.0 127.0 127.0 127.0 127.0 127.0 127.0 127.0 127.0 127.0 127.0 127.0
IV. HOUSING,
WATER,
ELECTRICITY, GAS
AND OTHER FUELS
123.3 123.2 122.9 122.1 121.7 122.0 122.1 121.3 121.2 121.2 121.4 121.6 122.0
Actual Rentals for
Housing 120.8 120.8 120.8 120.8 120.8 120.8 120.8 120.8 120.8 120.8 120.8 120.8 120.8
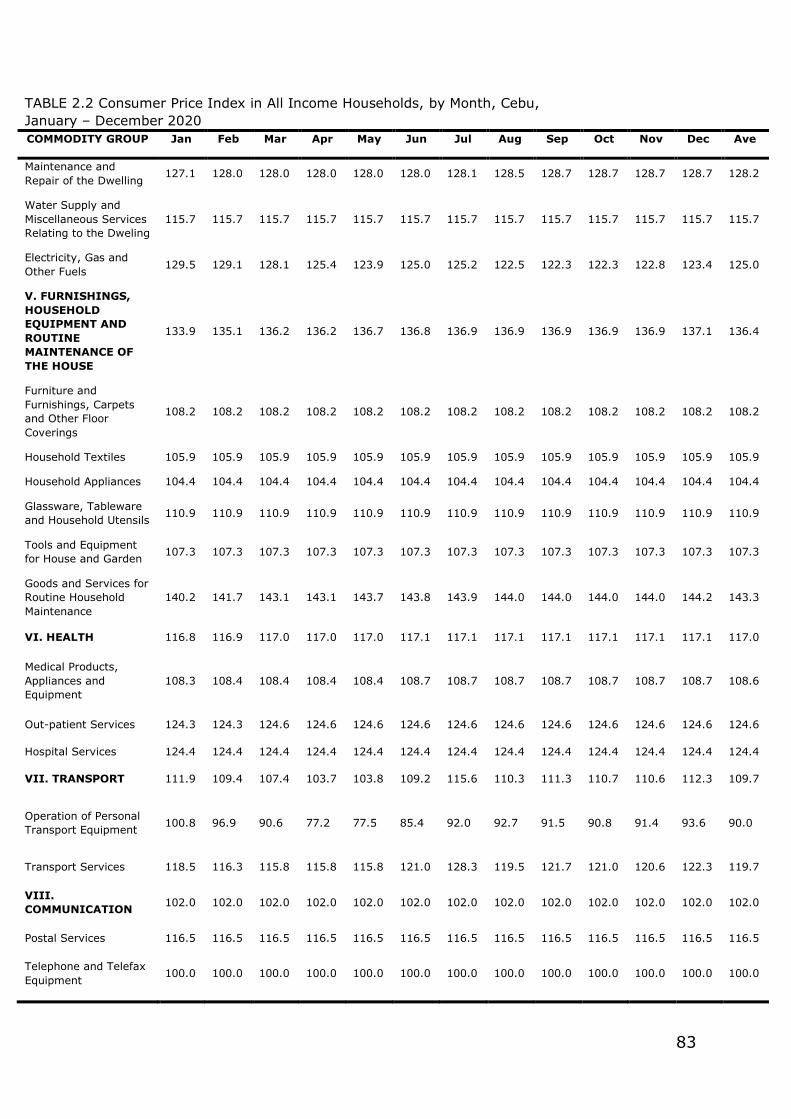
83
TABLE 2.2 Consumer Price Index in All Income Households, by Month, Cebu,
January – December 2020 COMMODITY GROUP Jan Feb Mar Apr May Jun Jul Aug Sep Oct Nov Dec Ave
Maintenance and
Repair of the Dwelling 127.1 128.0 128.0 128.0 128.0 128.0 128.1 128.5 128.7 128.7 128.7 128.7 128.2
Water Supply and
Miscellaneous Services
Relating to the Dweling
115.7 115.7 115.7 115.7 115.7 115.7 115.7 115.7 115.7 115.7 115.7 115.7 115.7
Electricity, Gas and
Other Fuels 129.5 129.1 128.1 125.4 123.9 125.0 125.2 122.5 122.3 122.3 122.8 123.4 125.0
V. FURNISHINGS,
HOUSEHOLD
EQUIPMENT AND
ROUTINE
MAINTENANCE OF
THE HOUSE
133.9 135.1 136.2 136.2 136.7 136.8 136.9 136.9 136.9 136.9 136.9 137.1 136.4
Furniture and
Furnishings, Carpets
and Other Floor
Coverings
108.2 108.2 108.2 108.2 108.2 108.2 108.2 108.2 108.2 108.2 108.2 108.2 108.2
Household Textiles 105.9 105.9 105.9 105.9 105.9 105.9 105.9 105.9 105.9 105.9 105.9 105.9 105.9
Household Appliances 104.4 104.4 104.4 104.4 104.4 104.4 104.4 104.4 104.4 104.4 104.4 104.4 104.4
Glassware, Tableware
and Household Utensils 110.9 110.9 110.9 110.9 110.9 110.9 110.9 110.9 110.9 110.9 110.9 110.9 110.9
Tools and Equipment
for House and Garden 107.3 107.3 107.3 107.3 107.3 107.3 107.3 107.3 107.3 107.3 107.3 107.3 107.3
Goods and Services for
Routine Household
Maintenance
140.2 141.7 143.1 143.1 143.7 143.8 143.9 144.0 144.0 144.0 144.0 144.2 143.3
VI. HEALTH 116.8 116.9 117.0 117.0 117.0 117.1 117.1 117.1 117.1 117.1 117.1 117.1 117.0
Medical Products,
Appliances and
Equipment
108.3 108.4 108.4 108.4 108.4 108.7 108.7 108.7 108.7 108.7 108.7 108.7 108.6
Out-patient Services 124.3 124.3 124.6 124.6 124.6 124.6 124.6 124.6 124.6 124.6 124.6 124.6 124.6
Hospital Services 124.4 124.4 124.4 124.4 124.4 124.4 124.4 124.4 124.4 124.4 124.4 124.4 124.4
VII. TRANSPORT 111.9 109.4 107.4 103.7 103.8 109.2 115.6 110.3 111.3 110.7 110.6 112.3 109.7
Operation of Personal
Transport Equipment 100.8 96.9 90.6 77.2 77.5 85.4 92.0 92.7 91.5 90.8 91.4 93.6 90.0
Transport Services 118.5 116.3 115.8 115.8 115.8 121.0 128.3 119.5 121.7 121.0 120.6 122.3 119.7
VIII.
COMMUNICATION 102.0 102.0 102.0 102.0 102.0 102.0 102.0 102.0 102.0 102.0 102.0 102.0 102.0
Postal Services 116.5 116.5 116.5 116.5 116.5 116.5 116.5 116.5 116.5 116.5 116.5 116.5 116.5
Telephone and Telefax
Equipment 100.0 100.0 100.0 100.0 100.0 100.0 100.0 100.0 100.0 100.0 100.0 100.0 100.0
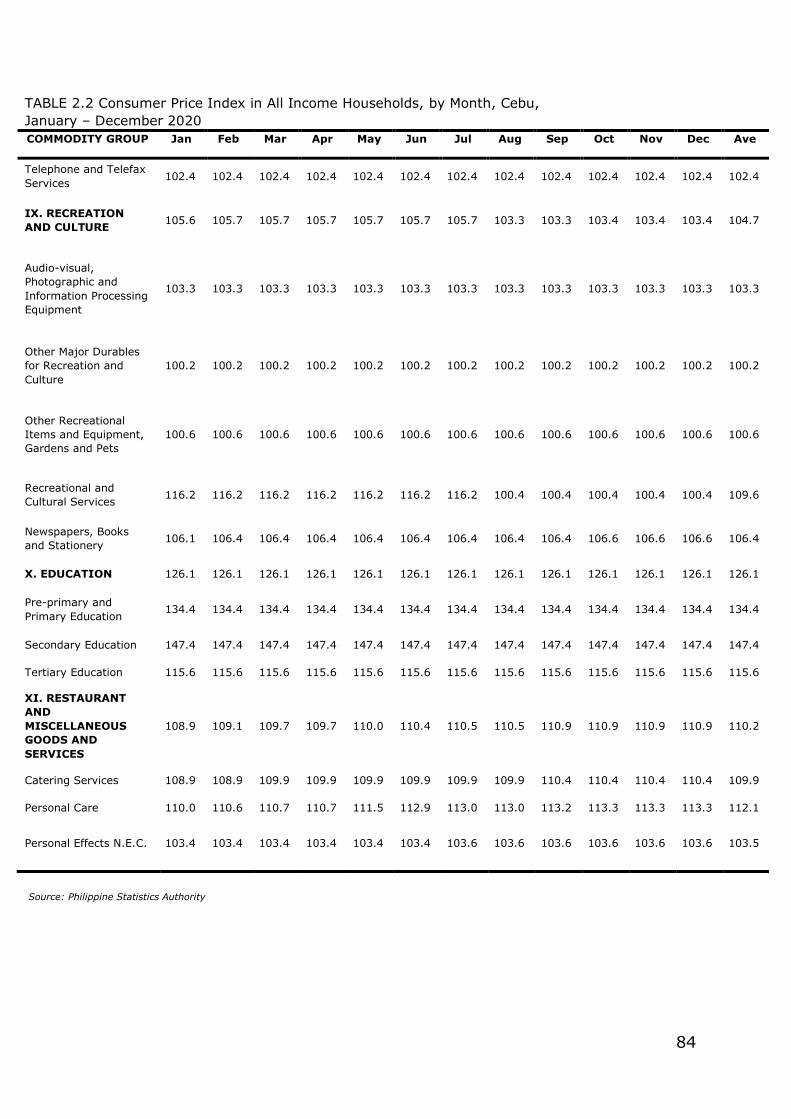
84
Source: Philippine Statistics Authority
TABLE 2.2 Consumer Price Index in All Income Households, by Month, Cebu,
January – December 2020 COMMODITY GROUP Jan Feb Mar Apr May Jun Jul Aug Sep Oct Nov Dec Ave
Telephone and Telefax
Services 102.4 102.4 102.4 102.4 102.4 102.4 102.4 102.4 102.4 102.4 102.4 102.4 102.4
IX. RECREATION
AND CULTURE 105.6 105.7 105.7 105.7 105.7 105.7 105.7 103.3 103.3 103.4 103.4 103.4 104.7
Audio-visual,
Photographic and
Information Processing
Equipment
103.3 103.3 103.3 103.3 103.3 103.3 103.3 103.3 103.3 103.3 103.3 103.3 103.3
Other Major Durables
for Recreation and
Culture
100.2 100.2 100.2 100.2 100.2 100.2 100.2 100.2 100.2 100.2 100.2 100.2 100.2
Other Recreational
Items and Equipment,
Gardens and Pets
100.6 100.6 100.6 100.6 100.6 100.6 100.6 100.6 100.6 100.6 100.6 100.6 100.6
Recreational and
Cultural Services 116.2 116.2 116.2 116.2 116.2 116.2 116.2 100.4 100.4 100.4 100.4 100.4 109.6
Newspapers, Books
and Stationery 106.1 106.4 106.4 106.4 106.4 106.4 106.4 106.4 106.4 106.6 106.6 106.6 106.4
X. EDUCATION 126.1 126.1 126.1 126.1 126.1 126.1 126.1 126.1 126.1 126.1 126.1 126.1 126.1
Pre-primary and
Primary Education 134.4 134.4 134.4 134.4 134.4 134.4 134.4 134.4 134.4 134.4 134.4 134.4 134.4
Secondary Education 147.4 147.4 147.4 147.4 147.4 147.4 147.4 147.4 147.4 147.4 147.4 147.4 147.4
Tertiary Education 115.6 115.6 115.6 115.6 115.6 115.6 115.6 115.6 115.6 115.6 115.6 115.6 115.6
XI. RESTAURANT
AND
MISCELLANEOUS
GOODS AND
SERVICES
108.9 109.1 109.7 109.7 110.0 110.4 110.5 110.5 110.9 110.9 110.9 110.9 110.2
Catering Services 108.9 108.9 109.9 109.9 109.9 109.9 109.9 109.9 110.4 110.4 110.4 110.4 109.9
Personal Care 110.0 110.6 110.7 110.7 111.5 112.9 113.0 113.0 113.2 113.3 113.3 113.3 112.1
Personal Effects N.E.C. 103.4 103.4 103.4 103.4 103.4 103.4 103.6 103.6 103.6 103.6 103.6 103.6 103.5
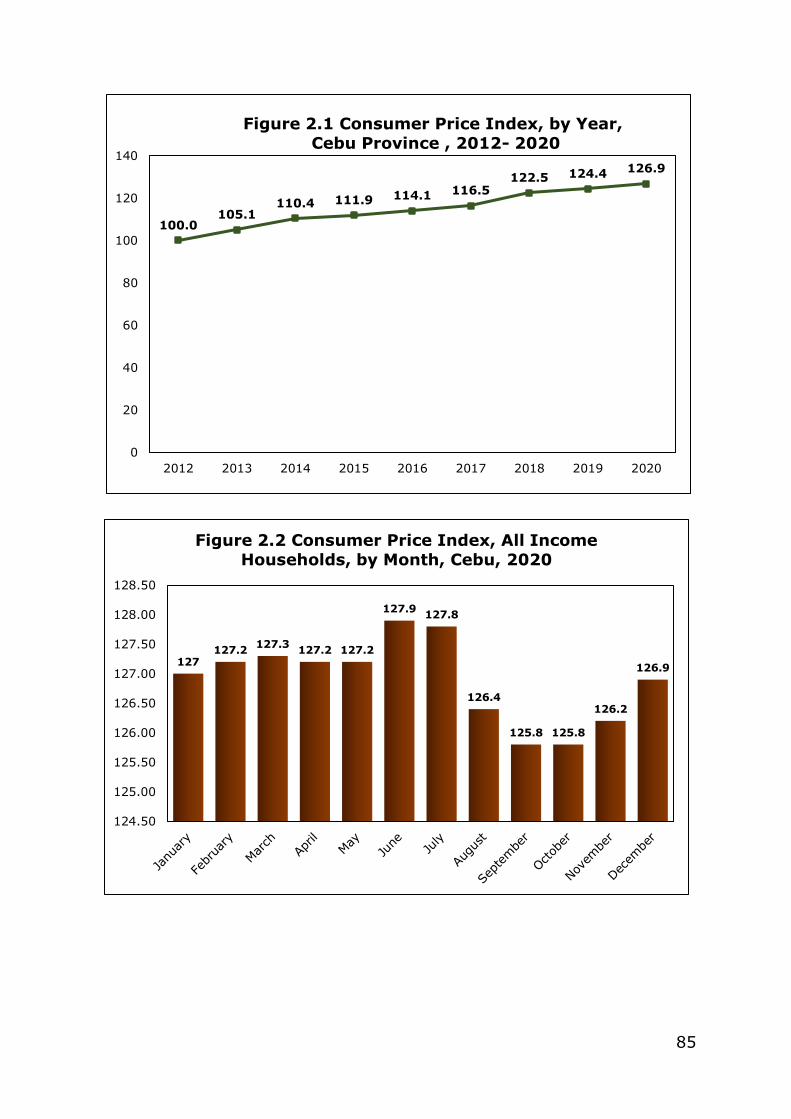
85
127127.2
127.3127.2 127.2
127.9127.8
126.4
125.8 125.8
126.2
126.9
124.50
125.00
125.50
126.00
126.50
127.00
127.50
128.00
128.50
Figure 2.2 Consumer Price Index, All Income
Households, by Month, Cebu, 2020
100.0105.1
110.4 111.9 114.1 116.5122.5 124.4 126.9
0
20
40
60
80
100
120
140
2012 2013 2014 2015 2016 2017 2018 2019 2020
Figure 2.1 Consumer Price Index, by Year,
Cebu Province , 2012- 2020
86
CHAPTER 3. AGRICULTURE
This chapter presents various data on the Crops statistics in Cebu
province for the year 2020 and selected data of the result of the 2012
Census of Agriculture and Fisheries (CAF).
Highlights:
Crops Statistics 2019 and 2020
The palay and corn production data are derived from the results of
the Quarterly Palay and Corn Production Survey conducted by the Philippine
Statistics Authority in the province of Cebu for the year 2019 and 2020. In
2020, Palay production in Cebu province decreased by 1.78% from 11.41
thousand metric tons in 2019 to 11.21 thousand metric tons in 2020.
Total area harvested for Palay reduced by 5% in 2020 from 3.82
thousand hectares in 2019 to 3.63 thousand hectares in 2020. In 2020,
94% of palay are produced from irrigated farms while 4% of palay are
produced from rainfed farms.
Meanwhile, Corn production in Cebu province further increased by
37.4% in 2020, from 46.84 thousand metric tons in 2019 to 64.37
thousand metric tons in 2020. As the volume of Corn production increases
in 2020, the area harvested for Corn also increased by 9% from 60.45
thousand hectares in 2019 to 66.04 thousand hectares in 2020.
Of the 64.37 thousand metric tons of Corn produced in Cebu
province, 97.6% or 62.81 thousand metric tons are white and 2.4% or 1.57
thousand metric tons are yellow.
For other crops, the crop with the largest volume of production in
2020 was the sugarcane for centrifugal sugar with 227.82 thousand metric
tons harvested with an area of 5.65 thousand hectares. This was followed
by Coconut with husk with 109.27 thousand metric tons of production with
an area of 38.81 thousand hectares. Next to Coconut is Banana with 86.22
thousand metric tons with an area of 9.25 thousand hectares. Mature
Coconut, Mango, Young Coconut, Napier Grass, Cassava, Sweet Potato,
and Eggplant were among the highest crop production in Cebu province for
the year 2020.
Livestock and Poultry
The volume of production in 2020 for Carabao decreased by 1.3
thousand metric tons from 2.16 thousand metric tons in 2019 to only 0.77
thousand metric tons of Carabao produced in 2020. Volume of production
for Cattle also decreased by 25.18% from 10.12 thousand metric tons in
2019 to 7.57 thousand metric tons in 2020. A decreased of 1.18% in the
production of Hogs was noted, from 101.09 thousand metric tons in 2019
87
to 99.90 thousand metric tons in 2020. On the other hand, an increase of
0.67% in the production of Goat from 5.32 thousand metric tons in 2019
to 5.35 thousand metric tons in 2020.
A decreased in the production of Chicken and Duck egg was noted in
the year 2020; a decreased of 1.94% for Chicken production from 68.79
thousand metric tons in 2019 to 67.45 thousand metric tons in 2020 and a
decreased of 6.53% in the production of Duck egg from 11.78 metric tons
in 2019 to 11.01 metric tons in 2020. On the other hand, an increase of
4.97% in the production of Chicken egg in the year 2020 compared to 2019
and a 2.87% in the production of Duck in the year 2020 compared to 2019
respectively.
In Cebu province, total production of fish reached to 9.86 thousand
metric tons which resulted to an increase of 60.32% compared to the
production of fish in 2019 at 6.15 thousand metric tons. Among the species
of fish produced in Cebu, the specie with highest production was the Bali
sardinella (Tamban) with 3.90 thousand metric tons of production in 2020.
This was followed by Fimbriated sardines (Tunsoy) with 1.02 thousand
metric tons of production. Anchovies (Dilis), Big-eyed Scad (Matangbaka)
and Roundscad (Galunggong) are among the top five species of fish with
the highest volume of production in 2020.
2012 Census of Agriculture and Fisheries
In Cebu province the number of agricultural farms reached to
149,421 with an area of 72.50 thousand hectares in 2012. This resulted to
an average area of each agricultural farms at 0.5 hectares. The municipality
of Dalaguete had the largest number of agricultural farms with 8,783 or
5.87% from the total agricultural farms in Cebu province. This was followed
by Argao with 8,658 agricultural farms or 5.79%. Next to Arago was Cebu
City with 7,468 agricultural farms or 4.99% from the total agricultural
farms in the province. The Municipality of Cordova had the least number of
agricultural farms with only 64 agricultural farms or 0.04% from the
province total agricultural farms.
Of the 149,421 agricultural farms in Cebu province, 99.99% or
149,350 of agricultural farms are managed by the household sector which
can either be manage by individual proprietor or partnership while 0.01%
or 71 agricultural farms are managed by the non-household sector.
In 2012, there were 194,236 farm parcels in Cebu province with an
area of 72.50 thousand hectares and an average area of 0.4 hectares per
farm parcels. The municipality of Dalaguete had the largest number of farm
parcels with 13,509 or 6.95% from the province total farm parcels. This
was followed by municipality of Argao with 11,437 number of farm parcels
or 5.89%. The municipality with the least number of farm parcels was in
88
Cordova with only 67 farm parcels or 0.03% from the province total number
of farm parcels.
The crop with the highest number of farm parcels was the Coconut
with 6,895 farm parcels with an area of 3,739 hectares. This is followed by
Banana with 5,141 with an area of 982 hectares.
About 12.43% of the agricultural operators in Cebu province,
belonged to the 50 to 54 years age group. Following closely were those in
the age group 45 to 49 years (12.05%) and those in the 40 to 44 years
(11.36%).
Majority of the agricultural operators were males (74%) and there
were 26% were female agricultural operators.
Of the 1,066 barangays in Cebu province, 289 barangays or 27.11%
have Fish Landing Centers. 17.64% or 188 barangays have Nursery/ Greenhouse, 13.13% or 140 barangays have Periodic or Permanent
Agricultural Produce Market (Bagsakan/ Bulungan), 13.70% or 146
barangays have Rice or Corn Mill.
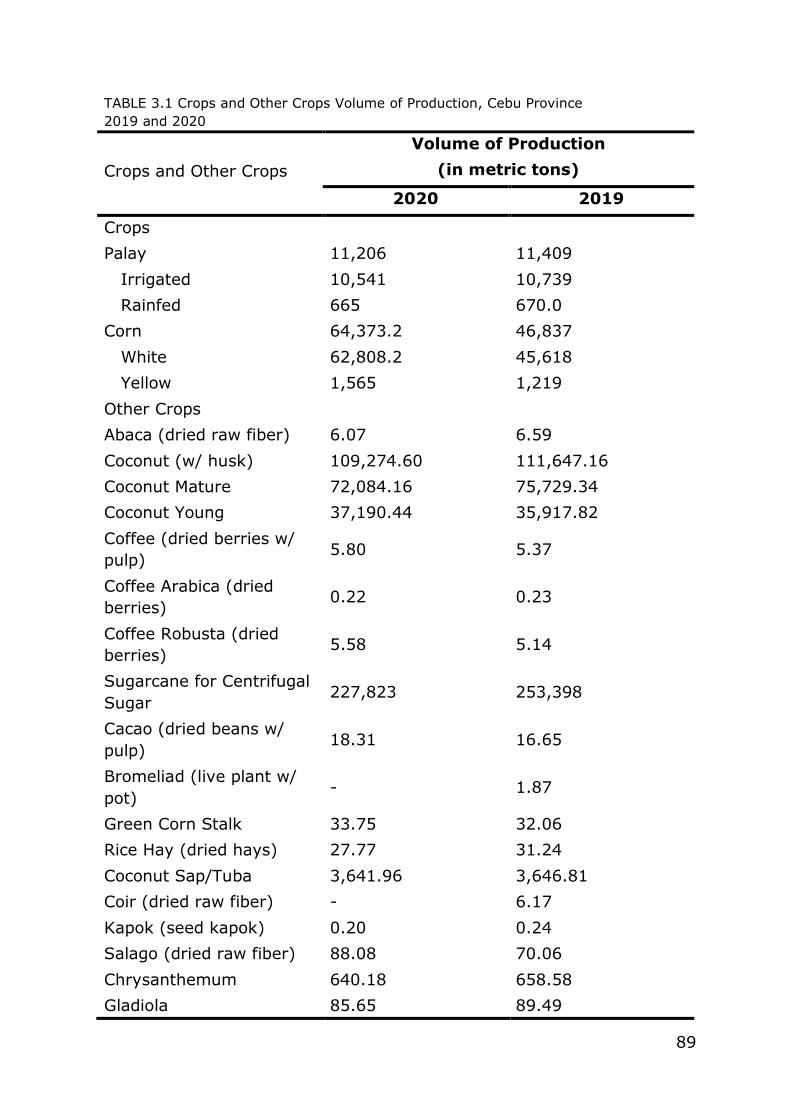
89
TABLE 3.1 Crops and Other Crops Volume of Production, Cebu Province
2019 and 2020
Crops and Other Crops
Volume of Production
(in metric tons)
2020 2019
Crops
Palay 11,206 11,409
Irrigated 10,541 10,739
Rainfed 665 670.0
Corn 64,373.2 46,837
White 62,808.2 45,618
Yellow 1,565 1,219
Other Crops
Abaca (dried raw fiber) 6.07 6.59
Coconut (w/ husk) 109,274.60 111,647.16
Coconut Mature 72,084.16 75,729.34
Coconut Young 37,190.44 35,917.82
Coffee (dried berries w/
pulp) 5.80 5.37
Coffee Arabica (dried
berries) 0.22 0.23
Coffee Robusta (dried
berries) 5.58 5.14
Sugarcane for Centrifugal
Sugar 227,823 253,398
Cacao (dried beans w/
pulp) 18.31 16.65
Bromeliad (live plant w/
pot) - 1.87
Green Corn Stalk 33.75 32.06
Rice Hay (dried hays) 27.77 31.24
Coconut Sap/Tuba 3,641.96 3,646.81
Coir (dried raw fiber) - 6.17
Kapok (seed kapok) 0.20 0.24
Salago (dried raw fiber) 88.08 70.06
Chrysanthemum 640.18 658.58
Gladiola 85.65 89.49
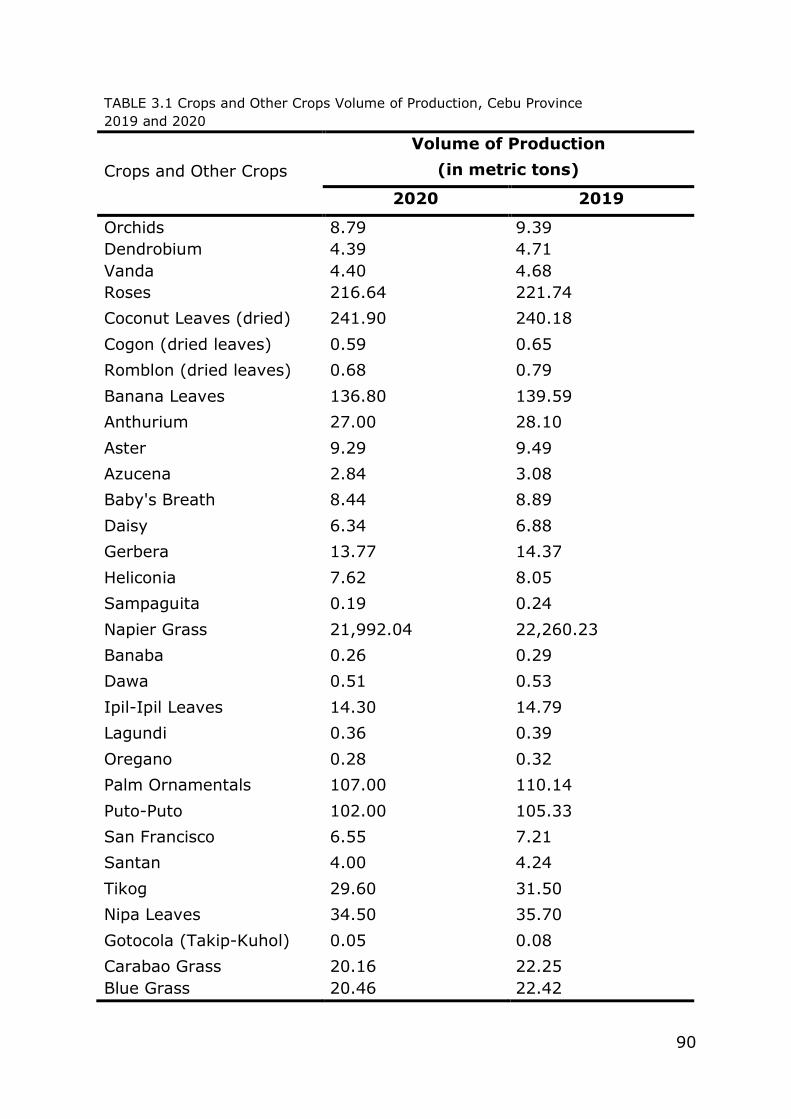
90
TABLE 3.1 Crops and Other Crops Volume of Production, Cebu Province
2019 and 2020
Crops and Other Crops
Volume of Production
(in metric tons)
2020 2019
Orchids 8.79 9.39
Dendrobium 4.39 4.71
Vanda 4.40 4.68
Roses 216.64 221.74
Coconut Leaves (dried) 241.90 240.18
Cogon (dried leaves) 0.59 0.65
Romblon (dried leaves) 0.68 0.79
Banana Leaves 136.80 139.59
Anthurium 27.00 28.10
Aster 9.29 9.49
Azucena 2.84 3.08
Baby's Breath 8.44 8.89
Daisy 6.34 6.88
Gerbera 13.77 14.37
Heliconia 7.62 8.05
Sampaguita 0.19 0.24
Napier Grass 21,992.04 22,260.23
Banaba 0.26 0.29
Dawa 0.51 0.53
Ipil-Ipil Leaves 14.30 14.79
Lagundi 0.36 0.39
Oregano 0.28 0.32
Palm Ornamentals 107.00 110.14
Puto-Puto 102.00 105.33
San Francisco 6.55 7.21
Santan 4.00 4.24
Tikog 29.60 31.50
Nipa Leaves 34.50 35.70
Gotocola (Takip-Kuhol) 0.05 0.08
Carabao Grass 20.16 22.25
Blue Grass 20.46 22.42
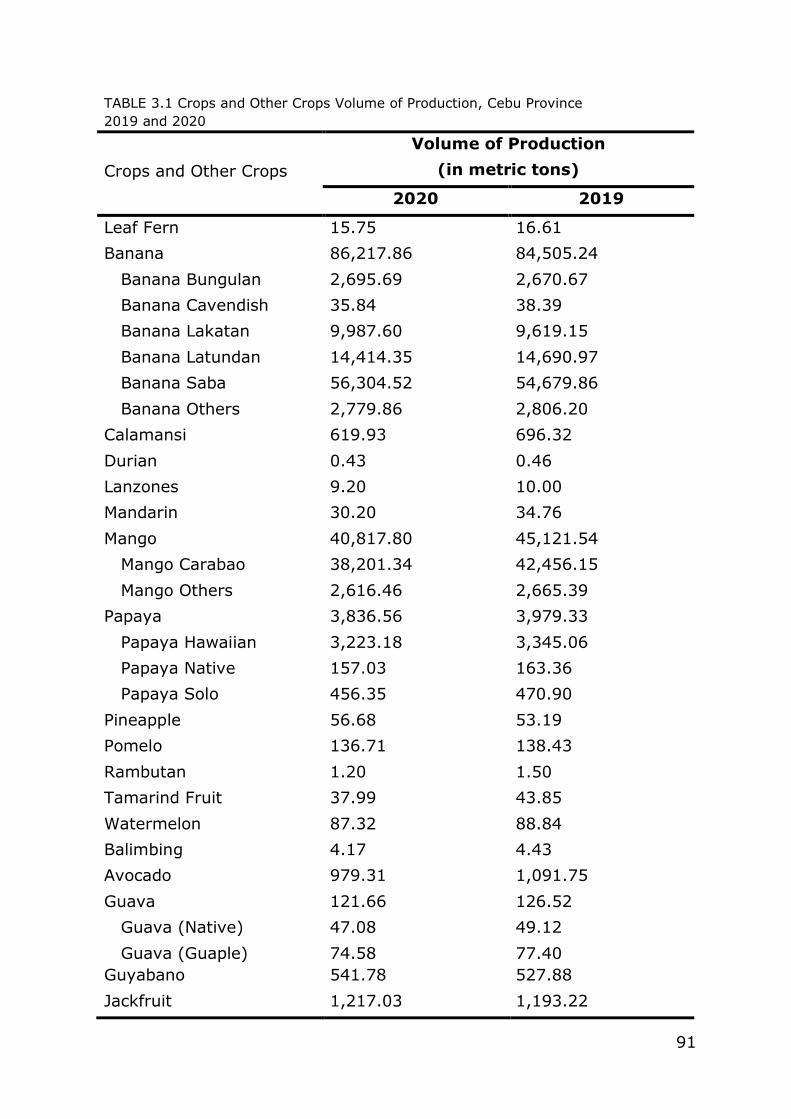
91
TABLE 3.1 Crops and Other Crops Volume of Production, Cebu Province
2019 and 2020
Crops and Other Crops
Volume of Production
(in metric tons)
2020 2019
Leaf Fern 15.75 16.61
Banana 86,217.86 84,505.24
Banana Bungulan 2,695.69 2,670.67
Banana Cavendish 35.84 38.39
Banana Lakatan 9,987.60 9,619.15
Banana Latundan 14,414.35 14,690.97
Banana Saba 56,304.52 54,679.86
Banana Others 2,779.86 2,806.20
Calamansi 619.93 696.32
Durian 0.43 0.46
Lanzones 9.20 10.00
Mandarin 30.20 34.76
Mango 40,817.80 45,121.54
Mango Carabao 38,201.34 42,456.15
Mango Others 2,616.46 2,665.39
Papaya 3,836.56 3,979.33
Papaya Hawaiian 3,223.18 3,345.06
Papaya Native 157.03 163.36
Papaya Solo 456.35 470.90
Pineapple 56.68 53.19
Pomelo 136.71 138.43
Rambutan 1.20 1.50
Tamarind Fruit 37.99 43.85
Watermelon 87.32 88.84
Balimbing 4.17 4.43
Avocado 979.31 1,091.75
Guava 121.66 126.52
Guava (Native) 47.08 49.12
Guava (Guaple) 74.58 77.40
Guyabano 541.78 527.88
Jackfruit 1,217.03 1,193.22
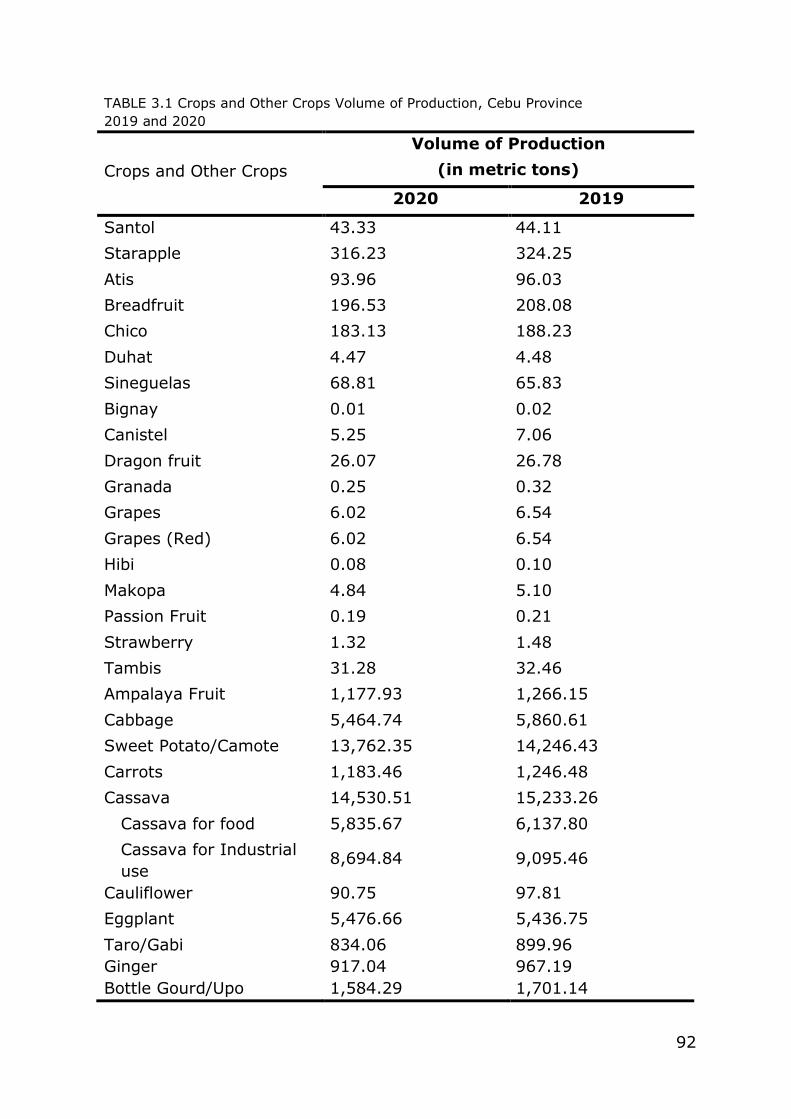
92
TABLE 3.1 Crops and Other Crops Volume of Production, Cebu Province
2019 and 2020
Crops and Other Crops
Volume of Production
(in metric tons)
2020 2019
Santol 43.33 44.11
Starapple 316.23 324.25
Atis 93.96 96.03
Breadfruit 196.53 208.08
Chico 183.13 188.23
Duhat 4.47 4.48
Sineguelas 68.81 65.83
Bignay 0.01 0.02
Canistel 5.25 7.06
Dragon fruit 26.07 26.78
Granada 0.25 0.32
Grapes 6.02 6.54
Grapes (Red) 6.02 6.54
Hibi 0.08 0.10
Makopa 4.84 5.10
Passion Fruit 0.19 0.21
Strawberry 1.32 1.48
Tambis 31.28 32.46
Ampalaya Fruit 1,177.93 1,266.15
Cabbage 5,464.74 5,860.61
Sweet Potato/Camote 13,762.35 14,246.43
Carrots 1,183.46 1,246.48
Cassava 14,530.51 15,233.26
Cassava for food 5,835.67 6,137.80
Cassava for Industrial
use 8,694.84 9,095.46
Cauliflower 90.75 97.81
Eggplant 5,476.66 5,436.75
Taro/Gabi 834.06 899.96
Ginger 917.04 967.19
Bottle Gourd/Upo 1,584.29 1,701.14
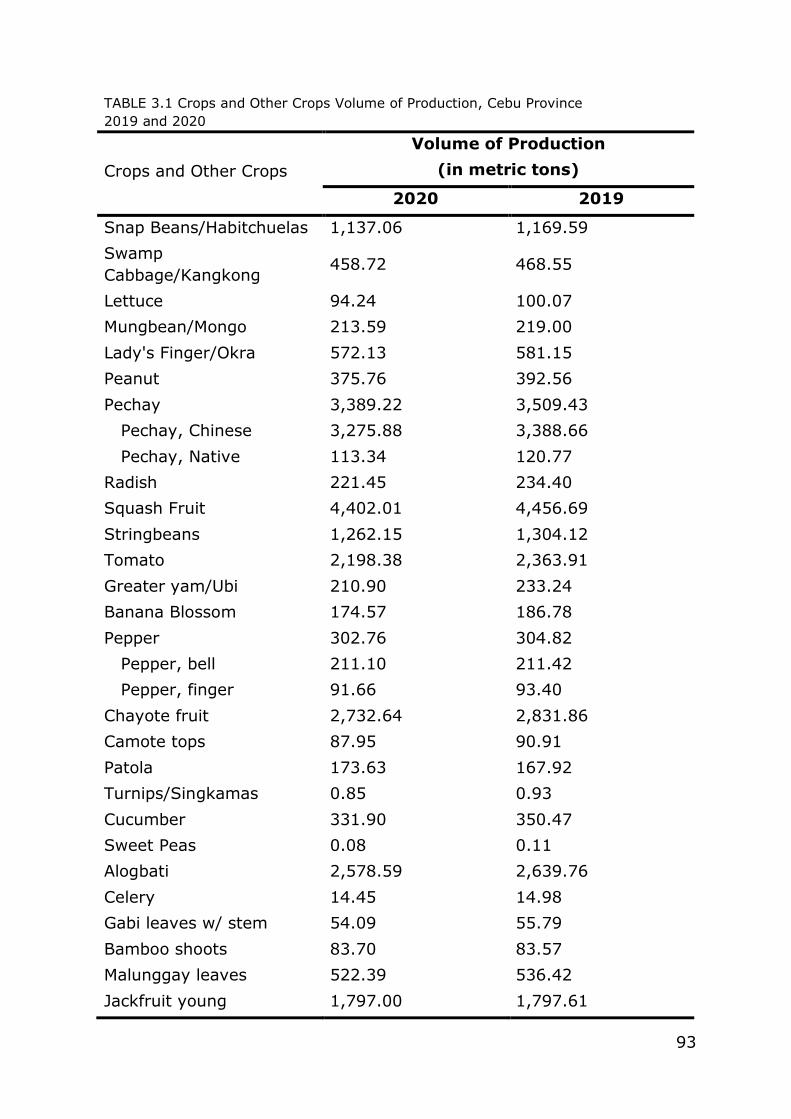
93
TABLE 3.1 Crops and Other Crops Volume of Production, Cebu Province
2019 and 2020
Crops and Other Crops
Volume of Production
(in metric tons)
2020 2019
Snap Beans/Habitchuelas 1,137.06 1,169.59
Swamp
Cabbage/Kangkong 458.72 468.55
Lettuce 94.24 100.07
Mungbean/Mongo 213.59 219.00
Lady's Finger/Okra 572.13 581.15
Peanut 375.76 392.56
Pechay 3,389.22 3,509.43
Pechay, Chinese 3,275.88 3,388.66
Pechay, Native 113.34 120.77
Radish 221.45 234.40
Squash Fruit 4,402.01 4,456.69
Stringbeans 1,262.15 1,304.12
Tomato 2,198.38 2,363.91
Greater yam/Ubi 210.90 233.24
Banana Blossom 174.57 186.78
Pepper 302.76 304.82
Pepper, bell 211.10 211.42
Pepper, finger 91.66 93.40
Chayote fruit 2,732.64 2,831.86
Camote tops 87.95 90.91
Patola 173.63 167.92
Turnips/Singkamas 0.85 0.93
Cucumber 331.90 350.47
Sweet Peas 0.08 0.11
Alogbati 2,578.59 2,639.76
Celery 14.45 14.98
Gabi leaves w/ stem 54.09 55.79
Bamboo shoots 83.70 83.57
Malunggay leaves 522.39 536.42
Jackfruit young 1,797.00 1,797.61
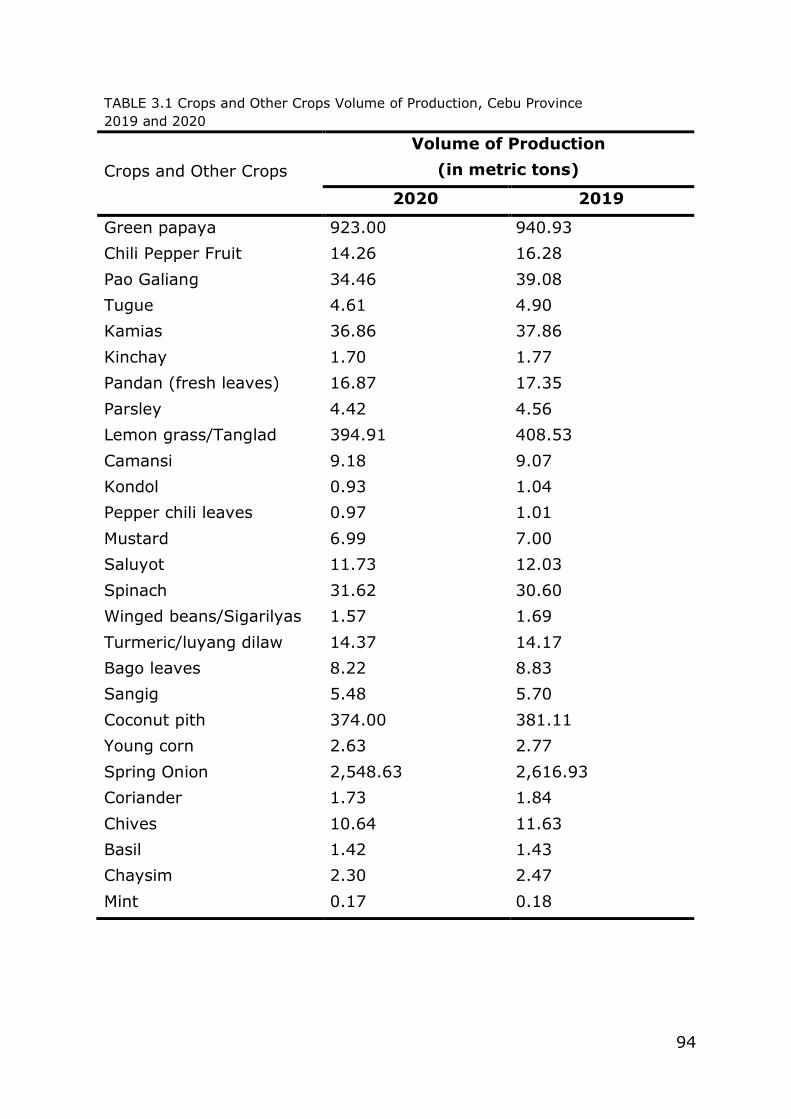
94
TABLE 3.1 Crops and Other Crops Volume of Production, Cebu Province
2019 and 2020
Crops and Other Crops
Volume of Production
(in metric tons)
2020 2019
Green papaya 923.00 940.93
Chili Pepper Fruit 14.26 16.28
Pao Galiang 34.46 39.08
Tugue 4.61 4.90
Kamias 36.86 37.86
Kinchay 1.70 1.77
Pandan (fresh leaves) 16.87 17.35
Parsley 4.42 4.56
Lemon grass/Tanglad 394.91 408.53
Camansi 9.18 9.07
Kondol 0.93 1.04
Pepper chili leaves 0.97 1.01
Mustard 6.99 7.00
Saluyot 11.73 12.03
Spinach 31.62 30.60
Winged beans/Sigarilyas 1.57 1.69
Turmeric/luyang dilaw 14.37 14.17
Bago leaves 8.22 8.83
Sangig 5.48 5.70
Coconut pith 374.00 381.11
Young corn 2.63 2.77
Spring Onion 2,548.63 2,616.93
Coriander 1.73 1.84
Chives 10.64 11.63
Basil 1.42 1.43
Chaysim 2.30 2.47
Mint 0.17 0.18
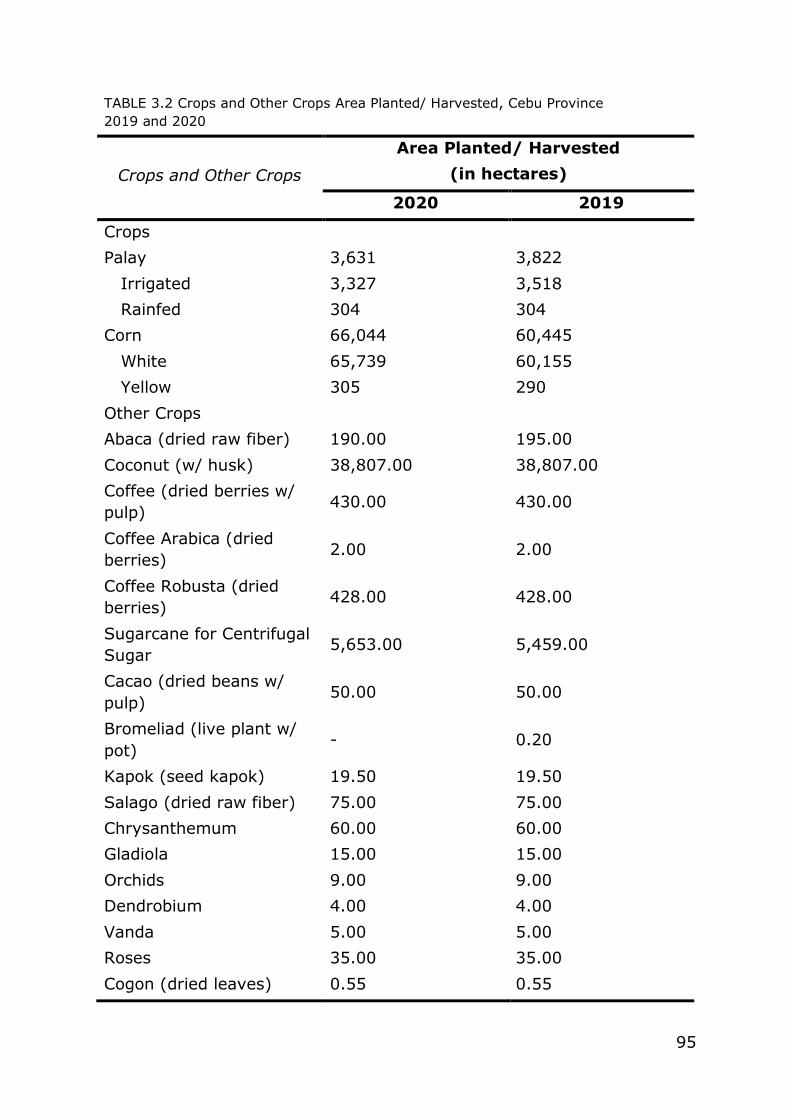
95
TABLE 3.2 Crops and Other Crops Area Planted/ Harvested, Cebu Province
2019 and 2020
Crops and Other Crops
Area Planted/ Harvested
(in hectares)
2020 2019
Crops
Palay 3,631 3,822
Irrigated 3,327 3,518
Rainfed 304 304
Corn 66,044 60,445
White 65,739 60,155
Yellow 305 290
Other Crops
Abaca (dried raw fiber) 190.00 195.00
Coconut (w/ husk) 38,807.00 38,807.00
Coffee (dried berries w/
pulp) 430.00 430.00
Coffee Arabica (dried
berries) 2.00 2.00
Coffee Robusta (dried
berries) 428.00 428.00
Sugarcane for Centrifugal
Sugar 5,653.00 5,459.00
Cacao (dried beans w/
pulp) 50.00 50.00
Bromeliad (live plant w/
pot) - 0.20
Kapok (seed kapok) 19.50 19.50
Salago (dried raw fiber) 75.00 75.00
Chrysanthemum 60.00 60.00
Gladiola 15.00 15.00
Orchids 9.00 9.00
Dendrobium 4.00 4.00
Vanda 5.00 5.00
Roses 35.00 35.00
Cogon (dried leaves) 0.55 0.55
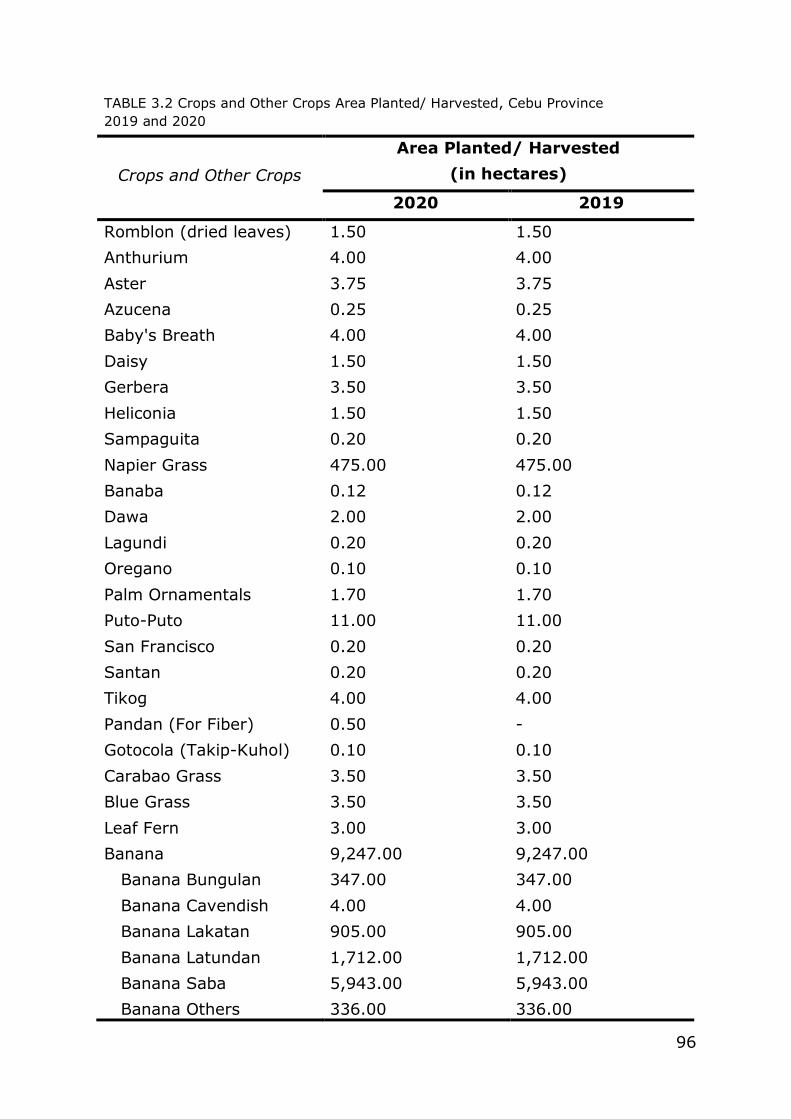
96
TABLE 3.2 Crops and Other Crops Area Planted/ Harvested, Cebu Province
2019 and 2020
Crops and Other Crops
Area Planted/ Harvested
(in hectares)
2020 2019
Romblon (dried leaves) 1.50 1.50
Anthurium 4.00 4.00
Aster 3.75 3.75
Azucena 0.25 0.25
Baby's Breath 4.00 4.00
Daisy 1.50 1.50
Gerbera 3.50 3.50
Heliconia 1.50 1.50
Sampaguita 0.20 0.20
Napier Grass 475.00 475.00
Banaba 0.12 0.12
Dawa 2.00 2.00
Lagundi 0.20 0.20
Oregano 0.10 0.10
Palm Ornamentals 1.70 1.70
Puto-Puto 11.00 11.00
San Francisco 0.20 0.20
Santan 0.20 0.20
Tikog 4.00 4.00
Pandan (For Fiber) 0.50 -
Gotocola (Takip-Kuhol) 0.10 0.10
Carabao Grass 3.50 3.50
Blue Grass 3.50 3.50
Leaf Fern 3.00 3.00
Banana 9,247.00 9,247.00
Banana Bungulan 347.00 347.00
Banana Cavendish 4.00 4.00
Banana Lakatan 905.00 905.00
Banana Latundan 1,712.00 1,712.00
Banana Saba 5,943.00 5,943.00
Banana Others 336.00 336.00
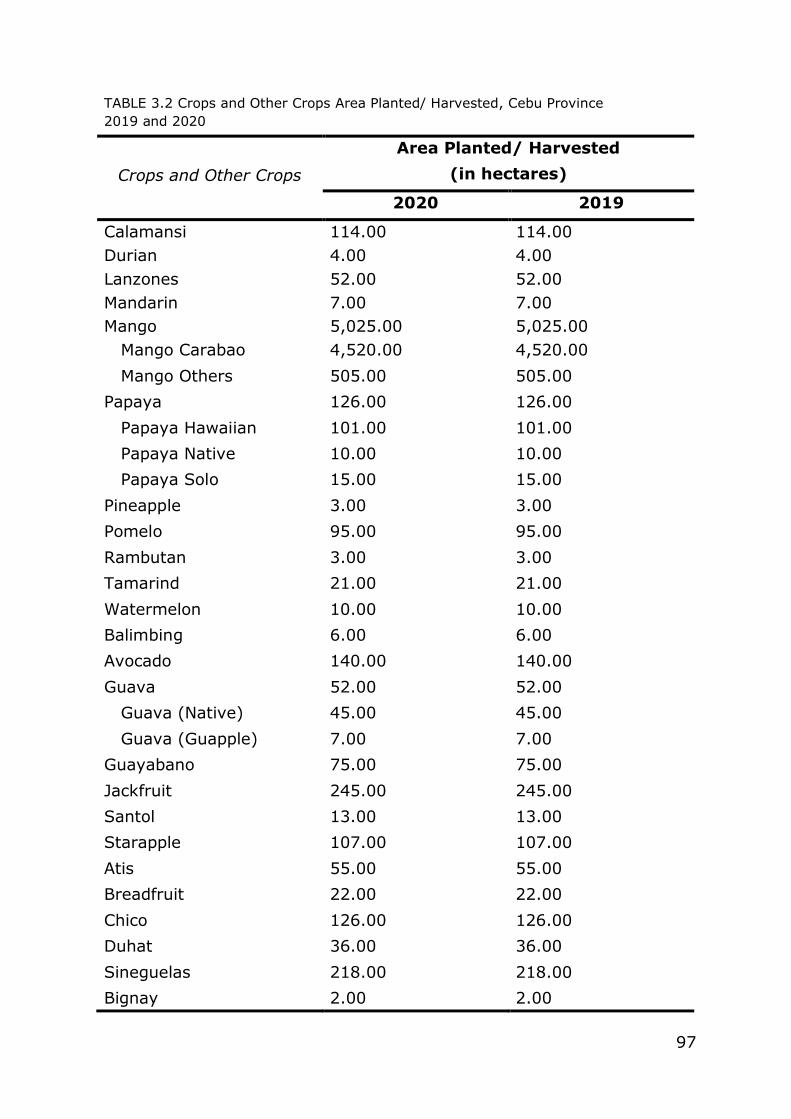
97
TABLE 3.2 Crops and Other Crops Area Planted/ Harvested, Cebu Province
2019 and 2020
Crops and Other Crops
Area Planted/ Harvested
(in hectares)
2020 2019
Calamansi 114.00 114.00
Durian 4.00 4.00
Lanzones 52.00 52.00
Mandarin 7.00 7.00
Mango 5,025.00 5,025.00
Mango Carabao 4,520.00 4,520.00
Mango Others 505.00 505.00
Papaya 126.00 126.00
Papaya Hawaiian 101.00 101.00
Papaya Native 10.00 10.00
Papaya Solo 15.00 15.00
Pineapple 3.00 3.00
Pomelo 95.00 95.00
Rambutan 3.00 3.00
Tamarind 21.00 21.00
Watermelon 10.00 10.00
Balimbing 6.00 6.00
Avocado 140.00 140.00
Guava 52.00 52.00
Guava (Native) 45.00 45.00
Guava (Guapple) 7.00 7.00
Guayabano 75.00 75.00
Jackfruit 245.00 245.00
Santol 13.00 13.00
Starapple 107.00 107.00
Atis 55.00 55.00
Breadfruit 22.00 22.00
Chico 126.00 126.00
Duhat 36.00 36.00
Sineguelas 218.00 218.00
Bignay 2.00 2.00
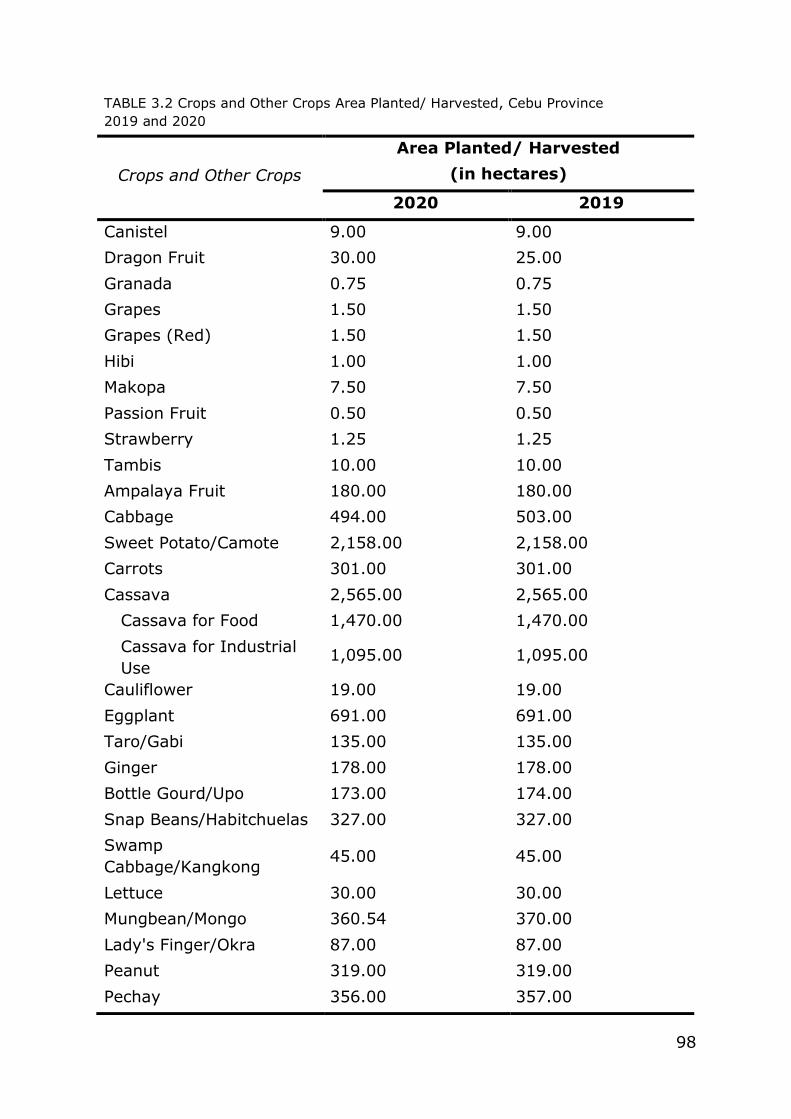
98
TABLE 3.2 Crops and Other Crops Area Planted/ Harvested, Cebu Province
2019 and 2020
Crops and Other Crops
Area Planted/ Harvested
(in hectares)
2020 2019
Canistel 9.00 9.00
Dragon Fruit 30.00 25.00
Granada 0.75 0.75
Grapes 1.50 1.50
Grapes (Red) 1.50 1.50
Hibi 1.00 1.00
Makopa 7.50 7.50
Passion Fruit 0.50 0.50
Strawberry 1.25 1.25
Tambis 10.00 10.00
Ampalaya Fruit 180.00 180.00
Cabbage 494.00 503.00
Sweet Potato/Camote 2,158.00 2,158.00
Carrots 301.00 301.00
Cassava 2,565.00 2,565.00
Cassava for Food 1,470.00 1,470.00
Cassava for Industrial
Use 1,095.00 1,095.00
Cauliflower 19.00 19.00
Eggplant 691.00 691.00
Taro/Gabi 135.00 135.00
Ginger 178.00 178.00
Bottle Gourd/Upo 173.00 174.00
Snap Beans/Habitchuelas 327.00 327.00
Swamp
Cabbage/Kangkong 45.00 45.00
Lettuce 30.00 30.00
Mungbean/Mongo 360.54 370.00
Lady's Finger/Okra 87.00 87.00
Peanut 319.00 319.00
Pechay 356.00 357.00
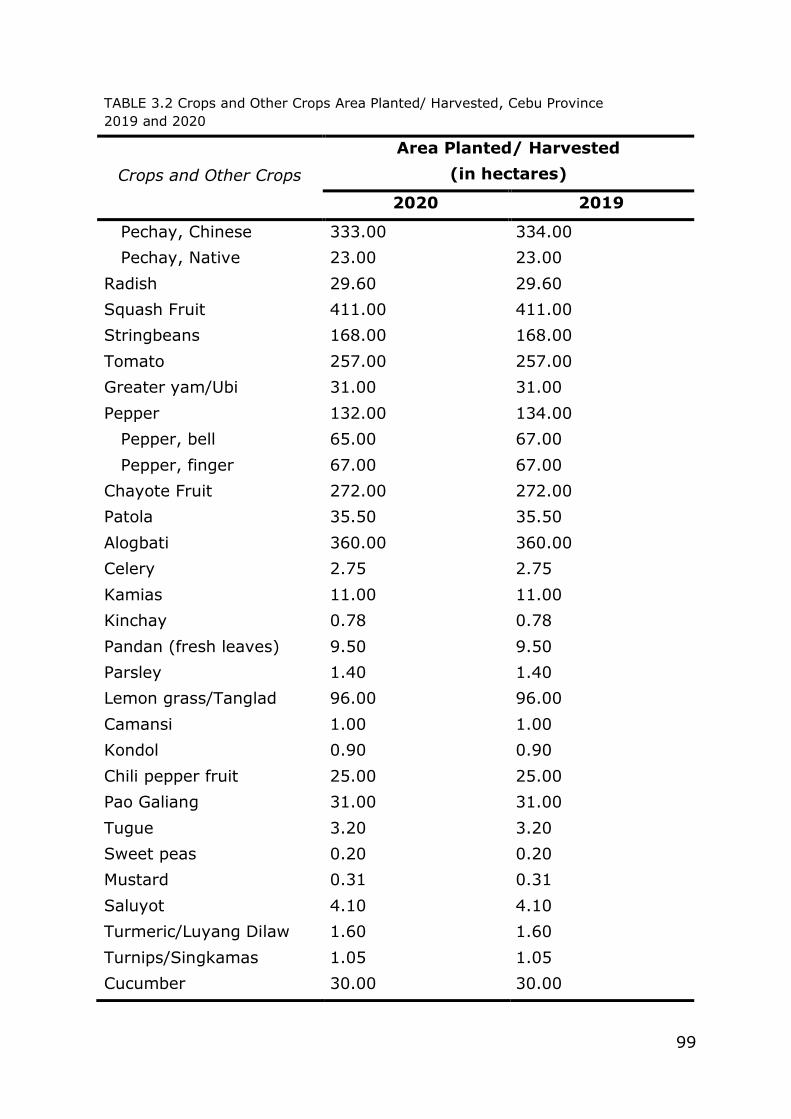
99
TABLE 3.2 Crops and Other Crops Area Planted/ Harvested, Cebu Province
2019 and 2020
Crops and Other Crops
Area Planted/ Harvested
(in hectares)
2020 2019
Pechay, Chinese 333.00 334.00
Pechay, Native 23.00 23.00
Radish 29.60 29.60
Squash Fruit 411.00 411.00
Stringbeans 168.00 168.00
Tomato 257.00 257.00
Greater yam/Ubi 31.00 31.00
Pepper 132.00 134.00
Pepper, bell 65.00 67.00
Pepper, finger 67.00 67.00
Chayote Fruit 272.00 272.00
Patola 35.50 35.50
Alogbati 360.00 360.00
Celery 2.75 2.75
Kamias 11.00 11.00
Kinchay 0.78 0.78
Pandan (fresh leaves) 9.50 9.50
Parsley 1.40 1.40
Lemon grass/Tanglad 96.00 96.00
Camansi 1.00 1.00
Kondol 0.90 0.90
Chili pepper fruit 25.00 25.00
Pao Galiang 31.00 31.00
Tugue 3.20 3.20
Sweet peas 0.20 0.20
Mustard 0.31 0.31
Saluyot 4.10 4.10
Turmeric/Luyang Dilaw 1.60 1.60
Turnips/Singkamas 1.05 1.05
Cucumber 30.00 30.00
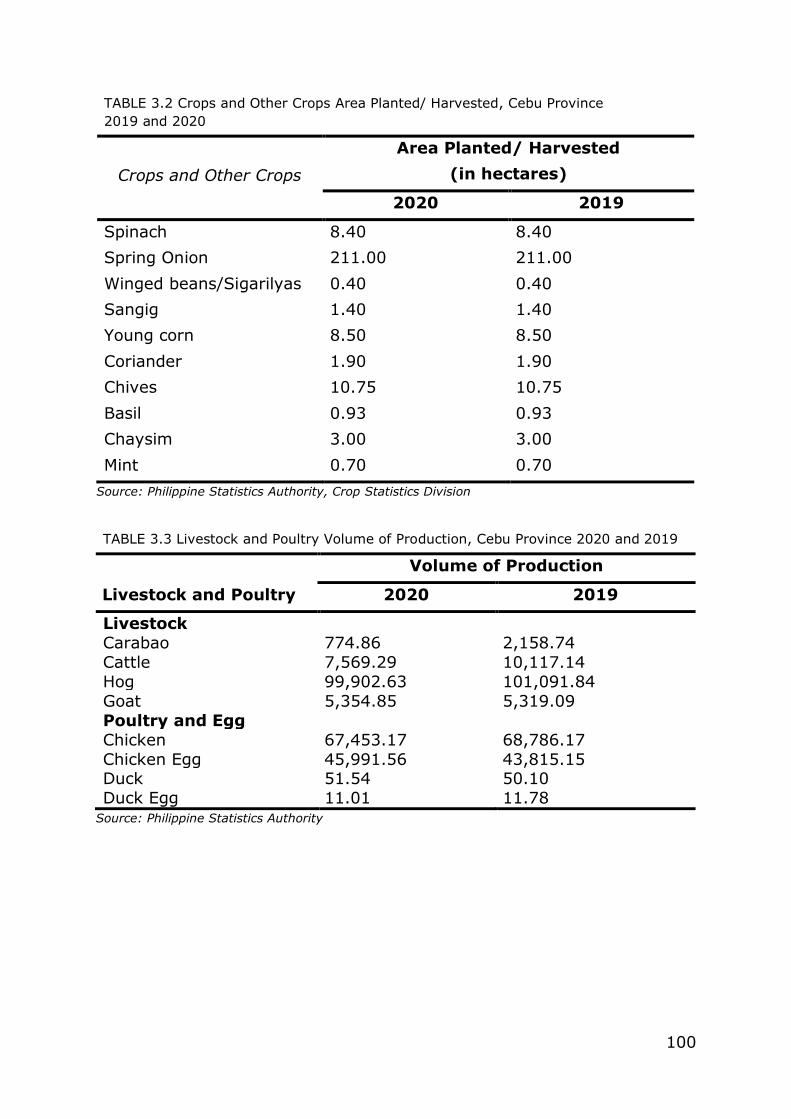
100
TABLE 3.2 Crops and Other Crops Area Planted/ Harvested, Cebu Province
2019 and 2020
Crops and Other Crops
Area Planted/ Harvested
(in hectares)
2020 2019
Spinach 8.40 8.40
Spring Onion 211.00 211.00
Winged beans/Sigarilyas 0.40 0.40
Sangig 1.40 1.40
Young corn 8.50 8.50
Coriander 1.90 1.90
Chives 10.75 10.75
Basil 0.93 0.93
Chaysim 3.00 3.00
Mint 0.70 0.70
Source: Philippine Statistics Authority, Crop Statistics Division
TABLE 3.3 Livestock and Poultry Volume of Production, Cebu Province 2020 and 2019
Livestock and Poultry
Volume of Production
2020 2019
Livestock
Carabao 774.86 2,158.74
Cattle 7,569.29 10,117.14
Hog 99,902.63 101,091.84
Goat 5,354.85 5,319.09
Poultry and Egg
Chicken 67,453.17 68,786.17
Chicken Egg 45,991.56 43,815.15 Duck 51.54 50.10
Duck Egg 11.01 11.78 Source: Philippine Statistics Authority
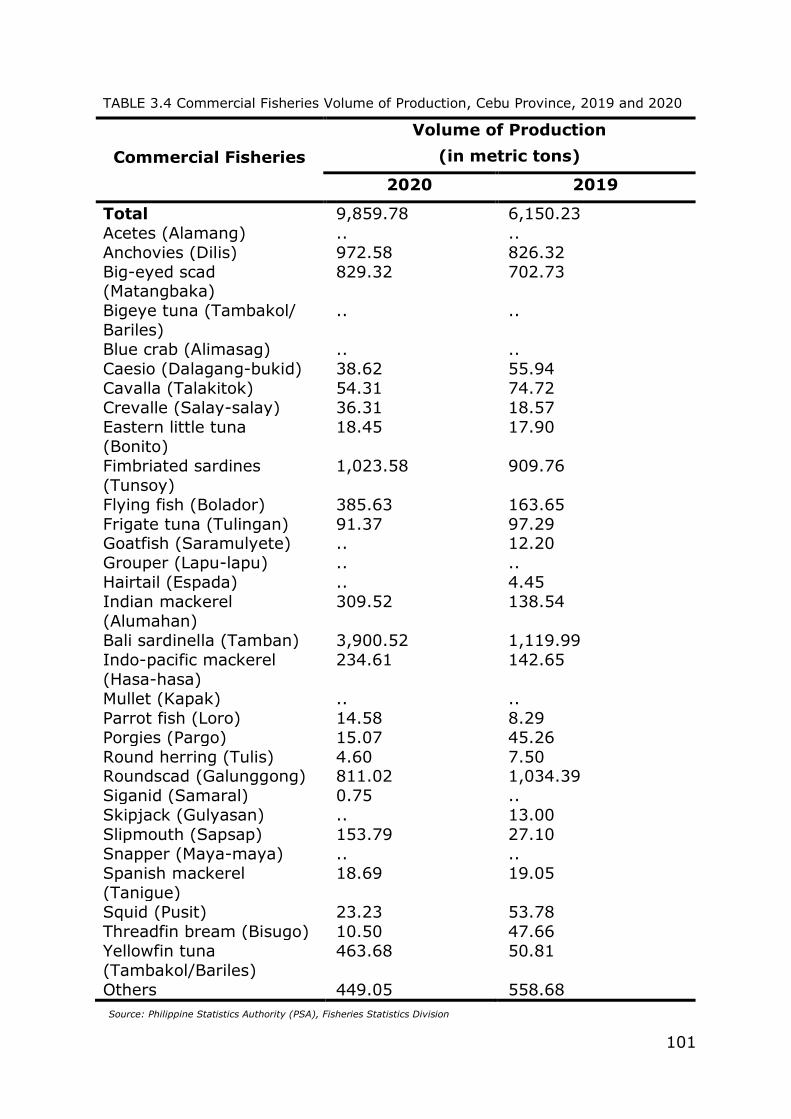
101
Source: Philippine Statistics Authority (PSA), Fisheries Statistics Division
TABLE 3.4 Commercial Fisheries Volume of Production, Cebu Province, 2019 and 2020
Commercial Fisheries
Volume of Production
(in metric tons)
2020 2019
Total 9,859.78 6,150.23
Acetes (Alamang) .. ..
Anchovies (Dilis) 972.58 826.32
Big-eyed scad (Matangbaka)
829.32 702.73
Bigeye tuna (Tambakol/
Bariles)
.. ..
Blue crab (Alimasag) .. ..
Caesio (Dalagang-bukid) 38.62 55.94
Cavalla (Talakitok) 54.31 74.72
Crevalle (Salay-salay) 36.31 18.57
Eastern little tuna
(Bonito)
18.45 17.90
Fimbriated sardines
(Tunsoy)
1,023.58 909.76
Flying fish (Bolador) 385.63 163.65
Frigate tuna (Tulingan) 91.37 97.29 Goatfish (Saramulyete) .. 12.20
Grouper (Lapu-lapu) .. ..
Hairtail (Espada) .. 4.45
Indian mackerel
(Alumahan)
309.52 138.54
Bali sardinella (Tamban) 3,900.52 1,119.99
Indo-pacific mackerel
(Hasa-hasa)
234.61 142.65
Mullet (Kapak) .. ..
Parrot fish (Loro) 14.58 8.29
Porgies (Pargo) 15.07 45.26
Round herring (Tulis) 4.60 7.50 Roundscad (Galunggong) 811.02 1,034.39
Siganid (Samaral) 0.75 ..
Skipjack (Gulyasan) .. 13.00
Slipmouth (Sapsap) 153.79 27.10
Snapper (Maya-maya) .. ..
Spanish mackerel
(Tanigue)
18.69 19.05
Squid (Pusit) 23.23 53.78
Threadfin bream (Bisugo) 10.50 47.66
Yellowfin tuna
(Tambakol/Bariles)
463.68 50.81
Others 449.05 558.68
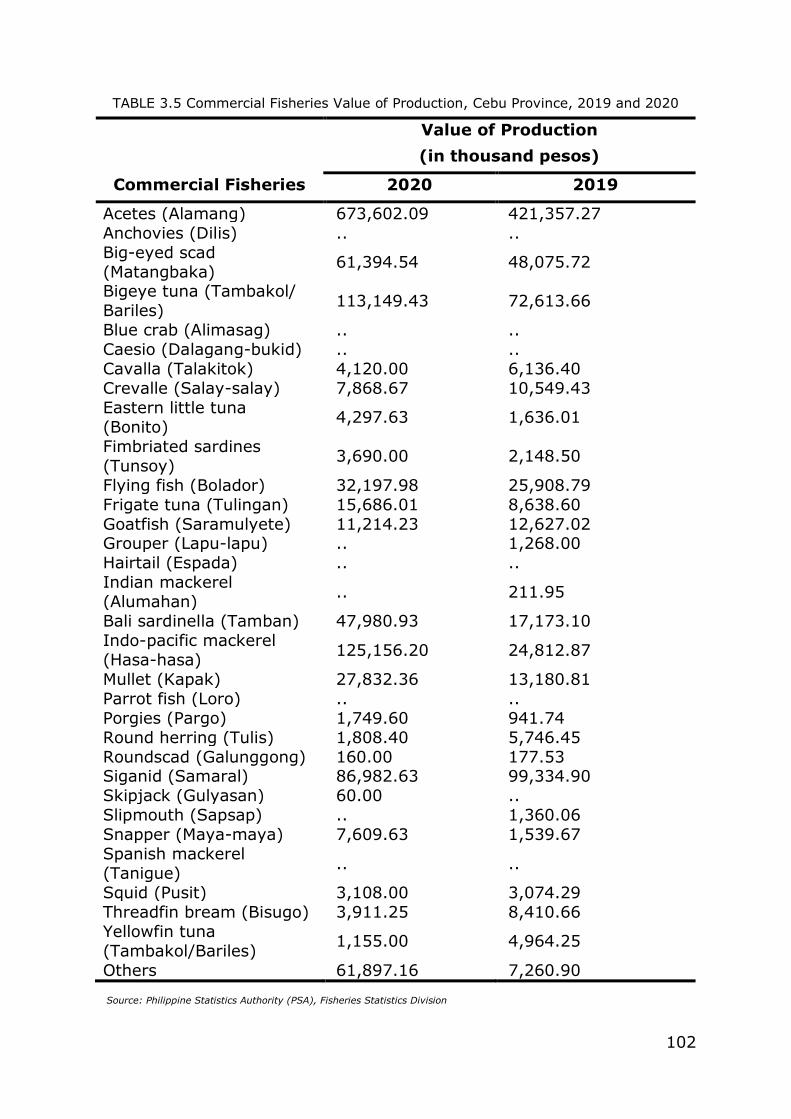
102
Source: Philippine Statistics Authority (PSA), Fisheries Statistics Division
TABLE 3.5 Commercial Fisheries Value of Production, Cebu Province, 2019 and 2020
Commercial Fisheries
Value of Production
(in thousand pesos)
2020 2019
Acetes (Alamang) 673,602.09 421,357.27
Anchovies (Dilis) .. ..
Big-eyed scad
(Matangbaka) 61,394.54 48,075.72
Bigeye tuna (Tambakol/
Bariles) 113,149.43 72,613.66
Blue crab (Alimasag) .. ..
Caesio (Dalagang-bukid) .. ..
Cavalla (Talakitok) 4,120.00 6,136.40
Crevalle (Salay-salay) 7,868.67 10,549.43
Eastern little tuna
(Bonito) 4,297.63 1,636.01
Fimbriated sardines
(Tunsoy) 3,690.00 2,148.50
Flying fish (Bolador) 32,197.98 25,908.79
Frigate tuna (Tulingan) 15,686.01 8,638.60
Goatfish (Saramulyete) 11,214.23 12,627.02 Grouper (Lapu-lapu) .. 1,268.00
Hairtail (Espada) .. ..
Indian mackerel
(Alumahan) .. 211.95
Bali sardinella (Tamban) 47,980.93 17,173.10
Indo-pacific mackerel
(Hasa-hasa) 125,156.20 24,812.87
Mullet (Kapak) 27,832.36 13,180.81
Parrot fish (Loro) .. ..
Porgies (Pargo) 1,749.60 941.74
Round herring (Tulis) 1,808.40 5,746.45
Roundscad (Galunggong) 160.00 177.53 Siganid (Samaral) 86,982.63 99,334.90
Skipjack (Gulyasan) 60.00 ..
Slipmouth (Sapsap) .. 1,360.06
Snapper (Maya-maya) 7,609.63 1,539.67
Spanish mackerel
(Tanigue) .. ..
Squid (Pusit) 3,108.00 3,074.29
Threadfin bream (Bisugo) 3,911.25 8,410.66
Yellowfin tuna
(Tambakol/Bariles) 1,155.00 4,964.25
Others 61,897.16 7,260.90
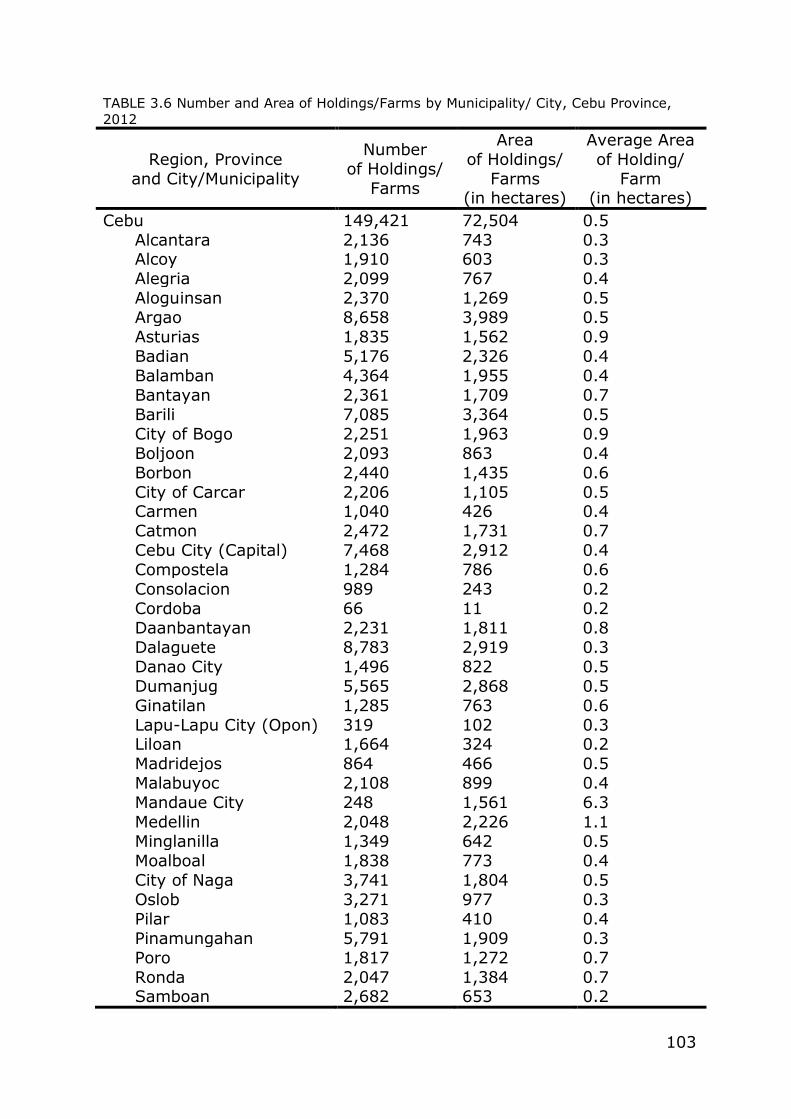
103
TABLE 3.6 Number and Area of Holdings/Farms by Municipality/ City, Cebu Province,
2012
Region, Province
and City/Municipality
Number
of Holdings/
Farms
Area
of Holdings/
Farms (in hectares)
Average Area
of Holding/
Farm (in hectares)
Cebu 149,421 72,504 0.5
Alcantara 2,136 743 0.3
Alcoy 1,910 603 0.3
Alegria 2,099 767 0.4
Aloguinsan 2,370 1,269 0.5
Argao 8,658 3,989 0.5
Asturias 1,835 1,562 0.9
Badian 5,176 2,326 0.4
Balamban 4,364 1,955 0.4
Bantayan 2,361 1,709 0.7
Barili 7,085 3,364 0.5
City of Bogo 2,251 1,963 0.9
Boljoon 2,093 863 0.4
Borbon 2,440 1,435 0.6
City of Carcar 2,206 1,105 0.5
Carmen 1,040 426 0.4
Catmon 2,472 1,731 0.7
Cebu City (Capital) 7,468 2,912 0.4
Compostela 1,284 786 0.6
Consolacion 989 243 0.2
Cordoba 66 11 0.2
Daanbantayan 2,231 1,811 0.8
Dalaguete 8,783 2,919 0.3
Danao City 1,496 822 0.5
Dumanjug 5,565 2,868 0.5
Ginatilan 1,285 763 0.6
Lapu-Lapu City (Opon) 319 102 0.3
Liloan 1,664 324 0.2
Madridejos 864 466 0.5
Malabuyoc 2,108 899 0.4
Mandaue City 248 1,561 6.3
Medellin 2,048 2,226 1.1
Minglanilla 1,349 642 0.5
Moalboal 1,838 773 0.4
City of Naga 3,741 1,804 0.5
Oslob 3,271 977 0.3
Pilar 1,083 410 0.4
Pinamungahan 5,791 1,909 0.3
Poro 1,817 1,272 0.7
Ronda 2,047 1,384 0.7
Samboan 2,682 653 0.2
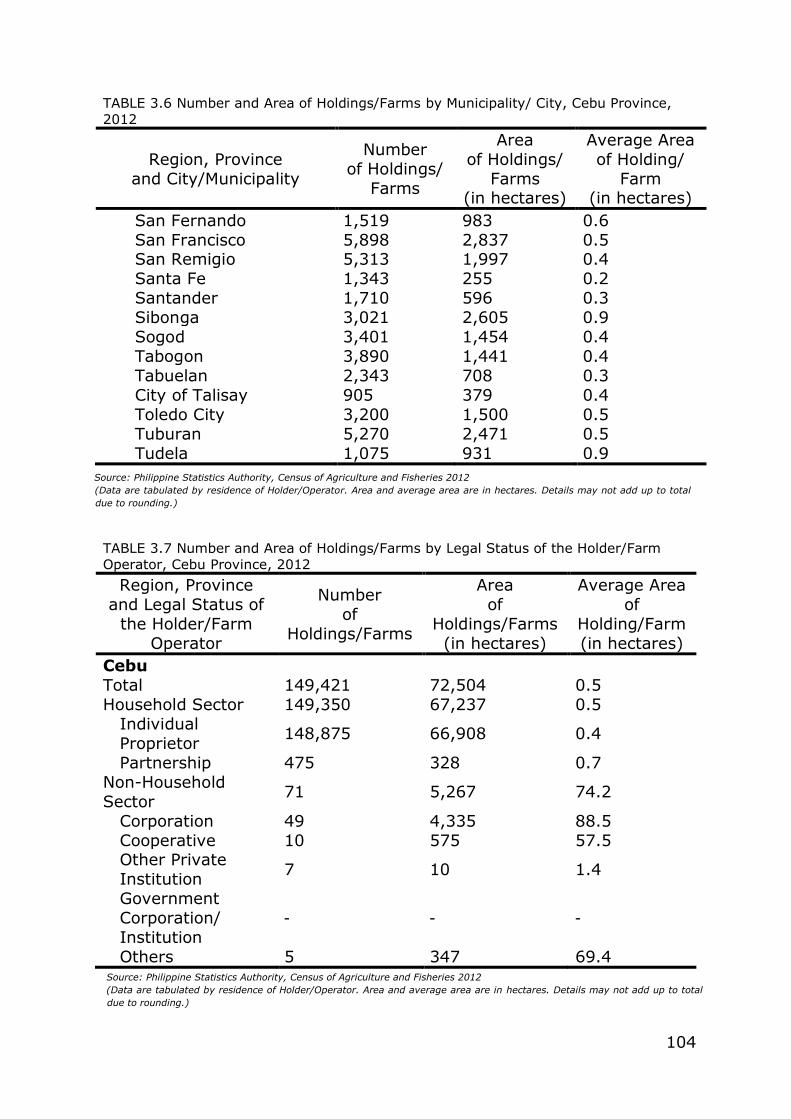
104
Source: Philippine Statistics Authority, Census of Agriculture and Fisheries 2012
(Data are tabulated by residence of Holder/Operator. Area and average area are in hectares. Details may not add up to total
due to rounding.)
Source: Philippine Statistics Authority, Census of Agriculture and Fisheries 2012
(Data are tabulated by residence of Holder/Operator. Area and average area are in hectares. Details may not add up to total
due to rounding.)
TABLE 3.6 Number and Area of Holdings/Farms by Municipality/ City, Cebu Province,
2012
Region, Province
and City/Municipality
Number
of Holdings/
Farms
Area
of Holdings/
Farms (in hectares)
Average Area
of Holding/
Farm (in hectares)
San Fernando 1,519 983 0.6
San Francisco 5,898 2,837 0.5
San Remigio 5,313 1,997 0.4
Santa Fe 1,343 255 0.2
Santander 1,710 596 0.3
Sibonga 3,021 2,605 0.9
Sogod 3,401 1,454 0.4
Tabogon 3,890 1,441 0.4
Tabuelan 2,343 708 0.3
City of Talisay 905 379 0.4
Toledo City 3,200 1,500 0.5
Tuburan 5,270 2,471 0.5
Tudela 1,075 931 0.9
TABLE 3.7 Number and Area of Holdings/Farms by Legal Status of the Holder/Farm
Operator, Cebu Province, 2012
Region, Province
and Legal Status of
the Holder/Farm
Operator
Number
of
Holdings/Farms
Area
of
Holdings/Farms
(in hectares)
Average Area
of
Holding/Farm
(in hectares)
Cebu
Total 149,421 72,504 0.5
Household Sector 149,350 67,237 0.5
Individual
Proprietor 148,875 66,908 0.4
Partnership 475 328 0.7
Non-Household
Sector 71 5,267 74.2
Corporation 49 4,335 88.5
Cooperative 10 575 57.5
Other Private
Institution 7 10 1.4
Government
Corporation/
Institution
- - -
Others 5 347 69.4
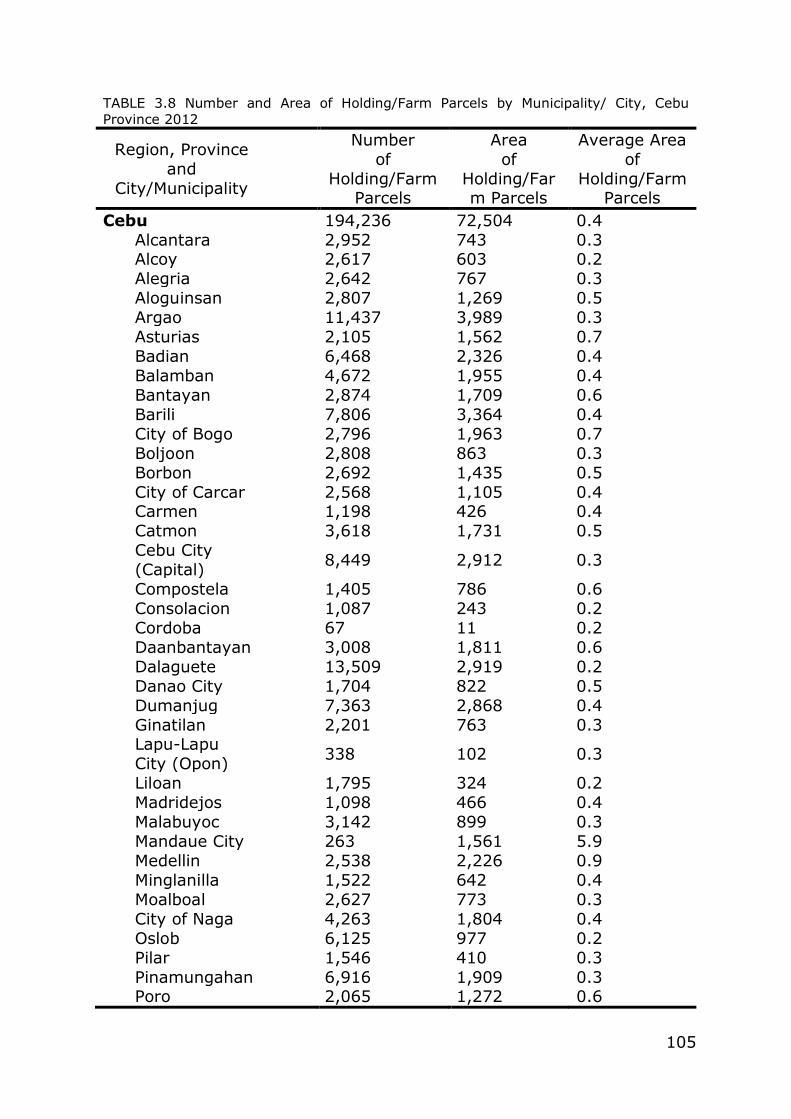
105
TABLE 3.8 Number and Area of Holding/Farm Parcels by Municipality/ City, Cebu
Province 2012
Region, Province
and
City/Municipality
Number
of
Holding/Farm Parcels
Area
of
Holding/Farm Parcels
Average Area
of
Holding/Farm Parcels
Cebu 194,236 72,504 0.4
Alcantara 2,952 743 0.3
Alcoy 2,617 603 0.2
Alegria 2,642 767 0.3
Aloguinsan 2,807 1,269 0.5
Argao 11,437 3,989 0.3
Asturias 2,105 1,562 0.7
Badian 6,468 2,326 0.4
Balamban 4,672 1,955 0.4
Bantayan 2,874 1,709 0.6
Barili 7,806 3,364 0.4
City of Bogo 2,796 1,963 0.7
Boljoon 2,808 863 0.3
Borbon 2,692 1,435 0.5
City of Carcar 2,568 1,105 0.4
Carmen 1,198 426 0.4
Catmon 3,618 1,731 0.5
Cebu City
(Capital) 8,449 2,912 0.3
Compostela 1,405 786 0.6
Consolacion 1,087 243 0.2
Cordoba 67 11 0.2
Daanbantayan 3,008 1,811 0.6
Dalaguete 13,509 2,919 0.2
Danao City 1,704 822 0.5
Dumanjug 7,363 2,868 0.4
Ginatilan 2,201 763 0.3
Lapu-Lapu
City (Opon) 338 102 0.3
Liloan 1,795 324 0.2
Madridejos 1,098 466 0.4
Malabuyoc 3,142 899 0.3
Mandaue City 263 1,561 5.9
Medellin 2,538 2,226 0.9
Minglanilla 1,522 642 0.4
Moalboal 2,627 773 0.3
City of Naga 4,263 1,804 0.4
Oslob 6,125 977 0.2
Pilar 1,546 410 0.3
Pinamungahan 6,916 1,909 0.3
Poro 2,065 1,272 0.6
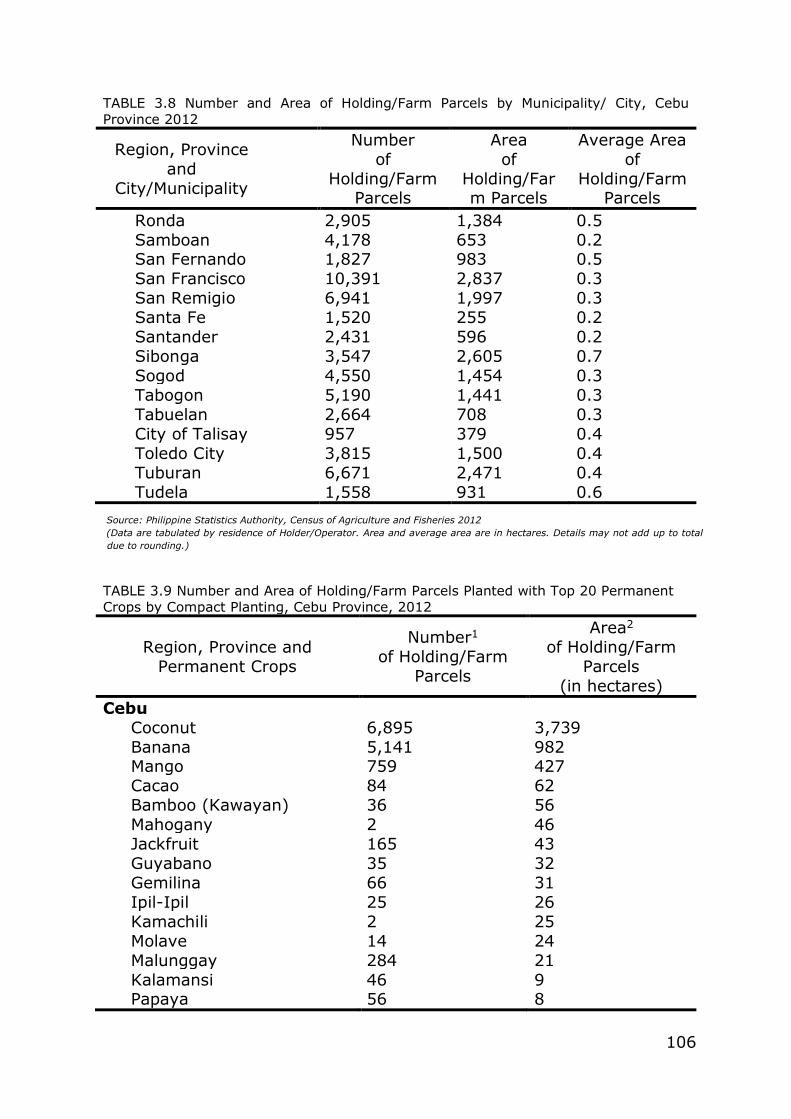
106
Source: Philippine Statistics Authority, Census of Agriculture and Fisheries 2012
(Data are tabulated by residence of Holder/Operator. Area and average area are in hectares. Details may not add up to total
due to rounding.)
TABLE 3.8 Number and Area of Holding/Farm Parcels by Municipality/ City, Cebu
Province 2012
Region, Province
and
City/Municipality
Number
of
Holding/Farm Parcels
Area
of
Holding/Farm Parcels
Average Area
of
Holding/Farm Parcels
Ronda 2,905 1,384 0.5
Samboan 4,178 653 0.2
San Fernando 1,827 983 0.5
San Francisco 10,391 2,837 0.3
San Remigio 6,941 1,997 0.3
Santa Fe 1,520 255 0.2
Santander 2,431 596 0.2
Sibonga 3,547 2,605 0.7
Sogod 4,550 1,454 0.3
Tabogon 5,190 1,441 0.3
Tabuelan 2,664 708 0.3
City of Talisay 957 379 0.4
Toledo City 3,815 1,500 0.4
Tuburan 6,671 2,471 0.4
Tudela 1,558 931 0.6
TABLE 3.9 Number and Area of Holding/Farm Parcels Planted with Top 20 Permanent
Crops by Compact Planting, Cebu Province, 2012
Region, Province and
Permanent Crops
Number1
of Holding/Farm
Parcels
Area2
of Holding/Farm
Parcels
(in hectares)
Cebu
Coconut 6,895 3,739
Banana 5,141 982
Mango 759 427
Cacao 84 62
Bamboo (Kawayan) 36 56
Mahogany 2 46
Jackfruit 165 43
Guyabano 35 32
Gemilina 66 31
Ipil-Ipil 25 26
Kamachili 2 25
Molave 14 24
Malunggay 284 21
Kalamansi 46 9
Papaya 56 8
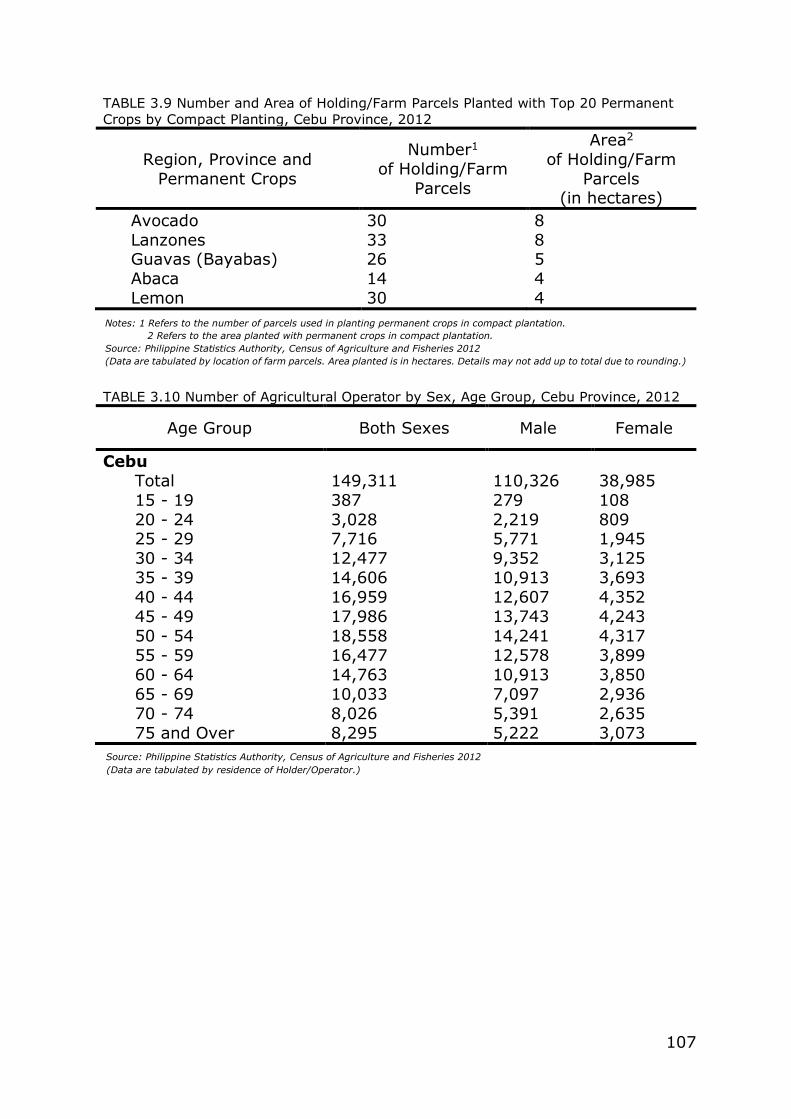
107
Notes: 1 Refers to the number of parcels used in planting permanent crops in compact plantation.
2 Refers to the area planted with permanent crops in compact plantation.
Source: Philippine Statistics Authority, Census of Agriculture and Fisheries 2012
(Data are tabulated by location of farm parcels. Area planted is in hectares. Details may not add up to total due to rounding.)
Source: Philippine Statistics Authority, Census of Agriculture and Fisheries 2012
(Data are tabulated by residence of Holder/Operator.)
TABLE 3.9 Number and Area of Holding/Farm Parcels Planted with Top 20 Permanent
Crops by Compact Planting, Cebu Province, 2012
Region, Province and
Permanent Crops
Number1
of Holding/Farm
Parcels
Area2
of Holding/Farm
Parcels (in hectares)
Avocado 30 8
Lanzones 33 8
Guavas (Bayabas) 26 5
Abaca 14 4
Lemon 30 4
TABLE 3.10 Number of Agricultural Operator by Sex, Age Group, Cebu Province, 2012
Age Group Both Sexes Male Female
Cebu
Total 149,311 110,326 38,985
15 - 19 387 279 108
20 - 24 3,028 2,219 809
25 - 29 7,716 5,771 1,945
30 - 34 12,477 9,352 3,125
35 - 39 14,606 10,913 3,693
40 - 44 16,959 12,607 4,352
45 - 49 17,986 13,743 4,243
50 - 54 18,558 14,241 4,317
55 - 59 16,477 12,578 3,899
60 - 64 14,763 10,913 3,850
65 - 69 10,033 7,097 2,936
70 - 74 8,026 5,391 2,635
75 and Over 8,295 5,222 3,073
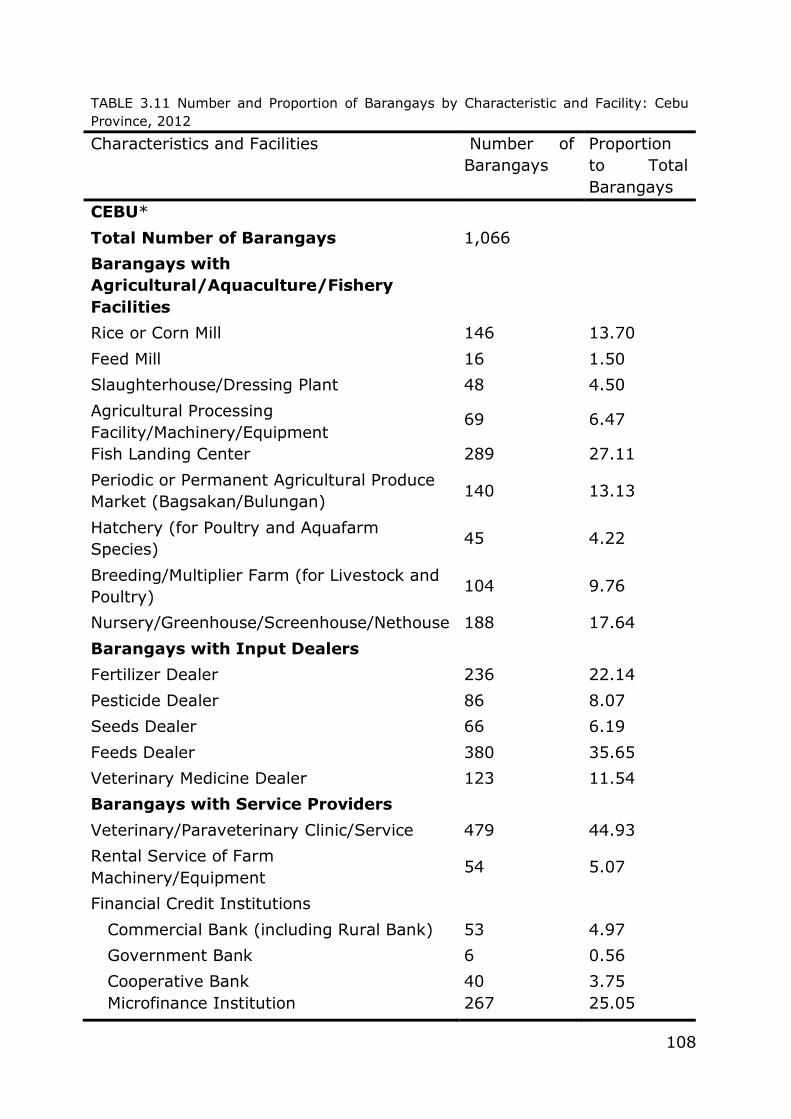
108
TABLE 3.11 Number and Proportion of Barangays by Characteristic and Facility: Cebu
Province, 2012
Characteristics and Facilities Number of
Barangays
Proportion
to Total
Barangays
CEBU*
Total Number of Barangays 1,066
Barangays with
Agricultural/Aquaculture/Fishery
Facilities
Rice or Corn Mill 146 13.70
Feed Mill 16 1.50
Slaughterhouse/Dressing Plant 48 4.50
Agricultural Processing
Facility/Machinery/Equipment 69 6.47
Fish Landing Center 289 27.11
Periodic or Permanent Agricultural Produce
Market (Bagsakan/Bulungan) 140 13.13
Hatchery (for Poultry and Aquafarm
Species) 45 4.22
Breeding/Multiplier Farm (for Livestock and
Poultry) 104 9.76
Nursery/Greenhouse/Screenhouse/Nethouse 188 17.64
Barangays with Input Dealers
Fertilizer Dealer 236 22.14
Pesticide Dealer 86 8.07
Seeds Dealer 66 6.19
Feeds Dealer 380 35.65
Veterinary Medicine Dealer 123 11.54
Barangays with Service Providers
Veterinary/Paraveterinary Clinic/Service 479 44.93
Rental Service of Farm
Machinery/Equipment 54 5.07
Financial Credit Institutions
Commercial Bank (including Rural Bank) 53 4.97
Government Bank 6 0.56
Cooperative Bank 40 3.75
Microfinance Institution 267 25.05
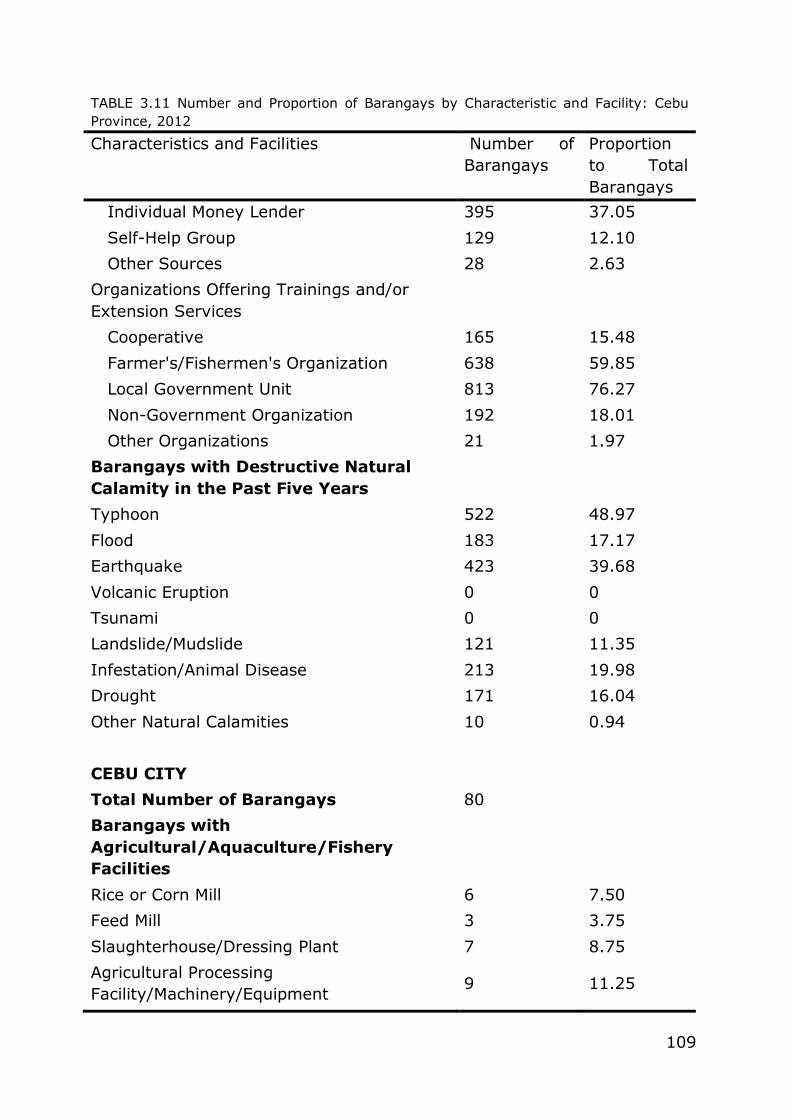
109
TABLE 3.11 Number and Proportion of Barangays by Characteristic and Facility: Cebu
Province, 2012
Characteristics and Facilities Number of
Barangays
Proportion
to Total
Barangays
Individual Money Lender 395 37.05
Self-Help Group 129 12.10
Other Sources 28 2.63
Organizations Offering Trainings and/or
Extension Services
Cooperative 165 15.48
Farmer's/Fishermen's Organization 638 59.85
Local Government Unit 813 76.27
Non-Government Organization 192 18.01
Other Organizations 21 1.97
Barangays with Destructive Natural
Calamity in the Past Five Years
Typhoon 522 48.97
Flood 183 17.17
Earthquake 423 39.68
Volcanic Eruption 0 0
Tsunami 0 0
Landslide/Mudslide 121 11.35
Infestation/Animal Disease 213 19.98
Drought 171 16.04
Other Natural Calamities 10 0.94
CEBU CITY
Total Number of Barangays 80
Barangays with
Agricultural/Aquaculture/Fishery
Facilities
Rice or Corn Mill 6 7.50
Feed Mill 3 3.75
Slaughterhouse/Dressing Plant 7 8.75
Agricultural Processing
Facility/Machinery/Equipment 9 11.25
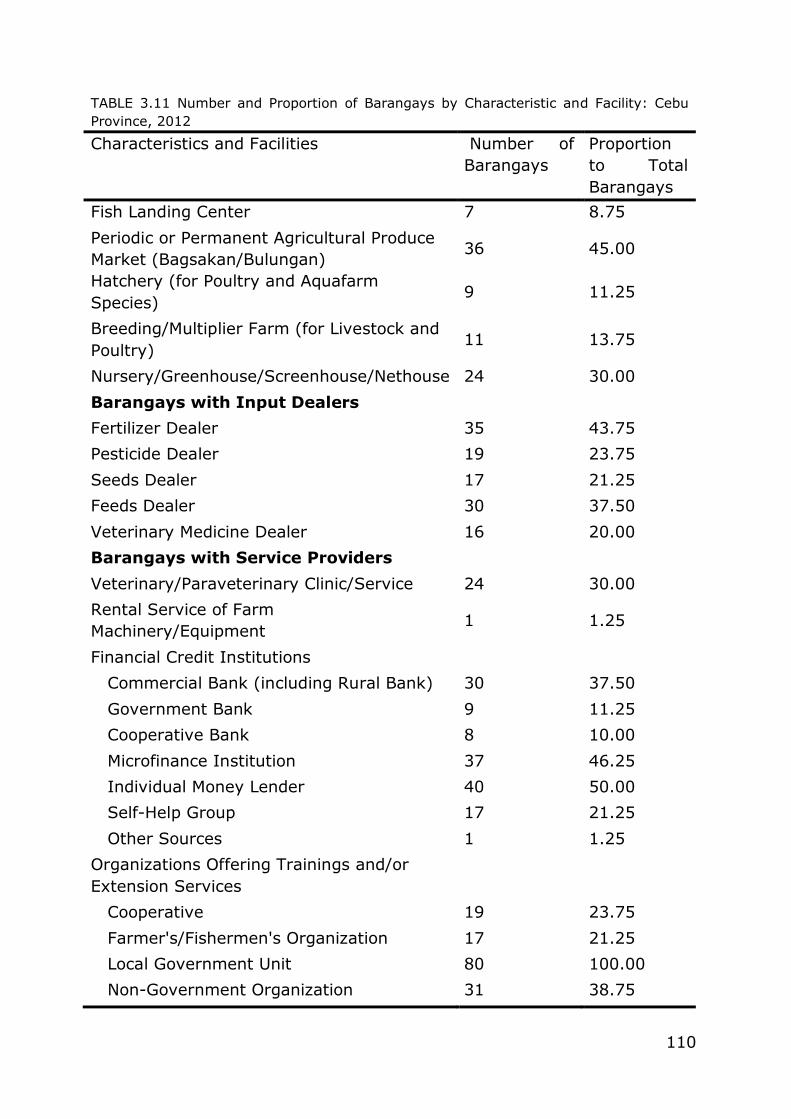
110
TABLE 3.11 Number and Proportion of Barangays by Characteristic and Facility: Cebu
Province, 2012
Characteristics and Facilities Number of
Barangays
Proportion
to Total
Barangays
Fish Landing Center 7 8.75
Periodic or Permanent Agricultural Produce
Market (Bagsakan/Bulungan) 36 45.00
Hatchery (for Poultry and Aquafarm
Species) 9 11.25
Breeding/Multiplier Farm (for Livestock and
Poultry) 11 13.75
Nursery/Greenhouse/Screenhouse/Nethouse 24 30.00
Barangays with Input Dealers
Fertilizer Dealer 35 43.75
Pesticide Dealer 19 23.75
Seeds Dealer 17 21.25
Feeds Dealer 30 37.50
Veterinary Medicine Dealer 16 20.00
Barangays with Service Providers
Veterinary/Paraveterinary Clinic/Service 24 30.00
Rental Service of Farm
Machinery/Equipment 1 1.25
Financial Credit Institutions
Commercial Bank (including Rural Bank) 30 37.50
Government Bank 9 11.25
Cooperative Bank 8 10.00
Microfinance Institution 37 46.25
Individual Money Lender 40 50.00
Self-Help Group 17 21.25
Other Sources 1 1.25
Organizations Offering Trainings and/or
Extension Services
Cooperative 19 23.75
Farmer's/Fishermen's Organization 17 21.25
Local Government Unit 80 100.00
Non-Government Organization 31 38.75
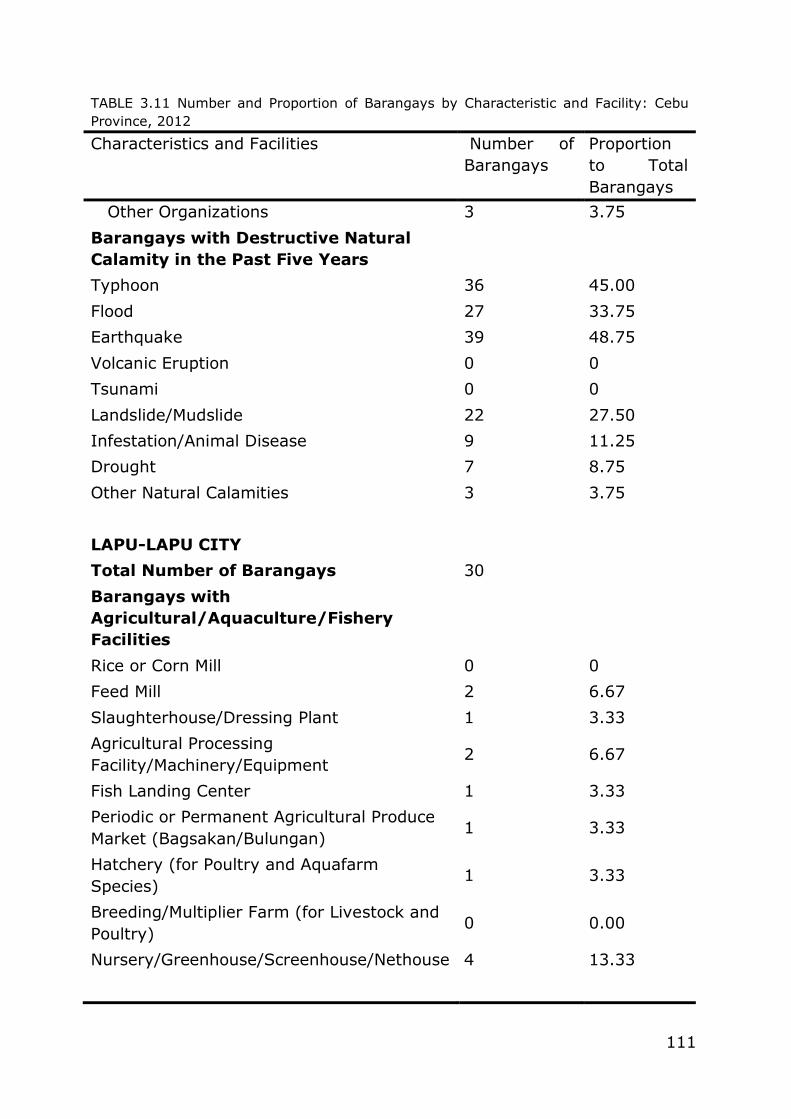
111
TABLE 3.11 Number and Proportion of Barangays by Characteristic and Facility: Cebu
Province, 2012
Characteristics and Facilities Number of
Barangays
Proportion
to Total
Barangays
Other Organizations 3 3.75
Barangays with Destructive Natural
Calamity in the Past Five Years
Typhoon 36 45.00
Flood 27 33.75
Earthquake 39 48.75
Volcanic Eruption 0 0
Tsunami 0 0
Landslide/Mudslide 22 27.50
Infestation/Animal Disease 9 11.25
Drought 7 8.75
Other Natural Calamities 3 3.75
LAPU-LAPU CITY
Total Number of Barangays 30
Barangays with
Agricultural/Aquaculture/Fishery
Facilities
Rice or Corn Mill 0 0
Feed Mill 2 6.67
Slaughterhouse/Dressing Plant 1 3.33
Agricultural Processing
Facility/Machinery/Equipment 2 6.67
Fish Landing Center 1 3.33
Periodic or Permanent Agricultural Produce
Market (Bagsakan/Bulungan) 1 3.33
Hatchery (for Poultry and Aquafarm
Species) 1 3.33
Breeding/Multiplier Farm (for Livestock and
Poultry) 0 0.00
Nursery/Greenhouse/Screenhouse/Nethouse 4 13.33
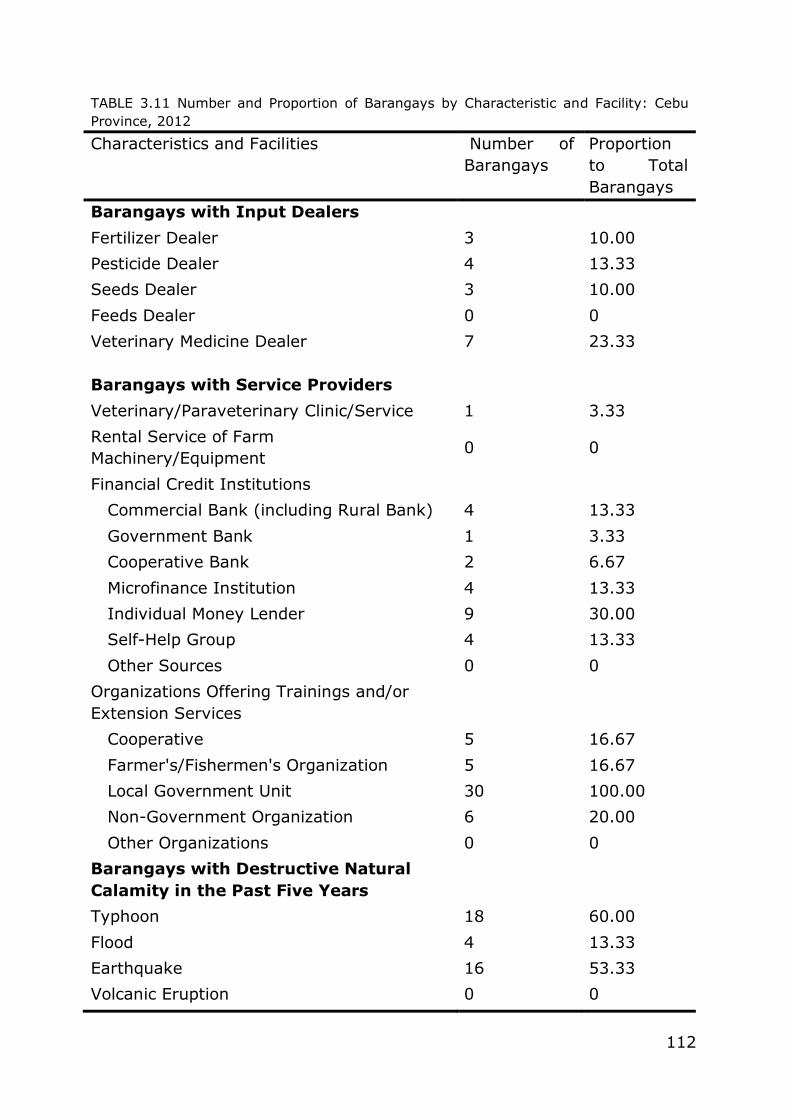
112
TABLE 3.11 Number and Proportion of Barangays by Characteristic and Facility: Cebu
Province, 2012
Characteristics and Facilities Number of
Barangays
Proportion
to Total
Barangays
Barangays with Input Dealers
Fertilizer Dealer 3 10.00
Pesticide Dealer 4 13.33
Seeds Dealer 3 10.00
Feeds Dealer 0 0
Veterinary Medicine Dealer 7 23.33
Barangays with Service Providers
Veterinary/Paraveterinary Clinic/Service 1 3.33
Rental Service of Farm
Machinery/Equipment 0 0
Financial Credit Institutions
Commercial Bank (including Rural Bank) 4 13.33
Government Bank 1 3.33
Cooperative Bank 2 6.67
Microfinance Institution 4 13.33
Individual Money Lender 9 30.00
Self-Help Group 4 13.33
Other Sources 0 0
Organizations Offering Trainings and/or
Extension Services
Cooperative 5 16.67
Farmer's/Fishermen's Organization 5 16.67
Local Government Unit 30 100.00
Non-Government Organization 6 20.00
Other Organizations 0 0
Barangays with Destructive Natural
Calamity in the Past Five Years
Typhoon 18 60.00
Flood 4 13.33
Earthquake 16 53.33
Volcanic Eruption 0 0
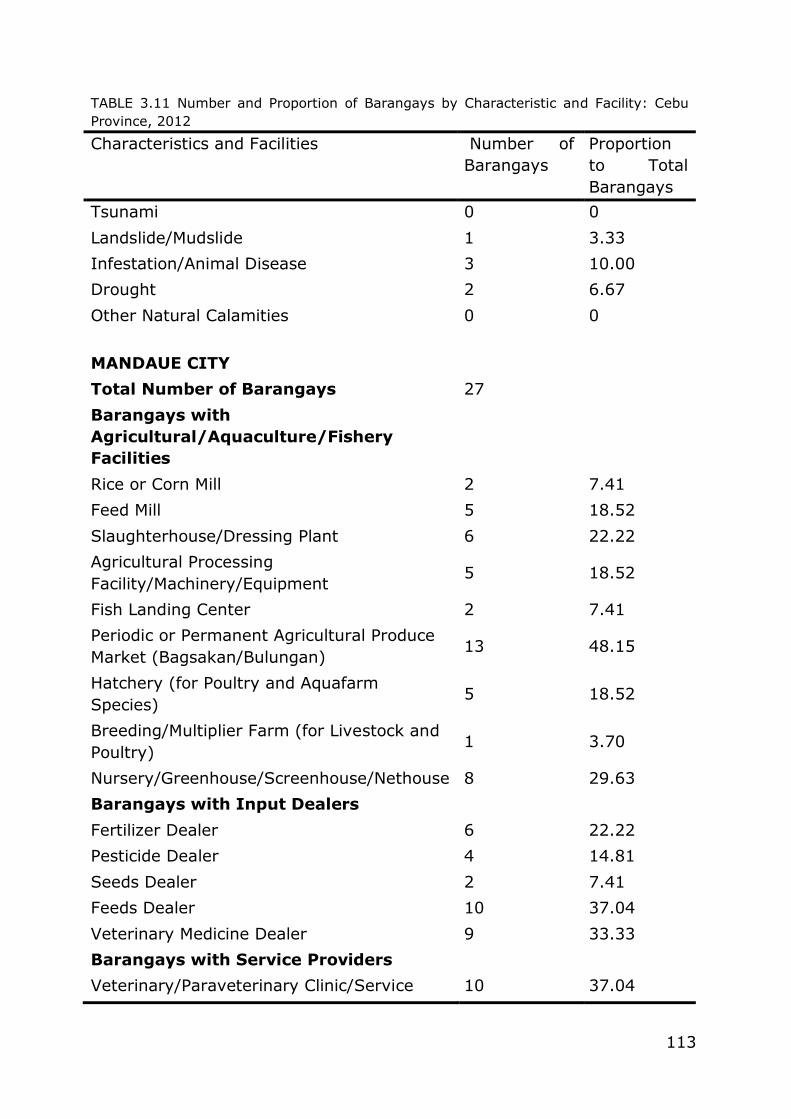
113
TABLE 3.11 Number and Proportion of Barangays by Characteristic and Facility: Cebu
Province, 2012
Characteristics and Facilities Number of
Barangays
Proportion
to Total
Barangays
Tsunami 0 0
Landslide/Mudslide 1 3.33
Infestation/Animal Disease 3 10.00
Drought 2 6.67
Other Natural Calamities 0 0
MANDAUE CITY
Total Number of Barangays 27
Barangays with
Agricultural/Aquaculture/Fishery
Facilities
Rice or Corn Mill 2 7.41
Feed Mill 5 18.52
Slaughterhouse/Dressing Plant 6 22.22
Agricultural Processing
Facility/Machinery/Equipment 5 18.52
Fish Landing Center 2 7.41
Periodic or Permanent Agricultural Produce
Market (Bagsakan/Bulungan) 13 48.15
Hatchery (for Poultry and Aquafarm
Species) 5 18.52
Breeding/Multiplier Farm (for Livestock and
Poultry) 1 3.70
Nursery/Greenhouse/Screenhouse/Nethouse 8 29.63
Barangays with Input Dealers
Fertilizer Dealer 6 22.22
Pesticide Dealer 4 14.81
Seeds Dealer 2 7.41
Feeds Dealer 10 37.04
Veterinary Medicine Dealer 9 33.33
Barangays with Service Providers
Veterinary/Paraveterinary Clinic/Service 10 37.04
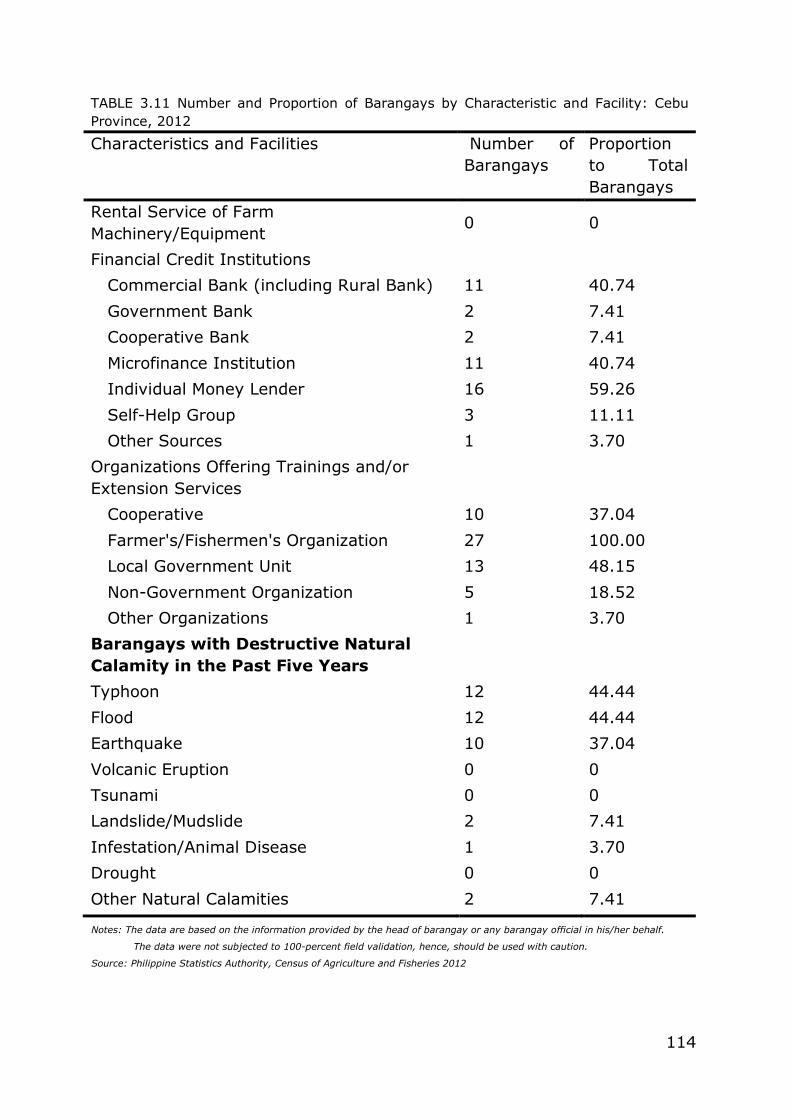
114
Notes: The data are based on the information provided by the head of barangay or any barangay official in his/her behalf.
The data were not subjected to 100-percent field validation, hence, should be used with caution.
Source: Philippine Statistics Authority, Census of Agriculture and Fisheries 2012
TABLE 3.11 Number and Proportion of Barangays by Characteristic and Facility: Cebu
Province, 2012
Characteristics and Facilities Number of
Barangays
Proportion
to Total
Barangays
Rental Service of Farm
Machinery/Equipment 0 0
Financial Credit Institutions
Commercial Bank (including Rural Bank) 11 40.74
Government Bank 2 7.41
Cooperative Bank 2 7.41
Microfinance Institution 11 40.74
Individual Money Lender 16 59.26
Self-Help Group 3 11.11
Other Sources 1 3.70
Organizations Offering Trainings and/or
Extension Services
Cooperative 10 37.04
Farmer's/Fishermen's Organization 27 100.00
Local Government Unit 13 48.15
Non-Government Organization 5 18.52
Other Organizations 1 3.70
Barangays with Destructive Natural
Calamity in the Past Five Years
Typhoon 12 44.44
Flood 12 44.44
Earthquake 10 37.04
Volcanic Eruption 0 0
Tsunami 0 0
Landslide/Mudslide 2 7.41
Infestation/Animal Disease 1 3.70
Drought 0 0
Other Natural Calamities 2 7.41
115
Chapter 4. CONSTRUCTION STATISTICS
This chapter presents various data series on the construction
statistics obtained from the approved building permits for the year 2019
and 2020.
Highlights:
In 2020, the total building construction from approved building
permits in Cebu province reached to 5,677 buildings which is lower by
25.4% compared to total buildings in 2019 with 7,119 buildings. The floor
area also decreased from 3,347,509 sq.m in 2019 with only 1,226,455
sq.m in 2020.
Of all types, Residential buildings were the highest with 3,929
buildings or 69% from the total buildings. This was followed by non-
residential buildings with 1,089 or 20% from total buildings in 2020 and
Alteration and Repair buildings have 640 buildings with 11% from the total
buildings. Additional buildings have the lowest number among the types of
buildings with only 19 buildings or 0.33%.
Of the 3,929 residential buildings, 88% or 3,467 were Single Houses.
401 buildings or 10% were Appartment/ Accesoria. Only 1 Residential
Condominium was recorded under residential building in Cebu province for
the year 2020.
Of the 1,089 non-residential buildings, 788 buildings or 72% were
Commercial Buildings. 118 of which were Industrial Buildings or 11% from
the total non-residential buildings. 113 buildings or 10% were Institutional
Buildings and 6% were Agricultural buildings.
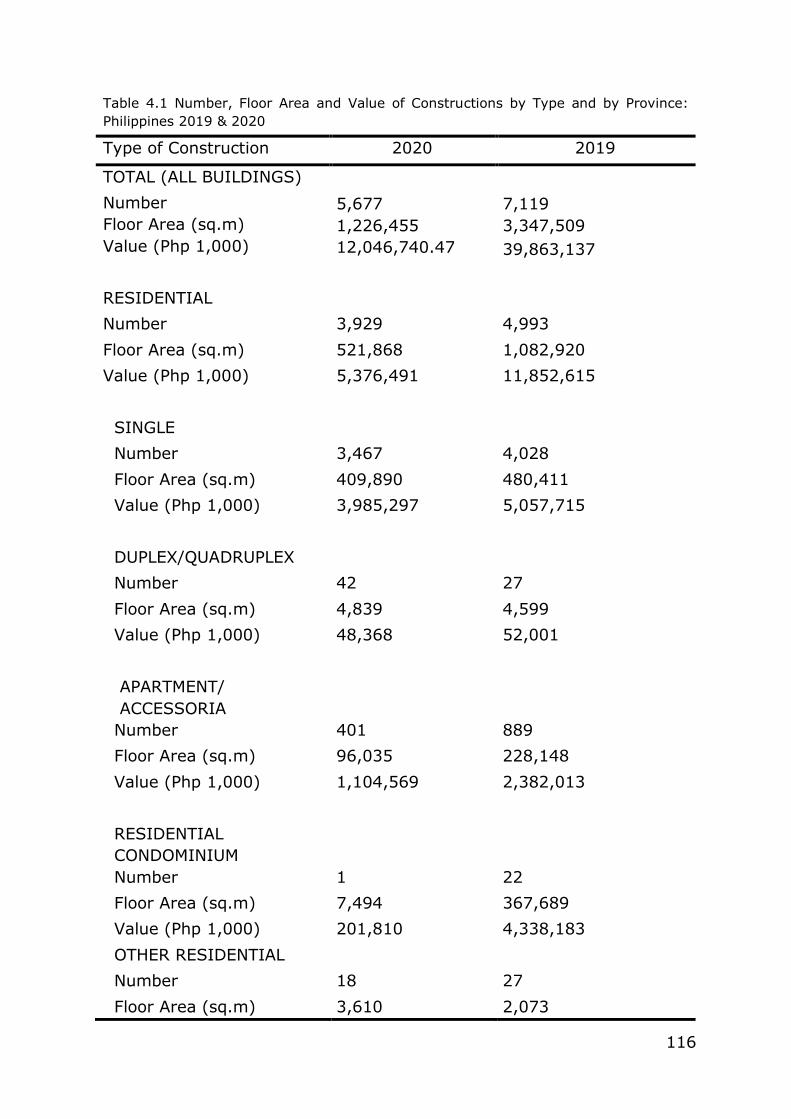
116
Table 4.1 Number, Floor Area and Value of Constructions by Type and by Province:
Philippines 2019 & 2020
Type of Construction 2020 2019
TOTAL (ALL BUILDINGS)
Number 5,677 7,119
Floor Area (sq.m) 1,226,455 3,347,509
Value (Php 1,000) 12,046,740.47 39,863,137
RESIDENTIAL
Number 3,929 4,993
Floor Area (sq.m) 521,868 1,082,920
Value (Php 1,000) 5,376,491 11,852,615
SINGLE
Number 3,467 4,028
Floor Area (sq.m) 409,890 480,411
Value (Php 1,000) 3,985,297 5,057,715
DUPLEX/QUADRUPLEX
Number 42 27
Floor Area (sq.m) 4,839 4,599
Value (Php 1,000) 48,368 52,001
APARTMENT/
ACCESSORIA
Number 401 889
Floor Area (sq.m) 96,035 228,148
Value (Php 1,000) 1,104,569 2,382,013
RESIDENTIAL
CONDOMINIUM
Number 1 22
Floor Area (sq.m) 7,494 367,689
Value (Php 1,000) 201,810 4,338,183
OTHER RESIDENTIAL
Number 18 27
Floor Area (sq.m) 3,610 2,073
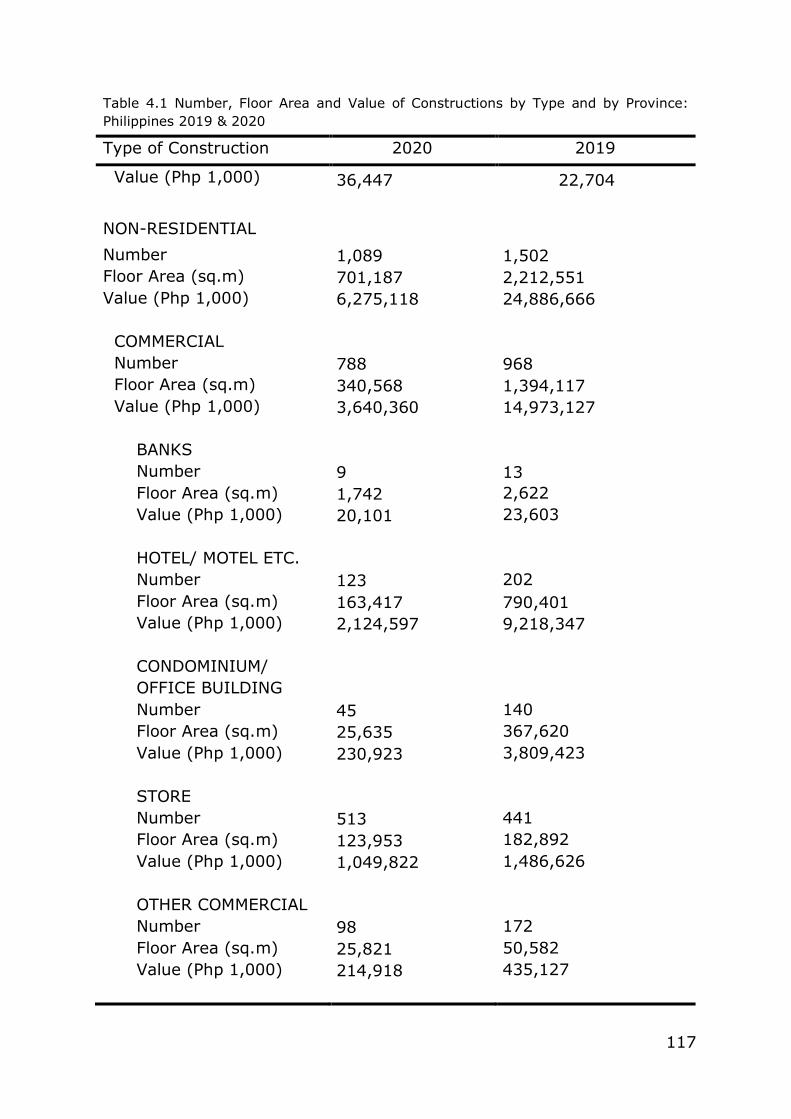
117
Table 4.1 Number, Floor Area and Value of Constructions by Type and by Province:
Philippines 2019 & 2020
Type of Construction 2020 2019
Value (Php 1,000) 36,447 22,704
NON-RESIDENTIAL
Number 1,089 1,502
Floor Area (sq.m) 701,187 2,212,551
Value (Php 1,000) 6,275,118 24,886,666
COMMERCIAL
Number 788 968
Floor Area (sq.m) 340,568 1,394,117
Value (Php 1,000) 3,640,360 14,973,127
BANKS
Number 9 13
Floor Area (sq.m) 1,742 2,622
Value (Php 1,000) 20,101 23,603
HOTEL/ MOTEL ETC.
Number 123 202
Floor Area (sq.m) 163,417 790,401
Value (Php 1,000) 2,124,597 9,218,347
CONDOMINIUM/
OFFICE BUILDING
Number 45 140
Floor Area (sq.m) 25,635 367,620
Value (Php 1,000) 230,923 3,809,423
STORE
Number 513 441
Floor Area (sq.m) 123,953 182,892
Value (Php 1,000) 1,049,822 1,486,626
OTHER COMMERCIAL
Number 98 172
Floor Area (sq.m) 25,821 50,582
Value (Php 1,000) 214,918 435,127
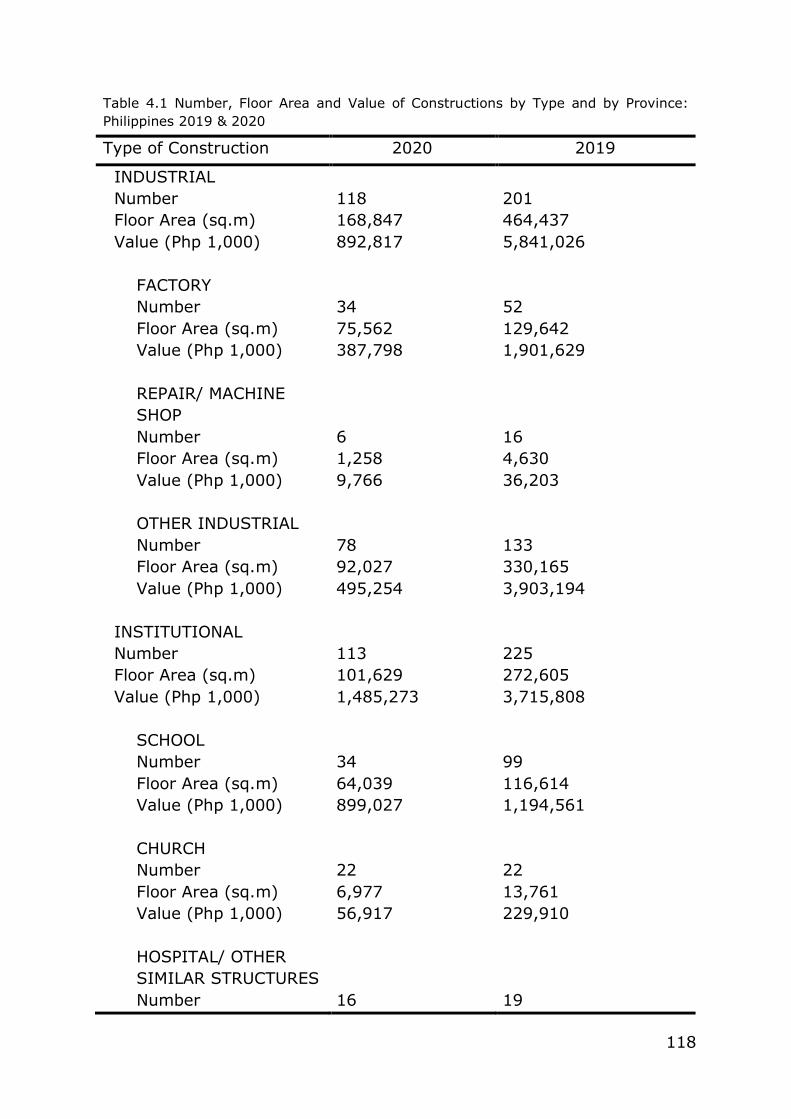
118
Table 4.1 Number, Floor Area and Value of Constructions by Type and by Province:
Philippines 2019 & 2020
Type of Construction 2020 2019
INDUSTRIAL
Number 118 201
Floor Area (sq.m) 168,847 464,437
Value (Php 1,000) 892,817 5,841,026
FACTORY
Number 34 52
Floor Area (sq.m) 75,562 129,642
Value (Php 1,000) 387,798 1,901,629
REPAIR/ MACHINE
SHOP
Number 6 16
Floor Area (sq.m) 1,258 4,630
Value (Php 1,000) 9,766 36,203
OTHER INDUSTRIAL
Number 78 133
Floor Area (sq.m) 92,027 330,165
Value (Php 1,000) 495,254 3,903,194
INSTITUTIONAL
Number 113 225
Floor Area (sq.m) 101,629 272,605
Value (Php 1,000) 1,485,273 3,715,808
SCHOOL
Number 34 99
Floor Area (sq.m) 64,039 116,614
Value (Php 1,000) 899,027 1,194,561
CHURCH
Number 22 22
Floor Area (sq.m) 6,977 13,761
Value (Php 1,000) 56,917 229,910
HOSPITAL/ OTHER
SIMILAR STRUCTURES
Number 16 19
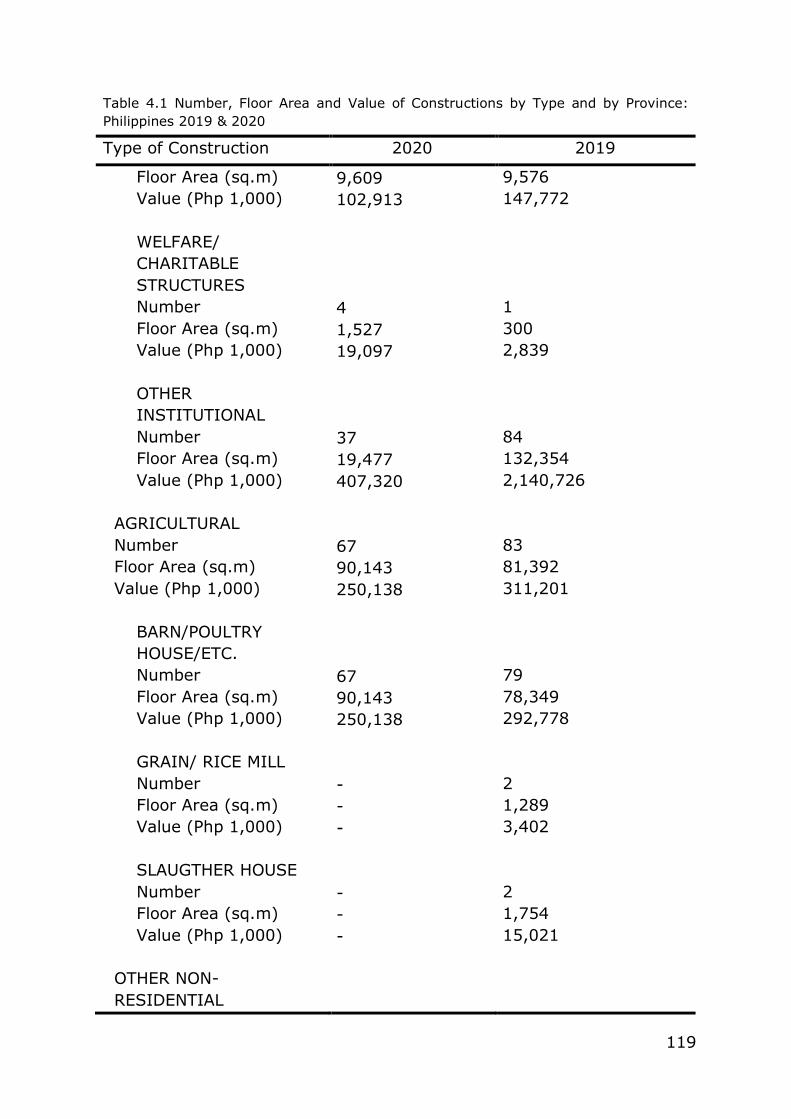
119
Table 4.1 Number, Floor Area and Value of Constructions by Type and by Province:
Philippines 2019 & 2020
Type of Construction 2020 2019
Floor Area (sq.m) 9,609 9,576
Value (Php 1,000) 102,913 147,772
WELFARE/
CHARITABLE
STRUCTURES
Number 4 1
Floor Area (sq.m) 1,527 300
Value (Php 1,000) 19,097 2,839
OTHER
INSTITUTIONAL
Number 37 84
Floor Area (sq.m) 19,477 132,354
Value (Php 1,000) 407,320 2,140,726
AGRICULTURAL
Number 67 83
Floor Area (sq.m) 90,143 81,392
Value (Php 1,000) 250,138 311,201
BARN/POULTRY
HOUSE/ETC.
Number 67 79
Floor Area (sq.m) 90,143 78,349
Value (Php 1,000) 250,138 292,778
GRAIN/ RICE MILL
Number - 2
Floor Area (sq.m) - 1,289
Value (Php 1,000) - 3,402
SLAUGTHER HOUSE
Number - 2
Floor Area (sq.m) - 1,754
Value (Php 1,000) - 15,021
OTHER NON-
RESIDENTIAL
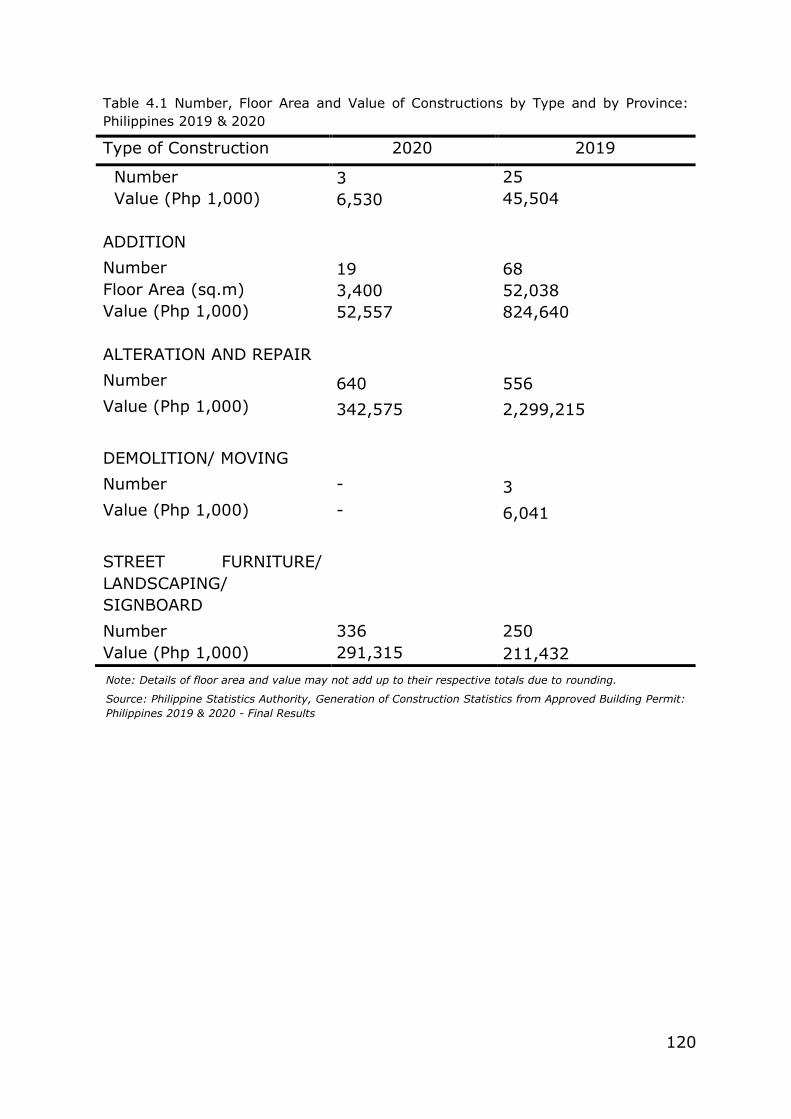
120
Note: Details of floor area and value may not add up to their respective totals due to rounding.
Source: Philippine Statistics Authority, Generation of Construction Statistics from Approved Building Permit:
Philippines 2019 & 2020 - Final Results
Table 4.1 Number, Floor Area and Value of Constructions by Type and by Province:
Philippines 2019 & 2020
Type of Construction 2020 2019
Number 3 25
Value (Php 1,000) 6,530 45,504
ADDITION
Number 19 68
Floor Area (sq.m) 3,400 52,038
Value (Php 1,000) 52,557 824,640
ALTERATION AND REPAIR
Number 640 556
Value (Php 1,000) 342,575 2,299,215
DEMOLITION/ MOVING
Number - 3
Value (Php 1,000) - 6,041
STREET FURNITURE/
LANDSCAPING/
SIGNBOARD
Number 336 250
Value (Php 1,000) 291,315 211,432
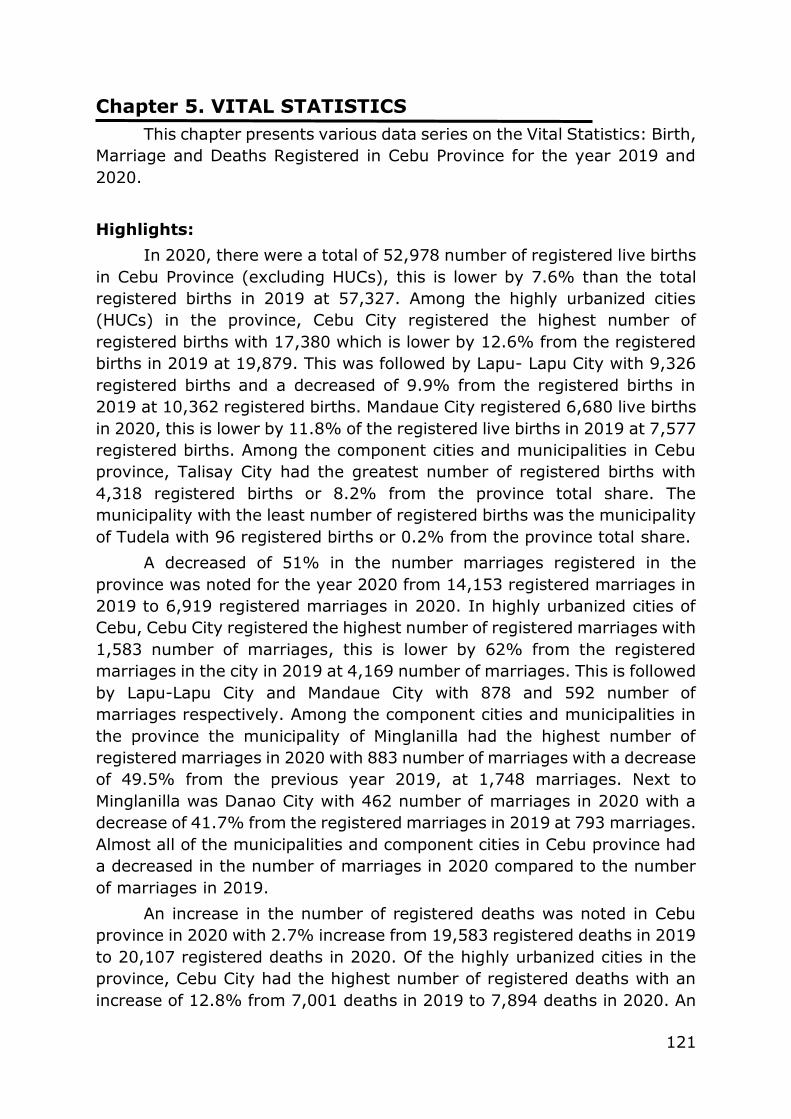
121
Chapter 5. VITAL STATISTICS
This chapter presents various data series on the Vital Statistics: Birth,
Marriage and Deaths Registered in Cebu Province for the year 2019 and
2020.
Highlights:
In 2020, there were a total of 52,978 number of registered live births
in Cebu Province (excluding HUCs), this is lower by 7.6% than the total
registered births in 2019 at 57,327. Among the highly urbanized cities
(HUCs) in the province, Cebu City registered the highest number of
registered births with 17,380 which is lower by 12.6% from the registered
births in 2019 at 19,879. This was followed by Lapu- Lapu City with 9,326
registered births and a decreased of 9.9% from the registered births in
2019 at 10,362 registered births. Mandaue City registered 6,680 live births
in 2020, this is lower by 11.8% of the registered live births in 2019 at 7,577
registered births. Among the component cities and municipalities in Cebu
province, Talisay City had the greatest number of registered births with
4,318 registered births or 8.2% from the province total share. The
municipality with the least number of registered births was the municipality
of Tudela with 96 registered births or 0.2% from the province total share.
A decreased of 51% in the number marriages registered in the
province was noted for the year 2020 from 14,153 registered marriages in
2019 to 6,919 registered marriages in 2020. In highly urbanized cities of
Cebu, Cebu City registered the highest number of registered marriages with
1,583 number of marriages, this is lower by 62% from the registered
marriages in the city in 2019 at 4,169 number of marriages. This is followed
by Lapu-Lapu City and Mandaue City with 878 and 592 number of
marriages respectively. Among the component cities and municipalities in
the province the municipality of Minglanilla had the highest number of
registered marriages in 2020 with 883 number of marriages with a decrease
of 49.5% from the previous year 2019, at 1,748 marriages. Next to
Minglanilla was Danao City with 462 number of marriages in 2020 with a
decrease of 41.7% from the registered marriages in 2019 at 793 marriages.
Almost all of the municipalities and component cities in Cebu province had
a decreased in the number of marriages in 2020 compared to the number
of marriages in 2019.
An increase in the number of registered deaths was noted in Cebu
province in 2020 with 2.7% increase from 19,583 registered deaths in 2019
to 20,107 registered deaths in 2020. Of the highly urbanized cities in the
province, Cebu City had the highest number of registered deaths with an
increase of 12.8% from 7,001 deaths in 2019 to 7,894 deaths in 2020. An
122
increased on the number of deaths was noted in the remaining two HUCs
namely Lapu-Lapu City and Mandaue City with 19.2% increase and 20.6%
increase from 2019 to 2020 respectively.
In Cebu province excluding highly urbanized cities for the year 2020,
the month of October had the highest registered births with 5,259 births or
9.93% from the province share. On the other hand, the month of March
had the least number of registered births with 3,416 or 6.45% from the
province total share.
In 2020, the month of January had the highest number of registered
marriages with 1,346 number of marriages or 19.45% in Cebu province
excluding HUCs. This was followed by the month of February with 1,180
marriages or 17.05%. The month of April had the least number of
marriages registered in 2020 with only 15 marriages registered or 0.22%
in Cebu province.
The month of July 2020, had the highest number of registered deaths in
Cebu province with 2,008 number of deaths or 10% of the registered
deaths in the province while the lowest deaths registered was recorded in
the month of April with 1,396 deaths or 6.9% in 2020.
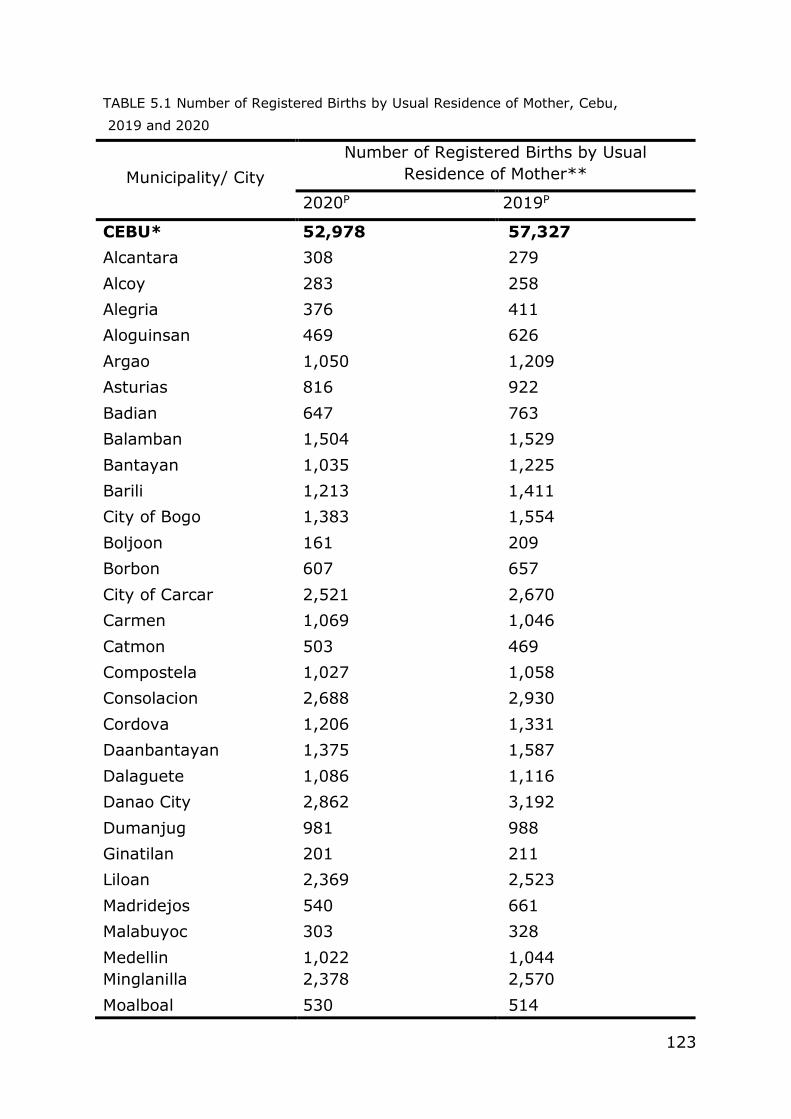
123
TABLE 5.1 Number of Registered Births by Usual Residence of Mother, Cebu,
2019 and 2020
Municipality/ City
Number of Registered Births by Usual
Residence of Mother**
2020P 2019P
CEBU* 52,978 57,327
Alcantara 308 279
Alcoy 283 258
Alegria 376 411
Aloguinsan 469 626
Argao 1,050 1,209
Asturias 816 922
Badian 647 763
Balamban 1,504 1,529
Bantayan 1,035 1,225
Barili 1,213 1,411
City of Bogo 1,383 1,554
Boljoon 161 209
Borbon 607 657
City of Carcar 2,521 2,670
Carmen 1,069 1,046
Catmon 503 469
Compostela 1,027 1,058
Consolacion 2,688 2,930
Cordova 1,206 1,331
Daanbantayan 1,375 1,587
Dalaguete 1,086 1,116
Danao City 2,862 3,192
Dumanjug 981 988
Ginatilan 201 211
Liloan 2,369 2,523
Madridejos 540 661
Malabuyoc 303 328
Medellin 1,022 1,044
Minglanilla 2,378 2,570
Moalboal 530 514
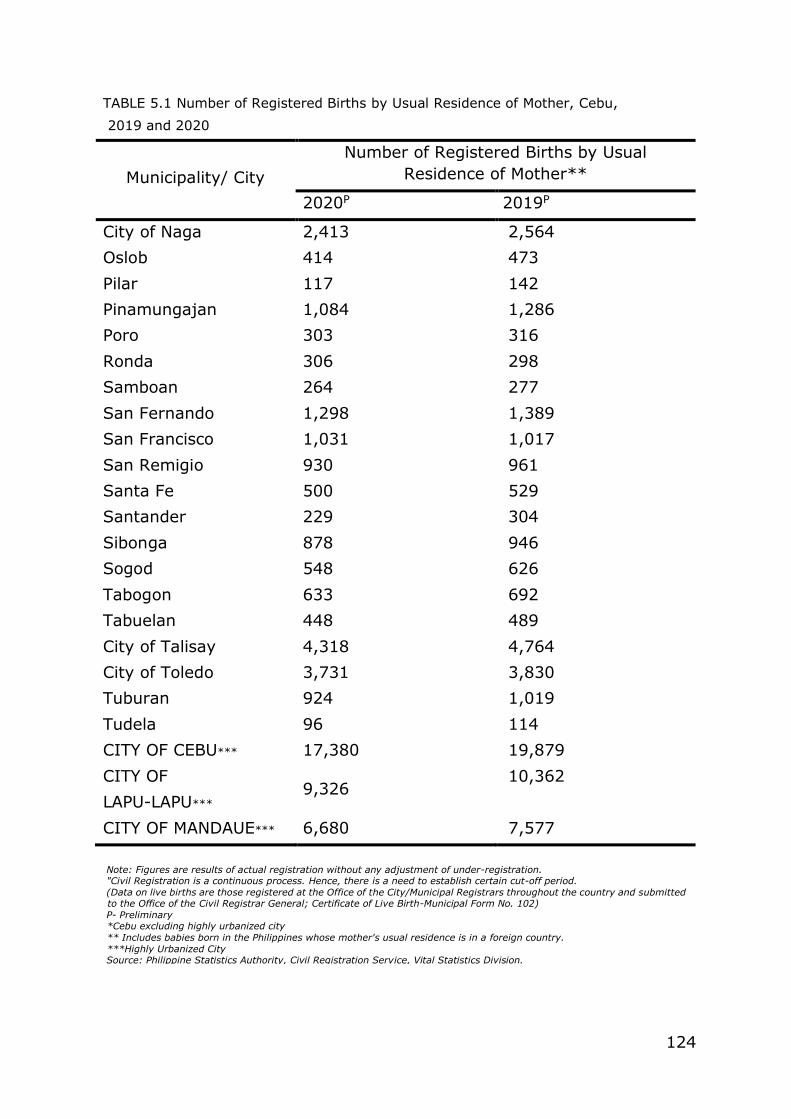
124
Note: Figures are results of actual registration without any adjustment of under-registration. "Civil Registration is a continuous process. Hence, there is a need to establish certain cut-off period.
(Data on live births are those registered at the Office of the City/Municipal Registrars throughout the country and submitted to the Office of the Civil Registrar General; Certificate of Live Birth-Municipal Form No. 102)
P- Preliminary *Cebu excluding highly urbanized city
** Includes babies born in the Philippines whose mother's usual residence is in a foreign country.
***Highly Urbanized City Source: Philippine Statistics Authority, Civil Registration Service, Vital Statistics Division.
TABLE 5.1 Number of Registered Births by Usual Residence of Mother, Cebu,
2019 and 2020
Municipality/ City
Number of Registered Births by Usual
Residence of Mother**
2020P 2019P
City of Naga 2,413 2,564
Oslob 414 473
Pilar 117 142
Pinamungajan 1,084 1,286
Poro 303 316
Ronda 306 298
Samboan 264 277
San Fernando 1,298 1,389
San Francisco 1,031 1,017
San Remigio 930 961
Santa Fe 500 529
Santander 229 304
Sibonga 878 946
Sogod 548 626
Tabogon 633 692
Tabuelan 448 489
City of Talisay 4,318 4,764
City of Toledo 3,731 3,830
Tuburan 924 1,019
Tudela 96 114
CITY OF CEBU*** 17,380 19,879
CITY OF
LAPU-LAPU*** 9,326
10,362
CITY OF MANDAUE*** 6,680 7,577
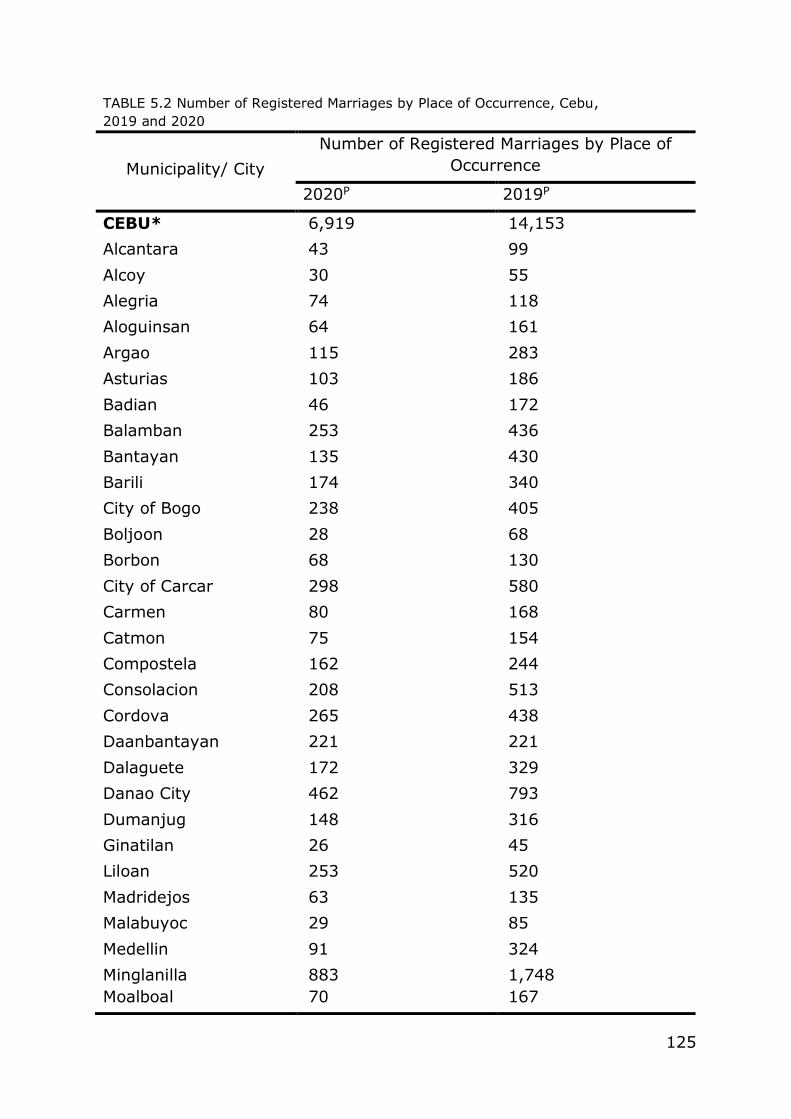
125
TABLE 5.2 Number of Registered Marriages by Place of Occurrence, Cebu,
2019 and 2020
Municipality/ City
Number of Registered Marriages by Place of
Occurrence
2020P 2019P
CEBU* 6,919 14,153
Alcantara 43 99
Alcoy 30 55
Alegria 74 118
Aloguinsan 64 161
Argao 115 283
Asturias 103 186
Badian 46 172
Balamban 253 436
Bantayan 135 430
Barili 174 340
City of Bogo 238 405
Boljoon 28 68
Borbon 68 130
City of Carcar 298 580
Carmen 80 168
Catmon 75 154
Compostela 162 244
Consolacion 208 513
Cordova 265 438
Daanbantayan 221 221
Dalaguete 172 329
Danao City 462 793
Dumanjug 148 316
Ginatilan 26 45
Liloan 253 520
Madridejos 63 135
Malabuyoc 29 85
Medellin 91 324
Minglanilla 883 1,748
Moalboal 70 167
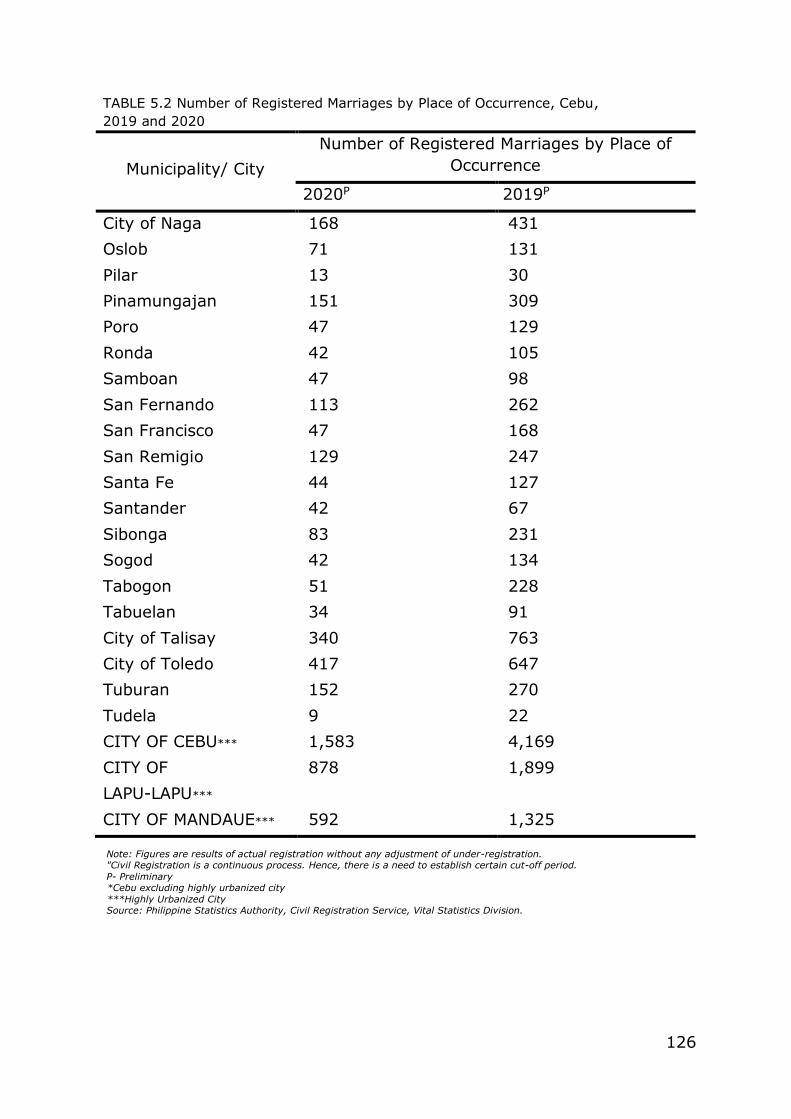
126
Note: Figures are results of actual registration without any adjustment of under-registration. "Civil Registration is a continuous process. Hence, there is a need to establish certain cut-off period.
P- Preliminary *Cebu excluding highly urbanized city
***Highly Urbanized City Source: Philippine Statistics Authority, Civil Registration Service, Vital Statistics Division.
TABLE 5.2 Number of Registered Marriages by Place of Occurrence, Cebu,
2019 and 2020
Municipality/ City
Number of Registered Marriages by Place of
Occurrence
2020P 2019P
City of Naga 168 431
Oslob 71 131
Pilar 13 30
Pinamungajan 151 309
Poro 47 129
Ronda 42 105
Samboan 47 98
San Fernando 113 262
San Francisco 47 168
San Remigio 129 247
Santa Fe 44 127
Santander 42 67
Sibonga 83 231
Sogod 42 134
Tabogon 51 228
Tabuelan 34 91
City of Talisay 340 763
City of Toledo 417 647
Tuburan 152 270
Tudela 9 22
CITY OF CEBU*** 1,583 4,169
CITY OF
LAPU-LAPU***
878 1,899
CITY OF MANDAUE*** 592 1,325

127
TABLE 5.3 Number of Registered Deaths by Usual Residence of Deceased, Cebu,
2019 and 2020
Municipality/ City
Number of Registered Deaths by Usual
Residence of Deceased**
2020P 2019P
CEBU* 20,107 19,583
Alcantara 113 103
Alcoy 136 117
Alegria 158 165
Aloguinsan 173 162
Argao 482 499
Asturias 356 356
Badian 273 279
Balamban 521 573
Bantayan 530 495
Barili 510 475
City of Bogo 595 595
Boljoon 115 131
Borbon 253 248
City of Carcar 844 789
Carmen 370 321
Catmon 233 229
Compostela 320 314
Consolacion 787 665
Cordova 393 353
Daanbantayan 612 605
Dalaguete 413 461
Danao City 981 971
Dumanjug 349 349
Ginatilan 117 122
Liloan 790 731
Madridejos 224 248
Malabuyoc 157 122
Medellin 428 385
Minglanilla 802 754
Moalboal 237 236
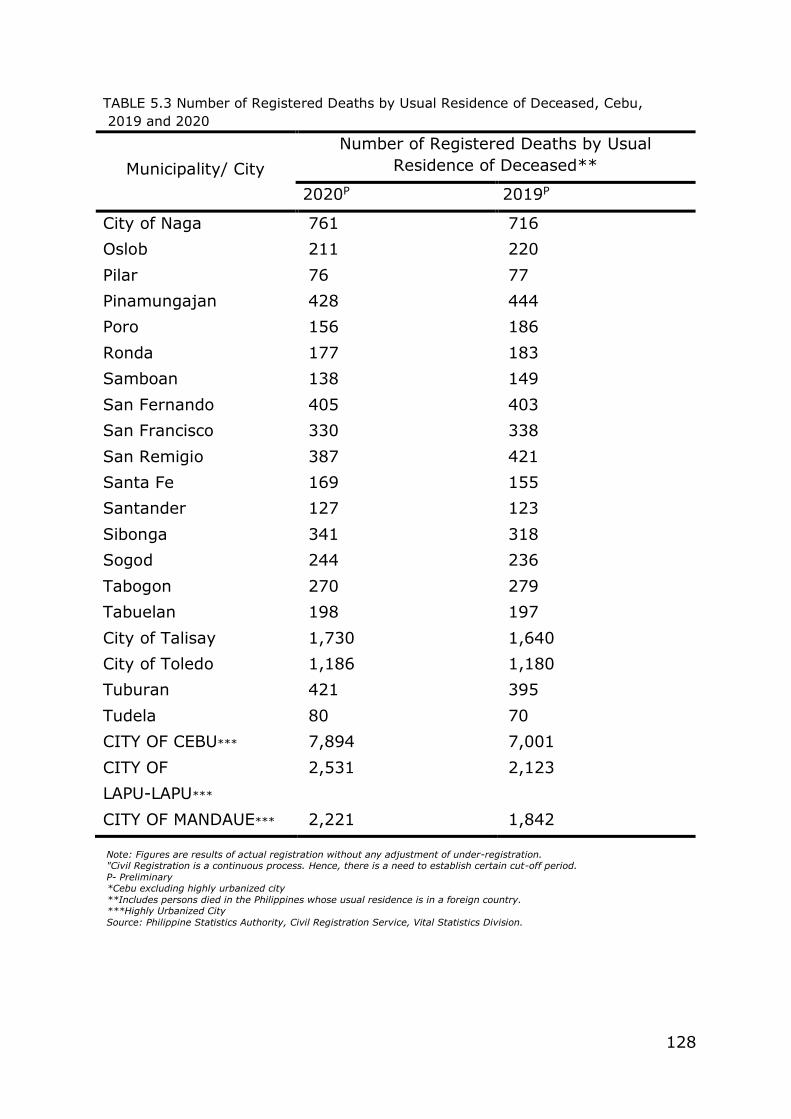
128
Note: Figures are results of actual registration without any adjustment of under-registration. "Civil Registration is a continuous process. Hence, there is a need to establish certain cut-off period.
P- Preliminary *Cebu excluding highly urbanized city
**Includes persons died in the Philippines whose usual residence is in a foreign country. ***Highly Urbanized City
Source: Philippine Statistics Authority, Civil Registration Service, Vital Statistics Division.
TABLE 5.3 Number of Registered Deaths by Usual Residence of Deceased, Cebu,
2019 and 2020
Municipality/ City
Number of Registered Deaths by Usual
Residence of Deceased**
2020P 2019P
City of Naga 761 716
Oslob 211 220
Pilar 76 77
Pinamungajan 428 444
Poro 156 186
Ronda 177 183
Samboan 138 149
San Fernando 405 403
San Francisco 330 338
San Remigio 387 421
Santa Fe 169 155
Santander 127 123
Sibonga 341 318
Sogod 244 236
Tabogon 270 279
Tabuelan 198 197
City of Talisay 1,730 1,640
City of Toledo 1,186 1,180
Tuburan 421 395
Tudela 80 70
CITY OF CEBU*** 7,894 7,001
CITY OF
LAPU-LAPU***
2,531 2,123
CITY OF MANDAUE*** 2,221 1,842
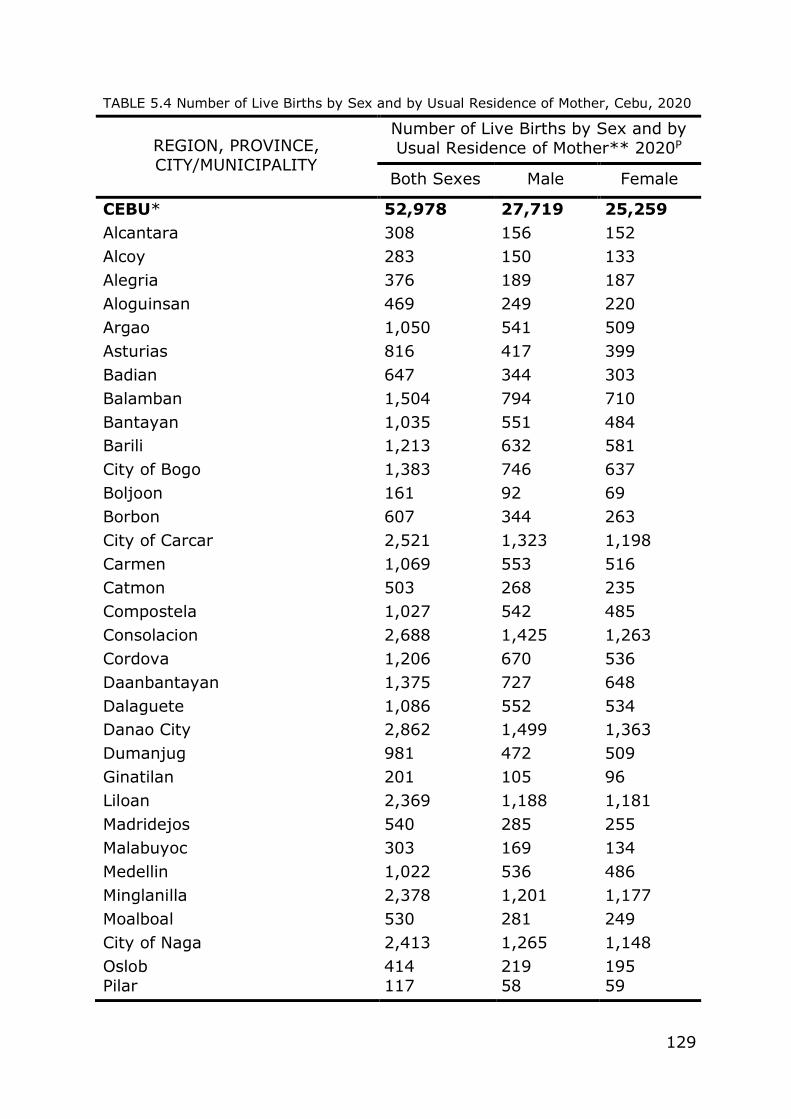
129
TABLE 5.4 Number of Live Births by Sex and by Usual Residence of Mother, Cebu, 2020
REGION, PROVINCE,
CITY/MUNICIPALITY
Number of Live Births by Sex and by
Usual Residence of Mother** 2020P
Both Sexes Male Female
CEBU* 52,978 27,719 25,259
Alcantara 308 156 152
Alcoy 283 150 133
Alegria 376 189 187
Aloguinsan 469 249 220
Argao 1,050 541 509
Asturias 816 417 399
Badian 647 344 303
Balamban 1,504 794 710
Bantayan 1,035 551 484
Barili 1,213 632 581
City of Bogo 1,383 746 637
Boljoon 161 92 69
Borbon 607 344 263
City of Carcar 2,521 1,323 1,198
Carmen 1,069 553 516
Catmon 503 268 235
Compostela 1,027 542 485
Consolacion 2,688 1,425 1,263
Cordova 1,206 670 536
Daanbantayan 1,375 727 648
Dalaguete 1,086 552 534
Danao City 2,862 1,499 1,363
Dumanjug 981 472 509
Ginatilan 201 105 96
Liloan 2,369 1,188 1,181
Madridejos 540 285 255
Malabuyoc 303 169 134
Medellin 1,022 536 486
Minglanilla 2,378 1,201 1,177
Moalboal 530 281 249
City of Naga 2,413 1,265 1,148
Oslob 414 219 195
Pilar 117 58 59
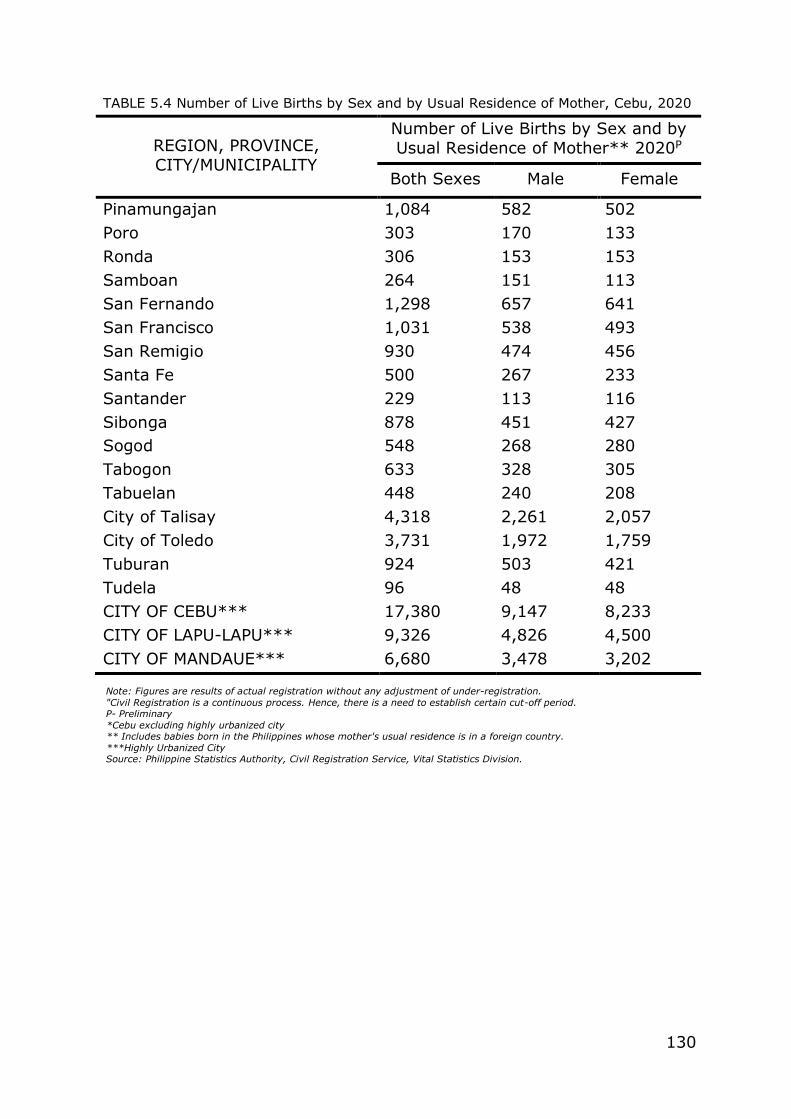
130
Note: Figures are results of actual registration without any adjustment of under-registration.
"Civil Registration is a continuous process. Hence, there is a need to establish certain cut-off period. P- Preliminary
*Cebu excluding highly urbanized city ** Includes babies born in the Philippines whose mother's usual residence is in a foreign country.
***Highly Urbanized City Source: Philippine Statistics Authority, Civil Registration Service, Vital Statistics Division.
TABLE 5.4 Number of Live Births by Sex and by Usual Residence of Mother, Cebu, 2020
REGION, PROVINCE,
CITY/MUNICIPALITY
Number of Live Births by Sex and by
Usual Residence of Mother** 2020P
Both Sexes Male Female
Pinamungajan 1,084 582 502
Poro 303 170 133
Ronda 306 153 153
Samboan 264 151 113
San Fernando 1,298 657 641
San Francisco 1,031 538 493
San Remigio 930 474 456
Santa Fe 500 267 233
Santander 229 113 116
Sibonga 878 451 427
Sogod 548 268 280
Tabogon 633 328 305
Tabuelan 448 240 208
City of Talisay 4,318 2,261 2,057
City of Toledo 3,731 1,972 1,759
Tuburan 924 503 421
Tudela 96 48 48
CITY OF CEBU*** 17,380 9,147 8,233
CITY OF LAPU-LAPU*** 9,326 4,826 4,500
CITY OF MANDAUE*** 6,680 3,478 3,202
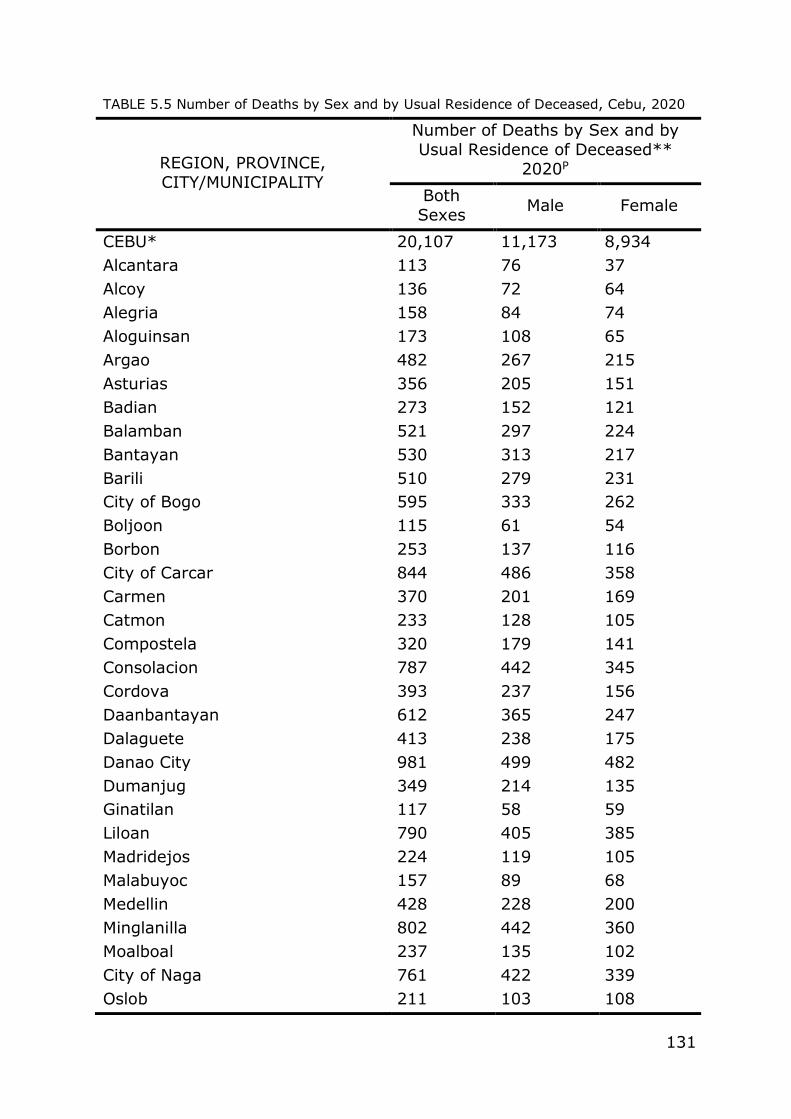
131
TABLE 5.5 Number of Deaths by Sex and by Usual Residence of Deceased, Cebu, 2020
REGION, PROVINCE,
CITY/MUNICIPALITY
Number of Deaths by Sex and by
Usual Residence of Deceased**
2020P
Both
Sexes Male Female
CEBU* 20,107 11,173 8,934
Alcantara 113 76 37
Alcoy 136 72 64
Alegria 158 84 74
Aloguinsan 173 108 65
Argao 482 267 215
Asturias 356 205 151
Badian 273 152 121
Balamban 521 297 224
Bantayan 530 313 217
Barili 510 279 231
City of Bogo 595 333 262
Boljoon 115 61 54
Borbon 253 137 116
City of Carcar 844 486 358
Carmen 370 201 169
Catmon 233 128 105
Compostela 320 179 141
Consolacion 787 442 345
Cordova 393 237 156
Daanbantayan 612 365 247
Dalaguete 413 238 175
Danao City 981 499 482
Dumanjug 349 214 135
Ginatilan 117 58 59
Liloan 790 405 385
Madridejos 224 119 105
Malabuyoc 157 89 68
Medellin 428 228 200
Minglanilla 802 442 360
Moalboal 237 135 102
City of Naga 761 422 339
Oslob 211 103 108
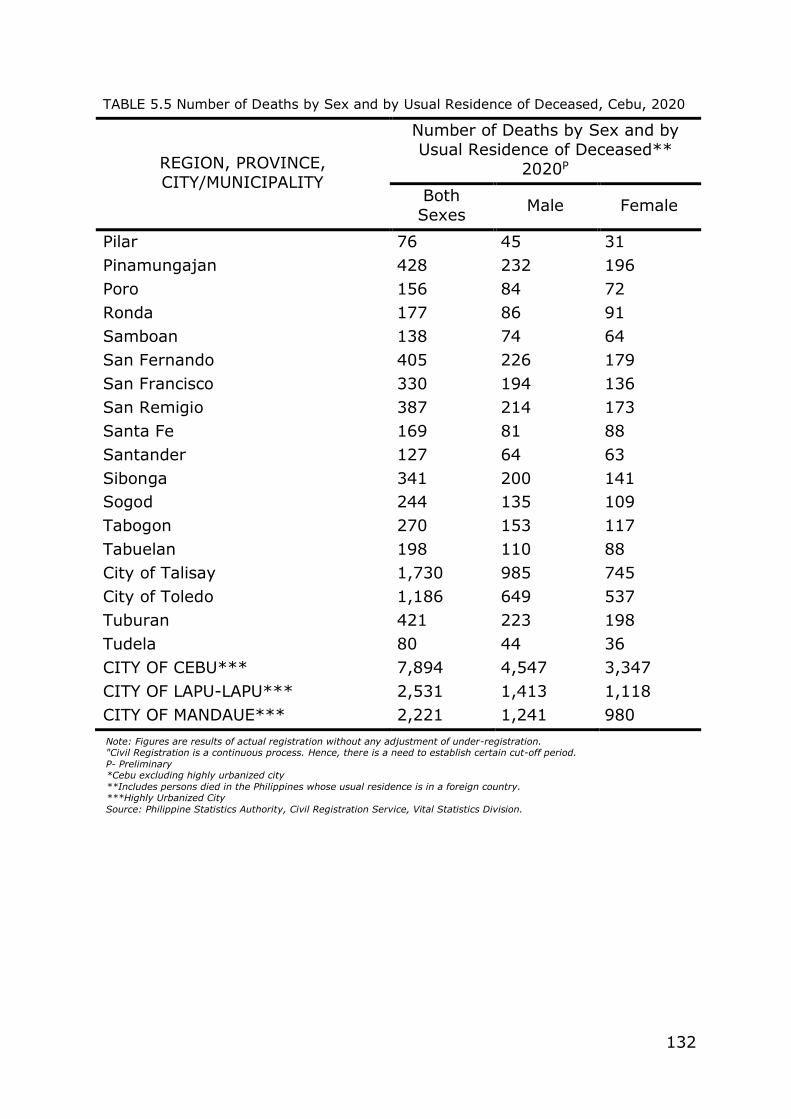
132
Note: Figures are results of actual registration without any adjustment of under-registration. "Civil Registration is a continuous process. Hence, there is a need to establish certain cut-off period.
P- Preliminary *Cebu excluding highly urbanized city
**Includes persons died in the Philippines whose usual residence is in a foreign country. ***Highly Urbanized City
Source: Philippine Statistics Authority, Civil Registration Service, Vital Statistics Division.
TABLE 5.5 Number of Deaths by Sex and by Usual Residence of Deceased, Cebu, 2020
REGION, PROVINCE,
CITY/MUNICIPALITY
Number of Deaths by Sex and by
Usual Residence of Deceased**
2020P
Both
Sexes Male Female
Pilar 76 45 31
Pinamungajan 428 232 196
Poro 156 84 72
Ronda 177 86 91
Samboan 138 74 64
San Fernando 405 226 179
San Francisco 330 194 136
San Remigio 387 214 173
Santa Fe 169 81 88
Santander 127 64 63
Sibonga 341 200 141
Sogod 244 135 109
Tabogon 270 153 117
Tabuelan 198 110 88
City of Talisay 1,730 985 745
City of Toledo 1,186 649 537
Tuburan 421 223 198
Tudela 80 44 36
CITY OF CEBU*** 7,894 4,547 3,347
CITY OF LAPU-LAPU*** 2,531 1,413 1,118
CITY OF MANDAUE*** 2,221 1,241 980

133
Table 5.6 Number of Live Births by Sex and by Usual Residence of Mother, Cebu 2019
PROVINCE, MUNICIPALITY/ CITY/
HIGHLY URBANIZED CITY
Number of Live Births by Sex and by
Usual Residence of Mother** 2019P
Both Sexes Male Female
CEBU* 57,324 29,971 27,353
Alcantara 279 137 142
Alcoy 258 126 132
Alegria 411 211 200
Aloguinsan 626 315 311
Argao 1,209 634 575
Asturias 922 484 438
Badian 763 410 353
Balamban 1,529 779 750
Bantayan 1,225 646 579
Barili 1,411 729 682
City of Bogo 1,554 809 745
Boljoon 209 103 106
Borbon 657 335 322
City of Carcar 2,670 1,389 1,281
Carmen 1,046 520 526
Catmon 469 257 212
Compostela 1,058 566 492
Consolacion 2,930 1,592 1,338
Cordova 1,331 688 643
Daanbantayan 1,587 837 750
Dalaguete 1,116 575 541
Danao City 3,192 1,623 1,569
Dumanjug 988 525 463
Ginatilan 211 113 98
Liloan 2,523 1,315 1,208
Madridejos 661 349 312
Malabuyoc 328 175 153
Medellin 1,044 549 495
Minglanilla 2,570 1,341 1,229
Moalboal 514 304 210
City of Naga 2,564 1,349 1,215
Oslob 473 228 245
Pilar 142 70 72
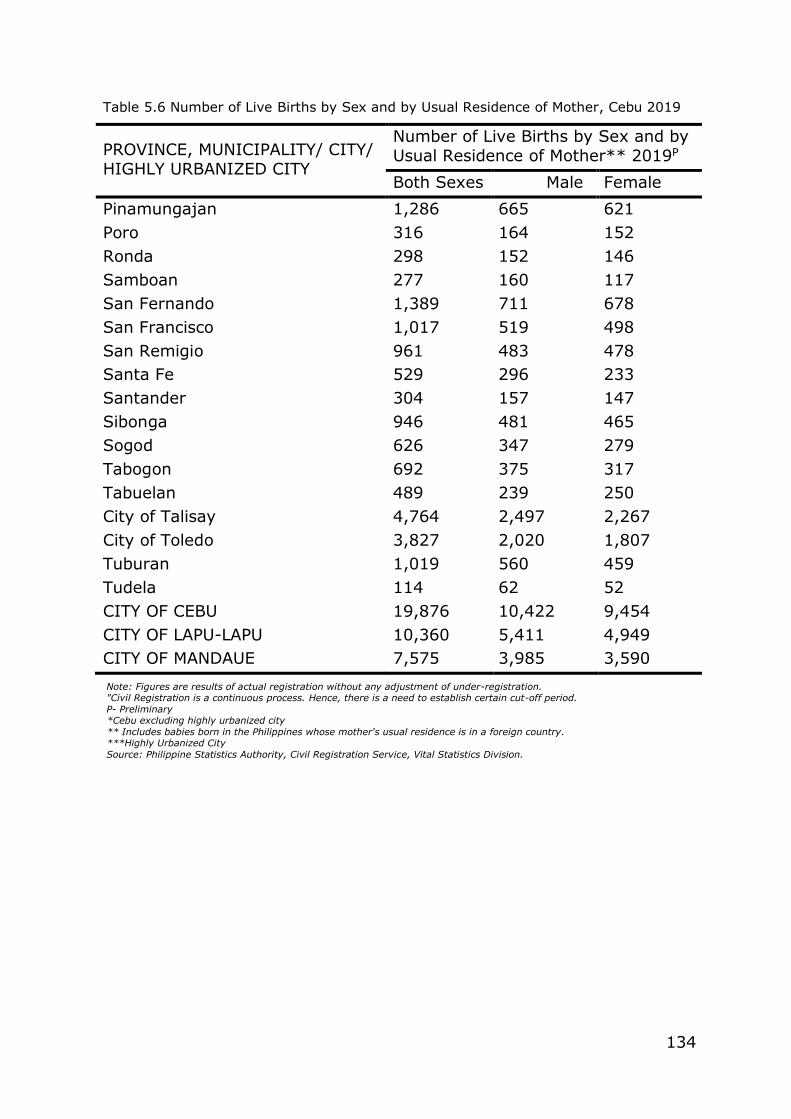
134
Note: Figures are results of actual registration without any adjustment of under-registration. "Civil Registration is a continuous process. Hence, there is a need to establish certain cut-off period.
P- Preliminary *Cebu excluding highly urbanized city
** Includes babies born in the Philippines whose mother's usual residence is in a foreign country. ***Highly Urbanized City
Source: Philippine Statistics Authority, Civil Registration Service, Vital Statistics Division.
Table 5.6 Number of Live Births by Sex and by Usual Residence of Mother, Cebu 2019
PROVINCE, MUNICIPALITY/ CITY/
HIGHLY URBANIZED CITY
Number of Live Births by Sex and by
Usual Residence of Mother** 2019P
Both Sexes Male Female
Pinamungajan 1,286 665 621
Poro 316 164 152
Ronda 298 152 146
Samboan 277 160 117
San Fernando 1,389 711 678
San Francisco 1,017 519 498
San Remigio 961 483 478
Santa Fe 529 296 233
Santander 304 157 147
Sibonga 946 481 465
Sogod 626 347 279
Tabogon 692 375 317
Tabuelan 489 239 250
City of Talisay 4,764 2,497 2,267
City of Toledo 3,827 2,020 1,807
Tuburan 1,019 560 459
Tudela 114 62 52
CITY OF CEBU 19,876 10,422 9,454
CITY OF LAPU-LAPU 10,360 5,411 4,949
CITY OF MANDAUE 7,575 3,985 3,590
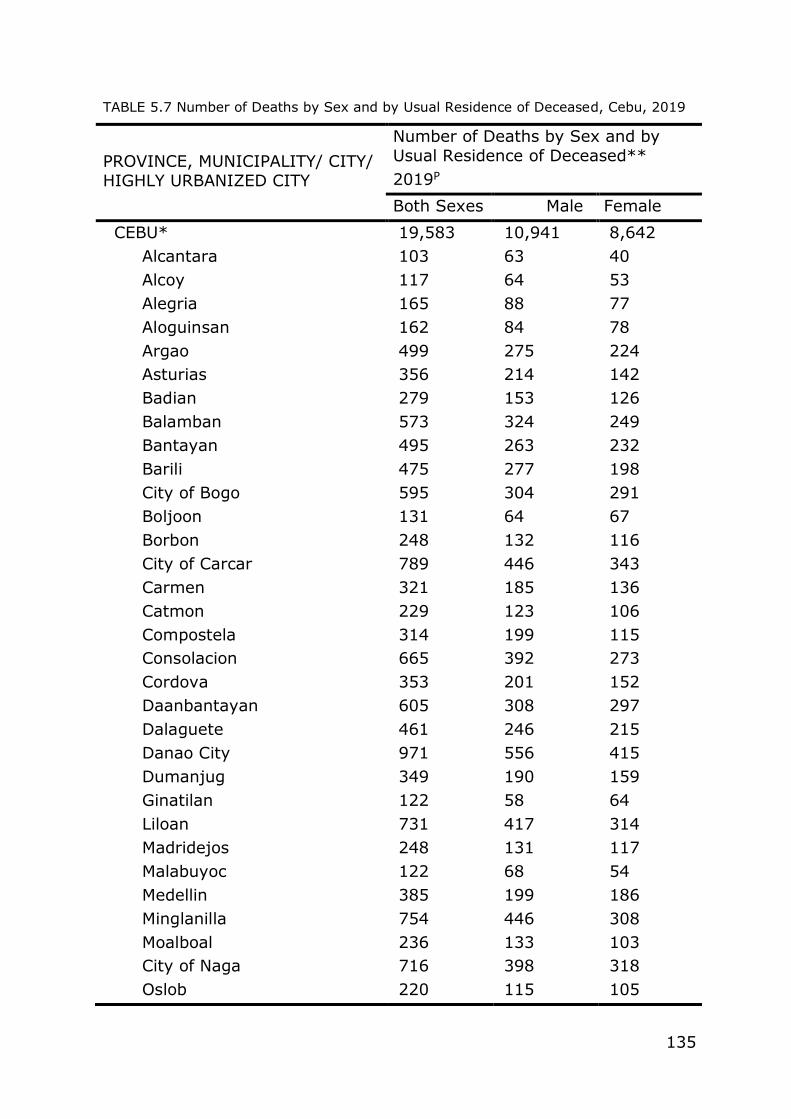
135
TABLE 5.7 Number of Deaths by Sex and by Usual Residence of Deceased, Cebu, 2019
PROVINCE, MUNICIPALITY/ CITY/
HIGHLY URBANIZED CITY
Number of Deaths by Sex and by
Usual Residence of Deceased**
2019P
Both Sexes Male Female
CEBU* 19,583 10,941 8,642
Alcantara 103 63 40
Alcoy 117 64 53
Alegria 165 88 77
Aloguinsan 162 84 78
Argao 499 275 224
Asturias 356 214 142
Badian 279 153 126
Balamban 573 324 249
Bantayan 495 263 232
Barili 475 277 198
City of Bogo 595 304 291
Boljoon 131 64 67
Borbon 248 132 116
City of Carcar 789 446 343
Carmen 321 185 136
Catmon 229 123 106
Compostela 314 199 115
Consolacion 665 392 273
Cordova 353 201 152
Daanbantayan 605 308 297
Dalaguete 461 246 215
Danao City 971 556 415
Dumanjug 349 190 159
Ginatilan 122 58 64
Liloan 731 417 314
Madridejos 248 131 117
Malabuyoc 122 68 54
Medellin 385 199 186
Minglanilla 754 446 308
Moalboal 236 133 103
City of Naga 716 398 318
Oslob 220 115 105
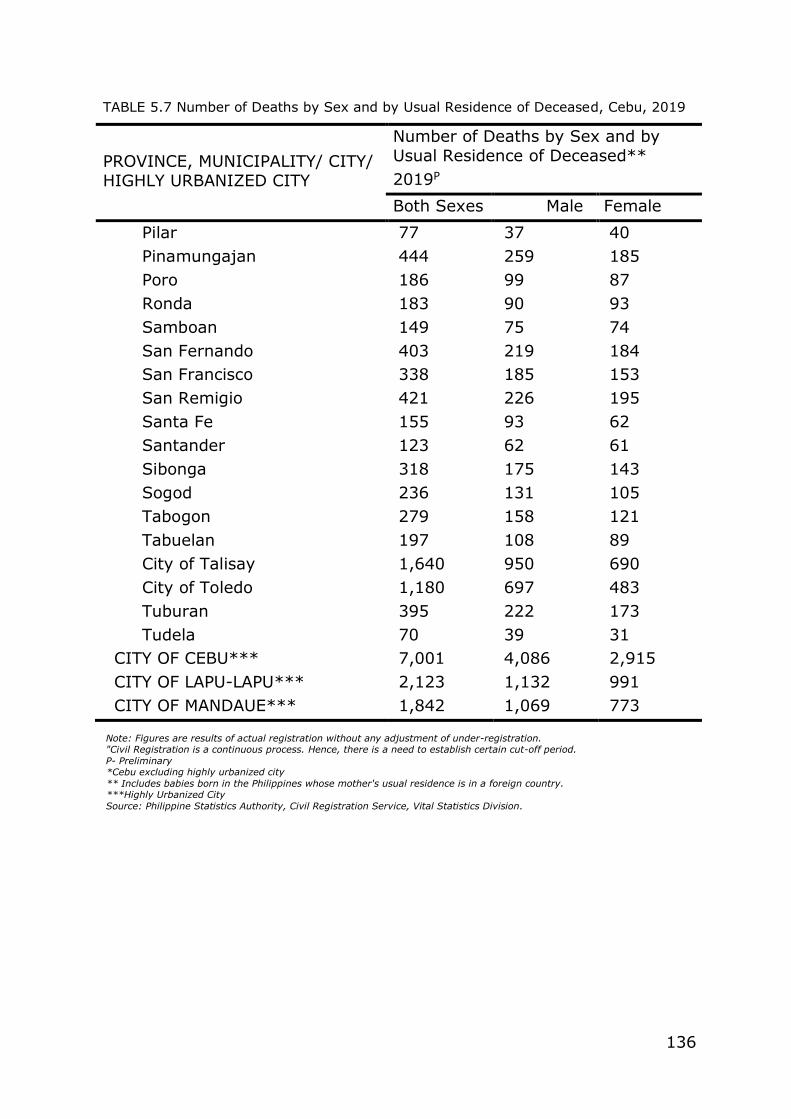
136
Note: Figures are results of actual registration without any adjustment of under-registration. "Civil Registration is a continuous process. Hence, there is a need to establish certain cut-off period.
P- Preliminary *Cebu excluding highly urbanized city
** Includes babies born in the Philippines whose mother's usual residence is in a foreign country. ***Highly Urbanized City
Source: Philippine Statistics Authority, Civil Registration Service, Vital Statistics Division.
TABLE 5.7 Number of Deaths by Sex and by Usual Residence of Deceased, Cebu, 2019
PROVINCE, MUNICIPALITY/ CITY/
HIGHLY URBANIZED CITY
Number of Deaths by Sex and by
Usual Residence of Deceased**
2019P
Both Sexes Male Female
Pilar 77 37 40
Pinamungajan 444 259 185
Poro 186 99 87
Ronda 183 90 93
Samboan 149 75 74
San Fernando 403 219 184
San Francisco 338 185 153
San Remigio 421 226 195
Santa Fe 155 93 62
Santander 123 62 61
Sibonga 318 175 143
Sogod 236 131 105
Tabogon 279 158 121
Tabuelan 197 108 89
City of Talisay 1,640 950 690
City of Toledo 1,180 697 483
Tuburan 395 222 173
Tudela 70 39 31
CITY OF CEBU*** 7,001 4,086 2,915
CITY OF LAPU-LAPU*** 2,123 1,132 991
CITY OF MANDAUE*** 1,842 1,069 773
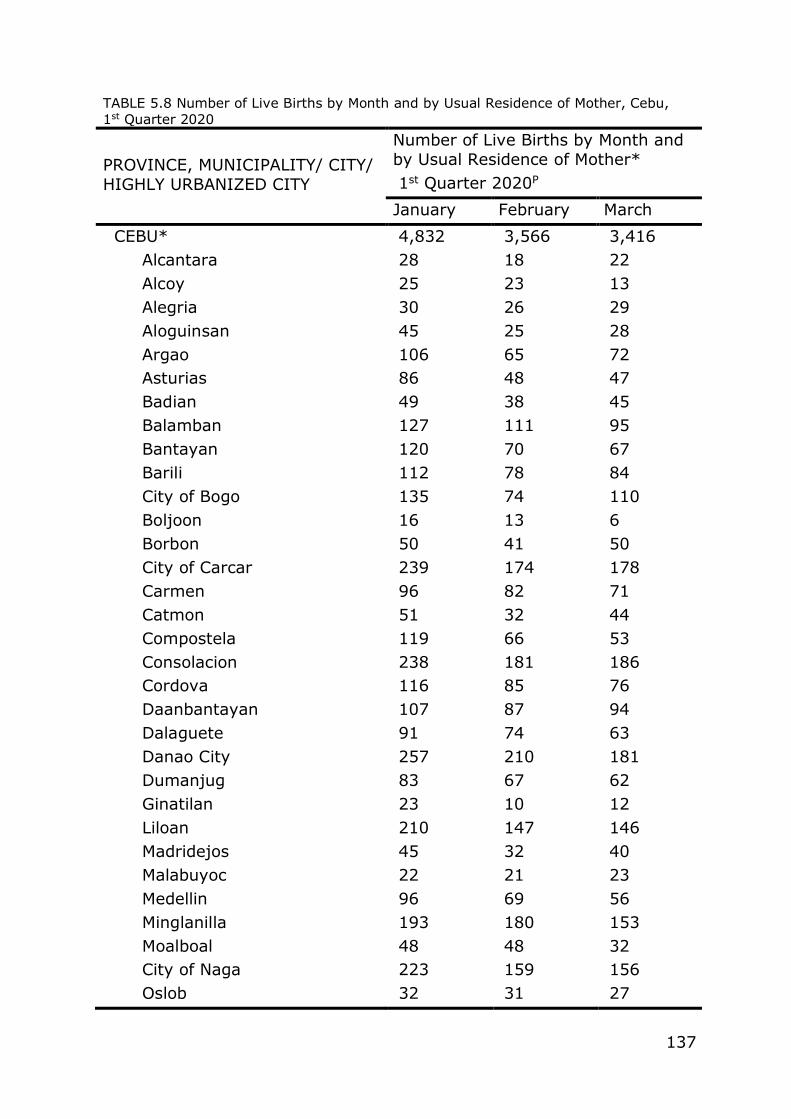
137
TABLE 5.8 Number of Live Births by Month and by Usual Residence of Mother, Cebu,
1st Quarter 2020
PROVINCE, MUNICIPALITY/ CITY/
HIGHLY URBANIZED CITY
Number of Live Births by Month and
by Usual Residence of Mother*
1st Quarter 2020P
January February March
CEBU* 4,832 3,566 3,416
Alcantara 28 18 22
Alcoy 25 23 13
Alegria 30 26 29
Aloguinsan 45 25 28
Argao 106 65 72
Asturias 86 48 47
Badian 49 38 45
Balamban 127 111 95
Bantayan 120 70 67
Barili 112 78 84
City of Bogo 135 74 110
Boljoon 16 13 6
Borbon 50 41 50
City of Carcar 239 174 178
Carmen 96 82 71
Catmon 51 32 44
Compostela 119 66 53
Consolacion 238 181 186
Cordova 116 85 76
Daanbantayan 107 87 94
Dalaguete 91 74 63
Danao City 257 210 181
Dumanjug 83 67 62
Ginatilan 23 10 12
Liloan 210 147 146
Madridejos 45 32 40
Malabuyoc 22 21 23
Medellin 96 69 56
Minglanilla 193 180 153
Moalboal 48 48 32
City of Naga 223 159 156
Oslob 32 31 27

138
Note: Figures are results of actual registration without any adjustment of under-registration. "Civil Registration is a continuous process. Hence, there is a need to establish certain cut-off period.
P- Preliminary *Cebu excluding highly urbanized city
***Highly Urbanized City Source: Philippine Statistics Authority, Civil Registration Service, Vital Statistics Division.
TABLE 5.8 Number of Live Births by Month and by Usual Residence of Mother, Cebu,
1st Quarter 2020
PROVINCE, MUNICIPALITY/ CITY/
HIGHLY URBANIZED CITY
Number of Live Births by Month and
by Usual Residence of Mother*
1st Quarter 2020P
January February March
Pilar 7 14 5
Pinamungajan 90 74 74
Poro 19 19 17
Ronda 25 17 20
Samboan 24 12 13
San Fernando 124 69 78
San Francisco 97 64 81
San Remigio 91 70 62
Santa Fe 59 28 28
Santander 14 23 15
Sibonga 78 53 59
Sogod 48 42 36
Tabogon 61 36 38
Tabuelan 35 25 28
City of Talisay 413 309 249
City of Toledo 333 256 242
Tuburan 89 59 42
Tudela 7 11 8
CITY OF CEBU*** 1,596 1,249 1,215
CITY OF LAPU-LAPU*** 806 601 593
CITY OF MANDAUE*** 617 465 424
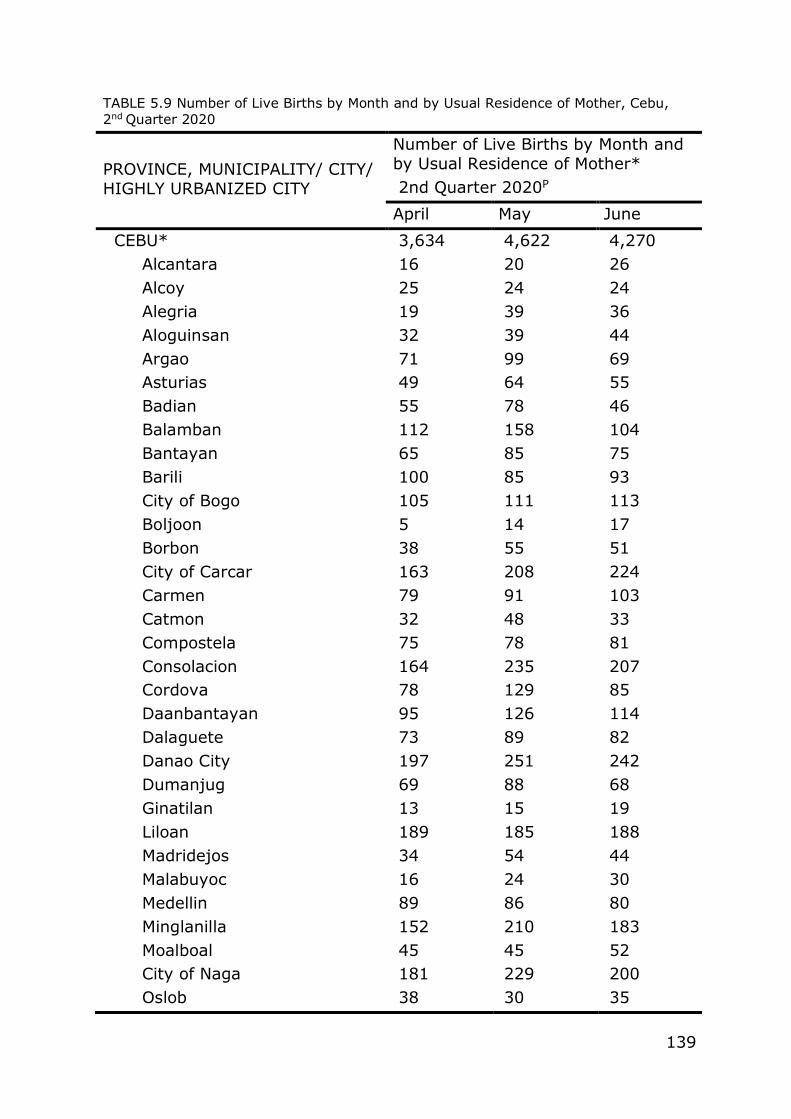
139
TABLE 5.9 Number of Live Births by Month and by Usual Residence of Mother, Cebu,
2nd Quarter 2020
PROVINCE, MUNICIPALITY/ CITY/
HIGHLY URBANIZED CITY
Number of Live Births by Month and
by Usual Residence of Mother*
2nd Quarter 2020P
April May June
CEBU* 3,634 4,622 4,270
Alcantara 16 20 26
Alcoy 25 24 24
Alegria 19 39 36
Aloguinsan 32 39 44
Argao 71 99 69
Asturias 49 64 55
Badian 55 78 46
Balamban 112 158 104
Bantayan 65 85 75
Barili 100 85 93
City of Bogo 105 111 113
Boljoon 5 14 17
Borbon 38 55 51
City of Carcar 163 208 224
Carmen 79 91 103
Catmon 32 48 33
Compostela 75 78 81
Consolacion 164 235 207
Cordova 78 129 85
Daanbantayan 95 126 114
Dalaguete 73 89 82
Danao City 197 251 242
Dumanjug 69 88 68
Ginatilan 13 15 19
Liloan 189 185 188
Madridejos 34 54 44
Malabuyoc 16 24 30
Medellin 89 86 80
Minglanilla 152 210 183
Moalboal 45 45 52
City of Naga 181 229 200
Oslob 38 30 35
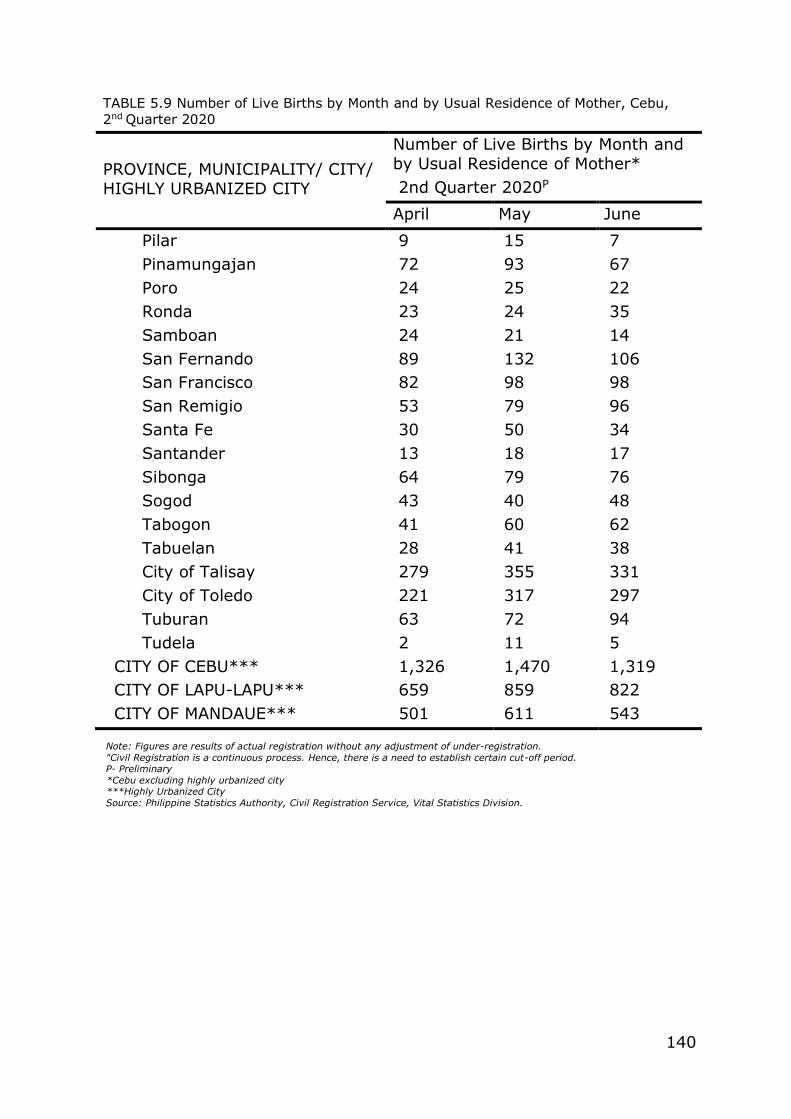
140
Note: Figures are results of actual registration without any adjustment of under-registration.
"Civil Registration is a continuous process. Hence, there is a need to establish certain cut-off period. P- Preliminary
*Cebu excluding highly urbanized city ***Highly Urbanized City
Source: Philippine Statistics Authority, Civil Registration Service, Vital Statistics Division.
TABLE 5.9 Number of Live Births by Month and by Usual Residence of Mother, Cebu,
2nd Quarter 2020
PROVINCE, MUNICIPALITY/ CITY/
HIGHLY URBANIZED CITY
Number of Live Births by Month and
by Usual Residence of Mother*
2nd Quarter 2020P
April May June
Pilar 9 15 7
Pinamungajan 72 93 67
Poro 24 25 22
Ronda 23 24 35
Samboan 24 21 14
San Fernando 89 132 106
San Francisco 82 98 98
San Remigio 53 79 96
Santa Fe 30 50 34
Santander 13 18 17
Sibonga 64 79 76
Sogod 43 40 48
Tabogon 41 60 62
Tabuelan 28 41 38
City of Talisay 279 355 331
City of Toledo 221 317 297
Tuburan 63 72 94
Tudela 2 11 5
CITY OF CEBU*** 1,326 1,470 1,319
CITY OF LAPU-LAPU*** 659 859 822
CITY OF MANDAUE*** 501 611 543

141
TABLE 5.10 Number of Live Births by Month and by Usual Residence of Mother, Cebu,
3rd Quarter 2020
PROVINCE, MUNICIPALITY/ CITY/
HIGHLY URBANIZED CITY
Number of Live Births by Month and
by Usual Residence of Mother*
3rd Quarter 2020P
July August September
CEBU* 4,285 4,515 5,234
Alcantara 30 30 30
Alcoy 20 25 25
Alegria 35 24 35
Aloguinsan 47 43 40
Argao 66 92 110
Asturias 87 65 82
Badian 64 44 71
Balamban 117 143 132
Bantayan 92 77 102
Barili 105 107 118
City of Bogo 119 124 136
Boljoon 13 22 22
Borbon 49 49 65
City of Carcar 199 215 225
Carmen 73 81 86
Catmon 37 34 49
Compostela 102 73 72
Consolacion 219 228 267
Cordova 94 115 103
Daanbantayan 117 107 132
Dalaguete 97 103 125
Danao City 235 244 275
Dumanjug 73 80 96
Ginatilan 14 12 24
Liloan 194 206 237
Madridejos 47 47 47
Malabuyoc 27 20 34
Medellin 85 100 106
Minglanilla 204 197 226
Moalboal 43 48 54
City of Naga 170 198 240
Oslob 27 43 40

142
Note: Figures are results of actual registration without any adjustment of under-registration.
"Civil Registration is a continuous process. Hence, there is a need to establish certain cut-off period. P- Preliminary
*Cebu excluding highly urbanized city ***Highly Urbanized City
Source: Philippine Statistics Authority, Civil Registration Service, Vital Statistics Division.
TABLE 5.10 Number of Live Births by Month and by Usual Residence of Mother, Cebu,
3rd Quarter 2020
PROVINCE, MUNICIPALITY/ CITY/
HIGHLY URBANIZED CITY
Number of Live Births by Month and
by Usual Residence of Mother*
3rd Quarter 2020P
July August September
Pilar 9 11 13
Pinamungajan 84 101 117
Poro 22 27 31
Ronda 15 41 26
Samboan 13 35 30
San Fernando 111 92 134
San Francisco 62 83 92
San Remigio 64 70 115
Santa Fe 40 43 52
Santander 23 18 25
Sibonga 75 81 79
Sogod 54 44 63
Tabogon 55 51 63
Tabuelan 41 37 47
City of Talisay 365 351 434
City of Toledo 261 346 403
Tuburan 81 80 90
Tudela 9 8 14
CITY OF CEBU*** 1,395 1,482 1,587
CITY OF LAPU-LAPU*** 740 808 857
CITY OF MANDAUE*** 573 567 614
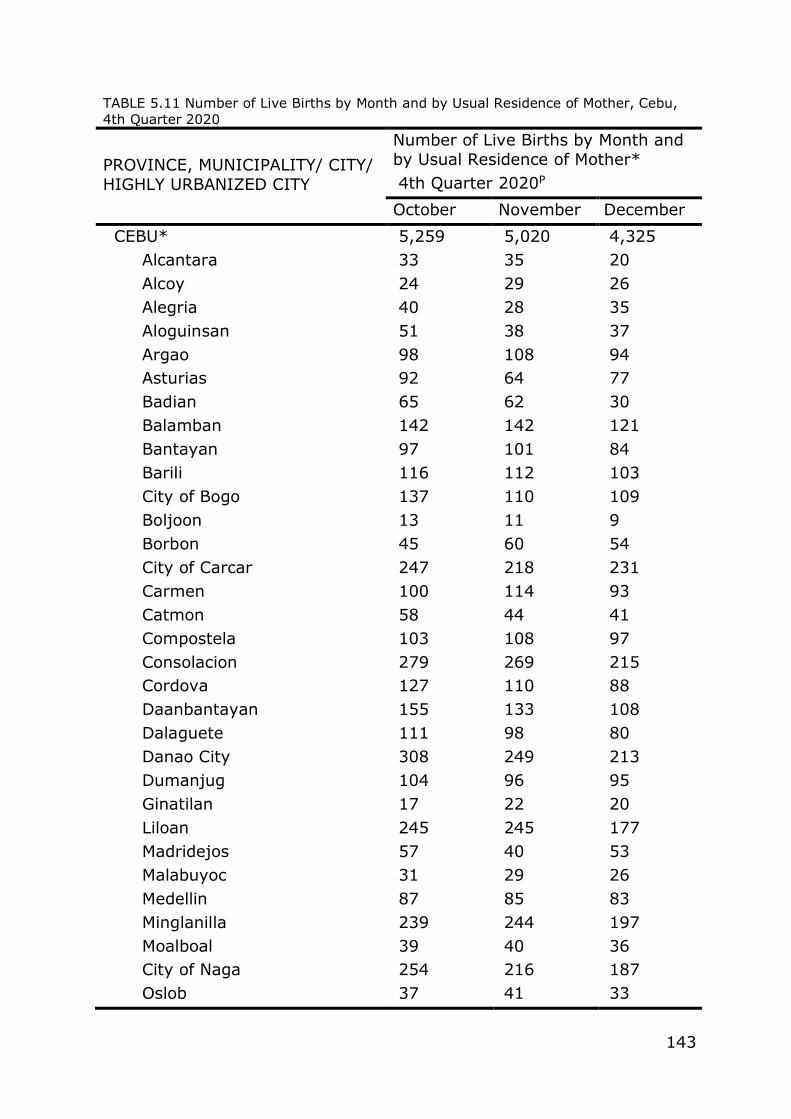
143
TABLE 5.11 Number of Live Births by Month and by Usual Residence of Mother, Cebu,
4th Quarter 2020
PROVINCE, MUNICIPALITY/ CITY/
HIGHLY URBANIZED CITY
Number of Live Births by Month and
by Usual Residence of Mother*
4th Quarter 2020P
October November December
CEBU* 5,259 5,020 4,325
Alcantara 33 35 20
Alcoy 24 29 26
Alegria 40 28 35
Aloguinsan 51 38 37
Argao 98 108 94
Asturias 92 64 77
Badian 65 62 30
Balamban 142 142 121
Bantayan 97 101 84
Barili 116 112 103
City of Bogo 137 110 109
Boljoon 13 11 9
Borbon 45 60 54
City of Carcar 247 218 231
Carmen 100 114 93
Catmon 58 44 41
Compostela 103 108 97
Consolacion 279 269 215
Cordova 127 110 88
Daanbantayan 155 133 108
Dalaguete 111 98 80
Danao City 308 249 213
Dumanjug 104 96 95
Ginatilan 17 22 20
Liloan 245 245 177
Madridejos 57 40 53
Malabuyoc 31 29 26
Medellin 87 85 83
Minglanilla 239 244 197
Moalboal 39 40 36
City of Naga 254 216 187
Oslob 37 41 33
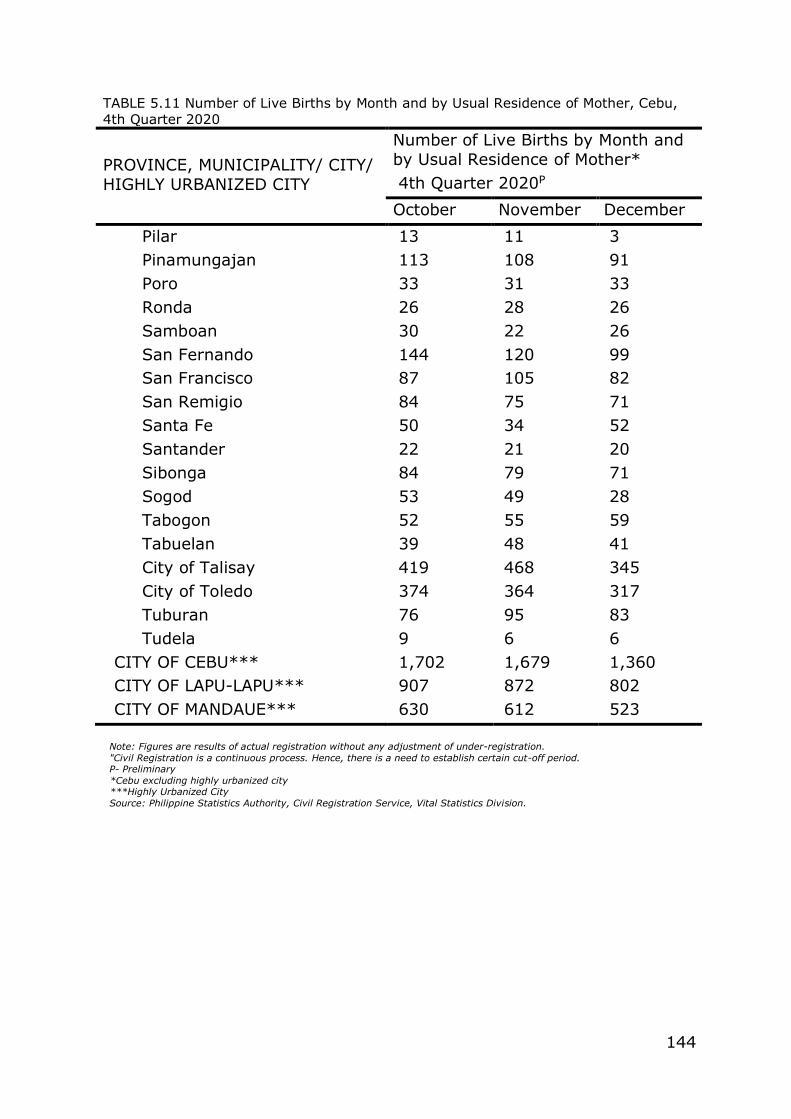
144
Note: Figures are results of actual registration without any adjustment of under-registration.
"Civil Registration is a continuous process. Hence, there is a need to establish certain cut-off period. P- Preliminary
*Cebu excluding highly urbanized city ***Highly Urbanized City
Source: Philippine Statistics Authority, Civil Registration Service, Vital Statistics Division.
TABLE 5.11 Number of Live Births by Month and by Usual Residence of Mother, Cebu,
4th Quarter 2020
PROVINCE, MUNICIPALITY/ CITY/
HIGHLY URBANIZED CITY
Number of Live Births by Month and
by Usual Residence of Mother*
4th Quarter 2020P
October November December
Pilar 13 11 3
Pinamungajan 113 108 91
Poro 33 31 33
Ronda 26 28 26
Samboan 30 22 26
San Fernando 144 120 99
San Francisco 87 105 82
San Remigio 84 75 71
Santa Fe 50 34 52
Santander 22 21 20
Sibonga 84 79 71
Sogod 53 49 28
Tabogon 52 55 59
Tabuelan 39 48 41
City of Talisay 419 468 345
City of Toledo 374 364 317
Tuburan 76 95 83
Tudela 9 6 6
CITY OF CEBU*** 1,702 1,679 1,360
CITY OF LAPU-LAPU*** 907 872 802
CITY OF MANDAUE*** 630 612 523
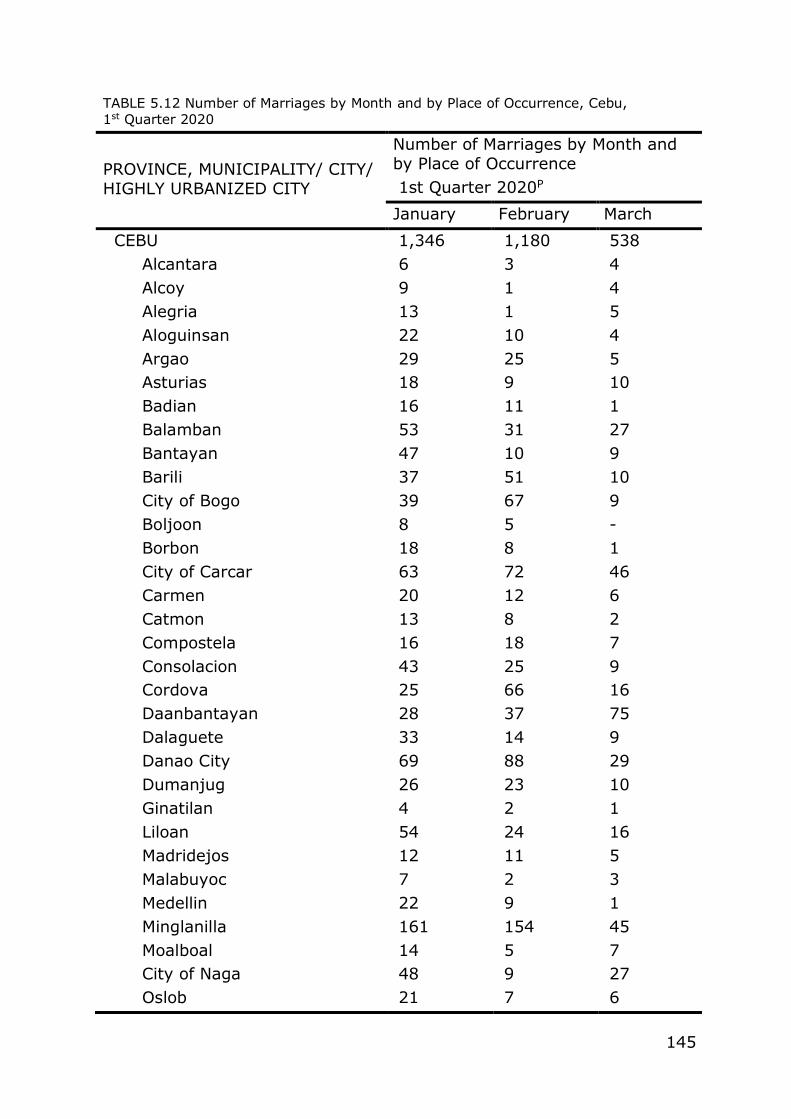
145
TABLE 5.12 Number of Marriages by Month and by Place of Occurrence, Cebu,
1st Quarter 2020
PROVINCE, MUNICIPALITY/ CITY/
HIGHLY URBANIZED CITY
Number of Marriages by Month and
by Place of Occurrence
1st Quarter 2020P
January February March
CEBU 1,346 1,180 538
Alcantara 6 3 4
Alcoy 9 1 4
Alegria 13 1 5
Aloguinsan 22 10 4
Argao 29 25 5
Asturias 18 9 10
Badian 16 11 1
Balamban 53 31 27
Bantayan 47 10 9
Barili 37 51 10
City of Bogo 39 67 9
Boljoon 8 5 -
Borbon 18 8 1
City of Carcar 63 72 46
Carmen 20 12 6
Catmon 13 8 2
Compostela 16 18 7
Consolacion 43 25 9
Cordova 25 66 16
Daanbantayan 28 37 75
Dalaguete 33 14 9
Danao City 69 88 29
Dumanjug 26 23 10
Ginatilan 4 2 1
Liloan 54 24 16
Madridejos 12 11 5
Malabuyoc 7 2 3
Medellin 22 9 1
Minglanilla 161 154 45
Moalboal 14 5 7
City of Naga 48 9 27
Oslob 21 7 6
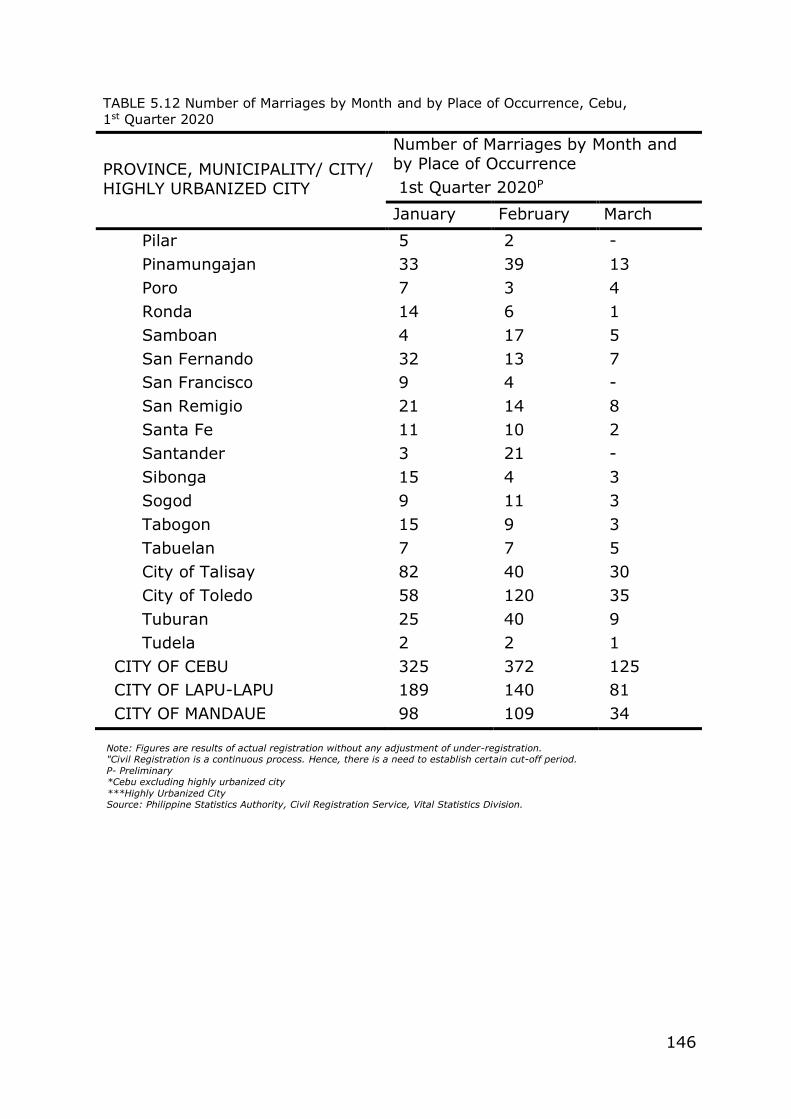
146
Note: Figures are results of actual registration without any adjustment of under-registration. "Civil Registration is a continuous process. Hence, there is a need to establish certain cut-off period.
P- Preliminary *Cebu excluding highly urbanized city
***Highly Urbanized City Source: Philippine Statistics Authority, Civil Registration Service, Vital Statistics Division.
TABLE 5.12 Number of Marriages by Month and by Place of Occurrence, Cebu,
1st Quarter 2020
PROVINCE, MUNICIPALITY/ CITY/
HIGHLY URBANIZED CITY
Number of Marriages by Month and
by Place of Occurrence
1st Quarter 2020P
January February March
Pilar 5 2 -
Pinamungajan 33 39 13
Poro 7 3 4
Ronda 14 6 1
Samboan 4 17 5
San Fernando 32 13 7
San Francisco 9 4 -
San Remigio 21 14 8
Santa Fe 11 10 2
Santander 3 21 -
Sibonga 15 4 3
Sogod 9 11 3
Tabogon 15 9 3
Tabuelan 7 7 5
City of Talisay 82 40 30
City of Toledo 58 120 35
Tuburan 25 40 9
Tudela 2 2 1
CITY OF CEBU 325 372 125
CITY OF LAPU-LAPU 189 140 81
CITY OF MANDAUE 98 109 34
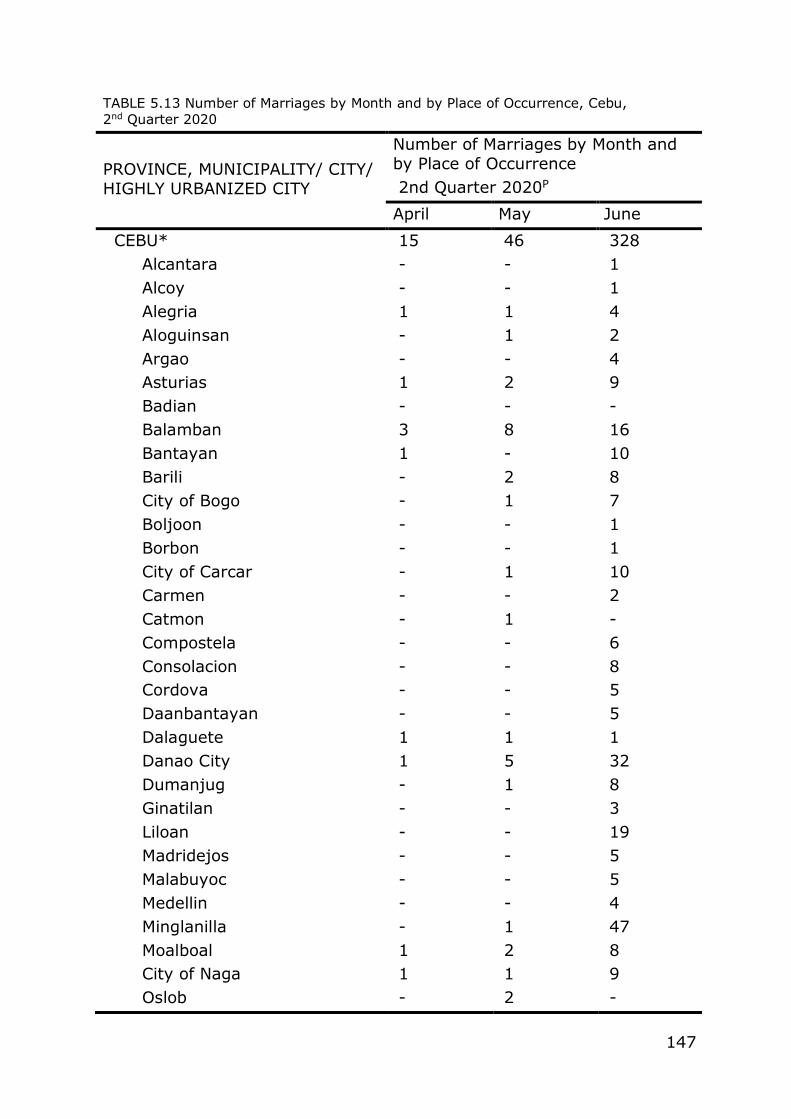
147
TABLE 5.13 Number of Marriages by Month and by Place of Occurrence, Cebu,
2nd Quarter 2020
PROVINCE, MUNICIPALITY/ CITY/
HIGHLY URBANIZED CITY
Number of Marriages by Month and
by Place of Occurrence
2nd Quarter 2020P
April May June
CEBU* 15 46 328
Alcantara - - 1
Alcoy - - 1
Alegria 1 1 4
Aloguinsan - 1 2
Argao - - 4
Asturias 1 2 9
Badian - - -
Balamban 3 8 16
Bantayan 1 - 10
Barili - 2 8
City of Bogo - 1 7
Boljoon - - 1
Borbon - - 1
City of Carcar - 1 10
Carmen - - 2
Catmon - 1 -
Compostela - - 6
Consolacion - - 8
Cordova - - 5
Daanbantayan - - 5
Dalaguete 1 1 1
Danao City 1 5 32
Dumanjug - 1 8
Ginatilan - - 3
Liloan - - 19
Madridejos - - 5
Malabuyoc - - 5
Medellin - - 4
Minglanilla - 1 47
Moalboal 1 2 8
City of Naga 1 1 9
Oslob - 2 -
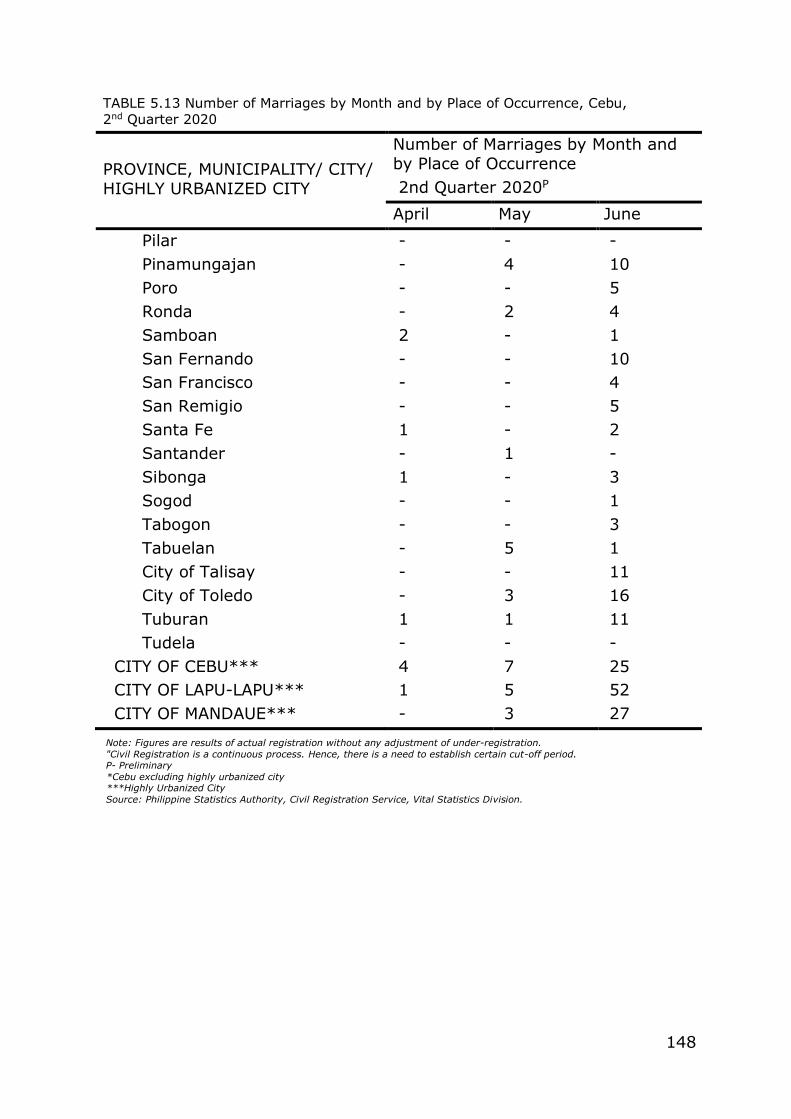
148
Note: Figures are results of actual registration without any adjustment of under-registration.
"Civil Registration is a continuous process. Hence, there is a need to establish certain cut-off period. P- Preliminary
*Cebu excluding highly urbanized city ***Highly Urbanized City
Source: Philippine Statistics Authority, Civil Registration Service, Vital Statistics Division.
TABLE 5.13 Number of Marriages by Month and by Place of Occurrence, Cebu,
2nd Quarter 2020
PROVINCE, MUNICIPALITY/ CITY/
HIGHLY URBANIZED CITY
Number of Marriages by Month and
by Place of Occurrence
2nd Quarter 2020P
April May June
Pilar - - -
Pinamungajan - 4 10
Poro - - 5
Ronda - 2 4
Samboan 2 - 1
San Fernando - - 10
San Francisco - - 4
San Remigio - - 5
Santa Fe 1 - 2
Santander - 1 -
Sibonga 1 - 3
Sogod - - 1
Tabogon - - 3
Tabuelan - 5 1
City of Talisay - - 11
City of Toledo - 3 16
Tuburan 1 1 11
Tudela - - -
CITY OF CEBU*** 4 7 25
CITY OF LAPU-LAPU*** 1 5 52
CITY OF MANDAUE*** - 3 27
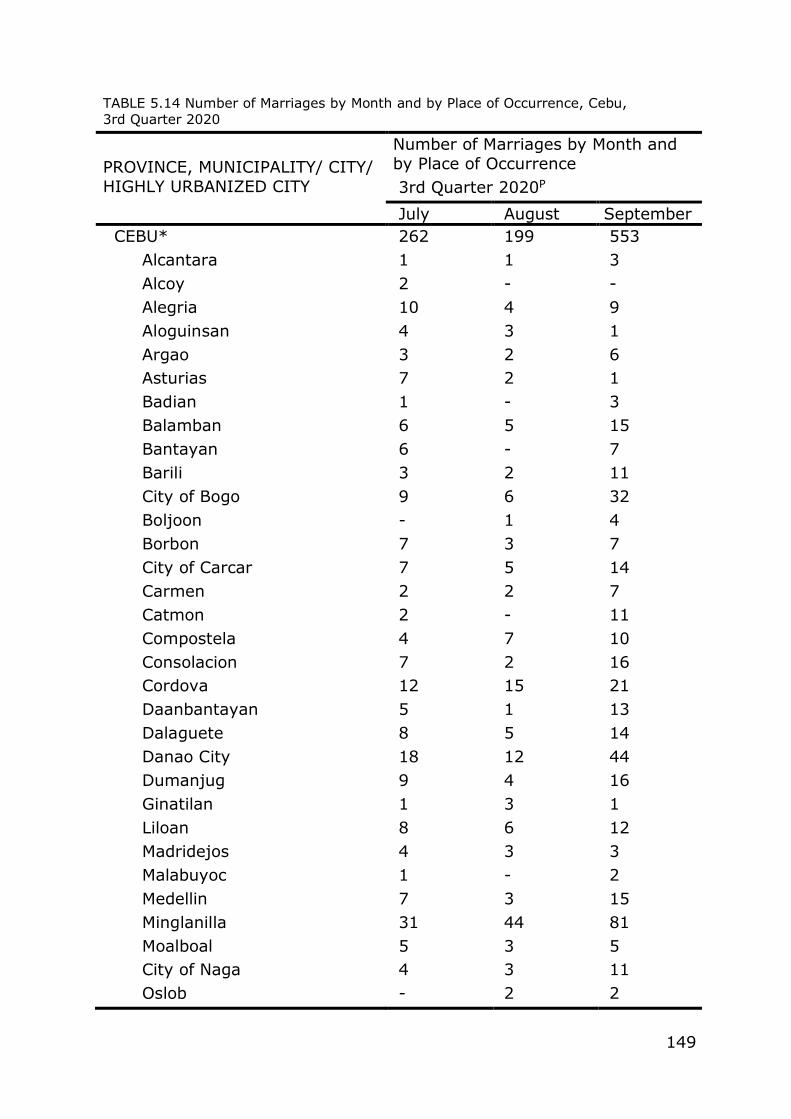
149
TABLE 5.14 Number of Marriages by Month and by Place of Occurrence, Cebu,
3rd Quarter 2020
PROVINCE, MUNICIPALITY/ CITY/
HIGHLY URBANIZED CITY
Number of Marriages by Month and
by Place of Occurrence
3rd Quarter 2020P
July August September
CEBU* 262 199 553
Alcantara 1 1 3
Alcoy 2 - -
Alegria 10 4 9
Aloguinsan 4 3 1
Argao 3 2 6
Asturias 7 2 1
Badian 1 - 3
Balamban 6 5 15
Bantayan 6 - 7
Barili 3 2 11
City of Bogo 9 6 32
Boljoon - 1 4
Borbon 7 3 7
City of Carcar 7 5 14
Carmen 2 2 7
Catmon 2 - 11
Compostela 4 7 10
Consolacion 7 2 16
Cordova 12 15 21
Daanbantayan 5 1 13
Dalaguete 8 5 14
Danao City 18 12 44
Dumanjug 9 4 16
Ginatilan 1 3 1
Liloan 8 6 12
Madridejos 4 3 3
Malabuyoc 1 - 2
Medellin 7 3 15
Minglanilla 31 44 81
Moalboal 5 3 5
City of Naga 4 3 11
Oslob - 2 2
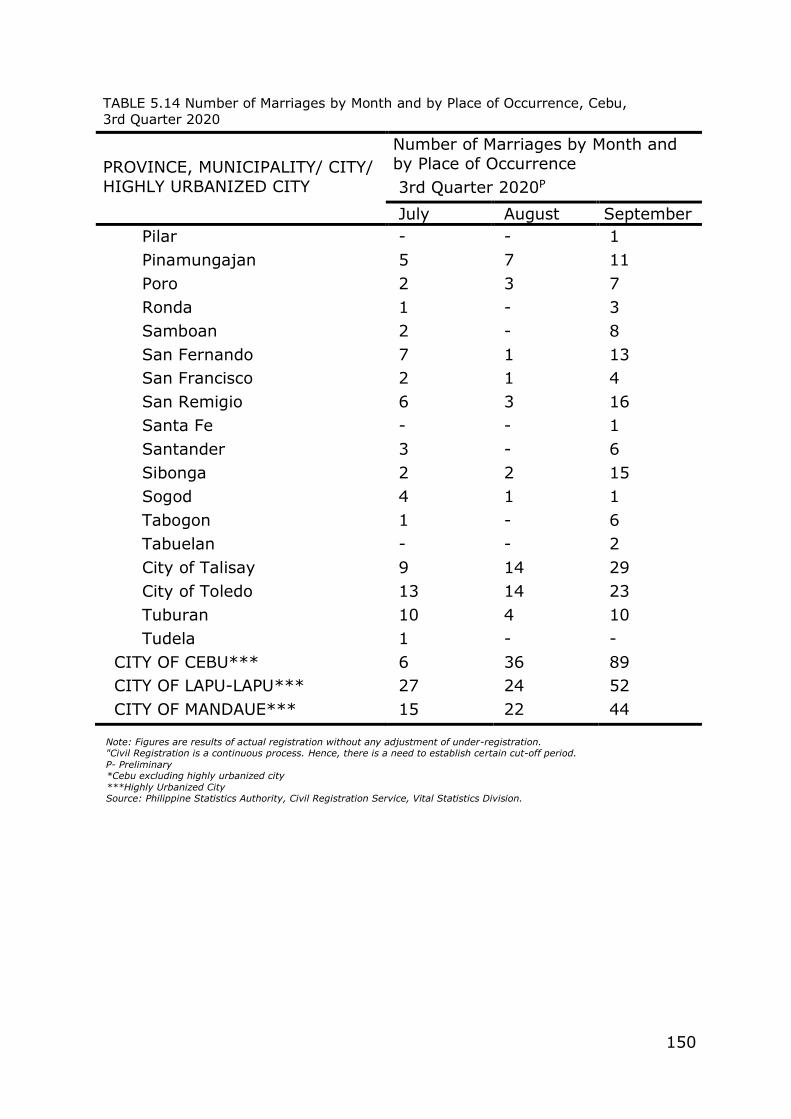
150
Note: Figures are results of actual registration without any adjustment of under-registration. "Civil Registration is a continuous process. Hence, there is a need to establish certain cut-off period.
P- Preliminary *Cebu excluding highly urbanized city
***Highly Urbanized City Source: Philippine Statistics Authority, Civil Registration Service, Vital Statistics Division.
TABLE 5.14 Number of Marriages by Month and by Place of Occurrence, Cebu,
3rd Quarter 2020
PROVINCE, MUNICIPALITY/ CITY/
HIGHLY URBANIZED CITY
Number of Marriages by Month and
by Place of Occurrence
3rd Quarter 2020P
July August September
Pilar - - 1
Pinamungajan 5 7 11
Poro 2 3 7
Ronda 1 - 3
Samboan 2 - 8
San Fernando 7 1 13
San Francisco 2 1 4
San Remigio 6 3 16
Santa Fe - - 1
Santander 3 - 6
Sibonga 2 2 15
Sogod 4 1 1
Tabogon 1 - 6
Tabuelan - - 2
City of Talisay 9 14 29
City of Toledo 13 14 23
Tuburan 10 4 10
Tudela 1 - -
CITY OF CEBU*** 6 36 89
CITY OF LAPU-LAPU*** 27 24 52
CITY OF MANDAUE*** 15 22 44
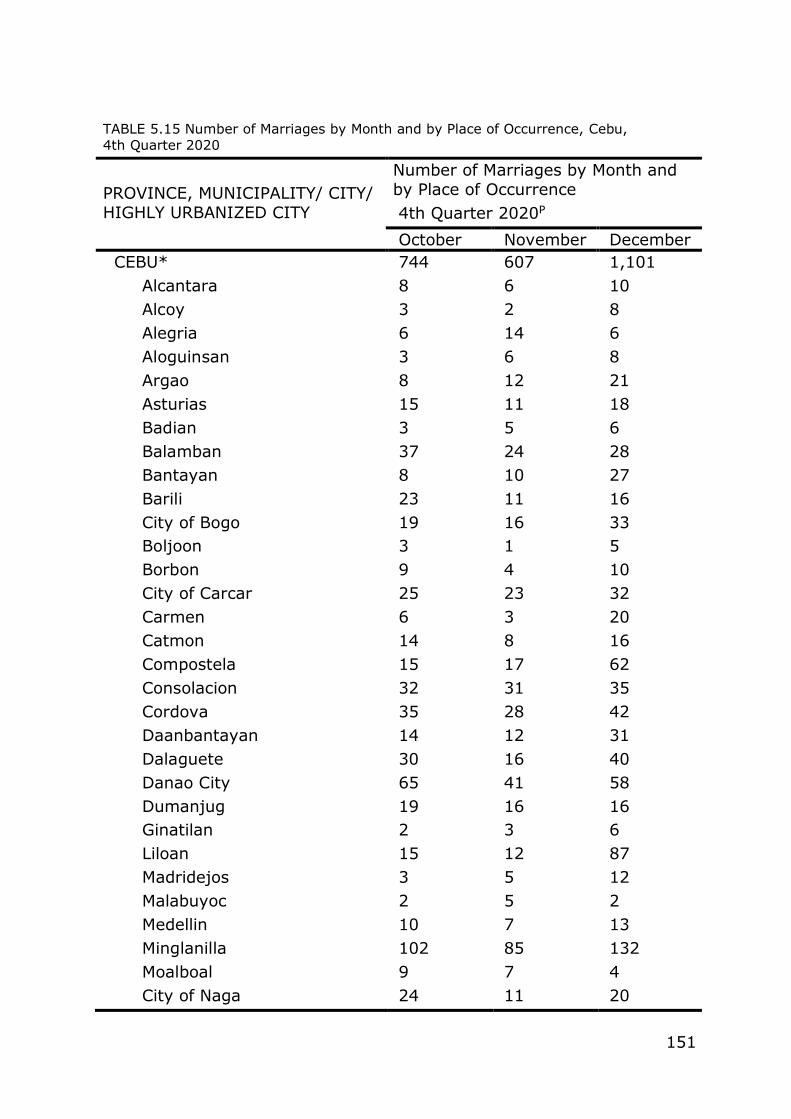
151
TABLE 5.15 Number of Marriages by Month and by Place of Occurrence, Cebu,
4th Quarter 2020
PROVINCE, MUNICIPALITY/ CITY/
HIGHLY URBANIZED CITY
Number of Marriages by Month and
by Place of Occurrence
4th Quarter 2020P
October November December
CEBU* 744 607 1,101
Alcantara 8 6 10
Alcoy 3 2 8
Alegria 6 14 6
Aloguinsan 3 6 8
Argao 8 12 21
Asturias 15 11 18
Badian 3 5 6
Balamban 37 24 28
Bantayan 8 10 27
Barili 23 11 16
City of Bogo 19 16 33
Boljoon 3 1 5
Borbon 9 4 10
City of Carcar 25 23 32
Carmen 6 3 20
Catmon 14 8 16
Compostela 15 17 62
Consolacion 32 31 35
Cordova 35 28 42
Daanbantayan 14 12 31
Dalaguete 30 16 40
Danao City 65 41 58
Dumanjug 19 16 16
Ginatilan 2 3 6
Liloan 15 12 87
Madridejos 3 5 12
Malabuyoc 2 5 2
Medellin 10 7 13
Minglanilla 102 85 132
Moalboal 9 7 4
City of Naga 24 11 20
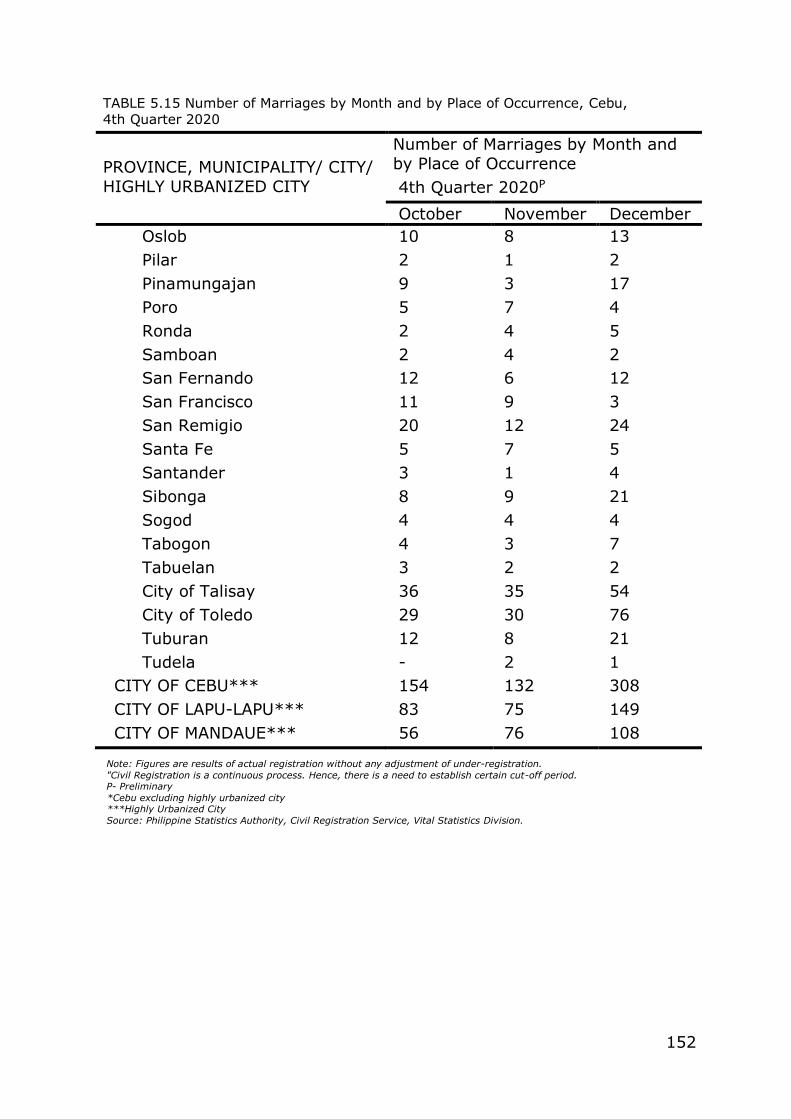
152
Note: Figures are results of actual registration without any adjustment of under-registration.
"Civil Registration is a continuous process. Hence, there is a need to establish certain cut-off period. P- Preliminary
*Cebu excluding highly urbanized city ***Highly Urbanized City
Source: Philippine Statistics Authority, Civil Registration Service, Vital Statistics Division.
TABLE 5.15 Number of Marriages by Month and by Place of Occurrence, Cebu,
4th Quarter 2020
PROVINCE, MUNICIPALITY/ CITY/
HIGHLY URBANIZED CITY
Number of Marriages by Month and
by Place of Occurrence
4th Quarter 2020P
October November December
Oslob 10 8 13
Pilar 2 1 2
Pinamungajan 9 3 17
Poro 5 7 4
Ronda 2 4 5
Samboan 2 4 2
San Fernando 12 6 12
San Francisco 11 9 3
San Remigio 20 12 24
Santa Fe 5 7 5
Santander 3 1 4
Sibonga 8 9 21
Sogod 4 4 4
Tabogon 4 3 7
Tabuelan 3 2 2
City of Talisay 36 35 54
City of Toledo 29 30 76
Tuburan 12 8 21
Tudela - 2 1
CITY OF CEBU*** 154 132 308
CITY OF LAPU-LAPU*** 83 75 149
CITY OF MANDAUE*** 56 76 108
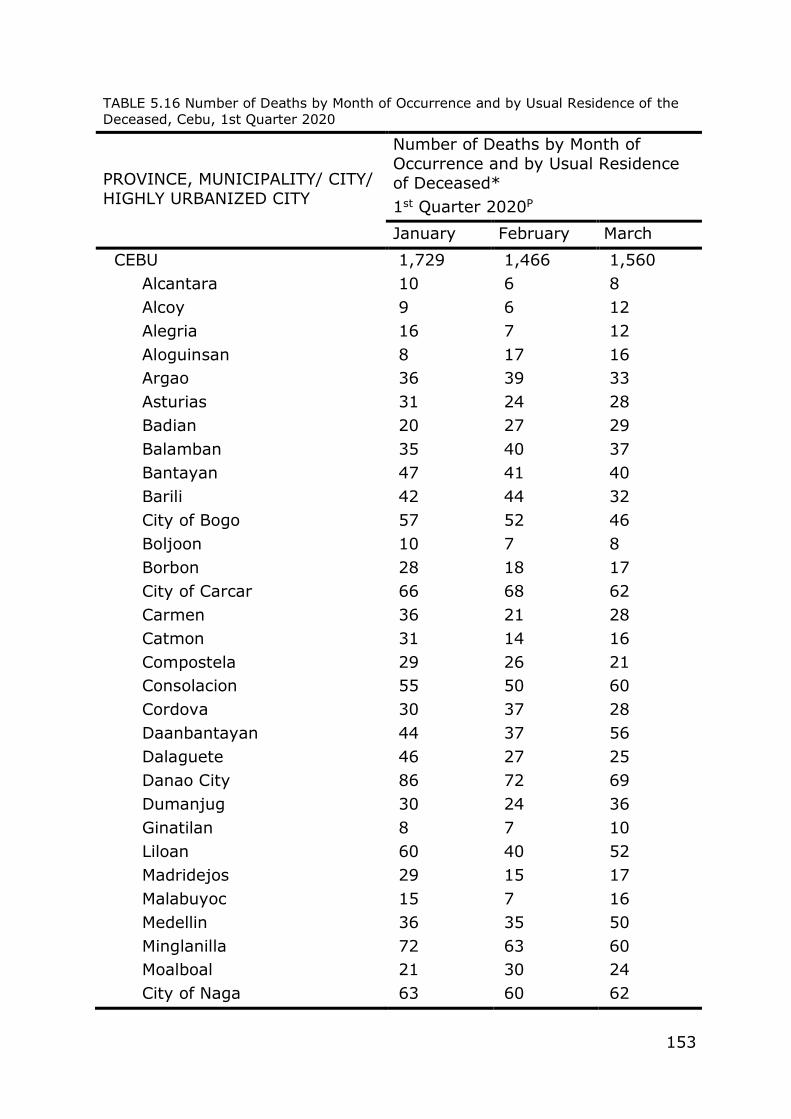
153
TABLE 5.16 Number of Deaths by Month of Occurrence and by Usual Residence of the
Deceased, Cebu, 1st Quarter 2020
PROVINCE, MUNICIPALITY/ CITY/
HIGHLY URBANIZED CITY
Number of Deaths by Month of
Occurrence and by Usual Residence
of Deceased*
1st Quarter 2020P
January February March
CEBU 1,729 1,466 1,560
Alcantara 10 6 8
Alcoy 9 6 12
Alegria 16 7 12
Aloguinsan 8 17 16
Argao 36 39 33
Asturias 31 24 28
Badian 20 27 29
Balamban 35 40 37
Bantayan 47 41 40
Barili 42 44 32
City of Bogo 57 52 46
Boljoon 10 7 8
Borbon 28 18 17
City of Carcar 66 68 62
Carmen 36 21 28
Catmon 31 14 16
Compostela 29 26 21
Consolacion 55 50 60
Cordova 30 37 28
Daanbantayan 44 37 56
Dalaguete 46 27 25
Danao City 86 72 69
Dumanjug 30 24 36
Ginatilan 8 7 10
Liloan 60 40 52
Madridejos 29 15 17
Malabuyoc 15 7 16
Medellin 36 35 50
Minglanilla 72 63 60
Moalboal 21 30 24
City of Naga 63 60 62

154
Note: Figures are results of actual registration without any adjustment of under-registration.
"Civil Registration is a continuous process. Hence, there is a need to establish certain cut-off period. P- Preliminary
*Cebu excluding highly urbanized city ***Highly Urbanized City
Source: Philippine Statistics Authority, Civil Registration Service, Vital Statistics Division.
TABLE 5.16 Number of Deaths by Month of Occurrence and by Usual Residence of the
Deceased, Cebu, 1st Quarter 2020
PROVINCE, MUNICIPALITY/ CITY/
HIGHLY URBANIZED CITY
Number of Deaths by Month of
Occurrence and by Usual Residence
of Deceased*
1st Quarter 2020P
January February March
Oslob 16 12 17
Pilar 8 4 4
Pinamungajan 38 36 40
Poro 14 12 8
Ronda 18 11 14
Samboan 16 13 8
San Fernando 32 23 33
San Francisco 24 26 33
San Remigio 39 16 30
Santa Fe 16 10 14
Santander 14 12 13
Sibonga 36 28 26
Sogod 32 18 21
Tabogon 31 20 21
Tabuelan 24 11 18
City of Talisay 130 115 126
City of Toledo 93 93 85
Tuburan 32 38 37
Tudela 10 7 2
CITY OF CEBU*** 558 536 569
CITY OF LAPU-LAPU*** 179 168 199
CITY OF MANDAUE*** 164 143 136
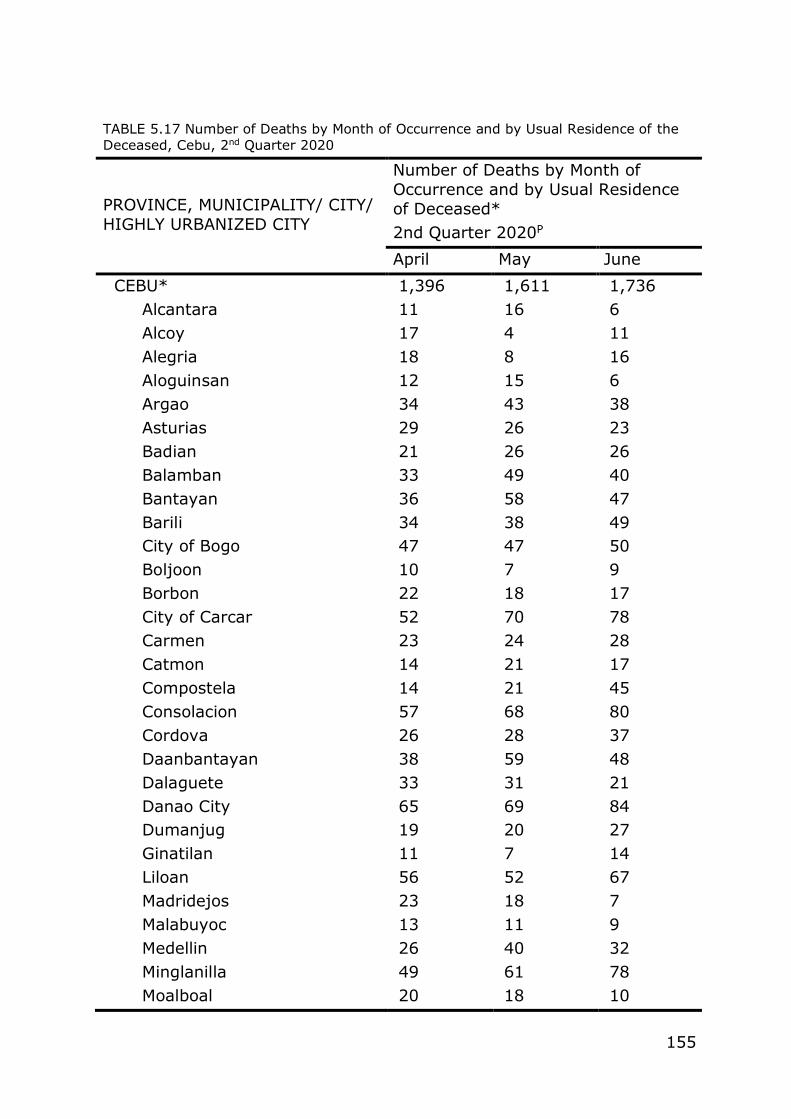
155
TABLE 5.17 Number of Deaths by Month of Occurrence and by Usual Residence of the
Deceased, Cebu, 2nd Quarter 2020
PROVINCE, MUNICIPALITY/ CITY/
HIGHLY URBANIZED CITY
Number of Deaths by Month of
Occurrence and by Usual Residence
of Deceased*
2nd Quarter 2020P
April May June
CEBU* 1,396 1,611 1,736
Alcantara 11 16 6
Alcoy 17 4 11
Alegria 18 8 16
Aloguinsan 12 15 6
Argao 34 43 38
Asturias 29 26 23
Badian 21 26 26
Balamban 33 49 40
Bantayan 36 58 47
Barili 34 38 49
City of Bogo 47 47 50
Boljoon 10 7 9
Borbon 22 18 17
City of Carcar 52 70 78
Carmen 23 24 28
Catmon 14 21 17
Compostela 14 21 45
Consolacion 57 68 80
Cordova 26 28 37
Daanbantayan 38 59 48
Dalaguete 33 31 21
Danao City 65 69 84
Dumanjug 19 20 27
Ginatilan 11 7 14
Liloan 56 52 67
Madridejos 23 18 7
Malabuyoc 13 11 9
Medellin 26 40 32
Minglanilla 49 61 78
Moalboal 20 18 10
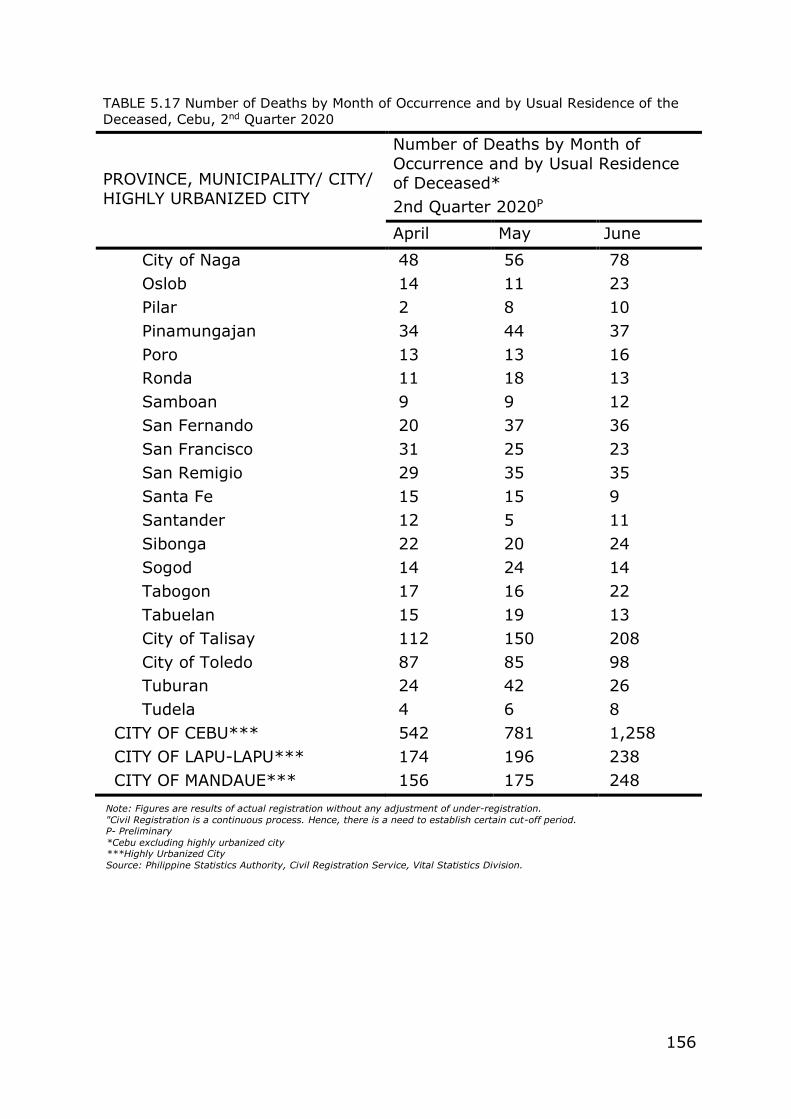
156
Note: Figures are results of actual registration without any adjustment of under-registration.
"Civil Registration is a continuous process. Hence, there is a need to establish certain cut-off period. P- Preliminary
*Cebu excluding highly urbanized city ***Highly Urbanized City
Source: Philippine Statistics Authority, Civil Registration Service, Vital Statistics Division.
TABLE 5.17 Number of Deaths by Month of Occurrence and by Usual Residence of the
Deceased, Cebu, 2nd Quarter 2020
PROVINCE, MUNICIPALITY/ CITY/
HIGHLY URBANIZED CITY
Number of Deaths by Month of
Occurrence and by Usual Residence
of Deceased*
2nd Quarter 2020P
April May June
City of Naga 48 56 78
Oslob 14 11 23
Pilar 2 8 10
Pinamungajan 34 44 37
Poro 13 13 16
Ronda 11 18 13
Samboan 9 9 12
San Fernando 20 37 36
San Francisco 31 25 23
San Remigio 29 35 35
Santa Fe 15 15 9
Santander 12 5 11
Sibonga 22 20 24
Sogod 14 24 14
Tabogon 17 16 22
Tabuelan 15 19 13
City of Talisay 112 150 208
City of Toledo 87 85 98
Tuburan 24 42 26
Tudela 4 6 8
CITY OF CEBU*** 542 781 1,258
CITY OF LAPU-LAPU*** 174 196 238
CITY OF MANDAUE*** 156 175 248

157
TABLE 5.18 Number of Deaths by Month of Occurrence and by Usual Residence of the
Deceased, Cebu, 3rd Quarter 2020
PROVINCE, MUNICIPALITY/ CITY/
HIGHLY URBANIZED CITY
Number of Deaths by Month of
Occurrence and by Usual Residence
of Deceased*
3rd Quarter 2020P
July August September
CEBU* 2,008 1,778 1,644
Alcantara 20 5 10
Alcoy 13 11 11
Alegria 13 12 16
Aloguinsan 26 13 16
Argao 43 47 35
Asturias 29 31 31
Badian 18 23 14
Balamban 49 50 47
Bantayan 42 44 32
Barili 67 36 33
City of Bogo 57 58 43
Boljoon 7 10 14
Borbon 21 20 22
City of Carcar 80 77 73
Carmen 40 38 39
Catmon 22 23 18
Compostela 31 28 27
Consolacion 102 73 55
Cordova 45 27 36
Daanbantayan 60 60 55
Dalaguete 35 53 24
Danao City 107 98 86
Dumanjug 30 27 29
Ginatilan 10 14 9
Liloan 92 71 72
Madridejos 23 17 19
Malabuyoc 15 13 12
Medellin 44 32 44
Minglanilla 101 70 53
Moalboal 9 20 19
City of Naga 73 64 61

158
Note: Figures are results of actual registration without any adjustment of under-registration. "Civil Registration is a continuous process. Hence, there is a need to establish certain cut-off period.
P- Preliminary *Cebu excluding highly urbanized city
***Highly Urbanized City Source: Philippine Statistics Authority, Civil Registration Service, Vital Statistics Division.
TABLE 5.18 Number of Deaths by Month of Occurrence and by Usual Residence of the
Deceased, Cebu, 3rd Quarter 2020
PROVINCE, MUNICIPALITY/ CITY/
HIGHLY URBANIZED CITY
Number of Deaths by Month of
Occurrence and by Usual Residence
of Deceased*
3rd Quarter 2020P
July August September
Oslob 19 16 17
Pilar 9 4 10
Pinamungajan 33 36 32
Poro 14 16 10
Ronda 9 16 12
Samboan 12 11 17
San Fernando 55 31 43
San Francisco 34 24 25
San Remigio 34 37 31
Santa Fe 9 16 21
Santander 8 10 13
Sibonga 34 40 30
Sogod 24 25 20
Tabogon 32 18 23
Tabuelan 13 13 21
City of Talisay 212 126 125
City of Toledo 97 130 96
Tuburan 30 36 36
Tudela 6 8 7
CITY OF CEBU*** 804 588 561
CITY OF LAPU-LAPU*** 355 215 197
CITY OF MANDAUE*** 307 201 172
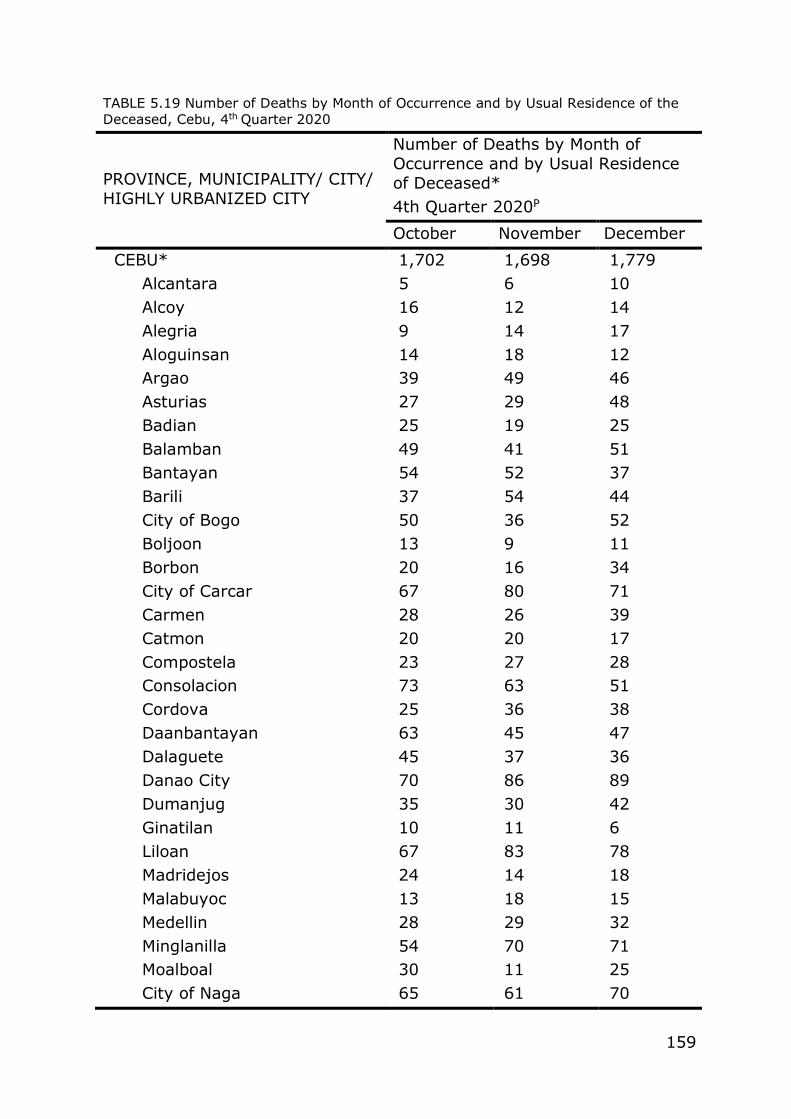
159
TABLE 5.19 Number of Deaths by Month of Occurrence and by Usual Residence of the
Deceased, Cebu, 4th Quarter 2020
PROVINCE, MUNICIPALITY/ CITY/
HIGHLY URBANIZED CITY
Number of Deaths by Month of
Occurrence and by Usual Residence
of Deceased*
4th Quarter 2020P
October November December
CEBU* 1,702 1,698 1,779
Alcantara 5 6 10
Alcoy 16 12 14
Alegria 9 14 17
Aloguinsan 14 18 12
Argao 39 49 46
Asturias 27 29 48
Badian 25 19 25
Balamban 49 41 51
Bantayan 54 52 37
Barili 37 54 44
City of Bogo 50 36 52
Boljoon 13 9 11
Borbon 20 16 34
City of Carcar 67 80 71
Carmen 28 26 39
Catmon 20 20 17
Compostela 23 27 28
Consolacion 73 63 51
Cordova 25 36 38
Daanbantayan 63 45 47
Dalaguete 45 37 36
Danao City 70 86 89
Dumanjug 35 30 42
Ginatilan 10 11 6
Liloan 67 83 78
Madridejos 24 14 18
Malabuyoc 13 18 15
Medellin 28 29 32
Minglanilla 54 70 71
Moalboal 30 11 25
City of Naga 65 61 70
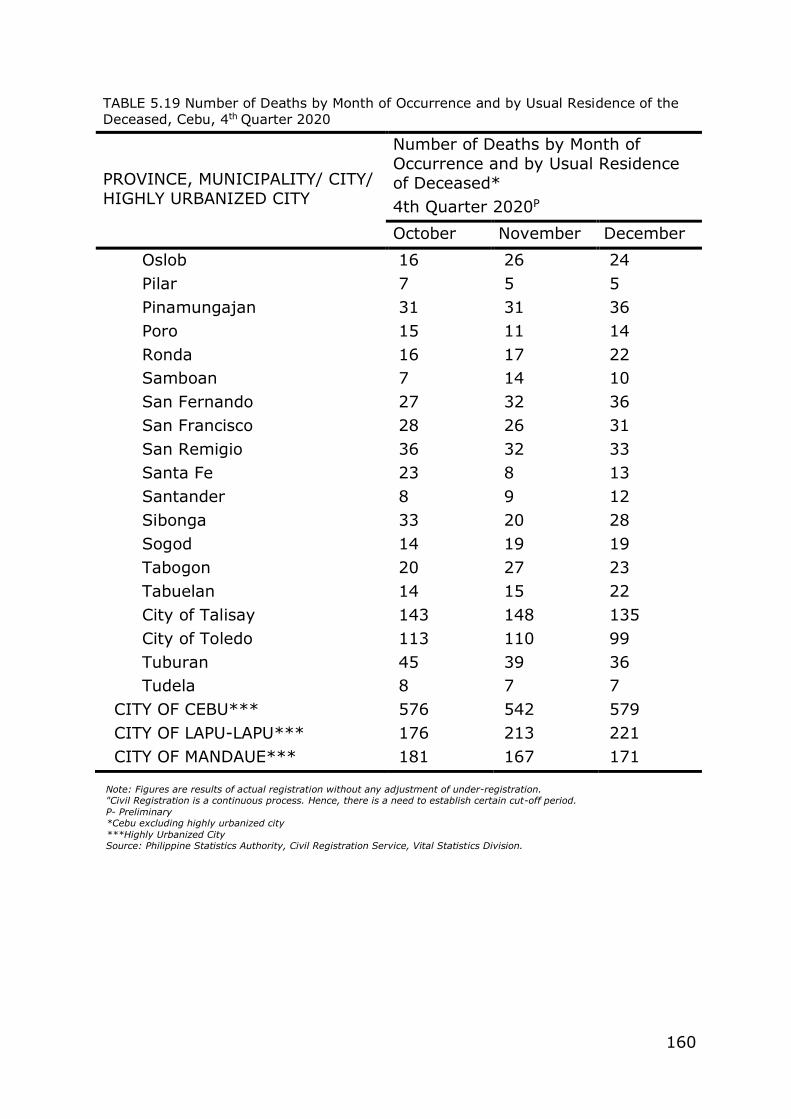
160
Note: Figures are results of actual registration without any adjustment of under-registration. "Civil Registration is a continuous process. Hence, there is a need to establish certain cut-off period.
P- Preliminary *Cebu excluding highly urbanized city
***Highly Urbanized City Source: Philippine Statistics Authority, Civil Registration Service, Vital Statistics Division.
TABLE 5.19 Number of Deaths by Month of Occurrence and by Usual Residence of the
Deceased, Cebu, 4th Quarter 2020
PROVINCE, MUNICIPALITY/ CITY/
HIGHLY URBANIZED CITY
Number of Deaths by Month of
Occurrence and by Usual Residence
of Deceased*
4th Quarter 2020P
October November December
Oslob 16 26 24
Pilar 7 5 5
Pinamungajan 31 31 36
Poro 15 11 14
Ronda 16 17 22
Samboan 7 14 10
San Fernando 27 32 36
San Francisco 28 26 31
San Remigio 36 32 33
Santa Fe 23 8 13
Santander 8 9 12
Sibonga 33 20 28
Sogod 14 19 19
Tabogon 20 27 23
Tabuelan 14 15 22
City of Talisay 143 148 135
City of Toledo 113 110 99
Tuburan 45 39 36
Tudela 8 7 7
CITY OF CEBU*** 576 542 579
CITY OF LAPU-LAPU*** 176 213 221
CITY OF MANDAUE*** 181 167 171
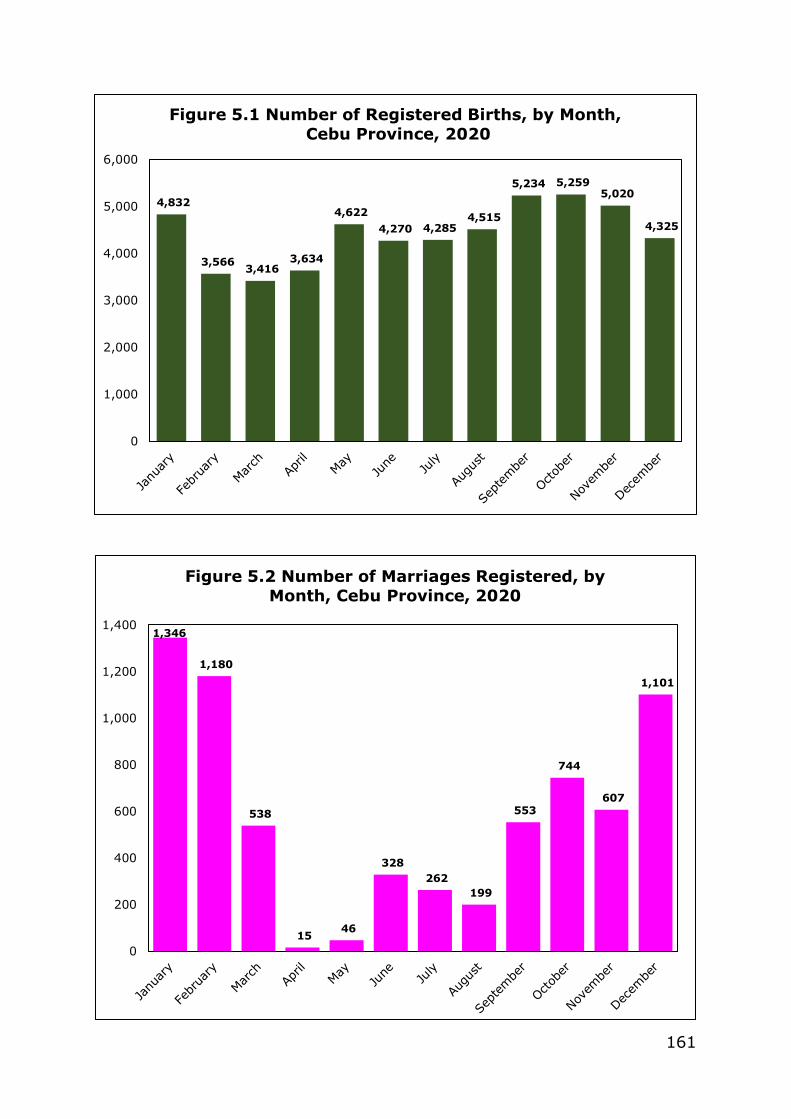
161
1,346
1,180
538
15 46
328
262
199
553
744
607
1,101
0
200
400
600
800
1,000
1,200
1,400
Figure 5.2 Number of Marriages Registered, by
Month, Cebu Province, 2020
4,832
3,566 3,416
3,634
4,622
4,270 4,285 4,515
5,234 5,259 5,020
4,325
0
1,000
2,000
3,000
4,000
5,000
6,000
Figure 5.1 Number of Registered Births, by Month,
Cebu Province, 2020
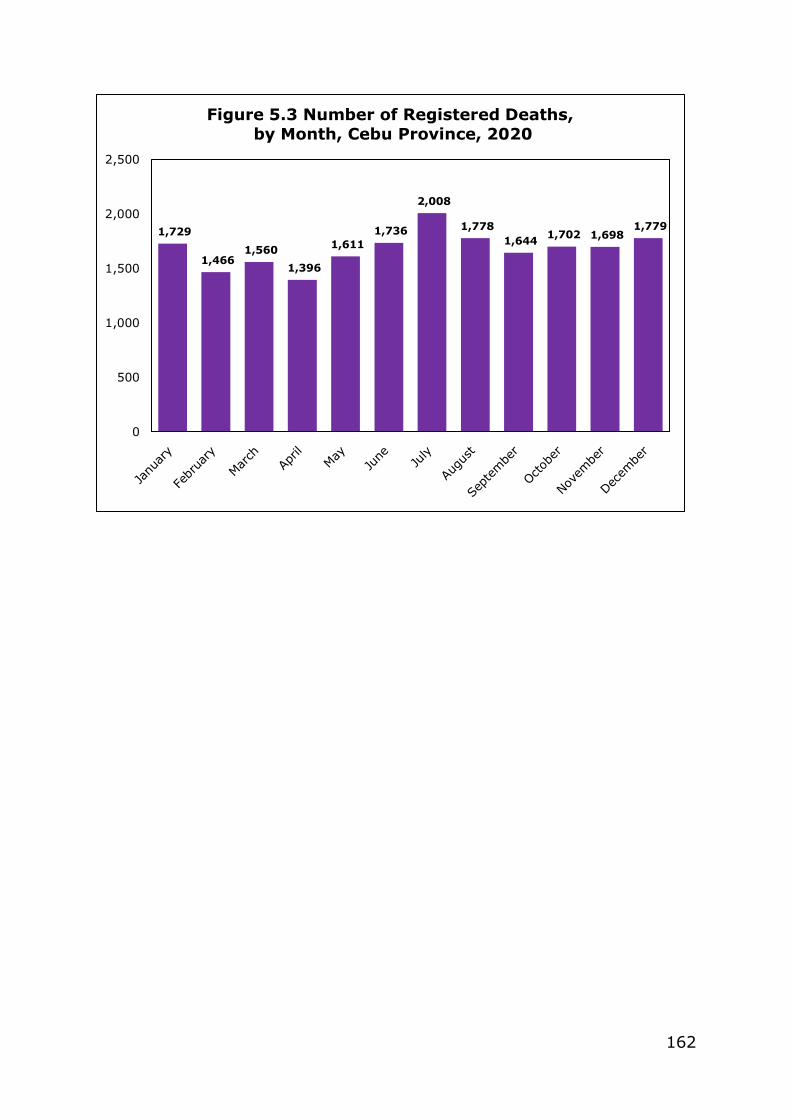
162
1,729
1,466 1,560
1,396
1,611
1,736
2,008
1,778
1,644 1,702 1,698
1,779
0
500
1,000
1,500
2,000
2,500
Figure 5.3 Number of Registered Deaths,
by Month, Cebu Province, 2020
163
REPUBLIC OF THE PHILIPPINES
PHILIPPINE STATISTICS AUTHORITY
Cebu Provincial Statistical Office
COUNTRYSIDE IN FIGURES: CEBU PUBLISHED OCTOBER 2021
ALL RIGHTS RESERVED
2021


![Predgovor [Foreword].](https://static.fdokumen.com/doc/165x107/63333df9ce61be0ae50e8cf4/predgovor-foreword-1681982858.jpg)