1995 - Philippine Statistics Authority - Eastern Visayas
67
• -- Report NO.4: Population, Land Area and Density: 1980, 1990 and 1995 1995 Republic of the Philippines NATIONAL STATISTICS OFFICE Manila
-
Upload
khangminh22 -
Category
Documents
-
view
0 -
download
0
Transcript of 1995 - Philippine Statistics Authority - Eastern Visayas
• --Report NO.4: Population, Land Area and Density:
1980, 1990 and 1995
1995Republic of the Philippines
NATIONAL STATISTICS OFFICEManila
1995 CENSUS OF POPULATION
> •
NSO File 'Copy
~'. ,"
iI
REPORT NO.4: Population, Land Area and Density:1980, 1990 and 1995
Republic of the PhilippinesNATIONAL STATISTICS OFFICE
ManilaDecember 2000
\
, I
, (
REPUBLIC OF THE PHILIPPINES
HIS EXCELLENCY
PRESIDENT JOSEPH EJERCITO ESTRADA
NATIONAL STATISTICAL COORDINATION BOARD
Honorable Felipe M. MedallaChairman
NATIONAL STATISTICS OFFICE
Tomas P. AfricaAdministrator
Carmelita N. ErichlDeputy Administrator
Paula Monina G. ColladoDirector III
Household Statistics Department
r
.,.
FOREWORD
One of the significant issues related to population growth concerns therelationship between increasing population size and available land resources.This relationship may be expressed in terms of population density.
POPCEN Report NO.4: Population, Land Area and Density is one ofthe series of reports based on the 1995 Census of Population (POPCEN)undertaken by the National Statistics Office (NSO). The publication providesinformation on population size, distribution, population density and thechange in population density over the last three census years 1980, 1990 and1995. These data will be useful for planners and policy makers in makingsound decisions to effect more efficient and judicious allocation ofgovernment resources and services.
We would like to acknowledge the support of the Land ManagementBureau, of the Department of Environment and Natural Resources (DENR),which provided the data on land area.
F-i:EJ10M P. FRiCAAd inis ator
ManilaDecember 2000
,
..
CONTENTS
EXPLANATORY TEXT
IntroductionAuthority for Conducting the 1995 Census of PopulationCensus OrganizationMethod of EnumerationPlace Where EnumeratedContent and Coverage of this PublicationConcepts and Definition of Terms
MAP: Population Density of the Philippines
HIGHLIGHTS
LIST OF TABLES
Population, Land Area and Population Density of the Philippinesby Region and Province: 1980, 1990 and 1995
Page
Vll
Vll
viiviii
IX
IX
IX
xiii
xv
•
I.
2
3
APPENDICES
A
B
C
D
Population, Land Area and Population Density of the Philippines byRegion, Province and CityfMunicipality: 1980, 1990 and 1995
Population, Land Area and Population Density of the Philippines byCity: 1980, 1990 and 1995
Batas Pambansa BIg. 72 (An Act Providing for the Taking of anIntegrated Census Every Ten Years Beginning in the Year NineteenHundred and Eighty and for Other Purposes)
Population and Population Density by Province and HighlyUrbanized Cities, Philippines: September I, 1995
List of 1995 Census of Population (POPCEN) Published Tables
List of 1995 Census of Population (POPCEN) Unpublished Tables
4
38
42
45
48
50
Introduction
EXPLANATORY TEXT
population, agriculture, industry andcommerce.
•
[n September 1995, the NationalStatistics Office conducted the 1995 Censusof Population (POPCEN). This nationwideundertaking is the 10th population censusconducted in the country.
Like the 1990 census, the 1995POPCEN is designed to take an inventory ofthe total population in the Philippines and tocollect information about theircharacteristics. The data will provide anupdated basis for the apportionment of theInternal Revenue Allocation (IRA) to localgovernment units and for the creation ofnew legislative areas such as regions,provinces, municipalities and barangays orthe conversion of a municipality into a city.The census of population is the source ofinformation on the size and distribution ofthe population as well as information aboutthe demographic, social, economic andcultural characteristics. These informationare vital for making rational plans andprograms for development.
Pursuant to the provision of BatasPambansa BIg. 72, a final report on thepopulation count, and number of householdsat the barangay level was submitted to thePresident and declared official, for allpurposes, under Proclamation No. 849 datedAugust 14, 1996.
Authority for Conducting the 1995Census of Population
Under Commonwealth Act No. 591,the Bureau of the Census and Statistics (nowNational Statistics Office) is authorized toprepare for and undertake all censuses of
Batas Pambansa BIg. 72, which waspassed on June 11, 1980, further accordedthe National Statistics Office (NSO) theauthority to conduct population censusesevery ten years beginning in 1980 withoutprejudice to the undertaking of specialcensuses on agriculture, industry,commerce, housing and other sectors as maybe approved by the National Economic andDevelopment Authority (NEDA).
More recently, Executive Order No.121, otherwise known as the ReorganizationAct of the Philippine Statistical System,which was passed on January 30, 1987,declared that the NSO shall be the majorstatistical agency responsible for generatinggeneral purpose statistics and undertakingsuch censuses and surveys as may bedesignated by the National StatisticalCoordination Board (NSCB).
On May 30, 1993, the NSCBapproved the conduct of a mid-decadepopulation census through NSCB Resolution6-93. The 1995 POPCEN was under theoverall supervision of the National CensusCoordinating Board (NCCB), which ischaired by the Director General of theNEDA. The NCCB membership consists ofrepresentatives (undersecretary level) of thevarious executive departments, including theAdministrator of the NSO. With respect tothe POPCEN, the NSO Administrator servesas the Executive Officer ofthe NCCB .
Census Organization
The 1995 POPCEN was supervisedand coordinated by the Household Statistics
viii
Department (HSD) under the direction andinstructions of the Administrator. Theplanning and preparatory activities for allaspects of the census was undertaken by theHSD in close coordination with the supportdivisions. Information Resources Division(IRD), Human Resources & ManagementDivision (HRMD), Financial ServicesDivision (FSD), and the AdministrativeServices Division (ASD). A Technical andAdministrative Group (TAG), headed by theChief of the HSD, oversaw the ten workinggroups created for this purpose.
The TAG was under the directionand supervision of a Steering Committeechaired by the Administrator and co-chairedby the Deputy Administrator. It wascomprised of the HSD Chief and divisionchiefs; Chiefs of the IRD, HRMD, FSD andASD; Regional Administrator (RA) of NCRas field representative; and Chief of theLegal Section.
The HSD Chief is assisted by theCensus Project Staff (CPS) in thecoordination of working groups of the TAGand in the communication flow betweenCentral Office (CO) units and the fieldoffices. The CPS also served as Secretariatto the Steering Committee and as POPCENmonitoring, communications and actioncenter. The Head of the CPS is an ex-officio member of the TAG.
During the POPCEN, the RA actedas the regional census coordinator for hisregion, while the PSO acted as theprovincial census executive officer for hisprovince. Each NSO District Office withina province served as operations center underthe direct supervision of the DistrictStatistics Officer (DSO).
1995 Census of Population
For the POPCEN, the DSO wasdesignated as the District Area Supervisor(DAS). In special cases, the Central Officeallowed a province to create sub-districtoffices for purposes of census supervision.The PSO assigned a regular field staff i.e.,the Statistical Coordination Officers(SCOs)! Assistant Statistical CoordinationOfficers (ASCOs) to run this sub-districtoffice.
For the field enumeration, a group ofcensus enumerators (ENs) was supervisedby a team supervisor (TS) and a group ofTS, by a Census Area Supervisor (CAS).NSO SCOslASCOs were designated asCAS. The DAS supervised all CAS, TS andENs of the municipalities covered by theDistrict or Subdistrict Office.
Method of Enumeration
The gathering of population data wasperformed by census enumerators throughhouse-to-house visits and interview of aresponsible member of each household. Thehousehold was used as the enumeration unit.However, a complete listing of buildingswhich contain living quarters, includingvacant ones, as well as housing units wasdone.
The households were interviewedusing the Household Questionnaire (CPForm 2). The items asked on populationwere household membership, relationship tohead, whether or not a person was anoverseas worker (OCW), date of birth., ageas of last birthday, sex, civil status,disability, ethnicity, .highest gradecompleted, trade skills and economicactivity.
•
•
Institutional households wereenumerated using the InstitutionalPopulation Questionnaire (CP Form 3). Allitems in CP Form 2 were also asked exceptfor item DCW where residence status wasasked instead.
Information about households ofFilipinos working in the PhilippineEmbassies, Consulates and Missions inforeign countries, were also gathered andincluded in the total population of thecountry.
Place Where Enumerated
All persons were enumerated in theirusual place of residence, which is thegeographic place (street, barangay, sitio,municipality or province) where theenumerated person usually resides.
Filipinos working in PhilippineEmbassies/Consulates and Missions abroadwere also enumerated. CP Form 2questionnaires were sent to them through theDepartment of Foreign Affairs.
Content and Coverage of this Publication
PDPCEN Report No. 4 containsthree tables on the population, land area anddensity, broken down by region, provinceand city/municipality for the years 1980,1990 and 1995. Figures on land area wereprovided by the Land Management Bureau(LMB) and are based on their 1997 cadastralsurvey.
The tables presented are population,land area and population density of thePhilippines by region, province and
ix
Explanatory Text
city/municipality for the years 1980, 1990and 1995.
Concepts and Definition of Terms Used
Persons Enumerated in the 1995 Census ofPopulation as Members of the HOlIsehold
The following were counted andenumerated as members of the household:
1. Persons whose usual place of residenceis the place where the household livesand who are present at the time of visitof the enumerator, except those bornafter 12:01 A.M., September 1,1995.
2. Family members who are overseas andwho are away at the time of the censusare considered members of thehousehold ..
3. Persons whose usual place of residenceis the place where the household livesbut are temporarily away at the time ofthe census for any of the followingreasons:
• on vacation, business/pleasure lrip ortraining somewhere in the Philippinesand are expected 10 he back within six(6) months from lime of departure;
• on vacation, business/pleasure trip orstudy/training abroad and are expected10 he back within a year from time ofdeparture;
• working or altending school in someother place bul comes horne al leastoncca week;
• confined in hospitals for a period of notmore than six (6) months at the time ofenumeration except when they are
r
Ix
confined as inmates in mental hospitals,leprosaria or leper colonies, drugrehabilitation cenlers, etc.;
• detained in national/provincial!city/municipal jails or in military campsfor a period of not more than six (6)months at the time of enumeration;
• training with thc Anned Forces of thePhilippines if training is not more thansix (6) months:
• on board coastal, inter-island or fishingvessels within Philippine territories; or
• on board ocean-going vessels but arcexpected to come home.
4. Boardersllodgers of the household oremployees of household-operated busi-nesses who do not usually go to theirrespective homes weekly.
5. Citizens of foreign countries, excludingmembers of diplomatic missions andnon-Filipino members of internationalorganizations, but including FilipinoBalikbayans who have resided or areexpected to reside in the Philippines formore than a year from his arrival.
6. Persons temporarily staying with thehousehold who have no usual place ofresidence or who are not certain to beenumerated elsewhere.
P~ons Enumerated a.~Members of theInstitutional Population
The following persons were enume-rated as members of the institutional popu-lation:
1995 Census of Population
1. Permanent lodgers in boarding houses
2. Dormitory residents who do 1I0tgo home at leastonce a week
3. Hotel residents who have stayed more than 6months at the time of the census
4. Boarders in residential houses, provided thattheir number is ten (10) or more.
5. Patients in hospitals who are confined for morethan 6 months
6. Wards in orphanages
7. Inmates of penal colonies or prison cells
8. Priest and seminarians in seminaries, nuns inconvents
9. Soldiers residing in military camps
10. Workers in mining and similar camps
The following persons wereexcluded as members of the institutionalpopulation but were included In thehouseholds to which they belong:
1. Military officials and members of theirhouseholds who have housing unitswithinmilitarycamps.
2. Managers (and members of theirhouseholds) of refugee camps,dormitories, hotels, hospitals, etc., whooccupy and regularly use as their placeof abode living quarters In theinstitutions that they manage.
3. Priests who, together with their relativesand/or household help, occupy andregularly use as their place of abode alivingquarter in the church or seminary.
•
Persons Excluded from tlte Enumeration
The following persons wereexcluded from enumeration even if theywere within the territorial jurisdiction of thePhilippines at the time of the POPCENenumeration:
I. Foreign ambassadors, ministers, consulsor other diplomatic representatives, andmembers of their fan1ilies (exceptFilipino and non-Filipino employeeswho have been residents of thePhilippines prior to said employment);
2. Citizens of foreih'll countries livingwithin the premises of an embassy,legation, chancellery or consulate;
3. Citizens of foreign countries who arechiefs or officials of internationalorganizations like United Nations (UN),International Labor Organizations (ILO),Asian Development Bank (ADB), Foodand Agricultural Organization (FAO),the US Agency for InternationalDevelopment (USAID) who are subjectto reassignment to other countries aftertheir tour of duty in the Philippines, andmembers of their families;
4. Citizens of foreign countries togetherwith non-Filipino members of theirhouseholds, who are students or who areemployed, or have business in thePhilippines but who are expected to stayin the country for less than a year fromarrival;
5. Citizens of foreign countries andFilipinos with usual place ofresidence ina foreign country who are visiting thePhilippines and who have stayed or are
Xl
Explanatory Text
expected to stay in the country for lessthan a year from arrival;
6. Citizens of foreign countries 111 refugeecamps/vessels; and
7. Residents of the Philippines on vacation,pleasure or business trip, study ortraining, etc., abroad who have beenaway from the Philippines for more thana year from departure.
Persons working for them or livingwith them were also enumerated based onthe rules of enumeration.
Land Area
The geographical size of a politicalentity measured in square kilometer.
Approved Cadastral Survey
Based on Land ManagementBureau's (LMB) definition, approvedcadastral survey is a completed geodeticsurvey of a geographical area or politicalentity, measured by traversing its boundary.The aggregate areas of all barangayscomprising the municipality form the area ofthat municipality.
Estimated Land Area
Estimated land area, as per definitionadopted from Report NO.7: Population,Land Area and Density based on the 1990Census of Population and Housing (CPH),refers to the unsurveyed area or area withoutcomplete cadastral survey. Areas which areeither having on-going cadastral surveyorhave been partially surveyed are included in
~.
xii
this category. Figures reported herein arebased on the 1997 estimated land areas.
Population Density
Population density refers to theaverage number of persons per squarekilometer, computed by dividing thepopulation by the estimated land area of agiven political entity.
1995 Census of Population
Percent Change in Density
The percent change in density iscomputed by getting the difference betweenthe densities of an area in two census yearsdivided by the density in the previouscensus; the result is then multiplied by 100.
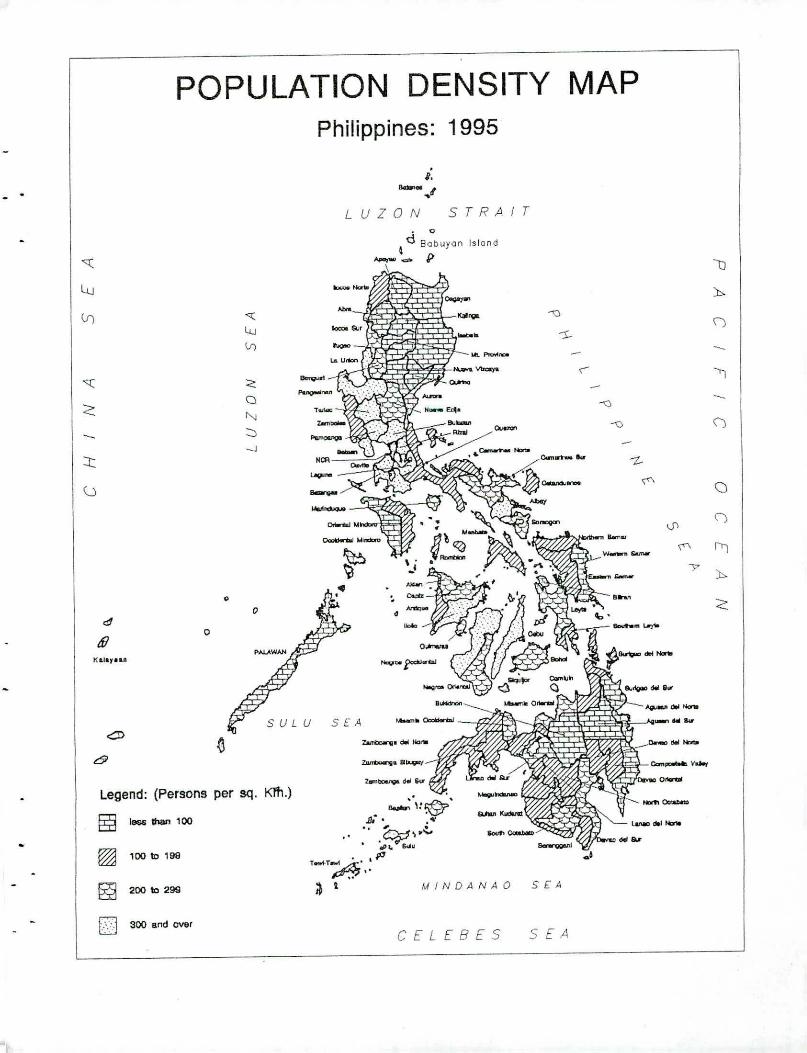
POPULATION DENSITY MAPPhilippines: 1995
I.--.'LUZON STRAIT
o
Legend: (Persons per sq. KlI1.)
gj lea than 100
~ 100 to 199
~ 200 to 299
0 300 and over...:'
-".
•. .
• c
~d 8obuyon Island
--I?l
•....
CELEBES
lJ
),.
""" \)
~ -("' ~
""" -"""
\)
7-
«\()
<Jl\)
'" r,.,,.
),.
<
•••••
S £ A
SEA
xvPoplllatioll, Lalld Area amI Dellsity
HIGHLIGHTS
• In 1990, the population density forthe Philippines stood at 202 personsper sq. km. This means that in aspan of five years, the averagenumber of persons per sq. km.increased by 27 persons.
• The total land area of the Philippinesis about 300,000 sq. km. If thenational population of 68,6 15,536persons as of September I, 1995 isevenly distributed across the totalland area. about 229 persons on theaverage, occupies every sq. km. ofland area.
area. yet it is a close second, in termsof population size, to the SouthernTagalog Region (Region IV) whichhas the largest land area.
• As a result, the NCR is the mostdensely populated of the 16 regions.In 1995, an average of 14,928persons were occUPYll1g every sq.km. ofland area in NCR. This figureis about 65 times the national densityof 229 persons.
most sparselypersons per sq.
TahIr 2. POJlulation Densit)' by Region:1990, 19')5
I Persons per sq. I.;m.Regioll I 1990 I 19<)5
Philippines 202 229
NCR 12.551 14,92RCAR 66 75I 277 297II 7& &4III 37Q 424IV 170 205V 217 240VI 26& 2&7VII 429 322VIII 13Q 153IX 135 154X 141 159XI 105 169XII 121< 149ARMM 96 105CARAGA QI 101
•. Apayao is thepopulated with 21
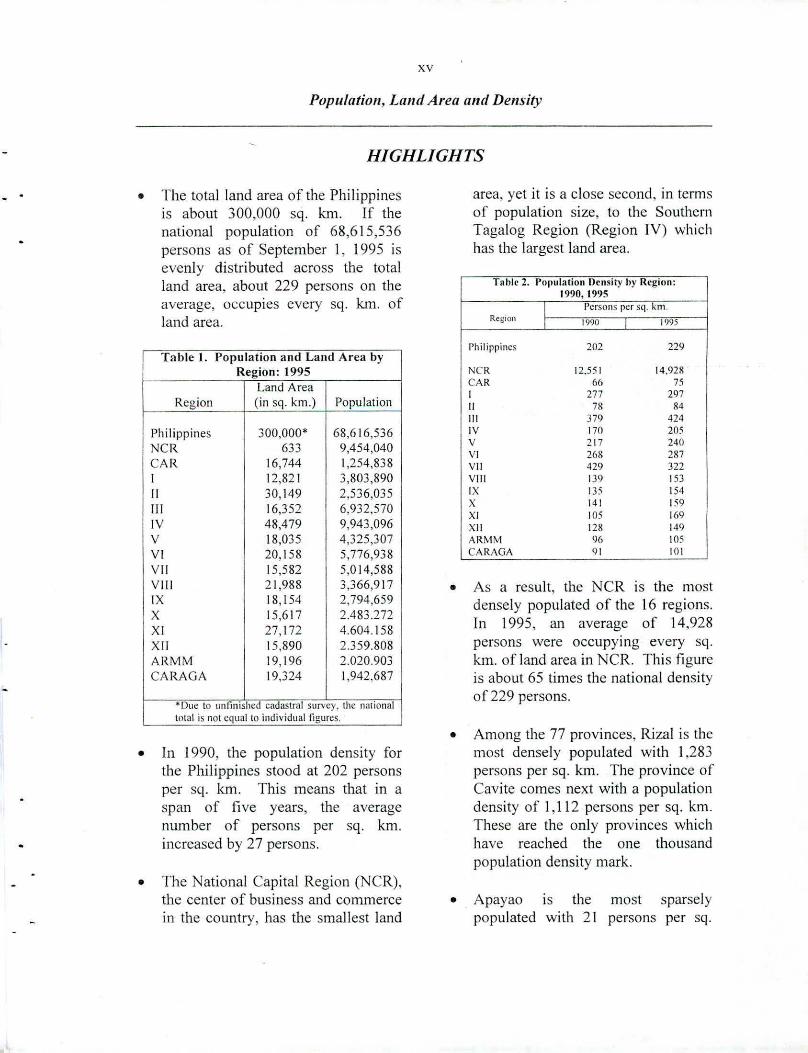
• Among the 77 provinces, Rizal is themost densely populated with 1,283persons per sq. kl11. The province ofCavite comes next with a populationdensity of 1,112 persons per sq. km.These are the only provinces whichhave reached the one thousandpopulation density mark.
The National Capital Region (NCR) .the center of business and commercein the country, has thc smallest land
Table J. Population and Land Area b)'Region: 1995
Land AreaRegion (in sq. km.) Population
Philippines 300,000' 68.616.536NCR 633 9,454,040CAR 16,744 1,254,838I 12,821 3,803,890II 30,149 2,536,035III 16,352 6,932,570IV 48,479 9,943,096V 18,035 4,325,307VI 20,158 5,776,938VII 15,582 5,014,588VIII 21,988 3,366,917IX 18,154 2,794,659X 15,617 2.483.272XI 27,172 4.604.158XII 15,890 2.359.808ARMM 19,196 2.020.903CARAGA 19.324 1,942.687
-Due to unfinished cadastral survey. the nalionaltotal is not equal to individual figures.
•
XVI
Populatioll, Lalltl Area alltl Dellsity
km. The provinces of Quirino andPalawan follow with a populationdensity of 38 and 39 persons per sq.km .. respectively.
Figure 1Ten Most Densely Populated Provinces: 1995- .-----------
1300 uu
a 700••""
• Within NCR, the population densityranges from 5,316 persons per sq.km. in Pateros to 66,000 persons persq. km. in Manila
Figure 2Population Density. Natlonal Capital Region:
1995
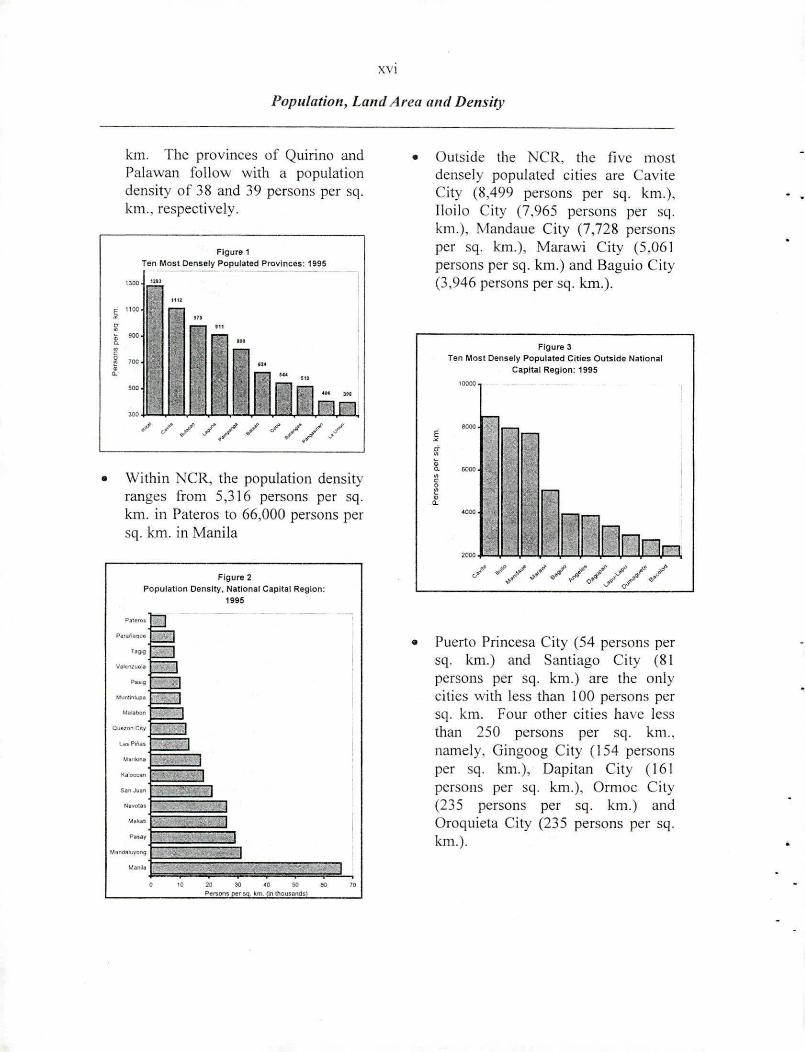
• Outside the NCR, the five mostdensely populated cities are CaviteCity (8,499 persons per sq. km.),Iloilo City (7,965 persons per sq.km.), l'vlandaue City (7,728 personsper sq. km.), Marawi City (5,061persons per sq. km.) and Baguio City(3,946 persons per sq. km.).
Figure 3Ten Most Densely Populated Cities Outside National
Capital Region: 1995
""'"
"''''E•[
~ -.,,"•Q
'000
~..•."'.
"'.YOl.'
10 ~ m ~ ~ ~ ro~~fSons f s ~m. (io thousands!
• Puerto Princesa City (54 persons persq. km.) and Santiago City (81persons per sq. km.) are the onlycities with less than 100 persons persq. km. Four other cities have lessthan 250 persons per sq. km ..namely. Gingoog City (154 personsper sq. km.), Dapitan City (161persons per sq. km.), Ormoc City(235 persons per sq. km.) andOroquieta City (235 persons per sq.km.).
XVII
Populatiol/, Laml Arelllll/d Del/sity
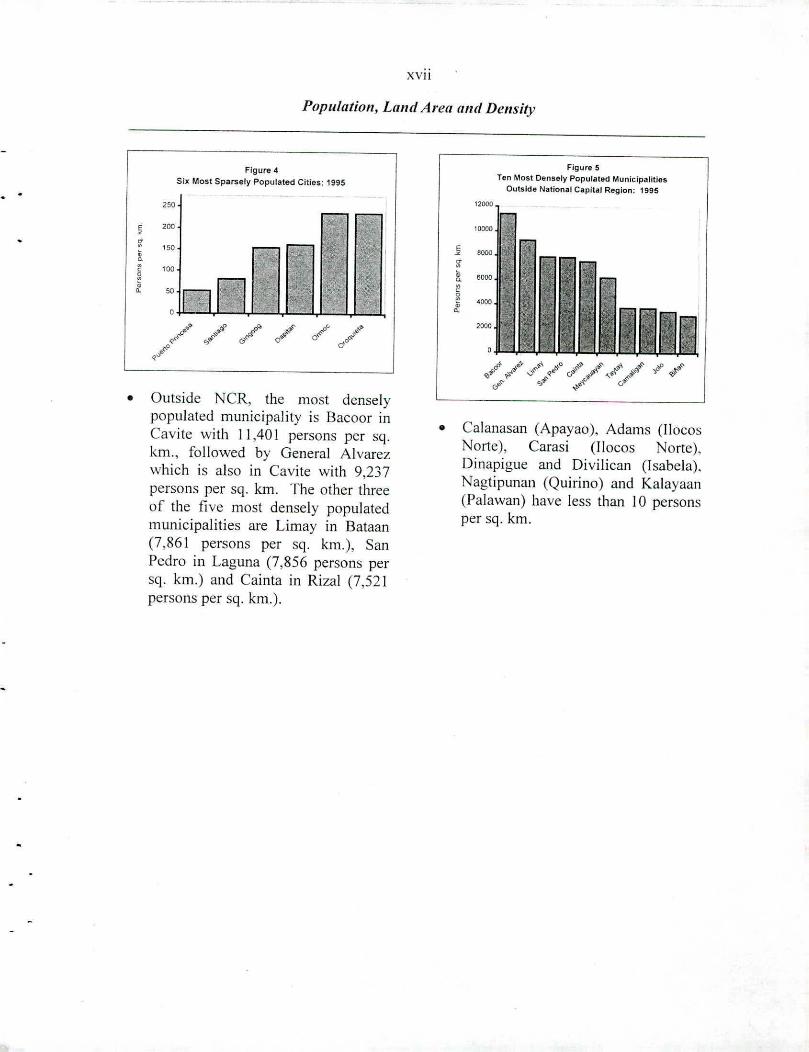
•
FIgure 4Sill Most Sparsely Populated Cities; 1995
250
Outside NCR, the most denselypoplllated municipality is Bacoor inCavite with 11,40 I persons per sq.km., followed by General Alvarezwhich is also in Cavite with 9,237persons per sq. km. The other threeof the five most densely populatedmunicipalities are Limay in Bataan(7,861 persons per sq. km.), SanPedro in Laguna (7,856 persons persq. km.) and Cainta in Rizal (7,521persons per sq. km.).
•
Figure 5Ten Most Densely Populated Municipalities
Outside National Capital Region: 1995
Calanasan (Apayao), Adams (IloeosNorte), Carasi (llocos Norte),Dinapigue and Diviliean (Isabela).Nagtipunan (Quirino) and Kalayaan(I'alawan) have less than 10 personsper sq. km.

Poplilatioll, Lalle! Area aile! DellSity
TABl.!:: I: ['OPULATION. LAND ,\REA AND POPULATION DENSITY OF THE PIIlLlPI'INES BY REGION AND PROVINCE: II)~O.)990 ANlJ 1'N:"
E$T1\1ATEDR+(Jl0~. I'ROV/!\ICE. I'OI'ULATIO:--; LAND AREA POPl.LATION DENSITY PERC'ENT ('lfANCi!: 1:-':IlFNsn yCITYiMlIN1("lI'ALITY 1980 199(l 1995 ISQ. KM) 1980 1990 1995 IIJXO - IlJ<)O - I'JKO -
199!l 1(1)5 11)1)5
III (2) (3) (4) (5) el (6) fI (7) g: 00 hi (9) if (10) jl
I'H1LIPI'I\:ES -lR,098.460 60,703,226 a1 68,616,536 hi 300,000.0 160 202 229 2C1.2 )J.O 42.7
\I (' I{ - \lETRO \-1,.\\111./\ 5.925.884 7.94~.3t)2 9,454.040 633.3 9.357 12551 14,92R J ..1I IX.1) 5lJ5
C 1\ R 914.432 1.146,19[ 1.254.838 16.7440 55 M~ 75 2.1.(1 10.] 3(1,4
lIIlK" 160,198 184,743 195.%4 3,1090 52 59 (,) 15.-' (1,1 n.-'BE\liUET 354.751 485.857 I 540,716 2,005.0 177 242 270 JCI.7 11(, 525IIT(iAO 111.368 147.281 J 149.598 2,506.0 ;4 59 <>0 ~2.2 J.(l .U . .l
KAII:-';( i/\ J 14.382 /137.055 154.145 1 3,173.0 36 l43 [ ;') I<),}l 12.5 J4.X
APAYAO 70.681 - 74.720 83.660 '}.951.0 I R 19 21 5.7 12.0 IHA
\ll)I):'\TAIN l'R(lVI~('E 103.052 116.535 130.755 2.0010 52 58 (IS 1J.1 12.2 2(11)
RHiIO" I .ILOCOS 2.922.892 3,550.642 3.803.890 12,820.9 228 277 297 21.5 7.1 30.1
1l.()"OS ~()RTE 390.666 4(,1.661 482.651 ),440.0 114 134 140 IX.2 4.5 2.\":-II.O"OS StiR 443.S91 519.966 545.385 2.517.0 176 207 217 17.2 ~.') 22.91.A I'SIO' 452578 548.742 597,4 ..'2 1,499.9 302 366 J91\ 21.2 R.9 32 (J
I' 1\:"(i:\SI1\ A' 1.63h.057 2.020.273 2.17R.412 5.364.0 305 377 406 23,5 7.8 33.2
l{E<j[O:X II. ("AriA YAN [.919.001 2.340.545 2.536.035 30,148.7 M 78 8; 22.0 8.4 32.1
V,\I\.I''y
BAT A~ES 12.091 15.026 14,)80 219.0 55 69 65 24.3 -5.Cl 17..\
("A( iAVAN 711.476 829,867 895,050 9,21;.5 77 90 '>7 lh.<l 7.9 25.x
ISI\BELA 870.604 1,080.341 1.160.n1 13,148.0 (16 82 88 2;.1 7.4 J:U
NIIEVA V[ZCAYA 241.690 301.179 334,965 4,081,0 59 74 82 24.6 [1.2 JH.h
O{lIRI\'O 83.230 114,132 131.119 3.486.2 24 33 38 ,37,1 14.9 57':'
RE(iIU', III - (,F::'>lTRAL Ll~ZON 4.802.793 6.199.017 6.932.570 16.351.9 294 379 42; 29. t II.R 44.3
BAT A"\: 323,25; 425,803 491,459 788.0 ;10 540 ()24 31.7 154 52.0
lH ILI\('AN 1.096.04b 1.505,219 1.784,441 1.822.0 602 826 979 37..~ 18.6 h2.x
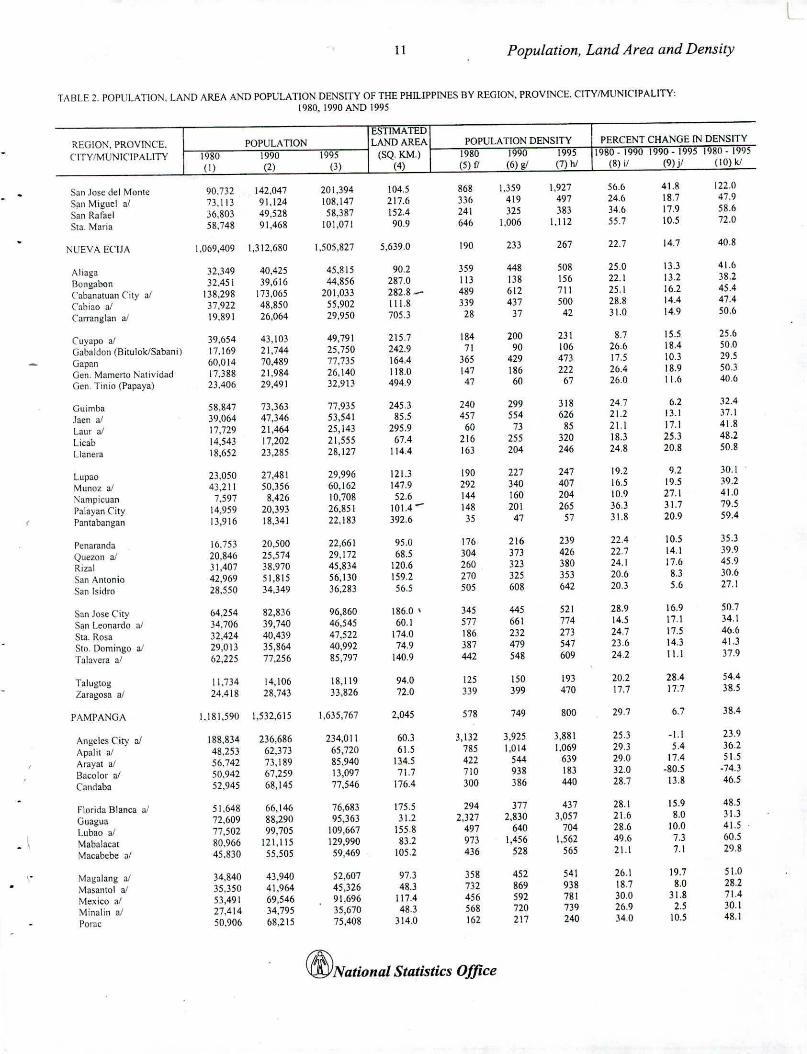
]'\llEVA ITIJA 1.069.409 1.312 ..680 1,505.827 5,639.0 190 233 267 22.7 14.7 40.X
J'!\\-lI'ANGA 1.181.590 1.532.615 1.635.767 2,0;50 578 749 ROO 19.7 Cl.7 3X,4
TARL.-\C 688.457 859.708 945,8)0 2.736.8 152 314 34b 14.1) 10.0 .~7.4
Zt\\lBALES 444.037 562.992 569.266 3,32 L1 134 170 171 2h.~ l.l 21\.1
REli[O?" IV - S()tiTIIER)'\ 6.118.620 8.263.099 9.943.096 48.478.7 126 170 205 35.0 20.,3 h25T1\( iAI.O(i
l\1:R(lR,\ 107.145 139.57.1 159.621 3.147.5 34 44 51 3lU 144 41).0
BAT:\~(iAS 1.174.201 1.476.783 1,658.567 3.195.6 367 462 51<) 25.R 12.3 41.3
('/\Vln: 771.320 1,152,534 1.610.324 1.447.5 533 796 1.112 4QA ]C},7 lOX.X
IAGliNA 973.104 1,)70,232 1.631.082 1,789.8 544 7M) 911 40.X 11}.O h7.6
MARI~DlIQUE 17J.715 185,524 199.910 934.7 186 198 214 !I.X 7.8 15.1(J('(,II1ENTAL ~llt'\[)ORn 221,431 282.59) 339.605 5,865.7 38 48 58 27.0 20.2 52.7
ORIE:'\T AL MI~DORO 446 ..938 550.049 608,616 4,449,5 100 124 (J7 2.ll 10.(1 3el.2
PAL\WAN 371.782 528,287 640,486 16,403.1 23 32 39 42.1 21.2 n.3Ql'EZO~ 1.129.277 1,)72.455 1.537,742 8.676.4 130 158 177 21.5 12.0 3(1.2
R[ZAL 555.533 9i7,448 1.312A89 1,0232 543 955 1.283 75.9 34.3 IJed
RO\1BLON 193,17; 227.62) 244.654 1,545.7 125 147 158 17.8 7.5 2h.6
RE<i[(j'J v - U[eOL 3,476.982 3,910.001 4.325.307 18.035.2 193 217 240 12.5 IO.h 24.4
Al.BA\' 809.177 903,785 1,005,315 2.634.5 307 343 382 11.7 11.2 24.2
CI\;\!AR!]'\ES 1'\ORTE 308,007 390,982 439,151 2,304.2 \34 170 Xl) 2h.9 12.3 42.(1
CA\lARI~ES StiR 1.099,3;6 1.305.919 1,432.598 5,367.8 205 f 24) 267 18.8 9.7 30 ...'CATA:'\DlIA\:ES 175.247 187,000 202,464 1,492.0 )17 125 136 6.7 8.3 15.:'~l,\SBATE 584.520 599,355 653.852 4.088.9 14) 147 160 2.5 9,1 II.I}
SORSOGOi'\ 500.685 522.960 591,927 2,147.8 233 243 276 4,4 (J.2 1H,2
(efj) National Statistics Office
2 Population, Land Area and Density
TABLE I: POPULATION, lAND AREA AND POPULATION DENSITY OF TIlE PIIILlPPINES BY REGION AND PROVINCE: 1980, 1990 AND 1995
ESTIMATEDREGION, PROYrNCE. POPULATION LAND AREA POPULATION DENSITY PERCENT CHANGE IN DENSITYCITY/MUNICIPALITY 1980 1990 1995 (SQ. KM.) 1980 1990 1995 1980 - 1990 - 1980 ~
1990 1995 1995(I) (2) (3) (4) (5) oJ (6) II (7) " (8) hi (9) il (10) jl
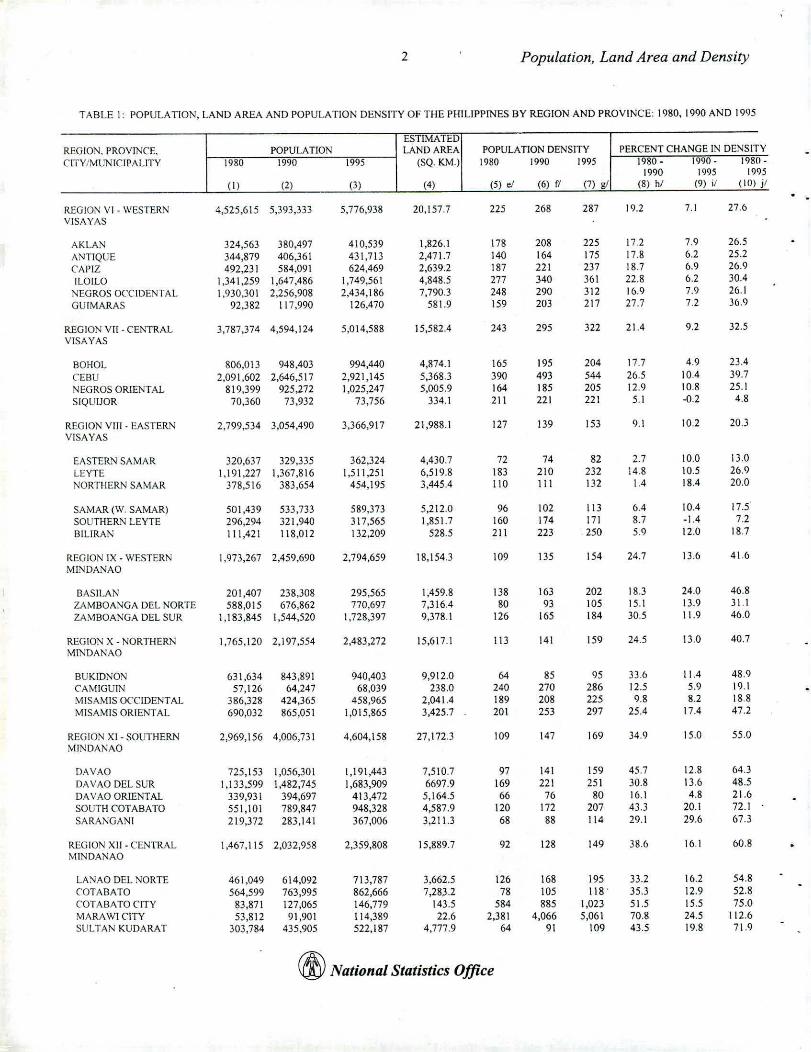
REGION VI - WESTERN 4,525,615 5,393,333 5,776,938 20,157.7 225 268 287 19.2 7.1 27.6VISAYAS
AKLA~ 324,563 380,497 410,539 1,826.1 178 208 225 17.2 7.9 26.5
ANTIQUE 344,879 406,361 431,713 2,471.7 140 164 175 17.8 6.2 25.2
CAPIZ 492,231 584,091 624,469 2,639.2 187 221 237 18.7 6.9 26.9
ILOILO 1,341,259 1,647,486 1,749,561 4,848.5 277 340 361 22.8 6.2 30.4
:-':EGROS OCCIDENTAL 1,930,301 2,256,908 2,434,186 7,790.3 248 290 312 16.9 7.9 26.1
GUIMARAS 92,382 117,990 126,470 581.9 159 203 217 27.7 7.2 36.9
REGIO~ VII - CEl'.'TRAL 3,787,374 4,594.124 5,014.588 15,582.4 243 295 322 21.4 9.2 32.5VISAYAS
BOHOL 806,013 948,403 994,440 4,874.1 165 195 204 17.7 4.9 23.4
('£BU 2,091,602 2,646,517 2,921,145 5,368.3 390 493 544 26.5 10.4 39.7:\'EGROS ORIENTAL 819,399 925,272 1,025,247 5,005.9 164 185 205 12.9 10.8 25.1SIQUIJOR 70,360 73,932 73,756 334.1 211 221 221 5.1 -0.2 4.8
REGION VIII • EASTERJ~ 2,799,534 3,054,490 3,366,917 21,988.1 127 139 153 9.1 102 20.3VISAYAS
EASTERN SAMAR 320,637 329,335 362,324 4,430.7 72 74 82 2.7 10.0 13.0
LEYTE 1,191,227 1,367,816 1,511.251 6,519.8 183 210 232 148 10.5 26.9
NORTHERN SAMAR 378,516 383,654 454,195 3,445.4 110 111 132 1.4 18.4 20.0
SAMAR (W. SAMAR) 501,439 533,733 589,373 5,212.0 96 102 113 6.4 10.4 17.5
SOUTHERN LEVTE 296,294 321,940 317,565 1,851.7 160 174 171 8.7 -1.4 7.2
BIURAN 111,421 118,012 132,209 528.5 211 223 250 59 12.0 18.7
REGION IX - WESTERN 1.973,267 2,459,690 2,794,659 18,154.3 109 135 154 24.7 13.6 41.6MNDANAO
BASILAN 201,407 238,308 295,565 1,459.8 138 163 202 18.3 24.0 46.8ZAMBOANGA DEL NORTE 588,015 676,862 770,697 7,316.4 80 93 105 15.1 13.9 31.1ZA\1BOANGA DEL SUR 1,183,845 1,544,520 1,728,397 9,378.1 126 165 184 30.5 11.9 46.0
REGlON X - NORTHERN 1,765,120 2,197,554 2,483,272 15,617.1 113 141 159 24.5 13.0 40.7MP.SOANAO
BUKIDSON 631,634 843,891 940,403 9,912.0 64 85 95 330 I 1.4 48.9CAMIGUIN 57,126 64,247 68,039 238.0 240 270 286 12.5 5.9 19.1MISAMIS OCCIDENTAL 386,328 424,365 458,965 2,041.4 189 208 225 9.8 8.2 188MI$AMIS ORIENTAL 690,032 865,051 1,015,865 3,425.7 201 253 297 25.4 17.4 47.2
REGION XI - SOUTHERN 2,969,156 4,006,731 4,604,158 27,172.3 109 147 169 34.9 15.0 55.0~rNDAJSAO
DAVAO 725,153 1,056,301 1,191,443 7,510.7 97 141 159 45.7 12.8 64.3DA v AO DEI. SUR 1,133,599 1,482,745 1,683,909 6697.9 169 221 251 30.8 13.6 48.5DA vAO ORIENTAL 339,931 394,697 413,472 5,164.5 66 76 80 16.1 4.8 21.6SOuTH (,OT ABA TO 551,101 789,847 948,328 4,587.9 120 172 207 43.3 20.1 72.1SARANGANI 219,372 283,141 367,006 3,211.3 68 88 114 29.1 29.6 67.3
REGION XII . CENTRAL 1,467,115 2,032,958 2,359,808 15,889.7 92 128 149 38.6 161 60.8MINDANAO
LA:-:AO DEL ~ORTE 461,049 614,092 713,787 3,662.5 126 168 195 33.2 16.2 54.8COTABATO 564,599 763,995 862,666 7,283.2 78 105 118' 35J 12.9 52.8COT ABA TO CITV 83,871 127,065 146,779 143.5 584 885 1,023 51.5 15.5 75.0MARAWI CITY 53,812 91,901 114,389 22.6 2,381 4,066 5,061 70.8 24.5 112.6SULTAN KUDARAT 303,784 435,905 522,187 4,777.9 64 91 109 43.5 19.8 71.9
~ National Statistics Office
3 Population. Land Area and Density
TABLE \, POPULATION. lAND AREA AND POPULATION DENSITY Of THE PHiLIPPiNES BY REGION AND PROVINCE, 1980. i990 AND i9<)5
ESTiMATEDREGION. PROVIKC'E. POPULATiON LAND AREA POPULATION DENSITY PERCENT CHANGE IN OENSITY
CITY/f\.U::,\lnrALITY 1980 1990 1995 (SQ.KM.) )980 1990 19\)5 1980. 1990. I'H\O •1990 1995 II}95
(i) (2) (3) (4) (5) el (6) fl (7) 81 18) hi (9) il (1fI) ,il
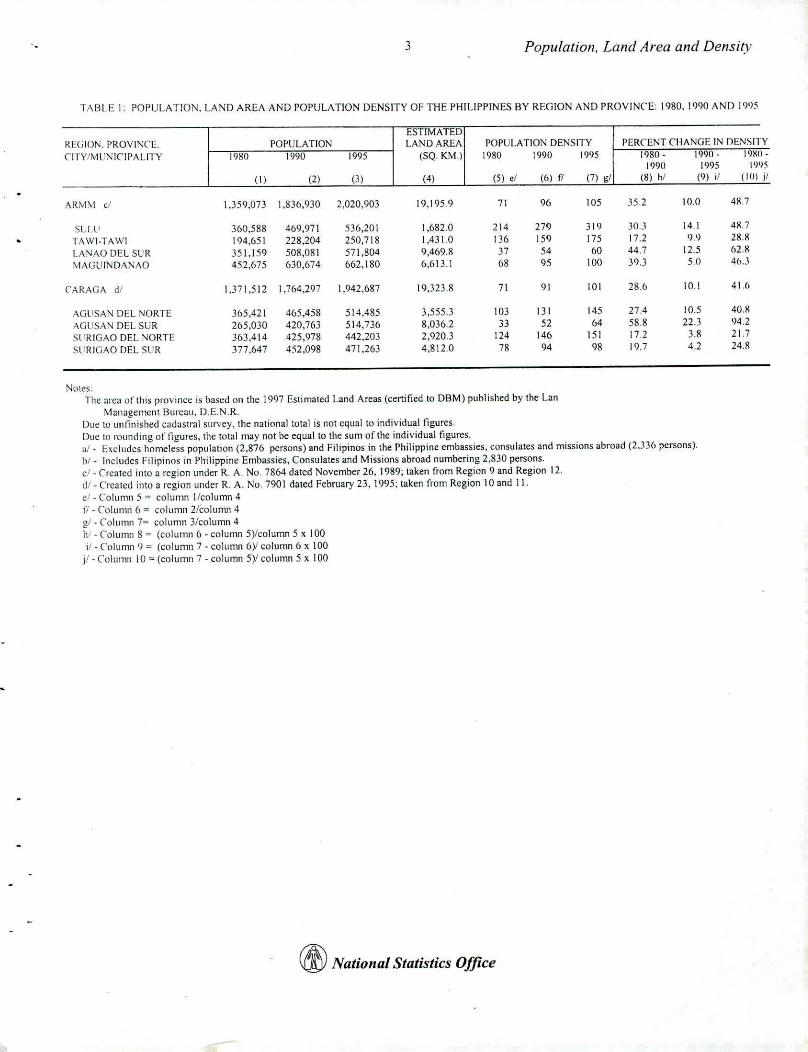
ARM'v1 ,I 1.359.073 i.836.930 2.020.903 i9.\95.9 7\ 96 \05 352 10.0 4H,7
StiLlI 360.588 469,971 536,201 1.682.0 214 279 319 30.3 14,1 4!U
TAWj.TA\VI 194,651 228.204 250.718 1,431.0 136 159 175 17.2 I)\) 28.8
LANAG DEL SUR 351.159 508.081 57\.804 9,469.8 37 54 60 44.7 12.5 62.X
\1A<.;UINDANAO 452.675 630.674 662.180 6,613.1 68 95 IDa 39.3 5.0 4(d
CARAGA dl 1.371,512 1.764,297 1.942,687 19.323.8 71 91 101 28.6 10.\ 41,6
AGllSAN DEL NORTE 365,421 465,458 514,485 3.555.3 103 131 145 27.4 10.5 40,H
AGUSAN DEL SUR 265.030 420.763 514,736 8.036.2 33 52 64 588 22.3 94.2
SlJRIGAO DEL :"JORTE 363,414 425.978 442.203 2.920.3 124 146 151 17.2 3.8 21.7
Sl:RIGAO OEL SUR 377.647 452.098 471.263 4.812.0 78 94 98 19.7 4.2 248
Notes:The area of this province is bast:d on the 1997 Estimated Land Areas (certified to DBM) published by the Lan
Management Bureau.D,E.N,R.Due to llnfinished cadastral survey, the national total is not equal to individual figures.Due 10 rounding of figures, tht total may not be equal 10 the sum of the individual figures.,,1_ Excludes homeless population (2.876 persons) and Filipinos in the Philippine embassies, consulates and missions abroad (2 . .33Cl persons).hI - Includes Filipinos in Philippine Embassies, Consulates and Missions abroad numbering 2,8.30 persons.cI. Created into a region under R. A. No. 7864 dated November 26.1989; taken from Region 9 and Region 12.d/. Created inlO a region under R. A. No. 7901 dated February 23,1995; taken from Region 10 and t I.e/ . Column 5:: column lIcolumn 41'1- Column 6:: column 2/column 4g.f. Column 7:: column 3lcolumn 4111-Column 8:: (column 6. column 5)1column 5 '" 100if. Column I):: (column 7 . column 6)/ column 6 x 100
jf - Column 10:: (column 7 - column 5)/ column 5 x 100
~ National Statistics Office
4 Population. Land Area and Density
TABLE 2. POPULA TlO~.LA:-.JDAREA AND POPULATION DENSITY OF THE PHILIPPINES BY REGION. PROVINCE. CITY/MUNICIPALITY:1980,1990 AND 1995
ESTIMATEDREGION. PROV[NC'E. POPULATION LAND AREA porULA nON DENSITY PERCENT CHANGE IN DENSITY
CITY/MUNICIPALITY 1980 1990 1995 (SQ.KM.) 1980 1990 1995 1980-1990 1990-}995 1980-1995
(I) (2) (3) (4) (5) [I (6) gI (7) hi (8) il (9) jl (10) kf
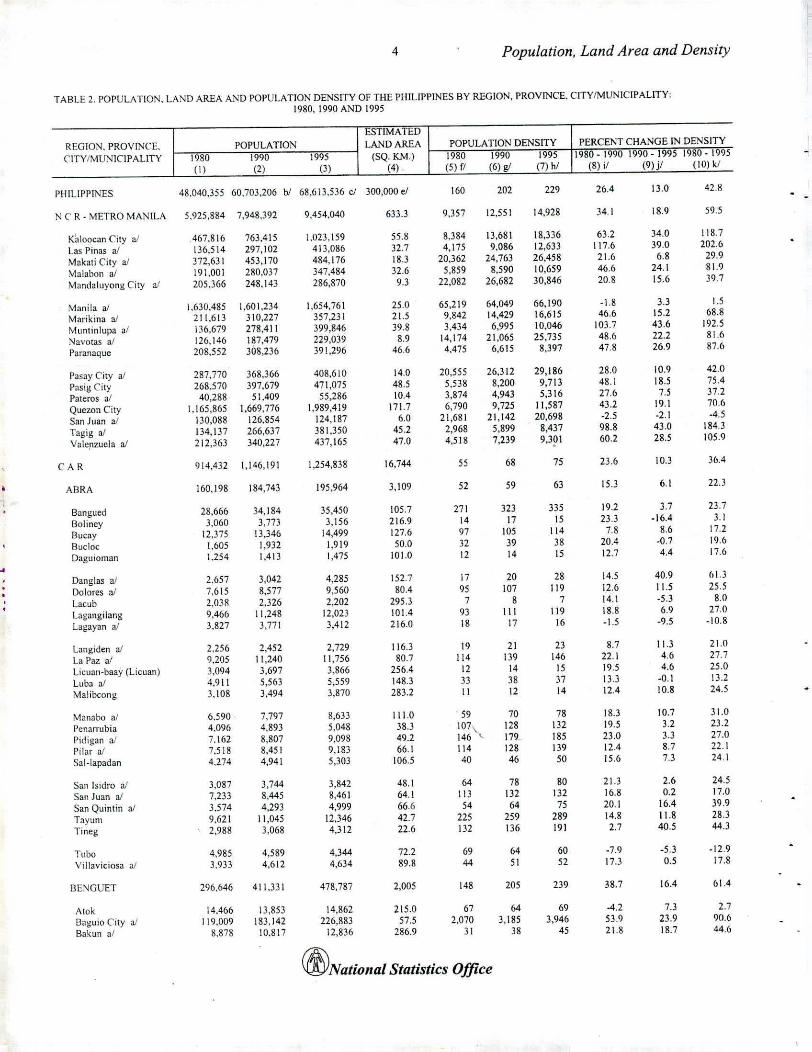
PHILIPPINES 48,040,355 60,703.206 hi 68,613.5)6 c/ 300,000 el 160 202 229 26.4 13.0 42.H
N (' R • METRO MANILA 5.925,884 7.948,392 9,454,040 633.3 9.357 12,551 14,928 341 18.9 59.5
Kaloocan City aJ 467.816 763.415 1.023,159 55.8 8.384 13.681 18,336 63.2 34.0 118.7
Las Pinas aJ 136,514 297,102 413,086 32.7 4,175 9,086 12,633 117.6 39.0 202.6
Makati City a! 372.631 453,170 484,176 18.3 20,362 24.763 26.458 21.6 6.8 29.9
Malabon a/ 191.001 280,037 347,484 32.6 5,859 8.590 10,659 46.6 24.1 81.9
Mandaluyong City oJ 205,366 248.143 286.870 9.3 22,082 26,682 30,846 20.8 15.6 39.7
."v1anila aJ 1.630,485 1.601.234 1.654.761 25.0 65.219 64.049 66.190 -1.8 3.3 1.5
Marikina aJ 211,613 310.227 357,231 21.5 9.842 14,429 16.615 46.6 15.2 68.8
Munlinlupa al 136.679 278.411 399.846 39.8 3,434 6,995 10.046 103.7 43.6 192.5
:"Javotas a! 126.146 187,479 229,039 8.9 14.174 21.065 25.735 48.6 22.2 81.6
Paranaque 208.552 308.236 391,296 46.6 4,475 6.615 8.397 47.8 26.9 87.6
Pasny City aJ 287.770 368,366 408.610 14.0 20,555 26,312 29,186 28.0 10.9 42.0
Pusig City 268,510 397,679 471.075 48.5 5,538 8,200 9,713 48.1 18.5 75.4
Paleros aJ 40,288 51.409 55,286 10.4 3.874 4,943 5.316 27.6 7.5 37.2
Quezon City 1,165,865 1,669.776 1.989,419 17\.7 6,790 9,725 11.587 43.2 19.1 706
San Juan aI 130.088 126.854 124,187 6.0 21,681 21,142 20.698 -2.5 -2.1 -4.5
Tagig aJ 134,137 266,637 381.350 45.2 2.968 5,899 8,437 98.8 43.0 184.3
Va1c.nzuela aJ 212,363 340,227 437,165 47.0 4,518 7,239 9.391 60.2 28.5 105.9
CAR 914,432 1,146,191 1.254.838 16.744 55 68 75 23.6 10.3 )6.4
ABRA 160.198 184,74) 195,964 3,109 52 ;9 63 15.3 6.1 22.3
Bangued 28,666 34,184 35.450 105.7 271 323 335 19.2 3.7 23.7
Bo1iney 3,060 3,773 3,156 216.9 14 17 15 23.3 -16.4 3.1
Bueay 12.375 13,346 14,499 127.6 97 105 114 7.8 8.6 17.2
Budoe 1.605 1.932 1,919 50.0 32 39 38 20.4 -{).7 1<.1.6
Daguioman 1.254 1,413 1.475 101.0 12 14 15 12.7 4.4 17.6
•Danglas at 2.657 3,042 4,285 152.7 17 20 28 14.5 40.9 61.3
Dolores a! 7.615 8,577 9,560 80.4 95 107 119 12.6 11.5 25.5
Laeub 2,0)8 2.326 2,202 295.3 7 8 7 14.1 -5.3 8.0
Lagangilang 9,466 11,248 12,023 101.4 93 III 119 18.8 6.9 27.0
Lagayan aJ 3.827 3.771 3,412 216.0 18 17 16 -1.5 -9.5 -10.8
Langiden a' 2,256 2,452 2,729 116.3 19 21 23 8.7 11.3 21.0
La Paz a/ 9.205 11.240 11,756 80.7 114 139 146 22.1 4.6 27.7
Lkuan-baay (Lieuan) 3.094 3.697 3.866 256.4 12 14 15 19.5 4.6 25.0
Luba aJ 4.911 5,563 5.559 148.3 33 38 37 13.3 -0.1 13.2
Malibc:ong 3.108 3,494 3,870 283.2 II 12 14 12.4 10.8 24,5
Manabo aJ 6.590 7.797 8.633 111.0 59 70 78 18.3 10.7 31.0
Penarrubia 4.096 4.893 5.048 38.3 107\ 128 132 19.5 3.2 23.2
Pidigan aJ 7.162 8.807 9,098 49.2 146 •.. 179 185 23.0 3.3 27.0
Pilar aJ 7.518 8.451 9,183 66.1 114 128 139 12.4 8.7 22.1
Sal-Iapadan 4.274 4.941 5,303 106.5 40 46 50 15.6 7.3 24.1
San Isidro aJ 3.087 3.744 3,842 48.1 64 78 80 21.3 2.6 24.5
San Juan aJ 7,233 8.445 8,461 64.1 III 132 132 16.8 0.2 17.0
San Quintin aJ 3.574 4,293 4,999 66.6 54 64 75 20.1 16.4 39.9
Tayum 9.621 11.045 12,346 42.7 225 259 289 14.8 11.8 28.3
Tineg 2,988 3,068 4,312 22.6 132 136 191 2.7 40.5 44.3
Tubo 4.985 4,589 4,344 72.2 69 64 60 .7.9 -5.3 -12.9
Villavkiosa al 3.933 4.612 4.634 89.8 44 51 52 17.3 0.5 17.8
BE\'GUET 296.646 411.331 478.787 2,005 148 205 239 38.7 16.4 61.4
Alok 14,466 13,853 14,862 215.0 67 64 69 -4.2 7.3 2.7
Baguio City aJ 119.009 183,142 226,883 57.5 2,070 3,185 3,946 53.9 23.9 90.6
Bakun al 8.878 10.817 12,836 286.9 31 38 45 21.8 18.7 44.6
(/JYNational Statistics Office
5 Population. Land Area and Density
TABLE 2. rOPULATION, LAND AREA AND POPULATION DENSITY OF THE PHILIPPrNES BY REGION, PROVINCE, CITY/MUNICIPALITY:1980.1990 AND 1995
ESTIMATEDREGION. PROVINCE. POPULATION LAND AREA POPULATION DENSITY PERCENT CHANGE IN DENSITYCITY/MUNICIPALITY 1980 1990 1995 (SQ. KM.) 1980 1990 1995 1980 - 1990 1990 - 1995 1980 - 1995
(I) (2) (3) (4) (5) (I (6) g/ (7) hi (8) II (9) jl (10) kl
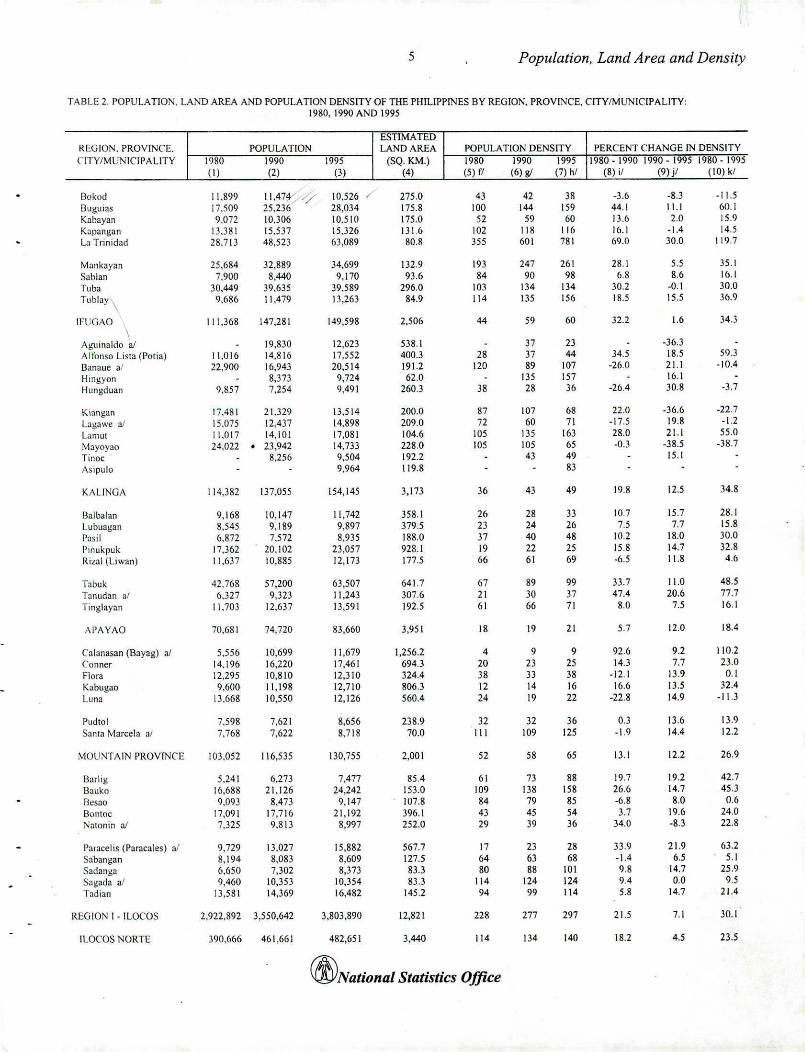
Bokod 11.899 11,47.;':/' 10.526 / 275.0 43 42 38 -].6 -8.3 -11.5Buguias 17.509 25.236 28,0)4 175.8 100 144 159 44.1 11.1 6n.1Kahayan 9,072 10.306 10.510 175.0 52 59 60 13.6 2.0 15.9Kapangan 13.381 15.537 15.326 131.6 102 118 116 16.1 .1.4 14.5L:I Trinidad 28,713 48,523 63,089 80.8 355 601 781 69.0 30.0 119.7
Munkayan 25.684 32.889 34,699 132,9 193 247 261 28.1 5.5 35.1Sablan 7,900 8,440 9,170 93,6 84 90 98 6,8 8.6 16.1Tuba 30,449 39.635 39.589 296.0 103 134 134 30.2 -0.1 30.0
Tublay\ 9,686 11.479 13,263 84.9 114 135 156 18.5 15.5 36.9
IFUGAO 111.368 147.281 149,598 2,506 44 59 60 32.2 1.6 34.3\,
-36,3Aguinaldo aJ 19,830 12,623 538.1 37 23Allonso Lis!a (POIia) 11.016 14.816 17.552 400.3 28 37 44 34.5 18.5 59.3Banaue a! 22.900 16.943 20,514 191.2 120 89 107 -26.0 21.1 -10.4Hingyon 8.373 9,724 62.0 135 157 16,1Hungduan 9.857 7.254 9.491 2603 38 28 36 -26.4 30.8 -J.7
Kiangan 17.481 21.329 13.514 200.0 87 107 68 22.0 -36.6 -22.7La~awe aJ 15.Q75 12.4]7 14.898 209.0 72 60 71 .17,5 19.8 -1.2Lamut 11.017 14.101 17,081 104.6 105 135 163 28.0 21.1 55,0
:'-1ayoyao 24.022 23.942 14.733 228.0 105 105 65 .0.3 -38.5 -38.7Tinoc 8.256 9.504 192.2 43 49 15.1Asipulo 9.964 119.8 83
KALINGA 114.382 137,055 154,145 3.173 36 43 49 19,8 12,5 34.8
Balbalan 9.168 10.147 11,742 358.1 26 28 33 10.7 15.7 28.1lubuagan 8.545 9,189 9,897 379.5 23 24 26 7.5 7.7 15.8Pasil 6.872 7.572 8.935 188.0 37 40 48 10.2 18.0 30.0I'mukpuk 17.362 20.102 23,057 928.1 19 22 25 15.8 14.7 32.8Rizal (Uwan) 11,6]7 10,885 12,173 177.5 66 61 69 .6.5 11.8 4.6
Tabuk 42.768 57,200 63.507 641.7 67 89 99 33.7 11.0 48.5Tanudan al 6.327 9,323 11.243 307.6 21 30 37 47.4 20,6 77.7Tinglayan 11.703 12.637 13.591 192.5 61 66 71 8,0 7.5 16.1
APAYAO 70,681 74.720 83.660 3,951 18 19 21 5.7 12.0 18.4
Cnlanas:m (Bayag) aJ 5,556 10.699 11,679 1.256.2 4 9 9 92.6 9.2 110.2Conner 14.196 16,220 17.461 694.3 20 23 25 14.3 7.7 23,0Flora 12.295 10.810 12.310 324.4 38 33 38 -12.1 13.9 0.1Kabugao 9,600 11,198 12,710 806.3 12 14 16 16.6 13.5 32.4Luna 13.668 10.550 12,126 560.4 24 19 22 -22.8 14.9 -11.3
Pudtol 7.598 7.621 8.656 238.9 32 32 36 0.3 13.6 13.9Santa Marcela a/ 7.768 7,622 8.718 70.0 III 109 125 -1.9 14,4 12.2
MOU>lTAIN PROVINCE 103.052 116,535 130,755 2,001 52 58 65 13.1 12.2 26,9
Barlig 5.241 6.273 7.477 85.4 61 73 88 19.7 19.2 42.7Bauko 16.688 21.126 24,242 153.0 109 138 158 26.6 14.7 45.3Besao 9.09] 8,473 9.147 107.8 84 79 85 -6.8 8.0 0,6Bonloc 17,091 17.716 21.192 396.1 43 45 54 3,7 19.6 24.0:"atonin aJ 7.325 9.813 8,997 252.0 29 39 36 34.0 .8.3 22.8
Paracelis (Paracales) aJ 9.729 13,027 15.882 567,7 17 23 28 33.9 21.9 63.2Sabangan 8.194 8,083 8.609 127.5 64 63 68 -1.4 6.5 5.1Sadanga 6.650 7,302 8,373 83.3 80 88 101 9.8 14,7 25.9Sagada at 9.460 10,353 10,354 83.3 114 124 124 9.4 0.0 9,5Tadian 13.581 14.369 16.482 145.2 94 99 114 5.8 14.7 21.4
REGIO" I - ILOCOS 2.922.892 3,550.642 3.803,890 12,821 228 277 297 21.5 7.1 30.1
ILOCOS NORTE 390.666 461,661 482,651 3,440 114 134 140 18.2 4.5 23.5
(jfyNational Statistics Office
6 Population, Land Area and Density
TABLE 2. POPULATION, LAND AREA AND POPl,'LA TJO~DENSITY OF THE PHILIPPINES BY REGIO)\;, PROVINCE. CITY/MUNICIPALITY:1980,1990 AND 1995
ESTIMATEDREGIOl'\. PROVINCE. POPULATlO~ LAND AREA POPULATION DENSITY PERCENT CHANGE IN DENSITYCITY/MUNIC[PALITY 1980 1990 1995 (SQ.KM.) 1980 1990 1995 1980-19901990.19951980.1995
(I) (2) (3) (4) (5) il (6) g/ (7) hi (8) it (9) jl (10) kl
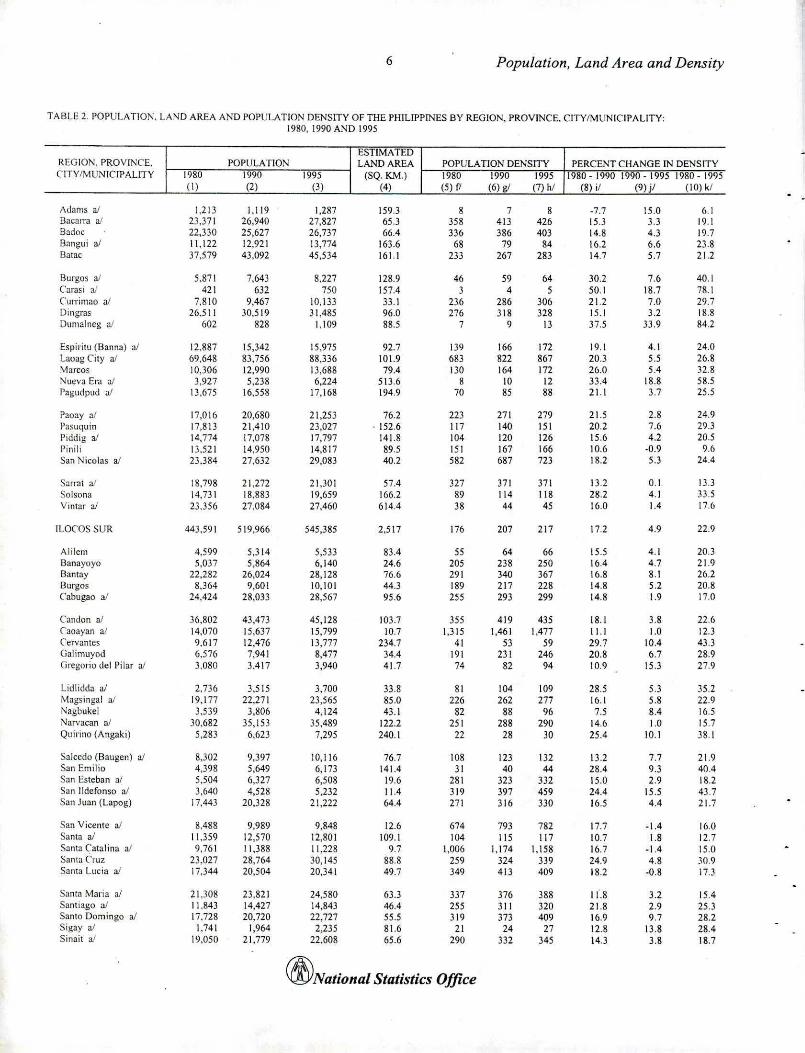
Adams aJ 1.213 1.119 1.287 159.3 8 7 8 -7.7 15.0 6.1Ilac,m;l aJ 23.371 26.940 27,827 65.3 358 413 426 15.3 3.3 19.1Badoc 22,330 25,627 26,737 66.4 336 386 403 14.8 4.3 19.7Bangui al 11,122 12,921 13,774 163.6 68 79 84 16.2 6.6 23.8Batac 37.579 43.092 45,534 J61.l 233 267 283 14.7 5.7 21.2
Burgos aJ 5.871 7,643 8,227 128.9 46 59 64 30.2 7.6 40.1Carasi a! 421 632 750 157.4 3 4 5 501 18.7 78.1CUlTimao aJ 7.810 9,467 10,133 33.1 236 286 306 21.2 7.0 29.7Dingras 26,511 30,5 19 31,485 96.0 276 318 328 15.1 3.2 18.8Dumalneg aJ 602 828 1,109 88.5 7 9 13 37.5 33.9 84.2
Espiritu (Sanna) aJ 12.887 15,342 15,975 92.7 139 166 172 19.1 4.1 24.0Laoag City aJ 69,648 83,756 88,336 101.9 683 822 867 20.3 5.5 26.8\1arcos 10.306 12,990 13,688 79.4 130 164 172 26.0 5.4 32.8Ntlt:va Era aJ 3,927 5.238 6,224 5136 8 10 12 33.4 18.8 58.5Pagudpud al 13,675 16,558 17,168 194.9 70 85 88 21.1 3.7 25.5
Paoay at 17,016 20,680 21,253 76.2 223 271 279 21.5 2.8 24.9Pasuquin 17,813 21,410 23,027 . 152.6 117 140 151 202 7.6 29.3Piddig af 14,774 17,078 17.797 141.8 104 120 126 15.6 4.2 20,5Pinili 13,521 14,950 14,817 89.5 151 167 166 10.6 -0.9 9.6San Nicolas aJ 23.384 27,632 29,083 40.2 582 687 723 18.2 5.3 24.4
Sall1lt aJ 18,798 21,272 21,301 57.4 327 371 371 13.2 0.1 13.3Solsona 14,731 18,883 19,659 166.2 89 114 118 28.2 4.1 33.5Vintar aJ 23,356 27,084 27,460 614.4 38 44 45 16.0 1.4 17.6
ILOCOS SUR 443,591 519,966 545,385 2,517 176 207 217 17.2 4.9 22.9
AIiJem 4,599 5,314 5,533 83.4 55 64 66 15.5 4.1 20.3Banayoyo 5,037 5,864 6,140 24.6 205 238 250 16.4 4.7 21.9Banlay 22,282 26,024 28,128 76.6 291 340 367 16.8 8.1 26.2Burgos 8,364 9,601 10,101 443 189 217 228 14.8 5.2 20.8Cabugao al 24.424 28.033 28.567 95.6 255 293 299 14.8 1.9 17.0
Candon aJ 36,802 43,473 45,128 103.7 355 419 435 18.1 3.8 22.6Caoayan at 14,070 15.637 15,799 10.7 1,315 1,461 1,477 11.1 1.0 12.3Cervantes 9.617 12,476 13,777 234.7 41 53 59 29.7 IDA 433Galimuyod 6.576 7,941 8,477 34.4 191 231 246 20.8 6.7 28.9Oregorio del Pilar aJ 3,080 3,417 3,940 41.7 74 82 94 10.9 15.3 27.9
Lid!idd<l aJ 2,736 3.515 3,700 33.8 81 104 109 28.5 5.3 35.2Magsingal aJ [9,177 22,271 23,565 85.0 226 262 277 16.[ 5.8 22.9Nagbukel 3,539 3,806 4,124 43.1 82 88 96 7.5 8.4 16.5Narvacan al 30.682 35,153 35,489 122.2 251 288 290 14.6 1.0 15.7Quirino (Angaki) 5,283 6.623 7.295 240.1 22 28 30 25.4 10.1 38.1
Salcedo (Baugen) a' 8,302 9,397 10,116 76.7 108 123 132 13.2 7.7 21.9San Emilio 4,398 5,649 6,173 141.4 31 40 44 28.4 9.3 40.4San Esteban at 5,504 6,327 6,508 19.6 281 323 332 15.0 2.9 18.2San IJdefonso aJ 3,640 4,528 5,232 11.4 319 397 459 24.4 15.5 43.7San Juan (Lapog) 17,443 20,328 21.222 64.4 271 316 330 16.5 4.4 21.7
San Vicente aJ 8.488 9,989 9,848 12.6 674 793 782 17.7 .1.4 16.0Sanla aJ 11,359 12,570 12,801 109.1 104 115 117 10.7 1.8 12.7Santa Catalina aJ 9,761 11,388 11,228 9.7 1,006 1,174 1,158 16.7 -1.4 15.0Sanla Cruz 23.027 28,764 30,145 88.8 259 324 339 24.9 4.8 30.9Santa Lucia al 17,344 20,504 20,341 49.7 349 413 409 18.2 -0.8 17J
Santa Maria at 21,308 23,821 24,580 63.3 337 376 388 11.8 3.2 [5.4Santiago aJ 11,843 14,427 14,843 46.4 255 311 320 21.8 2.9 25.3Santo Domingo aJ 17,728 20.720 22,727 55.5 319 373 409 16.9 9.7 28.2Sigay a! 1,741 1,964 2,235 81.6 21 24 27 12.8 13.8 28.4Sinait a' 19,050 21,779 22,608 65.6 290 332 345 14.3 3.8 18.7
(/J;;Nationat Statistics Office
7 Population, Land Area and Density
TABLE 2. POPULATION, LAND AREA AND POPULATION DENSITY OF THE PHILIPPINES BY REGION. PROVNCE. CITY/MUNICIPALITY:1980, 1990 AND 1995
ESTIMATEDREGIO:-J. PROVINCE. POPULATION lAND AREA POPULATION DENSITY PERCEKT CHANGE IN DENSITYCITY/MUNICIPALITY 1980 1990 1995 (SQ. Ie".) 1980 1990 1995 1980 - 1990 1990 - 1995 1980 - 1995
(I) (2) (3) (4) (5) fl (6) gI (7) hi (8) if (9) jt (10) kl
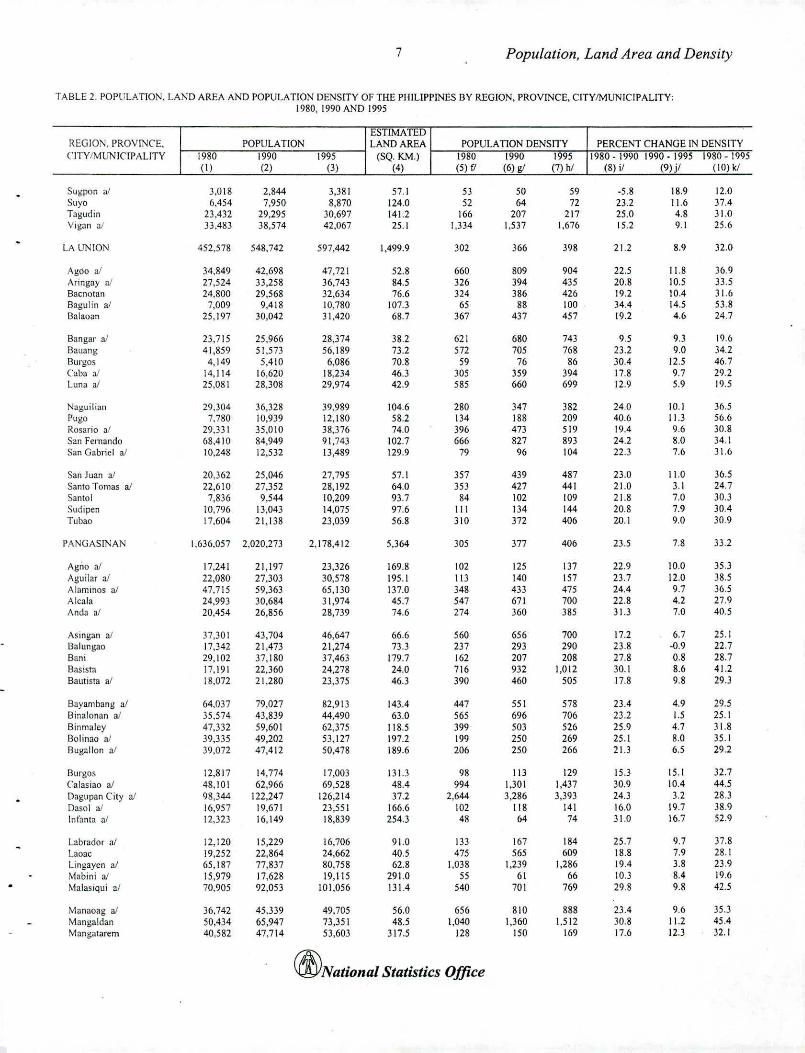
Sugpon aJ 3,018 2,844 3.381 57.1 53 50 59 -5.8 18.9 12.0Suyo 6,454 7.950 8.870 124.0 52 64 72 23.2 11.6 37.4Tagudin 23,432 29,295 30.697 (41.2 166 207 217 25.0 4.8 J 1.0Vigan aJ 33,483 38.574 42,067 25.1 1.334 1.537 1.676 15.2 91 25.6
LA lJ1'\ION 452.578 548.742 597,442 1,499.9 302 366 398 21.2 8.9 32.0
Agoo at 34,849 42,698 47,721 52.8 660 809 904 22.5 11.8 36.9Aringny aJ 27.524 33.258 36.743 84.5 326 394 435 20.8 10.5 33.5Baenalan 24,800 29.568 32,634 76.6 324 386 426 19.2 10.4 31.6Bagulin al 7,009 9,418 10,780 107.3 65 88 100 34.4 14.5 53.8BaJaoan 25,197 )0,042 31,420 68,7 367 437 457 19.2 4.6 24.7
Bangar aJ 23.715 25.966 28.374 38.2 621 680 743 9.5 9.3 19.6Bauang 41,859 51.573 56.189 73.2 572 705 768 23.2 9.0 34.2Burgos 4,149 5,410 6.086 70.8 59 76 86 30,4 12.5 46.7Caha a! 14,114 16.620 18,234 46.3 305 359 394 17.8 9.7 292Luna al 25.081 28.308 29,974 42.9 585 660 699 12.9 5.9 19.5
Naguilian 29,304 36,328 39,989 104.6 280 347 382 24,0 10.1 36.5Pugo 7.780 10,939 12,180 58.2 134 188 209 40.6 11.3 56.6Rosario a' 29.33 I 35.010 38,376 74.0 396 473 519 19.4 9.6 30.8San Femando 68,410 84,949 91,743 102.7 666 827 893 24.2 8.0 34.1San Gabriel aJ 10,248 12,532 13,489 129.9 79 96 104 22.3 7.6 ]1.6
San Juan a' 20,]62 25.046 27,795 57.1 357 439 487 23.0 11.0 36.5Santo Tomas at 22.610 27,352 28,192 64.0 353 427 441 21.0 3.1 24.7Santo 1 7.836 9.544 10.209 93.7 84 102 109 21.8 7.0 30.3Sudipen 10.796 13,04] 14.075 97.6 III 134 144 20.8 7.9 30ATubao 17.604 21.138 23.039 56.8 310 372 406 20.1 9.0 309
PJ\NGASI1':AN 1.636,057 2.020,273 2,178,412 5.364 305 377 406 23.5 7.8 ]3.2
Agoo aI 17.241 21,197 23,326 169.8 102 125 137 22.9 10.0 35.3Aguilar aJ 22.080 27.303 30,578 195.1 113 140 157 23.7 12.0 38.5Alaminos aI 47,715 59.363 65,130 137.0 348 433 475 24.4 9.7 36.5Alcala 24.993 30.684 ]1,974 45.7 547 671 700 22.8 4.2 27.9Anda al 20,454 26,856 28.739 74.6 274 360 385 31.3 7.0 40.5
Asingan aJ 37.301 43,704 46,647 66.6 560 656 700 17.2 6.7 25.1Balungao 17,342 21,473 21,274 73.3 237 293 290 23.8 -0.9 22.7Bani 29,102 37.180 37,463 179.7 162 207 208 27.8 0.8 28.7Basista 17.191 22.360 24,278 24.0 716 932 1,012 30.1 8.6 41.28alllisla aJ 18,072 21.280 23.375 46.3 390 460 505 17.8 9.8 29.3
Bayambang al 64.037 79,027 82.913 143.4 447 551 578 23.4 4.9 29.5Binalonan aJ 35.574 43,839 44,490 63.0 565 696 706 23.2 1.5 25.1Binmaley 47.332 59.601 62.375 118.5 399 503 526 25.9 4.7 31.8Bolinao al 39.335 49,202 53.127 197.2 199 250 269 25.1 8.0 35.1Bugallon aI 39,072 47,412 50,478 189.6 206 250 266 21.3 6.5 29.2
Burgos 12.817 14,774 17.003 131.3 98 113 129 15.3 15.1 32.7Calasiao aJ 48.101 62.966 69.528 48.4 994 1.301 1.437 30.9 10.4 44.5Dagupan City aJ 98,344 122.247 126.214 37.2 2.644 3.286 3,39] 24.3 3.2 283Dasol a! 16.957 19.671 23.551 166.6 102 118 141 16.0 19.7 38.9Infanta al 12.323 16,149 18.839 254.3 48 64 74 31.0 16.7 52.9
Labmdor a/ 12.120 15,229 16,706 91.0 133 167 184 25.7 9.7 37.8laoae 19,252 22.864 24,662 40.5 475 565 609 18.8 7.9 28.1llngayen aI 65.187 77.837 80,758 62.8 1,038 1,239 1.286 19.4 3.8 23.9Mabini aJ 15.979 17.628 19.115 291.0 55 61 66 10.3 8,4 19.6Malasiqui al 70.905 92.053 101.056 131.4 540 701 769 29.8 9.8 42.5
Manaoag aI 36.742 45.339 49.705 56.0 656 810 888 23.4 9.6 35.3Mangaldan 50,434 65,947 73.351 48.5 1,040 1.360 1.512 30.8 11.2 45.4Mangatarem 40,582 47.714 53.603 317.5 128 150 169 17.6 12.3 32.1
(/fYNational Statistics Office
8 Population, Land Area and Density
TABLE 2. POPULATIOS, LAND AREA AND POPULATION DENSITY OF THE PHILIPPINES BY REGION, PROVINCE, CITY/MUNICIPALITY:1980,1990 AND 1995
ESTIMATEDREGION. PROVINCE. POPULATION LAND AREA POPULATION DENSITY PERCENT CHANGE IN DENSITYC'\TY/\1UNrCIPALlTY 19RO 1990 1995 (SQ. KM.) 1980 1990 1995 1980 - 1990 1990. [995 1980 M 1995
(I) (2) (3) (4) (5) fI (6) 8' (7) hi (8) il (9) jl (IO) kJ
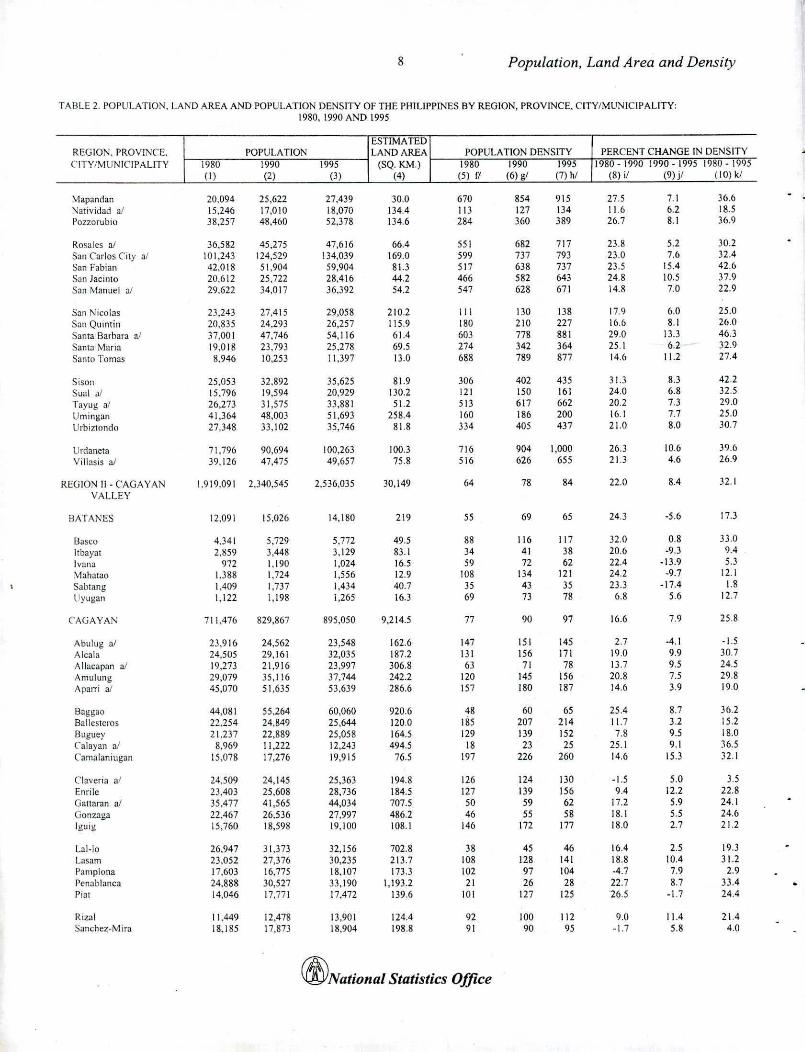
~lapandan 20,094 25.622 27.439 30.0 670 854 915 27.5 7.1 36.6~ati"idad a/ 15.246 17,010 18.070 134.4 113 127 134 11.6 6.2 18.5Pozzorubio 38.257 48.460 52.378 134.6 284 360 389 26.7 8.1 36.9
Rosales a/ 36.582 45,275 47,616 66.4 551 682 717 23.8 5.2 30.2Sail Carlos Cit)' aI 101.243 124,529 134,039 169.0 599 737 793 no 7.6 32.4San Fabian 42,018 51.904 59,904 81.3 517 638 737 23.5 15.4 42.6S<ln Jacinto 20,612 25,722 28.416 44.2 466 582 643 24.8 10.5 37.9S,ln Manuel al 29.622 34.017 36,392 54.2 547 628 671 14.8 7.0 22.9
San Nicolas 23,243 27,415 29,058 210.2 III 130 138 17.9 6.0 25.0San Quintin 20.835 24,293 26,257 115.9 180 210 227 Ib.b 8.1 26.0Santa Barbara a! 37.001 47,746 54.116 61.4 603 778 881 29.0 J 3.3 46.3Santa ~lari:'l 19,018 23.793 25,278 69.5 274 342 364 25.1 6.2 - 32.9Santo Tomas 8,946 10,253 11.397 13.0 688 789 877 14.6 11.2 27.4
Sison 25,053 32,892 35,625 81.9 306 402 435 31.3 8.3 42.2Sual aJ 15,796 19,594 20,929 130.2 121 150 161 24.0 6.8 32.5Tayug aJ 26,273 31,575 33,881 51.2 513 617 662 20.2 7.3 29.0Umingan 41,364 4S,003 51,693 258.4 160 186 200 16.1 7.7 25.0Urbizlondo 27.348 33,102 35.746 81.8 334 405 437 21.0 8.0 30.7
Urdaneta 71,796 90,694 100,263 100.3 716 904 1,000 26.3 10.6 39.6Villasis aJ 39,126 47.475 49,657 75.8 516 626 655 21.3 4.6 26.9
REGION II - ('AGA VAN 1.919.091 2,340.545 2,536,035 30,149 64 78 84 22.0 8.4 32.1VALLEY
HATANES 12,091 15,026 14,180 219 55 69 65 24.3 -5.6 17.3
Basco 4,341 5,729 5,772 49.5 88 116 117 32.0 0.8 33.0ltbayat 2,S59 3.448 3.129 83.1 34 41 38 20.6 -9.3 9.4Ivana 972 1.190 1.024 16.5 59 72 62 22.4 -13.9 5.3\1ahatao 1.388 1,724 1,556 12.9 108 134 121 24.2 .9.7 12.1Sabtang 1.409 1,737 1,434 40.7 35 43 35 23.3 -17.4 1.8llyugan 1,122 1,198 1,265 16.J 69 73 78 6.8 5.6 12.7
('AGAYAl': 711,476 829,867 l:\95,050 9,214.5 77 90 97 16.6 7.9 25.8
Abulug a! 23,916 24.562 23.548 162.6 147 151 145 2.7 ,4.1 -1.5Alcala 24,505 29,161 32.035 187.2 131 156 171 19.0 9.9 30.7Altaeapan 201 \9,273 21.916 23,997 306.8 63 71 78 13.7 9.5 24.5Amulung 29.079 35,116 37,744 242.2 120 145 156 20.8 7.5 29.8Aparri aJ 45,070 51,635 53,639 286.6 157 180 187 14.6 3.9 19.0
Baggao 44,081 55,264 60.060 920.6 48 60 65 25.4 8.7 36.2Ballesteros 22.254 24.849 25.644 120.0 IS5 207 214 11.7 3.2 15.2Buguey 21.237 22,889 25,058 164.5 129 139 152 7.8 9.5 18.0Calayan a! 8.969 11,222 12,243 494.5 18 23 25 25.1 9.1 36.5Camalaniugan 15-078 17,276 19,915 76.5 197 226 260 14.6 15.3 32.1
Claveria aJ 24.509 24.145 25.363 194.8 126 124 130 -1.5 5.0 3.5Emile 23.403 25,608 28.736 184.5 127 139 156 9.4 12.2 22.8Galtaran al 35,477 41,565 44,034 707.5 50 59 62 17.2 5.9 24.1Gonzaga 22,467 26.536 27,997 486.2 46 55 58 18.1 5.5 24.6Iguig 15.760 18,598 19,100 108.1 146 172 177 18.0 2.7 21.2
1.al-Io 26,947 31.373 32.156 702.8 38 45 46 16.4 2.5 19.3Lasam 23.052 27.376 30.235 213.7 108 128 141 18.8 10.4 31.2P,mlp!ona 17.603 16,775 18,107 173.3 102 97 104 .4.7 7.9 2.9Pcnablanca 24.888 30,527 33,190 1.]93.2 21 26 28 22.7 8.7 33.4Pial 14,046 17,771 17,472 139.6 101 127 125 '26.5 -1.7 24.4
Rizal 11,449 12.478 13,901 124.4 92 100 112 9.0 11.4 21.4S<Jnchez-Mira IS,185 17.873 18,904 198.8 91 90 95 -1.7 5.8 4.0
(j!JyNational Statistics Office
9 Population. Land Area and Density
TABLE 2. POPULATION, lASD AREA AND POPULA T10;-'; DENSITY OF THE PHILlPPI~ES BY REGION. PROVn,CE. CITYIMUNICIPALlTY:1980, 1990 A,'1D 1995
ESTIMATEDREGION. PROVINCE. POPULATION LAND AREA POPULATION DENSITY PERCENT CHANGE IN DENSITYCITY/MUNICIPALITY 1980 1990 1995 (SQ. Ie".) 1980 1990 1995 1980 - 1990 1990. 1995 1980 1995
(I) (2) (3) (4) (5) (I (6) g/ (7) hi (8) ;/ (9) jl (10) kl
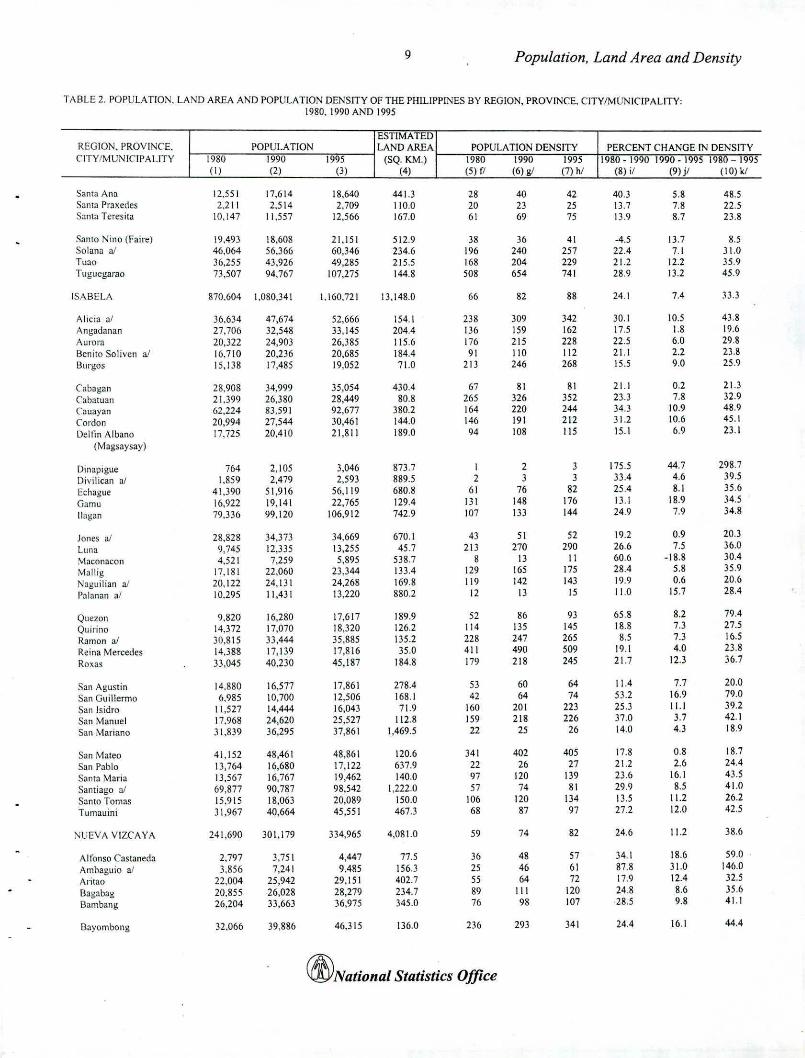
Santa An:) 12,551 17,614 18.640 441.3 28 40 42 40.3 5.8 48.5Santa Praxeties 2,211 2.514 2,709 110.0 20 23 25 13.7 7.8 22.5Santa Teresita 10.147 11.557 12.566 167.0 61 69 75 13.9 8.7 23.8
Santo Nino (Faire) 19.493 18.608 21.151 512.9 38 36 41 -4.5 13.7 8.5Solana a/ 46,064 56,366 60,346 234.6 196 240 257 22.4 7.1 JI.OTuao 36,255 43.926 49,285 215.5 168 204 229 21.2 12.2 35.9Tuguc!,!:arao 73,507 94,767 107,275 144.8 508 654 741 28.9 13.2 45.9
ISABELA 870.604 1,080,341 1,160,721 13.148.0 66 82 88 24.1 7.4 3.U
Alicia n/ 36,634 47.674 52,666 154.1 238 309 342 30.1 10.5 43.8Angadanan 27,706 32.548 33,145 204.4 136 159 162 17.5 1.8 19.6Aurora 20,322 24,903 26,385 115.6 176 215 228 22.5 6.0 29.8Benito So liven at 16,710 20,236 20,685 184.4 91 110 112 21.1 2.2 23.8Burgos 15,138 /7,485 19,052 71.0 213 246 268 15.5 9.0 25.9
Cabagan 28.908 34,999 35,054 430.4 67 81 81 21.1 0.2 21.3C'abatuan 21.399 26,380 28,449 80.8 265 326 352 23.3 7.8 32.9
Cauayan 62.224 83.591 92,677 380.2 164 220 244 ]4.3 10.9 48.9
Cordon 20,994 27,544 30,461 144.0 146 191 212 31.2 10.6 45.1
Dellin Albano 17,725 20,410 21,811 189.0 94 108 115 15.1 6.9 23.1
(Magsaysay)
Dinapigue 764 2,105 3,046 873.7 I 2 3 175.5 44.7 298.7
Divilican al 1,859 2,479 2,593 889.5 2 3 3 33.4 4.6 39.5
Echague 41,390 51,916 56,119 680.8 61 76 82 25.4 8.1 35.6
Garnu 16,922 19,141 22,765 129.4 131 148 176 13.1 18.9 34.5
llagan 79,336 99.120 106,912 742.9 107 133 144 24.9 7.9 34.8
Jones aJ 28,828 34,373 34.669 670.1 43 51 52 19.2 0.9 20.3
Luna 9,745 12,335 13,255 45.7 213 270 290 26.6 7.5 36.0
;vt•.conacon 4,521 7,259 5,895 538.7 8 13 11 60.6 -18.8 30.4
Mallig 17.181 22,060 23,344 133.4 129 165 175 28.4 5.8 35.9
Naguilian aJ 20.122 24,131 24.268 169.8 119 142 143 19.9 0.6 20.6
Palan•.n al 10.295 11,431 13,220 880.2 12 13 15 1l.0 15.7 28.4
Quezon <J.M20 16,280 17,617 189.9 52 86 93 65.8 8.2 79.4
Quirioo 14.372 17,070 18,320 126.2 114 135 145 18.8 7.3 27.5
RJmon aJ 30,815 33,444 35,885 135.2 228 247 265 8.5 7.3 16.5
Reina Mercedes 14,388 17,139 17.816 35.0 411 490 509 19.1 4.0 23.8
Ro:\as 33,045 40,230 45,187 184.8 179 218 245 21.7 12.3 36.7
San Agustin 14.880 16,577 /7,861 278.4 53 60 64 11.4 7.7 20.0
San Guillermo 6.985 10,700 12,506 168.1 42 64 74 53.2 16.9 79.0
San Isidro 11.527 14,444 16,043 71,9 160 201 223 25.3 ILl 39.2
San Manuel 17.968 24,620 25,527 112.8 159 218 226 37.0 3.7 42.1
San Mariano 31,839 36,295 37,861 1,469.5 22 25 26 14.0 4.3 18.9
San ~faleo 41,152 48,461 48,861 120.6 341 402 405 17.8 0.8 18.7
San Pablo 13,764 16,680 17,122 637.9 22 26 27 21.2 2.6 24.4
Sanla Maria 13,567 16,767 19,462 140.0 97 120 139 23.6 16.1 43.5
Santiago nI 69,877 90,787 98,542 1,222.0 57 74 81 29.9 8.5 41,0
Santo Tomas 15,915 18,063 20.089 150.0 106 120 134 13.5 11.2 26.2
Tumauini 31,967 40,664 45,551 467.3 68 87 97 27.2 12.0 42.5
:-':UEVA VIZC'AVA 241,690 301,179 334,965 4,081.0 59 74 82 24.6 11.2 38.6
Alfonso Castaneda 2,797 3,751 4,447 71.5 36 48 57 34.1 18.6 590
Arnbaguio al 3,856 7,241 9,485 156.3 25 46 61 87.8 31.0 146.0
Arilao 22,004 25,942 29,151 402.7 55 64 72 17.9 12.4 32.5
Bagabag 20,855 26,028 28,279 234.7 89 III 120 24.8 8.6 35.6
Bambang 26,204 33,663 36,975 345.0 76 98 107 28.5 9.8 4Ll
Bayomhong 32.066 39,886 46.315 136.0 236 293 341 24.4 16.1 44.4
(/JYNational Statistics Office

10 Population. Land Area and Density
TABLE 2. POPL'LATIOl'\, LAND AREA AND POPULA nON DE!,\sny OF THE PHILIPPINES BY REGION, PRovIKCE, CITY/MUNICIPALlTY:1980,1990 AND 1995
ESTI~ATEDREGIO!'i. PROVINCE. POPULATIO:S LAND AREA POPULATION DENSITY PERCENT CHANGE IN DENSITY
CITYfMUNIC'lPALlTY 1980 1990 1995 (SQ. KM.) 1980 1990 1995 1980 _ 1990 1990.1995 1980.1(1)5
(I) (2) (3) (4) (5) (I (6) gI (7) hi (8) II (9) jl (10) kl
Diadi 8.605 11.351 12,469 181.2 47 63 69 31.9 9.8 44.9
Oupax del i'\orte 16.743 20,904 22,142 )47.3 48 60 64 24.9 5.9 )2.2Dupax del Sur 9,632 12.297 13,900 590.0 16 21 24 27.7 1).0 44.]
Kasibu 15,029 21.425 26.252 )18.8 47 67 82 42.6 22.5 74.7
Kayapa 20.491 18.685 19.)76 482.9 42 )9 40 .8.8 3.7 -5.4
Quezon 9,716 12.206 13.944 187.5 52 65 74 25.6 14.2 4).5
Santa Fe al 6.338 9.960 11.854 )99.8 16 25 )0 57.1 19.0 87.0
Solano 36,710 44,246 46.945 139.8 26) 316 336 20.5 6.1 27.9Villa Verde 10.644 13,594 13,431 81.5 131 167 165 27.7 .1.2 26.2
QUIRING 83.230 114,132 131,119 3,486.2 24 33 38 37.1 14.9 57.5
Aglipay 12.335 16,427 20.205 300.2 41 55 67 33.2 23.0 63.8
Cabarroguis 17.450 21.793 22,812 260.2 67 84 88 24.9 4.7 30.7
Diffun 23.086 31.266 36,048 352.8 65 89 102 35.4 15.3 56./
Maddela 23,686 25.268 28.645 918.6 26 28 31 6.7 13.4 20.9
\!agtipunan 9.460 12.509 1,588.9 6 8 32.2S;}guday 6.673 9.918 10,900 65.5 102 151 166 48.6 9.9 6] ..3
REGION III • CENTRAL 4.802,793 6,199,017 6,932,570 16,351.9 294 379 424 29.1 11.8 44.3
LUZON
BATAAN 323.254 425,803 491,459 788.0 410 540 624 31.7 15.4 52.0
Abucay aJ 22.692 26.708 29.270 79.7 285 335 367 17.7 9.6 29.0
ll"gac aJ 13,109 18.241 20.906 56.6 232 322 369 39.1 14.6 59.5Balanga at 39.132 51.512 60.912 78.5 498 656 776 31.6 18.2 55.7DinaJupian 41,415 58.172 65.159 92.5 448 629 704 40.5 12.0 57.3Helmosa at 25,672 34.633 ]8,764 136.4 188 254 284 34.9 11.9 51.0
Limay aJ 24,281 32,629 40.092 5.1 4,761 6,398 7,861 ]4.4 22.9 65.1
Mariveles al 48.594 60.761 76.626 47.2 1.030 1.287 1.623 25.0 26.1 57.7Morong al 10.637 17.155 18.731 108.6 98 158 172 61.3 9.2 76.1Orani aJ )).083 43,494 48.695 59.0 561 737 825 31.5 12.0 47.2Orion aJ 28.049 35.263 39537 54.2 518 651 729 25.7 12.1 41.0
Pilar al 18,549 25,244 28,207 34.9 531 723 808 36.1 11.7 52.1
Samal 18,041 21,991 24,560 35.3 511 623 696 21.9 11.7 36.1
BULACAN 1,096,046 1,505,219 1,784,441 1.822 602 826 979 37.3 18.6 62.8
Angat aJ 24,844 34,494 39.037 74.0 336 466 528 38.8 1).2 57.1Balagtas (Bigaa) a! 28,654 42,658 49,210 28.7 998 1.486 1.715 48.9 15.4 71.7Baliuag aI 70.555 89,719 103,054 45.1 1.564 1.989 2.285 27.2 14.9 46.1Bocaue a! 49,693 67,243 69,718 198.1 251 339 352 35.3 3.7 40.3I:lulacan 34,920 48,770 54.236 65.3 535 747 831 39.7 11.2 55.3
Bustos 25.739 34,965 41,372 70.0 368 500 591 35.8 18.3 60.7Calumpit 45,454 59.042 70.839 56.3 807 1,049 1.258 29.9 20.0 55.8Dona Remedios Trinidad 4,759 8.614 11,194 145.8 33 59 77 81.0 30.0 135.2Guiguinto 27.751 44.532 52.575 27.5 1.009 1.619 1,912 60.5 18.1 89.5Hagonoy aI 73,176 90.212 99,423 103.1 710 875 964 23.3 10.2 35.9
,"'blolos aJ 95,699 125,178 147,414 67.3 1,422 1,860 2.190 30.8 17.8 54.0Marilao 35.069 56.)61 68,761 33.7 1,04\ 1,672 2.040 60.7 22.0 96.1:-.1eycauayan at 83579 123.982 137.081 221 3,782 5.610 6.203 48.3 10.6 64,0Norzagaray 26.032 33.485 51.015 85.3 305 393 598 28.6 52.4 %.0Obando 39,618 46.346 51,488 52.1 760 890 988 17.0 11.1 30.0
Pandi 22.679 32.648 40,520 31.2 727 1.046 1.299 44.0 24.1 78.7Paombong aJ 26.267 32.052 33.149 46.3 567 692 716 220 3.4 26.2!'Iaridel 39,121 52,954 66.)55 41.0 954 1,292 1.618 35.4 25.3 69.6Pulilan aJ 38.110 48,199 59.682 39.9 955 1.208 1,496 26.5 23.8 56,6San IIdefonso aI 44.931 59,598 69,319 128.7 349 463 539 32.6 16.3 54.3
(fJ)National Statistics Office
11 Population, Land Area and Density
TABLE 2. POPULATIO~. LAND AREA AND POPULATION DENSITY OF THE PHILIPPINES BY REG lOS. PROVINCE. CITYIMUNIClPALlTY:1980, 1990 A:-:O 1995
ESTIMATEDREGION, PROVINCE. POPULATION LAND AREA POPULA nON DENSITY PERCENT CHANGE IN DENSITY
('lTV/MUNICIPALITY 1980 1990 1995 (SQ.KM.) 1980 1990 1995 1980 - 1990 1990 - 1995 1980.1995
(I) (2) (3) (4) (5) fJ (6) gI (7) hi (8) il (9) jl (10) kl
San Jose del Monte 90.732 142.047 201.394 104.5 868 1.359 1.927 56.6 41.8 122.0
San Miguel a! 73.113 91.124 108.147 217.6 336 419 497 24.6 18.7 47.9
San Rafael 36.803 49.528 58.387 152,4 241 325 383 34.6 17.9 58.6
5ta. M:lria 58.748 91.468 101,071 90.9 646 1.006 1.112 55.7 10.5 72.0
1\UEYA ECIJA 1.069,409 1,312.680 1,505.827 5,639.0 190 233 267 22.7 14.7 40.8
Ahaga 32,349 40,425 45,815 90.2 359 448 508 25.0 13.3 41.6
l3ongabon 32,451 39.616 44.856 287.0 113 1J8 156 22.1 13.2 38.2
Cabanaluan City al 138.298 173.065 201.033 282.8- 489 612 711 25.1 16.2 45.4
Cabiao aJ 37.922 48.850 55.902 111.8 339 437 500 28.8 14.4 47.4
C'arranglan ai 19.891 26,064 29.950 705.3 28 37 42 31.0 14.9 50.6
Cuyapo 3.1 39,654 43.103 49,791 215.7 184 200 231 8.7 15.5 25.6
Gabaldon (BituloklSabani) 17.169 21.744 25.750 242.9 71 90 106 2C>.C> 18.4 50.0
Gapan 60.014 70,489 77,735 164.4 365 429 473 17.5 10.3 29.5
Gen, Mamt:l1o Natividad 17.388 21.984 26.140 118.0 147 186 222 16.4 18.9 50.3
Gen. Tinio (Papaya) 23,406 29.491 32.913 494.9 47 60 67 26.0 11.6 40.6
Guimba 58.847 73,363 77,935 245.3 240 299 318 24.7 6.2 32.4
Jaen al 39.064 47.346 53,541 85.5 457 554 626 21.2 13.1 37.1
Laur al 17.729 21,464 25,143 295.9 60 73 85 21.1 17.1 41.8
Licab 14,543 17.202 21,555 67.4 216 255 320 18.3 25.3 48.2
Ltanel'a 18.652 23.285 28,127 114.4 163 204 246 24.8 20.8 50.8
Lupao 23.050 27.481 29,996 121.3 190 227 247 19.2 9.2 )0.1
Munoz a! 43.211 50.356 60,162 147.9 292 340 407 16.5 19.5 39.2
7\ampicuan 7.597 8,426 10.708 52.6 144 160 204 10.9 27.1 41.0
Palayan City 14.959 20.393 26.851 101,4- 148 201 265 36.3 31.7 79.5
Pantabangan 13.916 18,341 22.183 392.6 35 47 57 31.8 20.9 59,4
Pcnaranda 16.753 20.500 22.661 95.0 176 216 239 22.4 10.5 35.3
Quezon aJ 20.846 25,574 29.172 68.5 304 373 426 22.7 14.1 39.9
Rizal 31,407 38.970 45.834 120.6 260 323 380 24.1 17.6 45.9
San Antonio 42.969 51.815 56.130 159.2 270 325 353 20.6 8.3 306
San Isidro 28.550 34.349 36.283 56.5 505 608 642 20.3 5.6 27.1
San Jose City 64.254 82.836 96,860 186.0 \ 345 445 521 28.9 16.9 50.7
San Leonardo aJ 34.706 39,740 46,545 60.1 577 661 774 14.5 17.1 34.1
$!a. Rosa 32,424 40.439 47,522 174.0 186 232 273 24.7 17,5 4C>.6
510. Domingo aJ 29.013 35,864 40.992 74.9 387 479 547 23.6 14.3 41.3
Talavera a! 62.225 77,256 85.797 140.9 442 548 609 24.2 11.1 37.9
Talugtog 11,734 14.106 18.119 94.0 125 150 193 20.2 28.4 54.4
Zaragosa aJ 24,418 28.743 33,826 72.0 339 399 470 17.7 17.7 38.5
PAMPANGA 1.181,590 1,532.615 1.635,767 2.045 578 749 800 29.7 6.7 38.4
Angeles City aJ 188.834 236.686 234.011 60.3 3.132 3,925 3.881 25.3 -1.1 23.9
Apalit at 48.253 62.373 65,720 61.5 785 1,014 1,069 29.3 5.4 362
Arayat al 56.742 73,189 85,940 134,5 422 544 639 29.0 17.4 51.5
Bacolor aI 50,942 67.259 13,097 71.7 710 938 183 32.0 -80.5 .74.3
Candaba 52.945 68.145 77,546 176.4 300 386 440 28.7 13.8 46.5
Florida Blanca al 51.648 66.146 76,683 175.5 294 377 437 28.1 15.9 48.5
Guagua 72,609 88,290 95,363 31.2 2.327 2,830 3,057 21.6 8.0 31.3
- \Lubao aJ 77.502 99.705 109,667 155.8 497 640 704 28.6 10.0 41.5
Mabalac31 80.966 121.115 129.990 83.2 973 1,456 1.562 49.6 7.3 60.5
Macabebc al 45.830 55.505 59,469 105.2 436 528 565 21.1 7.1 29.8
,- Magalang aJ 34.840 43.940 52.607 97.3 358 452 541 26.1 19.7 51.0
Masantol at 35.350 41.964 45.326 48.3 732 869 938 18.7 8.0 28.2
Mexico aJ 53,491 69,546 91.696 117.4 456 592 781 30.0 31.8 71.4
\1inalin al 27,414 34,795 35,670 48.3 568 720 739 26.9 2.5 30.1
l)orne 50.906 68.215 75,408 314.0 162 217 240 )4,0 10.5 48.1
(ff;;NatiOllal Statistics Office
12 Population, Land Area and Density
TABLE 2. POPULATIO:\', LA!,\'D AREA AND POPULATION DENSITY OF THE PHILIPPINES BY REGION, PROVINCE. CITY/MUNICIPALITY:1980, 1990 AND 1995
ESTlM.ATEDREGION, PROVI1'\('E. POPULATION LAND AREA POPULATIOS' DENSITY PERCENT CHANGE IN DENSITYCITY/MUNICIPALITY 1980 1990 1995 (SQ. K.M.) 1980 1990 1995 1980 - 1990 1990.1995 1980.1995
(I) (2) (3) (4) (5) fl (6) g/ (7) hi (8) if (9) jI (10) kl
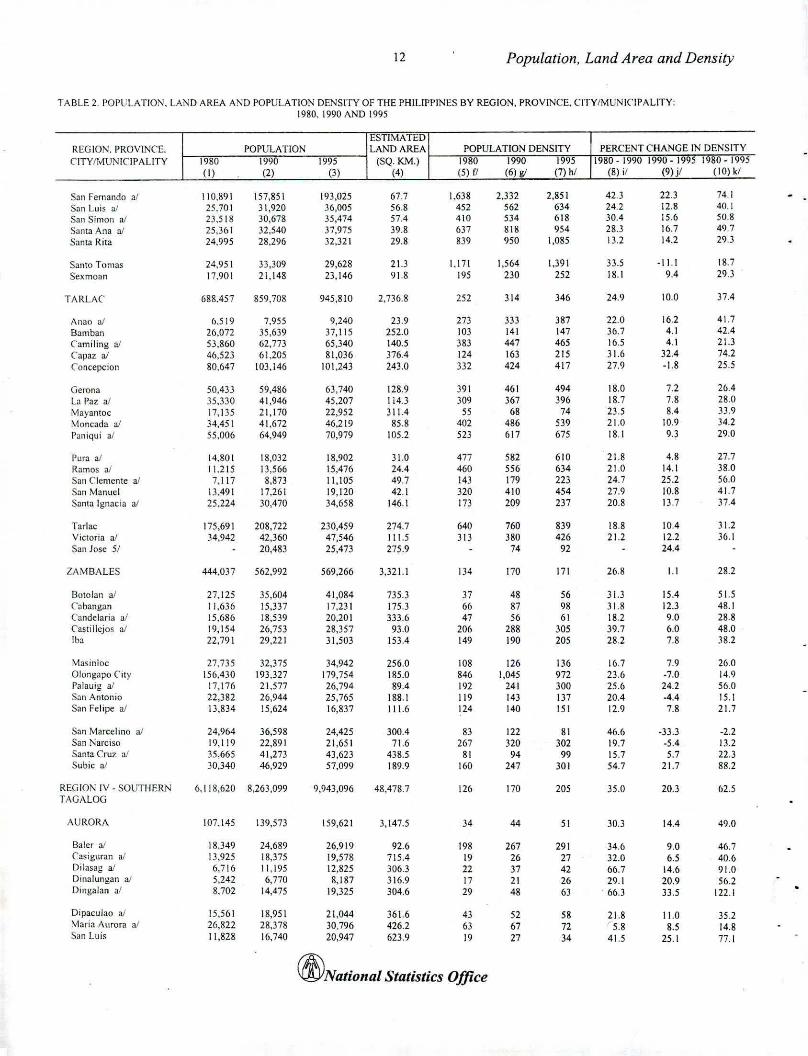
S3n Femando 31 110.891 157,851 193,025 67.7 1.638 2,332 2,851 42.3 22.3 74.1
San Luis a/ 25.701 31,920 ]6,005 56.8 452 562 634 24.2 12.8 40.1
S:m Simon aJ 2],518 ]0,678 35,474 57.4 410 534 618 30.4 15.6 50.8
Santa Ana aI 25,361 32,540 37,975 39.8 637 818 954 28.3 16.7 49.7
Santa Rita 24,995 28.296 32,321 29.8 839 950 1,085 13.2 14.2 29.3
Santo Tomas 24,951 33.309 29,628 21.3 1,171 1,564 1.391 33.5 -11.1 18.7Sexmoan 17.901 21.148 23,146 91.8 195 230 252 18.1 9.4 29.3
TARLA(' 688.457 859.708 945,810 2.736.8 252 314 346 24.9 10.0 37.4
Anao aJ 6,519 7,955 9,240 239 273 333 387 22.0 16.2 41.7
Bamban 26.072 35,639 37,115 252.0 103 141 147 36.7 4.1 42.4
Camiling aI 53,860 62,713 65,340 140.5 383 447 465 16.5 4.1 2\.3Capaz aJ 46.523 61.205 81,036 376.4 124 163 215 31.6 32.4 74.2Concepcion 80.647 103.146 101,243 243.0 332 424 417 27.9 -1.8 25.5
Gerona 50,433 59,486 63,740 128.9 391 461 494 18.0 7.2 26.4
La Paz at 35.330 41.946 45,207 114.3 309 367 396 18.7 7.8 28.0
Mayamoc 17,135 21.170 22,952 311.4 55 68 74 23.5 8.4 33.9Moncada aJ 34,451 41,672 46,219 85.8 402 486 539 21.0 10.9 34.2
Paniqui al 55.006 64.949 70,979 105.2 523 617 675 18.1 9.3 29.0
rum af 14.801 18,032 18,902 31.0 477 582 610 21.8 4.8 27.7Ramos at 11.215 13,566 15,476 24.4 460 556 634 21.0 14.1 38.0San Clemente at 7.117 8,873 11,105 49.7 143 179 223 24.7 25.2 56.0San Manuel 13.491 17.261 19,120 42.1 320 410 454 27.9 10.8 41.7Santa Ignacin al 25.224 30,470 34,658 146.1 173 209 237 20.8 13.7 37.4
Tarlac 175.691 208,722 230,459 274.7 640 760 839 18.8 104 31.2Victoria aJ 34.942 42,360 47,546 111.5 313 380 426 21.2 12.2 36.1San Jose 51 20,483 25,473 275.9 74 92 24.4
ZA:\1BALES 444.037 562,992 569.266 3.32\.1 1)4 170 171 26.8 1.1 28.2
Gutotan al 27.125 35,604 41.084 735.3 37 48 56 31.3 15.4 51.5Cahangan 11.636 15.337 17.231 175.3 66 87 98 3\.8 12.3 48.1Candelaria al 15.686 18,539 20.201 333.6 47 56 61 18.2 9.0 28.8('asri Ilejos ai 19.154 26,753 28.357 93.0 206 288 305 39.7 6.0 48.0Ih, 22.791 29,221 31,503 153.4 149 190 205 28.2 7.8 38.2
\-1asinloc 27.735 32.375 34,942 256.0 108 126 136 16.7 7.9 26.0Olongapo City 156.430 193.327 179.754 185.0 846 1,045 972 23.6 .7.0 14.9Palauig a! 17,176 21,577 26.794 89.4 192 241 300 25.6 24.2 56.0Snn Antonio 22,382 26,944 25,765 188.1 119 143 137 20.4 -4.4 15.153n Felipe aJ 13.834 15.624 16,837 111.6 124 140 151 12.9 7.8 21.7
San Marcchno aJ 24,964 36.598 24,425 300.4 83 122 81 46.6 -33.3 -2.2San Narciso 19,119 22,891 21.651 71.6 267 320 302 19.7 .5.4 13.2Santa Cruz a/ 35,665 41,273 43,623 438.5 81 94 99 15.7 5.7 22.3Subic aJ 30,340 46,929 57,099 189.9 160 247 301 54.7 21.7 88.2
REGION IV - SOlJTHER."J 6,118,620 8,263.099 9,943,096 48,478.7 126 170 205 35.0 20.3 62.5TAGALOG
AURORA 107,145 139,573 159,621 3,147.5 34 44 51 30.3 14,4 49.0
Baler af 18,349 24.689 26,919 92.6 198 267 291 34.6 9.0 46.7Casiguran al 13.925 18,375 19,578 715.4 19 26 27 32.0 6.5 40.6Oilasag aJ 6.716 11.195 12,825 306.3 22 37 42 66.7 14.6 91.0Oinalungan aI 5,242 6,770 8,187 316.9 17 21 26 29.1 20.9 56.2Dinga!an aJ 8.702 14,475 19,325 304.6 29 48 63 . 66.3 33.5 122.1
Dipaculao aJ 15,561 18,951 21,044 361.6 43 52 58 21.8 11.0 35.2\1aria Aurora al 26,822 28.378 30,796 426.2 63 67 72 ' 5.8 8.5 14.8San Luis 11,828 16,740 20,947 623.9 19 27 34 41.5 25.1 77.1
((fyNatio/lal Statistics Office

13 Population, Land Area and Density
L
TABLE 2. POPULATION. LAND AREA AND POPULATION DENSITY OF THE PHILlPPI!,ES BY REGION. PROVINCE. CITY/MtJNIC'IPALlTY:1980.1990 AND 1995
ESTIMATEDREGION. PROVI"'CE, POPULATION LAND AREA POPULATION DENSITY PERCENT CHANGE IN DENSITYCITY/MUNICIPALITY 1980 1990 1995 (SQ.KM.) 1980 1990 1995 1980 - 1990 1990 - 1995 1980.1995
(I) (2) () (4) (5) f/ (6) g/ (7) h/ (8) if (9) jI (10)'"
BATANGAS 1.174,201 1,476,783 1,658,567 ).195.6 )67 462 519 25.8 12.3 41.3
AgoncilJo al 16.143 20.227 2),)58 52.5 )07 )85 445 25.) 15.5 44.7
Alitagtag aJ 14,500 16,016 18,639 24.8 585 646 752 10.5 16.4 28.5Balayan al 43,486 5),870 62.244 108.7 400 496 57) 23.9 15.5 43.1
Balete 8.698 11.678 14.)8) 25.0 )48 467 575 34.3 2).2 . 65.4Batangas City ,/ 143,570 184.970 211,879 28).0 507 654 749 28.8 14.5 47.6
Bau:m nl 43.560 59,258 64,190 5).) 817 1,112 1,204 )6.0 8.) 47.4
Calaea 36.508 45,377 51,459 114.6 ) 19 )96 449 24.3 13.4 41.0Calatagan 27.578 )5,54) 40,707 112.0 246 )17 )6) 28.9 14.5 47.6
Cuenca ;11 17,109 20,176 22,758 58.2 294 347 391 17.9 12.8 33.0Ibaan al 25,875 31,220 34.757 69.0 )75 452 504 20.7 11.3 34.3
Laurel aJ 17,889 22,099 23,781 78.) 228 282 l04 23.5 7.6 .'2.9Lemery ) 42.783 5),932 58,073 109.8 )90 491 529 26.1 7.7 35.7
Linn 26,091 31.296 )6.000 76.8 )40 408 469 19.9 15.0 38.0
Lipn City 121.166 160,117 177,894 209.4 579 765 850 32.1 11.1 46.8
Lobo 24.))3 26,881 )1.849 189.) 129 142 168 10.5 18.5 3fl.9
Mabini al 2),6)7 30,474 33,499 44.5 5) I 685 75) 28.9 9.9 41.7
Malvar aJ 18,028 24,253 27,771 )).0 546 7)5 842 34.5 14.5 54.0
Mataasnakahoy 12,057 15,240 16,726 22.1 546 690 757 26.4 9.8 38.7Nasugbo al 59,405 75,515 83,874 278.5 21) 271 )01 27.1 11.1 41.2
Padre Garcia . 19.591 25,958 28.959 93.7 209 277 )09 )2.5 11.6 47.8
Ro~ario aJ 54,252 66.923 74,976 226.5 240 295 )) I 23.4 12.0 38_2
San Jose a! 28.74) )8.680 4).886 5).) 5)9 726 823 34.6 1).5 52.7
San Juan 59,345 67.741 71.913 273.4 217 248 26) 14.1 6.2 21.2
San Luis a/ 17.991 22,14) 26,423 42.6 422 520 620 2).1 19.) 46.9
San Nico[as al 10,5 II 13,174 [4.509 14.3 7)5 921 1,015 25.) 10.1 38.0
San Pa:-cua1 al 26,221 )4,629 40.849 50.7 517 68) 806 32.1 18.0 55.8
Santa Teresita a' 11,134 12,005 14,017 16.3 68) 7)7 860 7.8 16.8 25.9
Santo Tomas 43.010 58.209 65,759 95.4 451 610 689 )5.) 1).0 52.9
Taal al 29.699 34,925 )8,722 29.8 997 1,172 1.299 17.6 10.9 30.4Tallsay 19.447 2),15) 26,997 28.2 690 821 957 19.1 16.6 3t1.8
Tanauan aJ 74,020 92,754 10),868 107.2 690 865 969 25.) 12.0 4tl.3Taysal1 aI 19,370 22.508 26,504 93.6 207 240 28) 16.2 17.8 368Tingloy aJ 13.381 15,430 14.897 )).1 404 466 450 15.) .).5 11.)Tuy al 25.070 30,409 32,447 94.7 265 321 )4) 2].) 6.7 29.4
CAVITE 771.320 1.152,534 1.610,324 1,447.5 5)) 796 1.112 49.4 )9.7 108.8
Alfonso aJ 21,980 28,944 )4.61l 66.6 ))0 4)5 520 ) 1.7 19.6 57.5Amadeo aJ 16,234 21,022 22,728 )6.9 440 570 616 29.5 8.1 40.08ac(}(lr 90,364 159,685 250.821 22.0 4,107 7,258 11,401 76.7 57.1 177.6Carmona aJ 65,014 28,247 )5.686 40.2 1,617 70) 888 -56.6 26.) -45.1Cavite City 87,666 91.641 92.641 10.9 8,04) 8,407 8,499 45 1.1 5.7
Oasmarinas 51,894 136.556 262,406 90.1 576 1,516 2.912 163.1 92.2 405.7Gen. A[varez 65.977 86,824 9.4 7.019 9.2)7 31.6Gen. Emilio Aguinaldo al 9571 10,954 11.893 42.1 227 260 282 14.4 8.6 24.3Gen. Trias 39,745 52,888 66.837 81.5 488 649 820 )).1 26.4 68.2lmus aI 59.103 92,125 177,408 171.7 )44 5)7 1,0)) 55.9 92.6 200.2
Indang aJ 30,977 39,294 42.765 74.9 414 525 571 26.8 8.8 )8.1Kawit aI )9,)68 47,755 56,99) 22.9 1.719 2,085 2,489 2].) 19.) 44.8Magallanes aI 9.691 12.556 17,115 7).1 I)) 172 2)4 29.6 )6.) 76.6~aragondon al 18.018 22.814 25,828 92.1 196 248 280 26.6 1).2 43.3Mendez.Nunez aJ 15.044 17,652 20,321 43.3 )47 408 469 17.3 15.1 35. [
Naic ai 38.243 51.629 58.046 76.2 502 678 762 )5.0 12.4 51.8Noveleta aJ 14,460 20.409 27.)06 16.4 882 1,244 1.665 41.1 )).8 88.8
eIYNational Statistics Office
14 Population, Land Area and Density
REGION, PROVINCE, POPULATION POPULA nON DENSITY PERCENT CHANGE IN DENSITY
CITY IMUNI('IP ALlTY !980 1990 1995 1980 1990 1995 1980 ~ 1990 1990 - 1995 1980.1995
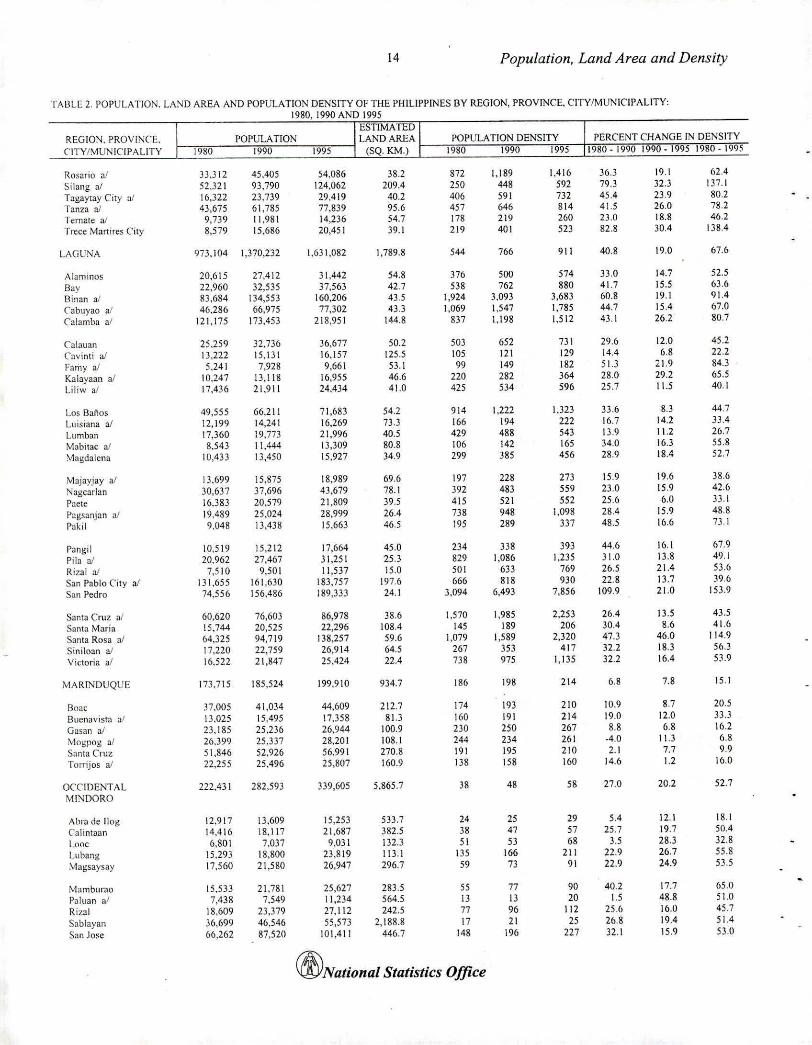
Rosario al 33.J 12 45,405 54,086 38.2 872 1.189 1,416 36.3 19.1 62,4
Silang aJ 52.321 93,790 124,062 209.4 250 448 592 79.3 32.3 137.1Tagaytay City aJ 16,322 23.739 29,419 40.2 406 591 732 45.4 23.9 80.2
Tanza aI 43,675 61,785 77,839 95.6 457 646 814 41.5 26.0 78.2
Temate aI 9,739 11,981 14,236 54.7 178 219 260 23.0 18.8 46.2
Trecc Mal1ires City 8,579 15.686 20,451 39.1 219 401 523 82.8 30.4 138.4
LAGUNA 973.104 1,370,232 1,631,082 1,789.8 544 766 9\1 40.8 19.0 67.6
Alaminos 20,615 27,412 31.442 54.8 376 500 574 33.0 14.7 52,5
Bay 22,960 32.535 37.563 42.7 538 762 880 41.7 15,5 63.6
Binan aJ 83,684 134,553 160,206 43.5 1,924 3.093 3.683 60.8 19.1 91.4
Cabuyao aJ 46,286 66,975 77,302 43.3 1.069 1,547 1.785 44.7 15,4 67.0
Calamba al IZ1.175 173,453 218.951 144.8 837 1.198 1.512 43.1 262 80.7
Calauan 25.259 32,736 36,677 50.2 503 652 731 29.6 12.0 45.2
Cavinti aJ 13.222 15,131 16.157 125.5 105 121 129 14.4 6.8 22.2
famy aJ 5.241 7,928 9,661 53.\ 99 149 182 51.3 ZI.9 84.3
Kalayaan aI 10,247 D.IIS 16.955 46.6 220 282 364 280 29.2 65.5
Liliw aJ 17,436 21.911 24,434 41.0 425 534 596 25.7 11.5 40.1
Los Banos 49,555 66,211 71.683 54.2 914 1,222 1,323 33.6 8,3 44,7
Luisiana aJ 12,199 14,241 16.269 73.3 166 194 222 16.7 14.2 33.4
Lumban 17,360 19.773 21.996 40.5 429 488 543 13.9 11.2 26.7
Mabilac af 8,543 11,444 1],309 80.8 106 142 165 34.0 16.3 55.8
;..1agdalcna 10,43) 13,450 15.927 34.9 299 385 456 28.9 18.4 52.7
Majayjay at 13.699 15.875 18.989 69.6 197 228 273 15.9 19.6 38.6
Nagcarlan 30.637 37,696 43.679 78.1 392 483 559 23,0 15,9 42.6
Paete 16.383 20,579 21.809 39,5 415 521 552 25.6 6,0 33, I
Pagsanj:m aJ 19,489 25.024 28,999 26.4 738 948 1,098 28.4 15.9 48.8
Pakil 9,048 13.438 15,663 46.5 195 289 337 48,5 16.6 73.1
Pangil 10,519 15.212 17,664 45.0 234 338 393 44.6 16.\ 67.9
rila aJ 20,962 27,467 3\.251 25.3 829 1.086 1.235 31.0 13.8 49.1
Ri7al aI 7,510 9.501 11,537 15.0 501 633 769 26.5 21.4 53.6
San Pablo City a! 131,655 161.630 183,757 197.6 666 818 930 22.8 13,7 39.6
San Pedro 74,556 156,486 189,333 24.1 3,094 6,493 7,856 109.9 2 \.0 153.9
Santa Cruz 01/ 60,620 76,603 86,978 38.6 1.570 1,985 2.253 26-4 13.5 43.5
Santa Maria 15,744 20,525 22,296 108.4 145 189 206 30.4 8.6 41.6
Santa Rosa 011 64.325 94,719 138,257 59.6 1,079 1,589 2,320 47.3 46,0 114.9
Siniloan at 17,220 22,759 26,914 64,5 267 353 417 32.2 18.3 5ed
Victoria at 16.522 21,847 25,424 22.4 738 975 1,135 32.2 16-4 53.9
MARlNDUQUE 173,715 185,524 199,910 934.7 186 198 214 6.8 7.8 15.1
Boac 37.005 41,034 44.609 2\2,7 174 193 210 10.9 8,7 20.5
Buenavista aJ 13.025 15.495 17,358 81.3 160 191 214 19.0 12.0 33.3
Gasan aJ 23.185 25.236 26.944 100.9 230 250 267 8.8 6.8 16.2
:\1ogpog at 26.399 25.337 28,201 108.1 244 234 261 .4.0 11.3 6.8
Santa Cruz 51,846 52.926 56.991 270,8 \91 195 210 2.1 7.7 9.9
Torrijos 011 22.255 25,496 25,807 160.9 138 158 160 14.6 1.2 16.0
OCCIDENTAL 222,431 282,593 339.605 5,865.7 38 48 58 27.0 20.2 52,7
MI~DORO
Ahra de lIog 12,917 13.609 15,253 533.7 24 25 29 5.4 12.1 \8.1
Calintaan 14.416 18,117 21.687 382.5 38 47 57 25.7 19,7 50.4
Looe 6.801 7.037 9.031 132.3 51 53 68 3.5 28.3 32.8
Lubang 15.293 18,800 23,819 113.1 135 166 211 22.9 26.7 55,8
.\1agsaysay 17,560 21.580 26,947 296.7 59 73 91 22.9 24,9 53.5
Mamburao 15.533 21,781 25,627 283.5 55 77 90 40.2 17.7 65.0
P:lluan aJ 7,438 7,549 11,234 564.5 13 13 20 \.5 48.8 5 \.0
Rizal 18,609 23.379 27.112 242.5 77 96 112 25.6 16.0 45.7
Sablayan 36,699 46,546 55,573 2,1888 17 21 25 26.8 19.4 5 \.4
San Jose 66.262 87,520 101,411 446.7 148 196 227 32.\ 15.9 53.0
CllYNationa/ Statistics Office
15 Population, Land Area and Density
TABLE 2. POPULATION. LAND AREA AND POPULATION' DENSITY OF THE PHILIPPINES BY REGION. PROVlNCE. CITY/MUNICIPALITY:1980,1990 A,"JD 1995
REGION. PROVrNCE. POPULATIO:"l"I~TIMATED
POPULATION DENSITY PERCENT CHANGE IN DENSITYLAND AREACITY/MUNICIPALITY 1980 1990 1995 I (SQ.KM.) 1980 1990 1995 1980.19901990-19951980.1995
(I) (2) (3) (4) (5) [I (6) gl (7) hi (g) U (9) jl (Ill) kl
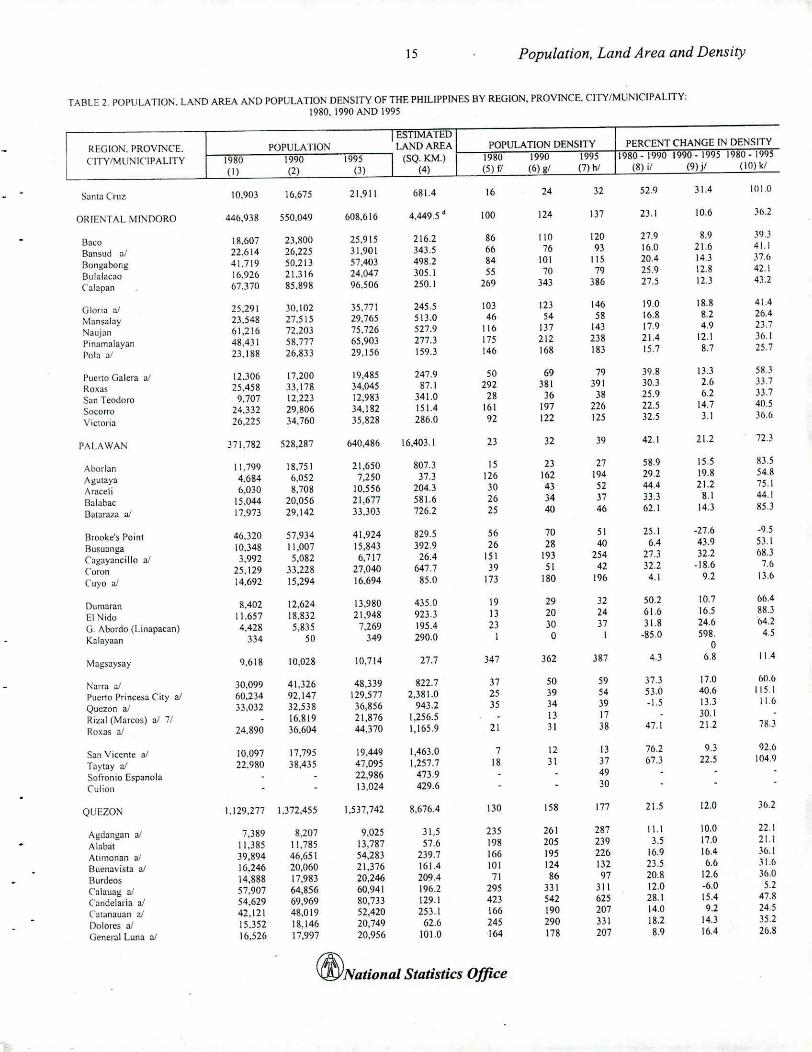
Sunla Cruz 10,(0) 16,675 21,911 681.4 16 24 32 52.9 31.4 IULO
ORIENTAL I\HNDORQ 446.938 550.049 608,616 4,449.5 d 100 124 m 23.1 10.6 )6.2
[laco 18,607 23.800 25,915 216.2 86 110 120 27.9 8.9 ]9.3
Bansud aJ 22.614 26.225 31,901 343.5 66 76 93 16.0 21.6 41.1
Bongabong 41.719 50.213 57,403 498.2 84 101 I 15 20.4 14.3 .'7.6
Bulalacao 16.926 21.316 24,047 305.1 55 70 79 25.9 12.8 42.\
Calapan 67.370 85.898 96.506 250.1 269 343 3g6 27.5 12.3 4].2
GlOria aJ 25.291 30.102 35.771 245.5 103 123 146 19.0 18.8 41.4
Mansalay 23.548 27,515 29,765 513.0 46 54 58 16.8 8.2 26.4
Naujan 61,216 72,203 75.726 527.9 116 137 143 17.9 4.9 23.7
Pinamalayan 48,431 58.777 65,903 277.3 175 212 238 21.4 12.1 36.1
Pol3 a.l 23.188 26.833 29.156 159.3 146 168 183 15.7 8.7 25.7
Puel10 Galera a'
12,306 17,200 19,485 247.9 50 69 79 39.8 13.3 58.:\
Roxas 25.458 33,178 34,045 87.1 292 381 391 30.3 2.6 33.7
San Teodoro 9.707 12,223 12,983 341.0 28 36 38 25.9 6.2 33.7
Socorro 24,332 29.806 34,182 151.4 161 197 226 22.5 14.7 40.5
Victoria 26.225 34.760 35.828 286.0 92 122 125 32.5 3. I 36.6
PALAWAN J71.782 528.287 640.486 16,403.1 23 32 39 42.1 21.2 72.3
Aborlan 1[,799 18,75\ 21.650 807.3 15 23 27 58.9 15.5 83.5
Agutaya 4.684 6,052 7.250 37.3 126 162 194 29.2 19.8 54.8
Araceli 6,030 8.708 10,556 204.3 30 43 52 44.4 21.2 75.\
8alabac 15,044 20.056 21,671 581.6 26 34 37 33.3 8. I 44.1
Balaraza aJ 17.973 29,142 33.303 726.2 25 40 46 62.1 14.3 85.3
Brooke's Point 46.320 57.934 41.924 829.5 56 70 51 25.\ .27.6 .9.5
Busuanga 10.348 11,007 15.843 392.9 26 28 40 6.4 43.9 53.\
C<lgayancillo a! 3.992 5,082 6.717 26.4 151 193 254 27.3 32.2 68.3
Coron 25.129 33.228 27,040 647.7 39 51 42 32.2 .18.6 7.•
Cuyo aJ 14,692 15,294 16.694 85.0 173 180 196 4.1 9.2 13.6
Dumaran 8,402 12,624 13,980 435.0 19 29 32 50.2 10.7 66.4
E\ Nido 11.657 18.832 21,948 923.3 13 20 24 61.6 16.5 88.3
G. Abordo (Linapacan) 4,428 5.835 7.269 195.4 23 30 37 31.8 24.6 ()4.2
Kalayaan 334 50 349 290.0 1 0 I .85.0 598. 4.50
Magsaysay 9,618 10.028 10,714 27.7 347 362 387 4.3 68 11.4
NaITa aJ 30,099 41,326 48,339 822.7 37 50 59 37.3 17.0 60.6
Puerto Princesa City aJ 60.234 92,147 129,577 2,381.0 25 39 54 53.0 40.6 115.1
Quezon aJ 33.032 32.538 36,856 943.2 35 34 39 -1.5 13.3 11.6
Rizal (Marcos) al 7/ 16.819 21.876 1.256.5 13 17 30. [
Roxas aJ 24,890 3••• 04 44.370 1.165.9 21 31 38 47. [ 21.2 7R.)
San Vicente al 10,097 17,795 19,449 1.463.0 7 12 13 76.2 9.3 92.6
Taytay a! 22,980 38.435 47,095 1.257.7 18 31 31 67.3 22.5 104.9
Sofronio Espanola 22,986 473.9 49
Cui ion 1l.024 429.6 30
QUEZO" 1,129,277 U72.455 1,537,742 8,676.4 130 158 177 21.5 12.0 )6.2
Agdangan al 7,389 8.207 9.025 31,5 235 261 287 11.1 10.0 22.1
A[abat I U85 11.785 13,787 57.6 198 205 239 3.5 17.0 211
Atimonan aJ 39,894 46,651 54,283 239.7 166 195 226 16.9 16.4 36.1
8uenavista al 16,246 20,060 21,376 161.4 101 124 112 as 6.6 31.6
Burdeos 14.888 17.983 20.246 209.4 71 86 97 20.8 12.6 36.0
Calauag aJ 57,907 64.g56 60,941 196.2 295 331 3 II 12.0 .6.0 5.2
Candelaria al 54,629 69,969 80,733 129.1 423 542 625 28.1 15.4 47.8
Calanauan aJ 42.121 48,019 52.420 253.1 166 190 207 14.0 9.2 24.5
Oolores aJ 15.352 18.146 20,749 62.6 245 290 331 18.2 14.3 35.2
Genera[ Luna a! 16,526 17.997 20.956 101.0 164 178 207 8.9 16.4 26.8
(if;JNational Statistics Office
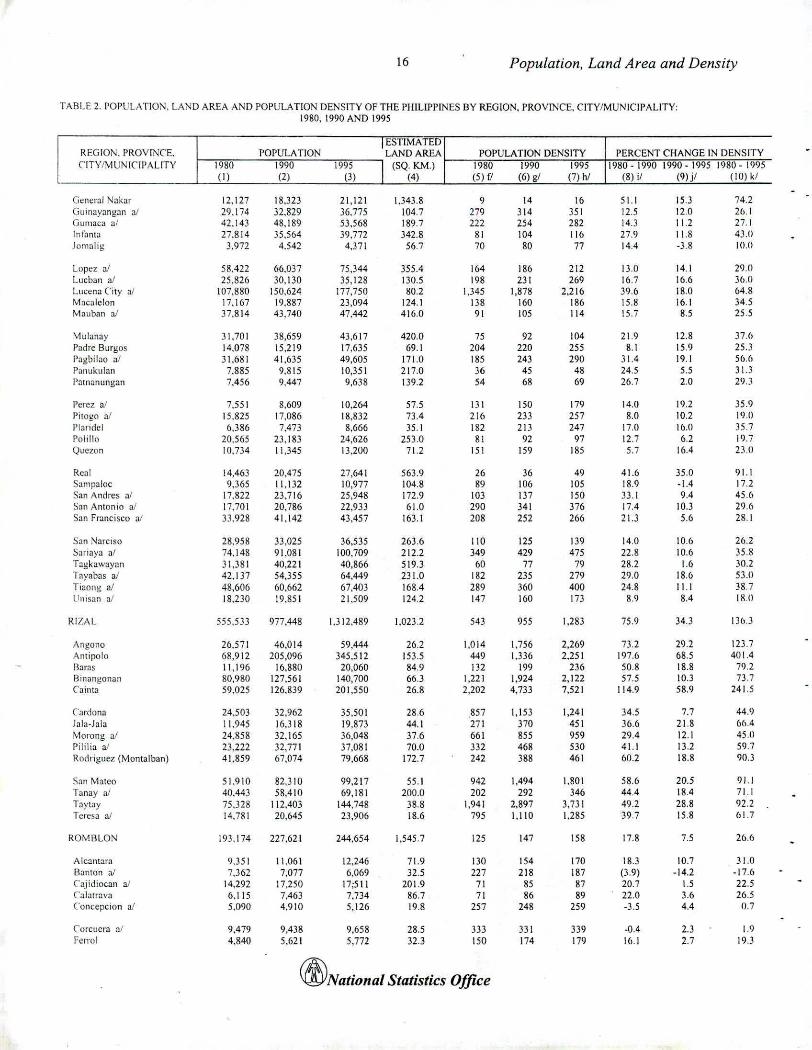
16 Population, Land Area and Density
TABLE 2. POPULATtO~, LA~D AREA AND POPULA nON DENSITY OF THE PHILIPPINES BY REGION. PROVINCE. CITY/MUNICIPALITY:1980,1990 AND 1995
REGION. PROVINCE. POPULATIONIESTIMATED
POPULATION DENSITY PERCENT CHANGE IN DENSITYLAND AREACITY 1\1U1\ IClf' ALiTY 1980 1990 1995 I (SQ. KM.) 1980 1990 1995 1980 - 1990 1990.1995 1980 - 1995
(I) (2) (3) (4) (5)[1 (6) gI (7) hi (8) il (9) jl (10) kl
General Nak::11 12.127 18.323 21.121 1.343.8 9 14 16 51.1 15.3 74.2Guinayangan aJ 29.174 32.829 36.775 1047 279 314 351 12.5 12.0 26.1Gumaca al 42.14] 48,189 53.568 189.7 222 254 282 14.3 11.2 27.1lnt~lnta 27.814 35,564 39.772 342.8 81 104 116 27.9 118 4).0Jomrtlig 3,972 4.542 4,371 56.7 70 80 77 14.4 .3.8 [O.n
Lopez al 58,422 66,037 75,344 355.4 164 186 212 13.0 14.J 29.nLucban aI 25.826 30.130 35.128 130.5 198 231 269 16.7 16.6 36.0Lucena City aJ 107.880 J 50,624 177,750 80.2 1.345 1,878 2.216 3'.6 18.0 64.8M::tcalclon 17.167 19,887 23,094 124.1 138 160 186 15.8 16.1 34.5M:lUban aJ 37.814 43,740 47,442 416.0 91 105 114 15.7 8.5 25.5
\1ulanay 31,701 38.659 4],617 420.0 75 92 104 219 12.8 37.6Padre Burgos 14,078 15.219 17,635 69.1 204 220 255 8.1 15.9 2S.JPagbilao a! 31,681 41,635 49,605 171.0 185 243 290 31.4 19,1 56.ClPanukuhm 7.885 9,815 10,351 217.0 36 45 48 24.5 5.5 3l.JPntn<:mungan 7.456 9,447 9,638 139.2 54 68 69 26.7 2.0 29.J
Perez al 7,551 8,609 10,264 57.5 131 150 179 14.0 19.2 35.9l'ilOgo nl 15,825 17,086 18.832 73.4 216 233 257 8.0 10.2 19.0Plari(tcl 6,386 7.473 8.666 35.1 182 213 247 17.0 16.0 ]5.7Polillo 20.565 23.183 24,626 253.0 81 92 97 12.7 6.2 19.7Quezon [0,734 11.345 13,200 71.2 151 159 185 5.7 16.4 23.0
Real 14,463 20,475 27,641 563.9 26 36 49 41.6 35.0 91.1S<lmpnloc 9,365 11.132 10,977 104.8 89 106 105 18.9 -1.4 17.2San Andres at 17,822 23.716 25,948 172.9 103 137 150 33.1 9.4 45.6S."lnAntonio aI 17.701 20.786 21.933 610 290 341 376 17.4 10.3 29.6San Frnncisco aJ 33.928 41,142 43.457 163.1 208 252 266 21.3 5.6 28.1
SOlnNarciso 28,958 33.025 36.535 263.6 110 125 139 14.0 10.6 26.2Sariaya aI 74.148 91.081 100.709 212.2 349 429 475 22.8 10.6 35.8Tagk<lwayan 31,381 40,221 40.866 519.3 60 77 79 28.2 1.6 30.2Tayabas aJ 42,[37 54.355 64,449 231.0 182 235 279 29.0 18.6 53.0Tiaong al 48.606 60.662 67.403 168.4 289 360 400 24.8 11.1 38.7L1llisan JJ 18,230 19,851 21.509 124.2 147 160 173 8.' 8.4 IlUI
RIZAL 555.5)] 977.448 1.312.48' 1,023.2 543 955 1.283 75.9 34.3 136.J
Angono 26.571 46.014 59.444 26.2 1.014 1.756 2.269 732 29.2 123.7Antipolo 68,912 205,096 345.512 153.5 449 1.336 2.251 197.6 68.5 401.4Baras 11,196 16.880 20.060 84.9 132 199 236 50.8 18.8 71).2Binangonan 80,980 127,561 140.700 66.3 1,221 1.924 2.122 57.5 10.3 73.7Cainta 59.Q25 126.839 20 I,550 26.8 2,202 4,733 7,521 114.9 58.9 241.5
Cardona 24,503 32.962 35,501 28.6 857 l.I53 1,241 34.5 7.7 44.9lnla.Jala 11.945 16.318 19.873 44.1 271 370 451 36.6 218 6f).4\1orong al 24.858 32.165 36-048 37.6 661 855 959 29.4 12.1 45.0Pililia a' 23.222 32,771 37.081 70.0 332 468 530 41.1 13.2 59.7Rodriguez (Montalban) 41,859 67,074 79.668 172.7 242 388 461 60.2 18.8 1)0.3
San Mateo 51.910 82.310 99,217 55.1 942 1,494 1,80 I 58.6 20.5 91.1Tanay a! 40,44] 58.410 69,181 200.0 202 292 346 44.4 18.4 71.1T;lytay 75.328 112.403 144,748 38.8 1.941 2,897 3.731 49.2 28.8 92.2Teresa aJ 14,781 20.645 23.906 18.6 795 I, 110 1.285 39.7 15.8 61.7
ROMALO~ 193,174 227,621 244.654 1,545.7 125 147 158 17.8 7.5 26.6
Alcantara 9.)51 11.061 12,246 71.9 130 154 170 18.3 10.7 31.nBanton aJ 7,362 7,077 6.069 32.5 227 218 187 (3.9) .14.2 .17.6C'ajidiocan a! 14,292 17,250 17;511 201.9 71 85 87 20.7 1.5 22.5Calatr:l\'i1 6,115 7,463 7.734 86.7 71 86 89 22.0 3.6 26.5Concepcion al 5.090 4,910 5.126 19.8 257 248 259 .3.5 4.4 0.7
Corcuera al 9,479 9,438 9.658 28.5 3J3 331 339 -0.4 2.3 1.9Fenol 4,840 5.621 5,772 32.3 150 174 179 16.1 2.7 19.3
(/fyNational Statistics Office
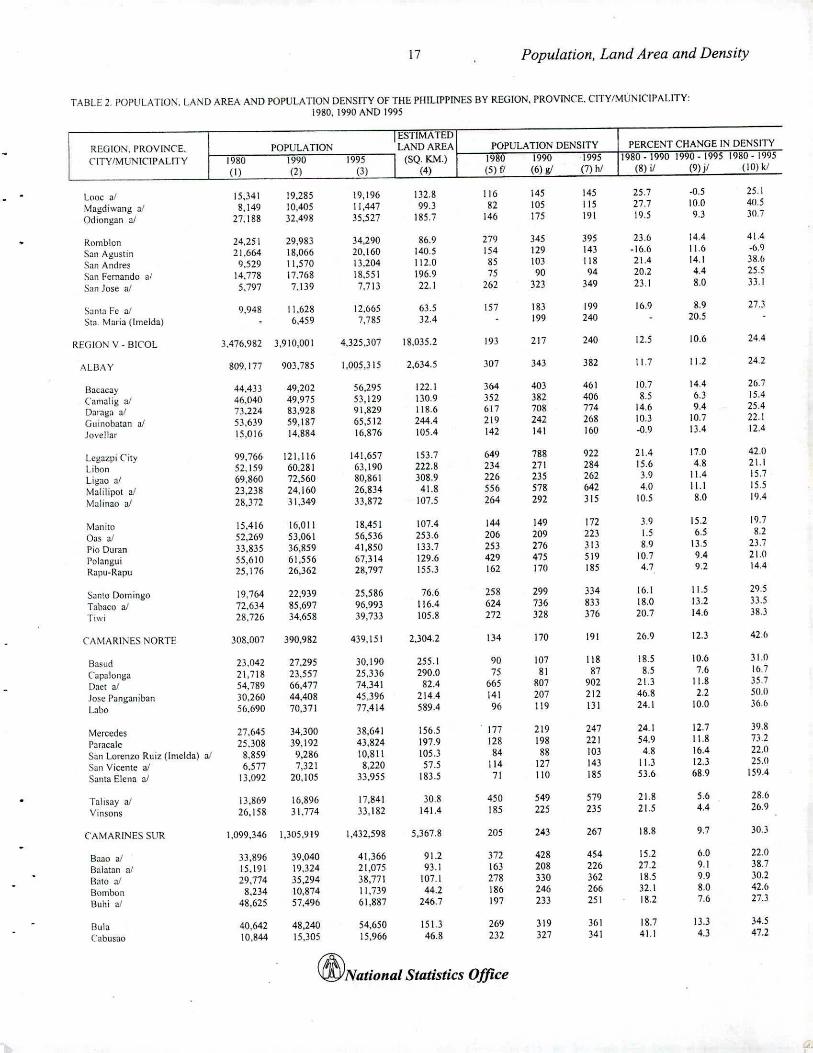
17 Population, Land Area and Density
TABLE 2. POPULATIO~'. LAND AREA AND POPULATION DENSITY OF THE PHILIPPlNES BY REGION. PROVINCE. ClTV/MUNIClPALlTY:1980.1990 AND 1995
REGION, PROVINCE. POPULATION1~T1MATED
POPULATION DENSITY PERCENT CHANGE IN DENSITYLAND AREA(,ITY/MUNICIPALITY 1980 1990 1995 l (SQ. KM.) 1980 1990 """'1995 1980.1990 1990.1995 1980 - 11)95
(1) (2) (3) (4) (5) fl (6) gI (7) hi (8) if (9) jl (10) kl
L(IOC aJ 15.341 19.285 19,196 132.8 116 145 145 25.7 -0.5 25.1
Magdiwang aI 8.149 10A05 11,447 99.3 82 105 115 27.7 10.0 40.5
Odiongan al 27.188 32,498 35.527 185.7 146 175 191 19.5 9.3 30.7
Romblon 24,251 29.983 34.290 86.9 279 345 395 23.6 14.4 41.4
San Aguslin 21.664 18,066 20.160 140.5 154 129 143 -16.6 11.6 -6.9
San Andres 9.529 11.570 13,204 112.0 85 103 118 21.4 14.1 ]8.6
San Fernando OIl 14,778 17.768 18.551 \96.9 75 90 94 20.2 4.4 25.5
S:lIl Jose a! 5.797 7.139 7.71l 22.1 262 J23 349 23.1 8.0 33.1
S;JnlJ Fe aJ 9.948 11.628 12.665 63.5 157 183 199 16.9 8.9 27,3
Sta. Maria (Imelda) 6,459 7.785 32.4 199 240 20.5
REGION V. BICOl 3.476,982 3.910,001 4,325,307 18.035.2 193 217 240 12.5 10.6 24.4
ALBAY 809.177 903,785 1,005,315 2,634.5 307 343 382 11.7 1\.2 24,2
Bacacay 44,433 49,202 56,295 122.1 364 403 461 10.7 14.4 26.7
Camalig a/ 46,040 49,975 53.129 130.9 352 382 406 8.5 6.3 15.4
Dal'aga al 73,224 83,928 91,829 118.6 617 708 774 14.6 9.4 25.4
Guinobatan a/ 53.639 59.187 65.512 244.4 219 242 268 10.3 10.7 22.1
Jove!!aT 15.016 14,884 16.876 105.4 142 141 160 -<l.9 13.4 12.4
Lcg.azpi Cily 99,766 12 \.116 141,657 153.7 649 788 922 21.4 17.0 42.0
Libon 52.159 60.281 63.190 222.8 234 271 284 15.6 4.8 21.1
Ligao aJ 69.860 72.560 80,861 308.9 226 235 262 3.9 11,4 15.7
Malilipot aJ 23.238 24.160 26,834 4 \.8 556 578 642 4.0 11.1 15.5
Malinao al 28.372 31,349 33,872 107.5 264 292 315 10.5 8.0 19.4
:v!anilo 15.416 16.011 18.451 107.4 144 149 l72 3.9 15.2 19.7
Oas a'
52.269 53,061 56,536 21J.6 206 209 223 \.5 6.5 8.2
Pio Duran 33.835 36.859 41,850 133.7 253 276 313 8.9 1l.5 23.7
Polangui 55,610 61,556 67,314 129.6 429 475 519 10.7 9.4 21.0
Rapu-Rapu 25,176 26,362 28,797 15S.3 162 170 185 4.7 9.2 14.4
Samo Domingo 19,764 22.939 25.586 76.6 258 299 334 16.1 11.5 29.5
Tahaco aJ 72.634 85,697 96,993 116.4 624 736 833 18.0 13.2 33.5
Tiwi 28.726 34,658 39.733 105.8 272 328 376 20.7 14.6 38.3
CAMARINES NORTE 308.007 390.982 439.151 2,304.2 134 170 191 26.9 12.3 42.(1
Basud 23.042 27.295 30.190 255.1 90 107 118 18.5 10.6 31.0
Capalonga 21,718 23.557 25.336 290_0 75 81 87 8.5 7.6 16.7
Dac! aJ 54.789 66,477 74.341 82.4 665 807 902 2 \.3 11.8 35.7
Jose P,mganiban 30,260 44.408 45,396 214.4 141 207 212 46.8 2.2 50.0
Labo 56,690 70.371 77,414 589.4 96 1\9 131 24.1 10.0 36.()
Mercedes 27.645 34,300 38.641 156.5 177 219 247 24.1 12.7 39.8
P:n<lcale 25.308 39,192 43.824 197.9 128 198 221 54.9 1\.8 7).2
San Lorenzo Ruiz (Imelda) aJ 8.859 9,286 1O,811 105.3 84 88 103 4.8 16.4 22.0
San Vicente aJ 6,577 7,321 8.220 57.5 114 127 143 11.3 12.3 25.(J
Santa Elena al 13,092 20,105 33.955 183.5 71 110 185 53.6 68.9 159.4
Tahsay aJ 13,869 16,896 17,841 30.8 450 549 579 2 \.8 5.6 28.6
Vinsons 26.158 31,774 33.182 141.4 185 225 235 21.5 4.4 26.9
CAMARINES SUR 1.099,346 1,305,919 1,432,598 5,367.8 205 243 267 18.8 9.7 30.3
Baao aJ 33,896 39,040 41,366 91.2 372 428 454 15.2 6.0 22.{)
l3alalan 011 15.191 }9,324 21,075 93.1 163 208 226 27.2 9.1 38.7
R,,!o aI 29,774 35.294 38.77\ 107.1 278 no 362 18.5 9.9 30.2
Bombon 8,234 10,874 11,739 44.2 186 246 266 32.1 8.0 42.6
Buhi aJ 48,625 57.496 61.887 246.7 197 233 251 18.2 7.6 27.3
8ula 40,642 48.240 54.650 IS J.J 269 319 361 18.7 1l.3 34.5
Cabusao 10.844 15,305 15,966 46.8 232 327 341 41.1 4.3 47.2
(jjyNational Statistics Office
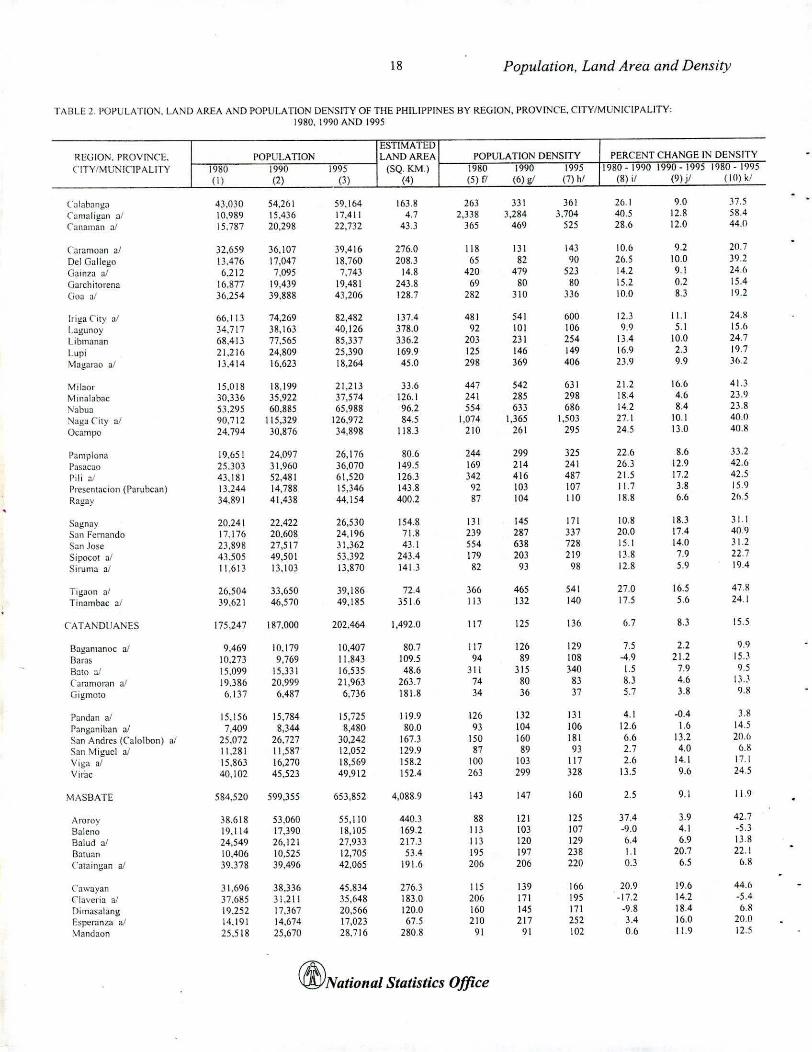
18 Population. Land Area and Density
TABLE 2. POPULATIO~. LA~D AREA AND POPULATION DENSITY OF THE PHILIPPINES BY REGION, PROVI~C'E. CITY/MUNICIPALITY:1980.1990 Al'D 1995
ESTIMATEDREGIOI'<. PROVINCE. POPULATION LAND AREA POPULATION DENSITY PERCENT CHANGE 11':DENSITY
CITY/MUl'IC1PALITY 1980 1990 1995 (SQ.KM) 1980 1990 1995 1980-19901990.19951980-1995(I) (2) (3) (4) (5) fl (6) gI (7) hi (8) it (9) jI (Ill) kl
Cal:Jbangn 43,030 54,261 59.164 16).8 263 331 361 26.1 9.0 37.5
C:lmalig~n ;JI 10,989 , 5,436 17,411 4.7 2,338 ],284 ].704 40.5 IVl 58.4
Canam311 al 15.787 20,298 22,732 43.3 365 469 525 28.6 12.0 44.0
Caramoan al 32.659 36,107 39,416 276.0 118 131 143 10.6 9.2 20.7Del Gallego 13.476 17,047 18.760 208.3 65 82 90 26.5 10.0 39.2Gainza aJ 6,212 7,095 7.743 14.8 420 479 523 14.2 9.1 24(1
Garchitorena 16.877 19.439 19,481 243.8 69 80 80 15.2 0.2 15.4Ci\J;J a/ 36,254 39,888 43,206 128.7 282 310 336 10.0 8.3 19,2
[riga City ;]/ 66.113 74,269 82,482 137.4 481 541 600 12.3 11.1 24.~
Lagunoy 34,717 38,163 40,126 378.0 92 101 106 9.9 5.1 15.6
Libmanan 68,413 77.565 85,337 336.2 203 231 254 13.4 10.0 24.7
Lupi 21.216 24,809 25,390 169.9 125 146 149 16.9 2.3 19.7
Magarao aI 13,414 16.623 18.264 45.0 298 369 406 23.9 9.9 3(),2
Milaor 15,018 18.199 21,213 33.6 447 542 631 21.2 16.6 41.3
Minalabac 30,336 35,922 37,574 IUd 241 285 298 18.4 4.6 23.9
Nabu:l 53,295 60,885 65,988 96.2 554 633 686 14.2 8.4 23.8Naga City aJ 90,712 115,329 126,972 84.5 1,074 1.365 1,503 27.1 10.1 40.0
Ocampo 24,794 30,876 34.898 118.3 210 261 295 24.5 13.0 40.~
Pamplona 19,651 24.097 26,176 80.6 244 299 325 22.6 86 33.2
Pasacao 25,303 31.960 36,070 149.5 169 214 241 26.3 12.9 42.6
Pili al 43,181 52,481 61,520 126.3 342 416 487 21.5 17.2 42.5
Presenl:lc;on (Paruhcan) 13,244 14,788 15,346 143.8 92 103 107 11.7 3.8 159
Ragay 34.891 41,438 44.154 400.2 87 104 110 18,8 6.6 26.5
Sagnay 20.241 22.422 26.530 154.8 131 145 171 10.8 18.3 31.1
San Fernando 17,176 20,608 24.196 71.8 239 287 337 20.0 17.4 40.9
San Jose 23,898 27,517 31,362 43.1 554 638 728 15.1 14.0 31.2
Sipocot aJ 4).505 49,501 53.392 243.4 179 203 219 13.8 7.9 22.7
Siruma a! 11.613 13,10) 13,870 141.3 82 9) 98 12.8 5.9 19.4
Tigaon al 26,504 33,650 )9,186 72.4 )66 465 541 27.0 16.5 47.R
Tinambac al )9,621 46,570 49,185 351.6 113 132 140 17.5 5.6 24.1
CATANDUANES 175.247 187.000 202,464 1,492.0 117 125 136 6.7 8.3 15.5
8ag:lmanoc aI 9,469 10,179 10,407 80.7 117 126 129 7.5 2.2 9.9
Bams 10.273 9,769 11.843 109.5 94 89 108 -4,9 21.2 15 ..'
Balo at 15.099 1S,331 16.535 48.6 311 315 340 1.5 7.9 9.5
Carnmoran a/ 19,386 20,999 21,963 263.7 74 80 8) 8.3 4.6 13.3
fiigmolo 6.137 6,487 6,736 181.8 )4 36 )7 5.7 3.8 9.8
Pandan al 15.156 15,784 15,725 119.9 126 132 131 4.1 -0.4 3.8
Pnngnniban nl 7.409 8,344 8,480 80.0 9) 104 106 12.6 1.6 14.5
San Andres (Calolbon) aI 25,072 26,727 30,242 167.3 150 160 181 6.6 13.2 20.6
San Mig-uel a! 11.281 11,587 12.052 129.9 87 89 9) 2.7 4.0 6.8
Viga aI 15,863 16,270 18.569 158.2 100 103 117 2.6 14.1 17.1
Virac 40.102 45.52) 49,912 152.4 263 299 328 13.5 9.6 24.5
MA$BATE 584.520 599.355 653,852 4,088.9 143 147 160 2.5 9.1 11.9
Aroroy 38.618 53,060 55,110 440.3 88 121 125 37.4 3.9 42.7
Balell0 19,\ 14 17,390 18,105 169.2 113 103 107 .9.0 4.1 -5.)
Balud al 24,549 26,121 27,933 217.3 III 120 129 6.4 6.9 13.8Bntuan 10,406 10.525 12.705 53.4 195 197 238 l.l 20.7 22.1('alaingan aI 39.378 39,496 42,065 191.6 206 206 220 0.3 6.5 CJ.R
Cnwayan 31,696 38.336 45.834 276.3 115 139 166 20,9 19.6 44.6
Claveri:l aI 37.685 31.211 35,648 183.0 206 171 195 -17.2 14.2 .5.4
Dimasalang 19.252 17,367 20,566 120.0 160 145 171 -9.8 18.4 6.8Esperanza aI 14.191 14,674 17,023 67.5 210 217 252 3.4 16.0 20.n
:-"landaon 25,518 25.670 28,716 280.8 91 91 102 0.6 11.9 12.5
(//YNational Statistics Office
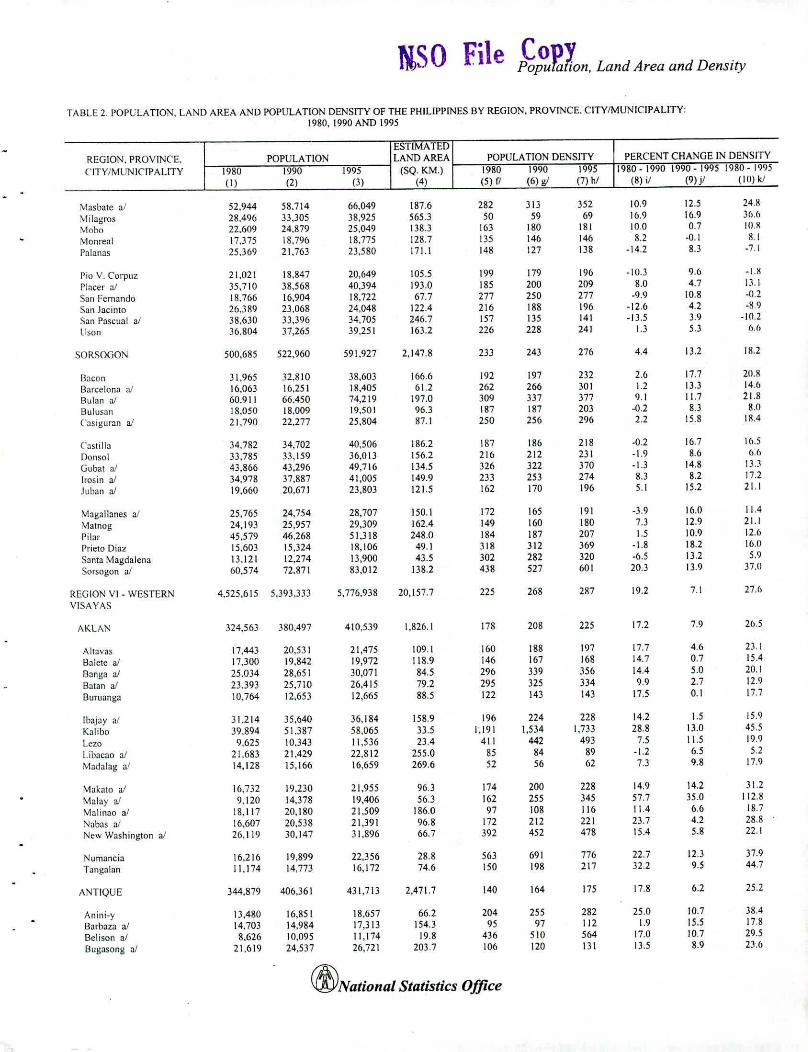
lisa File pConv L dA dD'opufalion, an rea an enSlty
TABLE 2. POPLiLA TION, LAND AREA AND POPULA nON DENSITY OF THE PHILIPPINES BY REGION. PROVI1'\CE. CITY/MUNICIPALITY:1980, 1990 AND 1995
ESTIMATEDREGION, PROVINCE. POPULATION LAND AREA POPULA nON DENSITY PERCENT CHANGE IN DENSITY
("lTV/MUNICIPALITY 1980 1990 1995 (SQ.KM.) 1980 1990 1(,)95 1980.1990 1990.1995 1980 - 1995
(I) (2) ()l (4) (5) [I (6) gI (7) hi (8) ;; (9) jl (10) kl
.\1asbatc a' 52.944 58.714 66.049 187.6 282 )13 )52 10.9 12.5 24.K
\1ilagros 28,496 )),)05 )8,925 565.3 50 59 69 16.9 16.9 3ed)
\1obo 22,609 24,879 25,049 138.3 16) 180 181 10.0 0.7 IO.K:--'lonreal 17.375 18.790 18.775 128.7 1)5 146 146 8.2 .0.1 8.1
Pnlanns 25.369 21.76) 2).580 17I.1 148 127 138 .14.2 8.) -7.1
Pio V. Corpuz 21,021 18,847 20,649 105.5 199 179 196 -10.3 9.6 -I.KPI<lcer at 35,710 )8,568 40,394 19).0 185 200 209 8.0 4.7 D.ISan Fernando 18.766 16,904 18.722 67.7 277 250 277 .9.9 10.8 -().2
S<ll1 Jacinto 26.389 2).068 24,048 J 22.4 216 188 196 .12.6 4.2 .R.9
San Pascual M )8.6)0 )),)96 34.705 246.7 157 135 141 .1 ).5 ).9 -10.2Uson )6.804 37,265 39,251 163.2 226 228 241 I.) 5.) 6.6
SORSOGON 500,685 522,960 591.927 2.147.8 23) 24) 276 4.4 1).2 18.2
Bacon )1,965 32,810 )8.60) 166.6 192 197 232 2.6 17.7 20.M
B<lrcelona 'J! 16,063 16,251 18,405 61.2 262 266 )01 L2 I).) 14.6Bul<ln 'J! 60,911 66.450 74,219 197.0 )09 ))7 )77 9.1 11.7 21.8
Bulusan 18,050 18,009 19,501 96.3 187 187 20) -0.2 8.) 8.0C<lsigurnn aJ 21,790 22,277 25,804 87.1 250 256 296 2.2 15.8 18.4
Castilla )4,782 34,702 40,506 186.2 187 186 218 .0.2 16.7 16.5Domol )),785 33,159 36,013 156.2 216 212 2)1 -1.9 8.6 /l.ll
Gubat a/ 43,866 43,296 49.716 1)4.5 )26 )22 )70 .1.3 14.8 13.3
[rosin aJ 34,978 )7,887 41,005 149.9 2)3 25) 274 8.) 8.2 17.2Juban aJ 19,660 20.671 2).80) 121.5 162 170 196 5.1 15.2 21.1
Magallanes aJ 25,765 24,754 28,707 150.1 172 165 191 .).9 16.0 11.4
Matnog 24,19) 25,957 29.309 162.4 149 160 180 7.3 12.9 21.1
Pilar 45,579 46,268 51,318 248.0 184 187 207 I.S 10.9 12.6
Prieto Diaz 15,603 15,324 18,106 49.1 )18 )12 )69 .1.8 18.2 16.11
S<Jnt<JMagdalena 13.121 12,274 1),900 4).5 )02 282 )20 -6.5 1).2 5.9
Sorsogon aJ 60,574 72,871 8),012 1)8.2 4)8 527 601 20.) 13.9 37.0
REGION VI - \VESTERN 4,525,615 5.)9).))) 5,776,938 20,157.7 225 268 287 19.2 7.1 27.6
VISA VAS
AKLAN 324,563 380,497 410.539 1.826.1 178 208 225 17.2 7.9 26.5
Altavas 17.443 20,531 21,475 109.1 160 188 197 17.7 4.{) HI
Balete aI 17,300 19,842 19,972 118.9 146 167 168 14.7 0.7 15.4
Banga aJ 25,034 28,651 )0,071 845 296 ))9 )56 14A 5.0 20.1
Balan aJ 2).39) 25,710 26,415 79.2 295 )25 ))4 9.9 2.7 12.9
Ouruanga 10,764 12,653 12,665 88.5 122 14) 14) 17.5 0.1 17.7
IhajJY al 31.214 )5,640 )6,184 158.9 196 224 228 14.2 1.5 15.9
Kahbo 39,894 51.387 58,065 )).5 1.191 1,5)4 1,7)) 28.8 1).0 45.5
Lelo 9.625 10.343 11.5)6 2).4 411 442 49) 7.5 11.5 19.9
LibacJo al 21,683 21,429 22,812 255.0 85 84 89 .1.2 6.5 5.2
Madalag al 14,128 15,166 16,059 269.6 52 56 62 7.) 9.8 17.9
MJkalO a/ 16,7)2 19.2)0 21,955 96.) 174 200 228 14.9 14.2 ) 1.2
Malay a/ 9,120 14,)78 19,406 56.3 162 255 )45 57.7 )5.0 112J!Ma1inao ai 18,117 20.180 21,509 186.0 97 108 116 11.4 6.6 18.7
7'lab<JsaJ 16,607 20.5)8 21.391 96.8 172 212 221 23.7 4.2 28.8
New Washington aJ 26,119 30,147 31,896 66.7 )92 452 478 15.4 5.8 22.1
Numancia 16.216 19,899 22,)56 28.8 56) 691 776 22.7 12.) 37.9
Tangalan 11.174 14,773 16,172 74.6 150 198 217 )2.2 9.5 44.7
ANTIQUE 344,879 406,)61 4)1,71) 2,471.7 140 164 175 17.8 6.2 25.2
Anini-y 13,480 16.851 18,657 66.2 204 255 282 25.0 10.7 38.4BJrbaza aJ 14.70) 14,984 17,) I) 154.) 95 97 112 1.9 15.5 17.8
Be1ison al 8,626 10,095 11,174 19.8 4)6 510 564 17.0 10.7 29.5BugJsong al 21.619 24.5)7 26,721 203.7 106 120 IJI 1).5 8.9 n.b
(//YNational Statistics Office

20 Population. Land Area and Density
TABLE 2 POPL"LATION. LAND AREA AND POPULATION DENSITY OF THE PHlllPPlNE..~ BY REGION, PROVINCE. CITY/MUNICIPALITY:1980.1990 AND 1995
ESTIMATEDREGION. PROVINCE. POPULATION LAND AREA POPULATION DENSITY PERCENT CHANGE IN DENSITYCITY/\.1UNIClPALlTY 1980 1990 1995 (SQ. KM.) 1980 1990 1995 1980-19901990-19951980-1995
(I) (2) (3) (4) (5) fl (6) gI (7)hl (8) if (9) jl (10) kl
("aluya 10,901 16.243 17,101 132.1 83 123 129 49.0 5.3 SCI.9
("ulas! aJ 25.674 29,719 30,431 228.6 112 130 133 15.8 2.4 IX.SIbm tic 28,526 )4,394 36,167 113.0 252 304 320 20.6 5.2 26.M
Law;]-an 18,785 19,865 21,069 111.9 168 178 188 5.7 6.1 12.2Liberlad aJ lJ,870 11,049 13,274 76.0 IJO 145 175 11.9 20 I 34.5Pandan 20.396 23.894 24,978 114.0 179 210 219 17.2 4.5 22.5
l'::lI11ongoll 24,262 27,376 29.235 113.0 215 242 259 12.8 6.8 20.5S:m 1mt: al 30,266 40,267 42,927 48.6 623 829 883 33.0 6.6 4l.XSan Remigio 19.208 21.682 22,869 400.4 48 54 57 12.9 5.5 19.1SebaSlc al 10,3(,9 12,553 12,438 59.4 175 211 209 21.1 -0.9 20.0Sibalorn at 35,515 42,647 46,143 201.l 176 212 229 20.1 8.2 29.9
Tibiao aI 17.200 20,192 19,628 177.4 97 114 III 17.4 -28 14.1Tobi<ls Fornier 22,511 25,816 26,155 111.7 202 231 234 14.7 I.l 16.2Valdemrna 12,968 14,197 15,433 140.3 92 101 110 9.5 8.7 19.0
CAPll 492.231 584,091 624,469 2.639.2 187 221 237 18.7 6.9 26.9
luarlcro 18.513 22,597 26,477 106.6 174 212 248 22.1 17.2 43.0Dao 23,921 29,156 29,266 886 270 329 330 21.9 04 22.)Ollmalag a! 22,198 25,484 28,348 109.2 203 233 260 14.8 11.2 27.7Dumarao 29,934 36.801 38,0)7 2326 129 158 164 22.9 34 27,1hisan nJ 17,414 21,510 22,720 54.2 321 397 419 23.5 5.6 30.5
J<lmindan al 25,652 27,896 34,022 412.0 62 68 83 8.7 22.0 32.6Ma.ayon 25,715 29,808 )0,))3 142.3 181 209 213 15.9 1.8 1lUIMambusao OJ! 32,097 33.213 35.632 136.9 234 243 260 3.5 7.3 1'.0('anay aI 31.650 36,817 39,124 116.4 272 316 336 16.3 6.3 23,6Panitan a/ 27,631 32,867 33,269 89.9 307 366 370 18.9 1.2 20.4Pilar 30.104 35,929 36,464 78.0 386 461 467 19.3 1.5 21.1Ponlevedra 30,489 36,748 38.223 130.9 2)) 281 292 20.5 4.0 25.4President Roxas 21,805 24,052 24,695 77.9 280 309 317 10.3 2.7 13.3RoXaSCilY aI 81.183 103,171 118,715 95.1 854 1,085 1,248 27.1 15.1 46.2Sapi.an 18,753 22,011 22,534 231.l 81 95 97 17.4 2.4 2lJ2
5igrn<l al 20,043 25.089 25.801 101.7 197 247 254 25.2 2.8 28.7Tapaz 35,129 40,942 40,809 435.6 81 94 94 16.5 -0.3 16.2
ILOILO 1.341,259 1,647,486 1,749,561 4,848.5 277 340 )61 22.8 6.2 )0.4
Ajuy ai 30,397 38,120 38,415 152.3 200 250 252 25.4 0.8 26.4Alimodian 22,906 27.203 29,179 144.8 158 188 202 18.8 7,) 27.4Amlao 15,782 19.560 20,711 100.3 157 195 206 23.9 5.9 31.2Badiangan 19,239 21,989 22,795 77.5 .248 284 294 14.3 3.7 185Balasan al 17,979 22,013 22,949 54.3 331 405 42) 22.4 4.3 27.6
Banatc 17.710 23,364 24,976 118.9 149 197 210 31.9 6.9 41.0Barofac KlIl:'vo al 34,276 39,757 40,968 94.5 363 421 434 16.0 3.0 19.5Bam!ac Viejo 24,135 31.660 33,652 185.8 130 170 181 ) 1.2 6.3 39.4Balad al 11.790 14.337 15,345 53.1 222 270 289 21.6 7.0 30.28ingawan 9.229 10,872 11,494 85.0 109 128 135 17.8 5.7 24.5
Cabaluan af 34,468 40.892 42,264 112.9 305 362 374 18.6 3.4 22.6Calino~ al 32,897 41.113 45,452 232.6 141 177 195 25.0 10.6 38.2Carles aJ 32,184 42,648 46,218 104.1 309 410 444 32.5 84 43.6Concepcion 21.121 28,355 30,111 97.0 218 292 310 34.3 6.2 42.tJDingle al 29,179 35,415 35,639 98.4 297 360 362 21.4 0.6 22.1
Duena~ al 23,962 28,472 28,954 90.5 265 315 320 18.8 1.7 20.8Dllmangas al 41.241 49,913 51,092 116.8 353 427 437 21.0 24 23.9E~tancia ;,V 19,817 27,229 30.673 29.4 674 926 1,043 37.4 12.6 54.to;Guimbal 19,502 23,478 26,316 44.6 437 526 590 20.4 12.1 34.9[gb:lras al 22,173 25,274 25,960 148.7 149 170 175 14.0 2.7 17.[
(flyNatiollal Statistics Office
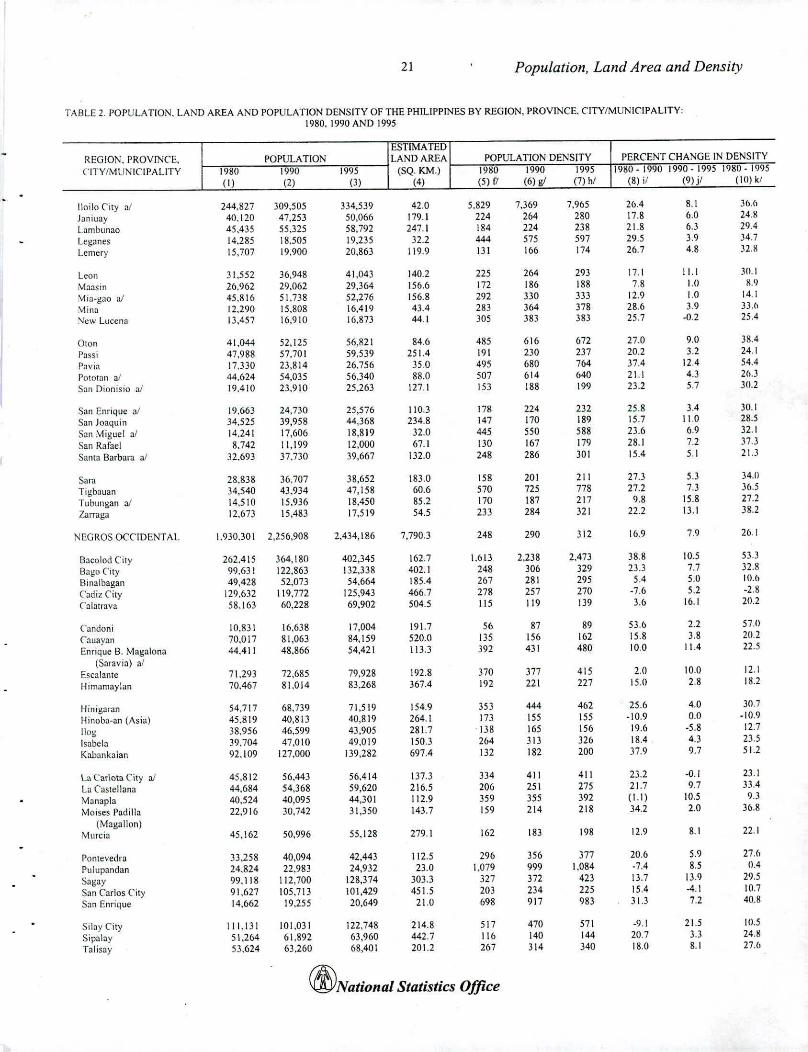
21 Population. Land Area and Density
TABLE 2. POPULATION. LAND AREA AND POPULATION DENSITY OF THE PHILlPPlNES BY REGION. PROVINCE, CITY/MUNIC'lPALlTY:1980, 1990 AND 1995
ESTIMATEDREG 10K. PROVINCE. POPULATION LAND AREA POPULATION DENSITY PERCENT CHANGE IN DENSITYCITY/MUNICIPALITY 1980 1990 1995 (SQ.KM.) 1980 1990 1995 1980 - 1990 1990.1995 1980.1995
(I) (2) (3) (4) (5) [I (6) gI (7) hi (8) if (9) jl (W) kl
Iloilo City at 244,827 309.505 334,539 42.0 5.829 7.369 7.965 2b.4 8.1 3fJ{\
Janiuay 40,120 47.253 50,066 179.1 224 264 280 17.8 6.0 24.8Lambllnao 45.435 55.325 58.792 247.1 184 224 238 21.8 6.3 29.4
Leganes 14.285 \8.505 19.235 32.2 444 575 597 29.5 3.9 34.7
Lemery 15.707 19.900 20,863 119.9 131 166 174 26.7 4.8 3VI
Leon 31.552 36.948 41,043 140.2 225 264 293 17.1 11.1 30.1
Mansin 26,962 29.062 29,364 156.6 172 186 188 7.8 1.0 ItlJ
\1i:l-gao a/ 45,816 51,738 52.276 156.8 292 330 333 12.9 1.0 [4.1
\1ina 12,290 15,808 16,419 43.4 283 364 378 28.6 3.9 33.(1,\)..:w Lucena 13,457 16,910 16.873 44.1 305 383 383 25.7 -0.2 25.4
Oton 41,044 52,125 56,821 84.6 485 616 672 27.0 9.0 38.4Passi 47,988 57.701 59.539 251.4 191 230 237 20.2 3.2 24, IPavia 17,330 2],814 26,756 35.0 495 680 764 37.4 12.4 54,4P(l101an a! 44,624 54,035 56,340 88.0 507 614 640 21.1 4.3 211.]San Dionisio aJ 19,410 23,910 25.263 \27.1 153 188 199 23.2 5.7 30,2
San Enrique a! 19,663 24,730 25,576 110.3 178 224 232 25.8 3.4 ]0.1
San Joaquin 34.525 39.958 44,368 234.8 147 170 189 \5.7 11.0 28.5
San Miguel a! 14,241 17,606 18.819 32.0 445 550 588 23.6 6.9 32.1
San Ralael 8.742 11.199 12.000 67.1 130 167 179 28.1 7.2 37.3
Santa Barbara aI 32,693 37.730 39,667 132.0 248 286 301 15.4 5.1 21.3
Sara 28.838 36.707 38,652 183.0 158 201 211 27.3 5.3 34.0
Tigbauan 34.540 4],934 47,158 60.6 570 725 778 27.2 7.3 36.5
Tubungan aI 14,510 15.936 18.450 85.2 170 187 217 9.8 15.8 27.2
Zarraga 12.673 15,483 17.519 54.5 233 284 321 22.2 13.1 38.2
NEGROS OCCIDENTAL 1,930.301 2,256,908 2,434,186 7.790.3 248 290 312 16.9 7.9 26.1
Bacolod City 262,415 364.180 402,]45 162.7 1,613 2.238 2,473 38.8 10.5 53.3
Sago City 99.631 122,863 132.338 402.1 248 306 329 23.3 7.7 32.8
Binalbagan 49,428 52,073 54,664 185.4 267 281 295 5.4 5.0 10.b
Cadiz City 129.632 119.772 125.943 466.7 278 257 270 .7.6 5.2 .2.8
lal:ltrava 58.163 60,228 69.902 504.5 115 119 139 3.6 16.1 20.2
Candoni 10.831 16.638 17.004 191.7 56 87 89 53.6 2.2 57.0
Cauayan 70.017 81.063 84.159 520.0 135 156 162 15.8 3.8 20.2
Enrique B. Magalona 44.411 48.866 54,42\ 113.3 392 431 480 10.0 11.4 22.5
(Saravia) alEscalante 71.293 72,685 79.928 192.8 370 377 415 2.0 10.0 12.1
Himamay:an 70.467 81,014 83.268 367.4 192 221 227 15.0 28 18.2
Hinigaran 54,717 68.739 71,519 154.9 353 444 462 25,6 4.0 30.7
Hinoba-an (Asia) 45,819 40,813 40,819 264.1 I73 155 155 .10.9 0.0 -10.9
llog ]8,956 46.599 43.905 281.7 .138 165 156 19.6 .5.8 12.7
Isabeln 39,704 47.010 49.019 150.3 264 3 I3 326 \8.4 4.3 23.5
Kahanknlan 92.109 127.000 139.282 697.4 132 182 200 37.9 9.7 51.2
la Car\ota City aJ 45,812 56,443 56,414 137.3 334 411 411 23.2 -0.1 23.1
La Castellana 44.684 54.368 59,620 216.5 206 251 275 21.7 9.7 33.4
Manapla 40,524 40.095 44,301 112.9 359 355 392 (L1) 10.5 9.3
Moises Padilla 22.916 30,742 31.350 143.7 159 214 218 34.2 2.0 36.8
(r-.1agallon)Murcia 45.162 50,996 55.128 279.1 162 183 198 \2.9 8.1 22.1
Pontevedra 33.258 40,094 42,443 112.5 296 356 377 20.6 5.9 27.6
Pulupandan 24,824 22.983 24.932 no 1.079 999 1.084 -7,4 8.5 0,4Sagay 99,\18 112.700 128.374 303.3 327 372 423 13.7 13.9 29.5
San Carlos City 91.627 105.713 101.429 451.5 203 234 225 15.4 -4.1 10.7
San Enrique 14,662 19.255 20.649 21.0 698 917 983 31.3 72 40.H
Silay City 111.13 I 101,031 122.748 214.8 517 470 571 -9.1 21.5 10.5Sipalay 5\,264 61,892 63.960 442.7 lib 140 144 20,7 3.3 24.~
Talisay 5].624 63.260 68,401 201.2 267 314 340 18.0 8.1 27.6
(ff;;National Statistics Office
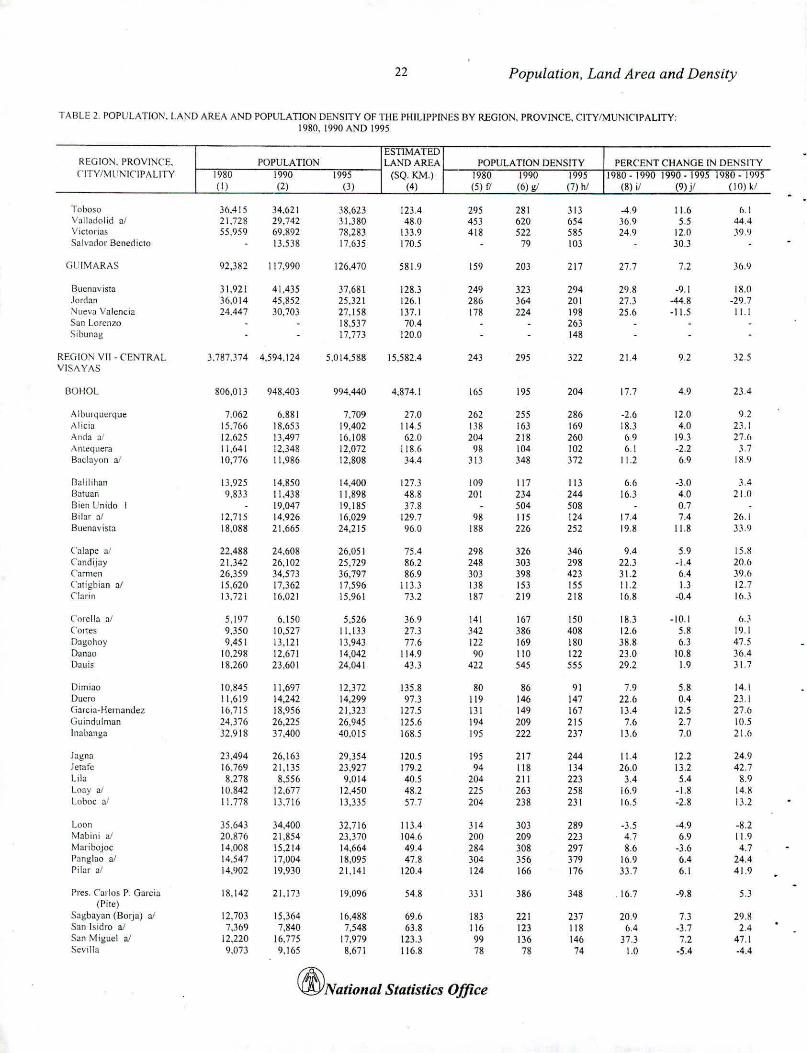
22 Population, Land Area and Density
TABLE 2. POPUlATIO)\,'. LA:'\D AREA AND POPULATION DENSITY OF THE PHILIPPINES BY REGION. PROVINCE. CITYIMUNIC1PALlTY:1980.1990 AND 1995
ESTIMATEDREGIO:-.J. PROVINCE, POPULATION LAND AREA POPULATION DENSITY PERCENT CHANGE IN DENSITYC[TY/~1Ur-.;ICIPALITY 1980 1990 1995 (SQ.KM.) 1980 1990 1995 1980.19901990-19951980-1l)l)5
(I) (2) (3) (4) IS) (I (6) g/ (7) hi (8) if (9) jl (10) kl
Tobo~o 36,415 34,621 38.623 123.4 Z9S 281 313 -4.9 11.6 fl.JValladolid 0.1 21,728 29.742 31.380 48.0 453 620 654 36.9 5.5 44.4Victorias 55,959 69.892 78,283 133.9 418 522 585 24.9 12.0 39,1)Salvador Benedicta 13538 17,635 170.5 79 103 30.3
Gt:I\ilARAS 92,382 117.990 126,470 581.9 159 203 217 27.7 7.2 -'Cl.t)
l3uenavista 3\,921 41,435 37,681 128.3 249 323 294 29.8 -9.1 [IUlJordan 36,014 45,852 25,321 126.1 286 364 201 27,3 -44.8 -29.7Nueva V:l!cnci;} 24.447 30,703 27,158 137.1 178 224 198 25.6 -11.5 [1.1San Lorenzo 18537 70.4 263Sibunag 17,773 120.0 148
REGIO:'\' VII - CENTRAL 3.787,374 4.594.124 5.014,588 15,582.4 243 295 322 21.4 9.2 32.5YISAYAS
iJOHOL 806,013 948,403 994,440 4,874.1 165 195 204 17.7 4.9 23.4
Alburqut:rque 7,062 6.SSl 7,709 27.0 262 255 286 -2.6 12.0 9.2Alici<l 15.766 18,653 19,402 114.5 138 163 169 18.3 4.0 23.1Anda ~' 12.625 13,497 16.108 62.0 204 218 260 6.9 19.3 27.llAnll."quera 11.641 12.348 12,072 1186 98 104 102 6.1 .2.2 3.7Baci;lyon at 10,776 11.986 12,808 34.4 3J3 348 372 11.2 6.9 [H,I)
Balilihan 13,925 14,850 14,400 127.3 109 117 113 6.6 .).0 3.4Baluan 9,833 11,438 11,898 48.8 201 234 244 16.3 4.0 11.0Bien l!nido \9,047 19,185 37.8 504 508 0.7Bilar :tI 12,715 14,926 16,029 129.7 98 115 124 17.4 7.4 26.1But=nav;sra 18,088 21,665 24,215 96.0 188 226 252 19.8 11.8 3).9
Calape aJ 22,488 24,608 26,051 75.4 298 326 346 9.4 5.9 IS.HCandijay 21.342 26,102 25,729 86.2 248 303 298 22.3 .1.4 lO.()Cannell 26,359 34,573 36,797 86.9 303 398 423 31.2 6.4 39.C1Catigbian 31 15,620 17,362 17,596 113.3 138 153 ISS 11.2 1.3 12.7['lar;n 13.721 16.021 15,961 73.2 187 219 218 16.8 -0.4 HdCorella <If 5,197 6,150 5,526 36.9 141 167 ISO 18.3 -10.1 6.3Cones 9.350 10.527 t 1,133 27.3 )42 386 408 12.6 5.8 19.1Oagohoy 9,451 13.121 13,943 77.6 122 169 180 38.8 6.3 47.5Danao 10,298 12,671 14,042 114.9 90 110 122 no 10.8 36.4Dauls 18,260 23,601 24,041 43.3 422 545 555 29.2 1.9 31.7
Dlmiao 10.845 11,697 12,372 135.8 80 86 91 7.9 5.8 14.'Ducro 11,619 14,242 14,299 97.3 \19 146 147 22.0 0.4 23.1Garcia-Hernandez \0,715 18,956 21,323 127.5 131 149 167 13.4 12.5 27.6Guindulman 24,376 26,225 26,945 125.6 194 209 215 7.6 2.7 10.5Inab.lnga 32.918 37,400 40,015 168.5 195 222 237 13.6 7.0 21.6
Jagna 23,494 26,163 29,354 120.5 195 217 244 \1.4 12.2 24.9Jetafc 16.769 21,135 23,927 179.2 94 118 134 26.0 13.2 42.7Lila 8.278 8556 9,014 40.5 204 211 223 3.4 5.4 8.9Loay aI 10.842 12,677 \2,450 48.2 225 263 258 16.9 .1.8 14.~Loboc af II. 778 13,716 l3,m 57.7 204 238 231 16.5 .2.8 D.l
Loon 35,643 34,400 32,716 113.4 314 303 289 -3.5 -4.9 -8.1Mabini aJ 20.876 21,854 23,370 104.6 200 209 223 4.7 6.9 11.9Maribojoc 14,008 15,214 \4,664 49.4 284 308 297 8.6 .3.6 4.7Panglao aJ 14.547 17,004 18.095 47.8 304 356 379 \6.9 6.4 24.4Pilar a' 14,902 19,930 21,141 120.4 124 166 176 33.7 6.1 41.9
Pres. Carlos P. Garcia 18,142 2].173 19,096 54.8 331 386 348 .16.7 -9.8 5.3(pire)
Sagbayan (Borja) aI 12,703 15.364 16.488 69.6 183 221 237 20.9 7.3 29.11San Isidro aI 7,369 7.840 7,548 63.8 116 123 118 6.4 -3.7 2.4San Miguel aJ 12.220 16.775 17,979 123.3 99 136 146 37.3 7.2 47.1Sevilla 9,073 9,165 8,671 \16.8 78 78 74 1.0 -5.4 .4.4
(/fyNatio/lal Statistics Office

23 Population, Land Area and Density
TABLE 2. POPULATIOt'. LAND AREA AND POPULATION DENSITY OF THE PHILlPPlNES BY REGlO~. PROVINCE. CITY/MUNICIPALITY;1980,1990 AND 1995
ESTIMATEDREGION. PROVINCE. POPULATIOS LAND AREA POPULATION DENSITY PERCENT CHANGE IN DENSITYCITY/MUNICIPALITY II)~W 1990 1995 (SQ. KM.) 1980 1990 1995 1980 ~ 1990 1990 ~ 1995 1980. [995
(I) (2) (3) (4) (5) (I (6) g/ (7) hi (8) il (9) jI (10) kI
Siell"a Bu!looes 17.904 21.101 20,787 198.9 90 106 105 17.9 .1.5 16.1Sikatun<J.a/ 5.244 5.525 6.030 38.2 137 145 158 5.4 9.1 15.0T:lgbilar.m City a! 42.683 56.363 66,683 36.5 1,169 1.544 1.827 32.1 18.3 sedTalibon 46.110 41.873 44.854 375.7 123 III 119 .9.2 7.1 .2.7Trinidad 15.501 19,945 20.893 195.3 79 102 107 28.7 4.8 34.8
Tubigon 29,993 34.302 34.578 81.9 366 419 422 14.4 0.8 15.3llhay 38.289 48,902 50.745 335.1 114 146 151 27.7 3.8 325ValenCIa 18.655 20,879 22,423 116.7 160 179 192 I \.9 7.4 20.2
CEBLI 2,091.602 2.646.517 2,921.145 5.368.3 390 493 544 26.5 10.4 39.7
Alcantara al 7.882 9.559 10,224 35.2 224 272 290 21.3 7.n 29.7"rcoy 8.129 10.485 11.539 61.6 132 170 187 29.0 10.1 41.9Alegria 16.351 18.253 18.403 89.5 183 204 206 J 1.6 0.8 12.5Alol;uinsan al 15.775 19.214 21,472 61.9 255 310 347 21.8 11.8 36.1Argao 44.060 52.157 54.447 191.5 230 272 284 18.4 4.4 23.6
Asturias a! 28,655 30,404 33.355 190.5 150 160 175 6.1 9.7 16.4B::ldian 21.512 26.545 29.200 110.1 195 241 265 2).4 10.0 35.78alamban 41.498 45.909 49,983 333.6 124 138 150 10.6 8.9 20.4B,mt::lyan aI 47.711 60.000 62.260 81.7 584 734 762 25.8 3.8 30.5Barili 01/ 39.560 47.789 52.060 122.2 324 391 426 20.8 8.9 31.6
I3ogo aJ 42.444 51.083 57.509 93.2 455 548 617 20.4 12.6 35.5Boljoon 10.735 11.646 12,318 117.0 92 100 105 8.5 5.8 14.7Borbon 20.137 23.239 26.020 1209 167 192 215 15.4 12.0 29.2('artar 57.822 70.841 78.726 116.8 495 607 674 22.5 11.1 36.2('amlcn 24.197 29.265 32.357 85.0 285 344 381 20.9 10.6 JJ.7
Catmon 17.357 19.773 21.647 109.6 158 180 198 13.9 9.5 24.7('ebu City 490.281 610.417 662.299 315.0 1,556 1.938 2.103 24.5 8.5 35.1('omposlela 17.504 22.006 26.499 53.9 325 408 492 25.7 20.4 51.4Consolacion 27,454 41,270 49.205 147.2 187 280 334 50.3 19.2 7CJ.2Cordob::l 16,455 22.331 26,613 17.2 957 1.298 1,547 35.7 19.2 61.7
Daanbantayan 45,1)26 58,771 64.845 92.3 498 637 703 28.0 10.3 41.2Dalaguete at 37.076 45,545 48.778 155.0 239 294 315 22.8 7.1 31.6Danao City 56.967 73.358 79.932 107.3 531 684 745 28.8 9.0 40,3Dumanjug al 25.258 31.932 35,279 85.5 295 373 41l 26.4 10.5 ]9.7GinatHan 10.566 11.160 11.924 70.1 151 159 170 5.6 6.8 12.9
Lapu.Lapu City (Opon) aJ 98.723 146,194 173,744 58.1 1,699 2.516 2.990 48.1 18.8 76.0Uloan 30,196 42.587 50,97] 45.9 658 928 1,111 41.0 19.7 68.8MadrideJos a/ 18.865 25,746 26,506 24.0 786 1.073 1,104 36.5 3.0 40.5Malabuyoc 13.740 14,628 17,090 69.3 198 211 247 6.5 16.8 24.4Mandaue City 110.590 180.285 194.745 25.2 4,388 7,154 7,728 63.0 8.0 76.1
Medellin at 28,641 34.184 41,796 73.2 391 467 571 19.4 22.3 45.9Minglanilla aJ 38.504 50.875 62.523 65.6 587 776 953 32.1 22.9 b2.4Moalboal aJ 16,420 20,041 22.021 124.9 III 160 176 22.1 9.9 34.1Naga a! 45.831 60,425 69.010 102.3 448 591 675 31.8 142 50.6Osloh aI 19.053 19,782 21,686 134.8 141 147 161 3.8 9.6 1l.8
Pilar aJ 11,126 11.499 11,191 32.4 343 355 345 3.4 .2.7 O.C,Pinamungajan 31.394 40,026 44,009 109.2 287 367 403 27.5 10.0 40.2Poro aJ 17.717 19.150 21.517 63.6 279 301 338 8.1 12.4 21.4Ronda aI 12.939 15.264 16,561 57.1 227 267 290 18.0 8.5 28.0Samboan 14,798 15.005 15.770 45.2 327 332 349 1.4 5.1 6.6
San Fernando 28.]24 35.051 38,700 69.4 408 50S 558 23.8 10.4 36,ClSnn Francisco 28.806 36.521 39,115 106.9 269 342 366 2b.8 7.1 35.8San Rcmigio 29,412 36.124 38,501 95.3 309 379 404 22.8 6.6 ]0.9Santa Fe 15.787 20.838 21.720 17.1 923 1.219 1.270 32.0 4.2 37.ClS;lntnnder 10.979 11.831 12.382 29.5 372 401 420 7.8 4.7 12.8
(ff;;National Statistics Office
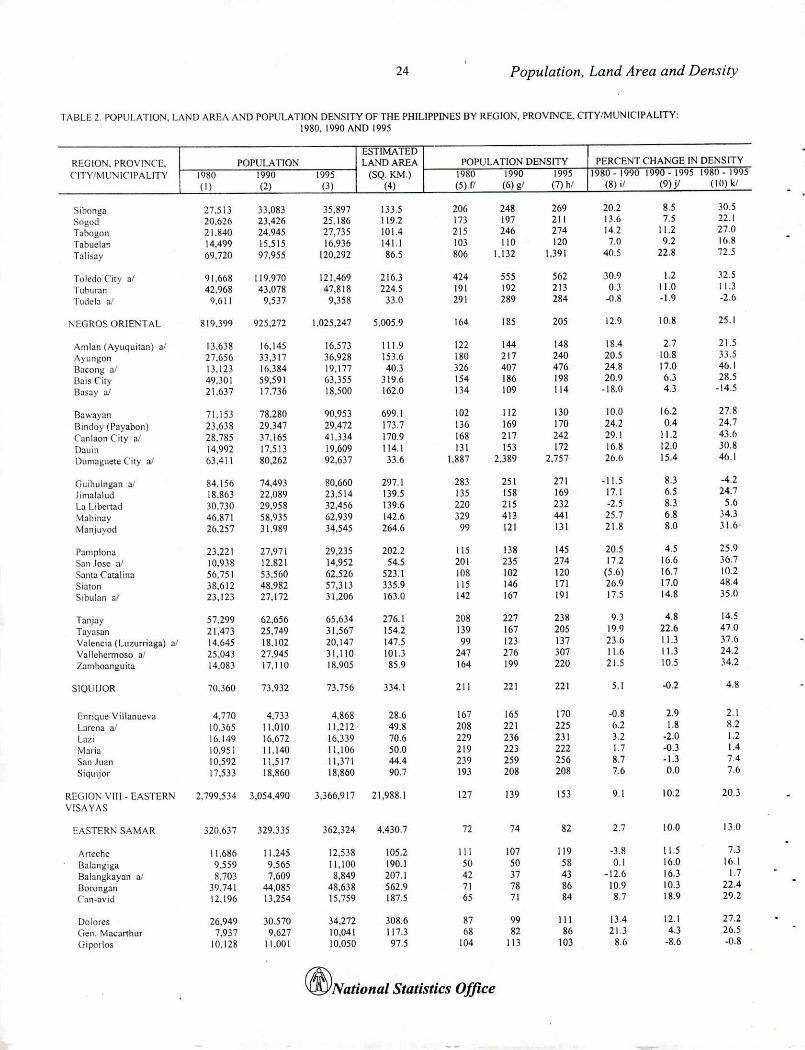
24 Population, Land Area and Density
TABLE 2. POPULATION, LAND AREA AND POPULATION OENSITY OF THE PHILIPPINES BY REGION. PROVINCE. CITY/MUNICIPALITY:1980,1990 AND 1995
ESTIMATEDREGION, PROVNCE, POPULATION LAND AREA POPULATION DENSITY PERCENT CHANGE IN DENSITYCITY!MU~I('IPALITY [980 1990 1995 (SQ. KM.) 1980 1990 1995 1980.19901990.1995 1980-1995
(I) (2) (3) (4) (5) fl (6) gI (7) hi (8) i/ (9) jI (10) kl
Sibnng<l 27.513 33,083 35,897 133.5 206 248 269 20.2 8.5 30.5Sogod 20,626 23,426 25,186 119.2 173 197 211 13.6 7.5 22.1
Tabogon 21.840 24,945 27,735 101.4 215 246 274 14.2 11.2 27.0
Tabuel;)n 14,499 15,515 16.936 141.1 103 110 120 7.0 9.2 16.8
Talisay 69.720 97.955 120,292 86.5 806 1,132 1,391 40.5 22.8 72.5
Toledo City a/ 91.668 119,970 121,469 216.3 424 555 562 30.9 1.2 32.5Tuhurall 42,968 43,078 47.818 224.5 191 192 213 03 11.0 11.3Tudela aJ 9.611 9,537 9,358 33.0 291 289 284 -0.8 -1.9 -2.6
i'\EGROS OR1El"TAL 819,399 925.272 1.025.247 5,005.9 164 185 205 12.9 10.8 25.1
Amlnn (Ayuquitan) aJ 13,638 16,145 16,573 111.9 122 144 148 18.4 2.7 21.5
Ayungon 27,656 33,317 36.928 153.6 180 217 240 20.5 10.8 .n.5Bacong al 13.123 16.384 19,177 40.3 326 407 476 24.8 17.0 46.1Bais City 49.301 59.591 63.355 319.6 154 186 198 20.9 6.3 28.5Basay aJ 21.637 17,736 18.500 162.0 134 109 114 -18.0 4.3 .14.5
Bawayan 71.153 78,280 90,953 699.1 102 112 130 10.0 16.2 27.8
Bindoy (Payabonl 23.638 29.347 29.472 173.7 136 169 170 24.2 0.4 24.7
Canlaon City aJ 28.785 37.165 41.334 170.9 168 217 242 29.1 11.2 4].6
Dauin 14.992 17.51l 19,609 114.1 131 153 172 16.8 12.0 30.8
Dumaguelt: City a' 63.4 t 1 80.262 92.637 33.6 1,887 2.389 2,757 26.6 15.4 46.1
Guihulngan at 84.156 74,493 80,660 297.1 283 251 271 -11.5 8.3 -4.2Jimalalud 18.863 22,089 23,514 139.5 135 158 169 17.1 6.5 24.7L:l Llbertad 30.730 29,958 32,456 1l9.6 220 215 232 -2.5 8.3 5.6
:vlabin:lY 46,871 58.935 62,939 142.6 329 413 441 25.7 6.8 34.3M::mjuyod 26.257 31.989 34.545 264.6 99 121 III 21.8 8.0 31.6.
l'amplona 23.221 27,971 29,235 202.2 115 138 145 20.5 4.5 25.9San Jose at 10.938 12.821 14,952 54.5 201 235 274 17.2 16.6 36.7Santa Catalina 56.751 53.560 62,526 523.1 108 102 120 (5.6) 16.7 10.2Siaton 38.612 48,982 57,31l 335.9 115 146 171 26.9 17.0 48.4Sibulan al 2],123 27,172 ]1.206 163.0 142 167 191 17.5 14.8 ]5.0
Tanjay 57,299 62.656 65,634 276.1 208 227 238 9.3 4.8 14.5Tayns,m 21.473 25,749 31,567 154.2 119 167 205 19.9 22.6 47.0Valencia (Luzurriaga) a! 14.645 18,102 20,147 147.5 99 123 137 236 11.3 37.6Val1ehcrmoso a/ 25.043 27,945 31.110 101.3 247 276 307 11.6 11.3 24.2Zamboanguita 14.083 17,110 18,905 85.9 164 199 220 21.5 10.5 34.2
SIQUIJOR 70,]60 73,932 73,756 334.1 2lI 221 221 5.1 -0.2 4.8
Enrique Villanueva 4,770 4,733 4,868 28.6 167 165 170 -0.8 2.9 2.1Larena al 10.365 11.010 11,212 49.8 208 221 225 6.2 1.8 8.2Lazi 16.149 16,672 16.339 70.6 229 236 231 3.2 .2.0 1.2Maria 10,951 11.140 11,106 50.0 219 223 222 1.7 -0.3 1.4San Juan 10,592 11,517 11,371 44.4 239 259 256 8.7 .1.3 7.4
Siquijor 17.533 18,860 18,860 90.7 193 208 208 7.6 0.0 7.6
REGIO!'\"\'111. EASTERN 2.799,534 3.054.490 3.366,917 21,988.1 127 139 153 9.1 10.2 20.3
VISAYAS
EASTERN SAMAR ]20.637 329.335 362,324 4,430.7 72 74 82 2.7 10.0 130
Aneche 11.686 11,245 12,538 105.2 III 107 119 .3.8 11.5 7.3
Bal<lngiga 9.559 9.565 11,100 190.1 50 50 58 0.1 16.0 16.1Balangkayan aJ 8.703 7.609 8,849 207.1 42 37 43 -12.6 16.3 1.7
Borongan 39.741 44,085 48,638 562.9 71 78 86 10.9 10.3 22,4Can-avid 12,196 13,254 15,759 187.5 65 71 84 8.7 18.9 29.2
Dolores 26.949 30,570 34.272 308.6 87 99 111 13.4 12.1 27.2Gen. Macarthur 7,937 9.627 10,041 117.3 68 82 86 21.3 4.3 26.5Giporlos 10.128 11.001 10.050 97.5 104 113 103 8.6 .8.6 .0.8
(/f)National Statistics Office

25 Population, Land Area and Density
TABLE 2. POPULATION, LAND AREA AND POPULATION DE'lSITY OF THE PHILIPPINES BY REGION. PROVINCE. CITY/MUNICIPALITY:1980, 1990 AND 1995
ESTIMATEDREGI01\', rROVINCE. POPULATION LAND AREA POPULAnot< DENSITY PERCENT CHANGE IN DENSITY(lTV/MUNICIPALITY 1980 1990 1995 (SQ. """.) 1980 1990 1995 1980. 1990 1990.1995 1980 - 1995
(I) (2) (3) (4) (5) (I (6) gI (7) hi (8P! (9) j! (10) k!
(jU;U<lll 30,689 33.825 35.447 160.0 192 211 222 102 4.8 15.5Hem;mi 7,032 6,840 8,055 49.4 142 118 163 -2.7 17.8 14.5
Jipapad 4,586 5.207 6.222 234.8 20 22 26 13.5 19.5 35.7Lawn-an a' 7,275 7,792 9.725 162.6 45 48 60 7.1 24.8 33.7
L10rcnle 19,091 18.278 16,071 496.1 38 37 32 -4.3 -12.1 -15.8
'Masloy 1.956 3,089 3.634 250.0 8 12 15 57.9 17.6 85.8
Maydolong 11.353 10.656 12.201 400.0 28 27 31 .6.1 14.5 7.5
\lcrcedes 4,848 4.505 5,473 23.3 208 193 235 .7.1 21.5 12.9
Gras 27.031 26.978 31.533 188.7 143 143 167 .0.2 ](,.9 16.7Quinapundan 11.355 10,986 12.644 67.7 168 162 187 -3.2 15.1 11.4
Salcedo 16.355 16,597 16,026 113.8 144 146 141 1.5 .).4 .2.0
'San Julian 13,007 11,469 11.858 115.8 112 99 102 -11.8 3.4 .8.8
San Policarpio 12,258 9,970 11.565 78.0 157 128 148 .18.7 16.0 -5.7
Sulm 12.357 12,738 14,010 150.0 82 85 93 3.1 10.0 13.4
Taft 14,545 13,449 16,613 164.3 89 82 101 .7.5 23.5 14.2
LEYTE 1,19\,227 1,367,816 \,511.251 6.519.8 183 210 232 14.8 10.5 26.9
r\buyog 41.702 47,265 48,905 688.3 61 69 71 13.3 3.5 17.3
Alangalang aI 29,453 33.375 38.853 150.5 196 222 258 Il.J 16.4 31.9
Albuera 27.585 32.395 33.939 303.4 9\ 107 112 17.4 4.8 23.0
Bab(llngon at 16,449 17.400 19.653 115.2 143 151 171 5.8 12.9 19.5
Rarugo 22.173 23.817 26.171 84.6 262 282 309 . 7.4 9.9 18.0
BMa 24.529 28.197 29.810 69.9 351 403 426 15.0 5.7 21.5
Baybay 74.640 82.281 86.179 459.3 163 179 188 10.2 4.7 15.5
Burauen 48,053 46,029 50.751 265.3 181 173 191 -4.2 10.3 5.6
Calubian 26,564 25.968 31.074 101.0 263 257 308 -2.2 19.7 17.0
Clpoocan 20,726 23.687 26,384 185.4 112 128 142 14.3 11.4 27.3
Carigara af 34,377 38.863 42.302 114.0 302 341 371 13.0 8.8 23.1
Dagami 22,021 25.606 27.039 51.9 424 493 521 16.3 5.6 22.8
Dulag 28.219 33.020 34.742 110.7 255 298 314 17.0 5.2 23.1
Hilongos al 43,744 48,617 50,744 192.9 227 252 263 11.1 4.4 16.0
Hindang 16,163 16.272 16.567 50.0 323 325 331 0.7 1.8 2.5
[nopacan <II 15,878 16.894 18.864 94.6 168 179 199 6.4 11.7 18.8
Isabel at 15.980 33,389 36,134 63.8 250 m 566 108.9 8.2 [26.1
Jaro al 29,739 31.727 32.726 207.2 144 153 158 6.7 3.1 10.0
Javier 17,307 18.658 21.539 152.7 III 122 141 7.8 15.4 24.5
Julila 9,724 9.944 11,671 53.3 182 187 219 2.3 17.4 20.0
Kananga 28,426 36.288 39.795 144.2 197 252 276 27.7 9.7 40.(1
La Paz 16.546 14.311 16.366 72.7 228 197 225 .13.5 14.4 -1.1
Leyle aJ 29.288 32.575 34,126 131.3 223 248 260 11.2 4.8 16.5
.\laca11hur 12,780 1l.159 16,645 57.6 222 228 289 3.0 26.5 30.2
Mahaplag 20.381 22.673 24,009 104.8 194 216 229 11.2 5.9 17.8
Matag-Qb 16,401 15.474 17,333 104.4 157 148 166 -5.7 12.0 5.7
~1alalom 26,182 28.291 28.232 132.0 198 214 214 8.1 -0.2 7.8
Mayorga 1),750 10.530 11.073 144.3 68 73 77 8.0 5.2 13.6
\!Ierida aJ 18.838 22.345 23.822 95.2 198 235 250 18.0 6.6 26.5OmlOc City 31 104,978 129.456 144,003 613.6 171 211 235 23.3 11.2 37.2
Palo 0.1 31.124 38.100 43,095 221.3 141 172 195 22.4 13.1 38.5Palompon al 40,242 45.745 50.319 126.1 319 363 399 13.7 10.0 25.0P<l~:.trana 10.854 12.565 14.442 86.4 126 145 167 15.8 14.9 33.1San Isidro 22.285 24,442 33.204 122.5 182 200 271 9.7 35.8 49.0
San Miguel aJ 11.729 13,438 14,504 145.1 81 93 100 14.6 7.9 23.7
S;lnta Fe 9.728 12.119 13.695 54.0 180 224 254 24.6 13.0 40.8
Tabango 29,384 29.743 31.837 96.6 304 308 330 1.2 7.0 8.3
Tabontabon 6.468 7.183 7.547 23.8 272 302 317 11.1 5.1 16.7
(jfyNational Statistics Office
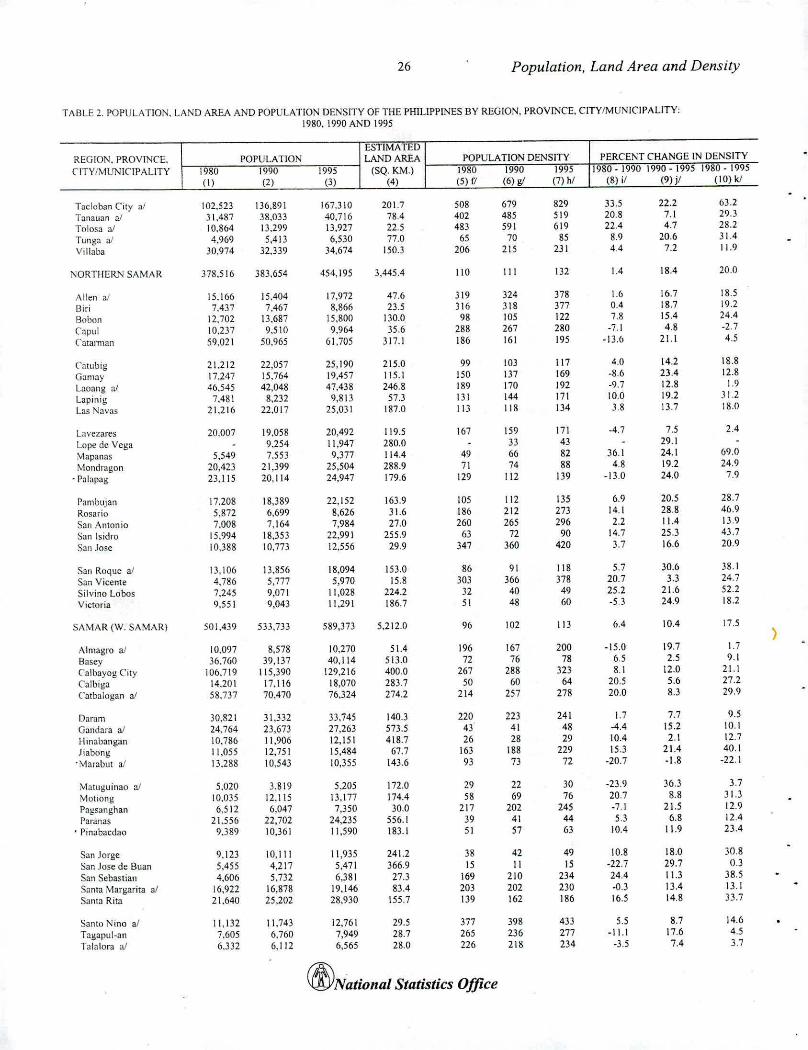
26 Population, Land Area and Density
TABLE 2. POPULATION. LAND AREA AND POPULATIO;.l DE'lSITY OF THE PHILIPPINES BY REGION. PROV~CE. CITY/MUNICIPALITY;1980, 1990 A!'\D 1995
ESTIMATEDREGION. PROVINCE, POPUl.ATION LAND AREA POPULA liON DENSITY PERCENT CHANGE IN DENSITYCITY/'i\,fUNICIPAlITY 1980 1990 1995 (SQ. KM.) 1980 1990 1995 1980 - 1990 1990 - 1995 1980.1995
(I) (2) (3) (4) (5) f/ (6) g! (7) hi (8) if (9) j/ (10) k/
Tacloban City a! 102.523 136.891 167.310 201,7 508 679 829 33.5 22.2 63.2
Tanauan a/ 3 \,487 38,033 40.716 78.4 402 485 519 20.8 7.1 29.3
Tolosa al 10,864 13.299 13,927 22.5 483 591 619 22.4 4.7 28.2
Tunga uJ 4.969 5,413 6,530 no 65 70 85 8.9 20.6 3\.4
Villaba 30,974 32.339 34,674 150.3 206 215 231 4.4 7.2 11.9
I\ORTlIER.'l SAMAR 378.516 383.654 454.195 3,445.4 110 111 132 1.4 18.4 20.0
Allen a! 15,166 15.404 17,972 47.6 319 324 378 1.6 16.7 18.5
Uiri 7,437 7,467 8.866 23.5 316 318 377 0.4 18.7 19.2
Hobnn 12,702 \3.687 15.800 \30.0 98 105 122 7.8 15.4 24.4
C'opul 10.237 9,510 9.964 35.6 288 267 280 -7.1 4.8 .2.7
C'n-farman 59.021 50.965 61.705 317.1 186 161 195 .13.6 21.1 4.5
Catubig 21,212 22,057 25.190 215.0 99 103 117 4.0 142 18.8
Gamay 17,247 15,764 19,457 115.1 150 137 169 .8.6 23.4 12.8
Lammg aJ 46,545 42,048 47,438 246.8 189 170 192 -9.7 12.8 1.9
Lapinig 7,481 8.232 9.813 57.3 131 144 171 10.0 19.2 31.2
Las Navas 21,216 22.017 25,031 187.0 113 118 \34 3.8 13.7 lito
Lavezares 20.007 19,058 20,492 119.5 167 159 171 -4.7 7.5 2.4
Lupe de Vega 9,254 11,947 280.0 33 43 29.1
~lapanas 5,549 7.553 9.377 114.4 49 66 82 36.1 24.1 69.0
Mondragon 20.423 21,399 25.504 288.9 71 74 88 48 19.2 24.9
. P<llilpa~ 23.115 20.114 24.947 179.6 129 112 139 .13.0 24.0 7.9
Pambujan 17.208 18,389 22.152 163.9 105 112 135 6.9 20.5 28.7
Rosario 5.872 6,699 8.626 3 \.6 186 212 273 14.1 28.8 46.9
San Antonio 7.008 7.164 7,984 27.0 260 265 296 2.2 11.4 \3.9
San Isidro 15,994 18,353 22.991 255.9 63 72 90 14.7 25.3 43.7
San Jose 10.388 10.773 12,556 29.9 347 360 420 3.7 16.6 20.9
San Roque al 13.106 13.856 18.094 153.0 86 91 118 5.7 30.6 38.1
San Vicente 4,786 5.777 5,970 15.8 303 366 378 20.7 3.3 24.7
Silvino Lobos 7,245 9.071 11,028 224.2 32 40 49 25.2 21.6 52.2
Victoria 9,551 9.043 11,291 186.7 51 48 60 .5.3 24.9 18.2
SA\IAR (W. SAMAR) 501,439 533,733 589.373 5.212.0 96 102 113 6.4 10.4 17.5)
Almagro aJ 10,097 8,578 10,270 51.4 196 167 200 .15.0 19.7 1.7
Basey 36.760 39.137 40.114 513.0 72 76 78 65 2.5 9.1
Calhayog CilY 106,719 115.390 129.216 400.0 267 288 323 81 12.0 2\.1
C'albiga 14.201 17.116 18.070 283.7 50 60 64 20.5 5.6 27,2
C'atbalogan 3.'58,737 70.470 76,324 274.2 214 257 278 20.0 8.3 29.9
Daram 30,821 31.332 33,745 140.3 220 223 241 1.7 7.7 9,5
Gandara aJ 24,764 23,673 27,263 57J.5 43 41 48 -4.4 15.2 10.1
Hinabangan 10.786 11,906 12.151 418.7 26 28 29 10.4 2.1 12,7
Jiabong 11.055 12,751 15,484 67,7 163 188 229 15.3 21.4 40.1
. \1arllbut ai \3.288 10.543 10.355 143.6 93 73 72 .20.7 .1.8 .22.1
MalUguinao a/ 5,020 3.819 5.205 172.0 29 22 30 .23.9 36.3 3.7
MOliong 10,035 12.115 13.177 174.4 58 69 76 20.7 8.8 31.3Pagsanghan 6,512 6,047 7,350 30.0 217 202 245 .7.1 21.5 12.9Paranas 21,556 22,702 24,235 556.1 39 41 44 5.3 6.8 12.4
• Pinabacdao 9,389 10,361 \1,590 183.1 51 57 63 10.4 11.9 23.4
San Jorge 9.123 IO,1l1 11,935 241,2 38 42 49 10.8 18.0 30.8San Jose de Buan 5,455 4,217 5,47\ 366.9 15 II 15 .22.7 29.7 0.3San Sebastian 4,606 5.732 6.381 27.3 169 210 234 24.4 11.3 38.5S:lnta Margarita aJ 16.922 16,878 19.146 83.4 203 202 230 -0.3 13.4 13.1Santa Rit:l 21,640 25,202 28.930 155.7 \39 162 186 16.5 14.8 33.7
Santo Nino aJ 11,132 1\,743 12,761 29.5 377 398 433 5.5 8.7 14.6
Tagapul-an 7.605 6,760 7,949 28.7 265 236 277 -I J.I 17.6 4.5
T<llalora aI 6.332 6.112 6.565 28.0 226 218 234 .3.5 7.4 3.7
(/f)N~tional StatisticsOffice
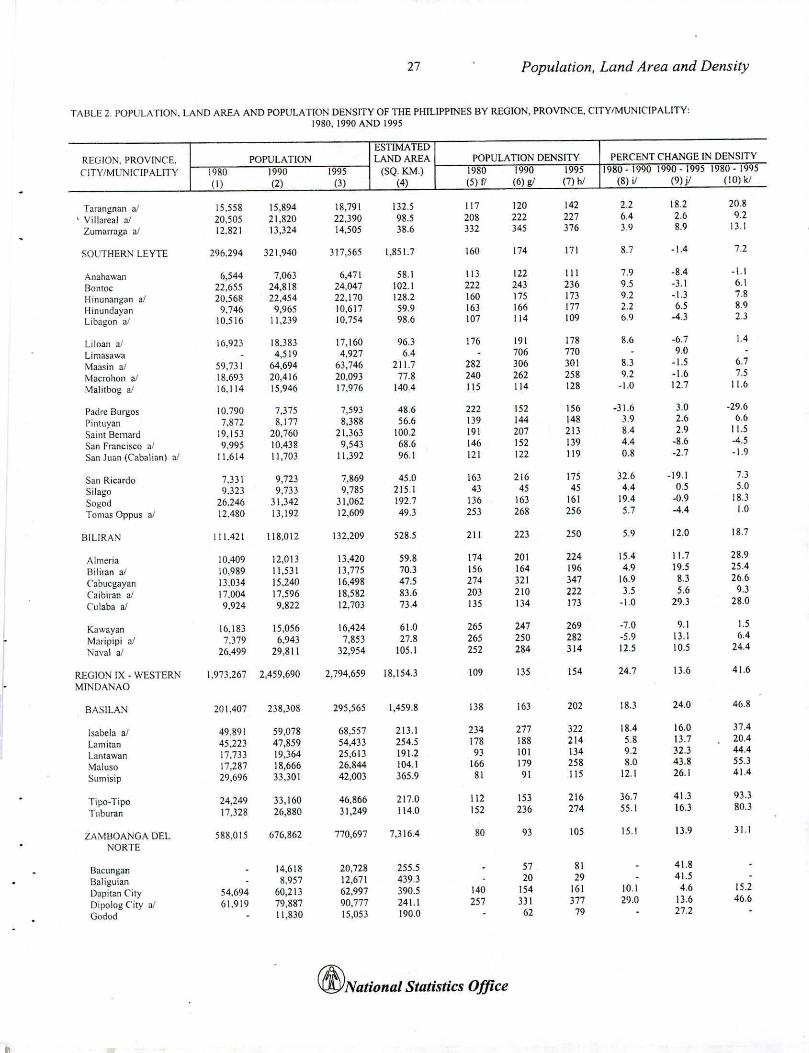
27 Population, Land Area and Density
TADLE 2. POPULATION. LAND AREA AND POPULATION DENSITY OF THE PHILIPPINES BY REGION, PROVIJ'CE, CITY/MUNICIPALITY;1980. 1990 AND 1995
ESTIMATEDREGION. PROVINCE, POPULATION LAND AREA POPULATION DENSITY PERCENT CHA!'GE IN DENSITY
CITY/MUNICIPALITY 1980 1990 1995 (SQ.KM.) 1980 1990 1995 1980-19901990.19951980-1995(I) (2) (3) (4) (5) fl (6) gI (7) hi (8) iI (9) jl (10) kl
Tarangnan a! 15.558 15,894 18,791 132.5 117 120 142 2.2 18.2 208
. Villareal aJ 20,505 21,820 22,390 98.5 208 222 227 6.4 2.6 9.2
Zumarraga aJ 12.82\ 13,324 14,505 38.6 332 345 376 3.9 8.9 13.1
SOUTHER!' LEYTE 296.294 321,940 317,565 1,851.7 160 174 171 8.7 .1.4 7.2
Anahawan 6.544 7,063 6,471 58.1 113 122 III 7.9 .8.4 .1.1
8ontoc 22,655 24,818 24,047 102.1 222 243 236 9.5 -3.1 6.1
Hinunangan aJ 20,568 22.454 22,170 128.2 160 175 173 9.2 -1.3 7.8
Hinundayan 9,746 9,965 10,617 59.9 163 166 177 2.2 6.5 8.9
Libagon a! 10.516 11.239 10,754 98.6 107 114 109 6.9 -4.3 2.3
Lilaan al 16,923 18,383 17,160 96.3 176 191 178 8.6 .6.7 1.4
Limasawa 4.519 4,927 6.4 706 770 9.0
Maasin al 59,731 64,694 63,746 211.7 282 306 301 8.3 -1.5 6.7
Macrohon iJ/ 18.693 20.416 20,093 77.8 240 262 258 9.2 -1.6 7.5
Malilbog al 16.114 15,946 17,976 140.4 115 114 128 -1.0 12.7 11.6
Padre Burgos 10.790 7.375 7,593 48.6 222 152 156 -31.6 3.0 -29.6
Pintuyan 7.872 8,177 8,388 56.6 139 144 148 3.9 2.6 6.6
Saini Bemard 19,153 20.760 21.363 100.2 191 207 213 8.4 2.9 11.5
San Francisco al 9,995 10,438 9,543 686 146 152 139 4.4 .8.6 -4.5
San Juan (Cabal ian) a' 11,614 11,703 11.392 96.1 121 122 119 0.8 -2.7 -1.9
San Ricardo 7.331 9,723 7,869 45.0 163 216 175 32.6 -19.1 7.3
Silago 9.323 9,733 9,785 215.1 43 45 45 4.4 0.5 5.0
Sogod 26.246 31,342 31,062 192.7 136 163 161 19.4 -0.9 18.3
Tomas Oppus aJ 12,480 13,192 12,609 49.3 253 268 256 5.7 -4.4 1.0
BIll RAN 111.421 118,012 132.209 528.5 211 223 250 5.9 12.0 18.7
Almeria IOA09 12,013 13,420 59.8 174 201 224 15.4 11.7 28.9
Biliran aI 10,989 11,531 13,775 70.3 156 164 196 4.9 19.5 25.4
C'abucgayan 13.034 15,240 16,498 47.5 274 321 347 16.9 8.3 26.6
Caihiran aI 17,004 17,596 18,582 83.6 203 210 222 3.5 5.6 9.3
Culaba aJ 9,924 9,822 12,703 73,4 135 134 173 - 1.0 29.3 28.0
Kawayan 16,183 15,056 16,424 61.0 265 247 269 -7.0 9.1 I.5
Maripipi a/ 7.379 6,943 7,853 27.8 265 250 282 -5.9 13.1 6.4
INaval a/ 26,499 29,811 32,954 105.1 252 284 314 12.5 10.5 24.4
I REGION IX - WESTER:-I 1,973,267 2,459,690 2,794,659 18,154.3 109 I35 154 24.7 13.6 41.6
MINDANAO
BASILA:"J 20 I ,407 238,308 295,565 1,459.8 138 163 202 18.3 24.0 46.8
Isabela al 49,891 59,078 68,557 213.1 234 277 322 18.4 16.0 37,4
Lamilan 45,223 47,859 54,433 254.5 178 188 214 5.8 13.7 20.4
Lantawan 17,733 19,364 25,613 191.2 93 101 134 9.2 32.3 44.4
Ma[uso 17,287 18,666 26,844 104.1 166 179 258 8.0 43.8 55.3
Sumisip 29,696 33,301 42,003 365.9 81 91 115 12.1 26.1 41.4
Tipo-Tipo 24,249 33,160 46,866 217.0 112 153 216 36.7 41.3 93.3
Tuburan 17,328 26,880 31,249 114.0 152 236 274 55.1 16.3 80.3
ZAMBOA..~GA DEL 588,015 676,862 770,697 7,316.4 80 93 105 15. I 13.9 31.1
NORTE
Bacungan 14,618 20,728 255.5 57 81 41.8
Baliguian 8,957 12,671 439.3 20 29 41..5
Dapitan City 54.694 60.213 62,997 390.5 140 154 161 10.1 4.6 15.2
Dipolog City aJ 61,919 79,887 90,777 241.1 257 331 377 29.0 13.6 46.6
Godod 11,830 15,053 190.0 62 79 27.2
(/f)National Statistics Office
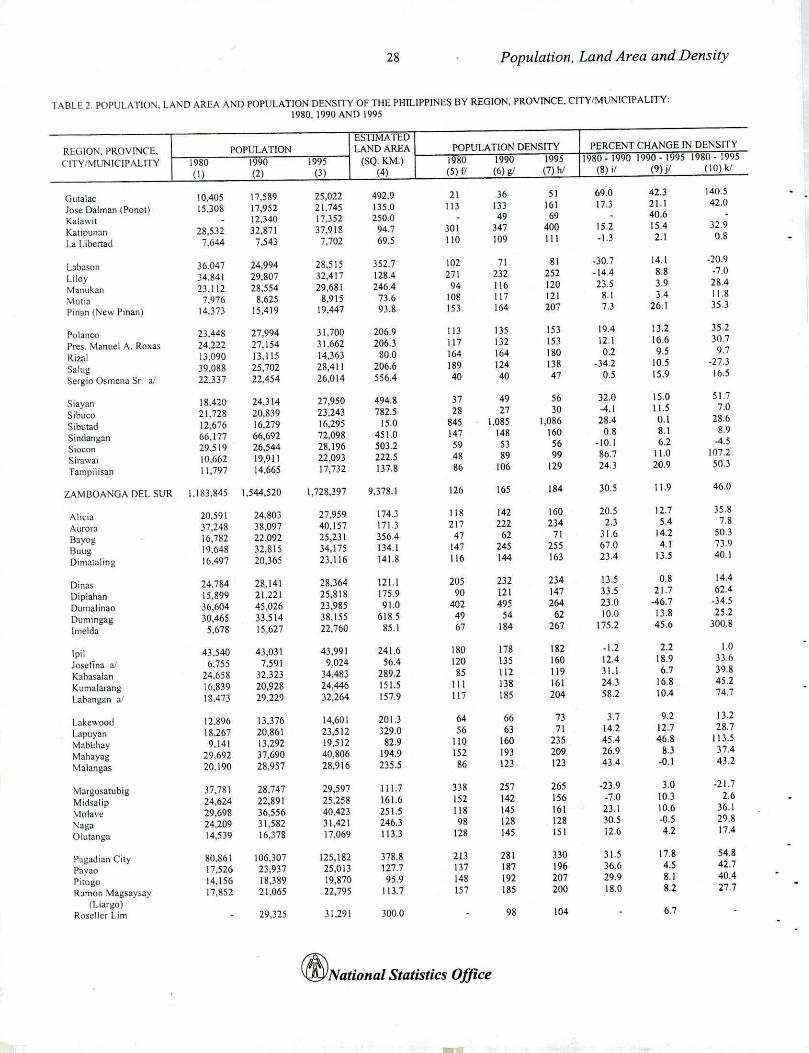
28 Population, Land Area and Density
TABLE 2. POPULATION, LAND AREA ,\NO POPULA nON DENSITY OF THE PHILIPPINES BY REGION, PROVlNCE. ClTYIMUl'lCIPALlTY;1980,1990 AND 1995
ESTIMATEDREGION, PROVI~CE. POPULATION LAND AREA POPULATION DENSITY PERCENT CHANGE IN DENSITY
CITY/~1UNICIPALlTY 1980 1990 1995 (SQ.KM.) 1980 1990 1995 1980 - 1990 1990.1995 1980.1995
(I) (2) (3) (4) (5) fl (6) gI (7) hi (8) if (9) j! (lO)kl
Gulalac 10,405 17.589 25.022 492.9 21 36 51 69.0 42.3 140.5
Jose Dalman (POnol) 15,308 17.952 21,745 135.0 113 133 161 17.3 21.1 42.0
Kalawit 12.340 17,352 250.0 49 69 40.6
Katipunan 28.532 32,871 37,918 94.7 301 347 400 15.2 15.4 32.9
La Libertad 7.644 7,543 7.702 69.5 110 109 III .1.3 2.1 0.8
Labason 36.047 24.994 28,515 352,7 102 71 81 .30.7 14.1 .20.9
Liloy ]4,841 29.807 32.417 128.4 271 232 252 -14.4 8.8 .7,n
Manukan 23.112 28,554 29.681 246.4 94 116 120 23.5 3.9 28.4
\-tulia 7,976 8.625 8,915 73.6 108 117 121 8.1 3.4 11.8
Pinan (New Pman) 14.373 15,419 19,447 93.8 153 164 207 7.3 26.1 35.3
Polanco 23,448 27,994 31,700 206.9 113 135 153 19.4 13.2 35.2
Pres. \1anuel A. Roxas 24,222 27.154 31.662 206.3 117 132 153 12.1 16.6 30,7
Rizal 13.090 13.115 14,363 80.0 164 164 180 0.2 9.5 9.7
Salug 39.088 25.702 28.411 206.6 189 124 138 -34.2 10,5 .27,3
Sergio Osmena Sr. ,; 22.337 22.454 26,014 556.4 40 40 47 0.5 15.9 16.5
Siayan 18,420 24,314 27.950 494.8 37 49 56 32.0 15.0 51.7
Sibuco 21,728 20,839 23,243 782.5 28 27 30 -4.1 11.5 7.0
Sibutad 12.676 16,279 16.295 15.0 845 1.085 1,086 28.4 0.1 28.6
Sindang:m 66,177 66,692 72.098 451.0 147 148 160 0.8 8.1 8.9
Siocon 29,519 26,544 28,196 503.2 59 53 56 .10.1 6.2 -4.5
Sirawai 10,662 19,91\ 22.093 222.5 48 89 99 86.7 11.0 J07.2
Tampilisan 11.797 14,665 17,732 137.8 86 106 129 24.3 20.9 50.3
ZAMBOANGA DEL SUR 1.183,845 1.544,520 1.728,397 9,378.1 126 165 184 30.5 11.9 46.0
Alicia 20,591 24,803 27,959 174.3 118 142 160 20.5 12.7 35.8
Aurora 37,248 38.097 40,157 171.3 217 222 234 2.3 5.4 7.8
BJyog 16,782 22.092 25,231 356.4 47 62 71 31.6 14.2 50.3
Buug 19.648 32,815 34.175 134.1 147 245 255 67.0 4.1 73.9
Dimataling 16,497 20.365 23.116 141.8 116 144 163 2).4 13.5 40.1
Dinas 24,784 28,141 28,364 121.1 205 232 234 13.5 0.8 14.4
Diplahan 15.899 21.22 [ 25,818 175.9 90 121 147 33.5 21.7 62.4
Dumalinao 36,604 45,026 23.985 91.0 402 495 264 23.0 -46.7 .34.5
Dumingag 30.465 33,514 38,155 618.5 49 54 62 10.0 13.8 25.2
Imelda 5,678 15.627 22,760 85.1 67 184 267 175.2 45.6 ]00.8
'pil 43,540 43.031 43,991 241.6 180 178 182 .1.2 2.2 1.0
Jasenn:! al 6.755 7,591 9.024 56.4 120 135 160 12.4 18.9 )).0
Kahasalan 24.658 32.323 34,483 289.2 85 112 119 31.1 6.7 39.8
Kumalarang 16.839 20.928 24,446 151.5 111 138 161 24.3 16.8 45.2
Labangan a/ 18.473 29.229 32,264 157.9 117 185 204 58.2 10.4 74.7
Lakewood 12.896 13.376 14.601 201.3 64 66 73 3.7 9.2 13.2
Lapuyan 18.267 20.861 23,512 329.0 56 63 71 14.2 12.7 28.7
MablJhay 9.141 1),292 19,512 82.9 110 160 235 45.4 46.8 113.5
Mahayag 29.692 37.690 40,806 194.9 152 193 209 26.9 8.3 37.4
Malangas 20.190 28.957 28,916 235.5 86 l23 l23 4).4 -0.1 43.2
\1argosatubig 37.781 28.747 29.597 111.7 338 257 265 .23.9 3.0 .21.7
Midsalip 24,624 22,891 25.258 161.6 152 142 156 .7.0 10.3 2.6
.\Iolavc 29.698 )6.556 40,423 251.5 118 145 161 23.1 10.6 36.1
l':aga 24,209 31.582 31,421 246.3 98 128 128 30.5 .0.5 29.8
Olutanga 14.539 16,378 17,069 113.3 128 145 151 12.6 4.2 17.4
Pagadian City 80,861 106,307 125,182 378.8 213 281 330 31.5 17.8 54.8
Payao 17,526 23.937 25.01] 127.7 137 187 196 36.6 4.5 42.7
Pitogo 14,156 18.389 19.870 95.9 148 192 207 29.9 8.1 40.4
Ramon Magsaysay 17.852 21,065 22,795 113.7 157 185 200 18.0 8.2 27.7
(Liargo)RoscHer Lim 29.325 31.291 )00.0 98 104 6.7
(/iYNational Statistics Office
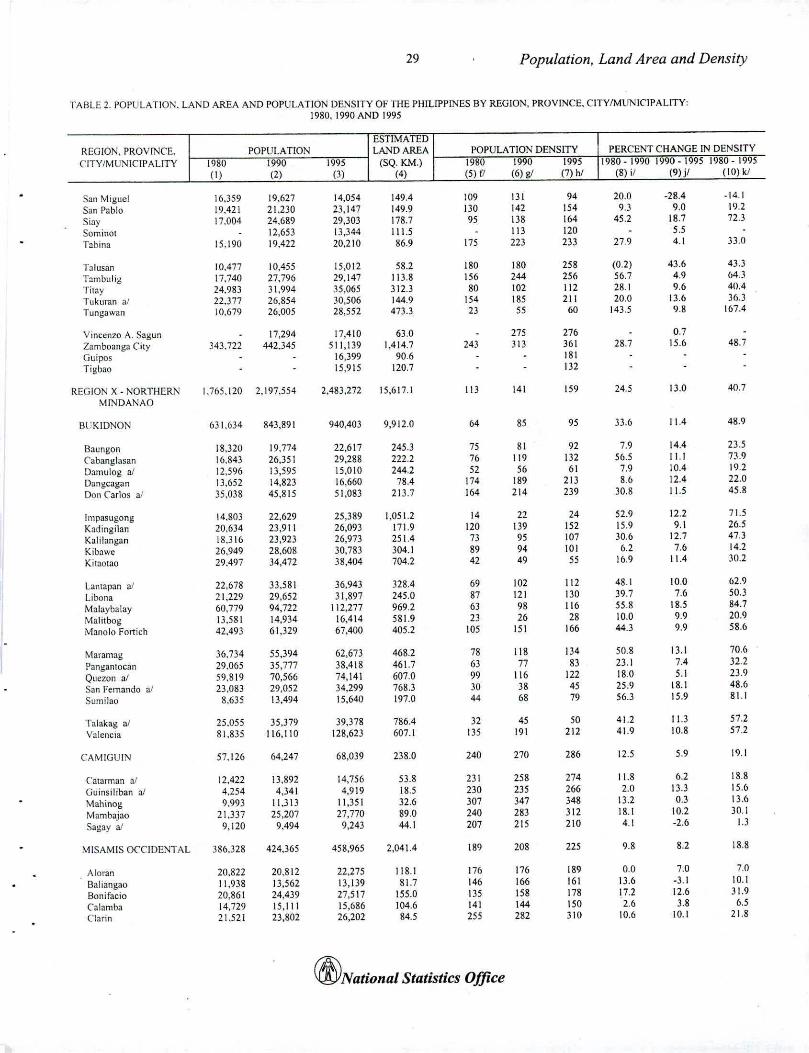
29 Population, Land Area and Density
TABLE 2. POPULATIOS. LAND AREA AI'D POPULATION DENSITY OF THE PHILIPPINES BY REGION. PROVINCE. CITY/MUNICIPALITY:1980, 1990AND 1995
ESTIMATEDREGION, PROV~CE, POPULATION LAND AREA POPULATIO" DENSITY PERCENT CHANGE IN DENSITYCITY/MUNICIPALITY 1980 1990 1995 (SQ. KM.) 1980 1990 1995 1980 - 1990 1990 - 1995 1980 - 1995
(I) (2) (3) (4) (5) fl (6) gI (7) hi (8) il (9) jf (Ill) kI
San Miguel 16.359 19.627 14.054 149.4 109 131 94 20.0 -28.4 -14.1
San Pablo 19,421 21,230 23,147 149.9 130 142 154 9.3 9.0 19.2
Siay 17.004 24,689 29,303 178.7 95 138 164 45.2 18.7 72.3
Sominot 12,653 13,344 111.5 113 120 5.5
Tabina 15,190 19,422 20,210 86.9 175 223 233 27.9 4.1 33.0
Talusan 10,477 10,455 15,012 58.2 180 180 258 (0.2) 43.6 43.3Tambulig 17.740 27,796 29,147 113.8 156 244 256 56.7 4.9 ()4.)
Tilay 24,98] 31,994 35,065 312.3 80 102 112 28.1 9.6 40.4Tukuran al 22.377 26,854 30,506 144.9 154 185 211 20.0 13.6 36.3Tungawan !O.679 26,005 28,552 473.3 23 55 60 14].5 9.8 167.4
Vincenzo A. Sagun 17,294 17,410 63.0 275 276 0.7Zambo<lllga City 343.722 442.345 511,139 1,414.7 243 313 361 28.7 15.6 48.7Guipos 16,399 90.6 181Tigbao 15,915 120.7 132
REGION X . NORTHER;"\' 1.765,120 2.197,554 2,483,272 15,617.1 113 141 159 24.5 13,0 40.7MINDANAO
BI'KIDNON 631,634 843,891 940,403 9,912.0 64 85 95 33.6 11.4 48.9
Baungon 18,320 19,774 22,617 245.3 75 81 92 7.9 14.4 23.5
C'abanglasan 16,843 26,351 29,288 222.2 76 119 132 56.5 11.1 73.9
Damulog aJ 12.596 13,595 15,010 244.2 52 56 61 7.9 10,4 19.2
Dangcagan 13,652 14,823 16,660 78.4 174 189 213 8.6 12.4 22.0
Don Carlos al 35,038 45.815 51,083 213.7 164 214 239 30.8 I 1.5 45.8
Impasugong 14,803 22,629 25,389 1,051.2 14 22 24 52.9 12.2 71.5
Kadingi!an 20,634 23,911 26,Q93 171.9 120 139 152 15.9 9.1 26.5
Kalilangan 18,316 23,923 26,973 251.4 73 95 107 30.6 12.7 47.3
Kibawe 26,949 28,608 30,783 304.1 89 94 101 62 7.6 14.2
Kilaotao 29,497 34,472 38,404 704.2 42 49 55 16,9 11.4 30.2
lantapan aJ 22.678 33,581 36,943 328.4 69 102 112 48.1 10.0 62.9
Libona 21,229 29,652 31,897 245.0 87 121 130 39.7 7.6 50.3
Malaybalay 60,179 94.722 112,277 9692 63 98 116 55.8 18.5 84.7
IMalitbog 13.581 14.934 16,414 581.9 23 26 28 10.0 9.9 20.9
Manolo Fortich 42,493 61,329 67,400 405,2 105 151 166 44.3 9.9 58.6
-Maramag 36.734 55,394 62,673 468.2 78 118 134 50.8 13.1 70.6
I Pangantocan 29,065 35,777 38,418 461.7 63 77 83 23.1 7.4 322
Quezon 011 59.819 70,566 74,141 607.0 99 116 122 18.0 5.1 23.9
San Fernando al 23,083 29.052 34,299 768.3 311 38 45 25.9 18.1 48.6
Sumitao 8,635 13,494 15,640 197.0 44 68 79 56.3 15.9 81.1
Talakag af 25.055 35.379 39,378 786.4 32 45 SO 41.2 11.3 57.2
Valencia R1,835 116,110 128,623 607.1 135 191 212 41.9 10.8 57.2
CAMIGUIN 57.126 64,247 68,039 238.0 240 2711 286 12.5 5.9 19.1
Catarman al 12,422 13,892 14,756 53.8 231 258 274 11.8 6.2 18.8
Guinsiliban a! 4.254 4,341 4,919 18.5 230 235 266 2.0 13.3 15.6
Mahinog 9,993 11,313 11,35 I 32.6 307 347 348 13.2 0.3 13.6
Mambajao 21,337 25,207 27,770 89.0 240 283 312 18.1 10.2 30.1
Sagay aJ 9,120 9.494 9,243 44.1 207 215 210 4.1 -2.6 1.3
MISAMIS OCCIDENTAL 386.328 424.365 458,965 2,041.4 189 208 225 9.8 8.2 18.8
Aloran 20.822 20,812 22,275 118.1 176 176 189 0.0 7.0 7.0
Baliangao 11,938 13,562 13,139 81.7 146 166 161 13.6 -3.1 10.1
Bonifacio 20.861 24,439 27,517 155.0 I3S 158 178 17.2 12.6 31.9
Calamba 14,729 15,111 15,686 104.6 141 144 ISO 2.6 3.8 6.5('laTin 21.521 23,802 26,202 84.5 255 282 310 10,6 10.1 21.8
(/f;;Nationat Statistics Office
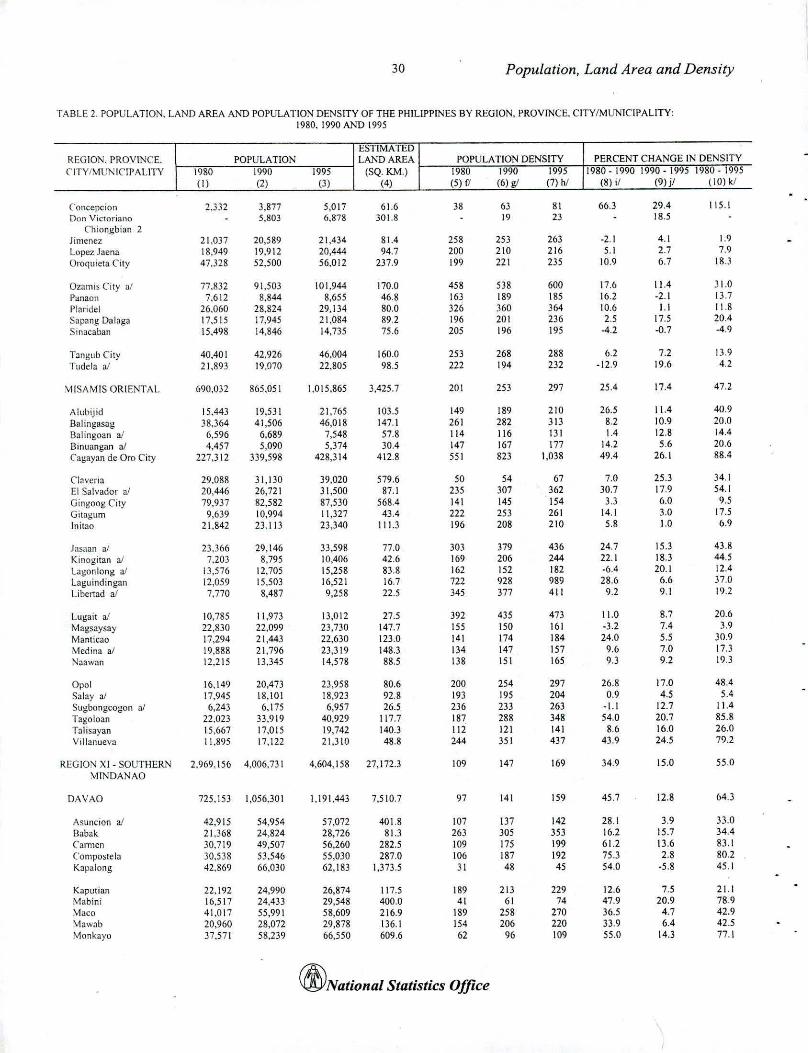
30 Populatio/l. La/ld Area a/ld Density
TABLE 2. POPULATION, LANO AREA AND POPULA nON DENSITY OF THE PHILIPPINES BY REGION, PROVINCE. CITY/MUNICIPALITY:1980. 1990 AND 1995
ESTIMATEDREGION, PROVINCE. POPULATION LAND AREA POPULA nON DENSITY PERCENT CHANGE rN DENSITYCITY/ML:KICIPALITY 1980 1990 1995 (SQ.KM.) 1980 1990 1995 1980.1990 1990 - 1995 1980.1995
(I) (2) (3) (4) (5) rJ (6) gI (7) hi (8) if (9) jf (10) kf
Concepcion 2.332 3.877 5,017 61.6 38 63 81 66.3 29.4 115.1Don Victori:mo 5,803 6,878 301.8 19 23 18.5
Chiongbian 2Jimenez 21.037 20.589 21,434 81.4 258 253 263 -2.1 4.1 1.9
Lopez Jaena 18,949 19,912 20,444 94.7 200 210 216 5.1 2.7 7.9
Oroquieta City 47.328 52.500 56.012 237.9 199 221 235 10.9 6.7 IlU
Ozamis City a/ 77.832 91,503 101.944 170.0 458 538 600 17.6 11.4 ) 1.0
Panaoll 7.612 8.844 8.655 46.8 163 189 185 16.2 -2.1 13,7Plaridcl 26.060 28.824 29.134 80.0 326 360 364 10.6 1.1 11.8
Sapang Dalnga 17,515 17,945 21,084 89.2 196 201 236 2.5 17.5 20.4
Sinacaban 15,498 14,846 14,735 75.6 205 196 195 -4.2 -0.7 -4.9
T.mgubCity 40,401 42.926 46,004 160.0 253 268 288 6.2 7.2 !J.9Tudela al 21.893 19,070 22,805 98.5 222 194 232 -12.9 19.6 4.2
\1iSAMIS ORIENTAL 690,032 865.051 1.015.865 3,425.7 201 253 297 25.4 17.4 47.2
Alubijid 15,443 19,531 21.765 103.5 149 189 210 26.5 11.4 40.9Balingasag 18.364 41,506 46,018 147.1 261 282 313 8.2 10.9 20.0
Balingoan 011 6.596 6.689 7,548 57.8 114 116 131 1.4 12.8 14.4
Binuangan aI 4,457 5.090 5,374 30.4 147 167 177 14.2 5.6 20.6
Cagayan de Oro City 227.312 339,598 428,314 412.8 551 823 1.038 49.4 26.1 88.4
("Iavena 29.088 31.130 39,020 579.6 SO 54 67 7.0 25.3 34.1
EJ Salvador a! 20,446 26.721 31.500 87.1 235 307 362 30.7 17.9 54.1
Gingoog City 79.937 82.582 87.530 568.4 141 145 154 3.3 6.0 9.5
Gitagum 9,639 10,994 11.327 43.4 222 253 261 14.1 3.0 17.5lnilao 21.842 23.113 23,340 111.3 196 208 210 5.8 1.0 0.9
Jasaan a! 23,366 29,146 33.598 77.0 30) 379 436 24.7 15.3 43.8
Kinogitan al 7,203 8.795 10,406 42.6 109 206 244 22.1 18.3 44.5
Lagonlong at 13,576 12.705 15.258 83.8 162 152 182 -6.4 20.1 12.4Laguindingan \2,059 15,503 16.521 16.7 722 928 989 28.6 6.6 37.0
Liber1ad 011 7.770 8,487 9.258 22.5 345 377 411 9.2 9.1 19.2
Lugait aI 10,785 11.973 13,0\2 27,5 392 435 473 11.0 8.7 20.6
Magsaysay 22.830 22.099 23.730 147.7 ISS ISO 161 -3.2 7.4 3.9
Manticao 17,294 21,443 22.630 123.0 141 174 184 24.0 5,5 30.9
Medina 011 19.888 21.796 23.319 148.3 134 147 157 9.6 7.0 17.3
Naawan 12.215 13.345 14,578 88.5 138 15\ 165 9.3 9.2 19.3
Opol 16.149 20.473 23.958 80.6 200 254 297 26.8 17.0 48.4
Salay aJ 17,945 18.101 18.923 92.8 193 195 204 0.9 4.5 5.4
Su~bongcogon aJ 6,243 6.175 6,957 26.5 236 233 263 .L1 12.7 11.4
Tagoloan 22.023 33.919 40,929 117.7 187 288 348 54.0 20.7 85.8
Talisayan 15.667 17.015 19.742 140.3 112 12\ 141 8.6 16.0 26.0Villanueva 11.1195 17.122 21,310 48.8 244 351 437 43.9 24.5 79.2
REGlON Xl - SOUTHER.."'J 2.969,156 4.006.731 4.604,158 27,172.3 109 147 169 34.9 15.0 55.0
~INDANAO
DAVAO 725.153 1.056.301 1.191.443 7,5 10.7 97 141 159 45.7 12.8 64.3
Asuncion at 42.915 54.954 57.072 401.8 107 137 142 28.1 3.9 33.0
Babak 21.368 24,824 28,726 81.3 263 305 353 16.2 15.7 34.4
Camlen 30.719 49,507 56.260 282.5 109 175 199 61.2 13.6 83.1
Compostela 30.538 53,546 55.030 287.0 106 187 192 75.3 2.8 80.2Kapalong 42.869 66.030 62.183 1.373.5 3\ 48 45 54.0 -5.8 45.1
Kaputian 22,192 24,990 26,874 117.5 189 213 229 12.6 7.5 2Ll.'-1abini 16.517 24.433 29,548 400.0 41 61 74 47.9 20.9 78.9Maco 41.017 55.991 58.609 216.9 189 258 270 36.5 4.7 42.9Mawab 20.960 28.072 29.878 136.1 154 206 220 33.9 6.4 42.5Monkayo 37,571 58.239 66.550 609.6 62 96 109 55.0 14.3 77.1
(/f;JNational Statistics Office
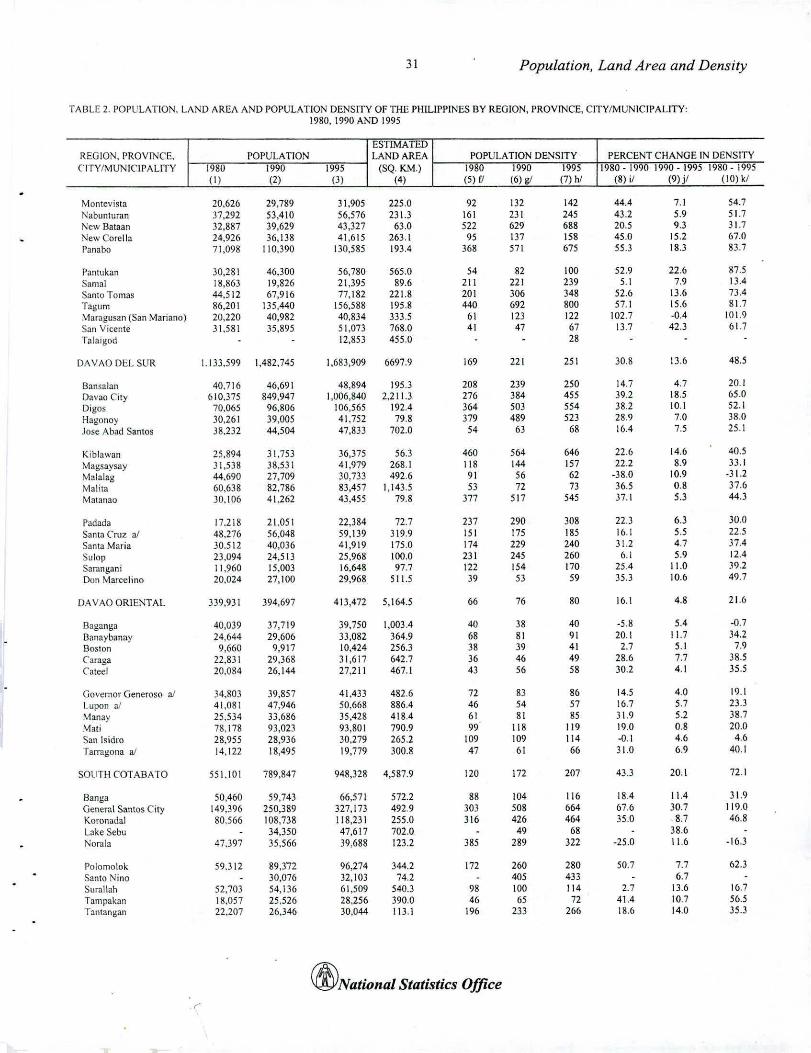
31 Population, Land Area and Density
TABLE 2. POPULATION. LASD AREA AND POPULATION DENSITY OF THE PHILIPPINES BY REGION, PROVrNCE, ClTY/MUNICIPALITY:1980, 1990 Al\"O 1995
ESTIMATEDREGION. PROVINCE. POPULATION LAND AREA POPULATION DENSITY PERCENT CHANGE IN DENSITYCITY/MUNICIPALITY 1980 1990 1995 (SQ. K.\4.) 1980 1990 1995 1980 - 1990 1990 - 1995 1980. 1995
(I) (2) (3) (4) (5) [I (6) gI (7) hi (8) ;1 (9) jf (10) kl
Montevisla 20,626 29,789 31,905 225.0 92 132 142 44.4 7.1 54.7r\abunturan 37,292 53,410 56,576 23 \.3 161 231 245 43.2 5.9 51.7!\ew Bataan 32,887 39,629 43,327 63.0 522 629 688 20.5 9.3 31.7New Corella 24.926 36,138 41,615 263.1 95 137 158 45.0 15.2 67.0Panabo 71,098 110,390 130,585 193.4 368 571 675 55.3 18.3 83.7
Pantukan 30,281 46.300 56,780 565.0 54 82 100 52.9 22.6 87.5Samal 18.863 19,826 21,395 89.6 211 221 239 5.1 7.9 13.4Santo Tomas 44,5 12 67,916 77,182 22\.8 201 306 348 52.6 13.6 73.4Tagum 86.201 135,440 156,588 1958 440 692 800 57.1 15.6 81.7Maragusan (San Mariano) 20.220 40,982 40,834 333.5 61 123 122 102.7 -0.4 [01.9San Vicente 31.581 35.895 51,073 768.0 41 47 67 13.7 42.3 61.7Talaigod 12.853 455.0 28
DAVAO DEL SUR 1.133,599 1.482.745 1.683.909 6697.9 169 221 251 30.8 13.6 48.5
Bansalan 40,716 46,691 48,894 195.3 208 239 250 14.7 4.7 20.1Davao City b10,375 849,947 1,006,840 2.211.3 276 384 455 39.2 18.5 65.0Dlgos 70.065 96,806 106,565 192.4 364 503 554 38.2 10.1 52.1Hagolloy 30.261 39,005 41.752 79.8 379 489 523 28.9 7.0 38.0Jose Abad Santos 38.232 44,504 47,833 702.0 54 63 68 16.4 7.5 25.1
Kiblawan 25,894 3\,753 36,375 56.3 460 564 646 22.6 14.6 40.5Magsaysay 31,538 38,531 41,979 268.1 118 144 157 22.2 8.9 33.1Malalag 44,690 27.709 30,733 4926 91 56 62 -38.0 10.9 -31.2Ma!ita 60,638 82,786 83.457 1,143.5 53 72 73 36.5 0.8 37.6Malanao 30,106 41.262 43.455 79.8 377 517 545 37.1 5.3 44.3
Padada 17,218 2 \,051 22.384 72.7 237 290 308 22.3 6.3 30.0Sanla Cruz aJ 48,276 56,048 59.139 319.9 151 175 185 16.1 5.5 22.5Sanla Maria 30.512 40,036 41,919 175.0 174 229 240 31.2 4.7 37.4Sulop 23.094 24,513 25.968 100.0 231 245 260 6.1 5.9 12.4Sarangani 11,960 15.003 16,648 97.7 122 154 170 25.4 11.0 39.2Don Marcelino 20.024 27,100 29.968 511.5 39 53 59 35.3 10.6 49.7
DAVAO ORIENTAL 339,931 394,697 413,472 5.164.5 66 76 80 16.1 4.8 21.6
Baganga 40,039 37,719 39,750 1,003.4 40 38 40 -5.8 5.4 -0.7Danaybanny 24,644 29,606 33,082 364.9 68 81 91 20.1 I \'7 34.2BasIon 9,660 9,917 10,424 256.3 38 39 41 2.7 5.1 7.9Caraga 22,831 29,368 31.617 642.7 36 46 49 28.6 7.7 38.5('atee! 20,084 26.144 27.211 467.1 43 56 58 30.2 4.1 35.5
Governor Cieneroso a/ 34,803 39,857 41,433 482.6 72 83 86 14.5 4.0 19.1Lupon a/ 41,081 47,946 50,668 886.4 46 54 57 16.7 57 23.3Manay 25,534 33,686 35,428 418.4 61 81 85 3 \'9 5.2 38.7Mall 78.178 93,023 93,801 790.9 99 118 119 19.0 0.8 20.0San Isidro 28.955 28,936 30,279 265.2 109 109 114 -0.1 4.6 4.6TiUTagona aJ 14,122 18,495 19.779 300.8 47 61 66 3 \'0 6.9 40.1
SOUTH C'OTABATO 551.101 789.847 948.328 4,587.9 120 172 207 43.3 20.1 72.1
Banga 50.460 59,743 66,571 572.2 88 104 116 18.4 1\.4 3 \,9General Santos City 149.396 250,389 327,173 492.9 303 508 664 67.6 30.7 119.0Koronadal 80,566 108.738 118.231 255.0 316 426 464 35.0 .8.7 46.8Lake Sehu 34.350 47,617 702.0 49 68 38.6Norala 47.397 35,566 39,688 123.2 385 289 322 -25.0 I\'6 -16.3
Polomolok 59,312 89,372 96,274 344.2 172 260 280 50.7 7.7 62.3Santo Nino 30,076 32,103 74.2 405 433 6.7Surallah 52.703 54,136 61,509 540.3 98 100 114 2.7 13.6 16.7Tampakan 18.057 25.526 28.256 390.0 46 65 72 41.4 10.7 56.5Tantang:m 22,207 26.346 30.044 113.1 196 233 266 18.6 14.0 35.3
({j);Natiollal Statistics Office
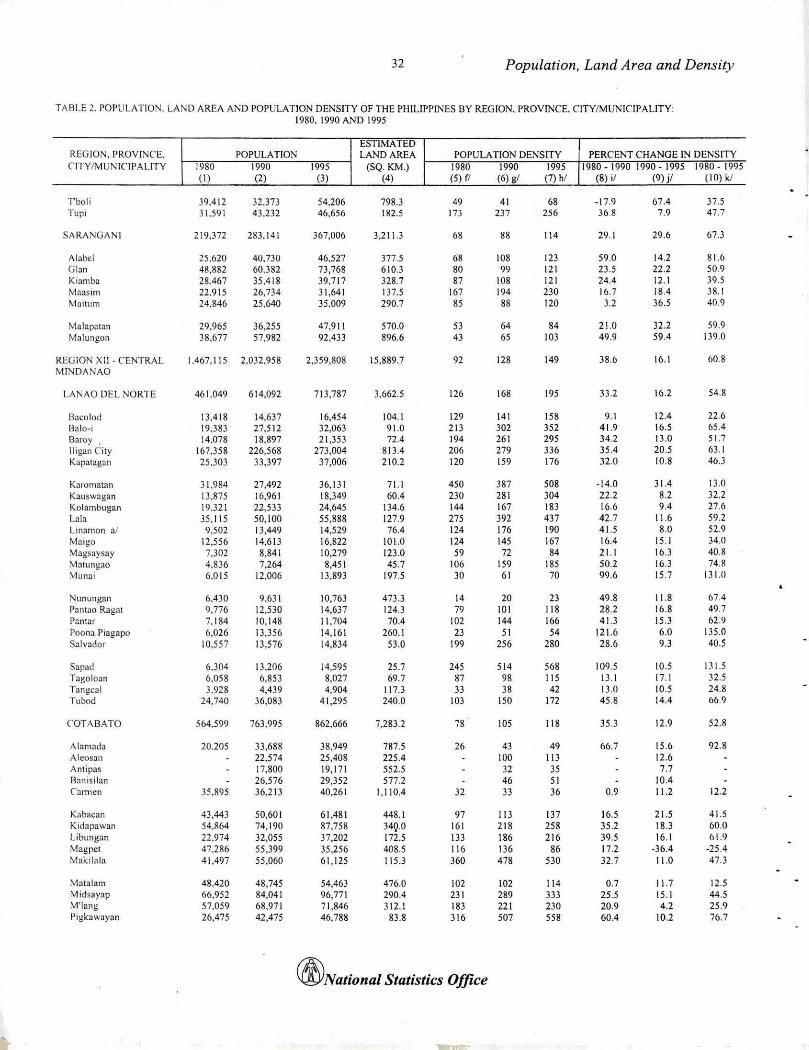
32 Population, Land Area and Density
TABLE 2. POPULATION, LAND AREA A!\D POPULA lION DENSITY OF THE PHILIPPINES BY REGION. PRQVlNCE. CITY/MUNICIPALITY:1980,191)0 A."1D 1995
ESTIMATEDREGION, PRQV(;';C'E. POPULATIOS LAND AREA POPULATION DESSITY PERCENT CHANGE IN DENSITYCITY/MLJr\IClPALITY 1980 1990 1995 (SQ.KM.) 1980 )990 1995 1980. 1990 1990 - 1995 1980-1995
(I) (2) (3) (4) (5) (I (6) gI (7) hi (8) if (9) jl (10) kl
Tboli 39,412 32,373 54,206 798.3 49 41 68 .17.9 67.4 37.5Tupi 31.591 43.232 46,656 182.5 173 237 256 36.8 7.9 47.7
SARANGANI 219.372 283.141 367,006 3,21 LJ 68 88 114 29.1 29.6 67.3
Alabd 25,620 40,730 46.527 377.5 68 108 123 59.0 14.2 81,6Glan 48.882 60,382 73,768 610.3 80 99 121 23.5 22.2 50.9Kiamba 28.467 35,418 39,717 328.7 87 108 121 24.4 12.\ 39.5Maasim 22,915 26.734 31,641 137.5 167 194 230 lb.? 18.4 38.1Maltum 24.846 25.640 35,009 290.7 85 88 120 3.2 36.5 40,9
Malapatan 29.965 36,255 47.911 570.0 53 64 84 21.0 32.2 59.9Malungon 38,677 57,982 92,433 896.6 43 65 103 49.9 59.4 139.0
REGION XII. CENTRAL 1.467,115 2.032.958 2,359,808 15.889.7 92 128 149 38.6 16.1 60.8MINDANAO
lANAO DEL NORTE 46[.049 614,092 713,787 3,662.5 126 168 195 33.2 16.2 54.8
Bacolod 13,418 14,637 16,454 104.1 129 141 158 9.1 12.4 22.6Balo-i 19.383 27,512 32,063 91.0 213 302 352 41.9 16.5 65.4Baroy , 14,078 18,897 21,353 72.4 194 261 295 34.2 13.0 51.7\ligan City 167,358 226,568 273,004 813.4 206 279 336 35.4 20.5 63.1Kapatagan 25,303 33,397 37,006 210.2 120 159 176 32.0 10.8 46.3
Kal'Omatan 31.984 27,492 36,131 71.1 450 387 508 .14.0 31.4 13.0Kauswagan 13,875 16,961 18.349 60.4 230 281 304 22.2 8.2 32.2Kolambugan 19.321 22.533 24,645 134.6 144 167 183 16.6 9.4 27.6Lil[a 35.115 50,100 55,888 127.9 275 392 437 42.7 11.6 59,2linamon ill 9.502 13,449 14,529 76.4 124 176 190 41.5 8.0 52.9Mnigo 12,556 14,613 16.822 101.0 124 145 167 16.4 15.1 34.0Magsnysay 7,302 8,841 10,279 123.0 59 72 84 21.1 16.3 40.8\1alungao 4,836 7,264 8,451 45.7 106 159 185 50.2 16.3 74.8\tIunai 6,015 12,006 13,893 197.5 30 61 70 99.6 15.7 131.0
Nunungan 6,430 9,631 10,763 473.3 14 20 23 49.8 11.8 67.4Panlao Ragal 9,776 12,530 14,637 124,J 79 101 118 282 16.8 49.7Pantar 7.184 10.148 11,704 70.4 102 144 166 41.3 15.3 62.9Poona Piagapo 6,026 13,356 14,161 260,1 23 51 54 121.6 6.0 135.0S:llv<ldor 10,557 13,576 14,834 53.0 199 256 280 28.6 9,3 40.5
Sapad 6,304 13,206 14,595 25.7 245 514 568 109.5 10.5 131.5Tagoloan 6,058 6,853 8,027 69.7 87 98 115 13.1 17.1 32.5Tangeal 3,928 4,439 4,904 117.3 33 38 42 !3.0 10.5 24.8Tubod 24,740 36,083 41,295 240.0 103 150 172 45.8 14.4 66.9
COTABATO 564,599 763.995 862.666 7.283.2 78 105 118 35.3 12.9 52.8
Alamada 20,205 33,688 38.949 787.5 26 43 49 66.7 15.6 92.8Aleos:ll1 22,574 25,408 225.4 100 113 12.6Antipas 17.800 19,171 552.5 32 35 7,7Banisi[an 26,576 29,352 577.2 46 51 10.4('alTTlen 35.895 36,213 40,261 1,110.4 32 33 36 0.9 11.2 12.2
Kabaean 43,443 50,601 61,481 448.1 97 113 137 16.5 21.5 41.5Kidapawan 54.864 74,190 87,758 34Q.0 161 218 258 35.2 18.3 60.0Libung:ln 22.974 32,055 37,202 172.5 133 186 216 39.5 16.1 61.9Magpct 47.286 55.399 35,256 408.5 116 136 86 17.2 .36.4 .25.4Makilala 41,497 55.060 61,125 liD 360 478 530 32.7 11.0 47.3
Y1alalam 48.420 48,745 54,463 476.0 102 102 114 0.7 11.7 12.5:\1id5ayap 66,952 84,041 96,771 290.4 231 289 333 25.5 15.1 44.5.\1'lang 57,059 68,971 71,846 312.1 183 221 230 20.9 4.2 25.9Pigkawayan 26,475 42,475 46,788 83.8 316 507 558 60.4 10.2 76.7
(jf)National Statistics Office
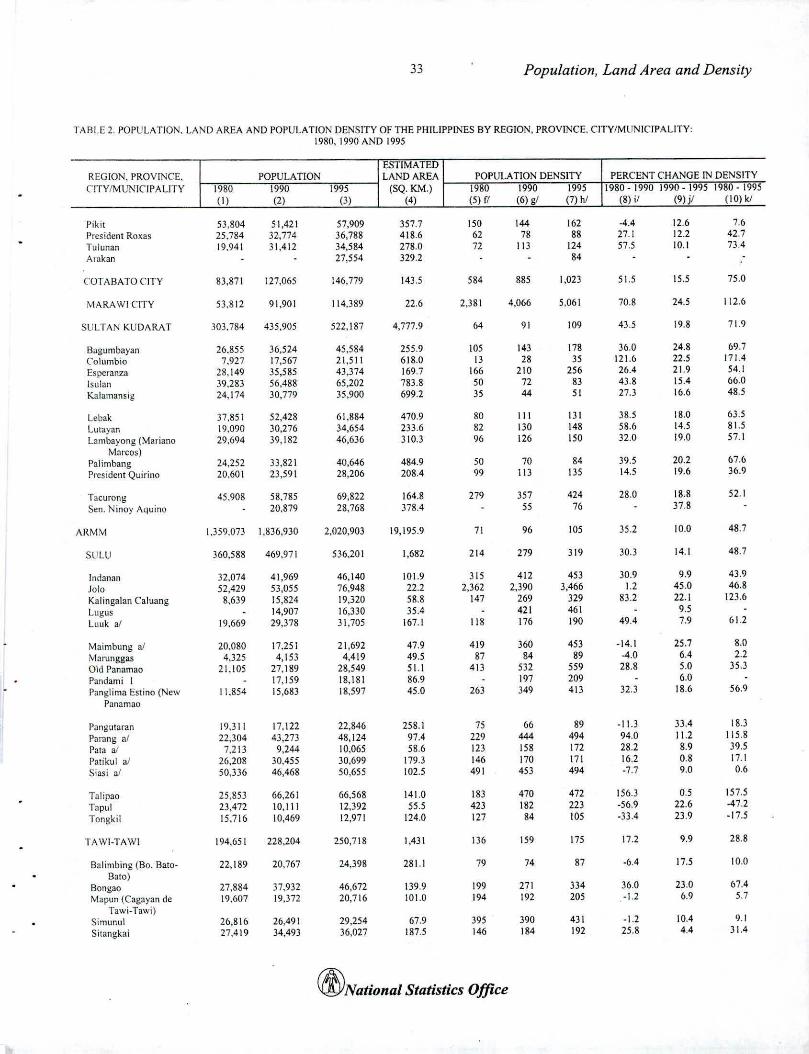
33 Population, Land Area and Density
TABLE 2. POPULATION. LA!'iO AREA AND POPULATION DENSITY OF THE PHILIPPINES BY REGION, PROVINCE, ('lTV/MUNICIPALITY:1980. 1990 AND 1995
ESTIMATEDREGION. PROVINCE. POPULATION LAND AREA POPULATION DENSITY PERCENT CHANGE IN DENSITYCITY/MUNICIPALITY 1980 1990 1995 (SQ. KM.l 1980 1990 1995 1980.1990 1990 - 1995 1980 - 1995
(I) (2) (3) (4) (5) f/ (6) g/ (7) hi (8) i/ (9) j/ (10) k/
Pikit 53,804 51,421 57.909 357.7 150 144 162 -4.4 12.6 7.•President Roxas 25.784 32,774 36.788 418.6 62 78 88 27.1 12.2 42.7Tulunan 19.941 31,412 34,584 278.0 72 113 124 57.5 10.1 73,4Arakan 27,554 329.2 84
COT ABA TO CITY 83.871 127.065 146,779 143.5 584 885 1.023 51.5 15.5 75.0
MARAWI CITY 53.812 91,901 114.389 22.6 2.381 4,066 5,061 70.8 24.5 112.6
SULTAN KUDARAT 303.784 435.905 522,187 4,777.9 64 91 109 43.5 19.8 71.9
Bagumbayan 26.855 36,524 45,584 255.9 105 143 178 36.0 24.8 69.7Columbia 7.927 17,567 21,511 618.0 13 28 35 121.6 22.5 171.4Esperanza 28.149 35.585 43,374 169.7 166 210 256 26.4 21.9 54.1
Isulan 39,283 56.488 65.202 783.8 50 72 83 43.8 15.4 66.0
Kalam:msig 24,174 30.779 35,900 699.2 35 44 51 27.3 16.6 48.5
Lebak 37,851 52,428 61,884 470.9 80 III 131 38.5 18.0 63.5Lutayan 19,090 30,276 34,654 233.6 82 130 148 58.6 14.5 81.5Larnbayong (~ariano 29,694 39,182 46,636 310.3 96 126 150 32.0 19.0 57.1
Marcos)Palimbang 24,252 33.821 40,646 484.9 50 70 84 39.5 20.2 67.6President Quirino 20.601 23,591 28,206 208.4 99 113 135 14.5 19.6 36.9
Tacurong 45.908 58,785 69,822 164.8 279 357 424 28.0 18.8 52.1
Sen. Ninoy Aquino 20.879 28,768 378.4 55 76 37.8
ARM\o1 1,359.073 1,836,930 2.020.903 19.195.9 71 96 105 35.2 10.0 48.7
SULU 360,588 469,971 536,201 1.682 214 279 319 30.3 14.1 48.7
Indanan 32.074 41,969 46,140 101.9 315 412 453 30.9 9.9 43.91010 52,429 53.055 7.,948 22.2 2.362 2,390 3.466 J.2 45.0 46.8
Kalingalan C'aluang 8,639 15,824 19.320 58.8 147 269 329 83.2 22.1 123.6
Lugus }4,907 16.330 35.4 421 461 9.5Luuk aJ 19.669 29,378 31.705 167.1 118 176 190 49.4 7.9 61.2
Maimbung aJ 20,080 17.251 21,692 47.9 419 360 453 .14.1 25.7 8.0Marunggas 4,325 4.153 4,419 49,5 87 84 89 -4.0 6.4 2.2
Old Panamao 21,105 27,189 28,549 51.1 413 532 559 28.8 5.0 35.3
Pandami I 17,159 18.181 86.9 197 209 6.0Panglima Estino (New 11,854 15.683 18,597 45.0 263 349 413 32.3 18.6 56.9
Pan:lm:lo
P:lngularan 19,311 17,122 22,84. 258.1 75 •• 89 -11,3 33.4 18.3
P:lrang aI 22.304 43,273 48,124 97.4 229 444 494 94.0 11.2 115.8P:lla aJ 7,213 9,244 10.065 58.6 123 158 172 28.2 8.9 39.5Patikul aI 26,208 30,455 30.699 179.3 146 170 171 16.2 0.8 17.1
Siasi a' 50,336 46,468 50,655 102.5 491 453 494 -7.7 9.0 06
Talipao 25.853 66,261 66,568 141.0 183 470 472 156.3 0.5 157.5
T<lpul 23,472 10.111 12.392 55.5 423 182 223 .56.9 22.6 -47.2Tongkil 15,716 10,469 12.971 124.0 127 84 105 -33.4 23.9 - I 7,5
TAWI.TAWI 194,651 228,204 250,718 1,431 136 159 175 17.2 9.9 28.8
Balimbing (Bo. Bato. 22.189 20.767 24,398 281.1 79 74 87 -6.4 17.5 10.0BalO)
Bongao 27,884 37.932 46,672 139.9 199 271 334 36.0 23.0 67.4Mapun (Cagayan de 19,607 19,372 20,716 101.0 194 192 205 -1.2 6.9 5.7
Tawi.Tawi)Simunul 26,816 26.491 29,254 67.9 395 390 431 .1.2 10.4 9.1
Sitangkai 27,419 34,493 36,027 187,5 146 184 192 25.8 4.4 31.4
(//YNational Statistics Office
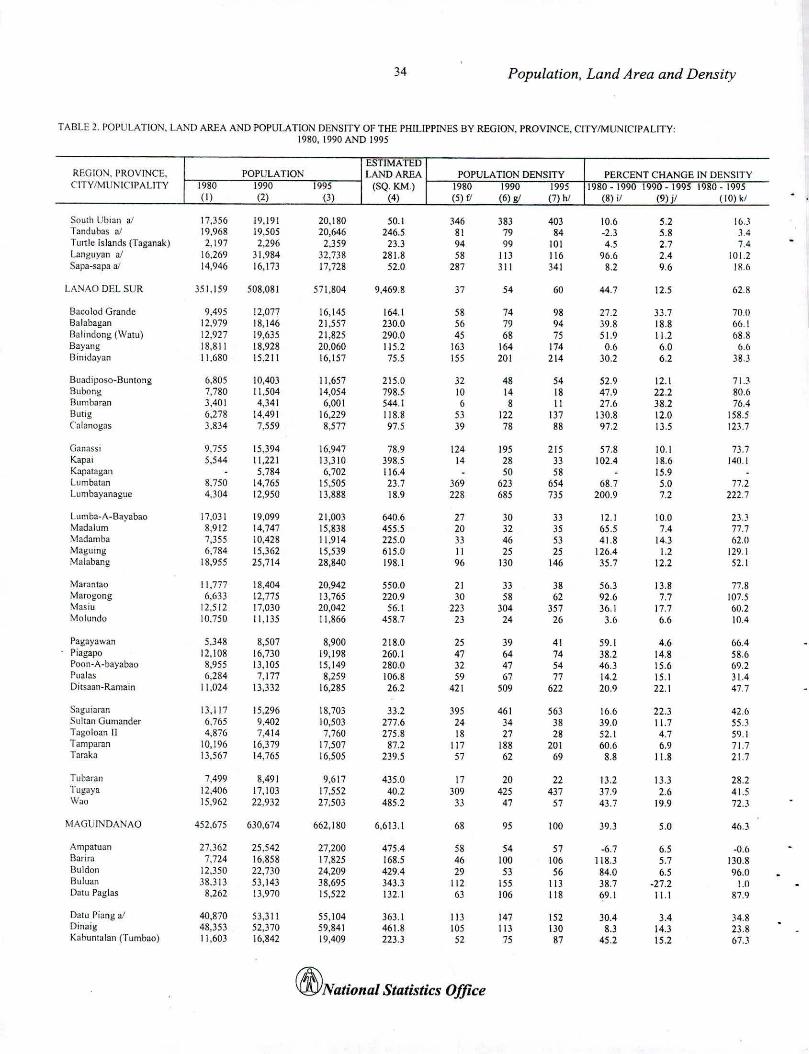
34 Population, Land Area and Density
TMlLE 2. POPULATION. LAND AREA AND POPULATION DENSITY OF THE PHiLiPPINES BY REGlO:-.l. PROVINCE. CITY/MUNICIPALITY:\980,1990 AND 1995
ESTIMATEDREGIO:-J, PROVINCE, POPULATION LAND AREA POPULATION DENSITY PERCENT CHANGE IN DENSITYCITY/MUNICIPALITY 1980 1990 1995 (SQ. KM.) 1980 1990 1995 1980-19901990-19951980-1995
(I) (2) (3) (4) (5) f/ (6) g/ (7) hi (8) if (9) j/ (10) kf
SIlUlh Ubian at 17,356 19,191 20,180 50.1 346 383 403 10.6 5.2 [CdTandubas a/ 19.968 19,505 20,646 246.5 81 79 84 -2.3 5.8 34Turtle Islands (Taganak) 2.197 2,296 2,359 23,3 94 99 101 4.5 2.7 7.4Languyan a/ 16,269 31.984 32,738 281.8 58 113 116 96.6 2.4 101.2Sapa-sapa al 14,946 16,173 17,728 52.0 287 311 341 8.2 9.6 18.(1
LA;.JAO DEL SUR 351,159 508,081 571,804 9,469.8 37 54 60 44.7 12.5 62.8
Bacolod Grande 9,495 12,077 16,145 164,1 58 74 98 27.2 33,7 70,0Balabagan 12,979 18,146 21,557 230.0 56 79 94 39.8 18.8 66.[Bahndong (\Vatu) 12,927 19,635 21,825 290.0 45 68 75 51.9 11.2 688Bayang 18,811 18,928 20,060 115,2 163 164 174 0,6 6.0 6.6Oinidayan 11.680 15,211 16,157 75,5 155 201 214 30,2 6.2 38,3
Buadiposo-Bunlong 6,805 10,403 11,657 215.0 32 48 54 52.9 12.1 71.3Bubong 7,780 11.504 14,054 798.5 10 14 18 47.9 22,2 80.6Bumbaran 3,401 4,341 6,001 544,1 6 8 II 27.6 38,2 76.4Butig 6.278 14,491 16,229 118,8 53 122 137 130.8 12.0 158.5C'a[anogas 3.834 7,559 8,577 97,5 39 78 88 97,2 13.5 123.7
Ganassi 9,755 15,394 16,947 78,9 124 195 215 57.8 10,1 73.7Kapai 5.544 11,221 13,310 398.5 14 28 33 102.4 18.6 [40.1Kapatagan 5,784 6,702 116.4 50 58 15,9lumbalan 8,750 14,765 15,505 23,7 369 623 654 68.7 5,0 77.2lumbayanague 4.]04 12,950 13,888 18,9 228 685 735 200,9 7,2 222,7
lumba-A-Bayabao 17,031 19.099 21.003 640.6 27 30 33 12.1 100 23.3~adalum 8.912 14.747 15,838 455.5 20 32 35 65.5 7,4 77.7Madamba 7,355 10,428 11.914 225.0 33 46 53 41.8 14.3 62.0Maguing 6.784 15.362 15,539 615.0 11 25 25 126.4 1.2 129.1Malabang 18.955 25,714 28,840 198,1 96 130 146 35.7 12.2 52.1
Marantao 11,777 18,404 20,942 550.0 21 33 38 56.3 13.8 77.8Marogong 6,633 12,775 13,765 220,9 30 58 62 92.6 7,7 107.5Masiu 12.512 17,030 20,042 56.1 223 304 357 36.1 17.7 60,2Molundo 10.750 11.135 11,866 458.7 23 24 26 3.6 6.6 10.4
Pagayawan 5.348 8,507 8,900 218.0 25 39 41 59.1 4.6 66.4Piagapo 12,108 16,730 19,198 260,1 47 64 74 38.2 14.8 58.6Poon-A-bayabao 8.955 13,105 15.149 280.0 32 47 54 46.3 15.6 69.2Pualas 6.284 7.177 8,259 106,8 59 67 77 14.2 15,1 31.4Ditsaan-Ramain 11.024 13,332 16,285 26.2 421 509 622 20.9 22,1 47.7
Saguiaran 13.117 15,296 18,703 33.2 395 461 563 16.6 22,3 42.6Sultan Gumander 6.765 9,402 10,503 277.6 24 34 38 39.0 11.7 55.3Tagoloan II 4.876 7,414 7,760 275.8 18 27 28 52.1 4,7 59,1Tamparan 10,196 16,379 17,507 87.2 117 188 201 60.6 6,9 71.7Taraka 13,567 14,765 16,505 239.5 57 62 69 8.8 11.8 21.7
Tubaran 7,499 8,491 9,617 435,0 17 20 22 13,2 13.3 28.2Tugaya 12,406 17,103 17,552 40.2 309 425 437 37.9 2,6 41.5Wao 15.962 22,932 27,503 485.2 33 47 57 43.7 19.9 72.3
MAGUINDANAO 452.675 630,674 662,180 6,613,1 68 95 100 39.3 5.0 4(1.3
Ampatuan 27.362 25,542 27,200 475.4 58 54 57 -6.7 6,5 -O,bOarira 7.724 16.858 17,825 168.5 46 100 106 118,3 5,7 1l0.8Buldon 12,350 22,730 24,209 429.4 29 53 56 84.0 6.5 96.0Buluan 38,313 53,143 38,695 343.3 112 155 III 38,7 -27.2 1.0Datu Paglas 8.262 13,970 15,522 132.1 63 106 118 69.1 11.1 87.9
Oatu Piang a/ 40.870 53,311 55.104 363.1 113 147 152 30.4 3.4 34.8Dinaig 48.353 52.370 59,841 461,8 105 113 130 8.3 14,3 23.8Kabunlalan (Tumbao) 11.60] 16,842 19,409 223.3 52 75 87 45.2 15,2 67 ..1
({f;;National Statistics Office
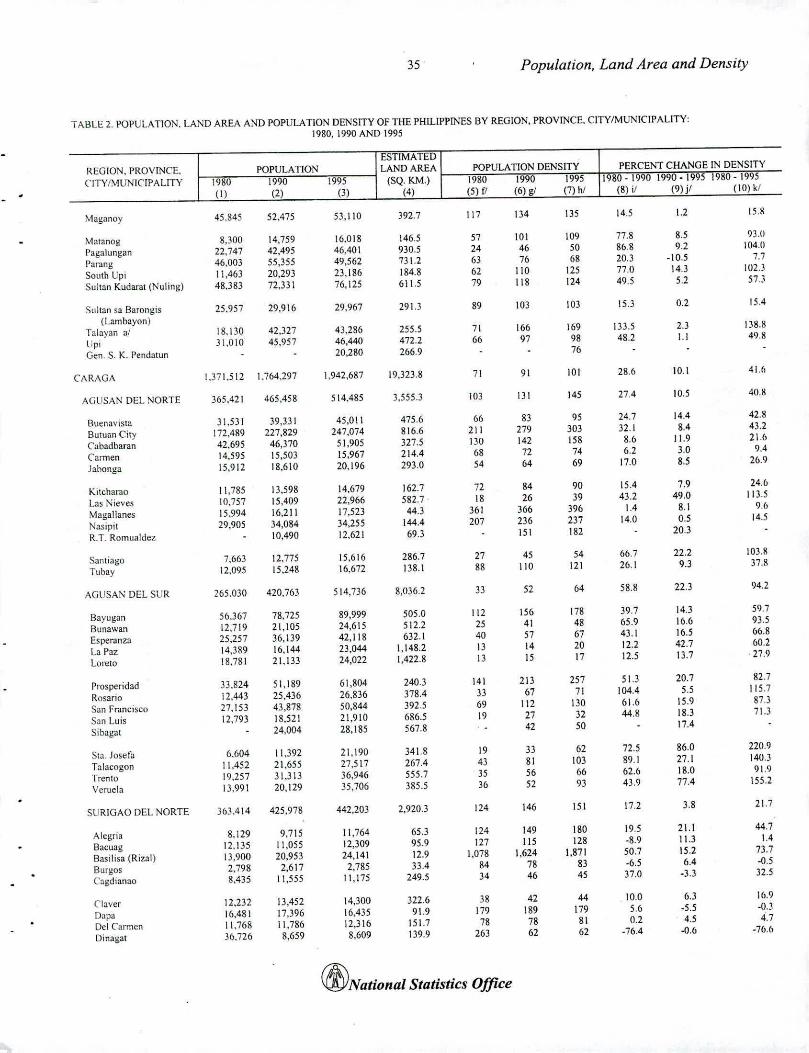
35 Population, Land Area and Density
TABLE 2. POPULATION. LAND AREA AND POPULATION DENSITY OF THE PHILIPPINES BY REGION, PROVINCE. CITY/MUNICIPALITY:1980, 1990 AND 1995
ESTIMATEDREGION. PROVINCE. POPULATION LAND AREA POPULATION DENSITY PERCEI'T CHANGE IN DENSITY
CITY 1\1UNIClPALITY 1980 19'10 1995 (SQ. KM.) 1980 1990 1995 1980.19901990-19951980-1995
(I) (2) (3) (4) (5) [I (6) gI (7) hi (8) ;/ (9) jl (10) kl
~1aganoy 45,845 52,475 53.110 392.7 117 134 135 14.5 1.2 IS.!/.
Mal3nog 8.300 14,759 16.018 146.5 57 101 109 77.8 8.5 93.0
Pagalungan 22,747 42,495 46,401 930.5 24 46 50 86.8 9.2 I04.ll
Parang 46,003 55,355 49,562 731.2 63 76 68 20.3 -10.5 7.7
South Cpi 11.463 20.293 23.186 184.8 62 110 125 77.0 14,3 102.3
Sultan Kudarat (Nuling) 48.383 72.331 76.125 611.5 79 118 124 49.5 5.2 57.,:i
Sultan sa Barongis 25.957 29.916 29.967 291.3 89 103 103 15.3 0.2 I SA
(Lambayon)Talayan al 18.130 42.327 43,286 255.5 71 166 169 133.5 2.3 138.8
Upi 31.010 45.957 46,440 472.2 66 97 98 48.2 1.1 49.8
Gen. S. K. Pendatun 20.280 266.9 76
C'ARAGA 1.371.512 1.764.297 1.942.687 19.323.8 71 91 101 28.6 10.1 41.6
AGLISAN DEL ~ORTE 365,421 465,458 514.485 3.555.) 103 131 145 27.4 10.5 40.X
Buenavista 31.531 39.33 I 45.011 475.6 66 83 95 24.7 14.4 42.8
Buluan City 172,489 227,829 247.074 816.6 211 279 303 32.1 8.4 4).2
Cabadbaran 42.695 46,370 51,905 327.5 1)0 142 158 8.6 1).9 21.6
Carmen 14.595 15.503 15,967 214.4 68 72 74 6.2 3.0 9.4
Jabonga 15.912 18.610 20.196 293.0 54 64 69 17.0 8.5 26.9
Kitcharao 11.785 13.598 14.679 162.7 72 84 90 15.4 7.9 24.()
Las Nieves 10.757 15,409 22,966 582.7 . 18 26 39 43.2 49.0 113.5
Magallanes 15.994 16.211 17.523 44.3 361 366 396 1.4 8.1 9.(,
Nasipit 29,905 34,084 ]4,255 144.4 207 236 237 14.0 0.5 14.5
R.T. Romualdez 10.490 12.621 69.3 151 182 203
Santiago 7,(6) 12.775 15,616 286.7 27 45 54 66.7 22.2 103.8
Tubay 12.095 15.248 16.672 138.1 88 110 121 261 9.3 37.8
AGUSAN DEL SUR 265,030 420,763 514.736 8.0362 J3 52 64 58.8 22.3 94.2
Bayugan 5().3()7 78.725 89,999 505.0 112 156 178 39.7 14.3 59.7
Bunawan 12.719 21.105 24.615 5122 25 41 48 65.9 16.6 93.5
Esperanza 25.257 36,139 42.118 632.1 40 57 67 43.1 16.5 66.8
La Paz 14.389 16.144 23.044 1.148.2 I) 14 20 12.2 42.7 60.2
Loreto 18.781 21.133 24,022 1,422.8 13 15 17 12.5 13.7 .27.9
Prosperidad 33.824 51.189 61.804 240.3 141 213 257 51.3 20.7 82.7
Rosario 12,443 25.436 26.836 378.4 33 67 71 104.4 5.5 115.7
San Francisco 27.153 43.878 50,844 392.5 69 112 130 6).6 15.9 87.3
San Luis 12.793 18.521 21.910 686.5 19 27 32 44.8 18.3 7).)
Sibagat 24.004 28.185 567.8 42 50 17.4
Sla. Josefa 6.604 11.392 21.190 341.8 19 33 62 72.5 86.0 220.9
Talacogon 11,452 21.655 27.517 267.4 43 81 103 89.1 27.1 1403
Trcnto 19.257 31.313 36.946 555.7 35 56 66 62.6 18.0 91.9
Vcruela 13.991 20,129 35,706 385.5 36 52 93 43.9 77.4 155.2
SURIGAO DEL NORTE 363.414 425.978 442,20) 2,920.3 124 146 151 17.2 3.8 21.7
Alegria 8.129 9.715 11,764 65.3 124 149 180 19.5 21.1 44.7
Bacuag 12.135 11,055 12.309 95.9 127 115 128 -8.9 11.3 1.4
Basilisa (Rizal) 13,900 20.953 24,141 12.9 1,078 1.624 1.871 50.7 15.2 73.7
Burgos 2,798 2,617 2.785 33.4 84 78 83 .6.5 6.4 -0.5
C:lgd13nao 8,435 11,555 11.175 249.5 34 46 45 37.0 -3.3 32.5
CI:lvcr 12.232 13,452 14.300 322.6 38 42 44 .10.0 6.3 16.9
Dapa 16,481 17.396 16.435 91.9 179 189 179 5.6 -5.5 -0.3
Dcl Carmcn 11,768 11,786 12,316 151.7 78 78 81 0.2 4.5 4.7
Dinagal 36.726 8.659 8,609 139.9 263 62 62 -76.4 -0.6 .76.6
(/f;JNational Statistics Office
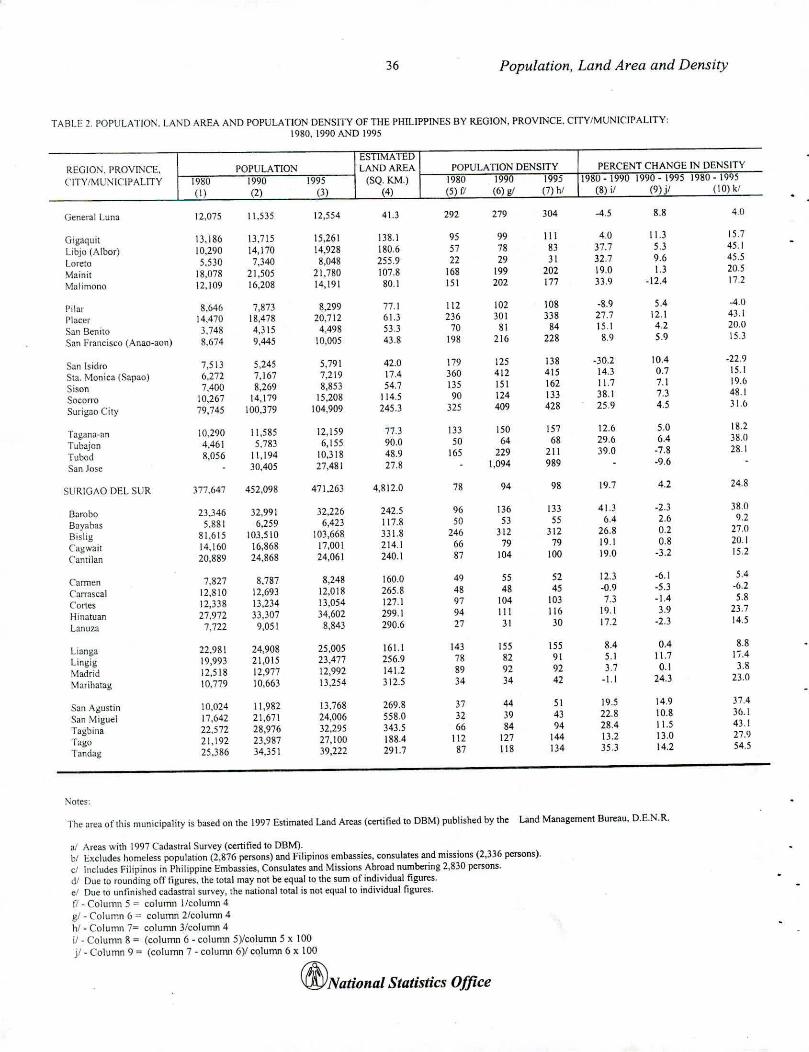
36 Population, Land Area and Density
TABLE 2. POPULATIO~. LAND AREA AND POPULATION DENSITY OF THE PHILIPPINES BY REGION. PROVINCE. CITY/MUNICIPALITY:1980.1990 AND 1995
ESTIMATEDREGIOS. PROVINCE. POPULATIO:-.J LAND AREA POPULATION DENSITY PERCENT CHANGE IN DENSITY
CITY/MUNICIPALITY 1980 1990 1995 (SQ.KM.) 1980 1990 1995 1980.19901990-1995 1980-1995(1 ) (2) (3) (4) (5) [I (6) gI (7) hi (8) it (9) jl (10) kI
General Luna 12,075 11.535 12,554 41.3 292 279 304 -4.5 8.8 4.0
Gigaquit 13.18. 13.715 15.261 138.1 95 99 111 4.0 11.3 15.7
Libjo (Aloof) 10.290 14.170 14.928 180.6 57 78 83 37.7 5.3 45.1
Loreto 5.530 7.340 8.048 255.9 22 29 31 32.7 9.6 45.5
Maini! 18.078 21.505 21,780 107.8 168 199 202 19.0 1.3 20.5
Malimono 12.109 16.208 14,191 80.1 151 202 177 33.9 -12.4 17.2
Pilar 8.646 7.873 8,299 77.1 112 102 108 .8.9 5.4 .4.0
Placer 14,470 18,478 20,712 61.3 236 301 338 27.7 12.1 43.1
San Benito 3,748 4.315 4,498 53.3 70 81 84 15.1 4.2 20.0
San Francisco (Anao-aon) 8.674 9.445 10.005 43.8 198 216 228 8.9 5.9 15.3
San Isidro 7,513 5,245 5,791 42.0 179 125 138 .30.2 lOA .22.9
Sta. Monica (Sapao) 6.272 7,167 7.219 17.4 360 412 415 14.3 0.7 15.1
Sison 7,400 8.269 8,853 54.7 135 151 162 11.7 7.1 19.6
Socono 10,267 14,179 15.208 114.5 90 124 133 38.1 7.3 48.1
Surigao City 79.745 100.379 104.909 245.3 325 409 428 25.9 4.5 31.6
Tagana-ao 10.290 11,585 12,159 77.3 III 150 157 12.6 5.0 18.2
Tubajon 4,461 5.783 6,155 90.0 50 64 68 29.() 6.4 38.lJ
Tubod 8.056 11,194 10.318 48.9 165 229 211 39.0 .7.8 281
San Jose 30,405 27,481 27.8 1.094 989 -9.6
SUR1GAO DEL SUR 377.647 452,098 471,263 4,812.0 78 94 98 19.7 4.2 24.8
Sarobo 2],346 32.991 32.226 242.5 96 136 133 41.3 .2.3 380
Bayabas 5.881 6,259 6,423 117.8 50 53 55 6.4 2.6 9.2
Bislig 81,615 103,510 103.668 331.8 246 312 312 26.8 0.2 27.0
('agwait 14.160 16.868 17,001 214.1 66 79 79 19.1 0.8 20.1
C'antilan 20.889 24.868 24.061 240.1 87 104 100 19.0 -3.2 15.2
('annen 7.827 8,787 8,248 160.0 49 55 52 12.3 .6.1 5.4
C':mascal 12.810 12.693 12.018 265.8 48 48 45 -0.9 -5.3 -6.2
C'0l1es 12.338 13,234 13,054 127.1 97 104 103 7.3 .1.4 5.8
Hinatuan 27.972 33.307 34,602 299.1 94 111 116 19.1 3.9 23.7
Lanu7.a 7.722 9.051 8.843 290.6 27 31 30 17.2 -2.3 14.5
Lianga 22.981 24,908 25,005 161.1 143 155 155 8.4 0.4 8.8
Ungig 19.993 21,015 23,477 256.9 78 82 91 5.1 11.7 li.4
\1adrid 12,518 12.977 12.992 141.2 89 92 92 3.7 0.1 3.8
Marih:nag 10.779 10.663 13.254 312.5 34 34 42 -1.1 24.3 23.0
San Agustin 10,024 11,982 13.768 269.8 37 44 51 19.5 14.9 37.4
San Miguel 17.642 21,671 24,006 558.0 32 39 43 22.8 10.8 36.1
Tagbina 22.572 28.976 32.295 343.5 66 84 94 28.4 11.5 43.1
Tago 21.192 23.987 27.100 188.4 112 127 144 13.2 13.0 27.9
Tandag 25.386 34.351 39.222 291.7 87 118 134 35.3 14.2 54.5
1'\otes:
The area of this municipality is based on the 1997 Estimated land Areas (certified to DBM) published by the Land Management Bureau. D.E.N.R.
a! Areas with 1997 Cadastral Survey (certified to DBM).hI Excludes homeless population (2.876 persons) and Filipinos embassies, consulates and missions (2,336 persons).cl Includes Filipinos in Philippine Embassies, Consulates and Missions Abroad numbering 2,830 persons.dl Due to rounding 00" ligures. the total may not be equal to the sum of individual figures.eJ Due to unfinished cadastral survey, the national tOlal is not equal to individual figures.fl. Column 5 = column I/column 4gJ • Column 6 = column 2/column 4hi - Column 7= column 3/column 4il - Column 8 =' (column 6 • column 5)1column 5 x 100j/_ Column 9 = (column 7 • column 6)1 cQlumn 6 x 100
@NatiOllal Statistics Office
37 Population, Land Area and Density
k/- Column 10 = (column 7. column S)/ column 5 x 100II Created into a municipality on May 8. 1995 under R.A. 7896 and 7897; laken from Jordan and Buenavista.ml Created into a municipality on May 8. 1995 under 7896 and 7897; taken from Jordan and Nueva Valencia.nr'Created into a region under R.A. 7864 dated November 26.1989; taken from Region 9 and Region 12.0/ Created into a region under R.A. 7901 dated February 23, 1995; taken from Region 10 and 11.
(//)National Statistics Office
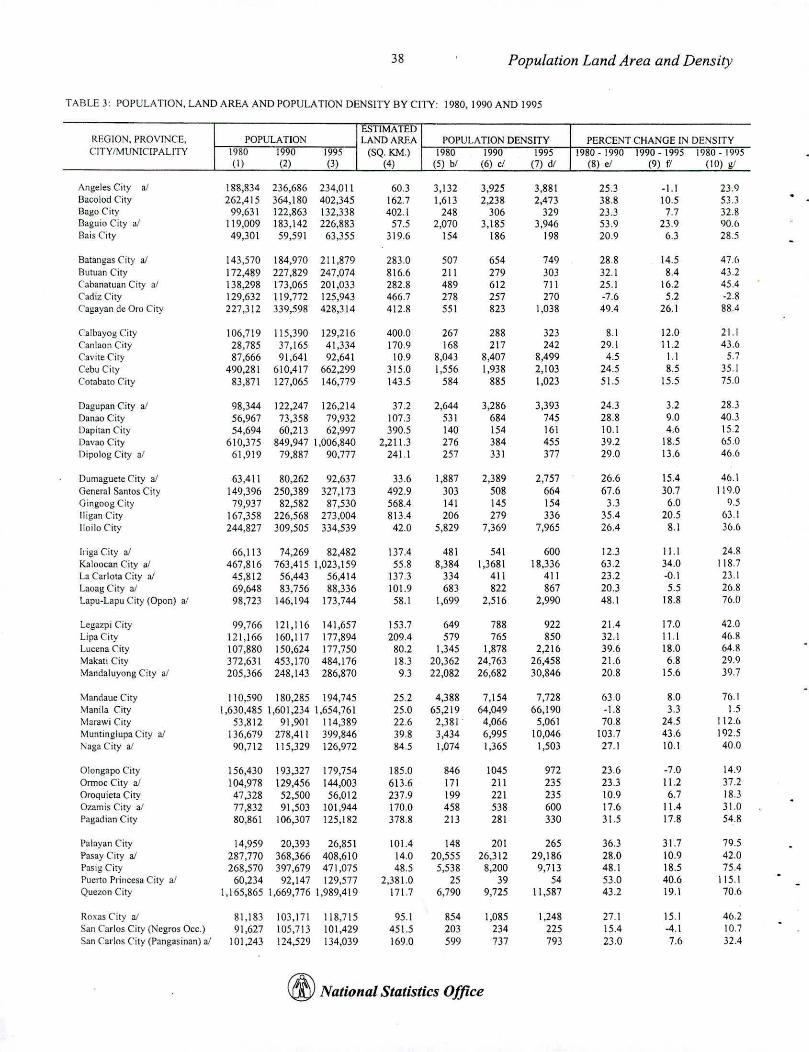
38 Population Land Area and Density
TABLE 3: POPULATION. LAND AREA AND POPULATION DENSITY BY CITY: 1980. 1990 AND 1995
ESTIMATEDREGION. PROVrNCE. POPULATION LASDAREA POPULATION DENSITY PERCENT CHANGE IN DENSITYCITY/MUNICIPALITY 1980 1990 1995 (SQ.KM.) 1980 1990 1995 1980 - 1990 1990 - 1995 1980 - 19()S
(I) (2) (3) (4) (5) bl (6) cI (7) dI (8) ,I (9) fl (10) '1,'
Angeles City oJ 188.834 236,686 234.011 60.3 3.132 3.925 3.881 25.3 -1.1 23.9Bacolod City 262.415 364,180 402,345 162.7 1.613 2.238 2,473 38.8 10.5 53.3Bago City 99,631 122.863 132.338 402.1 248 306 329 23.3 7.7 32.8Baguio City aJ 119.009 183.142 226.883 57.5 2.070 3.185 3.946 53.9 23.9 90.6Rais City 49.301 59,591 63.355 319.6 154 186 198 20.9 6.3 28.5
Batangas City aJ 143.570 184.970 211 ,879 283.0 507 654 749 28.8 14.5 47.6ButtJan eilY 172.489 227.829 247.074 816.6 211 279 303 32.1 8.4 43.2Cabanatuan City a' 138.298 173.065 201.033 282.8 489 612 711 25.1 16.2 45.4Cadiz City 129,632 119.772 125,943 466.7 278 257 270 -7.6 5.2 .2.8Cagayan de Oro City 227.312 339.598 428.314 412.8 551 823 1.038 49.4 26.1 88.4
Calbayog City 106.719 115.390 129.216 400.0 267 288 323 8.1 12.0 21.1Canlaan City 28.785 37.165 41.334 170.9 168 217 242 29.1 11.2 43.6('avile City 87.666 91.641 92.641 10.9 8,043 8.407 8,499 4.5 1.1 5.7Cebu City 490.281 610,417 662.299 315.0 1,556 1.938 2,103 24.5 8.5 35.1Colabato City 83,871 127.065 146,779 143.5 584 885 1.023 51.5 15.5 75.0
Dagupan City a/ 98,344 122.247 126.214 37.2 2,644 3,286 3,393 24.3 3.2 28.3Danao City 56,967 73.358 79,932 107.3 531 684 745 28.8 9.0 40.3Dapitan City 54,694 60.213 62,997 390.5 140 154 161 10.1 4.6 15.2Dav30 City 610,375 849.947 1.006.840 2,211.3 276 384 455 39.2 18.5 65.0Dipolog City a/ 61.919 79.887 90.777 241.1 257 331 377 29.0 13.6 46.6
Dumaguete City 3/ 63,411 80.262 92,637 33.6 1.887 2.389 2.757 26.6 15.4 46.1General Santos City 149.396 250,389 327,173 492.9 303 508 664 67.6 30.7 119.0Gingoog City 79,937 82,582 87,530 568.4 141 145 154 3.3 6.0 9.5lIigan City 167,358 226,568 273.004 813.4 206 279 336 35.4 20.5 63.1Iloilo City 244.827 309.505 334.539 42.0 5.829 7.369 7,965 26.4 8.1 36.6
Iriga City at 66.11 3 74,269 82.482 137.4 481 541 600 12.3 11.1 24.RKaloocan City aJ 467,816 763.415 1.023,159 55.8 8,384 1.3681 18.336 63.2 34.0 118.7La Carlota City aJ 45.812 56,443 56,414 137.3 334 411 411 23.2 -0.1 23.1Laoag City aJ 69,648 83.756 88,336 101.9 683 822 867 20.3 5.5 26.8Lapu-Lapu City (Dpon) aJ 98,723 146,194 173,744 58.1 1,699 2,516 2,990 48.1 18.8 76.0
Legazpi City 99,766 121,116 141.657 153.7 649 788 922 21.4 17.0 42.0Lipa City 121.166 160,117 177,894 209.4 579 765 850 32.1 11.1 46.RLucena City 107,880 150,624 177.750 80.2 1.345 1.878 2,216 39.6 18.0 64.8Makati City 372,631 453,170 484,176 18.3 20,362 24,763 26,458 21.6 6.8 29.9Mandaluyong City al 205,366 248,143 286.870 9.3 22,082 26.682 30.846 20.8 15.6 39.7
Mandaue City 110,590 180.285 194,745 25.2 4,388 7,154 7.728 63.0 8.0 76.1Manila City 1,630,485 1.601.234 1,654,761 25.0 65,219 64,049 66,190 -1.8 3.3 1.5Man~wiCity 53,812 91,901 114,389 22.6 2,381 . 4,066 5,061 70.8 24.5 112.6Muntinglupa City aJ 136.679 278.411 399,846 39.8 3,434 6,995 10,046 103.7 43.6 192.5l\'aga City aJ 90,712 115,329 126,972 84.5 1,074 1,365 1,503 27.1 10.1 40.0
Dlongapo City 156,430 193,327 179.754 185.0 846 1045 972 23.6 -7.0 14.9Onnoc City at 104.978 129,456 144,003 613.6 171 211 235 23.3 11.2 37.2Droquieta City 47,328 52,500 56,012 237.9 199 221 235 10.9 6.7 18.3Dzamis City aJ 77,832 91,503 101,944 170.0 458 538 600 17.6 11.4 31.0Pagadian City 80.861 106,307 125,182 378.8 213 281 330 31.5 17.8 54.8
Palayan City 14,959 20,393 26.851 101.4 148 201 265 36.3 31.7 79.5Pasay City aJ 287,770 368.366 408.610 14.0 20.555 26,312 29,186 28.0 10.9 42.0Pas;g City 268.570 397,679 471.075 48.5 5.538 8.200 9,713 48.1 18.5 75.4Puerto Princesli City at 60.234 92.147 129,577 2.381.0 25 39 54 53.0 40.6 115.1Quezon City 1,165,8651,669.7761,989,419 171.7 6.790 9,725 11.587 43.2 19.1 70.6
Roxas City aJ 81,183 103,171 118,715 95.1 854 1,085 1.248 27.1 15.1 46.2San Carlos City (Negros Dcc.) 91.627 105.713 101,429 451.5 203 234 225 15.4 -4.1 10.7San Carlos City (Pangasinan) aJ 101,243 124.529 134,039 169.0 599 737 793 23.0 7.6 32.4
((fj) National Statistics Office
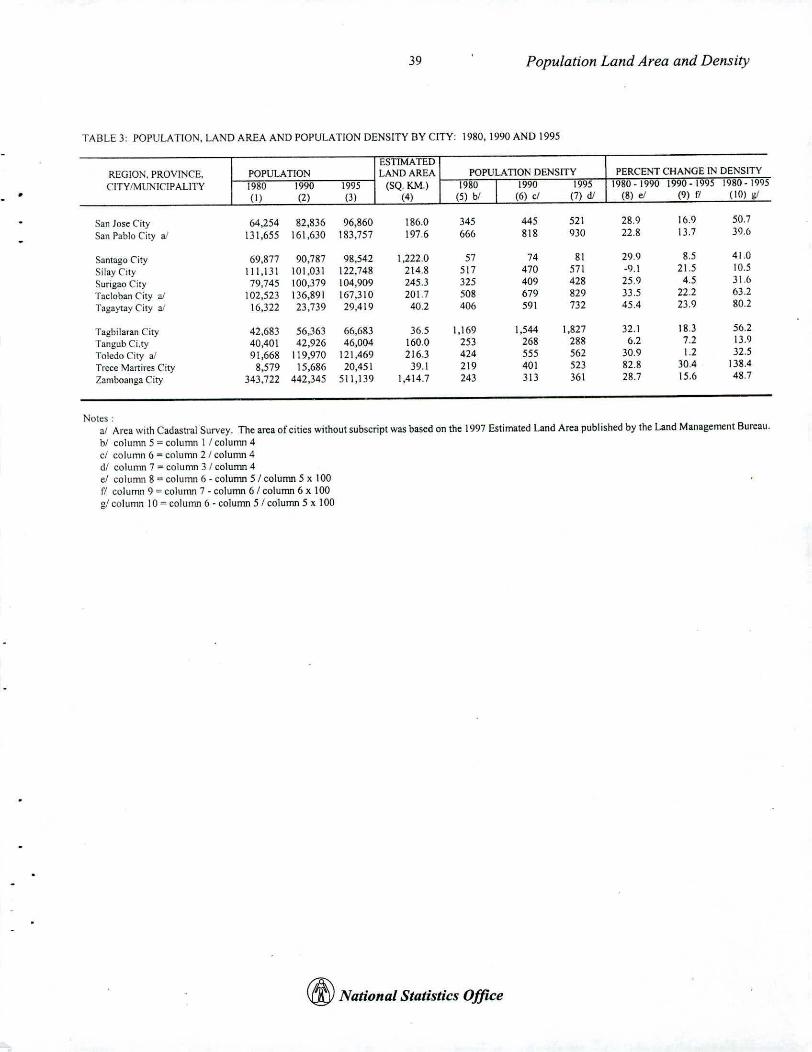
39 Population Land Area and Density
•
TABLE 3: POPULATION, LAND AREA AND POPULATION DENSITY BY CITY: 1980,1990 AND 1995
ESTIMATEDREGION', PROVINCE. POPULATION LAND AREA POPULATION DENSITY PERCENT CHANGE IN DENSITY
('fTY /MUNICIPALITY 1980 1990 1995 (SQ. KM.) 1980 I 1990 1995 1980-19901990-1995 1980-1995
(I) (2) (J) (4) (5) bI (6) d (7) dI (8) eJ (9) II (10) o;!
San Jose City 64,254 82,836 96,860 186.0 345 445 521 28.9 16.9 50.7
San Pablo City a' 131,655 161,630 183,757 197.6 666 818 930 22.8 13.7 39.6
Santago City 69,877 90,787 98,542 1,222.0 57 74 81 29.9 8.5 41.0
Silay CIty 111,131 101,031 122,748 214.8 517 470 571 -9.1 21.5 10.5
Surigao City 79.745 100,379 104,909 245.3 325 409 428 25.9 4.5 31.6
Tac10ban City aJ 102,523 136,891 167,310 201.7 508 679 829 33.5 22.2 63.2
Tagaytay City ts! 16,322 23,739 29,419 40.2 406 591 732 45.4 23.9 80.2
Tagbilaran City 42,683 56,363 66,683 36.5 1,169 1,544 1,827 32.1 18.3 56.2
Tangub CLty 40,401 42,926 46,004 160.0 253 268 288 6.2 7.2 13.9
Toledo City aI 91,668 119,970 121,469 216.3 424 555 562 30.9 1.2 32.5
Trece Martires City 8,579 15,686 20,451 39.1 219 401 523 82.8 30.4 138.4
Zamboanga City 343,722 442,345 511,139 1,414.7 243 313 361 28.7 15.6 48.7
Noles:al Area with Cadasrral Survey. The area of cities without subscript was based on the 1997 Estimated Land Area published by the Land Management Bureau.hi column 5 = column I I column 4cl column 6 =: colunm 2 I colunm 4dl column 7 = column 31 column 4e/ column 8 = column 6 - column 5/ column 5 x 100(I column <) = column 7 - column 61 column 6 x 100gI column 10::: column 6 - column 51 column 5 x 100
~ National Statistics Office
•
APPENDICES
42
BATAS PAMBANSA BLG. 72
APPENDIX A
PROVIDING FOR THE TAKING OF AN INTEGRATED CENSUS EVERY TENYEARS BEGINNING IN THE YEAR NINETEEN HUNDRED AND EIGHTY,AND FOR OTHER PURPOSES.
SECTION 1. A national census of population and other related data shall betaken every decade beginning in 1980, in accordance with plans prepared by the NationalCensus and Statistics Office, without prejudice to the undertaking of special censuses onagriculture, industry, commerce, housing and other sectors as may be approved by theNational Economic and Development Authority.
SECTION 2. There is hereby created the National Census Coordinating Board tobe composed of the Minister of Economic Planning, as Chairman, the Minister of HumanSettlements, the Minister of the Budget, the Minister of the Justice, the Minister ofNational Defense, the Mmister of Labor, the Minister of Finance, the Minister ofEducation and Culture, the Minister of Public Works, the Minister of Transportation andCommunications, the Minister of Public Highways, the Minister of Agriculture, theMinister of Natural Resources, the Minister of Public Information, and the Minister ofLocal Government and Community Development, as members, with the ExecutiveDirector of the National Census and Statistics Office as Executive Officer of the Board.
The census shall be under the supervision and coordination of the National CensusCoordinating Board which shall issue such rules and regulations as maybe be necessary forthe successful undertaking and completion of the censuses provided in this Act.
SECTION 3. There shall be established a provincial, city and municipal censusboard in each province, city and municipality, as the case may be, which shall provide suchfacilities and assistance as may be required by the National Census Coordinating Board.The boards shall be under the supervision and control of the National Census CoordinatingBoard.
SECTION 4. The Provincial Census Board shall be composed of the ProvincialGovernor, as Chairman, and the Division Superintendent of Schools, or in the case ofprovinces with more than one school division, the Division Superintendent designated bythe National Census Coordinating Board, as Vice Chairman, the District HighwayEngineer, or in the case of provinces which have two or more highway engineeringdistricts, the one that may be designated by the National Census Coordinating Board, theProvincial Commander of the Philippine Constabulary, the Provincial DevelopmentOfficer, the Provincial Assessor, and the Provincial Agriculturist, as members, with theProvincial Census Officer as the Executive Officer.
The City Census Board shall be composed of the Municipal mayor, as Chairman,and the District Supervisor, the Municipal Agriculturist, the Station Commander, the
43 APPENDIX A
Municipal Treasurer, and the Municipal Development Officer, as members, with theMunicipal Census Officer/Census Supervisor as the Executive Officer.
The Municipal Census Board shall be composed of the Municipal Mayor, asChairman, and the District Supervisor, the Municipal Agriculturist, the StationCommander, the Municipal Treasurer, and the Municipal Development Officer, asmembers, with the Municipal Census Officer/Census Supervisor as the Executive Officer.
SECTION 5. The National Census Coordinating Board and the local censusboards may call upon any ministry, bureau, office, agency or instrumentality of theGovernment for any assistance in the performance of their duties.
SECTION 6. The first day of May of every regular census year is herebydesignated as the reference date for the census. The collection of data will be byenumeration and the respondent shall be the head or any responsible member of thehousehold.
SECTION 7. Public school teachers shall be employed for enumeration work andfor such services shall be paid an honorarium as may be determined by the NationalCensus Coordinating Board but in no case not less than two hundred-fifty pesos and shallreceive service credits equivalent to the number of days rendered in census work. Othergovernment employees whose services are engaged for census work shall be entitled tosuch allowances as shall be prescribed by the National Census Coordinating Board payablefrom census funds. The census herein taken at the barangay level shall be certified to bythe corresponding barangay captain.
SECTION 8. Before the end of the year 1980 and of every census thereafter, acount of the population by province, city, municipality and barangay shall be published bythe National Census of Statistics Office. The final population count as determined fromthe processed census returns shall be considered official for all purposes uponproclamation by the President (Prime Minister).
SECTION 9. Data gathered pursuant to this Act shall not be used as evidence inany court or public office for or against any person, except in a criminal case for violationof Section 10 of this Act, nor shall such data be divulged to any person except toauthorized employees of the National Census and Statistics Office, acting in theperformance of their duties; nor shall such data be published except in the form ofsummaries or statistical tables in which no reference to an individual shall appear. Anyperson violating any provision of this Section shall be punished by a fine of not more thanfive hundred pesos or by imprisonment of not more than six months, or both.
SECTION 10. Any respondent as provided for in Section 6 who unjustifiablyrefuses to furnish the information called for in the census questionnaire, or knowinglycertifies or gives data or information which shall prove to be materially untrue in anyparticular, shall be guilty of an offense under this Act and shall, upon conviction, be

44 APPENDIX A
punished by a fine of not more than five hundred pesos or by imprisonment of not morethan three months, or both.
SECfION 11. The amount necessary for the holding of censuses shall be chargedto the appropriations available for the purpose in the corresponding Appropriations Acts.
SECTION 12. This Act shall take effect upon its approval.
Approved, June II, 1980
(SGD.) FERDINAND E. MARCOS
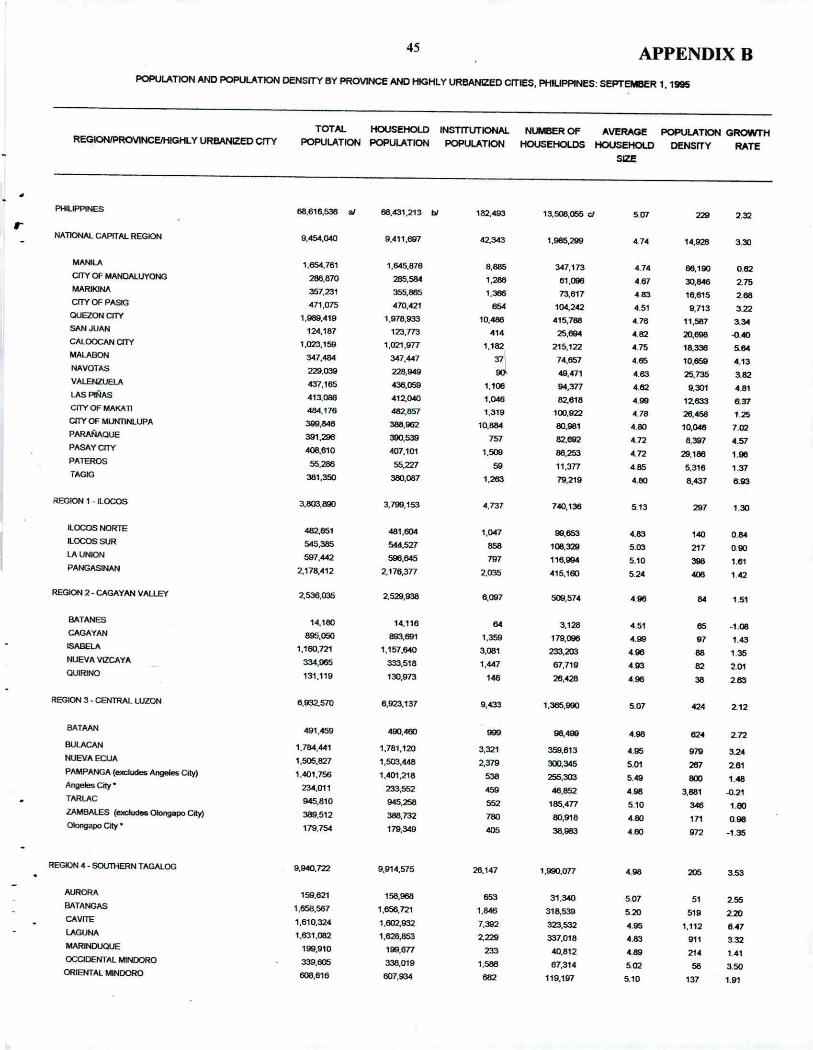
45 APPENDIXBPOPULATION AND POPULATION OENSrTY BY PROVINCE AND HIGHLY URBANIZED CITIES. PHILIPPINES: SEPTEMBER 1, 1995
TOTAL HOUSEHOlD lNsrrrUTIONAl NUMBER OF AVERAG~ POPULATION GRO'NTHREGIONJPROV\NCEJHIGHLY URBANIZED CITY POPULATION POPULATION POPULATION HOUSEHOlDS HOUSEHOLD DENSITY RATE
SIZE
•PHILIpPINES 68,616,538 " 68,431,213 bI '82._ 13,508,055 cJ 51]7 229 2.32
rNAllONAL CAPITAL REGIQI'II 9,454,040 9.411,697 42.343 1,985,299 4.74 14.928 330
MANIlA 1,654,761 1,645,876 8._ 341,173 4.74 66,190 082CfTYOF MANOALUYONG 286,870 285.584 1.288 61._ 467 30._ 2.15MARIKlNA 357,231 355,66' '.- 73,617 483 Ut61S 268CITY OF PASK; -471,075 470,421 654 104,242 4.51 9,713 3.22OUEZONcrrv 1,989,419 1,978,933 10,486 415,788 476 11,587 3.34SANJUAN 124,187 123,m 414 25._ 4.62 20,698 -040CAlOOCAN CITY 1,023.159 ',021,9n 1,182 215.122 475 18,336 5.64MAlA80N 347,484 347,447 37
174,657 4.65 10,659 4.13
NAVOTAS 229.039 228 .•••• 9l> 49.,471 4.83 25.735 3.82VAL.BU:l..IElA 437,165 436.059 1,106 94.377 4.62 9,301 4.81L6.SPlNAS 413,086 412,040 1.046 82,618 4." 12.633 6.37CITYOF MAK.1ITI 484,176 482.857 1,319 100,922 4.78 26.458 1.25CI1YOF MUNTINlUPA -.- _.962 10.8&t 60,961 480 10,046 700PARANA-QUE 391,296 390.539 757 82."'" 4.n 8,397 4.57PASAVaTY 408,610 407,101 '.509 86.253 4.n 29,186 1.96PATEROS 55.286 55.221 59 11,377 465 5,316 1.37lAGIG 381,350 380,067 '.263 19,219 480 6,437 6.93
REGION 1_ILOCOS 3,803,890 3,799,153 ",737 740,136 5.13 297 1.30
LOCOS NORTE 482.651 481,604 1,047 ".653 4.83 140 0."IlOCOSSUR 545._ 544,527 658 106,329 5.03 217 0.00lAUNlON 597,442 596.645 7ff1 "6,994 5.10 3118 1.61PANGASINAN 2,178,4'2 2.176,371 2.035 4'5,160 5.24 406 '.42
REGION2. CAGAYAN VAllEY 2,536,035 2,529,938 6,097 509,574 496 64 '.51
BATANES ' •• 180 14,116 64 3,128 4.51 65 .1.06CAGAYAN 805.050 893,691 '.359 179,096 4." 07 143ISAllB.A 1,160,721 1,157,640 3,081 233.203 496 68 136NUEVA VlZCAYA 334._ 333,516 1,447 67,719 403 82 201QU'RINO 131.119 130,973 148 26,-428 496 36 2.83
REGION3 - CENTRAL.LUZON 6,932,570 6,923,137 0._ 1,365,990 5.07 424 212
BATAAN 491.459 490.4&> 999 ••••••• 4.08 82' 2nI!lJlACAN 1,784,441 1,761,120 3.321 359,813 405 070 324NUEVAEOJA 1,505,827 1,503,448 2,379 300.345 5.01 267 26'PAMPANGA (excludes A~ Cdy) 1,401,756 1.4D1,218 536 255.303 5." 8lIO 1.48Angeles City • 2J.4,011 233.552 459 48.852 4116 3,881 -0.21TARiAC 945,810 945.258 552 185,477 5.10 346 1.80ZAMBAlES (exdudos OIoogapo City) 389,512 _.132 780 80,918 4.80 171 0960I0ngap0 C", • 179,754 179,349 405 36.083 480 on -1.35
REGK>N4_ SOUTHERNTAGAlOG 9,940,722 9,914,575 26,147 1,990,077 408 205 3.53
AURORA 159,621 158,968 863 31.340 507 51 2.558ATANGAS 1,656,567 ',656,721 1._ 318,539 520 510 220"'VITE 1,610,324 1,602,932 7.=- 323532 4.05 1,112 6_~7LAGUNA 1,631,082 1,l528.853 2.229 337,016 4.83 91' 332MARINOUOUE 199,910 199.en 233 40,812 4.89 2'4 1.41OCOOENTAL MINDORO 339.605 336.019 '.566 67.314 500 58 3.50ORIENTAl MINDORO 606,616 007,934 6112 119,'97 5.10 137 1.91
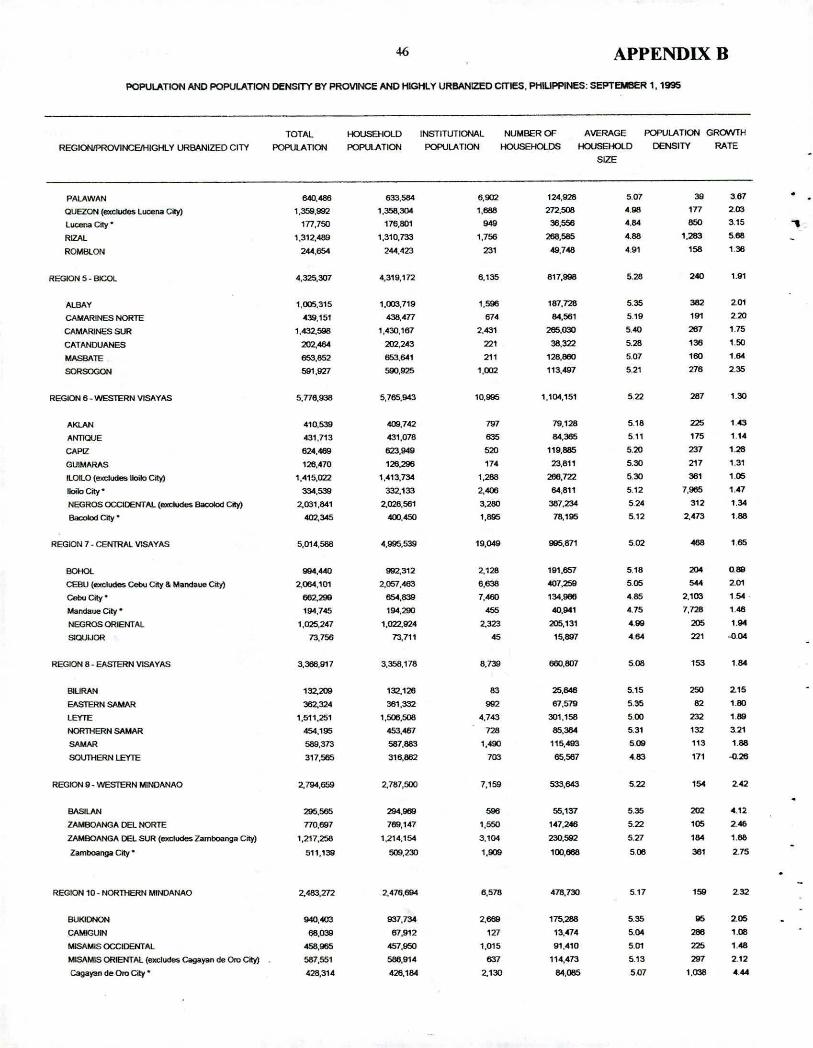
-16 APPENDIX B
POPULATION AND POPULATION DENSITY BY PROVlNCE AND HIGHLY URBANIZED CITlES, PHIUPPINES: SEPTEMBER 1, 1995
TOTAL HOUSEHOlD INSTITUTIONAL NUMBER OF AVERAGE POPULATION GROW'TH
REGIONIPROVINCElHIGHl Y URBANIZED CITY POPULATION POPlAATION POPULATION HDUSEHOLDS HOUSEHOlD DENSITY RATE
SIZE
PAlAWAN 640 ••••• 633.564 6.902 124,925 5.07 39 3.67
QUEZON (eJl{;1udes lucen41 City) '.359,992 ',358,3004 1._ 272.5<J6 ••• m 2Jl3
lucena City. ,n,750 176,801 ••• "'.556 •••• 650 3.'5RIZAL 1,312,489 1,310,733 1,756 266.585 '.66 1.263 566
ROM8lON 244,654 244,423 231 49,748 491 156 1.36
REGION 5 - 8ICOl.. 4,325,307 4,319.,n 6,135 817,998 5.26 2<0 1.91
AUlAY 1,005,315 ',003,719 1.596 187,128 5.35 382 201
CAMARINES NORTE 439,151 438,.t77 .,. 84,561 5.'9 lin 220
CAMARINES SUR 1,432,598 1,430,167 2,431 265.030 5.<0 261 1.75
CATANDUANES 202 •••• 202,243 221 36.322 5.26 136 1.50
MASllATE 653.652 653.641 21' 128,860 5.07 160 1."
SOR5OGON 591.927 500.925 1.002 113,497 521 276 235
REGIQfII6. WESTERN VI~YAS 5,ne,936 5,765,943 10,995 '.104,151 522 261 1.30
AIQAN 410,539 409,742 797 79,128 5,18 225 1.43
AtmClUE 431,713 431,078 635 ".- 511 175 1.14
CAPlZ 624,469 623 •••• 520 "9,885 5.20 237 1.26
GU1>.WU1S 126,470 126,296 174 23,S1' 5.30 217 1.31
ILOILO (exdudes Iloilo City) 1,415,022 ',413,734 '.266 266.722 530 361 105
IbloCityw 334.539 332,133 2,<06 64,811 5.12 7._ 1.47
NEGROS ocaDENT AL (exdudes BaooIod City) 2,031,841 2,028,561 3,260 Jfj7,234 524 312 1.""BacoIod City • <02,_ 400."" '.696 78,195 5.12 2,473 1.88
REGION 7. CENTRAl V1$AVAS 5,014,588 4,995,539 19,049 995,871 502 ••• 165
BOHOl ••...- 992,312 2,128 191,657 5.18 2<M 0."
CEBU (ell'Cludes Cebu City & Mandaue City) 2,064,101 2,057,463 6.638 0007,259 5.05 ••• 201
Cebu City. 662,299 .....639 7."'" 134,986 • 65 2,103 154 .
Mandaue Qly. 194,745 194,200 •••• 40,941 4.75 7.726 "8NEGROS ORIENTAL 1,025,247 1,022.924 2,323 205,131 ••• 205 1."
SlQUUOR 73,756 73,711 •• 15,897 ••• 221 ..,'"REGION 8. EASTERN VlSAYAS 3,366,917 3,356,178 8.739 660,607 508 '53 ,.•.
BIURAN 132.209 132,126 83 25 .••• 5.15 :>so 215
EASTERN SAMAR 362,32' 361.= 992 67,579 535 62 1.60
lEYTE 1,511,251 1,506,508 4,743 301,158 500 232 1.89
NORlHERN 5AMAR 454,195 "" ...., 126 65._ 5.31 132 3.21
SAMAR 569,373 587,883 1.490 115,493 5.09 113 1.88
S<lU1l<ERN lEYTE 317,565 316,862 703 65,567 '.63 171 "'26
REGION 9 - WESTERN MINDANAO 2,794,659 2,787,SXJ 7,159 633.""" 5.22 154 242
BASllAN 290._ 294 •••• 596 55,137 535 202 4.12
ZAMBOANGA DEL NORTE no,697 769,147 '.550 147,246 522 105 2.••ZAMOOANGA DEL SUR (excludes Zamboanga city) 1,217,.256 1,214,154 3,104 230.592 5.27 ,.. 1.66
Zamboanga City. 511,139 500.230 '.009 100,668 5.08 361 275
REGION 10. NORTHERN MINDANAO 2,483,m 2,476,694 6,578 418,730 5.17 '59 232
BUKiONON -."'" 937,734 2._ 175,286 535 •• 2.05
CAMIGUIN 66.039 67,912 127 13,414 5.'" 26ll 1.08
Ml$AMlS OCCIDENTAl .••.- =.650 1,015 91,410 5.01 225 1.•••
MlSAMIS ORIENTAl (elldud65 Cagayan de Oro City) 587,551 586,914 637 114,473 5.13 297 2.12
~yan de Oro City. 428,314 426,1&4 2,130 ".085 5.07 1.036 ••••
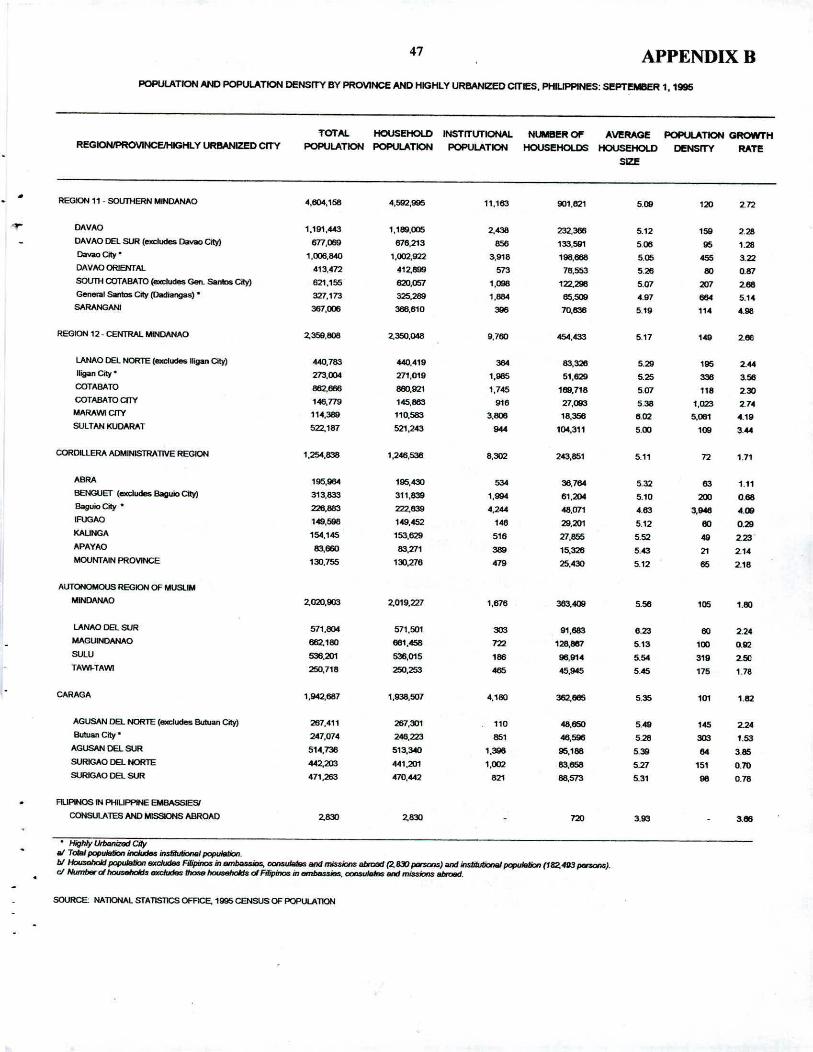
47 APPENDIXBPOPUlATfON AND POPULATJON DENSrrY BY PROVINCE AND HfGHLY UReANlZED CITIES. PHJUPPtNfS: SEPTEMBER 1, 19St5
TOTAL HOUSEHOlD tN$TffUTIONAL NUMBER Of"' AV'I!RAGf: POPUI..ATtON GROWTHREGIONIPROVINCEniIGHL Y URBANIZED CITY POPULATION POPULATtON POPULATION HOUSEHOlDS HOUSEHOlD DENSITY RAT!!
SIZE
REGION 11 - SOt.JTl-iERN MINDANAO 4,004,158 4,592,995 11,163 901,e21 5.00 120 272
.~ CAVAO ',191,443 1,189,005 2._ m."" 5.12 159 2.28DAVAO DEl SUR (excludes Davao City) 1m.fX!JiJ 676,213 856 133,581 506 95 1.28OavaoCity ~ 1.006,840 ',002,922 3,916 196,668 505 455 3.22CAVAO ORIENTAl 413,4n 412,899 573 76,553 5.28 80 061SOUTH COT ABA TO (excludes Gen. Santos City) 621,155 fS2O.rYSl '.098 1:12.29ll 5.07 207 268General &lrrtos City (lAdiangas) • 327,173 325,289 '.884 ••••500 4.97 ••• 5.14SARANGANI 367.006 366,810 - 70._ 5.19 114 •••
REGION 12 - CENTRAl.. MINDANAO 2,359,eoa 2,350,048 9.760 454.433 5.17 149 206
lANAO DEl NORTE (e)(z:h~ lligan City) 440,783 440,419 364 83,328 5.29 "'5 244"i9an City. m.OO4 271,019 '.... 51,629 525 336 3.56COTABATO _ ... 860,921 '.745 169,718 507 n8 230COTABATOaTY '<6,771l 145,663 918 27,093 5.38 ',023 27.M,Il,RAWI ClTY 114,389 "0,563 ',808 18,356 •. 02 5,081 4.19SULTAN KUDARAT 522,187 521,243 944 104,311 5.00 '00 '44
CORDILLERA ADMINISTRATIVE REGION ',254,838 ',246.536 8.302 243,851 5.11 72 1.71
ABIlA 195,964 195,430 534 36,7&4 5.32 •• 1.11BENGUET (ma:lucIes Baguio City) 313,833 311,839 '.•.. 81.204 5.10 200 0.68-Qly" 226.683 222_ 4,244 48,071 ••• ••••• '00IFUGAO 149,598 149,452 140 29,201 5.12 80 0.29KAIJNGA 154,145 153,629 51. 27.855 5.52 49 223',,"PAYAO 83,_ 83,271 389 15,326 5.43 21 21.MOUNTAIN PROVINCE 130,755 130.276 479 25._ 5.12 86 2.18
AUTONOMOUS REGION OF MUSlIM
""""""'0 2,020,903 2,019,227 1,678 383.400 5.56 105 1.80
LANAO DEL SUR 571,804 571,501 303 91.683 8.23 80 2,24MAGU~O 682180 661,458 722 "8.887 5.13 '00 002SULU 538.201 536,015 186 98,914 5.54 31. 250TAWl-TAWI 250,718 250.253 465 45,_ 545 175 1.78
CARAGA 1,942,687 ',938,501 4,180 362,lI65 5.35 ,ot 1.82
AGUSAN DEl. NORTE (excludes Butuan CIty) 261,41' 207.301 110 ••••••• 5.49 '45 22.Butuan City • 247,074 248,223 861 40._ 5.28 303 '.53AGUSAN DEL SUR 514,736 513,340 '.- 95,188 530 54 305SURIGAO DEl NORTE 44~203 441,201 '.002 83••••• 5.27 151 0.70SURIGAO DEL SUR 471,263 470,442 021 ".573 5.31 •• 0.78
FLlPlNOS IN PHlUPPINE EMBAS5JESI
CONSUlAlES AND M1SSKlNS ABROAD ~030 2030 720 '.03 .86
Highly um.na.d edy1/11 TobJI popul&tiotl incJucJtM itutitutioneI poJHJ1fJtiofl.
bI Hoosehold popuJ8bon excludes Fi/ipfno3 in tlmba.ssioo, ~ and ~ abroad (2,OJ p6IX1floS) and insbtvtiooaJ population (182, 4Q3 p8ROIIS).cI MJmberd~ fII.'ItCiuI.18Iti'Io:w1hcJuseho1dsdRipint::Jein~ oomuleM$ and~ abroad.
SOURCE: NAllONAL STATISTlCS 0FFlCE. 1995 CENSUS OF POPULATION

48 APPENDIXC
List of 1995 Census of Population (POPCEN) Published Tables
Table
I Population Enumerated in Various Censuses, 1903- I995
2 Population by Single-Year Age Classification and Sex: 1995
3 Percent Distribution of Population by Age Group, Sex andCitylMunicipality: 1995
4 Percent Distribution of Total Population IO Years Old and Over by AgeGroup, Sex ,Marital Status and CitylMunicipality: 1995
5 Percent Distribution of Household Population lOY ears Old and Overby Age Group, Sex ,Marital Status and CitylMunicipality:
6 Percent Distribution of Household Population 5 Years Old and Over byHighest Grade Completed, Age Group, Sex and CitylMunicipality:1995
7 Percent Distribution of Household Population by Mother Tongue, Sexand CitylMunicipality: 1995
8 Percent Distribution of Disabled Persons by Age Group, Sex and Typeof Disability: 1995
9 Percent Distribution of Household Population by Relationship to theHousehold Head and Household Size: 1995
10 Percent Distribution of Households by Age Group and Sex ofHousehold Head, Household Size: 1995
I I Percent Distribution of Overseas Workers lOY ears Old and Over byAge Group, Highest Grade Completed and Sex:: 1995
12 Percent Distribution of Household Population 15 Years Old and Overby Trade Skill (Major), Age Group and Sex: 1995
I3 Percent Distribution of Household Population 15 Years Old and Overwith Trade Skill by Trade Skill Group (Major and Minor), Manner ofAcquisition and Sex: 1995

49 APPENDIXC
List of 1995 Census of Population (POPCEN) Published Tables
Table
•
•
14 Percent Distribution of Household Population 15 Years Old and OverWho Worked At Anytime in the Past Year by Industry Group (Major),Age Group and Sex: 1995
IS Percent Distribution of Household Population 15 Years Old and OverWho Worked at Anytime in the Past Year by Industry Group (Majorand Minor), Highest Grade Completed and Sex: 1995
16 Percent Distribution of Household Population 15 Years Old and OverWho Worked At Anytime in the Past Year by Industry Group (Majorand Minor), Sex and Class of Worker: 1995
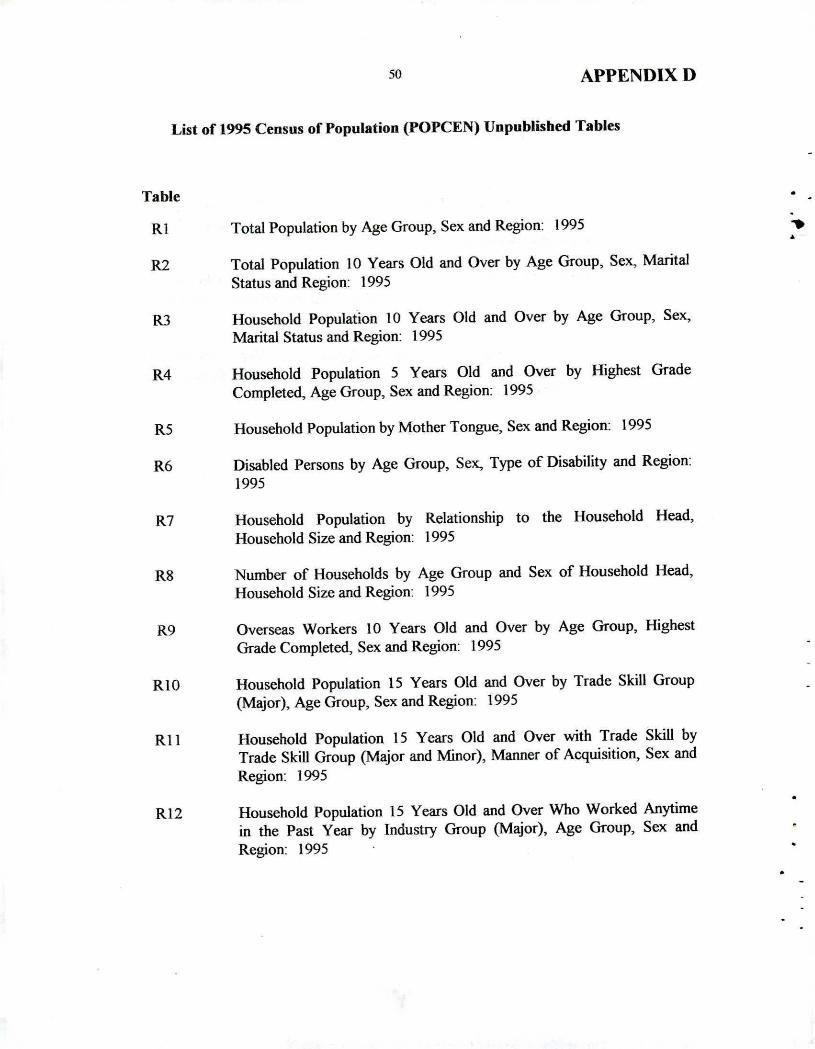
50 APPENDIX D
List of 1995 Census of Population (POPCEN) Unpublished Tables
Table
RI Total Population by Age Group, Sex and Region: 1995•
R2 Total Population 10 Years Old and Over by Age Group, Sex, MaritalStatus and Region: 1995
R3 Household Population 10 Years Old and Over by Age Group, Sex,Marital Status and Region: 1995
R4 Household Population 5 Years Old and Over by Highest GradeCompleted, Age Group, Sex and Region: 1995
R5 Household Population by Mother Tongue, Sex and Region: 1995
R6 Disabled Persons by Age Group, Sex, Type of Disability and Region:1995
R7 Household Population by Relationship to the Household Head,Household Size and Region: 1995
R8 Number of Households by Age Group and Sex of Household Head,Household Size and Region: 1995
R9 Overseas Workers 10 Years Old and Over by Age Group, HighestGrade Completed, Sex and Region: 1995
RIO Household Population 15 Years Old and Over by Trade Skill Group(Major), Age Group, Sex and Region: 1995
R I I Household Population 15 Years Old and Over with Trade Skill byTrade Skill Group (Major and Minor), Manner of Acquisition, Sex andRegion: 1995
RI2 Household Population 15 Years Old and Over Who Worked Anytimein the Past Year by Industry Group (Major), Age Group, Sex andRegion: 1995
51 APPENDIXD
•
List of 1995 Census of Population (POPCEN) Unpublished Tables
Table
••• R13 Household Population 15 Years Old and Over Who Worked Anytimein the Past Year by Industry Group (Major and Minor), Highest GradeCompleted, Sex and Region: 1995
RI4 Household Population IS Years Old and Over Who Worked Anytimein the Past Year by Industry Group (Major and Minor), Sex, Class ofWorker and Region: 1995
PI Disabled Persons by Age Group, Sex, Type of Disability and Province:1995
P2 Household Population by Relationship to the Household Head,Household Size and Province: 1995
P3 Number of Households by Age Group and Sex of Household Head,Household Size and Province: 1995
P4 Overseas Workers 10 Years Old and Over by Age Group, HighestGrade Completed, Sex and Province: 1995
P5 Household Population 15 Years Old and Over by Trade Skill Group(Major), Age Group, Sex and Province: 1995
P6 Household Population IS Years Old and Over with Trade Skill byTrade Skill Group (Major and Minor), Manner of Acquisition, Sex andProvince: 1995
P7 Household Population IS Years Old and Over Who Worked AtAnytime in the Past Year by Industry Group (Major), Age Group, Sexand Province: 1995
•,.
P8 Household Population IS Years Old and Over Who Worked AtAnytime in the Past Year by Industry Group (Major and Minor),Highest Grade Completed, Sex and Province: 1995
52 APPENDIX D
List of 1995 Census of Population (POPCEN) Unpublished Tables
Table
P9 Household Population 15 Years Old and Over Who Worked AtAnytime in the Past Year by Industry Group (Major and Minor), Sex,Class of Worker and Province: 1995
••••
MI Total Population by Age Group, Sex and City/Municipality: 1995
Anytime in the Past Year by Industry Group (Major and Minor), Sex,Class of Worker and Province: 1995
M2 Total Population 10 Years Old and Over by Age Group, Sex, MaritalStatus and City/Municipality: 1995
M3 Household Population 10 Years Old and Over by Age Group, Sex,Marital Status and City/Municipality: 1995
M4 Household Population 5 Years Old and Over by highest GradeCompleted, Age Group, Sex and City/Municipality: 1995
M5 Household Population by Mother Tongue, Sex and City/Municipality:1995
M6 Disabled Persons by Age Group, by Sex, Type of Disability andCity/Municipality: 1995
M7 Household Population 15 Years Old and Over Who Worked AtAnytime in the Past Year by Industry Group (Major and Minor),Highest Grade Completed, Sex and City/Municipality: 1995
M8 Household Population 15 Years Old and Over Who Worked AtAnytime in the Past Year by Industry Group (Major), Age Group, Sexand City/Municipality: 1995
•
_ .L
CITATION:
National Statistics Office, 1995 Cem;u;; of Population. Report NO.4:Population, Land Area and Densit'}, Manila, December 2000.
ISSN 0117 - 1453