Women and Men in Western Visayas 2011 - Philippine ...
187
I ~~S74'J 2//&1(141 ISSN.1656.Q469 Women & Men IN WESTERN VISAVAS 2011 Republika ng Pilipinas PAMBAN SANG lUPON SA UGNAYANG PANG.ESTADISTIKA (NATIONAL STATISTICAL COORDINATION BOARD) Regional Division VI luna St., La Paz, Iloilo City
-
Upload
khangminh22 -
Category
Documents
-
view
2 -
download
0
Transcript of Women and Men in Western Visayas 2011 - Philippine ...
I~~S74'J2//&1(141
ISSN.1656.Q469
Women & MenIN WESTERN VISAVAS
2011Republika ng PilipinasPAMBAN SANG lUPON SA UGNAYANG PANG.ESTADISTIKA(NATIONAL STATISTICAL COORDINATION BOARD)Regional Division VIluna St., La Paz, Iloilo City

FOREWORD
One of the gOlJernment's thrusts for the advancement of women isthe promotion of the 1979 Convention for the Elimination of All Formsof Discrimination against Women (CEDAW) and widening its reachamong policy lmakers, planners, and other stakeholders. TheCEDAW defines what constitutes discrimination against women andsets up an agenda for national action to end such discrimination. In2000, the Philippines was a signatory to the MillenniumDelJelopment Goals (MDG) Declaration which, among others. seeksto promote gender- equality and empowerment of women. Thead\Ocacy for the ConlJention and the MDGs seeks to recognize andmainstream women's fundamental rights and freedoms In thepolitical. social. cultural. economic, and other fields. Such ad\OCacyimplies the need for quality gender statistics for informed decisionson different gender issues.
The 2011 Statistical Handbook on Women and Men in WesternVisayas, 5th edition. presents the latest awilable gender statisticsthrough tables and charts with short explanatory texts and briefanalyses highlighting important features of the data. Data forprovinces and key cities are also prolided whene""r possible. Thisedition incorporates elected women and men ofticlals in the 2010election and special studies on women. Through this publication,the NSCB Regional Dilision VI hopes to contribute to thego""mment's efforts In furthering gender mainstreamlng and infulfilling the various international gender-related commitments of ourcountry.
~ is our wish that all concerned sectors would be able to make useof this publication in the formulation of effecti"" plans. programs, andpolicies for the advancement of women in Western Visayas.
We acknowiedge with deep gratitude our partners for their generoussupport in providing data for this publication and we look forward tocomments and suggestions from users on how we can further1mpro"" the quality and usefulness of this publication.
!- --1 '-_ROMULO A. VIROLASecretary General30 March 2011

CONTENTS
ForewordTable of Contents ii
Chapter 1 Population. Families, and Households 1.1Chapter 2 Employment 2.1Chapter 3 Agriculture and Agrarian Reform 3-1Chapter 4 Education 4-1Chapter 5 Health, Nutrition and Vital Statistics 5-1Chapter 6 Violence Against Women 6-1Chapter 7 Economic Participation 7-1Chapter 8 Girls and Boys 8-1Chapter 9 Special Studies on Women
9A The Women in the Sen.ice Sectorin Iloilo City 9-1
9B Domestic Violence in the Pro\ince ofAklan 9-24
9C Leisure Time Allocation Among Women:Some E\idence in Iloilo City, Philippines ' 9-39
AnnexesHistorical Dewlopments in the Ad;encement of Filipino
Women in the Philippines 10-1Technical Notes 10 -5Guide to Acronyms 10-12Sources 10-13NSCB Publications 10-14The National Statistical Coordination Board 10-18The NSCB Key Oflicials/NSCB Regional Di\ision VI 10-19
Ii

om n MenIN WESTERN VISA VAS
,
POPULATION, FAMILIESAND HOUSEHOLDS

POPULATION, FAMILIES, AND HOUSEHOLDS
A profile of the population is important in identifyirg areasof development. High population growth has considerableeffects on the distribution of resources and services and hasadverse influence on family life standards, hea~h, education,environment, and occupational opportunities.
Changes in the family structure have great effects onfamily Iffestyle. This situation poses extra burden on women ashome managers in their struggle to balance family,motherhood, economic, and social responsibilities. Below arethe priority issues in this sector:
o Serious' implications of changing population size, familystructure, merging typologies of family, composition anddistribution vis-a-vis available resources and services onthe status of women;
o Mu~iple burden due to inclination of population membersto define certain roles of men and women; and
o Need to address gender issues of the youth, elderly anddifferently-abled men and women.
The following policies were promulgated to address theabove issues:
o Enactment of the Family Code, which to date, is the mostenlightened piece of legislation to promote equality andjustice among family members; and
o The importance of the Filipino family as the fundamentalunit of society is underscored in the 1987 Constitutionand other existing legislations. The Constitution andother legislations recognize that well-functioning andhappy families constitutes the necessary foundation forsocial stability, economic progress, and development.
1-1

POPULATION, FAMIUES AND HOUSEHOUDS
LIST OF TABLES AND FIGURES
Table Page
1.1 Population and Sex Ratio by Age Group,Region VI: 2007 1-4
1.2 Population All Ages by Sex, by Pro,,;nce:2007 1-5
1.3 Population 10 Years Old and Over by Sexand by Marital Status: 2007 Hl
1.4 Population of Youth Aged 15-24 by 1-7Age Group: 2007
1.5 Projected Population of Youth Aged 15-24 1-7by Age Group: 2015 & 2020
1.6 Projected Population by Pro,,;nce: 2015 1-10
Figure
1.1 Population Pyramids, Region VI: 2000 & 2007 1-31,2 Projected Population Pyramid: 2015 10$1.3 Projected Population Pyramids by Pro,,;nce:
2015 1-9
1-2

POPULATION, FAMILIES AND HOUSEHOLDS
Figure 1.1 Population Pyramids, Region VI: 2000 & 2007
female
75+70-7465-6960.6455-5950-5445-4940-4435-3930-3425-2920-2415-1910-145-90-4
2000
male
female
75+70-7465-6960-6455-5950-5445-.4940-4435-3930-3425.2920-2415.19'0-'45-90-4
2007
male
Source: 2000 &2007 Census of Population, NSO
In 2007, population aged 10-14 and 71).74 took the biggestand smallest shares in the population pyramid, respectively.Those with ages 70-74 shared 1.6 percent and ages 10-14accounted 12.0 percent of thetotal population.
Dependency ratio in 2007 decreased to 69.6 percentcompared to 71.0 percent in 2000. This signifies that for everyone hundred working person (1~4) 5upports 70 dependents(1).14 and 65 & over).
1-3

POPULATION, FAMILIES AND HOUSEHOLDS
Table 1.1 Population and Sex Ratio by Age Group, Region VI: 2007
Age Women Men SexGroup Number % Number % Ratio
All Ages 3,352,155 49.1 3,475,478 50.9 104Under 1 77,886 2.3 82,343 2.4 1061-4 307,202 9.2 324,016 9.3 1055-9 389,761 116 416,886 12.0 10710-14 401,149 12.0 420,481 12.1 10515-19 356,122 106 392,484 11.3 11020-24 262,946 7.8 297,504 8.6 113
I 25-29 232,522 69 256,028 7.4 11030-34 205,517 6.1 223,118 6.4 10935-39 203,663 6.1 214,470 6.2 10540-44 183,683 5.5 191,405 5.5 10445-49 164,257 4.9 168,244 4.8 10250-54 143,047 4.3 141,331 4.1 9955-59 113,649 3.4 109,494 3.2 9660-64 88,080 2.6 77,849 2.2 8865-69 78,233 2.3 63,075 1.8 8170.74 60,476 1.8 45,799 1.3 7675 & o""r 83,962 2.5 50,971 1.5 61
Source: National Statistics Office
As revealed by the 2007 Census of Population, there were moremen than women in Western Visayas, a ratio 104 men to every 100women.
Furthermore, in 2007. wamen in age group 50 & overoutnumbered the men. a ratio of 86 men for every 100 women. Thegreater number of women among the elderly group may beattributed to the longer Ite expectancy of wamen as compared tomen. In contrast. however. men in age group under 1-49outnumbered women.
1-4

POPULATION. FAMILIES AND HOUSEHOLDS
TEbie 1.2 Population All Ages by Sex, b\' Province: 2007
Region/PlO\o1nce/City Women Men Both Sexes(Total)
Region VI 3,352,155 3,475,478 6,827,633Aklan 242,768 250,451 493,219Antique 249,768 264,864 514,632Capiz 342.582 358,225 700.807Guimaras 72,966 77,943 150.909Iloilo' 829.059 860.169 1.689.228Negros Occidental 1,148,552 1,218,737 2,367,289Iloilo City 213,728 201,019 414.747Bacolod City 252,732 244,070 496.802Source: 2007-Census of Populationand tiJusing, NSO
The 2007 census showed that there were more men(3,475,478) than women (3,352,155) in Western Visayas. This istrue to all the six provinces of the region. Comparing the twoHUes, however, there are more women population than men ..i.e., Bacolod City has 252,732 women, 1.7 percentage pointshigher than men and Iloilo City has 213,728 women, 3.1percentage points higher than men
Likewise, Negros Occeental slill remained to be the mostpopulous provinca in the region comprising 34.7 percent of theregion's population. Iloilo and Capiz followed accounting to 24.7percent and 10.3 percent, respectively. Guimaras with apopulation of 150,909 or 2.2 percen1 of the regen's totalpopulation still remained 10be the least populated among the sixprovinces.
1-5

POPULATION, FAMILIES AND HOUSEHOLDS
Table 1.3 Population 10 Yeara Old and Over by Sexand by Marital Status: 2007
Mantal StatusWomen Men
Number % NLmber %W••• m Vlsay" 2.5n,306 49.3 2,652,253 50.7
Single 1,109,947 43.1 1,358,754 51.2Married 1,161,584 45.1 1,141,870 43.1Widowed 204,092 7.9 61,925 2.3Separated/DilOrced 23,578 0.9 14,819 0.6Common-law/Li\e-in 71,614 2.8 68,478 2.6Unknown 6,491 0.3 6,407 0.2
Source: 2007 Census of Population, NSO
The 2007 Census of Population re"",ls that single men(51.2%) outnumbered women (43.1%). Ha.ve-.er,there were morewidows than widcllNers in the year 2007. Data shows that therewere 3 widowed women for ewry .1 widowed man. This suppOrtsthe obsenation that women tend to haw a longer life span thanmen.
1-6

POPULAllON, FAMILIES AND HOUSEHOLDS
Table 1.4 Population of Youth Aged 15-24 by Age Group: 2007
Age Group Women Men15-19 356,122 392,48420-24 262,946 297,504
15-24 619,068 689,988Source: 2007-Gensus of Population and Housing, NSO
The youth population in Western Visayas aged 15-24 asrelA3aled by the 2007 Census showed that there are more men(689,968) than women (619,068). Men consisted of 52.7 percentand women 47.3 percent of the region's total youth population.
Table 1.5 Projected Population of Youth Aged 15-24 byAge Group: 2015 & 2020
Age Group
15-1920-24
Women
353,000 415,700371,800 348,200
Men
370,400390,400
431,600365,500
15-24 724,800 763,900 760,800 797,100Source: 2QOO-Gensus Based National and Regiooal Population Projections, NSO
Based on the 2000 population projections, men will continue tooutnumber the women unlil year 2020 with an merage gender gapof 2.1 percent Youth with ages 15-24 is expected to increase by5.1 percent in 2020 from its 2015 base.
1-7

POPULATION, FAMIUES AND HOUSEHOLDS
Figure 1.2 Projected Population Pyramid, Region VI: 2015
Women
80+75-7970-7465-6960-6455-5960-5445-4940-4435-3930-3425-2920-2415-1910-145-90-4
2015
Men
Source: 2000 Census. Based Nationaland Regioral PopulationProjections, NSO
Dependents are projected to decrease to 61.3 percentfrom the 2007 level.
Women aged 55 years old and above is projected tooutnumbered the men in the same bracket which comprises6.5 percent of the total population
143

POPlJ..AllON, FAMIUES AND HOUSEHOLDS
Mm
Figure 1.3 Projected Population Pyramids by Province: 20158(»75-7970-7465-69~55-595~S44>49•••••••3S-3930-3425-2921>-241l-191().145.1)().4
Anlque
Mm
",+7l-1970-746~9~Sl-S9SO-544>49•••••••3l-3930-342l-2921>-2415-19HH4l-9().4
G.Jirmras",+7l-1970-746~9~5$-.595().S44>49 Mm4Q.443l-393().3425-2921>-2415-1910-14l-9().4
f'j,gros Occidental
\l\b!ren
Mm
1-9

POPULATION, FAMILIES AND HOUSEHOLDS
Table 1.6 Projected Population by Province: 2015
Proloince Women Men Both Sexes(Total)
Aklan 297,900 303,700 601,600Antique 324,200 336,000 660,200Capiz 424,700 433,200 857,900Guimaras 95,900 99,600 195,500Iloilo 1,269,800 1,276,800 2,546,600Negros Occidental 1,712,600 1,743,400 3,466,000Source: NatIOnal Stahshc:s OffICe, RegIOnVI
Negros Occidental is expected to be still the most populousproloince in 2015 with a projected population of 3,456,000 or 41,6percent of the region's total population, Iloilo proloince follows witha projected population of 2,546,600 or 30,6 percent of theregion's population and the least gender gap of 0,3 percent.
Guimaras will remain to halAethe least population in 2015projected at 195,500, Men will outnumber women in ages 0.59,while women will outnumber men in ages 60 & 01Aer.
Aklan is projected to halAea population of 601,600 in 2015with a gender gap around one percent. More than half (51.5%)will be in ages 0.24, The elderly population with ages 65 & olAerisexpected to comprise only 5.7 percent of the total regionalpopulation,
Meanwhile, Antique follows Aklan's rate of populationprojected to reach 660,200 in 2015, The elderly population (65 &olAer)will comprise 5.4 percent of Antique's population with moreelderly women (6.3'10)than men' (4,5'10). .
On the other hand, Capiz is expected to reach a population 01857,900 in 2015.There will be more men than women in Capiz inages 0.54.
1.10

Women&MenIN WESTERN VISAYAS
EMPLOYMENT

EWiPLOYIVlEiH
The participation of women in both formal and informal sectorsof the labor force is now increasing though there are problemsaffecting their producti"ty and income shares. Some of thepriority problems and issues concerning women in theemployment sector are:
o Unequal terms and conditions of work and benefits forwomen, specifically production workers;
o Unequal pay opportunities between men and women;
o Unequal employment opportunities between men and women;
o Need to strengthen women's participation as leaders in labororganizations and other associations; and
o Need to increase participation of women in work-basedorganizations.
To address these issues, the following policy refiorms andprograms were implemented and helped reduce the inequalitybetween men and women in both fiomnaland in1i:lmnalSectOffi:
D Republic Act No. 6725 was enacted on May 12, 1989prohibiting discrimination against women in employment,promotion and training opportunities.
o The Anti-5exual Harassment Act of 1995 which was signedinto law- the Philippine De-elopment Plan fur Women (PDPW)describes sexual harassment as consisting of unwanted andinappropriate remarks about a person's appearance and/orsexual acti"ties which affect, directly or indirectly, one's jobperfiormance, promotion or e-eluation;
2-1

" The 1987 Constitution, Art. II, Sec. 14 explicitly stipulatesthe fundamental equality between women and men to wit:"The state recognizes the role of women in nation-buildingand shall ensure the fundamental equality before the law ofwomen and men." . .
" The component actil.1ty for and by women of the Tulong saTao-NGO Micro-Credit Program (TST/NGO-MCP) - Thisprogram of the Department of Trade and Industry (DTI)seeks to address the credit needs of existing and potentialmicro-entrepreneurs through the extensive use of NGOs ascondLits for lending and technical assistance. The women'scomponent is called the Tulong sa Kababaihan;
l)
" Efforts of DTI to encourage the exploitation of regionalcomparative advances have been' perceived to createemployment in the countryside, particularly among women;
" Women's equal opportunity in the trade sldlls trainingprogram ofthe Technical Education and Skills DevelopmentAuthority (TESDA). c
," The National Center for Women prol.1des if upgraded
traditional and non-traditional trades including twenty-5even(27) training subjeCts in nine (9) trade areas. The Researchand Development actiloitles include concerns on women'scapalilitY development,.wider employment opportunities for
• , twomen and other measures for enhancing women's status.,
2.2

EMPLOYMENT
LIST OF TABLESIII ., r' Jl.
2.11
2.7
2-14
2-4
2.9
2-122-13
, Page
"
o 10" 11 2-5
'I','1 n I
; 2.1 .) Employment Status of Population Agec(15 ;!'
Years Old and Over by Age Group:6ctober 2009
f. '1~, 2.? Employed Women and Men by Highest
Grade Completed: October 20091,2.3 Unemployed Persons by Highest Grade
~ 'Completed, by Sex and Age Group:2007 • 2009 JI , r < 2~
2.4 Employed Women and Men by Class of Woi1<er:October 2009
2.5 Employed Women andMen by Major -J:, Occupation: 09'0ber 2009, n2.6 Employed Women and Men by Major
Industry Group: October 2009 I
2.7 Underemployment Rate of Female Workers n6
In Agricu~ure and Non-Agricu~ure: 2006:iT \' 2.102.8 Overseas Workers 10 Years Old and OYer
I by Age Group and Sex: 20002.9 'Unemployed and Underemployed by
"- ,- 1"..•• ,"Persons by Sex: 2006 - 2009 ' •, "Awrage Daily Basic Pay by Sex: 2006 - 2009
• j. ,-
Youth Employment by Age Group I "
and Sex: 2007 - 2009
Table
,. 2.102.11
2-3

EMPLOYMENT
Table 2.1 Employment Status of Population Aged 15 Yea 1'9 andOver: October 2009 (in thousands)
Category Women Men Both SexesTotal Population 15 years old and o\er 2,386 2,415 4,801Tolal Labor Force 1,163 1,889 3,052Employed 1,095 1,756 2,851Unemployed 68 133 201Nol in lhe Labor Force 1,224 525 1,749
Source: OCtober 2009 Labor Force Survey. NSO
In Western Visayas, 63.6 percent of the lolal population 15years old and over were in the labor force and only 36.4 percentwere not. ex lhe lolal labor force, men comprising 61.9 percent,outnumbened women.
More women in the labor force were employed (94.2%) lhanmen (93.0%).
Labor Force. the populetioo 15 years 01:1end o,""r whether employedor unemployed who contribute to the productioo of goods and services inthe country.
Employed. indude all those who, during the reference penod a/9 15years old and over as of their last birthday and are reported either.
At work. Those who do any work even for one hour during thereference period for payor profit, or work with out pay on the fann orbusiness enterprise operated by e member of the same householdrelated by blood, marriage or adoption; or
With a job but not at work. Those who have a job or businessbut not at work because of tha temporary iJInessiinjury, vacation orothar reasons. Lika.,.,;se, persons who expect to report for work orto start operation of a fann or business enterprise within two weeksfrom the date of the enumerator"visit, are considered employed.
2-4

EMPLOYMENT
Table 2.2 Employed Women and Men by Highest GradeCompleted: October 2009 (in thousands)
Highest Grade Completed Women MenBoth Sexes(Total)
Employed Persons by Highest 1,095 1,756 2.851Grade CompletedNo Grade Completed 14 34 48Elementary 333 673 1.007Undergraduate 177 390 568Graduate 156 283 439
High School 377 717 1,094Undergraduate 123 271 393Graduate 254 446 701
College 371 332 702Undergraduate 139 178 316Graduate 232 154 386
""te: Data tray not add up to totals due to roundingSource: October 2oo9 Labor Force Survey, NSO
As of the October 2009 round of the labor Force Survey ofthe NSO, there were more employed men than women. Mencomprised 61.6 pencent of the labor fonce, while womenaccounted for 38.4 percent.
Most employed men were high school graduate (25.4%)followed by elementary undergraduate (22.2%). However,employed women were mostly high school graduate (34.4%) andcollege graduate (21.2%). More than half or 60.1 percent of thewor1<ingcollege graduate were women.
2-5

EMPLOYMENT
Table 2.3 Unemployed Persons by Highest Grade Completedand by Sex: 2007- 2009 (in thousands)
Highest Grade 2007 2008 2009Completed/Sex Women Men Women Men Women Men
Western Visayas 65 130 74 136 78 139No Grade Completed 1 • . • • 1Elementary 8 28 10 27 9 31Undergraduate 5 15 6 18 4 17Graduate 3 12 4 9 5 13
High School 26 56 32 65 32 61Undergraduate 7 20 7 20 9 21Graduate 20 37 24 45 23 41
College 31 46 32 44 37 45Undergraduate 11 24 13 20 18 25Graduate and Highe 19 21 19 24 19 21
Not Reported - - - - - -Notes: 1. Details may not add up to totals due to rounding.
2. Data \-\ere averages of four survey rounds (January, April, July and October)3. Data ~re generated using population project;ons based on the 2000Census of Population .
•. Less than 500.
Source: National Statistics Office, Labor Force Survey, Public Use Files.
Unemployment in the region steadily increased in the past threeyears (2007-2009) aloeraging 3.8 percent increase per year for bothsexes. Men comprised more than 66.0 percent and women about 34.8percent of the total unemployed in the region.
Most unemployed were high school graduate or in high school leloelfor both sexes. Unemployed women were mostly college educated.

EMPLOYMENT-._----_._-------_._--_ .••_----_.rable 2.4 Employed Women and Men by ClaesofWor1<er:
O<:tober 2009 (in thousand)
Category Women Men Both Sexes(Total)
Employed Persons by Class ofWOf1<er 1,095 1,756 2,851
Wage and Salary 581 999 1,579Worl<ed for Pri""te Establishment 433 876 1,309WOf1<edfor Go""rnment 148 121 271
Own-Account 342 630 972Self-Employed 308 474 781Employer 34 158 191
Unpaid Family Wor1<er 172 126 299
Nols: Data may not add up Inlotals due to roundingSo urco: October 2OO9l.abo r FOI'ooSUrvey, NSO
Of the 2.9 million kltal wor1<force of 'Nestem Visayas in the2009 October round Labor Force Survey, 61.6 pe'rcent wereemployed men and only 38.4 percent were women. Thoseemployed in private establishments comprised 45.9 percent of thetotal wor1<forceend only 9.5 percent in govemment. Of the total1.3 million wor1<ers engaged in private establishments, 66.9percent were men and 33.1 percent were women.
'Nomen on the other hand, constituted the majority of thosewor1<ing in govemment accounting to 54.6 percent. More womenaiso comprised the unpaid family wor1<ers with 57.5 percent,higher by 15.4 percentage points compared to men.
2-(
EMPLOYMENT
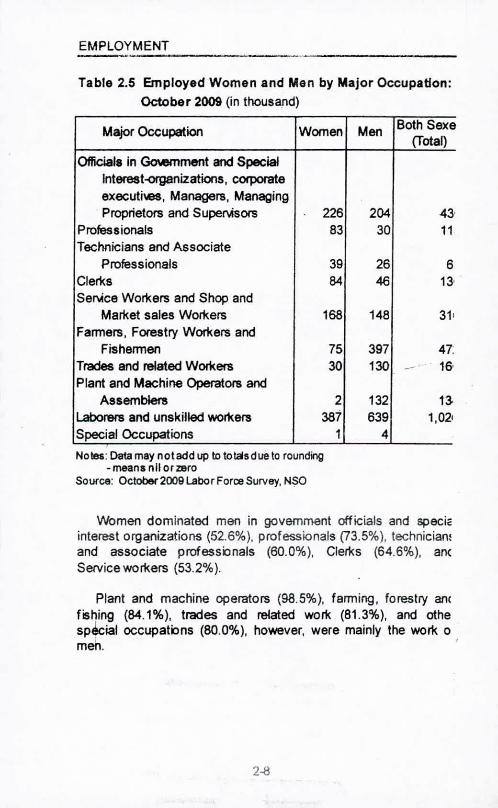
Table 2.5 Employed Women and Men by Major Occupation:October 2009 (in thousand)
Major Occupation Women Men Both Sexe(Total)
Officials in GoIemment and SpecialInterest~njzations, corporateexecuti\eS, Managers, Managing, Proprietors and Supel\isOlS 226 204 43
Professionals 83 30 11Technicians and Associate
Professionals 39 26 6Cler1<s 84 46 13Ser.4ce Wor1<ersand Shop and
Mar1<etsales Wor1<ers 168 148 31'Farmers, Forestry Wor1<ersand
Fishennen 75 397 47.Trades and related Wor1<efS 30 130 --' 16.Plant and Machine Operators and
Assemble!s 2 132 13Laborers and unskilled wor1<ers 387 639 1,02'Special Occupations 1 4
No lies: Data may not add up to totalsd ue to rounding.meananllorzaro
Source: October 2009 Labor Force Survey, NSO
Women dominated men in government officials and specieinterest organizations (52.6%), professionals (73.5%), technician!and associate professionals (60.0%), Cler1<s (64.6%), an<Servicewor1<ers (53.2%).
Plant and machine operators (98.5%), farming, forestry amfishing (84.1%), trades and related wor1< (81.3%), and othespecial occupations (60.0%), however, were mainly the wor1<0men.
2-8

EMPLOYMENT
Table 2.6 Employed Women and Men by Major Industry Group:October 2009 (in thousand)
Industry Group Women Men Both Sexes(Total)
Employed Persons by Major IndustryGroup 1,095 1,756 2,851
Agriculture, Hunting and Forestry 244 695 941Fishing 18 162 180Mining and QualT)'ing .. 7 9Manufacturing 59 77 137Electricity, Gas andWater 2 5 9Construction 2 137 140Wholesale and Retail Trade 307 209 516Hotels and Restaurants 55 26 80Trans., Storage and Communication 15 204 220Financial Intermediation 14 9 23Real Estate, Renting & Business
Acti>1ties 12 40 51Public Administration and Defense 71 97 168Education 84 19 105Health and Social Work 16 7 23Community, Social & Personal Sen.ic~ 36 32 66Priwte Hcuseholds with Employed
Persons 157 30 188
,,",tes:Datarraynotadduptototalsdueto rounding• rreans n~or zero
Source:October2009LaborForceSurvey,NSO
Six out of 16 industry groups were dominated by women. Therewere more employed women than men in Wholesale and RetailTrade (59.5%), Hotels and Restaurants (68.8%), FinancialIntermediation (60.9%), Education (80%), Health and social work(69.6%), Community, Social and Personal Services (54.5%), andPrivate Hcuseholds with Employed Persons (83.5%).
Almost 39.6 percent of the men's work force wereengaged in Agriculture, Hunting and Forestry which ranked firstamong the industry groups as to number of persons employed.
2-9

EMPLOYMENT
Table 2.7 Underemployment Rate of Women Workersin Agriculture and Non-Agriculture: 2006
Category Region VI Philippines
AgricultureVisibly underemployed 20.8 17.3In\1sibly underemployed 2.6 2.7
Non-AgricultureVisibly underemployed 7.6 6.4In\1sibly underemployed 4.2 5.1
Source: Labor Force Survey. NSO
The number of visbly underemployed women workers inthe region is higher than the national figure by 3.5percentage points in the Agriculture sector and 1.2percentage points in non-Agriculture sector.
Visbly underemployed, refers to employed persons whoworKed less than 40 hours during the reference week andwanted additional hours of worK.
Invisibly underemployed, refers to persons employed atfull-time jobs but who still went additional worK.
2-10

EMPLOYMENT
Table 2.8 Ovel'll9aa Workers 10 Years Old and Overby Age Group and Sex: 2000
AIJ9 Group Women Men Both Sexes(Total)
Ove,.•• Workers 10 YearsOld.nd Over 38,907 43,278 82, 185
Belo.v 20 7,583 3,716 11,29920-24 '5,842 4,151 9,99325-29 7,336 7,653 14,98930-34 6,415 7,045 13,46035-39 4,284 6,826 11,11040-44 3,029 6,121 9,15045 Years Old and Q;er 4,418 7,766 12,184
Sourco: NSO, 2000 C<>nsusof Populoffon end Housing
The 2000 census of Population and Housing showed that. inWestern Visayas, there are more men o..erseas wor1<ersthan womencomprising 52.7 percent of the total workers. Men dominated womeno-.erseas wor1<ersfrom ages 25-45 years old and Oloer.
From the age 9rouP 24 years old and below, women oloerseaswor1<ersdominated men. 01 the total 21,292 working abroad in theyear 2000, 63.1 percent were women and only 36.9 percent of thisage bracket were men.
2-11

EMPLOYMENT
Table 2.9 Unemployed and Underemployed Pel1lOllSby Sex: 2006 - 2009 (In Thousands)
SEX Year200i 2!X17 2008 2009.
lbImployed 186 196 210 216Women 68 65 74 78Men 118 130 138 139
UnderemplOyed 704 710 872 740Women 494 502 479 529Men 209 208 193 211
Ndss: 1. Det8/s may net acJ:Jup to taals ciJe to rourdng.2. D8taKMllM>7J(J8$ d fotr slK\<l)' rounds (Jtr>u8fY, April. J!.Iy Er1dOctober).J. Data KMl ganaratad using pcf)Iiatkn /Jrcif>djons basad 00 tha
2000 Census d Pop<JEtjoo.&vrca d dfta: Nalionti StEtjslics OIfica, l..iitJorForca SIwy, PthHc lSa Fiiss.
o.er the yeas, there 'I'oaS a reIalile increase r:i ~.pelSOIlS in both sexes in Western Visayas. More rren ttiM 'M:lITler1'M3t'llUl", ipIoyed in the regioo in the past fi:u years (2000-2009)Yoilh1118'oElf1!QB gender ~ r:i 29.5 pelCefll. More than tat r:i the leta!lJIlE!r1'1I:Aoyed'Mlre men in yeas 2008 Md 2009.
On the other hand, more than half r:i the total UI de CI i4AoyedwereY.OO'lel1 in years 2003 to 2009.
On the v.tde, a decrease r:i 5.4 percent in the nunber ofunderemployed was obser\ed in 2008. Women decreased I:>f 4.6percei .!age points and men I:>f 7.2 percentage points fran their IE!lelsthe pre.ious year.
2-12

EMPLOYMENT
Table 2.10 Average Daily Basic Pay by Sex: 2006-2009(In pesos)
Sex 2006 2007 2008 2009Both Sexes 192.97 186.15 196.53 212.79
Women 183.90 191.24 . 201.57 220.06Men 198.84 182.78 193.08 207.93
Note: 1. Data excludes basic pay of wage and salary v.orkers paid oncommission basis, honorarium, boundary 85 in the caseof jeBpney/buslfric~/e drivers.
2. Data "'6re calculated using population projections based onthe 2000 Census of PopuI8~on.
Source: Natlona! Statistics Office, Labor Force Survey, Public Use Files.
Except for the year 2006. the women were paid higher thanmen by an awrage of Php 9.69 than men.
For years 2007-2009 the awrage daily basic pay of bethwomen and men in the region were consistently on increasingtrends.
2.13

EMPLOYMENT
Table 2.11 Youth Employment by Age Group and Sex: 2008-2009(In Thousands)
I AGE GROUP 2008 2009Women .Men Women Men
All Age Groups 319 619 338 61415 - 19 87 167 96 15620 - 24 96 198 96 19825 - 30 135 253 146 261
Notes; 1. Details may not add up to totals due to rounding.2. Data ~r& averages of the four survey rounds (January, April, July
and October).3. Data KerB generated using population projections based on the
2000 Census of Population.
The age group 25-30 years showed the greatest number 01employed youth from the years 2008 to 2009, with an a>erage 0141.8 percentage points from the total population. In the same period,there were more men than women in all age groups.
In 2009, howe>er, of the 952,000 total employed youth, 64.5percent were men and only 35.5 percent were women.
2-14

Women MenIN WESTERN VISAYAS
AGRICULTURE ANDAGRARIA REFORM

AGRICULTURE AND AGRARIAN REFORM
Although women significantly contribute to agriculturalproducti\ity, they remain "in\isible" farmers. The limitedrecognition of women as producti\€ agricultural workers is pemapsdue to relati\€ insensiti\ity of policy-makers, planners andadministrators to their role in agricultural de\€lopment programtoward male farmers. Most agricultural and fisheries plans,programs and projects do not adequately address the needs ofwomen. The following are the priority issues concerning women inthe sector:
o limited access of women to land ownership and land use;
o limited access of women to credit from public banks,cooperati\€s and other agricultural inputs/seNces; and
o Lack of promotion of the rights of women peasants andagricultural workers to own land and access to supportseNces.
To address the abo\€ issues conceming women in thesector, the following policies and programs were formulated andimplemented:
o Ratification of the General Agreement on Tariffs and Trade inDecember 1994 enjoining all sectors to complete and find aniche in the wortd marke!. Since agriculture and fisheriescontribute nearty one-fourth to the gross national productand employ half of the labor force, it must be tapped as aspringboard for gender de\€lopment and for achie\ing thegoals of Philippines 2000;
o Medium-Term Agricultural De\€lopment Plan (MTPDP)seeks to enable farmers and fisherfolks to raise their incomeand impro\€ their li\ing standards;
3-1

The Department of Agriculture was the first agency to formulateagency-specific guidelines for gender de\€lopment in theguidelines for integrating Gender Concerns in the DA PlanningSystem;
o Gender concems were integrated into the training moduleson Fann Systems Del.elopment;
o Grains Production Enhancement Program (GPEP) RapidRural Appraisal Sun.ey was conducted from September1992 to March 1993 cropping seasons and generated sexdis aggregated data.
o Grameen Bank replication program, which focused onprOl.1dingcredit access to rural women as well as promotingsavings mobilization and capital build-up fonnation, wasimplemented;
o Initiated the del.elopment of Small Engineering Technologiesfor women; The Kasaganaan sa Sakahan at Kalikasan(KASAKALIKASAN), a national integrated pest managementprogram was implemented. It aims to educate fanners onproper crop husbandry and post management throughintensil.e training. The project guaranteed the participation ofat least 30 percent of women fanners/technicians nationwide.
o Del.elopment of viable agrarian refonn communities (ARCs),in pursuit of a faster, fairer and more meaningfulimplementation of CARP is targeted by DAR in the medium-tenn period (1993-1998). The ARCs will act as operating unitwhich synchronize and integrate land distribution and supportser\1ces delil.ery. Inten.entions provided to the ARCs willredound to increased fann productions, improl.ed householdincomes and promotion of sustainable del.elopment for some5 million fanners cOl.ered by 2 million hectares of agriculturallands.
3-2

AGRICULTURE AND AGRARIAN REFORM
LIST OF TABLES
Table Page
3.1 Percent Distribution of Women WorKers inAgriculture by Highest Grade Completed: 2001-2004 3-4
3.2 Percentage Share of Women Wor1<ersin Agricultureby Class of Wor1<ers,Region VI: 2002-2004 3-6
3.3 Wage & Salary and Own-Account Female WorKers,in Region VI: 2002-2004 3-7
3.4 Women in Agriculture in the Rural Areas:1998,1999& 2000 3-6
3.5 Awrage MarKlays in Paley and Com Farmingper Hectare by Source of Labor. 2004 3-9
3.6 Al.erage Man-{jays in Coconut and SugarcaneFarming per Hectare by Source of Labor. 2004 3-10
3.7 Daily Nominal Wage Rate: 2009 3-113.8 Daily Real Wage Rate: 2009 3-123.9 Beneficiaries of Agrarian Reform Communities
(ARC) by Pro\4nce: CY 2006 3-133.10 EP-CLOA Beneficiaries: CY 2008-2010 3-143.11 Number of agricultural Operators by Age Group
and Sex: 2002 3-15
Figure
3.1 Women WorKers in Agriculture by MajorOccupation Group, Region VI: 2004 3-5

AGRICUL lURE AND AGRARIAN REFORM
Table 3.1 Percent Distribution of Women Workers inAgriculture by Highest Grade Completed: 2001.2004
Highest Grade Completed 2001 2002 2003 2004
No Schooling 5.4 4.5 4.9 4.2Elementary 59.2 60.6 60.1 60.4Undergraduate 33.2 35.6 36.4 36.4Graduate 26.0 25.0 23.7 24.0
High School 30.0 29.2 27.6 27.8Undergraduate 14.4 14.1 12.3 13.7Graduate 15.5 15.1 15.3 14.1
College 6.1 6.1 7.8 8.0Undergraduate 3.6 3.8 4.5 5.4Graduate 2.5 2.2 3.2 2,6
Source: Labor Force Survey. NSO
More women workers who are at the elementary and highschool lewis actiwly participated in the agriculture sector for thepast four years. This comprised an 8wrage of 60.1 percent and28.7 percent, respectiwly. Participation of those who haw notgone to school and college graduates comprised the leastpercentage with an a\erage of 4.8 and 2.6 percent, respectiwly.
Percentage of elementary undergraduate women workers inAgriculture increased consistently from 2001-2003 and retain itshigh lewl in 2004. High school undergraduate workforce postedthe significant increase of 1.4 percentage points in 2004 from the12.3 percent recorded in 2003.
,3-4

AGRICULTURE AND AGRARIAN REFORM
Fig. 3.1 Women Workers in Agriculture by MajorOccupation Group, Region VI: 2004
ers
"7'Trade&ReIOperators & VVKrsAsserrblers 0,0%
0,0%
Officials Technicians '-"='~~;:...A"ofessionals 0.6% \.0/.. Workers
0.0% ~ 0.0%Special ~ Clerks
Occupations~" \ ~ 0.3%0.0% ~~ ./
'c
Source: Labor Force Survey, NSO
Laborers & unskilled workers comprised the bulk 01women workers in agriculture sector comprising 71.2percent. Agriculture workers followed with 28,0 percent.Officials and clerks shared less than one percent of thetotal work force.
3-5

AGRICULTURE AND AGRARIAN REFORM
Table 3.2 Percentage Share of Women Workers in Agricultureby Class of Workers, Region VI: 2002-2004
Category 2002 2003 2004
Wage and Salary Warners 34.9 33.8 34.2Warned for:Establishments 34.9 33.8 33.9Family Op~rated Acti-.ity 0.0 0.0 0.0GOl.ernmentlGol.€mment Corp. 0.0 0.0 0.3
Own Account Warners 29.5 30.2 28.4Self Employed 21.5 22.1 21.1Employer 8.0 8.1 7.3
Unpaid Family Worner 35.6 36 37.7Source; Labor Force Survey. NSO
Wage and salary warners of women in Agriculture sectorcomprised 34.2 percent of the regional total. Of which womenwarning in establishments comprised the bulk of 33.9 percent. OwnAccount Warners, on the other hand, constituted 28.4 percent.
Unpaid Family warners comprising 37.7 percent of the regionaltotal showed an increasing trend for three year-series (2002-2004).
3.6

AGRICULlURE AND AGRARIAN REFORM
Table 3.3 Wage & Salary and Own-Account Female Workers,Region VI: 2002-2004
Category 2002 2003 2004
AgriculturePermanent 51.3 50.6 54.6Short Term 37.8 40.9 40.9Different Employers 10.9 8.1 4.8
Non-AgriculturePermanent 79.3 76.1 76.8Short Term 18.8 21.6 21.7Different Employers 1.9 2.4 1.6
Source: Labor Force Survey. ~o
The own account female workers in the region engaged in thenon-agriculture with permanent job comprised 76.8 percent of the.regional total. It was higher than those with permanent job inAgriculture sctor accounting for 54.6 percent. Howe..er, for shortterm job and with different employers, those engaged in agricuturewas higher than those in the non-agriculture sector.
3-7

AGRICULTURE AND AGRARIAN REFORM
Table 3.4 Women in Agriculture In the Rural Areas:1998,1999 & 2000
Category 1998 1999 2000Female labor force participation rate 51.4 51.0 48.6Female employment rate 89.2 91.3 89.0Female unemployment rate 10.0 8.7 11.0Female underemployment rate 15.8 17.5 17.3Proportion of employed women in
agriculture as wage and salary eamers SO.8 55.3 47.0Proportion of females in agriculture as
own-<lCcountwor1<er* 30.3 30.3 27.5Proportion of employed women in agriculture 35.6 34.0 31.0
"Seff-elTl'loyod and OlTl'loyerSource: Bureau of Agricukural Statistics
. During the period 1998-2000, women in\Ol\e<Tlent in agriculturein the rural areas had been gelling less. This is shown by a declinein the labor force participation rate (from 51.4% in 1998 to 48.6% in2000); decrease in employment rate (from 91.3% in 1999 to 89.0%in 2000); increase in unemployment rate (from 15.8% in 1998 to17.3% in 2000); decrease in proportion as wage and salary earners(from 50.8% in 1998 to 47.0% in 2000); decrease in proportion asown-account wor1<er(from 30.3% in 1998 to 27.5% in 2000); and asignificant decrease in the proportion of employed women inagriculture from 35.6 pe~ent in 1998 to 31.0 percent in 2000.
Historically, it was In 1999 that women had significantly andacti""ly participated in agricultural actilities in the region. This isindicated by higher employment rate of 91.3 percent, the highestduring the period; and higher proportion of employed wOmen aswage and salary earners with 55.3 percent, also the highest duringthe period.
3-8

AGRICUl lURE AND AGRARIAN REFORM
Table 3.5 Average Man<lays in Palay and Corn Farmingper Hectare by Source of labor: 2004
Source of labor Palay ComWomen Men Women Men
Operator labor 0,2 5,3 0.4 14,6
Family labor 2.6 5,5 8.5 14,5
Hired labor 8,2 286 5.4 10,2Source: Agricu~uralAccounts and Statistical hdicators Division (AASID),
Bureau of Agrlcunural Statistics
Palay farming appeared to be more laborious than com farmingas it requires longer man<lays to complete, Men hired wor1<ersspent an aloerageof 28,6 man<lays in palay farming and only 10,2man<lays in com farming,
3.9

Table 3.6 Average Man-{jays in Coconut and SugarcaneFarming per Hectare By Source of Labor: 2004
Source of labor Coconut SugarcaneWomen Men Women Men
Unpaid labor 0.99 0.05 0.26
Family labor 0.8 1.66 0.14 0.87
Hired labor 23.25 0.98 26.65 92.49
Source: Agricultural Accounts and Statistical hdicators Division (AASID).Bureau of Agricultural Statistics
Sugarcane farming relati-.ely required longer working man-{jaysthan coconut farming for both women and men. Hired labor forsugarcane required 26.65 man-days for women and 92.49 man-days for men compared to the coconut's 23.25 and 0.98 man-daysfor women and men, respecti\o€ly.
3-10

AGRICULTURE AND AGRARIAN REFORM
Table 3.7 Doily Nominal Wage Rate: 2009
Workers Women Men Both Sexes(Total)
Farm Wof1<ers 178.3 188.9 187.2
Palay Farm Workers 186.3 197.9 195.8
Com Farm Workers 169.8 171.0 170.5
Coconut Farm Workers 159.4 170.0 169.5
Sugarcane Farm Workers 179.2 191.8 188.8
Source: Trends in Agricultural VVages. BAS
Men hired workers in agriculture enjoyed higher nominalwage rate compared to their women counterpart. In 2009, menfarm workers were paid an a""rage of Php188.9 per day,higher by Php10.6 than the women.
By crop, nominal wage ratee was higher among palay farmworkers, a""raging Php195.8 per day in 2009. Wagedifferential was computed at Php11.6 per day in fa\Or of menworkers. Coconut farm workers, howe""r, were paid the lowestnominal wage rate a""raging Php169.5 per day. Men workerswere paid Php170.0 per day, Php10.6, higher than the amountpaid to women.
Nominal IA6gerates is the amount of ooges a fann wr1<eractually received and is measured in current prices.
3-11

AGRICULlURE AND AGRARIAN REFORM
Table 3.8 Dally Real Wage Rate: 2009
Workers Women Men Both Sexes(Total)
Farm Workers 111.1 117.8 116.7
Palay Farm Workers 116.2 123.4 122.1
Com Farm Workers 105.8 106.6 106.3
Coconut Farm Workers 99.4 106.0 105.7Sugarcane Farm Workers 111.7 119.6 117.7
Source: Trends i1 Agricultural wages. BAS
Farm workers in Western Visayas were paid of their dailyreal wage rate at an a-erage of Php116. 7 per day in 2009.
The highest farm workers paid were those engaged in palayfarming a-eraging Php122.1 per day. Men workers were paidhigher by Php7.2 per day than the women workers. On otherhand, men sugarcane farm workers enjoyed wage differentialsof Php7.9 per day ol.eftheir women counterparts.
Real ooge rate is the nominal or money ooges deflated bythe consumer price index.
3-12

AGRICULTURE AND AGRARIAN REFORM
Table 3.9 Beneficiaries in Agrarian Reform Communities(ARC) by Province: CY 2006
Region! PrOl.1nce Women MenBoth Sexes(Total)
Region VI 2,115 4,708 6,823Aklan 232 223 455Antique 103 111 214Capiz 475 850 1,325Guimaras 167 347 514Iloilo 141 364 505Negros Occidenlal 997 2.813 3.810
Source: Departrrent of Agrarian Reform
Total Agrarian RefomnBeneficiaries (ARC) in Western Visayasreached 6,823 in year 2006. Men outnumbered the women asthey comprised 69.0 percent of the regional total.
Across pro\4nces, Negros Occidental outranked otherproo,1ncesas to number of beneficiaries in ARC with (3,810) or55.8 percent of the regional members. Out of 3,810 members,73.8 percent were men and only 26.2 percent were women. Capizfollowed with 1,325 members comprising 19.4 percent of theregional total . The proo,1nceof Antique had the least number ofbeneficiaries with only 214.
3-13

AGRICUL lURE AND AGRARIAN REFORM
Table 3.10 EP-CLOA Beneficiaries: CY 2008- 2010
PROVINCE 2008 2009 2010Women Men Women Men Women Men
REGIONAL TOTAL 2,644 4,927 1,670 3,556 2,325 8,645EP 129 206 129 291 54 110CLOA 2,515 4,721 1,541 3,265 2,271 8,535Aklan 244 246 96 129 158 162EP 0 0 0 0 0 0CLOA 244 246 96 129 158 162
Antique 82 128 100 55 27 23EP 0 15 5 5 1 1CLOA 82 113 95 50 26 22
Capiz 406 555 488 837 322 345EP 5 10 18 21 2 3CLOA 401 545 470 816 320 342
Guimaras 115 177 73 69 125 107EP 1 9 0 1 2 1CLOA 114 168 73 68 123 106Iloilo 444 627 173 318 419 618EP 98 129 32 61 35 81CLOA 346 498 141 257 384 537
Negros Occidental 1,353 3,194 740 2,148 1,274 7,390EP 25 43 74 203 14 24CLOA 1,328 3,151 666 1,945 1,260 7,366
Note: EP, Emancipation PatentCLOA, Certificate of Land Ownership Award
From 2008 to 2010, majority of the EP-CLOA holders in the regionwere men. They comprised about 72.1 percent of the total EP-CLOAholders in 2008 to 2010. Meanwhile, the percent share of womenbeneficiaries continued to drop from 2008 to 2010.
In its entirety, the prolince of Negros Occidental had the mostnumber of beneficiaries (both men and women) in the region from 2008to 2010. Among the prolinces, Antique and Guimaras had the leastnumber of EP-CLOA beneficiaries.
3-14

AGRICULTURE AND AGRARIAN REFORM
Table 3.11 Number of Agricultural Operators by Age Groupand Sex: 2002
Age Group Women Men Not TotalReported
All Ages 56,655 368,242 4,559 429,45615.19 45 530 16 59120.24 379 7,385 39 7,80325.29 965 21,159 165 22,28930.34 1,978 36,395 292 38,66535.39 3,195 45,124 385 48,70440.44 4,634 48,611 590 53,83545.49 5,682 46,946 436 53,06450.54 6,944 43,464 411 SO,81955.59 6,454 32,979 352 39,78560.64 8,328 32,307 329 40,96465.69 7,005 22,961 202 30,16870.74 4,783 15,022 156 19,96175 and O\er 6,062 14,035 .142 20,239Not Reported 201 1,324 1,044 2,569
Source:National Statistics OfIlce:2002 Census of t'gricullure
In the year 2002, agricultural operators in the region reached429,456, where 85.7% (368,242) of which were men and 13.2% werewomen.
Similarly, all age groups had more men than women agriculturaloperators.
Among women operators, 50-64 years old were the recorded agebracket. that most women engaged in agricultural aclil<ilies.Meanwhile, more men operators were in ages 4044 years.
3.15

Women &MenIN WESTERN VISAYAS
EDUCATION

EDUCATIONIn any de-.eloping country, literacy is a major battleground.
In Western Visayas, people particularly place a high value oneducation as it facilitates and impro-.es a person's employability.
In quest of quality education, women ha-.e to compete withmen in all qualifications and gi-.ens. Rare are programs speciallydesigned for family women thus placing them at a disadvantagenot only in terms of opportunities for higher ranks in fa'.Or of anassignment to other places but also of accepting study offersaway from home. In effect, family women would rather contendwith low salary and rank than to abandon their traditional roles 01motherhood and family care. Need-based special programs andstudies are pressing issues that need to be addressed. Otherpriority issues concerning women are:
o Inequitable access of women to ser,;ces and opportunitiesin some areas of education and training;
o Need to promote gender-fair education and training; and
o Non-fesponsi-.eness of education and training to theimpro-.ement of women's status.
To address the issue of accessibility to quality education,the Philippine go-.emment joined the worldwide mo-.ement,Education for All (EFA). Specifically, the go-.emment formulatedthe Philippine Plan of Action for EFA a set of clear policy andprogram directions to achie-.e the goal of basic education for allby the year 2000.
o A Women's Studies Consortium was established in 1990among six major uni-.ersities, namely: SI. Scholastica'sCollege, Philippine Women's Uni-.ersity, Miriam College,Uniloersity of the Philippines, De la Salle Uniloersity, andAteneo de Manila Uni-.ersity. The consortium is aimed toaccelerate the de-.elopment of women's studies as a field ofstudy.
4-1

o To address the issue 011 gender tracking in professions, theTechnical Education and Skills De-.elopment Authority(TESDA) has institutionalized a program called the Womenin Non-Traditional Trades (WIND. The WINT is aimed attraining and iO\oll.1ng women in various non-traditionalcourses such as automoti-.e, refrigeration and airconditioning, electricity, welding, plumbing, masonry,carpentry, etc.
4-2

EDUCA1l0N--------- -~-LIST OF TABLES
Table Page
4.1 Enrolment and Graduates in HEI by 4-4Program Lewl by Sex: SY 2006-2007
4.2 Number of HEI Faculty with Baccalaureale 4-5Degree by City/Prolince: SY 2006-2007
4.3 Number of HEI Faculty with Masleral Unils!Completed Academic Requirements (CAR)by City/Prolince: SY 2006-2007 4-6
4.4 Number of HEI Faculty with Masteral.Degreeby City/Prolince: SY 2006-2007 4-7
4.5 Number of HEI Faculty with Docloral Units!Completed Academic Requirements (CAR)by City/Prolince: SY 2006-2007 4-6
4.6 Number of HEI Faculty with Doctoral Degree:by City/Prolince: SY 2006-2007 4-9
4.7 Functional Literacy Under the AltematiwLearning System: 2007 4-10
4.8 Literacy in Rehabilitation Centers Under lheAllemati", Learning Syslem: 2007 4-11
4.9 Literacy for Indigenous People Under lheAllematiw Learning System: 2007 4-12
4.10 Literacy Classes Integrated with IncomeGenerating Project Under lhe Altemali-..eLearning System: 2007 4-13
4.11 Balik-Paaralan Para sa Out-of-5chool-Adulls Under lhe Altemati-..e LearningSyslem: 2007 4-14
4.12 Functional Literacy Rate of Population 10-64Years Old, by Sex and Age group: 2003 4-15
4.13 Basic Literacy rate of Population 10 Years Oldand O-..er,by Sex, and Age group: 2003 4-16 .
4-3

EDUCATlON
Table 4.1 Enrolment and Graduates In HEI by ProgramLevel and by Sex: SY 2006-2007
Program Lewl Enrolment GraduatesWomen Men Women Men
Undergraduate 104,294 86,087 22,996 15,196Masten; 3,645 1,658 419 232Doctoral 393 233 44 41Total 108,332 87,978 23,459 15,489Source: Cormisslon on Hgher Education
Enrolles in the HEI in the school year 2006-2007 reached196,310 wherein 55.2 percent of which were women and 44.8percent were men. In all program levels, it was recorded that therewere higher women enrolees than men.
There were 38,928 graduates in HEI, which is 19.2 percent ofthe total enrolment in the same year. More than half of thegraduates were women comprising 60.3 percent or 23,459graduates with an average gender gap of, among 3 programlevels, 17.6 percentage points.
4-4

EDUCATION
Table 4.2 Number of HEI Faculty with Baccalaureate Degreeby City/Province: SY :2006-2007
Baccalaureate DegreeCity/Prolo1nce
Women MenBoth Sexes(Total)
Aklan 111 132 243Antique 25 10 35Bacolod City 438 267 705Bago City 5 9 14Cadiz City 4 8 12Capiz 41 46 87Escalante City 5 5 10Guimaras 3 6 9Iloilo 136 114 250Iloilo City 641 432 1.073Kabankalan City 12 15 27La Carlota City 21 19 40Negros Occidental 38 29 67Passi City 7 8 15Roxas City 114 85 199Sagay City 6 8 14San Carlos City 2 15 17Silay City 3 4 7Sipalay City 9 2 11Talisay City 16 25 41Victorias City 2 6 8
Total 1,639 1,245 2,884Source: Col11TlSslOn on Hgher Education
In Western Visayas. the number of faculty in the HigherEducation Institutions (HEI) lor SY 2006-2007 with baccalaureatedegree were higher in women than in men. Of the 2,884 faculty,56.8 percent were women and 43.2 percent were men.
The two highly urbanized cities, Iloilo City (37.2%) andBacolod City (24.4%) registered the highest number of facultywith baccalaureate degree. The cities of Silay and Victoriasrecorded the least number of faculty holding baccalaureatedegree with only 7 and 8 faculties. respecth,ely.
4-5

EDUCATION
Table 4.3 Number of HEI Faculty with Masteral Units!Completed Academic Requirements (CAR)by City/Province: SY 2006-2007
With Masteral Units/Completed
City/Pro'o1nceAcademic Requirements (CAR)
Both SexesWomen Men
(Total)Aklan 214 142 356Antique 70 49 119Bacolod City 298 163 461Bago City 12 4 16Cadiz City 14 15 29Capiz 117 80 197Escalante City 8 8 16Guimaras 31 17 48Iloilo 416 254 670Iloilo City 677 383 1.060Kabankalan City 26 7 33La Canota City 27 15 42Negros Occidental 77 32 109Passi City 8 4 12Roxas Cily 57 54 111Sagay City 20 10 30San Carlos City 46 26 72Silay City 14 6 20Sipalay City 40 25 65Talisay City 22 14 36Victorias City 3 5 8
Total 2.197 1.313 3,510Source: CofTlTission on tigher Education
In SY 2006-2007, women, comprising 62.6 percent of theregional total, outnumbered men as to number of faculty withmasteral units or had completed academic requiremenls (CAR)for Masteral degree.
Iloilo City and 110110 Pro'o1ncerecorded the highest number offaculty with masleral units/CAR which totaled to 1,060 and 670faculty, respecti..ely. The city of Victorias has 8 faculty withmasteral units/CAR, the least number within the region.
4-<3

EDUCATION
Tabla 4.4 Number of HE! Faculty with Woasteral Degreeby City/Province: SY 2006.2007
Masteral Degree HolderCrty/Pro'oince
Women MenBoth Sexes
(Total)Aklan 95 47 142Antique 43 24 67Bacolod City 422 328 750Bago City g 8 17Cadiz City 15 5 20Capiz 25 21 46Escalante City . 6 5 11Guimaras 5 6 11Iloilo 236 130 366Iloilo City 610 446 1,056Kabankalan City 35 21 56La Ca~ota City 15 4 19Negros Occidental 31 14 45Passi City - 4 4Roxas City 72 30 102Sagay City 10 7 17San Carlos City 14 5 19Silay City 14 6 20Sipalay City 14 5 19Talisay City 33 56 89Victorias City 4 5 9
Total 1,708 1,1n 2,885Source: CorTTlission on Higher 6:fucation
Masteral Degree holder facuity in the Higher EducationInstitutions (HEI) was high among women, 59.2 percent thanof men, 40.8 percent. Women outnumbered men in 12 citiesand 5 pro'oinces. Relati..ely, the pro'oinces of Guimaras, andthe cities of Passi, Talisay and Victorias were dominated bymen.
Iloilo City, Bacolod City and Iloilo Proloince recorded thehighest number of faculty holding masteral degree with 1,056,750, and 366 faculty, respecti..ely. Passi City on the otherhand, had only 4 faculty with masleral degree,
4-7

EDUCATION
Table 4.5 Number of HEI Faculty with Doctoral UnllslCompleted Academic Requirements (CAR)by City/Province: SY 2006-2007
With Doctoral Units/Completed
City/Prolince Academic Requirements (CAR)
Women Men Both Sexes(Total)
Aklan 53 24 77Antique 17 28 45Bacolod City 24 19 43Bago City 6 2 8Cadiz City 15 4 19Capiz 19 25 44Escalante City . - .Guimaras 3 1 4Iloilo City 65 45 110Iloilo 146 96 242Kabankalan City 2 5 7La Canota City - . .Negros Occidental 6 1 7Passi City . 4 4Roxas City 14 10 24Sagay City 3 2 5San Canos City 5 3 8Silay C~y 3 1 4Sipalay City 3 2 5Talisay City 6 5 11Victorias City 2 . 2
Total 392 277 669Source: Cormission on t-igher Education
In SY 2006.2007, the number of facu~y in the HEI withdoctoral units or had completed academic requirements (CAR)for doctoral degree reached 669. Women dominated mencomprising 58.6 percent.
The top citieslprolinces as to the highest number of facu~ywith doctoral units/CAR were Iloilo City (242 or 36.2%), Iloilopro,,;nce (16.4%). On the other hand, Escalante City and LaCanota City had no faculty with doctoral degree or hadcompleted academic requirements for doctoral program for theschool year.
4.8

EDUCATION
Table 4.6 Number of HEI Faculty with Doctoral Degree:SY 2006-2007
City/Pro,;nce Doctoral Degree HolderWomen Men Both Sexes
Aklan 20 17 37Antique 2 10 12Bacolod City 103 50 153Bago City 7 1 8Cadiz City 4 3 7Capiz 14 14 28Escalante City . . .Guimaras . 2 2Iloilo 61 42 103Iloilo City 121 98 219Kabankalan City . 3 3La Carlota City 6 5 11Negros OcciC:~ntal 7 4 11Passi City . . .Roxas City 20 12 32Sagay City 7 3 10San Carlos City 23 4 27Silay City 1 . 1Sipalay City . 3 3Talisay City 5 2 7Victorias City . . .
Total 401 273 674Source: Comrission on Hgher Education
The number of doctoral degree holder faculty in the HEI totaledto 674 for SY 2006-2007Women dominated men as they comprisedmore than half or 59.5 percent of the total faculty.
The city of San Carlos and the pfO\ince of Antique had thelargest gender gap in faculty holding doctoral degreewith 70.4, and66.7 percentage points, respecti..ely.
The cities of Escalante, Passi and Victorias had no faculty inHEIwith doctoral degree.
4.9

EDUCATION
Table 4.7 Family Literacy Under the Alternative LearningSystem: 2007
NO.ofEnrollees CompletersDi,;sion Learning
Groups Women Men Women MenAklan 1 4 4 on-goingAntique 6 59 43 on-goingCapiz 6 35 34 on-goingIloilo 1 21 0 21 0Kabankalan City 4 6 5 3 2San Carlos City 6 24 20 15 13
Total 24 149 106 39 15Source: Alternative Learning System, Departrrenl 01 Education
In 2007, ALS conducted classes to 24 learning groups with255 enrollees. Of the total enrollees, 54 or 21.2 percentsuccessfully completed the program. Only the school di,;sion ofIloilo had com pieters, 38.9 percent. Among the completers, thewomen attained a completion rate of 72.2 percent, while men hadonly 27.8 percent.
The di,;soins of Aklan, Antique and Capiz had zerocompletion rate while the Iloilo achiel.ed 100 percent.
4-10

EDUCATION
Tabie 4.8 Literacy in Rehabilitation Cenle", Under theAlternative Leaminq System: 2007
Number of Enrolment CompletersDi'oision Learning
Groups Women Men Women I MenAklan 1 - 38 ongoingAntique 2 50 - 50 -Cadiz City 1 - 25 . 16Iloilo . 1 - 20 - 20Kabankalan City 4 18 34 1 29 'San Ca~os City 2 - 46 - 46Sliay City 1 , 24 1 24
Total 12 69 187 52 135Source: Alternative Learning System, Department of Education
In 2007, the ALS of the Department of Education was able toconduct twel", classes in S6\ef1 di'oisions to impro", the literacy ofthe inmates in rehabilitation centers. Out of 256 enrollees, 18873.4%) inmates, successfully completed the program. Among theenrolees, 73,0 percent of which were men and had a completionrate of 72,7 percent. On the other hand, women enrolees recordedthe highest completion rate which is 75.4 percent.
The school di'oisionof Antique, Iloilo and Sliay City recorded 100percent completion rate while Aklan had zero completion rate.
4.11

EDUCATION
Table 4.9 Literacy for Indigenous People Under theAlternative Learning System: 2007
'4umber 0Enrollees CompletersDi-.4sion Learning
Groups Women Men Women I MenAklan 6 74 67
~~ing59
Antique 5 39 32Cadiz City 1 18 7 161 7
Total 12 131 106 821 66Source: Bureau of Alternative Learning SysterT\ Department of Education
Through the ALS, literacy classes were also extended toindigenous groups in the region. In 2007, 12 groups were carriedout to a total of 237 enrollees, of which 55.3 percent were womenand 44.7 percent were men. The school di-.4sionsof Aklan andAntique had the most number of enrollees at 141 and 71,comprising 59.5 and 30.0 percent of the total enrollees.
In their entirety, only 62.4 percent of the enrollees completedthe program, 55.4 percent among the women and 44.6 percentamong the men.
Across di-.4sions, Cadiz City made it to 92.0 percentcompletion rate, followed by Aklan (88.7%). Antique had zerocompletion rate.
4-12

EDUCAllON
Table 4.10
Category
90439
6136.287
1.0541.892
562.5.374
8751.605
Source- Alternative Learning System (ALS), Oepartrrent of Education
Literacy classes integrc.t!odwith income generating projects(IGP) conducted totaled to 439 in 2007. There were 8,179enrollees, of which 76.9 percent were women and 23.1 percentwere men.
In \OCational skills classes, women outnumbered men inenrolment and completion numbering 5,674 (87.1%) and 4,812(86.8%).
In technical skills classes, howe"",r, more men than womenenrolled and completed the program. A total of 1,054 men(63.2%) enrolled and out of this, 875 (60.9%) completed theprogram.
4-13

EDUCATION
Table 4.11 Balik.Paaralan Para sa Out-of-5chool.AdullsUnder the Alternative Learning System: 2007
Number of Enrollees CompietersDi~sion Learning Women Men Women MenClasses
Iloilo 2 15 35 15 35Negros Occidental 4 47 23 47 23Roxas City 1 26 7 26 7
Total 7 88 65 88 65Source: AlternatIVe Learning System, Departrrent of EducatIOn
Another program of ALS is the conduct of literacy classesfor the Balik-Paaralan Para sa Out-of-School-Adults (BP-oSA).For the year 2007, Iloilo conducted two classes, NegrosOccidental, 4 classes and Roxas City, 1 class.
On the whole, a total of 153 out-of-school adults attendedthe classes with women (57.5%)outranking the men (42.5%)Both men and women completed the program 100%.
By di~sion, there were more enrollees in Negros Occidental(45.8%) than the rest. Likewise, women outranked men innumber of enrolees in the three di~isions.
4-14
EDUCAllON
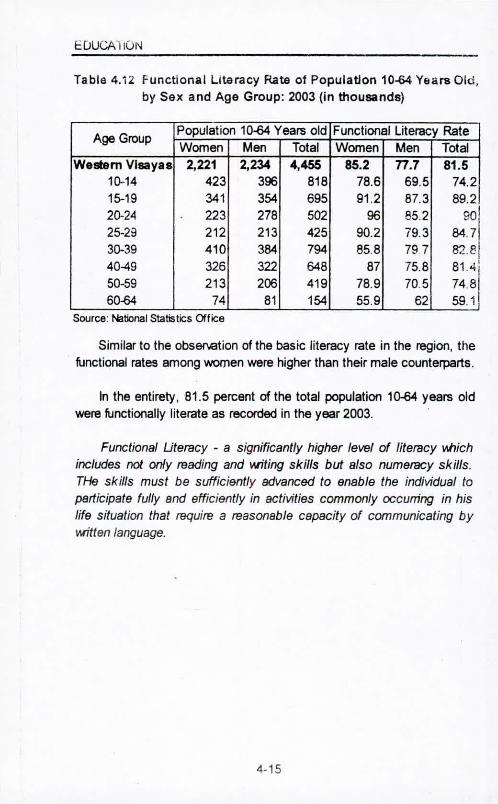
Table 4.12 Functional Litaracy Rata of Population 10~ Vears Old.by Sex and Age Group: 2003 (in thousands)
Age GroupPopulation 10~ Years old Functional Literacy RateWomen Men Total Women Men Total
Western Vlsayas 2,221 2,234 4,455 85.2 77.7 81.5lQ..14 423 396 818 78.6 69.5 74.215-19 341 354 695 91.2 87.3 89.22Q..24 223 278 502 96 85.2 00'25-29 212 213 425 90.2 79.3 84~713Q..39 410 384 794 858 797 828
140-49 326 322 648 87 75.8 81AI50-59 213 206 419 78.9 70.5 74.860-64 74 81 154 55.9 62 59.1 !
Source: National Statistics Office
Similar to the obs!l/\ation of the basic literacy rate in the region, thefunctional rates among women were higher than their male counterparts.
In the entirety, 81.5 percent of the total population lQ..64 years oldwere functionally literate as recorded in the year 2003.
Functiona' Uteracy - a significantly higher level of literacy I'ohichincludes not only reading and witing skills but also numeracy skills.THe skills must be sUfficiently advanced to enable the individual toparticipate fully and efficiently in activities commonly occuning in hislife situation that require a reasonable capacity of communicating bywitten language.
4-15

EDUCATION
Table 4.13 Basic Literacy Rate of Population 10 Years Old and Over,by Sex and Age Group: 2003 (in thousands)
Age Group Population 1~ Years old Basic Literacy RateWomen Men Total Women Men Total
Western Visayas 2,443 2,435 4,878 94.0 91.6 92.810-14 423 396 818 97.2 92.0 94.715-19 341 354 695 98.3 97.5 97.920-24 229 280 508 98.6 95.1 96.625-29 219 221 440 96.7 91.0 93.830-39 430 409 840 950 93.8 94.440-49 339 334 673 94.0 91.8 92.950-59 213 213 425 90.1 88.5 89.3
60 and OIer 250 228 478 782 76.9 77.6Source: National Statistics Office
Data shows that 94 out of 100women in the region has the abilityto read and write with understanding a simple message in any languageor dialect. There were more basically literate women aged 10 years oldand OIer than men in the year 2003. Women aged 20-24 years postedthe highest percentage points in the region.
Among men, ages 15-19 recorded the highest basic literacy rate of97.5.
Basic Uteracy - ability to read and wite wth understanding asimple message in any language or dialect. The basic literacy statusof an individual can be determined based on the respondents'ansoor tothe question "can _ read and wite a simple mesage in any languageordia/eet?
4-16

Women&MenIN WESTERN VISA YAS
HEALTH, NUTRITIONAND VITAL STATISTICS

HEALTH, NUTRITION AND VITAL STATISTICS
Women constitute one-half of the region's population. Givingthem equal rigilts and access in the legal and cultural contextwould not only make them partake in the o\€rall effort forde\€lopment but would also mean upgrading of the family. Ifwomen are integrated into the mainstream of de\€lopment,naturally, they become more mindful of the importance of healthand nutrition in the family, and thus, their community's.
In\€stment in women's health is indeed a de\€lopment issue.Their reproducti\€, physical and mental capacities must beimpro\€d to producti\€ly hamess them for de\€lopment. Amongthe concerns that women should be gi\€n elbow room for makingdecisions, are:
o Health and deh\€ry system to meet women's health andreproducti\€ needs;
o Further impro\€ment of the health and nutritional status ofwomen and children; and
o Women's participation in the deli\€ry of health andnutrition services.
Some recent policies, Institutional and programde\€lopments on health and nutrition include the following:
o The Department of Health's (DOH) issuance of policiessignificant to gender and de\€lopment such as: 'Peripheryas a Bias" and "Population Management." The first policystates that people in the periphery, specifically the poor,children, women, indigenous people, aged and disabled,shall be the priority of the DOH. They shall be guaranteedhealth information, education and services to make themresponsible for their health and the health of theircommunities. The second policy states that in a humaneand gender-sensiti\€ way, the DOH will provide e\€ryone
5-1

access to information, ser.ices and guidance in planning theirfamilies, whether through natural or artificial methods, as ameans to improling their health and well being. Theunderlying priorities are enhancing women's health, ensuringsafe motherhood and promoting child sur.i",,1 through birthspacing.
o The Women's Health and Safe Motherhood Project (WHSMP),which began implementation in mid-1985. It aims to impro\€the health of women in support of the go\€mment's currentdri\€ to reduce female morbidity and mortality. Aside fromproliding basic heallh ser.ices, Ihe program will supportcooperati\€ efforts to empower women in the communities toimpro\€ their health conditions.
o The DOH issuance of more than 100 medical cards to comfortwomen in 1994 through the NGO Task Force on FilipinoComfort Women. To make the Comfort Women Program moreeffecti\€, standard procedures and guidelines were formulatedto implement and monitor the program.
o The Matemal and Under-Fi\€ Care Program which aims,among others, to reduce morbidity among mothers during andafter pregnancy. One of its main actilities is the expansion ofits Female Functional Literacy Project to se\€n pro.,;nces,
o Recognizing mothers and children as the most wlnerablegroups among the urban poor. The Urban Health and NutritionProject has targeted comprehensi\€ maternal and child healthser.ices to ensure sur.i",,1 and de\€lopment of children and toprotect mothers from the host of ailments that threatenmaternal health.
o The Guidelines on HIV/AIDS IEC Actilities (print, broadcastand interpersonal communication) formulated by the PhilippineNational AIDS Council that recommends that IEC acti.,;ties begender-sensiti\€. IEC acti.,;ties should not portray women asinferior to men, e.g., women shown as sex objects of men.
5-2

HEALTH, NUTRIllON AND VITAL STAllSnCS
LIST OF TABLES
Table Page
5,1 Ten Leading Causes of Morbidity, Region VI: 2009 5-45.2 Ten Leading Causes of Morbidity, Aklan: 2009 5-55.3 Ten Leading Causes of Morbidity. Antique: 2009 5-65.4 Ten Lesding Causes of Morbidity, Capiz: 2009 5.75,5 Ten Leading Causes of Morbidity. Guimaras: 2009 5~5,6 Ten Leading Causes of Morbidity. 110110:2009 5-95,7 Ten Leading Causes of Morbidity. Negr08
Occidental: 2009 5-105,8 Projected Values of Life Expectancy at Birth:
2000-2005 to 2015-2020 5-115,9 Projected Total Fertility Rstes, Medium Assumpiion:
2000-2005 5-125.10 Projected Life Expectancy at Birth by Sex, Medium
Assumption: 2000-2005 5-125,11 Number of Disabled Persons by Type of Disability:
2000 5-135,12 Number of Infant Death by Sex and by City/
PrOlince: 2009 5-145,13 Number of Perinatal Dreaths and Deaths Among
Children Under 5 Years Old by City/prOlinee: 2009 5-155.14 Number of GO\emment Medical Practitioners by City
PrOlinee and by Sex: 2009 5-16
5-3

HEALTH, NUTRITIONAND VITAL STATISTICS
Table 5.1 Ten Leading Causes of Morbidity, Region VI: 2009
o;sease Women Men Both Sexes(Total)
Upper Respiratory Tract Infection 89,994 79,325 169,319Pneumonia 34,670 25,116 59,786Injuries 14,246 20,945 35,191Infuenza 14,449 13,777 28,226Acute watery diarrhea 11,687 12,474 24,161Hypertension 13,952 9,838 23,790Bronchitis 11,581 11,254 22,835T.B. Respiratory/Pulmonary 4,988 7,643 12,631Urinary Tract Infection 10,776 5,337 16,113Dengue 1,048 1,160 2,208
TOTAL 206,343 165,709 392,052Source: DOH-Center for Health Development-western \1sayas
In 2009, Upper Respiratory Trsct In!ectlon, the top leadingcause of morbidity, had Infected 169,319 persons, Of the tolalcasea, more women (53.2%) were sfnicted with URTI than men(46,8%).
Other leading causes of morbidity, howe",r, recorded higherpopulations among men were injuries (20,945 cases), acute waterydiarrhea (12,474 cases), Pulmonary/respiratory TB (7,643), and.dengue (1,160 cases).
On the other hand, there were more women inflicted with URTI(89,994 cases), pneumonia (34,670 cases), Inluenza (14,449cases), hype~ension (13,952 cases), bronchitis (11,581 cases)and Urinary Tractlnleclion (10,776 caaes) than men.
5-4

HEALTH, I,UTRITiO" AND VITAL ST" nsncs
Table 5.2 Ten Leading Causes of Morbidity, Aklan: 2009
Disease Women Men Both Sexes(Total)
Upper Respiratory Tract Infection 6.696 5,766 12,462Pneumonia 2,823 2,797 5,620Bronchitis 1,528 1,850 3,378Hypertension 1,919 1,308 3,227Acute watery diarrhea 1,467 1,747 3,214Injuries 1,096 1,813 2,909Urinary Tract Infection 895 498 1,393Influenza 473 444 917Pulmonary/Respiratory TB (PTB) 254 395 649Heart Diseases 233 213 446
TOTAL 17,384 16,831 34,215Source: [X)H..Center for l-lealthDelleloprrent-Western Visayas
Upper Respiratory Tract Infection (URn) was the leadingcause of morbidity in the pro\1nce of Aklan in 2009 with 12,462cases. Following URTl are pneumonia (5,620 cases), bronchitis(3,378 cases), hypertension (3,227 cases), and Acute waterydiarrhea (3,214 cases).
Men were more susceptible to bronchitis (54.8%), acutewatery diarrhea (54.4%), injuries (62.3%) and TB respiratory(60.9%) while more women suffered from URTl (52.7%),pneumonia (49.2%), hypertension (58.5%), Influenza (50.6%),UTI (63.3%), and gastritlis (51.2%).
5-5

Ht:AL IH, NUl KlllUN ANU VIIAL STATISTICS
5.3 Ten Leading Causes of Morbidity. Antique: 2009
Disease Women Men Both Sexes(Total)
Pneumonia 4,171 4,622 8,793Upper Respiratory Tract Infection 4,902 3,733 8,635Influenza 3,102 2,990 6,092Injuries 2,026 2,506 4,532Acute watery diarrhea 1,138 1,273 2,411Hypertens ion 889 1,342 2,231Bronchitis 1,019 783 1,802Pulmonary/Respiratory 16 (P16) 609 705 1,314Urinary Tract Infection 470 264 734Heart Diseases 46 34 80TOTAL 18,326 18,218 36.544Source: OOli-center for Health OeveloprTJ:!nt.Western Visayas
Pneumonia, the leading cause of morbidity in the pro\oince ofAntique infected 8,793 persons in 2009, Both women and men weremost likely susceptible to the disease, Following pneumonia on the10 leading diseases were URTI (8,635 cases), influenza (6,092cases), injuries (4,532 cases), and acute watery diarrhea (2,411cases).
Disease like pneumonia (4.622 cases), injuries (2,506 cases),acute watery diarrhea (1,273 cases), hypertension (1,342 cases),and pulmonary/Respiratory 16 (705 cases) were higher among men.While URTI, influenza, Bronchitis, heart disease and UTI were mostcommon in women during the year.
5-6

h'='AL1H, NUlti.liiON AND VIlAL SlATI::r'ICS
lable 5.4 Ten Leading Causes of Morbidity, Capiz: 2009
Disease Women Men Both Sexes(Total)
Upper Respiratory Tract Infection 5,046 4,191 9,237Pneumonia 4,171 3,435 7,606Hypertension 1,189 1,652 2,841Injuries 979 1,325 2,304Urinary Tract Infection 947 448 1,395Bronchitis 634 497 1,131Acute watery diarrhea 465 496 961Pulmonary/Respiratory T.B. (PTB 164 303 467Influenza 172 197 369Amoebiasis 71 112 183
TOTAL 13,838 12,656 26,494Source: [X)H..Center for J-eatth Deve\oprrenl-lNestern Visayas
Diseases of the URn, pneumonia, hypertension and injuries hadthe highest occurrence in the prmince of capiz inflicting 9,237;7,606; 2,841 and 2,304 persons, respectiwly. Other diseases thatcontributed to the high morbidity of the prolince included un (1,395cases), and bronchitis (1,131 cases),
More 'of women suffered from URn (5,046 cases), pneumonia(4,171 cases), un (947 cases) and bronchitis (634 cases). casesof hypertension, injuries, acute watery diarrhea, PTB, influenza andamoebiasis was higher among men with 1,652; 1,325; 496, 303,97and 112 cases, respecti""ly.
5-7

HEAL 111,NUTRI1l0N AND VITAL STA11SnCS
Table 5,6 Ten leading Causas of Morbidity, Gulmaras: 2009
Disease Women MenBoth Sexes(Total)
Upper Respiratory Tract Infection 3,858 3,271 7,129Injuries 589 783 1,372Urinary Tract Infection 539 222 761Pneumonia 348 339 687Hypertension 300 193 493Influenza 198 162 360Pulmonary/Respiratory T.B. (PTB) 152 168 320Acute watery diaJThea 125 152 277Arthritis 63 23 86Bronchitis 15 21 36
TOTAL ••• 6,172 5,313 11,485Source: DOH-Center for Helalth Oeveloprrent-V\estern Visayas
More women were infected with upper respiratory tractinfection (3,858 cases), un (539 cases), and pneumonia (348cases) in the pl'O\ince of Guimaras in 2009. The URn and injurieslargely contributed to the mortlidily status of the prol.ince thatinfected 7,129 and 1,372 persons, respecti..ely.
Relati..ely, more men than women suffered from injuries (786cases), pulmonary/respiratory tuberculosis (168 cases), and acutewatery diaJThea(152 cases).
5-8

HEALTH, NUlRI1l0N AND VITAL STAnsncs
Table 5.6 Ten Leading Causes of Morbidity, Iloilo: 2009
Disease Women Men Both Sexes(Total)
Upper Respiratory Tract Infection 20,626 17,901 38.527Pneumonia 4,092 4,163 8,255Hypertension 3,087 2,164 5,251Injuries 3,363 6,031 9,394Urinary Tract Infection 2,620 1,207 3,827Infuenza 1,588 1,587 3,175Bronchitis 1,522 1,345 2,867Pulmonary/Respiratory T.B. (PTB) 675 1,040 1,715Heart Diseases 500 257 757Diarrhea 10 10 20
TOTAL 38,073 35,695 73,768Source: DOH-Genter for Health Developrrent-western Visayas
The leading causes of morbidity in the pro.,;nce of Iloilo in 2009were Upper Respiratory Tract Infection, injuries, pneumonia andhypertension which infected 38,527; 9,394; 8,255, and 5,251persons, respecti-ely. Occurrence of URn and hypertension werehigher in women than in men.
Other diseases that largely contributed to the high morbidity ofthe proloince included un, infuenza, bronchitis, and PTB whichaffected 3,827; 3,175; 2,867; and 1,715 persons. Women weremore likely susceptible to un, influenza and bronchitis, than men.
5-9
HEALTIi, NU1RITlON AND VITAL STAllSllCS
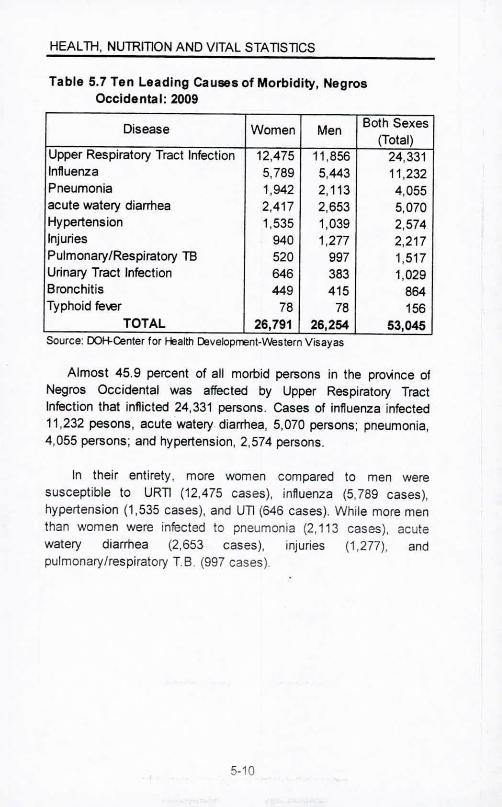
Table 5.7 Ten Leading Causes of Morbidity, NegrosOccidental: 2009
Disease Women Men Both Sexes(Total)
Upper Respiratory Tract Infection 12,475 11,856 24,331Influenza 5,789 5,443 11,232Pneumonia 1,942 2,113 4,055acute watery diarrhea 2,417 2,653 5,070Hypertension 1,535 1,039 2,574Injuries 940 1,277 2,217Pulmonary/Respiratory TB 520 997 1,517Urinary Tract Infection 646 383 1,029Bronchitis 449 415 864Typhoid fe",r 78 78 156
TOTAL 26,791 26,254 53,045Source: D:JH..Center for Health D3veloprrent-western Visayas
Almost 45.9 percent of all morbid persons in the pro\1nce ofNegros Occidental was affected by Upper Respiratory TractInfection that inflicted 24,331 persons. Cases of influenza infected11,232 pesons, acute watery diarrhea, 5,070 persons; pneumonia,4,055 persons; and hypertension, 2,574 persons.
In their entirety, more women compared to men weresusceptible to URll (12,475 cases), influenza (5,789 cases),hypertension (1,535 cases), and UTI (646 cases). While more menthan women were infected to pneumonia (2,113 cases), acutewatery diarrhea (2,653 cases), injuries (1,277), andpulmonary/respiratory T.B. (997 cases).
5-10

HEAL"TH. NUTRmON AND VITAL STA llSTICS
Table 5.8 Projected Values of Life Expectency at Birth:2000-2005 to 2015-2020
VearPhilippines Region VI
Women Men Women Men
2000.2005 72.33 . 67.08 72.56 66.55
2005-2010 73.83 68.58 73.76 68.05
2010-2015 75.03 69.78 74.96 69.25
2015-2020 76.03 70.98 76.16 70.45
Source: Technical Advisory Group and NationalStatistics Office Popu/a!oo A-ojections lk1~
For the years 2000 10 2020, women in Western Visayaswill conlinued to outli\6 men by 6 years. A woman is projected10 li\6 for an a\6rage of 73 years and slowly increases by oneyear from 2000 until it reaches to 76 years in 2020.
Projected life expectancy of men is lower than of women asthey are expecled to live for an average of 67 years andincreases by one year unlil it reaches to 70 years in 2020,
5-11
HEAL ll-l, NUTRITION AND VITAL STA nsncs
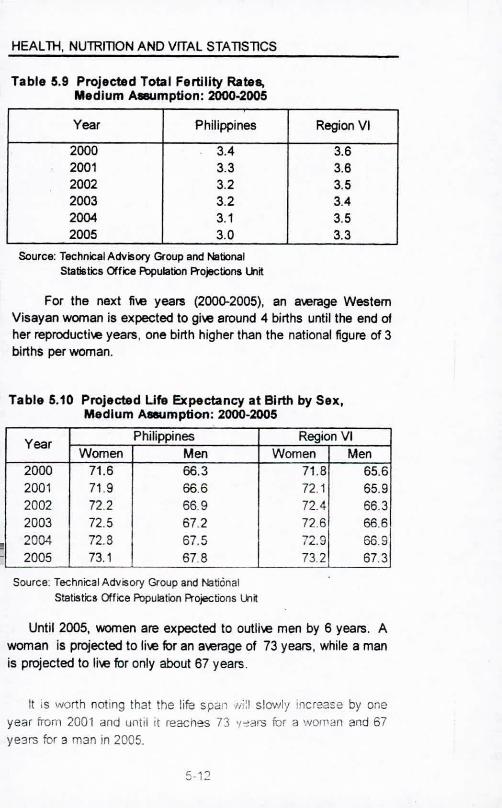
Table 5.9 Projected Total Fertility Rates,Medium ~mption: 2000.2005
Year Philippines Region VI
2000 3.4 3.62001 3.3 3.62002 3.2 3.52003 3.2 3.42004 3.1 3.52005 3.0 3.3
Source: Technical Advisory Group and NationalStatistics Office Population Projections lil.
For the next file years (2000-2005), an awrage WesternVisayan woman is expected to giw around 4 births until the end 01her reproductiw years. one birth higher than the national figure of 3births per woman.
Table 5.10 Projected Life Expectancy at Birth by Sex,Medium A8lIUmption: 2000-2005
YearPhilippines Region VI
Women Men Women Men2000 71.6 66.3 71.8 65.62001 71.9 66.6 72.1 65.92002 72.2 66.9 72.4 66.32003 72.5 67.2 72.6 66.6
: 2004 72.8 67.5 72.9 66.9- 2005 73.1 67.8 73.2 67.3
Source: Technical Advisory Group and f'.,IationalStatistic. Office Population Projections lil.
Until 2005, women are expected to oulliw men by 6 years. Awoman is projected to liw for an awrage of 73 years. while a manis projected to liw for only about 67 years.
It is worth noting that the life span wi:1slowly increase by oneyear from 2001 and until it reaches 73 "",al'3 for a woman and 67ye3f'S for 3 man in 2005.
5.12

HEALTH, NUTRITIONAND VITAL STAnsncs
Table 5,11 Number of Disabled Persons by Sexand Type of Disability: 2000
Type of Disability Women MenBoth Sexes(Total)
Low Vision 16,568 12,025 28,593Partial Blindness 4,124 3,898 8,022Mentally retarded 3,353 3,475 6,828Quadriplegic 2,527 3,182 5,709Total Deafness 2,602 2,705 5,307Others 15,523 17,818 33,341Total 44,697 43,103 87,800Source: 2000 census of Population and !-lousing, NSO
As of the last population count in 2000 a total of 87,800persons of the region's population was enumerated to ha\e someform of disability. Most of them were women {50.9%} and 49.1percent were men.
In their entirety, low \1sion (28,593 cases) largely contributedto the high count of persons with disability in the region, most ofwhom were women (16,568 cases), Other leading disabilitiesincluded mental retardation (6,828 cases), partial blindness (8,022cases), quadriplegic (5,709 cases) and total deafness {5,307cases}. Other cases of disability were recorded to ha\e the totalof 33,341 persons where most of them were men, 53.4 percent.
5.13

HEALTH. NUTRITION AND VITAL STATlSTlCS
Table 5.12 Number of Infant Deaths by Sex andby City/Province: 2009
Infant DeathsCity/Proloince
Women Men Both Sexes(Total)
Western Visayas 625 817 1442Aklan 48 62 110Antique 62 72 134Bacolod City 76 87 1638ago City 11 22 33Cadiz City 2 3 5Capiz 33 34 67Escalante City 8 17 25Guimaras 5 9 14Himamaylan City 10 8 18Iloilo 125 175 300Iloilo City 125 171 296Kabankalan City 4 12 16La Carlota City 1 4 5Negros Occidental 53 66 119Passi City 8 12 20Roxas City 21 31 52Sagay City 3 6 9San Carlos City 15 7 22Silay City 5 8 13Sipalay City 3 7 10Talisay City 4 1 5Victorias City 3 3 6
Source: Department of Health- FHSIS 2009
There were more infant deaths among men, which is eloidentalmost in all cities and proloinces.
Infant moratality, in Iloilo City posted highest among the regionwith an awrage of 2.5 percent from both sexes.
The cities of Cadiz, La Carlota and Talisay were obserwd tohaw the least number of infant deaths.
5-14

HEALTH, NlJTRlTIONAND VITAL STAllSllCS
Table 5.13 Number of Perinatal Deaths and Deaths Among ChildrenUnder 5 Years Old by City/Province: 2009
Perinatal DeathsDeaths Among Children
City/Pro\ince< 5 Years Old
Both BothWomen Men
SexesWomel Men
SexesWeatern Vlsayas 251 382 633 929 1178 2107Aklan 9 18 27 69 93 162Antique 13 17 30 85 103 188Bacolod City 60 88 146 125 142 267Bago City 3 12 15 21 30 51cadiz City a a a 6 10 16Capiz a 3 3 54 60 114Escalante City a 2 2 10 20 30Guimaras 1 2 3 9 15 24Himamaylan City a a a 16 13 29Iloilo 26 47 73 174 212 388Iloilo City 78 104 182 168 224 392, Kabankalan City 3 1 4 17 22 39La Cartota City a 6 .' 8 1 10 11Negros Occidental 22 31 53 77 104 181Passi City 3 5 8 9 15 24Roxas City 10 19 29 32 52 54Sagay City 2 5 7 10 10 20San Cartos City 10 9 19 16 12 28Silay City 3 4 7 9 11 20Sipalny City 7 4 11 6 10 16Talisay City a 1 1 7 2 9Victorias City 1 6 7 8 8 16
Source: Departmlnt of Heakh- FHSIS 2009
Deaths among children under 5 years old were highest in men.They comprised 55.9%
Among cities. Iloilo City had the biggest number of perinatal deathsand deaths among cnildren as?d 5 and below ac~cuntins br 28.8%and 18.6%, respccti'/y
5-15

HEALTH, NUTRITION AND VITAL STATISnCS
Table 5.14 Number of Government Medical Practitioners by CitylProvince and by Sex: 2009
City/Pro\ince Doctors Dentists Nurses Midwi""sWome MenWomen MenWomer Men Women Men
Western Vlsayas 143 91 89 33 365 32 1750 3Aklan 9 11 13 5 24 3 129 0Antique 12 6 1 0 27 2 178 08acolod City 14 5 3 3 . 26 1 28 08ago City 3 5 2 0 17 1 44 0Cadiz City 8 2 1 2 9 1 29 0Capiz 13 4 7 5 22 1 152 0Escalante City 2 2 2 0 7 0 24 0Guimaras 4 2 4 1 5 0 61 0Himamaylan City 1 1 0 1 5 1 21 0Iloilo 32 18 22 4 64 3 405 1110110City 12 5 10 1 37 4 43 0Kabankalan City 2 1 1 1 5 2 46 0La Carlota City 1 2 1 1 3 1 23 0Negros Occidental 11 11 11 2 50 4 356 0Passi City 4 1 0 1 7 3 33 0Roxas City 8 t 4 2 14 0 22 0Sagay City 0 3 3 0 10 0 43 1San Carlos City 1 2 1 1 4 1 30 0Silay City 2 1 0 2 7 1 11 1Sipalay City 0 4 1 0 7 0 31 0Tallsay City 4 2 1 1 8 2 22 0Victorias City 0 2 1 0 7 1 19 0
Source: DepartnentofHeallh- FHSIS 2009
In 2009, there were 2,558 go""mment medical practitioners inWestem Visayas. Sixty nine percent or 1,753 were midwi""s, 15.5percent or 397 were nurses, 11.2 percent or 286 were doctors and4.8 percent or 122 were dentists.
Of the total medical practitioners, 91.8 percent or 2,347 werewomen and only 6.2 percent or 159 were men. Women dominatedmen in all groups of practitioners.
Interestingly, of the 1,753 midwi""s, only three were men foundin Iloilo, Sagay City and Silay City.
5-16

Women&MenIN WESTERN VISA YAS
VIOLENCE AGAINSTWOMEN

VIOLENCE AGAINST WOMEN
Domestic lAolence has become a widespread social problem inPhilippine society. It is also a fact of life in Westem Visayas.Domestic lAolence takes many forms and women tend to bewin arable to be IActims because In many societies, they areexpected to be subserlAent or subordinate to men.
Govemment, to Improve reporting of crlmes, rapes, Incidence 01battered women end batterers, and slmller cases, has anchoredseveral measures. Interventions such as Installation of Women'sDesks, conduct of reproductive health scMlcacy, health end genderprograms In\OllAng LGUs, NGAs end the private sector, and otherrelated concerns ere some attempts Implemented to address theproblam of women. Insplte of these, more ere yet to be done br thewomen's betterment end dignity. The following are some prlorltyIssues end concems:
o Increase In known casas of lAolence: rape, Incest, batterlng,sexual harassment, and pomography;
o Increase In known cases of prostitution and sex trafllcklng;
o Inadequacy of lews (especially on rape) to protect women;
o problems in law enforcement and prosecution;
o Inadequacy of support services lor women IActimslsurlA\Ors oflAolence.
A major development has been the passage of RA 7877 or theAntl.Sexual Harassment Law that crlmlnalizes sexual harassmentin the workplace and educationellnstitutions.
6-1

There have also been more concrete responses to the problemof liolence against ""men, such as the estaliishment of more""men's crisis support centers, sewral of these being local GO-NGO netwa1< initiati\eS. Comnunity-based support Dr v.umenSUN\oo; of Violence Against Vl.bmen 0JA\IIIJ have been stated andthere Is goWng recDglition of the need for leninist counseling tohelp the women.
A presidential cirectiw dated Ma'ch 8, 1993 mandated thesetting up of poIicev.omen's desks In priority areas, and theconduc1 of training tOWll'd a mae gender-senslti\e response by lawenbrcers or cases of liolence ag!llnst ""men.
A sigllficanl gain at the InlemlltionallM v-.esthe a1irmation 01women's rights as human rights at the World Conference on t-klmanRights in 1991 (Vienna). The conference also called for theelimination of gender-based volence and all brms of sexualhamsment and exploitation.
The Philippines, a siglatory to the Convention on the Eliminationof P-JIForms of Oscrimlnation Ag!llnst women (CEDA\IIIJ. has beenrepresented in the CEDAW Committee for three terms.
6-2

VIOLENCE AGAINST WOMEN
LIST OF TABLES AND FIGURES
Table Page
6.1
6.26.3
Figure6.1
6.2
Top Ten Cases of Violence Against Women,Region VI: 2009 & 2010Reported Rape Cases by Prolince: 2005.2009Distribution of Cases of Violence Against WomenCommitted by Influence of SubstanceAbuse: 2001 & 2002
Distribution of Cases of Violence AgainstWomen by Prolince: 2010Distribution ofWeepons/Meens Used by thePerpetrators in Violence Against Women: 2002
6-3
6-46.5
6.7
6'<;
6.8

VIOLENCE AGAINST WOMEN
Table 6.1 Top Ten Cases of Violence Against Women,Region VI: 2009 & 2010
Classification of Offenses Number %2009 2010 2009 2010
RA9262 (violence against women & children 1,462 2,616 66.6 72.1Physical injuries 350 380 15.9 10.5Acts of Lasci"ousness 77 155 3.5 4.3Threat 75 131 3,4 3.6Rape 78 104 3.6 2.9Unjust vexation 40 69 1.8 1.9Oral Defamation 65 68 3.0 1.9Maltreatment 9 49 0.4 1.4Attempted Rape 29 31 1.3 0.9Alarm and Scandal 11 26 0.5 0.7
2.196 3,629Source: Alilippine National Police
Cases of "olence against women in Western Visayas in 2010increased by 78.9 percent from 2,196 recorded cases in 2009 to 3,629cases. Among the top most abuse cases committed against women,RA92621,,0Ience against women & children recorded the highestcases comprising 72.1 percent of the region total. Physical injuriesfollowed next consisting of 10.5 percent; acts of lasci"ousness. 4.3percen; and Threat. 3.6 percent.
Other common cases of "olence against women in WesternVisayas included rape, unjust vexation, oral defamation, maltreatment,attempted rape, and alarm & scandal.
Republic Acf No. 9262 of 2004 or fhe Anti-Violence Against Womenand their Children provides protection for abused \\Omen and theirchildren against their partners or former'male partners or those \\ithv.hom they had or an! having a dating relationship.
6-4

VIOLENCE AGAINST WOMEN
Table 6,2 Reported Rape Casea by Province: 2005-2009
RegionlPro'o1nce 2005 2006 2007 2008 2009Raglon VI 315 293 259 251 405Aklan 13 21 23 29 54Antique 23 32 24 22 29Capiz 23 31 16 16 30Gulmares 17 21 6 13 22110110 97 80 81 66 127Nacros Occidental 142 108 109 85 143
f\«)te; • rT'6ans nil or zeroSource: Phil~plne National Police
Rape cases in Westem Visayas conitued to decline for thepastthnee years (2006-2008). From the recorded cases of 315in 2005, it dropped by 20.3 percent in 2008. But a remar1<ableincrease of 61.4 percent was recorded in 2009.
Among the pro'o1nces, Negros Occidental posted thehighest number of rape cases, the highest eloerwas in 2009with 143 cases and in 2005 with 142 cases comprising 35.3and 45.1 percent, respectiwly, of the regional total cases.Following Negros Occidental is Iloilo pro'o1nce which alsorecorded higher rape cases of 127 in 2009 & 97 cases in2005. On the other hand, Guimaras consistently managed tohaw the least number of reported repe cases for the past fouryears.
In 2009, all pro'o1ncesposted an increase in the recordedrape cases. Guimaras and Negros Occidental had the notableincrease of 69.2 percent & 68.2 percent, respectiwly.
6-5

VIOLENCE AGAINST WOMEN
Fig 6.1 DIstribution of Cases of VlolenceAgalnstWomen by Province: 2010
ca~' .Ulmaras1.7 0 2.9%
In 2010, reported cases of ~oIence against women in theregion reached 3,709. Among the pro~nces, NegrosOccidental posted the highest recorded cases of ~olenceagainst women comprising 46.6 percent of the regional total.Pro~nces of Iloilo followed with 1,408 cases (38.0%). Capiz,recorded the least cases of ~olence against women with 64cases or 1.7 percent of the regional total.
6-6

VIOLENCE AGAINST WOMEN
Table 6.3 Cases of Violence Against Women Committed byPerpetrators With/Under or Without the Innuence ofDrugs/Alcohol: 2001 & 2002
Category2001 2002
Number % Number %Under the influence ot.Alcohol 102 23.6 153 42.7Rugby 68 15.7 0 0.0Drugs 8 1.9 9 2.5Both Alcohol & Drugs . - 1 0.3
None 254 58.8 195 54.5Note: - rTeans n~or zeroSource: A1R~pine National PoHce
Reported violence against women committed by perpetratornunder the influence of drugs/alcohol declined by 17.1 percent in2002 over the 2001 recorded commissions or 432 casas in 2001to 358 in 2002.
Of the total 358 casas. 54.5 percent of the cases werecommitted without the irtluence of any alcohol/drugs, whilealmost 43.0 percent of the crimes were committed under theinfluence of alcohol/drugs.
No reported case of violence against women was committedunder the influence of rugby in the year 2002 as compared to2001 which recorded 68 cases.
6.7

VIOLENCE AGAINST WOMEN
Bladednstrurrent17.7%
Figure 6.2 Dlstributlon ofWeaponsiMeans Used bythe Perpetrators In Violence Aga Ins!Women: 2002
Blunt RrearlTEi"strurrent
4.6%5.6%
Source: PhHippineNallonal f'llilce
Perpetrators mainly used hands/feeUfist (60.8%) to inflictpain to the ,,;ctims of ,,;olence. About 18.0 percent used bladedinstruments, 5.6 percent used blunt instruments, and 4.6percent used firearms. Some 11.3 percent used otherweapons/means such as chairs, kitchen wares etc. to inflictpain to ,,;ctims of ,,;olence.
6-8

Women&MenIN WESTERN VISA YAS
ECONOMICPARTICIPATION

ECONOMIC PARTICIPATION
A woman's reproductive beha,;or and her employmentstatus are closely related. In many societies, women'semployment has become more of a necessity rather thanchoice. Their mothering, household and child careresponsibilities, howe;er, hinder their desire for employmentoutside and far from their homes. Thus, mother women usuallyengage in seasonal or part-time and senice-related jobsbetween pregnancies that allow them to work near their homes.On the overall, their work being seasonal are not valuated orcounted as input to national or regionel gross production.
The non.valuation of women's work both in the productionand reproduction spheres is one significant issue that needs tobe addressed by the go;emment. If women's labor andreproduction are quantified and valuated, this would prove thatthey could equal to or even surpass men In terms of economicproduction, Below are some issues that need to be addressed:
o Lack of "slbillty and non-quantification of women'scontribution in the economy;
o Women's participation in making economic decisions;
o Limited access of women to credit; and
o impact of economic policies on women.
To lift some barriers to women's acti,;ly, Republic Act7192 was enacted. Under Section 5 of this law, women 01legal age, regardless of ci,;1 status, shall have the capacily toenter into contracts which shall in every respect be equal tothat of men under similar circumstances,
7-1

In all contractual situations where married men have the capacityto act, married women shall have equal rights. To this end:
o Women shall have the capacity to borrow and obtain loansand execute security and credit arrangements under the sameconditions as men;
o Women shall ha,", equal access to all go,",rnment and privatesector programs granting agricultural credit, loans and non-material resources and shall enjoy equal treatment in agrarianreform and land resettlement programs;
o Women shall have equal rights to act as incorporators andenter into insurance contracts; and
o Women shall have rights equal to those of married men inapplying for passports, and securing -.;sas and other traveldocuments, without need to secure the consent of theirspouses.
7-2

ECONOMIC PARTICIPATION
LIST OF TABLES
Table Page
7.1 Women and Men Issued New and RenewedDriwr's Licenses/Permits: 2010 74
7.2 Women and Men Elected Governors andVice Governors by Pro\1nce: 2010 7-5
7.3 Women and Men Elected Mayors andVice Mayors by Pro\1nce: 2010 Hj
7.4 Number of Women and Men in the LGUsby Lewl of Position: 2004 7-7
7.5 Filled and Unfilled Plantilla Positions in theLocal Gowmment Units, by Pro,,;nce: 2002 7-8
7.6 Number of Career and Non-Career Womenand Men Professionals in the LGUs:2004 7-9
7.7 Women and Men In the LGUs by Levelof Positions, by Pro\1nce: 2004 7-10
7.8 Women and Men In the LGUs, Non-Career/Non-Plantilla Positions: 2004 7-11
7-3

ECONOMIC PARTICIPATION
Table 7.1 Women and Men Issued New and RenewedDriver LicensesiPennits: 2010
Classification of Women MenUcenseslPermits Number % Number %
New 17,870 100.0 100.364 100.0Professional 974 5.5 21,838 21.8Non-Professional 4,229 23.7 10,479 10.4Sludent Permit 12,661 70.9 67,721 67.5Conducto(s Permit 6 0.Q3 326 0.3
Renewal 9,572 100.0 98,227 100.0Professional 1,940 20.3 86,630 88.2Non-Professional 7,629 79.7 11,319 11.5Student Permit - - . -Conduclo(s Permit 3 0.Q3 278 0.3
Note: • meant nil or zeroSource: Land Transportation Office
In 2010, the Land Transportallon Ofllce Issued 226,033licenses. Out of the total issuance, 118,234 or 52.3 percentwere new and 107,799 or 47.7 percent were renewedlicenses/permits.
Expectedly, a number of both new and renewedlicenses/permits were issued to men In all classifications. Newprofessional licenses issued 10 men reached 21,838 or 21.8percent of the total new issuances. Student permitslilcensescomprised the bulk of these new permltsllicenses (67.5%).
On lhe olher hand, more renewed licenses were issued tomen re'lching 98,227. On the overall, 88.2 percenl of lhe tolalrenewed licenses were professionals and 11.5 percent were nonprofessionals. No student permit were renewed as studentoermitees have aoolied for new non-oro!essionallicenses.
7-4

ECONOMIC PARTICIPATION
Table 7.2 Wornen and Men Elected Governors andVice Governors by Province: 2010
Pra,,;nce Governor Vice GovernorWomen Men Women Men
Aklan 1 1Antique 1 1Capiz 1 1Guimaras 1 1110110 1 1Negros Occ 1 1TOTAL 0 6 2 4Source: Department of the hterior and Local Government
In the 2010 elections, all elected governors were men.Only two pro,,;nces have elected women ,,;ce governor. Theseare the pralinces of Aklan and Antique.
7.5
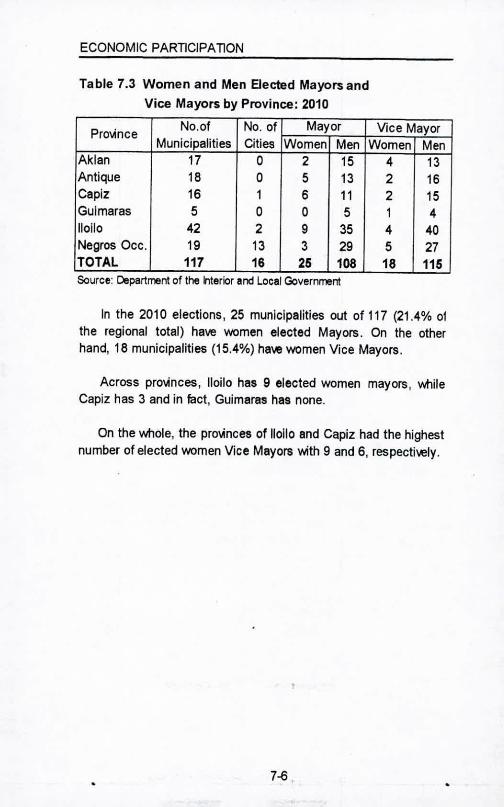
ECONOMIC PARTICIPATION
Table 7.3 Women and Men Bected Mayors andVice Mayors by Province: 2010
Pro\ince NO.of No. of Mayor Vice MayorMunicipalities Cities Women Men Women Men
Aklan 17 0 2 15 4 13Antique 18 0 5 13 2 16Capiz 16 1 6 11 2 15Guimaras 5 0 0 5 1 4Iloilo 42 2 9 35 4 40Negros Occ. 19 13 3 29 5 27TOTAL 117 16 25 108 18 115Source: Department of the nterio, and Local Government
In the 2010 elections, 25 municipalities out of 117 (21.4% ofthe regional total) have women elected Mayors. On the otherhand, 18 municipalities (15.4%) havewomen Vice Mayors.
Across pro\inces, Iloilo has 9 elected women mayors, whileCapiz has 3 and in fact, Guimaras has none.
On the whole, the pro\inces of 110110and Capiz had the highestnumber of elected women Vice Mayors with 9 and 6, respectively.
7-<3,

ECONOMIC PARTICIPATION
Table 7.4 Number of Women and Men in the LGUsby Level of Position: 2004
Category Women MenFirst level 6,659 5,629Second level 4,083 2,461Third Level (Career Executive) 20 19Non-executive career 1 .Total 10,763 8,109
Note:. means nil or zeroSource: CivK Service CorTflission
Women dominated men in all level of positions In thelocal government units In 2004. There were more women(6,659) or 35.3 percent than men (5,629) or 29.8 percentoccupying the Irst level position with a gender gap of 5.5percentage points. Consequently, the best gender gap 01less than one percent falls in the Career Executive and non-Executive Career.
The first level includes clericel, trades, crafts, andcustodial service positions, ..nich involve non-professional orsub-professionaloorl< in a non-suparvisory capacity requiringless than four years of collegiate studies.
The second level includes professional, technical andscientific positions, ..nich involve professional, technical orscientific oorl< in a non-supervisory or supervisory capacityrequiring at least four years of collegiate up to Division Chieflevel.
7-7

ECONOMIC PARTICIPATION
Table 7.5 Filled and Unfilled Plantilla Positions in theLocal Government Units by Province: 2002
Region/ProvincePlantilla Positions
Filled Unfilled TotalWestern Visayas 28,561 5,514 34,075
Aklan 2.160 211 2,371Antique 2,884 564 3,448Capiz 3,443 1,012 4,455Guimaras 878 182 1,060Iloilo 8,152 1,146 9,298Negros Occidental 11,044 2,399 13,443
Source: Civ~ Service Col'lYl'llsslon
Of the 34,075 plantilla positions in the LGUs, 16.2 percentwere still unfilled in 2002.
Among the provinces, Negros Occidental and Iloilorecorded the highest unfilled positions comprising 43.5 percentand 20.8 percent of the total regional unfilled positions in 2002.Guimaras, on the other hand, posted the least number 01unfilled positions of 182 for the year.
7-8

ECONOMIC PARTICIPATION
Table 7.6 Number of Career and Non-Career Women and MenProfessionals in the LGUs: 2004
Region/ProvinceCareer Non-Career
Women Men Women MenWestem Visayas 13,128 10,812 2,481 3,773
Aklan 1,688 967 331 393Antique 1,424 1,041 371 440Capiz ... ... ' ... ...Guimaras 511 303 42 77Iloilo 4,377 3,206 398 768Negros Occidental 5,128 5,295 1,339 2,095
Note: ... no dataSource: Civil Service Corrrrission
More women (13,128) than men (10,812) were occupyingthe career level of positions in 2004. This Is true to all theprovinces of Western Visayas, except for Negros Occidental.with a minimal gender gap of 1.0 percent.
Non-eareer level positions, on the other hend, were mostlyoccupied by men, 3,773 over women numbering 2,481.
Career level includes the first and second level bothpennanent and contractual positions. Non-eareer on the otherhand includes elective and co-ienninous positions.
7-9

ECONOMIC PARTICIPATION
Table 7.7 Women and Men in the LGUs by Levelof Positions by Province: 2004
CareerProlAnce First Level Second Level Third Level
Women Men Women Men Women MenWestern Vlsayss 9,032 a,6e7 5,727 3,335 20 20Aklsn 1,026 671 662 296 ... ...Antique 911 '767 563 274 '" ...Csplz 963 701 596 520 16 19Gulmeres 316 213 195 89 1 ...110110 2,520 2,205 1,857 1,004 '" 1Neoroe Occ. 3,276 4,140 1,852 1,152 3 ...
Note: ... no detsSource: CIvil Se~ce Commission
In 2004, more women then men occupied the fll'lt endsscond level csreer positions In the Loosl Gowmment Unitscomprising 50.9 percent end 63.2 percent, respscti\olely.
Across prolAnces, except for Negro. Occldentsl v.11ersmendominated women In the first le\olelcareer positions yielding sgender gap of 4.9 percentsge points,' all prcMnces weredominated by women. In contrast, in the second level careerpositions, women dominated men In sll the pralinces.
For third leYeI career positions, the prolince of Capizrecorded the highest number of women (16) and men (19)occupying third leYeI positions. Guimaras had one woman andIloilo had one man In the third level Career positions.
7-10

ECONOMIC PARTICIPATION
Tabl" 7.8 Women and Men in the LGU", rlon-Ca •.••erlPlantilia Positions: 20().4
Non-Careel1Plantilia PositionsPrcl\Ance Electhle Co-Termlnous Total
Women Men Women Men Women MenAldan J.4 182 9 29 43 211Antique 47 180 19 41 66 221Caplz 37 173 10 28 47 201Gulmeras 19 &4 13 9 32 63110110 120 405 74 143 194 &48Nearae Occidental 75 339 42 81 117 420
Pro'olnce ContT1lctual Caaual TotllWoman Men Woman Man Woman Man
Aklln 131 48 157 134 288 182Antlqua ... ... 30& 219 305 219Clplz 30 9 42 45 72 54Gulmaral 10 13 ... 1 10 14lIollo 11 12 In 195 188 207NaarOi Oocldentll 287 389 1288 955 1,553 1,344Nota: ... no dl!ll
. _nlIctzeroSource: eM Service eo"."...1on
On tha .,.,;,ol., non-eareer/pllntllla positions in Western Visayaswara dominated by men in 2004.Thia Is true to all of the sixpro\4ncea of the region. The elllOtl••••and co-terminous positionswera also dominated by men comprising 80.1 and 66.5 percent,respecti...,ly.
More ""'men howe""r. occupied the casual posItions than meniccounting 57.4 percent of the total casual staff occupying the .position in the region.
7-11

Women&MenIN WESTERN VISAYAS
GIRLS AND BOYS

GIRLS AND BOYS
A profile of the Girls and Boys population - portion of thepopulation aging 5-17 years old- is very important in identifyingareas for growth and development. Information on theirdemographics and socio-economic characteristics, as well asthe households where they belong is important in understandingthe factors affecting their development and well-being.
Local govemment units, public authorities and concernedagencies in developing effective policies and strategies to helpthe Filipino child live a healthy, active and rewarding life he/shedeserves, v.ill be benefited rrom the pro.,;ded information.
Policies and strategies should necessarily consider thefollov.ing rights ofthe child.
Every child has the right to:
1. be bom well;2. a wholesome family life that v.ill pro.,;de him/her v.ith love, careand understanding, guidance and counseling, and moral andmaterial security;
3. a well-rounded development of his personality;4. a well-balanced diet, adequate clothing, sufficient shelter,proper medical attention, and all the basic physicalrequirements of a healthy and .,;gorous life;
5. be brought up in an atmosphere of morality and rectitude;6. an education commensurate v.ith his abilities;7. full opportunities for safe and wholesome recreation andactll,ties;
~-1

8. protection against exploitation, improper inftuences,hazards and other conditions and circumstancesprejudicial to his physical, mental, emotional, social andmoral development;
9. Ii"" in a community and a society that can 01ler him anenvironment free from pernicious influences andconduci"" to promotion of his health and the cultivation ofhis desirable traits and attributes;
1O. the care, assistance, and protection of the State,particularly when the parents or guardians fail or unableto provide him with his fundamental needs for growth,development and improvement;
11. an efficient and honest go""rnment; and12. grow up as a free individual, In an atmosphere of peace,
understanding, tolerance, and universal brotherhood, andwith the determination to contribute his share in thebuilding of a better world.
8-2

LIST OF TABLES
T~ble p&gP.
e.l Number of Registered Livebinhs by Pro;;nce: 2009 R~8.2 Number of Registered Livebirths by City: 2009 8-58.3 Projected Population of Children Aged 0-14
by Age Group: 2015 & 2020 ~8.4 Number of Children with hsrelip/clstl pslste by
PrO'Ance:2007 8-78.5 Vlcllms of Child Abuse Served by DSWD:
2005-2006 8-88.8 Children 5-17 Yesr Old Who Worked During the Past
12 Months by Sex: September 2000 to October 2001 8.98,7 Age Group, Location of Residence snd Highsst
Grede Completed of Working Children Aged 5-17Who Worked Durtng the Past 12 Month. by Sex:Septsmber 2000 to October 2001 8-10
8,8 Working Children S-17 Yesra Old L1'04ngAWflYFromHome by Locellon, Age Group, snd Actl',jty by Sex:Ssptember 2000 to October 2001 8-11
8.9 Enrolmsnt In Public Elementsry School., All Agesby D1l1alon:SY 2009-2010 8-12
8,10 Enrolment In Public Secondary School. by D1',jalon:SY 2009-2010 8-13
8,11 Number of Girt. and Boya Promoted In PublicElementary School.: SY 2009-2010 8-14
8.12 Number of Repeetere In public Elemen1sry School.by 0I11810n:SY 2009-2010 8-15
8.13 Number of Drop-outs In Public Elementary Schoolaby DIlialon: SY 2009-2010 8-16
8.14 Number of Students Promoted In Public SecondarySchools by DI',jslon: SY 2009-2010- 8-17
8,15 Number of Repeateffi in Public SecondarySchools by Dilision: SY 2009-2010 8-18
8,16 Number of Drop-outs in Public Secondary Schoolby OIlision: SY2009.2010 8-19
8,17 Number of Failures in Public Secondary Schoolby Dilision: SY2004-2005 8-20
8.18 Working Children by Age Group & Sex: 2007.2009 8-21
3.3

GIRLS ANI) BOYS
Table 8.1 Number of Registered Li,-cbirths by Province: 2009
Province Girls Boys Both Sexes(Total)
Aklan 5,611 6,093 11,704Anti~e 4,921 4,561 9,482Caplz 3,688 4,060 7,748Gulmaras 1,362 1,311 2,673110110 14,888 15,671 30,559Negros Occidenlal 9,046 9,658 18,704Total 39,518 41,364 80,870Source: OOH-c:ern..,fo, Heo~h Dovelopmont.we.tom Visoyo.
In 2009, registered lI~blrths In Western Vlsayas reached80,870. This translates to 9 bablas born e~ry hour in the region.FI~ out of 9 babies born were boys.
Across pro\inces, Iloilo rag/.tarad the highest number ofllveblrths (30,559) accounting lor 37.8 percent of the totalli\ll!birthsIn the region. Negros Occldenlal and AkJan followed next with18,704 and 11,704 Ii~births, ra.pectl~ly _ Guimaras registeredthe least Ii\ll!births with only 2,873. Boys outnumbered girls inalmost all of the provinces, sxcept for Antique.
!l-4

GIRLS AND BOYS
Table 8.2 Number of Registered Live births by City: 2009
City Girls Boys Both Sexes(Total)
Bacolod City 4,697 5,214 9,911Bago CIty 1,357 1,408 2,765Cadiz CIty 1,154 1,256 2,410Escalante City 834 884 1,718Hlmamaylan City 1,105 1,191 2,296110110City 5,646 6,071 11,717Kabankalan City 1,595 1,688 3,283La Cenota City 836 854 1,690Paul City 698 754 1,452ROX8S City 2,059 2,398 4,457Sagay City 1,143 1,215 2,358San Canos City 1,173 1,315 2,488SUay City 1,295 1,337 2,632Sipalay City 470 485 955Talluy City 207 196 403Vlctorlas City 700 796 1,496
Total 24.868 27,062 62,031Sourco: OOK-center for Health Developmtn. 'Ntatarn Visay ••
Among the 16 cities of West em Visayas, Iloilo & Bacolod Cityposted the highest llvebirths In 2008 WIth 11,717 and 9,911 warmbodies. This translates to an averege of 32 babies born every day in110110City and 27 in Bacolod City, Sipalay City and Talisay City hadthe least number of Iiveblrths ~th 955 and 403 babies.
15 out of 16 cities in the region, recorded more boy babies bornIn 2009. A very minimal gender gap of 0.2 percent was noted in thecity of La Canota..
8-5

GIRLS AND BOYS
Table 8.3 Projected Population of Children Aged 0-14by Age Group: 2015 & 2020
Age Group Girls Boys2015 2020 2015 2020
Q-4 473,800 478,900 496,200 501,800
5-9 449,900 471,800 468,600 492,800
la.14 419,700 449:400 434,300 467,300Source: 1995 Census.Based t-iltionolend Regional Fbpulation A'ojections
Population of children eged 0.14 in Western Visayas isproJecled 10 reach 2,742,500 In the year 2015. Based from thislotel, it is projecled 10 increase to 2,862,000 by the year 2020.Boys is projected to still continue to outnumber Ihe girls as Iheycomprised more than half (51.1 '/oj of the population.
The proportion of 96 girls lor eYery 100 boys in the year 2015is projected to remain unlil the year 2020.
8~

GIRLS AND BOYS
Table 8.4 Number of Children with Harelip/Cleft Palaleby Province: 2007
Pro"nceActual PS Wilh Harelip/Cleft Palate
TolalWeiohled Girls Boys
Aklan 72,880 1 4 5Antique 77,041 8 15 23Capiz 103,292 3 5 8Guimaras 21,156 10 15 25Iloilo 297,578 54 90 144Negros Occide 403,362 114 186 300Total 975,309 190 315 505t-bte: ... no dataSource: National f\Utrition Counc~
Out of 975,309 pre-schoolers weighted in 2007, 505 childrenwere found to have harelip/cleft palate. This translates to 5 01every 10,000 children suffer ~om harelip/cleft palate in WesternVisayas. More boys (62.4'10) than girls (37.6%) are affected bythe aforementioned handicap.
More than half of the children with harelip/cleft palate werefound in Negros Occidental (59.4%). Iloilo and Guimarlls had28.5 and 5.0 percent recorded cases, respectively, of theharelipped/cleft palated children.
More boys than girls possessed Ihe handicap in allpro"nces of Western Visayas.
8-7

GIRLS AND BOYS
Ta hIe 8.5 Victims of Child A buS<!Served by DSWD,:'OOS& 2006: Type of Abuse Girls Boys Total~
2005 2006 2005 2006 2005 2006•Abandoned 11 25 26 16 37 41INeglected 29 31 29 19 58 50Sex ually Abus ed 57 64 . . 57 64Rape 39 59 . . 39 59Incest 16 18 . . 16 18Acts of Lasciliousness 2 7 . . 2 7
Sexually Exploited - . 1 1 1 1Victims of Pedophilia - . 1 1 1 1
Children in Conftict with the la 3 1 32 36 35 37Physical Abused 9 11 12 5 21 18Victims of Child Labor - 1 - - . 1Source: Departrrentof SoclollNthrl Ind Oovllopmont
Victims of several typel of abu.e seMd by. the Department 01Social Welfare and Dewlopment (DSWD) In the region Increased by10.8 percent in the year 2008 over the pre-Aousyem cales.
The number of sexually abused and abandoned children showeda notable increase of 47.4 and 10.8 percent, respectively. Among-the sexually abused children, aets of IsschAousness Increased by-250.0 percent and rapa 51.3 percent. Incest had a 12.5 percentncrement over the pre-Aousyear'. ceses.
Victims of physical abused end neglected children on the other-land, decreased by 23.8 end 13.8 percent, respectively.
Victims of child labor and sexual ex'ploitat;on posted the lowest_mber of abuse cases among children with only one case each.
8-8

GlkL~ ANU !:JOYS
Table 8.6 Children Aged 5.17 Years Who Worked During thePasl12 Months by Region: September 2000 toOctober 2001 (in thousands)
RegionGirls Boys Both Sexes
Number % Number % Number %
Philippines 1,470 100 2,548 100 4,018 100
NCR 80 5.4 88 3.5 168 4.2CAR 25 1.7 40 1.6 65 1.6Region 1 62 4.2 94 3.7 156 3.9Region 2 61 4.1 141 5.5 202 5Region 3 99 6.7 163 6.4 262 6.5Region 4 143 9.7 318 12.5 461 11.5Region 5 106 7.2 238 9.3 344 8.6Region 6 130 8.8 198 7.8 327 8.1Region 7 161 11 227 8.9 388 9.7Region 8 135 9.2 214 8.4 349 8.7Region 9 50 3.4 116 4.6 166 4.1Region 10 127 8.6 167 6.6 294 7.3Region 11 123 8.4 219 8.6 342 8.5Region 12 93 6.3 140 5.5 232 5.8Caraga 56 3.8 120 4.7 176 4.4ARMM 20 1.4 65 2.5 85 2.1
Source:2001SurveyonChildren,NSO
Of the 4,018 million working children aged 5.17 yearnsurveyed in 2001, 8.1 percent or 327,000 were in WestemVisayas.
All regions have similar trend in terms of proportion 01working children aged 5-17 yearn. In Western Visayas, moreboys aged 5-17 (198,000) than girls (130,000) were in theworking population during the survey period. This means thatfor every five working children aged 5-17 years, three are boys.
8.9

GIRLS AND BOYS
Table 8.7 Age Group, Location 01 Residence and HighestGrade Completed 01Working Children Aged 5-17Who Worked During the Past 12 Months by Sex:Septem ber 2000 to October 2001 (in thousands)
Category Girls Boys Both SexesNo. % No. % No. %
Total Working Children: 129 100 198 100 327 100Western Visayas
Age Group
5 - 9 years 3 23 4 2.0 7 2.110-14years 55 42.6 94 48 149 45615 - 17 years 71 55.0 100 51 171 52.3
ResidenceUrban 40 31.0 52 26 92 28.1Rural 89 69.0 146 74 235 71.9
Highest Grade Completed
No Grade Completed 1 06 3 1.5 4 1.2Elementary Undergraduate 38 29.5 78 39 116 35.5Elementary Graduate 21 16.3 41 21 62 19High School 58 45.0 71 36 129 39.4High School Graduate 10 7.8 5 2.5 15 4.6College Undergraduate 1 1.6 1 0.5 2 0.6
Source: 2001 Survey of Children, NSO
The result of the 2001 Survey of Children conducted by theNational Statistics Office revealed that the total number of workingchildren in Western Visayas aged 5-17 years reached 327,000.
More than half (52.3%)01 the working children were in the agebracket 15-17 years. Working children living in the rural areasaccounted for 69.0 percent boys and 73.7 percent girls.
Majorrty of the working children had entered elementary(35.5%) and high school (39.4%) levels of education. There weremore working boys (20.7%) than girls (16.3%) who graduatedelementary , however, there were more girls (45.0%) than boys(35.9%) who reached high school level
8-10
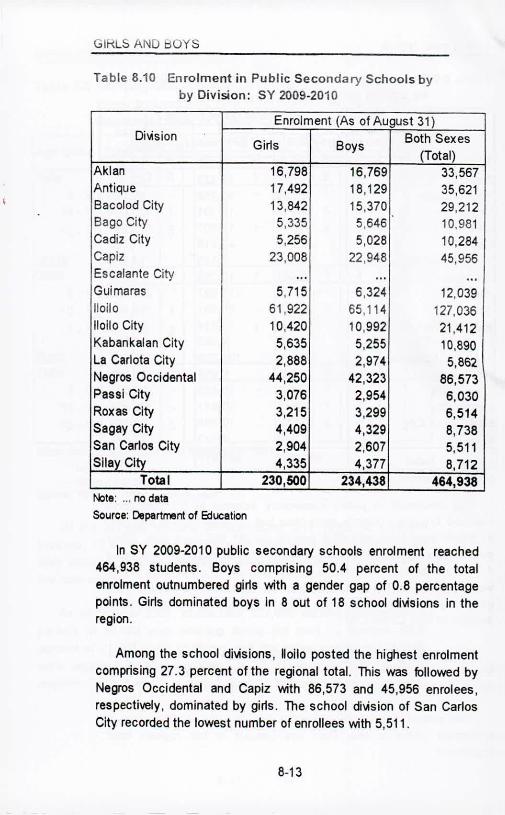
GlkL5 AND BOYS
Table 8.10 Enrolment in Public Secondary Schools byby Division: SY 2009-2010
Enrolment (As of August 31)Dil.ision
Girls Boys Both Sexes(Total)
Aklan 16.798 16.769 33,567Antique 17,492 18,129 35,621Bacolod City 13,842 15,370 29,212Bago City 5,335 5,646 10,981Cadiz City 5,256 5,028 10,284Capiz 23,008 22,948 45,956Escalante City ... ... ...Guimaras 5,715 6,324 12.039Iloilo 61,922 65,114 127,036110110 City 10,420 10,992 21,412Kabankalan City 5,635 5,255 10,890La Carlota City 2,888 2,974 5,862Negros Occidental 44,250 42,323 86,573Passi City 3,075 2,954 6,030Roxas City 3,215 3,299 6,514Segey City 4,409 4,329 8,738Sen Cerlos City 2,904 2,507 5,511Siley City 4,335 4,377 8,712
Total 230,500 234,438 464,938Noto: ... no dol.Soure.: Dopartmont of 8:lucotion
In SY 2009-2010 public secondary schools enrolment reached464,938 students. Boys comprising 50.4 percent of the totalenrolment outnumbered girls with a gender gap of 0.8 percentagepoints. Girls domina1ed boys In 8 out of 18 school dil.isions in theregion.
Among the school di\isions, Iloilo posted the highest enrolmentcomprising 27.3 percent of the regional total. This was followed byNegros Occidental and Capiz with 86,573 and 45,956 enrolees,respectively, dominated by girls. The school dil.ision of San CarlosCity recorded the lowest number of enrollees with 5,511.
8-13

GIRLS AND BOYS
Table 8.11 Number of Girls and Boys Promoted in PublicElementary Schools by Division: SY 2009.2010
Prelious School Year Promotees and GraduatesDi~sion
Girls Boys Both Sexes(Total)
Aklan 34,509 37,352 71,861Antique 35,534 36,851 72,385Bacolod City '26,182 27,169 53,351Bago City 10,201 10,834 21,035Cadiz City 9,841 10,125 19,966Cap!z 40,232 43,276 83,508Escalante City 6,570 6,757 13,327Gulmaras 9,704 10,710 20,414Iloilo 99,473 105,342 204,815Iloilo City 19,368 20,177 39,545Kabankalan City 12,103 12,440 24,543La Carlota City 3,928 4,193 8,121Negros Occidental 94,374 97,948 192,322Passi City 4,821 4,996 9,817Roxas City 9,409 9,580 18,989Sagay City 9,123 9,131 18,254San Carlos City 9,478 9,212 18,690SHay City 6,686 7,088 13,774
Total 441,536 463,181 904,717Source: Department 01 education
In SY 2009-2010, more boys (463,181) than girls (441,536) werepromoted in the elementary level. Boys dominated girls in 17 out 0118 school dilisions in Western Visayas. ~ is worth noting that girls(9,478) outnumbered the boys only in the school dilision of SanCarlos City, Negros Occidental.
The school dilisions of Iloilo and Negros Occidental posted thehighest number of pupils promoted with 204,815 and 192,322 pupils,respectively. The school dilision of La Carlota City had the lowestnumber of pupils promoted with only 8,121 pupils.
8-14

GlkL::> ,..NU "U/::>
Table 8.12 Number of Repeaters in Public ElementarySchools by Division: SY 2009.2010
RepeatersDllAsion
Girls BoysBoth Sexes(Total)
Aklan 559 1,362 1,921Antique 1,228 2,639 3,887Bacolod City 589 1,246 1,835Bago City 253 469 722Cadiz City 367 648 1,015Capiz 518 1,265 1,783Escalante City 211 403 614Guimaras 181 488 669lioHo 1,755 4,525 6,280Iioilo City 4e8 1,174 1,632Kabankalan City 411 839 1,250La Carlota City 54 116 170Negros Occidental 2,807 5,203 7,810Passi City 193 509 702Roxas City 111 291 402Sagay City 3ge 757 1,155San Carlos City 396 738 1,134SHay City 215 447 662
Total 10,504 23,119 33,623Source: Department of 6:jucltlon
In SY 2009-2010, pupli repeaters In public elementaryschools In the 18 school dloJslons of Western Visayes reached33,623. More than helf of the pupli repeaters .were boys(23,119). This is 2.4 percent 01the region's total enrolment inthe same school year.
Out of 18 school dilAslons, Negros Occidental recorded thehighest number of repeaters with 7,810 pupils (23.2%), followedby the school di.,;sion of Iioilo with 6,280 pupils or 2.8 percentof the region's total enrolment.

GIRLS AND BOYS
r"ble 8.13 Number of Drop-<>uls in Public Elementary School,by Division: SY 2009.2010 (As of March 31, 2009)
Pre\ious School Year Drop.outsD1\ision
Gi~s Boys Both Sexes(Total)
Aklan 381 784 1,165Antique 264 621 885Bacolod City 399 899 1,298Bago City 65 169 234Cadiz City 319 609 928Capiz 421 864 1,285Es calante City 265 524 789Guimaras 35 66 101Iloilo 1,346 3,368 4,714Iloilo City 203 490 693Kabankalan C~y 204 500 704La Carlola City 5 24 29Negros Occidental 1,877 3,562 5,439Passi C~ 61 132 193Roxas City 55 97 152Sagay City 341 638 979San Carlos City 454 747 1,201Silay City 176 423 599
Total 6,671 14,517 21,388Source: Department of Edueotion
In SY 200!}"2010, total drop-outs in public elementary schoolsreached 21,388 pupils. Drop-out was high among boys with14,517 pupils comp~slng 67.9 percent of the regiona/total.
Among the 18 school di.,;sions, Negros Occidental and Iloiloposted the highest oomber of dropouts, 5,439 pupils or 25.4percent and 4,714 pupils or 22.0 percent, respectively, of theregional total. Remarkably noting is the school di.,;sion of LaCarlota City which recorded the least number of drop-outs withonly 29 pupils.
8-16

GIRLS AND !JOYS
Table 8.14 Number of Students Promoted in Public SecondarySchools by Division: SY 2009.2010 (As of March 31)
Prelious School Year Promotees & GraduatesCilision
Girts Boys Both Sexes(Total)
Aldan 15,512 14,116 29,628Antique 16,658 14,823 31,481Bacolod City 12,375 11,323 23,698Bago aty . 5,040 4,222 9,262Cadiz City 4,693 3,899 8,592Capiz 21,787 18,175 39,962Escalante aty ... ... ...Guimaras 5,592 4,947 10,539Iloilo 58,805 53,963 112,768Iloilo City 8,312 6,920 15,232Kabankalan City 5,473 4,246 9,719La Cartota City 2,621 2,034 4,655Negros Occidental 42,500 35,462 77,982Passi City 2,738 1,997 4,735Roxas aty 2,841 2,455 5,296Sagayaty 4,055 3,423 7,478San Cartos City 2,749 2,147 4,896Silay City 4,140 3,147 7,287
Total 215,891 187,319 403,210
iIbt.: ...'" doiaSoi.rc.: Cepartmlrt cI fljUCaloo
In SY 2009-2010, a total 403,210 secondary students were promotedto the next higher level of education. More than half (53.5% or 215,891)of those promoted were girts and 45.5 percent or 187,319 were boys.Girts dominated the boys in all school dlisions of Western Visayas.
a the 18 schoo cilisions, Iloilo had the highest number of studentspromoted reaching 112,768. This is 28.0 percent of the total studentspromoted in all the school dilisions. NelTOSOccidental followed closelyv.ith 77,982 and Capiz v.ith 39,962 students.
The school ci~sions of La Cartota City and Passi City had the leastnumber of students promoted v.ith only 4,655 and 4,735, respectileiy.
8.17

GIRLS AND BOYS
Table 8.15 Number of Repealers in Public Secondary Schoolsby Division: SY 2009.2010
RepeatersDi'oision
Girts Boys Both Sexes(Total)
Aklan 116 544 660Antique 316 1,453 1,769Bacolod City 628 1,722 2,350Bage City 132 796 928Cadiz City 138 394 532Capiz 340 1,506 1,846Escalante City ... ... ...Guimaras 43 595 638Iloilo 717 3,666 4,383Iloilo City 599 1,424 2,023Kabankalan City 125 517 642La Carlota City 45 194 239Negros Occidental 561 2,367 2,928Pass; City 37 319 356Roxas City 99 304 403Sagay City 90 316 406San Carlos City 47 167 214Silay City 142 605 747
Total 4,175 16,889 21,0&4Note: ... no dataSource: Depl!Irtment of Education
For SY 2009-2010 the total number of repeaters in publicsecondary schools reached 21 ,064 students or 4.5 percent of the totalstudents enroled during the year. Of the total repeaters, 16,889 or80.2 percent were boys and 4,175 or 19.8 percent were girts. Boyrepeaters consisted 3.6 percent while girts consisted 0.9 percent ofthe total students enroled during the year.
The school di'oisions with the most number of repeaters were:Iloilo (4,383), Negros Occidental (2,928), Baeolod City (2,350), IloiloCity (2,023), and Capiz (1,846).
8-18

GIRLS "I,D BOYS
Table 8.16 Numher of Drop-outs in Public Secondary School,by D"i';on: SY 20~-2010
Pre\1OUSSchool Year Drop-<>utsDilAsion
Gi~s Boys Both Sexes(Total)
Aklan 507 1,141 1,648Antique 503 1,347 1,850Bacolod City 787 2,012 2,799Bago City 294 773 1,067Cadiz City 377 606 983Capiz 967 2,430 3,397Escalante City ... ... ...Guimaras 83 350 433Iloilo 2,027 5,870 7,897Iloilo City 1,654 1,973 3,627Kabankalan City 259 418 677La C~ota City 54 133 187Negros Occidental 1,983 4,147 6,130Passi City 116 387 503Roxas City 259 469 728Sagay City 213 424 637San Ca~os City 129 222 351Silay City 318 633 951
Total 10,530 23,335 33,865Note: ... No data
Source: Deportlrenl of 6:lucotlon
In SY 2009.2010, drop-<>uts in public secondary schoolstotaled to 33,865 studen", or 7.3 percent of the region's enrolment.Of the total drop-<>uts, 23,335 (68.9%) were boys and 10,530(31.1%) were girts. More boys than gi~s dropped out 6"omschoolduring the year, the trend Is true to all the 17 school di\1sions ofWestern Visayas.
In terms of wlume, incidence of drop-<>utwas higher in theschool dilAsions of Iloilo with 7,897; Negros Occidental (6,130);and Iloilo City (3,627). The division of La Cartota City, on the otherhand, had the lowest number of drop-outs during the school yearwith only 187 students.

GIRLS AND BOYS
Table 8.17 Number of Failures in Public Secondary Schoolsby Division: SY 2004.2005
FailuresDivtsion
Girls BoysBoth Sexes(Total)
Aklan 588 1,098 1,686Antique 376 1,361 1,737Bacolod C~y 918 2,102 3,020Bago City 229 635 864Cadiz City 312 649 961Caplz 814 1,962 2,716Escslante City ... ... ...Gulmara8 168 779 945iloilo 2,138 6,816 8,964iloilo City 877 1,796 2,673Kabankalan City 89 253 322La Carlate City 139 229 388Nagroe Occldentel 2,524 5,548 8,072Passl City 500 714 1,214ROX88 City 338 492 830Sagay City 183 362 525San Carlol City 307 424 731Sliay City 244 859 903
Total 10,702 25,879 38,581Noto: ,•.NodataSource:eoplrtmer.!of 5:lucatbn
In SY 2004.2005, Itudents who Itiled in public secondaryschoolatotaled to 36,581,7.4 percent olth. total regionalemolment for publicsecondarylchool •. Failing students was higher among boY' by41.5percentage points over the giril, The trend is true to all 'schooldivisions In tha region.
School divisions with high rate of failed students in 2004.2005included: Passi City, 17.6 percen~ Roxes City, 12.8 percent SanCerlos City, 12.5 percent and Iloilo City, 12.2 percent
The schooi di~sion 01 KaOankalan City had tne least number offailed students With 322 or 2.9 percent of tne total enrolment for thedi.,;sion.

GIRLS & BOYS
Table 8.18 Working Children by Age Group & Sex: 2007-2009(In thousand,)
Age Groups2007 2008 2009
Girls Boys Girls Boys Girls BoysAll Age Groups 65 135 56 116 73 109
5 - 14 21 42 14 26 21 3215.17 44 93 42 90 52 77
Notes: 1. Details maynef add up to totals due to rounding.2. A chifd is considered oorking or economically active if at any timeduring the reference period he eng8Qed in any economic activity forat least one hour. He may be studying, looking for WJrk and/orhousskeeping at the same time.
3. Statisticaf inquiries on -...orking children focus on thoseaged 5-17 years ofd based on the definition of B child 8S an individualbolow 18 yesrs olel.
4. Data v.ere generated using population projections based on the2000 Csnsus of Populstion.
Source o( data: National Statistics Office, Labor Force SufV8Y. Public Use Files.
For the past three years (2007-2009), worl<ing boysoutnumbered the girls in all age groups comprising more than hallof the region's total worl<ingchildren.
Majority of the mrking children were in the age bracket 1!;'17for both boys and girls.
8-21

Women& enIN WESTERN VISAYAS
SPECIAL STUDIES ON WOMEN:
A. "The Women in the ServiceSector in Iloilo City"
B. "Domestic Violence in theProvince of Aklan"
C. "Leisure Time AllocationAmong Women: Some. .Evidence in Iloilo City,Philippines

WOMEN INTHE SERVICE SECTOR
OBJECTIVES
General: To determine the profile of the women in the Ser.lceSector in Iloilo City.
Specific: The study aimed to know the following aboul the women:
• demographic. educational. household. and occupationalcharacteristics;
• specific type of ser.lce rendered and average monthlyincome;
• location. type. and payment status of the dwelling;
• mode of transportation and trawl time from place ofdwelling to the wor1<place;
• awrage monthly trawl cost incurred from place ofdwelling to the wor1<placeand .,;ce wrsa; and
• whether relationship exists between the age, maritalstatus, educational attainment. and appointmentstatus and income of the women.
SURVEY METHODOLOGY
A total of 500 women representing the selected 10M ajorSer\1ce Di.,;sionsllndustry Descriptions based on the 1994Philippine Standard Industrial Classification (PSIC) were studied(Appendix A). Simple random sampling was utilized, done at twostages. The first stage was by major di.,;sion lewl and the secondstage. by respOndent lewl.
Selection of the women-respondents was limited from one (1) tofiw (5) women in ewry industry/establishment, by type of ser\1ce.The industries/ establishments for each di.,;sion were identifiedbased on the listing of the City Planning and Dewlopment Office 01Iloilo City as of 1997 (Socia-Economic Profile of Iloilo City, 1998).
9.1

WOMEN IN THE SERVICE ECtOR(J~U:;: _.
A structured inter'olew schedule was specially designed togather the data. Pretesting of the instrument was done amongwomen worKers in the industries/establishments representing the10 major ser'olce dilisions of the same characteristics as that ofthe women-respondents but not included in the surwy.
Data collection lasted from October to December 1999. Tensenior college students were trained as data collectors. Thesurwy utilized the personal inter'olewtechnique. The respondentswere inter'olewed right in their worKplaces. In cases of callbacks,some women opted to complete the inten.iew in their homes afterwork hours and during off hours.
The chi-square was used to determine significant relationshipsbetween personal variables and income of the women.
FINDINGS
Demographic Characteristics of the Women
Table 9A.l presents the status of membership in the family,age, and marital status of the women in the Ser'olce Sector.
Nearly one-third (29.6%) considered themsehes head of thefamily. The rest considered themselvas family members,constituting 70.4 percent.
The women were relativaly young, avaraging 32.5 years old.Most of them were in the age bracket 25-34 years, comprising37.8 percent, followed by age brackets 15.24 and 35-44 yearswith 28.0 and 18.0 percent, respectiwly. One woman worker or0.2 percent was in the age bracke1 65-74 yearS. While notsupposed to be in the workplace, this old woman still enjoysdressmaking work.
Most of the women were either single (50.6%) or married(46.6%). Fiva or 1.0 percent of the women were separated fromtheir spouses. Fourteen (2.8%), howevar, refused to state theirmarital status.
9.2

WOMEN IN iHE SERVICE SECTOR
LIST OF TABLES
Tables Page
9A.l Demographic Characteristics 01 the Women 9-49A.2 Educational Attainment 01 the Women 9-59A.3 Household Characteristics 01 the Women 9-69A.4 Occupational Characteristics 01 the Women 9-89A.5 Type of Ser.ices Rendered & Income 01 the
Women 9-109A.S Place, Type and Payment Status 01Dwelling
01 the Women 9-139A.7 Mode 01Transportation and Trawl Time from
Dwelling to the Workplace 01 the Women 9-159A.8 Awrage Monthly Trawl Cost from Place 01Dwelling
to the Workplace Incurred by the Women 9-169A.9 Relationship Between Age and Income 01 the
Women 9.179A.l0 Relationship Belween Marital Status and Income
olthe Women 9-179A.ll Relationship Between Educational Attainment
and Income 01 the Women 9.189A.12 Relationship Belween Appointment Status and
Income 01 the Women 9-19
9-3..

WOMEN IN "THESERVICE $6f~• 4;4
Table 9A.1 Demographic Characteristics of the Women
Category n %
Membership Status in the FamilyFamily head 148 29.6Family member 352 70.4
Total 500 100.0Age
15 - 24 140 28.025 - 34 189 37.835 - 44 80 16.045 - 54 62 12.455 - 64 28 5.665 - 74 1 0.2Mean age = 32.5 years
Total 500 100.0
Marital StatusSingle 253 50.6Married 228 45.6Separated 5 1.0Rellsed to answer 14 2.8
To'tal 500 100.0
Most of the women were either single (50.6%) or married(46.6%). Fiw or 1.0 percent of the women were separated fromtheir spouses. Fourteen (2.8%), howewr, refused to state theirmarital status.
9-4

WOMEN IN THE SERVICE SECTOR
Table 9A.2 Educational Attainment of the Women
Category n %
Educational Attainment
Doctoral degree/Doctor (Ed.D.lPh.D.lM.D. 11 2.2Master's degree 17 3.4Bachelor's degree 259 51.8College, not graduated 66 13.2Vocational course/certificate 27 5.4High school graduate 69 13.8High school, not graduated 22 4.4Elementary graduate 20 4.0Primary grade 6 1.2No formal schooling 3 0.6
Total 500 100.0
Women in the SeNce sector had varied educational attainment(Table 9A.2). Majority had completed a college education earningacademic degree, comprising of Bachelo(s (51.8%), Maste(s(3.4%), and Doctoral (2.2%) degrees. Those with high schooldiploma and with college education but not graduated, constituted13.8 and 13.2 percent, respectively. Others had \OCationalcourse/certificate (5.4%), high school but not graduated (4.4%),elementary certificate (4.0%), and primary grade (1.2%).
Inspite the high educational attainment of majority of the womenworkers, it becomes obvious that three or 0.6 percent declared theyhaw never gone to formal schooling.
9-5
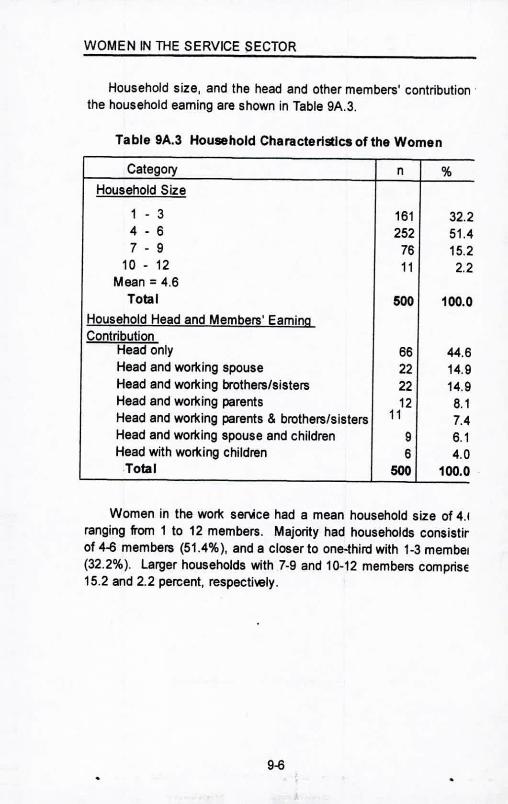
WOMEN IN THE SERVICE SECTOR
Household size, and the head and other members' contribution'the household earning are shown in Table 9A.3.
Table 9A.3 Household Characteristics of the Women
Category n %Household Size
1 - 3 161 32.24 - 6 252 51.47 - 9 76 15.210 - 12 11 2.2Mean = 4.6Total 500 100,0
Household Head and Members' EarningContribution
Head only 66 44.6Head and working spouse 22 14.9Head and working brothers/sisters 22 14.9Head and working parents 12 8.1Head and working parents & brothers/sisters 11 7.4Head and working spouse and children 9 6.1Head with working children 6 4.0.Total 500 100.0
Women in the work seNce had a mean household size of 4.1ranging from 1 to 12 members. Majority had households consistirof 4-6 members (51.4%), and a closer to one-third with 1-3 membel(32.2%). larger households with 7-9 and 10-12 members comprise15.2 and 2.2 percent, respectiwly.
9-6

WOMEN IN THE SERVICE SECTOR
Of the 148 women who considered themselves head of thehousehold, 66 or 44.6 percent were sole breadwinners in thehousehold. The rest were assisted by the working spouse orother employed household members.
An equal,proportion (14.9% each) claimed that householdearning was contributed by the household head and workingspouse, and head and working brother/sister. Other womenclaimed that household earning was contributed by head andworking parents (8.1%), and head and working parents andbrothers/ sisters (7.4%), head and working spouse and children(6.1%), and head and working children (4.0%).
9-7
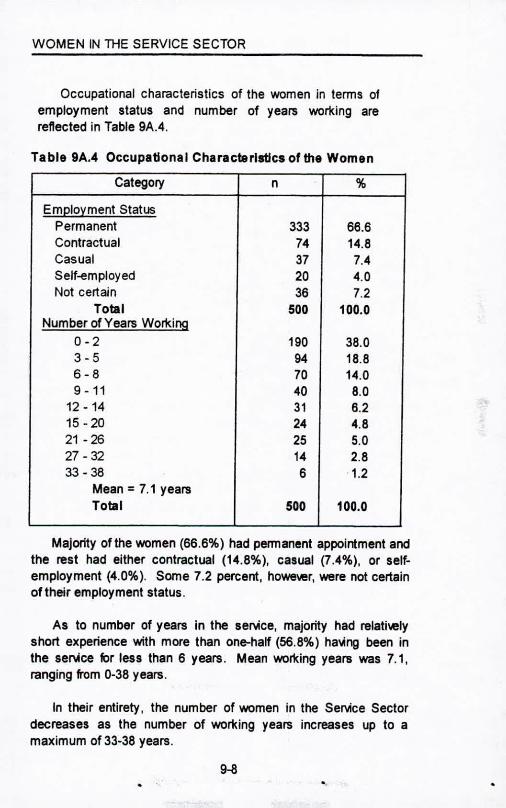
WOMEN IN THE SERVICE SECTOR
Occupational characteristics of the women in terms ofemployment status and number of years working arereflected in Table 9A.4.
Table 9A.4 Occupational Characteristics of the Women
Category n %
Employment StatusPermanent 333 66.6Contractual 74 14.8Casual 37 7.4Self-employed 20 4.0Not certain 36 7.2
Totel 500 100.0Number of Years Working
0-2 190 38.03-5 94 18.86-8 70 14.09 - 11 40 8.012 - 14 31 6.215 - 20 24 4.821 - 26 25 5.027 - 32 14 2.833-38 6 .1.2
Mean = 7.1 yearsTotal 500 100.0
Majorlty of the women (66.6%) had permanent appointment andthe rest had either contractual (14.8%), casual (7.4%), or self-employment (4.0%). Some 7.2 percent, howewr, were not certainoflheir employment status.
As to number of years in the ser'o1ce,majority had relatiwlyshort experience with more than one-half (56.8%) ha\ling been Inthe ser'o1cefor less than 6 years. Mean working years was 7.1.ranging from 0-38 years.
In their entirety, the number of women in the Ser'o1ceSectordecreases as the number of working years increases up to amaximum of 33-38 years.
9-a. .

WOMEN IN THE SERVICE SECTOR
Type of Service Rendered and Income of the Women
The 10 selected mejor se~ce groups and the specific type ofse~ce rendered, income renge, and awrege monthly income of thewomen can be gleaned in Table 9.5.
The 10 major se~ce groups included in the study and thedistribution of the women in each specific type of se~ce are:Wholesale and Retail Trede (18.4%); Health and Social Wof1((15.2%); Education (12.4%); Social, and Personal Se~ce Acti'oities(11.0%); Financial Institutions (9.2%); Hotels and Restaurents(8.6%); Real Estate and Miscellaneous Business Acti\ities (7.6%);Public Administmtors (7.2%); Pri\l8te Households with EmployedPersons (5.6%); and Trensportation and Communication (4.8%).
Monthly income of the women widely differed, depending uponthe se~ce group and/or specific type of ser\ice rendered. In theirentirety, the women had an awrege monthly income of Php5,708.16.The highest paid women were in the Financial Institutions withawmge income of Php8,797.11 per month and the lowest paid oneswere in the Pri\l8te Households with awmge income of Php 1,057.14per month.
Next to Financial Institutions, women in the Education, RealEstate and Miscellaneous Business Acti'oities, and Health andSocial Wof1( se~ce groups also enjoyed a relatiwly higher a_agemonthly income of Php8,661.81, Php8,308.41 and Php8,032.41 permonth, respectiwly. This was followed by the women in PublicAdministretion; Tmnsportation and Communication; and OtherCommun~y, Social, and Personal Ser\ice ActMies with awregemonthly incomes of Php7,686.21, Php5,249.95, and Php3,454.57per month, respectiwly. Women in the Wholesale and Retail Tredeand those in Hotels and Restaurents were among .the lowest paidse~ce wof1(ers with awrege monthly incomes of Php2,707.81 andPhp2,516.70 per month, respectiwly, next to those in PriwteHouseholds.
9-9

WOMEN IN ll-lE SERVICE SECTOR
Table 9A.5 Type of Service Rendered & Income of the Women
SeNce Group Aw. Mo. Incomen % RangeIncome
Wholesale & Retail Trade 92 18.4 2,707.81 800-9,000Gasoline Station 26 5.2 3,155.20 1,500-5,750Supermarkets 25 5.0 3,450.00 2,700-5,700Groceries, furniture,appliances, textile,clothing, footwear,drugstore 21 4.2 2,515.86 1,200-9,000Sari-sari.store 21 4.2 1,400.00 800-1,850 aI
Health and Social Work
(Doctors, nurses,technicians, mldwi~s,and aides; hospitals) 76 15.2 8,032.53 3,800-16,000Public 40 8.0 8,446.91 5,200-15,000Priwte 36 7.2 7,572.11 3,800-16,000
Education 62 12.4 8,661.81 3,800-21,000Public 38 7.6 9,941.72 4,800-21,000Priwte 24 4.8 6,635.29 3,800-17,000
Social, and PersonalSeNce ActilAties 55 11.0 3,454.57 700-18,000laundry and hair dressingand other beautytreatment 27 5.4 2,052.94 700-2,600 bIPersonal seNces (~ndors,buy & sell) 16 3.2 4,772.72 1,300-18,600Radio and teleloision 12 2.4 4,850.70 3,200-8,050
Total 600 100.0 5,708.16 500-27,000
aI AnnOla' w ilh free board and lodgi1gbI Anno! a' w ilh free ••••als duri1g horre service
9-10

WOMEN IN lHE SERVICE SECTOR
Across specific type of serlAce, in Wholesale and Retail Trade,supermarket workers (Php3,450.00) eamed higher than theircounterparts in gasolina stations (Php3,155.20), groceries, fumiture,appliances, clothing, footwear, and drugstore (Php2,515.86), andsari-sari stores (PhP1,400.00).
In Heanh and Social Work, public hospital workers(Php8,446.91) earned more than their counterpart in priwtehospitals (Php7,572.11).
On the other hand, in Education SerlAces, public educationalinstitution workers (Php9,941.72) eamed higher than thoseemployed in priwte aducational institutions (Php8,635.29). Thereloersa was seen in Financial Institutions whare priwte financialinstitutions peid more to their workers (Php9,183.35) as comparedto the public financial institutions (Php8,500.00).
In Real Estate SerlAce Group, those engaged in real estateacthilies (Php11,718.16) eamed more than real estate accountants,bookkeepers and security serlAce groups (Php5,239.64).
In Hotels and Restaurants, hotel and motel workers(Php3,060.00) were beller paid than those in clubs, bars, cocktaillounges (Php2,670.38), and restaurants (Php1,640.20).
On the whole, it is interesting to note that while maids and babysil1ers appeared to be the lowest paid workers, all of them alsoenjoyed tee board and lodging and likewise those in sari-saristores, groceries, fumiture, appliances, textile, clothing, andfootwear who claimed that almost all also enjoyed free board andlodging. Those in laundry and hairdressing and other beautytreatment ser'oices were, most of the time, offered free meals during. .
9-11

WOMEN IN ll-lE SERVICE SECTOR
Table 9A.5 continued.
Se~ce Group Ave. Mo. ",comen % Income Range
Financial Institutions 46 9.2 8,797.11 3,500-21,010Public 26 5.2 8,500.00 3,500-21,010Private 20 4.0 9,183.35 3,800-18,000
Hotels and Restaurants 43 8.6 2,516.70 1,000-8,500Hotels and Motels 15 3.0 3,060.00 1,200-8,500 sIRestaurants 15 3.0 1,840.20 1,000-3,000 sI
Clubs bars and cocktail 13 2.6 2,670.38 1,10()..4,500lounoesReal Estate andMiscellaneous BusinessActhAties 38 7.6 8,308.41 2,800-27,000Miscelleneous businessact/vties. <legal,accountlno & bookkeeolno.and security se~ces 20 4.0 5,239.64 3,250-11,200Real estate 18 3.6 11,718.164 2,800-27,000Public Administration(Regional, local & generalse~ces) 36 7.2 7,868.12 2,745-22,000Private Households withEmployed Persons (Maidsand baby sitters) 28 5.6 1,057.14 500-2,000 l>'Transportation andCommunication(Land, air and watertransportation, tour andtravel agencies, messengerse~ces, & telec.om-municatlons) 24 4.8 5,249.95 2,250-9,600 l>'
Total 500 100.0 5,708.16 500-27,000
aJ Somew ilhfreeboardandkldgingbI Ahl>st allw ithfreeboardandlodging
9--12

WOMEN IN THE SERVICE SECTOR
Analytically, based on the pre'l8i1ing cost of board andlodging that ranges from Php1,800.00 to Php2,400.00 permonth at the time of the survey, i1appears that these groups 01wor1<erswho enjoy free board and lodging, were eaming eloenhigher than other wor1<ersin ser-..1cegroups that needed higherqualification such as education, and the like.
In terms of income range, a wide disparity was obseMdamong the real estate wor1<ers (PpP2,800.00-27,000.00).Lowest minimum (Php500.00) and maximum (Php2,000.00)was also noted among maids and baby sitters.
Table 9A.6 Place, Type, and Payment Status 01 Dwelling01 the Women
Category n %
Place of DwellingWithin Iloilo City 363 72.6Outside Iloilo City 137 27.4Total 500 100.0
Type 01 DwellingOwned house 313 62.6Permanent 235 75.1Semi-permanent 41 13.1Temporary 37 11.8Total 500 100.0
Payment Status 01 Dwelling 313 62.6Owned houseNo oniJOing amortization 223 (71.2)With on-going amortization 31 (9.9)Not certain 59 (18.8)
Rented lodging house 187 37.2No oniJOing amortization 72 (71.2)With on-going amortization 115 (61.5)Total 500 100.0
9-13

WOMEN IN THE SERVICE SECTOR
Table 9A.6 displays the place, type, and payment status ofdwelling of the women in the Service Sector.
Of the 500 women, nearly one-third (72.6%) Iiled withproximity to their workplaces, within Iloilo City, while more thanone-fourth (27.4%) lived quite distant from their workplaces,outside Iloilo City.
Two out of three women (62.7%) dwelt in owned houses, and37.4 percent dwelt in rented lodging houses. Among the ownedhouses, one-third were permanent (75.1%) and the rest wereeither semi-permanent (13.1%) or temporary (11.8%). On theother hand, 64.2 percent of the rented lodging houses werepermanent, and 23.0 and 12.8 percent were semi-permanent andtemporary, respectiwly.
As to the payment status of the dwellings, majority of thewomen Iiling in owned houses (71.2%) had no oniloin9 monthlyamortization, while one of 10 women (9.9%) were still payingmonthly amortization. Almost one-fourth or 18.8 percent,howewr, were not certain of the peyment status of the housesthey were dwelling in.
On the contrary, among women who dwelt in lodging houses,More than one-half (61.5%) were paying monthly lodging fees,and the rest (38.5%) were lodging for free.
9-14

WOMEN IN THE SERVICE SECTOR
The mode of transportation utilized and the trawl time fromdwelling to the woJ1lplaceof the women are shown in Table 9A.7.
Tabla 9A.7 Moda of Transportation and Travel Time fromDwelling to the Workplace of the Women
Category n %Mode ofTransportationPublic utility whicle 367 73.4On foot 81 16.2Personal/Owned whicle 52 10.4
Total 500 100.0Trawl lime (Min.)5 - 14 140 28.015 - 29 141 28.230 - 44 98 19.645 - 59 42 8.480 - 74 46 9.275 - 89 18 3.690 - 104 15 3.0
Total 500 100.0
Women in the Service Sector utilized three modes 01transportation in trawlling from their dwelling to the woJ1lplace.Closer to three-fourths (73.4%) utilized public utility whicle and10.4 percent used owned or personal lehicle in commuting fromtheir homes to the woJ1lplaces and lice-lersa. Other women(16.2%) trawlled by foot only from their place of dwelling to theworkplace and lice-lersa.
On the alerage, the women spent 31.8 minutes orapproximately one hour back and forth trawl time from theirdwelling to the woJ1lplace. An almost equal proportion of thewomen trallfllled for 5-14 minutes (28.0%) and 15-29 minutes(28.2%) from dwelling to the woJ1lplace. Those with dwellingplaces quite distant from the woJ1lplace trallfllled for 30-44 minutes(19.6%), 45-49 minutes (8.4%), and 60-74 minutes (9.2%) andthose coming trom the farthest points to the workplace spent 75-89minutes (3.6%) and 90-104 minutes (3.0%).
9-15

WOMEN IN 1liE SERVICE SECTOR
Table 9A.8 Average Monthly Travel Cost from Place ofDwelling to the Workplace Incurred by the Women
Category n % Ave. TravelCost/Mo.
Women Who Did Not IncurTravel Cost 81 16.2Women Who Incurred TravelCost 419 83.8Those residing wnhin Iloilo City 282 87.3 Php330.9Those residing outside Iloilo City 137 32.7 Php532.0
Total 500 100.0 Php396.6
As stated elsewhere, 363 or 72.6 percent of the 500 women inthe Sen.1ceSector reside within Iloilo City and 137 or 27.4 percent,outside Iloilo City. Of this, 419 or 83.8 percent incurred travel costin travelling from place of dwelling to the workplace, consisting of282 or 67.3 percent of those IilAng within Iloilo City and all 137women liling outside Iloilo City (Table 9A.8).
As a whole, the 419 working women incurred an average ofPhp396.65 per month travel cost in travelling from their place ofdwelling to the workplace and lAce versa.
Women residing outside Iloilo City spent a relatively highera..erage travel cost of Php532.00 per month compared to thoseresiding within Iloilo City with an awrage of Php330.90 per month.
tt is worth mentioning that the 81 or 16.2 percent of the womenwho did not incur any travel cost from dwelling to the workplaceconstituted the maids, baby sitters, waiters, and messengers.
9-16

WOMEN IN THE SERVICE SECTOR
Table 9A.9 Relationship Between Age and Income of theWomen
Age (years)Monthly Income
<Php8000.00 - >Php8000.00 Total
15 - 34 269 60 329
35 - 54 78 64 142
55 - 74 13 16 29
Total 360 140 500
Obtained X2 = 52.4 Critical X2 0.01 = 9.2
As rewa led in Table 9A.9, the obtained chi-square is 52.4and the critical X2 0.01 = 9.2. This means that age is highlysignificantly related to income of the women. The older thewomen, the higher the income.
Table 9A.10 RelatJonshlp Between Marital Status and Incomeofthe Women
Marital StatusMonthly Income
<Php8000.00 - >Php8000.00 Total
Single 205 48 253
Married 146 87 233
Total 360 135 486
Obtained X2 = 47.4 Critical X2 0.01 = 6.6
As shown in Table 9A.10. the obtained chi-square is 47.4 andthe critical X2 0.01 = 6.6. Similar to age, marital status of thewomen is highly significantly related to their income. Marriedwomen earned more than the single or unmarried women.
9-17

WOMEN IN THE SERVICE SECTOR
Table 9A.11 Relationship Between Educational Attainmentand Income of the Women
Educational Monthly IncomeAttainment <PI1j)8000.00 - >Php8000.00 Total
High school 115 3 118
College 216 109 325
Total 331 112 443
Obtained Y?= 44.0 Critical X2 0.01 = 6.6
In Table 9A.11, the data shows that educational attainmentand income are highly significantly related to each other, asevidenced by the obtained Y?= 44.0 and critical Y? 0.01 = 6.6.
Women with high school education earned lower than thewomen with college education. In fact, not one of the 259 up tothe elementary-educated women earned more than Php8000.00per month. Conll9rsely, not one among the 11 post graduatedegree holders earned less than Php8000.00 per month.
9-18

WOMEN IN THE SERVICE SECTOR
Table 9A.12 Relationship Between Appolnment Status andIncome 01 the Women
Appolnment Monthly IncomeStatus <Php8000.00 - >PhpBOOO.OO Total
Permanent 229 104 333
Contractual 65 9 74
Casual 30 7 37
SelHlmployment 11 9 20
Not certain 25 11 36
Total 360 140 500
Obtained X' = 14.8 Critical X' 0.01 = 13.3
AppOinment status. also highly significantly affected theincome olthe women, as supported by the obtained X' = 14.8 andcritical X' 0.01 = 13.3 (Table 9A.12). Women with permanentwar\( appoinment earned more than their casual and/or contractualcounterparts.
,>: '.'\, ,
9-19

WOMEN IN THE SERVICE SECTOR
CONCLUSIONS
• One out of three women in the Ser.ice Sector consideredthemselws head of the household .
• The awrage woman worker is 32.5 years, single, and degreeholder.
• The women had an awrage household size of 4.6 members .
• Of the 148 women heads, one-half are sole breadwinners ofthe households, while the rest were assisted by otheremployed members.
• Two out of three women hold a permanent appointment withawrage work experience of 7.1 years .
• The women's income widely differed between major ser.iceclassification (Major Di~sion) and specific type of seMce(DilAsion).
• Olthe 10 Major DilAsions, highest paid women are those inFinancial Institutions and Education and the lowest paid arethose in Priwte Households and Hotels and Restaurants.
• By Di~sion, the beller paid women are in real estate actilAtiesand in public education ser.ices, while the lowest paid arethose the maids and baby sillers, and sari-sari store workers.
• Three out of four women liw in proximity to their workplacewithin UoiloCity, while one out of bur liw outside RoiloCity .
• The income of the women is related to age, marital status,education, and appointment status.
• Married, older, with college education, and with permanentWOl1< status women are earning better than women who aresingle, younger, with secondary education and casuaVcontractual work status.
9-20

WOMEN IN THE SERVICE SECTOR
RECOMMENDATIONS
This study is only a minute touch of the numerous relewntinformation and issues about the working women in the city endpro\ince of Iloilo and the Westem Viseyes as a whole. Moreshould be done to allow a deeper understanding of the women'spotential contribution to the economic actiloities obtaining in thearea.
Similar studies should be conducted using larger samples,extensile coverege, and including other major seNce classification(Major Di\ision) and specific seNce types (Di\ision) listed in thePhilippine Standard Industrial Classification (PSIC). Relewnt forundertaking in the City and Pro\ince of Iloilo and Westem Vi say asas a whole would include Agriculture and Fishery, Manufacturing,and Financiallntermedialion.
REFERENCES
CPDO. 1998. Socia-Economic Profile of Iloilo City.
NEDA. 1985. Glossary ofTenns in Statistics.
NSCB .. 1995. Definition ofTerms and Concepts.
NSCB. 1994. Philippine Standard Industrial Classification.
9-21

WOMEN IN iHE SERVICE SECTOR
Appendix A
SELECTED 10 MAJOR DIVISIONS/INDUSTRY DESCRIPTION
(1994 Philippine Standard Industrial Classification (PSIC)1. Wholesale and Retail Trade
- Gasoline stationsSupermarketsGroceries, fumiture, appliances, textile, clothing, footwear,drugstoresSari-sari stores
2. Health and Social Work (Doctors, nurses, technicians,midwiws, and aides in hospitals)- Public- Private
3. Education- Public• Private
4. Other Community, Social, and Personal Sel"lice ActivitiesLaundry and hairdressing and other beauty treatment
- Personal sel"lices (wndors, buy and sell)- Radio and teleloision
5. Financial Institutions- Public- Private
6. Hotels and Restaurants- Hotels and motels• Restaurants- Clubs, bars, and cocktail lounges
7. Real Estate and Miscellaneous Business ActiloitiesMiscellaneous business actiloities Oegal, accounting andbookkeeping, and security sel"lices)Real estate actiloities
8. Public Administration (Regional, local and general sel"lices)9. Prill8te Households with employed Persons (Maids and
baby sitters)10. Transportation and Communication (Land, air and water
transportation, tour and trawl agencies, messengersel"lices, and telecommunications.
9.22

WOMEN IN THE SERVICE SECTOR
"The Women In the Service Sector In 110110City"
About the Study
This study entitled "The Women in the SenAce Sector inUoiloCity" is one olthe smell area statistical studies conducted bythe author in coordination with the National Statistical CoordinationBoard (NSCB) Regional Unit 6.
The statistical surwy proposal/form/questionnaire hascomplied with the pro~sions of the Statistical Sur.ey Re~ew andClearance System (SSRCS). n has passed the re~ew and grantedclearance for conduct by the Technical Subcommittee on SUMlYDesign (TSSD) of the Regional Statistical Coordination Committee(RSCC) Region 6.
About the Author
Mr. Rubin L. Penpillo is Associate Professor V of the WestVissyas State Uniwrsity (WVSU), La Paz, loilo City. He teachesAgricultural Statistics and Plant and Animal Science courses inthe Graduate School, and Economics, Educational Statistics andEducational Foundations courses in the College of Education. Inaddition to being a practicing researcher, he acts as statisticianand/or research ad~ser for both undergraduate and graduateresearch papers/theses of students and graduate fellows of theUniversity.
Mr. Penpillo holds a Master of Science degree major inAgronomy and minor in Animal Science obtained from theUniversity of the Philippines at Los Banos, Laguna.
9-23
I

DOMESTIC VIOLENCE IN THE PROVINCE OF AKLAN
INTRODUCTION
This descriptiw research inlestigated 71 IActims andperpetrators of domestic lAolence rom the reported cases at theDepartment of Social Welfare and Dewlopment Office (DSWD),Aklan Extension Office Deeangpan sa Kababayenhan sa Aklan,and the PNP Aklan ProlAncial Office cowring the period January2001 to September 2003. The data gathered are describedusing descriptiw statistics such as frequency count,percentage, rank, and mean.
OBJECTIVES
Generally, this study aimed to present a profile of the womenwho are IActims of domestic .,;olence in the prolAnceof Aklan.Specifically, the study aimed to determine the following:
1. Personal profile of the IActims of domestic lAolance in termsof age, cilAl status, educational attainment, residence bymunicipality, and occupation;
2. Personal profile of the perpetrators of domestic lAolence interms of age, sex, educetional attainment, residence bymunicipality, and occupation. .
3. Forms of domestic lAolence.
4. Causes of domestic lAolence.
5. Assistance giwn to or awiled of by the .,;ctims of domestic.,;olence.
9-24

DOMEsne VIOLENCE IN THE PROVINCE OF AKLAN
METHODOLOGY
The study employed the descriptiw method of resean:h. Twosets of subjects were sludied, namely, lhe (1) liclims ofdomes lie liolence, and (2) perpelralors of domestic liolence.The firsl sel of subjecls imolwd 71 women who haw reportedcases of domeslic liolence 10Ihe DSWO Aklan Extension Officeand the PNP in the pralince. The second sel included lhe 71perpetralors who committed Ihe acls of domeslic liolenceatfecling Ihe firsl sel of subjecls. The dala were oblained frompertinenl records, documents, clients' profiles, and caseanalyses from the DSWD, Kalibo, Aklan; the Oaeangpan il mgaKababayenhan sa Aklan (Comprehensiw Cenler for Women),Kalibo, Aklan; and PNP Women's Desk, Camp Paslor Martelino,Kalibo, Aklan. The dala on serlices/assislance aleited by theliclims were laken from Ihe responses of social workersassigned in the agencies Ihrough personal inlerliew. The dalagalhered were lallied and presenled in lables and describedusing descripliw slalislics such as frequency counl, pen:enlage,rank, and mean.
9-25

DOMESTIC VIOLENCE IN THE PROVINCE OF AKLAN
FINDINGS
Profile of the Victims of Domestic Violence
Age. The oldest lActim was 63 and the youngest was 19 yearsold. The IActims were mostly within the age bracket of 24-33(35.2%) and 34-43 (32.4%) years (Table 98.1).
GilAI status. Almost half of the IActims were single (49.3%) andnearly half were married (47.9%). Two or 2.8% were widowed.Domestic lAolence affecting women most commonly occur amongmarried and single women who haw common-law relationships or"Iiw-in" relationships with the perpetrators (Table 98.1).
Educational attainment. Most of the IActims had secondaryeducation (45.1%), and some haw attained elementary (19.7%) andtertiary (18.1%) lewis of education. A few of them had no formalschooling (1.4%) at all (Table 98.1).
Occupation Qf the IActims. Most of the IActims were out-<>f-school (18.3%) and manual laborers (11.2%). Others were eitherhousekeepers (9.9%), self-employed (7.0%), or engaged inbusiness/trade (1.4%). Six or 8.6% had no wor!<at all (Table 98.1).
Residence Qf the Victims. Of the 17 municipalities of Aklan,the highest reported cases of lAoience were in Kalibo (39.4%),Numancia (14.1%), and Malinao (11.3%). No incidence wasreported for lezo, Tangalan, and 8uruanga (Table 9B.2).
Profile of the Perpetrators of Domestic Violence
Age. The oldest perpetrator was 65 years old and the youngestwas 19 years. Most of them were within the age brackets 27-34(15.5%) and 35-42 (15.5%). Eight or 11.3% were within theyounger age bracket of 19-26, and 7.0% and 5.6% were within theage brackets of 43-50 and 51-58, respectiwly (Table 98.3).
Sex. Almost all of the perpetrators were men (95.8%) with only3 or 4.2%, women.
9-26

DOMESTIC VIOLENCE IN lHE PROVINCE OF AKLAN
CiI,l status. Majority of the perpetrators were married (56.3%)and 25.4% were single.
Educational attainmant. Most of the perpetmtors had secondaryeducation (11.3%). Three or 4.2% each had primary and tertiaryeducation and 2.8% attained intermediate lewl of educetion(Teble 9B.3).
Occupation. Nine or 12.9% of the perpetrators were into manuallabor and 5.6% were selklmployed. File perpetmtors weregowmmant employeea (2.8%) and 1.4% each held priwte office, ateaching position, and in the military seNce (Table 9B.3).
Relationship 2! perpetflltors to the IActims. Most of theperpetmtors were related to the IActims by marriage (42.3%) andcommon4aw relationship (33.6%). Elewn or 15.5% of them wererelated to the IActims by consanguinity (15.5%) either as father,mothar, brother, sister, or ascendanUdescendant (Tabla 9B.4).
Fonns 2! Domestic Violence
A great majority of the lictims suffered from physical abuse(86.0%) which includes battering, slapping, kicking, pushing. hitting,punching, and dapriwtion of food, sleep and other basic needs. Sixor 8.4% cases were incest and 5.6% werepsychologically/emotionally ebused such as usa of abusiwlanguaga, shouting inwctiws and insults, infidelity, neglect!abandonment, lAces and immoml conduct, and absence of affection(Table 9B.5).
9-27

DOMEsne VIOLENCE IN THE PROVINCE OF AKLAN
Causes of Domestic Violence
Emotional/psychological/marital differences (18.3%) andeconomic/powrty (14.1%) were reported the common causes of1.10lence. Other causes include altitude/behal.1or/personalitydifferences/del.1ant social behal.1or (7.0%). and IAcas/gambling/drug addiction/alcoholism/sexual del.1ance (5.6%). The leastreported causes of 1.10lence were unemploymenUwor1<-related(2.8%) and religion/ideological differences/ cultural and ethnicdifferences (1.4%).
Assistance Awiled by the Victims of Domestic Violence
All I.1ctims of 1.10lenceawiled of counseling (100.0%). One-third haw availed of temporary shelter (33.8%) and legalassistance/assistance in legal actions and proceedings (22.5%).Others were referred for custody. psychiatric treatmenUpsychological examination. while still others awiled of financial/ .food/clothing! medicalltransportation assistance (Table 98.6).
9-28

DOMEsne VIOLENCE IN THE PROVINCE OF AKLAN
LIST OF TABLESTable
98.1 Profile of the Victims of Domestic Violence98.2 Residence of the Victims by Municipality98.3 Profile of the Perpetrators of Domestic Violence98.4 Relationship of the Perpetrators to the Victims98.5 Forms and Causes of Domestic Violence
Suffered Victims98.6 Assistance Availed by the Victims of Domestic
Violence
Page
9-30, 9-31, 9-32, 9.33
, 9.33
, 9.34
"9-29

DOMESTIC VIOLENCE IN THE PROVINCE OF AKLAN
Table 98.1 Profile of the Victims of Domestic ViolenceCategory f % Rank
Age (n=71)54 - 63 1 1.4 544 - 53 5 7 434 - 43 23 32.4 224 - 33 25 35.2 114 -23 17 24 3
Ci.,;1statusSingle 35 49.3 1Married 34 47.9 2Widowed 2 2.8 3
Educational attainmentPrimary (Gr. I-IV) 6 8.5 4Intennediate (Gr. V-VI) 14 19.7 2Secondary 32 45.1 1Tertiary 13 18.3 3No filnnal schooling 1 1.4 6No response 5 7 5
OccupationOut-of-school 13 18.3 1Manual labor 8 11.2 2Housekeeper 7 9.9 3.Sell-employed 5 7 4Business/trade 1 1.4 5.5Student 1 1.4 5.5None 6 8.5 7No response 30 42.3
9-30

DOMESTIC VIOLENCE IN THE PROVINCE OF AKLAN
Table 98.2 Residence of the Vlctlma bv MunlclpalltvMunicipalitY f %
(n=71)Kalibo 28 39.4Numancia 10 14.1Malinao 8 11.3Nabas 5 7Banga 4 5.6Malay 3 4.2Madalag 3 4.2Ibajay 2 2.8Balete 2 2.8New Washinglon 2 2.8Makalo 1 1.4Ubacao 1 1.4Balan 1 1.4Allaws 1 1.4Lezo 0 0Tangalan 0 0Buruanga 0 0
9-31.

DOMESTIC VIOLENCE IN 1liE PROVINCE OF AKLAN
Table 98.3 Profile of the Perpetrators of Domestic Violence
Category f % RankAge (n=71)59 - 66 1 1.4 651 - 58 4 5.6 543 - 50 5 7 435 - 42 11 15.5 1.527 - 34 11 15.5 1.519 - 26 8 11.3 3
No response 31 43.7SexMale 68 95.8 1Female 3 4.2 2
Ci'lil statusSingle 18 25.4 2Married 40 56.3 1No response 13 18.3
Educational attainmentPrimary (Gr. ~N) 3 4.2 2.5Intermediate (Gr. V-VI) 2 2.8 4Secondary 8 11.3 1Tertiary 3 4.2 2.5No response 55 77.5
OccupationManual labor 9 12.8 1Self-employed 4 5.6 2Gowmment employee 2 2.8 3Private employee 1 1.4 5.5Teaching/Education 1 1.4 5.5Military/PNP 1 1.4 5.5Farming/Agriculture 1 1.4 5.5None 3 4.2No response 49 69
9-32

DOMESTIC VIOLENCE IN THE PROVINCE OF AKLAN
Table 9a4 Relationship of the Perpetrators to the VictimsRelationship f % Rank
(n-71)Marriege 30 42.3 1Common-law spouse 26 33.6 2Consanguinity (father, mother,sister, ascendanUdescendanl) 11 15.5 3
Household companion 2 2.8 4
Employer 1 1.4 5.5Affinity 1 1.4 5.5
Table 98.5 Fonns and Causes of Domestic Violence Suffered bythe VlctlmsCat8!lOlY f %
(n=71)Fonns of Domestic ViolencePhysical abuse (battering, slapping, kicking,hilling, punching, deprillltion of food, sleep andbasic needs) 61 66
Incest 6 6.4
Psychological/emotional abuse (use of abusiwlanguage, shouting inwctiles & insults,neglecUabendonment, engegement in licesconduct, absence of affection) 4 5.6
Causes of Domestic Violence
Emotional/psychological/marital differences 13 18.3Economiclpowrty 10 14.1Atlitudelbehalior/parsonalily diflerences/delianl 5. 7Vice/gambling/drug addiction/alcoholism/sexual deliance 4 5.6Unemploymantlwork-related 2 2.8Religionlideological differences/cultural & ethnic 1 1.4
differences
.9-33

DOMESTIC VIOLENCE IN lHE PROVINCE OF AKLAN
Table 96.6 Asslslance Availed by the Vletlms of Domestic VlolenctAssistance f %
(n=71)CounselingTemporBIY shelterLegal assistance/legal actions & proceedingsReferral for custodyPsychiatric treatmenUpsychological examination
and ewluationFinanciaUbodiclothing assistanceReferral for medicationTransportation assistanceMedical assistance
9.34
7124167
76433
10033.822.59.9
9.98.55.64.24.2

DOMESTIC VIOLENCE IN THE PROVINCE OF AKLAN
CONCLUSION
In the light of the findings, the following conclusions are drawn:
1. The oldest .,;ctlm of domestic .,;olence is 64 and the youngest, 14years. MaJOlity of them is within the ages of 24-43 years, eithersingle or manted, and has common-law relationships with theperpetrators. Most are high school-educated, out-of-school,engaging in manual labor or Jobless at all. Of the 17 municipalities,reported incidence of domestic .,;olence was highest In Kalibo (capitaltown), Numancia and Malinao. No incidence was reported in Lezo,Tangalan and Buruanga.
2. The oldest perpetrator of domestic .,;olence Is 65 and the youngestis 19 yen. Most perpetrators are within the age range of 27-42years. Except for three who are women, almost all perpetrators aremarried men., high school-educated and doing manual labor. Flw,however, are employed in gowmment and private firms. Perpetratorsare related to the IActims mostly by mantage.
3. Physical abuse ranks first among the categories of domestic.,;olence, followed by incest, and psychological/emotional abuse.Physical abuse ranges from battering, slapping, kicking, pushing,hitting, punching, and depriwtlon from food, sleep and other basicneeds, In that order. Psychological/emotional abuse Includesabusiw language, shouting inwctlws and Insults, inldelity,neglecVabandonment, .,;ces and Immoral conduct, and absence ofaffection, In that order.
4. Emotional/psychological/marital dillerencas and economic crisis/po\oertyare the prewlent causes of domestic .,;olence. Other causesinclude attitudelbeha.,;or/personality, .,;ces/gambling/drug addiction!alcoholism/sexual de.,;ance, unemploymenVwork-related, andreligionlideological/cultural/ethnic ditrerences.. .
All .,;ctims of .,;olence haw availed of counseling fi'om the DSWDAklan Extension Office, the Daengpan it mga Kababayenhan saAklan, and the PNP Aklan ProlAnclal Command's Women's Desk.Other saNces awiled include temporary shelter, legalassistance/legal actions and proceedings, relenral of custody,psychiatric treatmenVpsychological evaluation, financial assistance,medical assistance, and foodIclothingitransportalion assistance.
9-35

DOMESTIC VIOLENCE IN THE PROVINCE OF AKLAN
RECOMMENDATIONS
Based on the foregoing conclusions, the followingrecommendations are ad\enced:
1. Non-formal education and liwlihood programs for the lesseducated and unemployed llictims of lAolence.
2. Women's Crisis Centers, adequately supported with funds andcompetent personnel, in all municipalities to respond to the needsof abused women and llictims of domestic lliolence.
3. IntensiYelwide scale information campaign on domestic lAolencethrough awareness seminars, symposia and conferences todiscuss the elAls of domestic lliolence to awaken the people on theneed to prewnt occurrences of lliolence against women.
4. PNP Aklan ProlAncial Command's Women's Desk to makecomprehensiw and thorough inwsligation of cases and improwtheir profile gathering procedures of cases of domestic lAolence.
5. DSWD Aklan Extension Office and Daengpan it mgaKababayenhan sa Aklan also to improw their profile data gatheringprocedures and PSWDO to establish databank on case histories ofboth the IActims and perpetrators of domestic lAolence in ewrymunicipality.
6. Adequate legal and psychological assistance on the duration ofany cilAl and/or criminal action pending in Court arising from theacts of lAolence committed.
7. Counseling and post-trauma psychological assistance to theIActims and counseling and psychological ellSluation of perpetratorsto ascel1ain their competence to liw a normal and non-lAolentlife.
9.36

DOMESTIC VIOLENCE IN THE PROVINCE OF AKLAN
REFERENCES
Bureau of Women's Welfare. 1994. PsychosocialInterwntions lor Women in Especially Difficult Circumstances.Batasan Complex, Constitution Hills, Quezon City.
Guererro, S. 1999. Breaking the Silence: The Realities ofFamily Violence in the Philippines Recommendations lorChange. UP Center for Women Studies, Diliman, Quezon C~y.
Guererro, S. 1999. The Meny Faces of Violence (Abuser andAbusillll Relationship in the Filipino Families). UP Center lorWomen Studies, Diliman, Quezon City.
Lujan, N. 2000. Domestic Violence More Likely in BiggerFamilies: Case Study in HoiloCity. Philippine Daily Inquirer.
Lujan, N. 2000. Study Urges Hotline fOr Men in DomesticViolence, Iloilo City Domestic. Philippine Daily Inquirer.
Riwra, R. 1997. Action Against VAW (The Arugaan ngKalakasan Experience). Action Research Publications. Diliman,Quezon City.
Warrior, J. Undated. Prellllnting Family Violence: A Manualfor Action.
9-37

DOMESTIC VIOLENCE IN lHE PROVINCE OF AKLAN
ABOUT THE AUTHORS
Ms. Rovi Christine E. Villarosa-Gonzales is a Master in RuralDewlopment (MRD) graduate student at Aklan State Uniwrsity,Banga, Aklan. She is President of the MRD Student Organization,2003-2004. She works as Project Evaluation Officer (PEO) II of theDSWD Field Office VI. She graduated from the Uniwrsity of thePhilippines in the Visayas in 1999 with a degree of Bachelor ofScience in Management.
Dr. Celedonia R. Hilario is Associate Professor I and currently,the Officer-in-Charge of the School of Arts and Sciences (SAS) ofAklan State Uniwrsity, Banga, Aklan. She is a graduate of Doctor ofPhilosophy (Ph.D.) in Educational Management from Aklan StateCollege of Agriculture; Master of Arts in Education (M.A.Ed.) inAdministration and Supervision from Aklan College; and Bachelor ofArts (A.B.) in Political Science from Uniwrsity of the East. She isan accredited VOW trainer of the Civil Service Commission. Prior toher designation as Ole-SAS, she was School Secretary of the SASand Coordinator of the General Education Program. Her article on"Moises llicito: General del Castillo's Nemesis," was published bythe Center for West Visayan Studies in the CWVS MonographSeries "Palayag."
9-38

LEISURE TIME ALLOCATION AMONG WOMEN:SOME EVIDENCE IN ILOILO CIlY, PHILIPPINES
METHODOLOGY
Using a statistical formula for sample size detennlnatlon.three hundl'8d eighty two (382) women respondents wereinterviewed In this study; 215 were wor1llngin private finns; 86were connected with the government agencies end 81 wereordinary householders. Selection utilizes geogl1lphlcal partitiontechnique di\lding the city by plaza- Jaro. Lapaz, Molo,Mandurriaoand Plaza Llbertad. Along Jare Plaza and Mandurriaowere seventy-seven (77) women residents inter.<iewed andsewnty-slx (78) from Molo. Lapaz and Plaza L1berted.The choiceon who to interview depended on the willingness of the subject toparticipate and the bias of the study toward the exclusion of apossible subject reveeled to be extremely wea"hy. Index ofwealth sarved as the dlscriminallng indicator. The mathod ofselection did not follow any pattem.
The study took place between July 2002 and February 2003.
9-39
lEISURE TIME AllOCATION AMONG WOMEN:SOME EViDENCE IN ILOilO CllY, PHILIPPINES
FINDINGS
Employment and Wages
The tolal number 01 women respondents comprises 78. 79~woridng (301) and 21.204% (81) householders. Among the 78.79% ilwork, a Intle more than 50% (56.5827%) obtained employment in til<priwte sector. About eighty six percent (88.1257%) are racailAn!incomes of not higher than Pl0, 000.00 a month. Almost three fourth,(74.8891%) haw families to support. Table 1 shows the ~tails.
As described in tha monthly income classification, it is show1that incomes of some 88% of women workers com.erge taMIrd lowemiddle class income lewl and lower class income lewl, despite theiopen participation in the labor market. The proliferating womelinl.Olwment in the labor force should signify increased productilA~rates across sectors, Implying robustness In economic. actnAtysuggesting more complex job segmentation and specializalion, aOtexpecting all incomes to ewntuaUy rise oloer time. This fal.Orablooutcome hoWe'.er, did not take Into p1aca.
The common argument on low wages is the O\eI'Supplyof labcsaluratlng the marketlAs-a-lAs the demand for II and the almost peffecsubstitutability of men and women in l8rious female dominated )01openings. Jobs relaled to salas tlilding, sales networking, teeching
•banking, office work and marketing that are Prel40usly ,swarmed b:women are now filled up with male competitors, while job demand ;1marine engineering and seafaring, construction and mining, is sticlosed to women participants.
Aside from eaming nol enough, a number of them haw famille.to support. Almost 75% haw children to altend. Although the stud:did not include family size and tolal family income resources aconsiderations, the rrm information can slightly support the hypothesi,that owrtime, assuming a growing family to care of, giwn a sticky fa.income to depend upon and a constant family
940.

lEISURE llME AllOCA 1l0N AMONG WOMEN:SOME EVIDENCE IN ILOilO CI1Y. PHILIPPINES
earnings to rely on. these women respondents will certainly hawvery limited time for leisura. The ofl8hoot might be to WOI1< outsidethe country for a higher pay but auch altematlw had proven tocause family misery - e consequence. a number though have hadopted to deal with anyway.
leisure/labor time allocation and the backward bending auoply
Data rewaled that women in Iloilo City wor\( 13-15 hours aday during the weekdaya and weekend! and relax for only an hourto three hours a day for the lame period. This Includes houleholdtaske, chlldcare, family responsibility and wor\( related duties. Notby choice that thase women spend the entire waking time solely forworlI, circumstances pressed them to.
The allocation did not vary Ilgnlficantly despite adjultmentsIn age and cllAl status. The difference only came out quite evidentlywhen labor and leisure time allocatlona were organized In terms ofincome rangas. Hlgh-income women heve Increasingly had enoughlime for leisure (3 hours during the weekdaya end 4 hours duringthe weekends) while the low-lncome women barely have any freelime.
Notwithstanding the obvioul reduction In the number ofhours wor\(ed by women in the upper income class, confirming theaxlstence of the backward bending supply curve of labor Is stilipremature. Subltltutlon effect remalnl pOlitlw al expected and notrade off between wor!( and leisure In the upper Income clasaoccurred. Hours spent for wor!( had ramained constant as Incomeriael and leisure demand had risen as well simultaneously: Whatexplains this exactly Is the willingness of women to sacrifice hour.sleep In exchange for an additional hour of leisure. Thus, as leisurelime IncreaSeS, women instead, extracted tha additional time fromhouroeleep. This Information leads to suppose two things: thatpoorer women in Iloilo City hardly have enough time for leisure andthose women earning higher incomes berely have enough time forsleep.
..

LEISURE llME ALLOCAllON AMONG WOMEN:SOME EVIDENCE IN ILOILO CliY, PHILIPPINES
Differences in leisure ecti'olties, Americen women and ~ !!llloiloCity participated in
What are the ectl\1lles, women in Iloilo City consider 'leisure'?How do these characteristically differ from those being enjoyed byAmerican women? Tables 2 and 3 show essential details.
One 1mportent fact one cen percei..e in the list abo..e is thesimplicity of the actilAties, women in Iloilo do. Regardless of anycircumstances, leisure they take, are those that cen be done withinthe 'olclnily of the household and work and those without much cost.Leisure Is in the form of laking snacks, beauty resting, talking withfriends, watching lV shows, window shopping, playing mahjong anddining out with friends- actilAties that are typically beslc to existenceand inexpensi..e to the purse. In addition, doing these, do not reallytake them far from work and thus they just must take ed'o6ntageinbreak time and recreation period.
Another key information about what women do with their freetime is the \/Blue they put to physical beauly. No matter what theIncome le..el, marital status, age and employment circumstancesmaybe, women across classlficetlons, ra\e8Jed to \/Blue the mosttheir physical beauty and friends. Dining out with friends and \illtingpenors lOr hair and make up, beauty massage and lpe are someacti1Atiesthat ranked high in the record.
How8'.er, the basic idea of leisure is to realize man's essenceof life, women, of course, not excluded. ~ is to allow ones choice setto expand and widen. The ebil~ to choose \/Brious actl\itles cfleisure to enhance Initial endowments on intelligence, being.existence, freedom, ser.Ace and 10'06for others signify the presenceof self~mpowerment and Personal de..elopment; absence of whichsuggests unspoken pain of lorment and anguish.
942

LEISURE TIME ALLOCATION AMONG WOMEN:SOME EVIDENCE IN ILOILO CITY, PHILIPPINES
In American societies, leisure actl~tles of women Includegoing to theatera, watching musical shows and concerts,exercising in the gym, allendlng In art galleries, dining inexpensive restaurants and many other else (refar to table 3). tt Isob~ous to detect that these actl\ltlas provtde chances to self.Improvement and charecter development otthe Indlvtdual. tt alsoseems to appear that these donot simply serve as gap fillers inbetween worllthst merely operate as a way out alternative.Theseare carefully planned acti\ltles and the benefit Is gained for aprice.
943

lEISURE llME AlLOCAllON AMONG WOMEN:SOME EVIDENCE IN ILOilO CIlY, PHILIPPINES
LIST OF TABLES
Tabla Paga
9C.1 Summary Statiatlc. on SamplaWomen Respondents, Iloilo Cny,Philippines: July 2002-Fabruary 2003
9C.2 lelsunl ActhAtlea Re\llllied by WomenRespondents: Iloilo cny, Phllippinas.July 2oo2-February 2003. 944
9C.3 leisure Actl'oilies American Women HB\eVarious Sources, 1997.1998 9-45
9-44

LEISURE TIME ALLOCATION AMONG WOMEN:SOME EVIDENCE IN ILOILO CllY, PHILIPPINES
Tabl. ge.1 Summary Statlltlca on Sampl. WomenRupondenta, 110110 City, Philippines:J I 2OO2-F b 2003ulY e ruarv
Indlcatora No. of RespondentsEmployment
PrI\8te 215GClY8mment 86Households 81
CI\l1StatusSingle 86Married 286Widow 10
Monlhly Incoma ClassificationLower clasa (Php4.000 & below) 107Lower middls cia•• (Php4,001.10,OOO) 222Middle clsll (Php10,001.16,OOO) 38Upper middle ( Php18,OOl- 22,000) 12Upper cia•• (Php22,OOO& o\8r) 3
Table 9C.2 Lelaure Aotlvltl •• Rev •• led by WomanRllpondenta: 110110 City, Philippine.:J I 2002F b 2003UIV • e ruarv
Weekdays Weekends1 taking anacks 1. going oul with friends2 beautifying 2. daling or dining out3 talking with friends 3. window ahopplng4 bllauty relting 4. \isiling.beauty parlora5 reading magezines 5. recreational games (mahjong)e watching TV
9-45

LEISURE liME ALLOCA liON AMONG WOMEN:SOME EVIDENCE IN ILOILO CIlY, PHILIPPINES
Table 9C.3 Lei •• ,.. Actlvltl •• American Women HaveV.rloue Sourcee: 1997.1998
1 mo"'e going2 attending sporting ewnts3 going to amusement parks4 Imol\Ing In exercise programs5 doing home Improwment and rapalr6 heling computer hobbles7 attanding Jazz perfolmences6 attending classical and musical per*lrmances9 lisltlng art museums and historical parks10 raading lilaratura11 attll/lding ballet per*lrmsnces12 attll/lding clesslcal plays13 Jolnlngmodem dancing14 enrolling in drawing end painting15 doing pottery work16 taking photography courses17 ll/lrolling In creatl\e writing16 buying art work19 singing In groups and organizing community choral groups20 attending opera per*lrmancea and musical plays
9-46

LEISURE llME ALLOCAllON AMONG WOMEN:SOME EVIDENCE IN ILOILO CllY, PHILIPPINES
CONCLUSION
Comparing Table 2 and 3, the Implication is a lillieupselling but not hopeless yet. On one hand, It can be said that'Women In Iloilo, not only do they haw wry IIltie time for leisureand In some Instances sleep, but also that their chosen leisureactl~tles allow very lillie opportunity to self.empowerment andimprowment'. On tha other. one can also say that 'women In Iloiloare creatlw enough to experience simple joys In ealing and beingwith friends, pampering oneself in spa and beauty salons,watching 1V and In playing mahJong'.
Maybe these are all one can optimally do given a limitedbudget and yet feeling satisfied. Maybe these are what they alsochooae to do. Maybe the ability to experience simple joys despitepoverty Is a quality exquisite to 110110 women. The study did notdelw Into further details, but one thing Is definite, despite wantingin leisure, women, are not yet at the frontier of complainingagainst their condition. The simple, Inexpenslw manlfestallons ofleisure maybe are the enduring and more fulfilling expressionsone can afford to share at the moment.
9-47
I

I
LEISURE TIME ALLOCATION AMONG WOMEN:SOME EVIDENCE IN ILOILO CITY, PHILIPPINES
About the Author
Grace Edmar Ellzar del Prado finished her AS Economicsfrom the Ateneo de Daveo Univeraity In 1983. Her MA inEconomics was eamed from the Ateneo de Manila in 1999 with acomprahensi\\!l exam rating of "excellant", She earned herrasearch methods lor soclologlca' studies from the Departmant ofSociology, Ateneo de Manila Unlwrslty In 2000 and enrolled InMasters of Statistics as her second degree to complement hereconomics course last 2004 from UP School of Statistics.
Ms. del Prado did the study "Human Development Index ofthe Province of 110110". She has written empirical studies aboutNGO operations, Indigenous people in Iloilo, leisuns allocation ofwomen, and other Institutional nssearches.
948

Women&MenIN WESTERN VISA YAS
I
ANNEXES
I

HISTORICAL DEVELOPMENTS IN THE ADVANCEMENT OFFILIPINO WOMEN IN THE PHILIPPINES
lhe following is a chronological account of significantmechanisms, laws and policies instituted in recognition of the roleof women in nation-building:
1979 - The Philippines is a signatory to the 1979 Comention onthe Elimination of All Forms of Discrimination AgainstWomen.
1982 - The Philippine De-.elopment Plan for Women (PDPW),1982-1992, addresses the need to institute appropriatepolicies, strategies, programsl projects and mechanismsto ensure that women are effecti-.ely mobilized in thede>elcpment process. The PDPW ser,es as thego>emment blueprint for integrating women in thede>elopment process.
1985 - The country was committed to the implementation of the1985 Nairobi FOlWard-Looking Strategies for theAdwncement of Women.
1987- The 1987 Constitution, Art. II, Sec. 14 explicitly stipulatesthe fundamental equality between women and men to wit:"The state recognizes the role of oomen in nation-buildingand shall ensure the fundamental equality before the lawof oomen and men. •
The 1987 Constitution recognizes women's maternal andeconomic role (Art. XIII, Sec. 14), and Women's specialheanh needs (Art. XIII, Sec. 11), and allows Filipino womento be mamed to aliens to retain their citizenship if theychose to do so (Art. IV).
10-1 I

likewise, Executive Order 207 entitled "New Family Codeof the Philippines" was issued to protect the equality 01women and the family such as the pro.,;sion that husbandand wife should have joint management of conjugalproperties,
Moreover, the 1987-1992 Medium Term PhilippineDevelopment Plan (MWDP) had stipulations that genderand development shall be effectively integrated acrosssectors at the national and sub-national planningprocesses,
1989 - Executive Order No. 348 was issued on February 17, 1989directing all govemment agencies to implement theprogram and projects outlined in the PDPW.
Republic Act No. 6725 was enacted on May 12, 1989prohibiting discrimination against women in employment,promotion and training opportunities.
1992 - Republic Act No. 7192, better known as the "Women inDevelopment and Nation-Building Act" was enacted onFebruary 12, 1992, a legislative milestone in the pursuit ofequality among women and men in deloelopment and nationbuilding.
Section 4 of the act directs the National Economic andDevelopment Authority (NEDA) to ensure, with theassistance of NCRFW, that all agencies which affect theparticipation of women in national deloelopment, collect sex-dis aggregated data and include such data in theirprogram/project papers, proposals or strategies.
10-2

1993 - Declaration on the Elimination of Violence Against Women.
1995 -The country committed to the implementation ofthe BeijingDeclaration and Platbrm for Action adopted during theFourth World Conference on Women held in Beijing, China.
Executiw Order No. 273, signed on September 8, 1995approwd and edopted the Philippine Plan for GenderResponsr.e Delo6lopment(PPGD) 1995-2025. The PPGD isa 3O-year perspectiw framework for pursuing full equalityand dewlopmenl for women and men in accordance withRA 7192 and the 1987 Constitution as well es the mainwhicle for implementing in the Philippines the BeijingPlatform br Action.
Ukewise, as a follow-lhrough to RA No. 7192, starling in1995, Section 27 ofthe General Appropriation Act (GAA) ofthe Republic of the Philippines hed pro",ded thal "Alldepartments, bureaus, oflicea and agencies shall set asidean amount to be used br gender-responsiw projects:
1996 - As a foJlo~hrough to Section 27 of the GAA, an amount of5% of the agency's total appropriation was set for gender-responsr.e projects.
Executiw Order No. 348 which adopted the PDPW in 1989also mandated the creation of Gender and Dewlopment(GAD) focal points within an agency, a sector or a locality.The focal points are tasked to catalyze, coordinate, pro..;dedirection to, and serw as technical ed..;ser on gender anddeYelopment efforts.
IlI-.J
I

1997 - Republic Act No. 8353, or the Anti-Rape Law, was enactedon September 30, 1997 expanding the definition of thecrime of rape and reclassifies it as a crime agains personinstead of a crime against chastity, To ensure smoothimplementation of gender-responsiw projects and programsin the country, three gowrnment agencies are mandated todeal specifically with the women's Issues. These are thefollowing:
a) National Commission on the Role of Filipino Women(NCRFW). tt is the recognized national machinery onwomen and is an ad\isory body to the President and thecabinet in fonnulating policies and programs on womenand dewlopment;
b) Bureau of Women and Young workers (BWYW) of theDepartment of Labor and Employment (DOLE). Thisagency fonnulates policies and promLlgates orders, rulesand regulations implementing the prolisions of the LaborCode affecting women and minors; and
c) Bureau of Women's Welfare (BWW) of the Department ofSocial Wetmre and Dewlopment (DSWD). • promoteswomen's welfare with specific attention to the prewntionor eradication of exploitation of women in any fonn suchas, but not limited to prostitution and iIIagal recruitment,as well as the promotion of skills for employment.

TECHt-lICAL NOn"S
Agrarian Reform Beneficiaries - refer to indi\idual beneficiariesunder PO 27 and RA 6657, or their cooperati,", association,or federation duly registered with the Securities andExchange Commission (SEC) or the Cooperali,",De,",lopment Authority (COA).
Agrarian Reform Communities - is composed of cluster of landreformed barangays in a municipality where there is acritical mass of farmers and farm workers awa~ing the fullimplementation of agrarian reform.
Birth, Live - refers to the complete expulsion or extraction of aproduct of conception from its mother, irrespecti,", of theduration of pregnancy, which after such separation,breathes or shows any other e\idence of life, such asbeating of the heart, pulsation of the umbilical cord, ordefinite mo,",ment of voluntary muscles, whether or notthe umbilical cord has been cut off or the placenta is stillattached; each product of such birth is considered ali,""
Crime - an act in \iolalion of penal law (Refer to the Re\ised PenalCode, Act No. 3815, amended) For statistical purposes,only crimes reported to authorities are co,",red.
Class of Worker - the relationship of the worker to the establishmentwere he works. Equiwlent to "industrial status" in othercountries. They are categorized as follows: (1) Wage andSalary Workers - class of worker who (a) worked for privatehousehold - a person working in priwte household for pay,in cash or in kind (domestic helper, household cook,gardener, family driver, etc.); (b) worked for privateestablishment - a person working in a priwte establishmentfor pay, in cash or in kind. This class includes not onlypersons working for a priwte industry but also thoseworking for a religious group (priest, acolyte), missionary(nuns sisters, etc.), unions and non-profit organizations,
10-5 I

I
This category includes the following types of workers: (b.llpersons working in public works projects on pri",te contracts;(b.2) public transport drivers who do not own the vehicle but dri-ethem on boundary basis; (b.3) dock hands or ste-edores; (b.4)cargo handlers in railroad stations or piers; and (b.5) palayhaMster getting fixed share of haMsted palay; and (c) workedfor go-emmentl
govemment corporation - a person working for thegovernment or a government corporation or any of its'instrumentalities. This category of workers includes the followingworkers: (c.l) Filipinos working in embassies, legation,chancelleries or consulates of foreign go-ernment in thePhilippines; (c.2) Filipinos working in intemational organizations ofSovereign States of Go-ernments like the United Nations WorldHealth Organization and others; and (c.3l Chaplains in the ArmedForces of the Philippines; (2) Own-Account Worker - class ofworker who is either. (a) self-employed with out any employee - aperson working for profit or fee in own business, farm, professionor trade without any paid employees as defined in category (b)below. This include workers who work purely on commissionbasis and who may not have regular working hours; (b)employer in own farm or business - a person working in his ownbusiness, farm, profession or trade who had one or more regularpaid employees, including paid family members; (cl worked withpay on Own family-operated farm or business - a person workingin his own family-operated farm or business and recei-es cash ora fixed share of the produce as payment for his senices; (3)Unpaid family worker - those who worked without pay on ownfamily operated farm or business operated by another memberli.,;ng in the same household. The room and board and any cashallowance gi-en as incenti-es are not counted as compensationfor these family workers.
10-6

Employed. per,;ons in the labor !cree who were reported either atwar!< or with a job business allhough not at war\(: (a) Atwor1<• those who did some wor1<,ewn for one hour duringthe refl>rence period; (b) with a job or business but not atwor!<• those who haw a job or business alen though not atwar!( during the reference period because of temporaryillness/injury, vacation or other lellloe of absence, badweather condition or slrike/labor dispute or other reasons.Likewise persons who are expected to report for wor!< or to. start operation of a farm or business enterprise within twoweeks from the date of the enumarator's \is it are consideredemployed.
Employment Rate. the proportion of total number of employedpersons 10the total number of persons in the labor force.
Fertility Rata, Total. refers to the awrage number of births awoman would hale by the end of her productile years nfertility lelels of each age during her child-bearing period (1549 ysars) remain constant at the lalels prel/8i1ingat a giwntime.
Hlghast Educational Attainment or Highest Grade Completad •refers to lhe highest grade or year completed in schoo/,college or uniwrsity, by person 5 years of age and owr.
Hou98hold • a social unh consisting of a person Ii\<ngalone or agroup of persons who: (a) sleep in the same housing unit:and (b) haw a common arrangement lor the preparation andconsumption of food.
Hou98hold Population. the aggregate of prilete householdpopulation. Compared to total population, this excludespopulation enumerated in institutional households such asnational/pro'oinciaVmunicipaVcity jails/detention centers,military camps, tuberculosis pa'lilions, mental hospitals,leprosaria/leper colonies or drug rehabilitation centers.
10-7

Industry. the nature or character of the business or enterprise orthe place wherein a person worns.
Labor Force, (Parsons In tha) - the population 15 years old and O'Alr
who contribute to the production of goods and saMcas in thecounlly. • includes those who an! either employed orunemployed. Those who are neither employed or unemployedare considered not in the labor force, e.g. persons who are notWOl1tlngand are not awilable for y,IOr1Iduring the referenceweek end persons who are not awilable and are not lookingfor worll because of reasons olher than those pre~ouslymentioned. Examples are housewiws, students, disabled orretired persons and seasonal worllers.
Labor Force Participation Rate • proportion of the total number ofpersons in the labor force to the total population 15 years oldand 0_.
L1ta Expectancy - an estimate of the a\lll18ge number of additionalyears a person can expect to liw, based on the age-specificdeath rates for a glwn year.
Literacy - the ability to read and write a simple message.
Literacy Rate • the percentage of population which can read and writea simple message in any language or dialect.
Literacy, Functlonal • a significantly higher lewl of literacy which
includes not only reading and writing skills but also numeracyskills. The skills must be Sufficiently advanced to enable theindMdual to participate fully and e1ficiently in actiloitiescommonly occurring in his life situation that require areaso~b1e capability of communication by.writing language.

Literacy, Simple - ability of a person to read and write withunderstanding a simple message in any language or dielect.The simple literacy status of an individual can be detenninedbased on the respondent's answer to the question "Can __read and write with a simple message in any language ordialect?".
Marltel Status - refers to the chil status of all persons 10 yearsand owr. A person in this age group is classified as: (a)Single - a person who has newr been married; (b) Married -a person married in a religious or civil ceremony, either livingtogether with the spouse at the time of lis it, or temporarilyliling apart because the spouse is employed elsewhere or isin the Anned Forces, etc.: (c) Widowed - a married personwhose spouse died and who has not remarries up to thetime of lisit; (d) SeparatedlDi'o<lrced - a person who haspermanently separated from his spouse, legally or thrumutual consent or whose merriage with another has beenannulled or dissolloed and can therefore remany; (e) Others -a person living consensually together (by mere consent) ashusband and wife without the benefit of a legal marriage; or(I) Unknown - a person whose marital status is not known tothe respondent, or whose marital status is being concealedby the respondent, or whose marital status is beingconcealed by the respondent.
Occupation - the specific kind of wor1l a person does. ~ a personhas a job but not at wor1l, it is the kind of wor1l he will bedoing when he reports for wor1l, or will be doing if he is waitingfor a new job to begin within two weeks from the date ofinteMew.
Population - cowrs both nationals and aliens, natiw and foreign-bom persons, intemees, refugees and any other groupphysically present within the' borders of a country at aspecified time. In assembling national demographic statisticsfor publication, the basic aim has been to obtain data for thephysically present (or de facto) population rather than for thelegally established resident (or de jure) inhabitants.
10-9

Population Projection - arithmetical procedure designed to yieldthe future size and structure of an initial population byapplying assumptions about future changes In growthrates and/or their components. By extension, rewrseprojections into the past can sometimes be made.
Population Pyramid - diagram depicting the age-sex structure ofa gilen population.
Phylllcal VIolence -the infliction of physical injuries as defined byArts. 262 to 266 of the Re\jsed Penal Code. May be asingle, manual act or a series of different acts, or acombination of assaults with the use of weapons. Womenhale been hit with a fist, slapped, poked in the eyes,strangled, kicked in other parts of the body including thebelly especially during pregnancy, showd to the floor,pushed down the stairs, banged by the head against thewall, hard objects at, poured boiling water Oler; stabbedwith a knife or bumed flesh with cigarettes, hit with a buttof a gun, shot at.
School-Age Population - the population between the ages ofsewn and twenty-four, inclusiw, lnespectlw of theexisting requirements of compulsory education or theperiod of education prollided for in lerious types of
Sexual Abuse - demanding sex regardless of her condition; forcingher to perform unacceptable sex acts; forcing her to dancenude before him; iJrcing him to watch pornographic llideoshows or to see pomographic materials catching himha'oing sex with another women in their own bedroom;forcing wife and mistress to sleep with him in the same
Sex Ratio - the ratio between males and females in a populationexpre~sed in number of males per 100 females.
Underemployed - employed persons who expressed the desire tohaw additional hours of work in their present job or in anadditional job, or to haw a new job with longer working
10-10

SOURCES
1. National Statistics Office (NSO). 2000 Census of Population;1999Philippine Yearbook; 2001 & 2002 Labor Force Survey;1994Functional Literacy Education and Mass Media Survey;Regional Population Projections based from the 1995 Censusof Population;
2. National Statistical Coordination Board (NSCB). 1995Census-Based National, Regional and Provincial Population ProjectionTechnical Worldng Group on Population Projections; 2002Woman and Men in the Philippines
3. Department of Agrarian Reform, Regional Office VI (OAR).2004 Annual Report
4. Department of Health, Region VI (DOH). 2009 Annual Report
5. Bureau of Agricultural Statistics, (BAS). 2009 Trends inAgricultural Wagas
6. Philippine National Police, Regional Command VI (PNP).2005-2009 Crime Statistics Report; 2009 Abuse Cases ofWomen and Children, monitored by the Regional Womenand Children's Concern Section
7. Department of Social Welfare and Dewlopment (DSWD).2006 Annual Report
8. Land Transportation Office, (LTO). 2010 Annual Raport
9. Department of the Interior & Local Gowmment (DILG)2010 Elected Officials
10. CiIoifSer,;ce Commission, (CSC). Inventory of Governmentpersonnel
11. National Commission on the Role of Filipino Women, (NCRF).1999-2005 Philippine Plen for Gender ResponsiveDevelopment
10-13

NSCB PUBLICATIONS
Regular Publications
Economic and Social Statistics and Indicators (National)
Philippine Statistical YearbookNational Accounts of the Philippines (Quarterly)Economic and Social IndicatorsStatwatch (Monthly)Economic Indicators
'1(. 0 Economic Indicators (Monthly)o Quarterly Economic Indiceso Foreign Directlmestments (Quarterly)o Food Balance Sheet of the Philippines (Annual)o Inventory of Airportso Inventory of Ports
Social Indicatorso Women and Men in the Philippineso Statistical Report on Children and Womeno Report on the Philippine HumanDewlopment Index
o Philippine Powrty Statistics
National Accounts of the Philippines (NAP)
• Quarterly, Semestral and Annual NAP• Gross Regional Domestic Product (Annual)• Gross Regional Domestic Expenditure (Annual)• Input-output Accounts
Sub-national Statistics
The Philippine Countryside in FiguresThe Countryside in Figures: Wesfem VisayesThe Countryside in Figures: GuimarasThe Countryside in Figures: Negros OccidentalThe Countryside in Figures: AntiqueThe Countryside in Figures: CapizThe Countryside in Figures: Aklan
10-14
• Regional Social and Economic Trends (RSET)o RSETl2010o RSETV 2010o RSET VI2010o RSETVI1I2010o RSET 1X2010o RSET XII2010
Southem Mindanao Statistical Yearbook• Women and Men
o Mindanaoo lIocos Regiono Westem Visayas
Facts and Figureso Bicalo Westem Mindanaoo Eastern Visayas in Figures
Serial Publications
• Factsheets• NSCB Statistical Serieso Gateway to Metro Manilao The International Rewnue Allotment
(IRA) as a Sourse of Funds for Local Gowmance
• NSCB Technical Paperso Emironmental Accounting in the Philippineso Powrty Assessment in the Philippineso Rebasing, Unking and Constant Price Estimation of the
National Accounts of the Philippineso Recent Initiatiws of the NSCB in Imprololng01licial Statistics
in the Philippineso Measuring the Contribution of the Informal Sector in the Philippines
Standard Classifications
Philippine Standard Industrial Classification (PSIC) 1994Philippine Standard Commodity Classification (PSCC), Rev.21993Philippine Standard Classification br Education (PSCEd) 1994Philippine Standard Occupational Classification (PSOC) 1993
10-15

d Proceedings of ConwntionsNational Conwnlion on StatisticsAsian Regional Section, Intemational Conferenceon Statistical Computing, 1998
Other NSCB Products and Services
Products
1. Statistical policies and measures to resolw specificissues and pro•••de policy directions in thePhilippine Statistical System.
2. The Philippine Statistical Dewlopment Program (PSDP)to seM as blueprint of priority programs and actillitiesto be undertaken to improw the Philippine StatisticalSystem in the Medium Term.
3. National Accounts and related economic accounls to assessthe economic performance of the country thru the following:National AccountsRegional AccountsInput-output (1-0) AccountsNational Health Accounts
4. Other social and economic indicatorsPowrty statisticsEnllironment statisticsFood balance sheetIndicators on children and women
• Gender and dewlopment statisticsQuarterly economic indicesForeign inwstments
• Leading economic indicatOlSEconomic and social impact analysis indicatorsHuman dewlopment index
10-16

5. Standards and classification systems to prescribe uniform standardsin gO\efl1ment statisticsPhilippine Standard Occupational Classification (PSOC)Philippine Standard Commodity Classification (PSCC)Philippine Standard Industrial Classification (PSIC)Philippine Standard Geographic Code (PSGC)Philippine Standard Classification of Education (PSCED)Philippine Classification of Commodities by Broad EconomicCategories (PCCBEC)Philippine Central Product Classification (PCPC)
6. Statistical publications to disseminate the most relewnt information I
produced by the PSS and to make statistics more accessibleto the public
Services
1. Maintenance of a one-stop statistical information center2. Monitoring of designated statistics3. Coordination of subnational statistical system4. Coordination of inter-agency concems on statistics5. SUMY reliew and clearance6. On-line statistical seNce through the internet (www..nscb.gov.ph)7. SeNcing data requests8. Technical seNces9. Ad'oOCacyfor statistical awareness
National Statistics MonthNational Conwntion on StatisticsNational Statistical Information canter Phase IIGowmment Statistics Accessibility ProgramHosting of intennational conferences in statisticsPhilippine Standard Geographic Code (PSGC)Philippine Standard Classification of Education (PSCED)Philippine Classification of Commodities by Broad EconomicCategories (PCCBEC)Philippine Central Product Classification (PCPC)
10-17

NATIONAL STATISTICAL COORDINATION BOARD
The National Statistical Coordination Board (NSCB) wascreated by 'o4rtueof Executiw Order 121 to seM as the highestpolicy-making and coordinating body on statistical matters in thecountry, It is further stated in the said EO that the Board's decisionsshall be final and executory. ,
Specifically, the powers and functions of the NSCB defined inSection 5 of EO 121, which are the following:
o Promote and maintain an efficient statistical system in thegowmment;
o Formulate policies on all matters relating to gowmmentstatistical operations;
o Approw the Philippine Statistical Dewlopment Program (PSDP);
o Prescribe uniform standards and classification systems ingowmment statistics;
o Recommend executiw and legislatiw measures to enhance thedewlopment and efficiency of the system, including the intemalstructure of statistical agencies;
o Re'04ewbudgetary proposals inwl'04ngstatistical operations andsubmit an integrated budget for the PSS to the Department ofBudget and Management (DBM);
o Re'04ewand clear, prior to release, all funds for statisticaloperations;
o Establish appropriate mechanism for statistical coordination atregional, pro'04ncial,and city lewis;
o Allocate statistical responsibilities among gowmment agenciesby designating the statistics to be collected by them, includingtheir periodicity and content; and,
o Dewlop, prescribe, and maintain appropriate framewor1ts for theimprowment of statistical coordination.
10-18

THE NSCB STAFFAs 01 March 201 1
ROMULO A V1ROLASecretary General
L1NAV. CASTROAssistant Secretary Gene<al
SUBNATIONAL STATISTICS OFFICECANDIDO J. ASTROLOGO
Oractor
BONIFPCIO R. MANUSONStatistical Coordination Officer I
EVELYN A TOLENTINOSupport Staff. Adrrinlstration
REGIONAL DNISION VI (Western Visayas)
NELIDAB. LOSAREQC-HeadiSCO W
MARIACRISTINAD. ARMADAStatistical Coordination Officer I
FELIX O. PROPETII>DOArtist lluatrator lISupport Stall.AdrTinlstraoon
10-19