Foreword from the CEO - MerSETA
40
1 merSETA Foreword from the CEO The merSETA is committed to seeking new and better methods to promote skills development. In order to do this, a deeper understanding of participants in learnership and apprenticeship programmes is necessary: an understanding of their motivations, experiences, mobility and employability in an increasingly complex environment is key to the effective achievement of policy intentions. This is also necessary for the efficient delivery of appropriate strategic interventions to address the supply of - and demand for - skilled labour. For these reasons, the merSETA commissioned an impact study to determine the effectiveness and efficiency of both the learnership and apprenticeship systems within its sector. The research investigated the extent to which merSETA programmes are equipping learners and apprentices to enter or advance through the labour market. The report, “Impact Assessment of Learnerships and Apprenticeships”, was completed in August 2008 and raises challenges - some specific to merSETA - others reflective of the broader SETA environment. The skills shortage remains a priority for all stakeholders as well as the need for an increased focus on the intermediate and higher end of the skills spectrum. Closer relationships between SETAs and FET colleges as well as effectively implementing Recognition of Prior Learning (RPL) are also highlighted. I thank everyone who participated in this study; it is important to take stock of our collective efforts. Our work continues. Dr Raymond Patel CEO
-
Upload
khangminh22 -
Category
Documents
-
view
1 -
download
0
Transcript of Foreword from the CEO - MerSETA

1merSETA
Foreword from the CEO The merSETA is committed to seeking new and better
methods to promote skills development. In order to do
this, a deeper understanding of participants in learnership
and apprenticeship programmes is necessary: an
understanding of their motivations, experiences, mobility
and employability in an increasingly complex environment
is key to the effective achievement of policy intentions. This
is also necessary for the efficient delivery of appropriate
strategic interventions to address the supply of - and
demand for - skilled labour.
For these reasons, the merSETA commissioned an impact
study to determine the effectiveness and efficiency of both
the learnership and apprenticeship systems within its sector.
The research investigated the extent to which merSETA
programmes are equipping learners and apprentices to
enter or advance through the labour market.
The report, “Impact Assessment of Learnerships and
Apprenticeships”, was completed in August 2008 and
raises challenges - some specific to merSETA - others
reflective of the broader SETA environment. The skills
shortage remains a priority for all stakeholders as well
as the need for an increased focus on the intermediate
and higher end of the skills spectrum. Closer relationships
between SETAs and FET colleges as well as effectively
implementing Recognition of Prior Learning (RPL) are also
highlighted.
I thank everyone who participated in this study; it is
important to take stock of our collective efforts. Our work
continues.
Dr Raymond Patel
CEO
2 Impact Assessment Study of Learnerships & Apprenticeships 2008
Table of Contents
Foreword From the Ceo ............................................................................................................................................3
ExECuTivE Summary ...................................................................................................................5
main aChievements oF the learnership and apprentiCeship systems ...............................................................................5
Using this doCUment....................................................................................................................................................9
ChapTEr 1: impaCT aSSESSmEnT of LEarnErShipS and apprEnTiCEShipS ............10
ChapTEr 2: ThE LEarnErShip impaCT STudy .....................................................................14
seCtion 1: a proFile oF the nsds phase ii merseta learnership popUlation ............................................................14
seCtion 2: the learning pathways oF learnership partiCipants in nsds phase ii .....................................................21
ChapTEr 3: ThE apprEnTiCEShip impaCT STudy ...............................................................26
seCtion 1: a proFile oF the merseta apprentiCeship popUlation nsds phases i & ii ................................................26
seCtion 2: pathways and experienCes oF apprentiCeship partiCipants ..........................................................................30
ChapTEr 4: ConCLuSionS and rECommEndaTionS ........................................................37
the merseta learnership impaCt stUdy ...................................................................................................................38
the merseta apprentiCeship impaCt stUdy ...............................................................................................................39
Key Challenges ........................................................................................................................................................40
reCommendations: .....................................................................................................................................................40
ChapTEr 5: organiSaTion & funCTion of mErSETa LEarnErShip &
apprEnTiCEShip programmES ............................................................................................................43
merseta’s CapaCity to implement the learnerships and apprentiCeships system .........................................................50
annExurE ............................................................................................................................................................54
3merSETA
Executive Summary
main achievements of the learnership and apprenticeship systemsThe learnership programme under merSETA has achieved
the following:
The survey results are positive showing that learnerships are working well according to responses from learners and other key stakeholders.
Learnerships form part of government’s intervention to enhance sustainable economic growth while redressing some of the inherited apartheid injustices.
Learnerships provide important opportunities for participants to learn in the workplace, linking theory and practice and thus deepening the skills base of the South African economy.
Learnerships provide key opportunities for unemployed people to gain skills and work experience and improve their employability.
NSDS Phase I: 1 April 2000 to 31 March 2005
NSDS Phase II: 1 April 2005 to 31 March 2010
This report covers merSETA Learnership delivery in NSDS Phase
II from commencement to 31 March 2008.
Featured findings of the learnership programme:
Forty-three per cent of those who were unemployed at registration (18.2 learners) and 67% of 18.1 (employed at the commencement of their learnership) learners were employed after completion or termination of their learnerships. This is a positive finding that reinforces the importance and impact of the learnership system in creating employment for the youth and its contribution to skills development.
Learners can be people that are already employed by their
employers (18.1 learners), or they can be unemployed people
(18.2 learners).
Seventy-four per cent of all the 18.1 and 18.2 learners completed their learnership programmes and only 7% terminated their studies before graduation.Eighty-three per cent of the learners who were employed after graduation or on termination of their learnership said that their employment was related to the learnership they had completed. Again this is positive for the merSETA learnership programme, highlighting the opportunity provided to further build on the learners’ skills and knowledge in their field of employment as it was directly related to the training they received.
In terms of the nature of their employment, 66% were permanently employed, 29% in temporary and contract positions and 4% were casual workers.
Approximately 32% earn a salary between R2 001 to R5 000 per month and 12% earn between R1 001 and R2 000. Only 3% earn less than R1 001 per month and another 3% earn more than R10 000 per month.
Almost all (92%) of those who completed their studies are working in the private sector with only 5% employed in government and 2% self-employed.
NSDS Phase I: 1 April 2000 to 31 March 2005
NSDS Phase II: 1 April 2005 to 31 March 2010
This report covers merSETA Learnership delivery in NSDS Phase
II from commencement to 31 March 2008.
Most of the completed learners were employed within one to 6 months of completion of the learnership programme. Of these, 24% were employed within one month or less, 31% between one and 3 months and another 24% between three and 6 months. This shows a commitment by employers to the learnership programme in making employment opportunities available to the learnership participants while underlining their positive perception of learnerships and their applicability to industry demands.
Almost all the learners who completed or terminated their learnership reported positively about how participation in the learnership impacted on their lives. Ninety-seven per cent indicated that the learnerships had improved their technical skills, their career opportunities and had enhanced their self confidence.
Overall, both employers and learners were satisfied with the organisation and objectives of the learnership system, reflecting well on merSETA and other stakeholders.
Featured findings of the apprenticeship programme:
Almost all (91%) of the Section 28 apprentices passed the trade test and qualified.
More than half of the CBMT enrolments (66%) and Time- based enrolments (57%) were still registered at the time of the survey. Only 8% of the Section 29 enrolments were still registered.
Forty per cent of all Time-based participants and 23% of all CBMT participants completed their apprenticeship and qualified.
A small number of apprenticeship participants terminated their studies before graduation; only 3% of the time-based enrolments, namely 2% of Section 28 and 11% of Competency
4 Impact Assessment Study of Learnerships & Apprenticeships 2008
Based Modular Training (CBMT) enrolments. This is a positive development which illustrates the commitment of both the learners and the system to the programme.
Seventy-six per cent of all CBMT participants who were unemployed on enrolment and gained employment passed the trade test and 97% of the Time-based and Section 28 participants who were unemployed at registration and completed their qualification, gained employment after graduation. This outcome is very positive as it reflects well on the programme.
A small number (1%) of apprenticeship participants were employed at registration and lost their jobs and became unemployed after completing or terminating the apprenticeship.
NSDS Phase I: 1 April 2000 to 31 March 2005
NSDS Phase II: 1 April 2005 to 31 March 2010
Apprenticeship reporting data is drawn from both Phase I and II to
31 March 2008 and includes data registered from 1998.
In terms of the nature of their employment, more than 90% (95% of CBMT apprentices, 94% of Section 28, and 91% of Time-based apprentices) of all participants who qualified had a permanent position with no end date.
Almost half of the participants (48% of CBMT and 42% of Time-based) who qualified reported continued employment at the company at which they did their work-based training, while 35% CBMT and 32% Time-based participants were employed by the same company prior to enrolling for a learnership.
All Section 28 apprentices who were unemployed at registration gained employment, and the total number (34) of Section 28 apprentices who are currently unemployed were employed at registration.
Fifty-one per cent of the Time-based apprentices who are currently unemployed were unemployed at registration and 49% (or 95) apprentices lost their employment.
Almost 75% of the CBMT apprentices who are currently employed were unemployed at registration while only 35 CBMT apprentices lost their employment.
Reasons for losing employment ranged from expiry of the
contract, poor treatment at the workplace to finding a place to study at university.
Almost all the apprentices who completed or terminated their studies reported positively about their apprenticeship experiences. The strongest impact seems to be the improvement of their technical skills, their career opportunities and enhancement of their self-confidence. In-depth interviews with apprentices also revealed this positive outcome.
Administration of learnerships and apprenticeships
The promulgation of the Skills Development Act, 1998 (Act 97 of 1998) introduced the concept of a learnership. The Act proposed that learnerships would incorporate apprenticeship but did not say that apprenticeship would no longer be allowed. This was due to the increasing recognition of the shortage of intermediate (Level 2 and Level 3) vocational skills in the South African labour market. As a result, apprentices continue to be trained under the two routes of the Manpower Training Act of 1981: Section 13 and Section 28.
Despite some concerns about the DoL’s capacity to administer and ensure implementation of the SDA, it has responded positively and has been seen to be quite proactive in taking up the challenge of addressing the shortcomings of the system. The DoL has taken ownership of finding solutions to having a single regulation governing both apprenticeships and learnerships with a number of processes being initiated in this regard.
A number of amendments to the SDA have been drafted to provide clarity about the continuation of the apprenticeship system. There is now an attempt to merge various clauses in the MTA with the SDA and provide sufficient clarity about how the two systems (apprenticeship and learnerships) would co-exist.
Concerns have been raised by many respondents regarding the institutional, legislated mechanisms and processes within which learnerships and apprenticeships are currently organised and function.
Overall, employers were highly satisfied with merSETA’s activities in its attempt to effectively and sufficiently support skills development in the sector
Main challenges still facing the learnership and
apprenticeship systems
The current skills shortage remains challenging for all SETAs
despite the successes noted in the study responses. The
immediate concern is that a large number of the learnerships that
are undertaken are in the lower NQF levels (mainly Levels 1 and 2)
rather than at the intermediary skills level where the highest need
lies. Reasons for this may partly be a result of the government
An apprenticeship is a non unit standard based registered
qualification, which is governed by the sections 13 – 29 of
the Manpower Training Act 56 of 1981. An apprenticeship
comprises the integration of workplace and institutional learning
and culminates in a national qualification through the following
training structures:
Section 28
Competency Based Modular Training
Time-based

5merSETA
drive to meet specific targets among unemployed youth and for
redress of past inequalities as level 1 learnerships are a critical
component in bridging access for those who were previously
denied training. This did not, however, address scarce and critical
skills needs. A balance needs to be achieved between redress
learnerships and skills interventions at the intermediary and higher
end of the skills spectrum; however, this report highlights additional
challenges resulting from the introduction of learnerships, for
example at the higher end of the skills spectrum, which have
proven to be problematic based on the costs involved and other
related problems.
The pipeline for the development of skilled personnel is partly a
responsibility of education and labour and, therefore, it is not the
sole responsibility of SETAs to deliver skills to the economy. The
effectiveness of the education system is critical in achieving this
objective. This not only raises the question of the linkage between
education and labour, and the lack of co-ordination between
the two ministries, but also highlights the fact that a number of
blockages have occurred, some of which are systemic and have
nothing to do with the functioning of merSETA. For example, the
disconnection between industry (and SETAs) and FET colleges is
highly problematic.
An example of this disconnect was illustrated fairly recently when
the DoE took a decision to change the curriculum of FET colleges.
The DoE decided as from January 2007 that the N courses
previously offered by FET colleges in three-month blocks would
be phased out and would be replaced with new one-year National
Vocational Certificate (NVC) courses offered at NQF levels 2, 3 and
4 over three years. The N1 course, for example, is the theoretical
component for an apprenticeship programme and is provided for
in the MTA. The DoE has indicated that it consulted business on
this change, but those interviewed indicated this was not their
experience. It is also believed that the DoL was caught unawares
by the decision to implement the new changes from 2008. While
there is a need to update current FET courses business argues
that transitional arrangements should be put in place or the new
courses phased in to allow those already in the system to complete
their qualifications. A SEIFSA (Steel and Engineering Industries
Federation of South Africa) document states: “It seems problematic
that at a time when shortages of skilled artisans present a key
constraint to growth, the DoE is introducing new and unpiloted one-
year vocational programmes at colleges without proper transitional
arrangements for companies indenturing apprentices…”
The lower incidence of recognition of prior learning and learning
plans is a concern, especially among socially marginalised groups
including women, youth and other identified groups. The DoL and
merSETA must focus in particular on Recognition of Prior Learning
(RPL) and learning plans and ensure equality in compliance across
social groups.

6 Impact Assessment Study of Learnerships & Apprenticeships 2008
using this document
Chapter 1
This Chapter provides the background to the Impact Assessment of Learnerships and Apprenticeships Study, providing a basic history
of skills development and training, including a timeline of relevant policy and Acts as they pertain to merSETA and the mandated role of
merSETA within the broader environment.
Chapter 2
This Chapter provides detailed findings in respect of the Learnership programmes delivered by merSETA in NSDS Phase II. It includes a
thorough profile of the Learner population including demographic details (age, gender and provincial location), movement and motivations
for those within the system and employment levels on completing or terminating their learnerships.
Chapter 3
This Chapter provides detailed findings in respect of the Apprenticeships delivered by merSETA for those apprentices registered in the
period February 2001 to March 2008 focusing on both the external effectiveness of apprenticeships in the sector and provides an in-
depth profile of participants and their experience of the system as delivered by merSETA.
Chapter 4
This Chapter examines the featured findings of the Learnership and Apprenticeship Impact Study; firstly as it pertains to the Learnership
Programmes followed by the Apprenticeship findings. These conclusions are then used to form the basis of recommendations for
change.
Chapter 5
Anchored in case studies and in-depth interviews with stakeholders and merSETA officials this Chapter provides deeper insight into the
practical achievements, challenges and systems as they are currently perceived by stakeholders and role-players.
7merSETA
Chapter 1
Impact Assessment of Learnerships and ApprenticeshipsIntroduction
In 2008 the Manufacturing, Engineering and Related Services
SETA (merSETA) commissioned an Impact Assessment of
Learnerships and Apprenticeships Study to ascertain the efficiency
and effectiveness of the learnership and apprenticeship systems
and to assess their impact on the demand for and supply of skills for
the industry. This was motivated by the need to collect and analyse
critical data regarding the development of a full understanding of the
potential impact of learnerships and apprenticeships on the labour
market. This included the scale, number and career progression
of qualified apprentices and learners as well as the employability of
newly qualified learners exiting at different NQF levels, establishing
what had motivated their choices and movements within the system
and the challenges they experienced throughout that period.
Undertaken by the HSRC the focus of the study is on investigating
ways to make learnerships and apprenticeship programmes
delivered by merSETA more efficient, i.e. the measurement of
the internal workings, organisation, functionality and quality of
learnerships and apprenticeships against legislated mechanisms
and procedures; and more effective through the assessment
of their external impact, namely the extent to which they equip
participants to enter or advance through the formal labour market,
self-employment or further education and training opportunities.
Existing studies across all SETAs were reviewed, interview samples
drawn from both learners and apprentices registered on merSETA
programmes, and engagement with employers, service providers
and merSETA personnel undertaken.
Methodology
The research used both quantitative and qualitative methods
allowing an understanding of both the statistical make-up of the total
learner and apprentice populations, in addition to their perceptions
and personal experiences of the process. The statistical analyses
were based on information provided by merSETA to provide a
true reflection of the shape of the learnership and apprenticeship
systems in terms of NQF levels, trades and qualifications, the
demographic profile of the total learnership and apprenticeship
population. Qualitative, or perception based, data were established
through interviews with representatives from the majority of the
stakeholder groups (learnerships and apprenticeships) at the
levels of provision and policy. Five provinces were visited and a
sample of training providers and employers were interviewed. In-
depth interviews were held with learners within specific pathways
in the low, intermediate and high skills bands.
8 Impact Assessment Study of Learnerships & Apprenticeships 2008
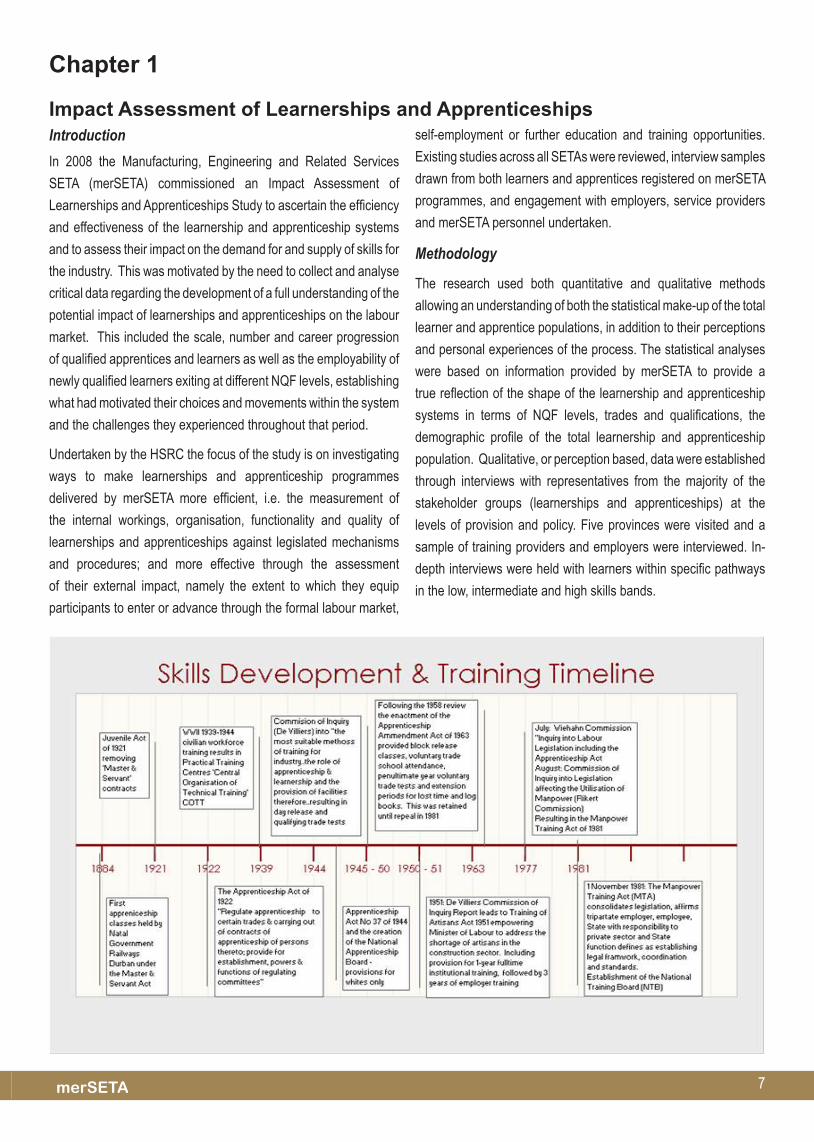
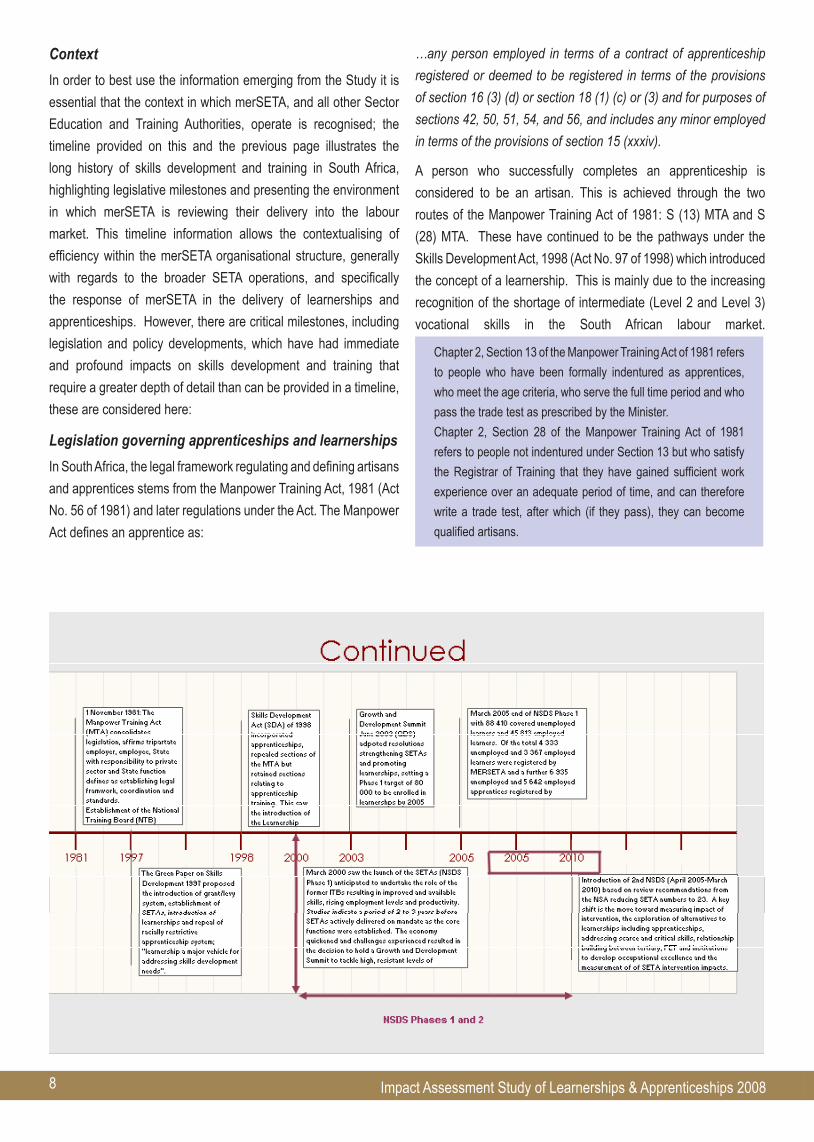
Context
In order to best use the information emerging from the Study it is
essential that the context in which merSETA, and all other Sector
Education and Training Authorities, operate is recognised; the
timeline provided on this and the previous page illustrates the
long history of skills development and training in South Africa,
highlighting legislative milestones and presenting the environment
in which merSETA is reviewing their delivery into the labour
market. This timeline information allows the contextualising of
efficiency within the merSETA organisational structure, generally
with regards to the broader SETA operations, and specifically
the response of merSETA in the delivery of learnerships and
apprenticeships. However, there are critical milestones, including
legislation and policy developments, which have had immediate
and profound impacts on skills development and training that
require a greater depth of detail than can be provided in a timeline,
these are considered here:
Legislation governing apprenticeships and learnerships
In South Africa, the legal framework regulating and defining artisans
and apprentices stems from the Manpower Training Act, 1981 (Act
No. 56 of 1981) and later regulations under the Act. The Manpower
Act defines an apprentice as:
…any person employed in terms of a contract of apprenticeship
registered or deemed to be registered in terms of the provisions
of section 16 (3) (d) or section 18 (1) (c) or (3) and for purposes of
sections 42, 50, 51, 54, and 56, and includes any minor employed
in terms of the provisions of section 15 (xxxiv).
A person who successfully completes an apprenticeship is
considered to be an artisan. This is achieved through the two
routes of the Manpower Training Act of 1981: S (13) MTA and S
(28) MTA. These have continued to be the pathways under the
Skills Development Act, 1998 (Act No. 97 of 1998) which introduced
the concept of a learnership. This is mainly due to the increasing
recognition of the shortage of intermediate (Level 2 and Level 3)
vocational skills in the South African labour market.
Chapter 2, Section 13 of the Manpower Training Act of 1981 refers
to people who have been formally indentured as apprentices,
who meet the age criteria, who serve the full time period and who
pass the trade test as prescribed by the Minister.
Chapter 2, Section 28 of the Manpower Training Act of 1981
refers to people not indentured under Section 13 but who satisfy
the Registrar of Training that they have gained sufficient work
experience over an adequate period of time, and can therefore
write a trade test, after which (if they pass), they can become
qualified artisans.

9merSETA
Challenges arising from the implementation of the Skills
Development Act
The following provides a brief description of the challenges that
have emerged from the system review, the response by the
Department of Labour, and the general recommendations that
are being considered to address and mitigate these issues. These
should be borne in mind when reading the findings of this report.
The role of merSETA in skills development
Established through the Skills Development Act 97 of 1998
merSETA’s mandate includes facilitating skills development to
approximately 500 000 people employed by approximately 32 000
companies spanning the following sub-sectors:
Metals and engineering;
Auto manufacturing;
Motor retail and component manufacturing;
Plastics industries.
The Act requires the development of skills in the South African
workforce in order to:
Improve the quality of life for workers, their prospects of work and labour mobility, productivity in the workplace and the competitiveness of employers and ultimately the delivery of social services;
Promote self-employment;
Increase levels of investment in education and training in the labour market and improve the return on that investment;
Encourage workers to participate in learnership and other training programmes:
Improve employment prospects of PDIs impacted by unfair o
discrimination and redress those disadvantages through
training and education;Encourage employers to:
Use the workplace as an active learning environment;o
Provide employees with opportunities to acquire new skills;o
Provide opportunities for new entrants to the labour market o
to gain experience;
Employ persons who find it difficult to get employment;o
To ensure quality of education and training in and for the workplace;
To assist:
Work seekers find work;o
Retrenched workers re-enter the labour market;o
Employers find quality employees;o
Section 10 of the Skills Development Act of 1999 describes the
functions of merSETA and others as:
Develop a sector skills plan within the framework of the national skills development strategy;
Implement its sector skills plan by:
Establishing learnerships;o
Monitoring the implementation of education and training in o
the sector;Promote learnerships by:
Identifying workplaces for practical work experience;o
Supporting the development of learning materials;o
Improving facilitation of learning;o
Assisting the conclusion of learning agreements;o
Register learnership agreements, including management of apprenticeship training.
Implementation of the Skills Development Act (Act No. 97 of 1998) revealed the following challenges and issues: The SDA is based on a model of co-determination by the social partners (government, labour & business) with SETA performance reflecting the sum total of the partners inputs noting that a lack of implementation
thus reflects the limited resources allocated; this together with the consequence of SETAs becoming an extension of the collective bargaining arena points to critical governance concerns SETAs are not the sole delivery conduit of skills into the economy, the shared responsibility additionally falls to Dept.s of Labour and Education and a failure of linkage between these, the SETAs and industry is
noted, specifically with FET colleges, a lack of stakeholder (business) engagement and transitional arrangements for the phasing in of new coursesA related systemic challenge is the uncertainty around the model and management of quality assurance, noting the disjuncture between education and training has undermined the continuum between vocational-
based and higher education approach with most qualifications having been occupational/workplace based requiring SAQA registration resulting in NQF compliance complicating occupational based learning Until recently learnerships concentrated on low skills levels and scepticism raised in response to artisan-based learnerships resulted noting limited SETA promotion of apprenticeships and an absence of
agreement of learning pathways for artisans and the definition of artisans.
The DoL initiatives in response to the above have been solution driven seeking a single regulation governing both apprenticeships and learnerships. Learning Pathways for Artisans, linked to JIPSA provides a definition of artisan (see below) and four routes for artisans:
- Apprenticeship Route - Internship or Skills Programme Route- Learnership Route - Recognition of Prior Learning Route
DoL engagement with National Treasury has proposed a standardisation of apprenticeship tax incentives be established ensuring they receive the same benefits as apprenticeships
The following definition of artisan is applied: “Artisan will mean a person who has been certified as competent by a relevant ETQA body for a qualification registered on the NQF for a trade listed by the Minister of Labour in the Skills Development Act amended, which trade has been designated at occupational level on the Organising Framework for Occupations and the person is registered with the Registrar for Artisans
as an Artisan for such a Trade (endorsed by the Artisan Development Coordinating Committee on 29 June 2007)
Proposed amendments to the SDA have been drafted to provide clarity around the continuation of the apprenticeship system, including but not limited to: As the apprenticeship system was not repealed by the MTA there is now an attempt to merge various clauses I the MTA with the SDA by introducing a new chapter on apprenticeships
Some amendments are proposed in relation to INDLELAThe introduction of a new clause on internships
The establishment of the Quality Council for Trades and Occupations (QCTO) which is intended as a centralised body which will oversee the quality assurance of trades and occupations thus addressing the lack of uniformity across SETAs in respect of quality assurance standards
Discussions on the QCTO can be interpreted as laying the groundwork for a review of the current training system.
10 Impact Assessment Study of Learnerships & Apprenticeships 2008
Chapter 2The Learnership Impact StudyBefore one can analyse the result of merSETA learnership
programmes and their impact on the labour market it is important
to understand who the ‘typical’ merSETA learner is. To this end
a demographic profile detailing the age, gender, race, disability,
provincial spread, NQF level and distribution by employment status
of merSETA learners who participated, completed or terminated a
learnership programme in the period 1 April 2005 and 31 March
2008, namely NSDS Phase II, noting that this Phase has yet to
complete and will run through to March 2010.
The following information further provides a ‘map’ of the merSETA
learnership experience of those who are currently registered and
undergoing a learnership capturing the reasons why they, and
those who have completed or terminated, enrolled for learnership
programmes, and where appropriate the impact on employment
status, job performance and the personal impact of learnership.
Section 1:
A profile of the NSDS Phase II merSETA learnership population merSETA learnership demographic profile
Enrolment figures by NSDS phase indicate that registration was
higher in the second NSDS Phase even though the time frame at
the point of analysis was only 3 years against 5 years of Phase
I. This indicates an increased acceleration of registration over
time, and the probable improvement and reporting system within
merSETA.
When viewed by year of registration it is apparent that the slow
start following the launch of Phase I in 2001 peaked in 2004 just
prior to the launch of NSDS Phase II at which point registration
decreased by between 7 to 10% until 2007/8.
It must be remembered that a number of learners registered for
more than one learnership and this obviously impacts on the
total learner head count. The information gathered cannot be
broken down to reflect only the NSDS Phase II period analysed
here; however, the merSETA database records a total learnership
population of 21 497 registrations from commencement of the
system to 14 March 2008. However the headcount of individual
learners is 19 056 indicating that 86% of this group registered for
more than one learnership qualification. The three primary reasons
for this are categorised as:
Learner progression in NQF levels, i.e. the same learner sequentially registered for the same learnership but at a higher level
“Learnership hopping” where the learner jumped from one type of learnership to another at the same NQF level
Unsuccessful first time learners registering again on a different commencement date.
Registration by NQF level
Of those registrations into more than one learnership programme
the majority registered for a NQF Level 2, (51%) while one in three
registered on NQF Level 1 and slightly more than 1% registered for
a learnership on the high skills band.
The 8 programmes with the highest registrations are listed here
highlighting the significant enrolment ( 7 143 equating to 1 in 3)
into National Certificate in Manufacturing, Engineering and Related
Activities: NQF Level 1 followed by:
National Certificate in Automotive Component Manufacturing and Assembly: NQF Level 2 (2 159)
National Certificate in servicing vehicles: NQF Level 2 (Passenger, Light delivery) (1 074)
National Certificate in Engineering Fabrication: NQF Level 2 (Boilermaker) (757)
National Certificate in Metal and Engineering Manufacturing Processes: NQF Level 2 (605)
National Certificate in Mechatronics: NQF Level 2 (603)
National Certificate in Automotive Repair & Maintenance (Passenger & Light Delivery): NQF Level 2 (557)
National Certificate in Service Station Operations NQF: Level 2 (502)
Learner profile by race, gender and age
Race
In respect to the equity targets set out in the NSDS merSETA
has exceeded the race target requirement. However, the gender
representation reflects an over-representation of men (75%) but
this is anticipated given the nature of the work undertaken in the
sector. Further analysis by race indicates the proportion of African
learners increases with age as all other groups decrease. While
the bulk of Coloured and Indian learners are younger than 20
years, 70% of White learners are younger than 25 with their African
colleagues recorded at just over 50% in the same age group. An
examination of age by NQF level shows the highest intermediate
11merSETA
skills registration falls into the age groups 31 to 35 and 51 50 55
years of age, high level skills enrolment occurs mainly in the 31 to
40 age group and the majority (94%) of learnership participants
enrol in NQF Levels 1 to 3 (or Low Skills Band
Gender
The proportional gender share is constant through NSDS Phases,
(just over 7 years in the period under review), and it is therefore
reasonable to expect that this will not change unless an active
intervention is made, again stressing that the nature of the work
undertaken in the sector favours males. Similarly the figure for
learners living with disability remains at 1% for the same period
and requires attention to meet the equity targets. At a year-on-year
level the proportion of African learners varied from 80 to 94% of
registration totals, but remained consistently above 80%.
Age
The average age for merSETA learners (mean age) is 27, with
figures indicating that more than half of the learnership participants
are younger than 25 and only 14% are older than 35 years of age.
The general one in four female to male ratio increases with age
until it reaches 1 in 3 in the 41 to 45 years age range.
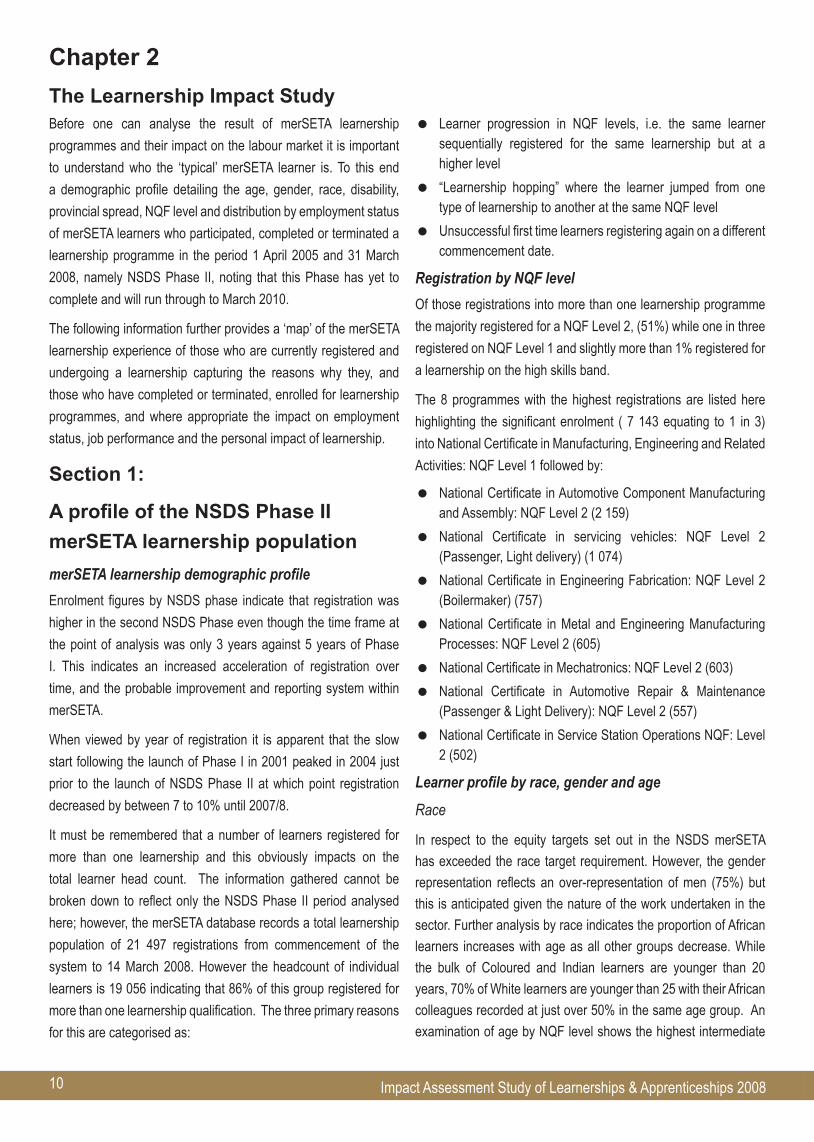
Employment status
Objective 4 of the NSDS Phase II promotes the assistance
of designated groups, including new entrants to participate in
accredited work, integrated learning and work-based programmes
to acquire critical skills to enter the labour market and self-
employment, and this is clearly achieved by merSETA with more
than 62% of those registered being unemployed at the point of
registration. The analysis provides insight into the learnership
population with respect to employment status by gender, age,
race and NQF level with findings reflecting an increase of 18.2
(unemployed) learners by 26% from Phase I to Phase II and a 5%
decline in 18.1 (employed) learners for the same period. [Figure: 1]
NSDS II -
Un-employed
35%
NSDS I - Un-
employed28%
NSDS II - Employed
18%
NSDS I - Employed
19%
figure 1: % share in headcount enrolment by employment status and nSdS phase
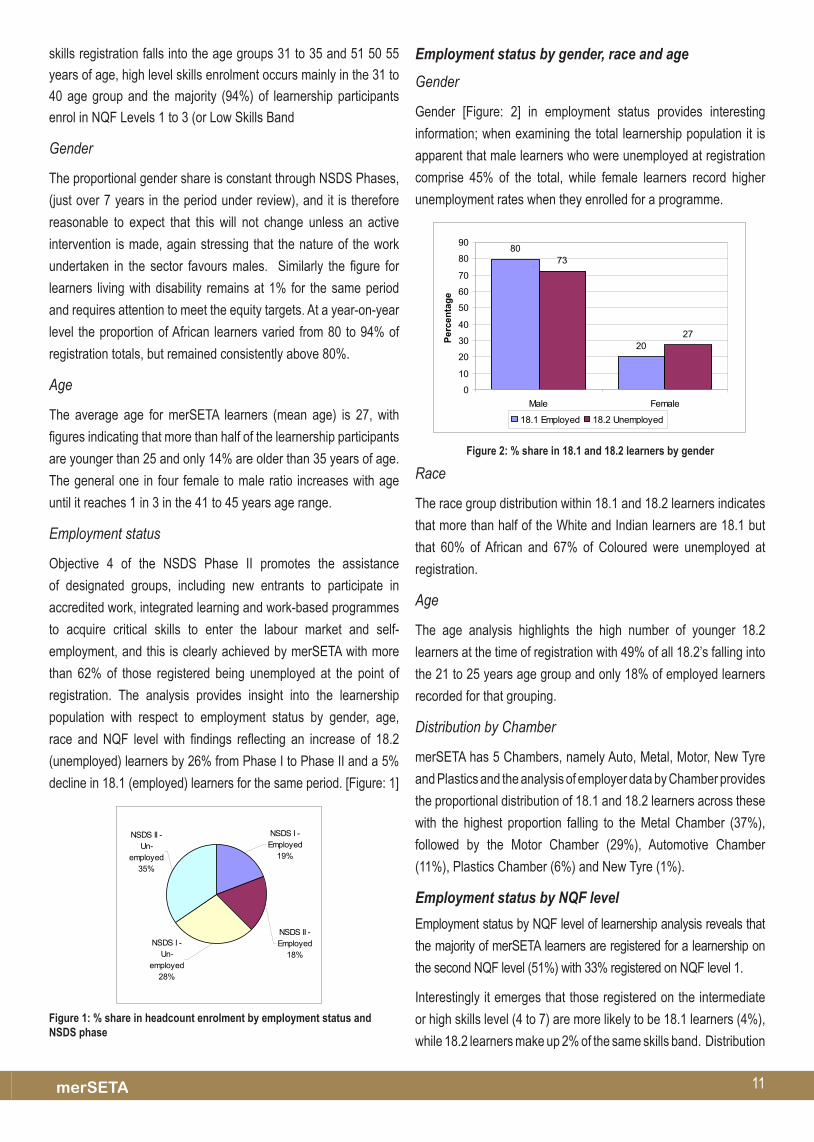
Employment status by gender, race and age
Gender
Gender [Figure: 2] in employment status provides interesting
information; when examining the total learnership population it is
apparent that male learners who were unemployed at registration
comprise 45% of the total, while female learners record higher
unemployment rates when they enrolled for a programme.
80
20
73
27
0
10
20
30
40
50
60
70
80
90
Male Female
Perc
enta
ge
18.1 Employed 18.2 Unemployed
figure 2: % share in 18.1 and 18.2 learners by gender
Race
The race group distribution within 18.1 and 18.2 learners indicates
that more than half of the White and Indian learners are 18.1 but
that 60% of African and 67% of Coloured were unemployed at
registration.
Age
The age analysis highlights the high number of younger 18.2
learners at the time of registration with 49% of all 18.2’s falling into
the 21 to 25 years age group and only 18% of employed learners
recorded for that grouping.
Distribution by Chamber
merSETA has 5 Chambers, namely Auto, Metal, Motor, New Tyre
and Plastics and the analysis of employer data by Chamber provides
the proportional distribution of 18.1 and 18.2 learners across these
with the highest proportion falling to the Metal Chamber (37%),
followed by the Motor Chamber (29%), Automotive Chamber
(11%), Plastics Chamber (6%) and New Tyre (1%).
Employment status by NQF level
Employment status by NQF level of learnership analysis reveals that
the majority of merSETA learners are registered for a learnership on
the second NQF level (51%) with 33% registered on NQF level 1.
Interestingly it emerges that those registered on the intermediate
or high skills level (4 to 7) are more likely to be 18.1 learners (4%),
while 18.2 learners make up 2% of the same skills band. Distribution
12 Impact Assessment Study of Learnerships & Apprenticeships 2008
of employed and unemployed learners within the NQF levels show
that higher levels are populated by 18.1 learners. [Figure: 3]
21
43
61 63
95100 100
79
57
39 37
50 0
0
20
40
60
80
100
120
NQF level1
NQF level2
NQF level3
NQF level4
NQF level5
NQF level6
NQF level7
Pe
rce
nta
ge
18.1 Employed 18.2 Unemployed
figure 3: % share in 18.1 and 18.2 learners within nQf level of learnershipnSdS phase ii
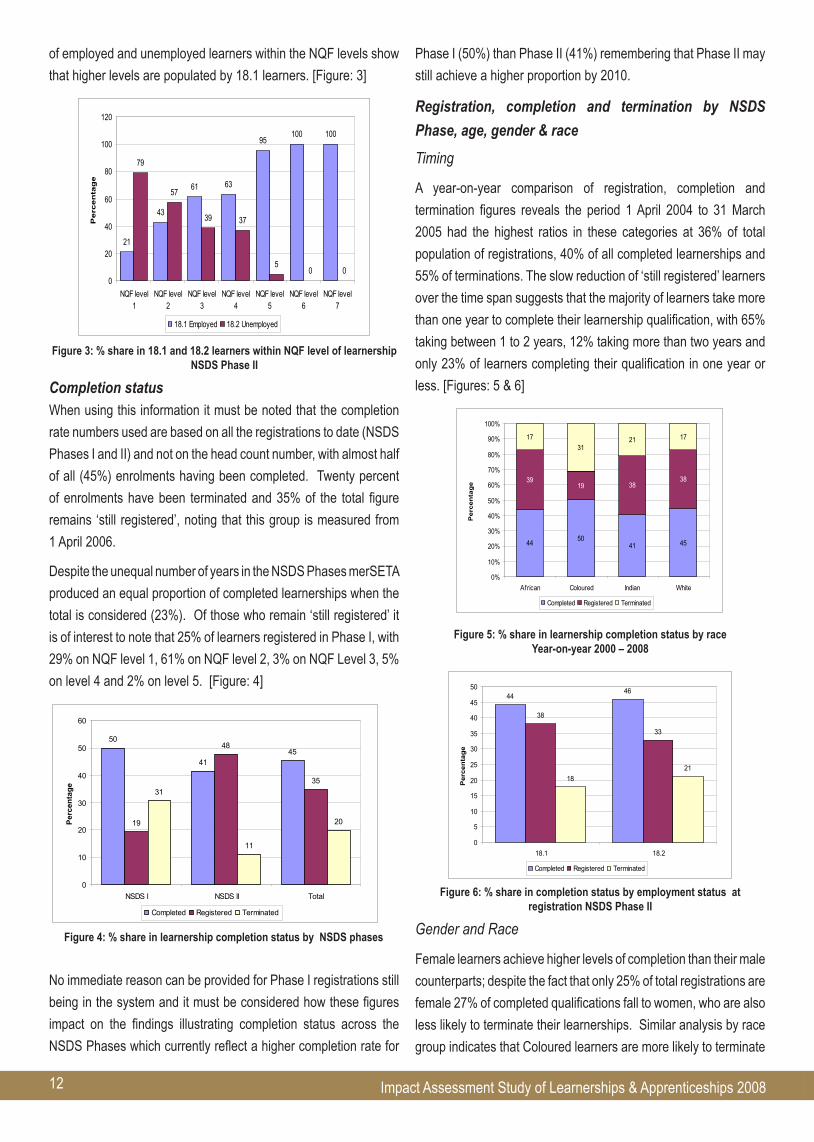
Completion status When using this information it must be noted that the completion
rate numbers used are based on all the registrations to date (NSDS
Phases I and II) and not on the head count number, with almost half
of all (45%) enrolments having been completed. Twenty percent
of enrolments have been terminated and 35% of the total figure
remains ‘still registered’, noting that this group is measured from
1 April 2006.
Despite the unequal number of years in the NSDS Phases merSETA
produced an equal proportion of completed learnerships when the
total is considered (23%). Of those who remain ‘still registered’ it
is of interest to note that 25% of learners registered in Phase I, with
29% on NQF level 1, 61% on NQF level 2, 3% on NQF Level 3, 5%
on level 4 and 2% on level 5. [Figure: 4]
50
4145
19
48
3531
11
20
0
10
20
30
40
50
60
NSDS I NSDS II Total
Perc
enta
ge
Completed Registered Terminated
figure 4: % share in learnership completion status by nSdS phases
No immediate reason can be provided for Phase I registrations still
being in the system and it must be considered how these figures
impact on the findings illustrating completion status across the
NSDS Phases which currently reflect a higher completion rate for
Phase I (50%) than Phase II (41%) remembering that Phase II may
still achieve a higher proportion by 2010.
Registration, completion and termination by NSDS
Phase, age, gender & race
Timing
A year-on-year comparison of registration, completion and
termination figures reveals the period 1 April 2004 to 31 March
2005 had the highest ratios in these categories at 36% of total
population of registrations, 40% of all completed learnerships and
55% of terminations. The slow reduction of ‘still registered’ learners
over the time span suggests that the majority of learners take more
than one year to complete their learnership qualification, with 65%
taking between 1 to 2 years, 12% taking more than two years and
only 23% of learners completing their qualification in one year or
less. [Figures: 5 & 6]
44 5041 45
3919 38
38
1731
21 17
0%
10%
20%
30%
40%
50%
60%
70%
80%
90%
100%
African Coloured Indian White
Per
cen
tag
e
Completed Registered Terminated
figure 5: % share in learnership completion status by race year-on-year 2000 – 2008
4446
38
33
1821
0
5
10
15
20
25
30
35
40
45
50
18.1 18.2
Per
cent
age
Completed Registered Terminated
figure 6: % share in completion status by employment status at registration nSdS phase ii
Gender and Race
Female learners achieve higher levels of completion than their male
counterparts; despite the fact that only 25% of total registrations are
female 27% of completed qualifications fall to women, who are also
less likely to terminate their learnerships. Similar analysis by race
group indicates that Coloured learners are more likely to terminate

13merSETA
but interestingly also have the highest proportional completion rate,
while Indian learners have the lowest completions and the second
highest proportion of terminations with African and White learners
following a similar pattern.
Employment Status
Completion status analyses (18.1 and 18.2 learners) show
that merSETA has successfully completed 45% of learnership
enrolments, only slightly under the NSDS Phase II target of 50%
with time available to meet the target prior to 2010.
Age
The average age of those who complete their studies is 26 years
and those who terminate 27 years. It emerges that 54% of learners
younger than 20 years at registration completed their learnerships,
while completion decreases as learner age increases.
Registration, completion and termination by NQF level
and Chamber
Completion status by Employer Chamber [Figure: 7] reveals that
although the auto manufacturing chamber has the highest proportion
of completions, 55%, only 12% of total enrolments fall into this
chamber; the bulk fall within the metal and engineering chamber
(36%) of which 47% have been completed but this category also
records the highest proportion of terminated learnerships at 28%.
5547 46 43 47
38
2536 42
41
7
2818 14 12
0%
10%
20%
30%
40%
50%
60%
70%
80%
90%
100%
Auto Metal Motor New Tyre Plastics
Perc
enta
ge
Completed Registered Terminated
figure 7: % share in learnership completion status within the employer’s
chamber nSdS phase ii
When considering completion proportions against NQF levels it
appears that completion percentages decrease as the NQF level
increases, NQF 1 have the highest proportion of completions (52%),
followed by Levels 3 and 2. The highest proportion of terminations,
33%, is on NQF level 6 and the lowest on NQF level 3.[Figure: 8]
5243 44
26 32
0 0
1641
51
5955
67
100
3215
515 13
33
0
0%
10%
20%
30%
40%
50%
60%
70%
80%
90%
100%
NQF level1
NQF level2
NQF level3
NQF level4
NQF level5
NQF level6
NQF level7
Perc
enta
ge
Completed Registered Terminated
figure 8: % share in learnership completion status by nQf level of learnership nSdS phase ii
Section 2:The Learning Pathways of Learnership Participants in NSDS Phase IIThe data used to determine the pathways travelled by merSETA
learners is drawn from registrations in the NSDS Phase II period
(April 2005 to March 2008 with conclusion in March 2010), including
those who are still registered and in the process of learnership
programmes. The findings provide an understanding of the
progression patterns and mobility of learners within the delivery
system and are reported against gender, race, age, provincial
distribution, NQF levels and employment status.
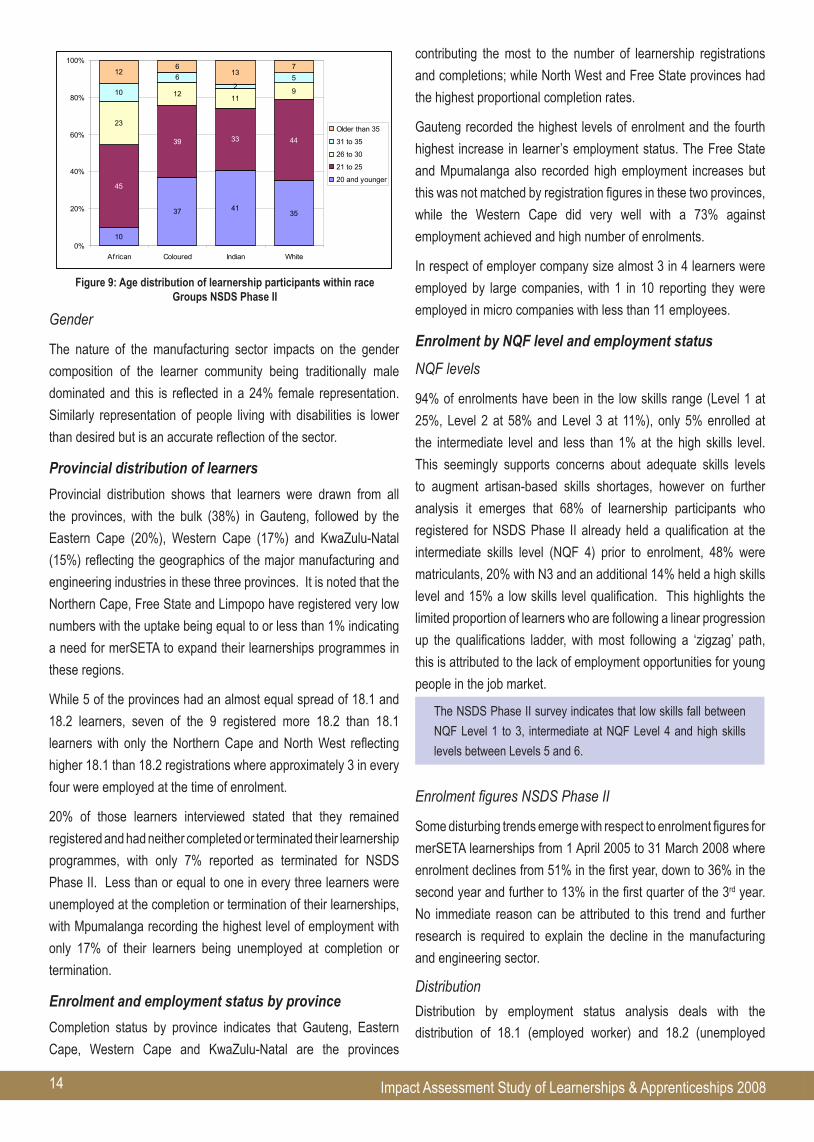
Race
Race group findings [Figure: 9] are extremely encouraging showing
that NSDS II learnership participants are dominated by Africans,
with 70% being African, 16% coloured, 4% Indian and 10% white; a
notable transformation achievement when framed against historic
realities.
Age
Positive findings also emerge with respect to the age of NSDS
Phase II learners, the DoL targets favour the youth and the
analysis indicates that only 11% of learners are over the age of 35,
highlighting merSETA’s achievements in attaining the objective of
providing unemployed youth with an opportunity to develop their
skills for employment generation.
14 Impact Assessment Study of Learnerships & Apprenticeships 2008
10
37 4135
45
39 33 44
23
12 11910
62
512
613
7
0%
20%
40%
60%
80%
100%
African Coloured Indian White
Older than 35
31 to 35
26 to 30
21 to 25
20 and younger
figure 9: age distribution of learnership participants within race groups nSdS phase ii
Gender
The nature of the manufacturing sector impacts on the gender
composition of the learner community being traditionally male
dominated and this is reflected in a 24% female representation.
Similarly representation of people living with disabilities is lower
than desired but is an accurate reflection of the sector.
Provincial distribution of learners
Provincial distribution shows that learners were drawn from all
the provinces, with the bulk (38%) in Gauteng, followed by the
Eastern Cape (20%), Western Cape (17%) and KwaZulu-Natal
(15%) reflecting the geographics of the major manufacturing and
engineering industries in these three provinces. It is noted that the
Northern Cape, Free State and Limpopo have registered very low
numbers with the uptake being equal to or less than 1% indicating
a need for merSETA to expand their learnerships programmes in
these regions.
While 5 of the provinces had an almost equal spread of 18.1 and
18.2 learners, seven of the 9 registered more 18.2 than 18.1
learners with only the Northern Cape and North West reflecting
higher 18.1 than 18.2 registrations where approximately 3 in every
four were employed at the time of enrolment.
20% of those learners interviewed stated that they remained
registered and had neither completed or terminated their learnership
programmes, with only 7% reported as terminated for NSDS
Phase II. Less than or equal to one in every three learners were
unemployed at the completion or termination of their learnerships,
with Mpumalanga recording the highest level of employment with
only 17% of their learners being unemployed at completion or
termination.
Enrolment and employment status by province
Completion status by province indicates that Gauteng, Eastern
Cape, Western Cape and KwaZulu-Natal are the provinces
contributing the most to the number of learnership registrations
and completions; while North West and Free State provinces had
the highest proportional completion rates.
Gauteng recorded the highest levels of enrolment and the fourth
highest increase in learner’s employment status. The Free State
and Mpumalanga also recorded high employment increases but
this was not matched by registration figures in these two provinces,
while the Western Cape did very well with a 73% against
employment achieved and high number of enrolments.
In respect of employer company size almost 3 in 4 learners were
employed by large companies, with 1 in 10 reporting they were
employed in micro companies with less than 11 employees.
Enrolment by NQF level and employment status
NQF levels
94% of enrolments have been in the low skills range (Level 1 at
25%, Level 2 at 58% and Level 3 at 11%), only 5% enrolled at
the intermediate level and less than 1% at the high skills level.
This seemingly supports concerns about adequate skills levels
to augment artisan-based skills shortages, however on further
analysis it emerges that 68% of learnership participants who
registered for NSDS Phase II already held a qualification at the
intermediate skills level (NQF 4) prior to enrolment, 48% were
matriculants, 20% with N3 and an additional 14% held a high skills
level and 15% a low skills level qualification. This highlights the
limited proportion of learners who are following a linear progression
up the qualifications ladder, with most following a ‘zigzag’ path,
this is attributed to the lack of employment opportunities for young
people in the job market.
The NSDS Phase II survey indicates that low skills fall between
NQF Level 1 to 3, intermediate at NQF Level 4 and high skills
levels between Levels 5 and 6.
Enrolment figures NSDS Phase II
Some disturbing trends emerge with respect to enrolment figures for
merSETA learnerships from 1 April 2005 to 31 March 2008 where
enrolment declines from 51% in the first year, down to 36% in the
second year and further to 13% in the first quarter of the 3rd year.
No immediate reason can be attributed to this trend and further
research is required to explain the decline in the manufacturing
and engineering sector.
Distribution
Distribution by employment status analysis deals with the
distribution of 18.1 (employed worker) and 18.2 (unemployed
15merSETA
learner) at the time of enrolment which is reflected as 18.1 at 44%
(or 4 303 learners) and 18.2 at 56% (5 565). Of the employed
workers 81% were male and 19% female, for the unemployed
learners 72% were male and 28% female. Race group distribution
against employment status reflects as 62% African, 19% coloured,
4% Indian and 15% white for NSDS Phase II.
Within the 18.1 findings the following profile of the average employed
worker/learner emerges, 65% are permanently employed, 6% are
casual workers, 94% are employed by the private sector, 2% are
self-employed and 2% are employed by government, with 96% in
the formal sector and 3% in the informal sector. The majority of
respondents in the survey earned between R2 000 and R3 000 per
month with 5% earning less than R1 000.
Unemployed learners, 18.2’s, report 44% are studying, 17% are
undertaking unpaid voluntary work, 23% take care of their homes
full-time while 48% indicated they were doing piece work for
payment in kind. Eighty-one percent stated they were looking for
work and 3% said they were doing nothing with the majority (84%)
replied that they relied on family and friends for assistance (cash,
food and clothing). Most (82%) indicated that they had some work
experience.
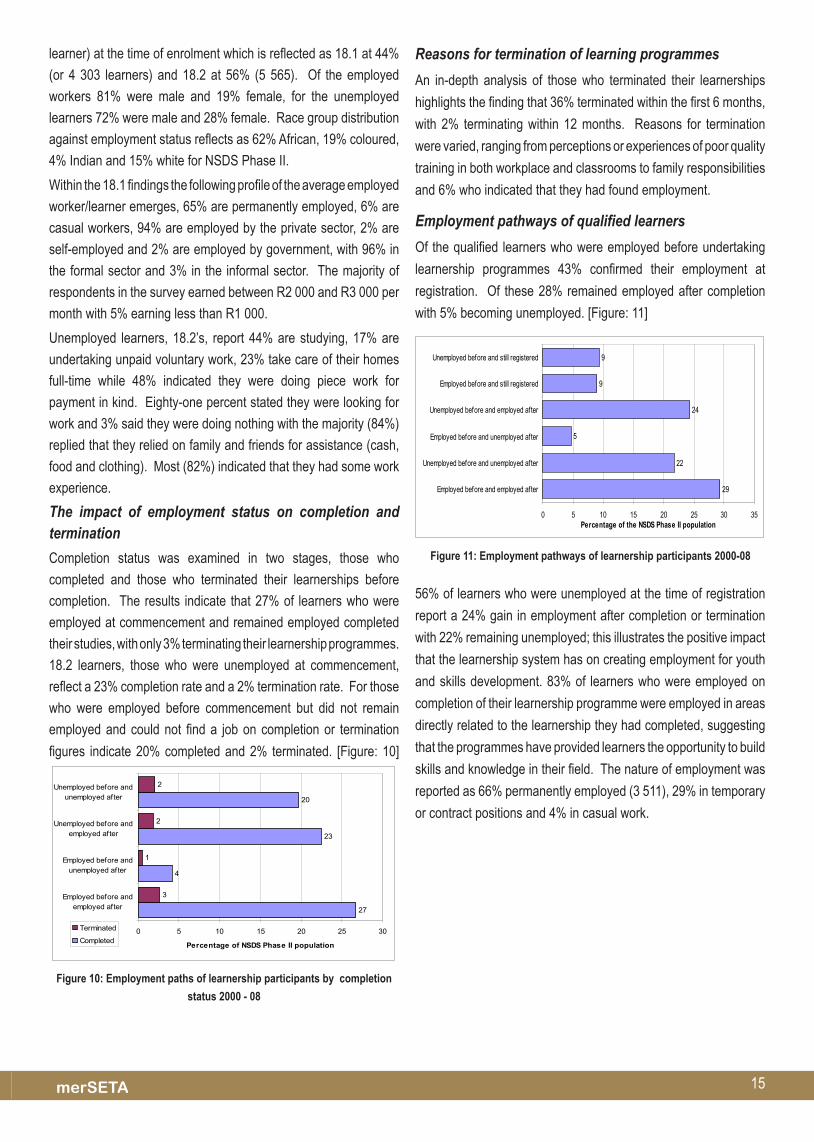
The impact of employment status on completion and termination
Completion status was examined in two stages, those who
completed and those who terminated their learnerships before
completion. The results indicate that 27% of learners who were
employed at commencement and remained employed completed
their studies, with only 3% terminating their learnership programmes.
18.2 learners, those who were unemployed at commencement,
reflect a 23% completion rate and a 2% termination rate. For those
who were employed before commencement but did not remain
employed and could not find a job on completion or termination
figures indicate 20% completed and 2% terminated. [Figure: 10]
27
4
23
20
3
1
2
2
0 5 10 15 20 25 30
Employed before andemployed after
Employed before andunemployed after
Unemployed before andemployed after
Unemployed before andunemployed after
Percentage of NSDS Phase II population
Terminated
Completed
figure 10: Employment paths of learnership participants by completion
status 2000 - 08
Reasons for termination of learning programmes
An in-depth analysis of those who terminated their learnerships
highlights the finding that 36% terminated within the first 6 months,
with 2% terminating within 12 months. Reasons for termination
were varied, ranging from perceptions or experiences of poor quality
training in both workplace and classrooms to family responsibilities
and 6% who indicated that they had found employment.
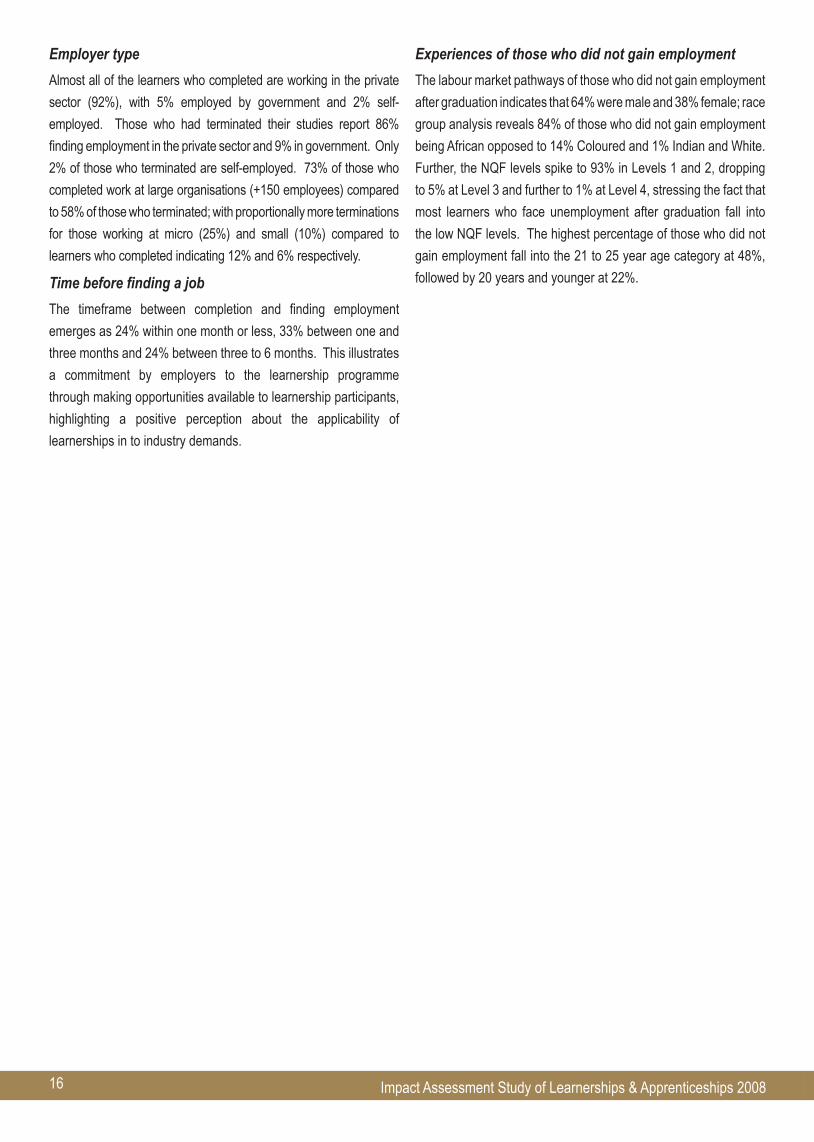
Employment pathways of qualified learners
Of the qualified learners who were employed before undertaking
learnership programmes 43% confirmed their employment at
registration. Of these 28% remained employed after completion
with 5% becoming unemployed. [Figure: 11]
29
22
5
24
9
9
0 5 10 15 20 25 30 35
Employed before and employed after
Unemployed before and unemployed after
Employed before and unemployed after
Unemployed before and employed after
Employed before and still registered
Unemployed before and still registered
Percentage of the NSDS Phase II population
figure 11: Employment pathways of learnership participants 2000-08
56% of learners who were unemployed at the time of registration
report a 24% gain in employment after completion or termination
with 22% remaining unemployed; this illustrates the positive impact
that the learnership system has on creating employment for youth
and skills development. 83% of learners who were employed on
completion of their learnership programme were employed in areas
directly related to the learnership they had completed, suggesting
that the programmes have provided learners the opportunity to build
skills and knowledge in their field. The nature of employment was
reported as 66% permanently employed (3 511), 29% in temporary
or contract positions and 4% in casual work.
16 Impact Assessment Study of Learnerships & Apprenticeships 2008
Employer type
Almost all of the learners who completed are working in the private
sector (92%), with 5% employed by government and 2% self-
employed. Those who had terminated their studies report 86%
finding employment in the private sector and 9% in government. Only
2% of those who terminated are self-employed. 73% of those who
completed work at large organisations (+150 employees) compared
to 58% of those who terminated; with proportionally more terminations
for those working at micro (25%) and small (10%) compared to
learners who completed indicating 12% and 6% respectively.
Time before finding a job
The timeframe between completion and finding employment
emerges as 24% within one month or less, 33% between one and
three months and 24% between three to 6 months. This illustrates
a commitment by employers to the learnership programme
through making opportunities available to learnership participants,
highlighting a positive perception about the applicability of
learnerships in to industry demands.
Experiences of those who did not gain employment
The labour market pathways of those who did not gain employment
after graduation indicates that 64% were male and 38% female; race
group analysis reveals 84% of those who did not gain employment
being African opposed to 14% Coloured and 1% Indian and White.
Further, the NQF levels spike to 93% in Levels 1 and 2, dropping
to 5% at Level 3 and further to 1% at Level 4, stressing the fact that
most learners who face unemployment after graduation fall into
the low NQF levels. The highest percentage of those who did not
gain employment fall into the 21 to 25 year age category at 48%,
followed by 20 years and younger at 22%.
17merSETA
This chapter provides a detailed profile of those apprentices who
have participated in merSETA’s apprenticeship from 1 February
2001 to March 2008. In order to accurately measure the impact
that the apprenticeship system has had on skills development and
training, and critically the development of artisan skills into the
labour market, a demographic profile has been developed to assist
in defining who makes up this group. The second aspect examined
is the external effectiveness of apprenticeships in the sector, with
these results providing insight into the internal efficiency of the
merSETA system.
Section 1:
A profile of the merSETA apprenticeship population NSDS Phases I & IIAcross NSDS Phases I and II merSETA has registered a total
number of 23 530 apprenticeships which translated to 22 789
people or actual apprenticeships from inception of the merSETA
to 14 March 2008.
This figure indicates that 729 or 3% of the total registered
apprenticeships were for more than one apprenticeship over the
timeframe, reasons for this are:
40% completed one apprenticeship qualification and registered for another;
43% terminated their first registration and registered for another, or the same, apprenticeship after a period of time;
The balance (13%) accounts for a combination of different options which include, but are not limited to, the apprentice terminating the same or different programmes more than once.
The Training of apprentices
A contract of apprenticeship can only be registered when the
trade has been designated and conditions of apprenticeship
prescribed; these designated trades and conditions vary by
industry or sector needs but must all include the following:
Qualifications for commencing apprenticeship
Section 13 (2) (a) of the MTA prescribes (generally exceptions
can be made) minimum age of 16, Standard 7 (Grade 9) and a
favourable medical report
period of apprenticeship
A definite period must be defined in the contract, with 3 years
minimum and 4 years maximum, including a minimum period
of practical training prior to Trade Testing ranging from 80 to 93
weeks
remuneration
Minimum wage for apprentices varies by industry with guidelines
pegged at percentage of artisan wage by industry
Technical Studies
Apprentices are required to attend classes at a technical college
(or by correspondence if geographically required) until N1 or N2
trade theory is attained
This is normally 11 weeks of classes 5 days per week and 2
weeks of examination; day release is an alternative once a
week for the academic year
Centralised technical training, integrated courses and
institutional training
Certain industries have centralised theoretical training at
specific colleges; while others have provided integrated courses
combining calculations, science and drawing with trade theory
Logbooks
The Apprenticeship Contract requires the employer provide a
schedule of training per apprentice under the regular supervision
of an artisan monitored through a log book filled in on a daily
basis.
merSETA apprenticeship demographic profile
Establishing the enrolments by year of registration proved
challenging with registration information utilised containing
entries that pre-date the beginning of NSDS Phase I, noting a
significant number of apprenticeships were registered prior to the
commencement date of February 2001.
This has required the reporting of findings to be undertaken on a
year-by-year analysis as opposed to the NSDS Phases used in the
learnership profile chapter, noting that 21% of all apprenticeship
registrations took place before the commencement of NSDS Phase
I, with approximately 33% of the total merSETA apprenticeship
population registered in Phase I followed by the same percentage in
Phase II. Approximately 15% of the total population did not record a
commencement date and are not included in the profile development.
Finally it is noted that 14% of the total population is recorded as
Section 28 apprenticeships, totalling 3 358 apprenticeships.
Chapter 3
The Apprenticeship Impact Study

18 Impact Assessment Study of Learnerships & Apprenticeships 2008
The data reveals that registrations increased slowly from 1989
reaching 1 848 immediately after the start of NSDS Phase I and
peaked at 2 942 in the 2004 to 2005 period as Phase II started, at
which point it began to decrease reaching 1 479 by March 2008.
NSDS Phase I: 1 April 2000 to 31 March 2005
NSDS Phase II: 1 April 2005 to 31 March 2010
Apprenticeship reporting data is drawn from both Phase I and II to
31 March 2008 and includes data registered from 1998.
Apprentice profile by year of registration and race group
Race
The total merSETA apprentice population indicates an aggregated
37% African, 11% Coloured 6% Indian and 46% White spread.
However, the most accurate finding is from the 2006 to 2007
period which shows a percentage distribution of 44% African, 12%
coloured, 5% Indians and 36% White participants.
Year of Registration
Interesting trends emerge in the year-on-year data; namely, that
African participation almost doubled from 28% in 1998 – 1999 to
47% in 2007-2008 with a continuous increase in both numbers and
percentage over the period. At the same time White participation
decreased from 54% to 35% for the same period, with Coloured
participation increasing by 2%, while Indian participation decreased
by 3%.
Completion status
Apprenticeship completions across the total population are
recorded at 42%, with approximately 67% of the registrations
between 1998 and 2003 obtaining their qualifications. In the same
period approximately 20% terminated their apprenticeships.
The records indicate that between 1998 and 2003 just over one
third of all registrations were terminated; the difference between
the completion percentages before and after 1998 is notable, rising
from 49% pre-1998 to 65% post-1998.
Apprenticeship registration by chamber and province
Registration by chamberAnalysis of employer chamber linked to year of registration [Figure:
12] yields an interesting finding indicating the highest proportion
of total apprenticeships (40%) falls within the Metal Chamber
followed by the Motor Chamber, who have taken turns to dominate
registrations over the past decade. Three percent of the total
apprenticeship population is within the Automotive Chamber.
Auto3%
Metal40%
Motor35%
New Tyre0%
Not Applicable
0%
Plastics2%
Unknow n20%
figure 12: number of registered apprenticeships by Chamber of employer 2000 - 08
Registration by province
Gauteng and North West provinces share 35% of registered
apprenticeships for the period under review, followed by KZN with
14% and 21% allocated to the Western Cape. An additional 21% of
registered apprenticeships total remain unallocated. [Figure: 13]
Western Cape10%
Unknow n21%
Mpuma-langa /
Limpopo8%
Kw aZulu Natal14%
Gauteng / NorthWest
35%
Free State/ Northern
Cape3%
Eastern Cape9%
figure 13 : number of registered apprenticeships by
year and province of employer 2000- 08
Apprentice profile by race, age and gender
Age
The average (mean) age of the apprenticeship population is noted
as very young with 77% younger than 25 at time of registration,
translating into 92% of the entire population being 30 years old or
younger.
However this has shown a shift in the past decade with a decrease
of 20% ion the under 20 years group and a concomitant increase
in the 21 to 35 years age range from 37% to 51%.
19merSETA
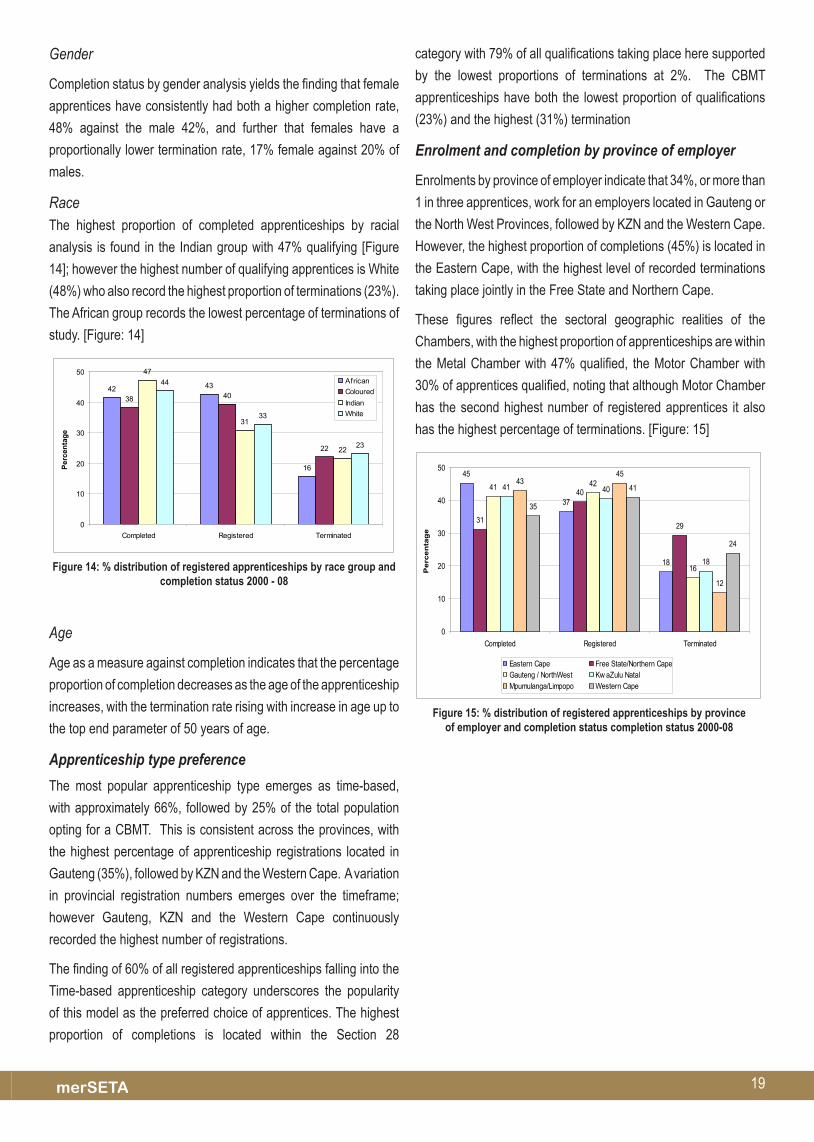
Gender
Completion status by gender analysis yields the finding that female
apprentices have consistently had both a higher completion rate,
48% against the male 42%, and further that females have a
proportionally lower termination rate, 17% female against 20% of
males.
RaceThe highest proportion of completed apprenticeships by racial
analysis is found in the Indian group with 47% qualifying [Figure
14]; however the highest number of qualifying apprentices is White
(48%) who also record the highest proportion of terminations (23%).
The African group records the lowest percentage of terminations of
study. [Figure: 14]
42 43
16
38 40
22
47
31
22
44
33
23
0
10
20
30
40
50
Completed Registered Terminated
Perc
enta
ge
AfricanColouredIndianWhite
figure 14: % distribution of registered apprenticeships by race group and completion status 2000 - 08
Age
Age as a measure against completion indicates that the percentage
proportion of completion decreases as the age of the apprenticeship
increases, with the termination rate rising with increase in age up to
the top end parameter of 50 years of age.
Apprenticeship type preference
The most popular apprenticeship type emerges as time-based,
with approximately 66%, followed by 25% of the total population
opting for a CBMT. This is consistent across the provinces, with
the highest percentage of apprenticeship registrations located in
Gauteng (35%), followed by KZN and the Western Cape. A variation
in provincial registration numbers emerges over the timeframe;
however Gauteng, KZN and the Western Cape continuously
recorded the highest number of registrations.
The finding of 60% of all registered apprenticeships falling into the
Time-based apprenticeship category underscores the popularity
of this model as the preferred choice of apprentices. The highest
proportion of completions is located within the Section 28
category with 79% of all qualifications taking place here supported
by the lowest proportions of terminations at 2%. The CBMT
apprenticeships have both the lowest proportion of qualifications
(23%) and the highest (31%) termination
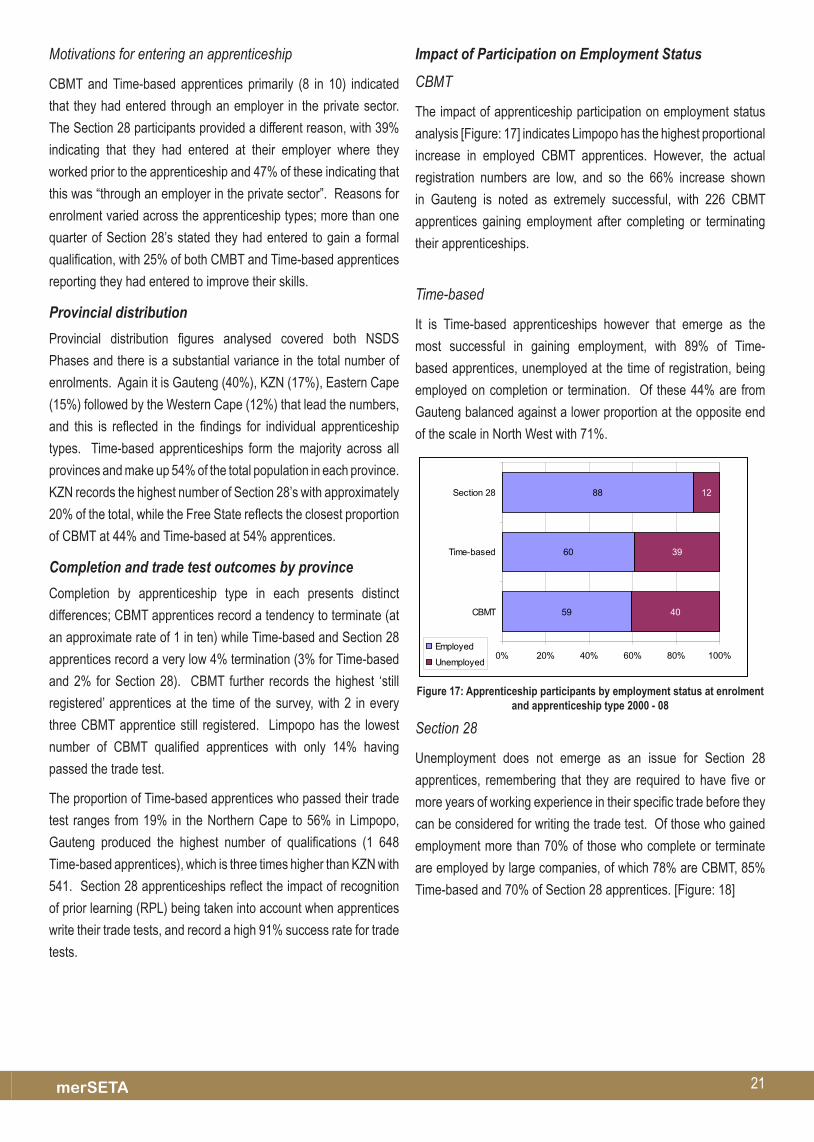
Enrolment and completion by province of employer
Enrolments by province of employer indicate that 34%, or more than
1 in three apprentices, work for an employers located in Gauteng or
the North West Provinces, followed by KZN and the Western Cape.
However, the highest proportion of completions (45%) is located in
the Eastern Cape, with the highest level of recorded terminations
taking place jointly in the Free State and Northern Cape.
These figures reflect the sectoral geographic realities of the
Chambers, with the highest proportion of apprenticeships are within
the Metal Chamber with 47% qualified, the Motor Chamber with
30% of apprentices qualified, noting that although Motor Chamber
has the second highest number of registered apprentices it also
has the highest percentage of terminations. [Figure: 15]
45
37
18
31
40
29
41 42
16
41 40
18
4345
12
35
41
24
0
10
20
30
40
50
Completed Registered Terminated
Per
cen
tag
e
Eastern Cape Free State/Northern CapeGauteng / NorthWest Kw aZulu NatalMpumulanga/Limpopo Western Cape
figure 15: % distribution of registered apprenticeships by provinceof employer and completion status completion status 2000-08

20 Impact Assessment Study of Learnerships & Apprenticeships 2008
Section 2: Pathways and experiences of apprenticeship participantsThe analysis of the apprenticeship system was used a sample of
2 034 apprenticeship participants from the population of 18 529,
including Competency Based Modular Training (CBMT) and Time-
based apprentices registered through merSETA from 1 February
2001 until March 2008; the Section 28 apprentices include all those
ever registered and captured on the merSETA database. Each
type of apprenticeship is reported separately in order to understand
the specific dynamics of each typology, the demographics of the
apprenticeship groupings by type, in addition to provincial spreads,
additional or supplementary qualifications achieved, enrolment
over time and employment status at registration. The provincial
registration figures reflect the four provinces that attract the most
apprentices are (in descending order) Gauteng, KwaZulu-Natal,
Eastern Cape and Western Cape.
Demographic profile by apprenticeship type
Gender
While approximately 5 times more women enrolled for a Time-
based apprenticeship than any other type, they still only made
up 4% of the total apprenticeship registrations. Of these only
1% (61 individuals) enrolled for a CBMT apprenticeship. The
NSDS gender targets remain challenging, mainly based on the
type of work undertaken in the sector. merSETA is aware that
interventions are required in both gender and people living with
disability registrations in order to meet the targets.
Race
Racial grouping analysis reveals that African apprentices are
in the majority in Time-based (59% African, 43% African, 11%
coloured, 5% Indian) and Section 28 apprenticeship types (56%
African, 39% African, 10% coloured, 7% Indian), while more white
apprentices enrolled in CBMT apprenticeships (52% white, 29%
African, 12% coloured, 7% Indian). Just over one in every four
CBMT registrations and more than one in every three Section 28
apprenticeship registrations and almost one in every two Time-
based apprenticeships are African apprentices.The analysis of
race group distribution over the period under review indicates the
proportion of African apprenticeship participants increases for both
CBMT and Time-based while the proportion of White apprentices
decreases in the same period. There has been a marked increase
in African apprentices moving from 16% in CBMT in 2001 – 2002
to 38% in 2007 – 2008, although White participants remained
the majority until 2005 – 2006 when more African than White
apprentices enrolled.
In Time-based apprenticeships the trend across racial grouping
is clear; from 2002 to 2003 more African than White apprentices
participated, while Coloured and Indian participation remained
fundamentally constant and White participation declined over the
timeframe. [Figure: 16]
39
1930
46
33
45
10
26
18
3
11
51
113
0%
10%
20%
30%
40%
50%
60%
70%
80%
90%
100%
CBMT Section 28 Time-based
Older than 35
31 to 35
26 to 30
21 to 25
20 and younger
figure 16: apprenticeship registrations by type and age 2000 - 08
category at registration
Section 28 apprenticeship figures do not present easily identifiable
trends; in the main the proportional participation of African and
White apprentices, is 56% and 44% respectively with marked
variances across the year on year periods.
Age
Age distribution highlights the density of registrations in the 21
to 25 year age category. Those who enrol for CBMT emerge as
younger than the other groups with 85% younger than 25 years.
This trend shifts for the Section 28 apprentices who record more
than one in every five registrations being older than 30 years. As
one would expect the apprentice participants are generally younger
than learnership participants with less than 1% over 40 years of
age. [Figure: 16]
Previous qualifications
A point of interest highlighted in the survey examined the highest
qualification of the apprentice other than the apprenticeship
currently undertaken noting that the majority have an NQF Level
4 or higher qualification with only an approximate 20% having a
lower NQF qualification. Similar trends emerge across the different
apprenticeship types, with proportions of 86%, 81% and 85% of
CBMT, Section 28 and Time-based apprentices respectively having
qualifications equal to or higher than matric.
21merSETA
Motivations for entering an apprenticeship
CBMT and Time-based apprentices primarily (8 in 10) indicated
that they had entered through an employer in the private sector.
The Section 28 participants provided a different reason, with 39%
indicating that they had entered at their employer where they
worked prior to the apprenticeship and 47% of these indicating that
this was “through an employer in the private sector”. Reasons for
enrolment varied across the apprenticeship types; more than one
quarter of Section 28’s stated they had entered to gain a formal
qualification, with 25% of both CMBT and Time-based apprentices
reporting they had entered to improve their skills.
Provincial distribution
Provincial distribution figures analysed covered both NSDS
Phases and there is a substantial variance in the total number of
enrolments. Again it is Gauteng (40%), KZN (17%), Eastern Cape
(15%) followed by the Western Cape (12%) that lead the numbers,
and this is reflected in the findings for individual apprenticeship
types. Time-based apprenticeships form the majority across all
provinces and make up 54% of the total population in each province.
KZN records the highest number of Section 28’s with approximately
20% of the total, while the Free State reflects the closest proportion
of CBMT at 44% and Time-based at 54% apprentices.
Completion and trade test outcomes by province
Completion by apprenticeship type in each presents distinct
differences; CBMT apprentices record a tendency to terminate (at
an approximate rate of 1 in ten) while Time-based and Section 28
apprentices record a very low 4% termination (3% for Time-based
and 2% for Section 28). CBMT further records the highest ‘still
registered’ apprentices at the time of the survey, with 2 in every
three CBMT apprentice still registered. Limpopo has the lowest
number of CBMT qualified apprentices with only 14% having
passed the trade test.
The proportion of Time-based apprentices who passed their trade
test ranges from 19% in the Northern Cape to 56% in Limpopo,
Gauteng produced the highest number of qualifications (1 648
Time-based apprentices), which is three times higher than KZN with
541. Section 28 apprenticeships reflect the impact of recognition
of prior learning (RPL) being taken into account when apprentices
write their trade tests, and record a high 91% success rate for trade
tests.
Impact of Participation on Employment Status
CBMT
The impact of apprenticeship participation on employment status
analysis [Figure: 17] indicates Limpopo has the highest proportional
increase in employed CBMT apprentices. However, the actual
registration numbers are low, and so the 66% increase shown
in Gauteng is noted as extremely successful, with 226 CBMT
apprentices gaining employment after completing or terminating
their apprenticeships.
Time-based
It is Time-based apprenticeships however that emerge as the
most successful in gaining employment, with 89% of Time-
based apprentices, unemployed at the time of registration, being
employed on completion or termination. Of these 44% are from
Gauteng balanced against a lower proportion at the opposite end
of the scale in North West with 71%.
59
60
88
40
39
12
0% 20% 40% 60% 80% 100%
CBMT
Time-based
Section 28
Employed
Unemployed
figure 17: apprenticeship participants by employment status at enrolment and apprenticeship type 2000 - 08
Section 28
Unemployment does not emerge as an issue for Section 28
apprentices, remembering that they are required to have five or
more years of working experience in their specific trade before they
can be considered for writing the trade test. Of those who gained
employment more than 70% of those who complete or terminate
are employed by large companies, of which 78% are CBMT, 85%
Time-based and 70% of Section 28 apprentices. [Figure: 18]
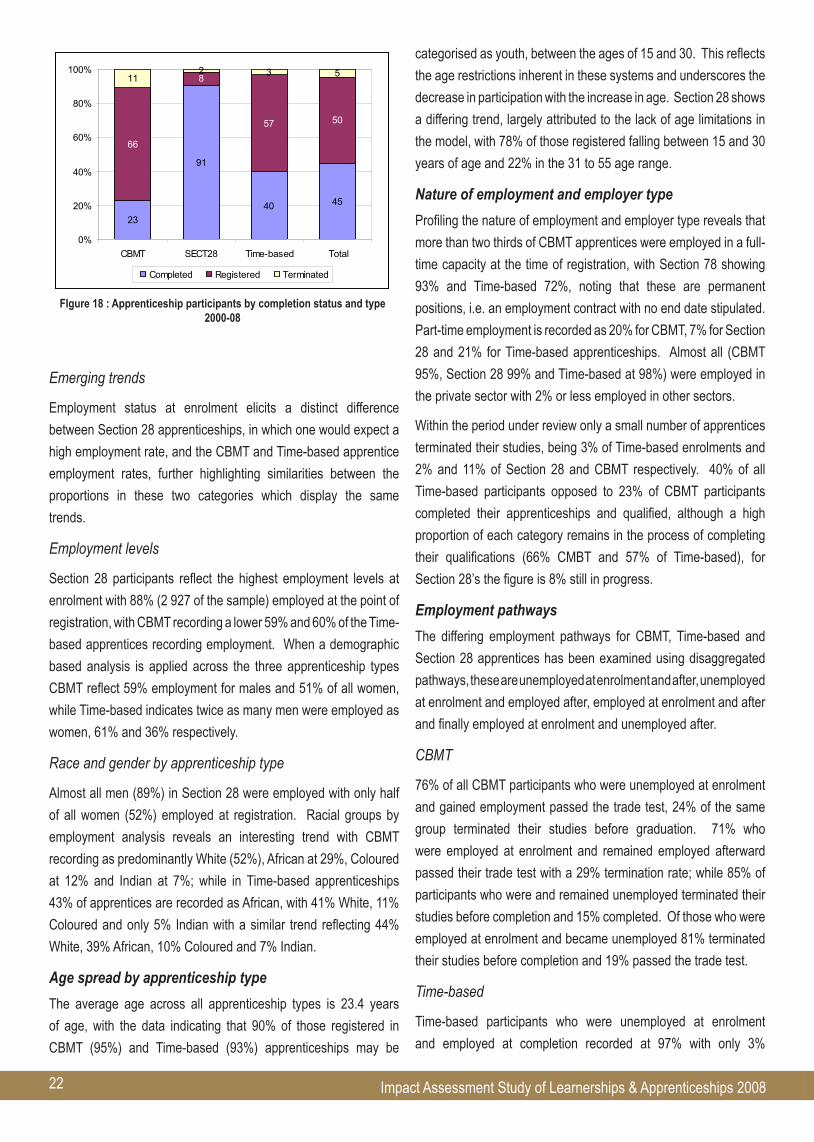
22 Impact Assessment Study of Learnerships & Apprenticeships 2008
23
91
40 45
66
8
57 50
112 3 5
0%
20%
40%
60%
80%
100%
CBMT SECT28 Time-based Total
Completed Registered Terminated
figure 18 : apprenticeship participants by completion status and type 2000-08
Emerging trends
Employment status at enrolment elicits a distinct difference
between Section 28 apprenticeships, in which one would expect a
high employment rate, and the CBMT and Time-based apprentice
employment rates, further highlighting similarities between the
proportions in these two categories which display the same
trends.
Employment levels
Section 28 participants reflect the highest employment levels at
enrolment with 88% (2 927 of the sample) employed at the point of
registration, with CBMT recording a lower 59% and 60% of the Time-
based apprentices recording employment. When a demographic
based analysis is applied across the three apprenticeship types
CBMT reflect 59% employment for males and 51% of all women,
while Time-based indicates twice as many men were employed as
women, 61% and 36% respectively.
Race and gender by apprenticeship type
Almost all men (89%) in Section 28 were employed with only half
of all women (52%) employed at registration. Racial groups by
employment analysis reveals an interesting trend with CBMT
recording as predominantly White (52%), African at 29%, Coloured
at 12% and Indian at 7%; while in Time-based apprenticeships
43% of apprentices are recorded as African, with 41% White, 11%
Coloured and only 5% Indian with a similar trend reflecting 44%
White, 39% African, 10% Coloured and 7% Indian.
Age spread by apprenticeship type
The average age across all apprenticeship types is 23.4 years
of age, with the data indicating that 90% of those registered in
CBMT (95%) and Time-based (93%) apprenticeships may be
categorised as youth, between the ages of 15 and 30. This reflects
the age restrictions inherent in these systems and underscores the
decrease in participation with the increase in age. Section 28 shows
a differing trend, largely attributed to the lack of age limitations in
the model, with 78% of those registered falling between 15 and 30
years of age and 22% in the 31 to 55 age range.
Nature of employment and employer type
Profiling the nature of employment and employer type reveals that
more than two thirds of CBMT apprentices were employed in a full-
time capacity at the time of registration, with Section 78 showing
93% and Time-based 72%, noting that these are permanent
positions, i.e. an employment contract with no end date stipulated.
Part-time employment is recorded as 20% for CBMT, 7% for Section
28 and 21% for Time-based apprenticeships. Almost all (CBMT
95%, Section 28 99% and Time-based at 98%) were employed in
the private sector with 2% or less employed in other sectors.
Within the period under review only a small number of apprentices
terminated their studies, being 3% of Time-based enrolments and
2% and 11% of Section 28 and CBMT respectively. 40% of all
Time-based participants opposed to 23% of CBMT participants
completed their apprenticeships and qualified, although a high
proportion of each category remains in the process of completing
their qualifications (66% CMBT and 57% of Time-based), for
Section 28’s the figure is 8% still in progress.
Employment pathways
The differing employment pathways for CBMT, Time-based and
Section 28 apprentices has been examined using disaggregated
pathways, these are unemployed at enrolment and after, unemployed
at enrolment and employed after, employed at enrolment and after
and finally employed at enrolment and unemployed after.
CBMT
76% of all CBMT participants who were unemployed at enrolment
and gained employment passed the trade test, 24% of the same
group terminated their studies before graduation. 71% who
were employed at enrolment and remained employed afterward
passed their trade test with a 29% termination rate; while 85% of
participants who were and remained unemployed terminated their
studies before completion and 15% completed. Of those who were
employed at enrolment and became unemployed 81% terminated
their studies before completion and 19% passed the trade test.
Time-based
Time-based participants who were unemployed at enrolment
and employed at completion recorded at 97% with only 3%
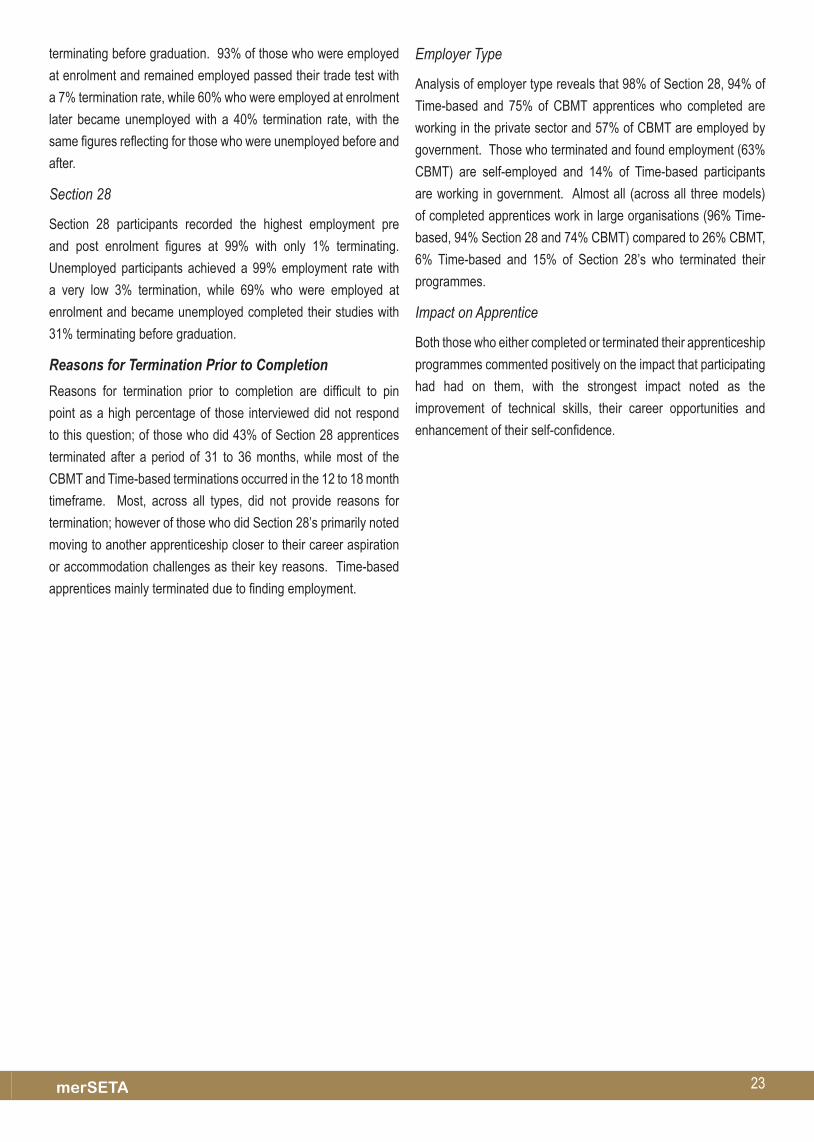
23merSETA
terminating before graduation. 93% of those who were employed
at enrolment and remained employed passed their trade test with
a 7% termination rate, while 60% who were employed at enrolment
later became unemployed with a 40% termination rate, with the
same figures reflecting for those who were unemployed before and
after.
Section 28
Section 28 participants recorded the highest employment pre
and post enrolment figures at 99% with only 1% terminating.
Unemployed participants achieved a 99% employment rate with
a very low 3% termination, while 69% who were employed at
enrolment and became unemployed completed their studies with
31% terminating before graduation.
Reasons for Termination Prior to Completion
Reasons for termination prior to completion are difficult to pin
point as a high percentage of those interviewed did not respond
to this question; of those who did 43% of Section 28 apprentices
terminated after a period of 31 to 36 months, while most of the
CBMT and Time-based terminations occurred in the 12 to 18 month
timeframe. Most, across all types, did not provide reasons for
termination; however of those who did Section 28’s primarily noted
moving to another apprenticeship closer to their career aspiration
or accommodation challenges as their key reasons. Time-based
apprentices mainly terminated due to finding employment.
Employer Type
Analysis of employer type reveals that 98% of Section 28, 94% of
Time-based and 75% of CBMT apprentices who completed are
working in the private sector and 57% of CBMT are employed by
government. Those who terminated and found employment (63%
CBMT) are self-employed and 14% of Time-based participants
are working in government. Almost all (across all three models)
of completed apprentices work in large organisations (96% Time-
based, 94% Section 28 and 74% CBMT) compared to 26% CBMT,
6% Time-based and 15% of Section 28’s who terminated their
programmes.
Impact on Apprentice
Both those who either completed or terminated their apprenticeship
programmes commented positively on the impact that participating
had had on them, with the strongest impact noted as the
improvement of technical skills, their career opportunities and
enhancement of their self-confidence.
24 Impact Assessment Study of Learnerships & Apprenticeships 2008
The findings of the merSETA Impact Assessment of Learnership
and Apprenticeships Report reveal that the merSETA administered
learnership and apprenticeship programmes are working well
based on the perceptions from both learners and key stakeholders.
However, in bringing together the main findings and formulating
conclusions and recommendations drawn from those, it is essential
that we place the merSETA learnership and apprenticeship
programmes into their broader context, critically remembering that
they form part of government’s intervention to enhance sustainable
economic growth while redressing some of the injustices inherited
from apartheid.
They provide important opportunities for participants to learn in
the workplace, linking theory and practice and assist in deepening
South Africa’s skills base. In addition to opportunity provision
to unemployed persons to gain skills they further provide work
experience and thus improve employability; they provide qualified
participants with the necessary skills to enter and advance through
the formal labour market, self-employment, or for further education
and training. Noting that merSETA and the Department of Labour
must work together to ensure that the strengths are maintained
and weaknesses improved the following achievements are noted
across the learnership and apprenticeship programmes.
Chapter 4:
Conclusions and recommendations
The national Training Board:
Resulting from the MTA of 1981 the National Training Board
(NTB) was established in order to represent the interests of
employees, employers and the State. Its functions were to co-
ordinate, encourage, promote or facilitate training; advise the
Minister on matters of policy and training matters, to conduct
research and establish standards.
A review in 1985 led to the implementation of recommendations
that saw the introduction of a competency based modular training
system including technical education in a technical college, on the
job instruction and institutional training by an accredited provider.
These formed the basis of the MTA which was finally published in
1990. Received thinking identifies this point as the devolutionary
trigger for the control moving from the Department of Manpower
to accredited Industry Training Boards (ITBs); highlighting the
move away from the state toward business and labour taking
responsibility for artisan training, the effective privatisation
handing sector autonomy to decide on appropriate training.
Despite providing for the de-racialisation of the apprenticeship
system few Africans were indentured.
Labour organisations increased role saw the amendments of the
1981 MTA bridging the gaps created by historic racial imbalances,
with COSATU and NUMSA promoting an integrated education
and training system. This ‘training ladder’ included the critical
ABET component and training framework enabling access to a
learning framework. Additional reviews of both the NTB and the
inclusion of labour as representatives enabled agreement and
commencement of strategic and policy work on the drafting of
a National Training Strategy Initiative (NTSI) published in 1994
with the stated vision “A human resources development system
in which there is an integrated approach to education and training
and which meets the economic and social needs of the country
and the development needs of the individual.”
This strategy, anchored in the integration between education and
training initiated the achievement of a National Qualifications
Framework (NQF) delivered through the establishment of SA
Qualifications Authority (SAQA) Act of 1995, the first piece
of legislation passed by the newly elected SA government,
including all qualifications, vocational to professional, allowing
the integration of recognition of prior learning into the formal
education system. Challenges have emerged within the
implementation of this system and the evolution of the NQF has
been troublesome, the DoE and DoL commissioned a Report
of the Study Team on the Implementation of the NQF (the NQF
Review) which has created intense debate and had not been
resolved at the time of writing.

25merSETA
The merSETa Learnership impact StudyConclusions:
The following are the key findings of the Learnership Impact
Study:
Seventy-four per cent of all the 18.1 and 18.2 learners completed their learnership programmes and only 7% terminated their studies before graduation.
Forty-three per cent of those who were unemployed at registration (18.2 learners) and 67% of 18.1 learners were employed after completion or termination of their learnerships. This is a positive development and illustrates the importance of the learnership system in creating employment for the youth and its contribution to skills development.
Eighty-three per cent of the learners who were employed after graduation or termination of their learnership indicated that the employment was related to the learnership they completed. This is an encouraging finding for the learnership programme as it suggests that it provides learners with the opportunity to further build their skills and knowledge in the field as their employment was directly related to the training they undertook.
In terms of the nature of their employment, 66% were permanently employed, 29% in positions that are temporary or contract and 4% were casual workers.
Approximately 32% earn a salary between R2 001 and R5 000 per month and 12% earn between R1 001 and R2 000. Only 3% earn less than R1 001 per month and another 3% earn more than R10 000 per month.
Almost all (92%) of those who completed their studies are working in the private sector with only 5% employed in government and 2% self-employed.
Most of the completed learners were employed between one and six months of completion of the learnership programme. Of these, 24% were employed within one month or less, 31% between one and three months and another 24% between three and six months. This shows the commitment employers are putting into the learnership programme by making employment opportunities available to the learnership participants. It further illustrates that employers have a positive perception about learnerships and their applicability to industry demands.
Almost all the learners who completed or terminated their learnership reported positively about how participation in the learnership impacted on their lives. Ninety-seven per cent indicated that the learnerships had made an improvement in their technical skills and their career opportunities and had enhanced their self-confidence.
Overall, both employers and learners were satisfied with the organisation and objectives of the learnership system, reflecting well on merSETA and other stakeholders.
The merSETa apprenticeship impact
StudyConclusions:The following are noted as the key findings of the apprenticeship
impact study:
Almost all (91%) of the Section 28 apprentices passed the trade test and qualified.
More than half of the CBMT enrolments (66%) and Time- based enrolments (57%) were still registered at the time of the survey. Only 8% of the Section 28 enrolments were still registered.
Only a small number of apprenticeship participants terminated their studies before graduation namely 3% of the Time-based enrolments, 2% of Section 28 and 11% of CBMT enrolments. This is a positive development and illustrates the commitment of both the learners and the system to the programme.
Forty-per cent of all Time-based participants and 23% of all CBMT participants completed their apprenticeship and qualified.
Seventy-six per cent of all CBMT participants who were unemployed at enrolment and gained employment passed the trade test and almost all (97%) of the Time-based and Section 28 participants, who were unemployed at registration and completed their qualification, gained employment after graduation. This outcome is very positive and reflects well on the programme.
A small number (1%) of apprenticeship participants who were employed at registration and lost their jobs and became unemployed after completing or terminating the apprenticeship.
In terms of the nature of their employment, more than 90% (95% of CBMT apprentices, 94% of Section 28, and 91% of Time-based apprentices) of all participants who qualified had a permanent position with no end date.
Almost half of the participants (48% of CBMT and 42% of Time-based participants) who qualified reported to be working at the company at which they did their work-based training, while 35% CBMT and 32% Time-based participants remained employed by the same company as prior to enrolling for a learnership.
All Section 28 apprentices who were unemployed at registration gained employment and the total number (34) of Section 28 apprentices who are currently unemployed were employed at registration.
Fifty-one per cent of the Time-based apprentices who are currently unemployed were unemployed at registration and 49% or 95 apprentices lost their employment.
26 Impact Assessment Study of Learnerships & Apprenticeships 2008
Almost 75% of the CBMT apprentices who are currently employed were unemployed at registration, while only 35 CBMT apprentices lost their employment.
Reasons for loss of employment by apprentices ranged from the expiry of contract, poor treatment at the workplace to finding a place to study at university.
Almost all the apprentices who completed or terminated their studies reported positively about their apprenticeship experiences. The strongest impact seems to be the improvement of their technical skills and their career opportunities, supported by enhancement of their self-confidence. In-depth interviews with the apprentices also revealed this positive outcome.
Joint findings
Joint findings in both learnership and apprenticeship respondents
raise concern with regards to the institutional, legislated
mechanisms and procedures within which the programmes are
currently organised and function. The Skills Development Act,
1998 (Act No. 97 of 1998) introduced the concept of learnerships
proposing that they would incorporate apprenticeships but did
not state that apprenticeships would no longer be allowed. This
was in recognition of the shortage of intermediate vocational
skills (Level 2 and 3) in the labour market and has resulted in the
continued training of apprentices under the two routes defined in
the Manpower Training Act of 1981: Section 13 and Section 28.
Despite some concerns about the Department of Labour’s capacity
to administer and ensure the implementation of the SDA, it has been
both positive and proactive in taking up the challenges experienced
in addressing the system’s shortcomings. The DoL has stepped
up and taken ownership of seeking solutions to having a single
regulation governing both apprenticeships and learnerships.
Key Challenges
The key challenges that face the programme are identified as
follows:
The skills shortage has been exacerbated rather than assisted based in the finding that a high number of learnerships undertaken are in the lower NQF Levels and not at the critical intermediary levels;
This may be as a result of government’s focus on the youth and redress, and while Level 1 programmes have provided skills bridging for those previously denied opportunities, it has not impacted on the growing scarce and critical skills need;
It is clear that a balance needs to be achieved between redress learnerships and skills interventions at the intermediary and higher end of the skills spectrum, but research indicates that
learnerships at the higher end of the spectrum have proven problematic due, primarily, to costs and other related aspects;
Challenges emerge in socially marginalised groups including women, youth and people with disabilities; noting specifically a lower incidence of Recognition of Prior Learning and learning plans. The DoL and merSETA must focus on these to ensure equality in compliance across social groups.
recommendationsBased on the findings and conclusions drawn there from
recommendations for change is made as follows:
Role of Employers:
The apprenticeship and learnership programmes are designed
to be work-based systems of training. Evidence from the case
studies (Chapter 5 of this report) found in this report leads to
the conclusion that supportive employers make an enormous
contribution to a successful learnership and apprenticeship
system, whereas if employers are not supportive it becomes very
difficult for apprentices and learners to successfully complete their
programmes. However, evidence also points to major differences
between employers in the extent to which they understand the
apprenticeship and learnership programmes, are convinced of their
value, and have appropriate structures in place to support it. There
are also major differences here between large employers, some of
whom have their own well-established training infrastructures and
in some cases in-house programmes outside of the apprenticeship
and learnership programmes, and smaller companies many of
whom have few resources to support training.
The Role of Training Providers
Given this evidence, an important priority must be to involve
many employers more fully in the programme. Measures must be
taken to ensure that they understand the value of learnership and
apprenticeship systems, that they meet their needs, and to help
ensure that they have more effective training infrastructure in place.
To achieve this outcome the following steps should be taken:
merSETA should be requested to take a more active and developmental role in working with employers to engage them fully in the learnership and apprenticeship programmes.
It must, of course, be recognised that for most employers training is not their main role, and they may need support if training is to be carried out effectively. This leads to a consideration of training providers.

27merSETA
Given the evidence that training providers should have a key role in
working with employers and apprentices/learners in implementing a
training programme, but that their role in training is often limited and,
further, that they have placed too much emphasis on assessment,
this training role should be clearly specified and monitored in the
following ways:
The type of training required for each programme should be specified;
merSETA should provide some guidelines which specify clearly what is expected of training providers with respect to training as well as assessment;
The implementation of these guidelines should be monitored.
Recruitment and Induction:
Many respondents pointed to problems associated with recruitment
and induction into the learnership programme. Often recruitment
seems to be overly dependent on the role of training providers,
and in many cases the involvement of employers is limited. It was
raised that many training providers, as commercial organisations,
have financial incentives in recruiting learners. As a result it has
been suggested that in a number of cases learners are recruited
to learnership programmes without fully understanding what they
are taking on, and there are instances where this is not the most
appropriate programme for them.
Steps are required to ensure that young people are recruited
into the learnership and apprenticeship programmes when this is
appropriate for them and their employer, and that both the youth
and their employers are fully aware of the opportunities and
responsibilities involved.
Data Collection and Monitoring;
The research has shown that the existing databases do not provide
full and adequate information on the progression of learners and
apprentices enrolled in the programmes. In particular, the data
on learners and apprentices who leave their programmes before
completion are limited. merSETA should be requested to establish
more effective arrangements and guidelines for data gathering
to ensure that the data on progression though learnerships and
apprenticeships are as complete as possible. Mechanisms for
tracking learners or apprentices who change training providers or
move to another programme should be established.
A Review of Targets for the Learnership Programme
While this was not a focus of this research study sufficient
comment emerged from those interviewed for a recommendation
to be formulated. It has been argued by a range of stakeholders
that the current policy focuses too strongly on the issue of targets
which specify “starts” on the programme, and not enough on the
quality of training which learners receive and the outputs from the
programme. It has been suggested in the issues discussed in this
report that there is a need to focus more on the training system,
and a need for quality assurance and contract management
systems which will underpin this. It has been further suggested that
by improving the quality of the training experience which young
people receive, higher completion rates will be achieved. The DoL
should review the targets set to in order to underpin a high-quality,
work-based learnership system while placing greater emphasis on
the quality of training and outputs from the programme rather than
on “starts”.
A final point emerges in respect of the racial disparities, which
remain stark; learnership participants registered at lower NQF
levels are dominated by Africans and the data collected reveals
that the percentage of White learners participating in learnerships
at higher NQF levels is far greater than that of the other race
groups, while the majority of those enrolled for apprenticeships are
White.
28 Impact Assessment Study of Learnerships & Apprenticeships 2008
If the learnership and apprenticeships delivered by merSETA and
the broader SETA environment are to achieve their objectives of
alleviating the acute shortage of critical skills in South Africa it is vital
that everyone involved in the process understand what they are,
how they work and what their purpose is. This chapter examines the
issues related to the organisation and function of the learnerships
and apprenticeships in terms of SETA, employer, training providers
and stakeholder capacity based on implementation case studies
undertaken in five provinces. The perceptual and experiential
reporting is enabling merSETA to effectively improve on the skills
needs of the sector, and strategically achieve its mandate to
effectively, efficiently and impactfully implement the learnership
and apprenticeship programmes. merSETA’s responses and
interventions are explored, including some of the challenges
currently faced in implementation of these processes.
Why participate in Learnerships and Apprenticeships?
The Employer Experience
In-depth interviews and case studies undertaken with employers
reveal they participate in the learnership and apprenticeship
systems because they recognise and acknowledge the need for
training for the future. Additional reasons for participating were
reported as:
Rebates for training;
Opportunity to empower in-house staff;
There is a perception of value attached to learnerships;
The misperception that apprenticeships were to be phased out;
Learnerships are seen to cater for elements that were previously not addressed in the ‘old apprenticeship’ system;
Learnerships are perceived as a progressive process;
It is mechanism to close the gap of the tradesman qualification allowing for a progressive learning process;
The roles and responsibilities are clearly articulated for learner and employer.
The positive aspects favour the learnership process rather than
the apprenticeship system, with employer’s beginning to articulate
a reticence to taking on learners in the workplace based in the
challenges experienced in administration processes and being
recognised as a training institution that “actually gets the learners
qualified”.
Recruitment and Selection
Employer experiences
Employer interviews highlight differences in recruitment, selection
and induction practices provincially. In respect to the induction
process they stress:
A correlation between a thorough induction programme and a high completion level;
‘Thorough’ induction programmes include issues such as health and safety, company policy and procedure;
It is clearly reported that poor induction programmes result in lower success rates.
The learner experience
Learners’ perceptions based on their experiences highlighted the
following:
Most learners had completed an application form and signed an agreement or a contract;
Learners and employers agree that this is less likely to occur in smaller companies;
Learners indicate that the Individual Learning Plan is not used effectively to aid in the progress and structure of learnerships and apprenticeship systems, and are rather seen as “an agreement between the training provider and the employer”;
Employers and training providers are perceived as playing a more prominent role in the recruitment process than the SETA
Despite some variations it seems that merSETA and employers are
adhering to the administrative requirements and regulations of the
learnership and apprenticeship programmes.
Recommendations to improve the recruitment and selection
process are namely:
Communication about learnerships and apprenticeship should be improved, including the benefits to employers, learners and to the economy;
merSETA should enhance its communication and outreach beyond employers to the public at large;
The use of career guidance and other specialists should be encouraged;
The Department of Labour should be involved in the recruitment process.
Chapter 5:Organisation & Function of merSETA Learnership & Apprenticeship Programmes
29merSETA
Workplace learning
Employer perceptions
Employers interviews confirmed that a work culture in which training
is prioritised and valued can have a positive impact on participant
completion rates. Those employers recognised the importance of
support including:
Providing for time off to attend off the job training;
Time at work to undertake portfolio development;
Personal tutoring and mentoring on the job;
Providing opportunities to develop beyond the immediate work role.
This finding should be viewed noting that these supports add
important aspects to the success of programme participants, while
an unsupportive environment contributes directly to the drop out
rate, particularly in cases where the needs of the job supersede
training issues.
Learner perceptions
Peer support has emerged as a contributing factor to the success of learnerships and apprenticeship programmes for learnership and apprenticeship programmes;
Peer support has a positive impact on successful completion of the programme, specifically when it extends to colleagues and beyond immediate supervisors;
Wages and conditions of employment provided by some employers were perceived to have resulted in a low level of staff morale and thus contributing to high levels of turnover.
Quality of training provided
The quality and structure of the training emerged as a key issue
for everyone. There is significant variation between programmes
with respect to how training is provided. It was frequently raised
that the traditional apprenticeship systems offered well-established
programmes with well-structured off-the-job training in FET colleges
or other training centres.
The Shared Employer / Learner Experience
Many respondents who had successfully completed the programme
reflected that overall the experience had been positive based in the
following experiences:
Those receiving on-the-job training reported positively on the link between training and job. It was found that for on-the-job training to be at its most effective it requires input, thought and planning from the employer to ensure alignment of type and level of task required for the programme and to make it a learning experience.
However, it was evident that some training received by young people is little more than “check-listing” with training only revising what they had done at work with no highlighting of learning needs or ways that they could learn from what they were doing. This view was confirmed by learners and employers interviewed, who indicated that in a number of cases training providers did not provide effective support for training.
An issue stresses a significant problem whereby many training providers are only assessing the achievement of competencies and not effectively assisting in ensuring appropriate training plans are in place. This suggests that these require regular review to ensure that the needs of learners are identified and met.
Employers raised issues relating to quality, including criticism of the training methods adopted. Instances were cited where tutors only visited for an hour monthly resulting in trainees believing that they were “not learning anything” contributing to high drop out rates. Equally, it was also reported by both employers and learners that when training consultants are based at the employer’s premises, working with the learners, the drop out rate has been reduced to zero.
Those learners who received off the job training cited the positive factors of an increased focus on learning away from the workplace, and the additional value achieved in meeting other apprentices resulting in the reinforcement of knowledge gained.
A number of employers were critical of Further Education and Training Colleges, noting a lack of support, not taking responsibility for learners individually, and not recognising the difficult transition from a school to an adult education environment as some of the challenges that result in difficulties for those learners who found the work hard.
Employers reported a lack of response to their needs by FET staff.
Quality issues
Issues raised with respect to training and recruitment prompted the
suggestion by a number of respondents that the quality assurance
procedures currently applied were not appropriate and are failing
to deliver a high quality learnership and apprenticeship training
system. Similar concerns were raised by FET colleges indicating
that the authenticity of evidence and quality of training provision
should be monitored. It was suggested that merSETA should focus
on quality of delivery as opposed to speed of completion. These
concerns were recognised by a number of Stakeholders suggesting
that the compliance and performance audits have become too
narrow focusing on processes rather than quality of training.

30 Impact Assessment Study of Learnerships & Apprenticeships 2008
Management Systems in Place to Implement merSETA’s
Guidelines
The employers follow the merSETA instructions and guidelines,
however there are a number of factors that hinder efficient
implementation especially of learnerships, these are identified as:
Theoretical training
The learnership programme was academically structured with the
theory becoming a stumbling block, notably where learners may
have the capacity to do the job but the fundamentals are perceived
or experienced as too complicated and not always appropriate. An
example cited is the requirement for mathematical abilities when
only numerical ability is required. Additionally, employers noted
the theoretical component of the syllabus has changed during
the learnership resulting in employers having to reorganise and
reconfigure the learning context and content.
Assessment and moderation
Assessment of the learning is done according to all deadlines and
the assessor portfolio and feedback is provided on a regular basis.
merSETA carries out moderation four times a year and training
managers do random sample moderation every three months. It
is noted by respondents in the case studies and interviews that the
challenge with the assessment lies in allocating a specific time for
completion, recognising that it is time consuming and assessors
often have multiple functions.
Mentoring policy
The mentoring policy is copied directly from the merSETA,
requiring a SETA registered mentor, qualified in that specific field,
located at each workplace and each learner allocated to a mentor.
However, the registration of Mentors is challenging and accredited
mentors are scarce, difficult to replace if or when required, and are
a prerequisite in the delivering of learnership programmes.
Workplace training
Workplace training exposes learners and apprentices to the same
information as qualified artisans. Constructively this means that
learners are receiving information firsthand; however, the support
for learners is minimal. It is difficult for employers to accommodate
training with production, often viewing training as a cost. For
dealerships in particular the training department is proposing a
comprehensive training programme on the NQF system across the
organisations.
Addressing the skills crisis
A variety of responses were provided as to whether the learnership
and apprenticeship systems are addressing the skills crisis. The
success rate of learners in NQF level 2 was rated positively by
employers; however, what happens thereafter was raised as a
challenge by the same. In terms of employment equity difficulties
were experienced in:
Complying with employment equity quotas specifically in regards to African females;
For those who are targeting the higher training levels, learnership programmes are not seen as addressing the skills crisis citing concerns in respect of too many loopholes, “shady tradesmen” and only 50% of learners qualifying.
Relationship with merSETA
On average the relationship between employers and merSETA
is good. Challenges were raised in respect of the bureaucracy
of SETAs generally and merSETA specifically, the DOL being
responsible for the SETA system construct, limited progress being
made in the Chambers despite increased behind-the-scenes
activity, a disproportionate amount of time spent on technical
issues as opposed to improving training, with unions specifically
being cited in this regard, and site visits to the dealerships often
being missed by merSETA.
Recommendations
Communication
Regular meetings should be held, material updated, and evidence of progress obtained. A dealership needs analysis should be conducted, including how they can be assisted with administration;
To address staff turnover it is recommended that assessors requires refresher course training, and additional training for assessors and moderators be offered;
Case study responses stress that companies who do extremely well should be urged to encourage others to enter the learnership programme;
Respondents recommend advertising through road shows, visits to FET colleges, hosting regular workshops (every second month) and conducting frequent spot checks.
Feedback on how employers are progressing with learners is essential. It is further recommended by respondents that engagement with employers is undertaken to develop a “proper curriculum and plan a system that suits everybody”.
A clear perception among small companies emerges noting they feel to have learnership is burdensome and there is lack of communication between the small companies and merSETA.
31merSETA
Administration
Administration should be reduced at the SETA level. It is noted that the speed at which issues are addressed by merSETA is improving since the centralisation of administration;
Give extension to learners who do not complete within a specific time frame;
Improve certification, trade tests, accreditation and qualification processes;
Revisit all processes, evaluate and align;
Increase turnaround time efficiency and staff motivation; address issues of merSETA being under-capacitated and under-capacity;
Consistency of contact person for each company dealing with merSETA to reduce communication issues;
Development of effective assessment tools, including “closing portfolios loopholes ensuring that evidence provided by the assessment processes gives a true evaluation of the learners’ potential”.
Accountability
merSETA needs to take cognisance of the urgency to implement learnerships and apprenticeships in addressing the skills shortage;
merSETA should advance inter-departmental cooperation and alignment, adopting a focus on an outcomes-based approach with a clear understanding of the strategic context of the skills shortage in South Africa.
Training provider capacity
This section reports specifically on the perceptions and experiences
of Training Providers in respect of their capacity to implement the
learnership and apprenticeship system.
Nature of relationship with merSETA
merSETA engages with the college’s curriculum developers
and campuses are then informed by the colleges of total intake
numbers. The campuses are then responsible for the learning
logistical arrangements. The colleges communicate separately
with merSETA and Employers. merSETA assigns learners to each
college and monitors their progress on a monthly basis. Additionally
colleges are required to complete a monthly report which includes
a constructive counsel improvement questionnaire.
Organisation to accommodate both learnerships
and N - coursesSpecific and special arrangements have been made for the
intake of learners in respect of facilitators and classrooms. Where
learners have been assigned by companies, matric is the required
baseline for enrolment. Enrolment type and number is depends on
the selected course with boilermakers, motor mechanics and fitters
being immediately accommodated and the available equipment
defining the NQF level. The learnership fits in well with the NVC
courses; the colleges are running training modules and their own
short – term skills training with limited difference between the two
bar the level of paperwork required which is perceived as diverting
attention and effort from actual teaching.
Capacity to offer modules
Most of the colleges included in the site survey have the required,
appropriate capacity and are offering the learnership modules
at the correct level, confirmed by merSETA. It is noted that the
duration of a learnership is 6 months; however, last year due to the
teachers’ strike, this was stretched to 8 months.
In relation to capacity colleges practice the “safety rule” ratio of 12
learners in a workshop to I lecturer.
Assessment and moderation
The colleges are guided by the requirements of the SETA.
Challenges with assessment have been listed as:
Evidence is based on limited details that do not provide a briad profile of learner capacity and capability potential. According to facilitators it would be better to conduct assessments at the end of the learnership as one single integrated assessment.
The assessment administration is too cumbersome and should be streamlined.
Facilitators have a strong view on the apprenticeships system in relation to assessment, with a specific call for the introduction of an assignment or test mark for each unit standard.
Challenges
The most significant challenges are noted as:
Human resources: Difficulties experienced in finding and convincing skilled trade test artisans to work for colleges when industry is offering better packages;
Infrastructure: Issues pertaining to insufficient funding for general equipment and infrastructure are raised, further noting that specific equipment utilised in specific trade is difficult to resource;
Leadership and N-course: The phasing out of N–courses is seen as problematic, noting that matriculants have traditionally opted to go to college to do N–courses; added to this companies are still looking for N3 graduates.
32 Impact Assessment Study of Learnerships & Apprenticeships 2008
Relationship with employers
Findings’ stemming from case study analysis reveals the following
issues, challenges and perceptions:
No close relationship exists with Employers. The engagement rests only on updates of attendance of registered learners and the subsidy status.
Subsidies are viewed as problematic by Facilitators who believe they have become a dominate motivator for companies to participate in training as apposed to effective training.
Companies’ primary focus is on the business related activities of production, not training, and therefore they are not always equipped to effectively conduct training with learners who are assigned to tasks not related to training.
Follow up of learners post-employment
It is a challenge for learners after completing NQF Level 2 to find
channels for further learning, especially as FET colleges have no
authority to liaise with employers post-completion of training.
Concerns
The following summarise the major concerns raised in the case
study responses:
Continuation: Learners are being trained in a particular learnership in the absence of a continuum of training. For example, learners having completed their NQF Level 2 are not employable and should be in a programme that immediately moves to the next level only finishing when an artisan qualification is attained. This would require merSETA to develop a strategy which allows companies to take learners on a three year basis to qualification completion.
Employers: Currently Employers take on learners for a single learnership conducted over a one year period. As this learner is not yet employable, it is proposed that companies have dedicated mentors who will guide learners to completing the unit standards to the benefit of the learner. This learner is then employable and the companies will have access to a pool of skilled artisans.
Administration: The learnership is “too paper intensive”, with responses stressing that training should be more practical, with all parties, training providers and employers, participating in the development of curriculum.
merSETA’s capacity to implement the learnerships and apprenticeships system In the interview process for this study included engagement with
merSETA officials on factors that have influenced the SETA’s
performance over the last two years.
The general consensus was that a SETA must be seen as a
business and not a parastatal. Therefore, the focus has been
on developing a business model outlook for the organisation,
restructuring to enhance delivery, sharpening the organisation’s
image, addressing service delivery excellence and implementing
good governance. Strategic thrusts were determined giving rise to
four main targets, namely;
Increase the labour pool;
Set the scene for new learners in the various sectors;
Address the work readiness of ABET;
Address scarce and critical skills.
In order to increase the labour pool an acceleration programme
has been developed which encourages companies to train an
increased number of learners. Further, a service division has been
established with incentivised client liaison offices. Incentives to
companies have been increased substantially for apprenticeship
training. The accelerator programme has been gaining momentum
and is advancing on realising the following targets:
Attainment of the 65% target is required;
WSPs must be in place;
Levy payments must be on time;
A work skills committee must be in place.
Additionally, 2-year MOUs have been drawn up with companies,
with the partnerships tasked to deliver 400 000 apprentices over
2 years. It is noted that emphasis is equally placed on small
companies, recognising that whilst they have a low uptake of
learners they have a very high pass rate.
Challenges
Challenges were noted as:
Artisans are getting older and younger people need to be inculcated into the importance of technical training;
Quality assurance is important and therefore an increased emphasise on training assessors is required;
Provision at FET colleges is crucial and needs to be addressed in order to have sufficient infrastructure to cater for training needs;
SAKE is required: skills, attitude, knowledge and expertise.
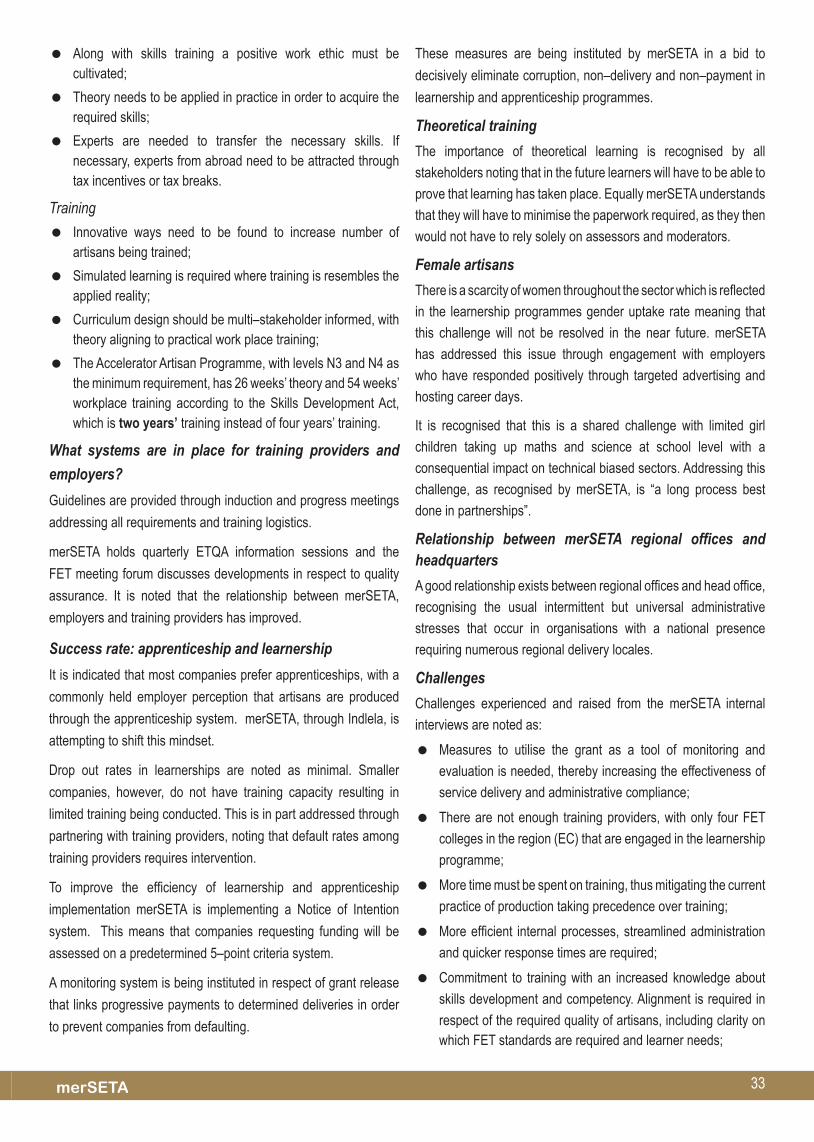
33merSETA
Along with skills training a positive work ethic must be cultivated;
Theory needs to be applied in practice in order to acquire the required skills;
Experts are needed to transfer the necessary skills. If necessary, experts from abroad need to be attracted through tax incentives or tax breaks.
Training
Innovative ways need to be found to increase number of artisans being trained;
Simulated learning is required where training is resembles the applied reality;
Curriculum design should be multi–stakeholder informed, with theory aligning to practical work place training;
The Accelerator Artisan Programme, with levels N3 and N4 as the minimum requirement, has 26 weeks’ theory and 54 weeks’ workplace training according to the Skills Development Act, which is two years’ training instead of four years’ training.
What systems are in place for training providers and
employers?
Guidelines are provided through induction and progress meetings
addressing all requirements and training logistics.
merSETA holds quarterly ETQA information sessions and the
FET meeting forum discusses developments in respect to quality
assurance. It is noted that the relationship between merSETA,
employers and training providers has improved.
Success rate: apprenticeship and learnership
It is indicated that most companies prefer apprenticeships, with a
commonly held employer perception that artisans are produced
through the apprenticeship system. merSETA, through Indlela, is
attempting to shift this mindset.
Drop out rates in learnerships are noted as minimal. Smaller
companies, however, do not have training capacity resulting in
limited training being conducted. This is in part addressed through
partnering with training providers, noting that default rates among
training providers requires intervention.
To improve the efficiency of learnership and apprenticeship
implementation merSETA is implementing a Notice of Intention
system. This means that companies requesting funding will be
assessed on a predetermined 5–point criteria system.
A monitoring system is being instituted in respect of grant release
that links progressive payments to determined deliveries in order
to prevent companies from defaulting.
These measures are being instituted by merSETA in a bid to
decisively eliminate corruption, non–delivery and non–payment in
learnership and apprenticeship programmes.
Theoretical training
The importance of theoretical learning is recognised by all
stakeholders noting that in the future learners will have to be able to
prove that learning has taken place. Equally merSETA understands
that they will have to minimise the paperwork required, as they then
would not have to rely solely on assessors and moderators.
Female artisans
There is a scarcity of women throughout the sector which is reflected
in the learnership programmes gender uptake rate meaning that
this challenge will not be resolved in the near future. merSETA
has addressed this issue through engagement with employers
who have responded positively through targeted advertising and
hosting career days.
It is recognised that this is a shared challenge with limited girl
children taking up maths and science at school level with a
consequential impact on technical biased sectors. Addressing this
challenge, as recognised by merSETA, is “a long process best
done in partnerships”.
Relationship between merSETA regional offices and headquarters
A good relationship exists between regional offices and head office,
recognising the usual intermittent but universal administrative
stresses that occur in organisations with a national presence
requiring numerous regional delivery locales.
Challenges
Challenges experienced and raised from the merSETA internal
interviews are noted as:
Measures to utilise the grant as a tool of monitoring and evaluation is needed, thereby increasing the effectiveness of
service delivery and administrative compliance;
There are not enough training providers, with only four FET colleges in the region (EC) that are engaged in the learnership
programme;
More time must be spent on training, thus mitigating the current practice of production taking precedence over training;
More efficient internal processes, streamlined administration and quicker response times are required;
Commitment to training with an increased knowledge about skills development and competency. Alignment is required in
respect of the required quality of artisans, including clarity on which FET standards are required and learner needs;

34 Impact Assessment Study of Learnerships & Apprenticeships 2008
Managing the human resources practitioner with the necessary skills in regards to coaching/mentoring in order to assess the potential impact of the managers on training.
Conclusion
The learnership and apprenticeship systems are ideal training
systems in the upliftment of skills. It is recognised that the challenges
faced currently lie mainly in respect to the SETA system, primarily
requirements and bureaucracies that are, in the main, a response
to prevention of system abuse and corruption. This however has
had a negative impact on both merSETA and Employers who are
neither abusing the system, nor delivering poor training services.
The principal challenges identified for intervention in respect of the
learnership programme are the level of required paperwork, the
bureaucratic red tape, the slow processing pace and the limited
training period which remains orientated towards the theoretical.
The majority of study participants believe that the apprenticeship
system is better because if a person is employed over a certain
period, they have security of employment and are more inclined to
excel in training.
35merSETA
AnnexureANNEXURE A: List of learnerships
merSETA registered learners in 106 different learnership programmes over the past approximately eight years. Table 2.23 lists all
these learnership programmes and also shows the number of participants who completed, terminated or are still registered with these
learnerships.
List of all learnership programmes by enrolment numbers and completion status
Learnership
number
Com
plet
ed
Reg
iste
red
Term
inat
ed
Tota
l
National Certificate in Manufacturing, Engineering and Related Activities: NQF Level 1 3 710 1 128 2 305 7 143National Certificate in Automotive Component Manufacturing and Assembly: NQF Level 2 781 767 611 2 159National Certificate in Servicing Vehicles: NQF Level 2 (Passenger, light delivery) 641 286 147 1 074National Certificate in Engineering Fabrication: NQF Level 2 (Boilermaker) 294 349 114 757National Certificate in Metal and Engineering Manufacturing Processes: NQF Level 2 348 186 71 605National Certificate in Mechatronics: NQF Level 2 338 244 21 603National Certificate in Automotive Repair and Maintenance (Passenger and Light Delivery Vehicle): NQF
Level 2185 352 20 557
National Certificate: Service Station Operations NQF: Level 2 0 502 0 502National Certificate In Welding (Downhand Welding: Plates): NQF Level 2 104 207 125 436National Certificate in Maintaining Vehicles: NQF Level 3 (Passenger, light delivery) 197 164 30 391National Certificate in servicing vehicles: NQF Level 2 (Earth-moving Equipment) 290 31 47 368National Certificate in Motor Sales and Support Services: NQF Level 4 (Vehicle Sales) 98 166 77 341National Certificate in Mechanical Engineering (Fitting): NQF Level 2 (Fitter) 148 153 35 336National Certificate in Iron and Steel Manufacturing: NQF Level 2 206 93 20 319National Certificate in Management Level 3 (Team Leader) 55 243 19 317National Certificate in Polymer Composite Fabrication: NQF Level 2 196 55 30 281
National Certificate in Mechanical Engineering (Fitting and Machining): NQF Level 2 (Fitter and Turner) 121 94 52 267
National Certificate in Air-conditioning, Refrigeration and Ventilation: NQF Level 2 174 23 61 258National Certificate in Air-conditioning, Refrigeration and Ventilation: Level 2 (Reviewed) 128 108 10 246National Certificate in Autotronics: NQF Level 2 155 64 26 245National Certificate in Servicing Vehicles: NQF Level 2 (Commercial Vehicles) 68 110 65 243National Certificate in New Venture Creation (SMME): NQF Level 2 0 194 37 231National Certificate in Engineering Fabrication: NQF Level 2 (Sheetmetal Worker) 71 94 57 222National Certificate in Mechanical Engineering (Machining): NQF Level 2 (Turner) 134 47 29 210National Certificate in Plastics Manufacturing: NQF Level 2 125 36 49 210National Certificate in Maintaining Vehicles: NQF Level 3 (Earth-moving Equipment) 66 112 6 184National Certificate in Automotive Repair and Maintenance (Earth-moving Equipment): NQF Level 2 37 143 0 180National Certificate in Motor Sales and Support Services: NQF Level 4 0 125 52 177National Certificate in Mechanical Engineering (Machining): NQF Level 2 (Tool, Jig and Die Maker) 90 57 15 162National Certificate in Air-conditioning, Refrigeration and Ventilation: Level 3 (Reviewed) 108 32 14 154National Certificate In Plastics Manufacturing : NQF Level 2 (Reviewed) 25 115 0 140National Certificate in Automotive Component Manufacturing and Assembly: NQF Level 3 65 59 0 124National Certificate in Mechatronics: NQF Level 3 86 33 4 123National Certificate in Automotive Repair and Maintenance (Commercial Vehicle): NQF Level 2 33 79 7 119National Certificate in Management: NQF Level 4 0 95 9 104National Certificate in Professional Driving: NQF Level 3 0 99 0 99National Certificate in Engineering Fabrication (Light or Heavy): NQF Level 3 (Boilermaker) 45 43 4 92National Certificate in Autotronics: NQF Level 3 67 17 6 90National Certificate in Mechanical Engineering (Fitting): NQF Level 3 (fitter) 53 26 3 82National Certificate in Mechatronics: NQF Level 4 41 32 2 75National Certificate in Air-conditioning, Refrigeration and Ventilation: NQF Level 3 40 18 11 69
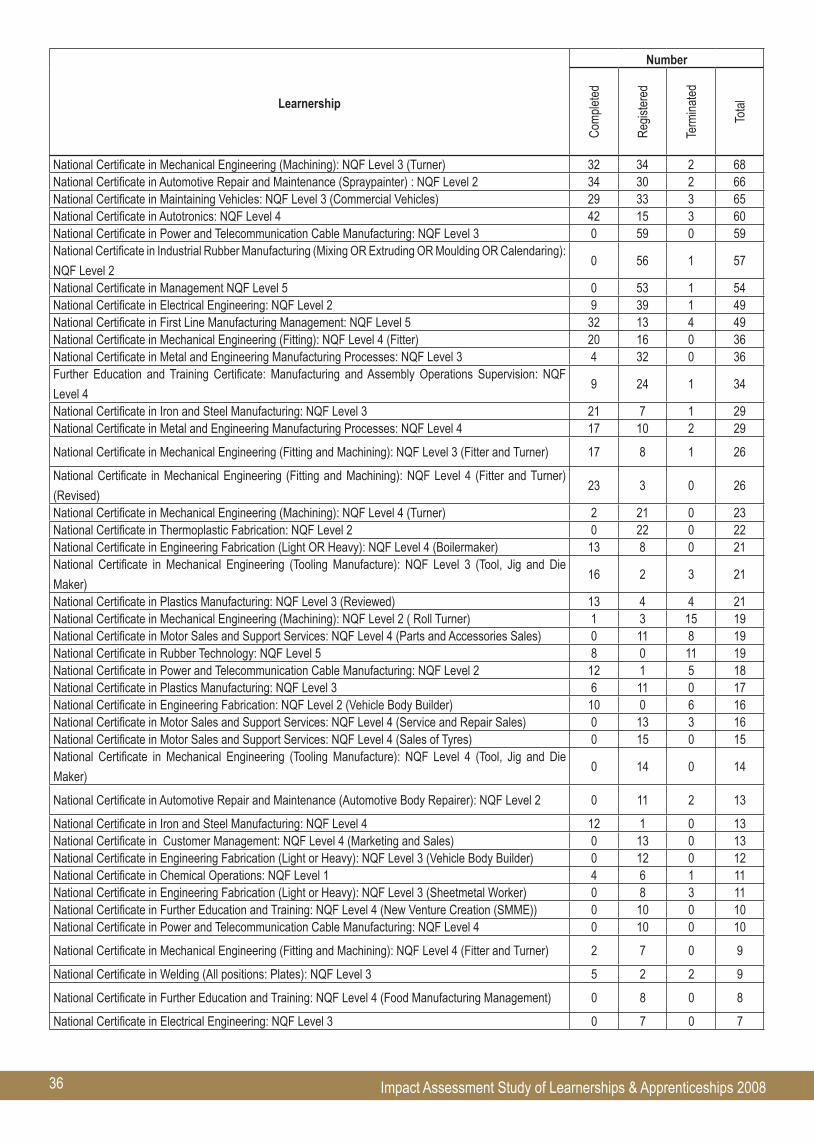
36 Impact Assessment Study of Learnerships & Apprenticeships 2008
Learnership
number
Com
plet
ed
Reg
iste
red
Term
inat
ed
Tota
l
National Certificate in Mechanical Engineering (Machining): NQF Level 3 (Turner) 32 34 2 68National Certificate in Automotive Repair and Maintenance (Spraypainter) : NQF Level 2 34 30 2 66National Certificate in Maintaining Vehicles: NQF Level 3 (Commercial Vehicles) 29 33 3 65National Certificate in Autotronics: NQF Level 4 42 15 3 60National Certificate in Power and Telecommunication Cable Manufacturing: NQF Level 3 0 59 0 59National Certificate in Industrial Rubber Manufacturing (Mixing OR Extruding OR Moulding OR Calendaring):
NQF Level 20 56 1 57
National Certificate in Management NQF Level 5 0 53 1 54National Certificate in Electrical Engineering: NQF Level 2 9 39 1 49National Certificate in First Line Manufacturing Management: NQF Level 5 32 13 4 49National Certificate in Mechanical Engineering (Fitting): NQF Level 4 (Fitter) 20 16 0 36National Certificate in Metal and Engineering Manufacturing Processes: NQF Level 3 4 32 0 36Further Education and Training Certificate: Manufacturing and Assembly Operations Supervision: NQF
Level 49 24 1 34
National Certificate in Iron and Steel Manufacturing: NQF Level 3 21 7 1 29National Certificate in Metal and Engineering Manufacturing Processes: NQF Level 4 17 10 2 29
National Certificate in Mechanical Engineering (Fitting and Machining): NQF Level 3 (Fitter and Turner) 17 8 1 26
National Certificate in Mechanical Engineering (Fitting and Machining): NQF Level 4 (Fitter and Turner)
(Revised)23 3 0 26
National Certificate in Mechanical Engineering (Machining): NQF Level 4 (Turner) 2 21 0 23National Certificate in Thermoplastic Fabrication: NQF Level 2 0 22 0 22National Certificate in Engineering Fabrication (Light OR Heavy): NQF Level 4 (Boilermaker) 13 8 0 21National Certificate in Mechanical Engineering (Tooling Manufacture): NQF Level 3 (Tool, Jig and Die
Maker)16 2 3 21
National Certificate in Plastics Manufacturing: NQF Level 3 (Reviewed) 13 4 4 21National Certificate in Mechanical Engineering (Machining): NQF Level 2 ( Roll Turner) 1 3 15 19National Certificate in Motor Sales and Support Services: NQF Level 4 (Parts and Accessories Sales) 0 11 8 19National Certificate in Rubber Technology: NQF Level 5 8 0 11 19National Certificate in Power and Telecommunication Cable Manufacturing: NQF Level 2 12 1 5 18National Certificate in Plastics Manufacturing: NQF Level 3 6 11 0 17National Certificate in Engineering Fabrication: NQF Level 2 (Vehicle Body Builder) 10 0 6 16National Certificate in Motor Sales and Support Services: NQF Level 4 (Service and Repair Sales) 0 13 3 16National Certificate in Motor Sales and Support Services: NQF Level 4 (Sales of Tyres) 0 15 0 15National Certificate in Mechanical Engineering (Tooling Manufacture): NQF Level 4 (Tool, Jig and Die
Maker)0 14 0 14
National Certificate in Automotive Repair and Maintenance (Automotive Body Repairer): NQF Level 2 0 11 2 13
National Certificate in Iron and Steel Manufacturing: NQF Level 4 12 1 0 13National Certificate in Customer Management: NQF Level 4 (Marketing and Sales) 0 13 0 13National Certificate in Engineering Fabrication (Light or Heavy): NQF Level 3 (Vehicle Body Builder) 0 12 0 12National Certificate in Chemical Operations: NQF Level 1 4 6 1 11National Certificate in Engineering Fabrication (Light or Heavy): NQF Level 3 (Sheetmetal Worker) 0 8 3 11National Certificate in Further Education and Training: NQF Level 4 (New Venture Creation (SMME)) 0 10 0 10National Certificate in Power and Telecommunication Cable Manufacturing: NQF Level 4 0 10 0 10
National Certificate in Mechanical Engineering (Fitting and Machining): NQF Level 4 (Fitter and Turner) 2 7 0 9
National Certificate in Welding (All positions: Plates): NQF Level 3 5 2 2 9
National Certificate in Further Education and Training: NQF Level 4 (Food Manufacturing Management) 0 8 0 8
National Certificate in Electrical Engineering: NQF Level 3 0 7 0 7
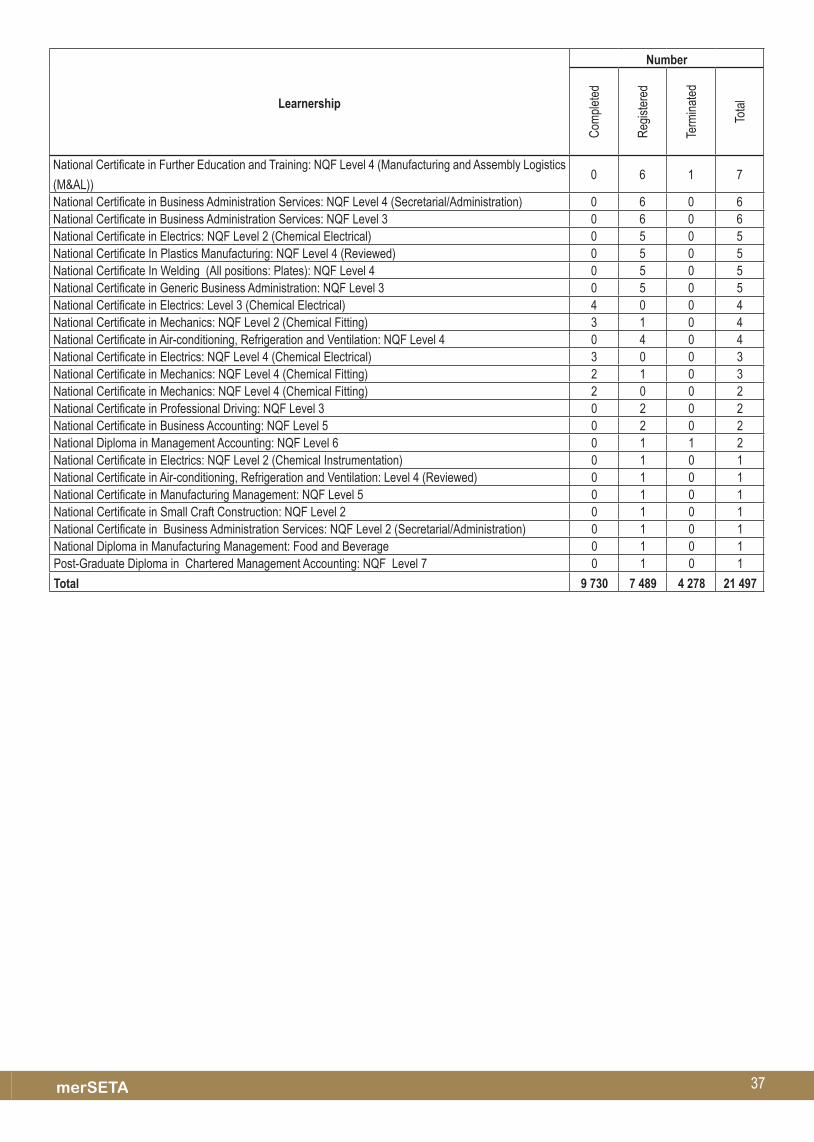
37merSETA
Learnership
number
Com
plet
ed
Reg
iste
red
Term
inat
ed
Tota
l
National Certificate in Further Education and Training: NQF Level 4 (Manufacturing and Assembly Logistics
(M&AL)) 0 6 1 7
National Certificate in Business Administration Services: NQF Level 4 (Secretarial/Administration) 0 6 0 6National Certificate in Business Administration Services: NQF Level 3 0 6 0 6National Certificate in Electrics: NQF Level 2 (Chemical Electrical) 0 5 0 5National Certificate In Plastics Manufacturing: NQF Level 4 (Reviewed) 0 5 0 5National Certificate In Welding (All positions: Plates): NQF Level 4 0 5 0 5National Certificate in Generic Business Administration: NQF Level 3 0 5 0 5National Certificate in Electrics: Level 3 (Chemical Electrical) 4 0 0 4National Certificate in Mechanics: NQF Level 2 (Chemical Fitting) 3 1 0 4National Certificate in Air-conditioning, Refrigeration and Ventilation: NQF Level 4 0 4 0 4National Certificate in Electrics: NQF Level 4 (Chemical Electrical) 3 0 0 3National Certificate in Mechanics: NQF Level 4 (Chemical Fitting) 2 1 0 3National Certificate in Mechanics: NQF Level 4 (Chemical Fitting) 2 0 0 2National Certificate in Professional Driving: NQF Level 3 0 2 0 2National Certificate in Business Accounting: NQF Level 5 0 2 0 2National Diploma in Management Accounting: NQF Level 6 0 1 1 2National Certificate in Electrics: NQF Level 2 (Chemical Instrumentation) 0 1 0 1National Certificate in Air-conditioning, Refrigeration and Ventilation: Level 4 (Reviewed) 0 1 0 1National Certificate in Manufacturing Management: NQF Level 5 0 1 0 1National Certificate in Small Craft Construction: NQF Level 2 0 1 0 1National Certificate in Business Administration Services: NQF Level 2 (Secretarial/Administration) 0 1 0 1National Diploma in Manufacturing Management: Food and Beverage 0 1 0 1Post-Graduate Diploma in Chartered Management Accounting: NQF Level 7 0 1 0 1
Total 9 730 7 489 4 278 21 497
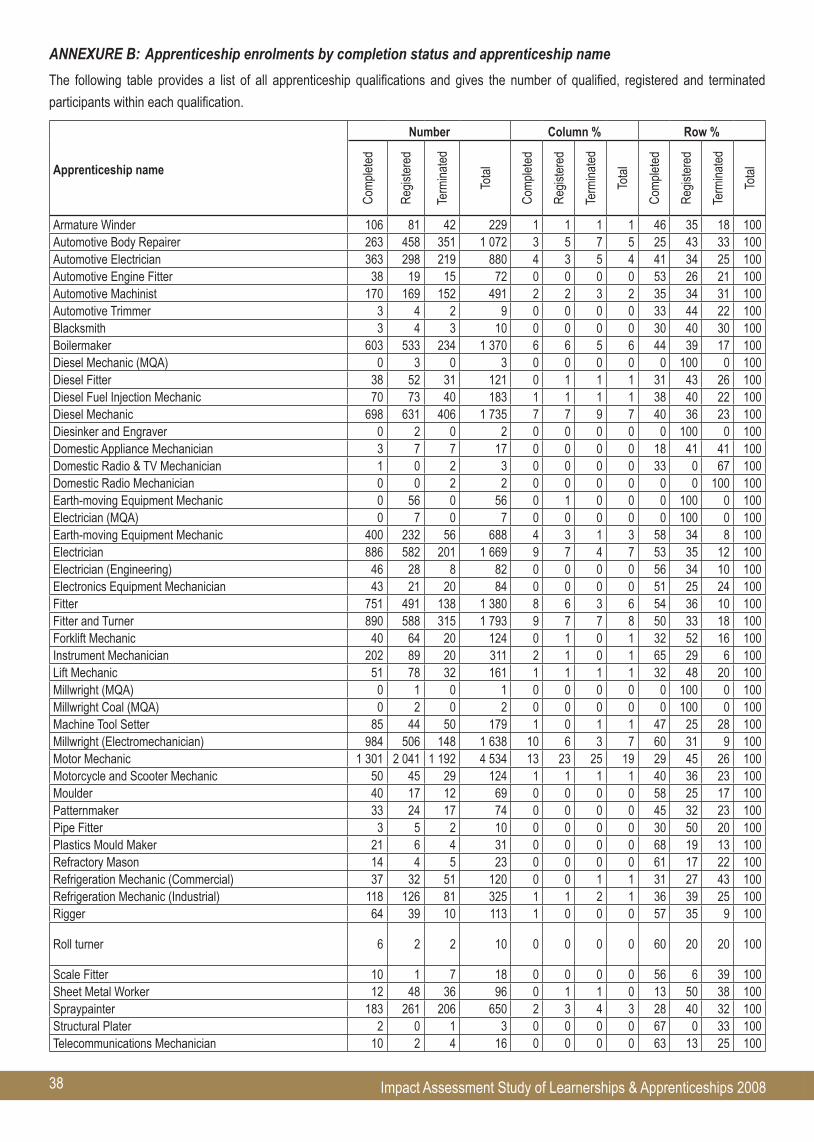
38 Impact Assessment Study of Learnerships & Apprenticeships 2008
ANNEXURE B: Apprenticeship enrolments by completion status and apprenticeship name
The following table provides a list of all apprenticeship qualifications and gives the number of qualified, registered and terminated
participants within each qualification.
apprenticeship name
number Column % row %
Com
plet
ed
Reg
iste
red
Term
inat
ed
Tota
l
Com
plet
ed
Reg
iste
red
Term
inat
ed
Tota
l
Com
plet
ed
Reg
iste
red
Term
inat
ed
Tota
l
Armature Winder 106 81 42 229 1 1 1 1 46 35 18 100Automotive Body Repairer 263 458 351 1 072 3 5 7 5 25 43 33 100Automotive Electrician 363 298 219 880 4 3 5 4 41 34 25 100Automotive Engine Fitter 38 19 15 72 0 0 0 0 53 26 21 100Automotive Machinist 170 169 152 491 2 2 3 2 35 34 31 100Automotive Trimmer 3 4 2 9 0 0 0 0 33 44 22 100Blacksmith 3 4 3 10 0 0 0 0 30 40 30 100Boilermaker 603 533 234 1 370 6 6 5 6 44 39 17 100Diesel Mechanic (MQA) 0 3 0 3 0 0 0 0 0 100 0 100Diesel Fitter 38 52 31 121 0 1 1 1 31 43 26 100Diesel Fuel Injection Mechanic 70 73 40 183 1 1 1 1 38 40 22 100Diesel Mechanic 698 631 406 1 735 7 7 9 7 40 36 23 100Diesinker and Engraver 0 2 0 2 0 0 0 0 0 100 0 100Domestic Appliance Mechanician 3 7 7 17 0 0 0 0 18 41 41 100Domestic Radio & TV Mechanician 1 0 2 3 0 0 0 0 33 0 67 100Domestic Radio Mechanician 0 0 2 2 0 0 0 0 0 0 100 100Earth-moving Equipment Mechanic 0 56 0 56 0 1 0 0 0 100 0 100Electrician (MQA) 0 7 0 7 0 0 0 0 0 100 0 100Earth-moving Equipment Mechanic 400 232 56 688 4 3 1 3 58 34 8 100Electrician 886 582 201 1 669 9 7 4 7 53 35 12 100Electrician (Engineering) 46 28 8 82 0 0 0 0 56 34 10 100Electronics Equipment Mechanician 43 21 20 84 0 0 0 0 51 25 24 100Fitter 751 491 138 1 380 8 6 3 6 54 36 10 100Fitter and Turner 890 588 315 1 793 9 7 7 8 50 33 18 100Forklift Mechanic 40 64 20 124 0 1 0 1 32 52 16 100Instrument Mechanician 202 89 20 311 2 1 0 1 65 29 6 100Lift Mechanic 51 78 32 161 1 1 1 1 32 48 20 100Millwright (MQA) 0 1 0 1 0 0 0 0 0 100 0 100Millwright Coal (MQA) 0 2 0 2 0 0 0 0 0 100 0 100Machine Tool Setter 85 44 50 179 1 0 1 1 47 25 28 100Millwright (Electromechanician) 984 506 148 1 638 10 6 3 7 60 31 9 100Motor Mechanic 1 301 2 041 1 192 4 534 13 23 25 19 29 45 26 100Motorcycle and Scooter Mechanic 50 45 29 124 1 1 1 1 40 36 23 100Moulder 40 17 12 69 0 0 0 0 58 25 17 100Patternmaker 33 24 17 74 0 0 0 0 45 32 23 100Pipe Fitter 3 5 2 10 0 0 0 0 30 50 20 100Plastics Mould Maker 21 6 4 31 0 0 0 0 68 19 13 100Refractory Mason 14 4 5 23 0 0 0 0 61 17 22 100Refrigeration Mechanic (Commercial) 37 32 51 120 0 0 1 1 31 27 43 100Refrigeration Mechanic (Industrial) 118 126 81 325 1 1 2 1 36 39 25 100Rigger 64 39 10 113 1 0 0 0 57 35 9 100
Roll turner 6 2 2 10 0 0 0 0 60 20 20 100
Scale Fitter 10 1 7 18 0 0 0 0 56 6 39 100Sheet Metal Worker 12 48 36 96 0 1 1 0 13 50 38 100Spraypainter 183 261 206 650 2 3 4 3 28 40 32 100Structural Plater 2 0 1 3 0 0 0 0 67 0 33 100Telecommunications Mechanician 10 2 4 16 0 0 0 0 63 13 25 100
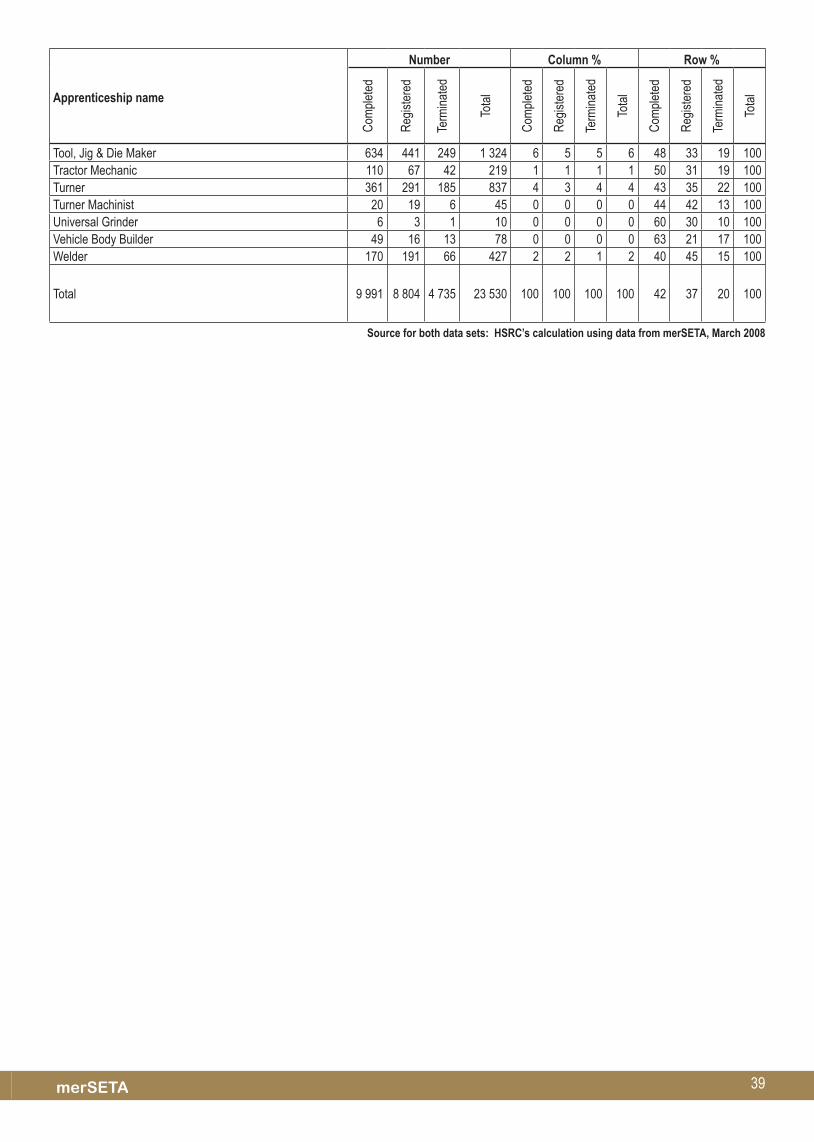
39merSETA
apprenticeship name
number Column % row %
Com
plet
ed
Reg
iste
red
Term
inat
ed
Tota
l
Com
plet
ed
Reg
iste
red
Term
inat
ed
Tota
l
Com
plet
ed
Reg
iste
red
Term
inat
ed
Tota
l
Tool, Jig & Die Maker 634 441 249 1 324 6 5 5 6 48 33 19 100Tractor Mechanic 110 67 42 219 1 1 1 1 50 31 19 100Turner 361 291 185 837 4 3 4 4 43 35 22 100Turner Machinist 20 19 6 45 0 0 0 0 44 42 13 100Universal Grinder 6 3 1 10 0 0 0 0 60 30 10 100Vehicle Body Builder 49 16 13 78 0 0 0 0 63 21 17 100Welder 170 191 66 427 2 2 1 2 40 45 15 100
Total 9 991 8 804 4 735 23 530 100 100 100 100 42 37 20 100
Source for both data sets: hSrC’s calculation using data from merSETa, march 2008

40 Impact Assessment Study of Learnerships & Apprenticeships 2008
noTES


![Predgovor [Foreword].](https://static.fdokumen.com/doc/165x107/63333df9ce61be0ae50e8cf4/predgovor-foreword-1681982858.jpg)