FOR WASTE BIOMASS TO ETHANOL - UNT Digital Library
294
SCREENING STUDY FOR WASTE BIOMASS TO ETHANOL PRODUCTION FACILITY USING THE AMOCO PROCESS IN NEW YORK STATE
-
Upload
khangminh22 -
Category
Documents
-
view
0 -
download
0
Transcript of FOR WASTE BIOMASS TO ETHANOL - UNT Digital Library
SCREENING STUDY FOR WASTE BIOMASS TO ETHANOL
PRODUCTION FACILITY USING THE AMOCO PROCESS IN NEW YORK STATE
The New York State Energy Research and Development Authority (NYSERDA) is a public benefit corporation created in 1975 by the New York State Legislature. A 13-member board governs NYSERDA.
NYSERDA's primary mission is to carry out a broad program of energy research, development and demonstration projects designed to develop and apply efficient technologies to help ensure that New York has secure and economical future supplies of energy, while protecting environmental values and promoting economic growth.
NYSERDA derives its basic research revenues from an assessment levied on the intrastate sales of New York State's investor-owned electric and gas utilities. Additional research dollars come from limited corporate funds and a voluntary annual contribution by the New York Power Authority.
In its research program, NYSERDA stresses consultation and collaboration with other organizations, including utilities, universities, industries, private engineering and scientific research firms, local governments, and State and Federal agencies. These efforts stretch NYSERDA's limited research funds and ensure the involvement of those who can use the results of the research.
NYSERDA also has responsibility for:
Managing the 3,300-acre Western New York Nuclear Service Center at West Valley 35 miles south of Buffalo, the site of a former commercial nuclear fuel reprocessing plant and a low-level radioactive waste disposal area. These responsibilities include:
- Participating in the West Valley Demonstration Project, a joint FederaVState effort to solidify the high-level radioactive wastes left over from the reprocessing operation and to clean up the facilities used.
- Mainmining the portion of the site not being used in the Demonstration Project, including the shut-down low-level radioactive waste disposal area.
Issuing tax-exempt bonds to finance facilities for electric and gas utilities and energy projects for private companies.
Constructing and operating facilities for disposal of low-level radioactive wastes produced in New York State, once the disposal method and site decisions have been made by the State Low-Level Radioactive Waste Siting Commission and approvals have been issued by State regulatory authorities.
Managing a 365-acre portion of a Superfund clean-up site in Malta, 20 miles north of Albany. Part of the site was once owned by the Federal government. Portions of it have been used by the Federal government and its contractors since the 1940s for activities that have included rocket engine and fuel testing, weapons testing, and space research.
For more information, contact the Technical Communications Unit, NYSERDA, 2 Empire State Plaza, Suite 1901, Albany, New York 12223-1253, (518) 465-6251.
State of New York George E. Pataki, Governor
Energy Research and Development Authority F. William Valentino,
President
New York State Energy Research and Development Authority Two Empire State Plaza. Suite 1901 0 Albany. New York 12223-1253 (518) 465-6251 Fax: (518) 432-9474
A NYSERDA Reuort in Brief
Report: Screening Study to Site a Biomass-to-Ethanol Production Facility Report 95-13
Project Manager: Judy Jarnefeld
Contractor: Stone & Webster Engineering Corporation
Background: In 1994, the New York City Department of Sanitation (NYCDOS) intended to solicit proposals for a City-based recycling facility using mixed waste paper. Because Amoco was interested in manufacturing ethanol from biomass, it proposed to do a siting screen in NYC, after which the study was expanded to include upstate locations as well.
Objectives: The objective was to identify and evaluate two sites in New York City and three sites in other New York State urban centers that would be appropriate for construction and long-term operation of a financially attractive and environmentally sound waste biomass-to-ethanol production facility using Amoco's biomass conversion technology (the "Amoco Process").
R&D Results: Siting information was gathered and used to identify two.sites in New York City: Arthur Kill and Procter & Gamble, and 23 sites in four upstate urban centers (Buffalo, Rochester, Syracuse, and Albany). Many site and business issues applied generically to all areas of the State. For example, process requirements affecting site selection and economic evaluation included minimum feedstock supply and quality; product and waste yields; emission characteristics; acreage and preferred shape of site; generic equipment costs; and utility, chemical, transportation, and storage requirements. Community issues included zoning, permitting, and environmental impacts.
Minimum feedstock supply for an economical plant was determined to be 500 tons/day (tpd). Wood, paper sludge, and yard waste were considered as supplements. Feedstocks in each of the four upstate regions were available to support a 500-tpd plant, but no larger; New York City could support a plant twice that size. Financial evaluations included cost of site work, utility hookups, and tipping fees. Capital costs were similar for all feedstocks studied. For both upstate and New York City, two approaches were studied: on-site oxidation of the solid by-product to generate energy, or transportation off site. In New York City, total capital cost, including the process island, balance of plant, site improvements, and land costs, were $139 million for on-site and $102 million for off-site oxidation. For a 1000-tpd plant in NYC, economies of scale provide costs of $223 million and $169 million, respectively. Upstate, the costs are $113 to $117 million with on-site oxidation, and $84 to $88 million without oxidation. (Labor costs varied among regions.) For Syracuse, the most economical upstate region, a biomass tipping fee of $35.59/ton was required to reach an ethanol sale price of $1.20/gallon. In New York City, $38/ton is needed to reach $1.20/gallon at the 500-tpd size, while only $6/ton is needed for the 1000-tpd plant.
The NYCDOS solicitation has not yet been issued, as markets for scrap paper have changed since 1994. This change in plans makes construction of an ethanol facility by Amoco in New York City unlikely, as paper supplies would be difficult to secure without NYCDOS aid. Upstate results, without economic development incentives, also did not appear compelling.
Copies Available: A limited number of copies of the full report are available from New York State Energy Research and Development Authority, 2 Empire State Plaza, Suite 1901, Albany, New York 12223-1253; (518) 465- 6251, ext. 241.
SCREENING STUDY FOR WASTE BIOMASS TO ETHANOL PRODUCTION FACILITY USING THE AMOCO
PROCESS IN NEW YORK STATE
Final Report
Prepared for
THE NEW YORK STATE ENERGY RESEARCH AND DEVELOPMENT AUTHORITY
Project Manager Judy Jarnefeld
and
NATIONAL RENEWABLE ENERGY LABORATORY AMOCO NYNEX
CHAMPION INTERNATIONAL STONE & WEBSTER DEVELOPMENT CORPORATION
Prepared by
STONE & WEBSTER ENGINEERING CORPORATION One Perm Plaza
250 West 34th Street New York, NY 10119-2998
Project Manager Henry Gastwirth
3 163-ERTER-ER-94
August 1995
NOTICE
This report was prepared by Stone & Webster Engineering Corporation (the "Contractor") in the come of
performing work contracted for and sponsored by the New York State Energy Research and Development Authority and the National Renewable Energy Laboratory (hereafter the "Sponsors"). The opinions expressed in this report do not necessarily reflect those of the Sponsors or the State of New York, and
reference to any specific product, service, process, or method does not constitute an implied or expressed
recommendation or endorsement of it. Further, the Sponsors and the State of New York make no warranties or representations, expressed or implied, as to the fimess for particular purpose or merchantability of any product, apparatus, or service, or the usefulness, completeness, or accuracy of any processes, methods, or
other infonnation contained, described, disclosed, or referred to in this report. The Sponsors, the State of
New York, arid the Contractor make no representation that the use of any product, apparatus, process,
method, or other infonnation will not infringe privately owned rights and will assume no liability for m y
loss, injury, or damage resulting from, or occurring in connection with, the use of infonnation contained,
described, disclosed, or referred to in this report.
DISCLAIMER
This report was prepared as an account of work sponsored by an agency of the United States Government. Neither the United States Government nor any agency thereof, nor any of their employees, make any warranty, express or implied, or assumes any legal liability or responsibility for the .accuracy, completeness, or usefulness of any information, apparatus, product, or process disclosed, or represents that its use would not infringe privately owned rights. Reference herein to any specific commercial product, process, or service by trade name, trademark, manufacturer, or otherwise does not necessarily constitute or imply its endorsement, recommendation, or favoring by the United States Government or any agency thereof. The views and opinions of authors expressed herein do not necessarily state or reflect those of the United States Government or any agency thereof.

DISCLAIMER
Portions of this document may be illegible in electronic image products. Images are produced from the best available original document.

ABSTRACT
This report evaluates the economic feasibility of locating biomass-to-ethanol waste conversion facilities in New York State. Part I of the study evaluates 74 potential sites in New York City and identifies two preferred sites on Staten -- the Proctor & Gamble and the Arthur Kill sites - - for further consideration. Part II evaluates upstate New York and determines that four regions surrounding the urban centers of Albany, Buffalo, Rochester, and Syracuse provide suitable areas from which to select specific sites for further consideration. A separate Appendix provides
supplemental material supporting the evaluations.
A conceptual design and economic viability evaluation were developed for a minimum-size facility capable of processing 500 tons per day (tpd) of biomass consisting of wood or paper, or a combination of the two for upstate regions. The facility would use Amoco’s bi,)mass
conversion technology and produce 49,000 gallons per day of ethanol and approximately 3UO tpd of lignin solid by-product. For New York City, a‘1000-tpd processing facility was also evaluated to examine effects of economies of scale.
The reports evaluate the feasibility of building a biomass conversion facility in terms of city and state economic, environmental, and community factors. Given the data obtained to date, including changing costs for feedstock and ethanol, the project is marginally attractive. A facility should be as large as possible and located in a New York State Economic Development Zone to take advantage of economic incentives. The facility should have on-site oxidation
capabilities, which will make it more financially viable given the high cost of energy,
KEY WORDS
Amoco biomass-to-ethanol conversion process; Recycling recovered paper; Minimum facility requirements; Site selection; Pro forma analysis;
Business’ assessment of feedstock supplier;
Business assessment of ethanol user
iii
ACKNOWLEDGEMENTS
We gratefblly acknowledge the substantive contribution of research, technical input, and funding or cost sharing made to this study by the following organizations and personnel:
Stone & Webster Engineering Corporation Henry Gastwirth Dr. Ernest Zabolotny
Stone & Webster Development Corporation Hope Hartley Stidstone
The New York State Energy Research and Development Authority (The Energy Authority) Judy Jarnefeld
National Renewable Energy Authority (NREL) Dianne Koepping
Ammo Joseph Masin
Champion International Corporation Richard Piela
NYNEX John Balaguer
John Halenar
iv
SECTION
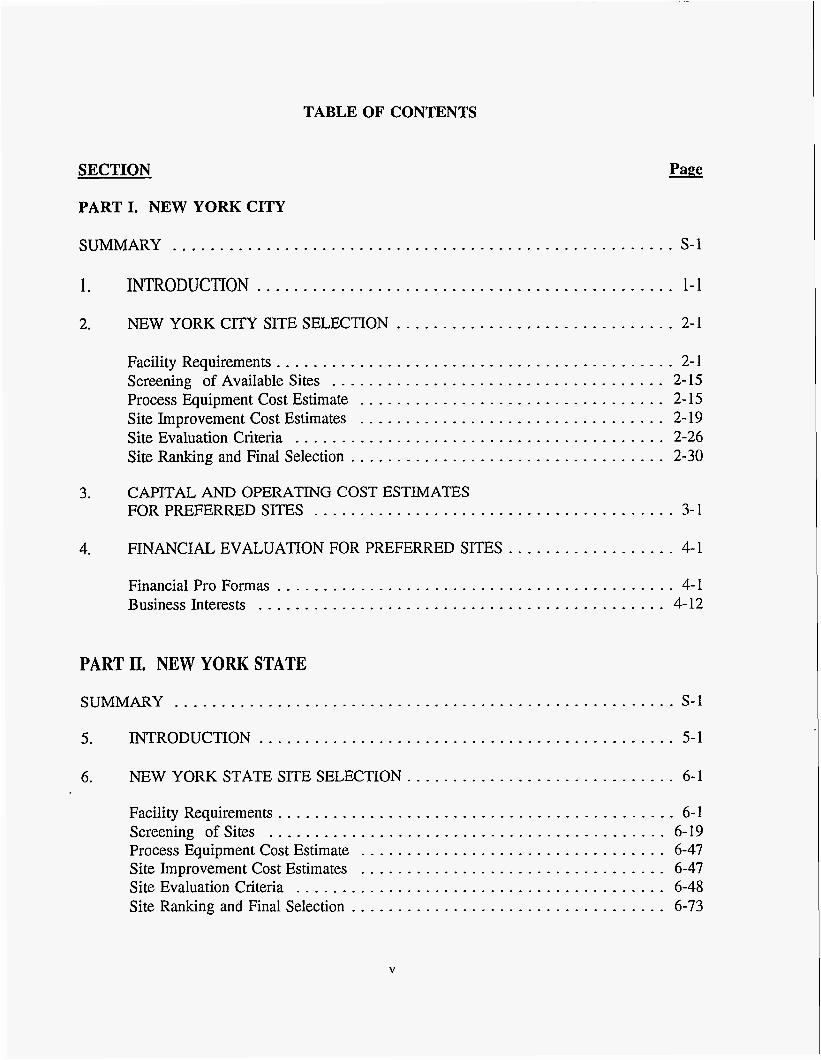
TABLE OF CONTENTS
PART I . NEW YORK CITY
SUMMARY . . . . . . . . . . . . . . . . . . . . . . . . . . . . . . . . . . . . . . . . . . . . . . . . . . . . . . 5-1
1 . INTRODUCTION ............................................. 1-1
2 . NEW YORK CITY SITE SELECTION .............................. 2-1
Facility Requirements ........................................... 2-1 Screening of Available Sites .................................... 2-15 Process Equipment Cost Estimate ................................. 2-15 Site Improvement Cost Estimates ................................. 2-19 Site Evaluation Criteria ........................................ 2-26 Site Ranking and Final Selection .................................. 2-30
3 .
4 .
CAPITAL AND OPERATING COST ESTIMATES FOR PREFERRED SITES ....................................... 3-1
FINANCIAL EVALUATION FOR PREFERRED SITES . . . . . . . . . . . . . . . . . . 4-1
Financial Pro Formas . . . . . . . . . . . . . . . . . . . . . . . . . . . . . . . . . . . . . . . . . . . 4-1 Business Interests . . . . . . . . . . . . . . . . . . . . . . . . . . . . . . . . . . . . . . . . . . . . 4-12
PART I1 . NEW YORK STATE
SUMMARY . . . . . . . . . . . . . . . . . . . . . . . . . . . . . . . . . . . . . . . . . . . . . . . . . . . . . . 5-1
5 . INTRODUCTION . . . . . . . . . . . . . . . . . . . . . . . . . . . . . . . . . . . . . . . . . . . . . 5-1
6 . NEW YORK STATE SITE SELECTION ............................. 6-1
Facility Requirements ........................................... 6-1 Screening of Sites ........................................... 6-19 Process Equipment Cost Estimate ................................. 6-47 Site Improvement Cost Estimates ................................. 6-47 Site Evaluation Criteria . . . . . . . . . . . . . . . . . . . . . . . . . . . . . . . . . . . . . . . . 6-48 Site Ranking and Final Selection .................................. 6-73
V
.-
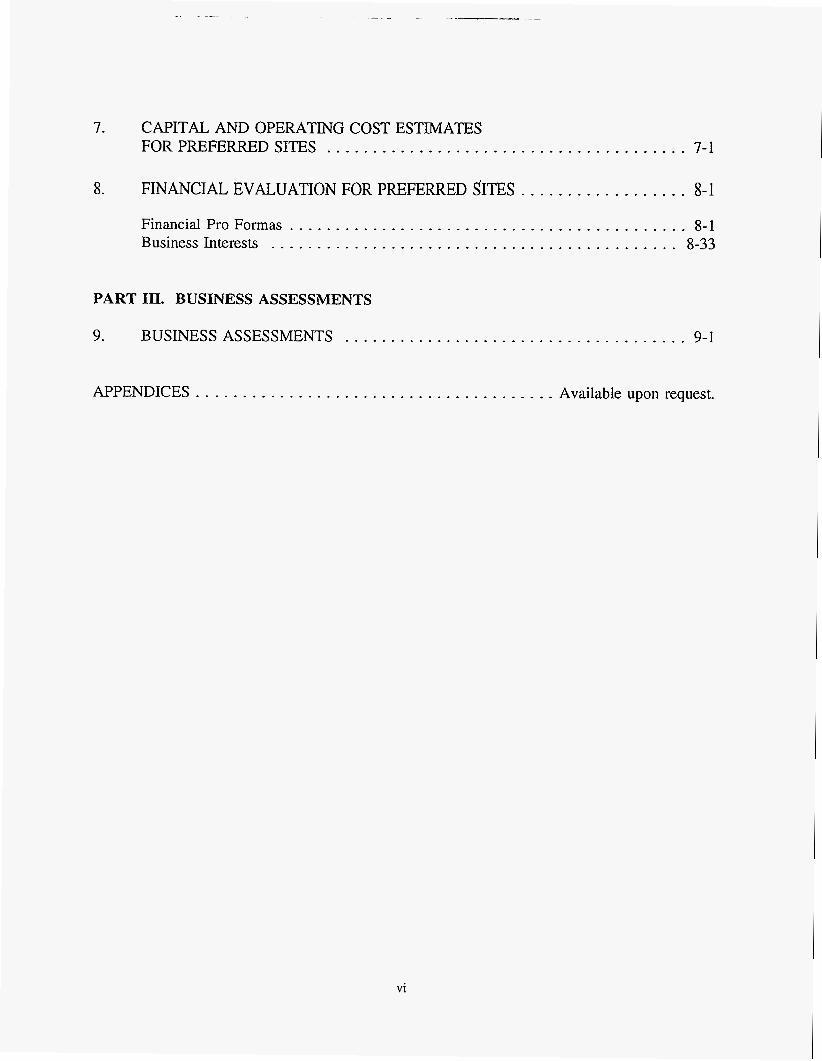
7. CAPITAL AND OPERATING COST ESTIMATES FOR PREFERRED SITES . . . . . . . . . . . . . . . . . . . . . . . . . . . . . . . . . . . . . . . 7-1
8. FINANCIAL EVALUATION FOR PREFERRED SITES . . . . . . . . . . . . . . . . . . 8-1
8- 1 Financial Pro Formas . . . . . . . . . . . . . . . . . . . . . . . . . . . . . . . . . . . . . . . . . . . Business Interests . . . . . . . . . . . . . . . . . . . . . . . . . . . . . . . . . . . . . . . . . . . . 8-33
PART III. BUSINESS ASSESSMENTS
9. BUSINESS ASSESSMENTS . . . . . . . . . . . . . . . . . . . . . . . . . . . . . . . . . . . . . 9-1
APPENDICES . . . . . . . . . . . . . . . . . . . . . . . . . . . . . . . . . . . . . . . Available upon request.
vi
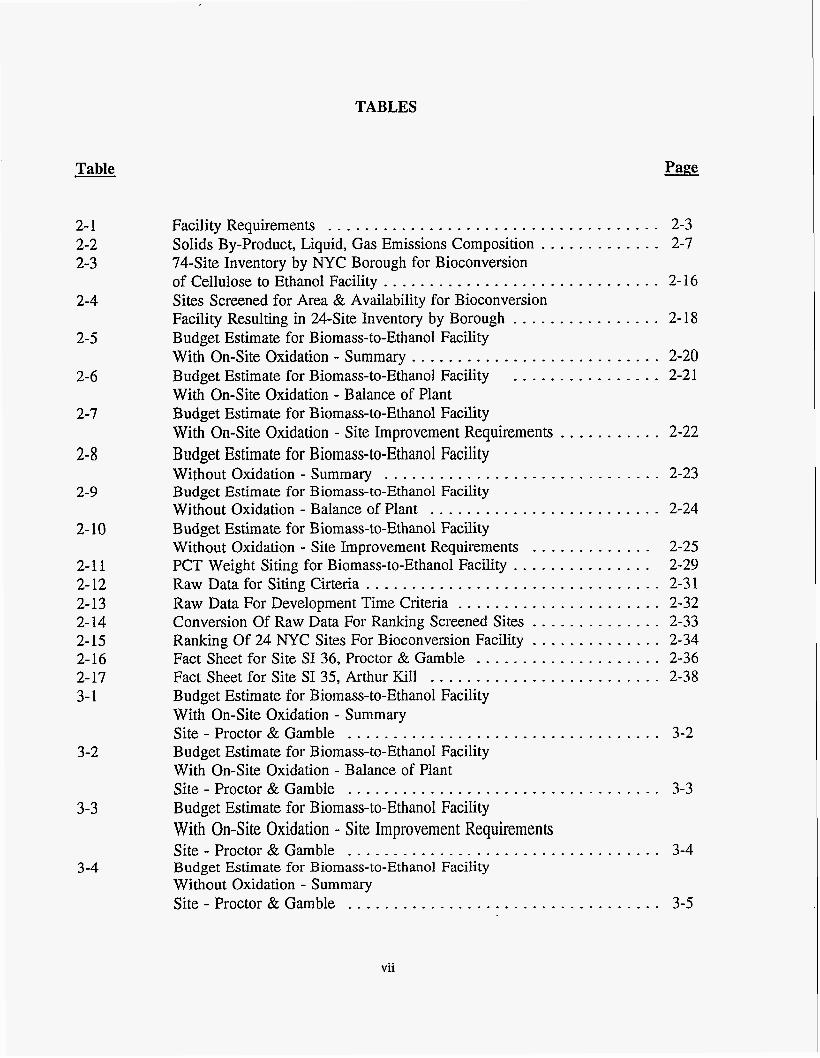
TABLES
Table
2- 1 2-2 2-3
2-4
2-5
2-6
2-7
2- 8
2-9
2- 10
2-11 2- 12 2-13 2- 14 2-15 2-16 2- 17 3- 1
3-2
3-3
3-4
Facility Requirements . . . . . . . . . . . . . . . . . . . . . - - 2-3 Solids By-product, Liquid, Gas Emissions Composition . . . . . . - - . . . . - 2-7 74-Site Inventory by NYC Borough for Bioconversion of Cellulose to Ethanol Facility . . . . . . - . . . . . . . . . - - . - - . . . . . . . - . 2-16 Sites Screened for Area & Availability for Bioconversion Facility Resulting in 24-Site Inventory by Borough . . . . . . . . . . . . - . . . 2- 18 Budget Estimate for Biomass-to-Ethanol Facility With On-Site Oxidation - Summary . . . . . . . . . . . . . . . . . . . . . . . . . . . 2-20 Budget Estimate for Biomass-to-Ethanol Facility . . . . . . . . . . . . . - . . 2-21 With On-Site Oxidation - Balance of Plant Budget Estimate for Biomass-to-Ethanol Facility With On-Site Oxidation - Site Improvement Requirements . . . . . . . . . . . 2-22 Budget Estimate for Biomass-to-Ethanol Facility Without Oxidation - Summary . . . . . - . . . . . . - - - - . . . . . . - - - - - . . 2-23 Budget Estimate for Biomass-to-Ethanol Facility Without Oxidation - Balance of Plant . - . . . . . . . . . . . . . . . . . . . . . . - 2-24 Budget Estimate for Biomass-to-Ethanol Facility Without Oxidation - Site Improvement Requirements . . . . . . . - . 2-25 PCT Weight Siting for Biomass-to-Ethanol Facility . . . . . . . . . . . . 2-29 Raw Data for Siting Cirteria . . . . . . . . . . . . . . . . . . . . . - . . . . . . . - - 2-31 Raw Data For Development Time Criteria . - - . . . . . . - . . . . - . . . - . . - 2-32 Conversion Of Raw Data For Ranking Screened Sites . . - - . . - . . . . 2-33 Ranking Of 24 NYC Sites For Bioconversion Facility . . . - . . . . . . - - 2-34 Fact Sheet for Site SI 36, Proctor & Gamble . . . - - . . . . . . . - 2-36 Fact Sheet for Site SI 35, Arthur Kill . . . . . . . . . . . . . - . . . . - . - . . . . 2-38 Budget Estimate for Biomass-to-Ethanol Facility With On-Site Oxidation - Summary Site - Proctor & Gamble . . . . - - . . . . . . Budget Estimate for Biomass-to-Ethanol Facility With On-Site Oxidation - Balance of Plant Site - Proctor & Gamble . . . . . . . . . . . . . . . . - . - . . . . . . . - . . . . - . . 3-3 Budget Estimate for Biomass-to-Ethanol Facility With On-Site Oxidation - Site Improvement Requirements Site - Proctor & Gamble . . . - . - - . - . . - . - - - . . . . - . - - . . . - - - . . - 3-4 Budget Estimate for Biomass-to-Ethanol Facility Without Oxidation - Summary Site - Proctor & Gamble . . . . . . . . . . . . . . . . . . . . - . . . . . . . . . . . - . 3-5
. . . . . . . . . .
- . . . .
. . . . . - - . . . . . - . . . . . . 3-2
vii
Table Page
3-5
3-6
3-7
3-8
3-9
3-10
3-1 1
3- 12
3-13
3-14
3-15
3-16
4- I 4-2 4-3 4-4 4-5 6- 1 6-2
Budget Estimate for Biomass-to-Ethanol Facility Without Oxidation - Balance of Plant Site . Proctor & Gamble . . . . . . . . . . . . . . . . . . . . . . . . . . . . . . . . . . 3-6 Budget Estimate for Biomass-to-Ethanol Facility Without Oxidation - Site Improvement Requirements Site . Proctor & Gamble .................................. 3-7 Budget Estimate for Biomass-to-Ethanol Facility With On-Site Oxidation - Summary Site . Arthur Kill . . . . . . . . . . . . . . . . . . . . . . . . . . . . . . . . . . . . . . . . 3-8 Budget Estimate for Biomass-to-Ethanol Facility With On-Site Oxidation - Balance of Plant Site . Arthur Kill ....................................... 3-9 Budget Estimate for Biomass-to-Ethanol Facility With On-Site Oxidation - Site Improvement Requirements Site . Arthur Kill Budget Estimate for Biomass-to-Ethanol Facility Without Oxidation - Summary Site . Arthur Kill . . . . . . . . . . . . . . . . . . . . . . . . . . . . . . . . . . . . . . . 3-1 1 Budget Estimate for Biomass-to-Ethanol Facility Without Oxidation - Balance of Plant Site . Arthur Kill . . . . . . . . . . . . . . . . . . . . . . . . . . . . . . . . . . . . . . . 3-12 Budget Estimate for Biomass-to-Ethanol Facility Without Oxidation - Site Improvement Requirements Site . Arthur Kill . . . . . . . . . . . . . . . . . . . . . . . . . . . . . . . . . . . . . . . 3-13 Biomas To Ethanol Facility Cost Estimate Proctor & Gamble W/Oxidizer .............................. 3-14 Biomass To Ethanol Facility Cost Estimate Proctor & Gamble W/O Oxidizer ............................ 3-15 Biomass To Ethanol Facility Cost Estimate Arthur Kill W/Oxidizer . . . . . . . . . . . . . . . . . . . . . . . . . . . . . . . . . . . 3- 16 Biomass To Ethanol Facility Cost Estimate Arthur Kill W/O Oxidizer . . . . . . . . . . . . . . . . . . . . . . . . . . . . . . . . . 3-17 Master Input Table (Pg.1 of 2 . Paper; Pg.2 of 2 . Wood) . . . . . . . . . . . 4-13
. . . . . . . . . . . . . . . . . . . . . . . . . . . . . . . . . . . . . . . 3-10
Case Input . Option 1 (500 TPD, paper, with Gasification, $1.20/gal) . . . 4-15 Pro Forma . Option 1 (500 TPD, paper, with Gasification, $1.20/gal) . . . 4-16 Results of Financial Evaluation .............................. 4- 18 Economic Incentives . . . . . . . . . . . . . . . . . . . . . . . . . . . . . . . . . . . . . 4- 19 Facility Requirements . . . . . . . . . . . . . . . . . . . . . . . . . . . . . . . . . . . . . 6-3 Solids By-product, Liquid, Gas Emissions Composition . . . . . . . . . . . . . . 6-6 for Paper Feedstock
... V l l l

Table Page
6-3
6-4
6-5 6-6
6-7 6-8 6-9 6-10 6-1 1
6-12
6-13
6- 14
6- 15
6-16
6-17
6-18
6- 19
6-20
6-21
Solids By-product, Liquid, Gas Emissions Composition . . . . . . . . . . . . .
Solids By-product, Liquid, Gas Emissions Composition . . . . . . . . . . . . . . 6-8
Paper Sludge Volume by Feedstock Zone and County . . . . . . . . . . . . . . Paper Sludge Daily Volume by Town, County, Company . . . . . . . . . . . 6-28
6-7 for Wood Feedstock
for WoodPaper Feedstock in 1:l Ratio 6-27
and Tipping Fee Indicators of Paper Waste Recycling Market ..................... 6-35 Indicators of Yard Waste Market ............................ 6-36 Compilation of Waste in Ethanol Facility Siting Zones . . . . . . . . . . . . . 6-37 Total Waste for Ethanol Facility Siting Zones .................... 6-38 Potential Sites by Ethanol Facility Siting Zones, . . . . . . . . . . . . . . . . . . 6-43 County and Town Budget Estimate for Biomass to Ethanol Facility . . . . . . . . . . . . . . . . . . 6-49 With On-Site Oxidation - Summary for Buffalo Budget Estimate for Biomass to Ethanol Facility . . . . . . . . . . . . . . . . . . 6-50 With On-Site Oxidation - Balance of Plant for Buffalo Budget Estimate for Biomass to Ethanol Facility : . . . . . . . . . . . . . . . . . With On-Site Oxidation - Site Improvement Requirements for Buffalo Budget Estimate for Biomass to Ethanol Facility . . . . . . . . . . . . . . . . . . With On-Site Oxidation - Summary for. Rochester Budget Estimate for Biomass to Ethanol Facility . . . . . . . . . . . . . . . . . . With On-Site Oxidation - Balance of Plant for Rochester Budget Estimate for Biomass to Ethanol Facility . . . . . . . . . . . . . . . . . . With On-Site Oxidation - Site Improvement Requirements for Rochester Budget Estimate for Biomass to Ethanol Facility . . . . . . . . . . . . . . . . . . 6-55 With On-Site Oxidation - Summary for Syracuse Budget Estimate for Biomass to Ethanol Facility . . . . . . . . . . . . . . . . . . 6-56 With On-Site Oxidation - Balance of Plant for Syracuse Budget Estimate for Biomass to Ethanol Facility . . . . . . . . . . . . . . . . . . With On-Site Oxidation - Site Improvement Requirements for Syracuse
6-51
6-52
6-53
6-54
6-57
Budget Estimate for Biomass to Ethanol Facility . . . . . . . . . . . . . . . . . . 6-58 With On-Site Oxidation - Summary for Albany
ix
Table Page
6-22
6-23
6-24
6-25
6-26
6-27
6-28
6-29
6-30
6-3 1
6-32
6-33
6-34
6-35
7- I
Budget Estimate for Biomass to Ethanol Facility . . . . . . . . . . . . . . . . . . 6-59 With On-Site Oxidation - Balance of Plant for Albany Budget Estimate for Biomass to Ethanol Facility . . . . . . . . . . . . . . . . . . With On-Site Oxidation - Site Improvement Requirements for Albany Budget Estimate for Biomass to Ethanol Facility . . . . . . . . . . . . . . . . . . 6-61 Without Oxidation - Summary for Buffalo Budget Estimate for Biomass to Ethanol Facility . . . . . . . . . . . . . . . . . . 6-62 Without Oxidation - Balance of Plant
6-60
for Buffalo Budget Estimate for Biomass to Ethanol Facility . . . . . . . . . . . . . . . . . . 6-63 Without Oxidation - Site Improvement Requirements for Buffalo
Without Oxidation - Summary for Rochester Budget Estimate for Biomass to Ethanol Facility . . . . . . . . . . . . . . . . . . 6-65 Without Oxidation - Balance of Plant for Rochester
Without Oxidation - Site Improvement Requirements for Rochester Budget Estimate for Biomass to Ethanol Facility . . . . . . . . . . . . . . . . . . 6-67 Without Oxidation - Summary for Syracuse Budget Estimate for Biomass to Ethanol Facility . . . . . . . . . . . . . . . . . . 6-68 Without Oxidation - Balance of Plant for Syracuse Budget Estimate for Biomass to Ethanol Facility . . . . . . . . . . . . . . . . . . 6-69 Without Oxidation - Site Improvement Requirements for Syracuse Budget Estimate for Biomass to Ethanol Facility . . . . . . . . . . . . . . . . . . 6-70 Without Oxidation - Summary for Albany Budget Estimate for Biomass to Ethanol Facility . . . . . . . . . . . . . . . . . . 6-7 1 Without Oxidation - Balance of Plant for Albany Budget Estimate for Biomass to Ethanol Facility . . . . . . . . . . . . . . . . . . 6-72 Without Oxidation - Site Improvement Requirements for Albany Budget Estimate for Biomass to Ethanol Facility . . . . . . . . . . . . . . . . . . . 7-2 With On-Site Oxidation - Summary for Buffalo
Budget Estimate for Biomass to Ethanol Facility . . . . . . . . . . . . . . . . . . 6-64
Budget Estimate for Biomass to Ethanol Facility . . . . . . . . . . . . . . . . . . 6-66
X
Table
7-2
7-3
1-4
7-5
7-6
7-7
7-8
7-9
7- 10
7-1 1
7- 12
7- 13
7- 14
7-15
7-16
Budget Estimate for Biomass to Ethanol Facility . . . . . . . . . . . . . . . . . . . 7-3 With On-Site Oxidation - Balance of Plant for Buffalo Budget Estimate for Biomass to Ethanol Facility . . . . . . . . . . . . . . . . . . . 7-4 With On-Site Oxidation - Site Improvement Requirements for Buffalo Budget Estimate for Biomass to Ethanol Facility . . . . . . . . . . . . . . . . . . . 7-5 Without Oxidation - Summary for Buffalo Budget Estimate for Biomass to Ethanol Facility . . . . . . . . . . . . . . . . . . . 7-6 Without Oxidation - Balance of Plant for Buffalo Budget Estimate for Biomass to Ethanol Facility . . . . . . . . . . . . . . . . . . . 7-7 Without Oxidation - Site Improvement Requirements for Buffalo Budget Estimate for Biomass to Ethanol Facility . . . . . . . . . . . . . . . . . . . 7-8 With On-Site Oxidation - Summary for Rochester Budget Estimate for Biomass to Ethanol Facility . . . . . . . . . . . . . . . . . . . 7-9 With On-Site Oxidation - Balance of Plant for Rochester Budget Estimate for Biomass to Ethanol Facility . . . . . . . . . . . . . . . . . . 7-10 With On-Site Oxidation - Site Improvement Requirements for Rochester Budget Estimate for Biomass to Ethanol Facility . . . . . . . . . . . . . . . . . . 7- 1 1 Without Oxidation - Summary for Rochester Budget Estimate for Biomass to Ethanol Facility . . . . . . . . . . . . . . . . . . 7-12 Without Oxidation - Balance of Plant for Rochester Budget Estimate for Biomass to Ethanol Facility . . . . . . . . . . . . . . . . . . 7-13 Without Oxidation - Site Improvement Requirements for Rochester Budget Estimate for Biomass to Ethanol Facility . . . . . . . . . . . . . . . . . . 7-14 With On-Site Oxidation - Summary for Syracuse Budget Estimate for Biomass to Ethanol Facility . . . . . . . . . . . . . . . . . . 7- 15 With On-Site Oxidation - Balance of Plant for Syracuse Budget Estimate for Biomass to Ethanol Facility . . . . . . . . . . . . . . . . . . 7-16 With On-Site Oxidation - Site Improvement Requirements for Syracuse Budget Estimate for Biomass to Ethanol Facility . . . . . . . . . . . . . . . . . . 7- 17 Without Oxidation - Summary for Syracuse
xi
Table Page
7- 17
7-18
7-19
7-20
7-2 1
7-22
7-23
1-24
7-25
7-26
7-27
7-28
7-29
7-30
7-3 1
7-32
8-la 8- lb 8- I C
Budget Estimate for Biomass to Ethanol Facility . . . . . . . . . . . . . . . . . . 7- 18
Budget Estimate for Biomass to Ethanol Facility . . . . . . . . . . . . . . . . . . 7-19
Budget Estimate for Biomass to Ethanol Facility . . . . . . . . . . . . . . . . . . 7-20
Budget Estimate for Biomass to Ethanol Facility . . . . . . . . . . . . . . . . . . 7-21
Budget Estimate for Biomass to Ethanol Facility . . . . . . . . . . . . . . . . . . 7-22
Budget Estimate for Biomass to Ethanol Facility . . . . . . . . . . . . . . . . . . 7-23
Budget Estimate for Biomass to Ethanol Facility . . . . . . . . . . . . . . . . . . 7-24
Budget Estimate for Biomass to Ethanol Facility . . . . . . . . . . . . . . . . . . 7-25
Without Oxidation - Balance of Plant for Syracuse
Without Oxidation - Site Improvement Requirements for Syracuse
With On-Site Oxidation - Summary for Albany
With On-Site Oxidation - Balance of Plant for Albany
With On-Site Oxidation - Site Improvement Requirements for Albany
Without Oxidation - Summary for Albany
Without Oxidation - Balance of Plant for Albany
Without Oxidation - Site Improvement Requirements for Albany
Buffalo with Oxidizer
Buffalo without Oxidizer
Rochester with Oxidizer
Rochester without Oxidizer
Syracuse with Oxidizer
Syracuse without Oxidizer
Albany with Oxidizer
Albany without Oxidizer
Biomass to Ethanol Facility Cost Estimate for . . . . . . . . . . . . . . . . . . . 7-26
Biomass to Ethanol Facility Cost Estimate for . . . . . . . . . . . . . . . . . . . 7-27
Biomass to Ethanol Facility Cost Estimate for . . . . . . . . . . . . . . . . . . . 7-28
Biomass to Ethanol Facility Cost Estimate for . . . . . . . . . . . . . . . . . . . 7-29
Biomass to Ethanol Facility Cost Estimate for . . . . . . . . . . . . . . . . . . . 7-30
Biomass to Ethanol Facility Cost Estimate for . . . . . . . . . . . . . . . . . . . 7-31
Biomass to Ethanol Facility Cost Estimate for . . . . . . . . . . . . . . . . . . . 7-32
Biomass to Ethanol Facility Cost Estimate for . . . . . . . . . . . . . . . . . . . 7-33
Master Input Table, Site Location . Albany, NY . . . . . . . . . . . . . . . . . . 8-12 Master Input Table, Site Location . Buffalo, NY . . . . . . . . . . . . . . . . . . 8-13 Master Input Table, Site Location . Rochester, NY . . . . . . . . . . . . . . . . 8-14
xii
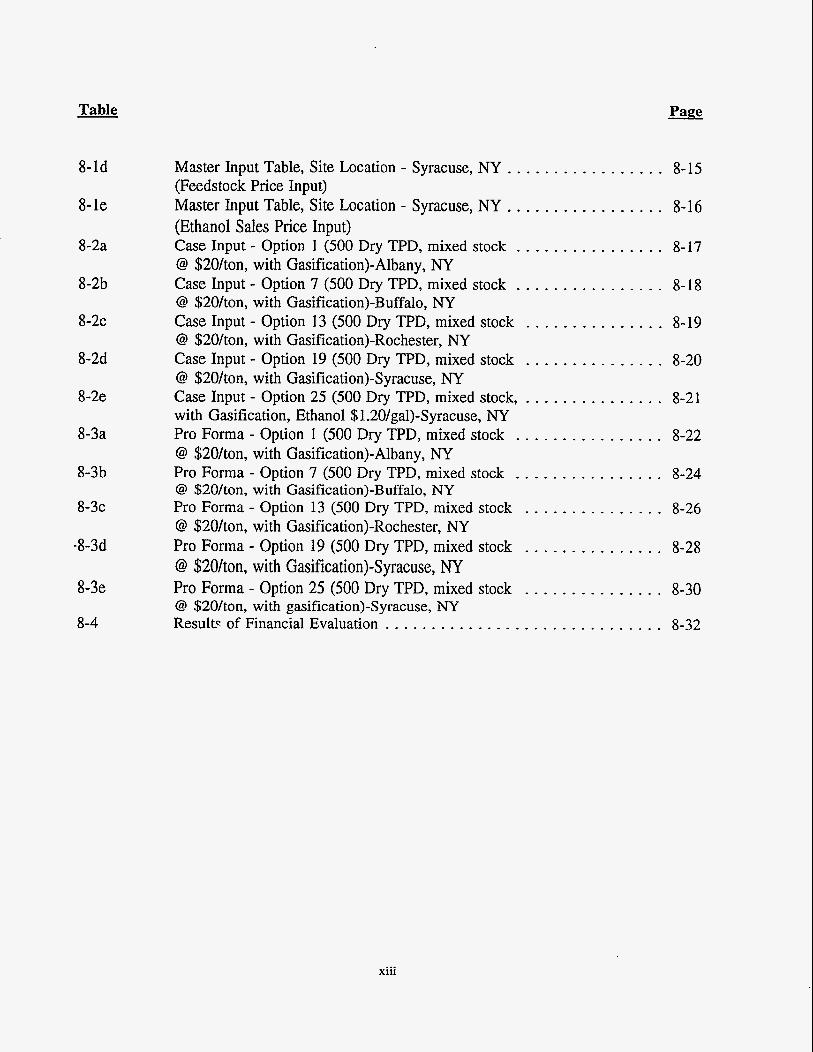
Table Page
8-ld
8- le
8-2a
8-2b
8 - 2 ~
8-2d
8-2e
8-3a
8-3b
8 - 3 ~
-8-3d
8-3e
8-4
Master Input Table, Site Location . Syracuse, NY . . . . . . . . . . . . . . . . . 8-15 (Feedstock Price Input) Master Input Table, Site Location . Syracuse, NY . . . . . . . . . . . . . . . . . 8-16 (Ethanol Sales Price Input) Case Input . Option 1 (500 Dry TPD, mixed stock . . . . . . . . . . . . . . . . 8-17 @ $20/ton, with Gasification)-Albany, NY Case Input . Option 7 (500 Dry TPD, mixed stock . . . . . . . . . . . . . . . . 8-18 @ $20/ton, with Gasification)-Buffalo, NY Case Input . Option 13 (500 Dry TPD, mixed stock . . . . . . . . . . . . . . . 8-19 @ $20/ton, with Gasification)-Rochester, NY Case Input - Option 19 (500 Dry TPD, mixed stock . . . . . . . . . . . . . . . 8-20 @ $20/ton, with Gasification)-Syracuse, NY Case Input . Option 25 (500 Dry TPD, mixed stock, . . . . . . . . . . . . . . . 8-21 with Gasification, Ethanol $1.2O/gal)-Syracuse, NY Pro Forma . Option 1 (500 Dry TPD, mixed stock . . . . . . . . . . . . . . . . 8-22 @ $20/ton, with Gasification)-Albany, NY Pro Forma . Option 7 (500 Dry TPD, mixed stock . . . . . . . . . . . . . . . . 8-24 @ $20/ton, with Gasification)-Buffalo, NY Pro Forma . Option 13 (500 Dry TPD, mixed stock . . . . . . . . . . . . . . . 8-26 @ $20/ton, with Gasification)-Rochester, NY Pro Forma . Option 19 (500 Dry TPD, mixed stock . . . . . . . . . . . . . . . 8-28 @ $20/ton, with Gasification)-Syracuse, NY Pro Forma . Option 25 (500 Dry TPD, mixed stock . . . . . . . . . . . . . . . 8-30 @ $20/ton, with gasification)-Syracuse, NY Resule of Financial Evaluation .............................. 8-32
xiii
Figure
FIGURES
Page
2- 1 2-2
2-3
2-4
2-5
2-6 2-7
6- 1 6-2
6-3
6-4
6-5
6-6
6-7
6-8
6-9
6-10
6-1 1
6- 12
6-13
Amoco Process Plot. ..................................... 2-10 Amoco Process Flow Schematic - Waste Paper Feedstock On-Site Oxidation of Solids By-product ........................ 2- 1 1 Amoco Process Flow Schematic - Waste Paper Feedstock Solids By-product Transported Off-Site ........................ 2- 12 Amoco Process Flow Schematic - Wood Feedstock On-Site Oxidation of Solids By-product ........................ 2- 13 Amoco Process Flow Schematic - Wood Feedstock Solids By-product Transported Off-Site ........................ 2- 14 Site Location Map . Proctor & Gamble ........................ 2-35 Site Location Map . Arthur Kill . . . . . . . . . . . . . . . . . . . . . . . . . . . . . 2-37
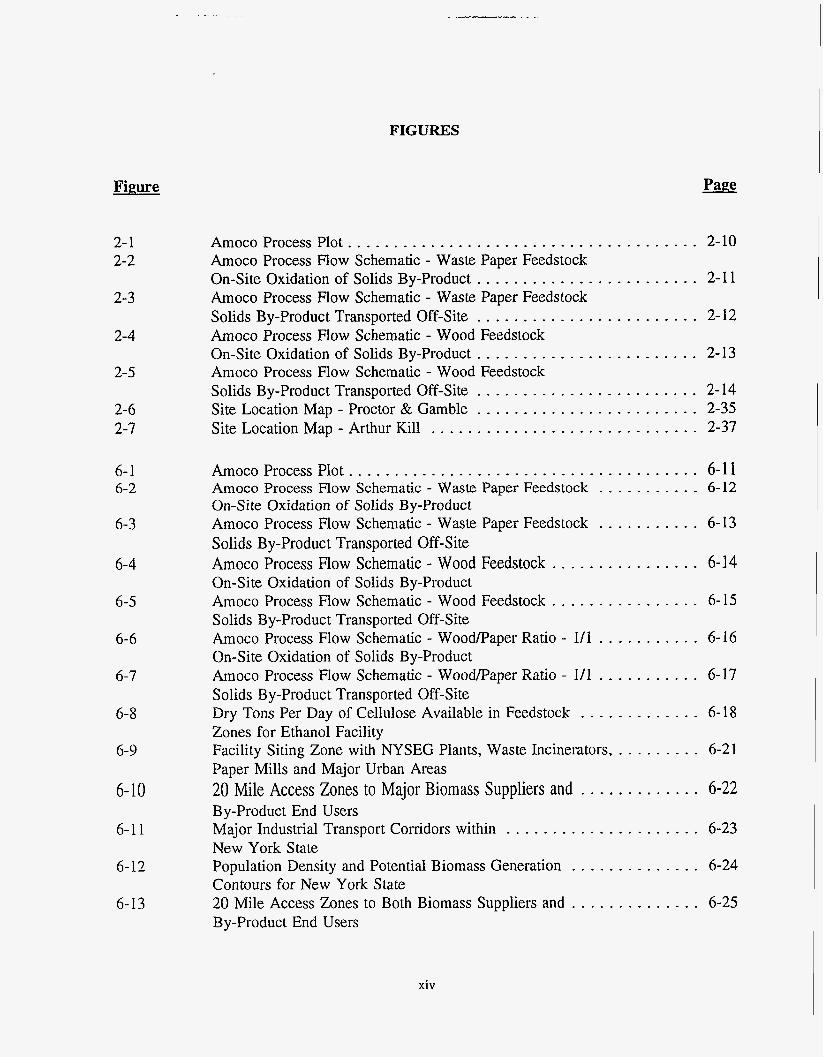
Amoco Process Plot . . . . . . . . . . . . . . . . . . . . . . . . . . . . . . . . . . . . . . 6- 1 I Amoco Process Flow Schematic - Waste Paper Feedstock . . . . . . . . . . . 6-12 On-Site Oxidation of Solids By-product Amoco Process Flow Schematic - Waste Paper Feedstock . . . . . . . . . . . 6-13 Solids By-product Transported Off-Site Amoco Process Flow Schematic - Wood Feedstock . . . . . . . . . . . . . . . . 6-14 On-Site Oxidation of Solids By-product Amoco Process Flow Schematic - Wood Feedstock . . . . . . . . . . . . . . . . 6- 15 Solids By-product Transported Off-Site Amoco Process Flow Schematic - Wood/Paper Ratio - 1/1 . . . . . . . . . . . 6-16 On-Site Oxidation of Solids By-product Amoco Process Flow Schematic - WoodPaper Ratio - 1/1 . . . . . . . . . . . 6-17 Solids By-product Transported Off-Site Dry Tons Per Day of Cellulose Available in Feedstock . . . . . . . . . . . . . 6-18 Zones for Ethanol Facility Facility Siting Zone with NYSEG Plants, Waste Incinerators, . . . . . . . . . 6-21 Paper Mills and Major Urban Areas
By-product End Users
New York State Population Density and Potential Biomass Generation . . . . . . . . . . . . . . 6-24 Contours for New York State 20 Mile Access Zones to Both Biomass Suppliers and . . . . . . . . . . . . . . 6-25 By-product End Users
20 Mile Access Zones to Major Biomass Suppliers and . . . . . . . . . . . . . 6-22
Major Industrial Transport Corridors within ..................... 6-23
xiv

Figure Page
6- 14
6-15
6-16
6- 17
6-18
6-19
Ethanol Facility Siting Zones and ............................ 6-26 Generalized Feedstock Zones Example of Existing Recycling Rate .......................... 6-34 and Potential Rate Averaged Tons Per Day of Waste Cellulose ..................... 6-39 Generated by New York State Counties Potential Ethanol Plant Sites and ............................. 6-46 Potential NYSEG Sites New York State Comrnercialhdustrial ........................ 6-75 Waste Stream Total Waste Density in New York State ........................ 6-76
xv
SCREENING STUDY FOR WASTE BIOMASS TO ETHANOL PRODUCTION FACILITY USING THE AMOCO
PROCESS IN NEW YORK STATE
PART I.
NEW YORK CITY
DESCRIPTION OF STUDY Obiective of Study
The objective of this study is to identify and evaluate two sites in New York City that could be appropriate for the construction and long-term operation of a financially attractive and environmentally sound waste biomass-to-ethanol production facility using Amoco’s biomass conversion technology.
Backmound
New York City Department of Sanitation (NYCDOS) is planning to solicit proposals for
a facility to use waste paper as feedstock to minimize waste and foster economic developnlent for both residents and businesses. The solicitation for such a facility in one of the City’s five boroughs is expected to be issued in 1995. Furthermore, legislation proposed by the US Environmental Protection Agency @PA) may require that at least 30 percent of the oxygenates contained in cleaner-burning gasoline will have to be made from renewable resources (which include waste biomass products).
These two events prompted the formation of a study group composed of Stone & Webster Engineering Corporation, Stone & Webster Development Corporation, the New York State Energy Research and Development Authority (NYSERDA), the National Renewable Energy Laboratory (NREL), Arnoco Corporation, NYNEX, and Champion International Corporation to explore the potential for a New York City biomass processing facility
designed to produce ethanol, which could be used for transportation fuels. This study for the City (Part I) is followed by a study of sites in upstate New York (Part n). The
business assessment studies provided by NYNEX and Champion International can be
found in Section 9, Vol. 111. Appendices are located in Vol. IV.
s-1
SITE SELECTION
Facilitv Reauiremen6
The processing facility design for converting biomass to ethanol requires seven principal processing steps, including waste papedwood storage, pretreatment, enzymatic hydolysis, fermentation, distillation, anaerobic digestion and solids/liquid separation.
Minimum facility requirements were prepared to identify the Amoco process characteristics that would affect site selection and economic evaluation. These
requirements for two types of cellulose-bearing feedstock materials (paper and wood) included feedstock quantity required, ethanol production rate, solids by-product characteristics, environmental emission characteristics, utilities, personnel, land area, and
power reliability. A fedstock quantity of 500 tons per day (tpd) was determined to be
the minimum economic facility size. This size facility would result in 49,000 gallons per day (gpd) of ethanol and approximately 360 tpd of lignin by-product. Since the solids by-product of the process has a significant heating value, the study evaluated two
approaches: on-site oxidation for local cogeneration of steam and power, and off-site
transport of the zolids by-product to a solids burning boiler or incinerator. Utility requirements and power generation requirements were developed for each approach as part of a conceptual flow diagram that integrates the processing steps.
Site Cost Estimates
Capital cost estimates were prepared for the basic process island as well for integration with the balance of plant requirements of a generic installation in New York City. These costs were subsequently made site specific for the two preferred sites.
The capital cost of the process island has been estimated to be $68 million for a 500 tpd plant and $108 million for a 1000-tpd plant in New York City. The capital cost of the
s-2
process island would be approximately the Same for paper and wood feedstock.
The total capital cost for a biomass-to-ethanol facility, including the process island, the balance of plant, site improvements, and land costs for processing 500 tpd of feedstock
was determined to be $139 million or $2837/gpd of ethanol with on-site oxidation of the solids by-product, and $102 million or $2082/gpd with no on-site oxidation. The total
capital cost for a plant processing lo00 tpd of feedstock was determined to be $223 million or $2276/gpd of ethanol with on-site solids by-product oxidation, and $169 million or $1724/gpd without on-site oxidation. These costs show a saving due to economies of scale of $561/gpd with on-site oxidation, and $358/gpd without on-site
oxidation. The costs were determined to be the same for paper and wood feedstocks.
Site Screeninp and Evaluation
An initial inventory of 74 sites was developed to be screened to meet Ammo’s minimum
facility requirements and as a basis for discussions with New York City and utility
agencies as to their availability. Following discussions with the agencies, sites were excluded that were either not available or did not meet minimum facility requirements. This process resulted in an inventory of 24 sites.
To identify two preferred sites in New York City for further detailed economic studies, numerous environmental and community related issues were reviewed, screened, and selected as key threshold and evaluation criteria. To qualify for further evaluation, sites were required to meet five threshold criteria, including size, shape, natural resources, availability, and zoning. Thirteen evaluation criteria, which enabled comparison of sites,
were grouped into four categories: land use, environmental receptors, transportation, and
economic factors. The evaluation criteria were also weighted using the Paired Comparison Technique (PCT), a scientific method for ranking sites by comparing only
two sites at a time.
s-3
The site selection process resulted in the identification of two preferred sites that ranked among the top five sites. These sites, the Proctor & Gamble (P&G) and Arthur Kill sites are privately owned and located on Staten Island. Privately owned sites are recommended because of the reduced permitting time over a publicly owned parcel, which can only be acquired after lengthy Uniform Land Use Regulatory Procedures (ULURP) are completed by New York City.
COST ESTIMATES FOR PREFERWED SITES
Capital costs for a 500-tpd plant constructed at either of the two preferred sites were estimated for the conditions of on-site as well as off-site oxidation of the solids by-
product. The cost of a plant with on-site solids by-product oxidation at the P&G site is
$135 million, whereas the comparable cost at the Arthur Kill site is $129 million. Similarly, the cost of a plant without on-site oxidation at the P&G site is $101 million, compared to the cost at the Arthur Kill site of $95 million. The principal cost difference
between the two sites is the cost of land. The Arthur Kill site is owned by Con Edison
which is prepared to make the site available at virtually no cost in support of the City’s interest in a manufacturing facility to recycle paper.
FINANGLAL EVALUATION
Pro Formas
A financial comparison analysis or pro forma was conducted for the biomass-to-ethanol facility to evaluate financial viability and risk. Twelve options were evaluated for each feedstock type of waste paper and waste wood. Two sizes were evaluated to determine the effect of economies of scale: 500 tpd and lo00 tpd. Within each size, two basic plant configurations were distinguished: a biomass facility with an on-site oxidation plant that converts solids by-product to power and steam for use within the facility; and a biomass facility that disposes of the solids by-product off-site and purchases all facility
s-4
energy needs from local utilities. The market price for ethanol was assumed to fall
within a range of $1.20 to $1.50. A required return of 20 percent on equity, after taxes,
was used for 10- and 20-year life cost evaluations.
Sensitivity analysis was conducted to show the effects of capital costs as well as O&M costs on the financial evaluation. The effects of economic incentives from city, state,
and federal sources were evaluated.
The pro forma evaluation determined the required feedstock tipping fee for the waste paper options and the required ethanol price for the wood waste options. For a paper waste 500 tpd plant, the required tipping fee ranges from $38 to $%'/ton, showing that
revenue from feedstock tipping is necessary for a financially viable project, producing ethanol for $1.20 to $1.50. Similarly, for the 1000-tpd plant, tipping revenues are required, although for a smaller fee. The required tipping fee ranges from $6 to $67/ton, demonstrating the significant economies of scale in capital and operating costs. For the
wood waste options, the required ethanol prices always exceed $1.50. The 1OOO-tpd plant, with on-site oxidation of the by-product, produces ethanol for the least cost ($1 37) when the wood feedstock cost is $20/ton.
The sensitivity analysis indicates that reductions in capital cost of a 500-tpd paper-to- ethanol plant on the order of 30 to over 100 percent are needed if the project is to be viable on ethanol sales alone at $1.20. If ethanol can be sold for $1.50, the necessary capital cost reductions are less onerous, ranging from 7 to 80 percent. The 1ooO-tpd
plants require smaller capital cost reductions.
As with the capital cost reductions, O&M costs would have to be reduced by 50 to over 100 percent for ethanol sales at $1.20 to adequately and profitably cover the project costs. A reduction of 10 to 70 percent is required when ethanol can be sold for $1.50.
Sensitivity of the required ethanol price to variations in capital cost and in total O&M
s-5
cost were evaluated for the wood waste options for prices of $20 and $40/ton. The
results indicate that reductions of 25 to over 100 percent are needed if wood costs
$20/ton, and 50 to over 100 percent are needed if wood costs $4O/ton. Similar results occur for the O&M costs.
Economic cost incentives may reduce tipping fees by as much as $30 to $40/ton; but to achieve these benefits, a facility must be located in an Economic Development Zone to take advantage of State-allowed investment credits.
The conclusion of the pro forma analysis is that there is a limited "window of opportunity" for a project such as this, sited in New York City. The project should be as large as possible and be able to take advantage of econcmic incentives. The facility with an on-site by-product oxidation plant appears to be more financially viable, because of the high energy costs in the area.
Business Interests
Potential business interests in the proposed waste biomass-to-ethanol production facility
were identified from land owners, feedstock suppliers, end product users, solid waste by- product consumers, and the financial community.
Con Ed has offered its site at the Arthur Kill in Staten Island in support of the City's interest for a manufacturing facility to recycle paper.
The principal feedstock supplier is anticipated to be New York City through the Department of Sanitation's collection of recyclable waste paper. The City currently collects paper materials from all City residences and from over 5,000 institutions, including City agencies, public schools, non-profits, and municipal hospital. By June 1,
1995, the City intends to add residential mixed paper (RMP) to the recycling program, which is estimated to increase the total volume of available waste paper to between 1,300
S-6
and 2,200 tons per day. The City has prepared a draft RFP (PIN: 82794AD00069) for
manufacturing facilities located within the City to process the waste paper to a usable product including ethanol, and has offered City-owned sites and tax incentives for such a facility. Ammo has gained the interest of the City for its process. The date for
issuance of a final RFP is currently in question after a 12-month delay, mostly resulting
from the changing political climate within the City.
NYNEX Corporation has indicated an interest in considering the use of the ethanol end product as an additive in its vehicle fleet as a response to the mandated use of oxygenated gasoline required by the Federal Clean Air Act by January 1995. In New York City, NYNEX has 4,000 vehicles, including distribution trucks, vans, bucket trucks, and
sedans, at 35 locations throughout the five boroughs. NYNEX is currently evaluating a number of alternative fuels for its vehicle fleet, including ethanol.
Various utilities and companies that bum municipal solid waste (MSW) were interviewed to gauge interest in processing the solid waste by-product from the Ammo process as a fuel source. Companies that bum MSW such as American ReFuel would consider the
by-product in the same light as municipal waste and require a tipping fee on the order of $50/ton. Public Service Electric and Gas of New Jersey expressed reservations about
processing the by-product from New York City becuse of political uncertainties involved
in accepting out-of-state waste, new permitting requirements, and unknown effects on the existing boilers. Burning in existing municipal incinerators within the City was considered as inappropriate due to the political resistance within the City to incinerate waste materials.
Based on the financial pro forma runs, it was decided to delay contacting the financial community for equity interests at this time. An improved capital cost structure for building a facility in New York City is required to ensure attractive returns on investments commensurate with operating requirements, including stable feedstock
costs/tipping fees for recycle paper.
s-I
BU§IN’ESS ASSESSMENTS
Feedstock SvDdier
Champion International perceived the Amoco process as a recycling process that competes with present practices by the paper industry. The paper industry has achieved national paper recovery rates of approximately 40 percent. The economics of achieving this rate is demonstrated by the industry’s ability to absorb current recycled paper price increases to over $100/ton in New York State. Champion indicated that such instability in price makes it currently unfavorable to recycle paper via the Amoco process. The company recommended that paper mill sludge would be a more suitable feedstock, particularly in New York State where approximately 400 dry tons/day of pap;* sludge
are generated and landfilled.
Feedstock SuDDlier/Ethanol-User
NYPJEX approached the business assessment of the Amoco process as a potential user of ethanol for its vehicle fleet and as a potential supplier of feedstock in the form of old telephone directories (OTD).
With approximately 4,000 of NYNEX’s 12,000 New York State vehicles located at 35 sites throughout the five boroughs of New York City, an Ammo ethanol facility located in the City would appear to offer efficiencies for providing fuel to at least one-third of the NYNEX New York fleet. However, questions related to transportation, storage, and
the Amoco intermediate distribution process itself remain to be answered.
Currently, old telephone books are included in the residential curbside program and are a mandatory item in the City’s commercial recycling program. Waste paper markets are presently very strong, with prices in the $70 to $100/ton range. Therefore, it appears unlikely that OTD will be a feedstock source for the Amoco process in New York City.
S-8
Regarding the NYNEX decision on alternative fuels for its vehicle fleet, review of EPA reports confirmed the benefitskosts associated with alternative fuels. However, more research is needed to determine such issues as optimum engine configuration, fuel metering systems, and fuel storage technology.
s-9
SECTION 1
INTRODUCTION
OBJECTIVE
The objective of this study is to identify and evaluate two sites in New York City that could be appropriate for the construction and long-term operation of a financially attractive and environmentally sound waste biomass-to-ethanol production facility using Ammo’s biomass conversion technology (the Amoco process).
STUDY BACKGROUND
The New York City Department of Sanitation (NYCDOS) is interested in projects that would minimize waste and foster economic development for both residents and businesses. In New York City, the largest curbside recycling program in the country serves 3 million residences and expects to collect 1300 to 2200 tons per day (tpd) of waste paper by the year 1995. NYCDOS intended to solicit proposals in 1994 for a manufacturing facility, to be located in one of the City’s five boroughs, that would use waste paper as feedstock. However, because of political and budgetary decisions related to the collection of residential mixed paper (RMP), the
solicitation has been put on hold. NYCDOS is working to develop a plan for collecting RMP by July 1995. A new proposal solicitation for a recycling facility for recovered paper will be prepared at that point. In addition to waste paper, 1 million tons per year of waste wood chips
are collected in metropolitan New York City.
A second factor supporting development of a waste-to-energy facility’s legislation proposed by
the US Environmental Protection Agency (EPA), which may require that at least 30 percent of the oxygenates contained in cleaner-burning gasoline will have to be made from renewable resources (which include waste biomass products). Thus the market for biomass products such as ethanol are expected to increase substantially.
1-1
For these reasons, A m m , together with NREL, NYNEX, Champion International, and Stone & Webster Engineering Corporation have been exploring the potential for a New York City
biomass processing facility designed to produce ethanol, which could be used for transportation fuels. A m m has developed its biomass conversion technology through 15 years of research and development @&D) and pilot plant work by its own staff, NREL, and other collaborators.
Efforts are underway to assess project feasibility in conjunction with large-scale paper, forest products, and agricultural operations. Application of Amom’s process is particularly facilitated in localities, such as New York City, with a waste paper recycling program.
STUDY ORGANIZATION
The study was managed by Stone & Webster Engineering Corporation (SWEC) with technical support from Amoco, Stone & Webster Development Corporation, NYNEX, Champion International, National Renewable Energy Laboratory (NREL), the New York State Energy and Research and Development (NYSERDA), and other parties. The following identifies
participation of the team members in selection of preferred sites and evaluation of project
viability in New York City.
Stone & Webster Engineering Corporation provided the overall management of the study and
preparation of this report. In addition, SWEC was responsible for site selection (Section 2), including screening potential sites in New York City, defining site improvement requirements and costs, defining key site evaluation criteria, and evaluating and ranking sites to determine the
preferred two sites. SWEC also developed refined budgetary capital and operating costs for the two preferred sites (Section 3) and identified potential business interests (Section 4).
Amoco defined process-related requirements for the biomass-to-ethanol production facility (Section 2) and estimated capital and operating costs for the island of process equipment for 500 and loo0 tpd of feedstock (Section 2).
1-2
Stone & Webster Development Corporation prepared financial pro formas for the construction
and long-term operation of an Ammo process facility (Section 4).
Champion International prepared a business assessment as a feedstock supplier (Section 9)
NYNEX prepared a business assessment as a potential ethanol user and a provider of old telephone directories or feedstock (Section 9).
1-3
SECTION 2
NEW YORK CITY SITE SELECTION
The study gathered and reviewed New York City siting data available within Stone & Webster
Engineering Copration and elsewhere, and determined design requirements of the Amoco
process for prospective sites. The preferred sites were selected based on developed criteria and
Amoco process requirements. Financial evaluations were performed to determine the economics
of developing a project in New York City.
FACILITY REQUIREMENTS FOR SITE SELECTION
Technolow 0 verview
A processing facility for converting biomass to ethanol requires a number of processing steps
(depicted later in Figures 2-1 through 2-5):
a
a
0
0
Waste PapedWood Storage. In the first step, feedstock (paper or wood) is
cleaned of contaminants and shredded prior to further processing.
Pretreatment. This step sterilizes the feedstock and prepares it for further
processing by hydrolysis agents.
Enzymatic Hydrolysis. enzymes. This operation converts cellulose to glucose.
Fermentation. In this step, glucose is converted to ethanol by applying
microorganisms in a fermentation process similar to the corn-to-ethanol process.
Typically, about half of the glucose is converted to carbon dioxide and half to
The feedstock is hydrolysed by adding acid and
ethanol. Small amounts of glucose are converted to microorganism cell mass.
Distillation. The ethanol is recovered using a distillation technology commonly
employed by the corn-to-ethanol industry. This is followed by the use of
2-1
. . .-
molecular sieves to break up the water-ethanol mixture.
0 Anaerobic Digestion. Solids emanating from the distillation process are
subjected to digestion by anaerobic bacteria to generate methane off-gas and the solids/liquid product. The methane off-gas may be used to supply energy
required by the Ammo process.
SoliddLiquid Separation. In the final step, unreacted solids are separated from
liquids. The solids may be used as fuel to supply process heat and power or sold to others for use as fuel. The liquids are subjected to digestion by aerobic bacteria and discharged for reuse in the process.
Facflitv Requirements
Minimum generic facility characteristics that would affect site selection and economic evaluation
were identified. These requirements included feedstock type, feedstock quantity, ethanol
production rate, solids by-product characteristics, environmental emission characteristics,
utilities, personnel, land area, and power reliability. The facility requirements are summarized
in Table 2-1 for two types of cellulose-bearing feedstock materials: paper and wood. A
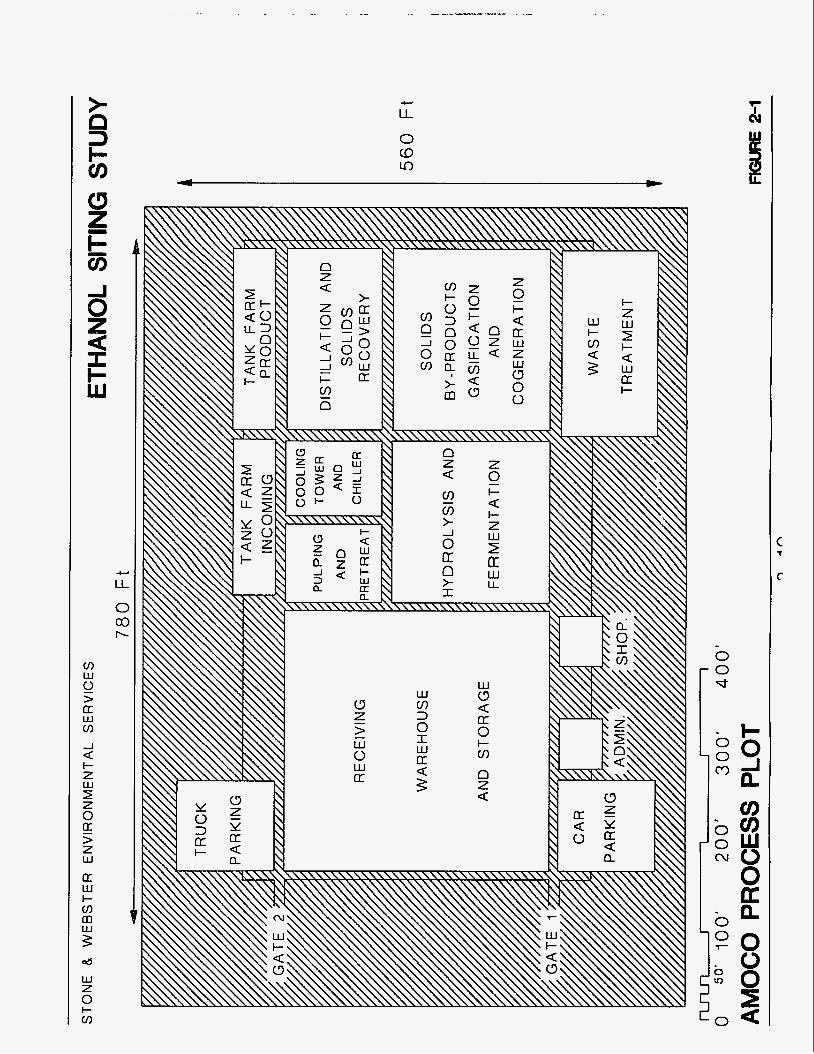
feedstock quantity of 500 tpd was selected as representing a minimum economic facility size. A site plan of the prototype biomass-to-ethanol facility is shown in Figure 2-1.
2-2
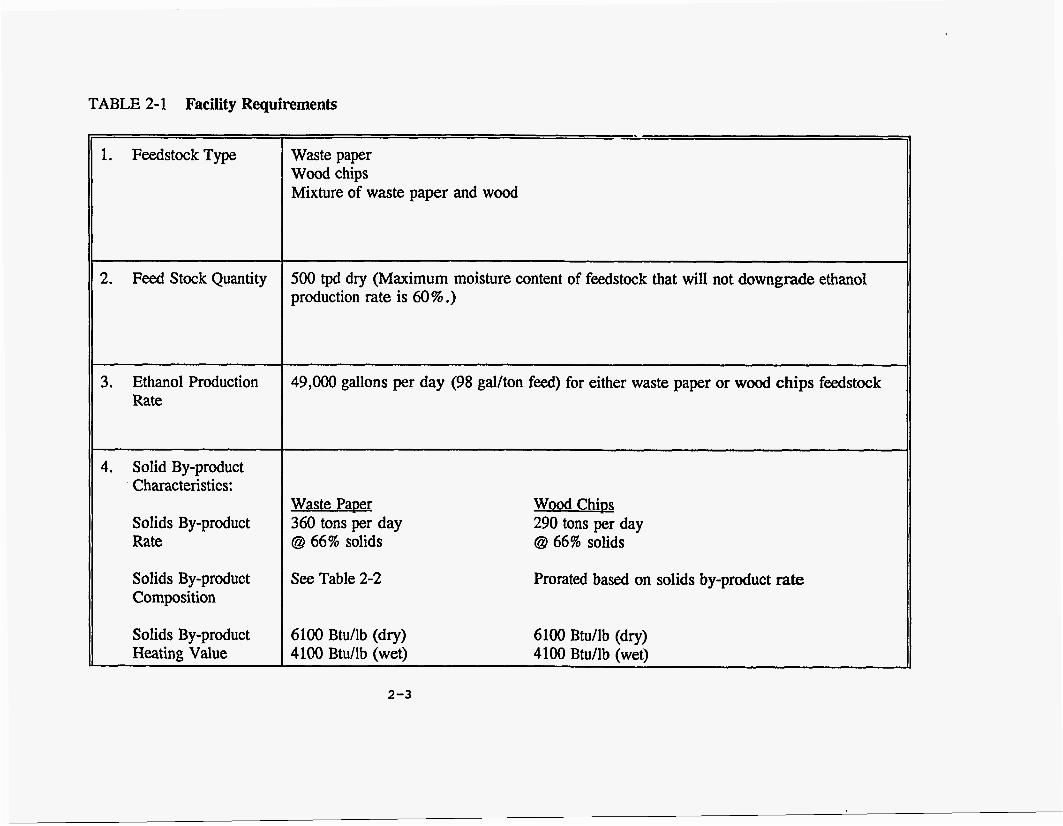
TABLE 2- 1 Facility Requirements
1. Feedstock Type
2. Feed Stock Quantity
3. Ethanol Production Rate
4. Solid By-product Characteristics:
Solids By-product Rate
Solids By-product Composition
Solids By-product Heating Value
Waste paper Wood chips Mixture of waste paper and wood
~ ~ ~~ ~ ~~~
500 tpd dry (Maximum moisture content of feedstock that will not downgrade ethanol production rate is 60%.)
49,000 gallons per day (98 gallton feed) for either waste paper or wood chips feedstock
Waste PaDer 360 tons per day @ 66% solids
See Table 2-2
6100 Btu/lb (dry) 4100 Btu/lb (wet)
Wood Chios 290 tons per day @ 66% solids
Prorated based on solids by-produc, rate
6100 BtuAb (dry) 4100 Btu/lb (wet)
2 -3
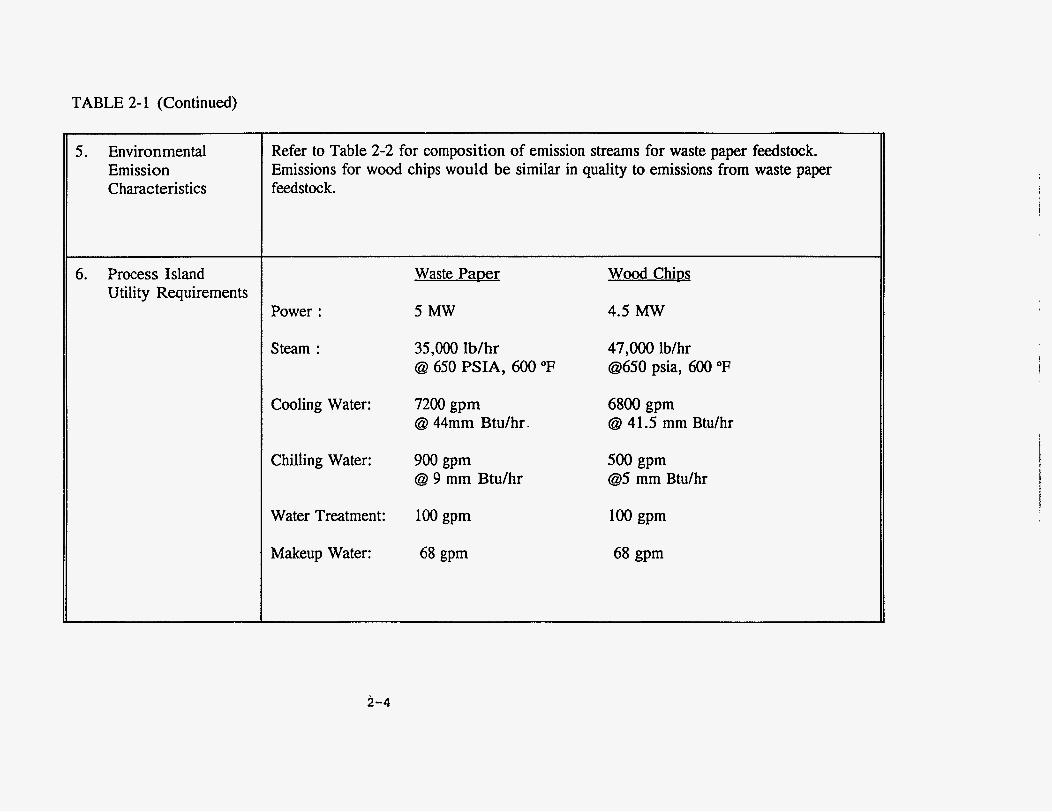
TABLE 2- 1 (Continued)
5. Environmental Emission Characteristics
6. Process Island Utility Requirements
Refer to Table 2-2 for composition of emission streams for waste paper feedstock. Emissions for wood chips would be similar in quality to emissions from waste paper feedstock.
Power :
Steam :
Cooling Water:
Chilling Water:
Water Treatment:
Makeup Water:
Waste PaDer
5 MW
35,000 Ib/hr @ 650 PSIA, 600 O F
7200 gpm @ 44mm Btu/hr.
900 gpm @ 9 mm Btu/hr
Wood Chips
4.5 MW
47,000 lb/hr a 6 5 0 psia, 600 O F
6800 gpm @ 41.5 mm Btu/hr
500 gPm @5 mm Btu/hr
2-4
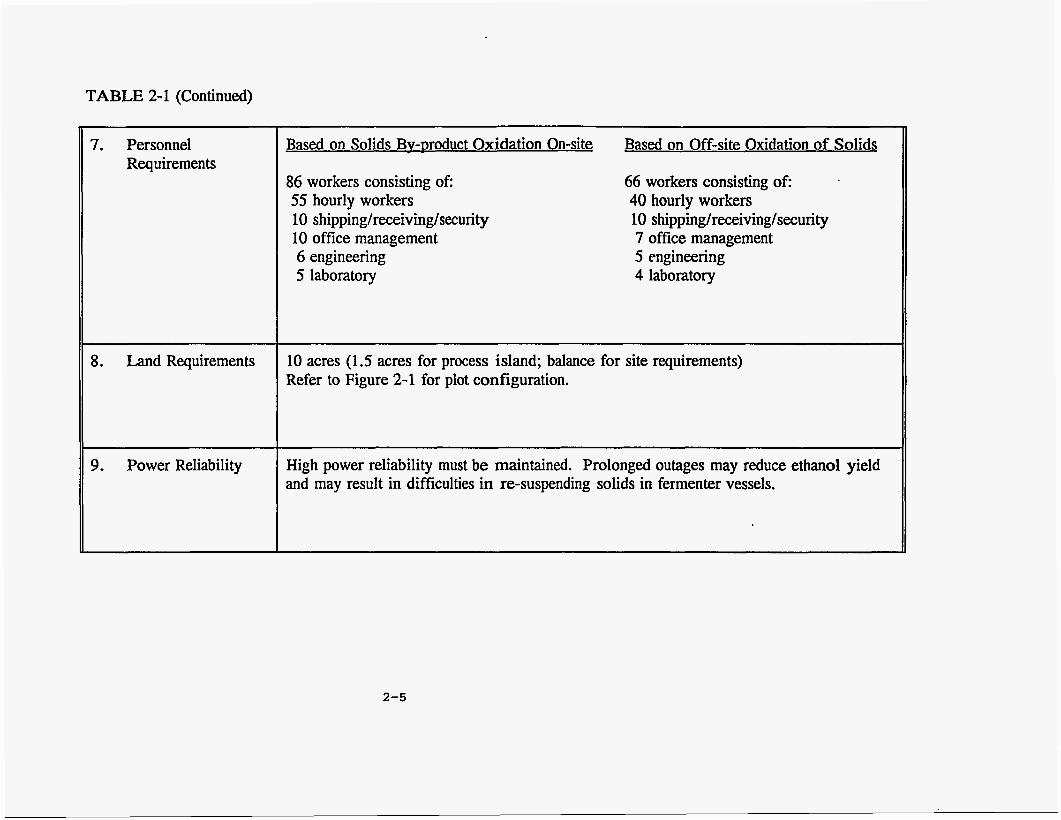
TABLE 2-1 (Continued)
n
7. Personnel Requirements
8 . Land Requirements
9. Power Reliability
Based on Solids Bv-product Oxidation On-site Based on Off-site Oxidation of Solids
86 workers consisting of: 55 hourly workers 10 shipping/receiving/security 10 office management 6 engineering 5 laboratory
66 workers consisting of: 40 hourly workers 10 shipping/receiving/security 7 office management 5 engineering 4 laboratory
10 acres (1.5 acres for process island; balance for site requirements) Refer to Figure 2-1 for plot configuration.
High power reliability must be maintained. Prolonged outages may reduce ethanol yield and may result in difficulties in re-suspending solids in fermenter vessels.
2-5
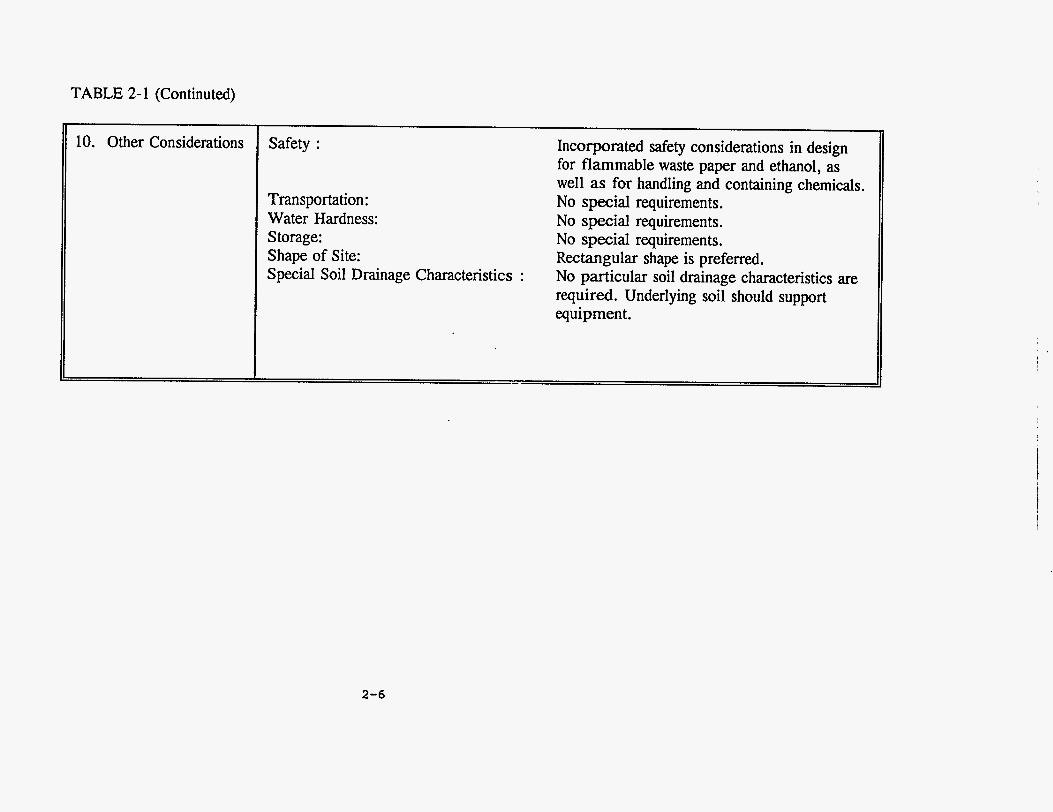
TABLE 2- 1 (Continuted)
~~
Safety : Incorporated safety considerations in design for flammable waste paper and ethanol, as well as for handling and containing chemicals.
Transportation: No special requirements. Water Hardness: No special requirements. Storage: No special requirements. Shape of Site: Special Soil Drainage Characteristics :
Rectangular shape is preferred. No particular soil drainage characteristics are required. Underlying soil should support equipment.
2-6
COMPONENTS WASTE SOLIDS
Garbage
Ash
SCRUBBED ANAEROBIC FERMENTER GAS OFF-GAS
Lignin
Furfural & acetaldehyde
Calcium sulfate
12500
28200
Cell mass
1150
Ethanol
30
Carbon Dioxide
Oxygen
47600
Nitrogen
Methane
245
Water
5oooo TOTAL
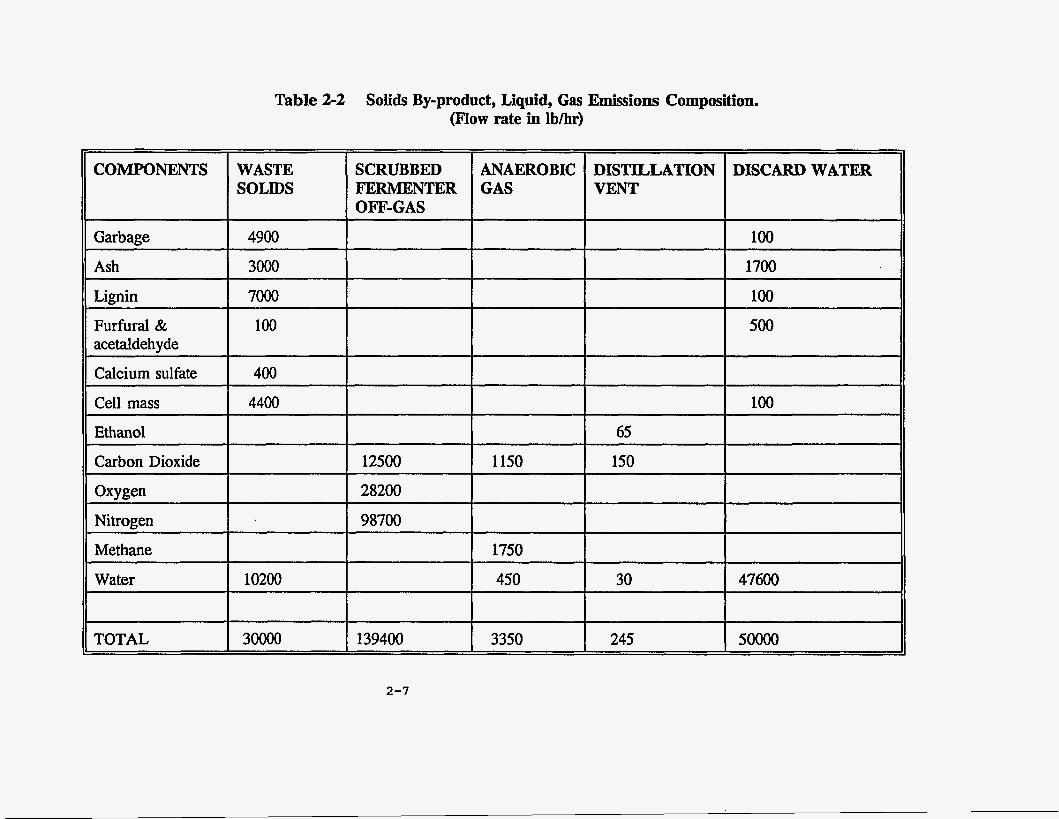
Table 2-2 Solids By-product, Liquid, Gas Emissions Composition. (Flow rate in lb/hr)
4900
3000
7000
100
400 I I 4400
98700
1750
3oooo 139400
2-7
DISTILLATION I DISCARD WATER ll VENT
100
1700
100
65
I 150
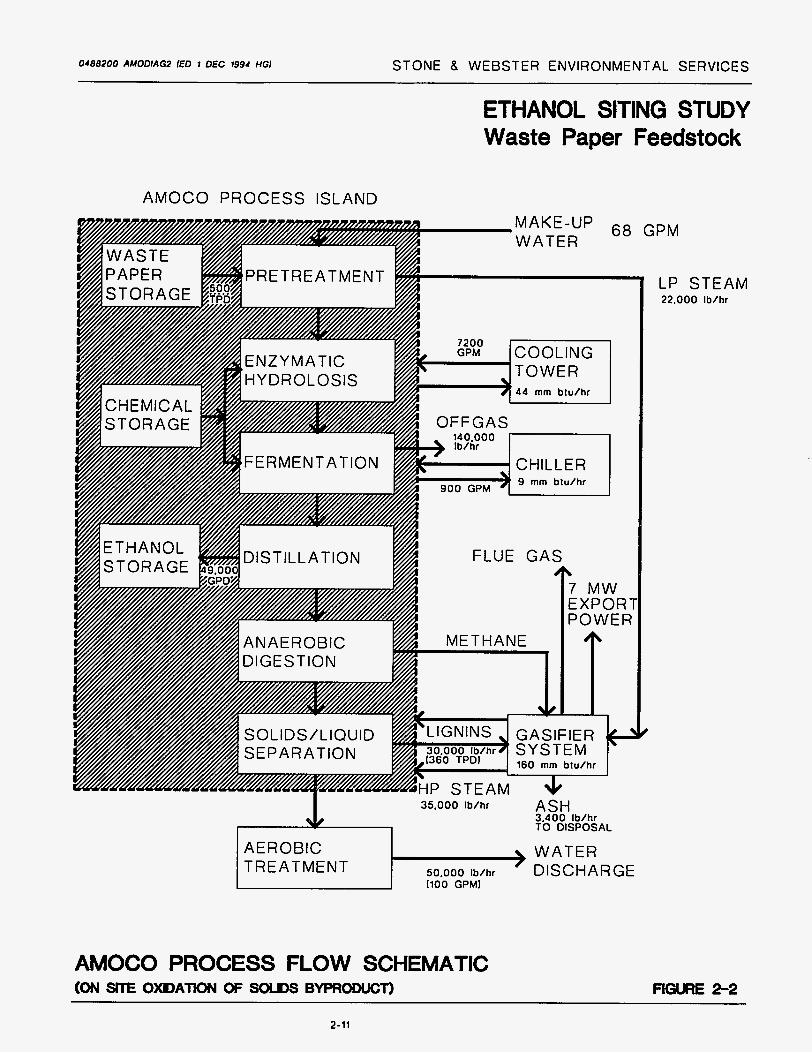
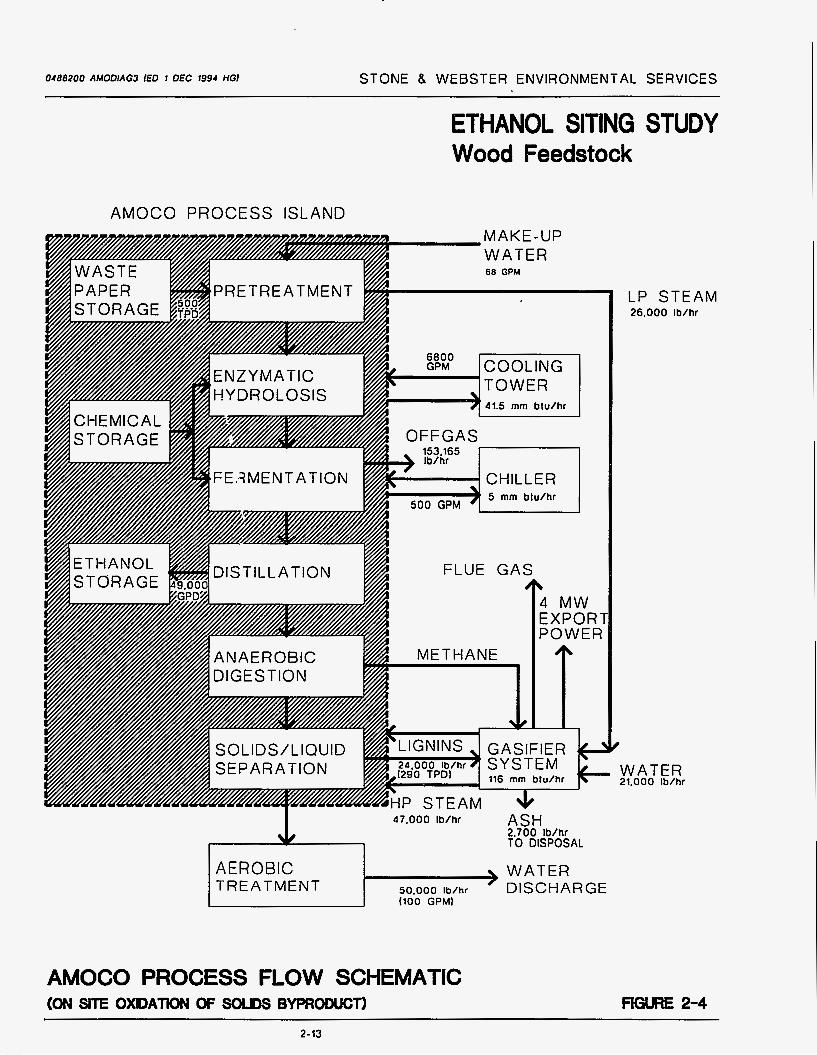
The solids by-product consists primarily of lignin, which has a significant heating value and can therefore be used as a fuel to generate steam and/or power. Combustion of the lignin with an estimated heating value of 6100 Btu/lb dry (4100 Btu/lb wet) material will generate
approximately 120 million Btulhr. In addition, gas leaving the anaerobic digestion operation within the Ammo process contains approximately 50 percent methane and, upon combustion,
can contribute an additional 40 million Btu/hr of heat value. The &lids by-product produced by the Amoco process represents approximately 50 percent of the dry feedstock. The composition of solids by-product emissions is summarized in Table 2-2.
With this much heat available from both by-products of the Amoco process, the study evaluated the economic benefits of two approaches for disposing of the solids by-product:
Approach A: Local cogeneration of steam and power through on-site gasification of the lignin and combustion of the methane containing off-gases.
A flow diagram depicting this approach is shown in Figures 2-2 and 2-4.
This approach requires a higher capital investment but makes the plant
self-sufficient with respect to process steam and power, and results in a net export of power. Gasification is the preferred processing method for the solids by-product because of the opposition by public and regulatory agencies to direct combustion of solids fuels within New York City.
Approach B : Transportation of the solids by-product to an off-site solids fuel burning facility.
A flow diagram depicting this approach is shown in Figure 2-3 and 2-4.
This approach involves little capital investment but requires high operating costs in the form of tipping fees at solids fuel burning facilities outside the City limits. These include utilities, industrial facilities, and cogeneration
2-8
plants burning municipal solid waste (MSW). The market value of the
solids by-product is discussed in the economic pro formas in Section 4.
utilities
Utility requirements for the Amoco process are power, steam, cooling and chilled water, and makeup water. To make the site selection more flexible and independent of the availability of cooled water, a closed-loop cooling tower and chiller were selected to supplement the Amoco process. A once-through cooling system would limit the siting of the facility to areas adjacent to large water bodies. Power and steam requirements are based on Approaches A and B. In
Approach A, a combination of gasification of lignin, combustion of by-product gases, and cogeneration can provide the required steam and power, and resul: in a net export of power. In Approach B, power would be purchased and steam produced through a package boiler fueled by the methane containing off-gases from the Ammo process. Natur;II gas would be purchased to supplement the fuel requirements.
See Attachments 2-1 through 2-3 in the Appendix for additional details about facility requirements.
2-9
cn W
> U W cn
Q
0
-I
I- z H 0 a:
W
z
> z W
a W I- cn m : ob
W z 0 I- cn
0 a Lo
4 t
W cn 3 0 I W oc
W (3
U 0 I- cn
a
n a z
0 -0
Kf
0 -0 m
0 0 m
0 L O
o
T-
m
0
C
C
T
0488200 AMODIAG2 [ED 1 OEC 1994 HGI STONE 8 WEBSTER ENVIRONMENTAL SERVICES
AEROBIC TREATMENT
ETHANOL SITING STUDY Waste Paper Feedstock
> WATER 50.000 Ib/hr DISCHARGE I100 GPMI
AMOCO PROCESS ISLAND
GPM
35.000 Ib/hr ASH 3.400 Ib/hr TO DISPOSAL
AMOCO PROCESS FLOW SCHEMATIC (ON SITE OXDATION OF SWDS BYPRODUCT)
LP STEAM 22.000 W h r
FIGURE 2-2
2-11

0488200 AMODIAGl ( E D 1 DEC 1 9 9 4 HG) STONE 8 WEBSTER ENVIRONMENTAL SERVICES
ETHANOL SITING STUDY Waste Paper Feedstock
AMOCO PROCESS ISLAND
LIGNINS
(360 TPD) TRANSPORTED OFF SITE 30.000 Ib/hr
AMOCO PROCESS FLOW SCHEMATIC ( s o t o s B V P R o o U C T ~ O F F = ) FfGURE 2-3
2-12
0488200 AMODlAGl IED 1 DEC 1994 HGI STONE 8 WEBSTER ENVIRONMENTAL SERVICES
AEROBIC TREATMENT
ETHANOL SITING STUDY Wood Feedstock
> WATER 50.000 Ib/hr DISCHARGE (100 GPMI
AMOCO PROCESS ISLAND
LP STEAM 26.000 Ib/hr
WATER 21.000 Ib/hr
ASH 47.000 Ib/hf 2.700 Ib/hf TO DISPOSAL
AMOCO PROCESS FLOW SCHEMATIC (ON SlTE 0XDATK)N OF SOLDS BVPRODUCT) FIGRE 2-4
2-13

0488200 AMODIAG4 [ED 1 DEC 1994 HGI STONE B WEBSTER ENVIRONMENTAL SERVICES
ETHANOL SITING STUDY Wood Feedstock
AMOCO PROCESS ISLAND
47.000 Ib/hr
WATER TREATMENT DISCHARGE
LIGNINS 24.000 LBIHR I290 TPDI TRANSPORTED OFF SITE
AMOCO PROCESS FLOW SCHEMATIC (SOUDS BYPRODUCT fRANspoRTED OFF SITE)
57.6 MM BTU/HR
FIGURE 2-5

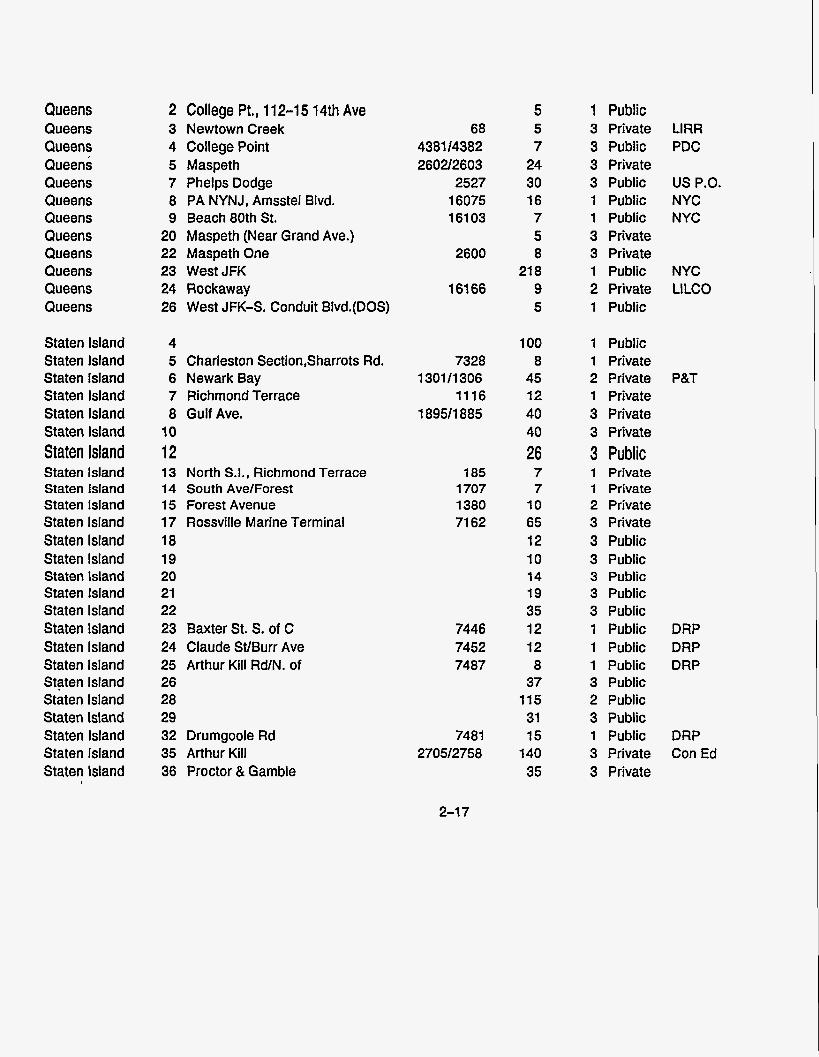
An inventory of 74 sites, including three sites identified by the NYC Department of Sanitation, was developed for purposes of screening sites to meet Amoco’s minimum facility requirements
and as a basis for discussing site availability with various City agencies. This inventory is shown in Table 2-3 by Borough along with description, black number, acreage, manufacturing zone (M
Zone), type of ownership, and owner, if known.
Following discussions with the NYC Department of General Services (Division of R d Estate Services), Con Edison, Brooklyn Union Gas, NYC Department Economic Development, and
NYC Department of Sanitation, sites were excluded that were either not available or did not meet the minimum requirements. The list of 24 remaining sites is shown in Table 2-4 by Borough and includes comments on most of the sites where additional information was obtained during data gathering.
PROCESS EQuJoplMENT COST ESTIMATE
This section provides estimates of capital budgets for process island equipment designed for
feedstock quantities of 500 and loo0 tpd. The estimates reflect the size, shape, and orientation of the Amoco process island, as well as the feedstock quality defined in Table 2-1 (Facility Requirements).
The capital cost estimate for a 500-tpd process island has been estimated by Amoco to be $47 million, based on building a facility in the Gulf Coast region of the United States (see Attachment 2-3a in the Appendix). This cost estimate Was upgraded to $68 million to reflect
the higher labor rates of New York City. Similarly, a capital cost estimate for the process island of a 1000-tpd plant in New York City was estimated to be $108 million. The capital cost of the process island is approximately the same for paper and wood feedstock.
The operating cost estimate for 500-tpd and 1000-tpd process islands is discussed in Section 4
(financial pro formas).
2-15
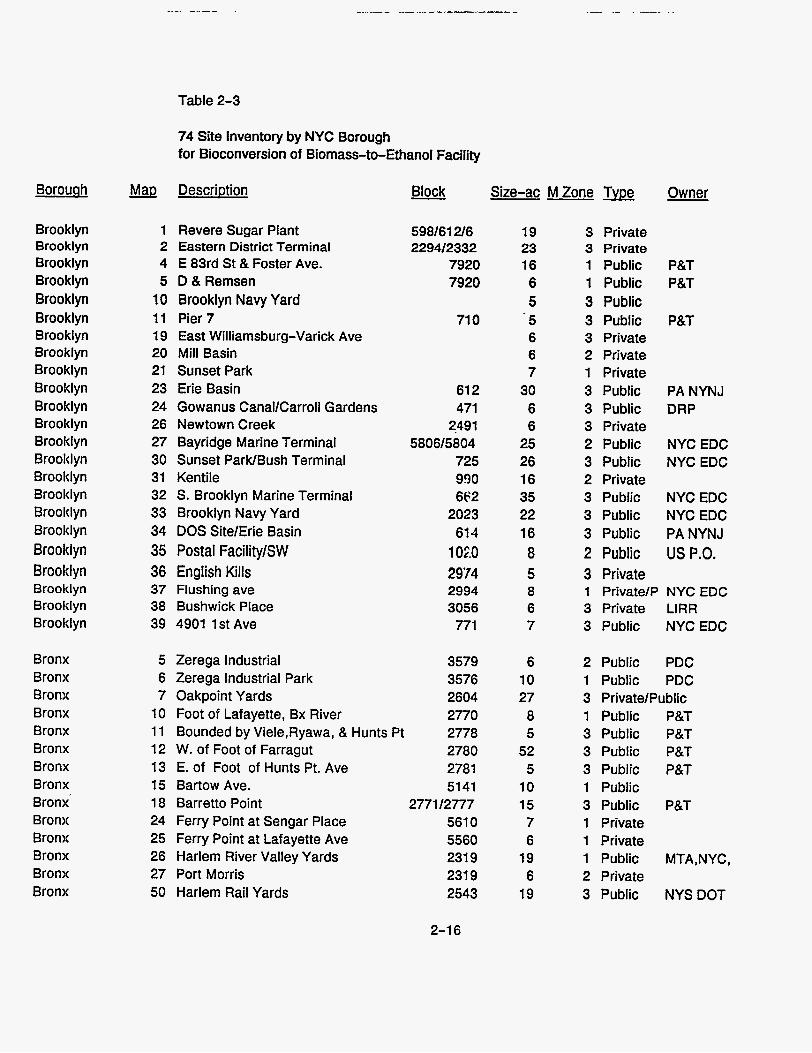
Table 2-3
74 Site Inventory by NYC Borough for Bioconversion of Biomass-to-Ethanol Facility
Borounh
Brooklyn Brooklyn Brooklyn Brooklyn Brooklyn Brooklyn Brooklyn Brooklyn Brooklyn Brooklyn Brooklyn Brooklyn Brooklyn Brooklyn Brooklyn Brooklyn Brooklyn Brooklyn Brooklyn Brooklyn Brooltlyn Brooklyn Brooklyn
Bronx Bronx Bronx Bronx Bronx Bronx Bronx Bronx Bronx Bronx Bronx Bronx Bronx Bronx
Mao
1 2 4 5
10 11 19 20 21 23 24 26 27 30 31 32 33 34 35 36 37 38 39
5 6 7
10 11 12 13 15 18 24 25 26 27 50
DescriDtion
Revere Sugar Plant Eastern District Terminal E 83rd St & Foster Ave. D & Remsen Brooklyn Navy Yard Pier 7 East Williamsburg-Varick Ave Mill Basin Sunset Park Erie Basin Gowanus CanallCarroll Gardens Newtown Creek Bayridge Marine Terminal Sunset ParWBush Terminal Kentile S. Brooklyn Marine Terminal Brooklyn Navy Yard DOS Site/Erie Basin Postal FacilitylSW English Kills Flushing ave Bushwick Place 4901 1st Ave
Zerega Industrial Zerega Industrial Park Oakpoint Yards Foot of Lafayette, Bx River
598161 2/6 229412332
7920 7920
71 0
61 2 471
2491 5806/5804
725 990 662
2023 61 4
1 or.0 29'74 2994 3056 771
3579 3576 2604 2770
Bounded by Viele,Ryawa, & Hunts Pt 2778 W. of Foot of Farragut 2780 E. of Foot of Hunts Pt. Ave 278 1 Bartow Ave. 5141 Barretto Point 2771 12777 Ferry Point at Sengar Place 561 0 Ferry Point at Lafayette Ave 5560 Harlem River Valley Yards 231 9 Port Morris 231 9 Harlem Rail Yards 2543
2-1 6
Size-ac MZone TvDe
19 23 16 6 5
' 5 6 6 7
30 6 6
25 26 16 35 22 16 8 5 8 6 7
6 10 27 8 5
52 5
10 15 7 6
19 6
19
3 Private 3 Private 1 Public 1 Public 3 Public 3 Public 3 Private 2 Private 1 Private 3 Public 3 Public 3 Private 2 Public 3 Public 2 Private 3 Public 3 Public 3 Public 2 Public 3 Private
Owner
P&T P&T
P&T
PA NYNJ DRP
NYC EDC NYC EDC
NYC EDC NYC EDC PA NYNJ us P.O.
1 Private/P NYC EDC 3 Private LIRR 3 Public NYCEDC
2 Public PDC 1 Public PDC 3 Private/Public 1 Public P&T 3 Public P&T 3 Public P&T 3 Public P&T 1 Public 3 Public P&T 1 Private 1 Private 1 Public MTA,NYC, 2 Private 3 Public NYSDOT
Queens Queens Queens Queens Queens Queens Queens Queens Queens Queens Queens Queens
Staten Island Staten Island Staten Island Staten Island Staten Island Staten Island
Staten Island Staten Island Staten Island Staten Island Staten Island Staten Island Staten Island Staten Island Staten Island Staten Island Staten Island Staten Island Staten Island Staten Island Staten Island Staten Island Staten Island Staten Island
Staten island
2 College Pt., 112-15 14th Ave 3 Newtown Creek 4 College Point 5 Maspeth 7 Phelps Dodge 8 PA NYNJ, Amsstel Blvd. 9 Beach 80th St.
20 Maspeth (Near Grand Ave.) 22 Maspeth One 23 West JFK 24 Rockaway 26 West JFK-S. Conduit Blvd.(DOS)
4 5 Charleston Section,Sharrots Rd. 6 NewarkBay 7 Richmond Terrace 8 Gulf Ave.
10 12 13 North S.I., Richmond Terrace 14 South Ave/Forest 15 Forest Avenue 17 Rossville Marine Terminal 18 19 20 21 22 23 Baxter St. S. of C 24 Claude St/Burr Ave 25 Arthur Kill RdlN. of 26 28 29 32 Drumgoole Rd 35 Arthur Kill 36 Proctor & Gamble
68 438114382 2602/2603
2527 16075 161 03
2600
161 66
7328 130111 306
1116 189511 885
185 1707 1380 71 62
7446 7452 7487
7481 270512758
5 5 7
24 30 16 7 5 8
21 8 9 5
100 8
45 12 40 40 26 7 7
10 65 12 10 14 19 35 12 12 8
37 115 31 15
140 35
1 Public 3 Private LlRR 3 Public PDC 3 Private 3 Public US P.O. 1 Public NYC 1 Public NYC 3 Private 3 Private 1 Public NYC 2 Private LlLCO 1 Public
1 Public 1 Private 2 Private P&T 1 Private 3 Private 3 Private 3 Public 1 Private 1 Private 2 Private 3 Private 3 Public 3 Public 3 Public 3 Public 3 Public 1 Public DRP 1 Public DRP 1 Public DRP 3 Public 2 Public 3 Public 1 Public DRP 3 Private Con Ed 3 Private
2-1 7
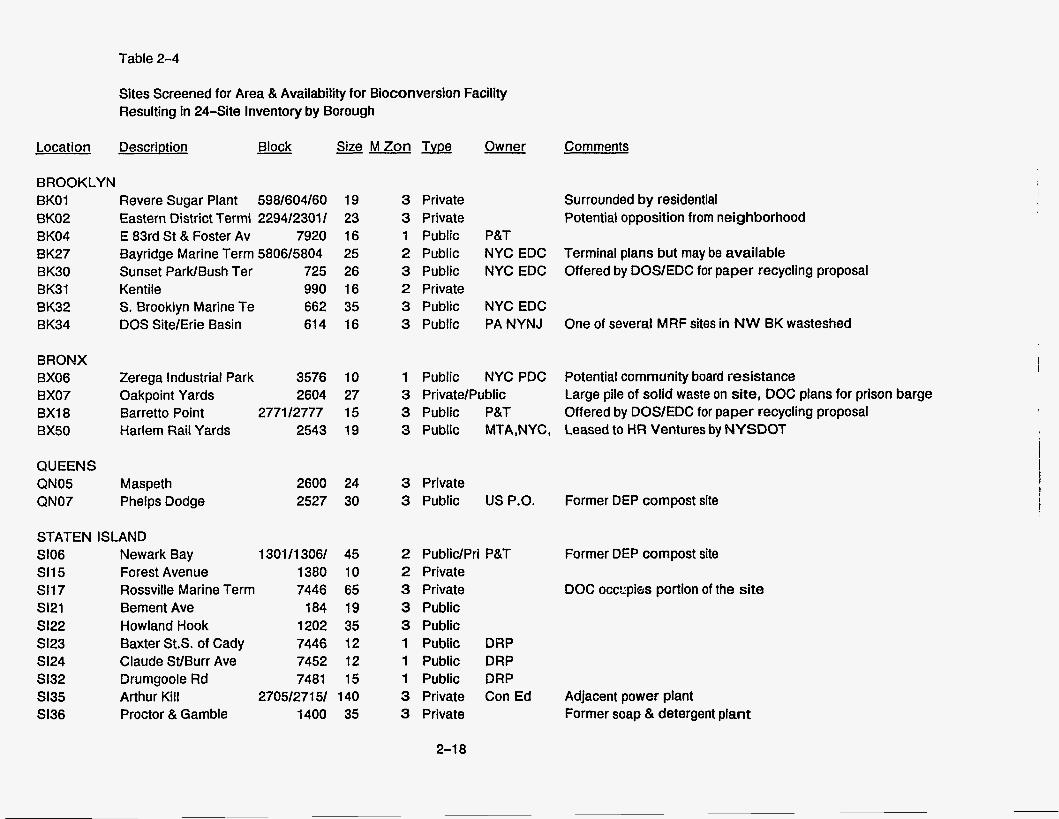
Table 2-4
Sites Screened for Area & Availability for Bioconversion Facility Resulting in 24-Site Inventory by Borough
Location Description Block -- Size MZon Owner
BROOKLYN BKO1 BK02 BK04 BK27 BK30 BK31 BK32 BK34
BRONX BX06 BX07 BX18 13x50
QUEENS QN05 QN07
Revere Sugar Plant 598/604/60 Eastern District Termi 2294/2301/ E 83rd St & Foster Av 7920 Bayridge Marine Term 5806/5804 Sunset ParklBush Ter 725 Kentile 990 S. Brooklyn Marine Te 662 DOS Site/Erie Basin 61 4
19 23 16 25 26 16 35 16
Zerega Industrial Park 3576 10 Oakpoint Yards 2604 27 Barretto Point 2771/2777 15 Harlem Rail Yards 2543 19
Maspeth Phelps Dodge
2600 24 2527 30
STATEN ISLAND SI06 Newark Bay 1301/1306/ SI1 5 Forest Avenue 1380 SI17 Rossville Marine Term 7446 SI21 Bement Ave 184 SI22 Howland Hook 1202 SI23 Baxter StS. of Cady 7446 SI24 Claude St/Burr Ave 7452 SI32 Drumgoole Rd 7481 SI35 Arthur Kill 2705/2715/ SI36 Proctor & Gamble 1400
45 10 65 19 35 12 12 15
140 35
Comments
3 Private Surrounded by residential 3 Private Potential opposition from neighborhood 1 Public P&T 2 Public NYC EDC Terminal plans but may be available 3 Public NYC EDC Offered by DOSlEDC for paper recycling proposal 2 Private 3 Public NYC EDC 3 Public PA NYNJ One of several MRF sites in NW BK wasteshed
1 Public NYC PDC Potential community board resistance 3 PrivatelPublic 3 Public P&T Offered by DOS/EDC for paper recycling proposal 3 Public MTA,NYC, Leased to HR Ventures by NYSDOT
Large pile of solid waste on site, DOC plans for prison barge
3 Private 3 Public US P.O. Former DEP compost site
2 PubliclPri P&T 2 Private 3 Private 3 Public 3 Public 1 Public DRP 1 Public DRP 1 Public DRP 3 Private Con Ed 3 Private
Former DEP compost site
DOC occ!^!pi6s portion of the site
Adjacent power plant Former soap & detergent plant
I
,
2-1 8
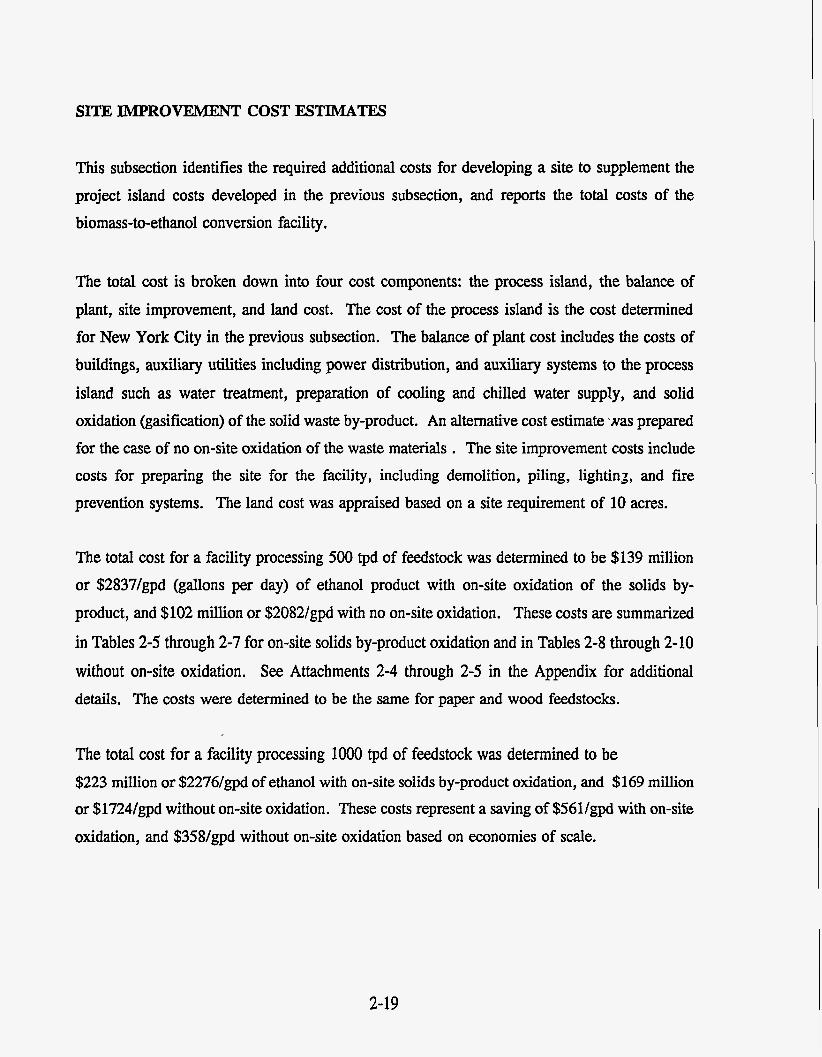
SITE IMPROVEMENT COST ESTIMATES
This subsection identifies the required additional costs for developing a site to supplement the project island costs developed in the previous subsection, and reports the total costs of the biomass-to-ethanol conversion facility.
The total cost is broken down into four cost components: the process island, the balance of plant, site improvement, and land cost. The cost of the process island is the cost determined for New York City in the previous subsection. The balance of plant cost includes the costs of buildings, auxiliary utilities including power distribution, and auxiliary systems to the process island such as water treatment, preparation of cooling and chilled water supply, and solid oxidation (gasification) of the solid waste by-product. An alternative cost estimate as prepared for the case of no on-site oxidation of the waste materials . The site improvement costs include costs for preparing the site for the facility, including demolition, piling, lightinb, and fire prevention systems. The land cost was appraised based on a site requirement of 10 acres.
The total cost for a facility processing 500 tpd of feedstock was determined to be $139 million or $2837/gpd (gallons per day) of ethanol product with on-site oxidation of the solids by- product, and $102 million or $2082/gpd with no on-site oxidation. These costs are summarized
in Tables 2-5 through 2-7 for on-site solids by-product oxidation and in Tables 2-8 through 2-10 without on-site oxidation. See Attachments 2-4 through 2-5 in the Appendix for additional details. The costs were determined to be the same for paper and wood feedstocks.
The total cost for a facility processing 1OOO tpd of feedstock was determined to be $223 million or $2276/gpd of ethanol with on-site solids by-product oxidation, and $169 million or $1724/gpd without on-site oxidation. These costs represent a saving of $561/gpd with on-site oxidation, and $358/gpd without on-site oxidation based on economies of scale.
2-19
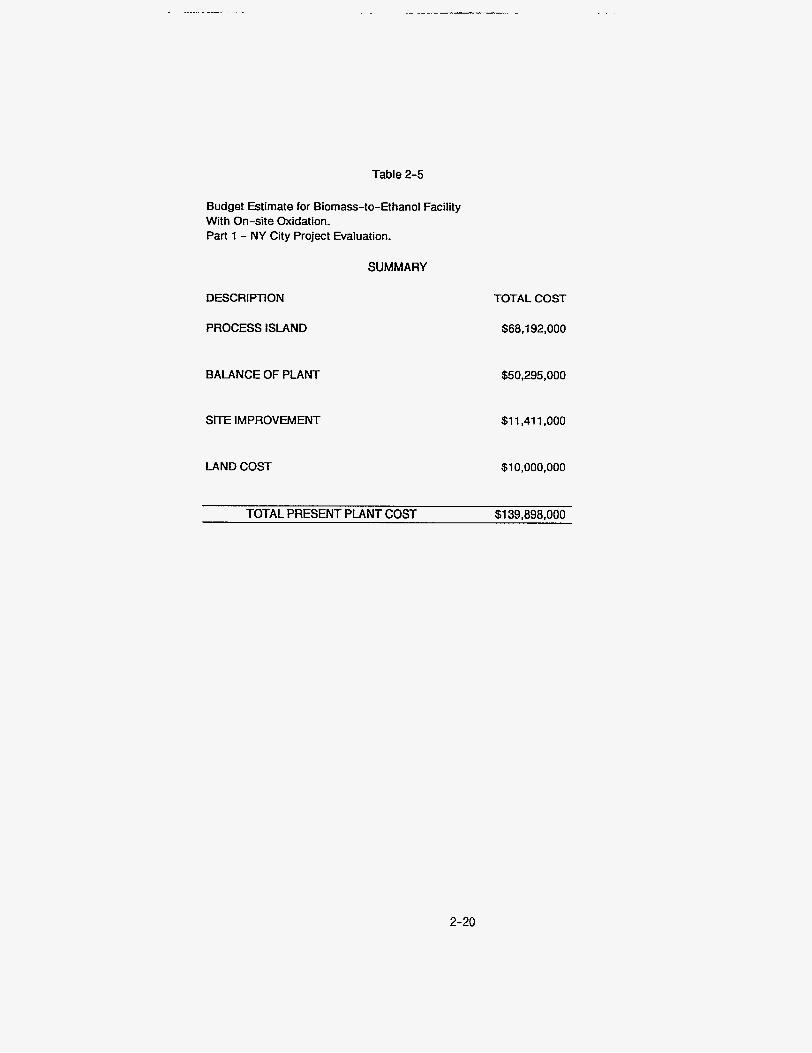
Table 2-5
Budget Estimate for Biomass-to-Ethanol Facility With On-site Oxidation. Part 1 - NY City Project Evaluation.
SUMMARY
DESCRlPnON
PROCESS ISLAND
TOTAL COST
$68,192,000
BALANCE OF PLANT $50,295,000
SITE IMPROVEMENT $1 1.41 1,000
LAND COST $1 0,000,000
TOTAL PRESENT PLANT COST $1 39,898,000
2-20
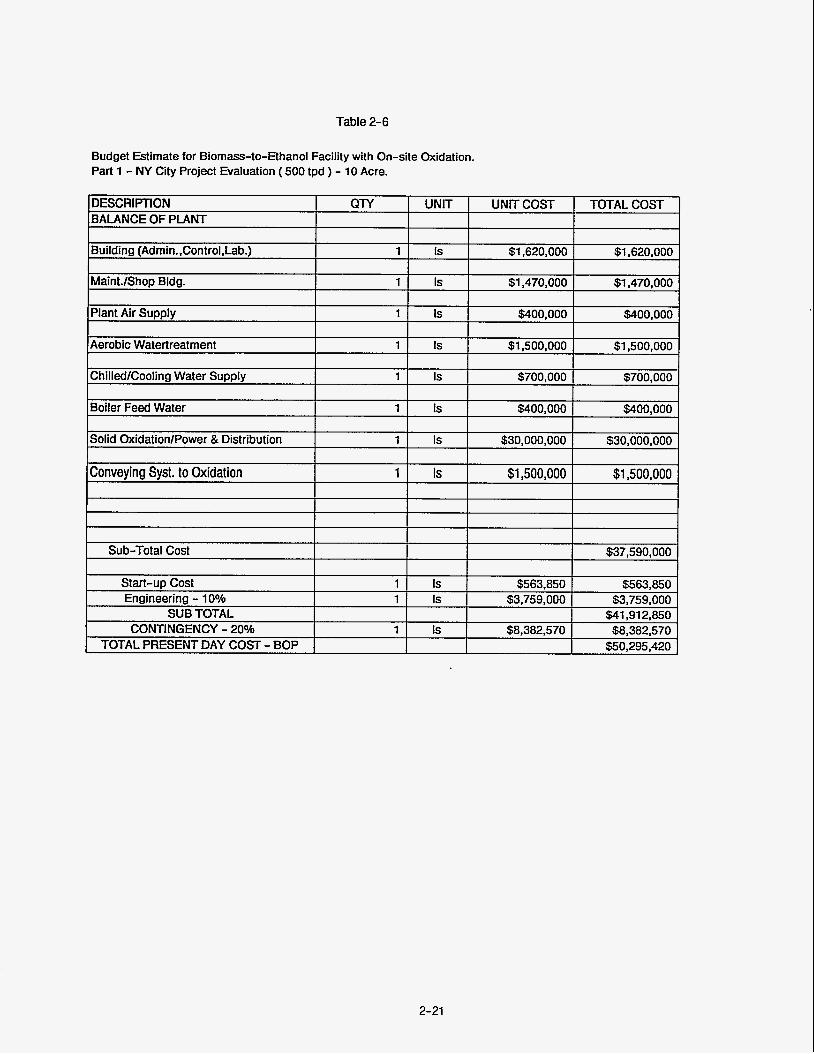
Table 2-6
Building (Admin.,Control,Lab.)
Budget Estimate for Biomass-to-Ethanol Facility with On-site Oxidation. Part 1 - NY City Project Evaluation ( 500 tpd ) - 10 Acre.
~ ~~
1 Is $1,620,000 $1,620,000
MaintJShop Bldg. 1 1 Is $1,470,000 1 $1,470,000
Plant Air Supply 1 1 Is $400,000 I $400,000
Chilled/Cooling Water Supply
Boiler Feed Water
1 Is $700,000 $700,000
1 Is $400,000 $400,000
Solid Oxidation/Power & Distribution 1 Is $30,000,000 $30,000,000
Conveying Syst. to Oxidation 1 Is $1,500,000 $1,500,000
2-21
Sub-Total Cost $37,590,000
Start-up Cost Engineering - 10%
SUB TOTAL
TOTAL PRESENTDAY COST -BOP CONTINGENCY - 20%
1 Is $563,850 $563,850 1 Is $3,759.000 $3,759.000
$41,912,850 1 Is $8,382,570 $8,382,570
$50,295,420
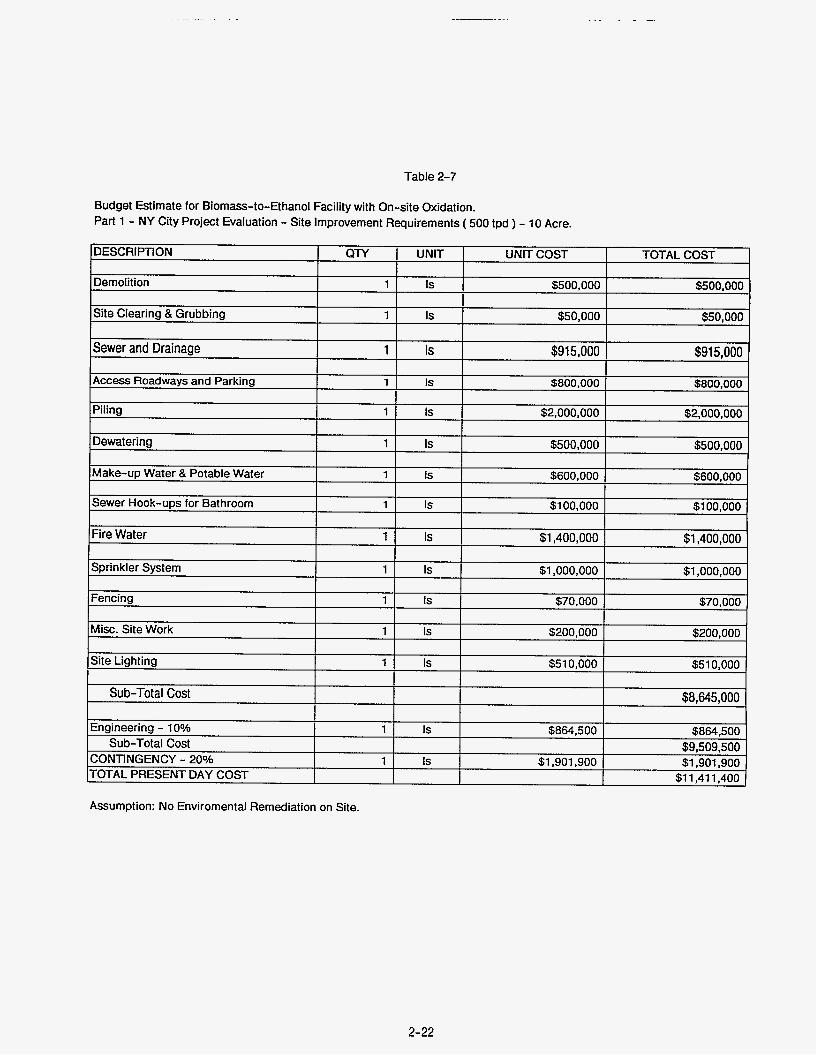
Table 2-7
Budget Estimate for Biomass-to-Ethanol Facility with On-site Oxidation. Part 1 - NY City Project Evaluation - Site Improvement Requirements ( 500 tpd ) - 10 Acre.
Assumption: No Enviromental Remediation on Site.
2-22
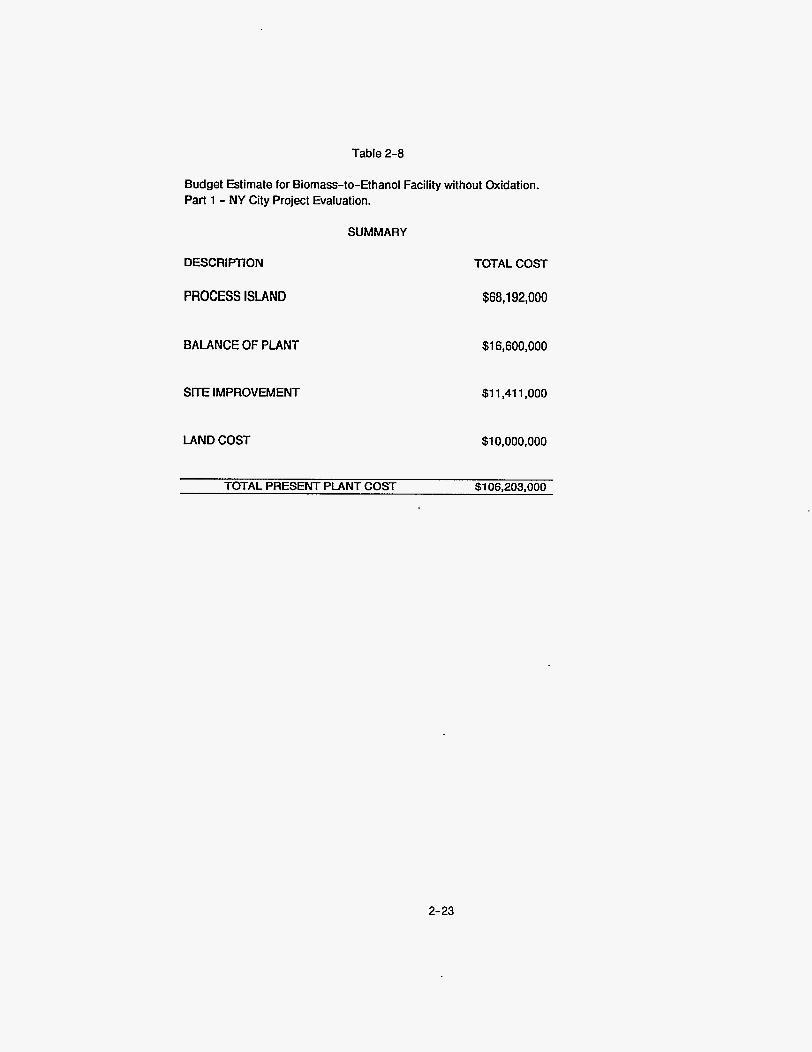
Table 2-8
Budget Estimate for Biomass-to-Ethanol Facility without Oxidation. Part 1 - NY City Project Evaluation.
SUMMARY
DESCRIFTION
PROCESS ISLAND
BALANCE OF PLANT
SITE IMPROVEMENT
LAND COST
TOTAL COST
$68,192,000
$1 6,600.000
$1 1,411,000
$1 0,000,000
$1 06,203,000 TOTAL PRESENT PLANT COST
2-23
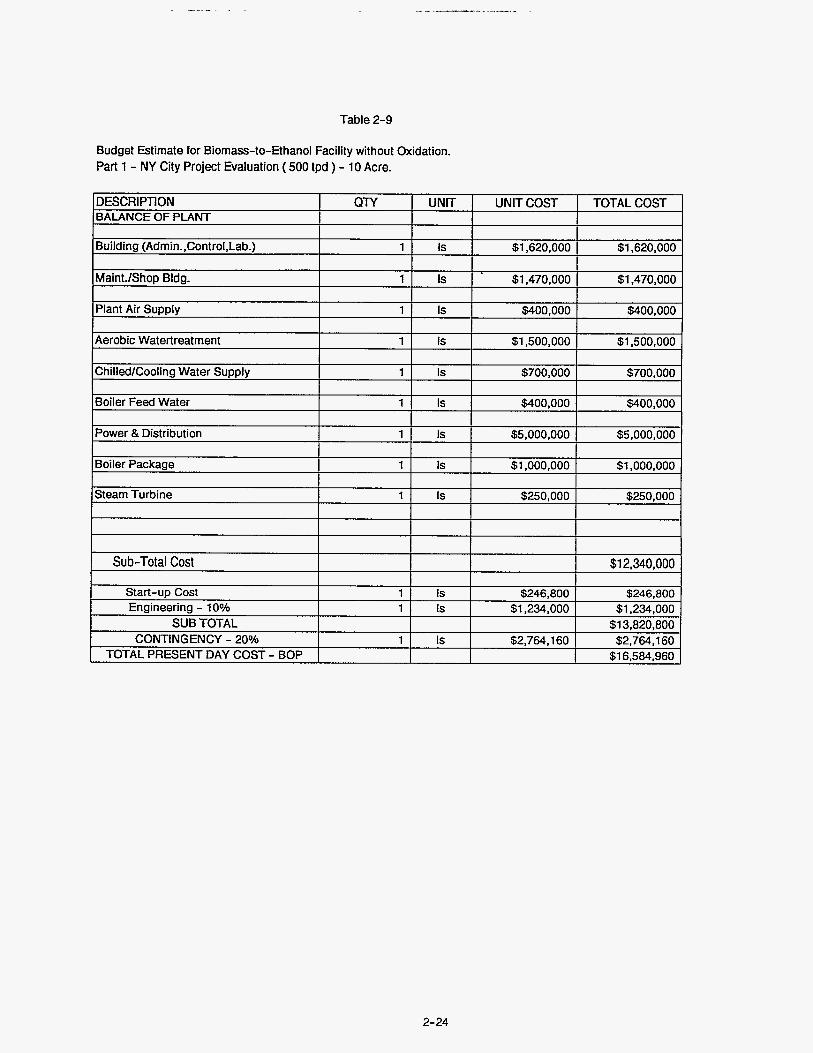
Table 2-9
DESCRIPTION BALANCE OF PLANT
Budget Estimate for Biomass-to-Ethanol Facility without Oxidation. Part 1 - NY City Project Evaluation (500 tpd ) - 10 Acre.
QTY UNIT UNITCOST 1 TOTAL COST
1 Start-up Cost Engineering - 10% 1
SUB TOTAL
TOTAL PRESENT DAY COST - BOP CONTINGENCY - 20% 1
Is $246,800 $246,800 Is $1,234,000 $1,234,000
$1 3,820,800 Is $2,764,160 $2,764,160
$1 6,584,960
2-24
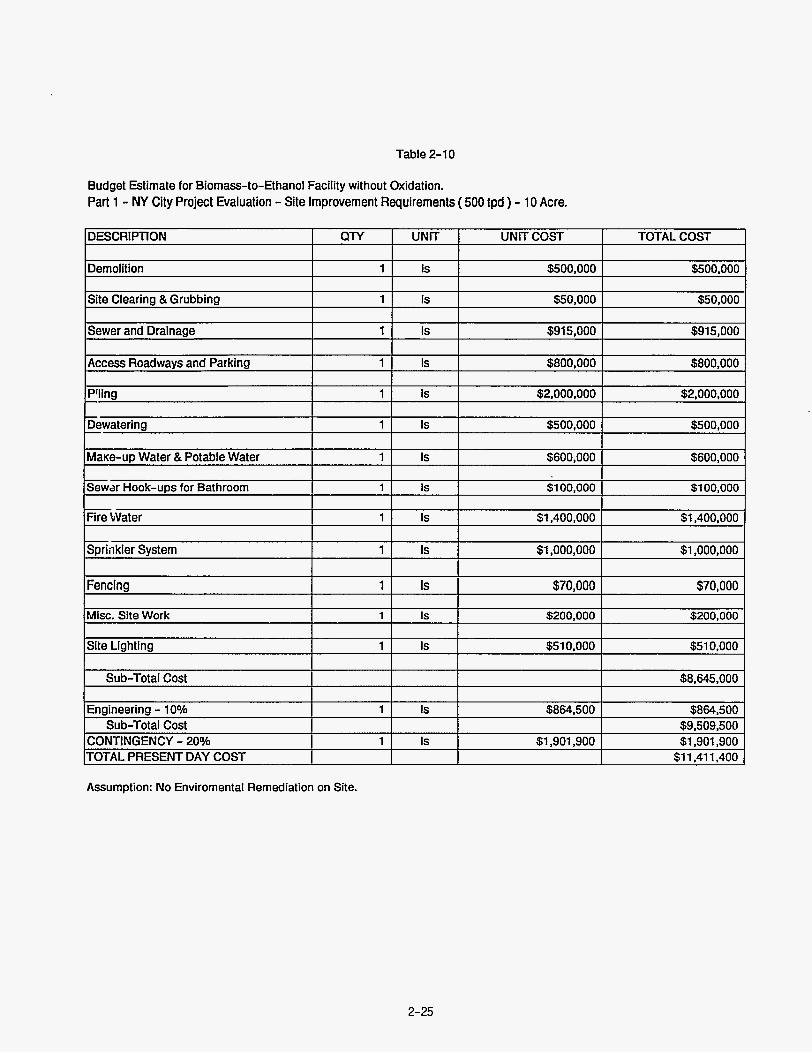
Table 2-10
DESCRIPTION
Budget Estimate for Biomass-to-Ethanol Facility without Oxidation. Part 1 - NY City Project Evaluation - Site Improvement Requirements (500 tpd ) - 10 Acre.
QTY I UNIT I UNIT COST TOTAL COST
Demolition 1 1 Is I $500.000 I $500,000 I I
Sewer and Drainage 1 Is $915.000 $915,000
1 1 Is I $1,400.000 I $1.400.000
Access Roadways and Parking
Piling
Dewatering
1 Is $800,000 $800,000
1 Is $2,000.000 $2,000.000
1 Is $500,000 $500,000
MaKe-up Water & Potable Water
Sewzr Hook-uDs for Bathroom
1 Is $600,000 $600,000
1 Is $1 00.000 $1 00.000
Sprinkler System 1 Is $1,000,000 $1,000,000
Fencing
Assumption: No Enviromental Remediation on Site.
1 Is $70,000 $70,000
2-25
Misc. Site Work 1 ) Is $200.000 I $200,000
Site Liahtina 1 1 Is $510.000 I $51 0.000
Sub-Total Cost $8.645.000
Engineering - 10% Sub-Total Cost
CONTINGENCY - 20% TOTAL PRESENT DAY COST
1 Is $864,500 $864,500 $9,509,500
$1 1.41 1,400 1 Is $1,901,900 $1,901,900
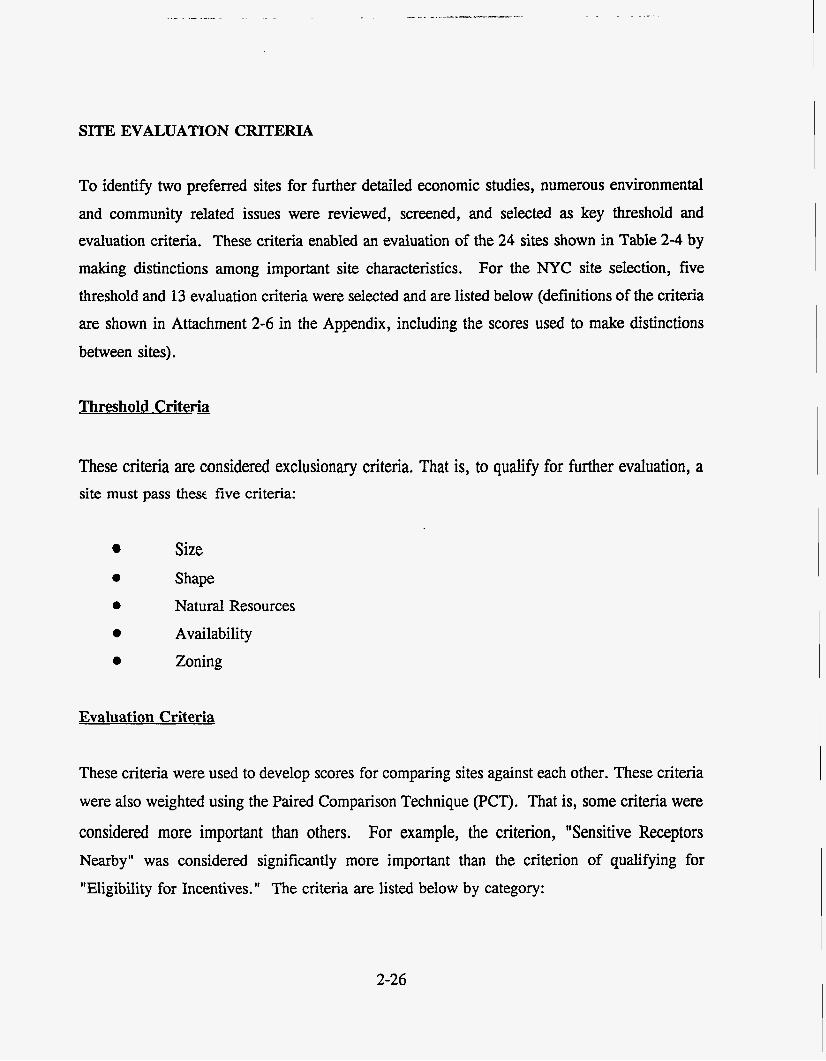
SITE EVALUATION CIUTERIA
To identify two preferred sites for further detailed economic studies, numerous environmental and community related issues were reviewed, screened, and selected as key threshold and evaluation criteria. These criteria enabled an evaluation of the 24 sites shown in Table 2-4 by making distinctions among important site characteristics. For the NYC site selection, five threshold and 13 evaluation criteria were selected and are listed below (definitions of the criteria are shown in Attachment 2-6 in the Appendix, including the scores used to make distinctions between sites).
Threshold Criterii
These criteria are considered exclusionary criteria. That is, to qualify for further evaluation, a site must pass these five criteria:
Size Shape Natural Resources Availability Zoning
Evaluation Criteria
These criteria were used to develop scores for comparing sites against each other. These criteria were also weighted using the Paired Comparison Technique (PCT). That is, some criteria were
considered more important than others. For example, the criterion, "Sensitive Receptors Nearby" was considered significantly more important than the criterion of qualifying for "Eligibility for Incentives." The criteria are listed below by category:
2-26
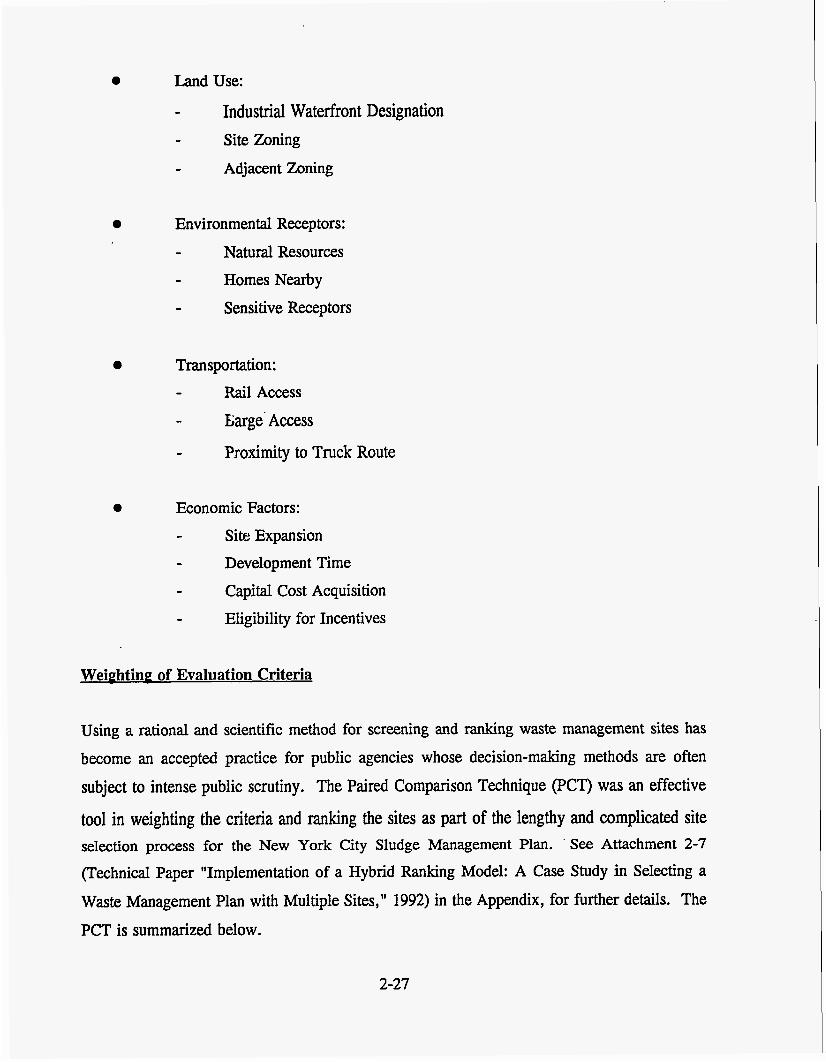
0 Land Use: - Industrial Waterfront Designation
Site Zoning Adjacent Zoning
0 Environmental Receptors: - Natural Resources - Homes Nearby - Sensitive Receptors
0 Transportation: - Rail Access - Sage Access - Proximity to Truck Route
0 Economic Factors: - Site Expansion - Development Time - Capital Cost Acquisition - Eligibility for Incentives
WeiphtinP of Evaluation Criteria
Using a rational and scientific method for screening and ranking waste management sites has become an accepted practice for public agencies whose decision-making methods are often
subject to intense public scrutiny. The Paired Comparison Technique (PCT) was an effective
tool in weighting the criteria and ranking the sites as part of the lengthy and complicated site selection process for the New York City Sludge Management Plan. ' S e e Attachment 2-7
(Technical Paper "Implementation of a Hybrid Ranking Model: A Case Study in Selecting a
Waste Management Plan with Multiple Sites," 1992) in the Appendix, for further details. The PCT is summarized below.
2-27
The PCT was developed by Dean and Nishry in the mid-1960s as a model for prioritizing engineering projects from a range of alternatives. Subsequently, the approach has been used in environmental studies and is particularly useful for site selection. The PCT (or some version of it) has also been used by the US Army Corps of Engineers and the US Department of Interior in evaluating alternatives for solid waste systems, proposed highway alternatives, and water resource assessment and planning.
The PCT breaks down the decision-making process so that decisions or preferences are assigned
to a number of selected criteria affecting an alternative. Once alternatives are established, a list of important decision-making criteria must be defined and relative weights of importance assigned to them. The PCT becomes useful in that only two criteria are compared against each other at any one time, and a simple positive response, negative response, or equal-in-importance response is assigned. The term "forced decision analysis" has been coined to describe this procedure because a decision-maker is literally forced to make a decision between two
alternatives. PCT enables decision mak-xs to select and prioritize key siting criteria, and then, once the field is narrowed, strategically choose between a number of eligible sites in a rational and defensible way.
Stone & Webster personnel have used the PCT to weight siting criteria for several projects. Guidelines for performing the PCT are shown in Attachment 2-8 in the Appendix. Each
participant scores the evaluation criteria and a consensus is developed. The final result is shown in Appendix Attachment 2-9 and summarized. below:
2-28
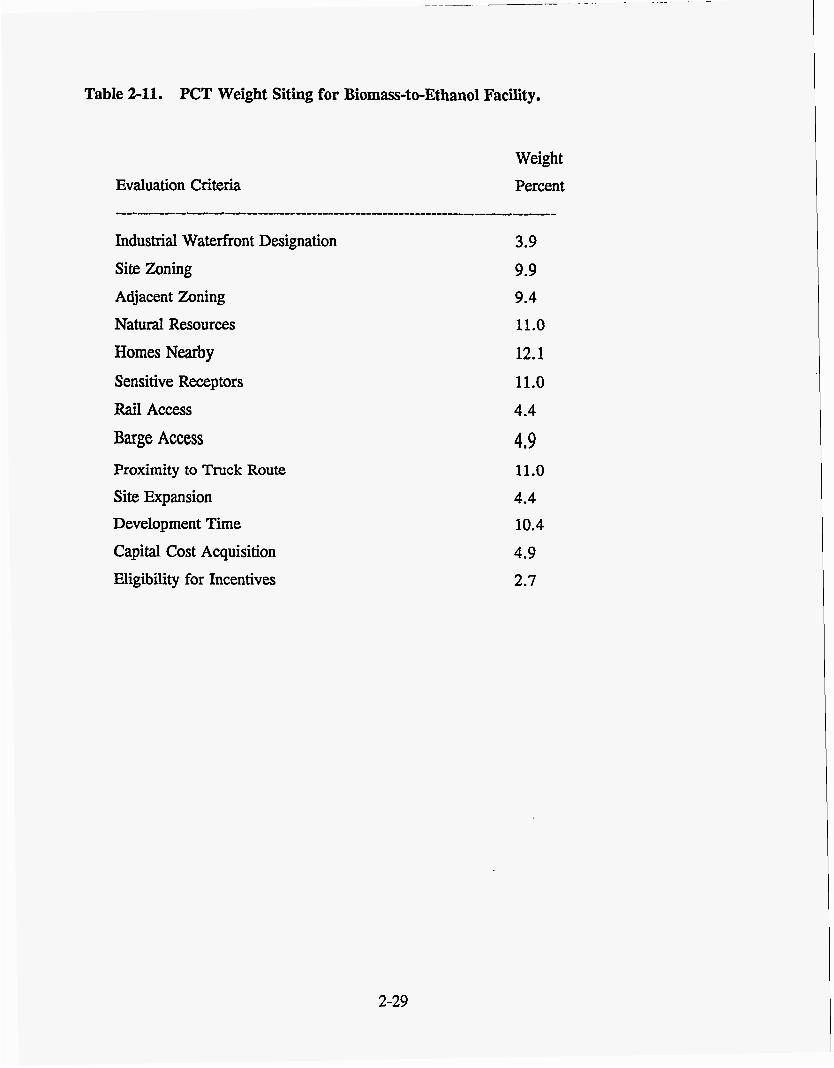
Table 2-11. PCT Weight Siting for Biomass-to-Ethanol Facility.
Evaluation Criteria Weight Percent
.................................................................... Industrial Waterfront Designation 3.9 Site Zoning 9.9 Adjacent Zoning 9.4 Natural Resources 11.0
Homes Nearby 12.1 Sensitive Receptors 11.0 Rail Access 4.4
Barge Access 4.9 Proximity to Truck Route 11.0 Site Expansion 4.4
Capital Cost Acquisition 4.9 Development Time 10.4
Eligibility for Incentives 2.7
2-29
SITE RANKING AND FINAL SELECTION
A data base was prepared for the 24 sites listed in Table 2-4. The raw data are shown in Table 2-12 for the evaluation criteria associated with each site. Because the criterion Development Time is composed of six criteria, the raw data are shown separately for this criterion in Table 2-13 along with the scores for each site. All of the scores for ranking the remaining sites are shown in Table 2-14. Again, the PCT was used to compare the scores of each site for each
criterion. The PCT process is automatically driven after the scores are established for each site
and the results are normalized on a percentile basis with a perfect site scoring 100 percent. The ranking results are shown in Table 2-15.
Of the top five ranked sites, Arthur Kill and Proctor & Gamble sites on Staten Island, and the Maspeth site in the Queens are privately owned parcels. This high ranking occurred even though the criterion, capital cost of land acquisition, is scored lower for privately owned sites than publicly owned sites. Other more heavily weighted criteria offset this disadvantage. For example, the Arthur Kill and Proctor & Gamble sites had perfect scores for the criteria, site
zoning (9.89% wt), adjacent zoning (9.34% wt), residential density (12.09% wt), and sensitive receptors nearby (10.99% wt). These four criteria out of the total of 13 criteria accounted for 42.31 percent of the score.
It is recommended that privately owned sites be pursued initially because of the reduced
permitting time over a publicly owned parcel, which can only be acquired after lengthy Uniform Land Use Regulatory Procedures (ULURP) are completed by NYC. Also, because wood chips were burned in the previous Proctor & Gamble facility and can be used in the Amoco process, this location is particularly desirable. In regard to the Arthur Kill site, Con Ed currently operates a 700-MW power plant adjacent to the site. Thus, like the P&G site, the land use has been known as heavy industrial. Also, Con Edison has offered this site as one of several potential paper recycling sites to be identified in the forthcoming NYC Depatment of Sanitation proposal. For these reasons, both of these sites are recommended. The Proctor & Gamble site is shown in Figure 2-6 and a site description fact sheet is in Table 2-16. The Arthur Kill site
location map is shown in Figure 2-7 and the site description fact sheet is in Table 2-17.
2-30
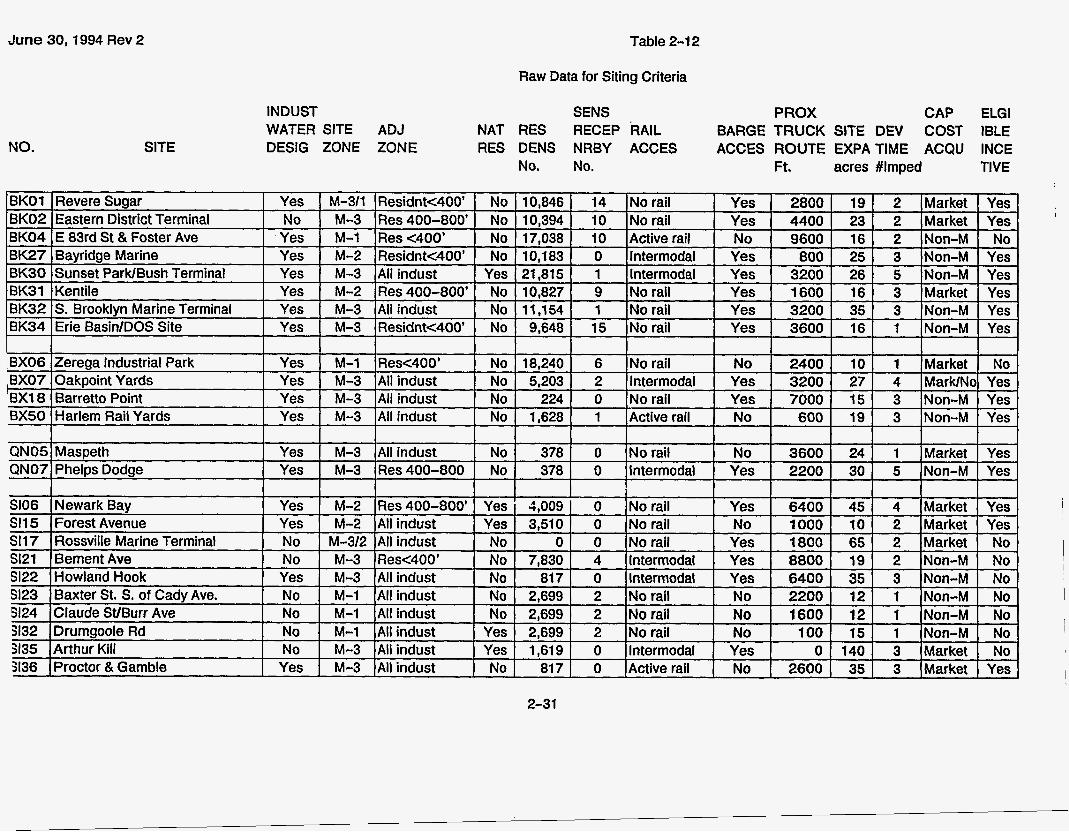
June 30,1994 Rev 2 Table 2-1 2
Raw Data for Siting Criteria
INDUST WATER SITE ADJ DESIG ZONE ZONE
PROX CAP ELGl BARGE TRUCK SITE DEV COST IBLE ACCES ROUTE EXPATIME ACQU INCE
Ft. acres #Irnped TIVE
SENS NAT RES RECEP RAIL RES DENS NRBY ACCES
No. No. NO. SITE
1 14 No rail I Yes I 2800 I 19 I 2 I Market I Yes 10 No rail I Yes I 4400 1 23 I 2 I Warket 1 Y& 10 Active rail I :;s 1 ~ 9:; 1 1 ~ i 1
Intermodal lnterrnodal Yes 3200 No rail Yes 1600 No rail Yes 3200 35 3
0 1 9 1 15 No rail I Yes I -3600 t 16 1 1 I
I I I I I I I I I 1 I I I
~~
BX06 Zerega Industrial Park Yes M-1 Resc400' No 18,240 6 No rail No 2400 10 1 Market No BX07 Oakpoint Yards Yes M-3 Allindust No 5,203 2 Intermodal Yes 3200 27 4 MarWNo Yes EX1 8 Barretto Point Yes M-3 All indust No 224 0 No rail Yes 7000 15 3 Non-M Yes BX50 Harlem Rail Yards Yes M-3 All indust No 1.628 1 Active rail No 600 19 3 Non-M Yes
QN05 Maspeth Yes M-3 All indust No 378 0 Norail No 3600 24 1 Market Yes QN07 Phelps Dodge Yes M-3 Res400-800 No 378 0 lnterrnodal Yes 2200 30 5 Non-M Yes
SI06 Newark Bay Yes M-2 Res400-800' Yes 4,009 0 Norail Yes 6400 45 4 Market Yes '
SI1 5 Forest Avenue Yes M-2 All indust Yes 3,510 0 No rail No 1000 10 2 Market Yes SI1 7 Rossville Marine Terminal No M-3/2 All indust No 0 0 No rail Yes 1800 65 2 Market No SI21 Bement Ave No M-3 ResC400' No 7,830 4 lnterrnodal Yes 8800 19 2 Non-M No 5122 Howland Hook Yes M-3 All indust No 817 0 Intermodal Yes 6400 35 3 Non-M No 5123 Baxter St. S. of Cady Ave. No M-1 All indust No 2,699 2 No rail No 2200 12 1 Non-M No 5124 Claude St/Burr Ave No M-1 All indust No 2,699 2 No rail No 1600 12 1 Non-M No 3132 Drumgoole Rd No M-1 All indust Yes 2,699 2 No rail No 100 15 1 Non-M No 3135 Arthur Kill No M-3 All indust Yes 1,619 0 lnterrnodal Yes 0 140 3 Market No SI36 Proctor & Gamble Yes M-3 All indust No 817 0 Active rail No 2600 35 3 Market Yes
2-31

June 30,1994 Rev 2 Table 2-1 3
Raw Data for Development Time Criteria.
NO.
BX07
BX50
SITE Occupant Dredging Extensive Fed Land Extensive Multi-story Relocation Permits Approvals Acquisition Cleanup Demolition Total Score
2-32
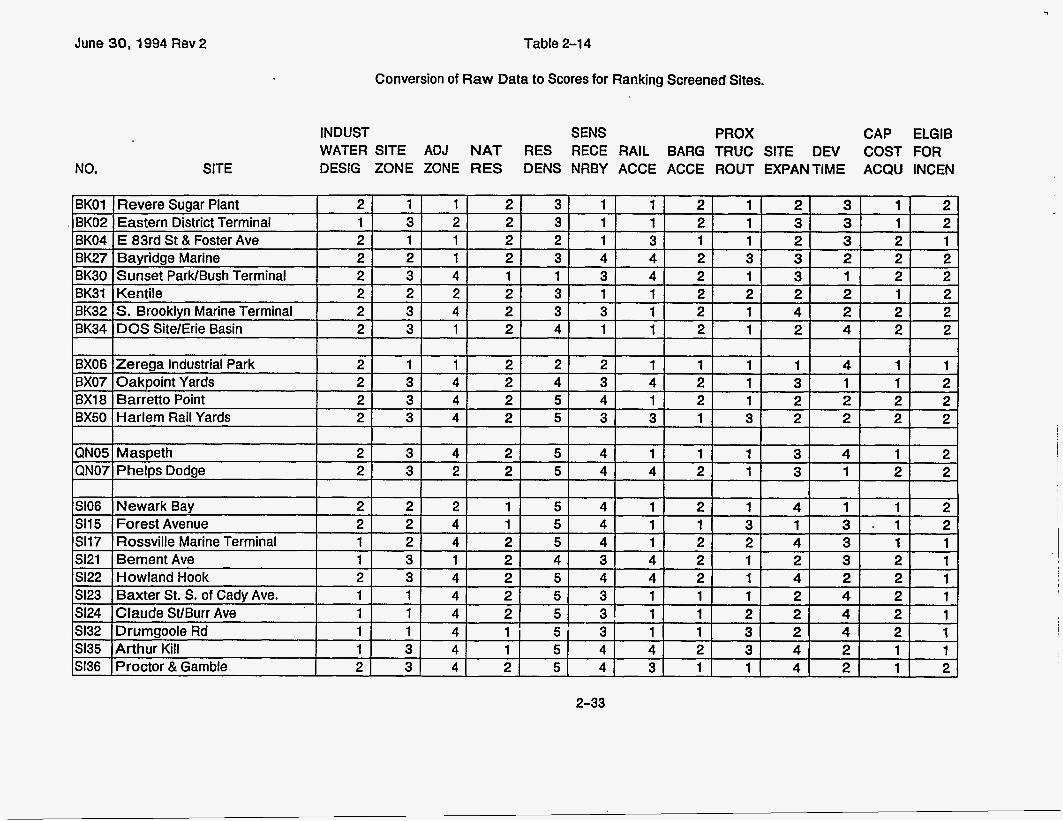
June 30,1994 Rev 2 Table 2-1 4
Conversion of Raw Data to Scores for Ranking Screened Sites.
INDUST SENS PROX CAP ELGIB WATER SITE ADJ NAT RES RECE RAIL BARG TRUC SITE DEV COST FOR
NO. SITE DESIG ZONE ZONE RES DENS NRBY ACCE ACCE ROUT EXPANTIME ACQU INCEN
2-33

:BKaylor 6/30/94 Rev 1
BX50 5135 5122 GIN05 5136 SI1 7 BX18 BK27 SI1 5
Table 2-1 5
Ranking of 24 NYC Sites for Bioconversion Facility.
Harlem Rail Yards 2 3 4 2 5 3 3 1 3 2 2 2 2 80.8 Arthur Kill 1 3 4 1 5 4 4 2 3 4 2 1 1 79.4 Howland Hook 2 3 4 2 5 4 4 2 1 4 2 2 1 79.1 Maspeth 2 3 4 2 5 4 1 1 1 3 4 1 2 77.4 Proctor & Gamble 2 3 4 2 5 4 3 2 1 4 2 1 2 76.7 Rossville Marine Termin 1 2 4 2 5 4 1 2 2 4 3 1 1 75.3 Barretto Point 2 3 4 2 5 4 1 2 1 2 2 2 2 74.6 Bayridge Marine 2 2 1 2 3 4 4 2 3 3 2 2 2 73.1 Forest Avenue 2 2 4 1 5 4 1 1 3 1 3 1 2 72.2
WEIGHTED PERCENT PERFECT RAW SCORE
NO. SITE
3.85% 9.89% 9.34% 10.99% 12.09% 10.99% 4.40% 4.95% 10.99% 4.40% 10.44% 4.95% 2 3 4 2 5 4 4 2 3 4 4 2
2.75% 2
100%
PAIRED INDUST SENS PROX CAP ELGIB COMPAR WATER SITE ADJ NAT RES RECEP RAIL BARGE TRUCK SITE DEV COST FOR SCORE DESIGNZONE ZONE RES DENS NRBY ACCES ACCES ROUTE EXPAN TIME ACQ INCEN PRCNT
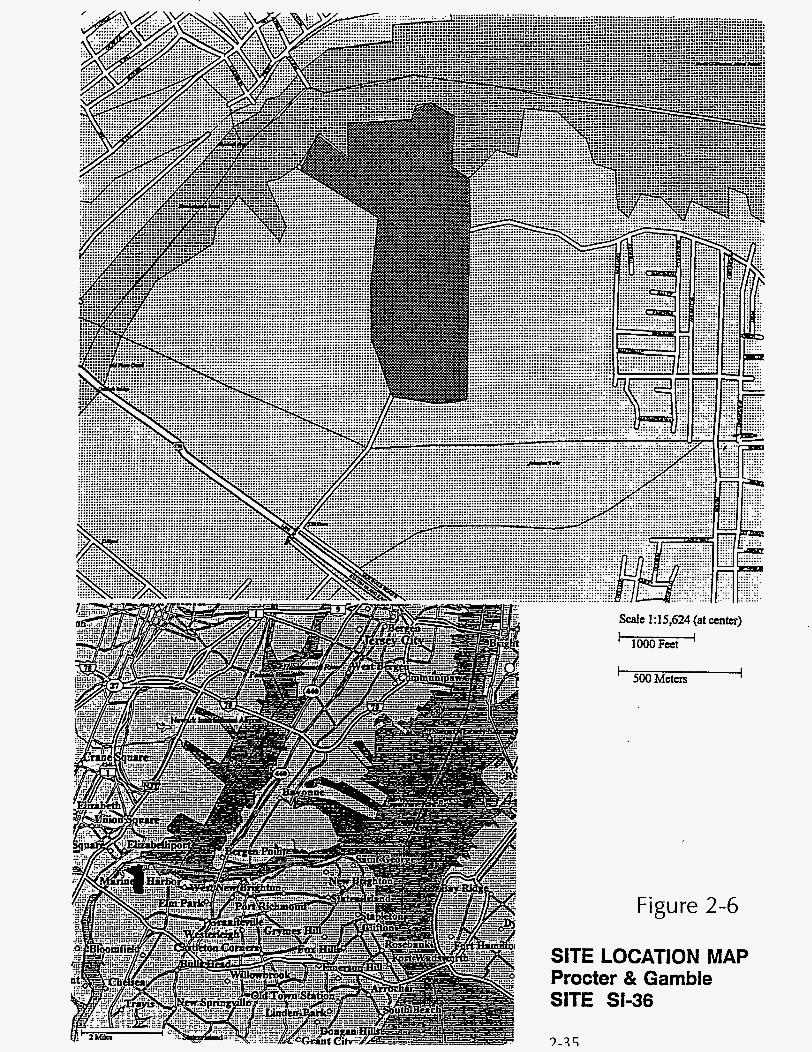
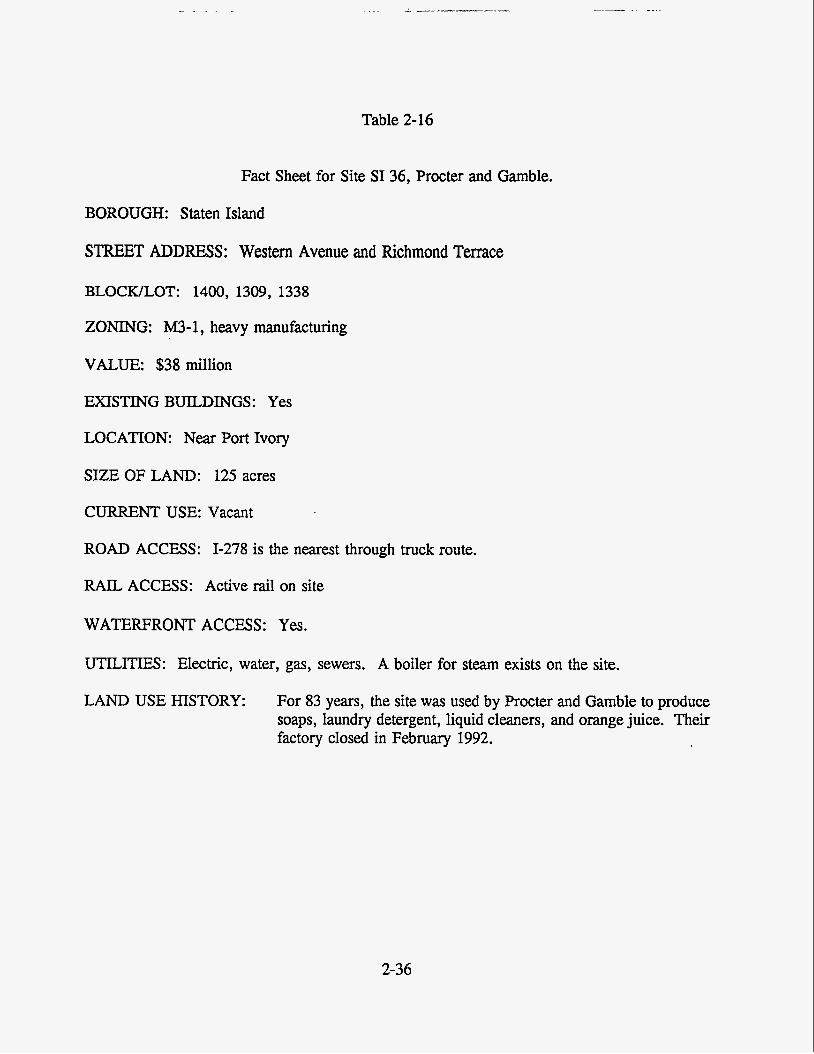
Table 2-16
Fact Sheet for Site SI 36, Procter and Gamble.
BOROUGH: Staten Island
STREET ADDRESS: Western Avenue and Richmond Terrace
BLOCIULOT: 1400, 1309, 1338
ZONING: M3-1, heavy manufacturing
VALUE: $38 million
EXISTING BUILDINGS: Yes
LOCATION: Near Port Ivory
SIZE OF LAND: 125 acres
CURRENT USE: Vacant
ROAD ACCESS: 1-278 is the nearest through truck route.
RAIL ACCESS: Active rail on site
WATERFRONT ACCESS: Yes.
UTILITIES: Electric, water, gas, sewers. A boiler for steam exists on the site.
LAND USE HISTORY: For 83 years, the site was used by Procter and Gamble to produce soaps, laundry detergent, liquid cleaners, and orange juice. Their factory closed in February 1992.
2-36
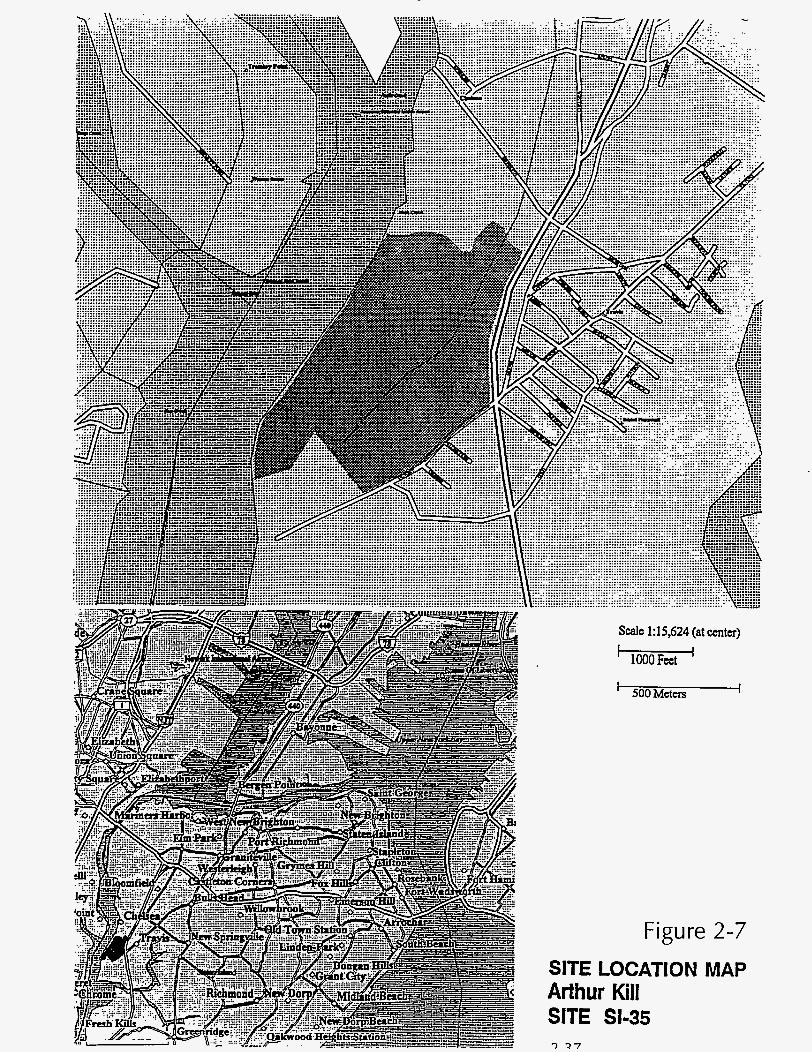
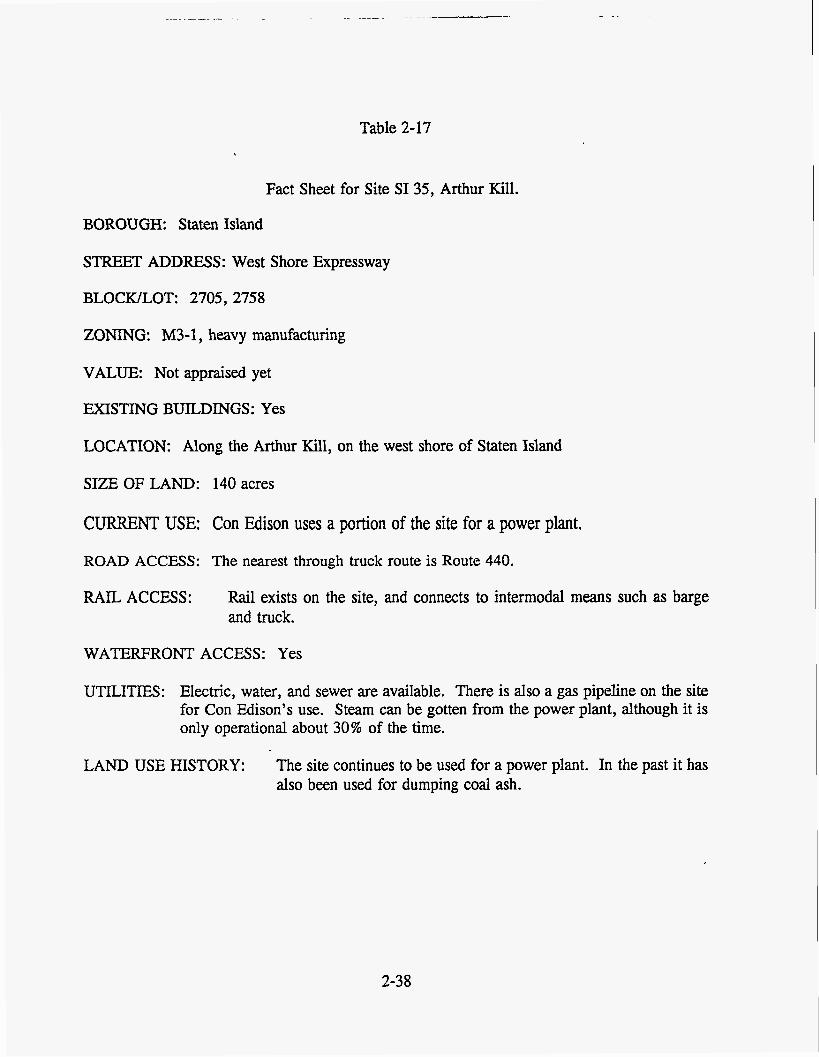
Table 2-17
Fact Sheet for Site SI 35, Arthur Kill.
BOROUGH: Staten Island
STREET ADDRESS: West Shore Expressway
BLOCWLOT: 2705, 2758
ZONING: M3-1, heavy manufacturing
VALUE: Not appraised yet
EXISTING BUILDINGS: Yes
LOCATION: Along the Arthur Kill, on the west shore of Staten Island
SIZE OF LAND: 140 acres
CURRENT USE: Con Edison uses a portion of the site for a power plant.
ROAD ACCESS: The nearest through truck route is Route 440.
RAIL ACCESS: Rail exists on the site, and connects to intermodal means such as barge and truck.
WATERFRONT ACCESS: Yes
UTILITIES: Electric, water, and sewer are available. There is also a gas pipeline on the site for Con Edison’s use. Steam can be gotten from the power plant, although it is only operational about 30% of the time.
LAND USE HISTORY: The site continues to be used for a power plant. In the past it has also been used for dumping coal ash.
2-38
SECTION 3 CAlpITAL AND OPERATING COST ESTIMATES FOR PREFERRED SITES
This section refines the capital costs for a 500-tpd plant constructed at either of two preferred sites, Proctor and Gamble (P&G) and Arthur Kill. It addresses the options of on-site and off-site oxidation of the solids by-product.
The capital costs for the two sites in terms of the process island, balance of plant, site improvements, and land costs are shown in Tables 3-1 through 3-6 for the P&G site and in Tables 3-7 through 3-12 for the Arthur Kill site. Supporting information for these costs is found in the Appendix as Attachments 3-1 through 3-4.
The cost of a complete plant (including solids by-product oxidation) at the P&G site is $134.5 million, whereas the comparable cost at the Arthur Kill site is $128.8 million. Similarly, the cost of a plant without on-site oxidation at the P&G site is $101 million, compared to the cost of the Arthur Kill site of $95.4 million. The principal cost difference between the two sites is
the cost of land. The Arthur Kill site is owned by Con Edison, which intends to cooperate with developing a New York City project and will make the site available for virtually no cost.
Tables 3-13 through 3-16 show more detailed breakdown of capital costs in terms of direct and
indirect costs,
The operating costs for the plants are reflected in Section 4 (financial pro formas).
3-1

I---
Table 3-1
Budget Estimate for Biomass-to-Ethanol Facility With On-site Oxidation. Part 1 - NY City Project Evaluation. Site - Proctor &Gamble
SUMMARY
DESCRIPTION TOTAL COST
PROCESS ISLAND $68,192,000
BALANCE OF PLANT $49,960,900
SITE IMPROVEMENT $1 1,345,400
VI UD COST $5,000.000
- TOTAL PRESENT PLANT COST $134,498,300
3-2
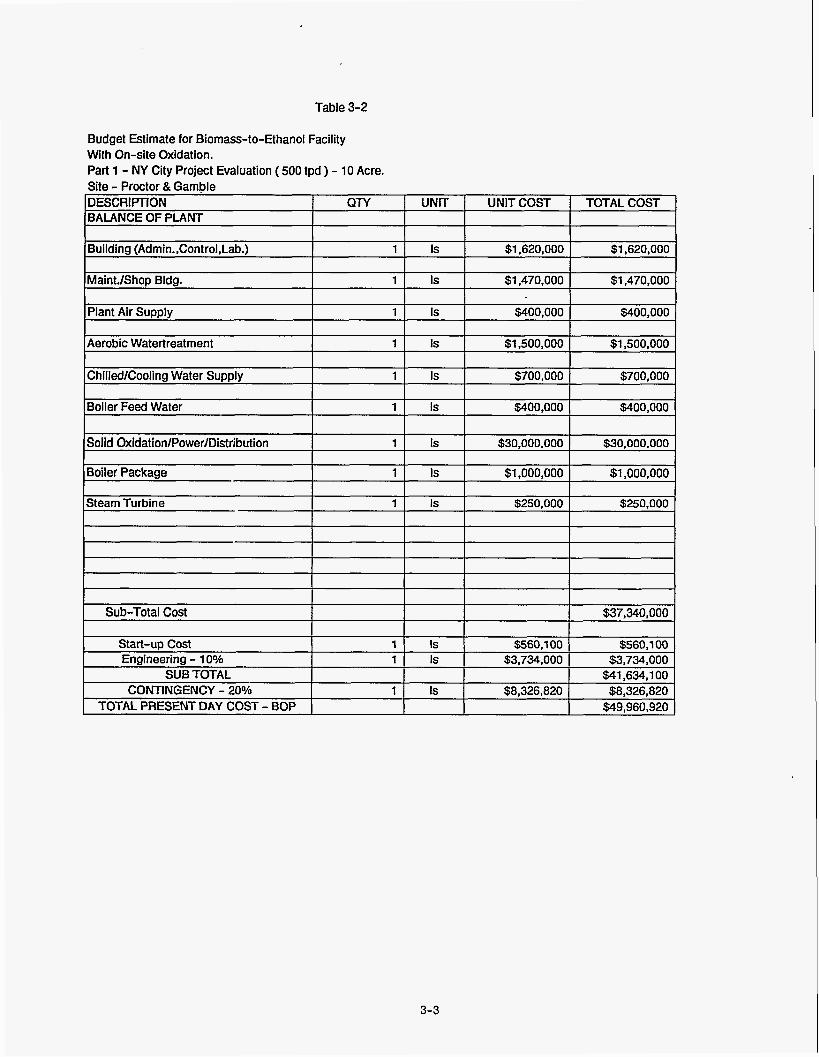
Table 3-2
Boiler Feed Water I 1 Is $400,000 $400,000
Solid Oxidation/Power/Distribution
JBoiler Package I Is I $1,000,000 I $1,000,000 I 1 1 Is $30.000.000 I $30,000,000
Isteam Turbine Is $250,000 I $250.000 I
~~ ~~
Sub-Total Cost
~ ~~
$37,340,000
Start-up Cost Engineering - 10%
SUB TOTAL
TOTAL PRESENT DAY COST - BOP CONTINGENCY - 20%
3-3
1 Is $560.100 $560,100 1 Is $3,734,000 $3,734,000
$41,634,100 1 Is $8,326,820 $8,326,820
$49,960,920
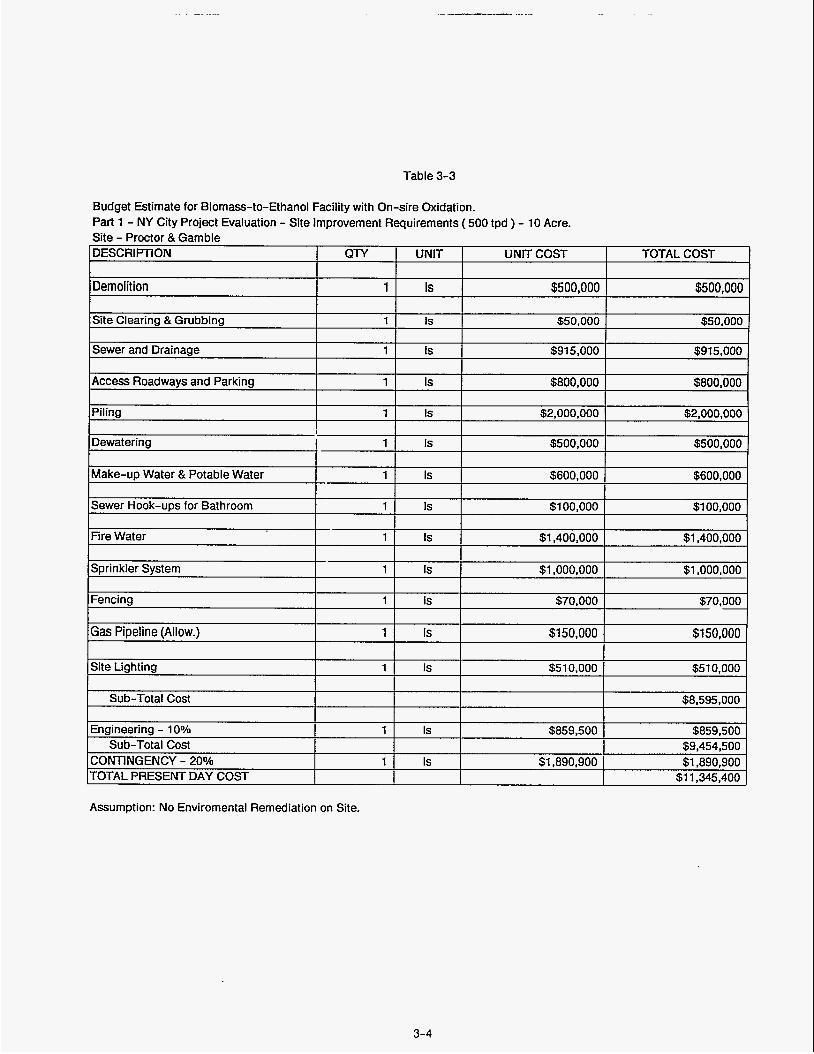
Table 3-3
DESCRlPnON
demolition
QTY UNIT UNIT COST TOTAL COST
1 Is $500,000 $500.000
Site Clearing & Grubbing 1 Is .$50,000 $50.000
, CONTINGENCY - 20% 1 1 Is $1,890,900 I $1,890,900 TOTAL PRESENT DAY COST I I $1 1 ..145.401)
Sewer Hook-ups for Bathroom
Fire Water
Sprinkler System
Assumption: No Enviromental Remediation on Site.
~~~
1 Is $1 00,000 $1 00,000
1 Is $1,400,000 $1,400,000
1 Is $1 .ooo.ooo $1 .ooo.ooo
3-4
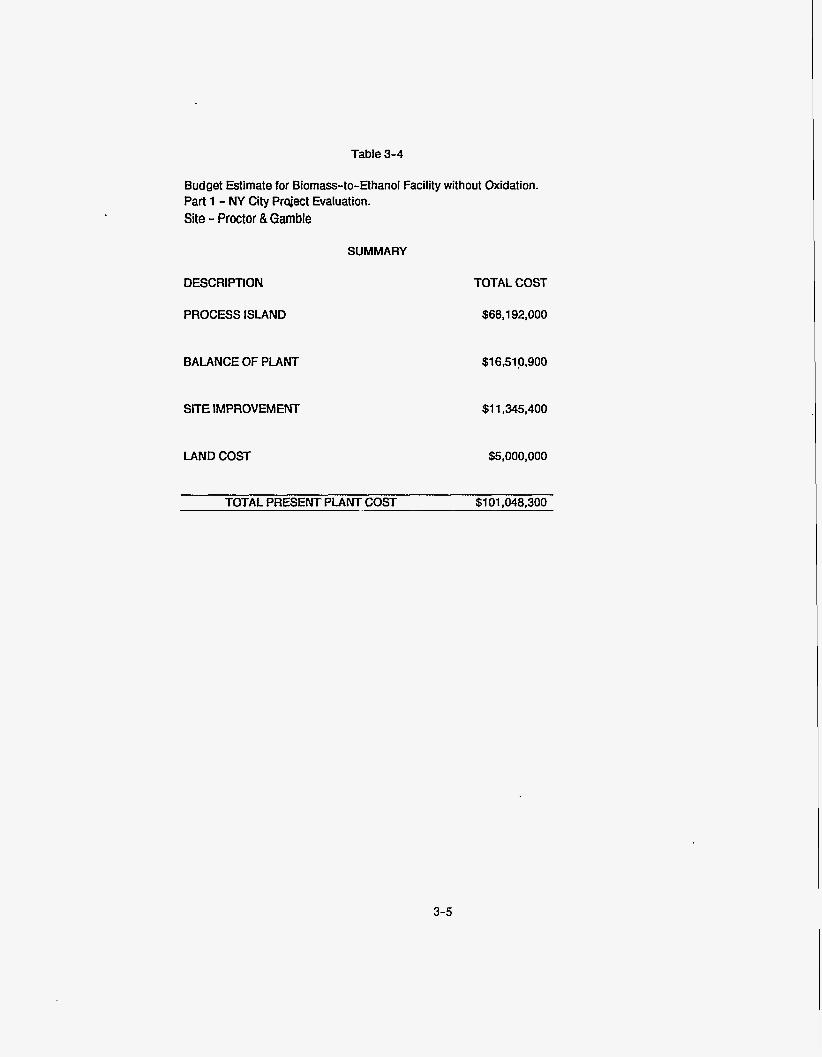
Table 3-4
Budget Estimate for Biomass-to-Ethanol Facility without Oxidation. Part 1 - NY City Prqect Evaluation. Site - Proctor &Gamble
SUMMARY
DESCRIPTION
PROCESS ISLAND
BALANCE OF PLANT
SITE IMPROVEMENT
LAND COST
TOTAL COST
$68,192,000
$1 6.51 0,900
$1 1.345.400
$5,000,000
TOTAL PRESENT PLANT COST $101,048.300
3-5
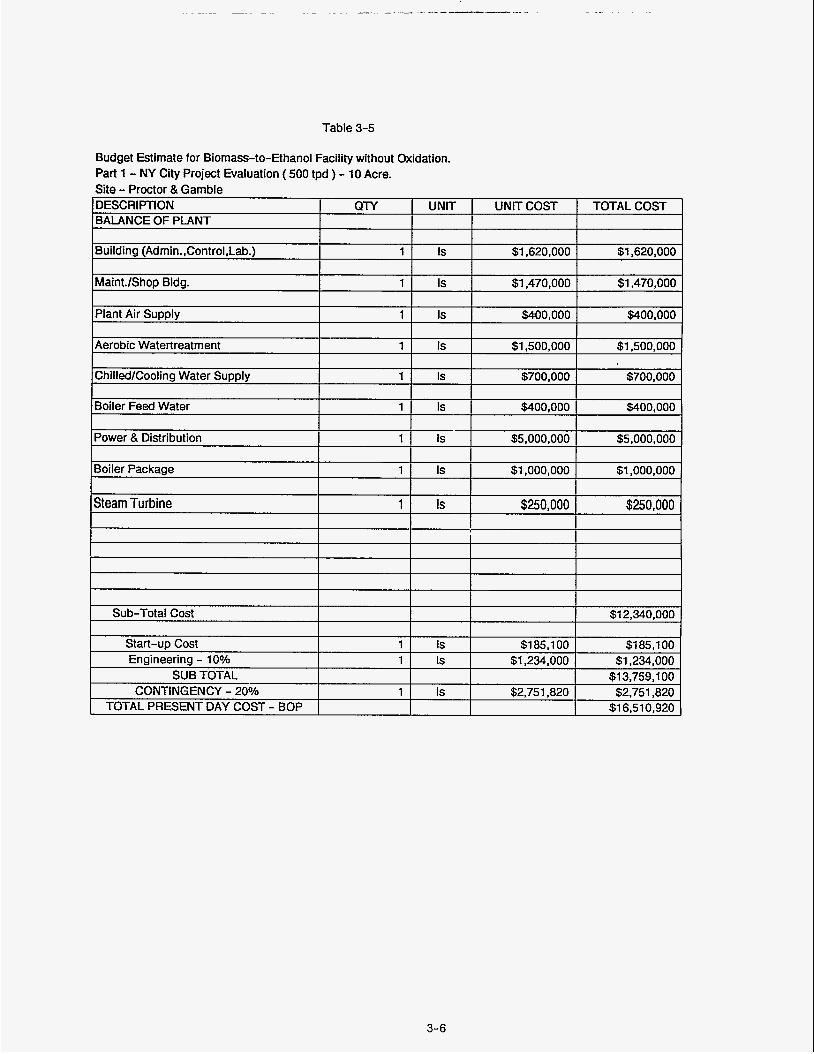
Table 3-5
DESCRIPTION QTY BALANCE OF PLANT
UNIT UNIT COST TOTAL COST
Boiler Package
Steam Turbine
I I I I
Sub-Total Cost I I I $12,340,000
1 Is $1,000,000 $1,000,000
1 Is $250,000 $250,000
Start-up Cost Engineering - 10%
SUB TOTAL
TOTAL PRESENT DAY COST - BOP CONTINGENCY - 20%
3-6
1 Is $1 85,100 $1 85,100
$1 3,759,100 1 Is $2,751,820 $2,751,820
$1 6.51 0.920
1 Is $1,234,000 $1,234,000
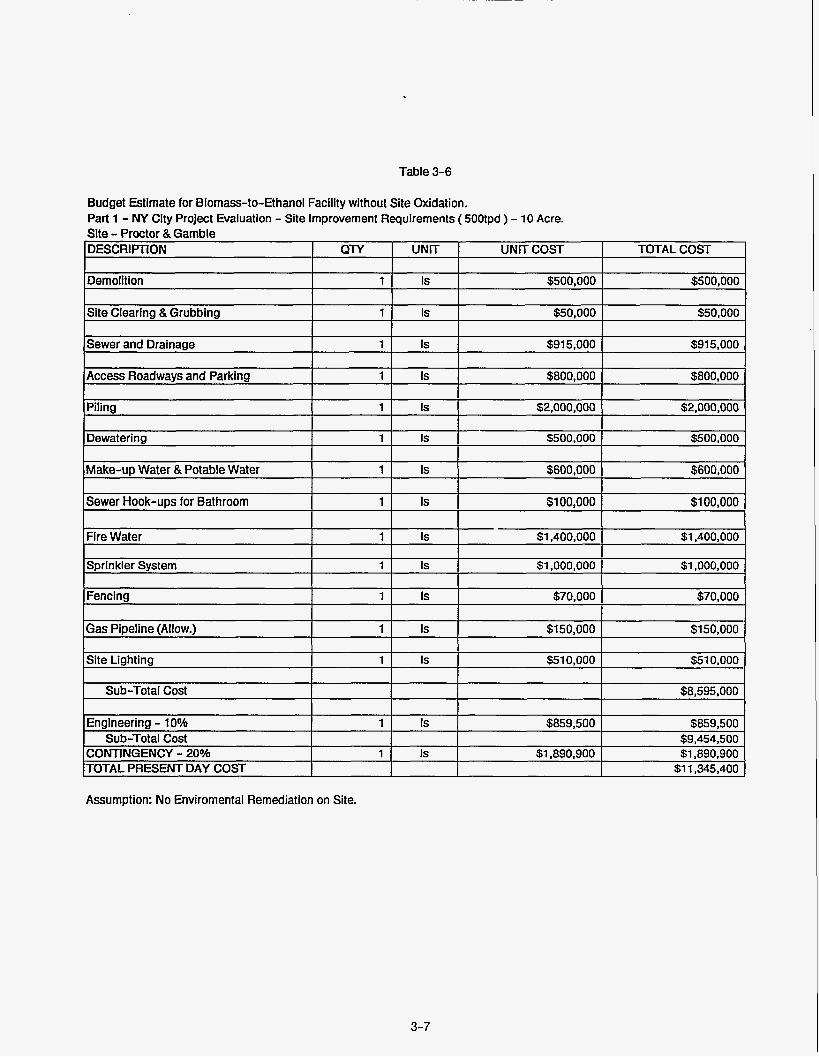
Table 3-6
Budget Estimate for Biomass-to-Ethanol Facility without Site Oxidation. Part 1 - NY City Project Evaluation - Site Improvement Requirements ( 500tpd ) - 10 Acre. Site - Proctor &Gamble
Assumption: No Enviromental Remediation on Site.
3-7
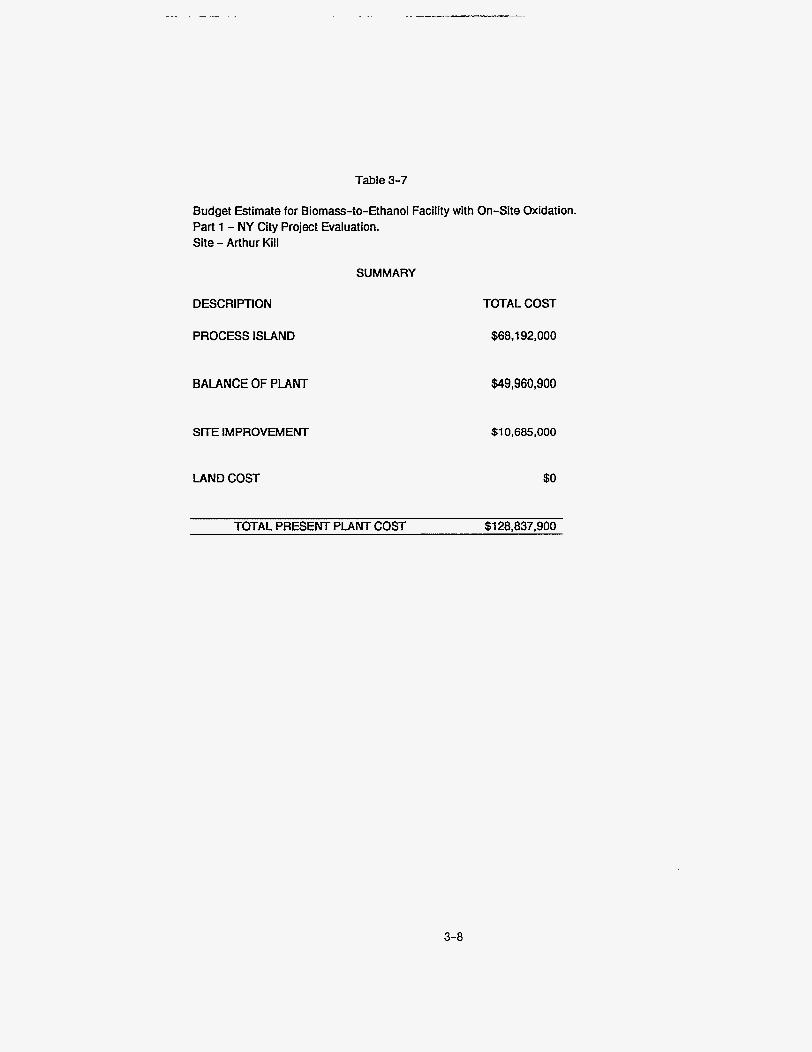
Table 3-7
Budget Estimate for Biomass-to-Ethanol Facility with On-Site Oxidation. Part 1 - NY City Project Evaluation. Site - Arthur Kill
SUMMARY
DESCRIPTION
PROCESS ISLAND
BALANCE OF PLANT
SITE IMPROVEMENT
LAND COST
TOTAL COST
$68,192,000
$49,960,900
$10,685,000
$0
TOTAL PRESENT PLANT COST $1 28.837.900
3-8

Table 3-8
Budget Estimate for Biomass-to-Ethanol Facility with On-Site Oxidation. Part 1 - NY City Project Evaluation ( 500 tpd ) - 10 Acre. Site - Arthur Kill
§400.000
$30,000,000
3-9
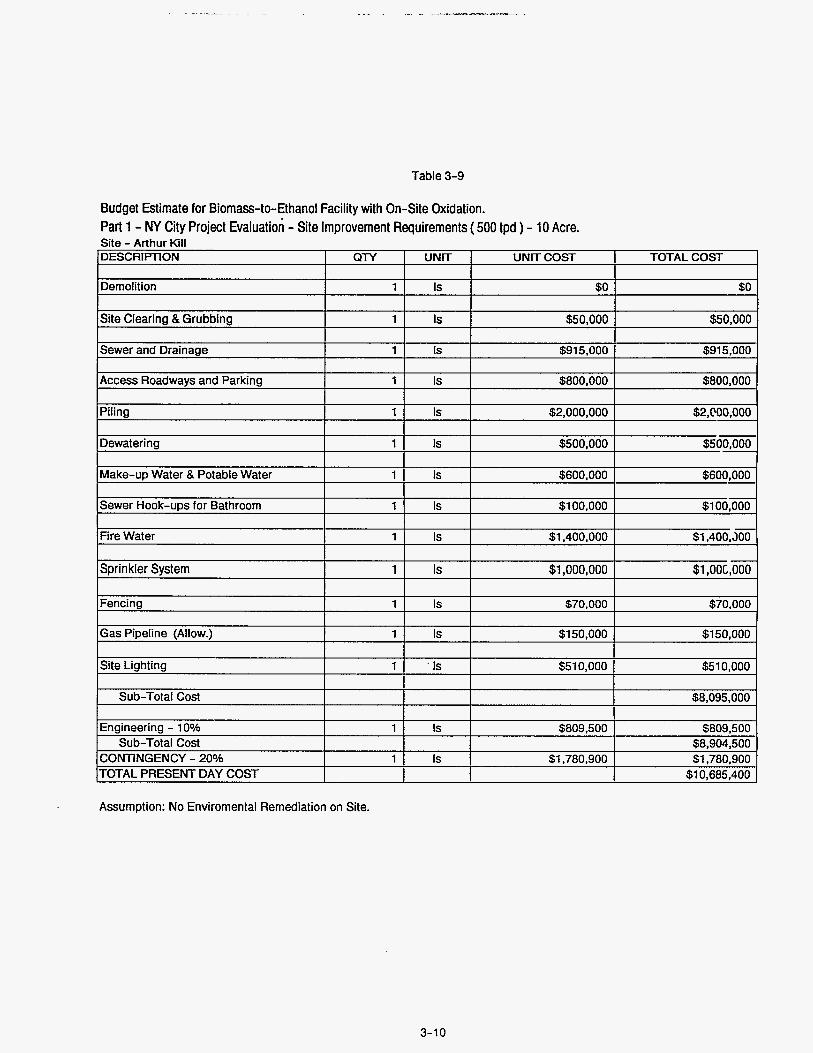
Table 3-9
Budget Estimate for Biomass-to-Ethanol Facility with On-Site Oxidation. Part 1 - NY City Project Evaluation - Site Improvement Requirements (500 tpd ) - 10 Acre. Site - Arthur Kill
Assumption: No Enviromental Remediation on Site.
3-10

Table 3-1 0
Budget Estimate for Biomass-to-Ethanol Facility without Oxidation. Part 1 - NY City Project Evaluation. Site - Arthur Kill
SUMMARY
DESCRIPTION TOTAL COST
PROCESS ISLAND $68,192,000
BALANCE OF PLANT $16,510,000
SITE IMPROVEMENT $1 0,685.000
LAND COST $0
TOTAL PRESENT PLANT COST $95,387.000
3-1 1
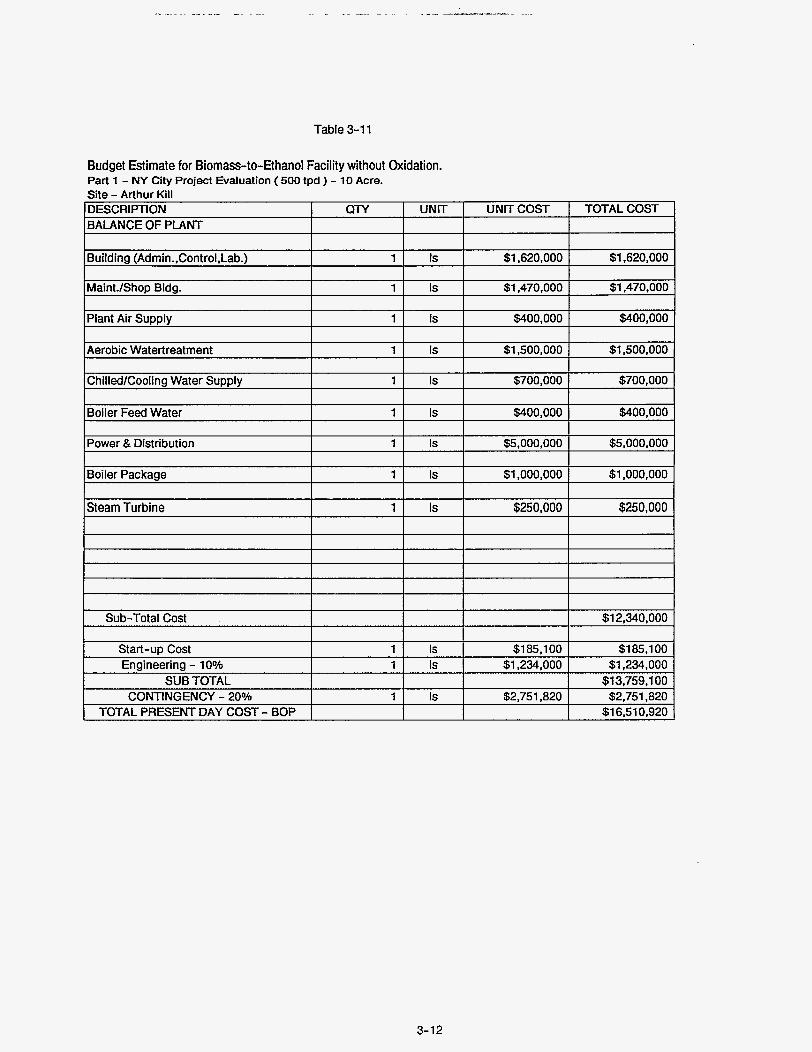
Table 3-1 1
Budget Estimate for Biomass-to-Ethanol Facility without Oxidation. Part 1 - NY City Project Evaluation ( 500 tpd ) - 10 Acre. Site - Arthur Kill
3-12
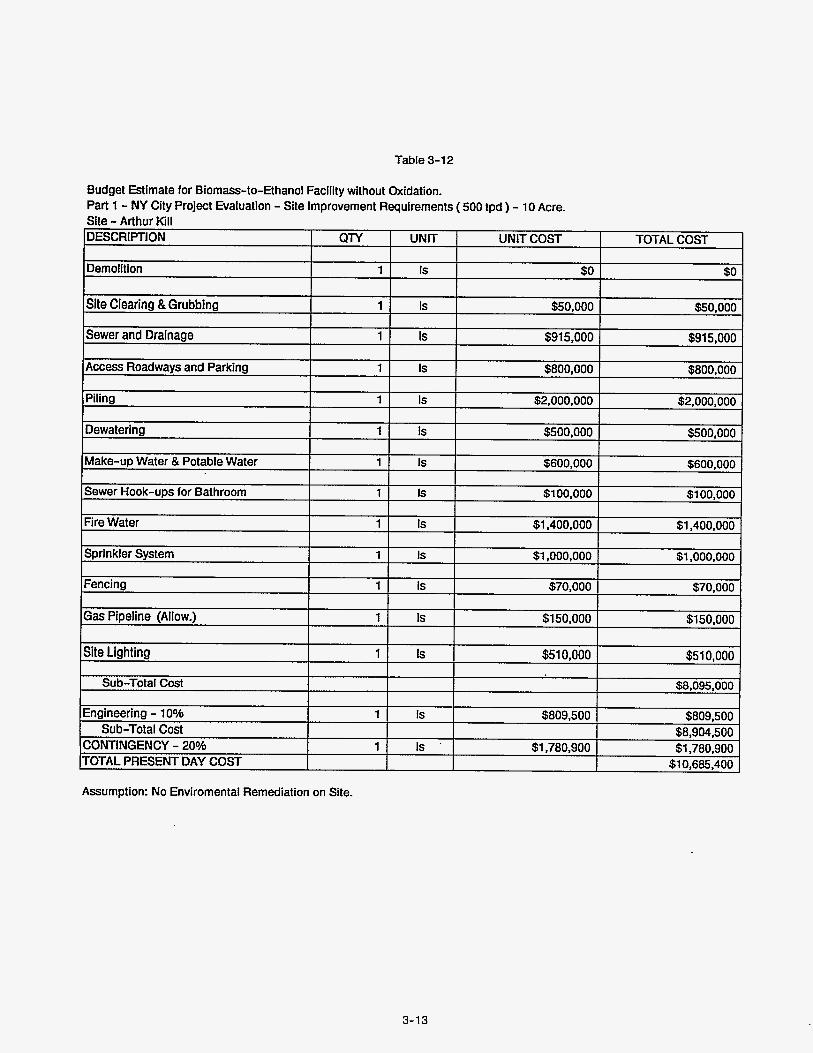
Table 3-12
Budget Estimate for Biomass-to-Ethanol Facility without Oxidation. Part 1 - NY City Project Evaluation - Site Improvement Requirements ( 500 tpd ) - 10 Acre. Site - Arthur Kill
Assumption: No Enviromental Remediation on Site.
3-13
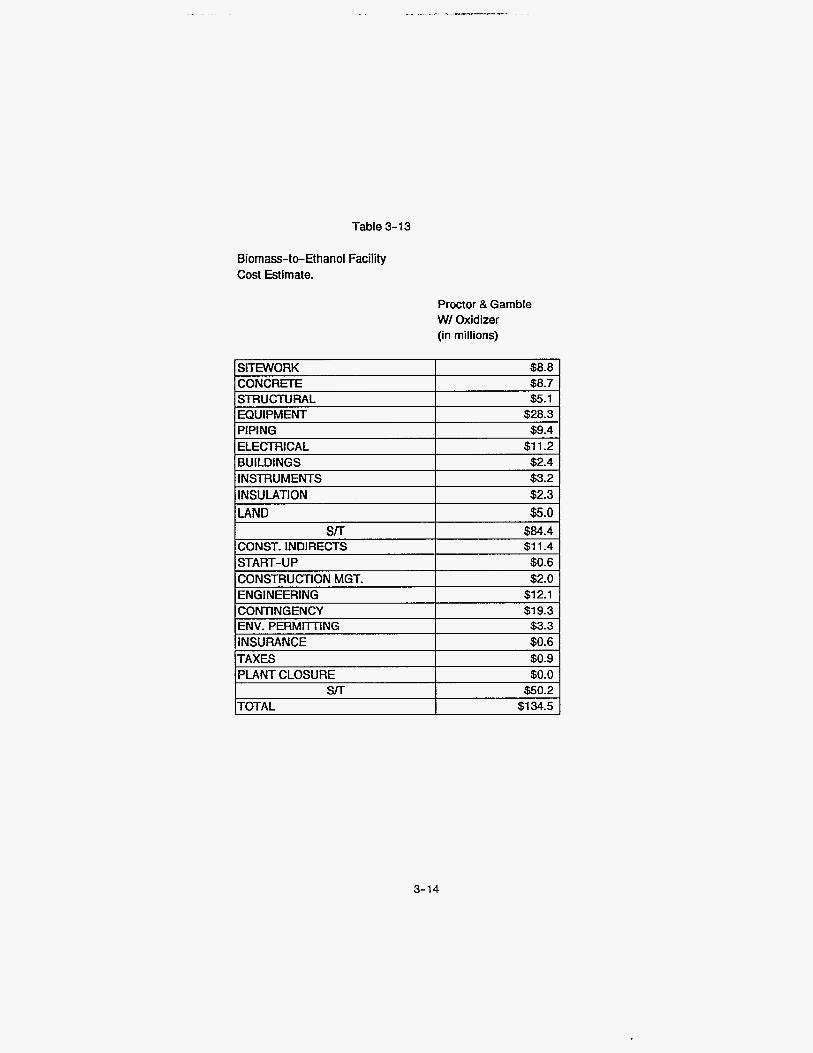
Table 3-13
SITEWORK CONCRETE STRUCTURAL EQUIPMENT PIPING ELECTRICAL BUILDINGS INSTRUMENT'S INSULATION
Biomass-to-Ethanol Facility Cost Estimate.
$8.8 $8.7 $5.1 $28.3 $9.4
$1 1.2 $2.4 $3.2 $2.3
Proctor &Gamble W/ Oxidizer (in millions)
SIT CONST. INDIRECTS START-UP
$84.4 $1 1.4 $0.6
I LAND I $5.0 I
CONSTRUCTION MGT. $2.0 ENGINEERING CONTINGENCY $1 9.3 ENV. PERMIlTlNG INSURANCE TAXES PLANT CLOSURE
a0.2
$12.1
)TOTAL
3-14
$134.5 I
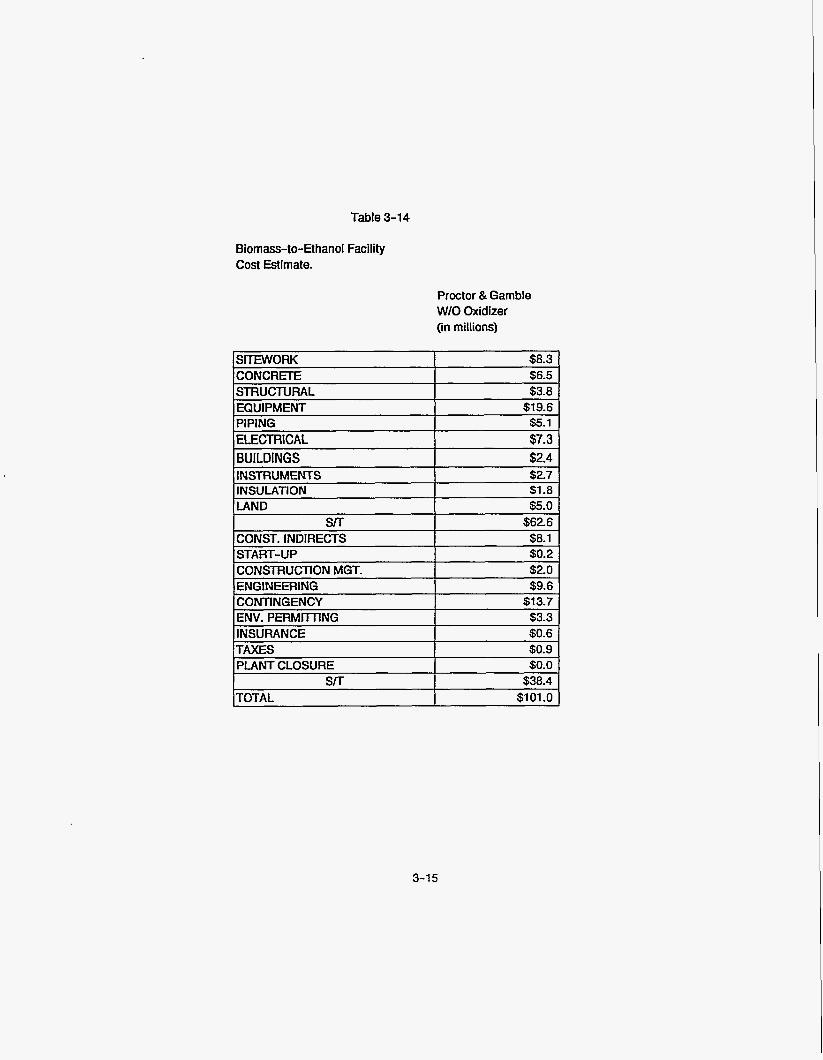
Table 3-14
~~~ ~~
BUILDINGS INSTRUMENTS INSULATION LAND
Biomass-to-Ethanol Facility Cost Estimate.
$2.4 $2.7 $1.8 $5.0
Proctor &Gamble W/O Oxidizer (in millions)
-. -
CONST. INDIRECTS START-UP CONSTRUCTION MGT.
CONCRETE
EQUIPMENT $19.6 PIPING ELECTRICAL
smumtw
-
$8.1 $0.2 $2.0
PLANT CLOSURE
TOTAL S/T
I Sm I $62.6 I
$0.0 $38.4
$1 01 .o
ENGINEERING CONTINGENCY $1 3.7 ENV. PERMIITING INSURANCE $0.6 TAXES $0.9
3-15
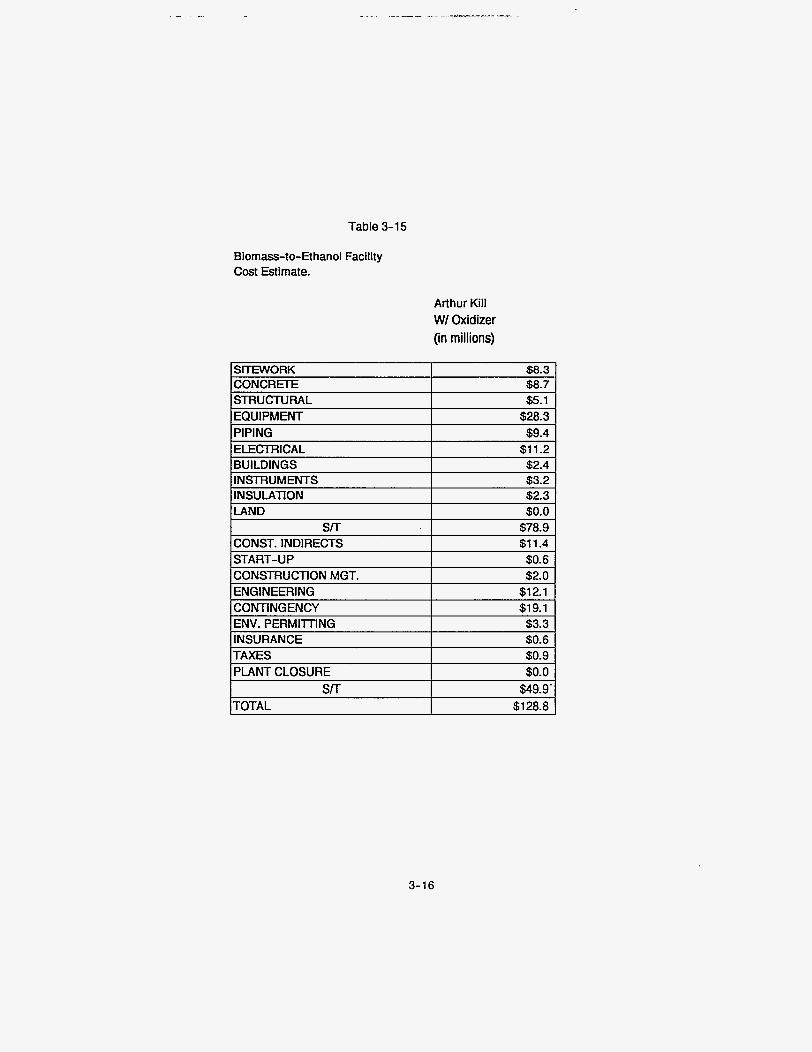
Table 3-15
SITEWORK CONCRETE STRUCTURAL EQUIPMENT
Biomass-to-Ethanol Facility Cost Estimate.
$8.3 $8.7 $5.1 $28.3
Arthur Kill W/ Oxidizer (in millions)
PIPING $9.4 ELECTRICAL $1 1.2 BUILDINGS INSTRUMENTS INSULATION LAND
$2.4 $3.2 $2.3 $0.0
STT CONST. INDIRECTS START-UP CONSTRUCTION MGT.
$78.9 $1 1.4 $0.6 $2.0
ENGINEERING
3-16
$12.1 CONTINGENCY $19.1 ENV. PERMITING $3.3 INSURANCE $0.6
PLANT CLOSURE $0.0 SIT
TOTAL $49.9' $128.8
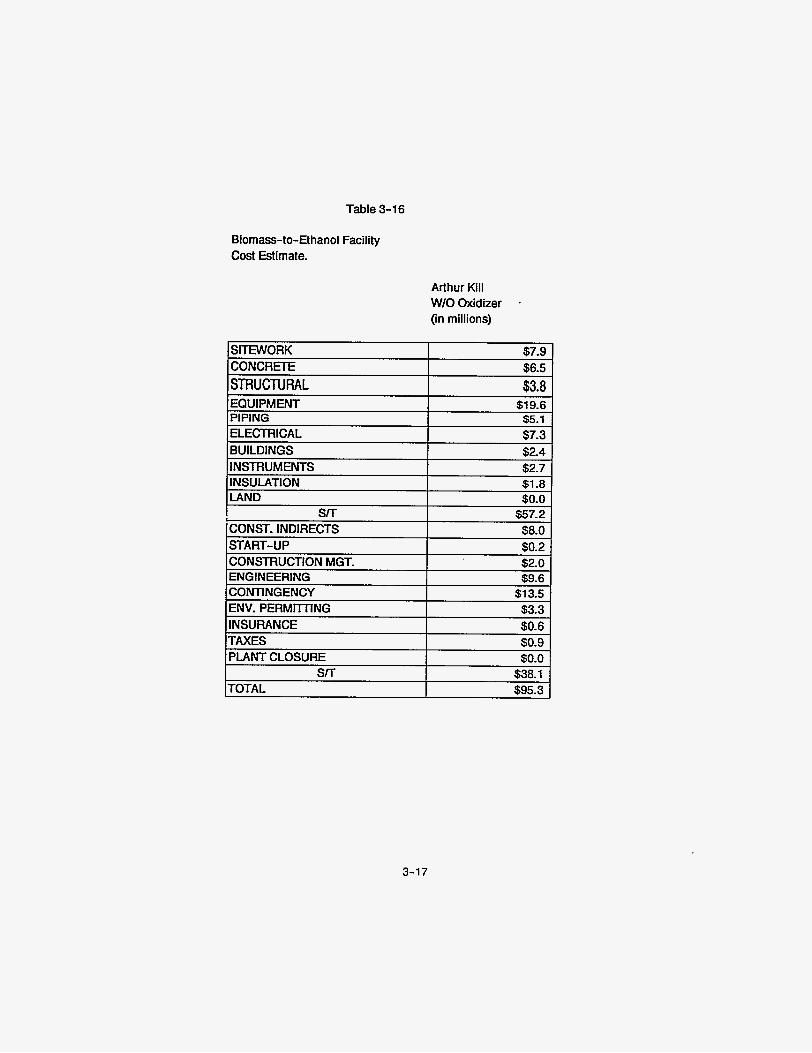
Table 3-16
Biomass-to-Ethanol Facility Cost Estimate.
Arthur Kill W/OOxidizer - (in millions)
3-17
SECTION 4 FINANCIAL EVALUATION FOR PREFERRED SITES
FINANCIAL PRO FORMAS
Introduction
Stone & Webster Development Corporation (SWDC) has evaluated the biomass-to-ethanol project for financial viability and risk from the point of view of a project developer. The project was evaluated by determining the pricing necessary to generate revenues that would provide an acceptable return on owner's equity, and comparing the required pricing to expected market prices.
In this section, the project and its omponents (Le., feedstock, output, sizes) are described to the extent necessary for input to the financial analysis. The financial structure of a potential investing company is then defined znd its revenue requirements from tipping fees or from
ethanol sales are determined, which in turn yield the required return on equity for the developer/equity partners. A financial cash flow statement (pro forma) is presented to demonstrate profitability. Finally, the results of sensitivity analyses are presented to provide assessments of project risks.
Proiect DescriFtion
A Master Input List was set up to accept data in the form used by the pro forma analysis for numerous cases. This table (Table 4-1) allows a side-by-side comparison of data for various
' sizes, feedstock, product options, etc.
The first page of the Master Input Table covers twelve options evaluated for wastepaper as the feedstock. The data needed for the evaluation included plant size, performance, capital cost, and
operating costs. Two sizes were evaluated to determine the effect of economies of scale: 500
tpd on a dry basis (595 tpd wet, as-tipped), and 1000 tpd dry (1190 tpd wet). Within each size,
4-1
.. . . . . . . - - ~ ---.-
two basic plant configurations were distinguished. One configuration is a biomass facility with a gasification plant that will convert the lignin produced by the conversion process to power and steam to be used within the facility and excess power, which is sold off-site to a utility (Options 1 and 7). The other configuration is a biomass facility that disposes of the waste lignin off-site and purchases all facility energy needs from local utilities (Options 2 and 8).
The shading on Table 4-1 indicates direct data input. Nearly all of the data was provided by other study participants via Stone & Webster Engineering Corporation. Stone & Webster Development Corporation provided some unit pricing, including average annual labor rate, maintenance cost, power purchase and sales rates, water and sewer charges, and natural gas price.
The next four options (3 to 6 and 9 to 12) vary two parameters: market price for ethanol, and
lignin disposal cost. The market price for ethanol is expected to fall within a range of $1.20 to $1.5O/gal. This is the price an end-user or blender will pay and does not reflect the $0.55/gal tax credit that they can take. Lignin disposal is expected to cost the facility from zero (whereby a purchase price exactly offsets the transportation cost) to $50/ton.
In all 12 wastepaper options, no price was set for the feedstock, either as a tipping fee or as XI expense. The value of the feedstock is the variable to be solved in the pro forma evaluation.
On the second page of Table 4-1 the same 12-option arrangement was set up using wood waste as feedstock (Options 13-24). The differences between the two facilities were ash and lignin production rates, power production with gasification, power and natural gas consumption without gasification, and water consumption. In addition, rather than setting an ethanol price and solving
for the value of the feedstock, the market value of wood waste was specified, leaving the value of ethanol to be determined. This reorientation was done to incorporate the results of research into sources and prices of feedstock that was performed concurrently with the financial evaluation. The research revealed that, rather than receiving a tipping fee for the waste, the facility would more likely have to pay $20 to $40/ton for the feedstock.
4-2
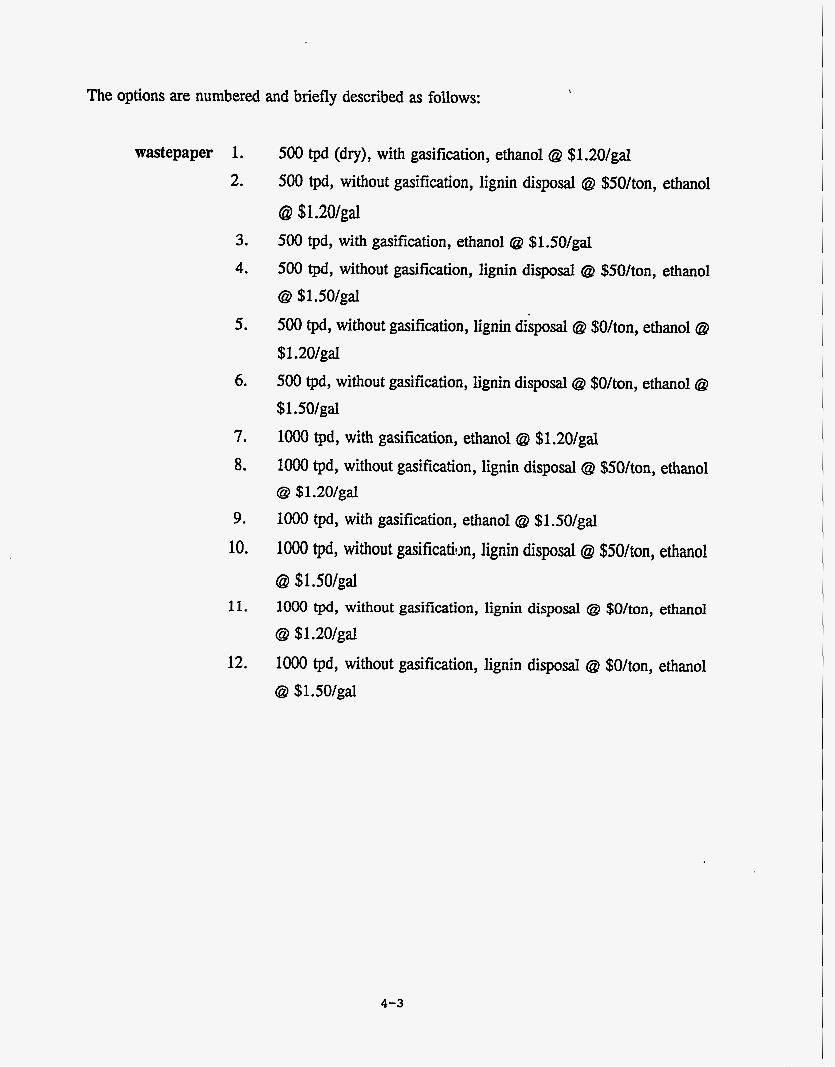
The options are numbered and briefly described as follows:
wastepaper 1. 2.
3. 4.
5.
6.
7.
8.
9.
10.
11.
12.
500 tpd (dry), with gasification, ethanol @ $1.20/gal 500 tpd, without gasification, lignin disposal @ $50/ton, ethanol
@ $1.20/gal 500 tpd, with gasification, ethanol @ $1.50/gal 500 tpd, without gasification, lignin disposal @ $50/ton, ethanol @ $1.50/gal
500 tpd, without gasification, lignin disposal @ $O/ton, ethanol @
$1.20/gal 500 tpd, without gasification, lignin disposal @ $O/ton, ethanol @
$1.50/gal lo00 tpd, with gasification, ethanol @ $1.20/gal loo0 tpd, without gasification, lignin disposal @ $50/ton, ethanol @ $1.20/gal lo00 tpd, with gasification, ethanol @ $1.50/gal
lo00 tpd, without gasificatim, lignin disposal @ $50/ton, ethanol @ $1.50/gal lo00 tpd, without gasification, lignin disposal @ $O/ton, ethanol
@ $1.20/gal
loo0 tpd, without gasification, lignin disposal @ $O/ton, ethanol @ $1.50/gal
4-3
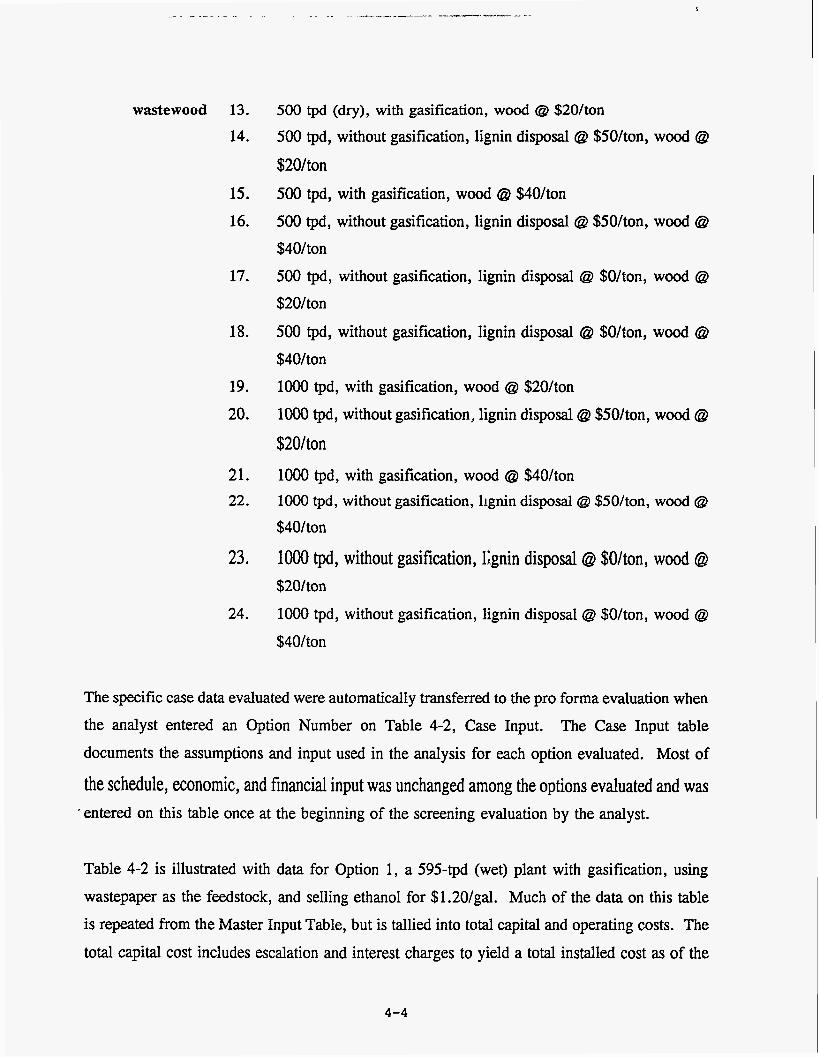
wastewood 13.
14.
15. 16.
17.
18.
19. 20.
21. 22.
23.
24.
500 tpd (dry), with gasification, wood @ $20/ton
500 tpd, without gasification, lignin disposal @ $50/ton, wood @
$20/ton 500 tpd, with gasification, wood @ $40/ton 500 tpd, without gasification, lignin disposal @ $50/ton, wood @
$40/ton 500 tpd, without gasification, lignin disposal @ $O/ton, wood @
$20/ton 500 tpd, without gasification, lignin disposal @ $O/ton, wood @
$40/ton loo0 tpd, with gasification, wood @ $20/ton lo00 tpd, without gasification, lignin disposal @ $50/ton, wood @
$20/ton loo0 tpd, with gasification, wood @ $40/ton lo00 tpd, without gasification, llgnin disposal @ $50/ton, wood @
$40/ton
loo0 tpd, without gasification, Kgnin disposal @I $Ohon, wood @I $20/ton lo00 tpd, without gasification, lignin disposal @ $O/ton, wood @
$40/ton
The specific case data evaluated were automatically transferred to the pro forma evaluation when the analyst entered an Option Number on Table 4-2, Case Input. The Case Input table documents the assumptions and input used in the analysis for each option evaluated. Most of
the schedule, economic, and financial input was unchanged among the options evaluated and was . entered on this table once at the beginning of the screening evaluation by the analyst.
Table 4-2 is illustrated with data for Option 1, a 595-tpd (wet) plant with gasification, using wastepaper as the feedstock, and selling ethanol for $1.20/gal. Much of the data on this table is repeated from the Master Input Table, but is tallied into total capital and operating costs. The total capital cost includes escalation and interest charges to yield a total installed cost as of the
4-4
commercial operation date. In this case, the total present day cost of $139,898,000 increased to $168,598,000 due to escalation and interest. The operating costs are tallied as both fixed and variable annual costs and as costs per gallon of ethanol produced. For Option 1, the annual operating budget is over $7 million for fmed costs, including labor, maintenance, and insurance, and over $3 million for variable costs, including ash disposal, chemicals, water, and sewer charges. The corresponding unit costs are $0.49/gal and $0.22/gal for a total of $0.71/gal of ethanol produced.
Table 4-2 also includes input for schedule, economic data such as inflation, escalation, and taxes, and financial data. The commercial operation date was assumed to be 4 years from now, which includes 2 years for construction. The economic life is 20 years per NYSERDA's
requirement. A 10-year life was also evaluated; the results of which are presented in the subsection Sensitivity Analysis. The plant is expected to operate at full capacity 83 percent of
the time. Assumptions for long-term inflation at 4 percent and nominal escalation ranging from 4 percent for most cost components to 5.5 percent for natural gas were included in this table.
Taxes included federal and state income taxes at 35 percent and 9 percent, respectively, and 8.25 percent gross receipts tax, which included both state and city rates. Property taxes were not included at this time because this would be site-specific. Tax depreciation was determined separately for several categories: buildings and structures, biomass conversion equipment, and balance of plant, in accordance with the 1986 Tax Reform Act.
Additional tax and economic development incentives were considered separately under the sensitivity analysis. Entering an "affirmative" on this table incorporates the economic incentives
listed on Table 4-5.
Financial Analvsis
Financial Structure. Developers of third party projects will generally seek to avoid carrying debt for the project on their own corporate balance sheets. They will attempt to create a financial structure which stands by itself, with debt backed only on the project's physical assets
4-5

and the strength of its contractual relationships. This debt would be "nonrecourse" to the developer, in that lenders cannot seek payment from the developer in the event of a project failure. To a large extent, the credit of the purchaser of the project's product and of the feedstock supplier are the basis for financing, because it is these parties' commitments to make payments on a take-if-tendered basis that assures the lender that funds will be available for debt service.
Some projects are developed with long-term feedstock (fuel) and output (Le., power, steam)
contracts that provide some cash flow certainty; this project may be able to contract long-term for feedstock (wastepaper, wood waste) but may not have a long-term contract for the output (ethanol), thus increasing the project's financial risk. Other contractual obligations ensure that the facility will be available: the lump-sum turnkey contractor guarantees that the facility will be built at a certain cost and date and that it will perform as required initially; the operation contractor guarantees that the facility will be adequately maintained so that the service can continue to be tendered.
When the contracting parties are financially strong and the project is basically sound, a high level of financial leverage is possible. Many projects in the process and energy sectors are financed with debt covering 80 percent or more of project cost. These are based mostly on the financial strength of the entity purchasing the project's output. In the case of an ethanol plant,
the degree of financial leverage that can be obtained will depend on the strength of the entities supplying waste for feedstock and purchasing the ethanol. A debt level of 80 percent would provide for enough equity to mitigate these risks to some extent and is typical of many nonrecourse financings.
Lenders generally are limiting loan terms to about 10 to 15 years for financing most projects. This is shorter than the 20-year economic life being evaluated and results in the need for higher revenues during the loan period. In general, the loan amortization period must be 1 to 2 years shorter than the term of the product off-take and feedstock contracts. Because ethanol is a commodity, the revenues for this project will be unit prices ($/gal, $/ton, etc) set by the
marketplace; little opportunity exists to structure revenues to alleviate cash flow constraints
4-6
during this period. The developer will probably focus attention on the debt structure to ease
cash flow problems. Assuming bank financing (as opposed to taxable or tax-exempt bonds),
interest rates are currently about 8 to 10 percent.
Equity in the project would generally be of two types: 1) general partner or active equity provided by the developer and/or equipment suppliers, construction contractor, or operating contractor; and 2) limited partner or passive equity that might be packaged for syndication by an investment banker. While the active equity holders may derive additional benefits from the project in terms of normal profits on services provided, the passive investor obtains a return solely from the cash flows of the project and associated tax benefits. The overall discounted
cash flowlinternal rate of return required for all equity participants is typically in the range of 20 percent or more, after-tax, for projects similar in market risk level to this biomass-to-ethancl projedt.
Revenue Reauirements. All of the costs of the project and, in the case of wastepaper as feedstock, revenues based on market prices for ethanol have been estimated. Tipping fees must make up the revenue shortfall, if any, to the extent that will yield the developer’s/equity partners’ target return on equity. The evaluation was set up to calculate the required cost per ton of feedstock in January 1994 dollars, escalating with inflation. Note that a negative tipping fee would indicate an expense for the project operator and not revenue. This can occur either by design (the maximum allowable tipping fee for a feedstock is negative) or by chance (the revenues from the sale of ethanol are more than adequate to cover the cost of the project and
provide the equity partners’ required target rate of return).
In the case of wood waste as feedstock, no revenues from tipping fees are available; the
feedstock is an expense. A market price for the feedstock was input and all revenue
requirements had to be borne by ethanol sales less a small amount of revenue generated by power sales when applicable. A required price per gallon of ethanol in 1994 dollars, escalating. with inflation, was calculated.
4-7
Pro Forma Statements. SWDC has developed a pro forma financial cash flow statement for a hypothetical developer of a biomass-to-ethanol production facility.
A cash flow statement is presented on Table 4-3 for a Option 1. Revenues from the sale of
ethanol are projected and tipping fees are included in revenues as appropriate. If the project
operator were to pay for any of the feedstock, that cash flow would be entered under Expenses. Gross margin is obtained by subtracting expenses from revenues, both of which are based on projected volume. Taxable income is determined by subtracting interest and tax depreciation
from gross margin. Income tax is simply taxable income multiplied by an effective income tax rate of 40.9 percent, which combines the 35 percent federal tax rate and the 9 percent deductible state tax rate.
Tax credits have not been included in this analysis but will be included in the sensitivity analysis under an economic incentives scenario. Depreciation is added back to income after tax, and
after-tax items such as plant cost, loan proceeds, and principal payments are included to determine net cash flow available to equity participants. Cash flow is negative in 1997, indicating an investment of equity, and again in 2004 through 2007, indicating cash flow
problems after the 5-year tax depreciation period has expired for the biomass portion of the plant. Other than these years, cash flow is positive in each year.
The debt service coverage ratio (DSCR), defined as the gross margin divided by principal and interest payment, is inadequate during the first 2 years. Obtaining financing is dependent, in part, upon demonstrating that the cash flows are sufficient to produce a minimum DSCR of at least 1.10 and average DSCR of at least 1.30 over the life of the loan. The shortfall is small and
of short duration and, therefore, could be handled by changing the financing terms or by
increasing the equity contribution. Any changes, however, can affect the equity return and so must be addressed carefully as the project is developed. The internal rate of return on this equity cash flow stream is 20 percent, as required, due to the calculated tipping fee of
$71.08/ton of feedstock. This is greatly in excess of the $20/ton tipping fee originally considered as feasible.
4-8
Initial Results. The pro forma evaluation was performed for the remaining 11 wastepaper options to determine the required feedstock tipping fee and for all 12 wood waste options to
determine the required ethanol price. Printouts of the Case Input (Table 4-2) and pro forma statement (Table 4-3) for each of those analyses are included in the Appendix as Attachments. Table 4-4 presents a summary of the results. For the 500 tpd (dry) plant, the required tipping fee ranges from $38 to $97/ton, showing that revenue from feedstock tipping is necessary for a financially viable project that produces ethanol for $1.20 to $1.50/gal. Similarly, for the lo00 tpd plant, tipping revenues are required, although for a smaller fee. The required tipping fee
ranges from $6 to $67/ton, demonstrating the significant economies of scale in capital and operating costs.
For the wood waste options, the required ethanol prices always exceed $lSO/gal. The loo0 tpd
plant with gasification produces ethanol for the least cost, $1.87/gal, when the feedstock cost is $20/ton.
The other results on Table 4-4 are discussed in the following.
Sensitivity Analysis. Given the results described above and recognizing that some uncertainty exists with costs that served as the basis of the evaluation, the results were tested to determine if there exists an opportunity for this project.
The figures supporting this analysis are in the Appendix as Attachments Figures 4-1 through 4-
16. CaDital Costs. Attached Figure 4-1 presents the effect on the required tipping fee of varying the capital cost for the wastepaper options with ethanol selling at $1.20/gal. It is evident that significant reductions in capital cost, on the order of 30 to more than 100 percent, are needed if the project is to be viable on ethanol sales alone.
If ethanol can be sold for $lSO/gal, the necessary capital cost reductions
are not as onerous, ranging from 7 to 80 percent. The lo00 tpd plants
4-9
require the smallest capital cost reductions (see Attachment Figure 4-2).
Oueratin? and Maintenance (O&W Costs. As with the capital
cost reductions, O&M costs would have to be reduced by 50 to over 100 percent for the ethanol sales at $1.20/gal to adequately and profitably cover the project costs (see Attachment Figure 4-3). A more modest reduction of 10 to 70 percent is required when ethanol can be sold for $lSO/gal, as shown on Figure 4-4.
Several O&M cost components contribute significantly to the total cost: labor, power, lignin disposal, and chemicals. Each of those costs were varied independently to determine the effect they have
on the financial results (see Attachment Figures 4-5 through 4-12).
Sensitivity of the required ethanol price to variations in capital cost
and in total O&M cost were evaluated. for the wood waste options
to determine what magnitude of reductions are needed to produce ethanol competitively. The results for the capital cost evaluation given wood waste prices at $20/ton and $40/ton, respectively (see Attachment Figures 4-13 and 4-14). Reductions of 25 to over 100 percent are needed if wood costs $20/ton, and 50 to over 100 percent are needed if wood costs $40/ton. Similar results occur for the O&M costs (see Attachment Figures 4-15 and 4-16).
Economic Incentives. Economic incentives listed in the "Draft
RFP to Recycle Recovered Paper at a Manufacturing Facility
Located in New York City" were reviewed for applicability to the wastepaper project. The incentives are summarized by their
potential effect on cash flow, and are presented on Table 4-5. The
incentives include low cost financing, various tax credits, reduced energy costs, waivers of various taxes, and capital cost grants.
4-10
Of all of the 23 economic incentives listed, only a few could be included
directly in the analysis. The others were excluded for one of several reasons:
0
0
0
Waiver of a tax that had not been included in the evaluation No change to applicable baseline value Not enough project data available to estimate value of the incentive Incentive not applicable to this project.
In particular, the Small Producer Ethanol Production credit of $O.lO/gal was not included because it is available only until the Year 2000, nor was the Electricity from Certain Renewables credit of $O.lS/kWh included because this project does not meet the closed-loop biomass definition
required. Closed-loop biomass requires that the feedstock be produced solely for the purpose of generating power, and not as a waste from some other process.
The remaining incentives (energy discounts, low cost financing, wage tax credits, and investment tax credits) were incorporated into the pro forma evaluation for Options 1, 2, 7, and 8 to determine if they provide a significant improvement in the project’s viability. Table 4-4 presents the resulting required tipping fee for comparison to the tipping fees required without the incentives. For all options, the required tipping fee is reduced by $30 to $40/ton. The tipping fee for the lo00 tpd plant with
gasification, selling ethanol for $1.20/gal, drops to -$2/ton, signifying that
revenue is no longer required from tipping. (The pro forma statements for these four options are included in the Appendix as Attachment Tables
4-6 through 4-9.)
4-11
Economic Life. NYSERDA required that a 10-year economic life also
be evaluated. The shorter time period increases the revenue required in the early years needed to recapture the investment and earn an adequate return. The 10-year evaluation was performed for Options 1, 2, 7, and 8
for wastepaper, and for Options 13, 14, 19, and 20 for wood waste. The results are shown on Table 4-4. The required tipping fee increases substantially, up $15 to $20/ton. (The pro forma statements are included
as in the Appendix as Attachment Tables 4-10 through 4-17.)
Conclusions
'The project is marginally attractive, given the data to date. There is a limited opportunity for a project such as this, sited in New York City. The project should be as large as possible, and located in an Economic Development Zone to take advantage of economic incentives. The facility with a gasification plant appears to be more financially viable, because of the high
energy costs in the area.
This section identifies potential business interests in the Amoco waste biomass-to-ethanol
production facility from !and owners, feedstock suppliers, end product users, solid waste product consumers, and the financial community.
Land Owners
Con Ed has offered sites at electrical utility locations to support the City's interest in a manufacturing facility to recycle paper. One such location is the preferred site at the Arthur Kill on Staten Island. The City has also offered City-owned sites for such a facility (see Feedstock Suppliers).
4-12
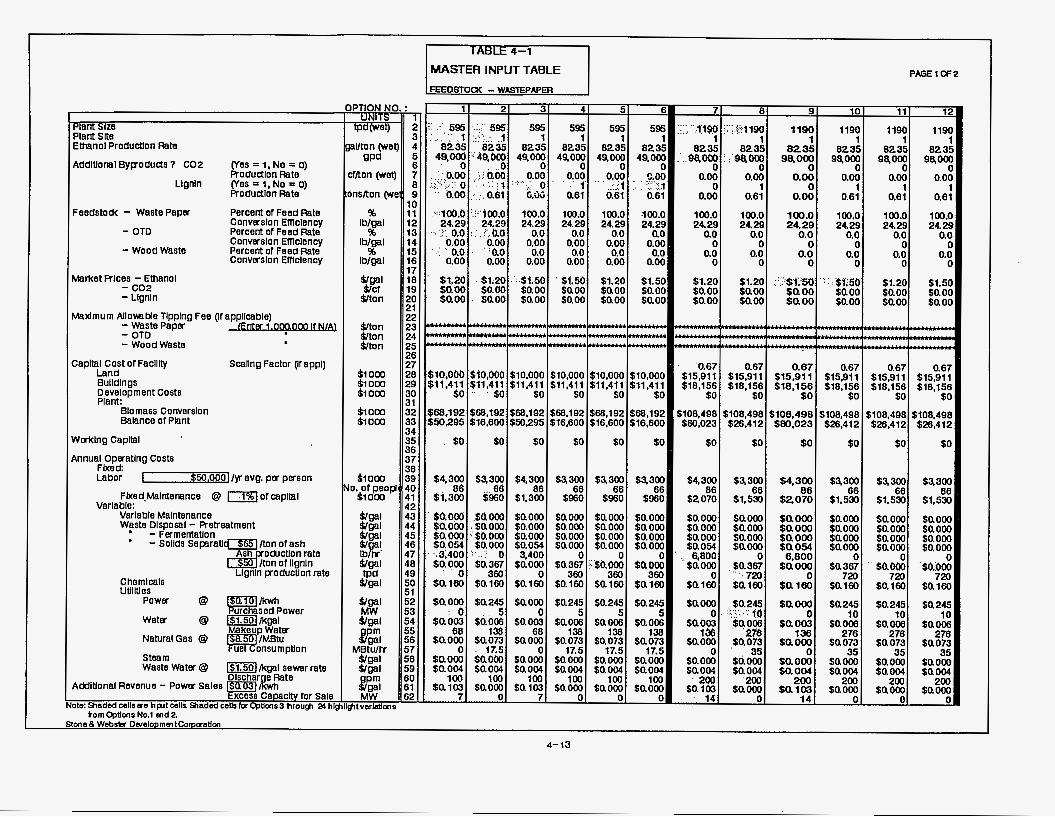
MASTER INPUT TABLE PAGE 1 OF2
Plant Size Plant Slte Ethanol ProducUon Rate
AddlUonal ByFOdUdS 7 C02 (Yes = 1, NO = 0) Rodudlon Rate (Yes = I, No = 0) Rodudlon Rate
Percent of Feed Rate Converslon Emclency Percent of Feed Rate Converslon Emclency Percent of Feed Rate Converslon Emclency
Llgnln
Feedstork - Waste Paper
- OTD
- Wood Waste
Market Rlces - Ethanol - c 0 2 - Llgnln
Maldmum Allovatie Tlpplng Fee (If appllcable) - - Waste OTD Paper - - Wood Waste
Capital Cost of Faclllty Land Bulldlngs Development Costs Plant:
Scallng Factor (If appl)
Blomass Converslon Balance of Plant
Wcrklng Capital
Annual operating Costs Flxed Labor $50.000] /yr avg. per person I
Flxed.Malntenance @ -of capltal
Varlable Malntenance W p e Dlsposal - Pretreatment - Fermentation
Varlable:
/ton of ash
Llgnln poductlon rate
oclJcUon rate 3% /ton of llgnln
* - Sollds Seprati
Chemlcals UUlltles
@ W s T P o w e r power
Water @ -5ollltgal
NaturalGas @ Makeup Water
steam Waste Water @ I$i.lOlikgat sewer rate
WsEEtg for Sale Additional Revenue - Power Sales
dote: Shaded wllsue hwt cella Shaded wllsfor Optlcns3 firow& i# hli
IPTION NO. : S I
tpd(wet) 2 3
aUton(wet) 4 gPd 5
6 Ylton (wet) 7
8 inslton (we 9
10 % 11
lblgal 12 % 13
IblQal 14 % 15
lblgal 16 17 18
&ton 20 21 22
&ton 23 &ton 24 &ton 25
26 27
Piom 28 $1000 29 $1000 30
31 $1000 32 $1000 33
34 35 36 37 38
$1000 39 IO. or peopl I 40
Siom 41
60
$?tvarktims
I I 21 31 41 51 6. 7 I I I 1 I 1
0 0.00
0 0.00
1 1
0 0 0.00 0.00 Q00
0.61 0.61 0.61
:.::100.0 ::i".JoO.o 100.0 100.0 100.0 .100.0 100.0 24.29 24.29 24.29 24.29 24.29 24.29 24.29
0.00 0.00 0.00 0.00 0.00 0.00 0 ' .,: " 0.0 ' " :o.o 0.0 0.0 0.0 0.0 0.0
0.00 0.00 0.00 0.00 0.00 0.00 0
~.'.1.'.0.0:.'..?'..hO 0.0 0.0 0.0 o.oI 0.0
61-20 $l;M ,':,$1.5O 'SI .% $1.20 $1.50 $1.20 sdoo m o o $0.00 taoo m o o $0.00 $0.00 $0.00 . $a00 $0.00 $am saoo $aoo Saw 1
HncHlcH
660,192 $68.192 $68,192 $68,192 $68,192 $68.192 $108,498 650,205 I I I I I I $16.600 $50,295 $16,600 $16,600 $16.600 $80,023
$0 . b o $0 $0 $0 $0
$4,300 $9300 $4,300 $9300 $9300 $9300 $4,300
$i,300 $960 $1,300 $960 $960 $960 $2070 86 86 86 86 66 66 66
.xmoo $aom .sa000 $a000 :(' $0, O00 $0.000 $a000 $0.054
::..: .O 3,400 $0.367 $0.000 360 0
$0.160 ta l60
s a 2 4 mom sa006 80.003
$0.073 saooo $0.000 mow $0.004 mow
5 0
138 68 . 17.5 0
w o r n
$aooo $0.367 i.
$0.000 $0.000
0
360 to. 160
$ a 2 4
$ a m
$aom
5
I38 $0.073
17.5
mow saom $0.000 $0.000
0 :'shoo0
360 $ai60
mow saooo $a051
mow $ a l a
5a000
taocm $sow
mooo mow $ a m
$0.000
. 6,800
0
0
136 0
' 200
' 14 -
81 91 10 I 11 I 12 1 1 1 1
1190 1190 I190 1190 1 1 1 1 1
8235 8 2 3 5 8235 8235 8235
0
... ':.:'.119a . :..:::
:'Q&oc$ 94000 gaOOO 0 9 4 y
1
0.0 0
0.0 0
$1.20 ::::''$y.'W "::: $J:5Q $1.20 $1.50 $a00 saoo tam m o o saoo $am SQOO $am $am m o o ----- ----- ----- 0.67 0.67 0.67 0.67 0.67
$15,911 $15.911 $15,911 $15,911 $15,911 $18,156 $0 $10.156 $0 $18,156 $0 $18,156 $0 $18,156 $0
$26.412 $80.023 $26,412 $26,412 $26,412 $108,498 $108,498 $108,498 $108,498 $108,49a
SO
s a w s a o s $a000 0 $0.000 0 saow 0
$a367 720 $a000 0 $a367 720 $0.000 720 woo0 720 $ a l a sal60 sa160 sa160 $ai60
0 6.000
$0.2451 $0.2451 sa245
4-13
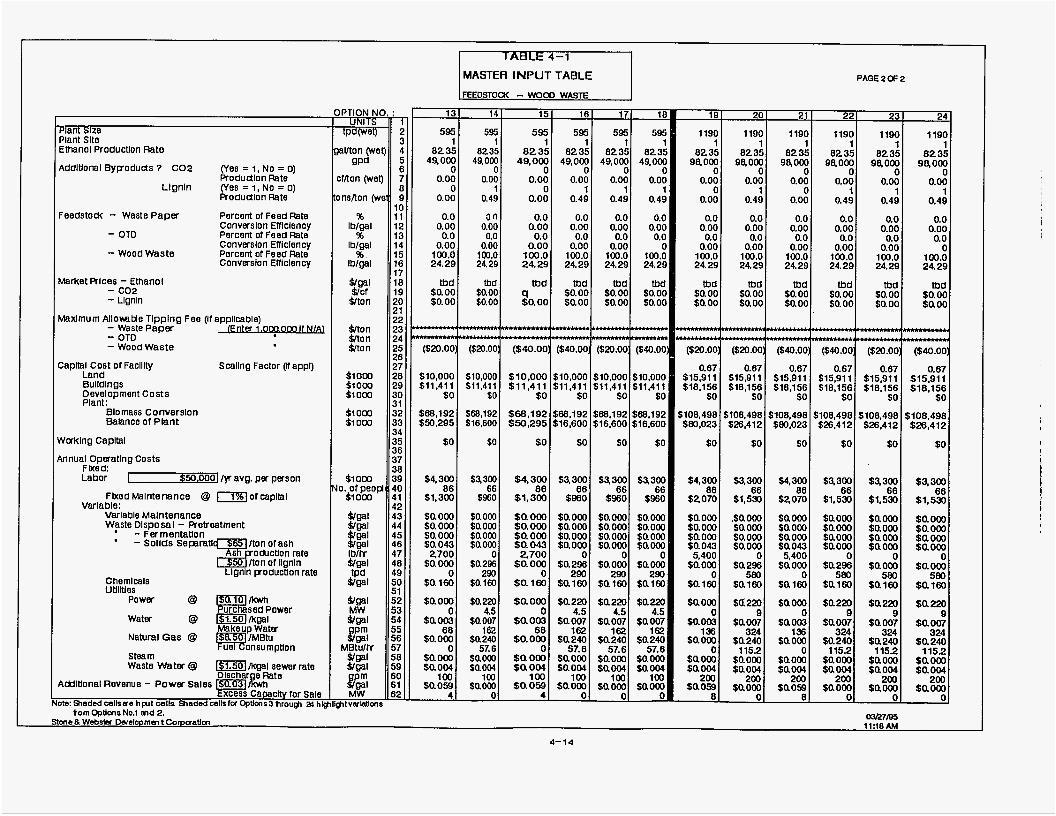
MASTER INPUT TABLE PAQE2CF2
Plant Size Plant Slte Ethanol Production Rate
Addltloml Bypoduds 7 C02 (Yes = I, No = 0) Rodudlon Rate
Llgnln (Yes = 1, No = 0) Rodudlon Rate
Feedsto& - Waste Paper Percent of Feed Rate Converslon Efflclency Percent of Feed Rate Converslon Efflclency Percent or Feed Rate Converslon Efflclency
- OTD
- Wood Waste
Market Rlces - Ethanol - c 0 2 - Llgnln
- Waste Paper - OTD - Wood Waste
MaxlmUm AllonaMe Tlpplng Fee (If appllcable) - Capltal Cost of Faclllty Scallng Factor (lfappl)
Land Bulldlngs D eve1 op ment Costs Plant:
Biomass Converslon Balance of Plant
Waltlng Capltal
Annual Operatlng Costs Flxed: Labor 1 $~,0001/y avg. per person
Fixed Malntenance Q of capltal
Varlable Malntenance W p e Dlsposal - Retreatment - Ferrnentatlon
Varlable:
/ton of ash
Llgnln productlon rate
oactlon rate a /ton of llgnln
' - Sollds Separatl
Chemicals Utilltles
W s T P o w e r
Makeup Water
W & % p t i o n
BE^^ for sale
power
Water Q 1s1.5olikgal NaturalGas Q
Steam Waste writer Q sewar rate
Addltlonal Revenue - Power Sales
09: Shaded wlIs(re hprt wlln Shaded cellsfcr CpUcns3 tvou@ ;# hl( tom Cdms No.1 m d 2.
1:
59: 1
8 2 3: 49.00(
( 0.oc
( 0.oc
0. c 0.oc
0.oc i00.c 24.22
Md $O.OC $0. oc
0. a
Il*lh(tlt*k(
nhkkkkm*
($m.oa
$10,000 $11,411
$0
$68.192 $50.295
$0
$4.300 86
$1,300
$0.000 $0. 000 $0.000 $0.043 2,700
0 $a000 sa 160
saooo $a O(M
aam $a 000 sa ow sa059 4
0
68
0
100
14 I 15 I 161 171 1E I I I I
595 1
8235 49,000
0 0.00
1 0.49
595 1
82 35 49,000
0 0.00
0 0.00
1 1 1 8235 8235 823:
49,000 49,000 49.W 0 0 C
1 1 1 0.00 0.00 o.oa 0.491 0.491 0.49
30 0.0 0.0 0.0 0.0 0.00 0.00 0.00 0.00 o.oa 0.0 0.0 0.0 0.0 0.0
0.00 0.00 0.00 0.00 a 100.0 100.0 100.0 100.0 100.0 24.29 24.29 24.29 24.29 24.2s
rnd rnd Md rnd Md $0.00 m o o moa $0.00 q
$0.00 80.00 m o o m o o $o.oa
TF ($20.00 ($40.00 ($40.00 ($20.00 ($40.00
$0
868,192 $68,192 $68.192 $68,192 $68,192 $16,600 $50,295 $16,600 $16,600 $16.600
$0 $0 $0 $0 $0
69300 $4,300 $9300 $9300 $9300
mom sa000 $0.000 mooo ~o.ooo $0.000 $0.000 80.000 $0.000 $0.000 taow $0.000 $0.000 $0.000 $aom $ a m $0.043 $0.000 $O.OOo $ O . m
66 86 66 66 66 $960 $1,300 $960 $960 $960
0 2 7 0 0 0 0 0
01 0
1190 1190 1 1
8235 8235 94000 94000
0 0 0.00 0.00
0 1 0.00 0.49
0.0 I 0.0 0.00 0.00 0.0 0.0
tbd rnd m o o $0.00 $0.00 m o o
kkkhkhtrmfhhhkmm -hkmhhkm
($20.00) ($20.00
0.67 0.67 $15,911 $15,911 $18,156 $18,156
$0 $0
i108,498 $108,498 880,023 $26,412
$0 $0
$4.300 $9300 $2070 $1,530 66
861 saow .$am $0.000 saooo m o o o saooo
saow $a296
$ a i m $ a i m
$0.043 $0.000 5,400 0
0 580
21 I 22 I 23 I 24
1190 1190 1190 1190 1 1 1 1
8235 8235 8235 8235 94000 94000 98,000 98,000
0 0 0 0 0.00 0.00 0.00 0.00
0 1 1 1 0.00 0.49 0.49 0.49
0.0 0.0 0.0 0.0 0.00 0.00 0.00 0.00 0.0 0.0 0.0 0.0
0.00 0 0.00 0.00 100.0 100.0 100.0 100.0 24.29 24.29 24.29 24.29
-mhChkhkk-- W m h C h k h k k k h k W n H h r r m * * * * * * * * C m
($40.00; ($40.00: ($20.00) ($40.00)
0.67 0.67 0.67 0.67 $15,911 $15,911 $15,911 $15,911 $18,156 $18,156 $18,156 $18.156
$0 $0 $0 $0
8108,498 $108.498 $108.498 $108.498 $80,023 $26,412 $26,412 $26,412
$0 $0 $0 $0
$4,300 $9300 $9300 $9300
$ a m mow Sam saooo saom $ a m $0.000 $0.000 wow mow $aow $ a m $a043 $a000 mow taooo
'aoyl $a296 5801 $a000 5801 $0.000 5801
$ai60 $ a i m $ai60 $ a i m
86 66 66 66 52070 $1,530 $1,530 $1.530
5,400 0 0 0
$a ooo 0
sa 003 136
0 $a ow mom moa taoB 200
115.2
$a 000
$0.007
Sam saow t a m
4-14
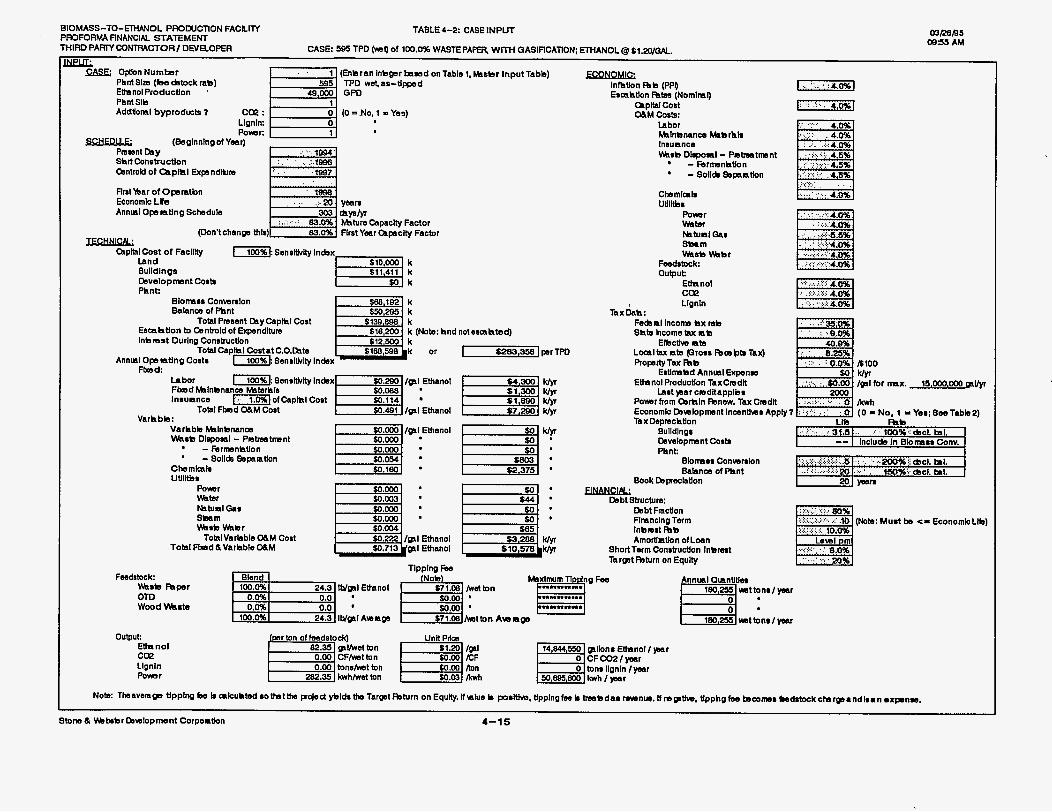
ffl/28185 0855 AM
BIOMASS-TO-EMANOL PRODUCTION FACbllY TABLE4-2: CASEINPUT PROFORMA FINANCIAL STATEMENT THIRD PARPlCONTRACTORI DEVEOPER CASE: s TPD of 100.0% WASTE PAPER w m GASIFICATION; EWANOL a 61.2o/GAL.
rvmt rr. ILYL.
EBSE; OpJonNumbsr onTable 1, hhebr InputTabb) Phnt Slm (be cktock mb) EUnnol Production ' Phnt S b AddWoml byproducta 7 Ca? :
Llpnln: Powsr:
(bglnnlngof Year) Pmant b y Shtt Consbuctlon Bntrold of Qphl Expndkm
FInt b a r of Opsratbn Economic LFe Annual Ope a t l ng Schedule
(Don't chang thle)
Y l t a 1 C o . t of Facllky I ~ ~ S e n a i t k H y Index Land Bulldlngs mve iopmnt costa Phnt. . -.._.
Blonnsa Conwnlon Balance of Phnt a! 139888 k (Nub: hnd notesaahtsd) Total Pmeent m y Caplhl cost
Total Caphl Coetat C.0.bb $1BB588 k or t283,-1psrTPD
Escahtlon to Canboldof Expmdltum Inbmrt During Consbuctlon
Flmd: Annual O p a t l n g Costs [ x i Sensitktty Index
I T l : ~enaltklty 1 n c b x E f - l .280 /-I Ethanol
Total Fixed M M Cost .481 / ~ 1 Ethanol
Labor Fbmd Malnbnancs Mabrhls lnsusnce [ . q l o f ~ a p ~ Cost 50.114
Varhbb: Varhbb Malnbnance Wasb Dlcposal - Pmtmatmnt
-Rrmenhtlon ' - Solids &paation
Chemkah Utllltba
i Powsr Wbr Fhtual Gar Bbam . Wsb Wbr
~.000
TotalVarhbleMM Cost ,222 /@IEthanol Total FixedaVarhbleMM 50.713 @I Ethanol
Feedstock N a b Raper
Wood Hhrte OTD
output: Etha no1 Ca? Llgnln Pomr
Tlpplng Fae Blend p- 1 1 W ~ l EUnnol
0.0% 0.0 * 100.0% 24.3 IWml
r ton of hmdstock)
.W b n W.a3 /)mh
lnfhtion Rb (PP9 Eemhtlon Fhtw (Nomlmr)
(Lpltal Cost M M Costs
Labor khlnbnanca Mabrhh lnsuance Hhsb O h p o a l - Pmtmatmnt
-Rrmnh t lon - Sollcb Spaation
Chemlcah Utllltba
Powsr Wbr Fhtual QI Sbam Wsla Wbr
Fwdatock: output:
E h n o l Ca? Llgnln
TaxDah: Fedsal lncom h x mb S h b hcome tax ab
Localtax ab proas FbosPb Tax) ROpftyTaX Fhb
Ethanol Production TaxCmdk
Elbcthre ate
Estlnnbd Annual Expenaa
Laat )ear cmdkapplba Powsrfrom Carkln knew. TaxCmdR Economk Cbvslopment lncenthar Tax Depmchtion
Bulldlngs Dsvelopmnt Cosb Phnt:
Book Cbpeclatlon
Blomsa Conwnlon Balance of Phnt
Osbt Structure: Dsbt Fnctlon Flmnclng Term Inbmat Fhb Amortlabn ofLoan
ShortTwm Conabuctlon Inbrast Tarwt kturn on Equlty
: ..o.o% 40.8% 6.25%
. ::. , : . A100
/a1 for nux. 15,000,000 al/yr
~~. Apply 7 (O=No, 1 -Yea:SwTable2)
(Nota: Must be c= EconomkLb)
Stom a h b b b r Dewlopment Corportkn 4-15
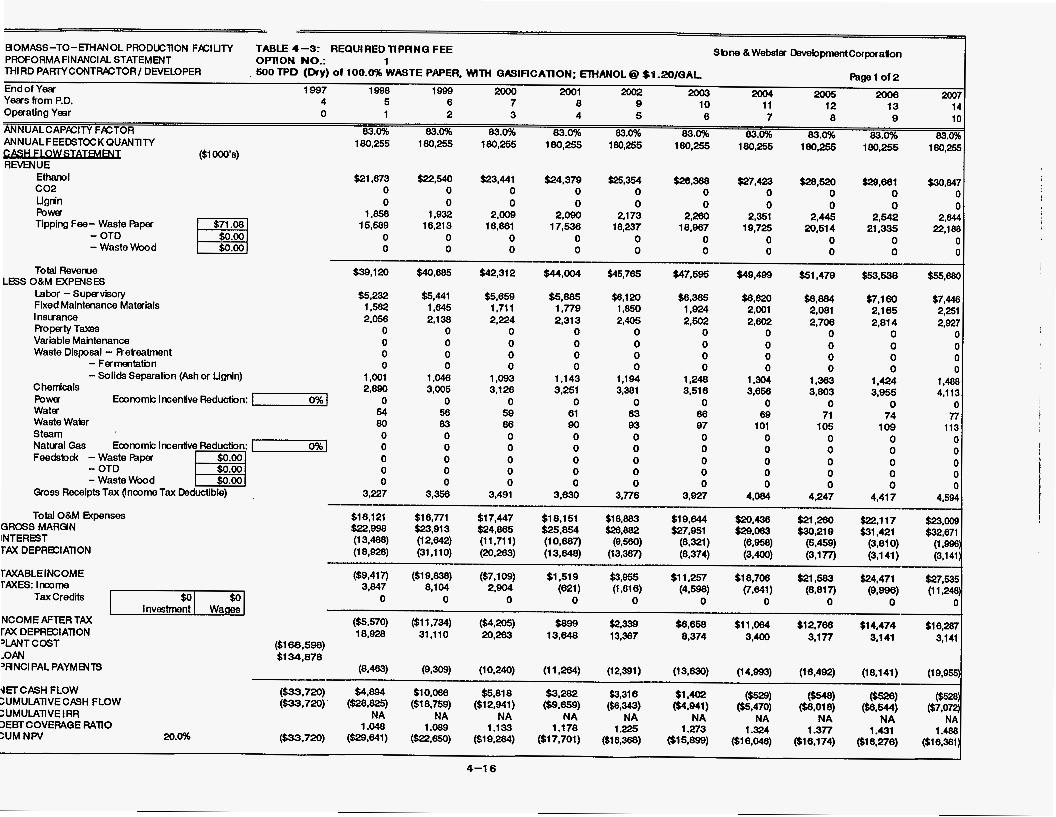
Sbne & Webster DevebpmentCorporallon
Pagel O f 2
BIOMASS-TO-ETHPNOL PRODUCTION FPCIUTY TABLE 4-3: REQUIRED TIPANQ FEE PROFORMA FINANCIAL STATEMENT OPllON NO.: 1 MI RD PARTYCONTMTOR I DEVELOPER
End of Yea 1997 1998 1999 2ooo 2001 2002 2003 2004 2005 2006 2307 Yeas from P.D. 4 5 6 7 8 9 10 11 12 13 14 Opaating Year 0 1 2 3 4 5 6 7 8 9 10 ANNUALCAPKITY FPCTOR 83.0% 83.0% 83.0% 83.0% 83.0% 83.0% 83.0% 83.0% 83.0% 83.0% ANNUALFEEDSTOCK a u A N n w 180,255 180,255 180,255 180,255 180,255 180,255 180,255 180,256 180,255 180,255 - ($1 ooo's)
. 600 TPD (Dry) of 100.096 WASTE PAPER. WlTH QASIFICATION; EMANOL @ Sl.aO/QAL
REVENUE Ethanol $21,673 $22,540 $23.441 $24.379 $25.354 $26,368 $27.423 $28,520 $29,661 $30,847 c02 0 0 0 0 0 0 0 0 0 0 Lignin 0 0 0 0 0 0 0 0 0 0 pbw 1,858 1.932 2,009 2,090 2,173 2,280 2,351 2,445 2,542 2,644 $71.08 15,589 16.21 3 16,861 17,536 18,237 18,967 19,725 20,514 21,335 22,188
0 0 0 0 0 0 0 0 0 0 0 0 0 0 0 0 0 0 0 0
Tipping Fee- Waste Paper
- Waste Wood - OTD
Total Revenue
Lebor -Supervisory Fixed Maintenance Materials I nsuance FYoperty Taxes Variable Maintenance Waste Disposal - Reteatment
LESS O&M EXPENSES
- Fermentatin - Solids Separatbn (Ash or Lignln) Chemicals
Water bw Economic lncenfive Redudion: I O%l
$39,120
$5.232 1,582 2,058
0 0 0 0
1,001 2,890
0 54
m,= $5,441 1,645 2,138
0 0 0 0
1.046 3,005
0 56
$42,312
$5,659 1,711 2,224
0 0 0 0
1,093 3,126
0 59
444.004
$55,885 1,779 2.31 3
0 0 0 0
1,143 3,251
0 61
$45,785
$6,120 1,850 2,405
0 0 0 0
1,194 3,381
0 83
$47,595
$88,385 1,924 2,502
0 0 0 0
1,248 3,516
0 68
S4a,w
$8,620 2.001 2,802
0 0 0 0
1,304 3,656
0 69
Waste Waier 80 83 86 90 93 97 101 Steam 0 0 0 0 0 0 0
0 0 0 0 0 0 0 0 0 0 0 0 0 0 0 0 0 0 0 0 0
Feedsbdc - Waste Papa
- Waste Wood
Natual Gas Economic Incentive Reduction: O%l 0 0 0 0 0 0 0 pJ - OTD
Gross Receipts Tax flncomeTax Deductible) 3,227 3,358 3,491 3,830 3,776 3,927 4,084
Total O&M Epenses GROSS MARGlN INTERBT TAX DEPReClATON
rAXABLElNCOME TAXES: Income
TaxCredb
NCOME AFTER TAX T A X DEPRB3ATION DLANTCOST -0PN WNCl PAL PAY M TS
$51,479
$8,884 2,081 2,706
0 0 0 0
1.363 3,803
0 71
105 0 0 0 0 0
$53,538
$7.1 80 2,165 2,814
0 0 0 0
1,424 3,955
0 74
109 0 0 0 0 a
$55,680
$7,446 2,251 2,927
0 0 0 0
1,- 4,113
0 77
113 0 0 0 0 0
,247 ,417 ,594
$16,121 $16,nl $17.447 $18,151 $18,883 $19,644 $20,436 $21,280 $22,117 $23,009 $221- $239913 $24,865 $25,ss4 m,882 $27,951 $29,063 $30,219 $31,421 $32,671
(18,928) (31,110) (20,263) (13.648) (13,367) (8,374) (3,400) (3,177) (3,141) (3,141
(SA17) (619,W) ($7.109) $1.519 $3,955 $11,257 $18,706 $21,583 $24,471 $27,535 3,847 8,104 2.904 (821) (1,616) (4,598) (7,W (6,817) (9,996) (11,248
0 0 0 0 0 0 0 0 0 0
($5570) ($1 1,734) ($4,205) $899 $2,339 M6,858 $11,084 $12,788 $14,474 $16,287 18,928 31.110 20,263 13,648 13,367 8,374 3,400 3,177 3,141 3,141
(13,488) (12,842) (11,711) (10,887) (9,560) (8,321) (6,m) (5,459) (3,810) (1 ,=
($1 68.598) $134.878
( 8 i w (0.309) (1 0.240) (1 1,284) (1 2,391 ) (1 3,830) (1 4.993) (16,492) (18.1 41) (1 9,955 ~~~~~~ ~~ ~~~~~~~~~~~
UETCASH FLOW ($33.720) %894 $10,066 $5,818 U P 6 $1.402 (-1 (-1 (t52s) (W >UMULAllVECASH FLOW ($33.720)' ($28*825) 618*759) ($12,941) ($Q.m) ($6,343) ($4,941) ($5,470) ($8,018) ($8,544) ($7,072 2UMULATIVE IRR NA NA NA NA NA NA NA NA NA NA ~EBTCOVEIWGE wno 1.048 1.089 1.133 1.178 1 .m 1.273 1.324 1.377 1.431 1.488 >UM N W 20.0% (w.7m) (-1641) (w.650) ($1 9,284) ($1 7.701) ($1 6.368) ($1 5.899) ($1 6,046) ($1 6.174) ($l6.=6) ($16,361
4-1 6
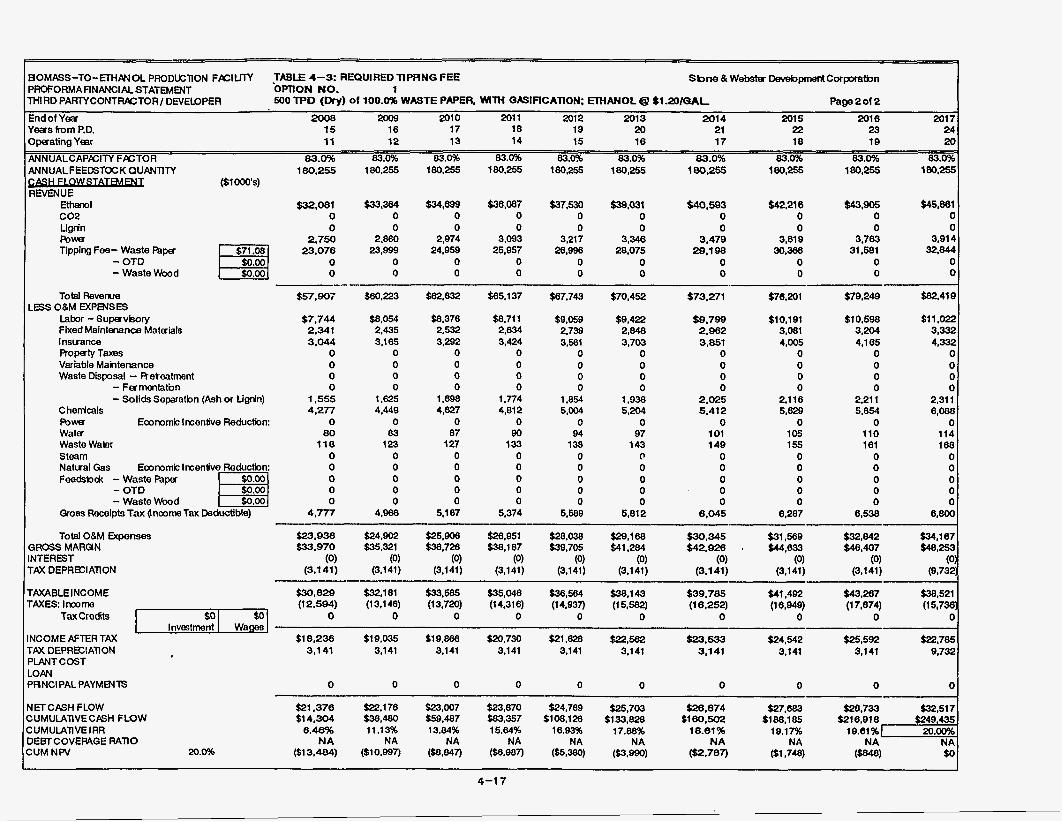
30MASS-TO-NMOL PRODUCnON FPClUTY 'ROfX)RMA FINANCIAL STATEMENT OPTION NO. 1 MlRD PAAPICONTFUCTOR/ DEVEWPER
Ind of Year 2008 2009 201 0 201 I 201 2 201 3 201 4 201 5 201 6 201 7 (ears from P.D. 15 16 17 18 19 20 21 22 23 24 >Fat ing Year 11 12 13 14 15 16 17 18 19 20
WNUALCAPKITY FPCTOR 83.096 83.0% 83.0% 83.0% 83.0% 83.0% 83.0% 83.0% 63.0% 83.096 WNUALFEEDSTOCK Q u m n n 180.255 180.255 180,255 180,255 180.255 180,255 180.255 180,255 180.255 180,255
?€VENUE Ethanol $32,081 $33.364 t34,m $38,087 $37.530 $39.031 $40.593 $42.21 6 s43.905 $45,881 c02 0 0 0 0 0 0 0 0 0 0 Lignin 0 0 0 0 0 0 0 0 0 0 m w 2.750 2.880 2.974 3.093 3,217 3.346 3.479 3,619 3,763 3,914
$71.08 23.076 23,999 24,959 25,957 28,886 20,075 29.198 30,388 31,581 32,844 0 0 0 0 0 0 0 0 0 0
- Waste Wood $0.00 0 0 0 0 0 0 0 0 0 0
Tipping Fee- Waste Fgper - OTD
Total Revenue $57.907 $60,223 %632 $65,137 $07.743 $70,452 $73,271 $76,201 $79,249 $62,419
Labor -Supervisory $7.744 $8,054 $8,376 $8,711 s9,059 $9,422 SB.799 ~10,191 $10.598 S I 1,022 Fixed Maintenance Materials 2.341 2,435 2,532 2.834 2.739 2,048 2,= 3,081 3,204 3,332 lnsuance 3.044 3,185 3.292 3,424 3,561 3,703 3.851 4,005 4,185 4,332 Ftopaty Tams 0 0 0 0 0 0 0 0 0 0 Variable Mahtenance 0 0 0 0 0 0 0 0 0 0 Waste Disposal - Reteatment 0 0 0 0 0 0 0 0 0 0 - Fermentatin 0 0 0 0 0 0 0 0 0 0 - Solids Separatbn (Ash or Lignin) 1.555 1,625 1.898 1.774 1.854 1.038 2.025 2,116 2.21 1 2.31 1 C henicals 4.277 4,449 4,627 4,812 5.004 5,204 5.412 5.629 5.854 8,088 m w Economic incentive Reduction: 0 0 0 0 0 0 0 0 0 0 Wata 80 63 87 m 94 97 101 105 110 114 Waste Wabr 118 123 1 27 I33 138 143 149 155 161 188 Steam 0 0 0 0 0 F 0 0 0 0 Natural Gas Economic Incenb've Reduction: 0 0 0 0 0 0 0 0 0 0
0 0 0 0 0 0 0 0 0 0 0 0 0 0 0 0 ' 0 0 0 0 0 0 0 0 0 0 0 0 0 0
Feedsbdc - Waste Paper
- Waste Wood Gross Receipts Tax (name Tax Deductible) 4,777 4,966 5,167 5,374 5,569 5.61 2 6.045 6,207 6,538 6,800
Total O&M Expenses $23.936 $24.902 $26,006 $26,951 $28,038 $20,168 $30.345 t31,=9 $32,842 $34,167 3-S MARGIN $33.970 W , W 1 -,726 $38,187 $39,705 $41,284 $42.926 * $44,633 548,407 m,253 NTEREST (0) (0) (0) (0) (0) (0) (0) (0) (0) (0)
TABLE 4-3: REQUIRED TIPRNG FEE
600 TPD (Dry) of 100.- WASTE PAPER, WITH GASIFICATION; EMANOL Q $1.20/QAL
Sbne & Websta Dweiopment Corporatbn
Page2of2
(SI OOO'S)
[I -- -
.eSS O&M EXPENSES
- OTD
TAX DEPR@2IATION (3.1 41) (3,141) (3,141) (3,141) (3,141) (3.141) (3.141) (3,141) (3,141) (9,732)
-AXABLE INCOME $30,- W,181 $35,048 $38.564 $38,143 $39.785 $41,492 $43,267 $38,521 'AXES Income (12.594) (13,146) (13.720) (14.316) (14.937) (15,582) (1 6.252) (1 6,949) (1 7,674) (I 5,730:
Taxcredits $0 $0 0 0 0 0 0 0 0 0 0 0
NCOME AFTER TAX $18.235 S19,035 $19.860 $20,730 $21.028 $22,562 $23.533 $24,542 $25.592 $22,785 1 Investment W a w
'AX DEPREIATION 3.1 41 3,141 3.1 41 3.141 3.141 3,141 3.1 41 3.141 3,141 9,732 'LANTCOST .OAN 'RNCIPAL PAYMENTS 0 0 0 0 0 0 0 0 0 0
IETCASH FLOW $21.376 $22.176 $23.007 $23.870 $24,769 $25.703 $26,674 $27.683 $28.733 $32,517 $249,435 XJMULATIVECPSH FLOW S14.304 $38.480 t59.487 $83.357 $108.128 $133.828 $1 80.502 $188.185
:UMULAnVEIRR 6.4696 11.13% 13.84% 15.04% 1 6 . W 17.88% 18.61 % 10.17% 1 O B I % I 20.00% EBTCOVEMGE mno NA NA NA NA NA NA NA NA NA NA :UM N W 20.0% (S13.484) (610,897) ($8.847) 66.987) (S5,m) (0.aao) ($2.787) (S1.748) (-1 $0
- $21 6,918
4-1 7
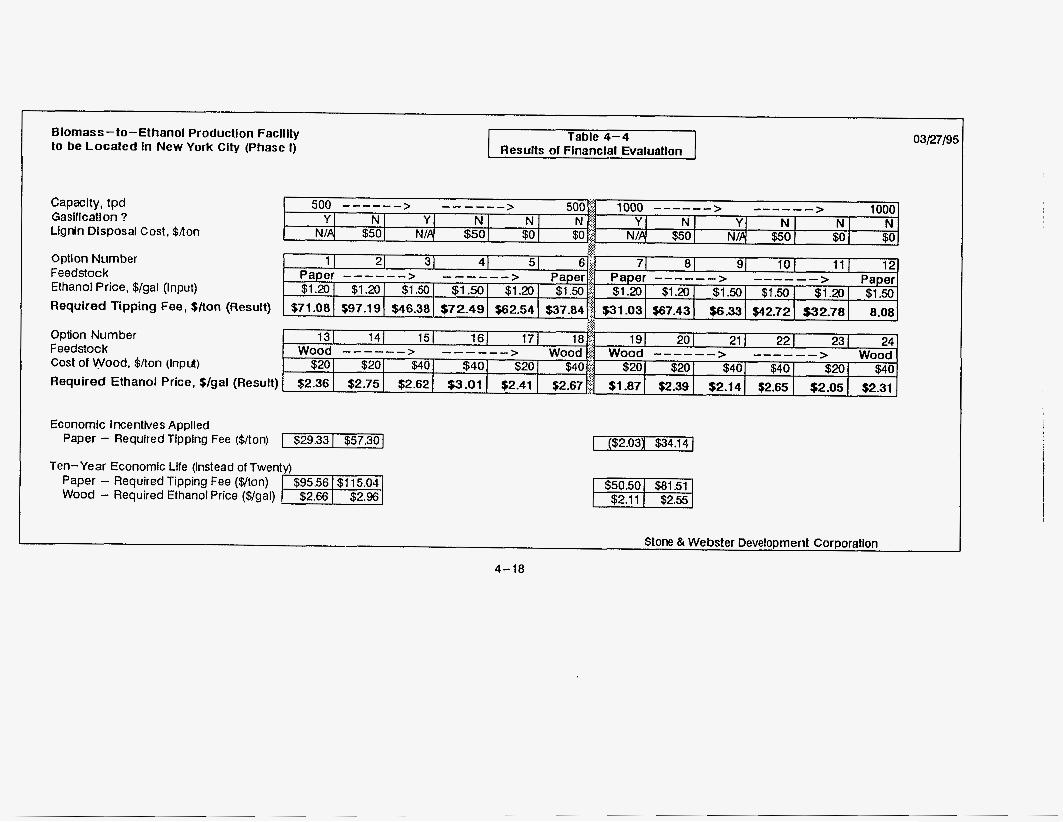
Biomass-Co- Ethanol Production Fnclilty to be Located in New York City (Phase I)
L Stone & Webster Development Corporation
Table 4-4 Results of Financial Evaluation
Optlon Number >I pa e r j Feedstock pa er -----_ ----_-
Ethanol Price, $/gal (Input) $1.20 $1.20 $1.50 $1.50 $1.20 $1.506 Required Tipping Fee, Sfion (Result) $71.08 $97.19 $46.38 $72.49 362.54 $37.84 1
Capacity, tpd Gasification ? Lignin Disposal Cost, $Ron
71 81 91 10 I 11 I 12 > Pa er
$31.03 $67.43 $6.33 ~2.72 $32.78 8.08'
> ------ Paper _--___ $1.20 $1.20 $1.50 $1.50 $1.20 $:50
Required Ethanol Price, $/gal (Result) $2.14
Economic incenthes Appiled Paper - Required Tlpplng Fee ($/ton) I $29.33 I $57.30 I
$2.65 $2.05 $2.31'
Ten-Year Economic Life (instead of Twenty) Paper - Required Tipping Fee (Uton) $95.56 $1 15.04 Wood - Required Ethanol Price (Ugal) -1
I ($2.031 $34.141
$50.50 I $81.51 $2.11 I $2.55
03/27/95
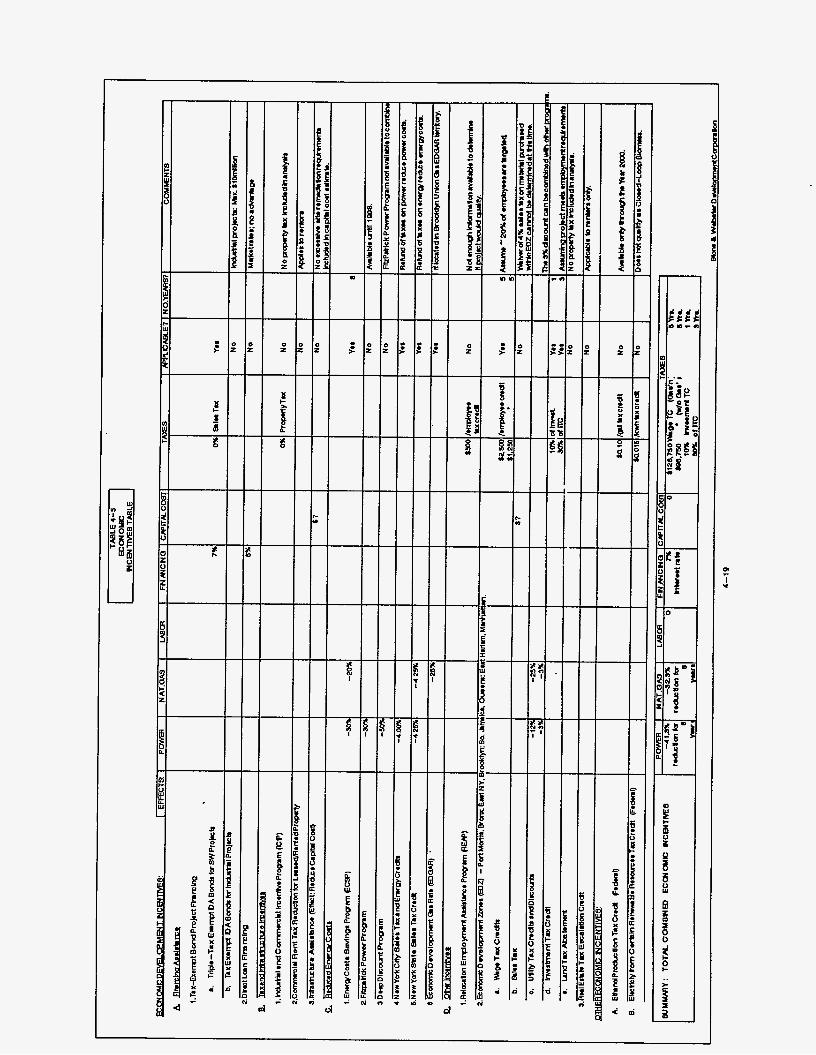
d

FRdstOC k SURD lien
The principal feedstock supplier is anticipated to be New York City through the Department of
Sanitation’s collection of recyclable waste paper. The City currently collects paper materials from all City residences and from over 5,000 institutions, including City agencies, public schools, non-profits, and municipal hospital. By June 1, 1995, the City intends to add
residential mixed paper (RMP) to the recycling program, which is estimated to increase the total
volume of available waste paper to between 1,300 and 2,200 tons per day. The City has prepared a draft RFP (PIN: 82794AD00069) for manufacturing facilities located within the City to process the waste paper to a usable product including ethanol, and has offered City-owned
sites and tax incentives for such a facility. Amoco has gained the interest of the City for its process. The date for issuing of a final RFP is currently in question after a 12-month, delay
mostly resulting from the changing political climate within the City.
Alternative feedstock suppliers within the City include the haulers of wood chips. Three such haulers were contacted. Details on these haulers, including quantities and price for wood, are found in Attachment 4-2 of the Appendix. Interest in supplying materials to an Ammo facility are subject to negotiation. A long-term reliable supply of feedstock may be a problem.
End Product Wsers
NYNEX Corporation has indicated an interest in considering the use of the ethanol end product as an additive in its vehicle fleet as a response to the mandated use of oxygenated gasoline
required by the Federal Clean Air Act by January 1995. In New York City, NYNEX has 4,000
vehicles, including distribution trucks, vans, bucket trucks, and sedans, at .35 locations
throughout the five boroughs. NYNEX is currently evaluating a number of alternative fuels for
its vehicle fleet, including ethanol.
Solid Waste BY Product Consumers
Various utilities and companies that bum municipal solid waste (MSW) were interviewed to
4-20
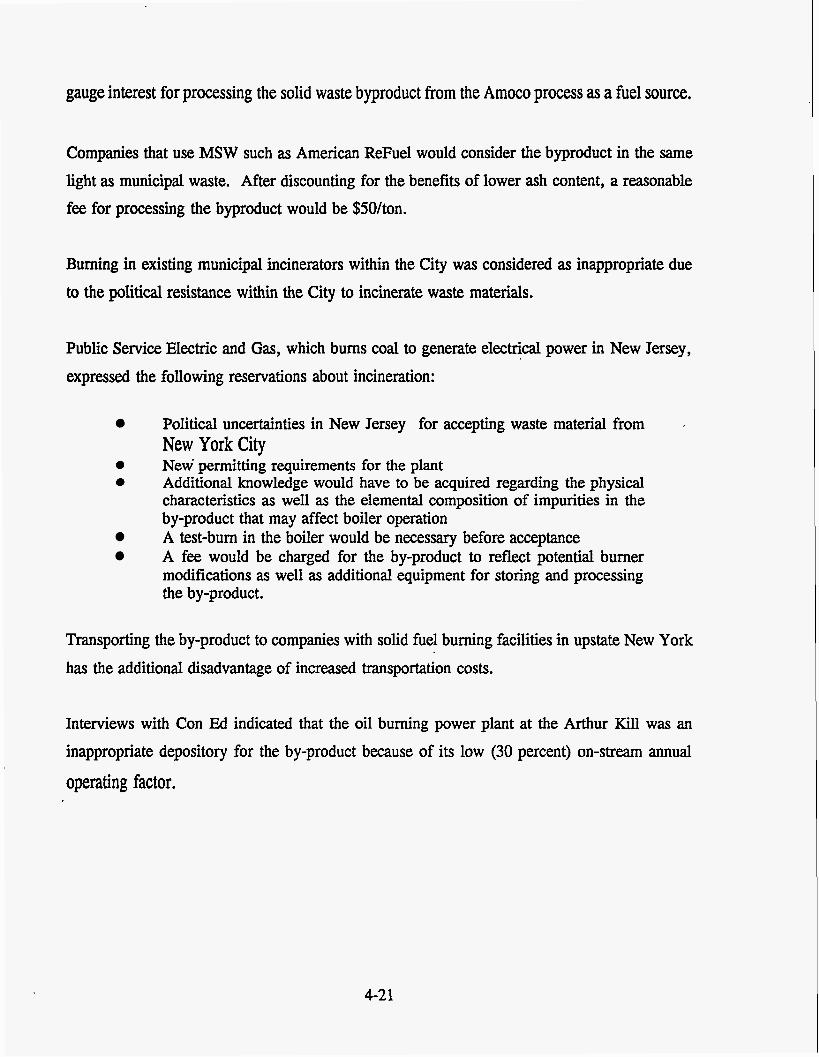
gauge interest for processing the solid waste byproduct from the Ammo process as a fuel source.
Companies that use MSW such as American ReFuel would consider the byproduct in the same light as municipal waste. After discounting for the benefits of lower ash content, a reasonable fee for processing the byproduct would be $50/ton.
Burning in existing municipal incinerators within the City was considered as inappropriate due to the political resistance within the City to incinerate waste materials.
Public Service Electric and Gas, which bums coal to generate electrical power in New Jersey, expressed the following reservations about incineration:
Political uncertainties in New Jersey for accepting waste material from .
0 0
New York City New permitting requirements for the plant Additional knowledge would have to be acquired regarding the physical characteristics as well as the elemental composition of impurities in the by-product that may affect boiler operation A test-bum in the boiler would be necessary before acceptance A fee would be charged for the by-product to reflect potential burner modifications as well as additional equipment for storing and processing the by-product.
Transporting the by-product to companies with solid fuel burning facilities in upstate New York has the additional disadvantage of increased transportation costs.
Interviews with Con Ed indicated that the oil burning power plant at the Arthur Kill was an inappropriate depository for the by-product because of its low (30 percent) on-stream annual
operating factor.
4-2 1
Financial Communitv
Based on the financial pro forma runs in this section, it was decided to delay contacting the financial community for equity interests at this time. An improved capital cost structure for building a facility in New York City is required to ensure attractive returns on investments
commensurate with operating requirements, including stable feedstock costs/tipping fees for
recycle paper.
4-22
SCREENING STUDY FOR WASTE BIOMASS TO ETHANOL PRODUCTION FACILITY USING THE AMOCO
PROCESS IN NEW YORK STATE
PART II.
NEW YORK STATE
SUMMARY
DESCRIPTION OF STUDY
Obiective of Studv
The objective of this study is to identify and evaluate four regions in upstate New York that could be appropriate for the construction and long-term operation of a financially attractive and environmentally sound waste biomass-to-ethanol production facility using Amom’s biomass conversion technology.
Backmound
Interest exists in the large urban regions of Buffalo, Rochester, Syracuse, and Albany in upstate New York in projects that would minimize waste and foster economic
development for both residents and businesses. Furthermore, legislation proposed by the
Environmental Protection Agency @PA) may require that at least 30 percent of the oxygenates contained in cleaner-burning gasoline will have to be made from renewable resources (which include waste biomass products).
These considerations prompted the formation of a study group composed of Amoco, the National Renewable Energy Laboratory (NREL), NYNEX, Champion International Corporation, and Stone & Webster Engineering Corporation to explore the potential for an upstate New York biomass processing facility designed to produce ethanol, which could be used for transportation fuels. This study for upstate New York (Part II) follows a similar study for New York City (part I). The business assessment studies provided by NYNEX and Champion International can be found in Section 9, Vol. III. Appendices are located in Vol. IV.
s-1
SITE SELECTION
Facilitv Reauirements
The processing facility design for converting biomass to ethanol requires seven technological processing steps, including waste paper/wood storage, pretreatment, enzymatic hydrolysis, fermentation, distillation, anaerobic digestion and solids/liquid separation.
Minimum facility requirements were prepared to identify the Amoco process
characteristics that would affect site selection and economic evaluation. These requirements for three types of cellulose-bearing feedstock materials (paper, wood, and combined wood/paper) included feedstock quantity required, ethanol production rate, solids by-product characteristics, environmental emission characteristics, utilities,
personnel, land ark and power reliability. A feedstock quantity of 500 tons per day (tpd) was determined to be a minimum economic facility size. Since the solids by- product of the process has a significant heating value, the study evaluated two approaches: on-site oxidation for local cogeneration of steam and power, and off-site
transport of the solids by-product to an existing waste-to-energy plant.
Site Cost Estimates
Capital cost estimates were prepared for the basic process island as well as for integration with the balance of plant requirements of a generic installation in the regions of Buffalo, Rochester, Syracuse, and Albany in upstate New York.
The capital cost of the process island has been estimated to be approximately $55 million for a 500-tpd plant in the four upstate regions. The capital cost of the process island would be approximately the same for paper, wood, and combined wood/paper feedstock.
s-2
The total cost for a 500-tpd biomass-to-ethanol facility, including the process island, the balance of plant with on-site oxidation of the solids by-product, site improvements and land costs was determined to range from $113 million or $2306/gpd of ethanol to $117 million or $2388/gpd of ethanol, depending on the upstate region. For a similar size ethanol facility with no on-site oxidation the total cost was determined to range from $84 million or $1714/gpd to $88 million or $1796/gpd.
Site ScreeninP
The site screening process for an Amoco biomass-to-ethanol conversion facility in upstate
New York required the identification of regions within the State that could support a nominal 500-tpd facility, the quantification of feedstock sources, and the identification of potential sites. This process resulted in the determination that each of the regions of Buffalo, Rochester, Syracuse, and Albany could support a biomass-to-ethanol facility; and that regional feedstock availability would restrict the ethanol facility to a 500-tpd
size.
A total of 23 potential sites were identified in the four upstate regions. To qualify for inclusion in the inventory, the sites were required to meet 13 evaluation criteria, which were grouped into four categories, including siting, utility, accessibility, and economic requirements.
COST ESTIMATES FOR SITES
Capital costs for a 500-tpd plant constructed in one of the four upstate regions were estimated for the conditions of on-site as well as off-site oxidation of the solids by-
product. The cost of a plant with on-site solids by-product oxidation ranged between
$113 and $1 17 million, while the cost of a plant without on-site oxidation ranged between $84 and $88 million. The principal cost difference among the sites was the labor cost, which varied by region.
s-3
FINANCIAL EVALUATION
Pro Form=
A financial comparison, or pro forma, analysis was conducted for the biomass-to-ethanol
facility to evaluate financial viability and risk. Thirty options were evaluated for the mixed feedstock consisting of the waste paper and wood in a ratio of 1: 1. The evaluation was performed for a plant size of 500-tpd for four regions in New York State: Albany,
Buffalo, Rochester, and Syracuse. Within each region two basic plant configurations were distinguished: a biomass facility with an on-site oxidation plant that converts solids by-product to power and steam used within the facility; and a biomass facility that disposes of the solids by-products off-site and purchases all facility energy needs from local utilities. A market price for the mixed feedstock was assumed at $20 and $40/ton. A required return of 20 percent on equity, after taxes, was used for 10-and 20-year life evaluations. For the most economical region, Syracuse, additional financial evaluations were performed to determine required feedstock tipping fees for ethanol sales prices of $1.20 and $lSO/gal.
Sensitivity analysis was conducted to show the effects of capital costs as well as O&M costs on the financial evaluation. The effects of the economic incentives were evaluated for the Syracuse region. The results are, however, typical for all New York State regions.
The pro forma evaluations determined that the required ethanol price would be approximately $1.97/gal for a feedstock price of $20/ton, and $2.23/gal for a feedstock price of $40/ton. For the Syracuse region, the required tipping fee ranges from $35.59 to $14.59/ton for the ethanol price range of $1.20 to $lSO/gallon.
Sensitivity of the required ethanol price to variations in capital cost and total O&M cost were evaluated for the mixed feedstock options for prices of $20 and $40/ton. The
s-4
results indicate that reductions of 35 to 80 percent in capital cost are needed if feedstock costs $20/ton, and 60 to over 100 percent if feedstock costs $40/ton. Similar results occur for the O&M costs.
Just as with the capital cost reductions, O&M costs would have to be reduced by 40
percent to 70 percint for the feedstock price of $20/ton to adequately and profitably cover the project costs. A reduction of 80 to over 100 percent is required when the feedstock can be purchased for $40/ton.
The sensitivity analysis indicates that reductions in capital cost of the plant for the Syracuse region, on the order of 40 to more than 80 percent, are needed if the project is to be viable on ethanol sales alone at $1.20/gal. If ethanol can be sold for $1.50/gal, the necessary capital cost reductions are less onerous, ranging from 7 to 50 percent. Similar results oc:ur for the O&M costs.
Economic cost incentives may reduce tipping fees by as much as $34 to $36/ton. The reduction in ethanol price ranges from $0.29 to $0.38/gal.
The conclusion of the pro forma analysis is that there is a limited opportunity for a project such as this, sited in New York State. The project should be sited to take advantage of economic incentives. The facility with an on-site by-product oxidation plant appears to be more financially viable, than one with off-site dispensation of the lignin.
Business Interests
Potential business interests in the proposed waste biomass-to-ethanol production facility were identified from land owners, feedstock suppliers, end product users, solid waste by- product consumers, and the financial community.
s-5
New York State Electrical & Gas Corporation (NYSEG) has expressed an interest in the
biomass-to-ethanol facility by offering sites at power plant locations.
Operation Oswego County Inc. and the County of Oswego Industrial Development
Agency have expressed strong interest in financing an engineering feasibility study for retrofitting the Miller Brewery site to an Amoco ethanol facility.
Interest from feedstock suppliers includes lumber mills, paper mills, and municipalities. Lumber by-products would be the main source of feedstock because of plentiful supply and ease of accessibility. The lumber would be supplemented by paper sludge (especially in the Albany region) and three different types of municipal solid waste, consisting of paper products, yard waste, and construction and demolition wood.
NYNEX Corporation has indicated a strong interest in using the ethanol end product as
a gasoline additive in its vehicle fleet as a response to the mandated use of oxygenated gasoline by January 1995, as required by the Federal Clean Air Act.
Based on the financial pro forma analysis, it was decided to delay contacting of the financial community for equity interests at this time. An improved capital cost structure for building a facility in New York State is required to ensure attractive returns on investments commensurate with operating requirements, including stable feedstock costs/tipping fees for recycle paper.
BUSINESS ASSESSMENTS
Feedstock Sumlier
Champion International perceives the Amoco process as a recycling process that competes with present practices by the paper industry. The paper industry has achieved national paper recovery rates of approximately 40 percent. The economics of achieving
S-6
this rate is demonstrated by the industry’s ability to absorb current recycle paper price
increases to over $100/ton in New York State. Such instability in price makes it currently unfavorable to recycle paper via the Amoco process. The Company recommends that paper mill sludge would be a more suitable feedstock, particularly in New York State where approximately 400 dry tons/day of paper sludge are generated and landfilled.
Feedstock Sumlier/Ethanol User
NYNEX approached the business assessment of the Ammo process as a potential user of ethanol for its vehicle fleet and as a potential supplier of feedstock in the form of old telephone directories (OTD).
With approximately 8,000 of NYNEX’s 12,000 New York State vehicles located outside New York City, an Ammo ethanol facility located in upstate New York would appear to offer efficiencies for providing fuel to approximately two-third of the NYNEX New York fleet. However, questions related to transportation, storage, and the Ammo intermediate distribution process itself remain to be answered.
More than 40 counties in upstate New York have some form of old telephone book recycling program. Waste paper markets are currently very strong; with prices in the $70 to $100/ton range. Therefore, the viability of an ethanol facility as an alternative end-use market for telephone books is completely dependent on current market conditions.
Regarding the NYNEX decision on alternative fuels for its vehicle fleet, review of EPA
reports confirmed the benefitskosts associated with alternative fuels. However, more
research is needed to determine such issues as optimum engine configuration, fuel metering systems, and fuel storage technology.
s-7

SECTION 5
INTRODUCTION
OBJECTIVE
"he objective of this study is to identify and evaluate four urbanized regions of Buffalo, Rochester, Syracuse, and Albany in upstate New York that could be appropriate for the construction and long-term operation of a financially attractive and environmentally sound waste biomass-to-ethanol production facility using Amoco's biomass conversion technology (the A m m pr&ss).
STUDY BACKGROUND
Interest exists at upstate New York regions in projects that would minimize waste and foster economic development for both residents and businesses. The large urban regions of Buffalo,
Rochester, Syracuse, and Albany, each produce a substantial volume of municipal paper and wood wastes, industrial wood wastes, and paper sludge waste from upstate paper mills.
A second factor supporting development of a waste-to-energy is legislation proposed by the Environmental Protection Agency @PA) that may require that at least 30 percent of the oxygenates contained in cleaner-burning gasoline to be made from renewable resources (which include waste biomass products). Thus the market for biomass products, such as ethanol, are expected to increase substantially.
For these reasons, Amoco, together with NREL, NYNEX, Champion International, and Stone
& Webster Engineering Corporation have been exploring the potential for an upstate New York biomass processing facility designed to produce ethanol which could be used for transportation fuels. Amoco has developed its biomass conversion technology through 15 years of research
and development (R&D) and pilot plant work by its own staff, NREL and other collaborators.
5-1
Efforts are underway to assess project feasibility in conjunction with large-de paper, forest products and agricultural operations.
STUDY ORGANIZATION
The study was managed by Stone & Webster Engineering Corporation (SWEC) with technical support from Amoco Corporation, Stone & Webster Development Corporation, NYNEX,
Champion International, National Renewable Energy Laboratory (NREL), the New York State Energy Research & Development Authority (NYSERDA), and other parties. The following identifies participation of the team members in selection of preferred sites and evaluation of
project viability in upstate New York.
Stone & Webster Engineering Corporation provided the overall management of the study and preparation of this report. In addition, SWEC was respons’ble for site selection (Section 7), including screening potential sites in upstate New York, defining site improvement requirements and costs, defining key site evaluation criteria, and evaluating sites in the four upstate regions. SWEC also developed refined budgetary capital and operating costs for the two preferred sites (Section 7) and identified potential business interests (Section 8).
Amoco defined process-related requirements for the biomass-to-ethanol production facility (Section 6), estimated capital and operating costs for the island of process equipment for 500 and 1000 tons per day (tpd) of feedstock (Section 6) and provided general technical guidance to the project.
Stone & Webster Development Corporation prepared financial pro formas for the construction and long-term operation of an Amoco process facility at the preferred sites (Section 8).
Champion International prepared a business assessment as a feedstock supplier (Section 9).
NYNEX prepared a business assessment as a potential ethanol user and a provider of old
5-2

telephone directories as feedstock (Section 9).
5-3
Section 6
UPSTATE NEW YORK SITE SELECTION
The study gathered and reviewed upstate New York siting data available within Stone & Webster Engineering Corporation and elsewhere, and determined design requirements of the Amoco process for prospective sites. The preferred sites were selected based on developed criteria and Amoco process requirements. Financial evaluations were performed to determine the economics of developing a project in upstate New York.
FACILITY REQUWEMENTS FOR SITE SELECTION
Technolog Overview
A processing facility for converting biomass to ethanol requires a number of processing steps
(depicted later in Figures 6-2 through 6-7).
0
0
0
0
0
Waste PaDedWood Storape. In the first step, feedstock @ape-' or wood) is cleaned of contaminants and shredded prior to further processing.
Pretreatment. This step sterilizes the feedstock and prepares it for further processing by hydrolysis agents.
Enzymatic Hvdrolvsis. The feedstock is hydrolysed by adding acid and enzymes. This operation converts cellulose to glucose.
Fermentation. In this step, glucose is converted to ethanol by applying microorganisms in a fermentation process similar to the corn-to-ethanol process. Typically, about half of the glucose is converted to carbon dioxide and half to ethanol. Small amounts of glucose are converted to microorganism cell mass. .
Distillation. The ethanol is recovered using a distillation technology commonly employed by the corn-to-ethanol industry. This is followed by the use of molecular sieves to break up the water-ethanol mixture.
6- 1

0
Anaerobic Dimstion. Solids emanating from the distillation process are subjected to digestion by anaerobic bacteria to generate methane off-gas and the soliddliquid product. The methane off gas may be used to supply energy required by the Amoco process.
Solids/Liauid SeDaration. In the final step, unreacted solids are separated from liquids. The solids may be used as fuel to supply process heat and power or sold to others for use as fuel. The liquids are subjected to digestion by aerobic bacteria and discharged for reuse in the process.
Facilitv Characteristics
Minimum generic facility characteristics that would affect site selection and economic evaluation were identified. These characteristics included feedstock type, feedstock quantity, ethanol production rate, solids by-product characteristics, environmental emission characteistics, utilities, personnel, land area, and power reliability. The facility characteristics are summarized
in Table 6-1 for three types of cellulose-bearing feedstock materials: paper, wood, and
combined
6-2
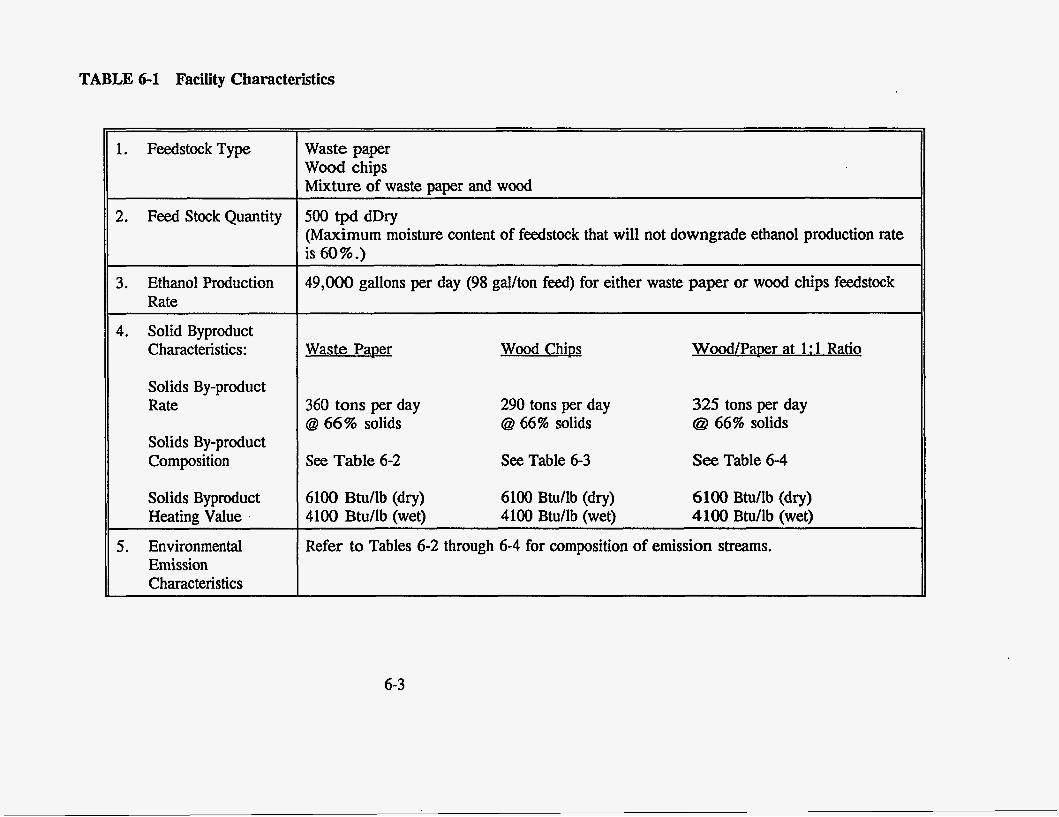
TABLE 6-1 Facility Characteristics
1. FeedstockType
2. Feed Stock Quantity
~ ~ ~~~
3. Ethanol Production Rate
4. Solid Byproduct Characteristics:
Solids By-product Rate
Solids By-product Composition
Solids Byproduct Heating Value .
~ ~~
5. Environmental Emission Characteristics
Waste paper Wood chips Mixture of waste uamr and wood
500 tpd dDry (Maximum moisture content of feedstock that will not downgrade ethanol production rate is 60%.)
49,000 gallons per day (98 g@/ton feed) for either waste paper or wood chips feedstock
Waste Paper
360 tons per day @ 66% solids
See Table 6-2
Wood Chips
290 tons per day @ 66% solids
See Table 6-3
Wood/Paper at 1 : 1 Ratio
325 tons per day @ 66% solids
See Table 6-4
6100 Btu/lb (dry) 6100 Btullb (dry) 6100 Btu/lb (dry) 4100 Btu/lb (wet) 4100 Btu/lb (wet) 4100 Btu/lb (wet)
Refer to Tables 6-2 through 6-4 for composition of emission streams.
6-3
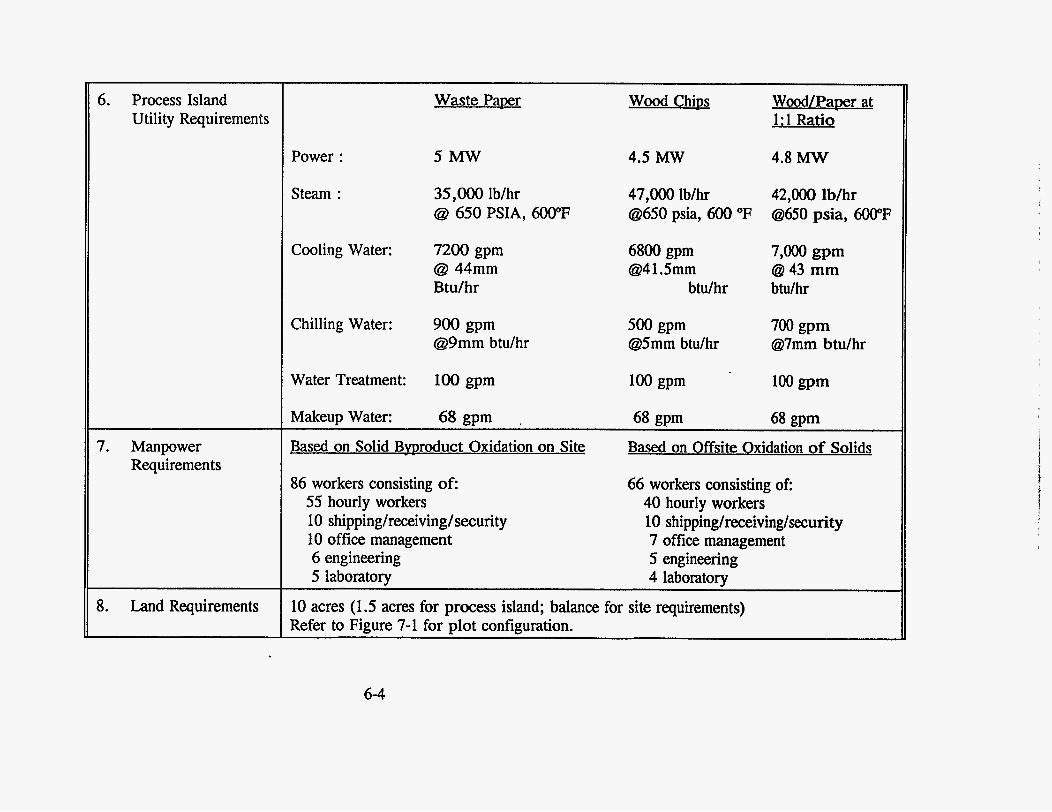
6. Process Island Utility Requirements
7. Manpower Requirements
8. Land Requirements
Power :
Steam :
Cooling Water:
Chilling Water:
Water Treatment:
Wood/Paper at 1:l Ratio
Waste PaDer wood ChiDs
5 w
35,000 lb/hr @ 650 PSIA, 600°F
7200 gprn @ 44mm Btu/hr
900 gpm @9mm btu/hr
4.5 Mw 4.8 Mw
47,000 lb/hr 42,000 lb/hr a650 psia, 600 OF a650 psia, 600°F
6800 gpm @41.5mm
btu/hr
500 gpm @5mm btu/hr
7,000 gpm 6343 mm btulhr
7 0 gpm @7mm btu/hr
100 gpm
Makeup Water: 68 gpm . 68 gpm 68 gpm Based on Solid Bvproduct Oxidation on Site Based on Offsite Oxidation of Solids
86 workers consisting of: 66 workers consisting of: 40 hourly workers
7 office management
55 hourly workers 10 shipping/receiving/security 10 shippinglreceivinglsurity 10 office management 6 engineering 5 engineering 5 laboratory 4 laboratory
10 acres (1.5 acres for process island; balance for site requirements) Refer to Figure 7-1 for d o t configuration.
6-4
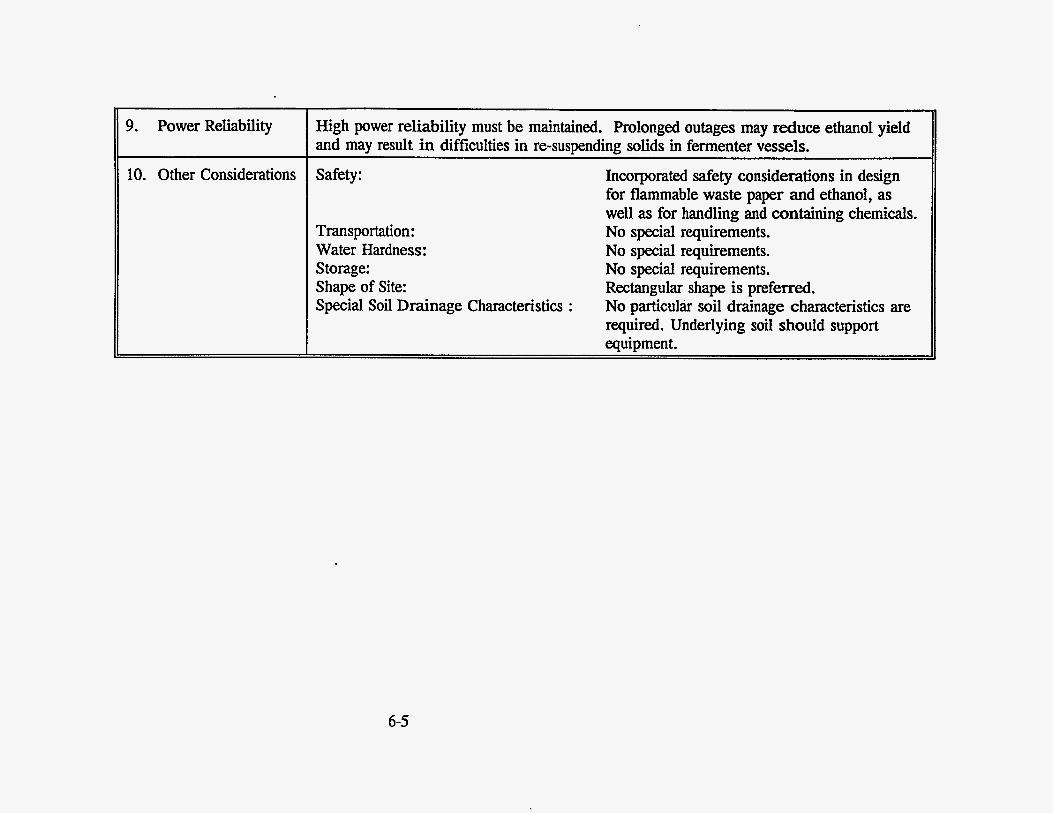
9. Power Reliability
10. Other Considerations
Transportation: Water Hardness: Storage: Shape of Site: Special Soil Drainage Characteristics :
High power reliability must be maintained. Prolonged outages may reduce ethanol yield and may result in difficulties in re-suspending solids in fermenter vessels.
Safety: Incorporated safety considerations in design for flammable waste paper and ethanol, as well as for handling and containing chemicals. No special requirements. No special requirements. No special requirements. Rectangular shape is preferred. No particulir soil drainage characteristics are required. Underlying soil should support equipment.
6-5
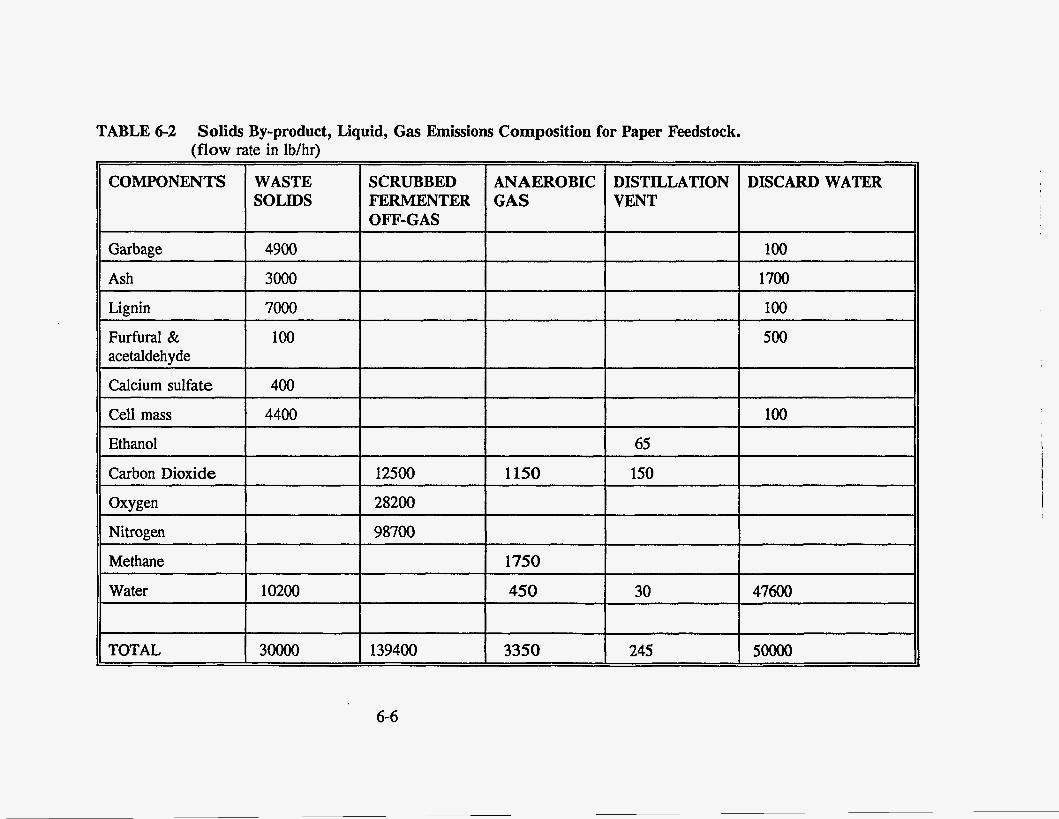
(flow
COMPONENTS
Garbage
Lignin
Ash
Furfural & acetaldehyde
Calcium sulfate
Cell mass
Ethanol
Carbon Dioxide
Oxygen
Nitrogen
Methane
Water
TOTAL
6-6
rate in lb/hr)
WASTE SCRUBBED ANAEROBIC DISTILLATION DISCARD WATER SOLIDS FERMENTER GAS VENT
OFF-GAS
4900 100
3000 1700
7000 100
100 500
400
4400 100
65
12500 1150 150
28200
98700
1750
10200 450 30 47600
3oooo 139400 3350 245 5oooo
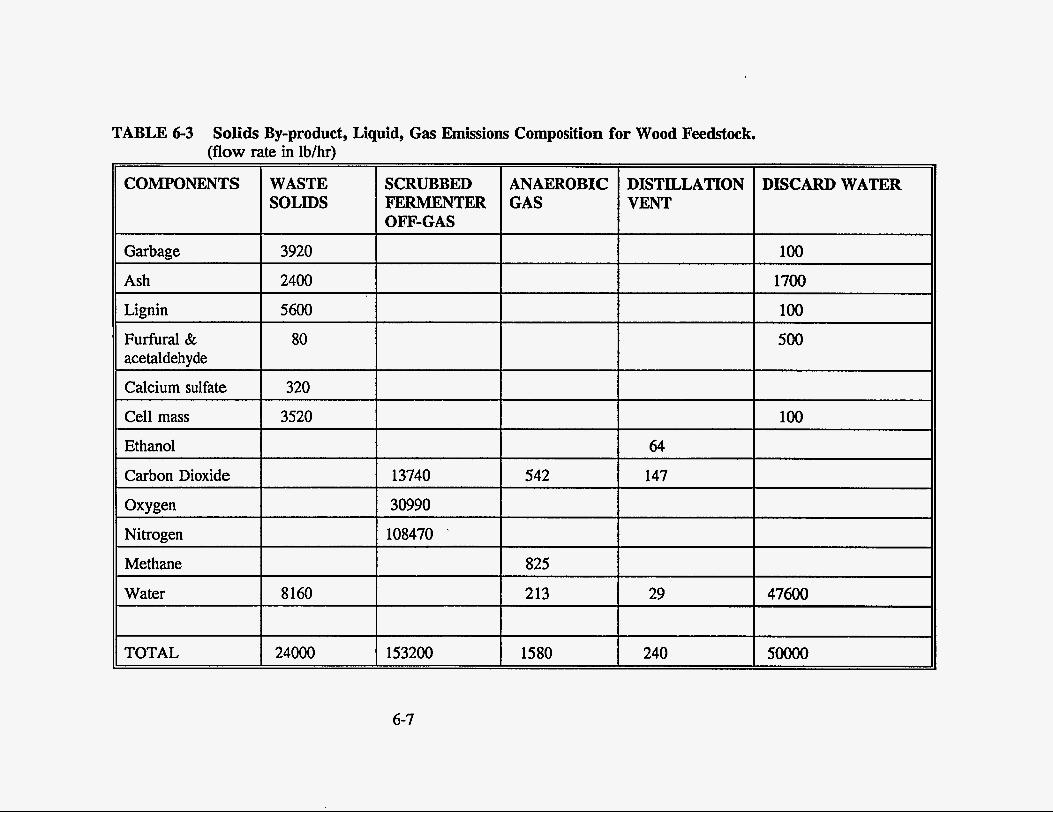
TABLE 6-3 Solids By-product, Liquid, Gas Emissions Composition for Wood Feedstock. (flow rate in lb/hr)
COMPONENTS WASTE SOLIDS
Garbage I 3920
Lignin 5600
Furfural & acetaldehyde I Calcium sulfate
Cell mass
Ethanol
Carbon Dioxide
Nitrogen
Methane
Water
TOTAL I 24000
SCRUBBED
OFF-GAS
64
13740 542 147 I
30990
108470 '
I I
153200 1 1580 I 240
DISCARD WATER
100
1700
100
500
100
47600
5 m
6-7
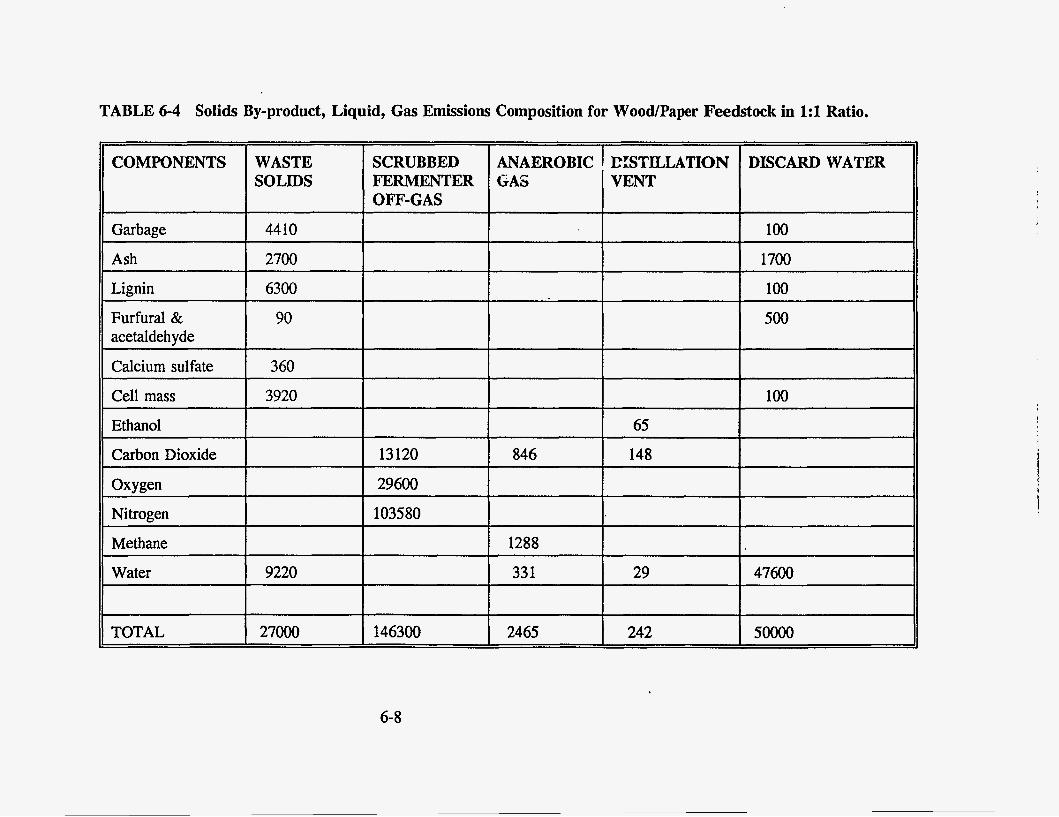
TABLE 6-4 Solids By-product, Liquid, Gas Emissions Composition for Woodpaper Feedstock in 1:l Ratio.
ANAEROBIC GAS
846
1288
33 1
2465
CISTILLATION DISCARD WATER VENT
100
1700
100
500
100
65
148
29 47600
242 5 m
SCRUBBED FERMllNl'ER OFF-GAS
COMPONENTS
11 Garbage I 4410 I
WASTE SOLIDS
Ash
Lignin
2700
6300
I 3920 I
Furfural & acetaldehyde
Calcium sulfate
90
360
Ethanol
Carbon Dioxide
Methane
Water
13120
Oxygen
Nitrogen
29600
103580
6-8
TOTAL 27000 146300
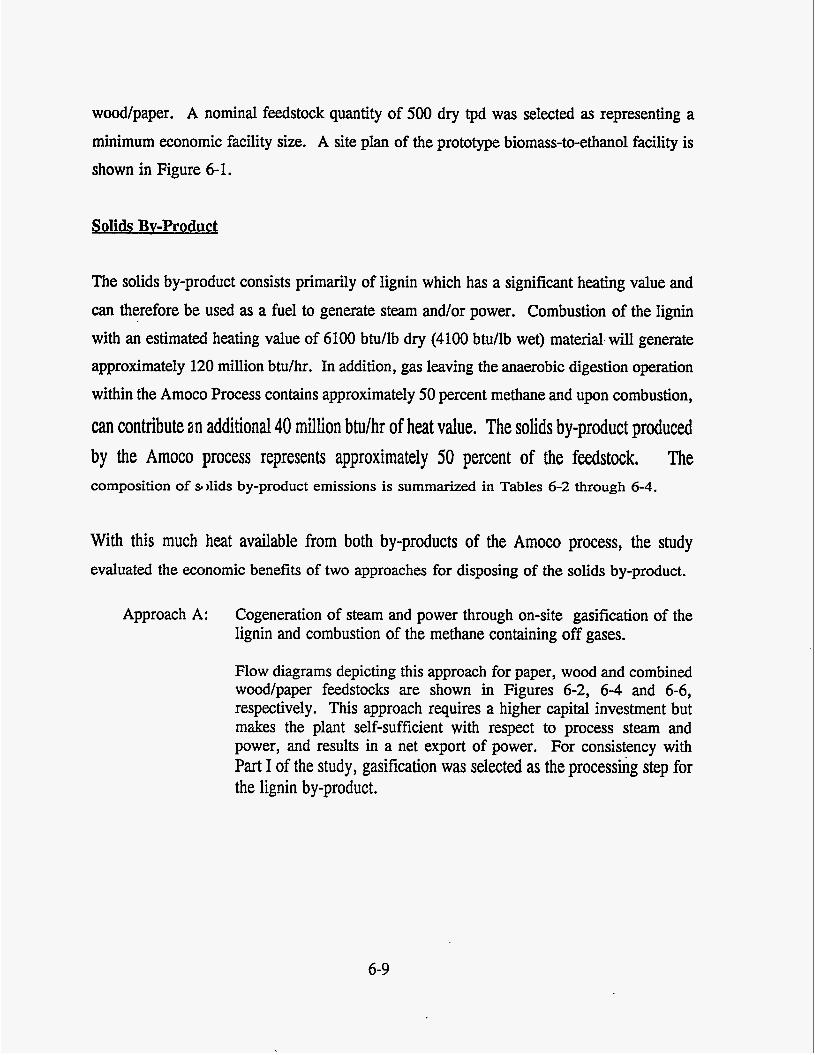
wood/paper. A nominal feedstock quantity of 500 dry tpd was selected as representing a minimum economic facility size. A site plan of the prototype biomass-to-ethanol facility is shown in Figure 6-1.
solids Bv-Product
The solids by-product consists primarily of lignin which ,,as a significant heating value and
can therefore be used as a fuel to generate steam and/or power. Combustion of the lignin with an estimated heating value of 6100 btu/lb dry (4100 btu/lb wet) material,will generate approximately 120 million btu/hr. In addition, gas leaving the anaerobic digestion operation within the Amoco Process contains approximately 50 percent methane and upon combustion,
can contribute an additional 40 million btulhr of heat value. The solids by-product produced by the Amoco process represents approximately 50 percent of the feedstock. The composition of s1)lids by-product emissions is summarized in Tables 6-2 through 6-4.
With this much heat available from both by-products of the Amoco process, the study evaluated the economic benefits of two approaches for disposing of the solids by-product.
Approach A: Cogeneration of steam and power through on-site gasification of the lignin and combustion of the methane containing off gases.
Flow diagrams depicting this approach for paper, wood and combined wood/paper feedstocks are shown in Figures 6-2, 6-4 and 6-6, respectively. This approach requires a higher capital investment but makes the plant self-sufficient with respect to process steam and power, and results in a net export of power. For consistency with Part I of the study, gasification was selected as the processing step for the lignin by-product.
6-9
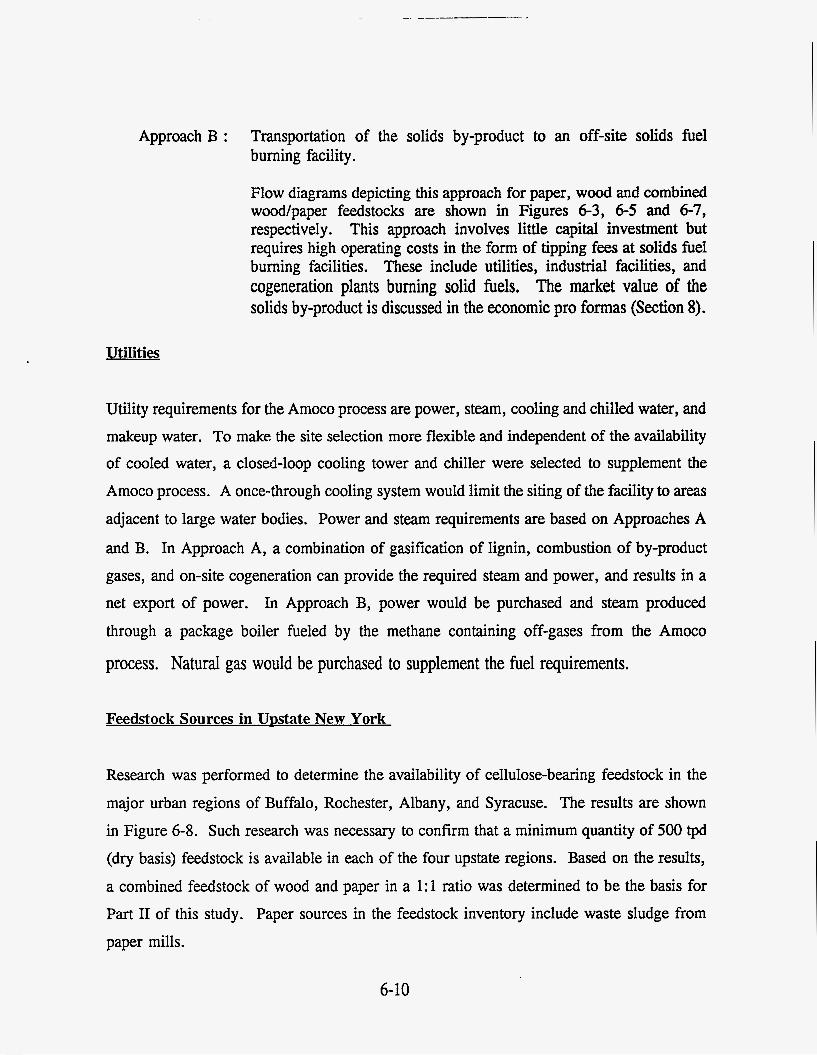
Approach B : Transportation of the solids by-product to an off-site solids fuel burning facility.
Flow diagrams depicting this approach for paper, wood and combined wood/paper feedstocks are shown in Figures 6-3, 6-5 and 6-7, respectively. This approach involves little capital investment but requires high operating costs in the form of tipping fees at solids fuel burning facilities. These include utilities, industrial facilities, and cogeneration plants burning solid fuels. The market value of the solids by-product is discussed in the economic pro formas (Section 8).
Utilities
Utility requirements for the Amoco process are power, steam, cooling and chilled water, and makeup water. To make the site selection more flexible and independent of the availability of cooled water, a closed-loop cooling tower and chiller were selected to supplement the Amoco process. A once-through cooling system would limit the siting of the facility to areas adjacent to large water bodies. Power and steam requirements are based on Approaches A
and B. In Approach A, a combination of gasification of lignin, combustion of by-product gases, and on-site cogeneration can provide the required steam and power, and results in a net export of power. In Approach B, power would be purchased and steam produced through a package boiler fueled by the methane containing off-gases from the Ammo
process. Natural gas would be purchased to supplement the fuel requirements.
Feedstock Sources in Umtate New York
Research was performed to determine the availability of cellulose-bearing feedstock in the major urban regions of Buffalo, Rochester, Albany, and Syracuse. The results are shown in Figure 6-8. Such research was necessary to confirm that a minimum quantity of 500 tpd (dry basis) feedstock is available in each of the four upstate regions. Based on the results, a combined feedstock of wood and paper in a 1:l ratio was determined to be the basis for Part I1 of this study. Paper sources in the feedstock inventory include waste sludge from paper mills.
6-10
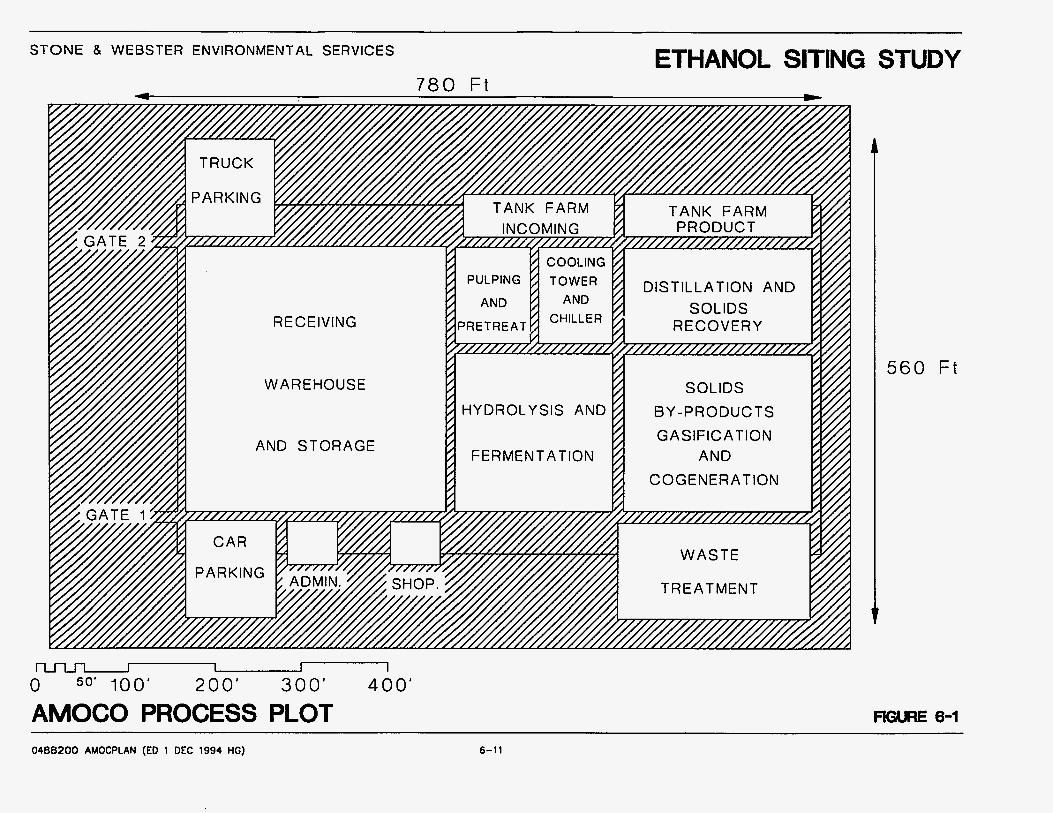
STONE & WEBSTER ENVIRONMENTAL SERVICES ETHANOL SITING STUDY
RECEIVING
WAREHOUSE
AND STORAGE
560 Ft
I 1 I 1 0 50' 100' 200' 300 ' 400' AMOCO PROCESS PLOT FKjluRE 6-1
0488200 AMOCPLAN (ED 1 DEC 1994 HG) 6-11
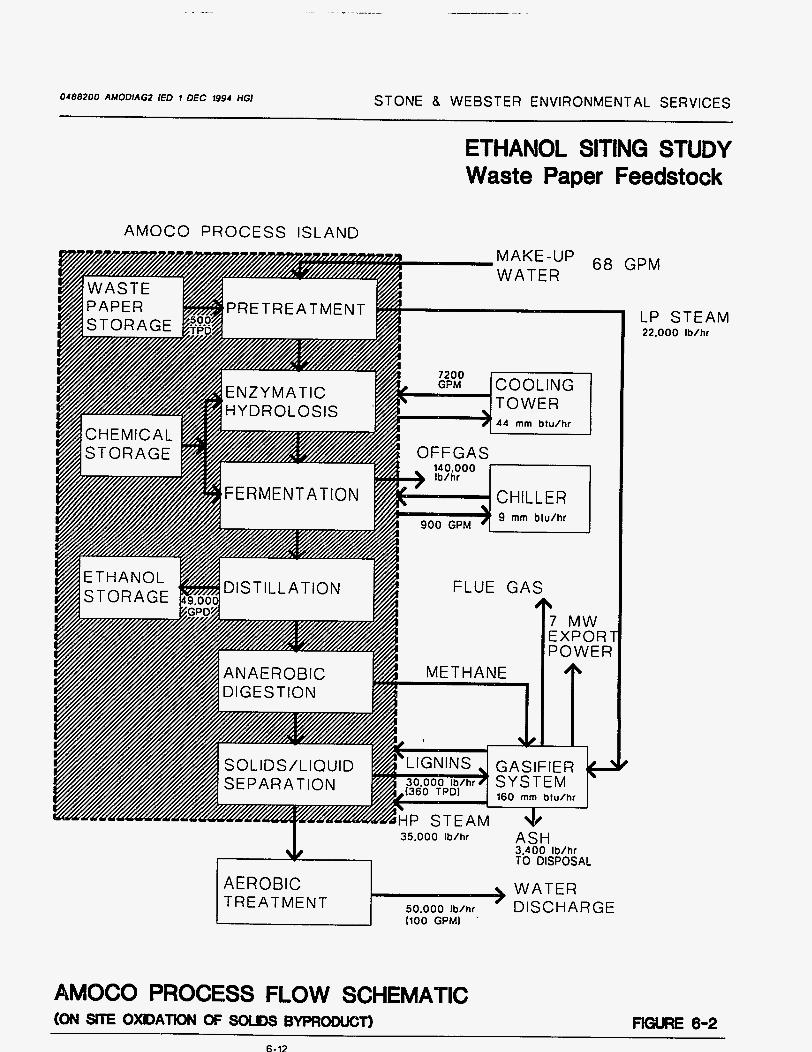
0488200 AMODlAG2 IED 7 DEC 1994 HGI STONE B WEBSTER ENVIRONMENTAL SERVICES
AEROBIC TREATMENT
ETHANOL SITING STUDY Waste Paper Feedstock
> WATER 50.000 Ib/hr DISCHARGE I100 GPMl '
AMOCO PROCESS ISLAND
AMOCO PROCESS FLOW SCHEMATIC
GPM
LP STEAM 22.000 Ib/hr

0488200 AHODIAGI (ED 1 DEC 1994 HG) STONE B WEBSTER ENVIRONMENTAL SERVICES
ETHANOL SITING STUDY Waste Paper Feedstock
AMOCO PROCESS ISLAND
LIGNINS 30.000 Ib/hr
(360 TPDI TRANSPORTED OFF SITE
AMOCO PROCESS FLOW SCHEMATIC ( W S BYPRODUCT TRANSPORTED OFF SITE)
LP STEAM 22.000 Ib/hr
FOR FREEZE PROTECTION AND OTHER INTERNAL USES
POWER 5 MW
MAKEUP WATER 35.000 Ib/hr
NATURAL G A S 17.5 mm btu/hr
FIGURE 6-3
6-13
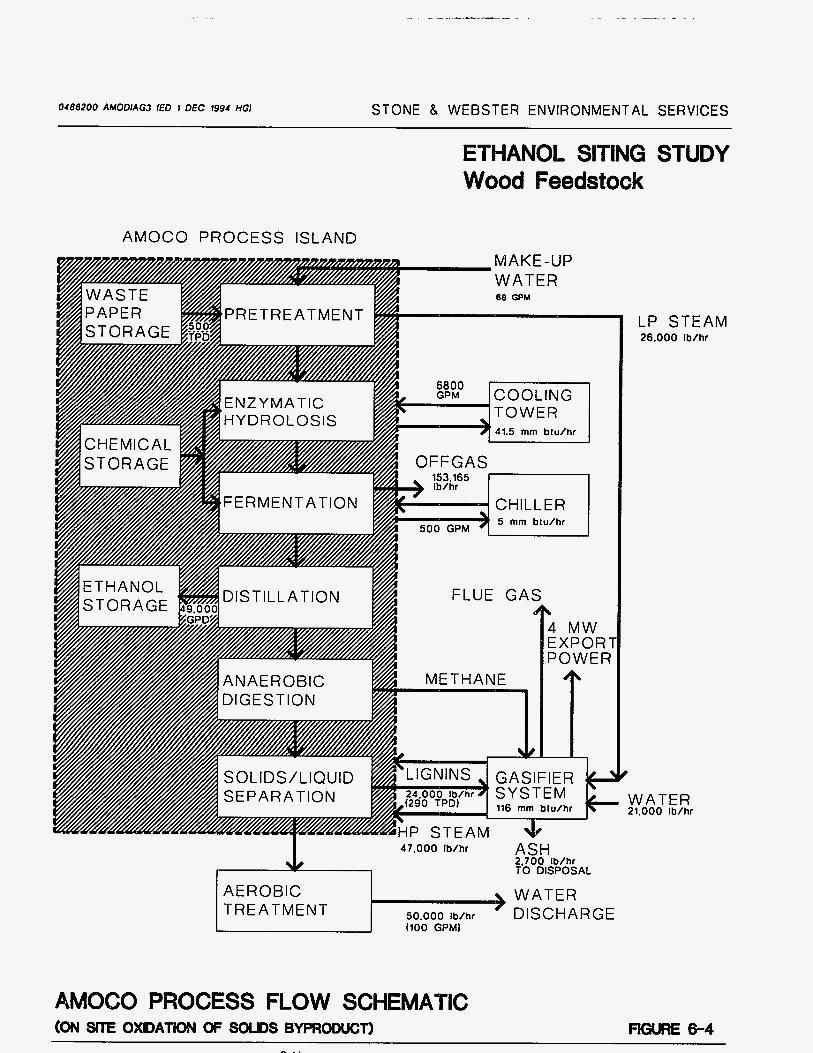
0488200 AMODIAG3 [ED 1 DEC 1994 HGJ STONE 8 WEBSTER ENVIRONMENTAL SERVICES
ETHANOL SITING STUDY Wood Feedstock
AMOCO PROCESS ISLAND
LP STEAM 26.000 Ib/hr
I 47.000 Ib/hr ASH 2.700 Ib/hr TO DISPOSAL
WATER - 50.000 Ib/hr DISCHARGE I100 GPM)
AEROBIC TREATMENT
AMOCO PROCESS FLOW SCHEMATIC (ON SITE OXDATKBl OF SWDS BYPROMICT)
WATER 21.000 Ib/hr
FlGuRE 6-4
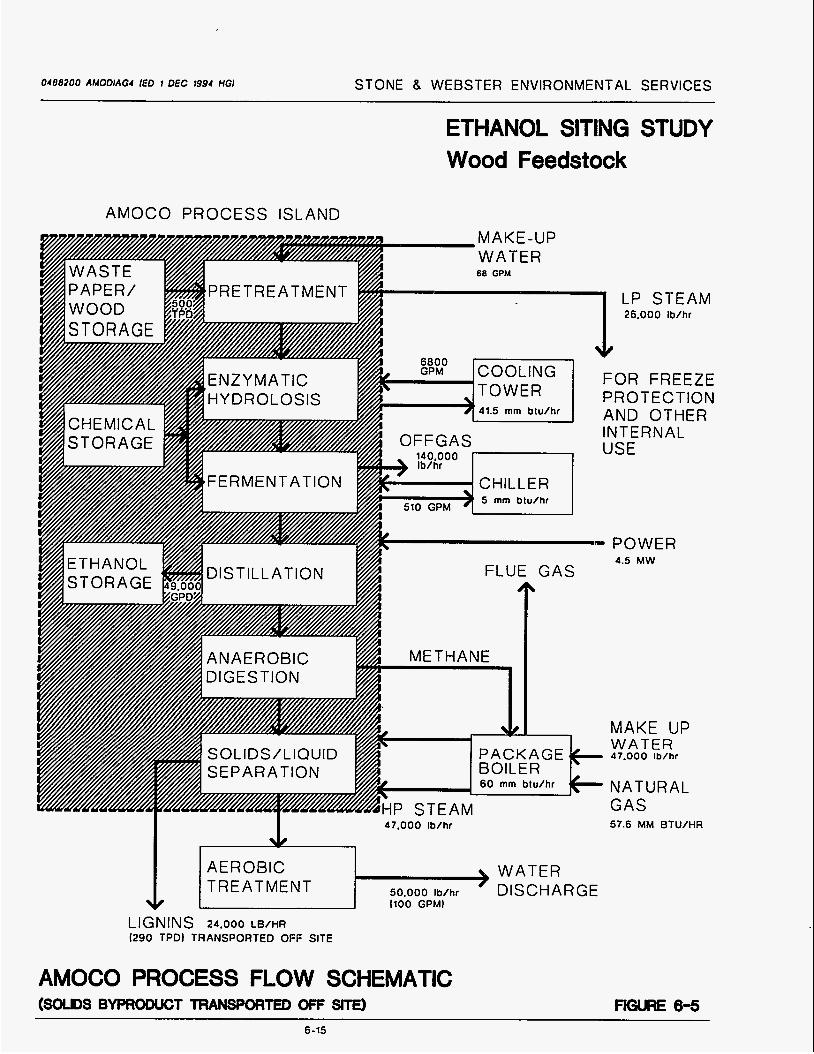
0488200 AMODlAG4 IED I DEC 1994 HGI STONE a WEBSTER ENVIRONMENTAL SERVICES
ETHANOL SITING STUDY Wood Feedstock
AMOCO PROCESS ISLAND
47.000 Ib/hr 57.6 MM BTU/HR
WATER TREATMENT 50.000 Ib/hr DISCHARGE
LIGNINS 24,000 LB/HR (290 TPD) TRANSPORTED OFF SITE
AMOCO PROCESS FLOW SCHEMATIC (SOUDS BM#ODUCT TRANSPORTED OFF §JlE)
6-15
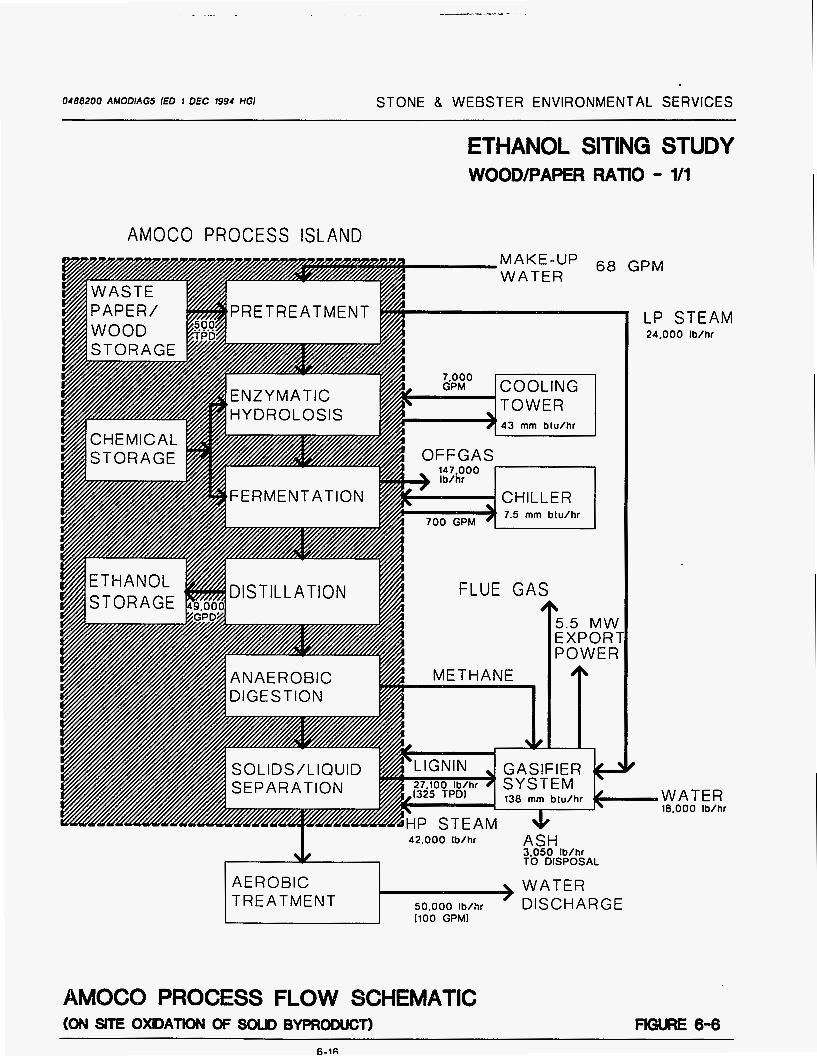
0488200 AUODlAG5 [ED 1 DEC 1994 HGI STONE 8 WEBSTER ENVIRONMENTAL SERVICES
ETHANOL SITING STUDY WOODPAPER RATIO - lA
AMOCO PROCESS ISLAND GPM
LP STEAM 24.000 Ib/hr
b
5.5 MW E X P O R l POWER
-WATER 18.000 Ib/hr
4 2 . 0 0 0 Ib/hr ASH 3.050 Ib/hr TO DISPOSAL
WATER DISCHARGE 50.000 Ib/hr
AEROBIC TREATMENT
AMOCO PROCESS FLOW SCHEMATIC (ON SITE 0XDATK)N OF SOLD B9(pRoDucf) FIGLIRE 6-6
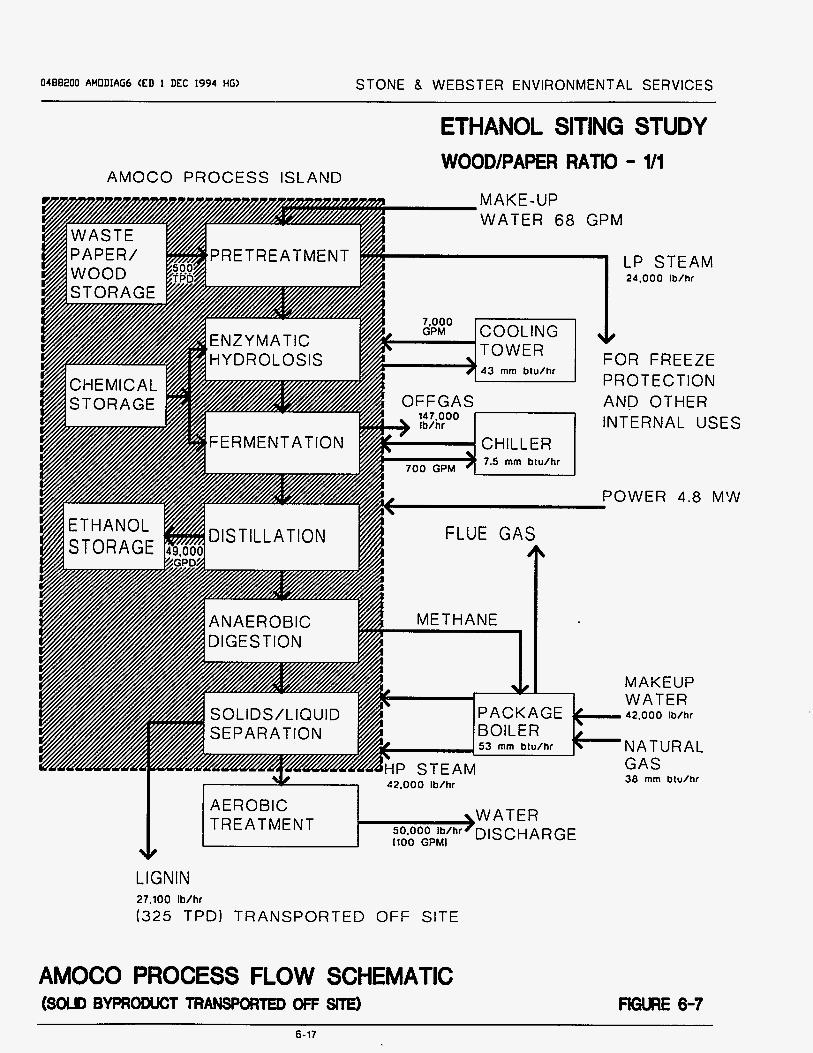
04ee200 AHODIAG~ (ED 1 DEC 199.1 HG) STONE 8 WEBSTER ENVIRONMENTAL SERVICES
)WATER AEROBIC TREATMENT 50.000 Ib/hr DISCHARGE
AMOCO PROCESS ISLAND
ETHANOL SITING STUDY WOODPAPER RAm - l/l
AMOCO PROCESS FLOW SCHEMATIC (sou> BYPFIODUCT TRANSPORTED OFF ME)
I
LP STEA ,M 24.000 Ib/hr
FOR FREEZE PROTECTION AND OTHER INTERNAL USES
POWER 4.8 MVV
MAKEUP WATER 42.000 Ib/hr
NATURA1 GAS 38 mm btu/hr
FlGllRE 6-7 6-17
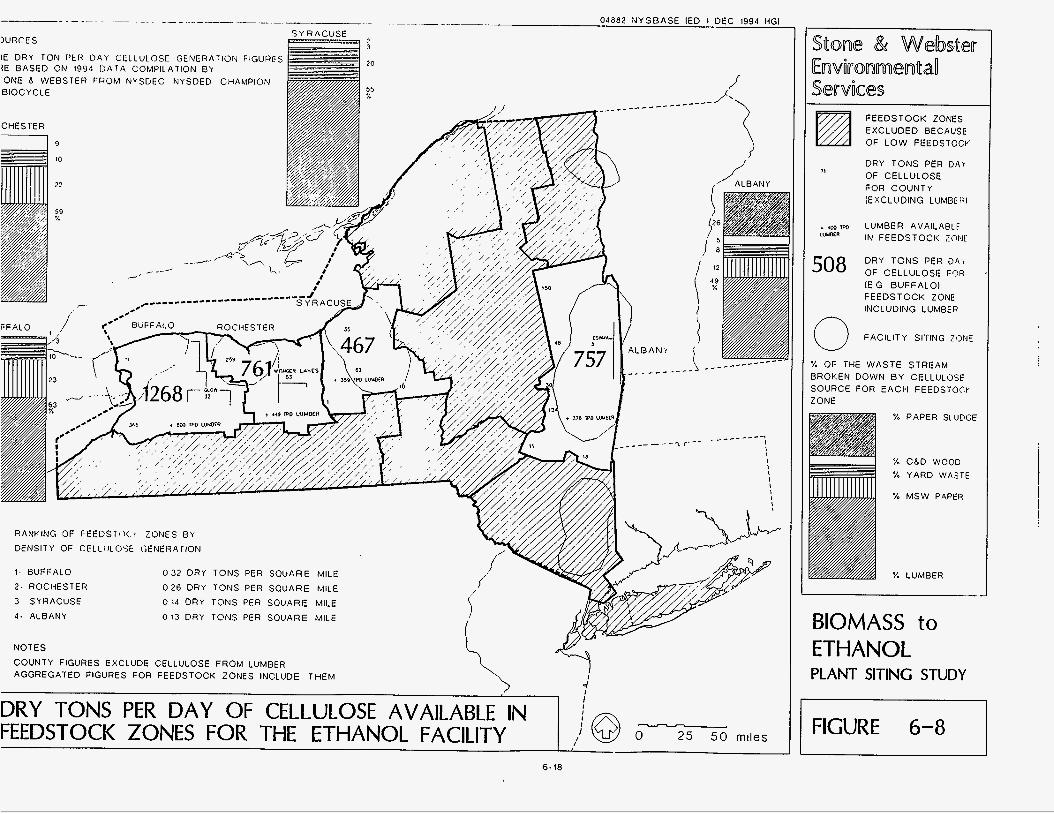
- ~. .- . - . . - - ._ - - 04882 NYSBASE E D I DEC 1994 HGI
IURCES SYRACUSE
BIOCYCLE
CHESTER
NOTES COUNTY FIGURES EXCLUDE CELLULOSE FROM LUMBER AGGREGATED FIGURES FOR FEEDSTOCK ZONES INCLUDE THEM i ?
k / I
FEEDSTOCK ZONES EXCLUDED BECAUSE OF LOW FEEDSTOCk
DRY TONS PER DAt OF CELLULOSE (EXCLUDING FOR COUNTY LUMPE1)I
I ,
+ 400 TFC LUMBER AVAILABLF WUDCR IN FEEDSTOCK Z(7NE
DRY TONS PER 0 4 ) 508 OF CELLULOSE F 3 R ( E G BUFFALO) FEEDSTOCK ZONE INCLUDING LUMBER
FACILITY SITING ZONE 0 i'e OF THE WASTE STREAM 3ROKEN DOWN B Y CELLULOSE SOURCE FOR EACH FEEDST0C.r !ONE
% PAPER SLl.J@GE
c m WOOD % YARD W A 3 T E
% MSW PAPER
% LUMBER
BIOMASS to ETHANOL PLANT SITING STUDY
I
DRY TONS PER DAY OF CELLULOSE AVAILABLE IN FEEDSTOCK ZONES FOR THE ETHANOL FACILITY -1 @ 0 -25 5 0 miles 1 -6-8
6-18
See Attachments 2-1 through 2-3 in the Appendix for additional details about facility requirements.
SITE SCREENING
Introduction
The siting study for an Amoco biomass-to-ethanol conversion facility in upstate New York
identifies regions within the State that could support a facility that processes a minimum of 500 dry tpd of feedstock. The primary method for evaluating whether a region could support an ethanol facility required the identification of feedstock sources, potential by-product users, and available cost-effective transportation corridors, as well as location near densely populated urban centers. The study for New York City (Part I) differed from this study in that it involved one populated region having a government-controlled feedstock source (paper) rather than several regions with diverse feedstock sources. Thus, the upstate New York study consisted of three steps: identifying potential regions, quantifying feedstock, and locating specific sites.
Identification of Repions
For a region to support a minimum 50-tpd Amoco biomass-to-ethanol facility, logistical concerns had to be evaluated; e.g., location of feedstock sources, proximity to solid waste-
burning facilities, cost-effective transportation corridors, and proximity to urban centers and densely populated areas. At the early stage of the study, the feedstock source considered
was sludge from paper mills, and the solids-burning facilities for the lignin by-product were considered to be waste-to-energy plants. Paper mills were targeted because of their large
number in upstate New York, as well as for their reliability as sources of waste paper sludge. The location of paper mills and waste-burning facilities is shown in Figure 6-9.
Zones that have reasonable access to both paper mill sludge and solids-burning facilities were
6-19
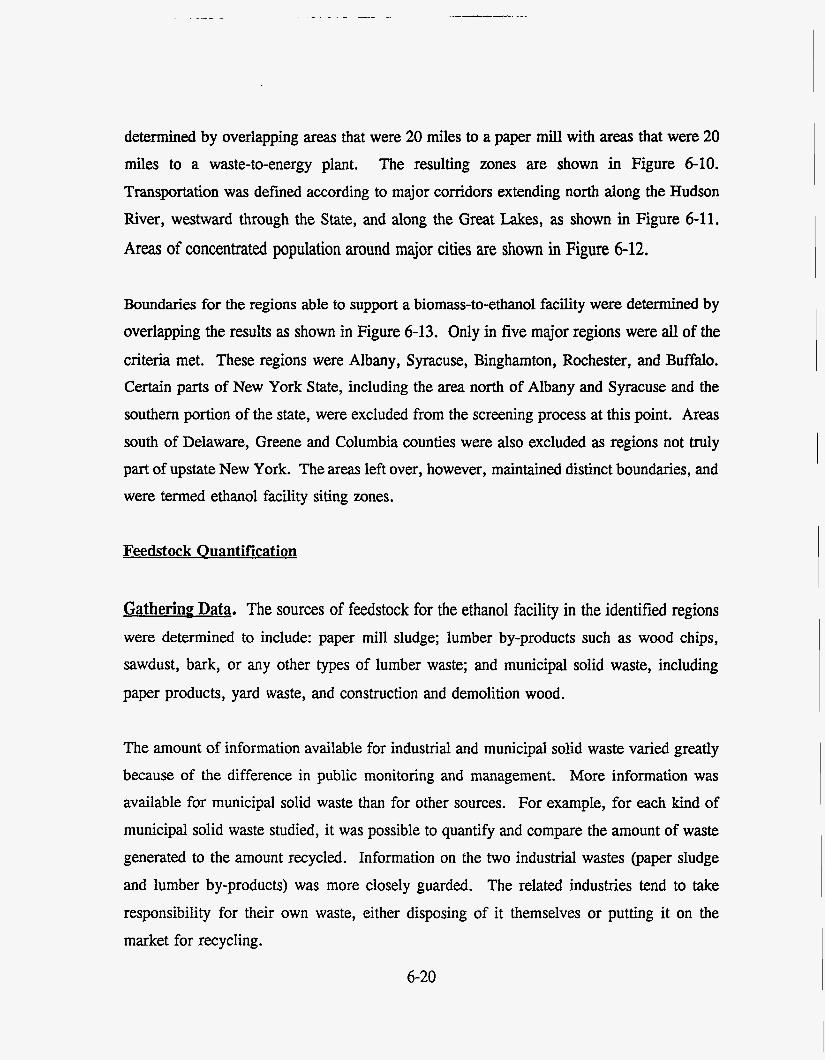
determined by overlapping areas that were 20 miles to a paper mill with areas that were 20 miles to a waste-to-energy plant. The resulting zones are shown in Figure 6-10. Transportation was defined according to major corridors extending north along the Hudson
River, westward through the State, and along the Great Lakes, as shown in Figure 6-11.
Areas of concentrated population around major cities are shown in Figure 6-12.
Boundaries for the regions able to support a biomass-to-ethanol facility were determined by
overlapping the results as shown in Figure 6-13. Only in five major regions were al l of the criteria met. These regions were Albany, Syracuse, Binghamton, Rochester, and Buffalo. Certain parts of New York State, including the area north of Albany and Syracuse and the
southern portion of the state, were excluded from the screening process at this point. Areas
south of Delaware, Greene and Columbia counties were also excluded as regions not truly part of upstate New York. The areas left over, however, maintained distinct boundaries, and were termed ethanol facility siting zones.
Feedstock Ouantification
Gathering Data. The sources of feedstock for the ethanol facility in the identified regions were determined to include: paper mill sludge; lumber by-products such as wood chips, sawdust, bark, or any other types of lumber waste; and municipal solid waste, including
paper products, yard waste, and construction and demolition wood.
The amount of information available for industrial and municipal solid waste varied greatly because of the difference in public monitoring and management. More information was available for municipal solid waste than for other sources. For example, for each kind of
municipal solid waste studied, it was possible to quantify and compare the amount of waste generated to the amount recycled. Information on the two industrial wastes (paper sludge
and lumber by-products) was more closely guarded. The related industries tend to take responsibility for their own waste, either disposing of it themselves or putting it on the
market for recycling.
6-20
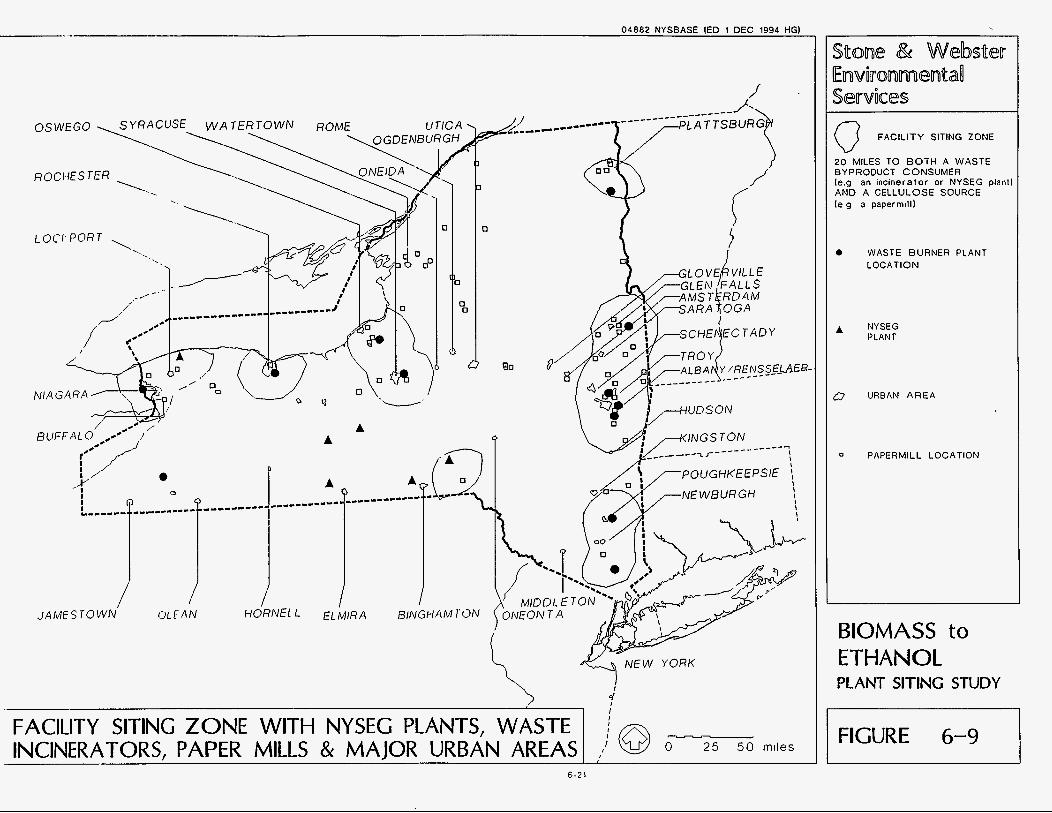
04882 NYSBASE [ED 1 DEC 1994 HGI . .-
0
c1
0
* c:
,/f
I
0
BO
FACILITY SITING ZONE
2 0 MILES TO BOTH A WASTE BYPRODUCT CONSUMER 1e.g an incinerator or NYSEG plant) AND A CELLULOSE SOURCE l e g a papermill1
A
c3
0
WASTE BURNER PLANT LOCATION
NYSEG PLANT
URBAN AREA
PAPERMILL LOCATION
BIOMASS to ETHANOL PLANT SITING STUDY
FIGURE 6-9
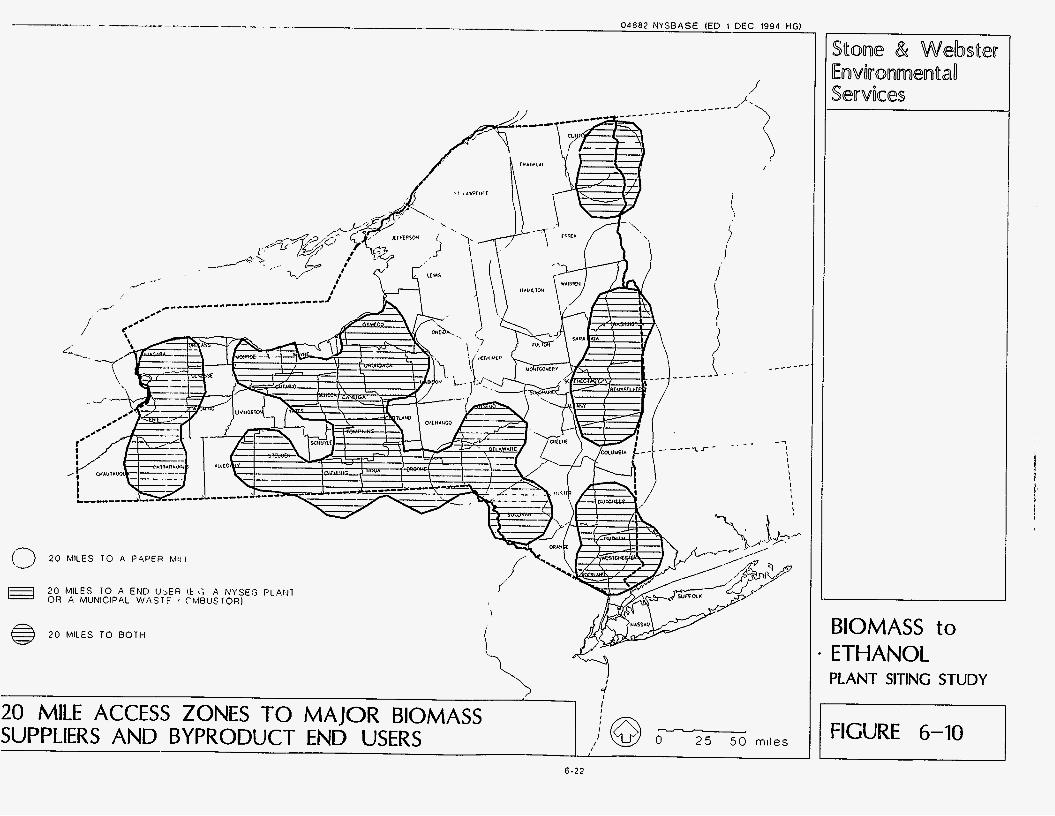
.- --_--_____ 04882 NYSBASE IED 1 DEC 1994 HGI
20 MILE ACCESS ZONES TO MAJOR BIOMASS SUPPLIERS AND BYPRODUCT END USERS
/J
J ,,' @ 2 5 5 0 mlles
- - I-. _ _ _ - - -
(3 20 MILES TO A PAPER MILL
20 MILES TO A END UbER It I; A NYSEG PLANT OR A MUNICIPAL WASTF 1 CIMRUSTOR)
@ 20 MILES TO BOTH
Stone & Websteu Eu-ilMiroonme~uan Services
BIOMASS to ETHANOL PLANT SITING STUDY
FIGURE 6-10
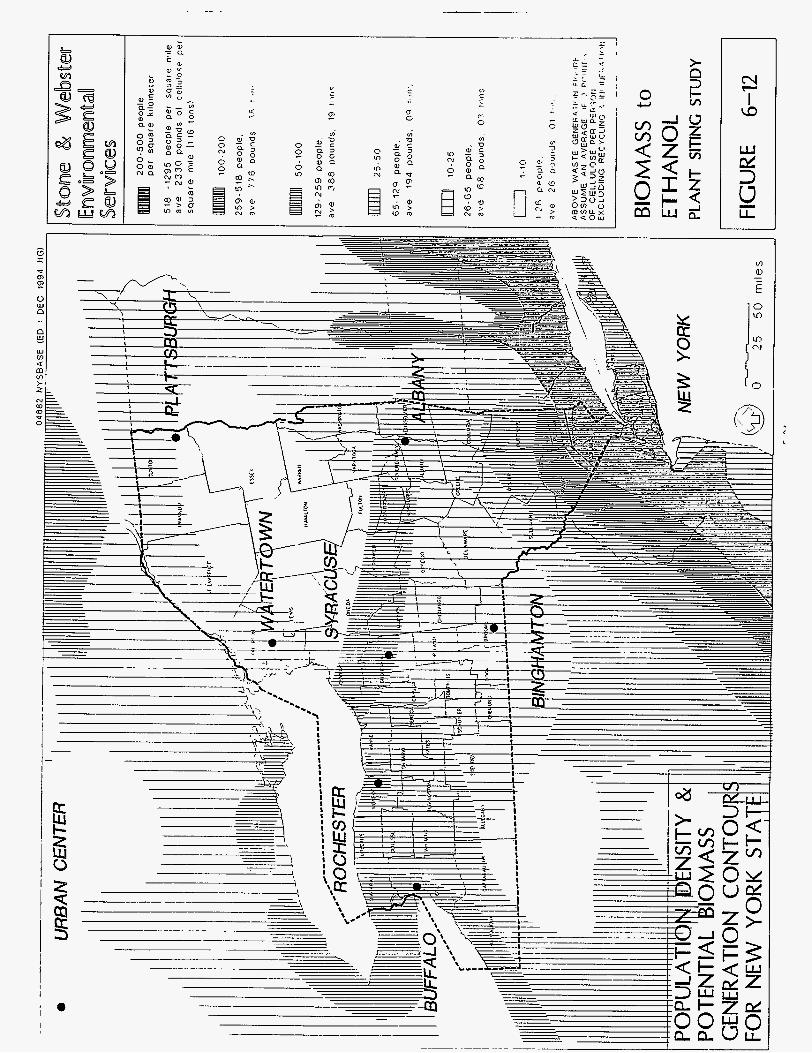
I rr
i ' I
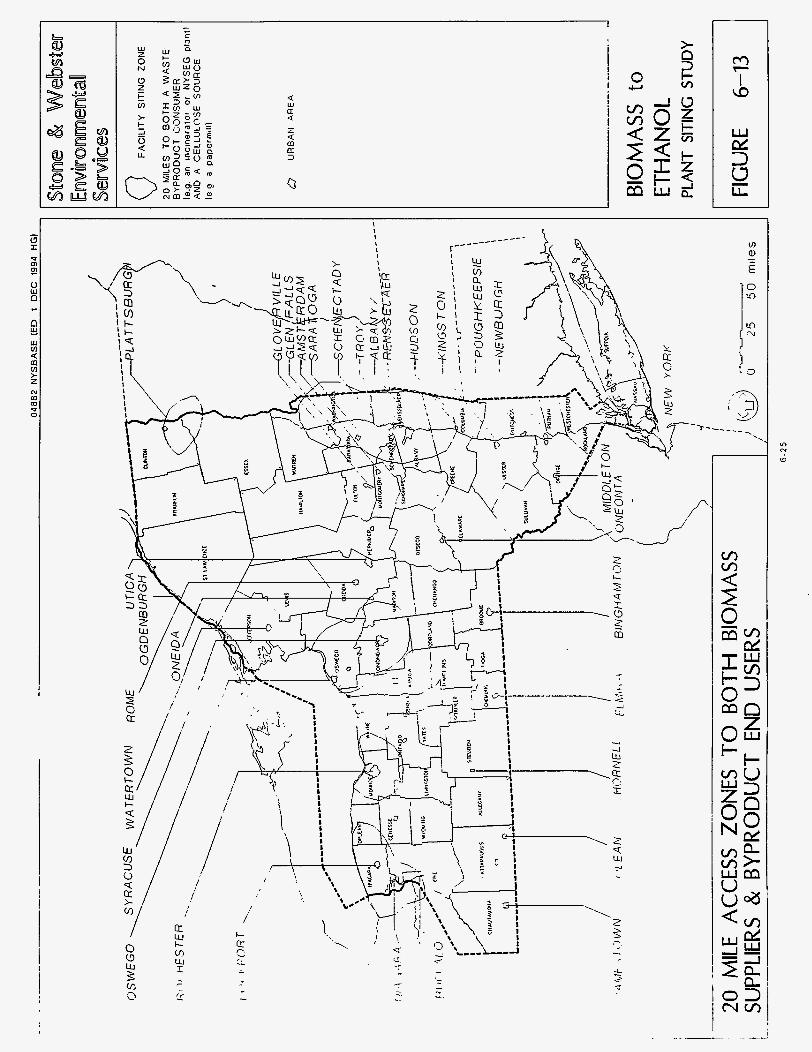
Q:
Q
z 4
cz 3
W a
m
0
- c rz
2 2 u ii

- . ._ ___ -~ -__- 04882 NYSBASE IED 1 DEC 1994 HGI
GENERALIZED FEEDSTOCk ZONES BY MAJOR CIHBAN G t N I k H S
1 LONG ISLAND lexcludedl 6 WATERTOWN 2 NEW YORK C I T Y lexcludedl 7 BINGHAMTON 3 POUGHKEEPSIE (excludedl 8 SYRACUSE A ALBANY 9 ROCHESTER 9 PLAT7SRI)RGI-I 9 BUFFALO
i
I
I I I
GENERA( I C E D FEEDC 1- k ZONE
BIOMASS to ETHANOL PLANT SITING STUDY
I -1 '
1 ,
-- - -- --__ ETHANOL FACILITY SITINGZONES t~
I - (\u\) OT-T= miles --- GENERALIZED FEEDSTOCK ZONES --
6 26
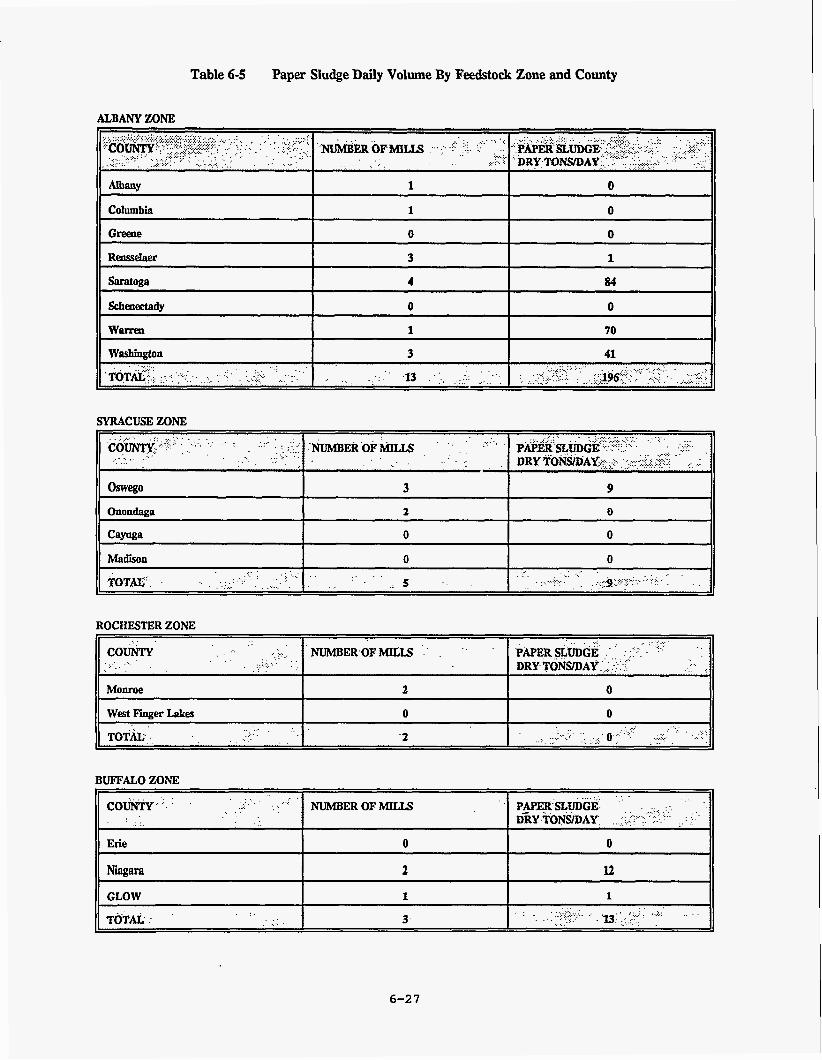
Table 6 5 Paper Sludge Dairy Volume By Feedstock Zone and County
Columbia
Greene
Rensselaer
Sarataga
schenectady
1 0
0 0
3 1
4 84
0 0
SYRACUSE ZONE
West Finger Lakes . . . . . . . . . . , . . . . . . . TOT&.,:. . _ .
ROCHESTER ZONE
~~ ~~ ~~ ~ ~~ ~ ~ ~~~~
0 0
'2 :
... . . . ... . . . . . . . . . . . . . . . . ... . .... ... ...... . . . . . . . . .... ..... .... .-. -, o-.:.-.'"- .:.
. . . . . . ... . -. : ..,. i . . . . A
IUFFALO ZONE . . . . . . . . ... . . . . . . . .
... co*;. I. : . . . . .
Erie
Ningara
GLOW
NUMBER OF MILLS
0
2
1
3
6-27
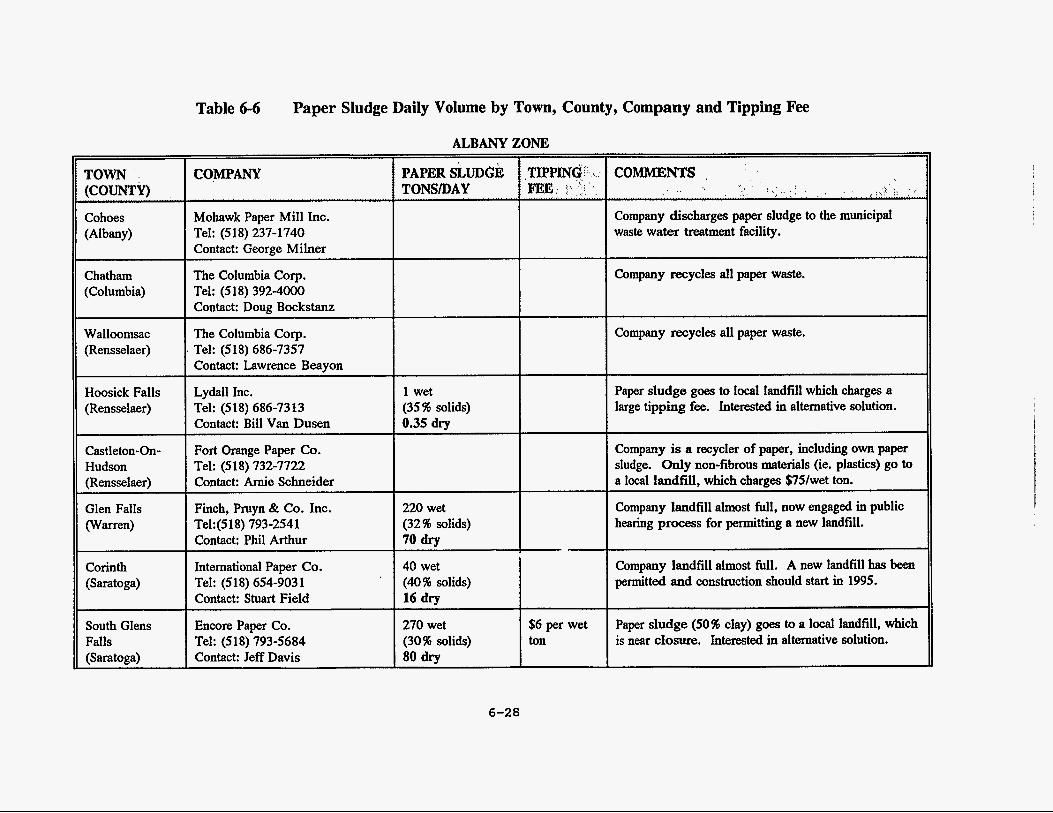
TOWN KOUNTM
~~~~
Lydall Inc. Tel: (518) 686-7313 Contact: Bill Van Dusen
Fort Orange Paper Co. Tel: (518) 732-7722 Contact: Arnie Schneider
Finch, Pruyn & Co. Inc. Tel:(518) 793-2541 Contact: Phil Arthur
, International Paper Co. I Tel: (518) 654-903 1 1 Contact: Stuart Field
Encore Paper Co. Tel: (518) 793-5684 Contact: Jeff Davis
'
,
Chatham (Columbia)
1 wet (35% solids) 0.35 dry
220 wet (32% solids) 70 dry
40 wet (40% solids) 16 dry
270 wet (30% solids)
-
80 dry
Walloomsac (Rensselaer)
Hoosick Falls (Rensselaer)
Castleton-On- Hudson (Rensselaer)
Glen Falls (Warren)
Corinth (Saratoga)
South Glens Falls (Saratoga)
Table 6-6 Paper Sludge Daily Volume by Town, County, Company and Tipping Fee
ALBANY
COMPANY PAPER !SLUDGE I TONS/DAY
Mohawk Paper Mill Inc. Tel: (518) 237-1740 Contact: George Milner
The Columbia Corp. Tel: (518) 392-4000 Contact: Doug Bockstanz
The Columbia Corp. . Tel: (518) 686-7357
Contact: Lawrence Beayon
--
$6 per wet ton
, .
, , , ..;:::::, ' . . . . . . , .
coMMEm
Company discharges paper sludge to the municipal waste water treatment facility.
.. . . , . . , , . . . .. .. , '.. . ... , ,. , , ,
Company recycles all paper waste.
Company recycles all paper waste.
Paper sludge goes to local landfill which charges a large tipping fee. Interested in alternative solution.
Company is a recycler of paper, including own paper sludge. Only non-fibrous materials (ie. plastics) go to a local landfill, which charges $75/wet ton.
Company landfill almost full, now engaged in public hearing process for permitting a new landfill.
~
Company landfill almost full. A new landfill has been permitted and construction should start in 1995.
~ ~~
Paper sludge (50% clay) goes to a local landfill, which is near closure. Interested in alternative solution.
6-28
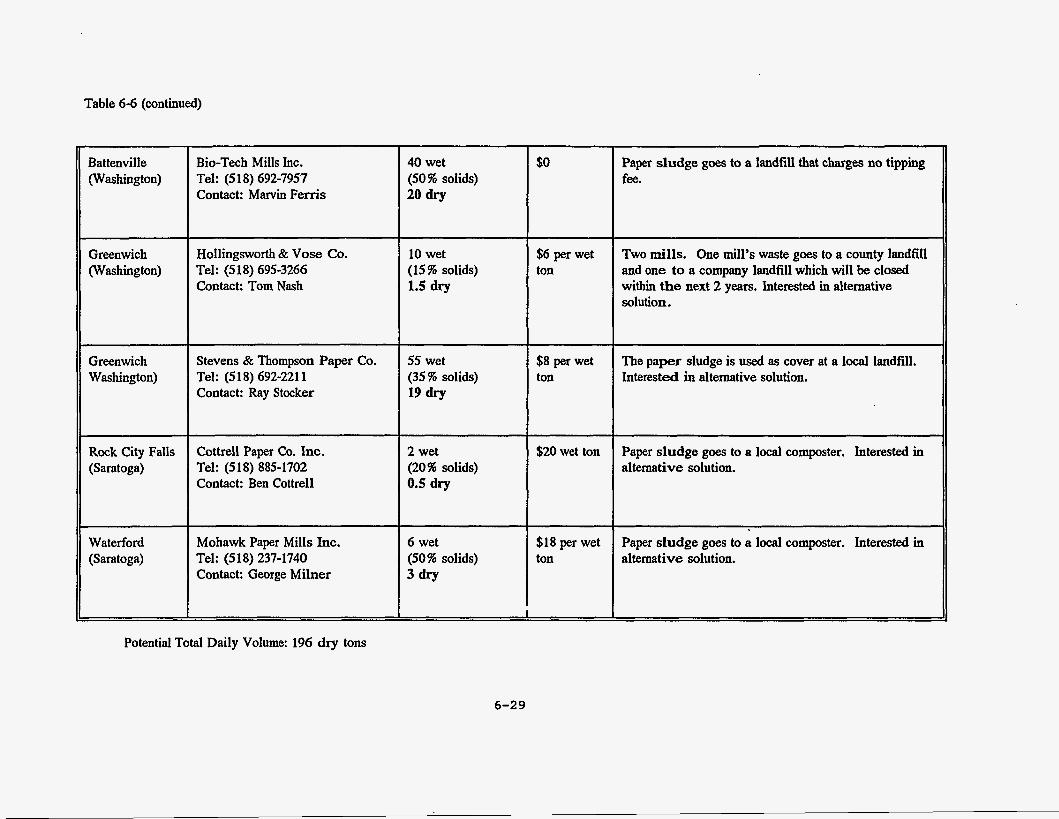
Table 6-6 (continued)
Battenville Bio-Tech Mills Inc. 40 wet (Washington) Tel: (5 18) 692-7957 (50% solids)
Contact: Marvin Ferris 20 dry
$0
~~~
Greenwich (Washington)
10 wet (15% solids) 1.5 dry
Hollingsworth & Vose Co. Tel: (518) 695-3266 Contact: Tom Nash
~~~~
$6 per wet ton
Stevens & Thompson Paper Co. Tel: (518) 692-221 1 Contact: Ray Stocker
Greenwich Washington)
55 wet (35% solids) 19 dry
Rock City Falls (Saratoga)
$8 per wet ton
Cottrell Paper Co. inc. Tel: (518) 885-1702 Contact: Ben Cottrell
2 wet (20% solids) 0.5 dry
$20 wet ton
Water ford (Saratoga)
Mohawk Paper Mills Inc. Tel: (518) 237-1740 Contact: George Milner
6 wet (50% solids) 3 dry
$18 per wet ton
Paper sludge goes to a landfill that charges no tipping fee.
Two mills. One mill’s waste goes to a county landfill and one to a company landfill which will be closed within the next 2 years. Interested in alternative solution.
The paper sludge is used as cover at a local landfill. Interested in alternative solution.
Paper sludge goes to a local composter. Interested in alternative solution.
Paper sludge goes to a local composter. Interested in alternative solution.
Potential Total Daily Volume: 196 dry tons
6-29
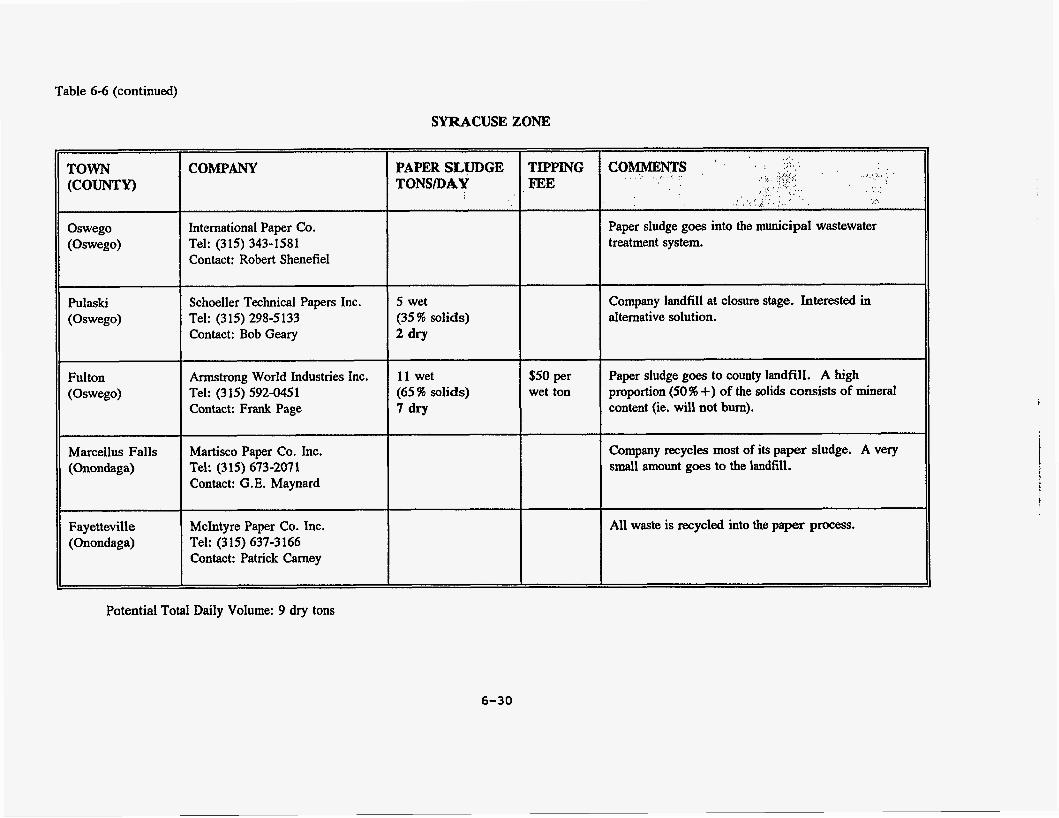
Table 6-6 (continued)
PAPER SLUDGE TONSDAY
(Oswego)
Fulton (Oswego)
Marcellus Falls (Onondaga)
TIPPING FEE
Fayetteville (Onondaga)
11 wet (65% solids)
COMPANY
$50 per wet ton
International Paper Co. Tel: (315) 343-1581 Contact: Robert Shenefiel
~
Schoeller Technical Papers Inc. Tel: (315) 298-5133 Contact: Bob G a r y
Annstrong World Industries Inc. Tel: (315) 592-0451 Contact: Frank Page
Martisco Paper Co. Inc. Tel: (315) 673-2071 Contact: G.E. Maynard
Mchtyre Paper Co. Inc. Tel: (315) 637-3166 Contact: Patrick Carney
II
Potential Total Daily Volume: 9 dry tons
5 wet (35% solids) 2 dry
Paper sludge goes into the municipal wastewater treatment system.
Company landfill at closure stage. Interested in alternative solution.
Paper sludge goes to county landfill. A high proportion (50% +) of the solids consists of mineral content (ie. will not bum).
Company recycles most of its paper sludge. A very small amount goes to the landfill.
All waste is recycled into the paper process.
6-30
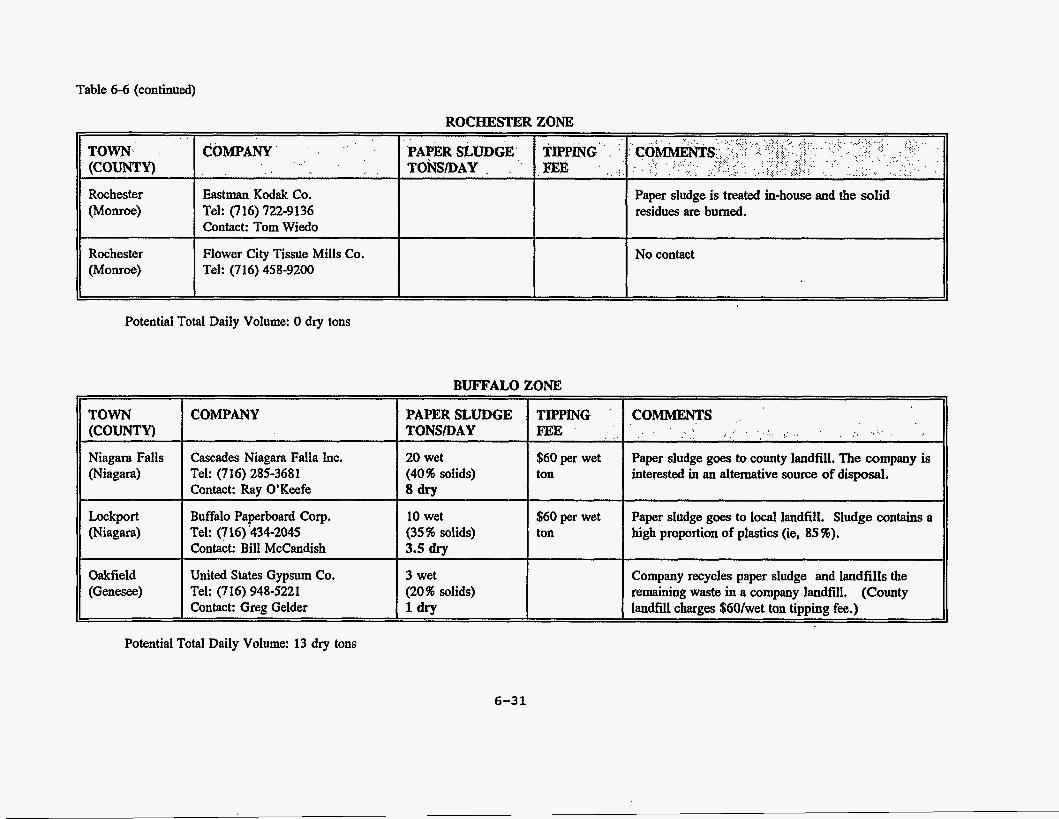
Table 6-6 (continued)
PAPERSLUDGE TONSDAY
ROCHE!STER ZONE
Rochester Paper sludge is treated in-house and the solid residues are burned.
Tel: (716) 458-9200
~~ ~~ ~~~ ~ ~~
. .,:; . . . TIPPING ' COMMENTS , .
$60 per wet ton
.. , . .. , ..(. ' ... , , .:. ,, . . : "
. , FEE ; , : , . . . .
Paper sludge goes to county landfill. The company is interested in an alternative source of disposal.
Potential Total Daily Volume: 0 dry tons
Niagara Falls (Niagara)
Lockport (Niagara)
BUFFALO ZONE
Cascades Niagara Falla Inc. Tel: (716) 285-3681 Contact: Ray O'Keefe
Buffalo Paperboard Corp. Tel: (716) 434-2045 Contact: Bill McCandish
TOWN I COMPANY (COUNTY)
$60 per wet ton
Paper sludge goes to local landfill. Sludge contains a high proportion of plastics (ie, 85 5%).
Oakfield (Genesee)
20 wet (40% solids) a drv
United States Gypsum Co. Tel: (716) 948-5221 Contact: Greg Gelder
10 wet (35% solids) 3.5 drv
3 wet (20% solids) 1 dry I landfill charges $60/wet t& tipping fee.)
~
Company recycles paper sludge and landfills the I remaining waste in a company landfill. (County
Potential Total Daily Volume: 13 dry tons
6-31
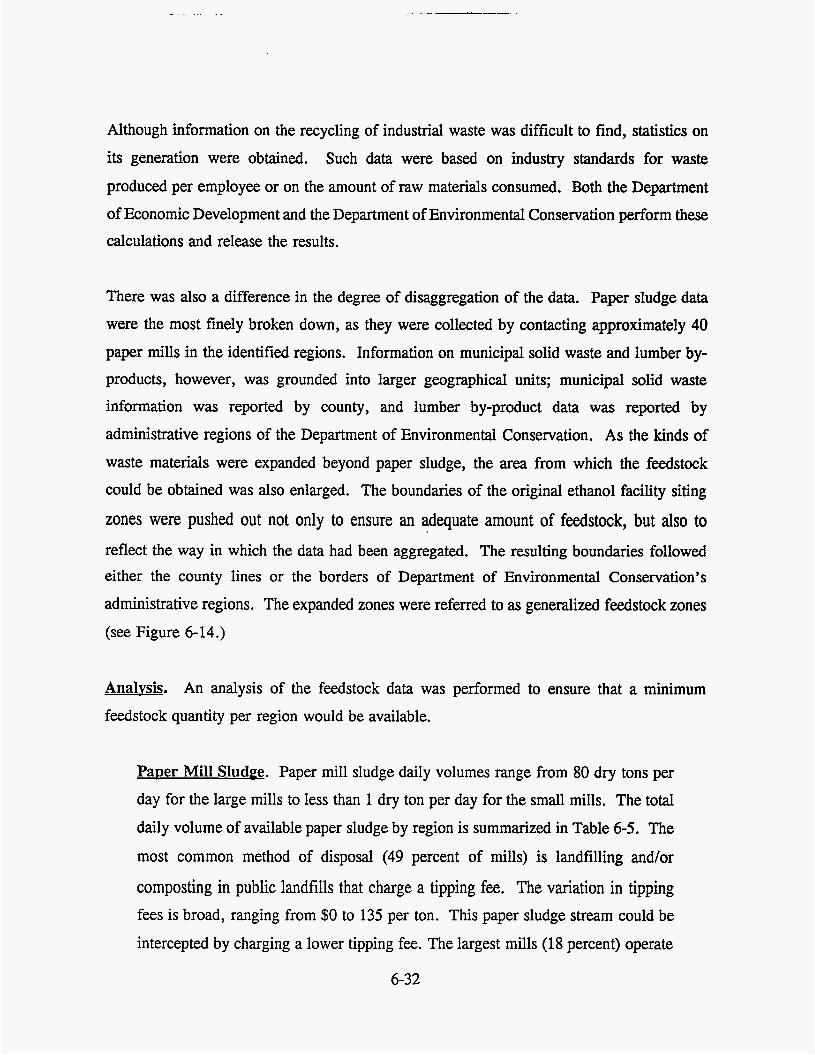
Although information on the recycling of industrial waste was difficult to find, statistics on its generation were obtained. Such data were based on industry standards for waste
produced per employee or on the amount of raw materials consumed. Both the Department of Economic Development and the Department of Environmental Conservation perform these calculations and release the results.
There was also a difference in the degree of disaggregation of the data. Paper sludge data were the most finely broken down, as they were collected by contacting approximately 40 paper mills in the identified regions. Information on municipal solid waste and lumber by- products, however, was grounded into larger geographical units; municipal solid waste information was reported by county, and lumber by-product data was reported by administrative regions of the Department of Environmental Conservation. As the kinds of waste materials were expanded beyond paper sludge, the area from which the feedstock could be obtained was also enlarged. The boundaries of the original ethanol facility siting
zones were pushed out not only to ensure an adequate amount of feedstock, but also to reflect the way in which the data had been aggregated. The resulting boundaries followed either the county lines or the borders of Department of Environmental Conservation’s administrative regions. The expanded zones were referred to as generalized feedstock zones (see Figure 6-14.)
Analvsis. An analysis of the feedstock data was performed to ensure that a minimum feedstock quantity per region would be available.
PaDer Mill Sludpe. Paper mill sludge daily volumes range from 80 dry tons per day for the large mills to less than 1 dry ton per day for the small mills. The total daily volume of available paper sludge by region is summarized in Table 6-5. The
most common method of disposal (49 percent of mills) is landfilling and/or
composting in public landfills that charge a tipping fee. The variation in tipping fees is broad, ranging from $0 to 135 per ton. This paper sludge stream could be intercepted by charging a lower tipping fee. The largest mills (18 percent) operate
6-32

private landfills, some of which are close to closure. Some of the private landfill waste stream could also be captured by providing a low-cost alternative to
developing new private landfills. A significant proportion (20 percent) of mills recycle their paper waste, 8 percent discharge paper sludge into local sewer
treatment facilities, and one mill incinerates paper wastes. This waste stream is assumed to be unavailable as potential feedstock. A detailed breakdown of paper mill sludge volumes by mill, method of disposal, and tipping fee is shown in Table 6-6.
MuniciDal and Lumber Wastes. A comparison was made of waste generated to the amount presently recycled. A low level of recycling indicated room for market expansion. To measure whether the current level of recycling was high or low, it was compared to national average levels of recycling. Figure 6-15 shows an example of this kind of analysis. Tables 6-7 and 6-8 show the results when local
recycling of paper and yard wastes are compared to recycling on a national basis.
In some instances, the amount being recycled locally was less than the national average, thereby indicating potential for growth. In other cases, the amount being
recycled was greater than the national ‘average, thereby indicating a glut of recycling at present and a possible decline in the future. A glut could result from an increase in public awareness about recycling or from the import of wastes from outside the region by local recycling facilities. Whatever the cause of a glut, it is not likely that a share of the paper recycling market could be captured there.
The estimate for growth in recycling is expressed as a positive figure in the tables, and the estimate for decline in expressed as a negative one. For example, Table 6-7 shows that Onondaga County (Syracuse) is recycling 56 percent of the paper
generated, a rate 13 percent greater than the national average of 43 percent. It is estimated that the Syracuse area market is glutted by 13 percent and may decline
in the future to reach an amount closer to the national average. The amount
6-33

04882 NYSBASE (ED 1 DEC 1994 HGI M88*RECYCLE8ARCHART
Potential Recycling Rate , , . . ..... , ' , .. .. (. , . ( (
Existing Recycling Rate
100% Total Paper Generated
31% Paper Currently Recycled
New York State Average for Paper
Recycling
I mational Average for Paper Recycling
EXAMPLE OF EXISTING RECYCLING RATE vs POTENTIAL RATE
100% Total Paper Generated
43% Paper Currently Recycled
BIOMASS to ETHANOL PLANT SITING STUDY
Figure 6-1 5
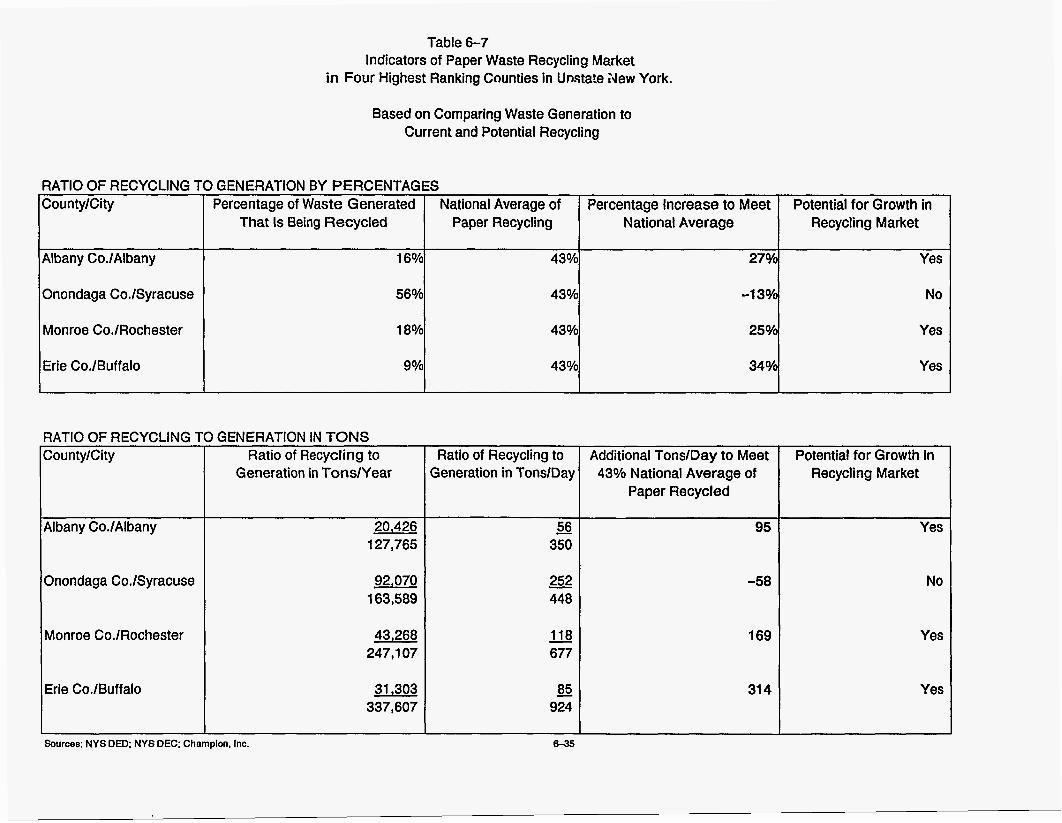
Table 6-7 Indicators of Paper Waste Recycling Market
in Four Highest Ranking Counties in Unsta!e New York.
County/City
Albany Co./Albany
Onondaga CoJSyracuse
Monroe Co./Rochester
Erie Co./Buffalo
Based on Comparing Waste Generation to Current and Potential Recycling
Percentage of Waste Generated National Average of Percentage Increase to Meet Potential for Growth in That Is Being Recycled Paper Recycling National Average Recycling Market
16% 43% 27% Yes
56% 43% -1 3% No
18% 43% 25% Yes
9% 43% 34% Yes
Ratio of Recycling to Generation in TonslDay
- 56 350
RATIO OF RECYCLING 1 Additional Tons/Day to Meet 43% National Average of
Paper Recycled
95 Albany CoJAlbany
Onondaga Co./Syracuse
Monroe Co./Rochester
Erie CoJBuffalo
1 GENERATION IN TONS Ratio of Recycling to
Generation in Tonslyear
20,426 127,765
92,070 163,589
43,268 247,107
31,303 337,607
252 448 -
- 118 677
- 85 924
-58
169
31 4
Sourcee: NYS DED; NYS DEC; Champion, Inc. 6-35
Potential for Growth in Recycling Market
Yes
No
Yes
Yes
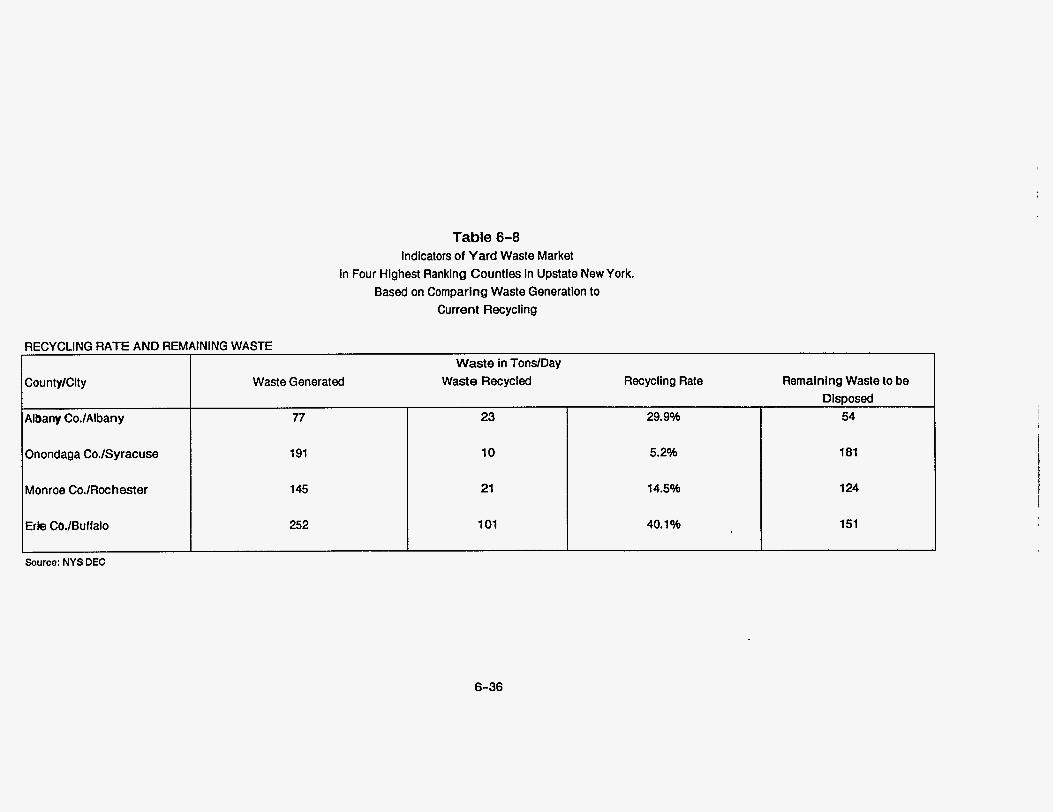
Table 6-8 Indicators of Yard Waste Market
in Four Highest Ranking Counties in Upstate New York. Based on Comparing Waste Generation to
Current Recycling
Cou ntylCity
Albany CoJAlbany
Onondaga Co./Syracuse
Monroe Co./Rochester
Erie Co./Buffalo
RECYCLING RATE AND REMAINING WASTE Waste in TondDay
Waste Generated
77
191
145
252
23
10
21
101
29.9%
5.2%
14.5%
40.1%
Remalning Waste to be DiSDOSed
54
181
1 24
151
6-36
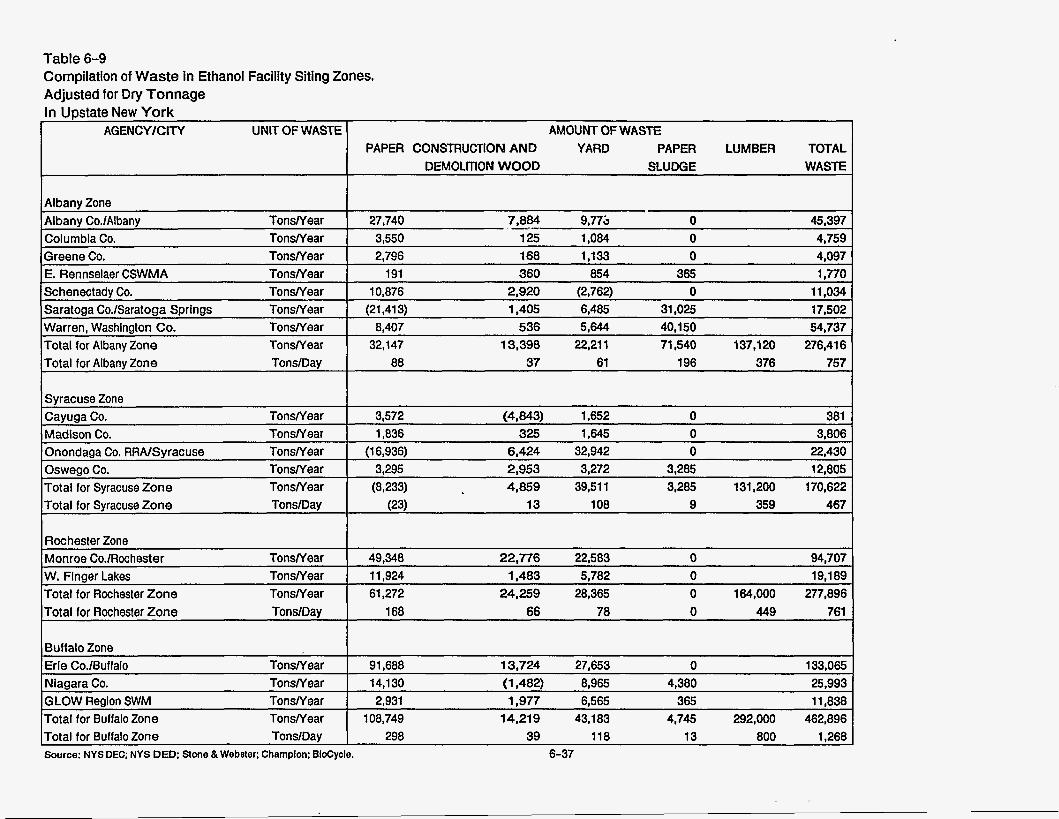
Table 6-9 Compilation of Waste in Ethanol Facility Siting Zones.
Albany Zone Albany CoJAlbany Tonwear Columbia Co. TonsNear Greene Co. TonsNear E. Rennselaer CSWMA TonsNear Schenectady Co. Tonwear
v
Adjusted for Dry Tonnage In Upstate New York
AGENCY/CIlY UNIT OF WASTE
lsaratoga Co./Saratoga Springs TonsNear Warren, Washington Co. TonsNear Total for Albany Zone TonslYear Total for Albany Zone TonslDay
Syracuse Zone Cayuga Co. Tonwear Madison Co. TonslYear
nondaga Co. RRAlSyracuse TonslY ear Tonwear
Total for Syracuse Zone Total for Svracuse Zone
TonsNear Tons/Day
Rochester Zone Monroe Co./Rochester TonsN ear W. Finger Lakes TonsNear Total for Rochester Zone TonsNear Total for Rochester Zone TondDay
Buffalo Zone Erie CoJBuffalo TonsNear Niagara Co. TonsNear GLOW Region SWM TonsNear Total for Buffalo Zone TonsNear Total for Buffalo Zone Tons/Day
AMOUNT OF WASTE PAPER CONSTRUCTION AND YARD PAPER LUMBER TOTAL
DEMOLITION WOOD SLUDGE WASTE
27,740 7,884 --. -- 9,77& 0 45,397 3,550 1 25 1,084 0 4,759 2,796 168 1,133 0 4,097
191 360 854 365 1,770 10,876 2,920 (2,762) 0 11,034
(21,413) 1,405 6,485 31,025 17,502 8,407 536 5,644 40,150 54,737
32,147 13,398 22,211 71,540 137,120 276,416 88 37 61 196 376 757
3.572 (4.843) 1.652 0 381 I 1.836 325 1.645 0 3.806 I
(1 6.936) 6.424 32.942 0 22.430 I 3,295 2.953 3,272 3.285 12.805 I (8,233) 4,859 39,511 3,285 131,200 170,622
(23) 13 108 9 359 467
49,348 22,776 22,583 0 94,707 11,924 1,483 5,782 0 19,189 61,272 24,259 28,365 0 164,000 277,896
168 66 78 0 449 761
91,688 13,724 27,653 0 133,065 14,130 (1,482) 8,965 4,380 25,993 2,931 1,977 6,565 365 11,838
108,749 14,219 43,183 4,745 292,000 462,896 298 39 118 13 800 1,268
Source: NYS DEC; NYS DED: Stone 8 Webeter; Champion: BioCycle. 6-37
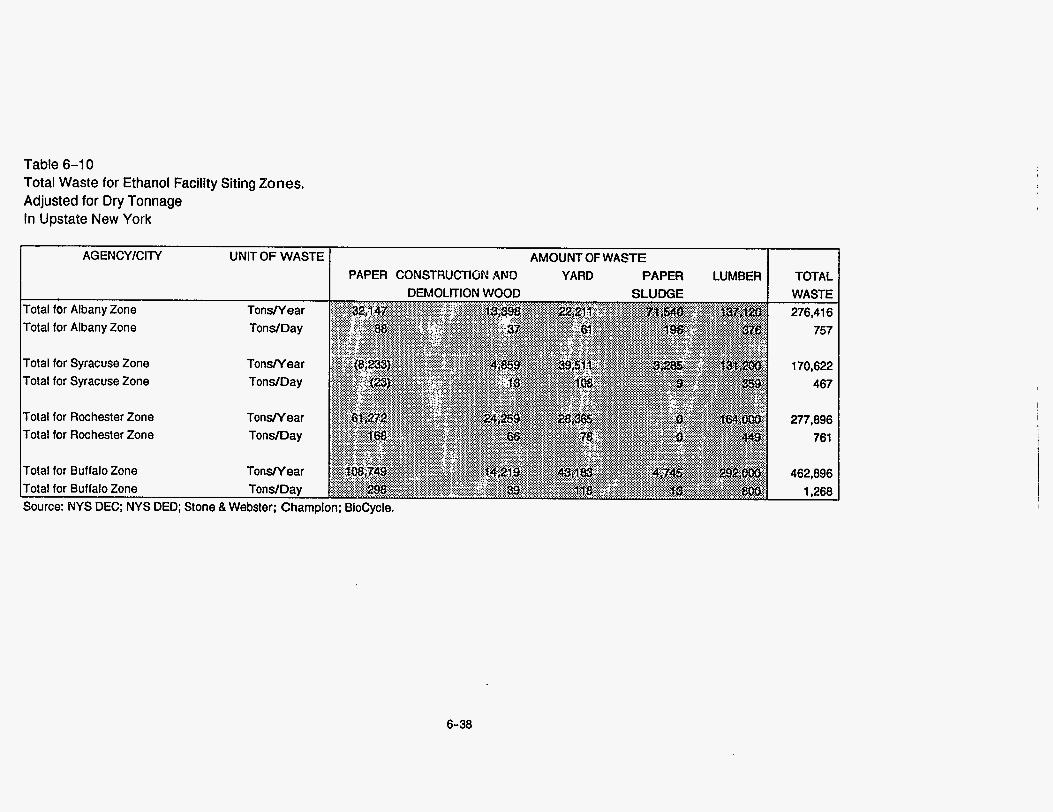
Table 6-1 0 Total Waste for Ethanol Facility Siting Zones. Adjusted for Dry Tonnage In Upstate New York
PAPER CONSTRUCTlCiN ,\NU
Total for Albany Zone
Total for Syracuse Zone Total for Syracuse Zone
Total for Rochester Zone Total for Rochester Zone
Total for Buffalo Zone
Source: NYS DEC; NYS DED; Stone & Webster; Champion; BioCycle.
6-30
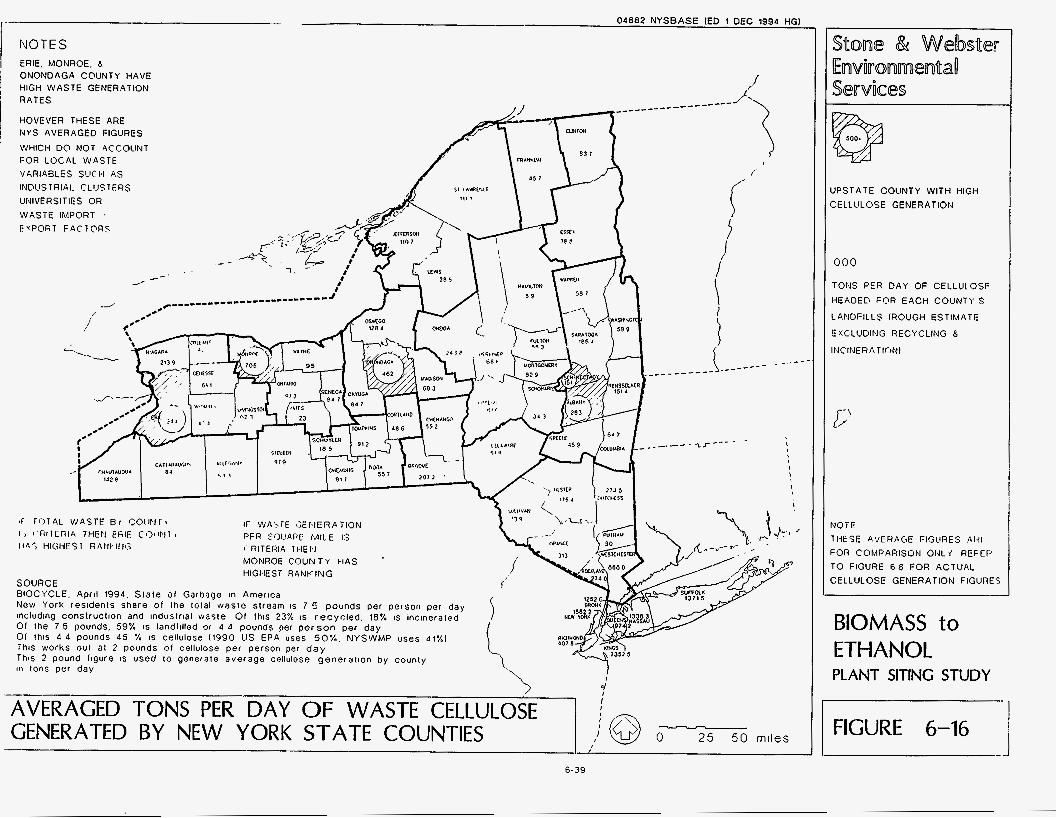
_- - 04882 NYSBASE E D 1 DEC 1994 HGI - .-
NOTES ERIE. MONROE. 8 ONONDAGA COUNTY HAVE HIGH WASTE GENERATION RATES
HOVEVER THESE ARE NYS AVERAGED FIGURES
WHICH DO NOT ACCOUNT FOR LOCAL WASTE VARIABLES SllCI3 AS INClUSTRlAL CLIJSTERS UNIVERSITIES OR WASTE IMPORT EYPORT F A C T P R S
/ - I I I
j@ ;- 25 5 0 mlles
AVERAGED TONS PER DAY O F WASTE CELLULOSE GENERATED BY NEW YORK STATE COUNTIES
I
UPSTATE COUNTY WITH HIGH CELL UL 0 SE GENERA T ION
000
TONS PER DAY OF CELLULOSE HEADED FOR EACH COUNTY'S
LANDFILLS (ROUGH ESTIMATE
EXCLUDING RECYCLING 8
INCINERA TlONI
4OTE I t i E S E AVERAGE FIGURES A l? l 'OR CUMPARISON ONLY' REFER r 0 FIGURE 6 8 FOR ACTUAL >ELLULOSE GENERATION FIGURES
BIOMASS to ETHANOL PLANT SITING STUDY
FIGURE 6-16 1 6.39
feasible for recycling there is thus represented by a negative number (-16,936 tons per year, as shown in Table 6-9). The amount of paper available for recycling in the entire Syracuse Zone appears in Table 6-10 (-8233 tons per year and -23 tons
per day).
For industrial waste, the comparison between amount generated and amount recycled was not possible becaise there were no statistics available on recycling of
paper sludge and lumber by-products. The analysis instead had to be based upon the generation figures alone. Considering only the generation figures, it appeared that approximately 500 tons per day of combined paper sludge and lumber by-
product waste were being created in each zone. The challenge would be to divert this waste stream from other forms of disposal and recycling towards the ethanol facility. An assumption was made that the diversion could be achieved by offering a cheaper or more profitable alternative to the existing method of disposal and recycling. In the case of paper sludge, supplying waste to the ethanol facility might be cheaper than landfilling. For lumber by-products, which have a market value, a higher rate for the sale of wood waste could be offered.
Findinvs. Table 6-9 shows the estimate for quantity of potential feedstock broken down by material and by county, and Table 6-10 shows the total for each zone. The quantity of tonnage has been adjusted for moisture content. The Plattsburgh and Binghamton Zones were dropped because their feedstocks either were not diversified enough or could not meet the threshold criteria of a nominal 500 tons per day. The remaining zones were Buffalo, Rochester, Albany, and Syracuse, which can provide 1268, 761, 757, and 467 tons of cellulose-bearing waste per day respectively (see Figure 6-8).
Another calculation was performed to verify these estimates. The original estimates were based on absolute quantities of waste per county. For the second round of estimates, an
average per capita rate of cellulose generation was applied to the density of each county. The results are shown in Figure 6-16 for the central counties in each region: Erie County
6-40
disposes 944 tpd in the Buffalo region; Monroe County disposes 705 tpd in the Rochester
region; Onondaga disposes 462 tpd in the Syracuse region; and Albany and Schenectady
Counties combined dispose 434 tpd in the Albany region. These figures are smaller than
those produced in the first round of calculations because they are estimated only for the county and not for the entire ethanol facility siting zone. They are also different because
they are based on an average per capita rate of waste disposal that may not reflect regional differences.
However, the figures do reveal a trend about the ranking of regions in terms of feedstock availability. Both the first and second analyses show that the Buffalo area has the most
potential waste and that the Rochester area contains the second largest quantity of feedstock. These two analyses, however, produce different results for the Albany and Syracuse areas. In the first estimate, Albany was clearly ahead of Syracuse, with 757 and 467 tons per day of waste respectively. In the second estimate, Albany and Syracuse had very similar estimates: 434 tons for the combined counties of Albany and Schenectady and 462 tons for
the county of Onondaga.
Another important finding of the analysis was the mixture of cellulose sources required to
make up a nominal 500 tpd facility. Lumber by-products proved to be the best source of cellulose-bearing feedstock, in terms of both quantity and availability. Lumber waste would need to be supplemented by the other types of cellulose sources, primarily paper sludge and municipal solid waste. The ratio of lumber to other wastes was determined to be approximately 1: 1. The bar graphs in Figure 6-8 show the proportions of various wastes to each other in the different regions.
Location of Sites
Individual sites were identified in each of the ethanol facility siting zones through contacts
with private developers, local economic development corporations, public utilities, and the Department of Economic Development. Sites were also identified by NYSERDA, Champion
6-4 1
International, and other members of the project team. A total of 23 sites were identified
through these contacts. The Albany Zone contains nine potential sites, the most of any zone. The Buffalo Zone is second with five potential sites. The sites are listed in Table 6-11 by facility-siting zone, county/town, site name, acreage, ownership and relevant site information. The location of these sites can be seen in Figure 6-17.
More detailed information on the data that were considered in this analysis can be found in Attachments 6-1 through 6-7 in the Appendix.
Conclusions
Based on the screening process, any of the four regions surromding the cities of Buffalo, Rochester, Albany, and Syracuse could support a nominal 500-ton-per-day facility. Individual sites for locating an ethanol facility within those regions were identified.
Feedstock availability limited the ethanol facility to a size of 500 tons per day; a more economical size of 1000-tons-per-day facility was deemed not feasible.
In upstate New York, the ethanol facility would need to rely on a mixture of feedstock sources. Lumber by-products would be the main source of feedstock because of their plentiful supply and ease of accessibility. The lumber would be supplemented by paper sludge (especially in the Albany region) and three different types of municipal solid waste, consisting of paper products, yard waste, and construction and demolition wood.
Although the municipal solid waste per region is often more available than the quantity of
paper sludge, paper sludge was considered to be more reliable, especially since paper mills often seek a cheaper alternative to private landfilling of waste. Municipal solid waste, on the other hand, requires extensive community cooperation and improved recycling practices. In all regions, a feedstock ratio of lumber by-products to supplementary waste of approximately 1: 1 would be required.
6-42
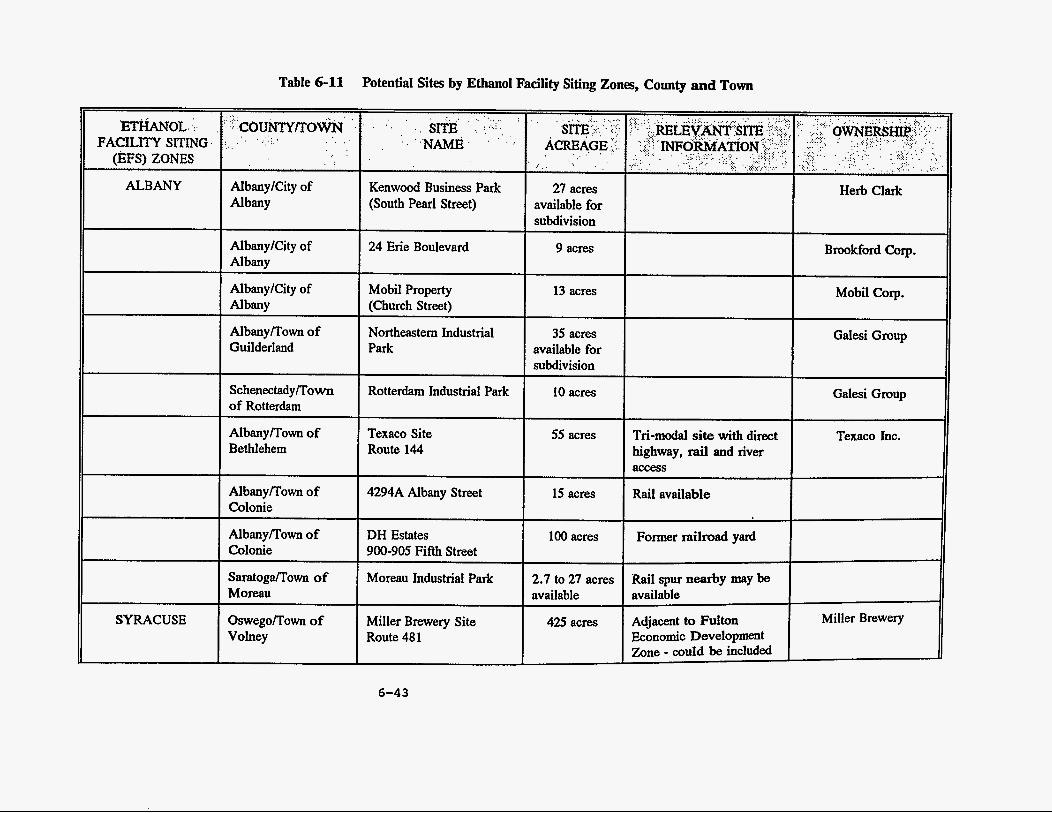
Table 6-11 Potential Sites by Ethanol Facility Siting Zones, County and Town
AlbanylCity of Kenwood Business Park (South Pearl Street) available for
AlbanylCity of 24 Erie Boulevard 9 acres Albany
AlbanylCity of Mobil Property 13 acres Albany (Church Street)
AlbanyRown of Northeastern Industrial 35 acres Guilderland Park available for
subdivision
SchenectadylTown Rotterdam Industrial Park 10 acres of Rotterdam
Albany/Town of Texaco Site 55 acres Beth 1 e h e m Route 144
AlbanyR'own of 4294A Albany Street 15 acres Colonie
Albany/Town of DH Estates 100 acres Colonie 900-905 Fifth Street
Saratoga/Town of Moreau Industrial Park 2.7 to 27 acres Moreau available
Oswego/Town of Miller Brewery Site Volney Route 48 1
425 acres
I I
Tri-modal site with direct highway, rail and river access
Rail available
Former railmad yard
Rail spur nearby may be available
Adjacent to Fulton Economic Development Zone - could be included
Herb Clark
Brookford Corp.
6-43
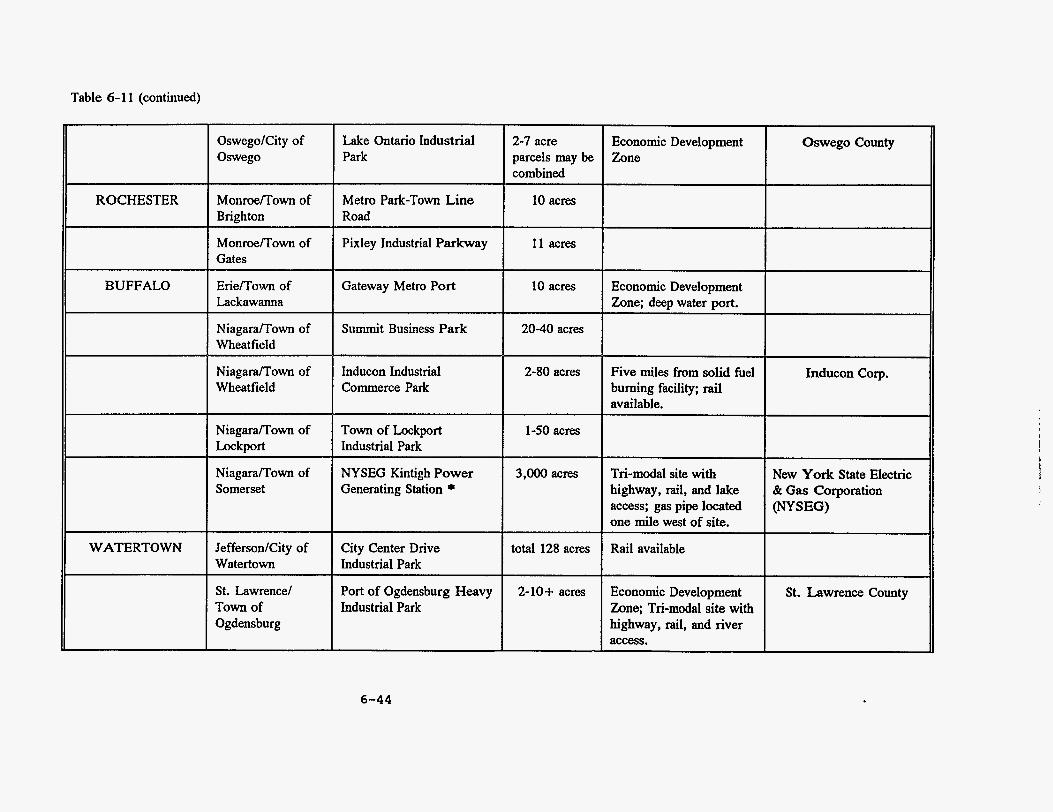
Table 6-1 1 (continued)
OswegoKity of Oswego
MonroeITown of Brighton
Monroe/Town of Gates
Erie/Town of Lackawanna
Niagara/Town of Wheatfield
Niagara/Town of Wheatfield
Niagara/Town of
Niagara/Town of
Lockport
Somerset
JeffersodCity of Watertown
St. Lawrence/ Town of Ogdensburg
ROCHESTER
Lake Ontario Industrial 2-7 acre Park parcels m y be
Metro Park-Town Line 10 acres Road
Pixley Industrial Parkway 11 acres
combined
Gateway Metro Port 10 acres
Summit Business Park 20-40 acres
Inducon Industrial 2-80 acres Commerce Park
Town of Lockport 1-50 acres
NYSEG Kintigh Power 3,000 acres
Industrial Park
Generating Station *
City Center Drive Industrial Park
Port of Ogdensburg Heavy Industrial Park
total 128 acres
2-10+ acres
BUFFALO
Economic Development Zone
WATERTOWN
Oswego County
Economic Development Zone; deep water port.
Five miles from solid fuel burning facility; rail available.
Tri-modal site with highway, rail, and lake access; gas pipe located one mile west of site.
Rail available
Economic Development Zone; Tri-modal site with highway, rail, and river access.
Inducon Cop.
New York State Electric & Gas Corporation (NYSEG)
St. Lawrence County
6-44
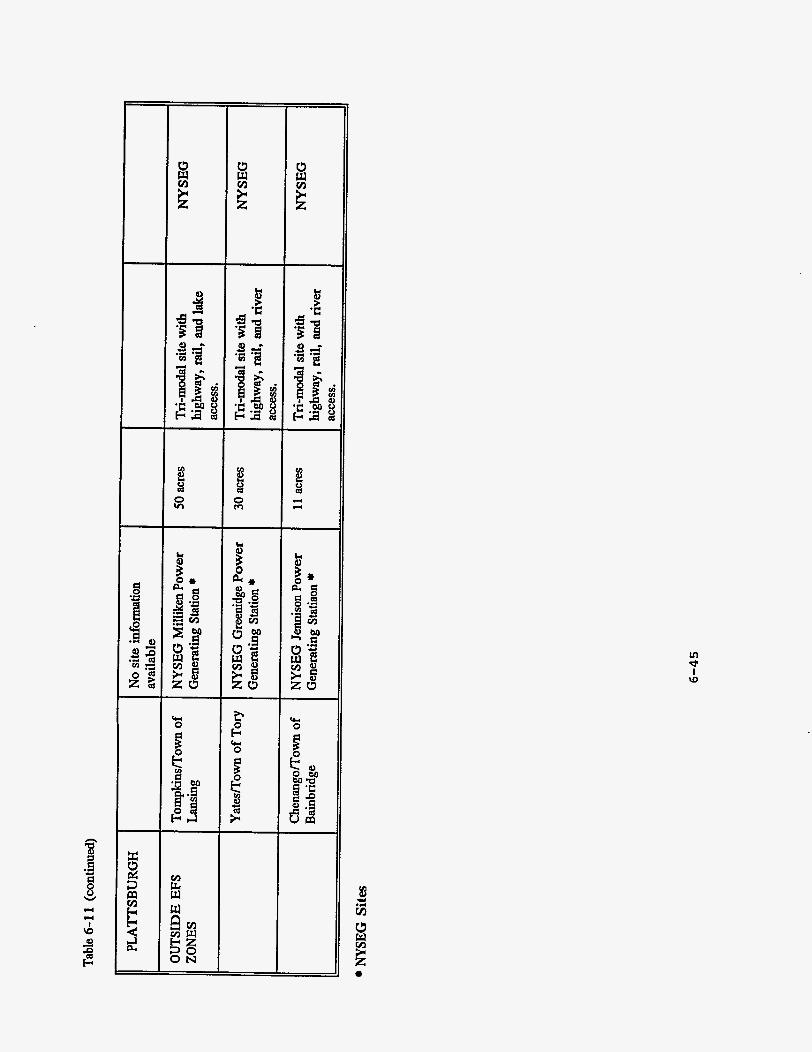
E
I I
cr 0
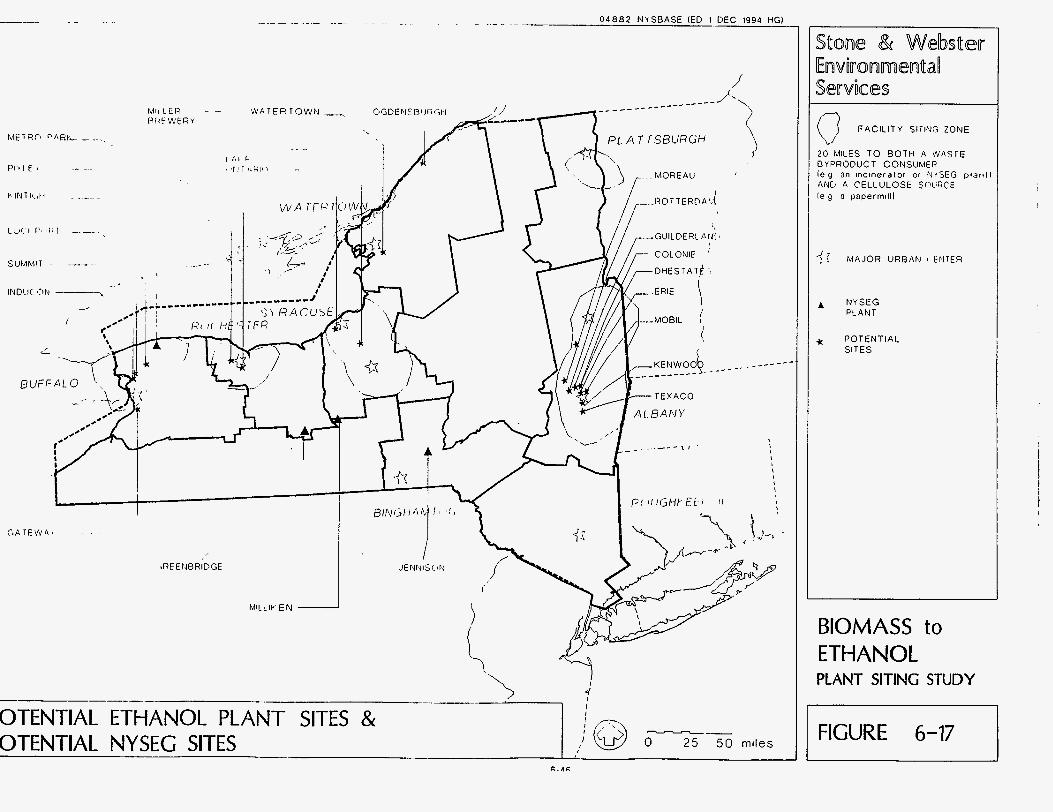
0 4 8 8 2 NYSBASE [ED I DEC 1994 HGI . . ~- . - - ..-
MILLER f-1 Ti F WE R Y
- bVATERTOWN -
. .. - I
_.. .-
I , I I
, .RE E NB RID GE
OTENTIAL ETHANOL PLANT SITES & OTENTIAL NY SEG SITES
I I I
I
I
I I
I
Saoane & Websuer [KUTVi~O~~e~UaO Services
FACIL ITY SITING ZONE 0 20 MILES T O BOTH A W A S T E OYPROOUCT CONSUMER l e g an incineralor 01 N f S E G p i a r t 1 1 ANCJ A CELLULOSE S W R C E
a papermilll
MAJOR URBAN ENTER
NYSEG PLANT
POTENTIAL SITES
BIOMASS to ETHANOL PLANT SITING STUDY
I FIGURE 6-17
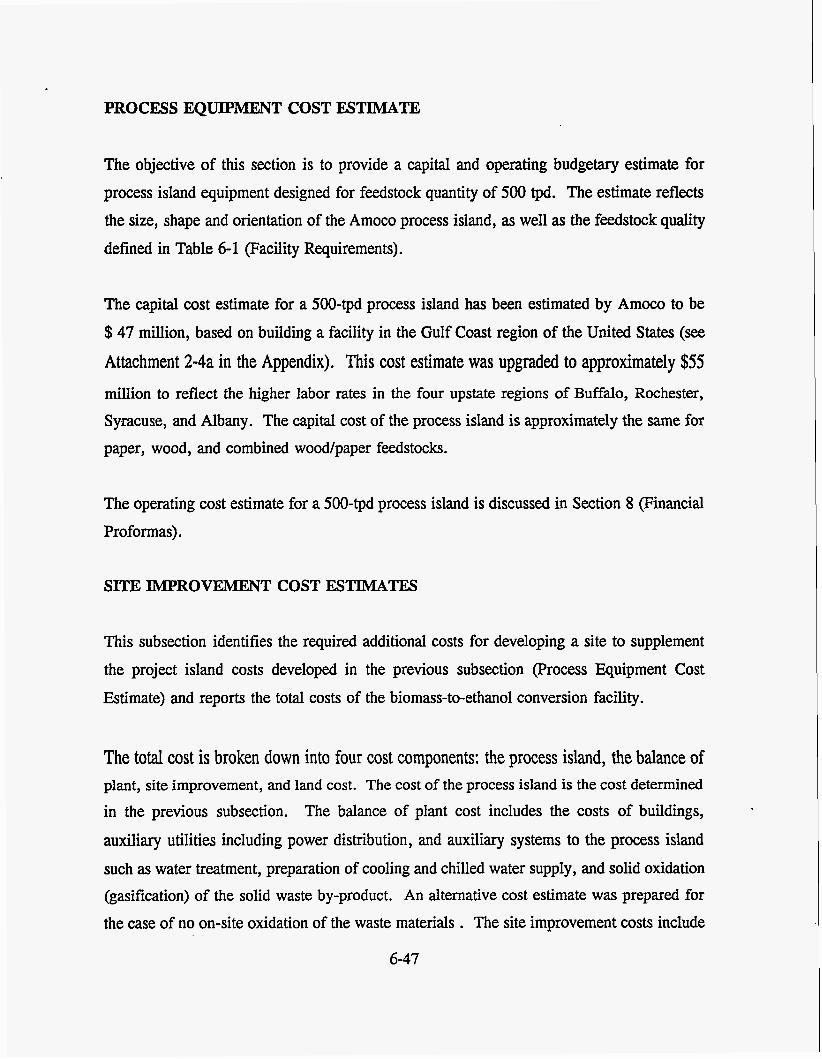
PROCESS EQUIPMJZNT COST ESTIMATE
The objective of this section is to provide a capital and operating budgetary estimate for process island equipment designed for feedstock quantity of 500 tpd. The estimate reflects the size, shape and orientation of the Amoco process island, as well as the feedstock quality defined in Table 6- 1 (Facility Requirements).
The capital cost estimate for a 500-tpd process island has been estimated by Amoco to be $ 47 million, based on building a facility in the Gulf Coast region of the United States (see
Attachment 2-4a in the Appendix). This cost estimate was upgraded to approximately $55 million to reflect the higher labor rates in the four upstate regions of Buffalo, Rochester, Syracuse, and Albany. The capital cost of the process island is approximately the Same for paper, wood, and combined wood/paper feedstocks.
The operating cost estimate for a 500-tpd process island is discussed in Section 8 (Financial Proformas).
SITE IMPROVEMENT COST ESTIMATES
This subsection identifies the required additional costs for developing a site to supplement the project island costs developed in the previous subsection (Process Equipment Cost Estimate) and reports the total costs of the biomass-to-ethanol conversion facility.
The total cost is broken down into four cost components: the process island, the balance of plant, site improvement, and land cost. The cost of the process island is the cost determined in the previous subsection. The balance of plant cost includes the costs of buildings,
auxiliary utilities including power distribution, and auxiliary systems to the process island such as water treatment, preparation of cooling and chilled water supply, and solid oxidation (gasification) of the solid waste by-product. An alternative cost estimate was prepared for the case of no on-site oxidation of the waste materials . The site improvement costs include
6-47
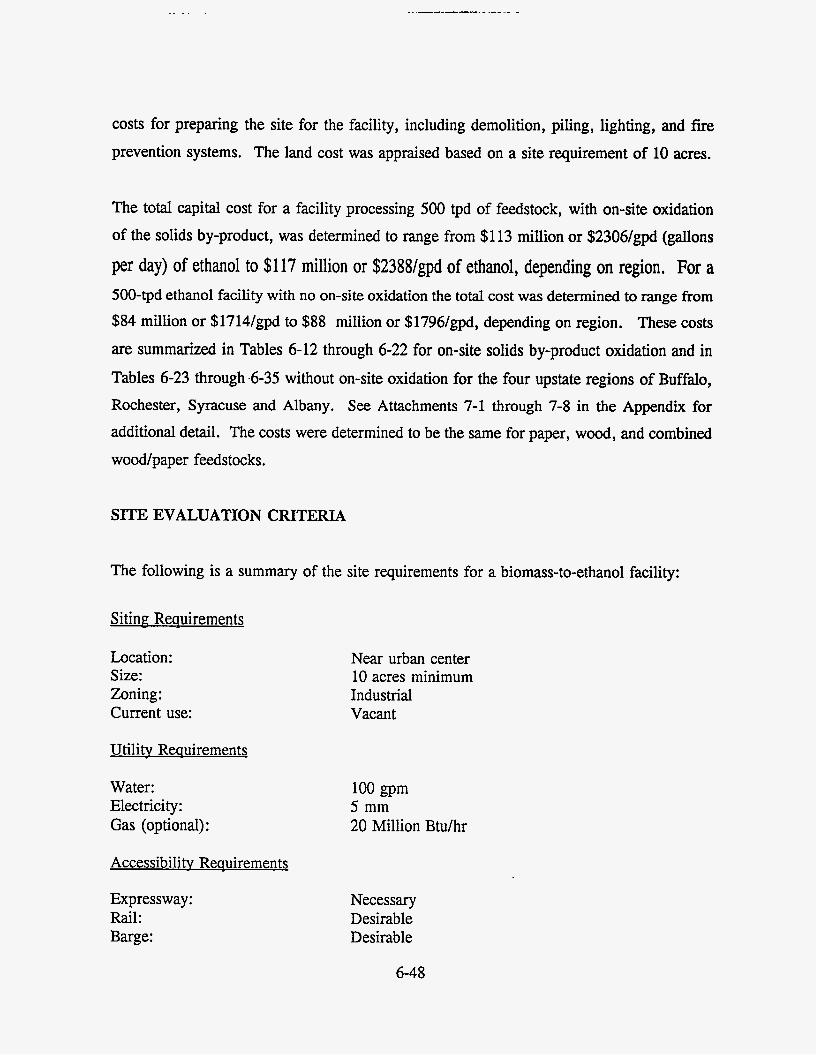
costs for preparing the site for the facility, including demolition, piling, lighting, and fire prevention systems. The land cost was appraised based on a site requirement of 10 acres.
The total capital cost for a facility processing 500 tpd of feedstock, with on-site oxidation of the solids by-product, was determined to range from $1 13 million or $2306/@ (gallons
per day) of ethanol to $117 million or $2388/gpd of ethanol, depending on region. For a 500-tpd ethanol facility with no on-site oxidation the total cost was determined to range from $84 million or $1714/gpd to $88 million or $1796/gpd, depending on region. These costs
are summarized in Tables 6-12 through 6-22 for on-site solids by-product oxidation and in Tables 6-23 through .6-35 without on-site oxidation for the four upstate regions of Buffalo, Rochester, Syracuse and Albany. S e e Attachments 7-1 through 7-8 in the Appendix for additional detail. The costs were determined to be the same for paper, wood, and combined wood/paper feedstocks.
SITE EVALUATION CRITERIA
The following is a summary of the site requirements for a biomass-to-ethanol facility:
Siting Requirements
Location: Size: Zoning: Current use:
Utilitv Reuuirements
Water: Electricity : Gas (optional):
Accessibility Requirements
Near urban center 10 acres minimum Industrial Vacant
100 gpm 5 mm 20 Million Btu/hr
Expressway: Rail: Barge:
Necessary Desirable Desirable
6-48
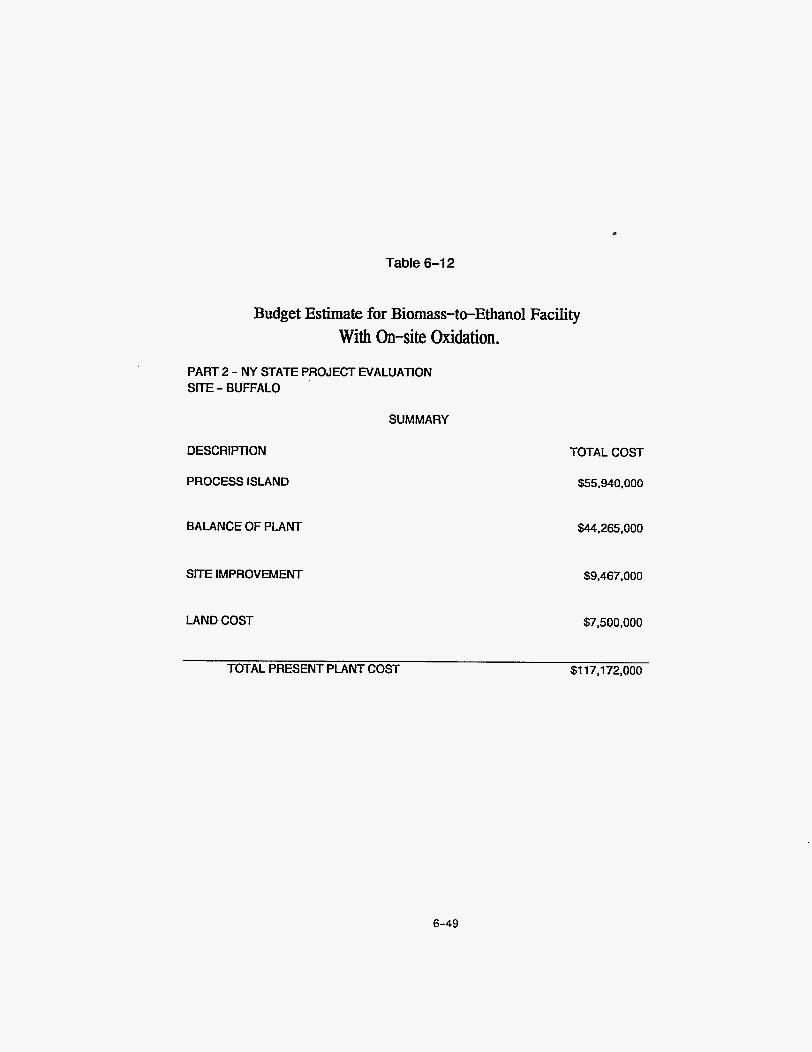
*
Table 6-1 2
Budget Estimate for Biomass-twEthano1 Facility With On-site Oxidation.
PART 2 - NY STATE PROJECT EVALUATION SITE - BUFFALO
SUMMARY
DESCRIPTION
PROCESS ISLAND
BALANCE OF PLANT
SITE IMPROVEMENT
LAND COST
TOTAL COST
$55,940,000
$44,265,000
$9,467,000
$7,500,000
TOTAL PRESENT PLANT COST $1 17,172,000
6-49
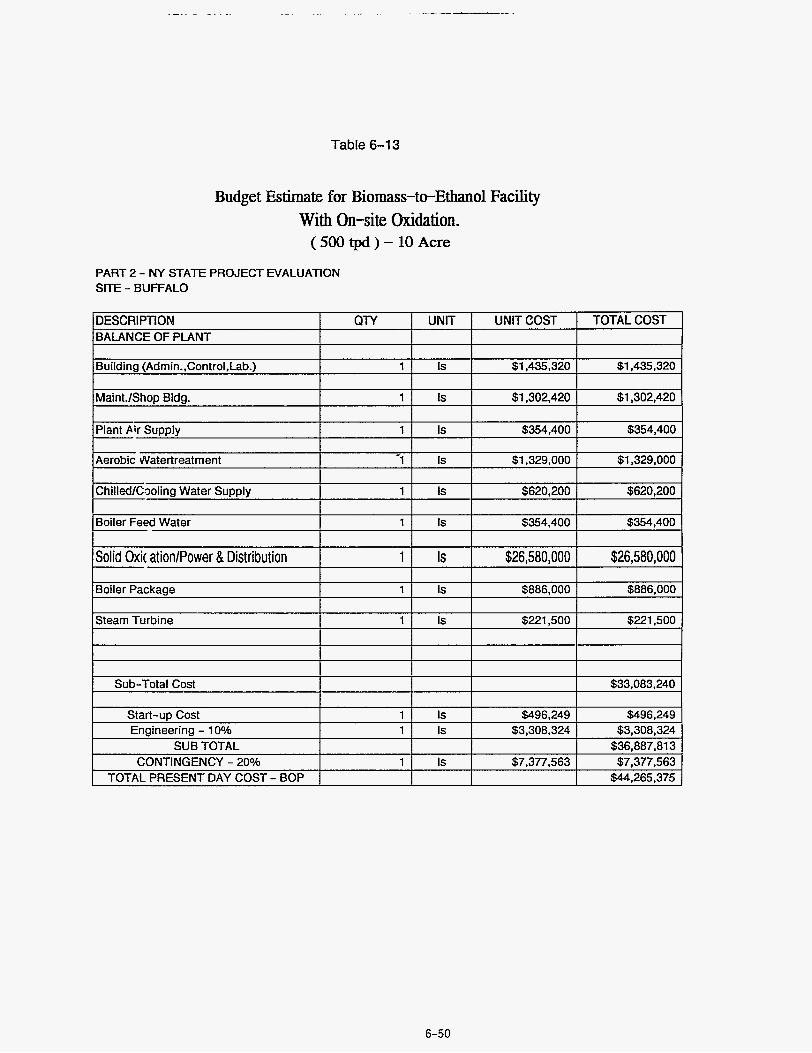
Table 6-1 3
DESCRIPTION
Budget Estimate for Biomass-twEthanol Facility With On-site Oxidation.
( 500 tpd ) - 10 Acre
QlY I UNIT I UNITCOST I TOTAL COST
PART 2 - NY STATE PROJECT EVALUATION SITE - BUFFALO
Building (Admin.,Control,Lab.)
MainLlShop Bldg.
1 Is $1,435,320 $1,435,320
1 Is $1,302,420 $1,302,420
Aerobic Natertreatment
Is $354,400 I $354,400 I I I I
-1 I Is $1,329,000 I $1,329,000
ChilledlCaoling Water Supply
Boiler Feed Water
1 Is $620,200 $620,200
1 Is $354,400 $354,400
ISolid Oxic ationlPower & Distribution I 1 I Is I $26,580,000 I $26,580,000 I Boiler Packaae 1 1 Is $886.000 I $886,000
Steam Turbine 1 1 Is $221.500 I $221.500
Start-up Cost Engineering - 10%
SUB TOTAL
1 Is $496,249 $496,249 1 Is $3,308,324 $3,308,324
$36,887,813
6-50
CONTINGENCY - 20% 1 1 IS $7,377,563 1 $7,377,563 TOTAL PRESENT DAY COST - BOP I I $44,265,375

Table 6-14
Engineering - 10% Sub-Total Cost
CONTINGENCY - 20% TOTAL PRESENT DAY COST Land cost allowance:
Budget Estimate for Biomass-to-Ethanol Facility With On-site Oxidation. ( 500 tpd ) - 10 Acre
> 1 Is $717,217 $71 7,217 $7,889,387
1 Is $1,577,877 $1,577,877 $9,467,264 $7,500.000
PART 2 - NY STATE PROJECT EVALUATION - SITE IMPROVEMENT REQUIREMENTS SITE - BUFFALO
Site Lighting 1 Is w i , a 6 0
Sub-Total Cost $7.1 72.1 70
Assumption: No Enviromental Remediation on Site.
6-51
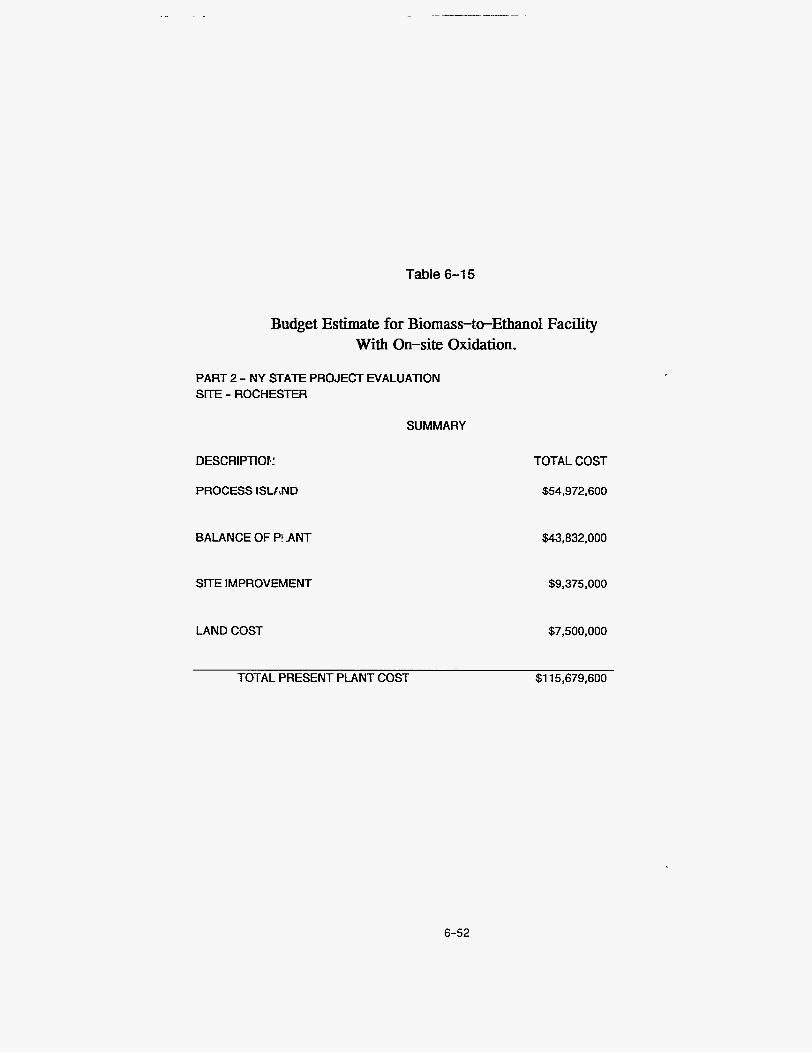
Table 6-1 5
Budget Estimate for Biomass-twEthanol Facility With On-site Oxidation.
PART 2 - NY STATE PROJECT EVALUATION SITE - ROCHESTER
SUMMARY
DESCRlPTIOFi
PROCESS ISUiND
BALANCE OF P! ANT $43,832,000
SITE IMPROVEMENT $9,375,000
LAND COST $7,500,000
TOTAL COST
$!34.972,600
TOTALPRESENTPLANTCOST $1 15,679,600
6-52
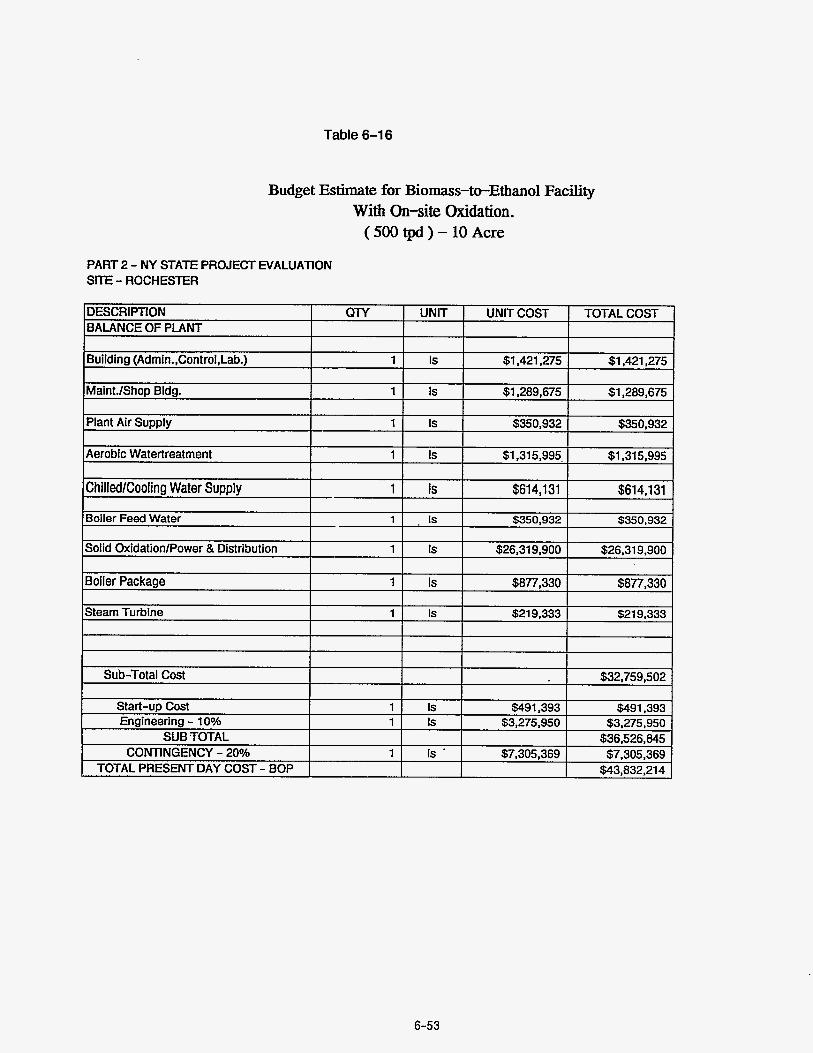
Table 6-16
Budget Estimate for Biomass-to-Ethanol Facility With On-site Oxidation.
( 500 tpd ) - 10 Acre
PART 2 - NY STATE PROJECT EVALUATION SITE - ROCHESTER
6-53

Table 6-1 7
Budget Estimate for Biomass-twEthano1 Facility With On-site Oxidation.
(500tpd)-lOAcre .
PART 2 - NY STATE PROJECT EVALUATION - SITE IMPROVEMENT REQUIREMENTS SITE - ROCHESTER
Assumption: No Enviromental Remediation on Site.
6-54
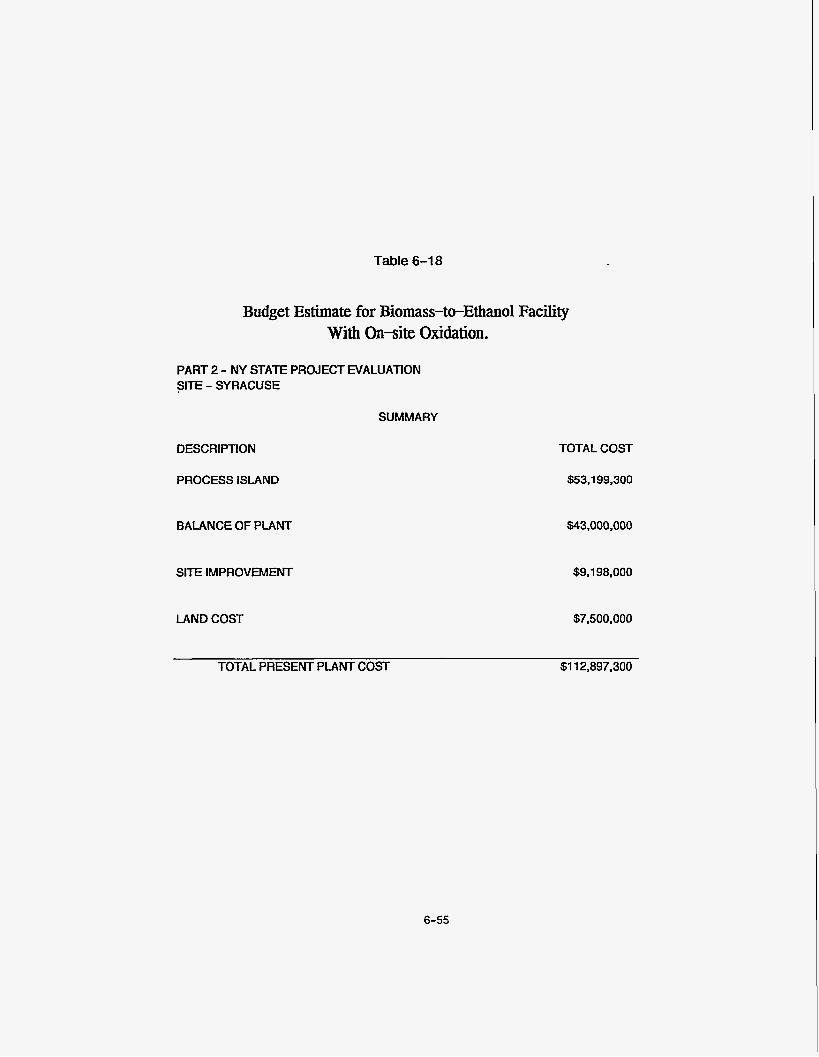
Table 6-18
Budget Estimate for Biomass-twEthano1 Facility With On-site Oxidation.
PART 2 - NY STATE PROJECT EVALUATION SITE - SYRACUSE
SUMMARY
DESCRIPTION
PROCESS ISLAND
BALANCE OF PLANT
SITE IMPROVEMENT
LAND COST
TOTAL COST
$53,199,300
$43,000,000
$9.1 98,000
$7,500,000
TOTAL PRESENT PLANT COST $1 12,897,300
6-55
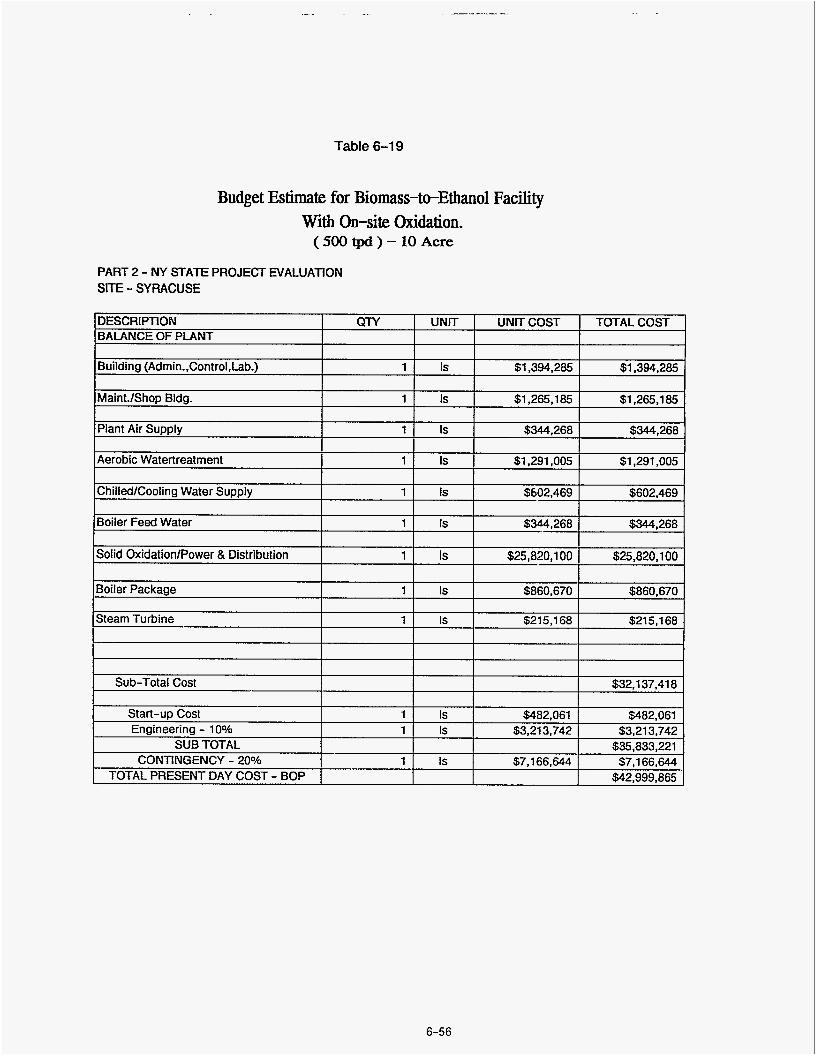
Table 6-1 9
DESCRIPTION
Budget Estimate for Biomass-to-Ethanol Facility With On-site Oxidation. ( 500 tpd ) - 10 Acre
QTY I UNIT I UNITCOST I TOTAL COST
PART 2 - NY STATE PROJECT EVALUATION SITE - SYRACUSE
Boiler Package
Steam Turbine
1 Is $860,670 $860,670
1 Is $21 5 1 68 $21 5,168
I Building (Admin..Control.Lab.) Is I $1.394.285 1 $1.394.285
Sub-Total Cost
Start-up Cost Engineering - 10%
SUB TOTAL CONTINGENCY - 20%
$32.1 37.41 8
1 Is $482,061 $482.061 1 Is $3,213,742 $3.21 3,742
$35,833,221 1 Is $7,166,644 $7,166,644
6-56
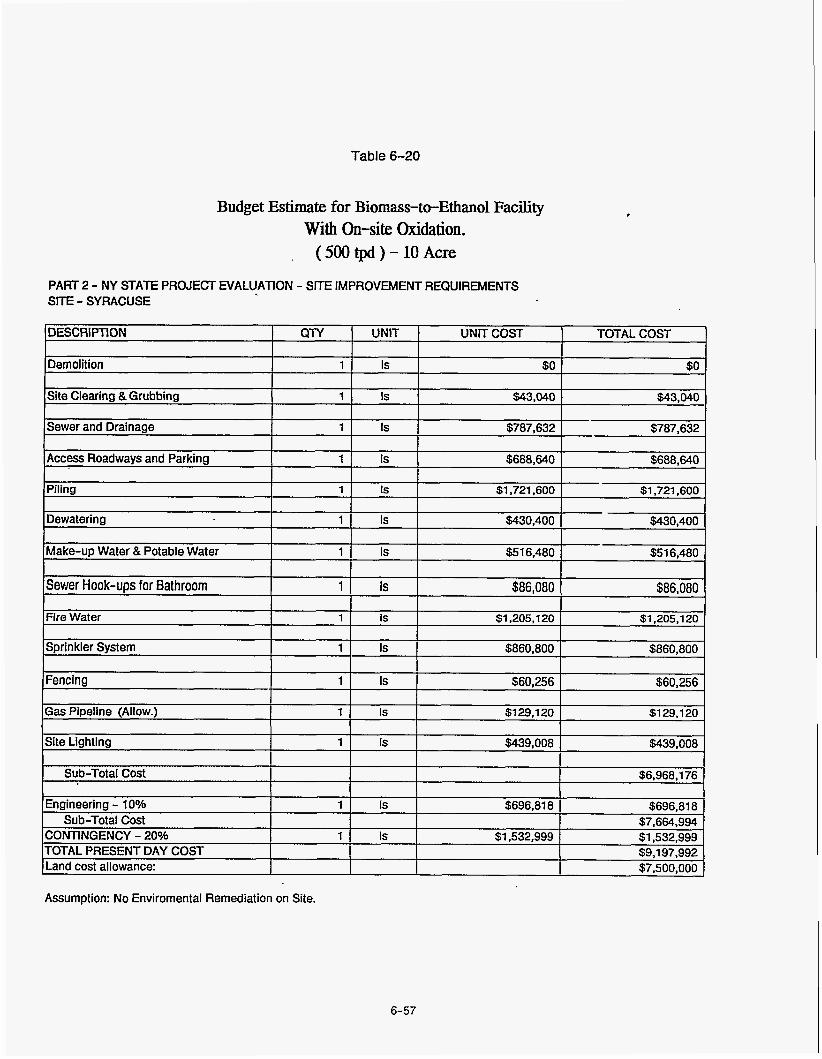
Table 6-20
DESCRIFTION
Demolition
Budget Estimate for Biomass-to-Ethanol Facility With On-site Oxidation.
, (500tpd)-lOAcre
QTY UNIT UNIT COST TOTAL COST
1 Is $0 $0
PART 2 - NY STATE PROJECT EVALUATION - SITE IMPROVEMENT REQUIREMENTS SITE - SYRACUSE
Dewatering I 1 1 Is $430,400 1 $430,400
I I I I Site Clearing &Grubbing 11 Is $43.040 I $43,040
Make-up Water & Potable Water
Sewer and Drainage 1 Is $787.632 $787,632
Access Roadways and Parking 1 Is $688.640 $688,640
1 Is $51 6.480 $516,480
I I I I
Piling 1 1 Is $1,721,600 I $1,721,600 I I I I
Sewer Hook-ups for Bathroom 1 Is $86,080 $86,080
Engineering - 10% Sub-Total Cost
CONTINGENCY - 20% TOTAL PRESENT DAY COST Land cost allowance:
1 Is $696.81 8 $696.81 8 $7,664.994
1 Is $1,532,999 $1,532,999 $9,197,992 $7,500,000
~ ~~
Assumption: No Enviromental Remediation on Site.
6-57

Table 6-21
Budget Estimate for Biomass-to-Ethanol Facility With On-site Oxidation.
PART 2 - NY STATE PROJECT EVALUATION SITE - ALBANY
SUMMARY
DESCRIPTION
PROCESS ISLAND
BALANCE OF PLANT
SITE IMPROVEMENT
LAND COST
TOTAL COST
$53,683,000
$43,250,000
$9,250,000
$7,500,000
TOTAL PRESENT PLANT COST $1 13,683,000
6-58
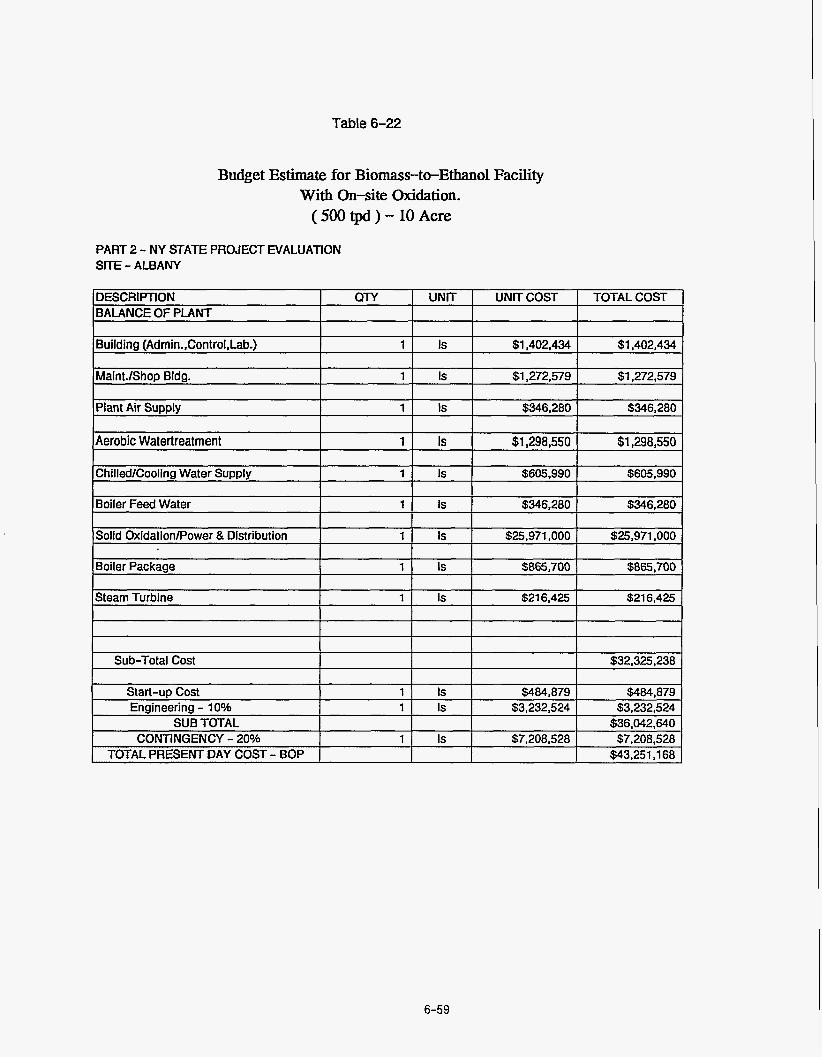
Table 6-22
Budget Estimate for Biomass-twEthano1 Facility With On-site Oxidation.
( 500 tpd ) - 10 Acre
PART 2 - NY STATE PROJECT EVALUATION SITE - ALBANY
DESCRIPTION QTY I UNIT 1 UNITCOST I TOTAL COST BALANCE OF PLANT I I Building (Admin.,Control,Lab.) 1 Is $1,402,434 $1,402,434
Maint./ShoD Blda. 1 Is $1.272.579 $1,272,579 I Plant Air Supply 1 Is $346,280 $346,280
Aerobic Watertreatment 1 Is $1,298,550 $1,298,550
ChilledlCooling Water Supply 1 Is $605,990 $605,990
Boiler Feed Water 1 Is $346.280 $346.280
Solid OxidationlPower & Distribution I 1 1 Is I $25,971,000 I $25,971,000 I I
Boiler Package 1 Is $865,700 $865,700
Steam Turbine 1 Is $21 6,425 $21 6,425
Sub-Total Cost $32,325,238
Start-up Cost 1 Is $484,879 I ineering - 10% 1 Is $3,232,524 1 $3,232,524
- r, n L l l Y -
SUB TOTAL I I I I $36,042,640 CONTINGENCY - 20% 1 1 Is $7.208.528 I $7.208.528 . . . .
TOTAL PRESENT DAY COST - BOP 1 I I $43,251,168
6-59
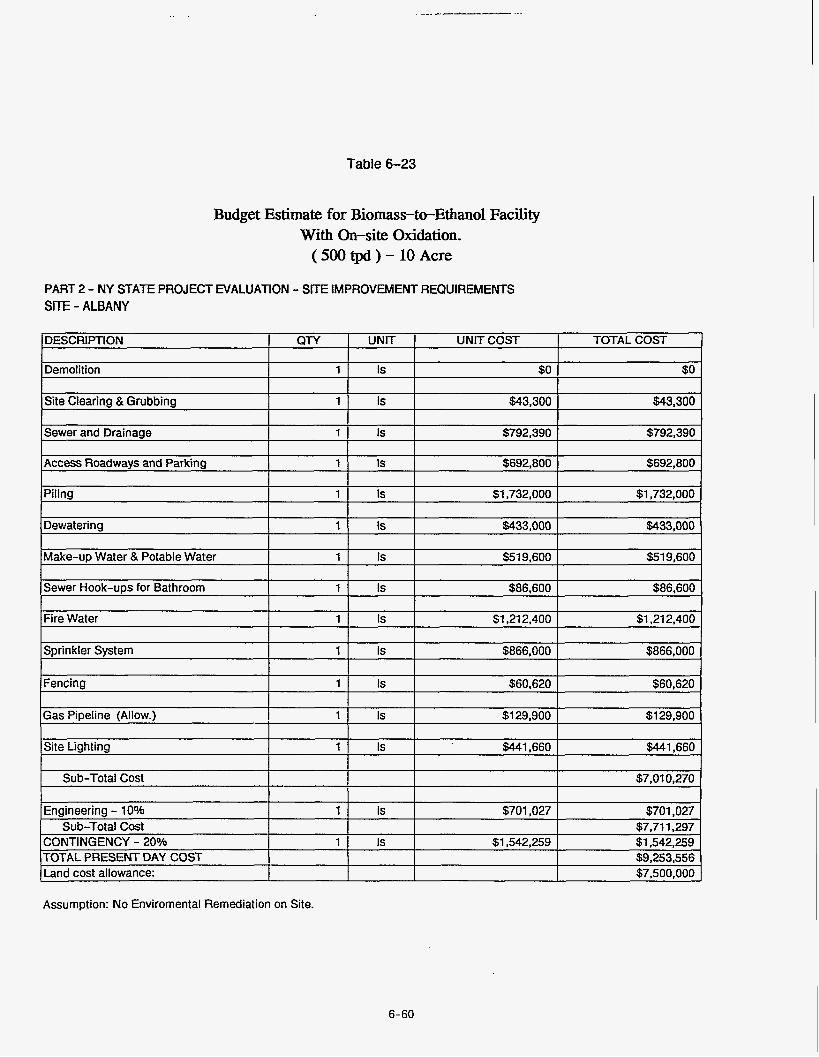
Table 6-23
Budget Estimate for Biomass-twEthano1 Facility With On-site Oxidation. ( 500 tpd ) - 10 Acre
PART 2 - NY STATE PROJECT EVALUATION - SITE IMPROVEMENT REQUIREMENTS SITE - ALBANY
Assumption: No Enviromental Remediation on Site.
6-60

Table 6-24
Budget Estimate for Biomass-to-Ethanol Facility Without Oxidation.
PART 2 - NY STATE PROJECT EVALUATION SITE - BUFFALO
SUMMARY
DESCRIFTION TOTAL COST
PROCESS ISLAND $55.940.000
BALANCE OF PLANT $14,62a,ooo
SITE IMPROVEMENT $9,467,000
LAND COST $7,500,000
TOTAL PRESENT PLANT COST $a7,535.000
6-61
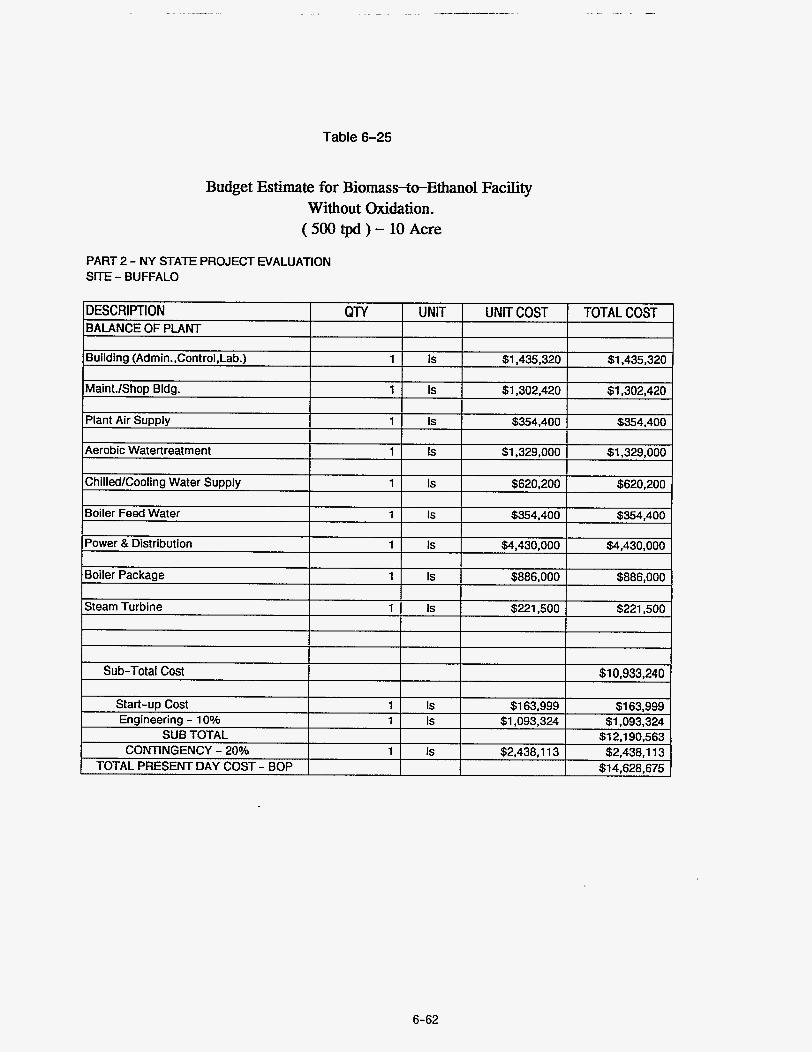
Table 6-25
Budget Estimate for Biomass-twEthano1 Facility Without Oxidation. ( 500 tpd ) - 10 Acre
PART 2 - NY STATE PROJECT EVALUATION SITE - BUFFALO
6-62
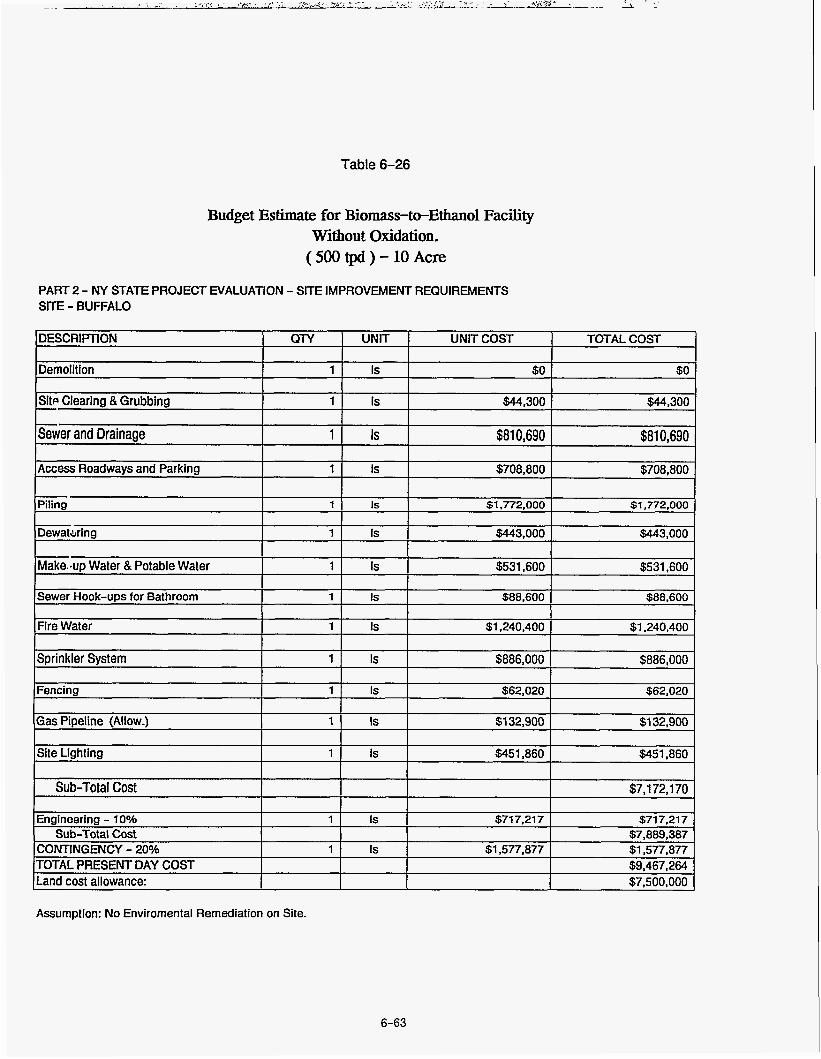
Table 6-26
Site Clearina & Grubbina 1 1 Is
Budget Estimate for Biomass-to-Ethanol Facility Without Oxidation.
(500 tpd) - 10 Acre
$44.300 I $44.300
PART 2 - NY STATE PROJECT EVALUATION - SITE IMPROVEMENT REQUIREMENTS SITE - BUFFALO
Sewer and Drainage
DESCRIPTION I QTY I UNIT I UNIT COST I TOTAL COST /
1 Is $810,690 $81 0,690
Fire Water 1 1 Is I $1,240,400 I $1,240,400
I I
I I I I SDrinkler Svstem Is $886.000 I $886.000
Sub-Total Cost
~
$7,172,170
~~ ~
Gas Pipeline (Allow.) I 1 1 Is I $1 32,900 I $1 32,900 I I
Engineering - 10% Sub-Total Cost
CONTINGENCY - 20% TOTAL PRESENT DAY COST
1 Is $71 7.21 7 $71 7.21 7 $7,889,387
1 Is $1,577,877 $1,577,877 $9,467,264
ILand cost allowance: I I I I S7.500.000 I
Assumption: No Enviromental Remediation on Site.
6-63

Table 6-27
Budget Estimate for Biomass-to-Ethanol Facility Without Oxidation.
PART 2 - NY STATE PROJECT EVALUATION SITE - ROCHESTER
SUMMARY
DESCRIPTION TOTAL COST
PROCESS ISLAND $54,972,600
BALANCE OF PLANT $14,485,600
SITE IMPROVEMENT $9,375,000
LAND COST $7,500,000
TOTAL PRESENT PLANT COST $86,333,200
6-64
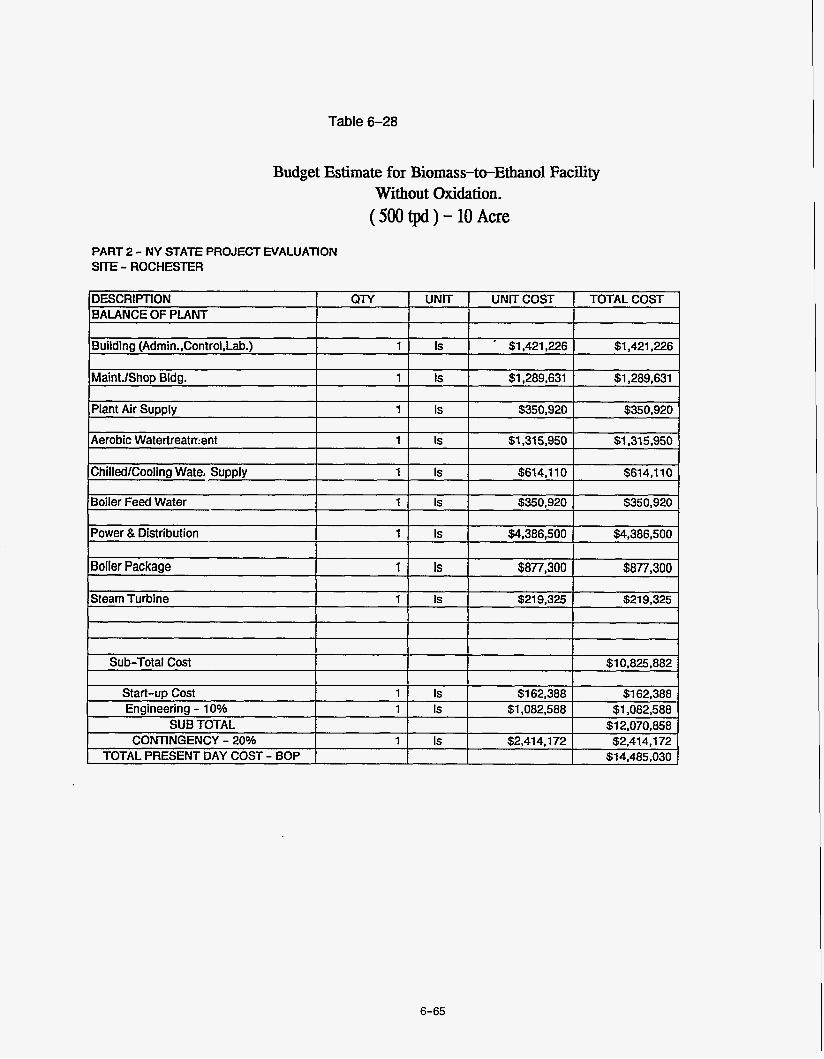
Table 6-28
Budget Estimate for Biomass-twEthanol Facility Without Oxidation. ( 500 tpd ) - 10 Acre
PART 2 - NY STATE PROJECT EVALUATION Sl lE - ROCHESTER
Steam Turbine 1 1 Is $219,325 I $219,325 I I I I
I ~ ~~
I I I I I I I
Sub-Total Cost I $1 0.8% ,882
Start-up Cost 1 Is $1 62,388 $1 62,388 Engineering - 10% 1 Is $1,082,588 $1,082,588
SUB TOTAL $12,070,858 CONTINGENCY - 20% 1 Is $2,414,172 $2,414,172
$14,485,030 TOTAL PRESENT DAY COST - BOP
6-65
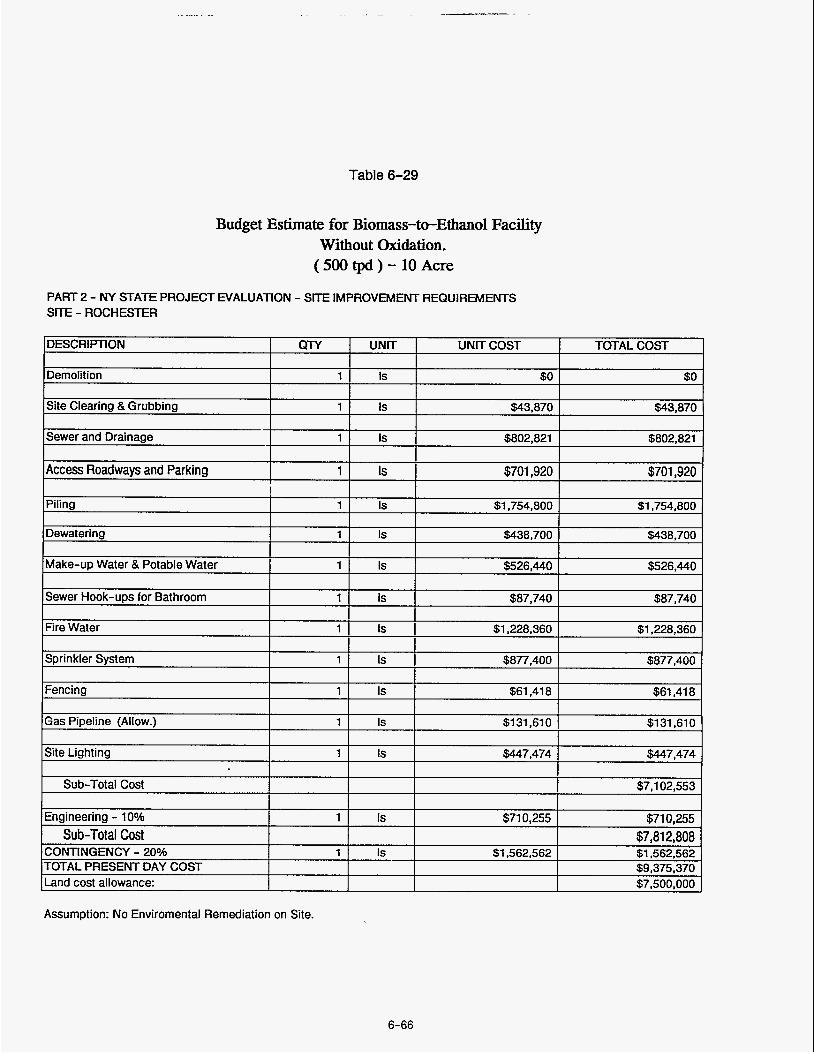
Table 6-29
DESCRIPTION
Demolition
Budget Estimate for Biomass-to-Ethanol Facility Without oxidation.
(500tpd)-lOAcre
QTY UNIT UNIT COST TOTAL COST
1 Is $0 so
PART 2 - NY STATE PROJECT EVALUATION - SITE IMPROVEMENT REQUIREMENTS SIT€ - ROCHESTER
Engineering - 10% Sub-Total Cost
CONTINGENCY - 20% TOTAL PRESENT DAY COST Land cost allowance:
1 Is $71 0,255 $710,255 $7,812,808
1 Is $1,562,562 $1,562,562 $9,375,370 $7,500,000
Assumption: No Enviromental Remediation on Site.
6-66
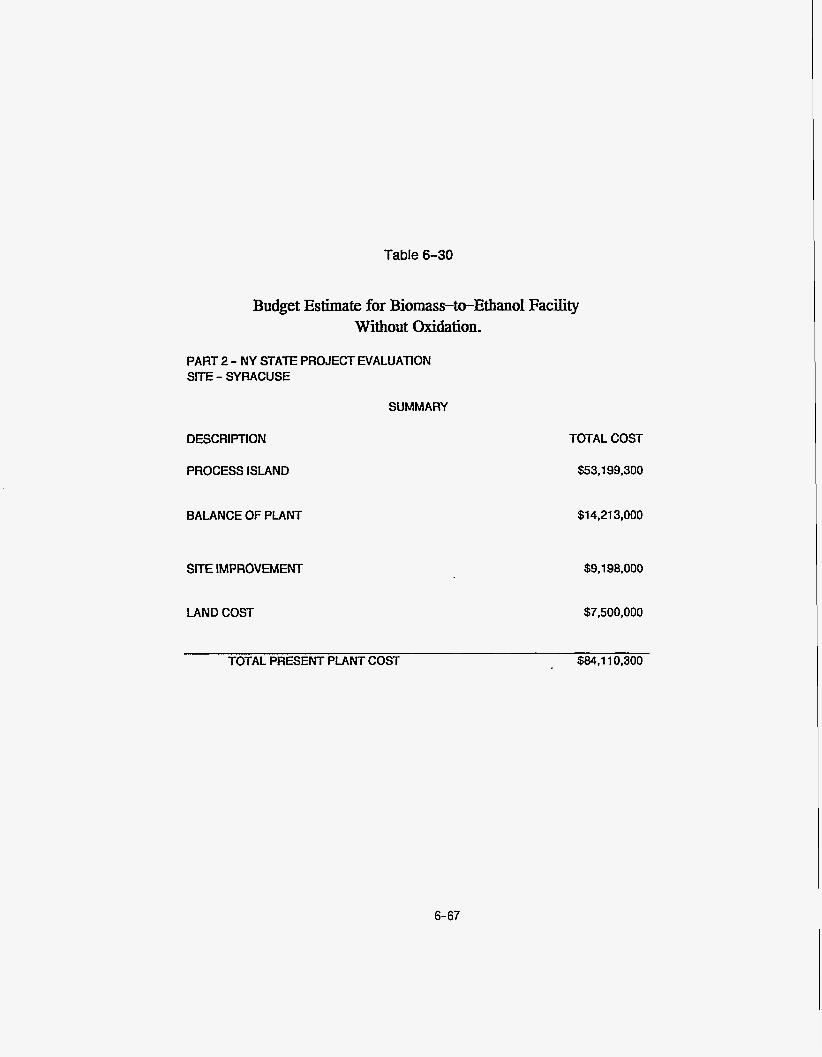
Table 6-30
Budget Estimate for Biomass-*Ethanol Facility Without Oxidation.
PART 2 - NY STATE PROJECT EVALUATION SITE - SYRACUSE
SUMMARY
DESCRIPTION
PROCESS ISLAND
BALANCE OF PLANT
SITE IMPROVEMENT
LAND COST
TOTAL COST
$53,199,300
$14,213,000
$9,198,000
$7,500.000
TOTAL PRESENT PLANT COST $84.1 10,300
6-67
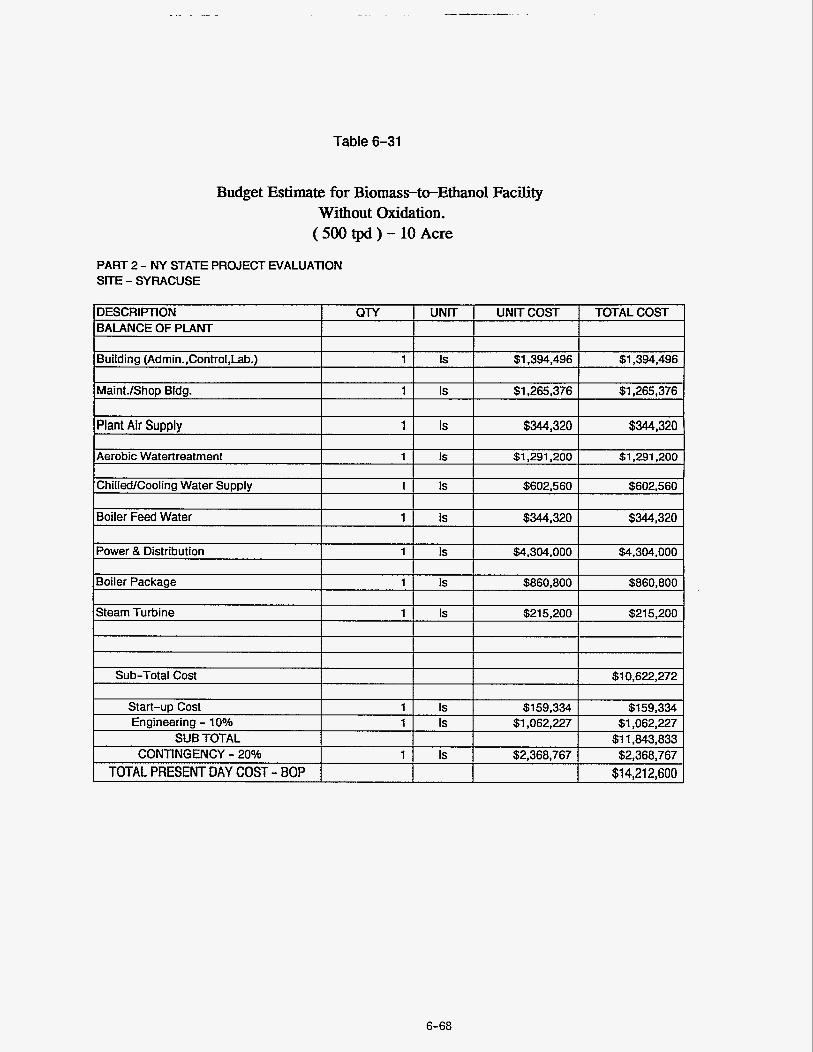
Table 6-31
Budget Estimate for Biomass-to-Ethanol Facility Without Oxidation. ( 500 tpd ) - 10 Acre
PART 2 - NY STATE PROJECT EVALUATION SITE - SYRACUSE
DESCRIPTION QW UNIT UNIT COST TOTAL COST BALANCE OF PLANT
Building (Admin.,Control,Lab.) 1 Is $1,394,496 $1,394,496
MaintJShop Bldg. 1 Is $1,26!5,376 $1,265,376
Plant Air Supply Is $344,320 I $344,320 I
I I I I
Sub-Total Cost $10,622,272
Start-up Cost 1 Is $159,334 $159,334 Engineering - 10% 1 Is $1,062,227 $1,062,227
SUB TOTAL $1 1,843,833 CONTINGENCY - 20% 1 Is $2,368,767 $2,368,767
$14,212,600 TOTAL PRESENT DAY COST - BOP
6-68
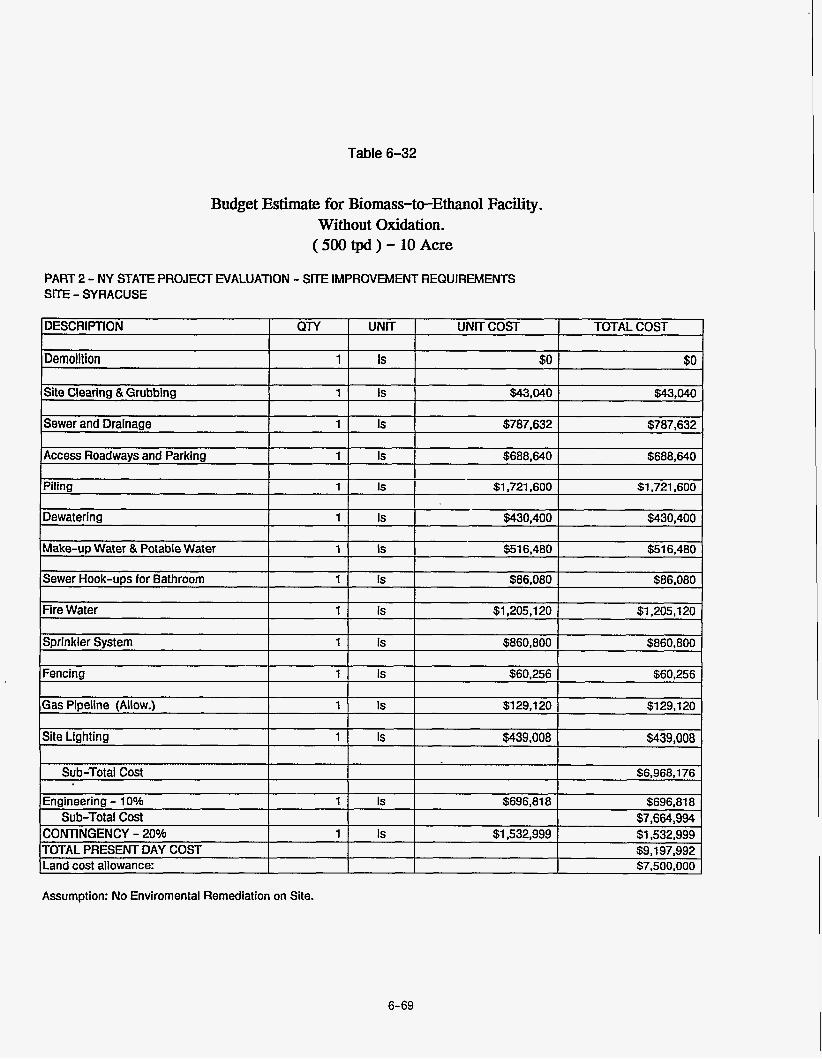
Table 6-32
Budget Estimate for Biomass-twEthanol Facility. Without Oxidation. ( 500 tpd ) - 10 Acre
PART 2 - NY STATE PROJECT EVALUATION - SITE IMPROVEMENT REQUIREMENTS SITE - SYRACUSE
Assumption: No Enviromental Remediation on Site.
6-69
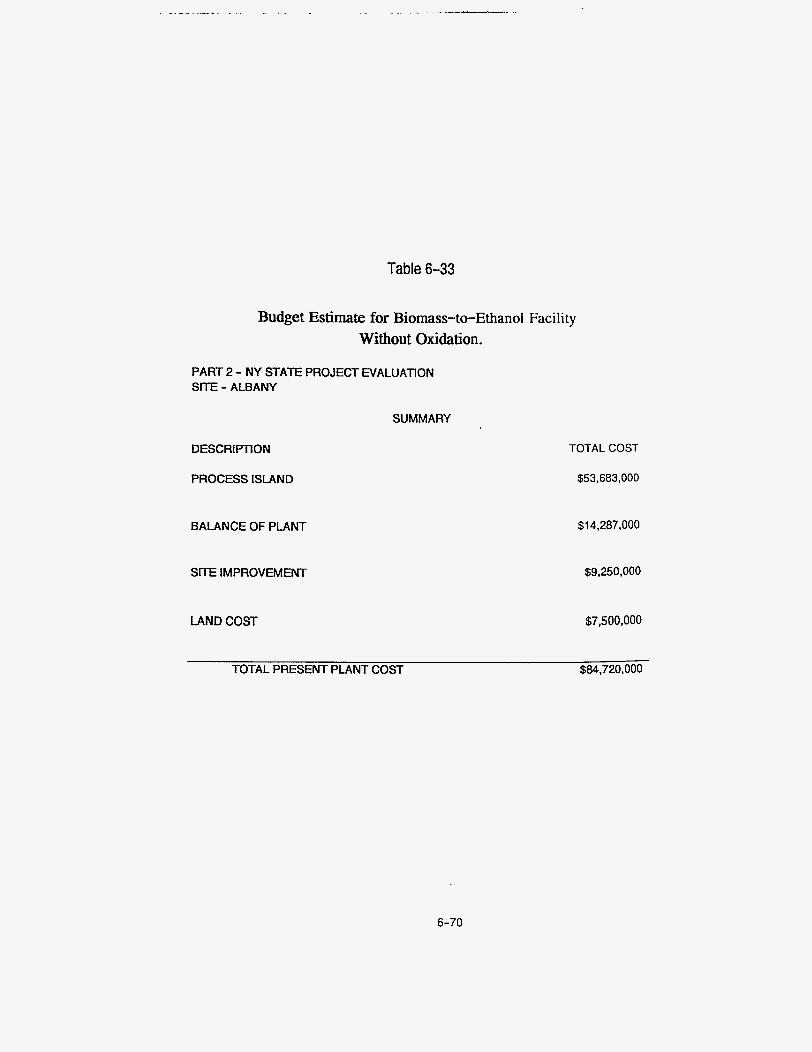
Table 6-33
Budget Estimate for Biomass-to-Ethanol Facility Without Oxidation.
PART 2 - NY STATE PROJECT EVALUATION SITE - ALBANY
SUMMARY
DESCRIPTION
PROCESS ISLAND
BALANCE OF PLANT
SITE IMPROVEMENT
LAND COST
TOTAL COST
$53.683.000
$14,287,000
$9,250,000
$7,500,000
TOTAL PRESENT PLANT COST $84,720,000
6-70
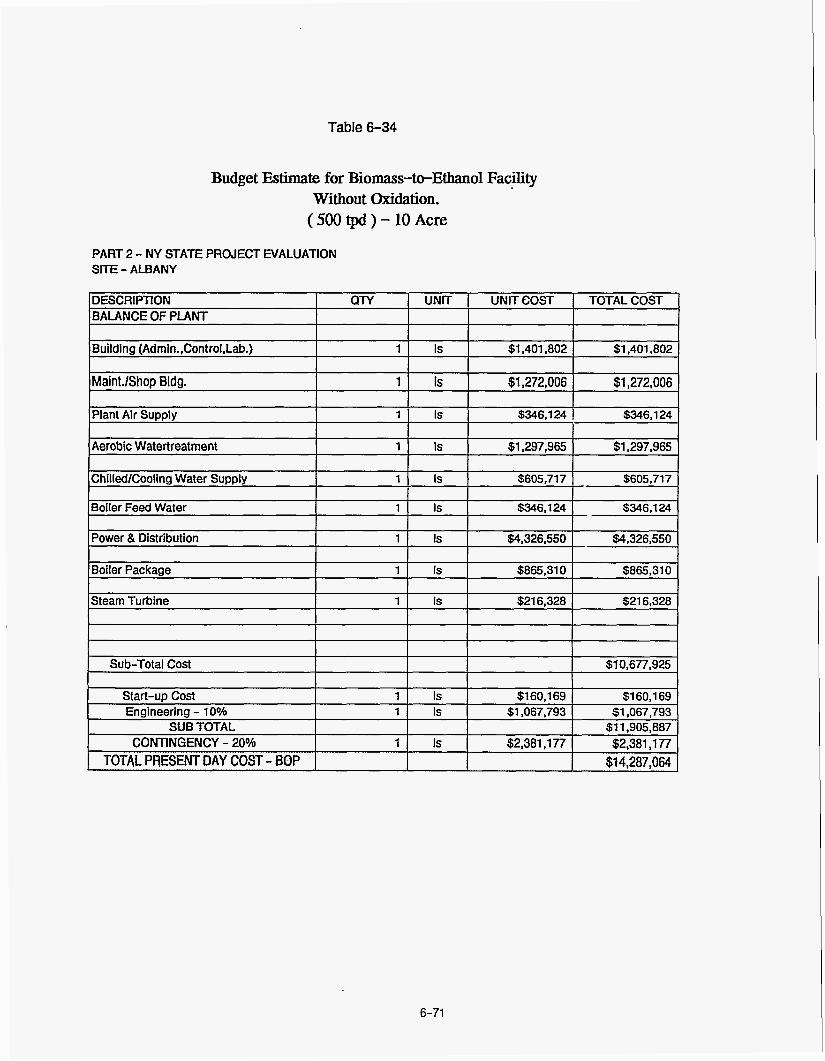
Table 6-34
DESCRIPTION
Budget Estimate for Biomass-twEthano1 Facility Without Oxidation. ( 500 tpd ) - 10 Acre
QTY I UNIT I UNITCOST I TOTAL COST
PART 2 - NY STATE PROJECT EVALUATION SITE - ALBANY
Building (Admin.,Control,Lab.)
Maint./Shop Bldg.
Plant Air Supply
1 Is $1,401.802 $1,401,802
1 Is $1,272,006 $1,272,006
1 Is $346,124 . $346,124 I
ChilledlCooling Water Supply
I I I I Aerobic Watertreatment 1 1 Is $1.297.965 I $1.297.965
1 Is $605.717 $605.717
Boiler Feed Water
Power & Distribution
1 Is $346.1 24 $346,124
1 Is $4.326.550 $4.326.550
Boiler Package I Is $865.310 I ~ $865,310 I I I
Steam Turbine 1 Is $21 6.328 $21 6,328
Sub-Total Cost
Start-up Cost Engineering - 10%
SUB TOTAL
TOTAL PRESENT DAY COST - BOP CONTINGENCY - 20%
6-71
$10,677,925
1 Is $160,169 $1 60,169 1 Is $1,067,793 $1,067,793
$1 1,905,887 1 Is $2,381,177 $2,381,177
$14,287,064

Table 6-35
Make-uD Water 8 Potable Water 1 1 Is
Budget E s h t e for Biomass-to-Ethanol Facility Without Oxidation. (500 tpd ) - 10 Acre
$519.600 I 3519.600
PART 2 - NY STATE PROJECT EVALUATION - SITE IMPROVEMENT REQUIREMENTS SITE - ALBANY
Engineering - 10% Sub-Total Cost
CONTINGENCY - 20% TOTAL PRESENT DAY COST Land cost allowance:
1 Is $701,027 $701,027 $7.71 1,297
1 Is $1,542,259 $1,542,259 $9,253,556 $7.500.000
Assumption: No Enviromental Remediation on Site.
6-72
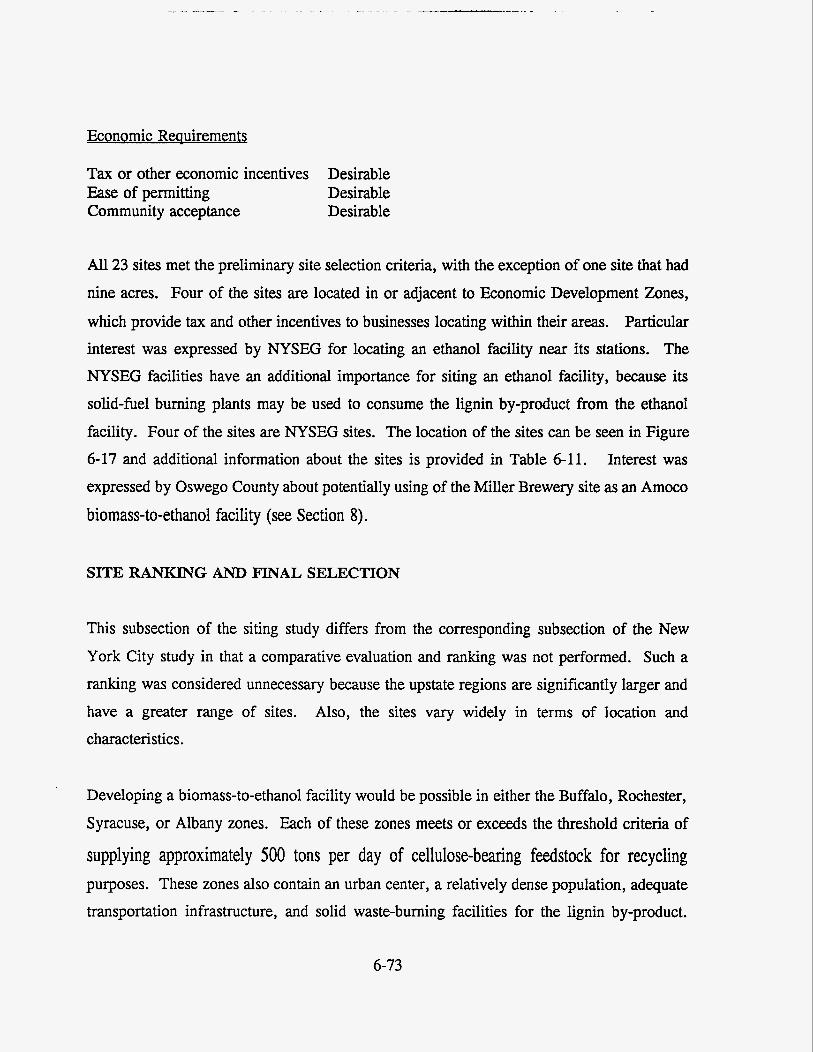
. . _. . . . .. . . . --
Economic Requirements
Tax or other economic incentives Desirable Ease of permitting Desirable Community acceptance Desirable
All 23 sites met the preliminary site selection criteria, with the exception of one site that had
nine acres. Four of the sites are located in or adjacent to Economic Development Zones,
which provide tax and other incentives to businesses locating within their areas. Particular interest was expressed by NYSEG for locating an ethanol facility near its stations. The NYSEG facilities have an additional importance for siting an ethanol facility, because its
solid-fuel burning plants may be used to consume the lignin by-product from the ethanol
facility. Four of the sites are NYSEG sites. The location of the sites can be seen in Figure 6-17 and additional information about the sites is provided in Table 6-11. Interest was
expressed by Oswego County about potentially using of the Miller Brewery site as an Amoco
biomass-to-ethanol facility (see Section 8).
LFITE RANKING AND FINAL SELECTION
This subsection of the siting study differs from the corresponding subsection of the New
York City study in that a comparative evaluation and ranking was not performed. Such a
ranking was considered unnecessary because the upstate regions are significantly larger and
have a greater range of sites. Also, the sites vary widely in terms of location and
characteristics.
Developing a biomass-to-ethanol facility would be possible in either the Buffalo, Rochester,
Syracuse, or Albany zones. Each of these zones meets or exceeds the threshold criteria of
supplying approximately 500 tons per day of cellulose-bearing feedstock for recycling purposes. These zones also contain an urban center, a relatively dense population, adequate transportation infrastructure, and solid waste-burning facilities for the lignin by-product.
6-73
Siting an ethanol facility in any of these zones would help distribute economic development more equitably throughout the state and resolve solid waste management problems in the
upstate region.
Other areas that would be feasible for a biomass-to-ethanol facility and could benefit from
proximity to such a waste-to-energy plant are the Long Island and Westchester regions. Although not included in this phase of the study, they may be considered in a future study. Each of these regions rivals the amount of solid waste generated in New York City. Individ-ually, New York City, Westchester, and Long Island rank as the top three regions for commercial and industrial waste generation in the State, and together they far outweigh the rest of the regions (see Figure 6-18). Figure 6-19 demonstrates that waste generation has been concentrated historically in Long Island and Westchester as well as in New York City. Not only do Long Island and Westchester rank highly in terms of waste generation, but they also have fairly dense populations and transportation infrastructures that would facilitate the logistics of locating and transferring waste. These two regions could act as self-contained
units, each supporting its own biomass-to-ethanol facility.
6-74
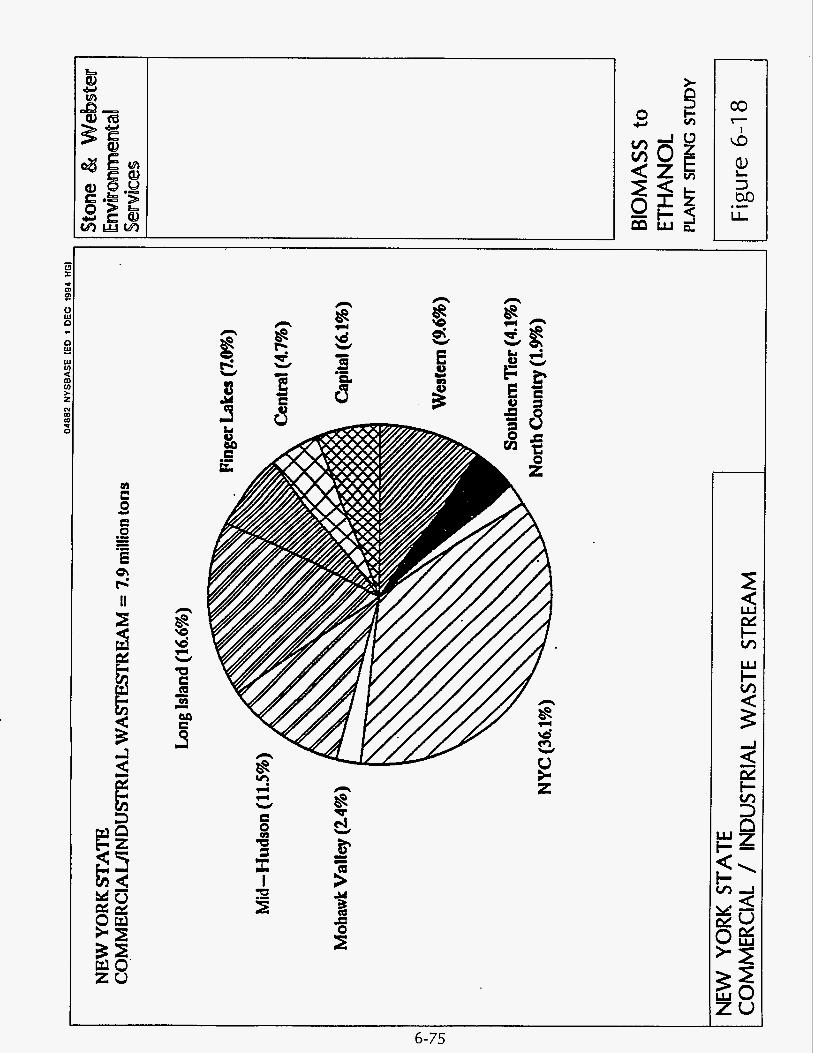
6-75
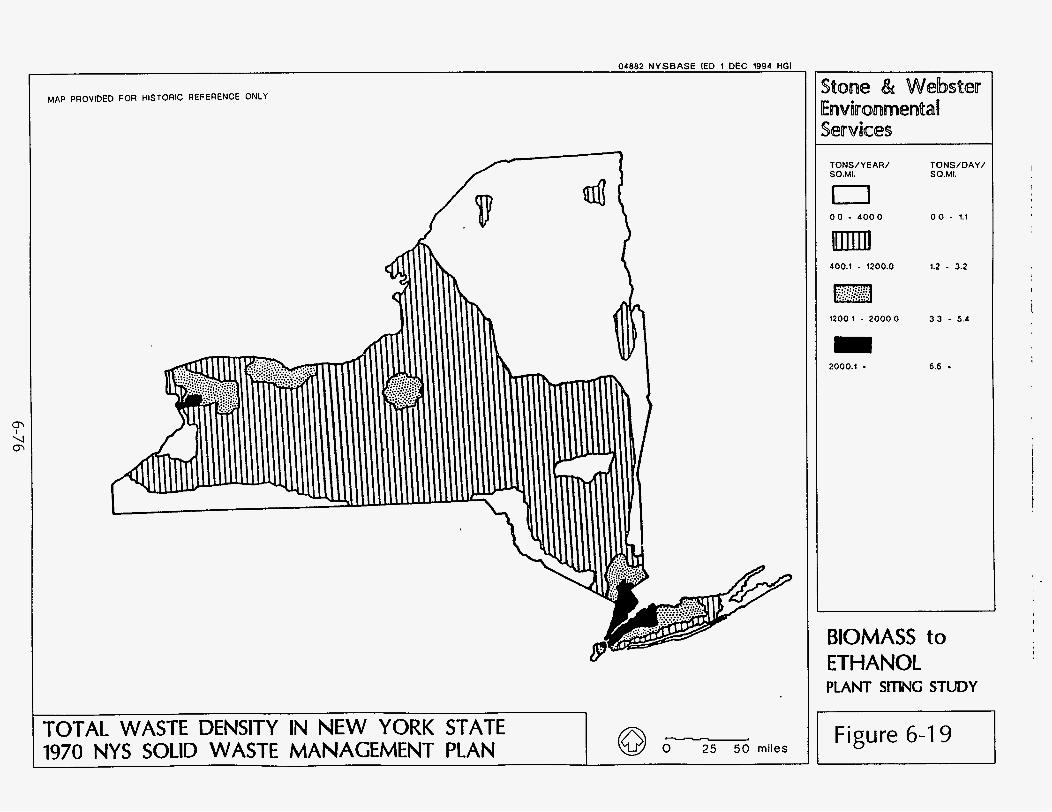
04882 N Y S B A S E (ED 1 D E C 1994 HGI
MAP PROVIDED FOR HISTORIC REFERENCE ONLY
TOTAL WASTE DENSITY IN NEW YORK STATE 1970 NYS SOLID WASTE MANAGEMENT PLAN 0 0 25 5 0 miles
TONS/YEAR/ SO.MI.
0 0 0 - 4 0 0 0
400.1 - 1200.0
1 2 0 0 1 - 2 0 0 0 0
TONS/DAY/ S(3.MI.
0 0 - 1.1
1.2 - 3.2
3 3 - 5 .4
2000.1 . 5.5 .
BIOMASS to ETHANOL PLANT SITING STUDY
1 Figure 6-19
SECTION 7 CAPITAL AND OPERATING COST ESTIMATES MIR PREFERRED SITES
This section defines the capital costs for a 500-tpd plant constructed in one of four regions: Buffalo, Rochester, Syracuse, and Albany. It addresses the options of on-site and off-site oxidation of the solids by-product. Unlike the Part I cost estimates that were determined for two specific sites in New York City, these estimates were determined for four urban regions, each of which contains multiple potential sites. As noted in Section 6 (Site Ranking and Final
Selection), the selection of preferred regional sites was considered u ~ e c e ~ ~ a r y because their variation in terms of location and characteristics made them easy to differentiate.
The capital costs in terms of the process island, balance of plant, site improvements, and land costs for all regions are shown in Tables 7-1 through 7-8. Supportive information for these costs is found in the Appendix as Attachments 7-1 through 7-8.
The operating costs for the plants are reflected in Section 8 (Financial Pro Formas).
7- 1
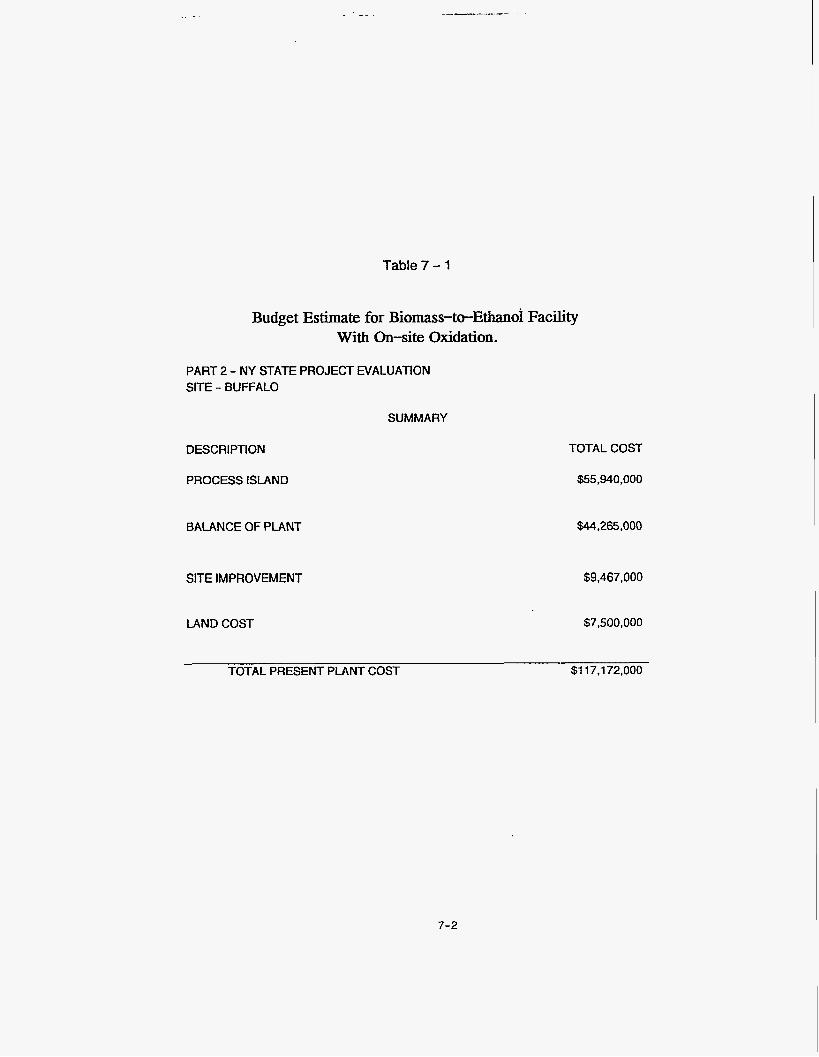
Table 7 - 1
Budget Estimate for Biomass-to-Ethanol Facility With &-site Oxidation.
PART 2 - NY STATE PROJECT EVALUATION SITE - BUFFALO
SUMMARY
DESCRIPTION
PROCESS ISLAND
BALANCE OF PLANT
SITE IMPROVEMENT
LAND COST
TOTAL COST
$55,940,000
$44,265,000
$9,467,000
$7,500,000
TOTAL PRESENT PLANT COST $1 17.1 72,000
7-2
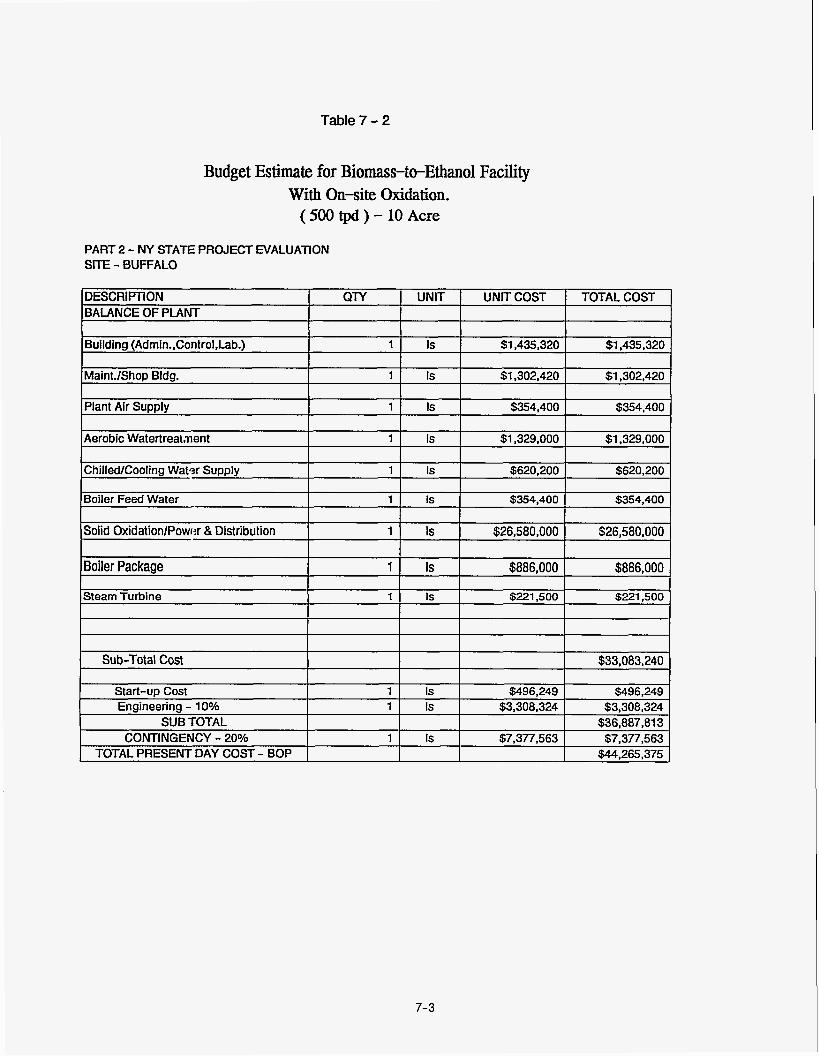
Table 7 - 2
I
IChilled/Cooling Watsr Supply
Boiler Feed Water
Budget Estimate for Biomass-teEthanol Facility With On-site Oxidation. (500 tpd) - 10 Acre
1 Is $620,200 $620,200
1 Is $354,400 $354,400
PART 2 - NY STATE PROJECT WALUATION SITE - BUFFALO
Solid 0xidationlPowr:r & Distribution 1 Is $26,580,000 $26,580,000
Boiler Package 1 Is $8 8 6,O 0 0 $886,000
Steam Turbine 1 1 1 Is 1 $221,500 I $221.500 I I
Sub-Total Cost
~
$33.083.240
Start-up Cost Engineering - 10%
SUB TOTAL
TOTAL PRESENT DAY COST - BOP CONTINGENCY - 20%
7-3
1 Is $496.249 $496,249 1 Is $3,308,324 $3,308,324
$36,887,813 1 Is $7,377,563 $7,377,563
$44,265,375
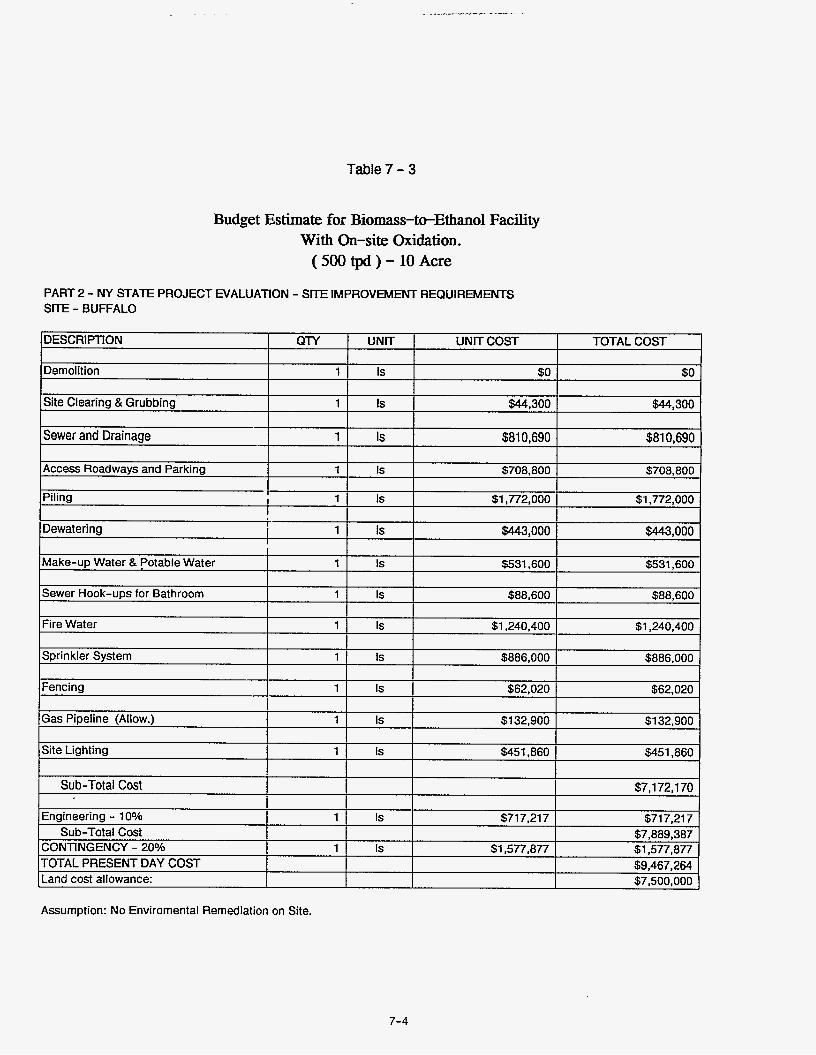
Table 7 - 3
DESCRIPTION
Demolition
Budget Estimate for Biomass-twEthanol Facility With On-site Oxidation. ( 500 tpd ) - 10 Acre
QTY UNIT UNIT COST TOTAL COST
1 Is $0 $0
PART 2 - NY STATE PROJECT EVALUATION - SITE IMPROVEMENT REQUIREMENTS SITE - BUFFALO
Site Clearing & Grubbing
Sewer and Drainage
Access Roadways and Parking
1 Is $44,300 $44,300
1 Is $81 0,690 $81 0,690
1 Is $708,800 $708,800
Piling I 1 Is $1,772,000 $1,772,000
Gas Pipeline (Allow.)
Site Lighting
1 Is $1 32,900 $1 32,900
1 Is $451,860 $451,860
Assumption: No Enviromental Remediation on Site.
Sub-Total Cost
7-4
$7,172,170
Engineering - 10% Sub-Total Cost
CONTINGENCY - 20% TOTAL PRESENT DAY COST Land cost allowance:
1 Is $717,217 $717,217 $7,889,387
1 Is $1,577,877 $1,577,877 $9,467,264 $7,500,000

Table 7 - 4
Budget Estimate for Biomass-to-Ethanol Facility Without Oxidation.
PART 2 - NY STATE PROJECT EVALUATION SITE - BUFFALO
SUMMARY
DESCRIPTION
PROCESS ISLAND
BALANCE OF PLANT
SITE IMPROVEMENT
LAND COST
TOTAL COST
$55,940,000
$1 4,628,000
$9,467,000
$7,500,000
TOTAL PRESENT PLANT COST , $87,535.000
7-5

Table 7 - 5
DESCRIPTION BALANCE OF PLANT
Budget Estimate for Biomass-twEthano1 Facility Without Oxidation.
( 500 tpl ) - 10 Acre
QlY UNIT UNIT COST TOTAL COST
PART 2 - NY STATE PROJECT EVALUATION SITE - BUFFALO
Building (Admin.,Control,Lab.)
Maint./Shop Bldg.
1 Is $1,435,320 $1,435,320
1 IS $1,302,420 $1,302.420
Plant Air Supply
Aerobic Watertreatment
1 Is $354,400 $354,400
1 Is $1.329.000 $1.329.000
ChilledlCooling Water Supply I Is $620,200 1 $620,200
Boiler Feed Water
Power & Distribution
Boiler Package
Steam Turbine
1 Is $354,400 $354,400
1 Is $4,430,000 $4,430,000
1 Is $886,000 $886,000
1 Is $221 500 $221 500
Sub-Total Cost $10,933,240
7-6
Start-up Cost Engineering - 10%
SUB TOTAL
TOTAL PRESENT DAY COST - BOP CONTINGENCY - 20%
1 Is $1 63.999 $1 63,999 1 Is $1,093,324 $1,093,324
$12,190,563 1 IS $2,438,113 $2,438,113
$14.628.675
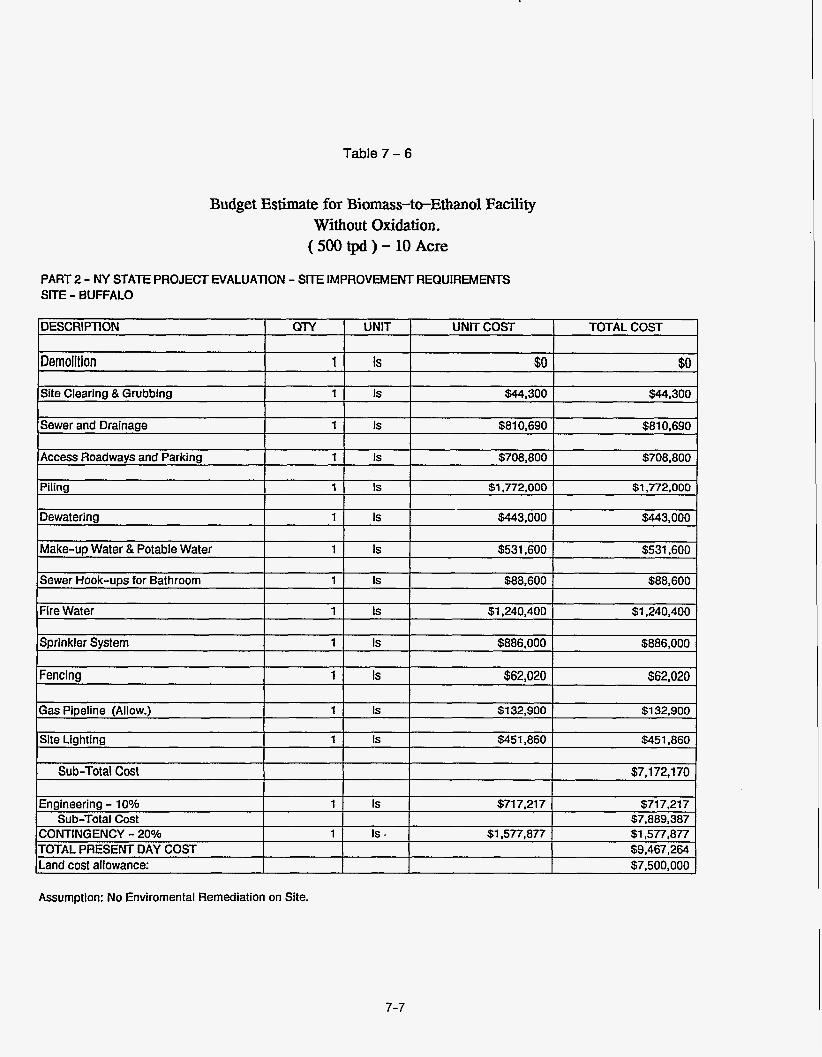
Table 7 - 6
Budget Estimate for Biomass-twEthano1 Facility Without Oxidation. ( 500 tpd ) - 10 Acre
PART 2 - NY STATE PROJECT EVALUATION - SITE IMPROVEMENT REQUIREMENTS SITE - BUFFALO
DESCRIPTION QTY UNIT UNIT COST TOTAL COST
Demolition 1 Is $0 $0
Sprinkler System I Is $886,000 I $886,000- I I I
Is $62,020 $62,020 Fencing 1
I I I I
Gas Pipeline (Allow.) 1 1 Is $132,900 I $1 32.900 I I I I
Assumption: No Enviromental Remediation on Site.
7-7
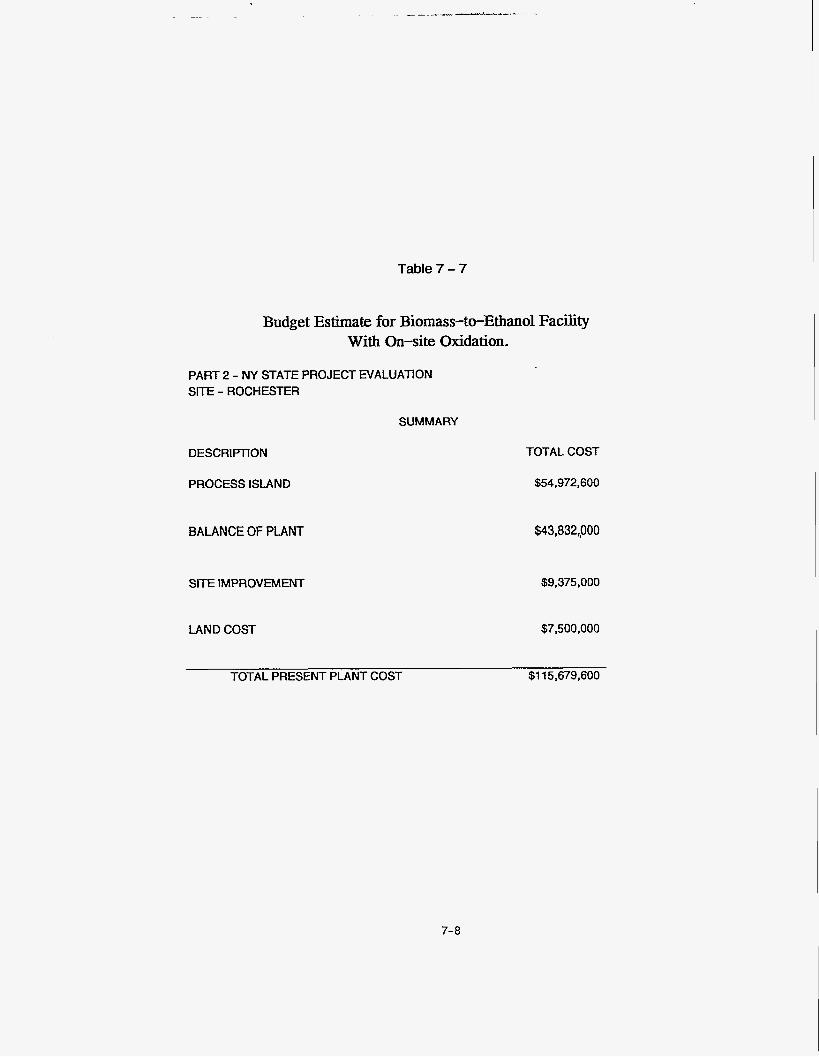
Table 7 - 7
Budget Estimate for Biomass-to-Ethanol Facility With On-site Oxidation.
PART 2 - NY STATE PROJECT EVALUATION SITE - ROCHESTER
SUMMARY
DESCRIPTION
PROCESS ISLAND
BALANCE OF PLANT
SITE IMPROVEMENT
TOTAL COST
$54,972,600
$43,832,,000
$9,375,000
LAND COST $7,500,000
TOTAL PRESENT PLANT COST $1 15,679,600
7-8

Table 7 - 8
Budget Estimate for Biomass-to-Ethanol Facility With On-site Oxidation. ( 500 tpd ) - 10 Acre
PART 2 - NY STATE PROJECT EVALUATION SITE - ROCHESTER
DESCRlfllON QlY I UNIT I UNITCOST I TOTAL COST BALANCE OF PLANT I I I I
~
Sub-Total Cost $32,759,502
Start-up Cost 1 Is $491,393 $491,393 Engineering - 10% 1 Is $3,275.950 $3,275,950
SUB TOTAL $36,526,845 CONTINGENCY - 20% 1 Is $7,305,369 $7,305,369
$43,832,214 TOTAL PRESENT DAY COST - BOP
7-9
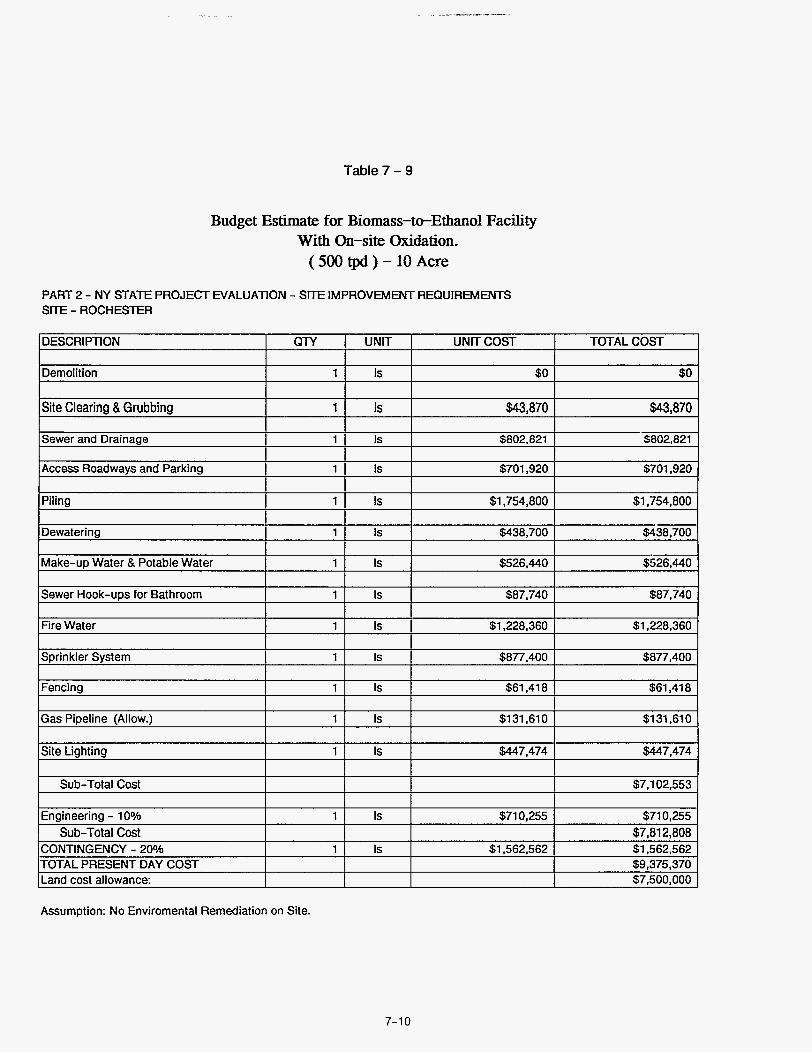
Table 7 - 9
Demolition
Budget Estimate for Biomass-twEthano1 Facility With On-site Oxidation.
( 500 tpd ) - 10 Acre
1 1 Is $0 I $0
PART 2 - NY STATE PROJECT EVALUATION - SITE IMPROVEMENT REQUIREMENTS SITE - ROCHESTER
Site Clearina & Grubbina 11 Is $43.870 I $43.870
Access Roadways and Parking
Piling
Dewatering
1 Is $701,920 $701,920
1 Is $1,754,800 $1,754,800
1 Is $438,700 $438,700
Sewer and Drainaae I 1 1 Is I $802.821 I
Make-up Water & Potable Water
Sewer Hook-uDs for Bathroom
1 IS $526,440 $526,440
1 IS $87.740 $87.740
Fire Water 1 1 IS $1.228.360 I $1.228.360
Sprinkler System
Fencing
1 Is $877,400 $877,400
1 Is $61,418 $61.41 8
Gas Pipeline (Allow.)
Site Lighting
Sub-Total Cost
Assumption: No Enviromental Remediation on Site.
1 Is $1 31,610 $1 31.61 0
1 Is $447,474 $447,474
$7,102,553
7-10
Engineering - 1 O o h Sub-Total Cost
CONTINGENCY - 20% TOTAL PRESENT DAY COST Land cost allowance:
1 Is $71 0,255 $71 0,255 $7,812,808
1 Is $1,562,562 $1,562,562 $9,375,370 $7,500,000
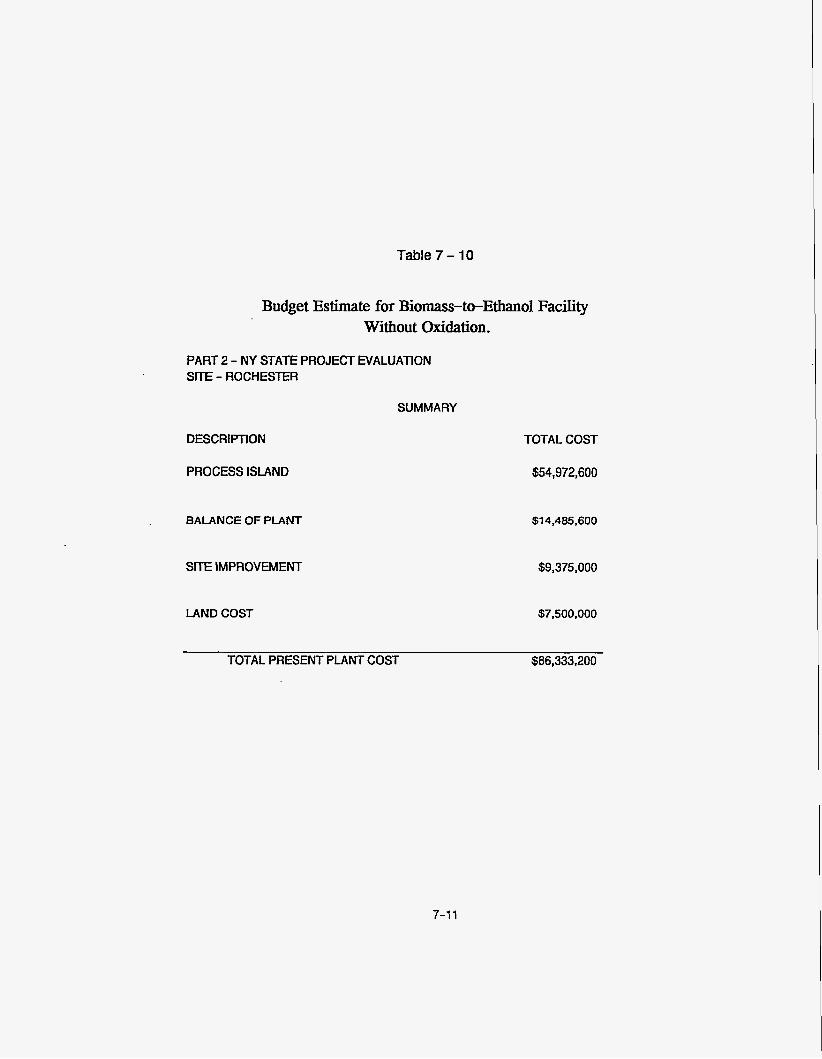
Table 7 - 10
Budget Estimate for Biomass-twEthanol Facility Without Oxidation.
PART 2 - NY STATE PROJECT EVALUATION SITE - ROCHESTER
SUMMARY
DESCRIPTION
PROCESS ISLAND
BALANCE OF PLANT
TOTAL COST
$54,972,600
$14,485,600
SITE lMPROVEh4ENT
LAND COST
TOTAL PRESENT PLANT COST $86,333,200
$9,375,000
$7,500,000
7-1 1

Table7-11
Aerobic Watertreatment
Budget Estimate for Biomass-to-Ethanol Facility Without Oxidation. ( 500 tpd ) - 10 Acre
1 1 Is $1.315.950 I $1.315.950
PART 2 - NY STATE PROJECT EVALUATION SITE - ROCHESTER
ChilledlCooling Water Supply
Boiler Feed Water
Power & Distribution
1 Is $614,110 $614,110
1 Is $350,920 $350,920
1 Is $4,386,500 $4,3 8 6,5 0 0
Boiler Package
Steam Turbine
1 Is $877,300 $877,300
1 Is $219.325 $21 9,325
Sub-Total Cost $1 0,825,882
7-12
Start-up Cost Engineering - 10%
SUB TOTAL
TOTAL PRESENT DAY COST - BOP CONTINGENCY - 20%
1 Is $1 62.388 $1 62,388 1 Is $1,082,588 $1,082,588
$1 2,070,858 1 Is $2,414,172 $2,414,172
$1 4,485,030
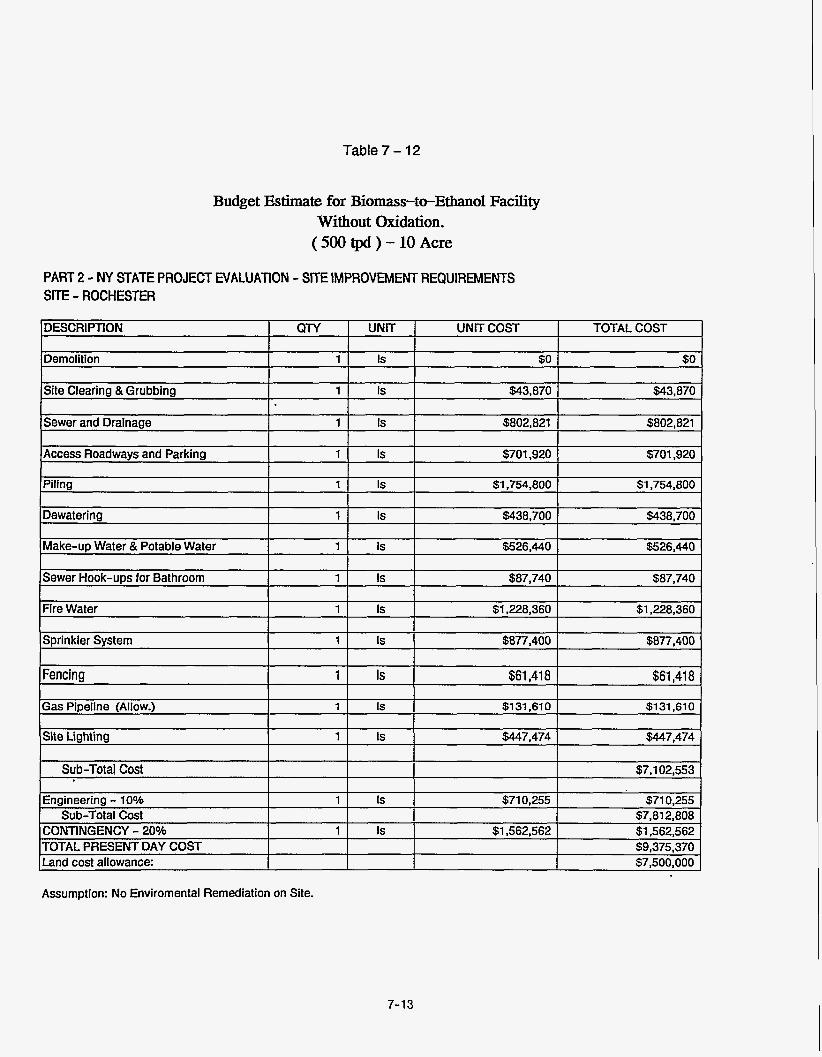
Table 7 - 12
Budget Estimate for Biomass-to-Ethanol Facility Without Oxidation. (500 tpd ) - 10 Acre
PART 2 - NY STATE PROJECT EVALUATION - SITE IMPROVEMENT REQUIREMENTS SITE - ROCHESTER
Assumption: No Enviromental Remediation on Site.
7-13
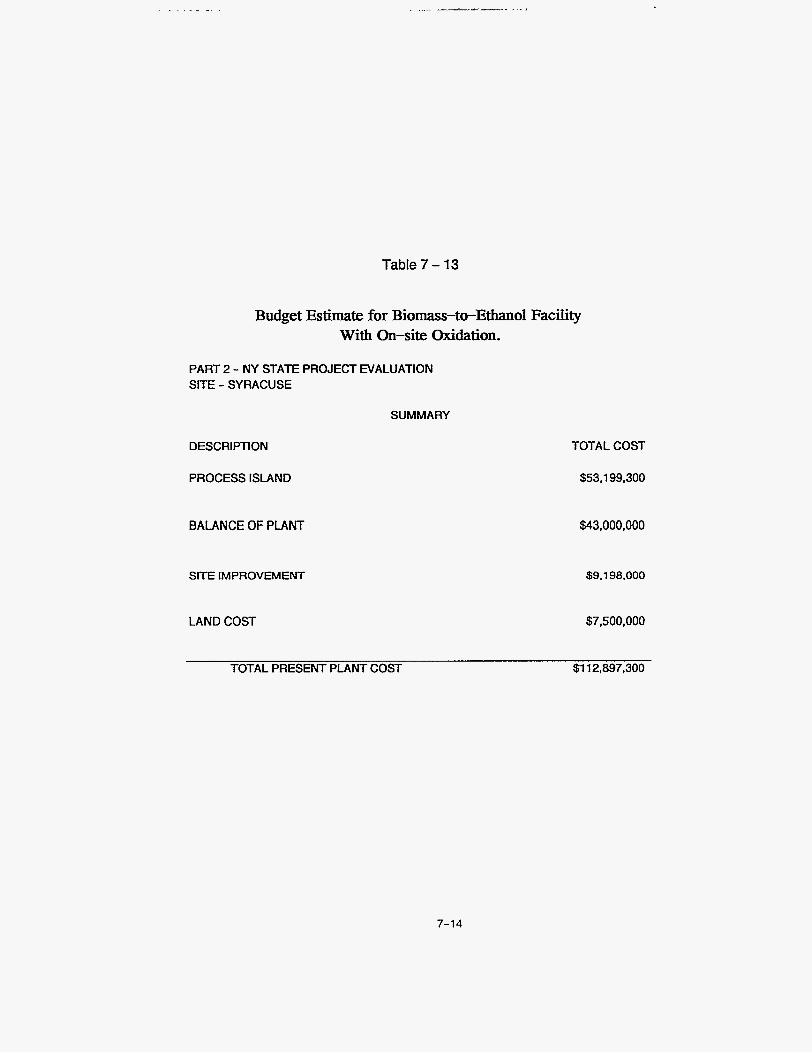
Table 7 - 13
Budget Estimate for Biomass-to-Ethanol Facility With On-site Oxidation.
PART 2 - NY STATE PROJECT EVALUATION SITE - SYRACUSE
SUMMARY
DESCRIPTION TOTAL COST
PROCESS ISLAND $53.1 99.300
BALANCE OF PLANT $43,000,000
SITE IMPROVEMENT $9.1 9a.ooo
LAND COST $7,500,000
TOTAL PRESENT PLANT COST $1 12,897,300
7-14
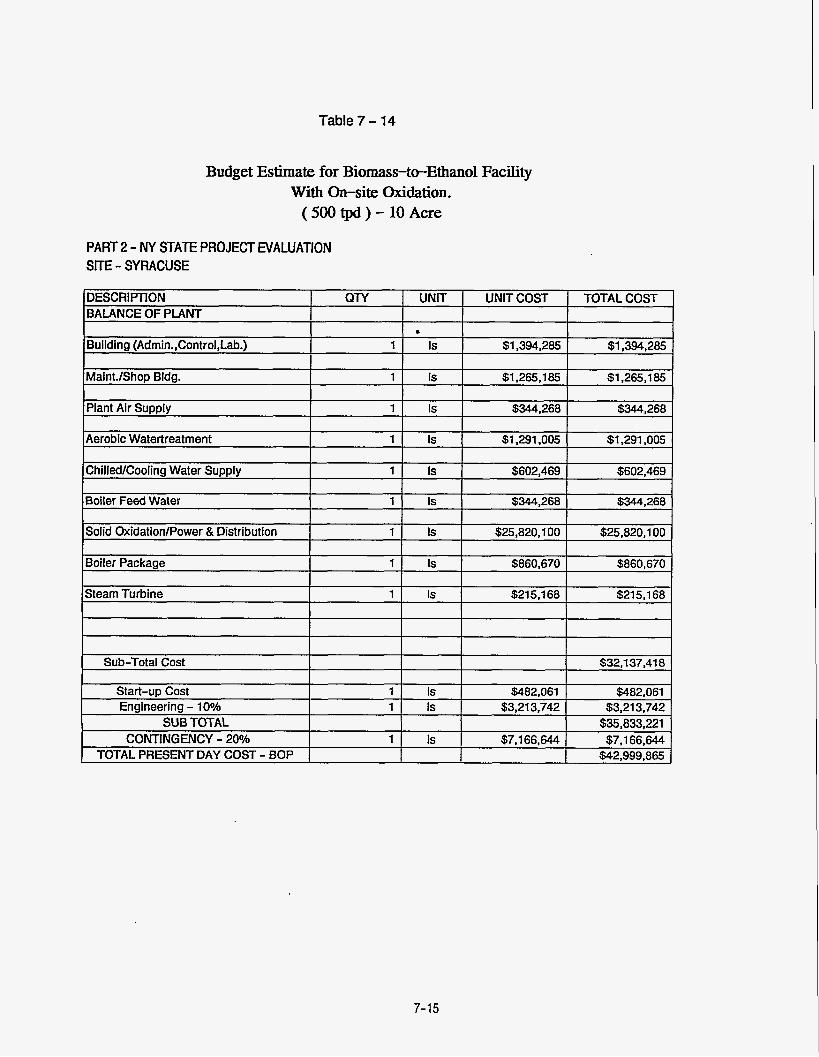
Table 7 - 14
BALANCE OF PLANT
Budget Estimate for Biomass-to-Ethanol Facility With &-site Oxidation.
( 500 tpd ) - 10 Acre
I I
PART 2 - NY STATE PROJECT EVALUATION SITE - SYRACUSE
Start-up Cost Engineering - 10%
SUB TOTAL
TOTAL PRESENT DAY COST - BOP CONTINGENCY - 20%
1 Is $482,061 $482,061 1 Is $3,213,742 $3,213,742
$35,833,221 1 Is $7,166,644 $7,166,644
$42,999,865
I I I I
I I I I
Sub-Total Cost I $32.137.41 8 I I I
7-15
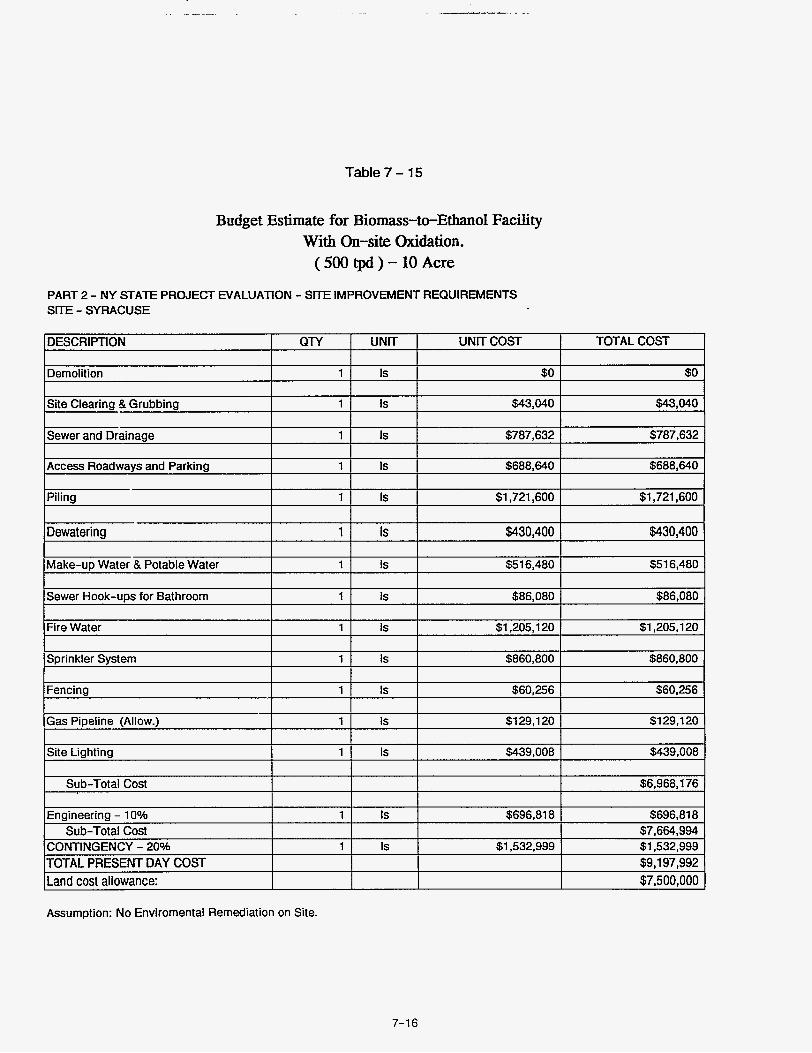
Table 7 - 15
Budget Estimate for Biomass-to-Ethanol Facility With On-site Oxidation.
( 500 tpd ) - 10 Acre
PART 2 - NY STATE PROJECT EVALUATION - SITE IMPROVEMENT REQUIREMENTS SITE - SYRACUSE
Assumption: No Enviromental Remediation on Site.
7-16

Table 7 - 16
Budget Estimate for Biomass-twEthano1 Facility Without Oxidation.
PART 2 - NY STATE PROJECT EVALUATION SITE - SYRACUSE
SUMMARY
DESCRIPTION
PROCESS ISLAND
B.4LANCE OF PLANT
SITE IMPROVEMENT
TOTAL COST
$53,199,300
$14.21 3,000
$9,198,000
LAND COST $7,500,000
TOTAL PRESENT PLANT COST $84,110,300
7-17
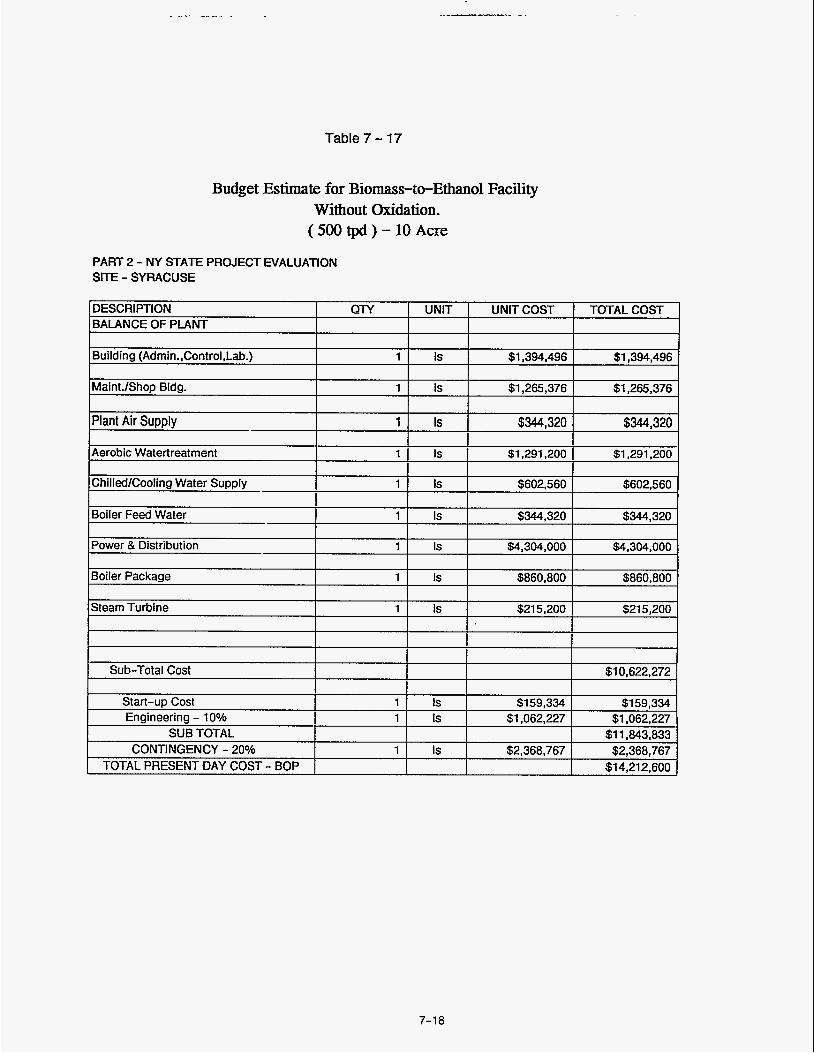
Table 7 - 17
DESCRlRlON
Budget Estimate for Biomass-to-Ethanol Facility Without Oxidation.
(5OOtpd)-lOAcre
QTY I UNIT I UNITCOST I TOTAL COST
PART 2 - NY STATE PROJECT EVALUATION S m - SYRACUSE
BALANCE OF PLANT I I I
Engineering - 10% SUB TOTAL
TOTAL PRESENT DAY COST - BOP CONTINGENCY - 20%
Start-uD Cost I I t Is I $159.334 I $159.334 I 1 Is $1,062,227 $1,062,227
1 Is $2,368,767 $2,368,767 Sl4.212.6fIfl
$1 1,843,833
7-18

PART 2 - NJ
TOTAL PRESENT DAY COST
ST
I $9,197,992
Table 7 - 18
Land cost allowance:
Budget Estimate for Biomass-to-Ethanol Facility Without Oxidation. ( 500 tpd ) - 10 Acre
$7,500,000
TE PROJECT NALUATlON - SITE IMPROVEMENT REQUIREMENTS
Assumption: No Enviromental Remediation on Site.
7-1 9

_. .... . ..~ - . .
Table 7 - 19
Budget Estimate for Biomass-twEthano1 Facility With On-site Oxidation.
PART 2 - NY STATE PROJECT EVALUATION SITE - ALBANY
SUMMARY
DESCRIPIION
PROCESS ISLAND
BALANCE OF PLANT
SITE IMPROVEMENT
LAND COST
TOTAL COST
$53,683,000
$43,250,000
$9,250,000
$7,500,000
TOTAL PRESENT PLANT COST $1 13,683,000
7-20
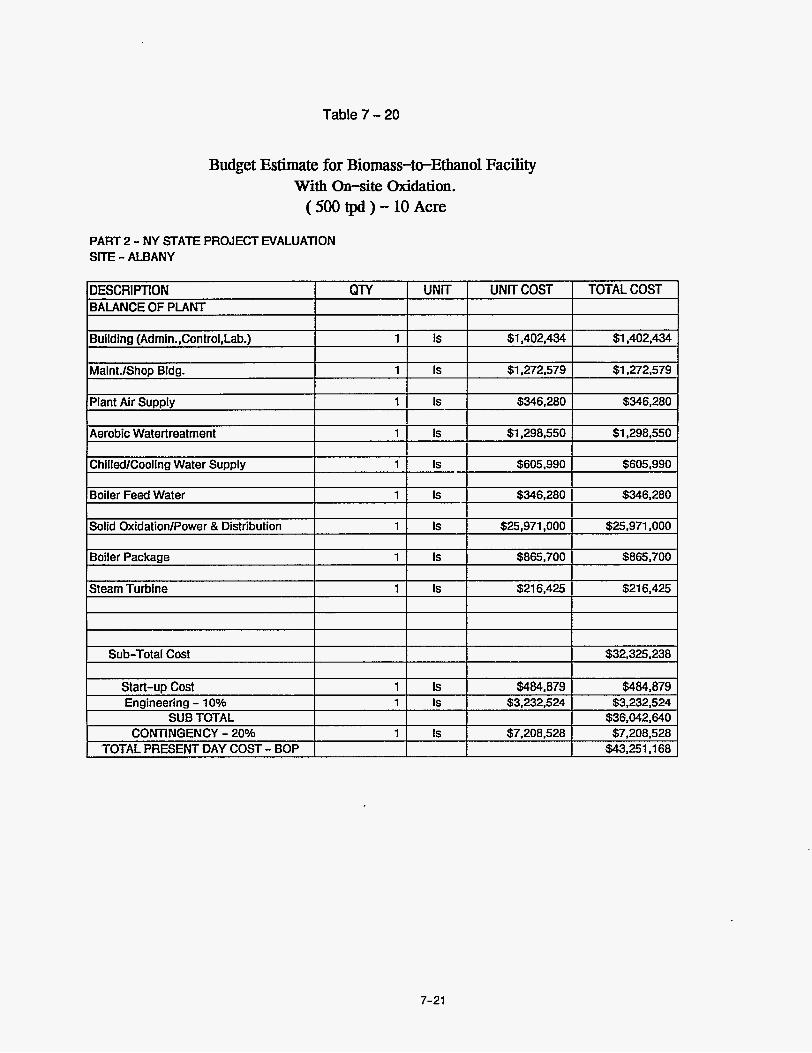
Table 7 - 20
DESCRIPTION QTY UNIT UNIT COST BALANCE OF PLANT'
Building (Admin.,Control,Lab.) 1 Is $1,402,434
MaintJShoD Bldo. 1 Is $1.272.579
Budget Estimate for Biomass-to-Ethanol Facility With On-site Oxidation.
( 500 tpd ) - 10 Acre
TOTAL COST
$1,402,434
$1.272.579
PART 2 - NY STATE PROJECT EVALUATION SITE - ALBANY
Plant Air Supply
Aerobic Watertreatment
1 Is $346,280 $346,280
1 Is $1,298,550 $1,298,550
Boiler Feed Water 1 1 Is $346.280 I $346.280
Solid OxidationlPower & Distribution 1 1 Is $25.971.000 I $25.971 .OOO
Boiler Package
Steam Turbine
1 Is $865,700 $865,700
1 Is $21 6,425 $21 6,425
Sub-Total Cost
7-21
$32,325.238
Start-up Cost Engineering - 10%
SUB TOTAL
TOTAL PRESENT DAY COST - BOP CONTINGENCY - 20%
1 Is $484,879 $484,879 1 Is $3,232,524 $3,232,524
$36,042,640 1 Is $7,208,528 $7,208,528
$43,251.1 68
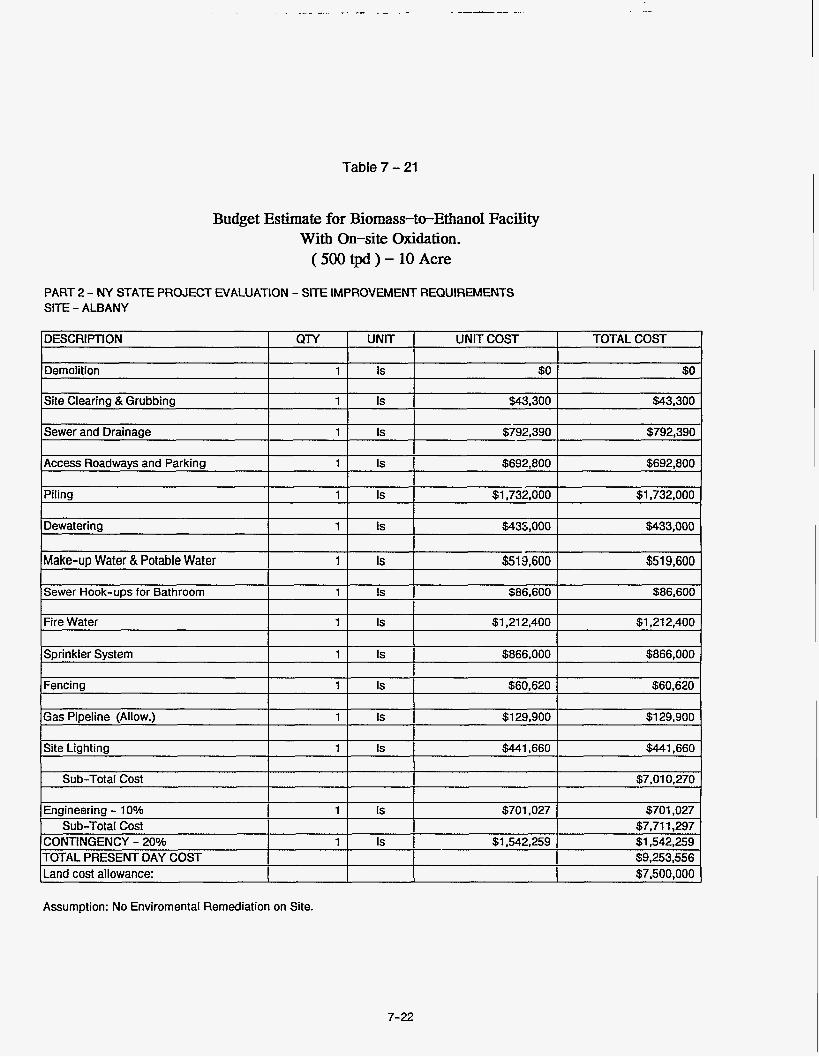
Table 7 - 21
Budget Estimate for Biomass-to-Ethanol Facility With On-site Oxidation.
( 500 tpd ) - 10 Acre
PART 2 - NY STATE PROJECT EVALUATION - SITE IMPROVEMENT REQUIREMENTS SITE - ALBANY
IDESCRIPTION QlY I UNIT I UNIT COST TOTAL COST
IMake-uD Water & Potable Water I 1 1 Is I $519.600 I $51 9.600
Sewer Hook-uDs for Bathroom I 1 1 Is $86.600 I $86.600
Fire Water 1 1 Is $1,212,400 I $1.21 2.400
Sprinkler System 1 Is $866,000 $866,000
Fencing 1 Is $60,620 $60,620
Gas Pipeline (Allow.) 1 Is $1 29,900 $1 29.900
Site Lighting I 1 1 Is $441.660 I $441,660
Sub-Total Cost $7.01 0,270
Engineering - 10% 1 Is $701,027 $701,027 Sub-Total Cost $7,711,297
CONTINGENCY - 20% 1 Is $1.542.259 $1.542.259 . . . . ITOTAL PRESENT DAY COST $9.253.556
I Land cost allowance: I I I I $7,500,000
Assumption: No Enviromental Remediation on Site.
7-22
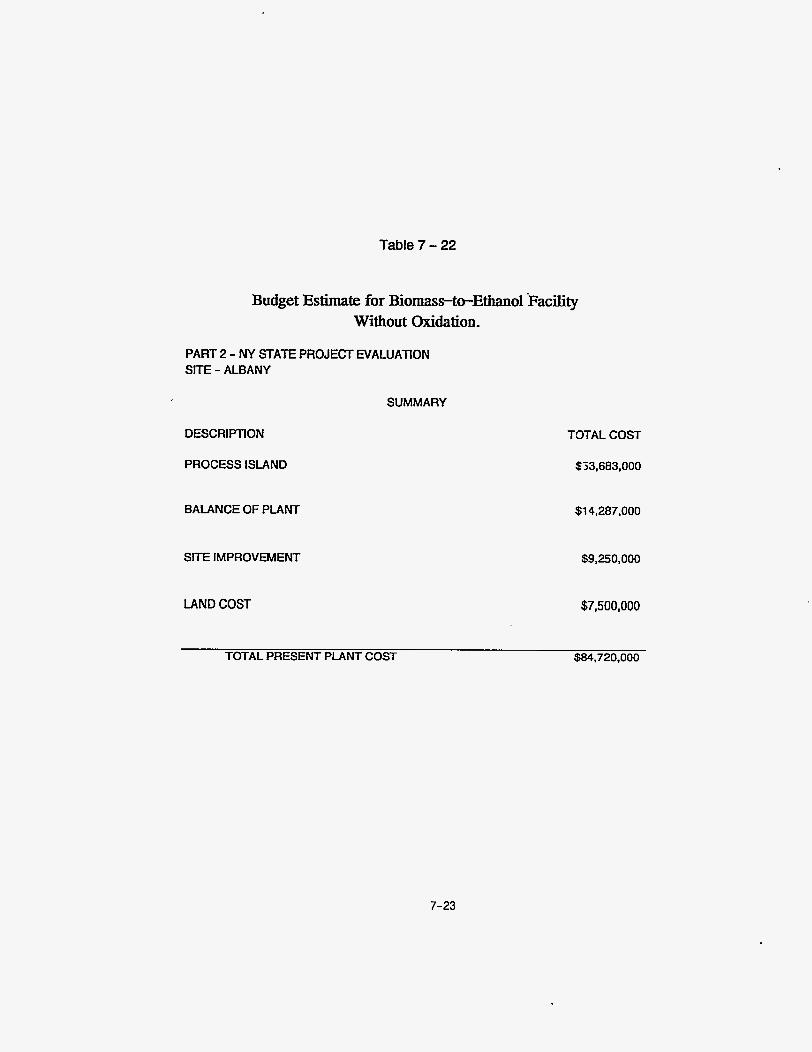
Table 7 - 22
Budget Estimate for Biomass-twEthano1 Facility Without Oxidation.
PART 2 - NY STATE PROJECT EVALUATION SITE - ALBANY
SUMMARY
DESCRlPnON
PROCESS ISLAND
BALANCE OF PLANT
SITE IMPROVEMENT
LAND COST
TDTAL COST
953,683,000
$1 4,287,000
$9,250,000
$7,500,000
TOTAL PRESENT PLANT COST $84,720.000
7-23
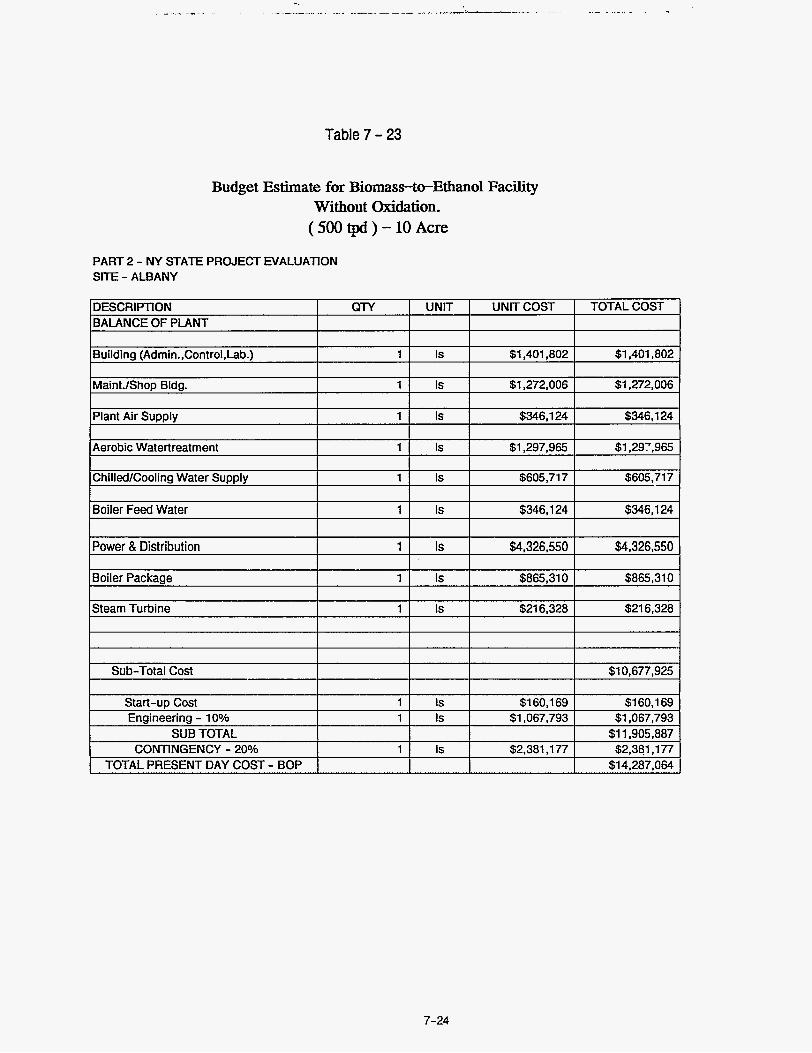
Table 7 - 23
Start-up Cost Engineering - 10%
SUB TOTAL
TOTAL PRESENT DAY COST - BOP CONTINGENCY - 20%
Budget Estimate for Biomass-to-Ethanol Facility Without Oxidation. ( 500 tpd ) - 10 Acre
1 Is $1 60.1 69 $1 60,169 1 Is $1,067,793 $1,067,793
$1 1,905,887 1 Is $2,381,177 $2,381,177
$14,287,064
PART 2 - NY STATE PROJECT EVALUATION SITE - ALBANY
Aerobic Watertreatment IS $1,297,965 I $1,297,965 I I
I I I I ChilledlCooling Water Supply 1 1 IS $605,717 I
IBoiler Feed Water I 1 1 Is I $346,124 I $346,124 I
7-24
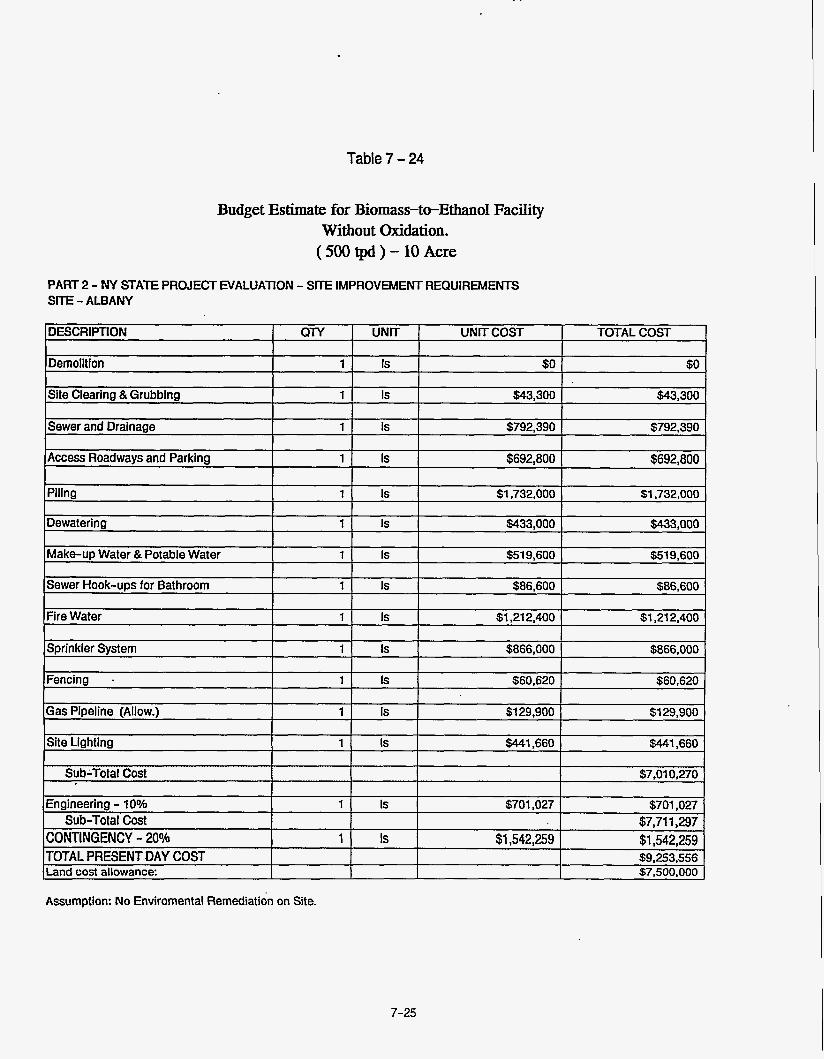
Table 7 - 24
TOTAL PRESENTDAY COST
Budget Estimate for Biomass-to-Ethanol Facility Without Oxidation. ( 500 tpd ) - 10 Acre
I $9,253,556
PART 2 - NY STATE PROJECT EVALUATION - SITE IMPROVEMENT REQUIREMENTS SITE - ALBANY
Land cost allowance: I I $7.500.000
Assumption: No Enviromental Remediation on Site.
7-25
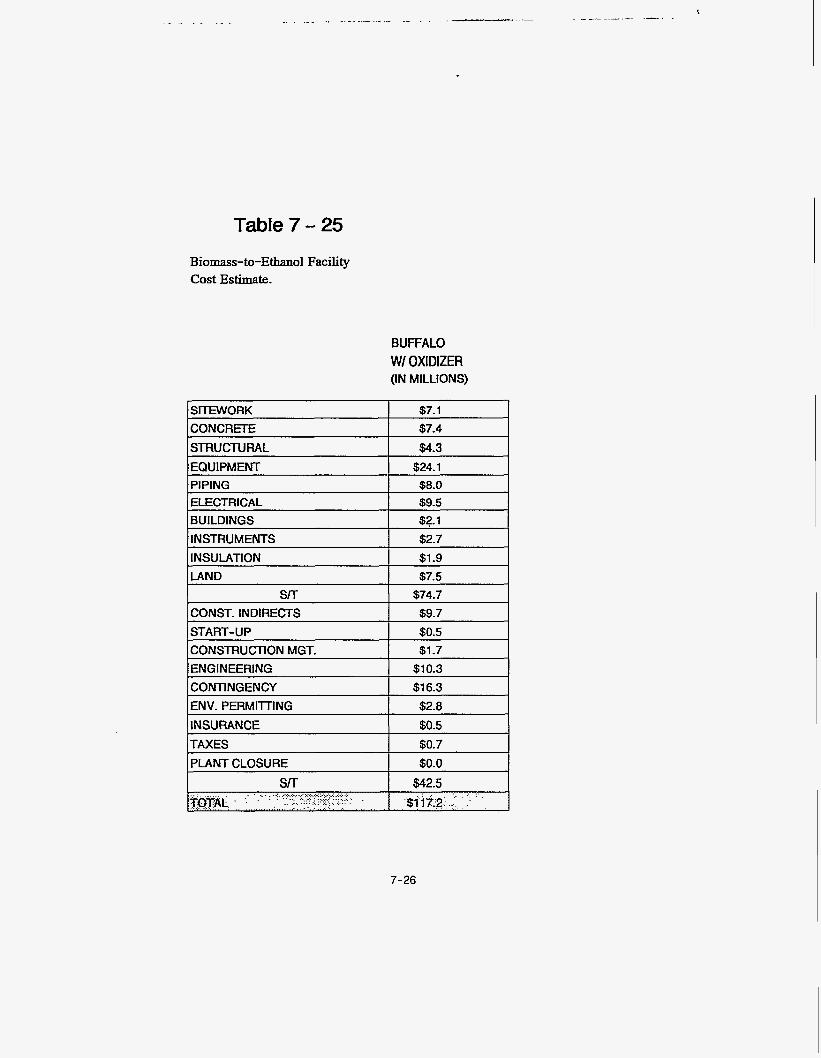
-e---
- SITEWORK $7.1 CONCRETE $7.4 s m u c i u m L $4.3
Table 7 - 25
LAND srr
CONST. INDIRECTS
Biomass-to-Ethanol Facility Cost Estimate.
$7.5 $74.7 $9.7
BUFFALO W/ OXIDIZER (IN MILLIONS)
CONSTRUCTION MGT. ENGINEERING CONTINGENCY
$1 -7 $1 0.3 $1 6.3
EQUIPMENT $24.1 PIPING ELECTRICAL BUILDINGS $2.1 INSTRUMENTS
ENV. PERMllllNG INSURANCE
I INSULATION I $1.9 I
$2.8 $0.5
TAXES PLANT CLOSURE
I START-UP I $0.5 I
$0.7 $0.0
7-26
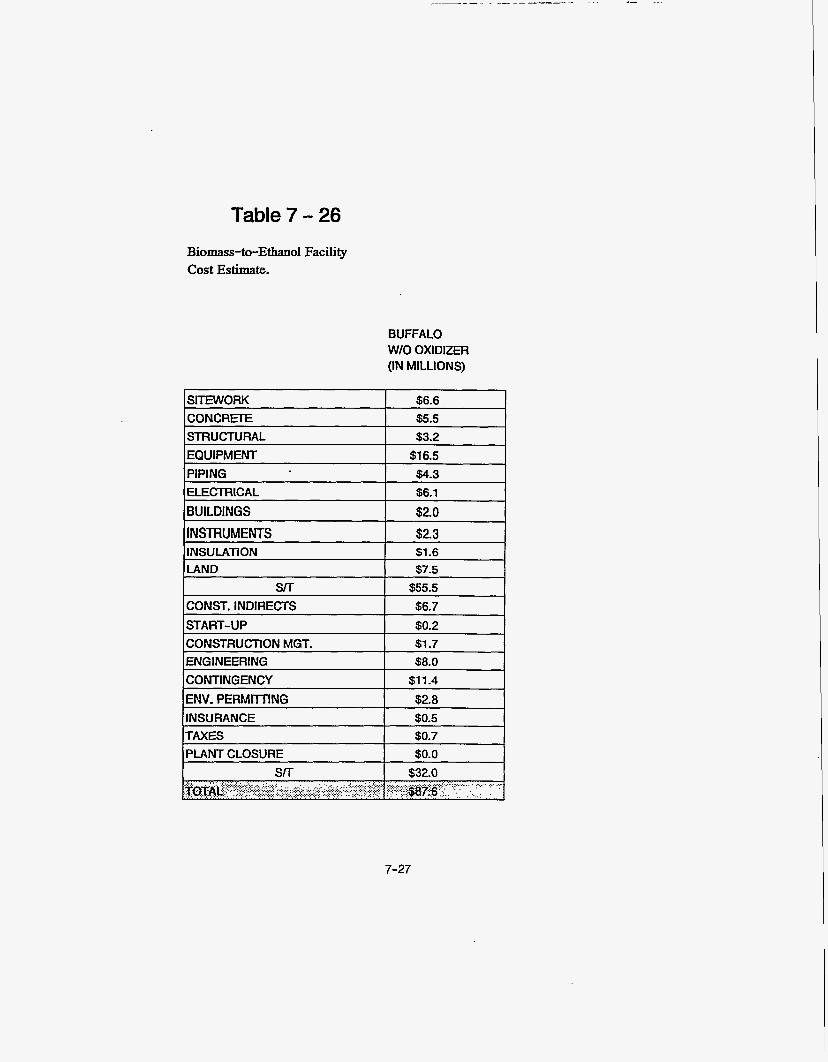
. - - -1-
SmWOFiK CONCRETE
Table 7 - 26
$6.6 $5.5
Biomass-to-Ethanol Facility Cost Estimate.
EQUIPMENT PIPING ELECTRICAL
BUFFALO WIO OXIDIZER (IN MILLIONS)
$1 6.5 $4.3 $6.1
INSTRUMENTS INSULATION LAND
ISTRUCTURAL 1 $3.2 I
$2.3 $1 -6 $7.5
CONST. INDIRECTS START-UP
/BUILDINGS
~
$6.7 $0.2
I $2.0
CONSTRUCTION MGT. $1.7
SIT I $55.5 I
CONTINGENCY ENV. PERMllTlNG
$1 1.4 $2.8
INSURANCE $0.5
PLANT CLOSURE ~
$0.0
7-27
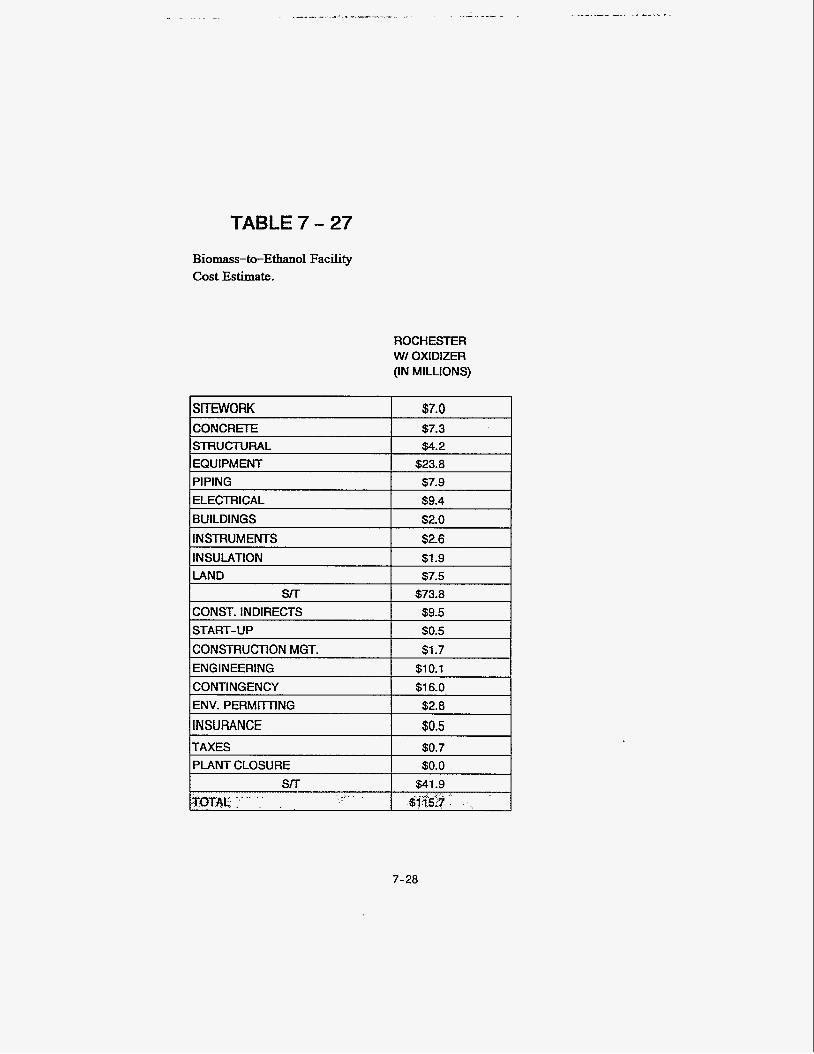
TABLE 7 - 27 Biomass-to-Ethanol Facility Cost Estimate.
ROCHESTER WI OXIDIZER (IN MILLIONS)
SKEWORK $7.0 CONCRETE $7.3 s m u c i U m L $4.2 EQUIPMENT $23.8 PIPING $7.9 ELECTRICAL $9.4 BUILDINGS $2.0 INSTRUMENTS $2.6 I INSULATION
$73.8 CONST. INDIRECTS ISTART-UP $0.5 i CONSTRUCTION MGT. $1.7 IENGINEERING $10.1 I CONTINGENCY I $16.0 I ENV. PERMlITlNG
INSURANCE TAXES $0.7 PLANT CLOSURE
7-28
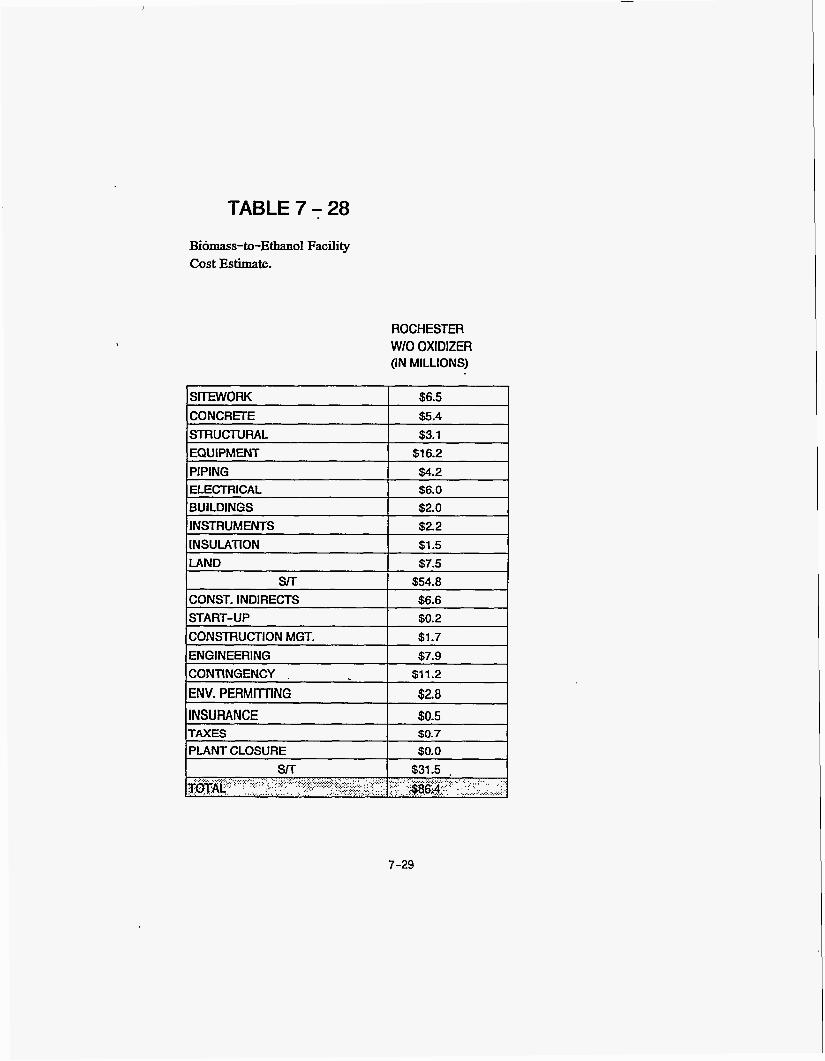
TABLE 7 - 28
S ~ O F W CONCRETE STRUCTURAL
Biomass-to-Ethanol Facility Cost Estimate.
$6.5 $5.4 $3.1
ROCHESTER W/O OXIDIZER (IN MILLIONS)
CONSTRUCTION MGT. ENGINEERING CONTINGENCY ,
ENV. PERMITTING
$1.7 $7.9
$1 1.2
$2.8
EQUIPMENT $1 6.2 PIPING ELECTRICAL BUILDINGS INSTRUMENTS $2.2
INSURANCE TAXES
I INSULATION I $1.5 I
$0.5 $0.7
]PLANT CLOSURE I $0.0 I I I $31.5 I
7-29
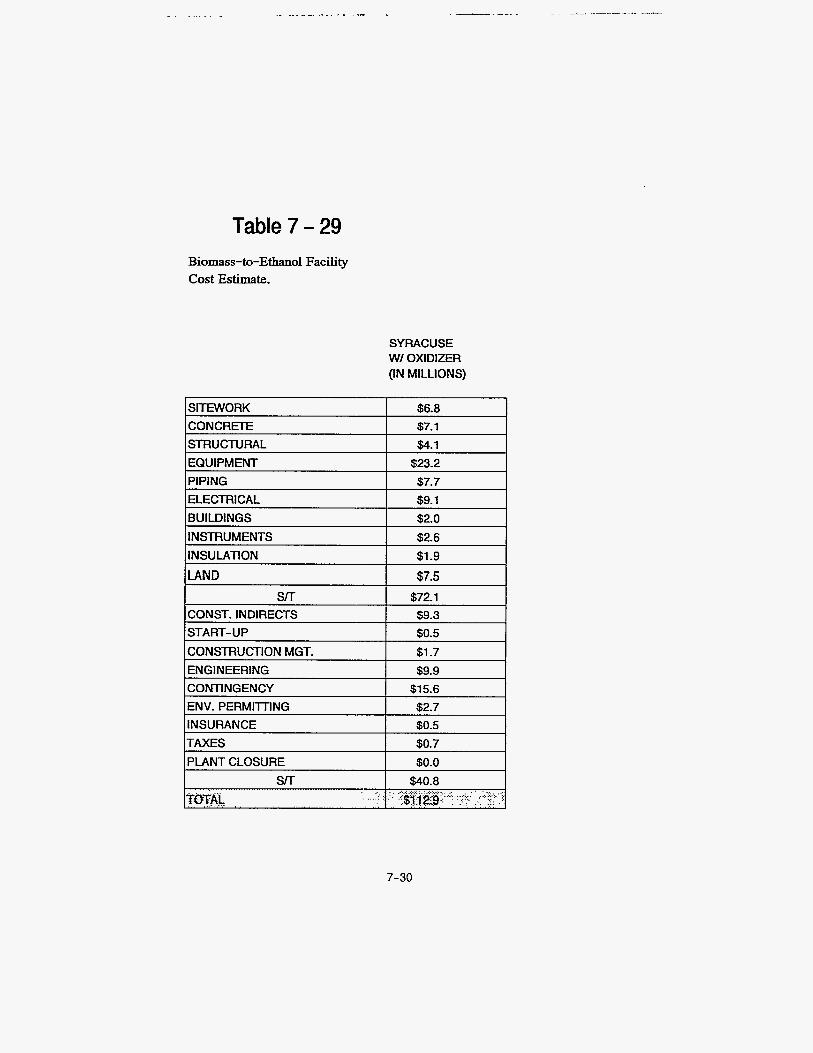
Table 7 - 29 Biomass-to-Ethanol Facility Cost Estimate.
SYRACUSE W/ OXIDIZER (IN MILLIONS)
7-30

Table 7 - 30
CONCRW smucmRAL I EQUIPMENT
Biomass-to-Ethanol Facility Cost Estimate.
$5.3 $3.0
$15.8
SYRACUSE W10 OXIDIZER (IN MILLIONS)
ISITEWORK I $6.4 I
CONST. INDIRECTS START-UP
$6.5 $0.1
I~IPING I $4.1 I I ELECTRICAL I $5.8 I leUlLDlNGS I $2.0 I I INSTRUMENTS I $22 I
$1 -5 $7.5
I s/T I $53.5 I
I CONSTRUCTION MGT. I $1.6 ENGINEERING CONTINGENCY $1 0.9 ENV. PERMllTlNG INSURANCE TAXES $0.7 I PLANT CLOSURE I $0.0 I
7-31
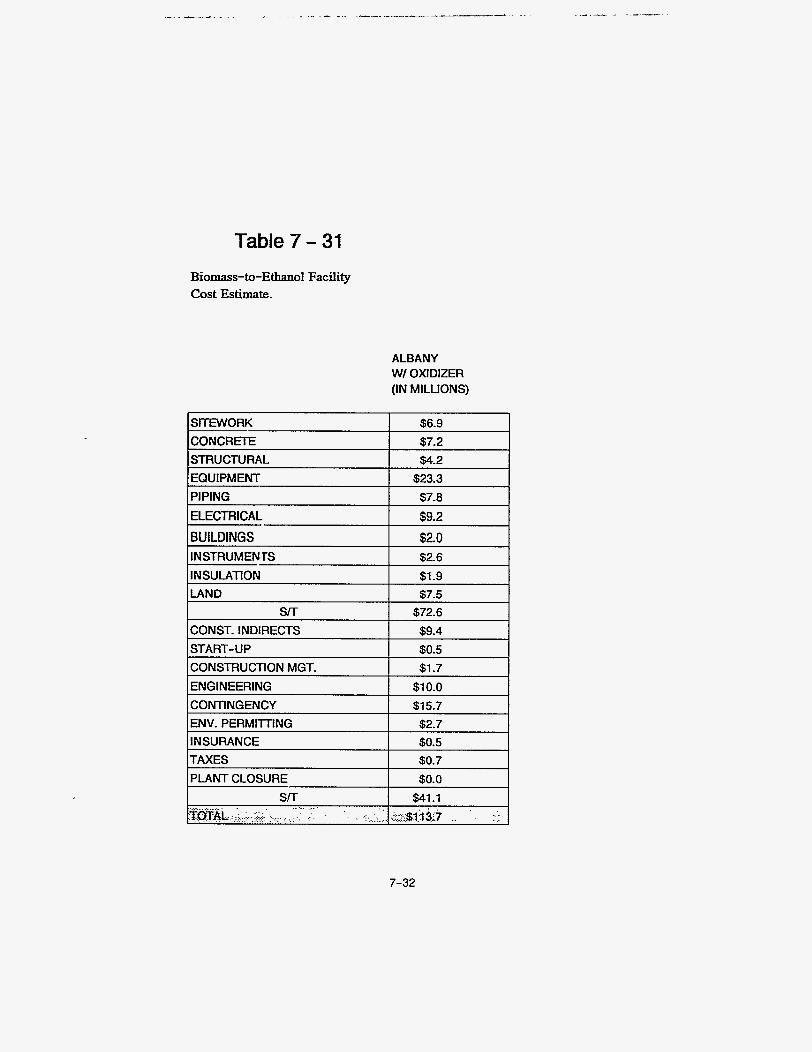
Table 7 - 31 Biomass-to-Ethanol Facility Cost Estimate.
ALBANY WI OXIDIZER (IN MILLIONS)
SITEWORK $6.9 CONCREE $7.2 I SlRUCIUw\L I $4.2 IEQUIPMENT I S23.3
PIPING $7.8 ELECTRICAL $9.2 BUILDINGS $2.0 INSTRUMENTS $2.6 INSULATION $1.9 LAND $7.5
SIT $72.6 CONST. INDIRECTS $9.4 I START-UP I $0.5
CONSTRUCTION MGT. $1.7 ENGINEERING $1 0.0
ICONTINGENCY I $15.7 ENV. PERMllTlNG INSURANCE
PLANT CLOSURE I $41.1
. . . . . . . . .... ........... . . , .. . . STT
......... . . . . ... . . . . . . ~~~~L.I:~...,..~~.~:.. .................. ............... . . :: --: I:: -c. I..?..$Ij3i? .... :
7-32
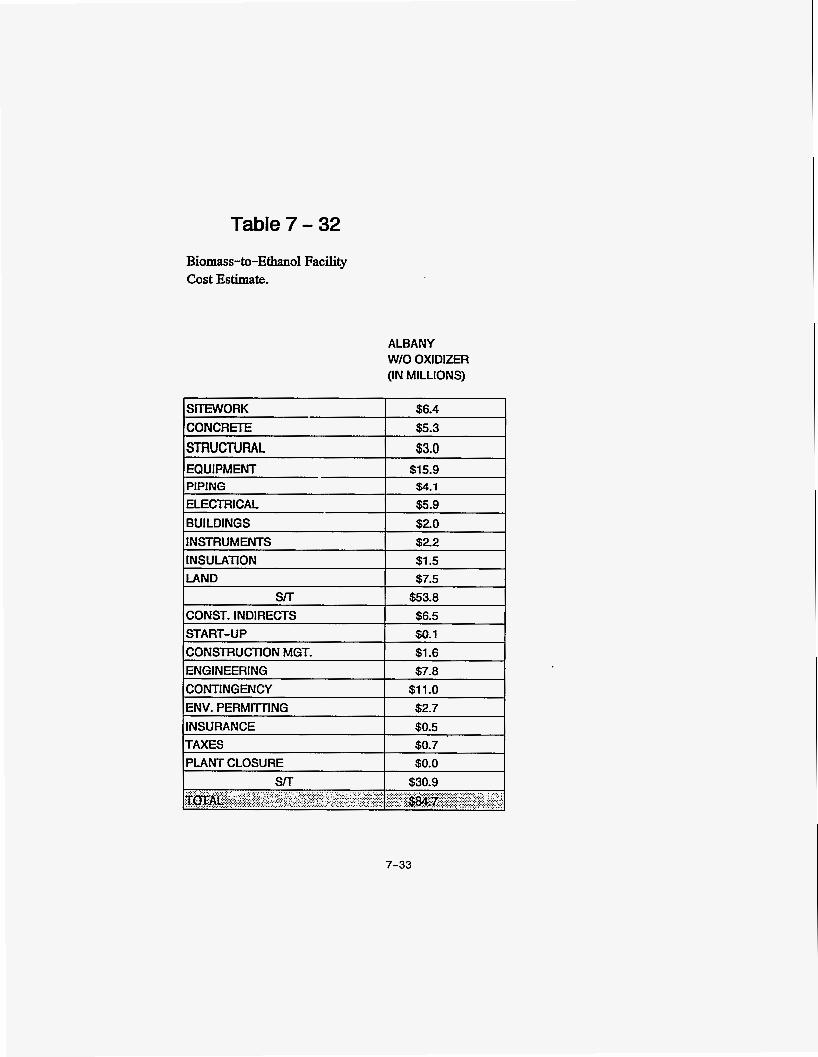
Table 7 - 32
CONCRETE
Biomass-to-Ethanol Facility Cost Estimate.
$5.3
7-33
SECTION 8
FINANCIAL EVALUATION FOR PREFERRED SITES
FINANCIAL PRO FORMAS
Introduction
Stone & Webster Development Corporation (SWDC) has evaluated the biomass-to-ethanol project for financial viability and risk from the point of view of a project developer. The project was evaluated by determining the pricing necessary to generate revenues that would provide an acceptable return on owner's equity, and comparing the required pricing to expected market
prices;
In this section, the project and its variations (Le., feedstock, output, sizes) are described to the extent necessary for input to the financial analysis. The financial structure of a potential developer is then defined and its revenue requirements from tipping fees or from ethanol sales
are determined, which in turn yield the required return on equity for the developer/equity partners. A pro 'forma financial cash flow statement is presented to demonstrate profitability. Finally, the results of sensitivity analyses are presented to provide assessments of project risks.
Project DescriDtion
A Master Input Table was set up to accept data in the form used by the pro forma analysis for numerous cases and four site locations: Albany, Buffalo, Rochester, and Syracuse. This table (Table &la, b, c, and d) allows a side-by-side comparison of data for the various site locations
and various product options, etc. The data needed for the evaluation included plant size, performance, capital cost, and operating costs. The evaluation was performed for the plant size of 500 tpd on a dry basis (595 tpd wet), and the feedstock assumed was a mixed stock consisting of 50 percent waste wood and 50 percent waste paper.
*
8- 1
Within each site location, two basic plant configurations were distinguished. A biomass facility with a gasification plant will convert the lignin produced by the conversion process to power and steam to be used within the facility. The power plant produces excess power, which is sold off- site to a utility. The other configuration is a biomass facility that disposes of the waste lignin off- site and purchases all facility energy needs from local utilities. This pair of configurations is designated Options 1 and 2, 7 and 8, 13 and 14, 19 and 20 for Albany, Buffalo, Rochester and Syracuse, respectively.
The shading on Table %la, b, c, and d, indicates direct data input. Nearly all of the data were provided by other study participants via Stone & Webster Engineering Corporation. Stone &
Webster Development Corporation provided some unit pricing, including average annual labor
rate, maintenance cost, power purchase and sales rates, water and sewer charges, and natural gas price.
The next four options (3 to 6, 15 to 18 and 21 to 24,9 to 12) vary two parameters: market value
for mixed stock, and lignin disposal cost. The market price for mixed stock was specified as $20 and $40/ton, leaving the sales price of ethanol to be determined. Lignin disposal is expected to cost the facility from zero (whereby a purchase price exactly offsets the transportation cost) to $50/ton.
The results of evaluation show that the lowest price for ethanol that allows an acceptable return on broker’s equity is $1.94/gal at a feedstock price of $20/ton for the site in Syracuse. Therefore, this site location was selected for analysis of the tipping fee necessary to generate required revenues at specified ethanol prices (options 25 to 30). In the above mentioned case,
’ rather than setting a feedstock value and solving for the ethanol price, the sales price of ethanol was specified at $1.20 and $lSO/gal, leaving the tipping fee for the waste to be determined. The input data for this case are presented on Table 8-le.
8-2
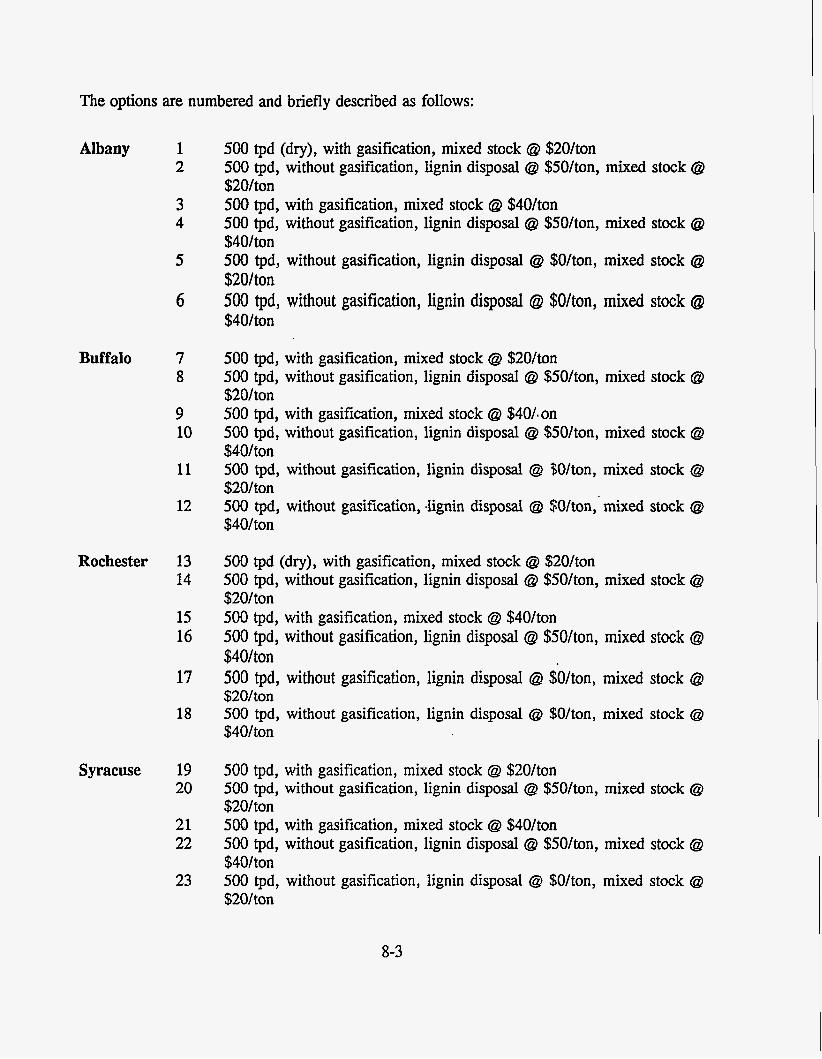
The options are numbered and briefly described as follows:
Albany
Buffalo
1 2
3 4
5
6
7 8
500 tpd (dry), with gasification, mixed stock @ $20/ton 500 tpd, without gasification, lignin disposal @ $50/ton, mixed stock @ $20/ton 500 tpd, with gasification, mixed stock @ $40/ton 500 tpd, without gasification, lignin disposal @ $50/ton, mixed stock @ $40/ton 500 tpd, without gasification, lignin disposal @ $O/ton, mixed stock @ $20/ton 500 tpd, without gasification, lignin disposal @ $ O h , mixed stock @ $4O/ton
500 tpd, with gasification, mixed stock @ $20/ton 500 tpd, without gasification, lignin disposal @ $50/ton, mixed stock @ $20/ton 500 tpd, with gasification, mixed stock @ $40/.on 500 tpd, without gasification, lignin disposal @ $50/ton, mixed stock @ $40/ton 500 tpd, without gasification, lignin disposal @ $Ohon, mixed stock @ $20/ton 500 tpd, without gasification, lignin disposal @ $O/ton, mixed stock @ $40/ton
9 10
11
12
Rochester 13 14
15 16
17
18
500 tpd (dry), with gasification, mixed stock @ $20/ton 500 tpd, without gasification, lignin disposal @ $50/ton, mixed stock @ $20/ton 500 tpd, with gasification, mixed stock @ $40/ton 500 tpd, without gasification, lignin disposal @ $%/ton, mixed stock @ $40/ton 500 tpd, without gasification, lignin disposal @ $O/ton, mixed stock @ $20/ton 500 tpd, without gasification, lignin disposal @ $O/ton, mixed stock @ $40/ton
Syracuse 19 20
21 22
23
500 tpd, with gasification, mixed stock @ $20/ton 500 tpd, without gasification, lignin disposal @ $50/ton, mixed stock @ $20/ton 500 tpd, with gasification, mixed stock @ $40/ton 500 tpd, without gasification, lignin disposal @ $50/ton, mixed stock @ $40/ton 500 tpd, without gasification, lignin disposal @ $O/ton, mixed stock @ $20/ton
8-3
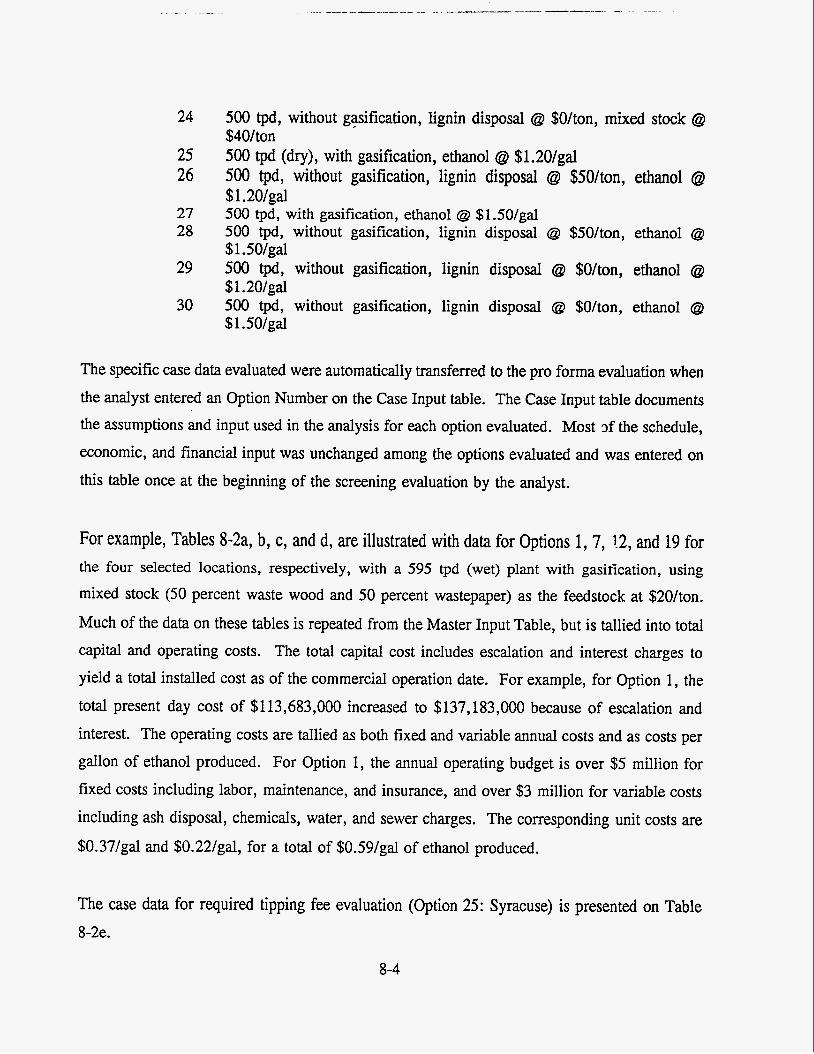
24
25 26
500 tpd, without gasification, lignin disposal @ $O/ton, mixed stock @ $40/ton 500 tpd (dry), with gasification, ethanol @ $1.20/gal 500 tpd, without gasification, lignin disposal @ $50/ton, ethanol @
500 tpd, with gasification, ethanol @ $1.50/gal 500 tpd, without gasification, lignin disposal @ $50/ton, ethanol @ $1.50/gal 500 tpd, without gasification, lignin disposal @ $O/ton, ethanol @
500 tpd, without gasification, lignin disposal @ $O/ton, ethanol @ $1.50/gal
!$1.20/gal 27 28
29
30 $1.20/gal
The specific case data evaluated were automatically transferred to the pro forma evaluation when
the analyst entered an Option Number on the Case Input table. The Case Input table documents the assumptions and input used in the analysis for each option evaluated. Most 3f the schedule,
economic, and financial input was unchanged among the options evaluated and was entered on
this table once at the beginning of the screening evaluation by the analyst.
For example, Tables 8-2a, b, c, and d, are illustrated with data for Options 1, 7, 12, and 19 for the four selected locations, respectively, with a 595 tpd (wet) plant with gasification, using mixed stock (50 percent waste wood and 50 percent wastepaper) as the feedstock at $20/ton.
Much of the data on these tables is repeated from the Master Input Table, but is tallied into total
capital and operating costs. The total capital cost includes escalation and interest charges to yield a total installed cost as of the commercial operation date. For example, for Option 1, the
total present day cost of $113,683,000 increased to $137,183,000 because of escalation and
interest. The operating costs are tallied as both fixed and variable annual costs and as costs per
gallon of ethanol produced. For Option 1, the annual operating budget is over $5 million for fixed costs including labor, maintenance, and insurance, and over $3 million for variable costs
including ash disposal, chemicals, water, and sewer charges. The corresponding unit costs are $0.37/gal and $0.22/gal, for a total of $0.59/gal of ethanol produced.
The case data for required tipping fee evaluation (Option 25: Syracuse) is presented on Table
8-2e.
8-4
Tables 8-2a, b, c, d, and e, also include input such as schedule, inflation, escalation, taxes, and financial data. The commercial operation date was assumed to be 4 years from now, which includes 2 years for construction. The economic life is 20 years per NYSERDA’s requirement. A 10-year life was also evaluated, the results of which are presented in Section 9 Sensitivity
Analysis. The plant is expected to operate at full capacity 83 percent of the time. Assumptions for long-term inflation at 4 percent and nominal escalation ranging from 4 percent for most cost components to 5.5 percent for natural gas were included in these tables.
Taxes included federal and state income taxes at 35 percent and 9 percent, respectively, and 8.25 percent gross receipts tax, which included both state and city rates. Property taxes were not included at this timebecause this would be site-specific. Tax depreciation was determined separately for several categories: buildings and structures, biomass conversion equipmen;, and balance of plant, in accordance with the 1986 Tax Reform Act.
Financial Analvsis
Financial Structure. Developers of third party projects will generally s&k to avoid carrying
debt for the project on their own corporate balance sheets. They will attempt to create a financial structure which stands by itself, with debt backed only on the project’s physical assets and the strength of its contractual relationships. This debt would be nonrecourse to the developer, in that lenders should not seek payment from the developer in the event of a project
failure. To a large extent, the credit of the purchaser of the project’s product and of the feedstock supplier are the basis for financing becaise it is these parties’ commitments to make payments on a take-if-tendered basis that assures the lender that funds will be available for debt
service.
Some projects are developed with long-term feedstock (fuel) and output (i.e., power, steam) contracts that provide some cash flow certainty; this project may be able to contract long-term for feedstock (wastepaper, wood waste) but may not have a long-term contract for the output (ethanol) thus increasing the project’s financial risk. Other contractual obligations enassure that
8-5
the facility will be available: the lump-sum turnkey contractor guarantees that the facility will be built at a certain cost and date and that it will perform as required initially; the operation
contractor guarantees that the facility will be adequately maintained so that the service can
continue to be tendered.
When the contracting parties are financially strong and the project is basically sound, a high
level of financial leverage is possible. Many projects in the process and energy sectors are financed with debt covering 80 percent or more of project cost. These are based mostly on the
financial strength of the entity purchasing the project’s output. In the case of an ethanol plant,
the degree of financial leverage that can be obtained will depend on the strength of the entities
supplying waste for feedstock and purchasing the ethanol. A debt level of 80 percent would provide for enough equity to mitigate these risks to some extent and is typical of many
nonrecourse financings.
Lenders generally are limiting loan terms to about 10 to 15 years for financing most projects.
This is shorter than the 20-year economic life being evaluated, and results in the need for higher
revenues during the loan period. In general, the loan amortization period must be 1 to 2 years
shorter than the term of the product off-take and feedstock contracts. Because ethanol is a commodity, the revenues for this project will be unit prices ($/gal, $/ton, etc) set by the
marketplace; little opportunity exists to structure revenues to alleviate cash flow constraints
during this period. The developer will probably focus attention on the debt structure to ease
cash flow problems. Assuming bank financing (as opposed to taxable or tax-exempt bonds),
interest rates are currently about 8 to 10 percent.
Equity in the project would generally be of two types: 1) general partner or active equity
provided by the developer and/or equipment suppliers, construction contractor, or operating contractor; and 2) limited partner or passive equity that might be packaged for syndication by an investment banker. While the active equity holders may derive additional benefits from the project in terms of normal profits on services provided, the passive investor obtains a return
solely from the cash flows of the project and associated tax benefits. The overall discounted
8-6
cash flow internal rate of return required for all equity participants is typically in the range of 20 percent or more, after-tax, for projects similar in market risk level to this biomass-to-ethanol project.
Revenue Reauirements. All of the costs of the project have been estimated. In the m e when the price of mixed stock (50 percent wood waste and 50 percent waste paper) was set, no revenues from tipping fees are available; the feedstock is an expense. A market price for the feedstock was input and all revenue requirements had to be borne by ethanol sales less a small amount of revenue generated by power sales when applicable. A required price per gallon of ethanol in 1994 dollars, escalating with inflation was calculated.
In the case when ethanol price is specified (Options 25 to 30), tipping fees must make up the revenue shortfall, if any, to the extent that will yield the developer’s/equity partners’ target return on equity. The evaluation was set up to calculate the required cost per ton of feedstock in January 1994 dollars, escalating with inflation.. Note that a negative tipping fee would indicate an expense for the project operator and not revenue. This can occur either by design (the maximum allowable tipping fee for a feedstock is negative) or by chance (the revenues from the sale of ethanol are more than adequate to cover the cost of the project and provide the equity partners’ required target rate of return).
Pro Forma Statements. SWDC has developed a pro forma financial cash flow statement for a hypothetical developer of a biomass-to-ethanol production facility.
A cash flow statement for four specified locations is presented on Tables 8-3a, b, c, and d for
I Options 1, 7, 13, 19. Revenues from the sale of ethanol are projected. If the project operator were to pay for any of the feedstock, that cash flow would be entered under Expenses. Gross margin is obtained by subtracting expenses from revenues, both of which are based on projected volume. The revenues for Option 25, Table 8-3e, include tipping. Taxable income is determined by subtracting interest and tax depreciation from gross margin. Income tax is simply taxable income multiplied by an effective income tax rate of 40.9 percent which combines the 35 percent
8-7
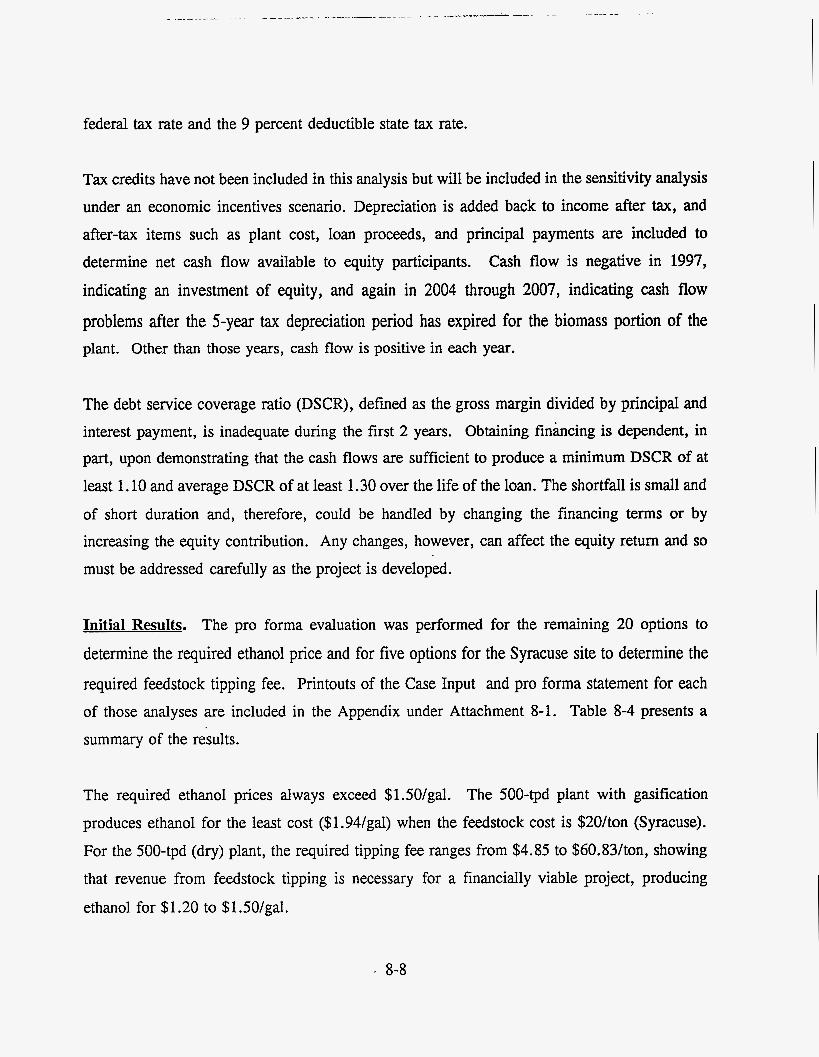
federal tax rate and the 9 percent deductible state tax rate.
Tax credits have not been included in this analysis but will be included in the sensitivity analysis under an economic incentives scenario. Depreciation is added back to income after tax, and
after-tax items such as plant cost, loan proceeds, and principal payments are included to
determine net cash flow available to equity participants. Cash flow is negative in 1997,
indicating an investment of equity, and again in 2004 through 2007, indicating cash flow
problems after the 5-year tax depreciation period has expired for the biomass portion of the plant. Other than those years, cash flow is positive in each year.
The debt service coverage ratio (DSCR), defined as the gross margin divided by principal and interest payment, is inadequate during the first 2 years. Obtaining financing is dependent, in
part, upon demonstrating that the cash flows are sufficient to produce a minimum DSCR of at
least 1.10 and average DSCR of at least 1.30 over the life of the loan. The shortfall is small and of short duration and, therefore, could be handled by changing the financing terms or by increasing the equity contribution. Any changes, however, can affect the equity return and so
must be addressed carefully as the project is developed.
Initial Results. The pro forma evaluation was performed for the remaining 20 options to
determine the required ethanol price and for five options for the Syracuse site to determine the required feedstock tipping fee. Printouts of the Case Input and pro forma statement for each of those analyses are included in the Appendix under Attachment 8-1. Table 8-4 presents a
summary of the results.
The required ethanol prices always exceed $1.50/gal. The 500-tpd plant with gasification
produces ethanol for the least cost ($1.94/gal) when the feedstock cost is $20/ton (Syracuse).
For the 500-tpd (dry) plant, the required tipping fee ranges from $4.85 to $60.83/ton, showing
that revenue from feedstock tipping is necessary for a financially viable project, producing
ethanol for $1.20 to $lSO/gal.
. 8-8
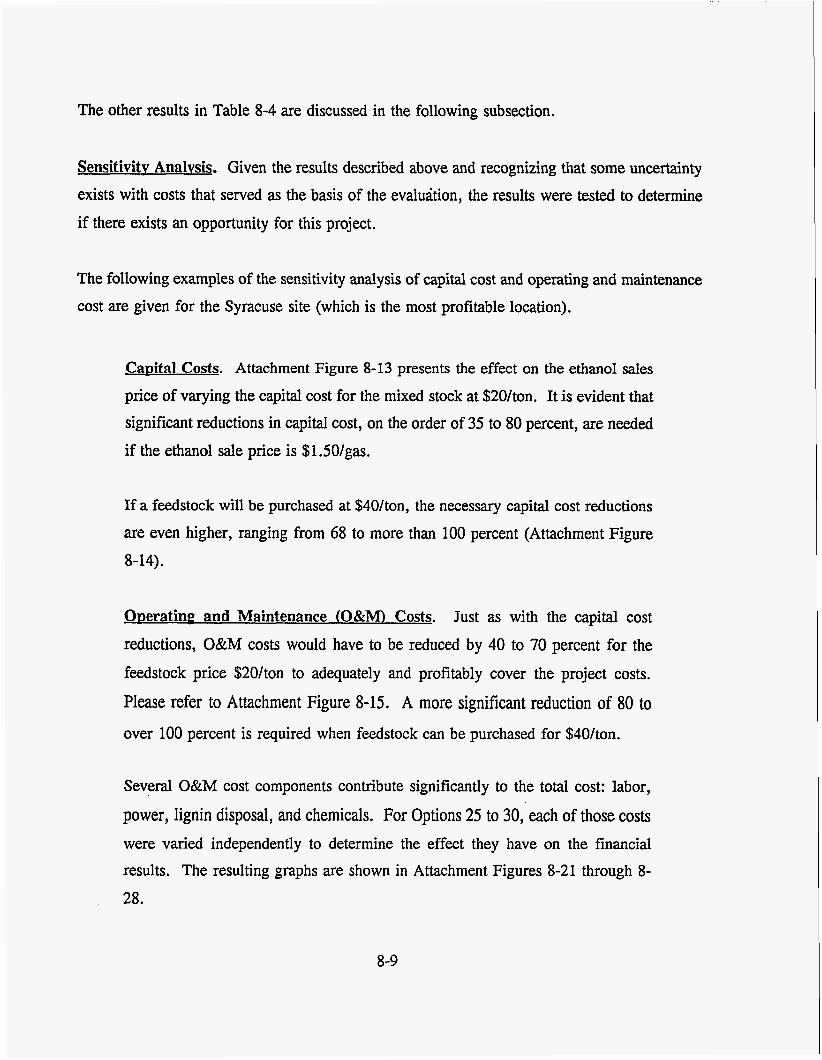
The other results in Table 8-4 are discussed in the following subsection.
Sensitivity Analvsis. Given the results described above and recognizing that some uncertainty exists with costs that served as the basis of the evaluation, the results were tested to determine if there exists an opportunity for this project.
The following examples of the sensitivity analysis of capital cost and operating and maintenance cost are given for the Syracuse site (which is the most profitable location).
CaDital Costs. Attachment Figure 8-13 presents the effect on the ethanol sales price of varying the capital cost for the mixed stock at $20/ton. It is evident that significant reductions in capital cost, on the order of 35 to 80 percent, are needed if the ethanol sale price is $1.50/gas.
If a feedstock will be purchased at $40/ton, the necessary capital cost reductions are even higher, ranging from 68 to more than 100 percent (Attachment Figure 8-14).
OperatinP and Maintenance (O&M Costs. Just as with the capital cost reductions, O&M costs would have to be reduced by 40 to 70 percent for the feedstock price $20/ton to adequately and profitably cover the project costs.
Please refer to Attachment Figure 8-15. A more significant reduction of 80 to over 100 percent is required when feedstock can be purchased for $40/ton.
Several O&M cost components contribute significantly to the total cost: labor,
power, lignin disposal, and chemicals. For Options 25 to 30, each of those costs were varied independently to determine the effect they have on the financial results. The resulting graphs are shown in Attachment Figures 8-21 through 8- 28.
8-9
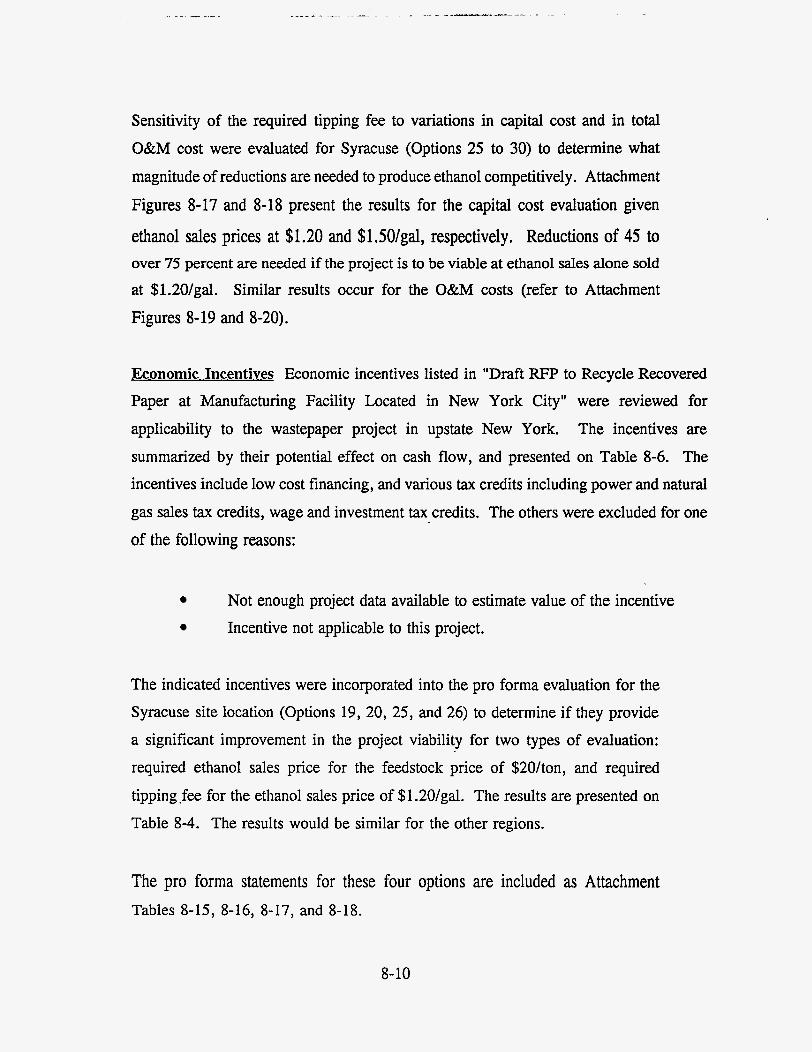
Sensitivity of the required tipping fee to variations in capital cost and in total
O&M cost were evaluated for Syracuse (Options 25 to 30) to determine what
magnitude of reductions are needed to produce ethanol competitively. Attachment
Figures 8-17 and 8-18 present the results for the capital cost evaluation given
ethanol sales prices at $1.20 and $1.5O/gal, respectively. Reductions of 45 to over 75 percent are needed if the project is to be viable at ethanol sales alone sold at $1.20/gal. Similar results occur for the O&M costs (refer to Attachment
Figures 8-19 and 8-20).
Economic Incentives Economic incentives listed in "Draft RFP to Recycle Recovered
Paper at Manufacturing Facility Located in New York City" were reviewed for applicability to the wastepaper project in upstate New York. The incentives are
summarized by their potential effect on cash flow, and presented on Table 8-6. The incentives include low cost financing, and various tax credits including power and natural
gas sales tax credits, wage and investment tax credits. The others were excluded for one
of the following reasons:
Not enough project data available to estimate value of the incentive Incentive not applicable to this project.
The indicated incentives were incorporated into the pro forma evaluation for the Syracuse site location (Options 19, 20, 25, and 26) to determine if they provide
a significant improvement in the project viability for two types of evaluation:
required ethanol sales price for the feedstock price of $20/ton, and required
tipping.fee for the ethanol sales price of $1.20/gal. The results are presented on
Table 8-4. The results would be similar for the other regions.
The pro forma statements for these four options are included as Attachment Tables 8-15, 8-16, 8-17, and 8-18.
8-10
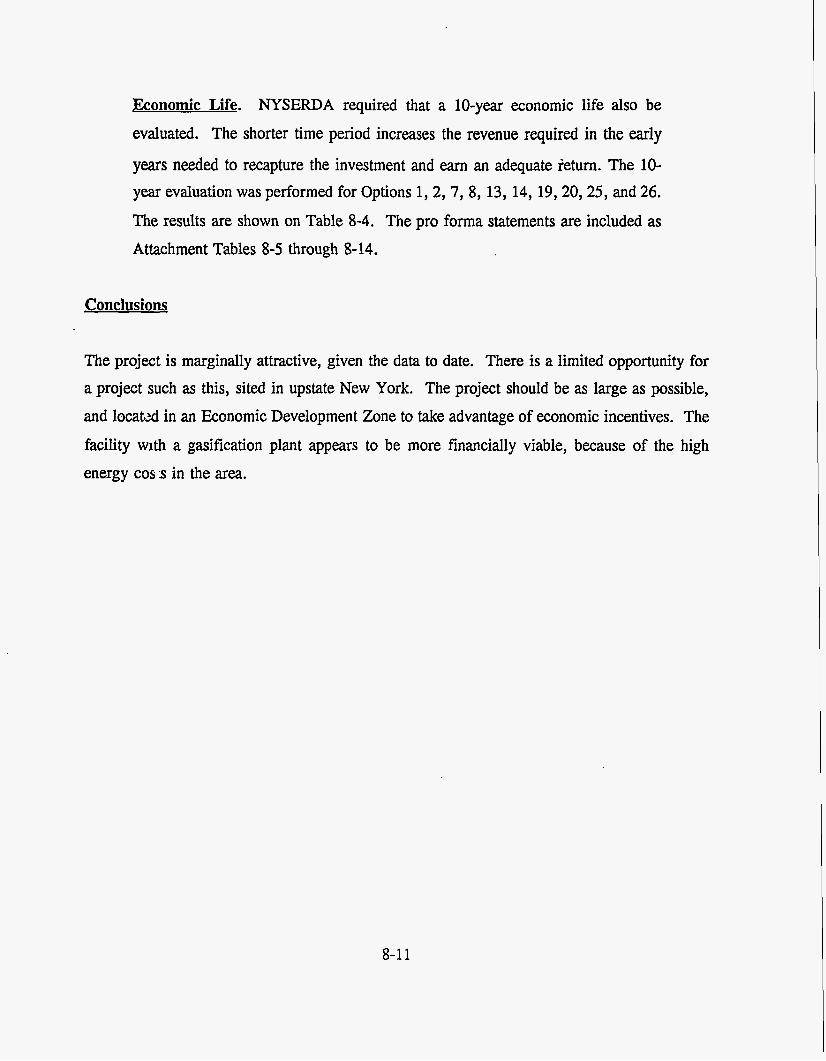
Economic Life. NYSERDA required that a 10-year economic life also be
evaluated. The shorter time period increases the revenue required in the early
years needed to recapture the investment and earn an adequate return. The 10- year evaluation was performed for Options 1,2,7, 8, 13, 14, 19,20,25, and 26.
The results are shown on Table 8-4. The pro forma statements are included as
Attachment Tables 8-5 through 8-14.
Conclusions
The project is marginally attractive, given the data to date. There is a limited opportunity for a project such as this, sited in upstate New York. The project should be as large as possible, and locatzd in an Economic Development Zone to take advantage of economic incentives. The facility with a gasification plant appears to be more financially viable, because of the high energy cos5 in the area.
8-1 1
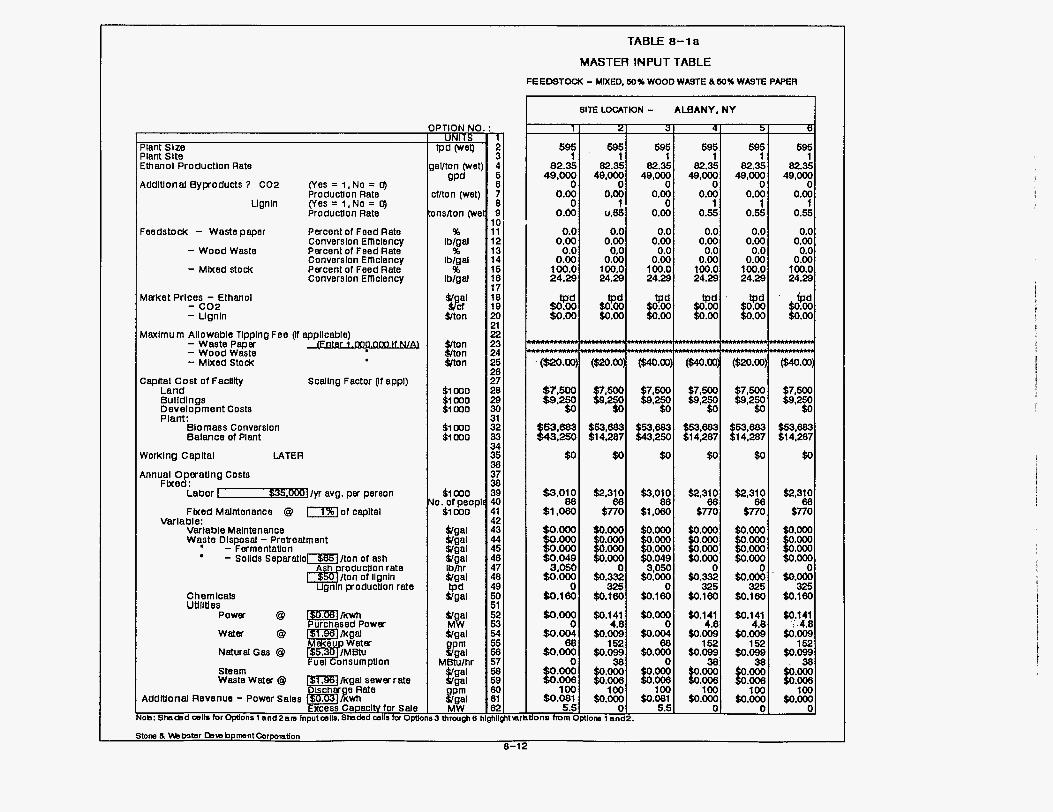
TABLE 8 - l a
MASTER INPUT TABLE
SITE LOCATION - ALBANY, NY
T I 21 31 41 51 6 I I I 1 1
'lant Slze ;'ant Slte :than01 Productlon Rate
595 I
82.35
0.00 0
0.00
\ddltional Byproducts 7 C02 (Yes = 1, No = a) Production Rate
Ugnln (Yes = 1,No = a) Production Rate
695 595 595 595 595 1 1 1 1 1
82.35 82.35 82.35 82.35 82.35
0.00 0.00 0.00 0.00 0.00 1 0 1 1 1
u.651 0.00 0.55 0.55 0.55
4Q*ooo 0 498m 0 -IO? 498m 0 49vm 0
:eedstock - Wastepaper Percent of Feed Rate Conversion EfHclency Percent of Feed Rate Conversion Enlclency Percent of Feed Rate Converslon Enlclency
- Wood Waste
- Mbted atodc
0.0 0.00 0.0
0.00 100.0 24.29
d w e t Prices - Ethanol - c 0 2 - Ugnln
0.0 0.0 0.0 0.0 0.0 0.00 0.00 0.00 0.00 0.00 0.0 0.0 0.0 0.0 0.0 0.00 0.00 0.00 0.00 0.00
100.0 100.0 100.0 100.0 100.0 24.29 24.29 24.29 24.29 24.29
Aexlmurn Allowable Tlpplng Fee (n appllcable) - Waste Paper - Wood Waste - Mbted Stodc
$0
$3,010 88
$1.080
:apltal Cost of Faclllty Scaling Factor (If appl) Land
$0 $0 $0 $0 $0
$2,310 $3,010 $2.310 $2,310 $2,310 88 66 66 66 66
$770 $1,060 $770 $770 $770
Bulldlngs Development Costs Plant:
Blomass Converslon Balance of Plant
Yorklng Capltal LATER
\nnual Operating Costs Fbted:
Labor I-lyr avg. per person
Fbted Malntenance Q m o l Capltal
Varlable Malntenance W y t e Dlsposal - Preteatment - Fermentation - Sollds Separatlor$85llton of ash
Varlable:
Ash roductlon rate
Ugnln production rate d /ton of llgnln
Chem lcals UUllties
Power Q p m urchased Power
Water Q K E I i k g a l Mweup Water
NaturalGas Q uel onsumption
Steam Waste Water @ Mgal sewer rate
RddMond Revenue - Power Sales xcess CapaclN tor Sale
ob: ShacbdeslloforOptlonsland2am Inputwlls.SIadedcsllsforOptio
lPTlON NO UNITS
tpd (wet)
aUton (wet] QPd
:f/ton (wet)
insiton (we
% lblgal
% lblgal
% lblgal
9;'
8%
8 E
Cton
$/ton
$1 mo
$1 mo $4 000
$1 mo 0 . of peopl
$1 mo Cgal Cgal $/gal $/gal lbmr $/gal tpd
Cgal
Cgal t&' &:I
Ea:l &I
MBtulhr
MW 3 thrwghti t
7 2 3 4 5 6 7 8 9
10 11 12 13 14 15 18 17 18 19 20 21 22 23 24 25 26 27 28 29 30 31 32 33 34 35 36 37 38 39 40 41 42 43 44 45 48 47 48 49 50 51 52 53 54 55 56 57 58 59 60 81 62 ii;ii;
Stone B M b s L s r DsrabpmntCorpomtion 8-12
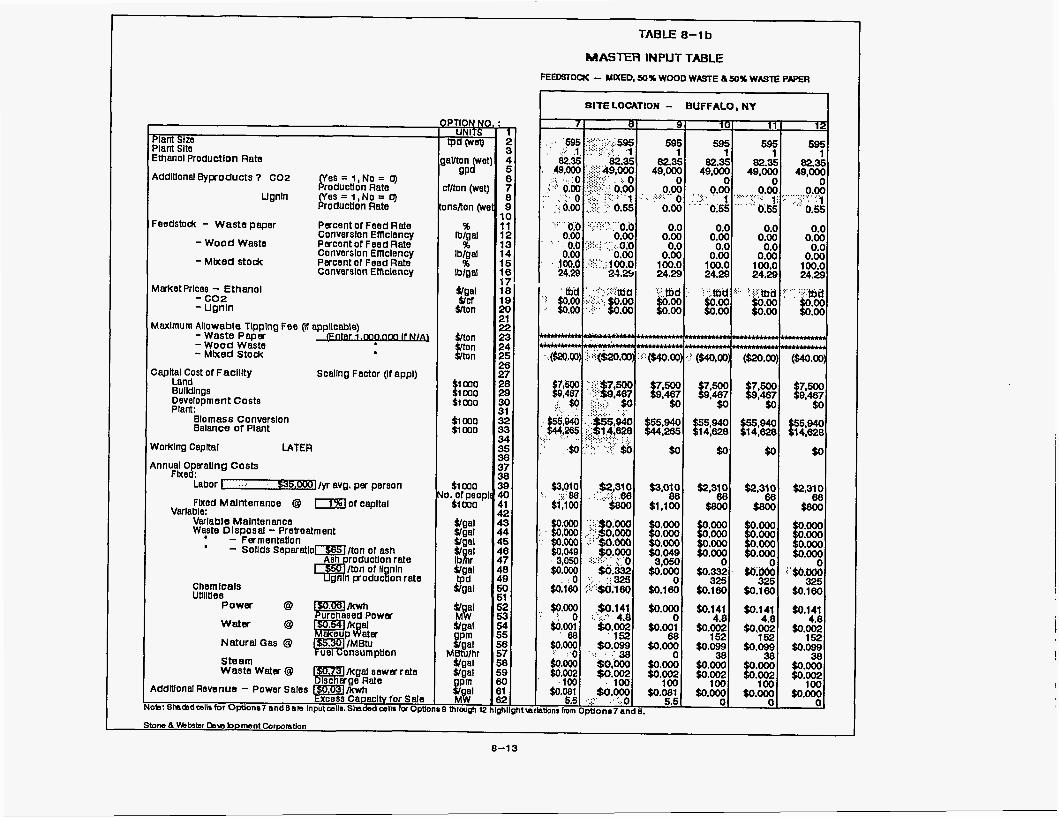
Piant Size Plant Site Ethanol Production Rate
Additlonal Byproducts 7 c02 es = i,No = 0) foductJon Rate
Ugnln 8s = 1,No = 0) roductlon Rate
Pacent of Feed Rate Converslon Emclency Percent or Feed Rate Conversion Emclency Percent of Feed Rate Convarslon Emciancy
Feadstodc - Waste paper
- W o o d Waste
- M k e d stodc
MMetPrlces - Ethanol - c02 - Ugnin
-Waste Paper - W o o d Waste - Mixed Stodc
Maxlmum Allowable Tlpplng Fee (lf applicable)
capital cost or Faclilty Scaling Factor (if appl) Land
Development Costs Plant:
Buildlngs
Blomass Converslon Balance of Plant
WOrklnQ Capital LATER Annual Operatlng Costs
Fixed: Lebor I ...' Ws.Oaa] lyr EiVQ. per person
Fbed Malntenance @ =of capltai
Variable Maintenance Waste Dis~osa l - Pretreatment
Varlable:
' - FermentatJon ' - Solids S e p a r a t l o m l t o n of ash
Chemicals Uullue8
W a t a
NaturalGas @
Steam Waste Wata Q
Addittonal Revenue - Power Sales
ob: ShsQdcsihfor OpUOn87 andearn lnputmils.Shadsd wllr for Opao
TABLE 8-1 b
MASTER INPUT TABLE FEEDSTOCK - MIXED, 5QX WOOD WASTE &WX WMTE PAPER
SITE LOCATION - BUFFALO, NY
71 81 91 101 11 I 1H i i
4 5 6 7 8 9 10 11 12 13 14 15 16 17 18 19 20 21 22 23 24 25 26 27 28 29 30 31 32 33 34 35 36 37 38 39 40 41 42 43 44 45 46 47 48 49 50 51 52 53 54 55 56 57 58 59 30 31 32 *iight\a
595 595 595
49.000 49,000 49000
$0.141
$0.000 $0.002
$0.000

Plant Slze Plant Slte Emanol Productlon Rate
8s = 1,No = 0) r roductlon Rate (Yes = 1, No = 0) Productlon Rate
Feedstock - Waste paper Percent of Feed Rate Converslon Emclency Percent of Feed Rate Converslon Enlciency Percent of Feed Rate Converslon Efflclency
AddHonal Byproducts 7 C 0 2
Llgnln
- Wood Waste
- Mbed stock
M a s t Rlces - Ethanol - c o 2 - Lignin
- Waste Paper If N / Q - Wood Waste - Mbed Stock
Maxlmum Allowable Tlpplng Fee (n applicable)
Capltai Cost of Facillty Scallng Factor (if appl) Land BUlldlngS Development Costs Plant:
Blomass Converslon Balance of Plant
Worklng Capltal LATER Annual Operating Costs
Fixed: Labor -6/yr avg. per person
UNITS fPD (wet)
ainE;pt) Fnon (wet)
tnslton (wet:
% lblgal
% Iblgal
% lblgal
Fbed Maintenance Q =of capitel
Varlable Malntenance W:ste Disposal - Pretreatment - Fermentatlon - Sollds SeparaUb-$BSllton of ash
Varlable:
'
Chemlcals uuinies
power Q v"" uchased Power
Water
Fuel Consumptlon
2 3
8 7 8 9
10 11 12 13 14 15 18 17
2
Steam Waste Water @
Addltlonal Revenue - Power Sales
Nob: Shaded 011s b r qXlons 13 and 14 are Input calls. Shnbd 0118 f o r 0
1 82.35
49,ooo 0
0.00 0
0.M)
5 9 6 6 9 5 1
82.35 49,ooo
0 0.00
1 0.55
TABLE 8-1 c
MASTER INPUT TABLE
FEEDSTOCK - MIXED, 50% worn WME a soox WASTE PAPER
595 1
82.35 49,ooo
0 0.00
0 0.00
1 SITE LOCATION - ROCHESTER. NY
595 1
82.36 49,000
0 0.00
1 0.55
0.0 0.00 0.0
0.00 100.0 24.29
0.0 0.0 0.0 0.0 0.0 0.00 0.00 0.00 0.00 0.00 0,o 0.0 0.0 0.0 0.0
0.00 0.00 0.00 0.00 0.00 100.0 1000 100.0 100.0 100.0 24.29 24.29 24.29 24.29 24.29
695 1
82.35 4 9 , m
0 0.00
1 0.55
&!ton
8% Qton
Simo
595 1
82.35
0 0.00
1 0.55
20 21 22 23 24 25 26 27 28
J i m $imo
Slmo o.ofpeopl
Slmo QQFd
( a m w.00 (W.00 (W.0a ($20.00 ($4000
$7,506 $7,500 $7,500 $7,500 $7,500 $7,500 7177 $9,375 $9,375 $9,375 $9,375 31 32 33 34 35 38 37 38 39 40 41 42 43
$3,010 88 $ 1 , m
$2,310 68 $3,olo 86 $2,310 66 4.310 88 $2,310 88
$790 $ l , W $790 $;rso $790
$0.m
$0.049
fO.ooo $0.180
%:E 3,050
0
3,050 $o.ooo , o $0.160
$0.000
$0.m 0
$0.332 325
$0.160
RE . '
$0.OOO $0.141 $0.ooO $0.141
88 152 68 152
.coo so.ooo $0.000
100 100 100 100
0 5.5 0
o 4.8
$a.ooo 0 so.oss 38 so.ooo 0 $0.099 38
mrh~onsfromOptbna 13and 14.
Q at
& a i
*gal
I b k r
T#D
$0.141
152 $0.099
38 $0.ooo $0.003
100
$0.2
48
48
50 51
47
49
$0.141 4.0
$00.005 152
$0.w 38
t0.m $0.003
100 t0.m"
Store 8 websbr Dwelopmont Corwratlon 8-14
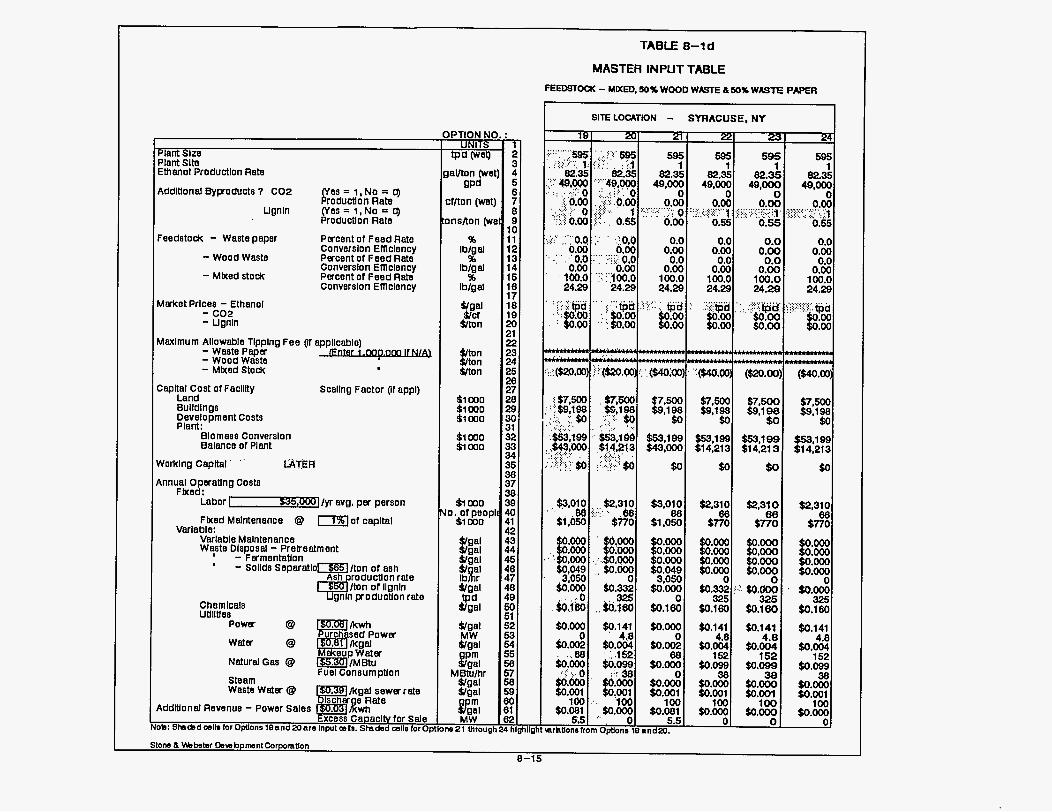
TABLE 8-ld
MASTER INPUT TABLE FEEDSTOM - MIXED. 50% WOOD WASTE LL 50% WASTE PAPER
24
595 1
82.35 4w00
0 0.00 gy?.; '..".: 3 0.55
0.0 0.00 0.0
0.00 100.0 24.29
:::::::.:::.:.:.. ... . ::.: ..:..:...fpd
I E - - ($40.00)
$7,500 $9,198
$0
@E $0
$2,310 66
$770
$0.ooo $0.ooo
0 $o.w 325
$0.1 80 $0.1 41
4.8 $0.004
152 $0.099
38 $0.ooo $0.001
100 $0.ooo
0
Piant size Plant Site Ethanol Productlon Rate
-7- 2 3 4 5 6 7 8 9
10 11 12 13 14 15 16 17 18 19 20 21 22 23 24 25 26 27 28 29 30 31 32 33 34 35 36 37 38 39 40 41 42 43 44 45 46 47 48 49 50 51 52 53 54 55 56 57 56 59 so $1 32 I
Addltlonal Byproducts 7 C02
Ugnln
hlghllgh
Feedstodc - Waste paper
- Wood Waste
- Mked Stock
e8 = 1, No = a) r roductlon Rate (ves = 1, No = a) Productlon Rate
Percent of Feed Rata Conversion Elficlency Percent or Feed Rate Converslon Elficlency Percent of Feed Rate Converslon Elficlency
Market Prices - Ethanol - c 0 2 - Ugnln
Maximum Allowable Tipping Fee (n applicable) - Waste Paper - Wood Waste - Mked Stock
Capttat cost or Faclllty Land
Scallng Factor (if appl)
BUlldlngS Development Costs Plant:
Blomass Converslon Balance of Plant
Noridng Capttal ' " LATER 4nnuai Ooeratina Costs
Fked: - Labor [-./yr avg. per person
Fked Malntenance Q of capital Varlable! . - . - -. -.
Varlable Malntenance W€!StO DlSpOSal - PrebXIatmOnt - Fermentatlon ' - SOlldS S e p a r & l O m / t O n Of ash
/ton of iignln
Chemicals UtllitleS
power Q
water Q
NaturalGas Q
Steam Fuel Consumptlon
- .. -. . . Waste Water Q hga l sewerrate
4ddmonal Revenue - Power Sales
Jb: 8had3dwlhtorOptlOns19and20srelnput~Is. SlndedwllsbrOp
)PTION NC UNITS
tpd WeQ
&gal Slct
&ton
$1 mo $1 mo $1 mo s1 mo s1 mo
$1 mo 0 . or peopl
$1 mo
Slgal Sl at I b k &gal tPd
*gal
&gal
%ai
MBtulhr &gal &gal
MW
GI MW
le21 througt
SITE LOCATION - SYRACUSE, NY
1Sl 201 21 I 221 E I I 1
0.c 0.W 0.c
0.W 100.c 24.5
$0.141
152 50.w
38 t0.m $0.001
100 $0.m
0
t0.G $0.1 41
4.8 $0.004
152 $0.099
38 $0.OOo $0.001
100 t0.m
0
Stone & Wbsbr DmmbpmentCorporation 8-15
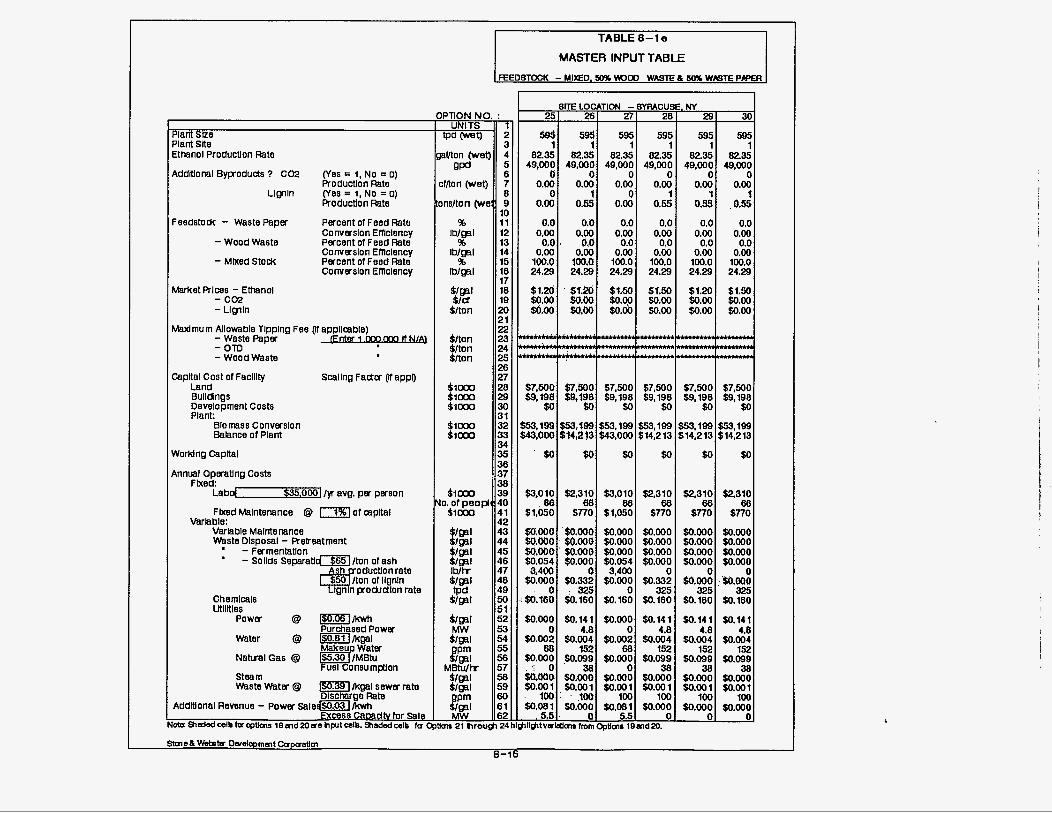
TABLE 8-1 o
MASTER INPUT TABLE FEEDSTOCK - MIXED. 8D9L Worn WASTE & MK WkSTE PPER
IPTlON NO. UNITS
wwt) aUton (wet)
mon (wet)
inslton (wet:
% Iblgsl
%
% lblgsl
lblgsl
$/-I $/U
$/ton
$/ton $/ton $/ton
$1000 $1000 $1000
$1000 $lorn
$lorn 0. of peopI!! $1000
S/Wl $/as1 $/as1
$/el
$/(.a1
$/-I
$/Wl $/Wl
$/PI l b l h
tpd
$/gsl M w 5 3
42 MWh
82 M w 6 2
am 21 hrou@
%ant Stze Dlant Slte Ethanol Productlon Rate
4ddiUonal Bwoduds 7 Co;!
Llgnln
:
; 4 5 6 7 a 9 IO 11 12 13 14 15 16 17 18 19 20 21 22 23 24 25 26 27 28 29 30 31 32 33 34 35 36 37 38 39 40 41 42 43 44 45 46 47 48 49 50 51 52
54 55 56 57 58 59 60 61
24
:eedstock - WastePaper
- Wood Waste
- Mtxed Stock
1 82.35
49,000 0 (Yes = 1, No = 0)
Roductlon Rate (Yes = 1, No = 0) Production Rate
Percent of Feed Rate Comwslon Enlclancy Percent of Feed Rate Comerslon Emclency Percent of Feed Rate Conversion Emclency
& x i 5 9 3 5 9 5 5 9 5 1 1 1
82.35 82.35 82.35 :48,000 49,000 49,000
0 0 a
m e t Rlces - Ethanol - c o 2
595 1
82.35 49,000
0 0.00
1 0.53
- Llfpln
595 1
02.35 49,000
0 0.00
1 ,&.as
W m u m Allowable Tlpplng Fae (nappllmble) - -Waste Paper -om - Wood Waste
0.0 0.00
0.0 0.00
100.0 24.29
2pital Cost of Faclllty Land Bulldngs Development Costs Plant:
Blomass Converslon Balance or Plant
0.0 0.00
0.0 0.00
100.0 24.29
Norklng Capital
0,o 0.00
100.0 24.29
$1.26 $0.00 Sd.00
Scallng F a d a (n appl)
' 0,0 0.0 0.0 0.00 0.00 0.00
lM),O 100.0 100.0 24.29 24.29 24.29
' $i.M $1.50 $tal $0*w $0.00 $0.00 $0,0 W.ob $0.00
4nnual Operatlng Costs Ftxed:
Labd SB.OOO~/~ avg. per person
Ftxed Malntemnce Q m o r mpltal
Varlable Malntemnce Wflsts Dlspofal - Reh?atrnent
Varlable:
- Fermentation - Solids Separatl-lton of ash
Chemlcals Utlltles
power
$1.20 $0.00 $0.00
Water Q
NatualGas Q
61.50 $0.00 $0.00
Steam Wasts Water Q
Addltlonal Revenue - POWK sa1e-m
mgal s e m rate DlSCharge Rate
Excess Camdtv for sale ~ S ~ a l e d o l L s f o r c p t k n s lOmd20aehpltwlk.Shadedoelb kr(
$2,310
s770
$2,310 6 6 6 6
$770
8llE LOCATION - SYRACU! 251 261 271 28
I I 1
$0.054 3,400
$0.000 0
@.I60
w.M)0'$0.000 $Oo.OOo $0.000 $0.000 $0.054 $0.000
0 3,400 0 $0.332 $0.000 $0.332 : 925 0 325
$0.160 $0.160 $0.160
"*,/ o.oo/ o.oI 0.00 1
0.00 0.B 0.00 0.a
sa.000 .$0.000 $0.000 w.000 '$0.000 $0.000
0.0 0 0 0.0 0.0 0.001 o.&l 0.00I 0.00
$0.000 $0.000
$0.000 $0.000 $0.000 $0.000
0 $d..ooo
325 $0.160
MI $0
$0.000 $0.000 so.000 $0.000
0 ;'W.rMO
325 $0.160
$0.000 $0.141 $0.000 $0.141
$0.002 $0.004 $0.002 $0.004 01 4.81 01 4.8
1 l l ~ t V a l d a w hornQ,tlum 19ad20.
:::i:::I $0.099 to.099
fo.000 $0.000 $0.001 $0.001
$0.000 $0.000
Stme6 Webtcr Dwelcpmmt Capaatirn 8-16
I
I

03/30185 BOWS-TO-EMANOLPRODUCTlON FACUiY PROFORW FNANCWSTATEMENT THRDPARMCONlRACTCRIDEKLOPER
ITE LOCATION -ALBANY. NY
TABLE 8-2a: CASE INPUT t o m AM
CASE 595 TPD ( w e of 100.096 MIXED STOCK (50% WASTE WOOD & 50% WASTE PAPER). WlTH GASIFICATION; WOOD @ S2O/TON
.In, IT. NLUL
GASZ OptlcnMmbs P h t S t e (badstockrate) Ehmol Robcticn &OW GPD P h t S t e Addtlonal bypoducb 7 co2: (O=No,,l =Vas)
Umh: Pons:
(BeehnhQ of Yea) RessltDay StatCcnaiuctbn Cato ldo f Caplhl & e n d b e
Biomass t3nwrslcn Babnce O f P h t
$11 883 k
$10200 k Snq5sojpsr lPD
Fl (Nbs: h d notescalrbsd) Total Ramt Day Caplhl Cost
Total C q h l Cost at C.O.Dab $137,183 k cr I Escalstlm to Centrold o f E w n d L r e hteresthrhg Canstructim
AnnualGpcrathg Costs I l o o % k SarsltLHy Index
Vertable Mahtenance Waste Dlspoeal -Rebaatmmt
Chemicals utllitles
-Fermmtatlcn - SOIYS sspatatlcn
P o w Wabr Nabrat Gas Stsam Waste Walar
Total Flxadb VarhbleOSM Total Vwhbb MM Cost
Fsedstock waste Paps Wood Waste MlxedStock
hfhtbn Rata pP) Eacahtlm Rata (Nomhal)
caphl Cord M M Cob:
Labcr M a h t m a w Matabh hiurnme WadeDispcsd -Rebsatmmt
-Fermmtatlcn 9 - soitis s~ra t lm
Chemkak Utlllllw
P o w Wakr NaUral Qs Stsam Wade Wabr
Feedstock: O*ut:
Ehmo l co2 U W
Tax Data: Fedaal hcometwrate State hcometaxrafs
Localtaxrate (QomRscslpbTeQ Ropsty Tax Rate
Estimated Annual Eqense Ehmol Ro&ctlm Tax Ode
Lastyba crsdltappllw Power ComCatah Rmew.Tax(Zedt EconomkDwelopmmtImathw Tax Depechtlcn
Eflectkerafs
b l ldhgs Dwebpmmt Costa P h t :
BIomassQnvenlcn Bahw O f P h t
BookDeprechtlcn
Debt4ach Fhsnchg Tam htemst Rab Amat&atlcn of h
8hcrtTsmCcnstuctim htaeot TargstReClm on EquHy
Debt Structure: .(. , .' .. .
(Now Must be c- Ecanomb uls)
Note: Theavsa~s tipphg tee hcakuhted so hrd the poled ybkb h e Target R h m on E q ~ l y . Mvalre t i porllke, m h g (be b trmtedas rwmue. Mnsgatke, tlpphg feebecoma fadstock &age a d ban -.e.
Btme R Websbr DwelopmmtCorpaatlm 8-17
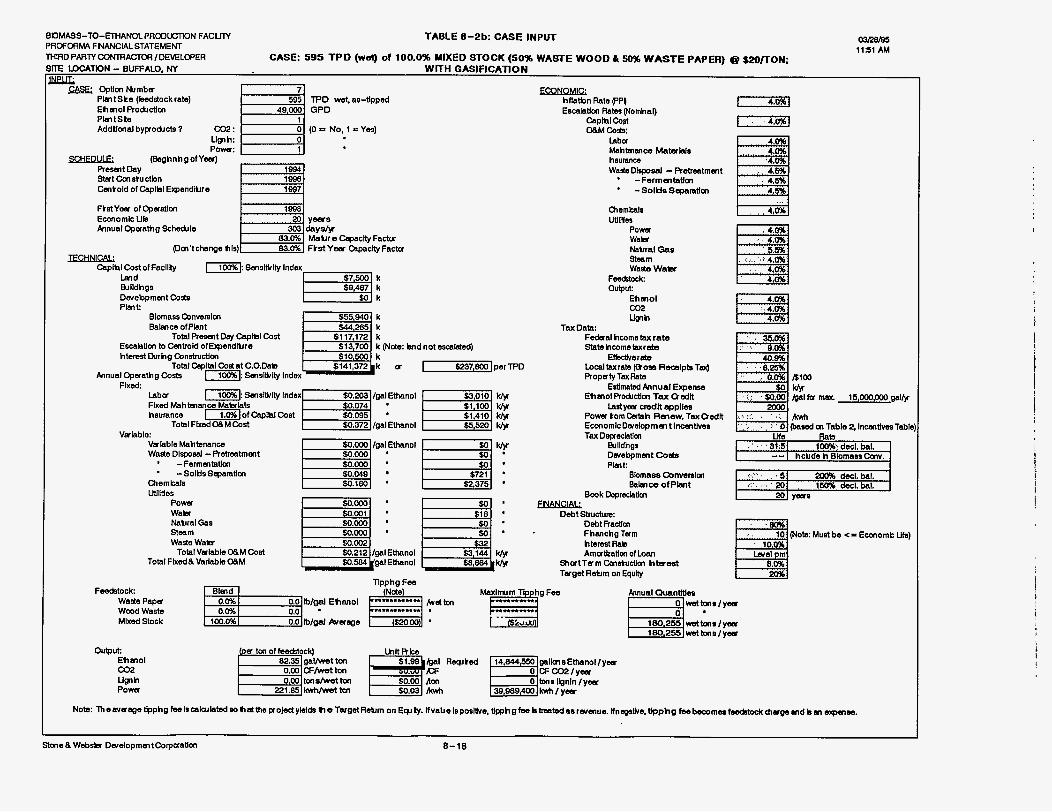
TABLE I-2b: CASE INPUT 03R8/W BDMASS-TO-ETHANOL PRODLETION F A C W PROFORMA FNANCIAL STATEMENT
TE .̂ . - LDCATDN - BUFFALO, NY
1151 AM THIRD PARlYCONTFiACTOR /DEVELOPER CASE: 595 TPD (wsr) of 100.096 MIXED STOCK (50% WASTE WOOD & 50% WASTE PAPER) @ t20nON;
WfTH GASIFICATION YULi
TPD wed,as-tlpped EBsEl OptlonMmba
P h t S t e (feedstockrate)
plrn t sin Ehmol Roductlcn 49000 GPD . ._ . . - I_
Addtlonal bypoducb 7 CO2 : Umh: P o w :
(Beghnhg of Yea) Resent Day StatCcnstuctbn Csntold of Caplhl Eqendhre
Bl 1 7
(0 = No, 1 =Vas)
FCstYw of Opaatlm Ecmomlc Llb hnual Operathg Schedrle
(Dcn't change hls)
W h I Cost of Facllky 1 1 : SenslWlty Index Lrnd fhlldhgs Devebpmmt C o d
a L Index
Fixed: Laba 1-1 SmsWlty Index $0.203, /gal Ethanol Fixed MahtslMu, MaWXiels .
Total FbtedOBMCost $0.372 /gal Ethanol
W.074 $0.095 hsumnut ~1 .Wb/o fCap lh ICost '
Virlable MahtsMnw / t g a l ~ t h a n o l
'
Virlable:
Waste Dlsposal - Prsbmtmmt ' -Fermentation . - SoMs Sqmmtlm m.wa
Qlemkals $0.160 ' Wlllles
P o w Wabr Nabral Gas Steam Waste Wakt
TotalValableOBMCost TotalFixed&VarhbleWM
El' $2 375
Qlemkals UtllHm
P o w Wakt Nabral Gas Stmm wasts wa*
F6edptock: OUiput:
Ehmol co2 Ugn h
Tax Data: FeQral hcome tax rate Statehcometaxrabs
E(bctker& Local taxrate (Qosl Rscslpta TgQ Propsty TaxRate
Ehmol Pro&ctlan Tax Oedlt Laayecr C m d t spplles
P o w tom Catah Renew. Tax Oedlt EcmomlcDwelopment lncmtlvw Tax Depecktlcn
Blldhgr Dwebpmmt Costa P h t :
Estlmafsd Annual Ewenw
Blmass ODnwnlcn edbnce O f P b n t
Book Deprechtlcn
Debt Structum: Debt hadlcn Fhanchg Tam htemst Rab Amatkatim of Loan
ShatTsmCanstuctlcn htusest Twget Rehrm on EquHy
, , , , , ,4.w
i, ,. , , 4.m , : 4.m
4.5%-
, , , ,.Is!% ...
.' , .*.I% El ' 1
I mi yeas
c= Economlc uts)
ouqlut: Ehmol co2 U m h P o w
N o k me avsage tlpphp fee lrcakuhted eo hcd the pow yleldp h e Target Rehrm on E ~ J ly. lfvalte Isposiihe, tipphgfee b tmated as rwmue. lfnspatke, tipphp Fae becomes fbsdstodc chaw a d b a eupma.
I
I
Stme& Websix DwalopmmtCorpaatlon 6-18
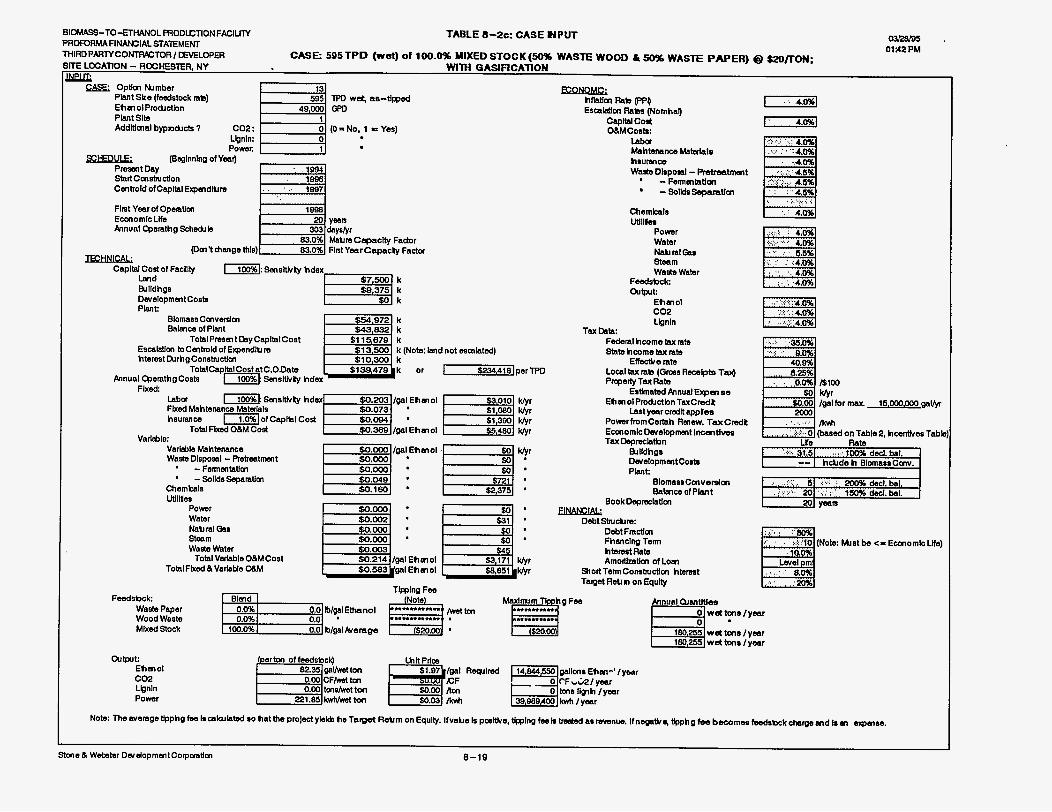
wRe/ss 01- PM
BIOMASS-TO-ETHANOL RODLCTIONFAClLITY PROFORMAFINAWIAL STATEMENT
TABLE 8--2~: CASE NPUT
THIRD PARTYCONTRPCTOR / EVELOPER CASE: 595TPD (wet) of 100.0% MIXED STOCK(SO% WASTE WOOD L 50% WAS= PAPER) @ $2onoN; ITE .-. - LOCATION - ROCHES'IER, NY WITH GASlFlCATlON IYLUAi
Optlm Mmber Plant Ske (feedstock rab) Ehm ol Probctbn Phnt sits Addlticnal bypndx!s 7 c 0 2 :
Lhnln: Power:
(Beglnnlng of Year) P m t Day Start Cmstnrctlon Cmbold ofCapbl EzpmdLra
hRatlm Rab (PPp EsmkHm Rabs (Nomhar)
capw c o l t ObMCosb:
Laba Mahtsnanw Matahla h r u r m w waats Dlipod - Rstrsatmt ' - Fennmtatlm - solids Sepamnm
Flnt Year of Opeatim EcmomlcLb Annual Operathg %he& b
pm't change thls)
Y M C o e t o f Facllty Iloo%l: Smslthrty hdex Lend M ldhgs DsrelopmmtCosta Ph"t . -...
Blomass Cmverelm Balm w of Plant
S11 679 k
$10300 k snA418j per TPD
F[ (Nots: land not escalated) TotalPlesmt DayCapltalCost
TotalCapltalCost atC.ODate $139479 k or I Esmlstlm toCmhold of EbpendH! re htemst IXlrhg Constructlcn
Annual Operathg Costa Scnsltlvty hdex
Labor -1 Smslthrly hdex Fixed Mahtenance Materials hsurance -1.Wb(of Caplhl Cost
Total Flxed ORM Cost
FIX&
VaMle: Varbble Mahtenance Waste Dlsposal - Retreatmart ' - Fennmtatlm ' -SolldsSeparntim
Chemkals WllUeS
Power Water Nab ral Gas Steam Waste Water
TotalFlxed R Varhble OBM Total VsrhbleORMCost
Feedsbck Waste Paper Wood Waste Mixed Stock
OuIJNplt: Ehmol c 0 2 Llgnln Power
Chemkals UtllHer
Power Water Nab la1 Gas Steam Waete Water
Feedsbck ou@ak
Ehmol c 0 2 Llgnln
TSX mta: Federal hcome tax rate State hcome tax rate
Local tax rab (Gloss Rbcslpts Ta@ Propetty Tax Rate
Eithnated Annual Emsr sa EhmolProQctbn TaxCredt
Last year C d l t appis~ PowerfromCertsh R a w . TaxCredt EconomlcDwelopmat Incsntha TaxDeprschtbn
E w e late
Flrlldhgr Dsreloprnmt Cor@ Plant:
BlomaseCmverslcn BabnwofPhnt
BookDepreclatlm
DebtStrudlra: Debt Fmctkn Fhanc lq Term htemst Rate Amoltbath of Loan
E41ortTermComtructIm htersst Tatget R d n on Equity
Tlpplng Fee
~ ~ [ b / y I E t h a n o I F lTton 0.0 Ib/gal Average 20.00 100.0%
h n u a l Ql~tf t les
( N o h lUlstbec-EconomlcLb)
Stone h Webster DwdopmatCorpomtlm 8-19
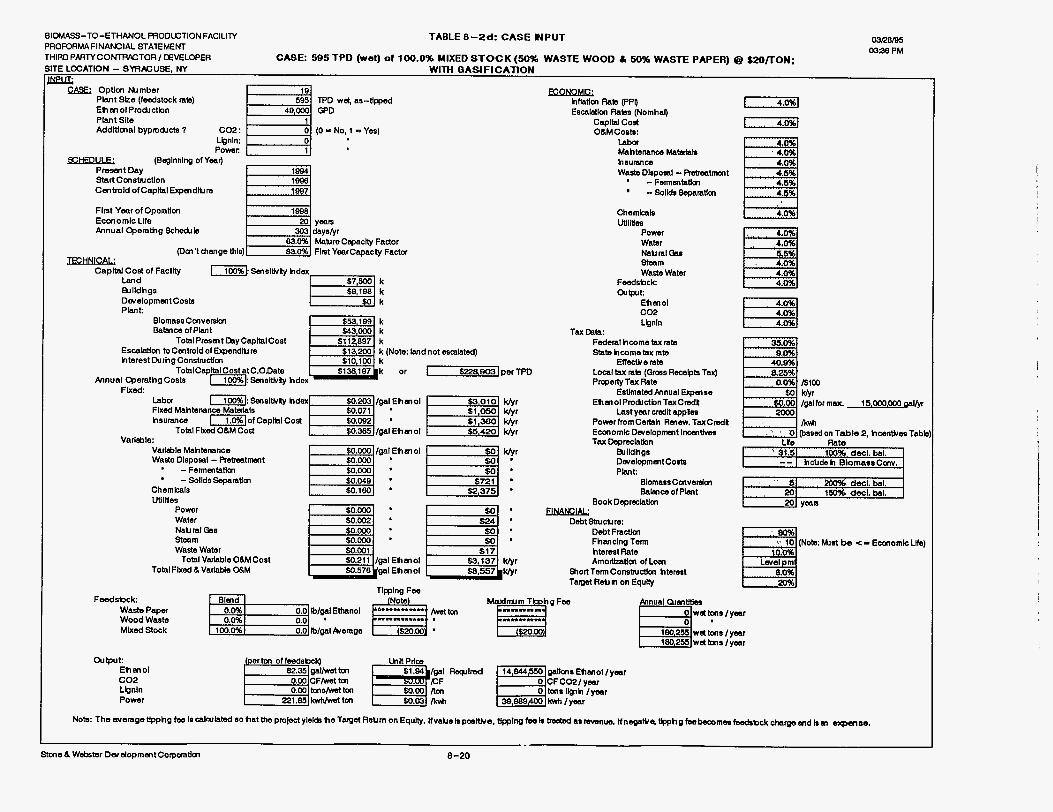
BIOMASS-TO-ETHANOL PRODLCTION FACILITY PROFORMA FINAbCIAL STAEMENT
TABLE 8-2d: CASE INPUT
THIRD PARlYCONTF%TORt EMLOPER CASE: 595 TPD (wet) of 100.096 MIXED STOCK (50% WASTE WOOD & 50% WASTE PAPER) 6p SMITON:
03/28/85 0338 PM
, _ . . - ITE LOCATION - SyRM2USE, NY WITH GASIFICAT~ON ..-a -. w
GAS2 Optlm h m b e r Phnt Ske (feedstock rab) E h m 01 Prodrctbn Phnt Slte Addltlmal bypmdrdn 7 c 0 2 :
Lignln: Power:
(Beglnnlng of Year) PrsstntDay Start Ccnst~ctlon Cmtmld ofcapltal E?pmdkum
TPD wet, GPD
(0 = No, 1
Flnt Yaar of Opeatlcm Ecmomlc Llfe Pnnual QJerathg %he& b
(Dm't change this)
Y M Cost of Facllty Iloo%l: SmsWRy hdex Land b l l dhgs Dwelopmmt Costs Pbnt:
Blomass Cmverslm Babnu, of Plant
$11 897 k
$10100 k I eaea3 I per TPD
E[ (No: bnd not escahted) TotalPmsmt ChyCapltalCost
EscaWcm toCmtrold of E?pendllrm hterest Curhg Conshrctim
TolalCapltalCost atC.ODate Pnnual Werathg Costs Lloo%b Sensittvky hdex
F l x d Labor L-1 SensiEkky hdex .203 tgalEhmol Flxed Mahtenanu, Materiels hsunvlce I1.0%1of Caphl Cost
Total Flxed O W Cost
VarWle Mahtenance Wash, Dlsposal - Rstrsetmmt ' -Fennentatlm
- SolldsSeparatlm
VaMle:
Chemlcals UtllMes
Power Water Nab ml Gas Steem W a d Water
Total Fked h Varlable O(LM Total Varhble O&MCost
Tlpplng Fee Feedsbck
Waste Paper Wood Waste Mlxed Stock
hrlatlcn Rab (PPI) Escalation Rabs (Nomhal)
capltal cost OhMCoob:
Laba Mahtenams Matahh hsumnw Waate Dlspoml - Rsbaatmcnt ' - F ~ ~ ~ ~ ~ n t a t k n
-solkh8qMratkn
Chemlcab UtlllSe
Power Water Nabml(kr Steam Wasta Watsr
F d s b c k ou@lt:
Ehmol c 0 2 Llgnln
TU mta: Federal hcometax rate Stab hcome Bw rate
Local Bw mb (Oms Recelpts Tax) Property Tax Rate
EstimatedPnnual Gpmse EhmolProdctbn TaxCmdt
Lastymrcredkapplee PowerhomCertah R a w , TaxCmdt E m o m k Dwelopmat lncmthrw TaxDepmchtbn
Mldhgs Dwelopmmt Costs Phnt:
Effactt/e rate
Biomass Cmverslm Bahw of P h t
BookDepmchtlm
DsbtstrucUre: Debt Fractlcn Fhanclng Term htemst Rate Amolttzatlm of Loa
WortTermConsbuctim hterat Tagst Rstl n on Equity
E] 4.6% 4. %
1-1 4.0%
L b Rats 100% decl. bal. " 3r.51
I hcbds h BlomassCanv. -- , ' , " 51 , MO% decl.bal.
, 201, 160% decl. bal. ~~
I 201 ymm
I*] 10 (Now h a t be c- Emomlc Llfe)
Outpw E h m o l c 0 2 Llgnln Power
pallmi Ehmol t ymr
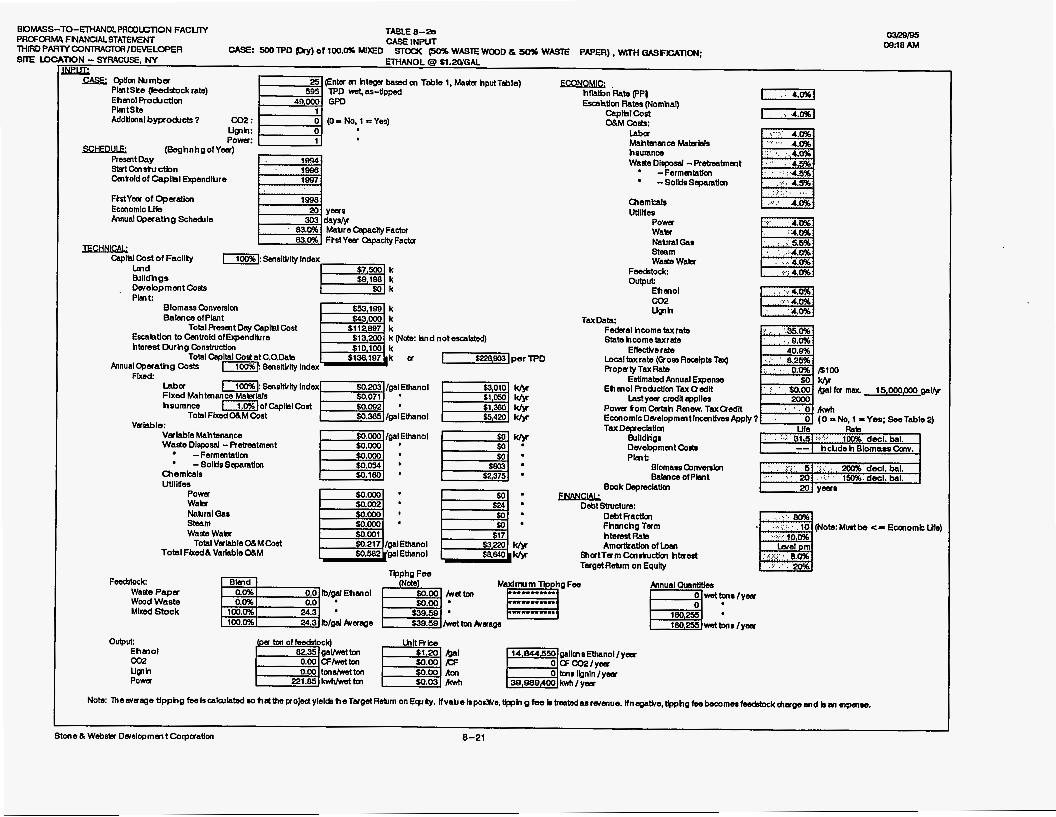
B D W PROFol
s m u m m F
oJRB/85 TO-ETHANOLPRWLCllON FACUM TABLE e-- FNANCWSTATEMENT CASE INPUT OM8 AM YCONlFIArnlDEvELOPER T D N - SYRACUSE, NY m
CASE: 500 7PD (au) of 100.0% MIXED STOCK (509b WASTE WOOD & 50% WASTE PAPER), WITH OAsFlCATIoN; ETHANOL @ L1.2tYGAL
~
cn Table 1, Ma* hputTble) GfSE CpImNlrnbu PhtSke (Iwdstockrate) EhmolRo&cticn PhtSte Addlimal bypoducts 7 co2 : 1-1 (0 = No, 1 = Yes)
F ! t----+l (8eghnhg of Y m )
R m t Day S$rtCcnstuctbn Csntold of Caplhl Ependllrre
FtstYea of Opaarim I ' Ecmomlc LHe Annual Operathg S c h e d h
Caplhl Cost of Facllky h d Bildhgs
Plm t: Dwebprnmt Costs I. - ,
Biomass Bnveralm BabnceofPlant
Total Resmt Day Caphl Cost
Total Qpltal Cog at C.O.Dab
Escahtlcm to Csntrold ofEpendltlre hterest Ourhg Bnstructlm
AnnuaiOpaathg Costs -1 SensRClty Index Flrorl
hnd n o t e s c a m
I -803 I per
. Labw 1-b SmsWlty Index Flxed Mahtmance Matttats hsurance -]of Caphl Cost
Total FkedOBMCost V d n h l r . .I-.".
Varhble Mahtenance Warts Disposal -Rstroatmmt
Chemicals UtlllUm
-Fermmtatlm - sotnssepamtlm
P o w Watt Nabral Qaa Steam W a h Wabr
Total Flxedd Varkble O&M Total VahbleCXMCost
Escahtim R a h (Nomhal) CapM Cost OBM Costp:
Labor Mahtmmm Matalsls hsuranw WahDlopod -Retxmtmmt
-Fermmtatlon -SOlttaSaparanon
Chernkale wines
P o w Watt Nabral Gaa Steam Wads Wabr
Feedptock OUtput:
Ehmol co2 Ugr h
Tax Data: Federal hcometaxrate State hcomebxrate
Localtaxrate (QomRbcelptsTQO RopstyTaxRate
Ehmol Ro&ctlcn Tax OedR
Efbctkerate
Estlmatd Annual € p e w
Lastym cmdRappllm Powa tomcutah Renew. TaxOedlt Economlc Dwelopmmtlmentlvea Appty 7 1-1 E No, 1 =Yes; See Table 2) ~ a x ~ e p ~ ~ h t l m ufe h b
100% decl. bat. Rllldh'gs : , :.,:: 3(.5 :::,.':.. I hcbde h B1orna.o Canv. -- Dwebpmmt Coab
P h t : Blomasa~,rrvenlm Balmce OfPbnt 160%. decl. bat.
Book Deprechtlrn FNANCIAL:
Debt Strueturn: ~~. Debt Fractlcn , :.:. 80% Fhwchg Tam * m ( N o k M u s t b .. .:.;,r (0 c-EcmomtUFe) htemst Rab Amutlcatlm of Lom
shatTsmConrtuctlon htueat TargetRelurn on Equlty
h e 1 m . .. ...,. . , , . .(. .,. .:.' : ,
OUlput: Ehmol co2 Ugr h P o w
Now Thewsage tlpphg fw l scakuhtd M hdttm poled yleldp heTsrget Rehrrn on Eq.l ty. lfvabe h p o a l e , tlFph g tse b tmatdas rwmue. lfnsgatke, tJpphg fsebecomea fsedstock &age a d ban Cqara.
8-21 Stone 6 Web* Dweloprnm t Corpuatlcn
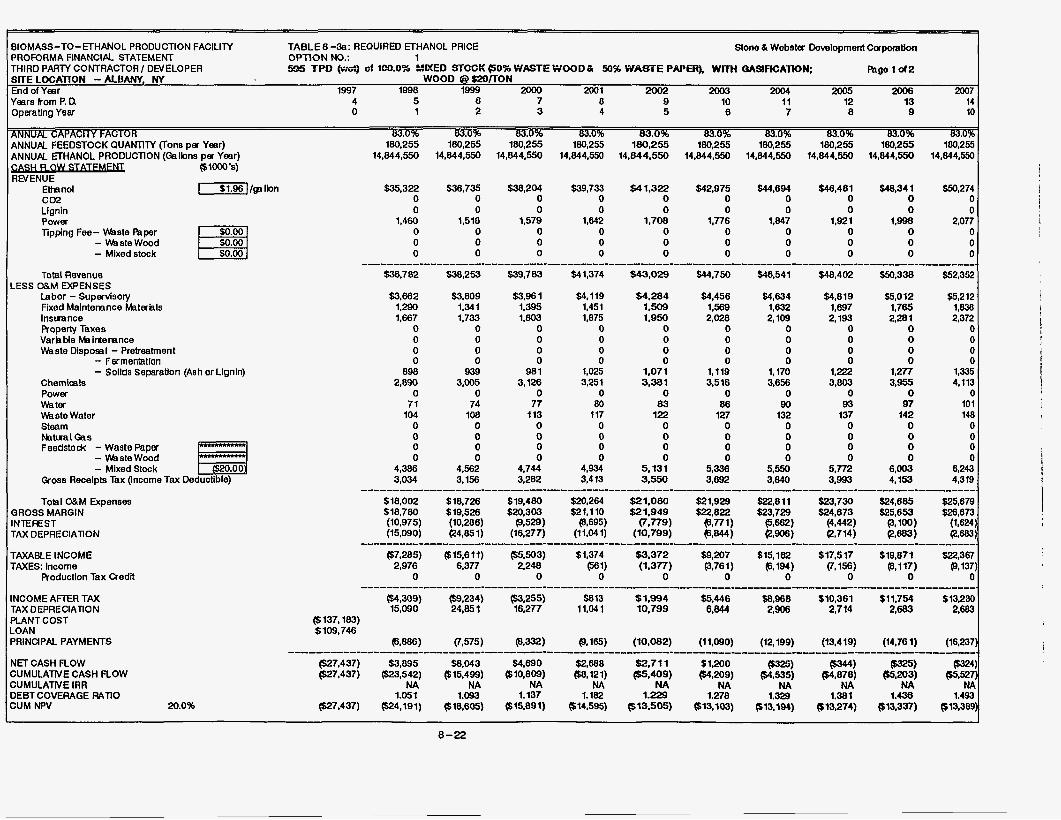
Stone & Webster Development Corporation TABLEB-3a: REQUIRED ETHANOL PRICE OPTlON No.: 1
3IOMASS-TO- ETHANOL PRODUCTION FACILITY 'ROFORMA FlNANClCV STATEMENT rHlRD PARTY CONTRACTOR / DEVELOPER NTELOCATlON -ALBANY, NY WOOD @$2O/TON ind of Yeer 1997 1998 1999 2Ooo 2001 2002 2003 2004 2005 2006 2007 feers horn P. D. 4 5 6 7 8 9 10 11 12 13 14
55x5 TPD &ci) of 100.0% URED STOCK (50% WASTE WOO D L 5056 W A S E PAPER). W i l H QASIFICAWN; h g e 1 of2
3paatlng Year 0 1 2 3 4 5 6 7 8 9 10
ANNUAL FEEDSTOCK QUANTITV (Tons per Yeer) 180,255 180,255 180,255 180,255 180,255 180,255 180,255 180,255 180,255 180,255 CAPA-R 83.0% 83.0% 83.0% 83.0% 83.0% 83.0% 83.0% 83.0% 83.0% 03.0%
ANNUAL FTHANOL PRODUCTION (Geibns per Yeer) 14,844,550 14,844,550 14,844,550 14,844,550 14,844.550 14,844,550 14,844,550 14,844,550 14,844,550 14,844,550 ($looO's)
WENUE Ethanol C M Lignin Power Tipping Fee- Waste Paper
- Waste Wood - Mixed stock
m $ i . g 6 ) / g s l b n
Total Revenue
Labor - Supervisory Fixed Maintenance Materials lnsvance Property Taxes Variable Mainterance Waste Disposal - Pretreatment
.ESS O&M EXPENSES
- Famentatlon - Solids Separation (Ash or Llgnln)
Chemicals Power Water Waste Water Steam ktualGes Feedstock - Waste Paper - W s t e Wood - Mixed Stock &as Receipts Tax (Income Tax Deductible)
Tobl O&M Expenses ;ROSS MARGIN NTEREST TAX DEPRECIATION
-AXABLE INCOME -AXES: Income
Production Tax QedR
NCOME AFIER TAX 'AX DEPRECIATION LANT COST OAN 'RINCIPAL PAYMENTS
JET CASH FLOW :UMULATNE CASH FLOW :UMULATNE IRR
:UM NPV )EBT COVERAGE wno
20.0%
$3,662 1,290 1,667
0 0 0 0
898 2,890
0 71
104 0 0 0 0
4,386 3,034
$3,809 1,341 1,733
0 0 0 0
939 3.005
0 74
108 0 0 0 0
4,562 3.156
$3,96 1 1,395 1,803
0 0 0 0
981 3,126
0 77
113 0
$4*119 1,451 1,875
0 0 0 0
1,025 3,251
0 80
117 0
0 0 0 0 0 0
4,744 4,934 3,282 3,413
$4.284 1.509 1,950
0 0 0 0
1.071 3.381
0 83
122 0 0 0 0
5.131 3,550
$4,456 1,569 2,028
0 0 0 0
1,119 3,516
0 86
127 0 0 0 0
5,338 3,692
$4,634 1,632 2,109
0 0 0 0
1,170 3,856
0 90
132 0 0 0 0
5,550 3,840
$4,8 19 1,697 2,193
0 0 0 0
1.222 3.803
0 93
137 0 0 0 0
5,772 3,993
$5,012 1,765 2,281
0 0 0 0
1,277 3,955
0 97
142 0 0 0 0
6,003 4, I53
$5,212 1,836 2,372
0 0 0 0
1,335 4,113
0 101 148
0 0 0 0
6,243 4,319
8-22
i
!
i
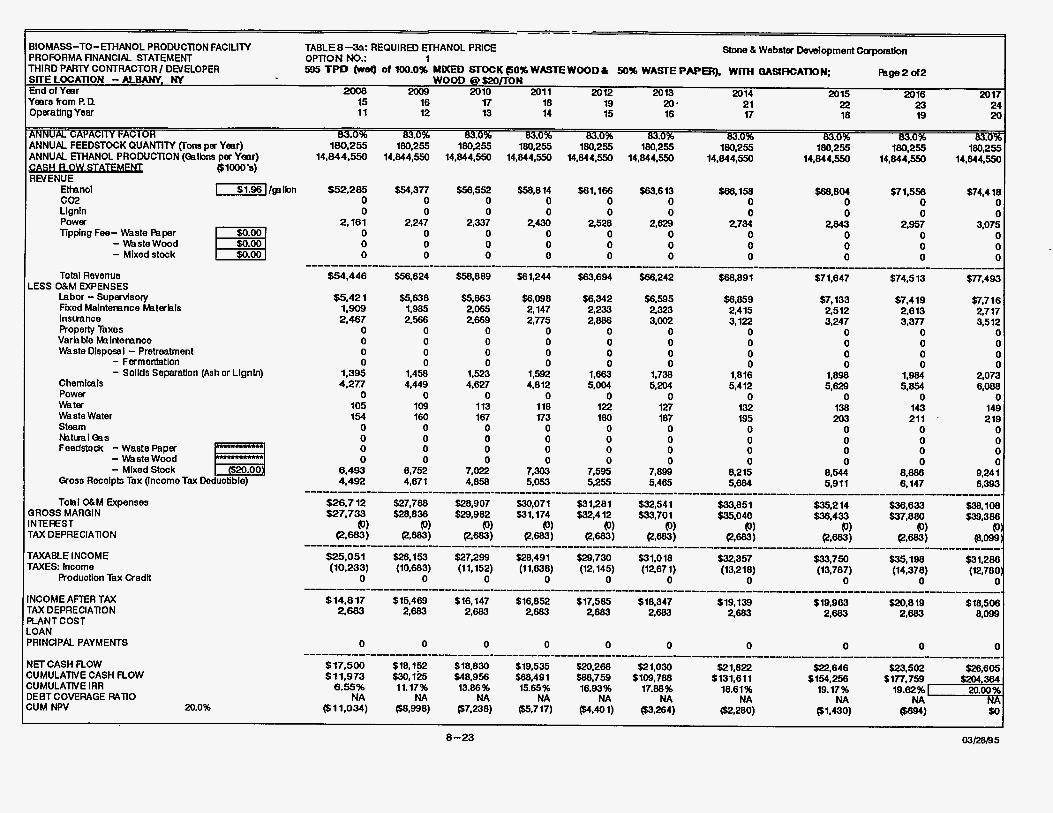
Stone h Webster Devalopment Corporabkm IIOMASS-TO-ETHANOL PRODUCTION FACILITY 'ROFORMA FINANCIAL STATEMENT OPTION NO.: I HlRD PARTY CONTRACTOR/ DEVELOPER ;tlELOCATlON -ALBANY, NY
2008 2009 2010 2011 2012 2013 2014 2015 2016 2017 tnd of Yesr 'esrs from P. D. 15 16 17 18 19 20, 21 22 23 24
TABLEB- REQUIRED ETHANOL PRICE
595 TPD Page2d2 of Mo.O% MIXED STOCK 60% WASTE WOODL 50% WASTE PAP& WITH OASIRCATION; WOOD @t20/TON
)peratlng Year 11 12 13 14 15 16 17 18 i9 20
14,044,550 14,844,550 14,844,550
-$1.96/pIbn $52.285 0
$54,377 0
$56,552 W,814 0 0
$681,166 0
563,613 0
Lignin Power Tipping Fee- Waste Paper - Waste Wood - Mixed stock
Total Revenue
Labor - Supervisory Fixed Maintenance kter ia ls lnsuance Roperty Taxes VarhMe Meintenance Waste Disposal - Pretreatment
Chemicals Power Water Waste Water Steam
ESS O&M EXPENSES
- Fermentatton - Sollds Separation (Ash or Llgnln)
NatualGas Feedstodc - Waste Paper - Waste Wood - Mixed Stock Oross Receipts Tax (Income Tax Deductible)
TOM O&M Expenses iROSS MARGIN JTEREST AX DEPRECIATION
AXABLE INCOME AXES Income
Roduction Tax Qedit
ICOME AFTER TAX 4X DEPRECIATION A N T COST 3AN RlNClPAL PAYMENTS
IET CASH FLOW :UMULATNE CASH FLOW :UMULAME IRR
:UM NPV IEBT COVERAGE wino
20.0%
0 0 0 0 0 0 0 0 0 0 2.161 2,247 2,337 2,430 2528 2,629 2734 2343 2957 3,075
0 0 0 0 0 0 0 0 0 0 0 0 0 0 0 0 0 0 0 0
$68,891 $71,647 $74,5 13 $77,493
____________________----_------------I----------I---------------------------------------- 0 0 0 0 0 0 0 0 0 0
$54.446 $56,624 $58,889 $61,244 $63,694 566242
$5.42 I $5,638 $5,863 $6,098 $6,342 $6,595 $6,859 $7,133 $7,419 $7,7 16 1.909 1,985 2,065 2,147 2,233 2,323 2,415 2,512 2,613 2,717 2,467 2,566 2,669 2,775 2,886 3,002 3,122 3,247 3,377 3,512
0 0 0 0 0 0 0 0 0 0 0 0 0 0 0 0 0 0 0 0 0 0 0 0 0 0 0 0 0 0 0 0 0 0 0 0 0 0 0 0
1.395 1,458 1,523 1,592 1,663 1.738 1,816 1,898 1,984 2,073 4.277 4,449 4.627 4,812 5.004 5,204 5,412 5,629 5.854 6,088
0 0 0 0 0 0 0 0 0 0 105 109 113 118 122 127 132 138 143 149 154 160 167 173 180 187 195 203 211 ' 219
0 0 0 0 0 0 0 0 0 0 0 0 0 0 0 0 0 0 0 0 0 0 0 0 0 0 0 0 0 0 0 0 0 0 0 0 0 0 0 0
6.493 6,752 7,022 7,303 7,595 7,899 8,215 8,544 8,886 9,24 1 4.492 4,671 4,858 5,053 5,255 5,465 5,684 5,911 6,147 6,393
---------------------------------------------------------------I--____-_______________________ . $26.712 $27,788 $28,907 $30,071 $31,281 $32,541 $33,851 $35,2 14 $36,633 $38,108 $27.733 $28,836 $29,982 $31,174 $32,412 $33,701 $35,040 $36,433 $37,880 $39,386
(0) (PI (0) (PI (0) (0) 9) (0) (0) (0) Cr.683) en6831 @,683) @,683) @,683) esw esw (ato-1
$25,051 $26,153 $27,299 $28,491 $29,730 $31,018 $32,357 $33,750 $35,198 $31,286
0 0 0 0 0 0 0 0 0 0
2.683 2,683 2,683 2,683 2,683 2,683 2.683 2683 2,683 8,0-
-------------------------------------------------- ------ ---- ----________ - . (10.233) (10,683) (11,152) (11,638) (12,145) (12,671) (13,218) (13,767) (14,378) (12,780:
$14.817 $15,469 $16,147 $16,852 $17,585 $18,347 $19,139 $19,963 $20,8 I 9 $18,506 ------------------------------------------------- .------ ---- -----______- ---------- .
I
8-23 03/26/95
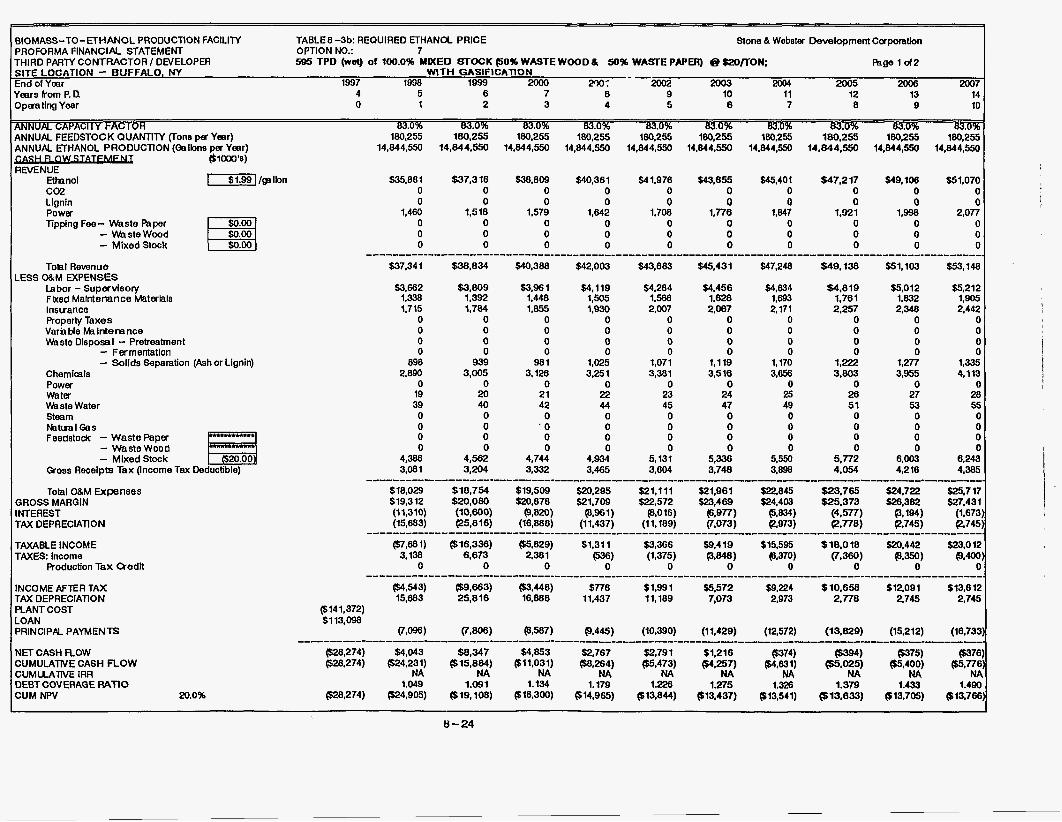
UOMASS-TO- ETHANOL PRODUCTION FACILITY 'ROFORMA FINANCIAL STATEMENT OPTION NO.: 7
TABLE8 -3b: REQUIRED ETHANOL PRICE I Stone & Webeter Development Capomtion
-HIRD PARTY CONTRACTOR / DEVELOPER SITE LOCATION - BUFFALO, NY Ind of Year 1997 1998 1999 2Ooo 290: 2002 2003 2004 2005 2006 2007 'ears from P. 0. 4 5 6 7 8 9 10 11 12 13 14 ) p a l i n g Year 0 1 2 3 4 5 8 7 8 9 10
R 83.0% 83.0% 83.0% 83.0% 83.0% 83.0% 63.0% 83.0% 83.0% 83.041; INNUAL FEEDSTOCK QUANTITY (Tons pef Year) 180,255 180.255 180,255 180,255 180,255 100,255 180,255 180,255 180,255 180,255 INNUAL ETHANOL PRODUCTION (Gelbns per Year) 14,844.550 14,844,550 14,844,550 14,044,550 14,844,550 14,844,550 14,844,550 14,844,550 14,844,550 14,844,550
4EMNUE E h n o l V ] / g s l b n $35,881 $37,316 $38,809 $40,361 $41,978 $43,655 $45,401 547,217 $49,106 551,070 CO2 0 0 0 0 0 0 0 0 0 0
595 TPD (wsl) of 100.0% MIXED STOCK eo% WASTE WOOD & 50% WASTE PAPER) @@/TON: Psge 1 of2 - - WITH GASIFICATION
(%lmO'S)
Lignin Power Tipping Fee- Waste Psper
- Mixed Stock - Waste Wood
Toal Revenue
Labor - Supervisory Fixed Malntenance Materkls lnslrance Property Taxes VarbMe hkintemnce Waste Disposal - Pretreatment
Chernlcals Power Water Waste Water Steam
.ESS W M EXPENSES
- Ferrnentatlon - Solids Separation (Ash or Lignin)
b&tUa lGeS Feedstodc - Waste Paper - Waste Wood - Mixedstock ems Receipts Tax (Income Tax Deductible)
Total O&M Expenses 3ROSS MARGIN MEREST TAX DEPRECIATION
r m w E INCOME TAXES: Income
Production Tax Qedit
NCOME AFTER TAX TAX DEPRECIATION ' L A M COST .OAN 'RINCIPAL PAYMENTS
4ET CASH FLOW >UMULAME CASH R O W X J M U A T M iRR
:UM NFV 20.0% EBTCOVERAGE wno
1 I 8-24
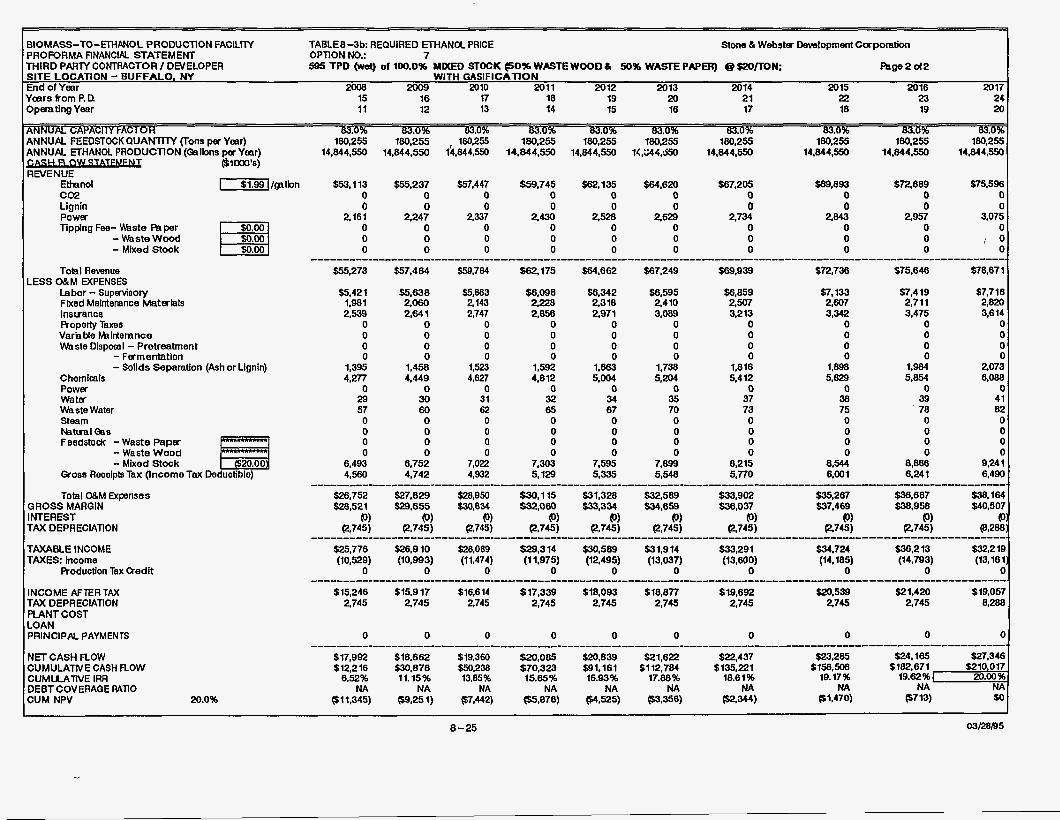
BIOMASS-TO-ElH PROFORMA flNANC
Stone & Webstcr Development Corporation
REVENUE E h n o l CO2 Lignin POWBT l ipping Fee- Waste Pa per - k s t e Wood
- Mixed Stock
$53.113 0
$55,237 0
$57,447 0
$59,745 $62.135 s’w20 0 0 0
$67,205 0
569,893 0
$72.889 0
$75,596 0
0 0 2.247 2,337
Tohl Revenue
Labor - Supervisory Fbted Maintenance Materials Insuance Property Taxes Variable Mnintemnce Waste Disposal - Pretreatment
Chemicals Power water Waste Water Steam
LESS O S M EXPENSES
- Fsmentatlon - Solids Separation (Ash or Lignin)
Natual (33s Feedstock -Waste Paper - Waste Wood - Mixed Stock &os8 Receipts Tax (Income Tax Deductible)
Total O&M Expenses GROSS MARGIN INTEREST TAX DEPRECIATION
TAXABLE INCOME TAXES Income
Production Tax &edit
INCOME AFTER TAX TAX DEPRECIATION PLANT COST LOAN PRINCIPAL PAYMENTS
NET CASH FLOW CUMULATWE CASH FLOW CUMUATIVE IRR
CUM NPV DEBTCOVERAQE wno
20.0%
0 2.734
0 2,843
0 2,957 3,075 01 0 0 0
2430 2.528 2.629
$542 1 1,981 2,539
0 0 0 0
1,395 4,277
0 29 57 0 0 0 0
6,493 4,560
$5,638 2,060 2,64 1
0 0 0 0
1.458 4,449
0 30 60 0 0 0 0
6,752 4,742
$5,883 2,143 2,747
0 0 0 0
1,523 4,627
0 31 62 0 0 0 0
7,022 4,932
$6,098 2,228 2,858
0 0 0 0
1,592 4,812
0 32 65 0 0 0 0
7,303 5,129
56,342 2,318 2,97 1
0 0 0 0
1,663 5,004
0 34 67 0 0 0 0
7,595 5,335
$6,595 2,410 3,089
0 0 0 0
1.738 5,204
0 35 70 0 0 0 0
7.899 5,548
$6,859 2,507 3,213
0 0 0 0
1,816 5,412
0 37 73 0 0 0 0
8,215 5,770
$7.133 2,607 3,342
0 0 0 0
1,898 5,629
0 38 75 0 0 0 0
8,564 6,001
$7,419 2,711 3,475
0 0 0 0
1,984 5,854
0 39
‘ 78 0 0 0 0
8,888 6,241
$7.716 2,820 3,614
a a a a
a
a a a a
2,073 6,088
41 82
9,241 6,490
$26,752 $28.521
$27,829 $28,950 $29.655 $30.834
$30,115 $31,328 $32.589 m.080 $33.334 $34.659
$33,902 $36.037
535,267 $37.469
$38,687 $38.958
E38,164 $40.507
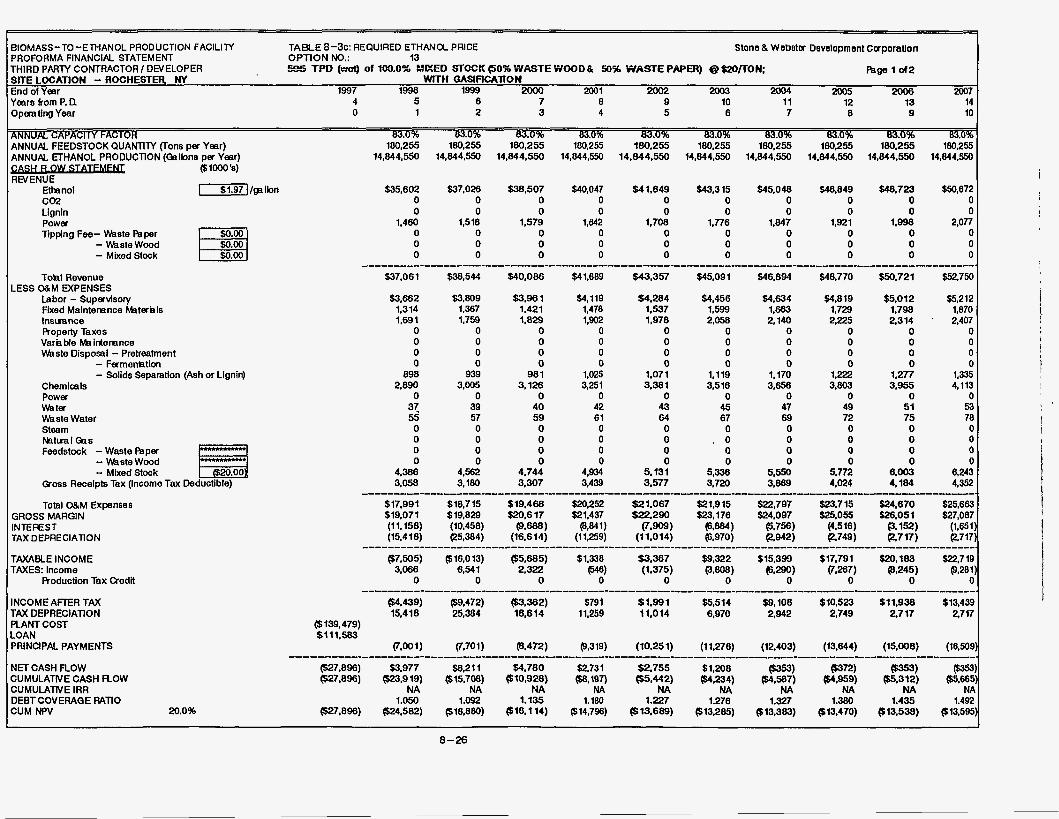
Stone & Webster Development Caporauon
page 1 of2
BIOMASS- TO-ETHANOL PRODUCTION FAClLlN PROFORMA FINANCIAL STATEMENT OPTlON No.: 13 THIRD PARTY CONTRACTOR I DEVELOPER SITE LOCATION - ROCHESTER MY End of Year 1997 1998 1999 2Ooo 2001 2002 2003 2004 2005 2006 2007 Years from P. 0. 4 5 6 7 8 9 10 11 12 13 14 O p m ting Year 0 I 2 3 4 5 6 7 8 9 10
TABLE 8 - 3 ~ : REQUIRED ETHANOL PRICE
!%E5 TPD (wot) of 10.0% MIXED STUCK @ O X WASTE HOOD & 5056 WASTE PAPER) @ $ZO/TON; WITH OASlFlCATlON
Tohl Revenue
labor - Supervisory Fixed Maintenance hterhls lnsuance Property Taxes VarhMe hkintemnce Waste Disposal - Pretreatment
Chemicals Power Water Waste Water Steam
LESS O&M D(PENSES
- Ferrnenbtion - Solids Separation (Ash or Lignin)
lrletml a s Feedstock - Waste Paper - Waste Wood - Mixed Stock ($20.001 Qoss Receipts Tax (Income Tax Deductible)
mmhnmn
Total O&M Expenses GROSS MARGIN INTEREST TAX OEPREClAllON
TAXABLE INCOME TAXES: Income
Production Tax Qedit
INCOME AFIER TAX TAX DEPRECIATION PLANT COST
PRINCIPAL PAYMENTS
NET CASH FLOW CUMULATNE CASH FLOW CUMULATNE IRR
CUM NPV 20.0% DEBTCOVERAGE wno
$37,061
$3.662 1,314 1,691
0 0 0 0
898 2,890
0 2 0 0 0 0
4,386 3,058
$38,544
$3.809 1.367 1,759
0 0 0 0
939 3,005
0 39 57 0 0 0 0
4,5452 3,180
$40,086
$3.96 1 1.421 1,829
0 0 0 0
981 3,126
0 40 59 0 0 0 0
4.744 3,307
$41,889
$4,119 1,478 1,902
0 0 0 0
1,025 3,251
0 42 61 0 0 0 0
4,934 3,439
$43.357
$4,284 1,537 1,978
0 0 0 0
1.071 3,381
0 43 64 0 0 0 0
5.131 3,577
$45,091
$4,458 1,569 2,058
0 0 0 0
1,119 3,516
0 45 67 0
. o 0 0
5,338 3,720
$46,894
$4,634 1,863 2,140
0 0 0 0
1,170 3,656
0 47 69 0 0 0 0
5,550 3,869
$48,770
$4,819 1,729 2,225
0 0 0 0
1222 3,803
0 49 72 0 0 0 0
5,772 4,024
$50,721
$5,012 1,798 2.314
0 0 0 0
1,277 3,955
0 51 75 0 0 0 0
6,003 4,184
$52,750
$5,212 1,870 2,407
0 0 0 0
1,335 4,113
0 53 78 0 0 0 0
8,243 4,352
I
1 I
8-26
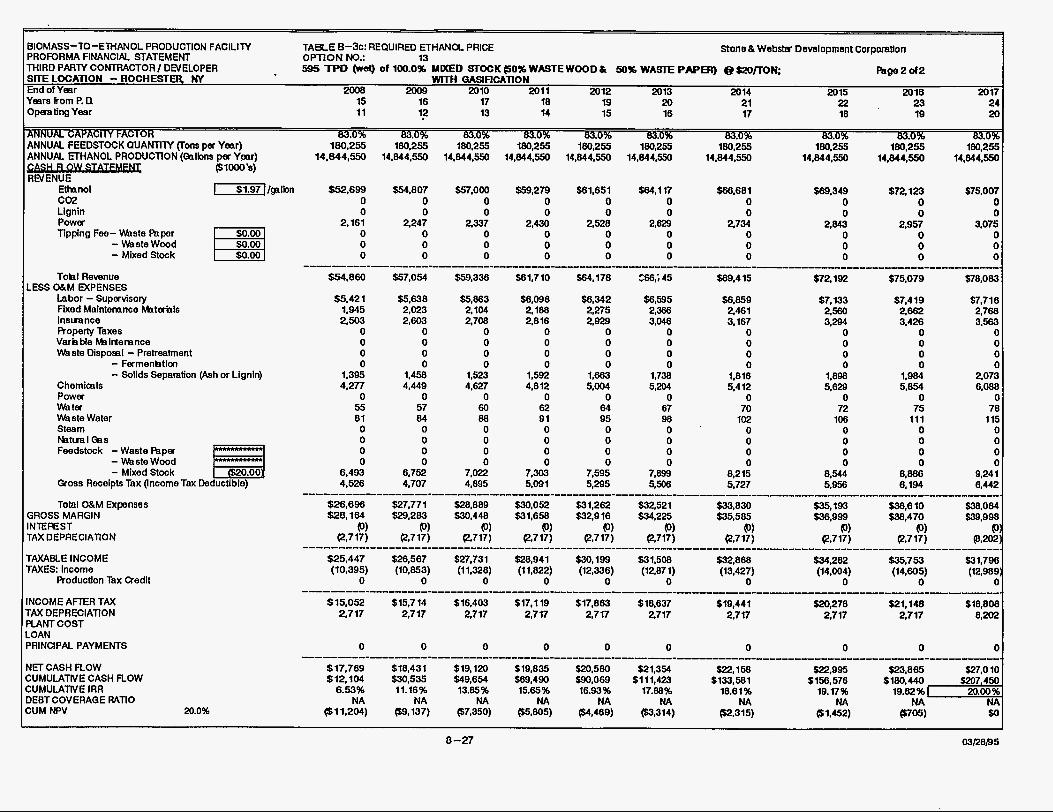
1-1 /ga I bn $52,699 $54,807 $57,000 $59,279 $61,651 $64,117 ~ ~~
Lignin power Tipping Fee- Waste Paper - Waste Wood - Mixed Stock
TOW Revenue
Labor - Supervisory Fixed Maintemnce Materials lnsuance Property Taxes Variable Msirtenence Waste Disposal - Pretreatment
Chemicals Power water Waste Water Steam
.ESS W M EXPENSES
- Fermenhtim - Solids Separation (Ash or Lignin)
Natual Qls Feedstock -Waste Paper - Waste Wood - Mixed Stock Gross Receipts Tax (Income Tax Deductible)
Total O&M Expenses ;ROSS MARGIN NTEREST 'AX DEPRECIATION
'AXABLE INCOME 'AXES: Income
Production Tax Credit
UCOME AFER TAX AX DEPRECIATION L A M COST OAN 'RINUPAL PAYMENTS
IET CASH FLOW iUMULATWE CASH FLOW iUMULAME IRR IEBTCOVERAQE mmo iUM NPV 20.0%
$5.42 1 $5,638 $5,863 $6,098 $6,342 $6,595 $6,859 $7.133 $7.419 $7.716 1.945 2,023 2,104 2,188 2,275 2,366 2,461 2,560 2,662 2,760 2,503 2,603 2,708 2,816 2,929 3,046 3,167 3,294 3,426 3.563
0 0 0 0 0 0 0 0 0 a 0 0 0 0 0 0 0 0 0 a 0 0 0 0 0 0 0 0 0 a 0 0 0 0 0 0 0 0 0 a
0 0 0 0 0 0 0 0 0 a
0 0 0 0 0 0 ' 0 0 0 a 0 0 0 0 0 0 0 0 0 a 0 0 0 0 0 0 0 0 0 a 0 0 0 0 0 0 0 0 0 a
1,395 1,458 1,523 1,592 1,663 1,738 1,816 1,898 l,W 2,073 4,277 4,449 4,627 4,812 5.004 5,204 5,412 5,829 5,854 6,088
55 57 60 62 64 67 70 72 75 78 81 04 88 91 95 98 102 I06 111 115
6,493 6,752 7,022 7.303 7,595 7,899 8,215 8,514 8,888 9,241 4,526 4,707 4,895 5,091 5,295 5,506 5.727 5,956 6,194 6,442 -------------------.------------------------------ ----------______________________________------------------
$26,696 $27,771 $28,889 $30,052 $31,262 $32,521 $33,830 $35,193 W , 6 10 $38,004 $28,164 $29,283 $30,448 $31,658 $32,916 $34,225 $35,585 $36,999 $30,470 $39,998
(0) (0) (0) (0) (0) (0) 0) (0) (0) (0 R717) @,717) @,717) @,717) @,717) @,717) W 1 7 ) 6717) @,717) (8,202 --------------------------------------------------------------------------------------------------------------
$25,447 $26,567 $27,731 $28.941 $30.199 $31.508 $32.860 $34.282 $35.753 531.798
I 8-27 03/28/95
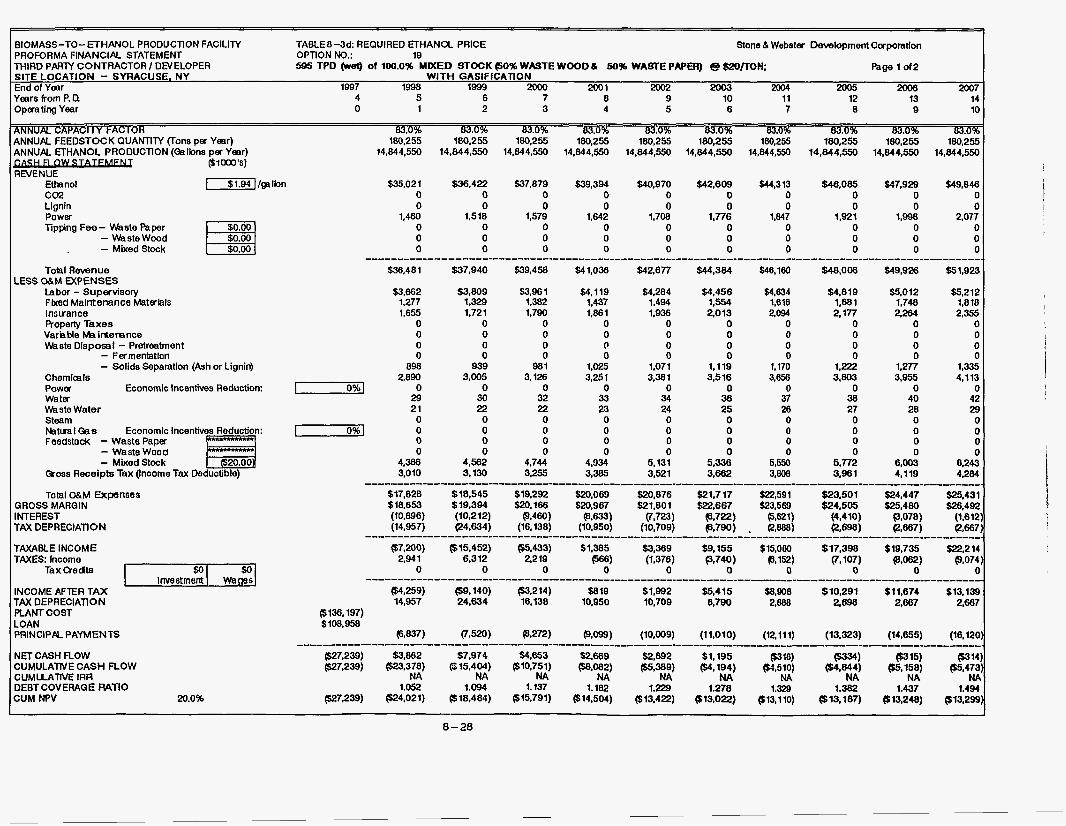
IiOMASS-TO- ETHAN 'ROFORMA FINANCIAL
Stone 81 Webater Development Caporation
,NNUAL FEEDSTOCK QUANTITY (Tons per Yeer) ,NNUAL ETHANOL PRODUCTION (Oaibns per Year)
W E N U E ( $ l o a ' s )
Ethanol 181.941 ibn CO2 Lignin Power Tipping F e e - Waste Paper
- Mixed Stock - WasteWood
TOW Revenue
Labor - Supervisory Fked Maintenance Materials Instrance Roperty Taxes VaraMe Mairrtenance Waste Disposal - Pretreatment
Chemicals Power Economic Incentives Reduction: Water Waste Water Steam Natuai QIS Economic Incentives Reduction: Feedstobc - Waste Paper
Gross Receipts Tax (Income Tax Deductible)
ESS O&M EXPENSES
- Ferrnentatlon - Solids Separation (Ash or Lignin)
E/ - Waste Wood - Mixed Stock
Total O&M EXpenSeS 3ROSS MARGIN UTEREST 'AX DEPRECIATION
'AXABLE INCOME 'AXES: Income
Tax Qedts I $01 $01 I investment I wages]
VCOME AFTER TAX 'AX DEPRECIATION LANT COST OAN 'RINCIPAL PAYMENTS
IET CASH FLOW :UMULAME CASH FLOW :UMLLATM IRR
:UM NPV 20.0% IEBTCOVERAQE mno
180,255 180,255 180,255 180,255 180,255 180,255 180,255 180,255 180,255 180,255 14,844,550 14,844,550 14,844,550 14,844,550 14,844,550 14,844,550 14,844,550 14,844,550 14,844,550 14,844.550
$35,021 $36,422 $37,879 $39,394 $40,970 $42,609 $44,313 $46,085 $47,928 $49,846 0 0 0 0 0 0 0 0 0 0 0 0 0 0 0 0 0 0 0 0
1,460 1,518 1,579 1,642 1,708 1,776 1,841 1,921 1,m 2,077 0 0 0 0 0 0 0 0 0 0 0 0 0 0 0 0 0 0 0 0 0 0 0 0 0 0 0 0 0 0
$36,481 $37,940 $39,456 $441,036 $42,877 $44,384 $48,160 $48,006 $49.926 $51,923 ----------- --___------__--__-_-- __________________ ----_--___--_---__-_---------------- ---_---------.
I 0% I
I 0% 1
$3,682 $3,809 $333 1 $4,119 $4,284 $4,456 $4,634 $4,819 $5.012 $5,212 1,277 1,329 1,382 1,437 1,494 1,554 1,618 1,681 1,748 1,818 1,655 1,721 1,790 1,861 1,936 2,013 2,094 2, In 2,284 2.355
0 0 0 0 0 0 0 0 0 0 0 0 0 0 0 0 0 0 0 0 0 0 0 0 0 0 0 0 0 0 0 0 0 0 0 0 0 0 0 0
898 939 981 1,025 1.071 1.119 1,170 1,222 1.2n 1,335 2.890 3,005 3,126 3,251 3,381 3,516 3,856 3.803 3.955 4,113
0 0 0 0 0 0 0 0 0 0 29 30 32 33 34 36 37 38 40 42 21 22 22 23 24 25 26 27 28 29 0 0 0 0 0 0 0 0 0 0 0 0 0 0 0 0 0 0 0 0 0 0 0 0 0 0 0 0 0 0 0 0 0 0 0 0 0 0 0 0
4,386 4,562 4.744 4,934 5,131 5,336 5,550 5.772 6,003 8,243 3,010 3,130 3,255 3,385 3,521 3.882 3,808 3,961 4,119 4,284
$17,828 $18,545 $19,292 $20,069 $20,876 $21.717 $22,591 S23.501 $24,447 $25,431
(10,098) (10,212) (9,460) (8.633) (7,723) (5,722) 6621) (4,410) 9.078) (1,612)
-------------------------------- ----_--_____________-_---------------~----,-----~----------
$18553 $19.394 $20,168 $20,967 $21,801 $22,667 $23,569 $24,505 $25,480 $26,492
(14.957) e4.634) (16,138) (10,950) (10,709) (5,790) , @,888) WW (2,687) (2,667) ..................................... --_________________^____________________------------~
($7,200) 615,452) ($5,433) $1,385 $3,369 W,155 $15,080 $17,398 $19,735 $22,214 (1,376) F3.740) (6152) (7.107) (8,062) (9,074)
0 0 0 0 0 0
58,908 $10,291 $11,674 $13,139 Cb1259) WA140) 63,214) $8 19 $1.992 $5,415 14,957 24.634 16,138 10,950 10,709 6,790 2,888 2,898 2667 2,667
2 9 1 6.312 2,219 (566) 0 0 0 0 ----------------------------------- ---________________________________D____----- -
($136,197) $108.958
(7,520) (8,272) (9.099) (10,009) (11,010) (12111) (13,323) (14,855) (18,120)
1 8-28
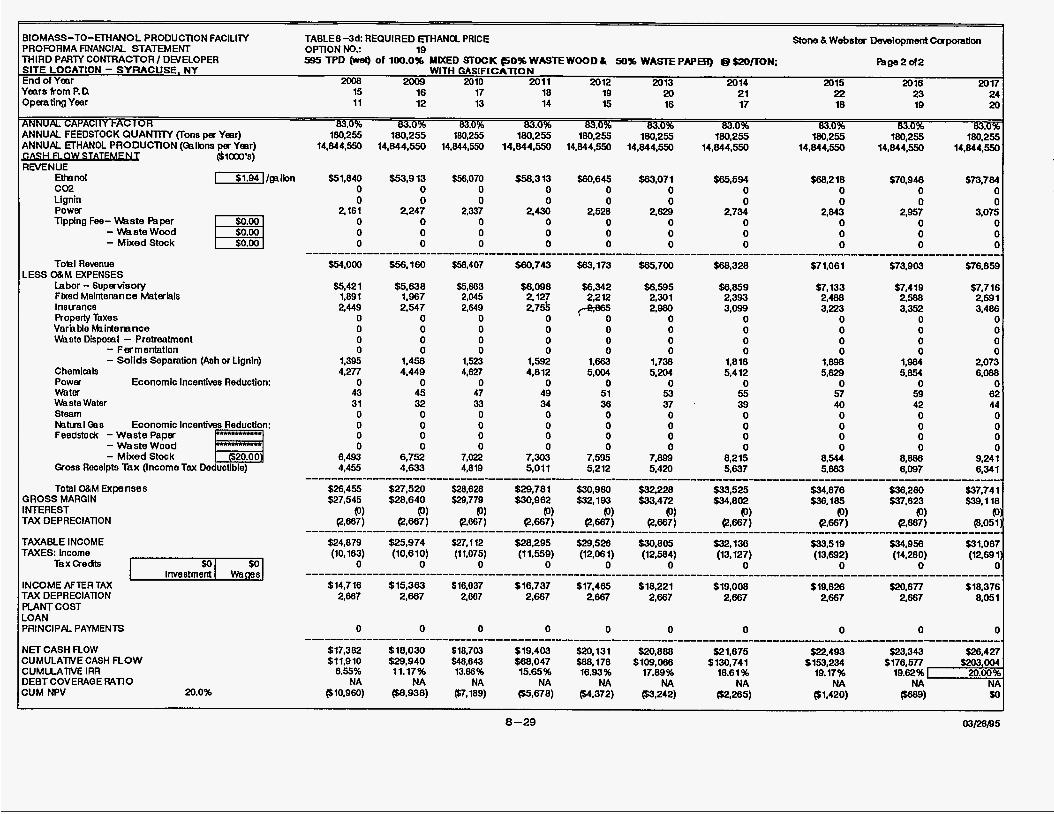
IIOMASS-TO-ETHANOL PRODUCTION FAClLllY 'ROFORMA FINANCIAL STATEMENT OPTION No.: 19 HlRD PARlY CONTRACTOR/ DWELOPER ;ITE LOCATION - SYRACUSE. NY h d of Year 2008 2009 2010 2011 2012 2013 2014 2015 2016 2017 'ears from P. Cl 15 16 17 18 19 20 21 22 23 24
TABLE8-3d: REQUIRED EFHANOL PRICE
595 TPD (rrel) of 100.0% YDED STOCK 60% WASTE WOOD & 50% WASTE PAPEA) e =/TON Rnge2d2 WITH GASIFICATION
)perating Year 11 12 13 14 15 16 17 18 19 2a
~NRLJAL CAPAC~TTFXXOR 83.0% 83.0% 83.0% 83.0% 83.0% 83.0% 83.0% 83.0% 83.0% 83.0% 180,255 180.255 180,255 180.255 180.255 180,255 180,255 180,255 180,255 180,255
14,844,550 14.844.550 14,844,550 14.844.550 14,844.550 14,844,550 14,844.550 14,044,550 14,044,550 14.844.550
TaxQedts $0 Investment
LNNUAL FEEDSTOCK QUANTITY (Tons per Yesr) rNNUAL ETHANOL PRODUCTION (Cglbns per Year)
IEMNUE (S lCm'S)
Ettrsnol ~ I / g a l b n C02
$0 Wages
Lianin PiWer Tipping Fee- Waste Paper
- Waste Wood - Mixed Stock
Tohi Revenue
Labor - Supervisory Fixed Maintenance Matslals lnsuance Roperty Taxes Var'aMe MaiWenance Wste Disposal - Pretreatment
Chemicals Power Economic Incentives Reduction: water Wste Water Steam Nstual Oas Economic Incentives Reduction: Feedstodc - Waste Paper - Waste Wood - Mixed Stock Gross Receipts Tax (Income Tax Deductible)
Total O&M Expenses
.ESS O&M MPENSES
- Fermentatton - Solids Separation (Ash or Lignin)
B 20.00
3ROSS MARQIN NTEREST 'AX DEPRECIATION
'AXABLE INCOME
IEF CASH FLOW IJMULAME CASH FLOW :UMUATM IRR
:UM NPV 20.0% )EBTCOVERAGE wno
Stone h Webster Devdopment Caporation
8-29 03/28/95
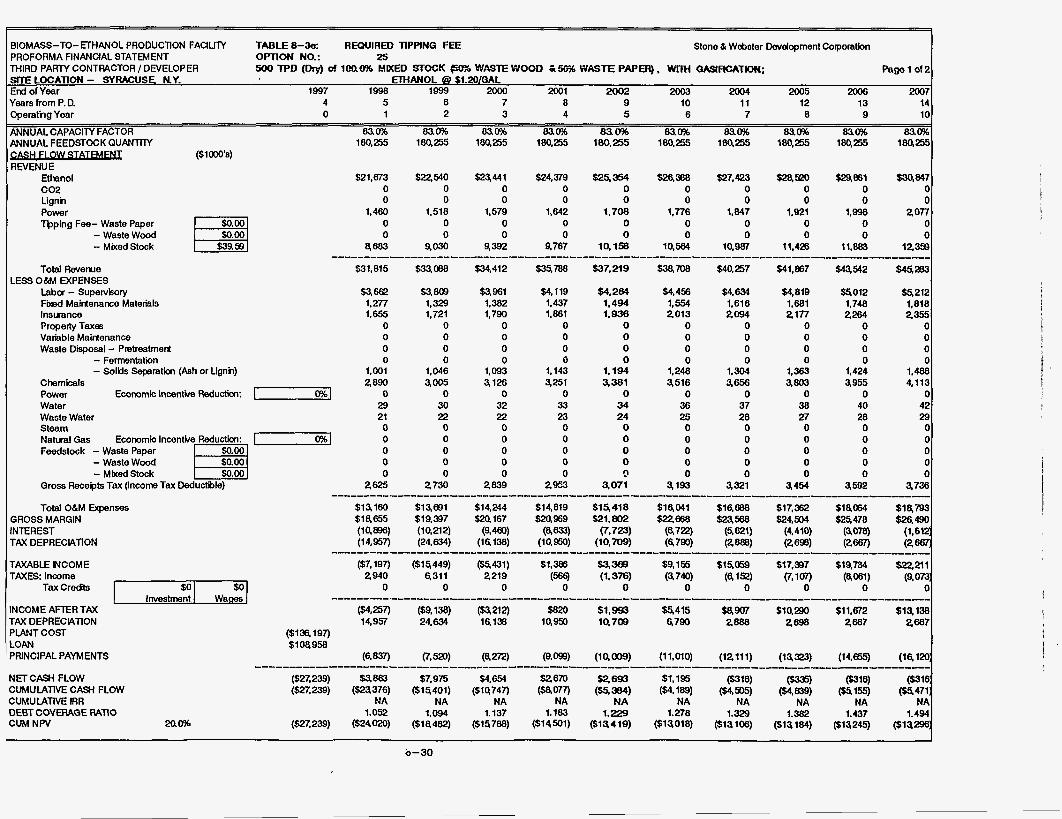
BIOMASS-TO-ETHANOL PRODUCllON F A C I W TABLE 8-3e: REWIRED TIPIING FEE PROFORMA FINANCIAL STATEMENT OPTlON NO.: 25 I Stone & Webster Development Corporation
THIRD PAmY CONTRACTOR I DEVELOPER Pagelof2 Sm LOCATION - SYRMUSE NY. ETHANOL (3 $I.M/GAL End of Year 1997 1998 1999 2Ooo 2001 2002 2003 2004 2005 2006 2007
500 TPD (Dty) of 100.0% MNED STOCK (50% t'JASTE WOOD 150% HASTE PAPEFi), Wmc OASIRCATK))(;
Years from P. D. 4 5 6 7 8 9 10 I1 12 13 14 Operatng Year 0 1 2 3 4 5 6 7 8 9 10
ANNUAL CAPACITY FACTOR 830% 83.0% 830% 83.0% 630% 83.0% 83.w 83.0% 830% 83.0% ANNUAL FEEDSTOCK QUANTITY - ($loOo'S) REVENUE
EttrallOl c02 Lignh Power Tpping Fee- Waste Paper - Waste Wood - Mbed Stock $39.58
I O%l
Total Revenue
Labor - SupervGory F& Maintenance Materials Insurance Property Taxat Variable Maintenance Waste Disposal - Pretreatment
LESS O M EXPENSES
- Femntation - Solids Seperaticm (Ash or Ugnh) Chemicals Power Economic lncentke Reduction: Water Waste Water Steam
Feedstock - Waste Paper - Waste Wood
Natural Gas Economic Incentke Reductbn: [ O%l
- Mbed Stock Gross Recelpb Tax (Income Tax Deductible)
Total O&M Expenses GROSS MARGIN INTEREST TAX DEPRECWTION
TAXABLE INCOME TAXES Income
Tax Credts $0 $0 Investment W a r n
INCOME AFTER TAX TAX DEPRECWTION PLANT COST LOAN PRINCIPAL PAYMENTS
NETCASH FLOW CvMULATlM CASH FLOW c u M u u n v E IRR DEBT COVERAGE wmo CUM N W 20.0%
sws? 1.277 1.655
0 0 0 0
1.001 2890
0 29 21
sa- 1,329 1,721
0 0 0 0
1.046 3005
0 30 22
sa 961 1,382 1,790
0 0 0 0
1,093 3,126
0 32 22
$4,119 1,437 1,861
0 0 0 0
1,143 9251
0 33 23
$4,284 1.494 1.938
0 0 0 0
1.194 a381
0 34 24
$4,456 1,554 2013
0 0 0 0
1,248 3,516
0 36 25
$4.634 1,616 2094
0 0 0 0
1,304 am
0 37 26
$5212 $4,819 a 0 1 2 1,881 1.748 1,818 2 177 2284 2355
0 0 0 0 0 0 0 0 0 0 0 0
1,363 1,424 1,488 9803 9955 4,113
0 0 0 38 40 42 27 28 29
0 0 0 0 0 0 0 0 0 0 0 0 0 0 0 0 0 0 0 0 0 0 0 0 0 0 0 0 0 0 0 0 0 0 0 0 0 0 0 0 0 0 0 0 3 0 0 0 0 0
2625 2 730 2839 2953 3,071 9193 9321 9454 ass2 9736
1
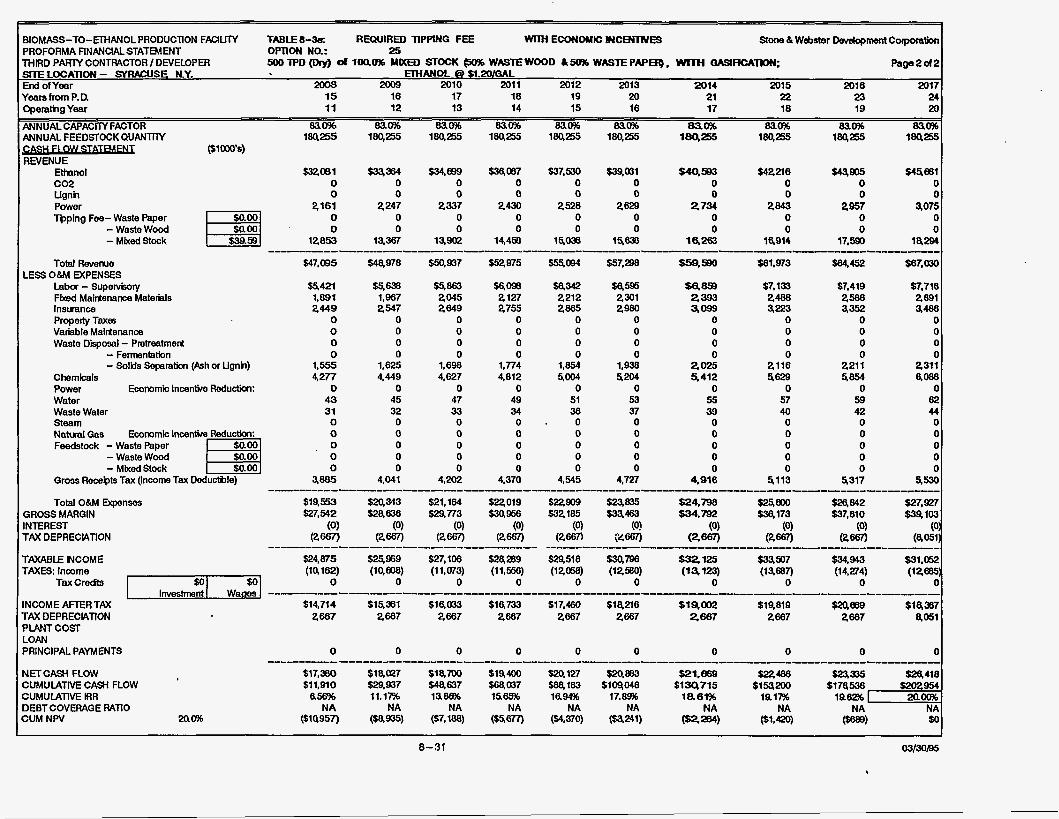
BIOMASS-TO-RHANOL PRODUCllON FAClllTv TABLE 8-3a: REQUIRED TtPPlNG FEE WITH ECONOMK: MCENTNeS I PROFORMA FlNANClAL STATEMENT OPTION NCT: 25 I Stone & Webster Devdopment Colporatbn
'THIRD PAFlM CONTRACTOR I DEVELOPER ~ ~ ~ E L O C A ~ O N - SYRACUSE MY. EIHANOL c? fl.2oK;AL End of Ymr 2008 2009 2010 2011 2012 2013 2014 2015 2016 2017
500 TPD (Dry) d lOQO% U#ED STOCK @O% WBlEWOOD &!iD% WASE PAP-, WITH QASIRCATION; Page82d2
15 16 17 18 19 20 21 22 ~.
23 I Ye& from P. D. Operathg Year I 1 12 13 14 15 16 17 18 19 2c
ANNUAL CAPACIW FACTOR 830% 830% 830% 830% 630% 830% 830% 830% 830% 83olc ANNUAL FEEDSTOCK QUANTTIy 184255 184255 18q255 184255 184255 18q255 1 8 9 s 184255 184255 16035 - RNENUE
Ethsnol CO2 Ugnn Power Tpping Fee- Waste Paper - Waste Wood - M k d Stock
$32,081 0 0
%334 $34,899 SwJ87 537,530 S3w31 0 0 0 0 0 0 0 0 0 0
$4q= 0 0
M2w6 0 0
w= 0 0
Wal C c
2,161 2 247 2337 2430 2528 2m 2734 e w e957 3075 0 0 0 0 0 0 0 0 0 C 0 0 0 0 0 0 0 0 0 a
12853 13.367 13.m 14,458 15,036 15,638 16.283 16,914 17,590 18W
s 4 n $7.419 $7.716 I
NETCASH FLOW CUMULATIVE CASH FLOW cuMuLAnvE RR DEBTCOVERAGE wno CUM NPV
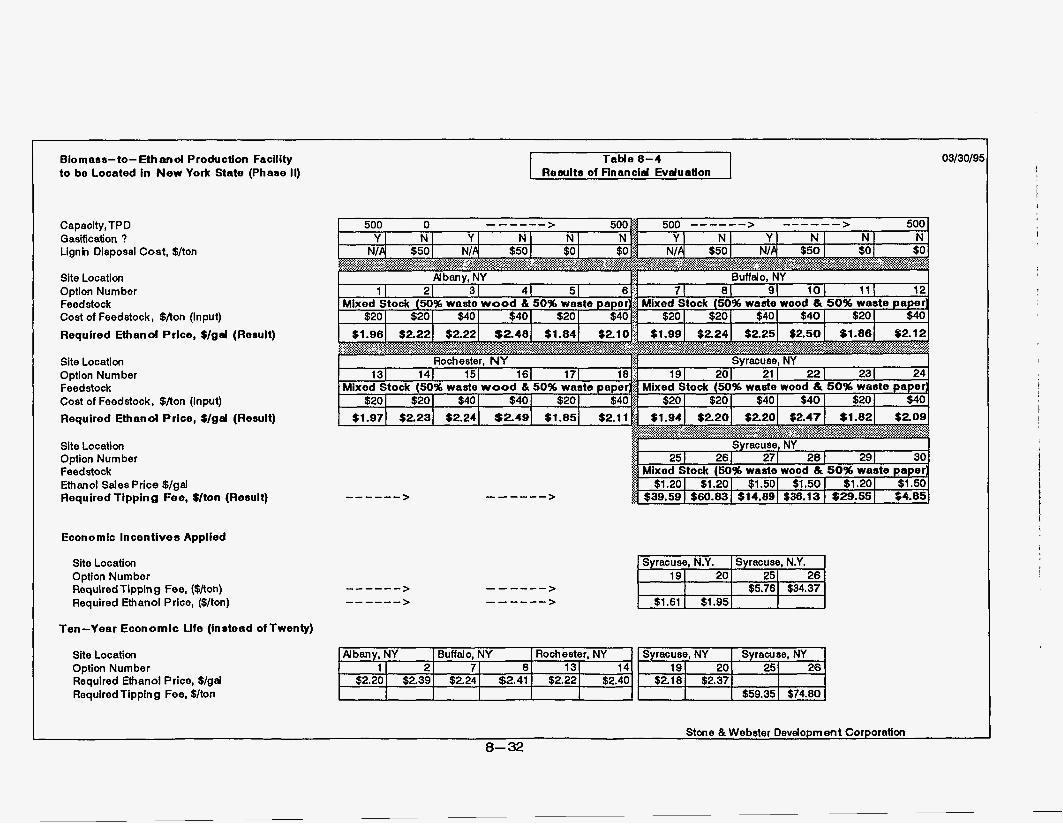
BiOma88-tO- Ethanol Production Facility t o be Located in N e w Yo& State (Phase II)
Syracuse, N.Y. 191 20
I
Capacity, TP D Dasification ? Lignin Disposal Cost, $/ton
Syracuse, N.Y. 25 I 26
$5.761 S34.37
Site Location Option Number Feedstock Cost of Feedstock, $/ton (input) Required Ethanol Price, $/gal (Rerult)
Buffalo, NY Rochester, NY Albany, NY 1 2 7 8 13 14
$2.20 $2.39 $2.24 $2.41 $2.22 $2.40
Site Location Option Nurn ber Feedstock Cost of Feedstock, $/ton (Input)
Syracuse, NY Syracuse, NY 19 20 25 26
$59.35 $74.80 $2.18 $2.37
Required Ethanol Price, $/gal (Result)
Site Location Option Number Feedstock Ethanol Sales Price $/gal Required Tipping Fee, $/ton (Result)
Economic Incentives Applied
Site Location Option Number Required Tipping Fee, ($/ton) Required Ethanol Price, ($/ton)
Ten-Year Economic Ufe (instead of Twenty)
Site Location Option Number Required Ethanol Price, $/gal Required Tipping Fee, $/ton
Table 8-4 Rearlts of Financid Evaluation
>
$1.61 I $1.95 I I I
03/30/95
Stone & Webeter Development Corporation 8-32
I
!
I
BUSINESS INTERESTS
This section identifies potential business interests for the Ammo waste biomass-to-ethanol production facility from land owners, feedstock suppliers, end product users, solid waste by-product consumers, and the financial community.
The Coalition of Northeastern Governors (CONEG) recently convened a forum to discuss "Siting an Ethanol Plant in the Northeast". The goal of the forum was to identify barriers and prospective strategies for siting biomass-to-ethanol facilities in the region in the near future. A
letter from CONEG, with an attached forum agenda, is shown as Attachment
8-2 in the Appendix.
Land Owners
New York State Electrical & Gas Corporation (NYSEG) has expressed an interest in the
biomass-to-ethanol facility by offering sites at power plant locations. The NYSEG letter of interest is shown as Attachment 8-3 in the Appendix. More detailed information about NYSEG sites can be seen in Attachment 8-4 in the Appendix.
Operation Oswego County Inc. and the County of Oswego Industrial Development Agency have expressed strong interest in financing an engineering feasibility study for retrofitting the Miller
Brewery site to an Amoco ethanol facility. The Operation Oswego County Inc. letter is shown as Attachment 8-5 in the Appendix.
Feedstock Sunpliers
Interest from feedstock suppliers includes lumber mills, paper mills and municipalities. Lumber by-products would be the main source of feedstock because of their plentiful supply and ease of
accessibility. The lumber would be supplemented by paper sludge (especially in the Albany
region) and three different types of municipal solid waste, consisting of paper products, yard
8-33
waste, and construction and demolition wood.
End Product Usee
NYNEX Corporation has indicated a strong interest in considering the use of ethanol end product as an additive in its vehicle fleet as a response to the mandated use of oxygenated
gasoline required by the Federal Clean Air Act by January 1995. As part of this study NYNEX is presently evaluating a number of alternative fuels for its vehicle fleet, including ethanol.
Solid Waste Bv-Product Consumers
Various waste-to-energy plants and other solid fuel burning plants, such as those owned by NYSEG, would be very interested in consuming the solid by-product from the Amoco process. Waste-to-energy plants would consider the by-product as municipal waste and would charge a
fee on the order of $50/ton. Interest from companies such as NYSEG provides flexibility for negotiating a price for the by-product.
Financial Community
Based on the financial pro forma runs in this section and Attachment 8-1, it was decided to delay
contacting the financial community for equity interests at this time. An improved capital cost
structure for building a facility in New York State is required to ensure attractive returns on investments commensurate with operating requirements, including stable feedstock costs/tipping
fees for recycle paper.
8-34
SCREENING STUDY FOR WASTE BIOMASS TO ETHANOL PRODUCTION FACILITY USING THE AMOCO
PROCESS IN NEW YORK STATE
PART III.
BUSINESS ASSESSMENTS

SECTION 9 BUSINESS ASSESSMENTS
This section contains the business assessments of the Ammo process made by Champion International and NYNEX, respectively a feedstock provider and a supplier/potential user of ethanol.
BUSINESS ASSESSMENT BY A FEEDSTOCK SUPPLIER CHAMPION INTERNATIONAL
Backmound Champion IntEmational performed a business assessment of the Amoco process as an alternative means for recycling paper. Its assessment is based on the past development of paper recycling practices, the s mess of which is significant in making feedstock material potentially available to the Amoco process.
Four years ago, the paper industry made a public commitment to increase the recovery, recycle, and reuse of paper products. This effort took the form of a national paper recovery goal to recover 40 percent of all paper used in the year 1995.
When this commitment was announced, there was uncertainty about the country’s political motivation and ability to recover that amount of paper in usable condition, uncertainty about the sufficiency of markets among manufacturers both at home and abroad, uncertainty about the technology to increase recycled content in certain paper grades, and even uncertainty about consumer acceptance of various types of recycled and recycled-content paper and
paperboard products.
Despite these uncertainties, the paper industry took the initiative, recognizing that, given the
percentage of paper products in the municipal solid waste stream, there was a collective responsibility to help solve the national landfill crisis. Today, the paper industry takes pride
9- 1
in achieving of 40 percent paper recovery goal a full 2 years ahead of schedule.
Thanks to the help of environmentally conscious citizens, the US paper industry today recovers:
More than one of every two newspapers published Nearly 60 percent of all corrugated paper used A third of all paper and paperboard packaging, nearly three times the
recovery rate of all other packaging materials combined.
The paper industry has invested billions of dollars to retrofit or build new capacity allowing it to substantially increase its dependence on recovered paper as a raw material. US mills
use of recovered paper continues to grow at three times the rate of growth of total production
capacity, and today a third of he industry raw material fiber comes from recovered paper.
For 6 consecutive years, there has been a reduction in the amount of paper and paperboard products being sent to landfills. From 1987 to 1993, the amount of paper and paperboard
products going to landfills was cut by 11 million tons. In 1994, for the first time, more paper was recovered in the US for recycling and reuse than was buried in landfills.
More is still expected of this industry in paper recovery, recycling, and'reuse. Most recently, the American Forest and Paper Association has embarked on a new initiative with
the goal of recovering for recycling and reuse 50 percent of all the paper used in the US in the year 2000.
This goal will be very challenging beacuse the industry faces the same uncertainties 4 years ago when the 40 percent recovery target was established. When achieved, the US paper recovery rate will far exceed the world average and will rival the recovery rates of far more densely populated and wood-fiber deficient countries such as Japan. At that point, twice as much paper and paperboard will be recovered in the US as will end up in landfills.
9-2
The following lessons were learned in reaching the current 40 percent recovery rate and will
play a role in reaching the 50 percent recovered paper products:
Increased levels of mixed paper recycling will be key to reaching these new goals. Paper recycling from office buildings will continue to increase.
The office pack will become the norm for waste hauling from office buildings. Markets are already in place, and most haulers already know how to collect, process, and market office waste
paper. Multi-tenant and small office buildings will continue to pose problems. Corrugated boxes will be collected from small generators and households. Residential mixed pper recycling will increase, but slowly and
haphazardly. The greater diversity of residential mixed paper combined with less experience collecting, processing, and selling it create greater obstacles to success in this area.
0
Forces DrivinP Increased Office and Residential Paper Recvcling
Intense Public S u ~ ~ o r t of Recvcling. For the last 6 years, public support for recycling has held steady in spite of the barrage of news stories about inadequate markets for recyclables and the reality that recycling is costly. This public support ensures that the supplies of wastepaper will continue to increase.
Increased State RecvclinP Goa&. These will create more supplies of recyclables and put
more pressure on end markets, particularly the paper industry to use more
recycledlrecovered material.
Volume-Based Fees. Volume-based fees are a mechod to have people pay for solid waste services based on the amount of trash they throw away. These fees will also create
9-3
additional pressure to recycle. After all, recycling is an alternative to trash. The amount of material collected for recycling increases dramatically when volume-based fees are instituted, thus increasing the pressure to collect residential mixed paper.
However, last year saw the defeat of a number of attempts to impose volume-based fees in the East Coast States. This defeat was largely because property taxes for trash collection and disposal were left in place and a per-bag fee was added.
Recvcled Content Reauirement. For newsprint, recycled content requirements exist
nationwide, although they vary with locality.
For printing and writing papers, the President’s Executive Order will clearly stimulate markets for office paper. The only way to get the fiber to meet these requirements is to
increase the number of office collection program; and to increase the convenience of participation in these programs. Most states are currently aligning their procurement requirements with the Federal requirements, thereby strengthening the impact of the
Executive Order.
In addition to state minimum content laws and Federal and state procurement requirements, the private business sector has clearly increased its desire to use recycled paper. For example, the National Recycling Coalition’s Buy Recycled Business Alliance announced that
its 500 members spent more than $10.5 billion on recycled products in 1993. Minimum content requirements and buy recycled campaigns will push the demand side for the private sector.
Fiber Substitution. As recycled newspapers are increasingly used for newsprint and as corrugated paper increasingly goes to medium and linerboard, mixed paper will be in more demand as a substitute grade for mills that previously used newspaper and corrugated cardboard.
9-4
Forces That Cou Id Delav or Prevent Increased Recvcling
Backlash APainst Recvcling. Recycling costs money and is not a totally benign process. However, the political reality is that curbside collection programs and state recycling laws
are not being canceled.
Source Reduction. If source reduction can be taken seriously, it will crowd out recycling with a higher priority.
Suecifications. The definitions, forms, and specifications for recycled material remain
unclear; e.g., What is an office pack? What is residential mixed paper? What do individual mills want and need?
Multi--tenant buildings will be good sources of a mor 2 mixed paper. It might be possible to keep newspaper separate, but expect a mixed office paper grade from these building.
Office paper recycling raises some interesting design-for-recycling issues. Will -offices start demanding that overnight packages and mail services stop using (or take back) Tyvex packages? What about neon and goldemod colored paper?
Forces In Residential MxedrPaper Collection
Residential mixed paper recycling will increase but not as fast or easily as office paper recycling. A residential recycling program is, in effect, the ultimate multi-tenant program.
Depending on what the local government requires collected, residences could produce anything from a low-grade mixed office stock to a completely mixed grade.
Currently, residential mixed paper efforts involve adding boxes or magazines to collection routes, although perhaps one or two hundred communities might collect box boardjunk mail,
or mixed paper. Residential mixed paper recycling must overcome a number of significant
hurdles.
9-5
First, all collection programs are pioneering efforts. Little reliable data exist concerning the actual composition of individual community residential wastepaper or the effectiveness of
existing programs in collecting and processing mixed paper. Some programs collect for tissue mills, some for boxboard mills, some for export markets.
Second, mixed paper poses unique and important collection problems. Should its collection
be kept separate from newspaper? Should collection be kept separate for bottles and cans? What kind of collection equipment will be used? Will it be automatically collected using
split costs? Will it be in wet-dry systems? Absolutely no consistency exists now in terms of how residential mixed paper is collected.
Many recycling collectors are using equipment purchased in the last 3 years. It is reasonable to expect them to want to fully depreciate the value of their equipment before they have to
invest in new equipment of a different design.
Third, how will mixed paper be processed? Are materials recovery facilities, which are
mostly bottle and can separation operations with some newsprint processing capacity, capable of processing mixed paper into a saleable grade?
Fourth, ironically, the cost of recycling and the need to meet state-imposed recycling goals could work against each other. Communities with access to tissue mills may only want to collect paper that can be used by these mills. After all, these mills have been able to pay more for bibber than boxboard mills. Yet this means they will not collect all of the available grades of mixed paper and will achieve a lower recovery rate of paper.
One thing is certain, the need to meet the increased recycling goals and increased demand for mixed paper caused by increased markets and the realities of fiber substitution make residential mixed paper recycling inevitable. However, exactly how it will be collected and
processed is still uncertain. There will be a great deal of experimentation over the next few
years as haulers and processors learn the most efficient and cost-effective methods.
9-6
As for the market price of residential mixed paper, the most economical wastepaper sources have already been exploited and tapping additional sources for paper recycling will be more
expensive.
The cost of wastepaper has risen to very high levels ($lOO/ton) in just a few months. Historically, the cost of wastepaper has fluctuated with other paper market prices and, as the
paper industry crawls out of one of its longest downturns, wastepaper prices are expected to be high for the next 3 to 5 years.
Effect on Amoco Process
In contracting a biomass-to-ethanol conversion facility based on the A m m process, it would be prudent to find a cellulose raw material source with stable prices and a steady, readily available supply. The Amoco process is more economical when receiving a tipping fee for the feedstock than when required to pay for the raw material.
As a result, Champion recommends that the use of paper mill sludge be investigated. Based on a 1990 report for New York reference, there are 13 paper mi l ls that have dedicated waste
water treatment plants; the total generation rate is 410 dry tpd of mostly cellulose-containing sludge. If it were possible to quantify the sewer losses of those mills that use municipal sewage facilities, this cellulose source would increase significantly.
Currently, the New York State Department of Economic Development - Office of Recycling Market Development is conducting a study to expedite the development and application of paper mill sludge reuse technologies. Twenty five mills are currently involved. The objectives are of the studies: 1) to maximize the recovery and reuse of some or all components of paper mill sludge generated by mills using post-consumer fiber sources in New York State; 2) to minimize mill reliance on solid waste disposal capacity for mill
sludges; and 3) to improve the cost effective management of mill sludge.
Consequently, there is the potential for a synergistic relationship between the Ammo project
9-7
and the recycling goals of New York State. (See Attachment 9-1 in the Appendix, letter
from New York State Department of Economic Development).
For these reasons, the use of paper mill sludge as the cellulose source should be thoroughly considered as the feedstock for the biomass-to-ethanol conversion project.
Conclusion
Champion International believes that the Ammo process competes with current practices of the paper industry. The paper industry has already achieved national paper recovery rates of approximately 40 percent. Using existing recycling processes, the economics of achiwing this recovery rate are demonstrated by the industry’s ability to absorb recent rapid price increases for recycled paper to over $100/ton in New York State. Such instability in price makes it currently unfavorable to recycle paper via the Ammo process. Instead of usirg
(recycled) paper as a feedstock, Champion recommends that paper mill sludge would prwide
a more suitable source. This is particularly true in New York State, where approximately 400 dry tpd of paper sludge are generated and landfilled.
9-8
BU§INESS A S S E S S m BY A FEEDSTOCK SUPPLIERIPOTENTIAL ETHANOL USER - m x
Backmound
NYNEX Corporation has joined with Amoco, Stone & Webster, Champion International, New York State Energy Research and Development Authority, and the National Renewable Energy Laboratory in a site evaluation study for a proposed Amoco biomass-to-ethanol facility to be located in New York State. NYNEX is involved in the project both as a
facilitator of potential suppliers of feedstock and a potential user of the ethanol end-product in its vehicle fleet.
The project is divided into two parts: Part I focuses on New York City, and Part II focuses on the upstate New York urban regions of Buffalo, Syracuse, Albany, and Rochester.
NYNEX Deliverables. NYNEX had four primary deliverables as part of this site evaluation study:
4)
Analyze the process involved in moving NYNEX toward the use of alternative fuels in its vehicle fleet (same for Part I and Part II) Compare ethanol to other alternative fuels for fleet use (same for Part I and Part 11) Evaluate of the proposed Ammo processing facility for its potential to supply ethanol fuel at specific sites (in NYC for Part I; elsewhere in the State for Part 11) Evaluate of the Amoco process as an alternative end-use for recycled old telephone directories (OTD) (in NYC for Part I; elsewhere in the State for Part II).
9-9
Revised Amroach. Since the project began in April 1994, NYNEX’s approach to fulfilling its deliverable obligation has been modified. It was originally anticipated that NYNEX would have to do original research and testing of ethanol in its vehicles in order to compare alternative fuels.
It became evident that original research and testing were actually unnecessary in view of the availability of ethanol vehicle test results from the US EPA. During a meeting with officials from the New York City Department of Environmental Protection PEP), NYNEX was informed that any valid testing of ethanol in fleet vehicles would probably involve a
minimum 2-year study with multiple vehicles involved, all having undergone expensive conversion to accommodate alternative fuels.
DEP officials suggested that testing ethanol as a fuel additive was unnecessary since the
Federal Clean Air Act mandates that oxygenated gasoline (using ethanol) must be used in New York City fleets by January 1995. Regarding use of ethanol as an alternative fuel, NYNEX’s preliminary research indicated that a number of studies and comparisons have already been done.
Thus, NYNEX deliverables now include two new deliverables: 1) an analysis of the internal corporate process involved in making an alternative fuel decision; and 2) a comparison of alternative fuels using existing rather than original research.
Eventually, NYNEX plans to make use of the work involved in this project related to
alternative fuel comparisons; however, a final decision on which alternative fuel is most
appropriate for the vehicle fleet is not likely to be made prior to the conclusion of the site evaluation study.
Another change in the NYNEX portion of this project resulted from the unexpected death in early October of Mr. John Balaguer, Director of Environmental Issues for NYNEX Information Resources, and the driving force behind NYNEX’s involvement in this project.
Mr. Balaguer’s work involved the comparison of ethanol to other alternative fuels. Much of his work is included in the report as background attachments and citations.
9-10
Movinp the NYNEX Fleet Toward Alternative Fuels
Fleet Characteristics. The NYNEX fleet in New York State and New England totals more than 18,000 vehicles, including sedans, bucket trucks, vans, distribution trucks, and a variety of equipment used by these vehicles. Vehicles are housed at approximately 450 locations throughout the NYNEX territory. Of the more than 18,000 vehicles, some 3,000 are diesel-powered rather than gasoline-powered.
Approximately 12 million gallons of fuel (gasoline and diesel fuel) are consumed annually. Fueling facilities are widely dispersed throughout the territory. Not all facilities that are used to house vehicles have fueling capability.
New York City figures include: 4,000 vehicles (approximately 800 of which are diesel-powered) at 35 locations throughout the five boroughs.
New York State (outside of New York City) figures include: different locations.
8,000 vehicles housed at 160
Alternative Fuel Decision-MakinP Process. In terms of corporate organizational structure, operation of the NYNEX fleet falls under the direction of the Vice President for Corporate
Services. The reporting hierarchy includes a General Manager of Logistics and Fleet Services, a Director of Fleet Services, and approximately 650 lower level employees reporting to the Director and providing maintenance, service, dispatch, and other functions
related to the vehicle fleet.
’ The NYNEX Corporate Environmental Organization reports to the Same Vice President as
the Fleet Services organization. The decision on moving to an alternative fuel for the vehicles would be centered in these two functional areas, with input from other business units that are in fact internal customers of the Corporate Services group.
9-1 1
Factors to be Considered. A number of factors would have to be considered before a decision on alternative fuels could be made, both in terms of the general concept of using
alternative fuels as well as the specific choice from among the many fuels available, such as ethanol, methanol, compressed natural gas, propane, hydrogen, and even electricity.
These factors include but are not limited to: fuel cost; fuel economy; local availability (which may be different for NYC as opposed to upstate regions); safety; vehicle conversion cost; maintenance cost; operational effectiveness; emission benefits; potential tax incentives;
and legislative and regulatory requirements, e.g., Clean Air Act Amendments of 1990, Energy Policy Act of 1992.
Another consideration involves the existing fleet fueling facilities. As a result of recent underground storage tank regulations, all NYNEX fueling facilities are currently being modernized, with completion expected by 1998. Because of the high cost of this effort, it is likely that the corporation would choose a liquid alternative fuel that the renovated fueling facilities could accommodate.
Comparison Of Ethanol To Other Alternative Fuels
NYNEX has already begun an extensive research analysis of existing testing efforts aimed at
addressing the issues and questions raised in the preceding section.
As noted previously, an alternative fuel decision will not be made by the corporation in the time-frame of this site evaluation study. Such a decision will also not be made by the NYNEX Information Resources Environmental Issues Organization, the primary participant in this site evaluation study. NYNEX’s role will be to provide the decision-makers within the Fleet Services organization with any research and information resulting from this study, and to continue to serve as a conduit for any further research data resulting from Amoco’s operation of the potential ethanol-from-biomass facility.
9-12
No original comparative research will be done in conjunction with NYNEX participation in the site evaluation study. NYNEX is, however, participating in several other projects that will result in research data that will facilitate a decision on alternative fuels. One such
project is the Vermont Electric Vehicle Demonstration Project. The NYNEX-New England telephone company is one of six utilities, seven government agencies, four corporations, two academic institutions, and two non-profit organizations participating in the project, which began in October 1993 and is scheduled to conclude in October 1995. The purpose of the
project is to promote the testing and demonstration of near-term electric hybrid vehicle technology, assess the feasibility of electric vehicle use in a northern rural environment, disseminate results to the general public and to potential Vermont manufacturers of electric vehicle technologies, and make recommendations for promoting the technology in Vermont.
NYNEX is also involved in testing a number of compressed natural gas vehicles. Data from these and other efforts will be added to the wealth of information that will eventually be used to make an alternative fuel decision.
ExistinP Research. Key pieces of existing comparative research on alternative fuels include a series of reports from the US EPA detailing the positive and negative aspects of alternative fuels, including compressed natural gas (CNG), ethanol, liquefied petroleum gas, electricity and gasoline.
NYNEX has obtained and reviewed the following EPA reports:
0
0
EPA Analysis of the Economic and Environmental Effects of Methanol as an Automotive Fuel, September 1989 EPA Analysis of the Economic and Environmental Effects of compressed Natural Gas as a Vehicle Fuel, April 1990 EPA Analysis of the Economic and Environmental Effects of Ethanol as an Automotive Fuel, April 1990.
9-13
Information contained in these reports should prove helpful as NYNEX considers fleet fuel alternatives. Interestingly, however, most of the reports raise as many questions as they answer and indicate that more research is needed to resolve issues such as optimum engine
configuration, fuel metering systems, fuel storage technology.
Initially, methanol looked promising as an alternative fuel since it clearly results in improved ozone levels and reduces the quantity of toxins released. But the fact that studies have uncovered problems with cold starting and formaldehyde emissions is troublesome. Regarding CNG, the apparent cost benefits are attractive, but vehicle conversion costs of $2,000-3,000 could present an obstacle. In addition, the recent NYNEX investment in upgrading underground storage facilities probably precludes non-liquid alternative fuels. Of course, ethanol has already been proven as a fuel additive as a result of its substantial air toxins benefits. Higher percentage mixes or neat ethanol, however, would require vehicle conversions. The higher octane in ethanol could result in improved engine efficiency by as much as 33 percent, but lower vapor pressure could cause cold-starting problems. And
according to the EPA, "currently, projected fuel production costs.. .prohibit near-term
consideratim of neat ethanol as a major transportation fuel."
In summary, the NYNEX Fleet Operations staff has many issues to consider and questions to answer before deciding on an alternative fuel for the NYNEX fleet.
Other background material that will be turned over to Fleet Operations at the conclusion of this project include:
0 "Clean Fuels Report", published by J.E. Sinor Consultants. This periodic report looks at CNG, LNG, propane, methanol, ethanol and biofuels, hydrogen, electric vehicles, and reformulated gasoline, and provides comprehensive coverage of current
developments.
"Exhaust Emission Testing of Two Ethanol Variable Fueled 1992 Chevrolet Luminas--Test Results 1993", published by Mike Samulski of the EPA's Engine and Vehicle Regulations
0
9-14

Branch. This report presents exhaust emission test results for two 1992 low-mileage Chevrolet Lumina ethanol variable fuel vehicles that were tested on both Indolene and E85 fuel using
the Federal Test Procedure for exhaust emissions. This study showed that when operating on 85 percent ethanol, the Luminas
experienced reductions in NMHC, CO, C02, and NOX, with penalties in alcohol and aldehyde emissions and fuel economy (per volume of fuel) when compared to operation on Indolene. Both vehicles saw a volumetric fuel economy penalty of 30 percent but saw a slight increase in energy based fuel economy when operated on 85 percent ethanol as compared to Indolene.
NYNEX has reviewed a number of Arthur D. Little studies including "Motor Fuels in a
Clean Fuels Environment", "Fuel Cell Technology", "Electric Vehicle Use in Hong Kong", "CNG Transit Buses", and "Implementation of Alcohol Fuels".
NYNEX will also review additional related material from NREL's Alternative Fuels
Utilization Program and from work by Southwest Research Institute, San Antonio, Texas, associated with ethanol variable fueled vehicles and economic and environmental effects of
ethanol as an automotive fuel.
A report released by the Northeast Regional Biomass Program, entitled "A Resource Assessment for Ethanol in the Northeast" information.
should also provide good background
Potential Of Amoco Facility To SUDD~V Fuel To NYNEX Sites
With approximately 4,000 of NYNEX's 12,000 New York State vehicles located at 35 sites throughout the five boroughs of New York City, an Ammo ethanol facility located in the
City would appear to offer efficiencies for providing fuel to at least one-third of the NYNEX
New York fleet.
9-15
At the start of this project, it was thought that this question pertained to ethanol both as an additive and as a neat fuel. However, it now appears that the question is only relevant if
NYNEX were to adopt ethanol as an alternative to its current fuel needs since, if Federal Clean Air Act standards require ethanol as an oxygenate additive, it must be assumed that such blends would be readily available through normal distribution channels.
Questions related to transportation costs, storage requirements and restrictions, and the Amoco intermediate distribution process itself remain to be answered before it can be
determined if a New York City ethanol facility could efficiently serve the entire NYNEX region or if additional Amoco facilities would be required in other parts of the territory in order to get the fuel to the rest of 14,000 NYNEX vehicles located outside of New York City at more than 400 widely scattered locations.
Based on the issues raised above, it would appear likely that a more centrally located ethanol facility (either in the Capital District or the Syracuse area) would be needed to
cost-effectively serve the rest of the NYNEX fleet. .
Amoco Process As An Alternative Method Of Recvclinp NYC (OTD) Old TeleDhone Directories
NYNEX Backmound. NYNEX Information Resources Company (NIRC) publishes telephone directories for the NYNEX telephone companies in New York and New England, as well as selected markets overseas. NYNEX publishes more than 250 directory titles annually, with more than 35 million copies printed. Approximately 150 of those titles and
19 million copies are in New York State. Between 40,000 and 50,000 tons of directories are distributed annually, the majority in New York State.
Telephone directories comprise less than 1/2 of 1 percent of the total paper waste stream (paper is 41 percent of the total waste stream). But because of the seasonal nature of directory delivery, the books are a highly visible fraction of the waste stream. NYNEX’s
recycling activities are designed to minimize the impact of its products on the environment.
9-16
The NYNEX approach has been to work with local recycling officials and government officials to get directories included in existing recycling programs, rather than setting up
separate collection programs just for phone books. NYNEX has also expended a great deal of effort on identifying and developing end-use markets for old telephone directories (OTD) so that once a collection is complete, an outlet for recycling the collected material will be available.
Currently, more than 40 counties in the New York State have some form of telephone directory recycling. Regarding recovery rates, NYNEX has experienced rates from 10 percent to 50 percent of books distributed compared to a national rate of slightly more than
17 percent.
Markets that are currently accepting OTD include boxboard, wallboard, animal bedding, cellulose insulation, packaging material, tissue products, padded envelopes, coreboard, compost, roll cores, disposable hospital utensils, hydro-seeding mulch, and new directory paper. The wastepaper markets are eitremely positive at the present time and OTD is benefiting frorr. the general improvement in these markets. Many markets are allowing OTD to remain in the newsprint mix, which is selling for $70 to $100/ton.
Even straight loads of phone books are finally commanding positive prices; for example a market in Dutchess County, NY, is paying $%/ton for separated phone books. Among markets that are not paying positive dollars, many will at least backhaul truckload quantities of OTD at no expense to the community doing the collecting.
Biomass Conversion As Recvcliny in New York State
During the research for this site evaluation study, the question arose as to whether the biomass conversion technology as used in the Amoco ethanol process is considered recycling under New York State Department of Environmental Conservation (NYSDEC) definitions. This issue relates to New York City as well as the upstate New York areas.
Both Amoco and NYNEX wrote letters to the NYSDEC seeking an interpretation. Thus far,
9-17
NYNEX has received a verbal response and Amoco has received a written response, both of which indicated that "the proposed conversion facility would not be viewed as a recycling facility, but would be considered either a refuse-derived fuel processing facility regulated under Subpart 360.3 or a non-specific facility regulated under Section 350-1.9(b)" (see
Attachments 9-2, 9-3, and 9-4 in the Appendix).
This preliminary determination may imply a possible reluctance on the part of some recycling programs to send material to the Ammo facility if they are unable to claim the tonnage against their state-mandated recycling goals. Some recycling coordinators interviewed in the
upstate area were adamant that unless they could claim the material headed for the ethanol
plant as recycled, they would rather divert that material to a local waste-to-energy facility.
DEC officials held out the possibility that county or municipal solid waste management plan recycling goals could be revised downward as a result of sending material to a refuse-derived fuel facility, and there is still a possibility that the DEC will revise its definitions of recycling to include biomass conversion. Thus, the eventual impact of this issue on the
project remains to be determined.
New York City DOS officials said that while they would like to be able to use the residential
mixed paper fraction to boost their recycling rates, even if they could not, there would still
be a benefit to the City in diverting this fraction from the landfill to a biomass conversion facility.
New York Citv Analysis
The New York City DOS residential curbside recycling program, administered under Local
Law 19 since 1989, covers approximately 3 million residences in the five boroughs of the City.
Since September 1993, New York City has also had mandatory commercial recycling. Businesses and institutions within the City must contract with a private hauler or recycler to recycle corrugated cardboard; high-grade office paper; newspaper; textiles; and magazines,
9-18
catalogs and phone books. Food or beverage service establishments must recycle corrugated cardboard, metal cans, glass bottles and jars, plastic bottles and jugs, and aluminum foil
products.
The curbside residential program currently includes corrugated cardboard, newspaper, magazines, catalogs, and telephone directories.
The DOS is recovering approximately 1,200 tons of recyclables per day from the residential curbside/containerized program. About two thirds of that material is paper.
Starting in July 1995, under the City’s solid waste management plan, the DOS plans to add residential mixed paper (RMP) to the recycling prcgram. The RMP mix includes kraft
paper, high-grade paper, non-corrugated cardboard, direct mail, and other mixed paper. The DOS anticipates recovering 423 to 705 tons per day of the RMP mix, or 128,000 to 213,000 tons per year.
Specific materials expected to be designated as RMP by the DOS include direct mail, paper bags, greeting cards, envelopes, printing and writing paper, computer printout, tissue product tubes, and telephone directories.
Telephone Directory Recvcling. The RMP mix is the most likely feedstock for the
proposed Amoco biomass conversion process since other markets are not readily available for most of the material included in the mix. Whether telephone directories are actually included in the mix is an open issue and is dependent on prevailing market conditions.
Currently, phone books are included in the residential curbside program and are a. mandatory item in the City’s commercial recycling program. New York City residents place their out-dated directories out with the rest of their paper recyclables on their normal recycling
day.
New York City uses six to nine different recyclers in their residential program. Most of these firms are leaving the directories in with their newsprint mix, most of which is being
9-19
sold overseas. Newsprint markets are currently very strong, with prices in the $70/ton range. At least one of the City's recyclers is separating the phone books out of the curbside mix.
NYNEX distributes well over 10,OOO tons of Yellow Pages and White Pages directories in New York City annually. Different directory titles distribute at different times of the year. NYNEX estimates that New York City is collecting approximately 15 percent of the
directories distributed, or 1500 to 1800 tons of directories per year.
In order for any of this tonnage to end up in the material being diverted to the Amoco ethanol facility, the DOS would have to move OTD from the current residential curbside mix to the new RMP fraction. While possible, DOS officials say it is unlikely because of the current strength of the newsprint markets. An incentive of some kind would be necessary for recyclers to separate phone books from the current mixed paper strsm. For example, if the Ammo process were to provide a positive market, or if the recyclers could increase the
quality and value of the newsprint fraction, then it might make sense to separate the OTD
from the rest of the curbside mix. DOS officials have been cautions regarding the availability of the RMP stream in general since the City has a new mayor and new DOS commissioner and is in the midst of reviewing all of its recycling programs as well as attempting to renegotiate the provisions of Local Law 19.
The DOS has 5-year processing contracts in place with all of its recyclers. These firms enjoy a significant amount of autonomy in determining markets for collected material. Ammo will likely have to deal directly with the recyclers to determine what type and quantity of materials would be available for the Ammo biomass conversion process. As noted by DOS officials, this is a market-based decision to be made by the recyclers, not by the City or the DOS.
New York City Recyclers. Following are the recycling companies that New York City currently deals with on a primary and backup basis:
9-20
Rutigliano Paper Stock 854 Shepherd Avenue
Brooklyn, NY 11208 Contact: Jack Rutigliho 7 18-257-0244
Waste Management 72 Scott Avenue Brooklyn, NY 11237 Contact: Glenn Lostritto 718-497-4000
Crystal Waste Paper 321 Canal Place
Bronx, NY 10451 Contact: Anthony V. LaCavalla 71 8-665-0770
A & R Lobosco Inc. 31-33 Farrington Street Flushing, NY 11354 Contact: Michael Lobosco 7 18-358-2098
Recycling Systems 627 Eagle Rock Avenue, Suite 132 West Orange, NJ 07052
Contact: Manny Luongo
201-344-2222
9-2 1
D. Benedetto
420 Lexington Avenue
New York, NY 10017 Contact: Charles Rotante 2 12-867-8484
BQE 75 Thomas Street Brooklyn, NY 11222
Contact: Richard Chestock
I1 8-381-2194
Nekboh Recycling
2 North 5th Street Brooklyn, NY 1121 1 Contact: Philip Barretti (Sr. or Jr.) 7 1 8-384-1OO 1 or 7 18-384-5 15 1
NMS Paper Removal
58-35 47th Street Maspeth, NY 11378 Contact: Michael Sinisi
71 8-38 1- 13 19
Conclusions for New York City
While potential feedstock for the Amoco process appears to be abundant in New York City, both from the residential mixed paper stream and other sources, it appears unlikely that old
telephone directories would be included in that feedstock as long as strong, positive markets exist for the City’s current curbside and containerized waste paper mix, of which.old phone
books are already a part.
9-22
Another consideration is the DEC recycling definition. Even if the Ammo facility were to pay for the material, some recycling programs are not going to be interested in sending
material there if they are not going to get credit for that material under their recycling mandate. As noted in the sections above, this feeling is not consistent throughout New York State, and other considerations, such as jobs and economic development, might be more important.
Regarding the NYNEX decision on alternative fuels for its vehicle fleet, review of EPA
reports confirmed the benefitskosts associated with alternative fuels. However, more research is needed to determine such issues as optimum engine configuration, fuel metering
systems, and fuel storage technology. NYNEX will be turning all of its information and research data over to the appropriate Fleet Services personnel for further study and
evaluation. NYNEX will be happy to continue serving as the point of contact within NYNEX for any of the other site evaluation study participants.
Upstate New York Analvsis
As part of the NYNEX deliverable in Part 11, NYNEX interviewed recycling officials in Onondaga County (Syracuse), Erie County (Buffalo), and the Capital District (which includes Albany, Schenectady and Rensselaer counties). NYNEX does not publish directories in Rochester (Rochester Telephone territory).
NYNEX conclusions in Part I, regarding NYC, showed that, while potential feedstock for the Ammo process appears abundant in NYC, it is unlikely that old telephone directories
would be included in that feedstock as long as strong, positive markets exist for the material, which is already part of the City’s curbside recycling program.
NYNEX was interested in finding out if the conclusions would be the same in other parts of
New York State.
OnondaPa Countv. The first county contacted was Onondaga County, specifically Suzanne
LaLonde, head of the recycling department for the Onondaga County Resource Recovery
9-23
Authority (OCRRA). Some years ago, 33 of 35 communities in the County gave OCRRA
"contractual control" over disposal of garbage and recyclables.
In the summer of 1994, Onondaga completed its fourth annual telephone directory collection. The program started in 1991, when about 180 tons of directories were collected curbside and at drop-off centers. The bulk of the collected directories went to animal bedding, except for 50 tons that went to Anheuser-Busch as part of a test of shredded phone books as a bulking
agent in the cornposting of brewery food waste.
The tonnage of directories collected has continued to increase over the years. In 1994,
almost 300 tons of directories were recycled, most going to the cellulose insulation manufacturer American Intercel (Atlanta, Ga.), which paid the County a nominal amount for the material. Regarding other types of waste paper that might be available for the Amoco plant, Ms. LaLonde provided NYNEX with a chart showing the breakdown of available fibre (see Attachments 9-5 and Table 9-6 in the Appendix).
In general, while the County is currently recycling about 91,OOO tons of paper waste a year, it is estimated that another 103,000 tons are still in the waste stream. This is partly because
the County does not take certain grades of paper, but it is also due in part to the fact that people are not recycling all that they could.
All of the phone books are now being collected curbside. Ms. LaLonde said that the two material recovery facilities MRFs that the County uses are mixing some phone books in with
their news mix (up to 5 percent per load). At present, the County does not recycle what has been referred to as residential mixed paper (RMP) (see Part I, NYC section).
Burn Plant Under Construction. Ogden Martin is currently building an 850- ton/day waste-to-energy facility in Onondaga County. Test burns were scheduled for this fall.
The question in Onondaga centers around the bum plant and the County's 40 percent recycling mandate. If the County will not get recycling credit for the
9-24
corrugated mill.
NYNEX Directorv Distribution. NYNEX publishes four separate directory titles in Onondaga County and distributes approximately 600 to 700 tons of directories annually. Because of the central location of the County, however,
the Amoco plant could conceivably draw significant tonnage from surrounding areas. The Onondaga collection program has recovered more than 300 tons of directories each of the past 2 years. Thus, the recovery rate is almost 50 percent--one of the highest in the Northeast.
See Attachments 9-5 and 9-6 in the Appendix for feedstock availability numbers for Onondaga County.
Erie Countv. The general feedstock (and specific telephone directory) situation is quite different in Erie County (Buffalo Area). According to Thomas Dearing, Community Planning Coordinator for the Erie County Planning Division, the County has no Solid Waste Management Plan, and, thus, no mandated recycling percentage. The County has no
publicly-owned waste management facilities whatsoever. They rely completely on the private sector for waste management. Therefore, the concern about recycling credit for material diverted to a facility utilizing the Amoco process to convert biomass to ethanol would not be a factor in Erie County. -
On the other hand, the mix that is referred to as RMP is not being recycled to any great extent in the 36 communities in the County (not counting Buffalo), according to Mr. D d n g . Recycling officials are just beginning to push communities to add this material to
’ their programs.
NYNEX Directory Distribution. NYNEX publishes a county-wide Erie directory, as well as several smaller community directories. Total tonnage distributed is approximately 1,500 tons. Western New York, however, is one
of the weakest areas for directory recycling. Three years ago, when NYNEX
first began organizing a collection program, the City of Buffalo was the only
9-26
material that might go to the Ammo plant, then recycling officials there would just as soon send the material to the bum plant to help meet their quota.
This reaction was not consistent throughout the upstate area. Onondaga's 40 percent mandate is not controlled simply by its Solid Waste Management Plan. OCRRA's waste-to-energy plant permit states that the County must recycle 40
percent of its processables, which is an even higher standard.
Interestingly, the presence of a bum plant in a county results in numerous differences in how the state deals with those counties. For example, Onondaga County does not get credit toward its recycling mandate for any of the yard waste it composts, despite the state's inclusion of composting in the recycling definitions. That's because the mandate for Onondaga is "40% of all
material that otherwise would have been burned. " Since no yard waste is
allowed to be burned in New York State, no credit for what the County composts is given.
Neighboring Madison County, on the other hand, which does not have a waste-to-energy facility, gets recycling credit for all the yard waste composted in the County.
Onondaga's proposed waste-to-energy (WTE) facility has a maximum capacity of 295,000 tons per year, and Ms. LaLonde feels they are going to be right on target with their current non-recyclable paper stream. The only way an ethanol facility would become an attractive alternative would be if the local economy continues to improve and the amount of burnable waste exceeds the 295,000 tons.
Solvay Site. The following is really outside of the NYNEX areas of concern
for this report, but Ms. LaLonde said that the Solvay Site (originally an Allied Chemical location and currently site of a Stone Container corrugated mill) would make an ideal location for the Ammo plant becaise there is an adjacent power plant for co-generation and the potential for feedstock from the
9-25
municipality actively collecting directories. Most of the material collected in Buffalo's program went to U.S. Gypsum in Oakfield, which uses the material
to make the backsheet of its wallboard products. Another strong market in the
area is Buffalo Paperboard in Luckport, New York.
Over the years, other municipalities and private haulers added directories to
- their programs -- primarily because residents began pressuring them when they read about the City of Buffalo program in the Recycling Pages that run in the
front of most NYNEX directories. Dealing with multiple private haulers and recyclers can be a frustrating experience; it is much easier to deal with a county-wide, single point-of-contact program as in Onondaga County.
See Attachments 9-7 and 9-8 in the Appendix for feedstock availability
numbers for Erie County.
CaDital District. The Capital District of New York comprises Albany, Schenectady, and
Rensselaer counties, but, like Syracuse, the central location .means an ethanol facility would
be able to draw feedstock from a much wider area. Recycling programs are extensive and quite well-developed in the Capital District. The ANSWERS Program is the primary recycling operation in the area.
Jeff Edwards, Recycling Coordinator for Schenectady County, presented yet another response to a possible alternative end-use market for RMP. Mr. Edwards said he would not be a "purist" regarding the issue of getting recycling credit for material diverted to an biomass-to- ethanol facility. More important to Mr. Edwards was the willingness of such a facility to
1 locate in Schnectady County for the economic development benefits. If the facility were to
locate elsewhere in the vicinity, Mr. Edwards would also expect the market to be positive;
Le., willing to pay for the feedstock material. If the facility were located in Schenectady County, then he would be more willing to accept a flat market. With GE having recently laid off 1,OOO employees, economic development and jobs take precedence over recycling
mandates and other issues in this area.
9-27

Right now, most of the.RMP fraction in Schenectady County goes to a local landfill. The County only collects junk mail and office paper among materials that might be part of the
RMP mix. Next year, the RMP material will be going to a landfill out of the area. In 5 years, Schenectady County expects to have a bum plant in operation.
NYNEX Directorv Distribution. NYNEX publishes a primary directory in all three Capital District counties, as well as numerous community directories. Other publishers also publish directories in this area. As noted, many more
directories are published in surrounding counties. Because of the availability
of transport via the Hudson River, it is conceivable that an biomass-to-ethanol facility located in this area could even draw phone books and other feedstock material from as far away as the New York Metropolitan Area.
In the three primary Capital District counties, NYNEX distributes x2proximately 1,OOO tons of directories annually. Last year, more than 300 tons of directories were recovered in the three counties. Most of the collected
m3terial went to the nearby Bonded Insulation Company, a manufacturer of cellulose insulation. Another strong market in the area is Columbia Corporation, a manufacturer of boxboard. A strong emphasis on regionalization exists in the area, making the organization of collection
programs simpler than in more segmented areas.
S e e Attachments 9-9 and 9-10 in the Appendix for feedstock availability numbers for Schenectady County and Attachment 9-1 1 for' feedstock availability numbers for other parts of the Capital District as well as the rest of the state.
Conclusions for New York State
The conclusions for the upstate regions seem to be quite similar to the one in New York City: The viability of a biomass-to-ethanol facility as an alternative end-use market for phone books -- or any type of waste paper -- is completely dependent on current market
9-28
conditions.
In Onondaga County, for example, since the County is currently getting paid for its recycled directories there would be no incentive to send directories to Amoco at a zero-dollar rate. In fact, because of the current strength of the waste paper markets, it is unlikely that old telephone directories would be part of Ammo feedstock anywhere in New York State or the rest of the Northeast Region.
The residential mixed paper stream is probably a more likely feedstock since there appears to be no current positive market for most of this material. The Amoco process is particularly
attractive for such things as soiled pizza boxes and other contaminated and otherwise unrecyclabk materials.
The other consideration, however, is the DEC recycling definition. Even if the Amoco facility were to pay for the material, some recycling programs are not going to be interested in sending ma*erial there if they are not going to get credit for that material under their recycling mandate. However, this feeling is not consistent throughout the region and other considerations, such as jobs and economic development, might be more important in certain parts of the state.
Regarding the NYNEX decision on alternative fuels for its vehicle fleet, review of EPA reports confirmed the benefitdcosts associated with alternative fuels. However, more
research is needed to determine such issues as optimum engine configuration, fuel metering systems, and fuel storage technology. NYNEX will be turning all of its information and
research data over to the appropriate Fleet Services personnel for further study and
evaluation. NYNEX will be happy to continue serving as the point of contact within NYNEX for any of the other site evaluation study participants.
9-29