Foot drop and plantar flexion failure determine different gait strategies in Charcot-Marie-Tooth...
12
Foot drop and plantar flexion failure determine different gait strategies in Charcot-Marie-Tooth patients Romildo Don a, * , Mariano Serrao b,c,e , Paolo Vinci d , Alberto Ranavolo a , Angelo Cacchio a , Francesco Ioppolo a , Marco Paoloni a , Rita Procaccianti a , Flaminia Frascarelli a , Fabio De Santis a , Francesco Pierelli b , Massimo Frascarelli a , Valter Santilli a a Department of Physical Medicine and Rehabilitation, Movement Analysis Laboratory, ‘‘La Sapienza’’ University of Rome, Italy b Rehabilitation Unit, Polo Pontino-ICOT, ‘‘La Sapienza’’ University of Rome, Italy c Rehabilitation Centre, Policlinico Italia, Rome, Italy d Italian Charcot-Marie-Tooth Association (AICMT), Rome, Italy e IRCCS Neuromed, Pozzili (IS), Italy Received 8 March 2007; accepted 19 June 2007 Abstract Objective. To describe the temporal, kinetic, kinematic, electromyographic and energetic aspects of gait in Charcot-Marie-Tooth patients with foot drop and plantar flexion failure. Methods. A sample of 21 patients fulfilling clinical, electrodiagnostic and genetic criteria for Charcot-Marie-Tooth disease were eval- uated by computerized gait analysis system and compared to a group of matched healthy subjects. Patients were classified as having isolate foot drop (group 1) and association of foot drop and plantar flexion failure (group 2). Results. While it was impossible to detect a reliable gait pattern when the group of patients was considered as a whole and compared to healthy subjects, we observed two distinctive gait patterns when patients were subdivided as group 1 or 2. Group 1 showed a gait pattern with some characteristics of the ‘‘steppage pattern’’. The complex motor strategy adopted by this group leads to reduce the swing velocity and to preserve the step length in spite of a high energy consumption. Group 2 displayed a ‘‘clumsy pattern’’ characterized by very slow gait with reduced step length, a broader support area and great reduction in the cadence. This group of patients is characterized by a low energy consumption and greater energy recovery, due above all to the primary deficit and the various compensatory mechanisms. Conclusions. Such between-group differences in gait pattern can be related to both primary motor deficits and secondary compensa- tory mechanisms. Foot drop and plantar flexion failure affect the overall gait strategy in Charcot-Marie-Tooth patients. Ó 2007 Elsevier Ltd. All rights reserved. Keywords: CMT; Gait analysis; Gait patterns; Surface EMG; Kinetic; Kinematic 1. Introduction Charcot-Marie-Tooth (CMT) disease is a genetically and clinically heterogeneous neuropathy (Dyck et al., 1993; Bir- ouk et al., 1997; Garcia et al., 1998) that affects various aspects of the patient’s quality of life (Vinci et al., 2005). With a prevalence of 1 case in 2500, it is the most frequent inherited neuropathy and one of the most common neuro- genetic diseases (Martyn and Hughes, 1997). Clinical manifestations involve the peripheral nervous system and are generally characterized by symmetrical weakness and atrophy of distal muscles, predominantly in the lower limbs (Harding and Thomas, 1980; Adams and Victor, 1989), with variable rates of progression (Garcia, 1999). One of the most disabling symptoms consists of gait disturbances, which are commonly influenced by muscle weakness (Adams and Victor, 1989; Vinci et al., 2001), with 0268-0033/$ - see front matter Ó 2007 Elsevier Ltd. All rights reserved. doi:10.1016/j.clinbiomech.2007.06.002 * Corresponding author. E-mail address: [email protected] (R. Don). www.elsevier.com/locate/clinbiomech Clinical Biomechanics 22 (2007) 905–916
-
Upload
independent -
Category
Documents
-
view
0 -
download
0
Transcript of Foot drop and plantar flexion failure determine different gait strategies in Charcot-Marie-Tooth...

www.elsevier.com/locate/clinbiomech
Clinical Biomechanics 22 (2007) 905–916
Foot drop and plantar flexion failure determine different gaitstrategies in Charcot-Marie-Tooth patients
Romildo Don a,*, Mariano Serrao b,c,e, Paolo Vinci d, Alberto Ranavolo a, Angelo Cacchio a,Francesco Ioppolo a, Marco Paoloni a, Rita Procaccianti a, Flaminia Frascarelli a,
Fabio De Santis a, Francesco Pierelli b, Massimo Frascarelli a, Valter Santilli a
a Department of Physical Medicine and Rehabilitation, Movement Analysis Laboratory, ‘‘La Sapienza’’ University of Rome, Italyb Rehabilitation Unit, Polo Pontino-ICOT, ‘‘La Sapienza’’ University of Rome, Italy
c Rehabilitation Centre, Policlinico Italia, Rome, Italyd Italian Charcot-Marie-Tooth Association (AICMT), Rome, Italy
e IRCCS Neuromed, Pozzili (IS), Italy
Received 8 March 2007; accepted 19 June 2007
Abstract
Objective. To describe the temporal, kinetic, kinematic, electromyographic and energetic aspects of gait in Charcot-Marie-Toothpatients with foot drop and plantar flexion failure.
Methods. A sample of 21 patients fulfilling clinical, electrodiagnostic and genetic criteria for Charcot-Marie-Tooth disease were eval-uated by computerized gait analysis system and compared to a group of matched healthy subjects. Patients were classified as having isolatefoot drop (group 1) and association of foot drop and plantar flexion failure (group 2).
Results. While it was impossible to detect a reliable gait pattern when the group of patients was considered as a whole and compared to
healthy subjects, we observed two distinctive gait patterns when patients were subdivided as group 1 or 2. Group 1 showed a gait patternwith some characteristics of the ‘‘steppage pattern’’. The complex motor strategy adopted by this group leads to reduce the swing velocityand to preserve the step length in spite of a high energy consumption. Group 2 displayed a ‘‘clumsy pattern’’ characterized by very slowgait with reduced step length, a broader support area and great reduction in the cadence. This group of patients is characterized by a lowenergy consumption and greater energy recovery, due above all to the primary deficit and the various compensatory mechanisms.
Conclusions. Such between-group differences in gait pattern can be related to both primary motor deficits and secondary compensa-tory mechanisms. Foot drop and plantar flexion failure affect the overall gait strategy in Charcot-Marie-Tooth patients.� 2007 Elsevier Ltd. All rights reserved.
Keywords: CMT; Gait analysis; Gait patterns; Surface EMG; Kinetic; Kinematic
1. Introduction
Charcot-Marie-Tooth (CMT) disease is a genetically andclinically heterogeneous neuropathy (Dyck et al., 1993; Bir-ouk et al., 1997; Garcia et al., 1998) that affects variousaspects of the patient’s quality of life (Vinci et al., 2005).With a prevalence of 1 case in 2500, it is the most frequent
0268-0033/$ - see front matter � 2007 Elsevier Ltd. All rights reserved.
doi:10.1016/j.clinbiomech.2007.06.002
* Corresponding author.E-mail address: [email protected] (R. Don).
inherited neuropathy and one of the most common neuro-genetic diseases (Martyn and Hughes, 1997).
Clinical manifestations involve the peripheral nervoussystem and are generally characterized by symmetricalweakness and atrophy of distal muscles, predominantly inthe lower limbs (Harding and Thomas, 1980; Adams andVictor, 1989), with variable rates of progression (Garcia,1999). One of the most disabling symptoms consists of gaitdisturbances, which are commonly influenced by muscleweakness (Adams and Victor, 1989; Vinci et al., 2001), with
906 R. Don et al. / Clinical Biomechanics 22 (2007) 905–916
sensory impairment rarely playing a major role (Dycket al., 1993).
Clinically, gait pattern is characterized by foot drop, i.e.,a decreased capacity to raise the foot from the floor duringthe swing phase, with compensation achieved by increasedknee and hip flexion (Sabir and Lyttle, 1984). However,this ‘‘steppage gait’’ description cannot reflect the complexinteraction between muscle deficit, structural alterations,biomechanical dysfunctions and compensatory adjust-ments occurring during the course of the disease. In addi-tion, patients affected by gait disturbances may not onlyhave foot drop, but also a plantar flexor deficit, whichcould further impair gait (Vinci and Perelli, 2002).
A review of the literature has shown that few works gobeyond a clinical and qualitative gait description (Sabirand Lyttle, 1984).
In the study conducted by Kuruvilla et al. (2000), thenumber of CMT patients was very small, the diagnosiswas based exclusively on clinical criteria, the kinematicand kinetic data individually described and data on clinicalfeatures were not provided.
More recently, Newman et al. (2007) described severalgait abnormalities in CMT patients, but this study failedto detect distinctive walking patterns, possibly owing tothe heterogeneity of the subjects enrolled.
The variability of the biomechanical impairments islikely to affect the sensitiveness of gait analysis in detectingsignificant alterations. Global gait pattern is determined byboth primary impairments (e.g., foot drop and plantarflexor failure) and compensatory mechanisms involvingseveral muscles and joints. Thus, when analyzing a hetero-geneous sample of CMT patients, the gait abnormalitiespresent in subgroups of patients may not reach statisticalsignificance.
Our hypothesis is that only by grouping patients on thebasis of their functional deficits it may be possible to detect
peculiar gait alteration with respect to healthy subjects and
to identify distinctive gait patterns. Since foot drop andankle plantar flexion deficit are the most important biome-chanical impairments in CMT patients, we suggest thatthey may influence the global gait pattern by determiningthe development of different adaptive motor strategies.
The purpose of this study was to define the global gaitpattern of CMT patients, grouped on the basis of the pres-ence of foot drop and plantar flexion failure and to com-
pare it to a control group of healthy subjects. At this aimwe describe the temporal, kinetic, kinematic, electromyo-graphic and energetic aspects of walking, trying to identifycommon features among patients with similar biomechan-ical impairment.
2. Methods
2.1. Patients
A sample of 46 patients consecutively admitted, betweenApril 2003 and December 2005, to our outpatient service
for rehabilitation treatment with complaints of gait distur-bances and leg weakness were examined. All the patientsfulfilled the clinical, electrodiagnostic and genetic criteriafor CMT (Dyck et al., 1993).
In order to perform a complete gait analysis evaluation,we included only those subjects who were able to walkbarefoot without assistive devices such as canes or walkers(Hauser ambulation index <4) (Hauser et al., 2004). Basingon this criterion patients with severe foot rotation in one orboth limbs as well as patients with severe equinus defor-mity were not included. Exclusion criteria were markedweakness of the thigh and pelvic girdle muscles (<4 at man-ual muscle testing, MMT), lower limbs surgery, acquiredneuropathies and participation in any clinical drug trialsat the time of the study.
At the end of this selection process, a total of 21 patientswere included: 10 were males and 11 females; mean (SD)age 40 (14) years (range 15–59 years); disease duration 5–30 years.
All 21 patients had previously undergone DNA analysis,with 19 proving positive: 12 had CMT 1A, 1 had CMT 1X,3 had CMT 1B, 3 CMT had 2A-MFN2. In the remainingtwo patients, both from the same family with a dominantlyinherited axonal CMT, DNA tests for CMT type 1 geneswere negative and tests for CMT type 2 genes were inprogress.
All the patients gave their written consent after they hadreceived a full explanation of the study procedure. Thestudy was approved by the local ethics committee and con-formed to the Helsinki declaration.
2.2. Controls
Twenty-one healthy gender- and age-matched subjectsserved as control group (10 males and 11 females; meanage 40.1 ± 10.8 years, range 14–60 years).
2.3. Clinical evaluation
All the patients underwent a complete clinical assess-ment which included: (i) evaluation of foot drop; (ii) eval-uation of plantar flexor failure; (ii) evaluation of footrotation; (iii) evaluation of passive range of motion(RoM) of the ankle and knee; (iv) lower limb manual mus-cle testing; (v) sensory examination; (vi) tendon reflex elic-itation; (vii) CMT neuropathy score.
To minimize differences between examiners in gradingthe neurological examination, all the patients were evalu-ated by a single experienced physician (PV).
Foot drop, plantar flexor failure and foot rotation wereevaluated according to the method proposed by Vinci andPerelli (2002). For foot drop grading, ankle angle duringmaximal active dorsiflexion against gravity was measuredwith a manual goniometer. An angle between 90� and100� was considered to indicate mild foot drop, and anangle greater than 100� severe foot drop.

R. Don et al. / Clinical Biomechanics 22 (2007) 905–916 907
Plantar flexor failure was determined by means of astanding test (Vinci and Perelli, 2002; Vinci et al., 2006).Subjects who were unable to raise their heels at least2 cm from the floor, while standing on two scales (to ensurethat body weight was distributed symmetrically), were con-sidered to have plantar flexor failure.
Foot rotation was classified as (a) neutral if the heelangle, while standing, was between 0� and 10�; (b) in inver-sion if the heel angle was negative (varus heel); (c) in ever-sion if the heel angle was greater than 10� (valgus heel)(Vinci and Perelli, 2002).
We evaluated the RoM by measuring the passive maxi-mal ankle dorsiflexion (with the knee straight) and maxi-mal knee extension using a manual goniometer.
For the lower limb manual muscle test, we used the sixdegrees Medical Research Council standard muscle testing(MRC) (0 = no activity, 5 = maximal force). After everypatient had been trained to contract each muscle properly,the best performance out of a set of five was chosen. Wetested the following muscle groups in each limb on bothsides: flexor hallucis brevis and lumbricales, tibialis ante-rior, tibialis posterior, peroneus longus and brevis, extensorhallucis longus, extensor digitorum longus, triceps surae,quadriceps, biceps femoris, semitendinosus and semi-membranosus which, taken together, are termed hamstringmuscles, gluteus maximum, gluteus medius, ileopsoas.
Sensation was tested clinically for light touch, pain, jointposition and vibration, starting from the toes and movingproximally. Touch was tested by a wisp of cotton, painby a sharp pin, vibration by a 128-Hz tuning fork; propri-oception was investigated by asking five times the blinded
patient to describe the position of the second toe and the
ankle, which were passively moved upward or downward by
the examiner, avoiding end-of-range-of-motion position
(DeMyer, 2004). In each of these three sensory tests, werecorded whether sensation was normal, reduced or absent,specifying the region of the body.
In order to assess physical disability, we administeredthe CMT neuropathy score, which is based on the patient’ssymptoms, neurological examination and neurophysiologi-cal testing (Shy et al., 2005). Patients’ symptoms include
topographic distribution of sensory deficits and upper and
lower limbs motor impairments. Neurological examination
includes topographic distribution of pin sensibility and vibra-
tion reduction and of muscle weakness in the upper and lower
limbs. Neurophysiological testing includes amplitudes of sen-sory and motor potentials of the ulnar nerve. The CMT neu-ropathy score assigns a score that indicates a mild (10points), moderate (11–20) or severe (21–36) degree of dis-ease. The CMT neuropathy score assigns a score that indi-cates a mild (10 points), moderate (11–20) or severe (21–36)degree of disease.
2.4. Instrumental evaluation (gait analysis)
Gait analysis was performed using the ELITE stereo-photogrammetric system (BTS, Milano, Italy) (Ferrigno
and Pedotti, 1985) with eight infrared video cameras(TVC, BTS, Milano, Italy) for the acquisition of kinematicvariables. Two Kistler platforms (Kistler Instruments,Winterthur, Switzerland) were used to acquire groundreaction forces. Kinematic and kinetic data were acquiredand digitized with a sampling rate of 100 Hz. The surfacemyoelectric signals were acquired with a sampling rate of1000 Hz using a 16-channel telemetric transmission surfaceelectromyograph (pocket EMG System, BTS, Milano,Italy). The lower and upper cut-off frequencies of the Ham-ming filter were 10 Hz and 400 Hz, respectively, and thecommon mode reaction ratio was 100 dB.
Anthropometric data were collected for each subject andretroreflective spherical markers placed over prominentbony landmarks (Davis et al., 1991). Disposable Ag/AgClbipolar surface electrodes, greased with electroconductivegel were placed on the center of each muscle belly accord-ing to the European recommendations for surface electro-myography (Hermens et al., 1999). The surface electrodeswere placed bilaterally on the soleus, gastronemius media-lis, tibialis anterior, short head of the biceps femoralis, vas-tus medialis, rectus femoris, gluteus maximum and gluteusmedium muscles.
Subjects were then instructed to walk at a self-selectedspeed along a level surface approximately 10 m in length.Ten valid trials were acquired for each subject. A valid trialwas defined as one in which subjects struck the force plat-forms without adjusting their stride length.
2.5. Data analysis
In the present study we chose a set of time–distance,kinematic and kinetic parameters allowing a thoroughanalysis of gait.
2.5.1. Time–distance data
A stride was considered as the time between two consec-utive heel–floor contacts of the same limb, and was subdi-vided in a stance phase (from 1st initial contact to foot-off)and a swing phase (from foot-off to 2nd initial contact).Within the stance phase, we considered three subphases:the loading response, the mid-stance and the push-off(Perry, 1992). As time–distance gait parameters, we evalu-ated stride duration, step length, step width, percentageswing phase duration and swing velocity (Perry, 1992).
2.5.2. Kinematic dataThree-dimensional marker trajectories during walking
were obtained by using a frame-by-frame tracking system(Tracklab – BTS, Milano, Italy). Determination of jointcentres of rotation and calculation of joint angular excur-sion were performed (Vaughan et al., 1999), and jointexcursion data were normalized to the stride durationand reduced to 100 samples over the gait cycle.
Among the kinematic data we recorded, we chose toevaluate those parameters that allowed to quantify thefunctional deficits related to the foot drop and plantar

908 R. Don et al. / Clinical Biomechanics 22 (2007) 905–916
flexion failure and the adaptive changes occurring at knee,hip and pelvic level.
For the former we evaluated: ankle angle at initial con-tact, ankle dorsiflexion and plantar flexion RoM during thestance phase and ankle dorsiflexion RoM during the swingphase (Fig. 1a).
For the latter we evaluated: knee flexion RoM duringthe loading response subphase, knee flexion peak duringthe swing phase (Fig. 1b); hip extension RoM during thestance phase, hip flexion and abduction peaks during theswing phase (Fig. 1c); pelvic frontal RoM during the swingphase (Fig. 1d).
2.5.3. Kinetic dataNet internal joint moments were calculated by means of
an inverse dynamics approach (Vaughan et al., 1999). Jointmoments were normalized to the subject’s body weight.Joint moment curves were used to calculate the angularimpulse, i.e., the area under the joint moment curve withina specific time interval. Angular impulse quantifies the totalcontribution of a joint moment to the production of move-ment and accounts, as previously reported (De Vita et al.,1998), for different gait adaptations (e.g., changes in walk-ing speed) more accurately than peak moment values.
As for the kinematic data, we chose to evaluate thosekinetic parameters that allowed to quantify the functionaldeficits related to the foot drop and plantar flexion failureand the adaptive changes occurring at knee and hip joints.
For the former we evaluated: ankle dorsiflexor angularimpulse during the loading response subphase, ankle plan-tar flexor angular impulse during the mid-stance subphaseand ankle plantar flexor angular impulse during the push-off subphase (Fig. 1a).
For the latter we evaluated: knee 1st and 2nd extensorangular impulse during the stance phase (Fig. 1b); hipextensor angular impulse during the loading response sub-phase and hip flexor angular impulse during the push-offsubphase (Fig. 1c).
2.5.4. EMG data
The times of muscle activity onset and offset were deter-mined using a detection algorithm based on the continuouswavelet transform, disregarding every transition lasting lessthen 125 ms (Merlo et al., 2003). The time of activity onset/offset was then normalized to the stride duration, andreduced to a series of 100 on/off data samples for each mus-cle and each stride.
2.5.5. Energetic behaviour
We measured the mechanical behaviour of the body interms of energy recovery and energy consumption in rela-tion to the whole body centre of mass (CoM). This meth-odology has been validated in both normal (Cavagnaet al., 1976, 2002) and abnormal gait patterns (Detrembleuret al., 2003) and it gives information on the mechanicalenergy expenditure, involving the whole skeletal musclesystem during walking.
The trajectory of the CoM was calculated by means ofthe segmental analysis method (Saini et al., 1998). Briefly,the instantaneous CoM position was calculated by anthro-pometric data and by lower limb, pelvis and upper bodykinematics. The masses of the pelvis and lower limb seg-ments and the relative CoM were calculated using equa-tions derived from Zatsiorsky and Seluyanov (1983).
We calculated the fraction of mechanical energy(R-step) recovered by the pendular transduction of poten-tial energy to kinetic energy and vice versa during eachwalking step (Cavagna et al., 2002), as follows:
R-step ¼ W þv þ W þ
f � W þext
W þv þ W þ
f
¼ 1� W þext
W þv þ W þ
f
where W þv , W þ
f , W þext represent the positive work (sum of
the positive increments over one step) produced by thegravitational potential energy, by the kinetic energy of for-ward motion and by the total mechanical energy, respec-tively. In summary, the R-step represents an index ofmechanical energy recovery which can vary between 0and 1 (the worst and the ideal mechanical energetic behav-iour, respectively).
We also calculated the total energy consumption (TEC)as the sum of the negative (W �
ext) and positive work (W þext),
each divided by their respective efficiencies (Cavagna et al.,1976), as follows:
TEC ¼ W þext
1:20þ W �
ext
0:25
Given the cyclic nature of walking, the positive workdone at each step is equal to the negative work, which thuschanges the previous formula to
TEC ¼ W þext
0:21
TEC was then normalized to the body weight and steplength.
In summary, the TEC represents an index of the totalmechanical energy expenditure aimed at moving subject’sbody during walking. Higher values are indicative ofgreater energy expenditure.
2.6. Statistical analysis
The statistical analysis was performed using the SAS 8.2(SAS Institute Inc., Cary, NC, USA).
A P value of less than 0.01 was considered statisticallysignificant.
We used the Mann–Whitney U-test to compare thetime–distance, kinetic, kinematic and energetic data of allthe CMT patients and controls.
As our work focused on the effects of foot drop andankle plantar flexor failure, we subdivided CMT patientsaccording to the distribution of these two clinical features.Chi-square test was used to detect significant differences inthe other clinical features among the groups.

Fig. 1. Kinematic and kinetic parameters evaluated for gait assessment and concerning ankle (a), knee (b), hip (c), joints and pelvis (d). Graphs are relativeto the control group. ((a) AA = ankle dorsi–plantar flexion angle at initial contact, ST AD RoM = ankle dorsiflexion RoM during stance phase, APRoM = ankle plantar flexion RoM during stance phase, SW AD RoM = ankle dorsiflexion RoM during swing phase, AD = ankle dorsiflexor angularimpulse during loading response subphase, MS AP = ankle plantar flexor angular impulse during mid-stance subphase, PO AP = ankle plantar flexorangular impulse during push-off subphase; (b) KF RoM = knee flexion RoM during loading response subphase, KF peak = knee flexion peak duringswing phase, 1st KE = first knee extensor angular impulse during stance phase, 2nd KE = second knee extensor angular impulse during stance phase;(c) HE RoM = hip extension RoM during stance phase, HF peak = hip flexion peak during swing phase, HA peak = hip abduction peak during swingphase, HE = hip extensor angular impulse during loading response subphase, HF = hip flexor angular impulse during push-off subphase; (d) SW PFRoM = pelvic frontal RoM during swing phase.)
R. Don et al. / Clinical Biomechanics 22 (2007) 905–916 909
Then we performed Kruskal–Wallis to evaluate signifi-cant differences in kinematic and kinetic gait parametersamong CMT groups and controls. A Tukey’s post hoc testwas performed when Kruskal–Wallis was significant.
In addition, Chi-square test was used to detect sig-nificant differences in the muscle on/off patterns betweenthe two CMT groups at each percentage of the strideduration.
3. Results
3.1. Clinical findings
Table 1 summarizes the patients’ main clinical features.All the patients had a moderate disability at the CMT neu-ropathy score (11–20 points). Distributions of clinical fea-tures among groups did not show significant differences

Table 1Patients’ main clinical features
CMT group 1 CMT group 2
Age: mean (SD), range 40 (16), 15–59 40 (12), 17–57Gender (males/females) 5/5 5/6CMT type (# of patients) 1A (6), 1B (1), 1X (1), 2A (1), 2 (1) 1A (6), 1B (2), 2A (2), 2 (1)CMT neuropathy score: mean (SD), range 16 (2), 12–19 15 (2), 12–19Foot rotation (# of feet) N (8), I (8), E (4) N (10), I (8), E (4)Foot drop severity (# of patients) Mild (2), severe (8) Severe (11)Ankle plantar flexion strength deficit (# of patients) 0 9Ankle dorsiflexion strength deficit (# of patients) 6 10Ankle eversion strength deficit (# of patients) 7 10Sensory reduction, light touch (# of patients) 10 10Sensory reduction, pain (# of patients) 6 7Sensory reduction, proprioception (# of patients) 6 9Patellar tendon reflex absence (# of patients) 7 8Achilles tendon reflex absence (# of patients) 9 11Knee hyperextension (# of patients) 5 8
Foot rotation: N = normal or almost normal; I = inversion; E = eversion; strength deficits: score 0–3 at manual muscle testing; knee hyperextension:maximum knee passive extension P 185�.
910 R. Don et al. / Clinical Biomechanics 22 (2007) 905–916
except for the strength deficits of ankle motions. Indeed, ingroup 2 the strength of ankle dorsiflexion, eversion andplantar flexion was more frequently deficient than in group1.
On the basis of the foot drop and plantar flexion failure,patients were subdivided into two groups: group 1 com-prised 10 patients with foot drop alone (2 with mild and8 with severe foot drop), while group 2 comprised 11patients with both foot drop (all severe) and plantar flexorfailure.
3.2. Gait analysis
3.2.1. CMT vs controls
CMT patients displayed a significantly longer strideduration, lower swing velocity, shorter step length andgreater step width than controls; no differences were foundbetween patients and controls in the percentage swingduration (Table 2).
Significant differences between patients and controlswere found in all the kinematic and kinetic ankle parame-ters on both sides, except for the plantar flexor angularimpulse during the push-off subphase (Table 2, Fig. 2).
We found statistical differences in knee flexion RoMduring the loading response subphase, hip extensor angularimpulse during the loading response subphase and hipflexor angular impulse during the push-off subphase. Nosignificant differences emerged between patients and con-trols in the other kinematic and kinetic parameters (Table2, Fig. 3).
The data concerning energy expenditure are shown inTable 3. Energy recovery (R-step) and energy consumption(TEC) values were significantly higher in CMT patientsthan in controls (Table 3).
3.2.2. Group 1 vs group 2 vs controlsTable 2 shows the time–distance, kinematic and kinetic
mean values and the statistical differences between the
two patient groups as well as between patients and con-trols. As shown, there was a statistically significant differ-ence both between the patient groups and between thepatients and controls in most of the kinematic and kineticparameters.
As shown in Table 2 and Figs. 2 and 3, the main differ-ences between the two patient groups were in the degree ofankle-related parameter abnormalities and in the presenceof distinctive values of pelvic-, hip- and knee-relatedparameters. In addition, the comparison of each patientgroup with the controls reveals pelvic, hip and knee abnor-malities that did not emerge when the patients were notsubdivided. Furthermore, the plantar flexor angularimpulse was higher in group 1 and lower in group 2patients than in controls (Table 2, Fig. 2).
As regards energy expenditure, R-step values were sig-nificantly lower and TEC values significantly higher ingroup 1 than in group 2 patients.
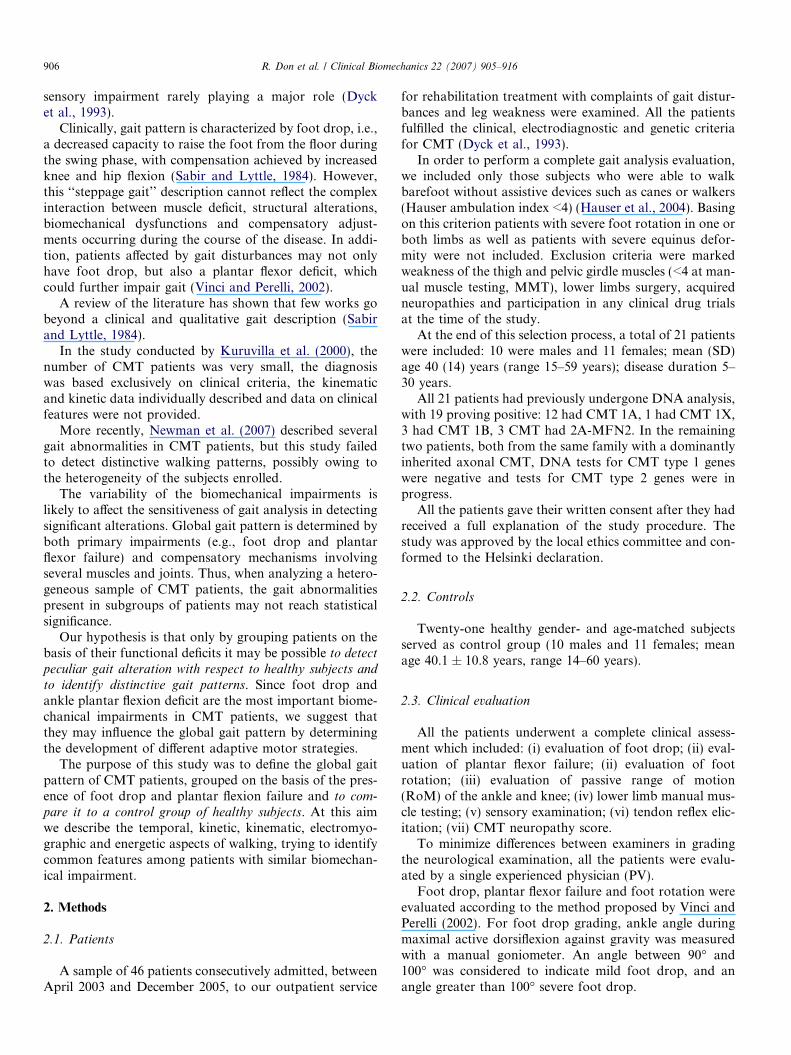
The muscle on/off pattern analysis is shown in Fig. 4.The y-axis shows the percentage of strides in which themuscle was active for each percentage of the gait cycle ineach group. Grey areas indicate significant differencesbetween groups. The following significant differences wereobserved: (i) mid-stance bursts of activity of the gastrocne-mius medialis and soleus muscles were longer in group 1than in group 2 owing to earlier activation and delayedde-activation; more specifically, gastrocnemius medialiswas more frequently active in the 29–35% and 47–66%intervals of the gait cycle and soleus in the 27–35% and44–64% intervals (all P < 0.001); (ii) tibialis anterior activ-ity during swing was more frequent in group 2 than ingroup 1, particularly in the last 6% of the gait cycle (allP < 0.01); (iii) biceps femoris activity around foot-off wasmore frequent in group 1 than in group 2, particularly inthe 61–71% interval (all P < 0.001); (iv) the vastus medialismuscle was more frequently active in group 1 than in group2 during both the stance and swing phases, there being adelayed offset during mid-stance and earlier activation dur-

Table 2Kinematic and kinetic mean data in CMT patients and controls
CMT sample CMT group 1 CMT group 2 Control group
Stride duration (ms) R 1383 (181)a 1336 (131)b 1425 (214)b 951 (80)L 1382 (197)a 1309 (168)b 1448 (206)b 930 (41)
Swing duration (% stride duration) R 41.0 (3.8) 44.2 (1.6)b,c 38.0 (2.4)b,c 41.5 (2.0)L 41.2 (3.8) 44.6 (1.6)b,c 38.2 (2.3)b,c 42.5 (2.3)
Swing velocity R 1.9 (0.3)a 2.0 (0.2)b,c 1.7 (0.4)b,c 3.0 (0.4)L 1.8 (0.3)a 2.0 (0.1)b,c 1.7 (0.2)b,c 3.0 (0.5)
Anterior step length (mm) R 513 (72)a 566 (32)c 465 (64)b,c 579 (61)L 501 (76)a 550 (46)c 455 (69)b,c 544 (52)
Stride width (mm) B 141 (25)a 122 (12)c 159 (21)b,c 120 (11)Pelvic frontal RoM swing phase (deg) R 5.2 (1.8) 1.5 (0.4)b,c 10.0 (1.4)b,c 5.3 (1.4)
L 5.2 (1.9) 1.6 (0.5)b,c 10.1 (1.5)b,c 5.0 (1.8)Hip extension RoM stance phase (deg) R 32.4 (7.2) 38.6 (4.0)b,c 26.8 (4.1)b,c 34.3 (3.6)
L 33.0 (7.3) 38.9 (4.2)b,c 25.0 (2.7)b,c 35.1 (3.9)Hip flexion peak swing phase (deg) R 34.5 (11.2) 44.4 (8.1)b,c 25.5 (2.0)b,c 31.1 (3.2)
L 34.2 (12.3) 45.4 (7.5)b,c 24.0 (2.9)b,c 29.5 (3.3)Hip abduction peak swing phase (deg) R �6.1 (5.8) �1.6 (3.1)b,c �10.2 (4.4)b,c �4.1 (1.7)
L �5.0 (4.1) �1.7 (2.5)b,c �8.1 (2.7)b,c �3.0 (2.0)Hip extensor angular impulse loading response subphase R 18.3 (6.8)a 12.5 (2.8)c 23.5 (4.7)b,c 13.3 (3.0)
L 19.2 (7.6)a 12.3 (2.7)c 25.5 (4.3)b,c 14.2 (4.5)Hip flexor angular impulse push-off subphase R �182.1 (59.4)a �230.5 (42.3)b,c �138.1 (31.3)c �136.8 (22.6)
L �206.4 (67.8)a �261.2 (57.1)b,c �156.6 (23.2)c �154.3 (21.2)Knee flexion RoM loading response subphase (deg) R 6.3 (4.4)a 2.1 (1.0)b,c 10.1 (1.9)c 10.2 (1.9)
L 6.4 (4.9)a 1.9 (1.1)b,c 10.4 (3.2)c 9.9 (1.8)Knee flexion peak swing phase (deg) R 56.8 (10.6) 66.1 (3.2)b,c 48.4 (7.1)b,c 56.1 (4.8)
L 57.6 (9.2) 66.3 (3.2)b,c 49.7 (4.1)b,c 55.1 (5.1)1st Knee extensor angular impulse stance phase R 78.3 (38.5) 107.7 (25.3)b,c 45.8 (18.7)b,c 76.7 (5.6)
L 78.5 (32.3) 103.6 (19.3)b,c 50.8 (16.7)b,c 73.5 (5.6)2nd Knee extensor angular impulse stance phase R 47.7 (24.5) 29.9 (19.0)b,c 64.0 (16.4)b,c 42.3 (2.8)
L 45.7 (24.8) 24.2 (10.6)b,c 65.3 (15.6)b,c 39.7 (2.8)Ankle dorsiflexion RoM stance phase (deg) R 21.9 (6.4)a 17.3 (4.0)b,c 26.2 (5.0)b,c 10.5 (2.2)
L 22.1 (6.5)a 18.0 (2.3)b,c 25.8 (6.9)b,c 9.5 (2.1)Ankle plantar flexion RoM stance phase (deg) R 15.7 (5.6)a 21.2 (2.2)c 10.8 (1.0)b,c 20.3 (2.0)
L 15.6 (5.3)a 20.7 (1.9)c 10.9 (1.5)b,c 19.7 (2.4)Ankle dorsiflexion RoM swing phase (deg) R 6.9 (3.3)a 6.5 (4.1)b,c 7.2 (3.6)b 15.1 (1.4)
L 6.5 (2.7)a 7.0 (2.7)b,c 6.0 (3.7)b 15.3 (1.9)Ankle dorsi–plantar flexion angle initial contact (deg) R �10.4 (6.1)a �12.5 (6.9)b,c �8.4 (4.8)b,c 2.3 (2.9)
L �9.0 (5.9)a �10.8 (7.0)b,c �7.3 (4.4)b,c �0.2 (3.3)Ankle dorsiflexor angular impulse loading response subphase R �10.4 (5.5)d,a �12.1 (8.7)e �8.6 (1.7)e �22.6 (4.2)
L �9.7 (5.1)d,a �10.4 (8.7)e �9.1 (1.2)e �18.8 (4.2)Ankle plantar flexor angular impulse mid-stance subphase R 35.2 (17.6)a 41.7 (6.9)b,c 29.6 (17.9)b,c 54.2 (9.4)
L 33.3 (17.2)a 39.4 (9.8)b,c 28.3 (16.4)b,c 51.2 (10.3)Ankle plantar flexor angular impulse push-off subphase R 253.0 (126.4) 373.9 (34.9)b,c 143.0 (54.0)b,c 296.4 (47.9)
L 257.3 (116.9) 371.9 (28.8)b,c 153.0 (38.5)b,c 300.6 (59.2)
Data are mean (SD).a P < 0.01, significance of difference between all CMT patients and controls (calculated by Mann–Whitney U-test).b P < 0.01, significance of differences between CMT groups and controls (calculated by Tukey post hoc test).c P < 0.01, significance of differences between CMT group 1 and CMT group 2 (calculated by Tukey post hoc test).d Observed and calculated in only four subjects of the sample.e Observed and calculated in only two subjects of the group.
R. Don et al. / Clinical Biomechanics 22 (2007) 905–916 911
ing swing; more specifically, the significance intervals were9–26% and 76–93% (all P < 0.005); (v) there were signifi-cant differences in the rectus femoris muscle pattern,involving the burst of activity around foot-off (more fre-quent in group 1 in the 42–78% interval, all P < 0.001)and the burst during swing (more frequent in group 2 inthe 83–94% interval, all P < 0.001); (vi) glutei bursts ofactivity were considerably longer in group 2 than in group1; more specifically, the significance intervals were 7–21%and 56–72% for gluteus maximum (all P < 0.005) and 45–57% and 67–76% for gluteus medium (all P < 0.001).
4. Discussion
This study quantitatively describes the gait pattern in 21CMT patients with leg muscle weakness, without severefoot deformities, classified as moderate according to theCMT neuropathy score, who were able to walk barefootunaided.
As hypothesized, the main finding of this study is thatthe distribution of ankle functional deficits (foot dropand plantar flexor failure) among CMT patients is closelyrelated to the overall walking strategy, as shown by the

Fig. 2. Kinematic and kinetic parameters values of the ankle joint during gait cycle. Graphs are relative to the whole CMT sample (grey thick lines), CMTgroup 1 (black thin lines) and 2 (dashed lines), and controls (black thick lines).
Fig. 3. Kinematic and kinetic parameters values of the knee, hip and pelvis during gait cycle. Graphs are relative to the whole CMT sample (grey thicklines), CMT group 1 (black thin lines) and 2 (dashed lines), and controls (black thick lines).
Table 3Energetic behaviour during gait (energy recovery and consumption) inCMT patients and controls
R-step (%) TEC (kcal/km kg)
Controls 65.8 (4.7) 0.51 (0.11)CMT patients 74.3 (8.4)a 0.65 (0.38)a
Group 1 71.5 (5.5)b,c 0.86 (0.47)b,c
Group 2 77.4 (9.5)b,c 0.42 (0.15)b,c
Data are mean (SD).a P < 0.01, significance of difference between all CMT patients and
controls (calculated by Mann–Whitney U-test).b P < 0.01, significance of differences between CMT subgroups and
controls (calculated by Tukey post hoc test).c P < 0.01, significance of differences between CMT group 1 and CMT
group 2 (calculated by Tukey post hoc test).
912 R. Don et al. / Clinical Biomechanics 22 (2007) 905–916
emergence of two patterns with distinctive deficit-relatedand compensation-related features. Conversely, when ana-lyzed as a whole, our patients sample displayed character-istic gait changes attributable to the functional deficits,without showing an overall compensatory strategy.
Recently, Newman et al. (2007) found several kinematicabnormalities in the gait of a CMT sample. They did notidentify an overall gait strategy as compensatory mecha-nism required to maintain walking ability achieved statisti-cal significance. For example, neither an increase in hip andknee flexion nor an increase in pelvic obliquity and hipabduction were reported during the swing phase despitethe presence of marked foot drop. We propose that the het-erogeneity of the biomechanical impairments in that study
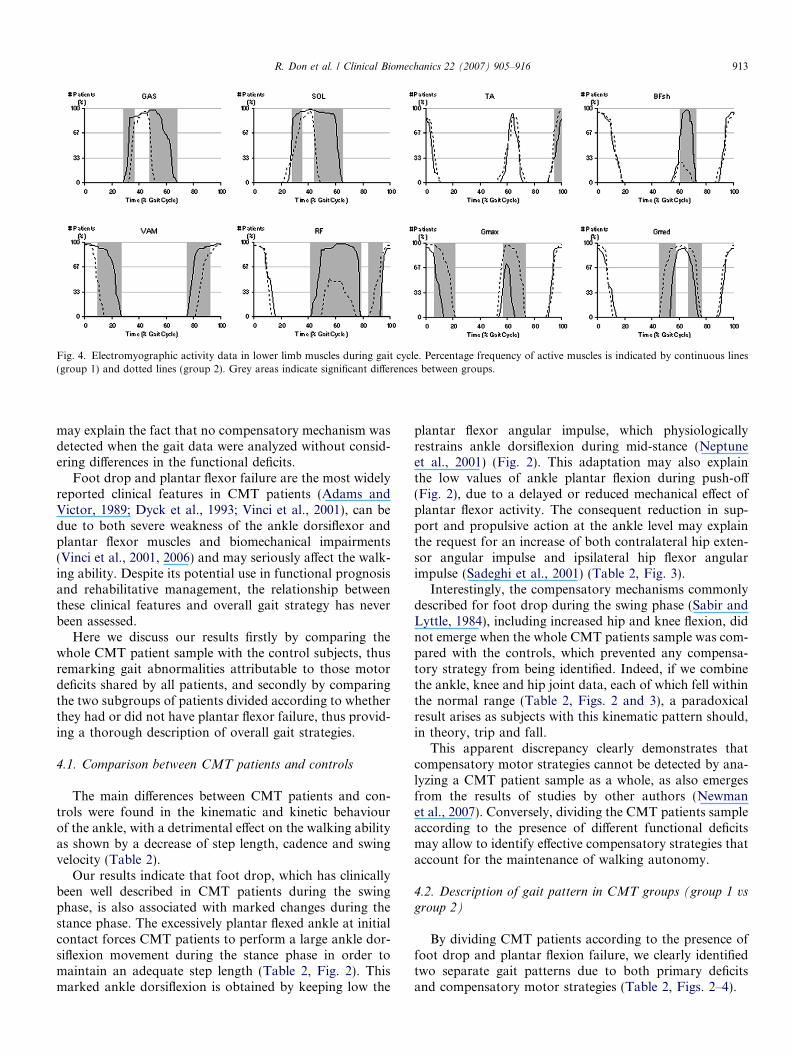
Fig. 4. Electromyographic activity data in lower limb muscles during gait cycle. Percentage frequency of active muscles is indicated by continuous lines(group 1) and dotted lines (group 2). Grey areas indicate significant differences between groups.
R. Don et al. / Clinical Biomechanics 22 (2007) 905–916 913
may explain the fact that no compensatory mechanism wasdetected when the gait data were analyzed without consid-ering differences in the functional deficits.
Foot drop and plantar flexor failure are the most widelyreported clinical features in CMT patients (Adams andVictor, 1989; Dyck et al., 1993; Vinci et al., 2001), can bedue to both severe weakness of the ankle dorsiflexor andplantar flexor muscles and biomechanical impairments(Vinci et al., 2001, 2006) and may seriously affect the walk-ing ability. Despite its potential use in functional prognosisand rehabilitative management, the relationship betweenthese clinical features and overall gait strategy has neverbeen assessed.
Here we discuss our results firstly by comparing thewhole CMT patient sample with the control subjects, thusremarking gait abnormalities attributable to those motordeficits shared by all patients, and secondly by comparingthe two subgroups of patients divided according to whetherthey had or did not have plantar flexor failure, thus provid-ing a thorough description of overall gait strategies.
4.1. Comparison between CMT patients and controls
The main differences between CMT patients and con-trols were found in the kinematic and kinetic behaviourof the ankle, with a detrimental effect on the walking abilityas shown by a decrease of step length, cadence and swingvelocity (Table 2).
Our results indicate that foot drop, which has clinicallybeen well described in CMT patients during the swingphase, is also associated with marked changes during thestance phase. The excessively plantar flexed ankle at initialcontact forces CMT patients to perform a large ankle dor-siflexion movement during the stance phase in order tomaintain an adequate step length (Table 2, Fig. 2). Thismarked ankle dorsiflexion is obtained by keeping low the
plantar flexor angular impulse, which physiologicallyrestrains ankle dorsiflexion during mid-stance (Neptuneet al., 2001) (Fig. 2). This adaptation may also explainthe low values of ankle plantar flexion during push-off(Fig. 2), due to a delayed or reduced mechanical effect ofplantar flexor activity. The consequent reduction in sup-port and propulsive action at the ankle level may explainthe request for an increase of both contralateral hip exten-sor angular impulse and ipsilateral hip flexor angularimpulse (Sadeghi et al., 2001) (Table 2, Fig. 3).
Interestingly, the compensatory mechanisms commonlydescribed for foot drop during the swing phase (Sabir andLyttle, 1984), including increased hip and knee flexion, didnot emerge when the whole CMT patients sample was com-pared with the controls, which prevented any compensa-tory strategy from being identified. Indeed, if we combinethe ankle, knee and hip joint data, each of which fell withinthe normal range (Table 2, Figs. 2 and 3), a paradoxicalresult arises as subjects with this kinematic pattern should,in theory, trip and fall.
This apparent discrepancy clearly demonstrates thatcompensatory motor strategies cannot be detected by ana-lyzing a CMT patient sample as a whole, as also emergesfrom the results of studies by other authors (Newmanet al., 2007). Conversely, dividing the CMT patients sampleaccording to the presence of different functional deficitsmay allow to identify effective compensatory strategies thataccount for the maintenance of walking autonomy.
4.2. Description of gait pattern in CMT groups (group 1 vs
group 2)
By dividing CMT patients according to the presence offoot drop and plantar flexion failure, we clearly identifiedtwo separate gait patterns due to both primary deficitsand compensatory motor strategies (Table 2, Figs. 2–4).

914 R. Don et al. / Clinical Biomechanics 22 (2007) 905–916
4.2.1. Gait pattern of group 1
The pattern that characterizes group 1 is partially inagreement with the typical clinical description of the gaitof CMT patients, which focuses on the swing phase (Sabirand Lyttle, 1984; Adams and Victor, 1989; Dyck et al.,1993). In our study, this pattern is exhaustively character-ized and is, moreover, complemented by kinematic andkinetic data relative to the stance phase, electromyographicand energetic data (Tables 2 and 3, Figs. 2–4).
At initial contact, these patients land with the ankleexcessively plantar flexed. During the loading response,most patients display a lack of dorsiflexor angular impulsedue to flatfoot landing. In the few patients who do notshow flatfoot at initial contact (Table 2), the low valuesof the dorsiflexor angular impulse can be attributed tothe incapacity of the weak dorsiflexor muscles to ade-quately control the landing of the foot on the floor. Duringthe following mid-stance subjects increased the passiveankle dorsiflexion motion in order to preserve body pro-gression, as discussed above. This increased ankle dorsiflex-ion is obtained by delaying the activation of the plantarflexor muscles, as shown by our EMG data (Fig. 4),thereby reducing the plantar flexor angular impulse (Table2).
In parallel with these changes, we observed a consensualincrease in hip extension and a higher knee angular impulsevalue during stance. This finding can be explained by thefact that the increase in ankle dorsiflexion needs to be coor-dinated with a greater hip extension in order to preservebody progression and balance (Sadeghi et al., 2001). Thiscombination of joint motion requires an additional anti-gravitational effort which is exerted upon the knee exten-sors, as shown by the presence of a prolonged EMGactivity in vastus medialis and rectus femoris muscle(Table 2, Figs. 2–4).
During the push-off subphase, patients display anincreased plantar flexor angular impulse that maintainsplantar flexion excursion and delivers the energy for thefoot-off (Neptune et al., 2001) (Table 2). This may be per-formed, despite the delayed onset of EMG plantar flexoractivity during the mid-stance (Fig. 4), by a massive recruit-ment of the muscles spared by the disease in this group ofpatients. Another important contribution to propulsiveenergy delivery during push-off comes from the hip flexors,as shown by the increase in the hip angular impulse, whichis needed to lift the lower limb off the ground and to per-form enhanced hip flexion during swing (Table 2, Fig. 3).
During the swing phase, patients typically display footdrop and compensatory increases of knee and hip flexion.
The motor strategy we have described, which may bereferred to as a ‘‘steppage’’ pattern, reduces gait speed asa result of an increase in step duration, which is attribut-able to a longer duration of the swing phase. The strategyadopted by these patients, however, maintains step lengthwithin normal values.
As regards energy behaviour, these patients increaseboth energy recovery and consumption during gait if com-
pared with healthy subjects. This increase in energy con-sumption may be related to the high mechanical effortrequired to carry out the peculiar gait strategy adoptedby these subjects, in particular upon hip flexor, knee exten-sor and ankle plantar flexor muscles, for both support andpropulsion purposes.
In terms of rehabilitation management, we can hypoth-esize for these patients the advisability of adopting orthoticdevices aimed at avoiding an excessive metabolic cost forlocomotion by reducing the need for compensatory mech-anisms during the swing phase, without affecting the resid-ual propulsion capacity as may result from use of solidankle-foot orthoses.
4.2.2. Gait pattern of group 2The gait pattern of group 2 comprises some less widely
described features that have not been previously well char-acterized (Sabir and Lyttle, 1984; Dyck et al., 1993).
At initial contact, these patients also have an excessivelyplantar flexed ankle, though to a lesser degree than group 1(Table 2, Fig. 2).
The same lack of dorsiflexion angular impulse wasfound during the loading response. Peculiar aspects of thissubphase are an increased hip extensor angular impulseand a decreased knee flexion RoM and knee extensor angu-lar impulse (Table 2, Fig. 3). This suggests that thesepatients use their hip extensor muscles more than theirknee extensors to perform load acceptance, as shown bythe prolonged EMG activity in gluteus maximum andreduced duration of vastus medialis EMG activity (Fig. 4).
During the mid-stance, as observed in group 1, patientsdisplayed increased passive ankle dorsiflexion associatedwith a decreased plantar flexor angular impulse. This pat-tern was, however, more enhanced than in group 1, indicat-ing not only a compensatory neural mechanism for flatfootlanding, but also a direct mechanical effect of plantar flexorfailure. The failure of the decelerating action of the plantarflexors may explain the request for decreasing hip exten-sion, thus restraining forward progression of the body inorder to maintain anterior–posterior balance (Table 2,Figs. 2 and 3).
During the push-off subphase, patients clearly displayedthe effects of plantar flexor failure, consisting of a markeddecrease in both angular impulse and plantar flexion RoM(Fig. 2), partly compensated in terms of body support bythe increased knee extensor angular impulse (Neptuneet al., 2001). Unlike group 1, the hip flexor angular impulsedoes not increase to compensate for the propulsion deficit,possibly owing to differences in the nature of swing phasecompensation adopted by these patients.
Indeed, hip and knee flexion during the swing phase werereduced and the main mechanisms used to prevent trippingwere increased hip abduction and pelvic elevation on theswinging side obtained by prolonging activation of the glu-teus medium muscle (Fig. 4).
In addition, it is noteworthy that the degree of foot dropin this phase is similar in both groups, whereas the degree

R. Don et al. / Clinical Biomechanics 22 (2007) 905–916 915
of flatfoot at initial contact is lower in group 2 than ingroup 1 (Table 2, Fig. 2). This apparent discrepancy is eas-ily explained by the different ankle angle at foot-off: ingroup 2, the plantar flexor failure results in a lower amountof plantar flexion being produced during push-off. This lastobservation also explains why group 2 patients require lesslower limb elevation than group 1 patients to avoid trip-ping and falling.
This motor strategy leads to a very slow gait, character-ised by reduced step length, a broad support area and agreatly reduced cadence. As regards energy behaviour,these patients display a greater energy recovery and lowerenergy consumption than group 1. These differences maybe due to two factors: one related to the primary deficit,the other to the compensatory mechanisms. The former isrelated to the broader muscle weakness in this group ofpatients, which determines a lower overall energy outputand consequently requires a greater amount of energyrecovery to maintain walking ability. The latter cannot beexplained on the basis of our kinetic data, possibly dueto the lack of information concerning joints angularimpulses and energy consumption occurring in the frontalplane, where the most relevant compensatory mechanisms(increase of hip and pelvic RoM) of these patients takeplace.
In terms of rehabilitation management, our results sug-gest for these patients the advisability of strengthening andorthotic treatments aimed at avoiding that the increase ofproximal frontal plane motion may affect dynamic balanceand predispose to falls. Further studies are required to ver-ify the short- and long-terms effects of these treatments onthe walking ability and prevention of falls.
4.3. Limitations of the study
In this study, patients with different genotypes were con-sidered together. However, as no major differences in theclinical expression of the disease have been found betweenCMT type 1 and CMT type 2 (Bienfait et al., 2006), we donot believe that this aspect is likely to have affected ourresults.
Overall, it should be borne in mind that the results of thegait analysis in our study are closely linked to the clinicalcharacteristics of the patients enrolled, even though theseclinical characteristics are in accordance with those ofpatient series in the literature (Birouk et al., 1997; Garciaet al., 1998; Garcia, 1999; Dyck et al., 1993). Althoughthe patients selected for this study complained of gait diffi-culties, they were able to walk barefoot without assistivedevices and did not present severe foot deformities; more-over, the patients’ leg muscles were involved, while thethigh and pelvic girdle muscles were spared, and they hadbut mild sensory abnormalities. In particular, this last fea-ture, which has not a prominent role in the clinical expres-sion of CMT, may contribute to affect gait mainly whenwalking on irregular surfaces (DeMott et al., 2007). How-ever, sensory impairments were almost equally distributed
among groups 1 and 2 (Table 1), thus the differencesdetected between these groups cannot be attributed to sen-sory abnormalities. An analysis of the influence of sensoryimpairment on gait pattern, which was not an aim of ourstudy, may be useful to understand if this factor may playa role in determining gait abnormalities observed in CMTpatients. Similarly, having excluded patients with severefoot deformities from our study, and given the equal distri-bution of the mild foot deformities among patient groups(Table 1), our findings can be attributed exclusively to footdrop and plantar flexor failure.
5. Conclusions
In conclusion, we performed an exhaustive gait analysisto investigate the presence of overall gait strategies in asample of CMT patients. The results of this study, whichidentified two different gait patterns for different combina-tions of foot drop and plantar flexor failure, may serve as aframework to further investigate the factors involved in thedevelopment of distinctive motor strategies and establishthe most appropriate rehabilitative, orthotic and surgicaltreatments to prevent ambulatory impairments.
References
Adams, R.D., Victor, M., 1989. Degenerative disease of the nervoussystem. Principles of Neurology, fourth ed. McGraw-Hill, New York,pp. 1056–1057.
Bienfait, H.M., Verhamme, C., van Schaik, I.N., Koelman, J.H., deVisser, B.W., de Haan, R.J., et al., 2006. Comparison of CMT1A andCMT2: similarities and differences. J. Neurol. 253, 1572–1580.
Birouk, N., Gouider, R., Le Guern, E., Gugenheim, M., Tardieu, S.,Maisonobe, T., et al., 1997. Charcot-Marie-Tooth disease type 1Awith 17p11.2 duplication. Clinical and electrophysiological phenotypestudy and factors influencing disease severity in 119 cases. Brain 120,813–823.
Cavagna, G.A., Thys, H., Zamboni, A., 1976. The sources of externalwork in level walking and running. J. Physiol. 262, 639–657.
Cavagna, G.A., Willems, P.A., Legramandi, M.A., Heglund, N.C., 2002.Pendular energy transduction within the step in human walking.J. Exp. Biol. 205, 3413–3422.
Davis, R.B., Ounpuu, S., Tyburski, D., Gage, J.R., 1991. A gait analysisdata collection and reduction technique. Hum. Mov. Sci. 10, 575–587.
DeMott, T.K., Richardson, J.K., Thies, S.B., Ashton-Miller, J.A., 2007.Falls and gait characteristics among older persons with peripheralneuropathy. Am. J. Phys. Med. Rehabil. 86, 125–132.
DeMyer, W., 2004. Technique of the Neurological Examination, fifth ed.McGraw-Hill, New York.
Detrembleur, C., Dierick, F., Stoquart, G., Chantraine, F., Lejeune, T.,2003. Energy cost, mechanical work, and efficiency of hemipareticwalking. Gait Post. 18, 47–55.
De Vita, P., Lassiter Jr., T., Hortobagyi, T., Torry, M., 1998. Functionalknee brace effects during walking in patients with anterior cruciateligament reconstruction. Am. J. Sports Med. 26, 778–784.
Dyck, P.J., Chance, P.F., Lebo, R.V., Carney, J.A., 1993. Hereditarymotor and sensory neuropathies. In: Dyckk, P.J., Griffin, J.W., Low,P.A., Poduslo, J.F. (Eds.), Peripheral Neuropathy, third ed. W.B.Saunders, Philadelphia, PA, pp. 1094–1136.
Ferrigno, G., Pedotti, A., 1985. ELITE: a digital dedicated hardwaresystem for movement analysis via real-time TV signal processing.IEEE Trans. Biomed. Eng. 32, 943–950.

916 R. Don et al. / Clinical Biomechanics 22 (2007) 905–916
Garcia, C.A., 1999. Clinical features of Charcot-Marie-Tooth. NY Acad.Sci. 883, 69–76.
Garcia, A., Combarros, O., Calleja, J., Berciano, J., 1998. Charcot-Marie-Tooth type 1A with 17p duplication in infancy and early childhood.Neurology 50, 1061–1067.
Harding, A.E., Thomas, P.K., 1980. The clinical features of hereditarymotor and sensory neuropathy, types I and II. Brain 103, 258–280.
Hauser, S.L., Dawson, D.M., Lehrich, J.R., Beal, M.F., Kevy, S.V.,Propper, R.D., Mills, J.A., Weiner, H.L., 2004. Intensive immuno-suppression in progressive multiple sclerosis. A randomized, three-armstudy of high-dose intravenous cyclophosphamide, plasma exchange,and ACTH. N. Engl. J. Med. 308, 173–180.
Hermens, H.J., Freriks, B., Merletti, R., Stegeman, D., Block, J., Rau, G.,et al., 1999. European recommendations for surface electromyography.SENIAM Project Roessingh Research and Development b.v.,Enschede, The Netherlands.
Kuruvilla, A., Costa, J.L., Wright, R.B., Yoder, D.M., Andriacchi, T.P.,2000. Characterization of gait parameters in patients with Charcot-Marie-Tooth disease. Neurol. Ind. 48, 49–55.
Martyn, C.N., Hughes, R.A.C., 1997. Epidemiology of peripheralneuropathy. J. Neurol. Neurosurg. Psych. 62, 310–318.
Merlo, A., Farina, D., Merletti, R., 2003. A fast and reliable technique formuscle activity detection from EMG signals. IEEE Trans. Biomed.Eng. 50, 316–323.
Neptune, R.R., Kautz, S.A., Zajac, F.E., 2001. Contributions of theindividual ankle plantar flexor to support, forward progression andswing initiation during walking. J. Biomech. 34, 1387–1398.
Newman, C.J., Walsh, M., O’sullivan, R., Jenkinson, A., Bennett, D.,Lynch, B., O’brien, T., 2007. The characteristics of gait in Charcot-Marie-Tooth disease types I and II. Gait Post. 26, 120–127.
Perry, J., 1992. Gait Analysis. Normal and Pathological Function.SLACK.
Sabir, M., Lyttle, D., 1984. Pathogenesis of Charcot-Marie-ToothDisease. Gait analysis and electrophysiologic, genetic, histopathologic,and enzyme studies in a kinship. Clin. Orthop. Relat. Res. 184, 223–235.
Sadeghi, H., Sadeghi, S., Prince, F., Allard, P., Labelle, H., Vaughan,C.L., 2001. Functional roles of ankle and hip sagittal muscle momentsinn able-bodied gait. Clin. Biomech. 16, 688–695.
Saini, M., Kerrigan, D.C., Thirunarayan, M.A., Duff-Raffaele, M., 1998.The vertical displacement of the center of mass during walking: acomparison of four measurement methods. J. Biomech. Eng. 120, 133–139.
Shy, M.E., Blake, J., Krajewski, K., et al., 2005. Reliability and validity ofthe CMT neuropathy score as a measure of disability. Neurology 64,1209–1214.
Vaughan, C.L., Davis, B.L., O’Connor, J.C., 1999. Dynamics of HumanGaits, second ed. Human Kinetics Publishers, Champaign, IL.
Vinci, P., Perelli, S.L., 2002. Footdrop, foot rotation and plantarflexorfailure in Charcot-Marie-Tooth disease. Arch. Phys. Med. Rehabil. 83,513–516.
Vinci, P., Oliveira, G.R., Antenor, J.A., Thomas, F.P., 2001. Anticipationin Charcot-Marie-Tooth disease type 2. Neurology 4 (suppl. 3), 324–325.
Vinci, P., Serrao, M., Millul, A., Deidda, A., De Santis, F., Capici, S.,Martini, D., Pierelli, F., Santilli, V., 2005. Quality of life in patientswith Charcot-Marie-Tooth disease. Neurology 65, 922–924.
Vinci, P., Serrao, M., Pierelli, F., Sandrini, G., Santilli, V., 2006. Lowerlimb manual muscle testings in the early stages of Charcot-Marie-Tooth disease type 1A. Funct. Neurol. 3, 159–163.
Zatsiorsky, V.M., Seluyanov, V.N., 1983. The mass and inertia charac-teristics of the main segments of the human body. In: Matsui, H.,Kobayashi, K. (Eds.), Biomechanics VIII-B Champaign: HumanKinetics. pp. 1152–1159.