New insights into the plantar pressure correlates of walking speed using pedobarographic statistical...
8
Journal of Biomechanics 41 (2008) 1987–1994 New insights into the plantar pressure correlates of walking speed using pedobarographic statistical parametric mapping (pSPM) Todd C. Pataky a, , Paolo Caravaggi a , Russell Savage a , Daniel Parker a , John Y. Goulermas b , William I. Sellers c , Robin H. Crompton a a HACB, School of Biomedical Sciences, University of Liverpool, Sherrington Buildings, Liverpool L69 3GE, UK b Department of Electrical Engineering and Electronics, University of Liverpool, UK c Faculty of Life Sciences, University of Manchester, UK Accepted 25 March 2008 Abstract This study investigates the relation between walking speed and the distribution of peak plantar pressure and compares a traditional ten-region subsampling (10RS) technique with a new technique: pedobarographic statistical parametric mapping (pSPM). Adapted from cerebral fMRI methodology, pSPM is a digital image processing technique that registers foot pressure images such that homologous structures optimally overlap, thereby enabling statistical tests to be conducted at the pixel level. Following previous experimental protocols, we collected pedobarographic records from 10 subjects walking at three different speeds: slow, normal, and fast. Walking speed was recorded and correlated with the peak pressures extracted from the 10 regions, and subsequently with the peak pixel data extracted after pSPM preprocessing. Both methods revealed significant positive correlation between peak plantar pressure and walking speed over the rearfoot and distal forefoot after Bonferroni correction for multiple comparisons. The 10RS analysis found positive correlation in the midfoot and medial proximal forefoot, but the pixel data exhibited significant negative correlation throughout these regions (po5 10 5 ). Comparing the statistical maps from the two approaches shows that subsampling may conflate pressure differences evident in pixel-level data, obscuring or even reversing statistical trends. The negative correlation observed in the midfoot implies reduced longitudinal arch collapse with higher walking speeds. We infer that this results from pre- or early-stance phase muscle activity and speculate that preferred walking speed reflects, in part, a balance between the energy required to tighten the longitudinal arch and the apparent propulsive benefits of the stiffened arch. r 2008 Elsevier Ltd. All rights reserved. Keywords: Plantar pressure; Gait biomechanics; Stance phase; Biomedical image processing; Plantar aponeurosis; Longitudinal arch; Midfoot; Locomotor efficiency 1. Introduction The human foot is a complex structure that constitutes the primary mechanical interface between our bodies and the environment. As walking speed increases, the foot must transmit increasing propulsive impulsive to the ground, the mechanics of which are not fully understood (Zatsiorsky et al., 1994; Alexander, 2004; Erdemir et al., 2004; Erdemir and Piazza, 2004). Previous studies have demonstrated that peak pressures are positively correlated with walking speed across the plantar surface of the foot (Rosenbaum et al., 1994; Zhu et al., 1995; Drerup et al., 2001; Burnfield et al., 2004; Segal et al., 2004; Taylor et al., 2004; Warren et al., 2004; Yang et al., 2005). The only exception is that, in some of these studies, a peak pressure decrease was observed in the lateral midfoot as a function of walking speed, but this trend either failed to reach significance (Drerup et al., 2001; Taylor et al., 2004) or was not explicitly discussed (Rosenbaum et al., 1994; Segal et al., 2004). We believe that a decrease in midfoot peak pressure is non-trivial because it implies decreased longitudinal arch collapse modulated by pre-stance or early stance muscular ARTICLE IN PRESS www.elsevier.com/locate/jbiomech www.JBiomech.com 0021-9290/$ - see front matter r 2008 Elsevier Ltd. All rights reserved. doi:10.1016/j.jbiomech.2008.03.034 Corresponding author. Tel.: +44 151 794 5500. E-mail address: [email protected] (T.C. Pataky).
Transcript of New insights into the plantar pressure correlates of walking speed using pedobarographic statistical...

ARTICLE IN PRESS
0021-9290/$ - se
doi:10.1016/j.jb
�CorrespondE-mail addr
Journal of Biomechanics 41 (2008) 1987–1994
www.elsevier.com/locate/jbiomech
www.JBiomech.com
New insights into the plantar pressure correlates of walking speed usingpedobarographic statistical parametric mapping (pSPM)
Todd C. Patakya,�, Paolo Caravaggia, Russell Savagea, Daniel Parkera, John Y. Goulermasb,William I. Sellersc, Robin H. Cromptona
aHACB, School of Biomedical Sciences, University of Liverpool, Sherrington Buildings, Liverpool L69 3GE, UKbDepartment of Electrical Engineering and Electronics, University of Liverpool, UK
cFaculty of Life Sciences, University of Manchester, UK
Accepted 25 March 2008
Abstract
This study investigates the relation between walking speed and the distribution of peak plantar pressure and compares a traditional
ten-region subsampling (10RS) technique with a new technique: pedobarographic statistical parametric mapping (pSPM). Adapted from
cerebral fMRI methodology, pSPM is a digital image processing technique that registers foot pressure images such that homologous
structures optimally overlap, thereby enabling statistical tests to be conducted at the pixel level. Following previous experimental
protocols, we collected pedobarographic records from 10 subjects walking at three different speeds: slow, normal, and fast. Walking
speed was recorded and correlated with the peak pressures extracted from the 10 regions, and subsequently with the peak pixel data
extracted after pSPM preprocessing. Both methods revealed significant positive correlation between peak plantar pressure and walking
speed over the rearfoot and distal forefoot after Bonferroni correction for multiple comparisons. The 10RS analysis found positive
correlation in the midfoot and medial proximal forefoot, but the pixel data exhibited significant negative correlation throughout these
regions (po5� 10�5). Comparing the statistical maps from the two approaches shows that subsampling may conflate pressure
differences evident in pixel-level data, obscuring or even reversing statistical trends. The negative correlation observed in the midfoot
implies reduced longitudinal arch collapse with higher walking speeds. We infer that this results from pre- or early-stance phase muscle
activity and speculate that preferred walking speed reflects, in part, a balance between the energy required to tighten the longitudinal arch
and the apparent propulsive benefits of the stiffened arch.
r 2008 Elsevier Ltd. All rights reserved.
Keywords: Plantar pressure; Gait biomechanics; Stance phase; Biomedical image processing; Plantar aponeurosis; Longitudinal arch; Midfoot; Locomotor
efficiency
1. Introduction
The human foot is a complex structure that constitutesthe primary mechanical interface between our bodies andthe environment. As walking speed increases, the foot musttransmit increasing propulsive impulsive to the ground, themechanics of which are not fully understood (Zatsiorskyet al., 1994; Alexander, 2004; Erdemir et al., 2004; Erdemirand Piazza, 2004). Previous studies have demonstrated thatpeak pressures are positively correlated with walking speed
e front matter r 2008 Elsevier Ltd. All rights reserved.
iomech.2008.03.034
ing author. Tel.: +44151 794 5500.
ess: [email protected] (T.C. Pataky).
across the plantar surface of the foot (Rosenbaum et al.,1994; Zhu et al., 1995; Drerup et al., 2001; Burnfieldet al., 2004; Segal et al., 2004; Taylor et al., 2004; Warrenet al., 2004; Yang et al., 2005). The only exception is that,in some of these studies, a peak pressure decrease wasobserved in the lateral midfoot as a function of walkingspeed, but this trend either failed to reach significance(Drerup et al., 2001; Taylor et al., 2004) or was notexplicitly discussed (Rosenbaum et al., 1994; Segal et al.,2004).We believe that a decrease in midfoot peak pressure is
non-trivial because it implies decreased longitudinal archcollapse modulated by pre-stance or early stance muscular

ARTICLE IN PRESST.C. Pataky et al. / Journal of Biomechanics 41 (2008) 1987–19941988
activity. If the arch is not loaded in this manner, the highervertical ground reaction forces associated with fasterwalking speeds (Keller et al., 1996) would cause the archto collapse to a greater extent. Decreased longitudinal archcollapse would thus imply that there is some propulsivebenefit, direct or indirect, to active arch collapse preven-tion. To our knowledge this issue has not been explicitlyaddressed in the biomechanics literature.
All previous studies of the plantar pressure correlates ofwalking speed have employed traditional subsamplingmethodology. ‘Subsampling’ refers to spatial data reduc-tion; the foot is discretized into on the order of 10 regions(Rosenbaum and Becker, 1997), and one metric is extractedper region (usually the maximal pressure). While effectivelyreducing the large data set to a manageable size, the mainproblem with subsampling is that it ignores most of thedata. An adult foot can contact over 500 sensors whenusing currently available commercial hardware, so sub-sampling can entail an approximately 50-fold decrease inspatial information. Disposing of so much data could beproblematic if there is substantial intra-region variation.
Here we employ the established cerebral fMRI metho-dology: ‘Statistical parametric mapping’ (SPM) (Fristonet al., 1995) to analyze pedobarographic images collectedfor a range of walking speeds. The technique first registersplantar pressure images such that homologous structuresoptimally overlap, and then conducts pixel-level statisticaltests using a mass univariate approach. The result is acontinuous statistical map that can be viewed in the contextof the original foot pressure images.
The purposes of the current study were: (1) to use SPMto clarify the midfoot pressure correlates of walking speed,and (2) to corroborate the results with those obtained usinga traditional ten-region subsampling (10RS) technique.
2. Methods
2.1. Design
Ten males (age: 28.878.3 years, height: 177.178.3 cm, mass:
76.1711.7 kg) volunteered to participate in this experiment. Following
previous studies (Rosenbaum et al., 1994; Burnfield et al., 2004; Taylor
et al., 2004; Yang et al., 2005), subjects were asked to walk either ‘slow’,
‘normal’, or ‘fast’ over a 10m gait runway. Right foot pressure data were
collected at 500Hz using a 0.5m Footscan 3D system (RSscan, Olen,
Belgium). A Kistler force plate (model 8281B, Winterthur, Switzerland)
was used to continuously calibrate the pressure data. Subjects took four
steps before contacting the pressure plate. Walking speed was measured as
the average velocity of a single reflective marker that was strapped to the
participant’s abdomen; motion was recorded at 50Hz using a six camera
ProReflex system (Qualisys, Gothenburg, Sweden).
Twenty repetitions of each speed were performed in random order,
yielding a total of 600 pedobarographic records. To avoid gait adjustments
due to pressure plate targeting, subjects used tape to mark starting
positions and were given 15min to practise the three walking speeds. They
were instructed to look forward and to disregard foot placement; if their
foot landed outside the sensing zone of the equipment, the trial was
discarded and immediately repeated. This type of failure occurred, on
average, 2.8 times over the 60 trials. Prior to participation subjects gave
informed consent according to the policies of the Research Ethics
Committee of the University of Liverpool.
2.2. Pedobarographic statistical parametric mapping
Pedobarographic SPM (pSPM) analyses were conducted on peak
pressure images and consisted of three main steps: (1) Image generation,
(2) Registration, and (3) Statistical tests. All analyses were implemented in
MATLAB 7.4 (The MathWorks, USA).
The images produced by the RSscan software had pixel coordinates
spaced 5.08 and 7.62mm in the horizontal and vertical directions,
respectively (manufacturer specified). To produce an image on a square
grid and thus accurately depict foot geometry, pixel coordinates x were
mapped to new locations y using a vertical stretching transformation:
y ¼1 0
0 7:62=5:08
" #x (1)
The transformed image was then obtained by resampling over the new
coordinates using bilinear interpolation (Goshtasby, 2005). Images were
then registered (Maintz and Viergever, 1998) and spatially smoothed using
a recently described algorithm that minimized the mean squared error
between the images (Pataky and Goulermas, in press) such that
homologous structures optimally overlapped. The first normal walking
peak pressure image was used as the registration template for each subject.
All within-subjects (WS) images were registered to this template using an
optimal rigid-body transformation and were then registered again to the
resulting mean image. Between-subjects (BS) registration was performed
once per subject using the mean images and an optimal affine
transformation.
Following Friston et al. (1995), statistical analyses were conducted
using linear mass-univariate parametric regression models. The WS model
was:
I ij ¼ ðb1Þj vi þ ðb2Þj ti þ ðb3Þj þ eij (2)
where Iij is the pressure observation at the jth pixel in the ith trial, vi is the
walking SPEED, and ti models an experimental TIME drift nuisance
factor across the experimental session; we chose to include a linearly
varying ti factor in the statistical model after observing a small baseline
drift in the force plate (�20N/h). The b are unknown regression
parameters. The residuals (eij) are assumed to be normally distributed.
In a subsidiary analysis we tested this assumption using pixel-level
Kolmogorov–Smirnov tests (Conover, 1971); such analysis is not strictly
necessary (see Discussion), but is included to emphasize registration
quality and the nature of the data.
The BS model was
I ij ¼ ðb1Þj vi þ ðb2kÞj tki þ ðb3lÞj sli þ ðb4Þj þ eij (3)
where sli is a nuisance factor that blocks SUBJECTS to account for gross
differences (e.g. body weight). Here k and l index the 10 experimental
sessions (one per subject) and the nine SUBJECT degrees of freedom,
respectively. We note that the TIME and SUBJECT nuisance effects are
not of empirical interest. Including these terms both isolates SPEED
effects and protects against type II error.
Pixel test statistics having the Student’s t distribution were computed
according to Friston et al. (1995). To demonstrate the statistical
robustness of the current data set, statistical inferences were made with
both an uncorrected p threshold of 0.05 and a Bonferroni threshold of
5� 10�5 to correct for multiple comparisons.
2.3. Ten-region subsampling (10RS)
Commercial software (Footscan 7, RSscan) was used to automatically
define 10 anatomical regions (Fig. 1A) for the template image of each
subject. Regional peak pressures were then extracted from the WS
registered images (Fig. 1B and C) and statistical tests were conducted
using the models above (Eqs. (2) and (3)). We corrected for multiple
ARTICLE IN PRESST.C. Pataky et al. / Journal of Biomechanics 41 (2008) 1987–1994 1989
comparisons using a Bonferroni threshold of po0.0051 (across the 10
regions). Differences between 10RS and pSPM results were assessed
qualitatively.
Fig. 1. Regions of interest and subsampling example. (A) Commercial
software was used to automatically define 10 anatomical regions (T1: toe
1; T2–5: toes 2–5; M1–M5: metatarsals 1–5; MF: midfoot; HM: heel
medial; HL heel lateral). Peak pressure images (B) were then subsampled
(C) by extracting the maximum value in each region.
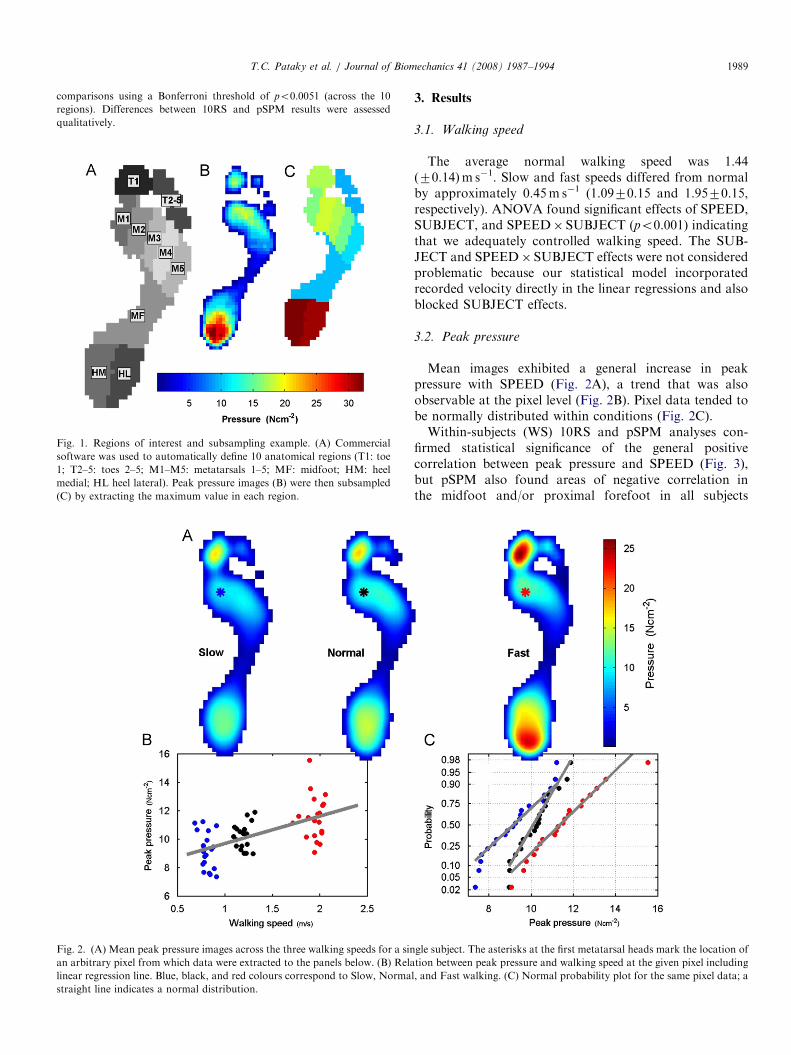
Fig. 2. (A) Mean peak pressure images across the three walking speeds for a sin
an arbitrary pixel from which data were extracted to the panels below. (B) Rela
linear regression line. Blue, black, and red colours correspond to Slow, Norma
straight line indicates a normal distribution.
3. Results
3.1. Walking speed
The average normal walking speed was 1.44(70.14)m s�1. Slow and fast speeds differed from normalby approximately 0.45m s�1 (1.0970.15 and 1.9570.15,respectively). ANOVA found significant effects of SPEED,SUBJECT, and SPEED� SUBJECT (po0.001) indicatingthat we adequately controlled walking speed. The SUB-JECT and SPEED�SUBJECT effects were not consideredproblematic because our statistical model incorporatedrecorded velocity directly in the linear regressions and alsoblocked SUBJECT effects.
3.2. Peak pressure
Mean images exhibited a general increase in peakpressure with SPEED (Fig. 2A), a trend that was alsoobservable at the pixel level (Fig. 2B). Pixel data tended tobe normally distributed within conditions (Fig. 2C).Within-subjects (WS) 10RS and pSPM analyses con-
firmed statistical significance of the general positivecorrelation between peak pressure and SPEED (Fig. 3),but pSPM also found areas of negative correlation inthe midfoot and/or proximal forefoot in all subjects
gle subject. The asterisks at the first metatarsal heads mark the location of
tion between peak pressure and walking speed at the given pixel including
l, and Fast walking. (C) Normal probability plot for the same pixel data; a

ARTICLE IN PRESS
Fig. 3. Within-subjects analyses. (A) Ten-region subsampling analysis, masked at a Bonferroni-corrected po0.005. Subjects are labelled in columns by the
numbers ‘1’ through ‘10’ for convenient reference in the main text. (B) pSPM analysis, masked at an uncorrected po0.05. (C) pSPM analysis, masked at a
Bonferroni-corrected po5� 10�5. (D) Probability values associated with the test statistics, logarithmic scale.
T.C. Pataky et al. / Journal of Biomechanics 41 (2008) 1987–19941990
(Fig. 3B,C). The 10RS analysis (Fig. 3A) obscured theseresults. Most notably, 10RS midfoot data exhibitedpositive correlation in most subjects.
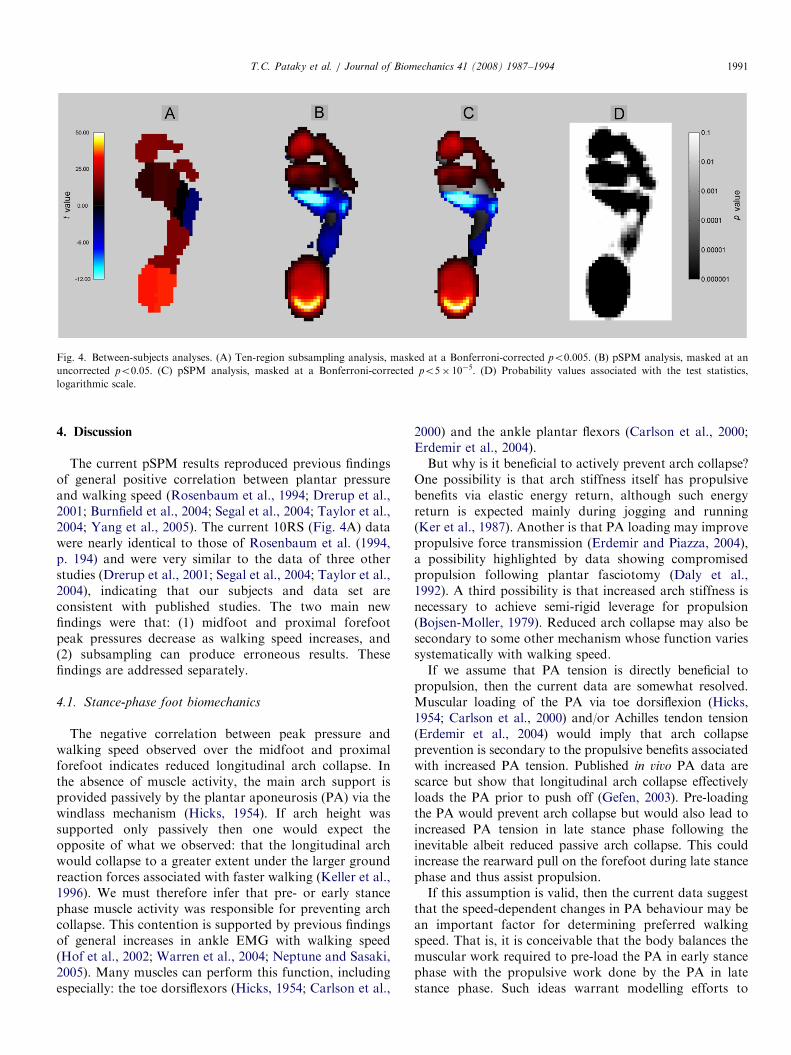
Between-subjects (BS) correlations were highly signifi-cant (Fig. 4). The 10RS midfoot data exhibited strongpositive correlation (Fig. 4A), representing a clear depar-ture from the pixel data, which were negatively correlatedbroadly over the midfoot and proximal forefoot (Fig. 4Band C). Apparent discrepancies between these data and theWS data can be explained by the smaller WS data sets andalso narrow midfoot contact regions; the midfoot andforefoot trends emerge with the larger BS data set.
Both the BS and WS results were insensitive to p thresh-olding; statistical clusters sizes reduced slightly with the harshBonferroni correction (Figs. 3B and C, 4B and C), but the datawere qualitatively identical irrespective of threshold.
3.3. Statistical assumptions
The statistical models (Eqs. (2)and (3)) assume thatthe residuals (eij) are normally distributed. Kolmogorov–
Smirnov tests revealed that only the foot periphery wasassociated with non-normality in the WS registered images(Fig. 5), attesting to both successful registration andstatistical assumption validity. Kolmogorov–Smirnovresults were similar for BS registered images (Fig. 6) exceptfor the posterior midfoot region, which exhibited non-normal residuals. We observed, however, that removinghigh arched subjects one-by-one from the data set causedthe midfoot residuals to become increasingly normallydistributed (data not presented in interest of space). Thusthe non-normal midfoot residuals in the BS images areattributable to arch height differences across subjects andare responsible for the lower t values in the posteriormidfoot (Fig. 4B).We also note that the proximal forefoot, an area
associated with highly negative peak pressure correlation,exhibited normally distributed residuals (Fig. 6). We inferthat the midfoot data reflect a spatially continuousextension of the proximal midfoot trends, the significanceof which is weakened by slight non-normality due toanatomical rather than functional variability.
ARTICLE IN PRESS
Fig. 4. Between-subjects analyses. (A) Ten-region subsampling analysis, masked at a Bonferroni-corrected po0.005. (B) pSPM analysis, masked at an
uncorrected po0.05. (C) pSPM analysis, masked at a Bonferroni-corrected po5� 10�5. (D) Probability values associated with the test statistics,
logarithmic scale.
T.C. Pataky et al. / Journal of Biomechanics 41 (2008) 1987–1994 1991
4. Discussion
The current pSPM results reproduced previous findingsof general positive correlation between plantar pressureand walking speed (Rosenbaum et al., 1994; Drerup et al.,2001; Burnfield et al., 2004; Segal et al., 2004; Taylor et al.,2004; Yang et al., 2005). The current 10RS (Fig. 4A) datawere nearly identical to those of Rosenbaum et al. (1994,p. 194) and were very similar to the data of three otherstudies (Drerup et al., 2001; Segal et al., 2004; Taylor et al.,2004), indicating that our subjects and data set areconsistent with published studies. The two main newfindings were that: (1) midfoot and proximal forefootpeak pressures decrease as walking speed increases, and(2) subsampling can produce erroneous results. Thesefindings are addressed separately.
4.1. Stance-phase foot biomechanics
The negative correlation between peak pressure andwalking speed observed over the midfoot and proximalforefoot indicates reduced longitudinal arch collapse. Inthe absence of muscle activity, the main arch support isprovided passively by the plantar aponeurosis (PA) via thewindlass mechanism (Hicks, 1954). If arch height wassupported only passively then one would expect theopposite of what we observed: that the longitudinal archwould collapse to a greater extent under the larger groundreaction forces associated with faster walking (Keller et al.,1996). We must therefore infer that pre- or early stancephase muscle activity was responsible for preventing archcollapse. This contention is supported by previous findingsof general increases in ankle EMG with walking speed(Hof et al., 2002; Warren et al., 2004; Neptune and Sasaki,2005). Many muscles can perform this function, includingespecially: the toe dorsiflexors (Hicks, 1954; Carlson et al.,
2000) and the ankle plantar flexors (Carlson et al., 2000;Erdemir et al., 2004).But why is it beneficial to actively prevent arch collapse?
One possibility is that arch stiffness itself has propulsivebenefits via elastic energy return, although such energyreturn is expected mainly during jogging and running(Ker et al., 1987). Another is that PA loading may improvepropulsive force transmission (Erdemir and Piazza, 2004),a possibility highlighted by data showing compromisedpropulsion following plantar fasciotomy (Daly et al.,1992). A third possibility is that increased arch stiffness isnecessary to achieve semi-rigid leverage for propulsion(Bojsen-Moller, 1979). Reduced arch collapse may also besecondary to some other mechanism whose function variessystematically with walking speed.If we assume that PA tension is directly beneficial to
propulsion, then the current data are somewhat resolved.Muscular loading of the PA via toe dorsiflexion (Hicks,1954; Carlson et al., 2000) and/or Achilles tendon tension(Erdemir et al., 2004) would imply that arch collapseprevention is secondary to the propulsive benefits associatedwith increased PA tension. Published in vivo PA data arescarce but show that longitudinal arch collapse effectivelyloads the PA prior to push off (Gefen, 2003). Pre-loadingthe PA would prevent arch collapse but would also lead toincreased PA tension in late stance phase following theinevitable albeit reduced passive arch collapse. This couldincrease the rearward pull on the forefoot during late stancephase and thus assist propulsion.If this assumption is valid, then the current data suggest
that the speed-dependent changes in PA behaviour may bean important factor for determining preferred walkingspeed. That is, it is conceivable that the body balances themuscular work required to pre-load the PA in early stancephase with the propulsive work done by the PA in latestance phase. Such ideas warrant modelling efforts to

ARTICLE IN PRESS
Fig. 6. Residual normality tests on BS registered images, masked at
po0.001. Data are presented as for Fig. 5.
Fig. 5. Residual normality tests on within-subjects registered images, masked at po0.001. Coloured data indicate the values of dimensionless
Kolmogorov–Smirnov test statistics. A test statistic with value x indicates that there was a maximum difference of 100x% between the sample residuals
and a normal distribution with identical mean and standard deviation. Since residual smoothing will ensure normality (see Discussion), these data are
meant only to demonstrate successful registration and the general nature of the data; we therefore apply an arbitrarily conservative threshold of po0.001.
T.C. Pataky et al. / Journal of Biomechanics 41 (2008) 1987–19941992
elucidate the PA’s propulsive role. Presently, we mayconclude only that the data suggest that reduced long-itudinal arch collapse is either directly beneficial to orsymptomatic of walking at faster speeds.
4.2. Pedobarographic methodology
The main methodological finding was that subsamplingcan produce erroneous results. The current 10RS methodfound positive correlation in the midfoot and medialforefoot, findings that are consistent with six previousstudies (Rosenbaum et al., 1994; Drerup et al., 2001;Burnfield et al., 2004; Segal et al., 2004; Taylor et al., 2004;Yang et al., 2005), but that are inconsistent with the pixel-level data. Subsampling distorted the forefoot effects andreversed the midfoot effects, showing a negative correlationonly in the lateral forefoot (Fig. 4A), identical to the dataof Rosenbaum et al. (1994).Since the current subsampled data were consistent with
previous studies we attribute the negative midfoot correla-tion finding to pSPM’s ability to detect such differencesrather than to data peculiarities. The contradictionbetween the two methods can be explained by the midfootregion definition. Its posterior edge encroaches on theanterior heel, a region associated with high pressure

ARTICLE IN PRESST.C. Pataky et al. / Journal of Biomechanics 41 (2008) 1987–1994 1993
(Fig. 2A) and positive correlation with walking speed(Fig. 4B and C). Since subsampling extracts only a singlemaximum value, the 10RS midfoot data are driven by thishigh anterior heel pressure.
The subsampling results (Fig. 4A) would lead one toinfer that load shifts medially as speed increases; this isindeed what has been inferred previously (Rosenbaumet al., 1994). However, the pixel-level data (Fig. 4B and C)elucidate that the decreased peak pressure actually occursacross the entire midfoot and proximal forefoot, bothmedially and laterally. This observation is critical becauseit implies that employing subsampling methods mayproduce results that lead to incorrect interpretations offoot biomechanics.
The functional brain imaging community has largelyabandoned subsampling (termed ‘‘Region of Interest’’analysis in the literature) in favour of SPM analyses forprecisely these reasons. Defining physical boundaries onarbitrary regions constitutes a biased ad hoc solution thatdisregards the spatial structure inherent in the data. Wethus recommend that pedobarographical analyses shouldinclude all regional pixel data rather than just singleregional values.
We must note that regional hypotheses may still betested in the context of pixel-level statistical mapping. Oneapproach is to examine the profile of the statistical map inthe vicinity of a specified region, without defining hardspatial limits (Friston, 1997). The only adjustment to themethodology is at the level of statistical inference.Implementing such regional tests is facilitated by pSPMpreprocessing methodology because anatomical segmenta-tion needs to be performed only once on a template image.Image registration then ensures efficient homologous dataextraction.
One statistical challenge peculiar to pedobarographicSPM is the inclusion of subjects with varying longitudinalarch heights in a common statistical model. This is achallenge because high arched subjects (e.g. Subjects 2and 6, Fig. 3) will exhibit many null midfoot values. Thecontinuous statistical fields observed in the current data setallowed us to retain a parametric approach and to assumethat the lower midfoot significance was a result of nullobservation skewing. This approach may not be appro-priate where statistical fields are non-continuous or wherethe data are more seriously skewed by many high-archedsubjects. In such cases a non-parametric approach may bemore suitable.
An additional statistical challenge is power analysis or,equivalently, protection against Type II error. Poweranalysis is not currently relevant because we foundsignificant effects across the entire foot surface (the nulleffects observed in the normality analyses are subsidiaryresults that we consider demonstrative of the nature of thedata rather than constituting a scientific result). We cautionthat power analyses (Friston et al., 1996) would benecessary in cases where pSPM results procure conclusionsof no significant effects of experimental treatments.
A third important statistical issue is SPM-basedinference and the multiple comparisons problem. In thispaper we used a simple Bonferroni correction to control forfamily-wise Type I error over the search area, an approachwhich ignores the spatial structure of the pSPMs.Grounding statistical inferences in random field theory(Friston et al., 1995) furnishes a much more sensitiveanalysis because it accounts for spatial smoothness in theunderlying data. One does not need to control for pixel-level Type I error but rather only for Type I error in localmaxima or ‘blobs’ in the smooth pSPMs. The criticalthresholds can be derived from distributional approxima-tions as a function of the residual term smoothness. Weintend to demonstrate this in future applications when thesensitivity of detecting group differences becomes more ofan issue.The final statistical issue requiring discussion is residual
normality. We have presented a spatial analysis of normality(Figs. 5 and 6) for completeness, to show that the raw(registered) data conform to the statistical assumptions. Thisis not necessary in general because typical SPM analysessmooth data prior to inference which, by the central limittheorem, ensures that the residuals are normally distributed.Interestingly, if the data are smoothed with a very largekernel corresponding to the size of the 10RS regions, theresults would converge roughly to the current 10RS data.This emphasizes a weakness of the subsampling approach;greater spatial smoothing yields small spatial precision ofthe inferences that ensue.We finally note that one individual in the current data set
(Subject 9, Fig. 3) had excessive pronation. Despite theapparent pathology, this subject’s foot was successfullyregistered to the BS template (Fig. 6). This highlights thegeneralized nature of pSPM’s algorithms and indicates thatit may be possible to compare healthy and pathologicalpopulations directly using pSPM. Such comparisons wouldrequire random effects modelling (Holmes and Friston,1998), where each subject effect is treated as a randomvariable. The current paper employed fixed effects BSanalysis; subject effects were treated as fixed free para-meters. To implement random effects analysis, one wouldcreate WS contrast images and then submit these pSPMs toa second level between-subject analysis where a one-samplet-test can test the null hypothesis that the particular effectwas zero. For example, the effect of walking speed couldbe summarized with the map of regression coefficients b1(Eq. (3)) for each subject and these speed-dependentsummaries could be used to compare normal and patientgroups. This is an established procedure in human brainmapping and can be generalised to any hierarchicalobservation model with an arbitrary number of levels.
5. Summary
Using a cerebral fMRI protocol adapted for pedobaro-graphic image analysis, we found that midfoot andproximal forefoot peak plantar pressures are negatively

ARTICLE IN PRESST.C. Pataky et al. / Journal of Biomechanics 41 (2008) 1987–19941994
correlated with walking speed. This is a novel result whichsuggests that early stance phase muscular activity preventsarch collapse to achieve a propulsive benefit, possibly viaPA tension. We also found that traditional subsamplingmethods obscure and may even reverse statistical trends,demonstrating that subsampling may lead to incorrectinferences regarding foot function. Pedobarographic stu-dies should consider pixel-level data where possible.
Conflict of interest statment
Software that performs the analyses described herein isassociated with a UK Patent application (reference #GB0725094.7, filed 21 December 2007). The authorsconfirm the scientific integrity of all data presented in thismanuscript and report no other conflict of interest.
Acknowledgements
Financial support was provided by the Leverhulme Trust(Grant F/0025/x) and NERC (Grants GR3/11202 andGR3/12004).
References
Alexander, R.McN., 2004. Bipedal animals, and their difference from
humans. Journal of Anatomy 204, 321–330.
Bojsen-Moller, F., 1979. Calcaneocuboid joint and stability of the
longitudinal arch of the foot at high and low gear push off. Journal
of Anatomy 129 (1), 165–176.
Burnfield, J.M., Few, C.D., Mohamed, O.S., Perry, J., 2004. The influence
of walking speed and footwear on plantar pressures in older adults.
Clinical Biomechanics 19, 78–84.
Carlson, R.E., Fleming, L.L., Hutton, W.C., 2000. The biomechanical
relationship between the tendoachilles, plantar fascia and metatarso-
phalangeal joint dorsiflexion angle. Foot and Ankle International 21
(1), 18–25.
Conover, W.J., 1971. Practical Nonparametric Statistics. Wiley, New
York, pp. 293–201.
Daly, P.J., Kitaoka, H.B., Chao, E.Y.S., 1992. Plantar fasciotomy for
intractable plantar fasciitis: clinical results and biomechanical evalua-
tion. Foot and Ankle 13, 188–195.
Drerup, B., Hafkemeyer, U., Moller, M., Wetz, H.H., 2001. Der einfluss
der geschwindigkeit beim gehen auf die druckverteilung bei orthopa-
dieschuhtechnischer Versorgung [effect of gait velocity on pressure
distribution in therapeutic footwear]. Der Orthopade 30 (3), 169–175.
Erdemir, A., Piazza, S.J., 2004. Changes in foot loading following plantar
fasciotomy: a computer modeling study. Journal of Biomechanical
Engineering 126, 237–243.
Erdemir, A., Hamel, A.J., Fauth, A.R., Piazza, S.J., Sharkey, N.A., 2004.
Dynamic loading of the plantar aponeurosis in walking. Journal of
Bone and Joint Surgery 86 (3), 546–552.
Friston, K.J., 1997. Testing for anatomically specified regional effects.
Human Brain Mapping 5, 133–136.
Friston, K.J., Holmes, A.P., Worsley, K.J., Poline, J.P., Frith, C.D.,
Frackowiak, R.S.J., 1995. Statistical parametric maps in functional
imaging: a general linear approach. Human Brain Mapping 2,
189–210.
Friston, K.J., Holmes, A., Poline, J.B., Price, C.J., Frith, C.D., 1996.
Detecting activations in PET and fMRI: levels of inference and power.
NeuroImage 4, 223–235.
Gefen, A., 2003. The in-vivo elastic properties of the plantar fascia during
the contact phase of walking. Foot and Ankle International 24 (3),
238–244.
Goshtasby, A., 2005. 2-D and 3-D image registration: for medical,
remote sensing, and industrial applications. Wiley, New York,
pp.145–146.
Hicks, J.H., 1954. The mechanics of the foot: II The plantar aponeurosis
and the arch. Journal of Anatomy 88, 25–31.
Hof, A.L., Elzinga, H., Grimmius, W., Halbertsma, J.P.K., 2002. Speed
dependence of averaged EMG profiles in walking. Gait and Posture
16, 78–86.
Holmes, A.P., Friston, K.J., 1998. Generalisability, random effects and
population inference. NeuroImage 7, S754.
Keller, T.S., Weisberger, A.M., Ray, J.L., Hasan, S.S., Shiavi, R.G.,
Spengler, D.M., 1996. Relationship between vertical ground reaction
force and speed during walking, slow jogging, and running. Clinical
Biomechanics 11 (5), 253–259.
Ker, R.F., Bennett, M.B., Bibby, S.R., Kester, R.C., Alexander, R.M.,
1987. The spring in the arch of the human foot. Nature 325, 147–149.
Maintz, J.B.A., Viergever, M.A., 1998. A survey of medical image
registration. Medical Image Analysis 2 (1), 1–37.
Neptune, R.R., Sasaki, K., 2005. Ankle plantar flexor force production is
an important determinant of the preferred walk-to-run transition
speed. Journal of Experimental Biology 208, 799–808.
Pataky, T. C., Goulermas, J. Y., in press. Pedobarographic statistical
parametric mapping (pSPM): a pixel-level approach to foot pressure
image analysis. Journal of Biomechanics, doi:10.1016/j.jbiomech.
2008.04.034.
Rosenbaum, D., Becker, H.P., 1997. Plantar pressure distribution
measurements: technical background and clinical applications. Foot
and Ankle Surgery 3, 1–14.
Rosenbaum, D., Hautmann, S., Gold, M., Claes, L., 1994. Effects of
walking speed on plantar pressure patterns and hindfoot angular
motion. Gait and Posture 2, 191–197.
Segal, A., Rohr, E., Orendurff, M., Shofer, J., O’Brien, M., Sangeorzan, B.,
2004. The effect of walking speed on peak plantar pressure. Foot and
Ankle International 25 (12), 926–933.
Taylor, A.J., Menz, H.B., Keenan, A.M., 2004. The influence of walking
speed on plantar pressure measurements using the two-step gait
initiation protocol. Foot 14, 49–55.
Warren, G.L., Maher, R.M., Higbie, E.J., 2004. Temporal patterns of
plantar pressure and lower-leg muscle activity during walking: effect of
speed. Gait and Posture 19, 91–100.
Yang, S., Chiu, Y. L., Lin, C. C., Chen, Y. H., 2005. Influence of walking
speed to the peak plantar pressure response. In: Seventh Symposium
on Footwear Biomechanics, Cleveland, USA (unpublished abstract).
Zatsiorsky, V.M., Werner, S.L., Kaimin, M.A., 1994. Basic kinematics of
walking: step length and step frequency, a review. Journal of Sports
Medicine and Physical Fitness 34, 109–134.
Zhu, H., Wertsch, J.J., Harris, G.F., Alba, H.M., 1995. Walking cadence
effect on plantar pressures. Archives of Physical Medicine and
Rehabilitation 76, 1000–1005.