Evidence-Based Normative Data in Lumbar Flexion Control Tests; a Pilot Study
113
NORTHUMBRIA UNIVERSITY SCHOOL OF HEALTH AND LIFE SCIENCES MSc Physiotherapy (Pre-Registration) Research Dissertation ‘Evidence-Based Normative Data in Lumbar Flexion Control Tests; a Pilot Study’ Samuel Stuart BSc (Hons) 05009713 A DISSERTATION SUBMITTED IN PARTIAL FULFILMENT OF THE REQUIREMENTS OF THE DEGREE OF MASTER OF SCIENCE Words: 14,881 1 st October 2012
Transcript of Evidence-Based Normative Data in Lumbar Flexion Control Tests; a Pilot Study

NORTHUMBRIA UNIVERSITY
SCHOOL OF HEALTH AND LIFE SCIENCES
MSc Physiotherapy (Pre-Registration)
Research Dissertation
‘Evidence-Based Normative Data in Lumbar Flexion
Control Tests; a Pilot Study’
Samuel Stuart BSc (Hons)
05009713
A DISSERTATION SUBMITTED IN PARTIAL FULFILMENT OF THE
REQUIREMENTS OF
THE DEGREE OF MASTER OF SCIENCE
Words: 14,881
1st October 2012

ABSTRACT
Study Design: Descriptive pilot study.
Objectives: To develop evidence-based ‘normative’ data for range of movement (ROM)
at the hip, knee and lumbar spine during four clinical tests for lumbar flexion control.
Summary of background data: Recently several studies have highlighted movement
control dysfunction of the lumbar region as a potential diagnostic area. However,
evidence-based ‘normative’ ROM data for a ‘normal’ population has yet to be
uncovered, making lumbar control assessments difficult. This is the first study to utilize
a biomechanical device to evaluate the ROM during lumbar flexion control tests.
Methods: 20 people without LBP performed 4 clinical tests involving the control of
lumbar flexion. ROM during the tests was evaluated using electrogoniometry at the hip,
knee and lumbar spine. The lumbar spine electrode monitored flexion control and 5
degrees of lumbar flexion was classed as a loss of control. Each participant was
recorded performing the tests 3 times after being taught the tests by the researcher.
Results: Average ROM values were shown to be 10-15° less than the previously
reported values. The intra-measure and inter-rater agreement results demonstrated that
the majority of the ROM variables had moderate or above (>0.4) correlation. However,
several of the results showed poor (<0.2) to fair (>0.2 – 0.4) intra-measure agreement
and inter-rater agreement. Bland-Altman Plots showed that the majority of the ROM
differences were within 1°-10°, however there were outliers of up to 30° difference.
Therefore, there were large variations in the ROM measurements between test attempts
due to the limitations of the data collection procedures.
Conclusions: This study was not able to provide accurate ‘normative’ ROM values due
to the limitations of the methodology. However, the conclusion of this pilot study was
that the lumbar flexion control testing methodology is feasible but requires
modifications. Further study is required on the validity of the utilised motor control tests.

TABLE OF CONTENTS
1 CHAPTER 1
Introduction 1
1.1 Literature Review
1.2 Lumbar Stability 4
1.3 Pain Alteration in LBP 6
1.4 Motor Control 7
1.5 Feedback and Feed-forward Control 9
1.6 Motor Control Assessment 11
1.7 Neutral Zone 13
1.8 Reliability and Validity 14
1.9 Range of Movement 16
1.9.1 Research Objectives
2 CHAPTER 2 Methodology
2.1 Rationale 21
2.2 Study Design 21
2.3 Study sample 22
2.4 Ethics 23
2.5 Baseline Measurements 23
2.5.1 Equipment 24
2.6 Lumbar Flexion Motor Control Tests 24
2.7 Electrogoniometry: Reliability and Validity 25
2.8 Data Collection Protocol 26
2.9 Data Analysis 27
3 CHAPTER 3 Results
3.1 Baseline Measurements 30
3.2 Lumbar Flexion Control Tests 31
3.3 Intra-measure Repeatability 40
3.4 Inter-rater Agreement 43
3.5 Association of Other Parameters 44
4 CHAPTER 4 Discussion
4.1 Normative Range of Movement 47
4.2 Methodological Reliability 48

4.3 Novice-Expert Variation 50
4.4 Feed-Forward and Feedback Mechanisms 51
4.5 Skin Movement and Distraction 54
4.6 Fasciae Influence on Range of Movement 57
4.7 Lumbar Spine Neutral Zone Range of Movement 59
4.8 Associated and Compensatory Factors 60
4.9 Recommendations for Future Studies 63
5 CHAPTER 5
Conclusion 64
REFERENCES 66
List of Figures
Figure 1 – Literature Review Search Terms and Results .......................................................................... 19
Figure 2 - Waiters Bow Bland-Altman Plots (Attempt 2 and 3)…………………………………………………35
Figure 3 - Seated Knee Extension Bland-Altman Plots (Attempts 2 and 3)…………………………………..36
Figure 4 - Sitting Forward Lean Bland-Altman Plots (Attempts 2 and 3)………………………………….…..37
Figure 5 - Rocking Backwards in Four Point Kneeling Bland-Altman Plots (Attempts 2 and 3)……..…….38
Figure 6- Lumbar Spine Movement…..……………………………..……………………………………………..46
Figure 7 - Example of Lumbar Spine Electrode Placement…………………………………………….….......61
List of Tables
Table 1 - The ROM results from the review of the literature…………………………………………..……..…19
Table 2 - Study Inclusion and Exclusion Criteria…………………………………………………………….......22
Table 3 - Lumbar Flexion Control Test Procedures…………………………………………………..………….25
Table 4 - Data Collection Procedure……………………………………………………………………..………..27
Table 5 - Baseline Measurements…………………………………………………………………………..........31
Table 6 - Average Number of Test Attempts….……………………………………………………………..…. 31
Table 7 - Summary of Descriptive Data for Lumbar Flexion Control Test ROM (Attempts 1 -3)................34
Table 8 - Summary of Intra-measure Data for Lumbar Flexion Control Tests (Attempts 2-3)……………...39
Table 9- Inter-Rater ROM Agreement for Lumbar Flexion Tests (attempts 1-3)........................................43
Table 10 - Spearman’s Correlations for Hamstring Length (LKEA), Body Mass Index (BMI), Age and Joint
ROM (Attempts 1-3)....................................................................................................................................45

List of Appendices
Appendix 1.0 Data Collection Protocol ................................................................................................... ….84
Appendix 3.0 Data Analysis Procedure………………………………………………………………………..….86
Appendix 4.0 Baseline Measures Raw Data………………………………………………………………..……90
Appendix 5.0 Inter-Rater Agreement Raw Data…………………………………………………………..……..91
Appendix 6.0 Electorgoniometry Kit and Placement Examples……………………….................................92
Appendix 7.0 Other Associated Parameters (LKEA, BMI, Age and Joint ROM)……………………….…….95

Key: MCD; Motor Control Dysfunction, WB; Waiters Bow, SKE; Seated Knee Extension, SFL; Sitting
Forward Lean, RBFPK; Rocking Back in Four Point Kneeling, ROM; Range of Movement, EG;
Electrogoniometry, KROM; Knee ROM, HROM; Hip ROM, LSROMLOC; Lumbar Spine ROM to the point
of Loss of Control, TLSROM; Total Lumbar Spine ROM, LHROM; Lateral Hip ROM, LLSROM; Lateral
Lumbar Spine ROM.
1 Chapter 1
1 Chapter 1
Introduction
Low back pain (LBP) has become a huge financial and social burden in modern
society, with up to 90% of LBP being classified as non-specific LBP (Luomajoki et al,
2007). Non-specific LBP is a diagnosis that means that in medical terms the cause is
unclear and this makes physiotherapy treatment difficult (Tidstrand and Horneij, 2009).
There remains no clear diagnostic clinical test and no treatment has been consistently
effective in reducing typical symptoms, limitations and diability associated with LBP
(Luomajoki et al. 2007, Enoch et al. 2011, Henry et al. 2012). Luomajoki et al. (2007)
stated that sub-groups of LBP classification have been proposed and a classification
system of this nature is the future of LBP diagnosis, treatment and management.
However, in order to be applied to practice a classification system must be reliable,
feasible, generalizable and valid (Henry et al. 2012). Currently there still remains an
absence of specific pathoanatomical diagnosis, as the cause of LBP remains a complex
multi-factorial debate, which involves many factors e.g. genetics, environment,
biopsychosocial issues etc. Therefore, several researchers have called for sub-groups
of LBP based on clinical symptoms and features in order to give specific treatment
(Luomajoki et al. 2007, Henry et al. 2012, Hoffman et al. 2012). As a result, a number of
diagnostic assessment processes have been developed to aid in the diagnosis of LBP
patients’ (Enoch et al., 2011, Luomajoki et al. 2008, O’Sullivan, 2005).
Recently several studies have highlighted the assessment of static and dynamic ‘motor
control’ of the lumbar spine as a possible area for physiotherapeutic clinical diagnosis of
LBP (Enoch et al. 2011, Luomajoki et al. 2007, 2008, Tidstrand and Horneij, 2009, Suni
et al. 2006, Ben-Masaud et al. 2009, Paatelma, Karvonen and Heinonen, 2010).
Luomajoki et al. (2007) reported that motor control dysfunction has several widely used

Key: MCD; Motor Control Dysfunction, WB; Waiters Bow, SKE; Seated Knee Extension, SFL; Sitting
Forward Lean, RBFPK; Rocking Back in Four Point Kneeling, ROM; Range of Movement, EG;
Electrogoniometry, KROM; Knee ROM, HROM; Hip ROM, LSROMLOC; Lumbar Spine ROM to the point
of Loss of Control, TLSROM; Total Lumbar Spine ROM, LHROM; Lateral Hip ROM, LLSROM; Lateral
Lumbar Spine ROM.
2 Chapter 1
synonyms for motor control diagnosis i.e. movement control dysfunction, movement
impairment syndromes, motor control dysfunctions and relative flexibility. In this study
we will use the term motor control dysfunction (MCD).
Murphy et al. (2006) stated that the disruption of the stability system of the spine
during dynamic movements occurs in LBP patients. Motor control is required to maintain
spinal stability to ensure protection of the spine and prevention of injury. Several studies
have demonstrated the importance of spinal stabilization within its neutral zone, as well
as altered muscle activation and recruitment within LBP onset and reoccurrence.
Inappropriate motor control leads to inefficient spinal stabilization, which perpetuates
LBP as subjects with motor control dysfunction are unknowingly damaging themselves
through faulty movement patterns (Murphy et al. 2006, Luomajoki et al. 2007). Motor
control dysfunction (MCD) has been described as having several different components
but a common aspect is a reduced control of active movement (Luomajoki et al. 2007),
which leads to excessive movement, tissue damage and chronic LBP (O’Sullivan,
2005). The complex anatomy of the lumbar region and the movement demands placed
on it create a challenge for specific physiotherapeutic diagnosis. Motor control of the
lumbar spine can be biomechanically tested with particular trunk and limb movements
(Enoch et al. 2011). Comerford and Mottram (2012) stated that to have dysfunctional
motor control a subject must fall outside of the ‘normal’ range of movement for a
particular test. However, there remains no clear consensus for ‘normal’ ROM during
MCD tests and the ‘normal’ ROM’s reported are based upon expert opinion rather than
an objective evidence base.
The detection of uncontrolled movement is a key competence of physiotherapy and
the examination processes involved have been investigated for reliability and validity in

Key: MCD; Motor Control Dysfunction, WB; Waiters Bow, SKE; Seated Knee Extension, SFL; Sitting
Forward Lean, RBFPK; Rocking Back in Four Point Kneeling, ROM; Range of Movement, EG;
Electrogoniometry, KROM; Knee ROM, HROM; Hip ROM, LSROMLOC; Lumbar Spine ROM to the point
of Loss of Control, TLSROM; Total Lumbar Spine ROM, LHROM; Lateral Hip ROM, LLSROM; Lateral
Lumbar Spine ROM.
3 Chapter 1
several studies (Enoch et al. 2011, Luomajoki et al. 2007, 2008, Dankaerts et al. 2006,
Henry et al. 2012). These studies evaluated the reproducibility of the MCD tests
involved and the majority showed satisfactory reproducibility. Reliable observation of
motor control of the lumbar region is important as it aids clinical reasoning, but it
remains difficult to visually assess lumbar movement during MCD testing without
biomechanical equipment (Enoch et al. 2011, Luomajoki et al. 2008). Therefore, there
remains a need for MCD tests with reproducible quantitative methods utilizing
biomechanical devices. Clinical reasoning is an important factor in all physiotherapy
areas and is a key factor in musculoskeletal physiotherapy. Performing accurate
assessments which are evidence based allows practitioners to develop and prescribe
rehabilitation which is accurate, while being as effective as possible (Mottram and
Comerford, 2008). However, Enoch et al. (2011) stated that there remains no clear
consensus as to the ‘normal’ cut-off points for the MCD tests. The lack of a quantitative
evidence-base for ‘normal’ range of movement during motor control dysfunction tests
leads to variability in the descriptions of the tests (Enoch et al. 2011), which makes it
increasingly difficult for inexperienced practitioners to perform accurate assessments. It
would therefore be of benefit for clinicians to have a simple, valid, reliable and
reproducible testing method capable of detecting MCD (Murphy et al. 2006).
The overall aim of this study was to determine the ‘normal’ ROM values for several
motor control dysfunction tests. Therefore a pilot study was performed to acquire
quantitative ROM data using a biomechanical device from individuals without LBP
during four lumbar flexion control tests (i.e. waiters bow, seated knee extension, sitting
forward lean and rocking backwards in four point kneeling). A pilot study was performed
to provide valuable information for the planning and justification of larger studies into

Key: MCD; Motor Control Dysfunction, WB; Waiters Bow, SKE; Seated Knee Extension, SFL; Sitting
Forward Lean, RBFPK; Rocking Back in Four Point Kneeling, ROM; Range of Movement, EG;
Electrogoniometry, KROM; Knee ROM, HROM; Hip ROM, LSROMLOC; Lumbar Spine ROM to the point
of Loss of Control, TLSROM; Total Lumbar Spine ROM, LHROM; Lateral Hip ROM, LLSROM; Lateral
Lumbar Spine ROM.
4 Chapter 1
motor control assessments (Lancaster, Dodd and Williamson, 2002). Lumbar flexion
control was assessed in this study, as Paatelma, Karvonen and Heinonen (2010)
showed lumbar flexion during motor control dysfunction (MCD) testing was clinically
significant. An experimental methodology was developed using electrogoniometry to
evaluate evidence-based normative ROM at the hip, knee and lumbar spine when
performing the above clinical tests. The obtained data provides a methodology to create
evidence-based rather than expert-opinion based guidelines for conducting lumbar
flexion control tests.
1.1 Literature Review
1.2 Lumbar stability
Lumbar spine stability is important, as the lumbar region passes forces from the torso
to the lower limbs during both active and passive movements (Wagner et al. 2005,
Nakipoglu, Karagöz, Özgirgin, 2008). Several studies have stated that three
subsystems are important in maintaining spinal stability; passive (ligaments and spinal
column) active (muscles and fasciae) and control (central and peripheral nervous
system) (Panjabi, 2003, Wagner et al. 2005, Gibson and McCarron, 2004).
Luomajoki et al. (2007) stated that clinical instability and motor control are closely
linked. Similarly, Cook et al. (2006) reported that 88% of specialist LBP physiotherapists
believed that abnormal movement patterns are the main finding in clinical instability.
Originally instability was described by Pope and Panjabi (1985) as ‘’a mechanical entity
and an unstable spine is one that is not in an optimal state of equilibrium’’ and
furthermore ‘’stability is affected by restraining structures that if damaged will lead to
altered equilibrium and thus instability’’. Mulholland (2008) reported that Panjabi

Key: MCD; Motor Control Dysfunction, WB; Waiters Bow, SKE; Seated Knee Extension, SFL; Sitting
Forward Lean, RBFPK; Rocking Back in Four Point Kneeling, ROM; Range of Movement, EG;
Electrogoniometry, KROM; Knee ROM, HROM; Hip ROM, LSROMLOC; Lumbar Spine ROM to the point
of Loss of Control, TLSROM; Total Lumbar Spine ROM, LHROM; Lateral Hip ROM, LLSROM; Lateral
Lumbar Spine ROM.
5 Chapter 1
originally believed instability was caused by a loss of stiffness. However, Gibson and
McCarron (2004) stated that to maintain the equilibrium a subsystem (passive, active or
control) can compensate for a defective subsystem to create spinal stiffness and
decrease the spinal neutral zone (NZ).
Panjabi (1992a, b) introduced the concept of the NZ; describing it as ‘a region of inter-
vertebral motion around the neutral posture where little resistance is offer by the
passive spinal column’. Although in 2003 Panjabi refined his theory and stated that
three areas contribute to the development of LBP; ‘joint stabilisation within its NZ, inter-
segmental instability and altered recruitment patterns of stabilising muscles’. However,
Panjabi (2003) declared that controversy remained over the definition of spinal
instability, but stated that it is commonly defined as ‘’the loss of normal pattern of spinal
motion causing pain and/or neurologic dysfunction’’. Similarly, Sahrmann (2002)
believed that movement occurs through a pathway of least resistance and that if
another a joining area (e.g. the hip) is stiff compared to the lumbar region then
excessive movement will occur in the lower back leading to LBP.
Mulholland (2008) wrote that after the nineties instability became the term used to
denote a diagnosis of abnormal patterns of movement, which usually had increased
ROM. McGill (2007) believed that structural instability which can be found on
radiological examination is rare and this lead to the term instability being used instead of
clinical instability. However, O’Sullivan (2005) defined MCD as “a back problem that
behaves like clinical instability but has no radiological findings”, which is a similar
definition as that of clinical instability given by McGill (2007) (i.e. ‘clinical patterns like
instability but not verifiable by radiography’). Mulholland (2008) stated that Panjabi had
changed his views towards instability after the nineties, as in 2004 Panjabi et al. created

Key: MCD; Motor Control Dysfunction, WB; Waiters Bow, SKE; Seated Knee Extension, SFL; Sitting
Forward Lean, RBFPK; Rocking Back in Four Point Kneeling, ROM; Range of Movement, EG;
Electrogoniometry, KROM; Knee ROM, HROM; Hip ROM, LSROMLOC; Lumbar Spine ROM to the point
of Loss of Control, TLSROM; Total Lumbar Spine ROM, LHROM; Lateral Hip ROM, LLSROM; Lateral
Lumbar Spine ROM.
6 Chapter 1
a new hypothesis for chronic LBP abandoning instability altogether and stating that
damage to ligaments causes pain which leads to MCD. Recently researchers such as
Demoulin et al. (2007) and Enoch et al. (2011) have developed Panjabi’s theories
stating that instability causes tissue damage and leads to MCD.
1.3 Pain Alteration in LBP
LBP often occurs due to harmful loading of the spine causing initial tissue damage,
which causes pain (Wrigley et al. 2005). In the view of Panjabi (2006), Lederman (2011)
and O’Sullivan (2005) motor control dysfunction is a secondary condition caused by
tissue damage (i.e. ligament damage) which causes pain. O’Sullivan (2005) stated that
therefore MCD’s are present in Chronic LBP (CLBP) disorders, which fuelled research
into assessment of motor control of the lumbar region. This focus coincided with the
recognition of the need for early intervention aimed at preventing recurrence of LBP and
the development of CLBP disorders (Suni et al. 2006, O’Sullivan, 2005, Enoch et al.
2011). Lederman (2011) stated that many of the clinical examinations for assessing
posture, structure or biomechanical factors have no value in explaining why patients
develop their condition and are therefore redundant. However, Hodges (2011) stated
that altered, dysfunctional movement due to pain is the target for clinical interventions.
In the view of Hodges (2011) the initial pain from injury causes adaptation to prevent
further pain, which leads to motor control dysfunction (i.e. excessive movement, altered
muscle recruitment etc.). Rather than the pain-spasm-pain model which would state that
pain causes hyperactivity or spasm which leads to more pain (Williams, Haq, Lee,
2010). However, this ‘protective adaptation mechanism’ while having short term benefit

Key: MCD; Motor Control Dysfunction, WB; Waiters Bow, SKE; Seated Knee Extension, SFL; Sitting
Forward Lean, RBFPK; Rocking Back in Four Point Kneeling, ROM; Range of Movement, EG;
Electrogoniometry, KROM; Knee ROM, HROM; Hip ROM, LSROMLOC; Lumbar Spine ROM to the point
of Loss of Control, TLSROM; Total Lumbar Spine ROM, LHROM; Lateral Hip ROM, LLSROM; Lateral
Lumbar Spine ROM.
7 Chapter 1
(i.e. pain relief) has long-term consequences such as decreased ROM and increased
load.
Pain induces pathological changes in ‘motor control’ through an adaptive process, as
activity is redistributed throughout the muscles (Hodges, 2011, O’Sullivan, 2005).
Secondary to motor control changes are later changes in the surrounding
musculoskeletal structures, as the motor control system alters muscle recruitment
patterns in an attempt to compensate for instability and pain (Ben-Masuad et al. 2009).
Marras et al. (2001) stated that changes in muscle recruitment patterns can significantly
affect loading on passive structures (i.e. inter-vertebral joints, ligaments etc.), inducing
LBP or musculoskeletal damage (Renkawitz et al. 2006). Several researchers believe
that control of muscle co-ordination allows for stability of the lumbar region and for the
lumbar region to take the huge force loads applied to it during activities of daily life
(Enoch et al. 2011, Hall et al. 2009, Granata and Orishimo, 2001). O’Sullivan (2005)
and Hodges and Moseley (2003) believed that CLBP develops as a result of altered
motor control (i.e. muscle co-ordination, altered proprioception and lack of active
movement control) which provides a basis for peripherally driven nociceptor
sensitisation.
1.4 Motor Control
Panjabi (2003) stated that neural control mechanisms represent motor control. The
CNS has a large input into motor control dysfunction, as it controls all movements,
postures and muscular activation. Structural and peripheral mechanisms may give an
explanation for the cause of CLBP, but the role of the central nervous system (CNS)
and neural control systems are important aspects to consider in MCD assessments.

Key: MCD; Motor Control Dysfunction, WB; Waiters Bow, SKE; Seated Knee Extension, SFL; Sitting
Forward Lean, RBFPK; Rocking Back in Four Point Kneeling, ROM; Range of Movement, EG;
Electrogoniometry, KROM; Knee ROM, HROM; Hip ROM, LSROMLOC; Lumbar Spine ROM to the point
of Loss of Control, TLSROM; Total Lumbar Spine ROM, LHROM; Lateral Hip ROM, LLSROM; Lateral
Lumbar Spine ROM.
8 Chapter 1
Where muscular or passive stability is compromised further strain may be placed on the
neurological structures, which further exacerbates the instability (van Vliet and
Heneghan, 2006). Understanding motor control is of importance in not only the
management of patients with damaged CNS, but also in the management of
musculoskeletal dysfunction in patients with intact CNS (van Vliet and Henegham,
2006). Therefore, all clinicians involved in assessment and management of LBP should
have a good understanding of the motor control processes involved in maintaining
spinal stability (Comerford and Mottram, 2001a).
The commands for muscular activation are stored as cortical maps within the CNS and
transmitted through peripheral nerves to the muscles. Activity is based on learning
which in the view of Shumway-cook and Woollacot (2001) is developed by repetition
and habituation. Therefore, after an initial injury neural pathways adapt and repeated
dysfunctional movements become automatic. At the same time previous actions and
controls become inefficient and slower (Comerford and Mottram, 2012). In the view of
Comerford and Mottram (2012) this process is an aspect of their uncontrolled range of
movement dysfunction loop. Their dysfunction loop includes; inefficient local and global
muscle recruitment, inhibition of motor unit recruitment, dimished proprioception, pain
and pathology, movement control dysfunction (i.e. uncontrolled ROM), which all create
abnormal strategies and dysfunction. Several studies have provided evidence
supporting altered muscle recruitment (Hodges and Moseley, 2003, Wagner et al.
2005), delayed muscle activation (Massé-Alarie et al. 2012) and increased activity of
global muscles of the lumbo-pelvic region in LBP patients (Hodges et al. 2003,
Comerford and Mottram, 2001a). Cook et al. (2006) also stated that poor co-ordination,

Key: MCD; Motor Control Dysfunction, WB; Waiters Bow, SKE; Seated Knee Extension, SFL; Sitting
Forward Lean, RBFPK; Rocking Back in Four Point Kneeling, ROM; Range of Movement, EG;
Electrogoniometry, KROM; Knee ROM, HROM; Hip ROM, LSROMLOC; Lumbar Spine ROM to the point
of Loss of Control, TLSROM; Total Lumbar Spine ROM, LHROM; Lateral Hip ROM, LLSROM; Lateral
Lumbar Spine ROM.
9 Chapter 1
proprioception deficits and loss of control over active movements were important in
MCD assessment.
Luomajoki et al. (2007, 2010) stated that the motor control of individual muscles is
linked to MCD. Recent epidemiological studies have shown that the key stabilizing
muscles for the lumbar spine are the transverse abdominus (TrA) and the multifidus
(MF) (Richardson et al. 2004, Hides et al. 2010, Hides et al. 2011, Biely, Smith and
Silfies, 2006, Kavcic, Grenier and McGill, 2004). Kavcic, Grenier and McGill (2004)
showed that TrA and MF activation is linked, forming a ‘corset’ around the waist
(Danneels et al. 2001, Hides et al. 2001, McGill, 2007). Muscular activation causes
fasciae tensioning and extensor moments which support spinal stability (McGill, 2007,
Barker et al. 2004, Tesh et al. 1987, Hodges and Richardson, 1997). However, debate
remains over the combination of global (e.g. erector spinae group) and local (e.g. TrA,
MF) in rehabilitation or isolation of local deep muscles (e.g. TrA). As a result many
rehabilitation programmes have been developed in order to address different aspects of
motor control dysfunction (Hides et al. 2004, Goldby et al. 2006, Hall et al. 2009).
Therefore, with an increase in the focus on motor control as an area for intervention it is
important that the initial clinical assessments for motor control are accurate.
1.5 Feedback and Feed-forward Control
The neuromuscular stability of the lumbar spine is controlled by the CNS. Pain free
dynamic movement involves a combination of feed-forward (open loop) and feed-back
(closed loop) control of trunk stability (Zeinali-Davarani, et al. 2008, Desmurget and
Grafton, 2000), which can be assessed using electromyography (EMG).

Key: MCD; Motor Control Dysfunction, WB; Waiters Bow, SKE; Seated Knee Extension, SFL; Sitting
Forward Lean, RBFPK; Rocking Back in Four Point Kneeling, ROM; Range of Movement, EG;
Electrogoniometry, KROM; Knee ROM, HROM; Hip ROM, LSROMLOC; Lumbar Spine ROM to the point
of Loss of Control, TLSROM; Total Lumbar Spine ROM, LHROM; Lateral Hip ROM, LLSROM; Lateral
Lumbar Spine ROM.
10 Chapter 1
As previously discussed in this section adaptation may be caused by pain from an
initial injury which may cause inhibition of feed-forward mechanisms (Hodges et al.
2003). In the view of van Vliet and Henegham (2006) the primary motor cortex is
functionally organized, which means that practice will invoke a change in response.
Within all subjects (i.e. LBP and non-LBP) even small amounts of practice can create
cortical changes due to improvements in the efficiency of existing synapses which
become stronger. With increased practice comes change in the balance of excitation
and inhibition which is possibly responsible for anatomical changes in synaptic
organization and is an important factor in cortical plasticity with rehabilitation (van Vliet
and Henegham, 2006). Braun et al. (2001) reported that well learned tasks have pre-
existing cortical maps which are functionally organized, which the somatosensory cortex
activates depending on the specific task requirements. Flor (2003) demonstrated that
there are changes in these cortical maps in back pain subjects, with increased
representation of nociceptive information (i.e. nociceptor sensitization) and cortical
excitation. Therefore, an understanding of task or movement specific motor control is
important and how afferent information is integrated with feed-forward and feedback
mechanisms (van Vliet and Henegham, 2006).
Feed-forward mechanisms have been shown to be compromised in trunk muscles of
patients with LBP (Hodges, 2001 and Hodges et al. 2003). Falla et al. (2004) reported
that neck muscle activation during flexion was significantly delayed in patients with
chronic neck pain. Similarly, Rabebold et al. (2001) reported delayed muscle response
in chronic LBP and this was associated with impaired postural control of the lumbar
spine. Feed-forward activity creates anticipatory trunk muscle activation in non-LBP
subjects, which is influenced by all afferent information i.e. nociceptive information,

Key: MCD; Motor Control Dysfunction, WB; Waiters Bow, SKE; Seated Knee Extension, SFL; Sitting
Forward Lean, RBFPK; Rocking Back in Four Point Kneeling, ROM; Range of Movement, EG;
Electrogoniometry, KROM; Knee ROM, HROM; Hip ROM, LSROMLOC; Lumbar Spine ROM to the point
of Loss of Control, TLSROM; Total Lumbar Spine ROM, LHROM; Lateral Hip ROM, LLSROM; Lateral
Lumbar Spine ROM.
11 Chapter 1
altered proprioception, muscle length and muscle tension (van Vliet and Heneghan,
2006). However, there has been little research on the implications of altered feed-
forward mechanisms in LBP subjects or patients with dysfunction. It is believed that
practitioners should know the ‘normal’ feed-forward activity that would occur during the
movement being performed by the subject in order to evaluate the risks of LBP
reoccurrence and provide appropriate rehabilitation (van Vliet and Heneghan, 2006).
There have been a number of studies which have suggested the use of management
programmes for individual muscle retraining and rehabilitation of the lumbar muscles,
but there are none evaluating rehabilitation of feed-forward lumbar control.
1.6 Motor Control Assessment
Clinical tests for motor control are based on the idea of dissociation (Sahrmann, 2002,
Comerford and Mottram, 2012). Dissociation is the ability to activate muscles
isometrically to hold positions or preventing motion in particular segments, while moving
an adjacent segment. Trunk dissociation has been previously assessed using the prone
knee extension test (Woolsey, Sahrmann and Dixon, 1988), which measures the same
activity as when performing backwards rocking in 4 point kneeling (Stevens et al. 2007).
However, there are currently a range of clinical tests for lumbar motor control.
There remains no single sign or physical examination for motor control (Biely, Smith
and Silfies, 2006). Therefore, it is said to be important to have a range of motor control
assessments in order to make a reliable comprehensive clinical judgement about a
patient’s control (Comerford and Mottram, 2001b, Tidstrand and Horneij, 2009).
Comerford and Mottram (2001b) believed that functional testing for ‘normal function’
patterns is a fundamental part of motor control assessments. Mottram and Comerford

Key: MCD; Motor Control Dysfunction, WB; Waiters Bow, SKE; Seated Knee Extension, SFL; Sitting
Forward Lean, RBFPK; Rocking Back in Four Point Kneeling, ROM; Range of Movement, EG;
Electrogoniometry, KROM; Knee ROM, HROM; Hip ROM, LSROMLOC; Lumbar Spine ROM to the point
of Loss of Control, TLSROM; Total Lumbar Spine ROM, LHROM; Lateral Hip ROM, LLSROM; Lateral
Lumbar Spine ROM.
12 Chapter 1
(2008) stated that everyone should have the ability to perform movement patterns which
are unfamiliar to them i.e. outside of ‘normal function’. Performance within these
movement patterns gives physiotherapists tests for motor control (Comerford and
Mottram, 2003). However, Enoch et al. (2011) reported that there remains a need for
more precise test descriptions, with more quantitative and reproducible methods for
measuring motor control. The clinical tests currently utilised by physiotherapist are
based on previous studies which define a clinical judgment via can or cannot, yes or no
and pass or fail. Between these points Enoch et al. (2011) believed that valuable data is
lost and there remains no clear consensus for when particular tests are passed or
failed. Murphy et al. (2006) believed that consensus is difficult as currently
physiotherapists identify dysfunctions using tests which only ‘experienced’ professionals
feel confident in.
Sterling, Jull and Wright (2001) stated that some practitioners who deal with
musculoskeletal pain are able to notice altered movement patterns and controls, but
some changes in motor control are less apparent. Enoch et al. (2011) also identified
that it is clinically difficult to visually estimate how much movement occurs in the lumbar
region during motor control tests without the use of technical equipment (i.e. ultrasound,
electromyography, electrogoniometry, MRI etc.). Similar to this, previous studies of
motor control around the lumbo-pelvic complex have concluded that using
biomechanical equipment could provide much needed quantitative data (O’Sullivan,
2005, Fritz, Erhard and Hagen, 1998, Paatelma, Karvonen, Heinonen, 2010). McGill et
al. (2003) recognised that there is a need for biomechanical analysis of the control of
stability of the lumbar spine, as the biomechanical processes involved may require
particular interventions to prevent chronic LBP development (Suni et al., 2006).

Key: MCD; Motor Control Dysfunction, WB; Waiters Bow, SKE; Seated Knee Extension, SFL; Sitting
Forward Lean, RBFPK; Rocking Back in Four Point Kneeling, ROM; Range of Movement, EG;
Electrogoniometry, KROM; Knee ROM, HROM; Hip ROM, LSROMLOC; Lumbar Spine ROM to the point
of Loss of Control, TLSROM; Total Lumbar Spine ROM, LHROM; Lateral Hip ROM, LLSROM; Lateral
Lumbar Spine ROM.
13 Chapter 1
1.7 The Neutral Zone
Comerford and Mottram (2012) described the NZ as important because the
establishment of a ‘neutral training region’ is fundamental to the MCD assessment
process. The most important aspect of a lumbar MCD test is the ability for a patient to
maintain the neutral lumbar position during the test (Comerford and Mottram, 2012).
Several studies have stated that appropriate motor control (i.e. muscular coordination
etc.) allows the spine to stay within its NZ and maintain stability reducing LBP onset and
reoccurrence (Enoch et al. 2011, Suni et al. 2006, Panjabi, 2003, 2006, Tidstrand and
Horneij, 2009). The control of the NZ has been recognized by many studies as
important in the prevention and management of LBP. Panjabi (1992b) and Enoch et al.
(2011) believed that the control of ROM at the NZ was more relevant to LBP than
maximal end range values. Suni et al. (2006) stated that the control of the lumbar NZ
involves a biomechanical approach and therefore studies have focused on
biomechanical assessment.
The NZ has been measured using in vitro stepwise testing for the past 20+ years,
which has shown that during flexion-extension testing; 4.8° of movement occurs in the
NZ during flexion of the LS (Goertzen, Lane and Oxland, 2004). However, other
researchers have shown that NZ ROM is variable. Yamamoto et al. (1989) stated that
NZ ROM ranged from 5° to 10° depending on the segment, with L5/S1 having the
greatest NZ ROM. A more recent study by Gay et al. (2006) demonstrated that with
loading the lumbar NZ was smaller with a range from 0.78° to 2.11°, which is similar to
the in vitro work of Panjabi et al. (2004) who stated that LS neutral zone ROM with 8mn
of loading was only 0.93° during flexion. Although, previously Panjabi (1992b) stated
that during flexion the lumbar NZ was 1.5°, the elastic zone (EZ) was up to 6.1° and

Key: MCD; Motor Control Dysfunction, WB; Waiters Bow, SKE; Seated Knee Extension, SFL; Sitting
Forward Lean, RBFPK; Rocking Back in Four Point Kneeling, ROM; Range of Movement, EG;
Electrogoniometry, KROM; Knee ROM, HROM; Hip ROM, LSROMLOC; Lumbar Spine ROM to the point
of Loss of Control, TLSROM; Total Lumbar Spine ROM, LHROM; Lateral Hip ROM, LLSROM; Lateral
Lumbar Spine ROM.
14 Chapter 1
ROM was 7.6°. He also described that ROM between L5 and S1 during flexion was as
follows; NZ 3°, EZ 7° and ROM 10°. The above evidence shows that there is debate on
the ROM made in the NZ during flexion, therefore monitoring of the lumbar spine during
MCD tests is a key requirement.
1.8 Reliability and Validity
Physiotherapists currently use various models to deal with LBP disorders i.e. Motor
control model (O’Sullivan, 2005, Vibe Fersum et al., 2009). However, all models involve
the application of accurate clinical examinations. Reliable and valid assessments of
motor control dysfunction of the lumbar spine in patients with and without LBP are vital
in order to aid clinical decisions (Luomajoki et al. 2008). Recently several studies by
Enoch et al. (2011), White and Thomas (2002), Dankaerts et al. (2006) and Luomajoki
et al. (2007) showed that there was good inter and intra-rater reliability when using
certain clinical tests for motor control dysfunctions, although their results rely on the
concept of ‘expert opinion’. Even though these studies reported satisfactory to
substantial inter-rater reliability, specific ‘normal’ ROM values for joints (e.g. Lumbar
spine, hip and knee) during motor control dysfunction tests have received no attention
(Enoch et al. 2011).
Luomajoki et al. (2008) stated that there has been little evidence to denote a difference
between movement patterns in people with or without LBP as much of the research is
based solely on clinical observation of movement (i.e. subjective evaluation). Luomajoki
et al. (2008) therefore created a hypothesis that impaired motor control and
physiotherapists’ lack of knowledge about motor control assessment perpetuates LBP.
This is similar to research by Enoch et al. (2011) and Dankaerts et al. (2006) who
Key: MCD; Motor Control Dysfunction, WB; Waiters Bow, SKE; Seated Knee Extension, SFL; Sitting
Forward Lean, RBFPK; Rocking Back in Four Point Kneeling, ROM; Range of Movement, EG;
Electrogoniometry, KROM; Knee ROM, HROM; Hip ROM, LSROMLOC; Lumbar Spine ROM to the point
of Loss of Control, TLSROM; Total Lumbar Spine ROM, LHROM; Lateral Hip ROM, LLSROM; Lateral
Lumbar Spine ROM.
15 Chapter 1
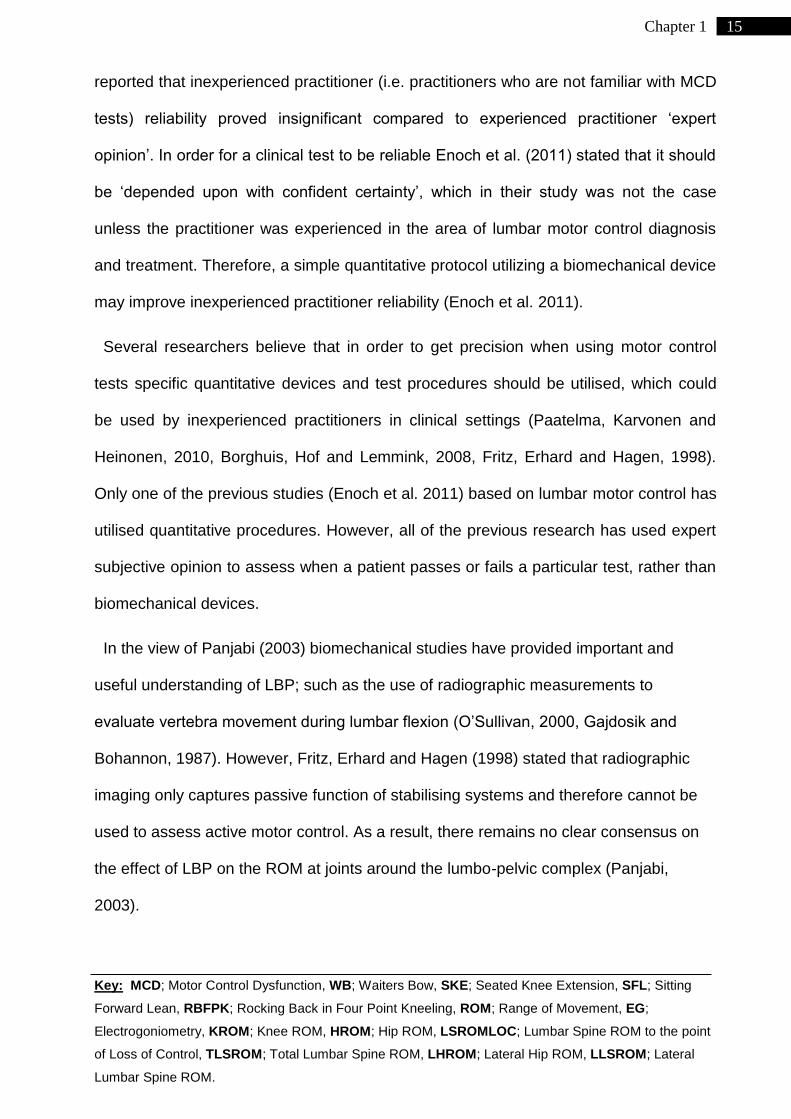
reported that inexperienced practitioner (i.e. practitioners who are not familiar with MCD
tests) reliability proved insignificant compared to experienced practitioner ‘expert
opinion’. In order for a clinical test to be reliable Enoch et al. (2011) stated that it should
be ‘depended upon with confident certainty’, which in their study was not the case
unless the practitioner was experienced in the area of lumbar motor control diagnosis
and treatment. Therefore, a simple quantitative protocol utilizing a biomechanical device
may improve inexperienced practitioner reliability (Enoch et al. 2011).
Several researchers believe that in order to get precision when using motor control
tests specific quantitative devices and test procedures should be utilised, which could
be used by inexperienced practitioners in clinical settings (Paatelma, Karvonen and
Heinonen, 2010, Borghuis, Hof and Lemmink, 2008, Fritz, Erhard and Hagen, 1998).
Only one of the previous studies (Enoch et al. 2011) based on lumbar motor control has
utilised quantitative procedures. However, all of the previous research has used expert
subjective opinion to assess when a patient passes or fails a particular test, rather than
biomechanical devices.
In the view of Panjabi (2003) biomechanical studies have provided important and
useful understanding of LBP; such as the use of radiographic measurements to
evaluate vertebra movement during lumbar flexion (O’Sullivan, 2000, Gajdosik and
Bohannon, 1987). However, Fritz, Erhard and Hagen (1998) stated that radiographic
imaging only captures passive function of stabilising systems and therefore cannot be
used to assess active motor control. As a result, there remains no clear consensus on
the effect of LBP on the ROM at joints around the lumbo-pelvic complex (Panjabi,
2003).

Key: MCD; Motor Control Dysfunction, WB; Waiters Bow, SKE; Seated Knee Extension, SFL; Sitting
Forward Lean, RBFPK; Rocking Back in Four Point Kneeling, ROM; Range of Movement, EG;
Electrogoniometry, KROM; Knee ROM, HROM; Hip ROM, LSROMLOC; Lumbar Spine ROM to the point
of Loss of Control, TLSROM; Total Lumbar Spine ROM, LHROM; Lateral Hip ROM, LLSROM; Lateral
Lumbar Spine ROM.
16 Chapter 1
1.9 Range of Movement
Clinical observation of ROM is an integral aspect of any motor control test and
accurate objective measurement and interpretation of that measurement results in the
use and development of interventions (Gajdosik and Bohannon, 1987, O’Sullivan, 2005,
Comerford and Mottram, 2001b). Electrogoniometry (EG) technology has been
developed to measure joint ROM in clinical and research settings due to its clinical
application (Wang et al. 2011). In the past EG has been used to clinically evaluate the
end ROM of the lumbar spine in different populations, but no studies have assessed the
ROM made during motor control tests (Intolo et al. 2009, Marras and Wongsam, 1986).
Comerford and Mottram (2001a) stated that during the sitting forward lean test ‘normal’
individuals will be able to maintain a spinal neutral position within 30º of hip flexion
(Table 1), which was based on results of early work by Woolsey, Sahrmann and Dixon
(1988) and Marras and Wongsam (1986). However, Marras and Wongsam (1986) only
assessed lumbar flexion end ranges, which Bible et al. (2010) showed are never
actually achieved during functional activities. In the view of Enoch et al. (2011) clinical
tests should concentrate on motor control in smaller aspects e.g. until anterior pelvic tilt
is observed. Enoch et al. (2011) stated that testing for end range movement misses out
valuable data needed to create cut-off points for a normal population e.g. velocities,
maintenance of spinal neutral zone, flexibility, influence of age, gender, knee angle etc.
Several studies have shown that flexibility of the hamstrings and knee angles during
lumbar flexion tests have an influence on the observed ROM at the lumbar spine
(Borman, Trudelle-Jackson and Smith, 2011, Carregaro and Gilcoury, 2009, Shin et al.
2004, Marras and Wongsam, 1986). Also, Intolo et al. (2009) proved that increasing age
decreases lumbar ROM by approx. 2º every decade. Enoch et al. (2011) stated that

Key: MCD; Motor Control Dysfunction, WB; Waiters Bow, SKE; Seated Knee Extension, SFL; Sitting
Forward Lean, RBFPK; Rocking Back in Four Point Kneeling, ROM; Range of Movement, EG;
Electrogoniometry, KROM; Knee ROM, HROM; Hip ROM, LSROMLOC; Lumbar Spine ROM to the point
of Loss of Control, TLSROM; Total Lumbar Spine ROM, LHROM; Lateral Hip ROM, LLSROM; Lateral
Lumbar Spine ROM.
17 Chapter 1
research should include these factors to contextualize results within a population.
Marras and Wongsam (1986) demonstrated that patients with LBP could only achieve
20º of lumbar flexion and healthy patients could only achieve up to 28º, but they did not
assess hip flexion or include any of the above contextual factors. Therefore, the clinical
tests currently used for motor control assessment may not be accurate, as there is no
research showing any specific objective quantitative data only ‘expert opinion’.
Enoch et al. (2011) highlighted that research has yet to uncover a ‘normal’ set of
values for ROM in motor control clinical tests for a ‘normal’ population i.e. people
without LBP. Normative values have yet to be definitively covered due to the small
sample size or lack of involvement of patients’ without LBP in relevant research i.e.
n=13 (Luomajoki et al. 2007), n=15 (Enoch et al. 2011), n=10 (Roussel et al. 2009a)
n=0 (Paatelma, Karvonen and Heinonen, 2010) etc. The term ‘normative’ refers to a
standard set of degrees of movement at the low back, hip and knee in people without
low back pain during motor control dysfunction tests. The ‘normal’ degrees of movement
are used by practitioners to assess patients with low back pain and not being able to
control movement within the ‘normal’ degrees indicates dysfunction (Sahrmann, 2002,
Comerford and Mottram, 2012).
A search for relevant literature was carried out on 24th March 2012 (Figure 1), which
was combined with a search of relevant text books in order to gain a comprehensive
view of reported ‘normal’ ROM degrees for the four motor control tests involved in this
study. The results of this search show that there was very little research that actually
gave specific ROM values for the tests involved in this study (Table 1). Table 1
demonstrates that there is variation in the ‘normal’ ROM values reported by previous
research, which could confuse clinical reasoning processes (Comerford and Mottram,

Key: MCD; Motor Control Dysfunction, WB; Waiters Bow, SKE; Seated Knee Extension, SFL; Sitting
Forward Lean, RBFPK; Rocking Back in Four Point Kneeling, ROM; Range of Movement, EG;
Electrogoniometry, KROM; Knee ROM, HROM; Hip ROM, LSROMLOC; Lumbar Spine ROM to the point
of Loss of Control, TLSROM; Total Lumbar Spine ROM, LHROM; Lateral Hip ROM, LLSROM; Lateral
Lumbar Spine ROM.
18 Chapter 1
2012). Only the sitting forward lean (SFL) test had the same values within the research
that had reported it (i.e. 30° hip flexion ROM). The other ‘normal’ ROM values were
shown to have large variations of up to 50° (SKE; 30°-50° and 80° ROM). The
differences in the ROM values could be explained by the reliance on expert opinion and
the other factors discussed in this section. The variation in ROM values between the
previous research studies and texts was the basis for this study.
MCD assessment’s are used by practitioners to develop and prescribe appropriate
interventions (Mottram and Comerford, 2008), and should therefore be based on a solid
objectively assessed evidence-base not merely ‘expert opinion’. Normative data based
on biomechanical device testing would also allow for accurate cut-off points to be
developed for subjects with and without LBP, which Luomajoki et al. (2007) stated is the
future for LBP diagnosis, treatment and management. The flexion control movements
involved in this study are also not only used as tests of motor control (Enoch et al. 2011,
Luomajoki et al. 2007, 2008), but are used as interventions (Norris, 2000, Sahrmann,
2002, Comerford and Mottram, 2012). This has implications on rehabilitation as well as
assessment. With no clear consensus on the ‘normal’ ROM during the movements then
using them as an intervention or assessment is not evidence-based practice and could
therefore be ineffective, inefficient and/or potentially dangerous (Grimshaw, Eccles and
Tetroe, 2004).

Key: MCD; Motor Control Dysfunction, WB; Waiters Bow, SKE; Seated Knee Extension, SFL; Sitting
Forward Lean, RBFPK; Rocking Back in Four Point Kneeling, ROM; Range of Movement, EG;
Electrogoniometry, KROM; Knee ROM, HROM; Hip ROM, LSROMLOC; Lumbar Spine ROM to the point
of Loss of Control, TLSROM; Total Lumbar Spine ROM, LHROM; Lateral Hip ROM, LLSROM; Lateral
Lumbar Spine ROM.
19 Chapter 1
Figure 1. Literature Review Search Terms and Results
Table 1. The ROM results from the review of the literature
Test Articles Joint ROM (True Angle)
Waiters Bow
Luomajoki et al. (2007) Norris (2000) Comerford and Mottram (2012)
Hip 50º- 70 º 30°-45°
50°
Seated Knee Extension
Luomajoki et al. (2007) Sarhmann (2002) Norris (2000) Comerford and Mottram (2012)
Knee
30º- 50 º 80 º (10°) 80 º (10°)
75°-80° (10°-15°)
Sitting Forward Lean
Enoch et al. (2011) Comerford and Mottram (2001a) Comerford and Mottram (2012)
Hip
30 º (120°) 30 º (120°)
30°
Rocking Backward in Four Point Kneeling
Comerford and Mottram (2012) Luomajoki et al. (2007) Sarhmann (2002)
Hip
30° (120°) 30 º (120°)
Dysfunctional if LS flexion after 50% of movement
Key: MCD; Motor Control Dysfunction, WB; Waiters Bow, SKE; Seated Knee Extension, SFL; Sitting
Forward Lean, RBFPK; Rocking Back in Four Point Kneeling, ROM; Range of Movement, EG;
Electrogoniometry, KROM; Knee ROM, HROM; Hip ROM, LSROMLOC; Lumbar Spine ROM to the point
of Loss of Control, TLSROM; Total Lumbar Spine ROM, LHROM; Lateral Hip ROM, LLSROM; Lateral
Lumbar Spine ROM.
20 Chapter 1
1.9.1 Research Objectives
Research Question:
What are the evidence-based normative ROM angles during lumbar flexion motor
control tests?
Objectives:
Evaluate a methodology for the development of evidence-based normative data for
the ROM at the lumbar spine, hip and knee during clinical tests for lumbar flexion
motor control.
Establish evidence-based normative ROM data at the lumbar spine, hip and knee
during lumbar flexion control tests.
Establish cut off points of lumbar flexion control ROM for subjects without LBP
during lumbar flexion motor control tests.

Key: MCD; Motor Control Dysfunction, WB; Waiters Bow, SKE; Seated Knee Extension, SFL; Sitting
Forward Lean, RBFPK; Rocking Back in Four Point Kneeling, ROM; Range of Movement, EG;
Electrogoniometry, KROM; Knee ROM, HROM; Hip ROM, LSROMLOC; Lumbar Spine ROM to the point
of Loss of Control, TLSROM; Total Lumbar Spine ROM, LHROM; Lateral Hip ROM, LLSROM; Lateral
Lumbar Spine ROM.
21 Chapter 2
2 Chapter 2
Methodology
2.1 Rationale
Physiotherapy is an autonomous profession, relying on clinical reasoning skills and
evidence based practice to achieve clinical effectiveness (Mead, 2006). Recently motor
control testing for LBP has become an area of interest, which involves the control of
movement of one segment while moving another segment through a ‘normative’ ROM.
It is essential that physiotherapy uses the best available evidence in order to
appropriately provide interventions (Schreiber and Stern, 2005). Interventions are
provided based on failing a motor control test i.e. not being able to control movement
through the ‘normative’ ROM (Mottram and Comerford, 2008). However, no studies
have provided an evidence-base for ‘normative’ ROM values. It is widely recognized
that practice not based on the best available evidence is inefficient, ineffective and in
some cases dangerous (Grimshaw, Eccles and Tetroe, 2004). Therefore, this study
aimed to create an evidence-base for ‘normative’ ROM during four lumbar flexion
control tests.
2.2 Study Design
Descriptive pilot study, as it was self funded and there was a limited time scale for the
submission of the MSc dissertation. Although the design was limited due to the time
scale and sample size (n=20) involved, it was still adequate to allow for a statistical
analysis of the methodology and normative data. Schulz and Grimes (2005) believed
that unbiased trials with imprecise results are better than no results, as research based

Key: MCD; Motor Control Dysfunction, WB; Waiters Bow, SKE; Seated Knee Extension, SFL; Sitting
Forward Lean, RBFPK; Rocking Back in Four Point Kneeling, ROM; Range of Movement, EG;
Electrogoniometry, KROM; Knee ROM, HROM; Hip ROM, LSROMLOC; Lumbar Spine ROM to the point
of Loss of Control, TLSROM; Total Lumbar Spine ROM, LHROM; Lateral Hip ROM, LLSROM; Lateral
Lumbar Spine ROM.
22 Chapter 2
on methodological rigor and not sample size can still be useful to practitioners in a
clinical setting.
2.3 Study Sample
Participants were recruited via the university e-mail system, being sent an invitation
letter (Appendix 1.0), information sheet (Appendix 2.0) and informed consent form
(appendix 3.0) via this system. The e-mail was sent to members of university staff once
ethical approval was obtained, who forwarded it onto students and other staff members.
The first 20 participants to reply were selected for the study, provided that they met the
inclusion criteria (Table 2) and those not chosen were informed via an informal email
(Appendix 4.0). All participants were assigned a random number (1-20) to randomize
the sample.
Table 2. Study Inclusion and Exclusion Criteria
Inclusion Criteria: Exclusion criteria:
Healthy individuals; selected from university staff and students who will have a range of activity levels.
This will be an asymptomatic convenience sample (n=20).
Aged between 18 and 45 years.
Previous medical history of 2 years low back pain or leg pain of spinal origin, within 6 months of spinal trauma.
Any abdominal, Gastro-intestinal, neurological or respiratory condition.
Any non-healed fractures, anomalies or tumours.
Any acute trauma (Luomajoki et al. 2007, Enoch et al. 2011).
In addition, all participants were required to travel to the study location themselves.

Key: MCD; Motor Control Dysfunction, WB; Waiters Bow, SKE; Seated Knee Extension, SFL; Sitting
Forward Lean, RBFPK; Rocking Back in Four Point Kneeling, ROM; Range of Movement, EG;
Electrogoniometry, KROM; Knee ROM, HROM; Hip ROM, LSROMLOC; Lumbar Spine ROM to the point
of Loss of Control, TLSROM; Total Lumbar Spine ROM, LHROM; Lateral Hip ROM, LLSROM; Lateral
Lumbar Spine ROM.
23 Chapter 2
2.4 Ethics
Approval was obtained from Northumbria Universities ethics committee. Participants
were free to leave the study and withdraw their data at anytime without giving reason.
The tests involved in the study were simple physical tests that were performed in static
positions (i.e. sitting, standing and kneeling) and were unlikely to cause any discomfort.
Participants wore shorts with a sports bra (if female) or no top (if male). The testing
took place in a closed room, with only the researcher and supervisor present. Each
subject was not allowed to view other subjects performing the clinical tests, a screen
was placed around the testing area and towels were used to cover the participant when
not performing the tests, maintaining participants’ dignity.
All data gathered was anonymously coded onto a private password protected
computer and original sheets were stored in a locked case for a period of two years
after which they were destroyed. Feedback was given to each participant on the
outcome of their tests once the project was completed.
2.5 Baseline Measures
The test procedure involved baseline measurements of age, gender, height, weight,
BMI, hamstring length (via knee extension angle test, Davis et al. 2008).
Hamstring length has been shown to be an influence on lumbar ROM (Carregaro and
Coury, 2009), therefore this was included as one of the baseline measures of this study.
A review by Davis et al. (2008) demonstrated that the knee extension angle (KEA) test
is the most reliable test of hamstring length and was used in this study. Also, age,

Key: MCD; Motor Control Dysfunction, WB; Waiters Bow, SKE; Seated Knee Extension, SFL; Sitting
Forward Lean, RBFPK; Rocking Back in Four Point Kneeling, ROM; Range of Movement, EG;
Electrogoniometry, KROM; Knee ROM, HROM; Hip ROM, LSROMLOC; Lumbar Spine ROM to the point
of Loss of Control, TLSROM; Total Lumbar Spine ROM, LHROM; Lateral Hip ROM, LLSROM; Lateral
Lumbar Spine ROM.
24 Chapter 2
gender and BMI were recorded at baseline as all of these factors have been shown to
influence lumbar ROM (Intolo et al. 2009, Koley, Kaur and Sandhu, 2009).
KEA test procedure: Participants lay supine on a plinth. Therapist bent their hip and
knee 90°. Participants then extended their knee and held the position. The angle of
the knee was recorded, 5-15º was desirable (Norris and Matthews, 2005). This was
repeated 3 times on each leg with an average taken.
2.5.1 Equipment
A physiotherapy department room at Coach Lane Campus, Northumbria University.
Plinth – height adjustable
Biometrics electrogoniometer kit and software with laptop
Curtain/screen
Stopwatch or clock to monitor time period
Double sided and zinc oxide tape
Towels: enough for each participant to have their own during testing
2.6 Lumbar Flexion Motor Control Tests
There remains no gold standard for motor control tests and all of the currently used
tests rely on observation of the quality and range of movement. This studies aim was to
monitor ROM during several motor control tests using a biomechanical device. Lumbar
flexion control tests were used, as research by Paatelma, Karvonen and Heinonen
(2010) showed that lumbar spine flexion during MCD testing was clinically significant.
Lumbar spine, hip and knee angles were monitored, as Shin et al (2004) and Pal et al.

Key: MCD; Motor Control Dysfunction, WB; Waiters Bow, SKE; Seated Knee Extension, SFL; Sitting
Forward Lean, RBFPK; Rocking Back in Four Point Kneeling, ROM; Range of Movement, EG;
Electrogoniometry, KROM; Knee ROM, HROM; Hip ROM, LSROMLOC; Lumbar Spine ROM to the point
of Loss of Control, TLSROM; Total Lumbar Spine ROM, LHROM; Lateral Hip ROM, LLSROM; Lateral
Lumbar Spine ROM.
25 Chapter 2
(2007) demonstrated that changes in the angles at the hip and knee can alter the ROM
at the lumbar spine.
The clinical tests involved were: waiters bow (WB), sitting forward lean (SFL), sitting
knee extension (SKE) and rocking backward in four point kneeling (RBFPK) (Liebenson
et al. 2009, Enoch et al. 2011, Luomajoki et al. 2007).
Table 3. Lumbar Flexion Motor Control Test Procedures Test Test procedure
WB Standing with feet shoulder width apart and hands on hips. Keeping knees stable but slightly unlocked. Bend forwards at the hips, while not allowing flexion in the lower back (LB). Lower as far as hip flexibility allows while keeping LB in neutral and return to standing position, leading with the hips not the spine.
SKE Upright sitting on plinth with feet unsupported, LB in neutral; extension of the knee without movement (flexion) of low back.
SFL Upright sitting on plinth with feet supported, LB in neutral; knees and hips at 90° with the hands resting on the thighs. Lean forwards from hips as far as flexibility will allow while keeping LB in neutral.
RBFPK Transfer of the pelvis backwards ("rocking") in a quadruped position (i.e. hands and knees in contact with the plinth) as far as flexibility allows while keeping LB in neutral.
2.7 Electrogoniometry: Reliability and Validity
Biometrics Ltd. (2011) data-link electrogoniometry (EG) was used to measure the
ROM at the lumbar spine, hip and knee when performing the MCD tests. Gajdosik and
Bohannon (1987) reported that EG it is a reliable and valid measure of ROM. Since this
early work many studies have utilised this equipment to assess the lumbar spine, due to
the accuracy and ability to monitor several planes of movement at one time to an
accuracy of ±2º (Biometrics Ltd., 2011, Intolo et al. 2009, Marras and Wongsam, 1986).
Rowe et al. (2001) also tested the Biometric flexible EG proving that it is a valid
measure of joint kinematics. EG has been specifically assessed in several studies

Key: MCD; Motor Control Dysfunction, WB; Waiters Bow, SKE; Seated Knee Extension, SFL; Sitting
Forward Lean, RBFPK; Rocking Back in Four Point Kneeling, ROM; Range of Movement, EG;
Electrogoniometry, KROM; Knee ROM, HROM; Hip ROM, LSROMLOC; Lumbar Spine ROM to the point
of Loss of Control, TLSROM; Total Lumbar Spine ROM, LHROM; Lateral Hip ROM, LLSROM; Lateral
Lumbar Spine ROM.
26 Chapter 2
proving that it is a valid and reliable measure for lower extremity ROM (Szulc,
Lewandowski and Marecki, 2000, Bronner, Agraharasamakulam and Ojofeitimi, 2010).
Twin axis EG electrodes (Biometrics Ltd. 2011) were applied using tape at the lumbar
spine and left hip to monitor the saggital and frontal plane ROM during the tests
(Appendix 6.0). The lumbar spine EG was used to monitor the neutral lumbar position,
flexion control of the lumbar spine and lateral movement. A single axis electrode was
used for the left knee to monitor the saggital ROM during the tests. Appendix 6.0
demonstrates the electrode placement at the hip, knee and lumbar spine which were
based on previous studies (Marras and Wongsam, 1986, Mayhew, Norton and
Sahrmann, 1983, Szulc, Lewandowski and Marecki, 2000). The attachment of the
electrodes was performed according to the Biometrics Ltd. (2011) guidelines, with extra
zinc oxide tape over the electrodes to add pressure (Rowe et al. 2001). The electrodes
were attached in a neutral standing position and remained in place for all the testing, as
Piriyaprasarth et al. (2008) stated that removal and reattachment can cause
measurement errors.
2.8 Data Collection Protocol
Each participant attended one testing session at Northumbria University, which took an
average of 60 minutes to complete. The session was run by the researcher with the
support of their supervisor. Table 4 demonstrates the data collection procedure utilised.
An alarm was set in the Biometrics software, which sounded when lumbar flexion went
above 5º, which indicated anterior pelvic tilt and a loss of flexion control. Loss of flexion
control is shown in the trace as a bending moment, as after this point the spine begins
to move beyond the neutral position and into flexion (Panjabi, 1992b). There is variation

Key: MCD; Motor Control Dysfunction, WB; Waiters Bow, SKE; Seated Knee Extension, SFL; Sitting
Forward Lean, RBFPK; Rocking Back in Four Point Kneeling, ROM; Range of Movement, EG;
Electrogoniometry, KROM; Knee ROM, HROM; Hip ROM, LSROMLOC; Lumbar Spine ROM to the point
of Loss of Control, TLSROM; Total Lumbar Spine ROM, LHROM; Lateral Hip ROM, LLSROM; Lateral
Lumbar Spine ROM.
27 Chapter 2
in the reported NZ ROM degrees. Therefore this study used the original widely accepted
ROM degrees from Panjabi (1992b) and the in vitro stepwise spinal testing (Goertzen,
Lane and Oxland, 2004) to base 5° of flexion control on. The Biometrics equipment had
an accuracy of ±2°; therefore analyzing the collected data at 5° gave a true angle of
between 3° and 7°. This potentially gave the point at the final degree of the neutral or
elastic zone (5°-6°), where the LS segments were beginning to go into flexion. Not only
in research but in clinical practice 5° is also seen as the minimum observable clinically
significant change in ROM (Uswatte and Taub, 1999, Zigler, 2004, Pennal et al. 1972).
The data was marked, using the hand held data marker, by the researcher at the point
that the lumbar spine went past 5° of flexion (i.e. when the alarm sounded). This mark
showed as a yellow line on the graphical output of the biometrics software.
Table 4. Data Collection Procedure
Start
Position
The researcher used their hands to position the lumbar spine in a neutral position before each attempt and the lumbar spine electrode was ‘zeroed’ at this point. In contrast the knee and hip electrodes were ‘zeroed’ in a straight position prior to being attached. This allowed the EG to monitor lumbar spine flexion from a neutral lumbar position.
Teaching
of Test
Movement
The participants (n=20) were taught each test by the researcher individually prior to their own performance. Each participant performed the 4 clinical tests several times, with the first attempts being adjusted by the researcher so that the final 3 attempts were deemed competent by the researcher (Enoch et al. 2011). Tactile feedback was given in the first attempts with verbal feedback also given in the first attempts by the researcher. The participants were given a strict set of instructions for each test (Table 3), which was the same for each participant. A demonstration of each of the tests was given by the researcher just prior to the participants own performance.
Test The last 3 attempts were performed with no feedback and were recorded with an average taken. Participants were given a 2 minute break between each test and the order of the tests was the same for each participant (i.e. WB, SKE, SFL, RBFPK) as Luomajoki et al. (2008) believed this represents clinical practice where routines often develop.

Key: MCD; Motor Control Dysfunction, WB; Waiters Bow, SKE; Seated Knee Extension, SFL; Sitting
Forward Lean, RBFPK; Rocking Back in Four Point Kneeling, ROM; Range of Movement, EG;
Electrogoniometry, KROM; Knee ROM, HROM; Hip ROM, LSROMLOC; Lumbar Spine ROM to the point
of Loss of Control, TLSROM; Total Lumbar Spine ROM, LHROM; Lateral Hip ROM, LLSROM; Lateral
Lumbar Spine ROM.
28 Chapter 2
2.9 Data analysis
The data was analyzed to find the ‘normal’ ROM at the hip, knee and lumbar spine to
the point of loss of flexion control (Appendix 4.0). The raw-data was analysed initially on
the Biometrics Ltd. (2011) software (Appendix 3.0). ROM results were then transferred
and statistically analysed using Microsoft Excel (2007) with the Analyse-it statistical
package and Medcalc (2012) version 12.2.1. Mainly descriptive statistics (total means,
standard deviations etc.) were reported for the ‘normal’ ROM results (Table 6), as no
formal power testing had been completed for this pilot study (Lancaster, Dodd and
Williamson, 2002).
Repeatability of each test was based upon the agreement between the final two
attempts (2-3), which were chosen as the learning effect allowed for consistent results.
To show individual measurement errors the standard error of measurement (SEM) was
calculated [SEM = SD differences between attempts 2-3 x √2 (Vet et al. 2006, Enoch et
al. 2011)]. Minimal detectable change (MDC) [MDC = SEM x √2 x 1.96] was also
calculated to show the minimal difference between attempts 2 and 3 not due to error.
The ROM differences must be lower than the MDC in order to be repeatable (Damstra
et al. 2011).
The difference between individual measurements was also calculated using Bland-
Altman plots (Bland and Altman, 1986, 2003). Bland-Altman plots were constructed by
plotting the ROM differences between attempt 2 and 3 (y-axis) against the mean ROM
of attempts 2 and 3 (x-axis) for each ROM variable (Figure 2-5). The dark blue line was
the average difference, the distance between this line and the ‘y=0’ (orange dashed)
line indicates the bias towards one of the attempts. The distance between the dark blue
line (average difference) and each dot represents the difference between the attempts.
The closer the dots are to the dark blue line the less disagreement between ROM
Key: MCD; Motor Control Dysfunction, WB; Waiters Bow, SKE; Seated Knee Extension, SFL; Sitting
Forward Lean, RBFPK; Rocking Back in Four Point Kneeling, ROM; Range of Movement, EG;
Electrogoniometry, KROM; Knee ROM, HROM; Hip ROM, LSROMLOC; Lumbar Spine ROM to the point
of Loss of Control, TLSROM; Total Lumbar Spine ROM, LHROM; Lateral Hip ROM, LLSROM; Lateral
Lumbar Spine ROM.
29 Chapter 2
measures. The brown dashed lines in Figures 2-5 indicates the 95% Limits of
agreement (LoA), which represents the value below which 95% of the differences
should lie if the data is normally distributed (Bisdas et al. 2008).
A statistician was consulted and spearman’s correlation coefficients (rho) were used to
evaluate agreement between individual measures (intra-measure) due to the distribution
of the data (Table 7). The correlation coefficient ratings are as follows; 0-0.2
indicates ‘poor’ agreement: 0.2-0.4 indicates ‘fair’ agreement; 0.4-0.7 indicates
‘moderate’ agreement; 0.7-0.8 indicates ‘strong’ agreement; and >0.8 indicates ‘almost
perfect’ agreement. A high positive rho in this case indicated that ROM differences
between attempts were small.
Inter-rater agreement was analysed between the main researcher (novice) and their
supervisor (expert). The inter-rater agreement was analysed using 4 randomly selected
subject ROM results, which were analysed by both researchers using a set protocol
(Appendix 3.0). Similar to previous studies weighted Kappa correlations were then used
to assess the level of agreement between the two raters.
The ROM data (attempts 1-3) was also examined using rho for association between
different parameters; such as hamstring length (LKEA), body mass index (BMI), age
and the point of loss of flexion control of the lumbar spine compared to total LS ROM.

Key: MCD; Motor Control Dysfunction, WB; Waiters Bow, SKE; Seated Knee Extension, SFL; Sitting
Forward Lean, RBFPK; Rocking Back in Four Point Kneeling, ROM; Range of Movement, EG;
Electrogoniometry, KROM; Knee ROM, HROM; Hip ROM, LSROMLOC; Lumbar Spine ROM to the point
of Loss of Control, TLSROM; Total Lumbar Spine ROM, LHROM; Lateral Hip ROM, LLSROM; Lateral
Lumbar Spine ROM.
30 Chapter 3
3 Chapter 3
Results
The main aim of this study was to create a set of ‘normative’ ROM values for the hip,
knee and lumbar spine during lumbar flexion control tests, which would allow for cut-off
points to be made for non-LBP subjects. In order to do this a quantitative methodology
using a biomechanical device (i.e. Biometrics EG) was created to assess the ROM at
these joints during the tests. This section will discuss the findings of this methodology
and the reliability of the method used.
3.1 Baseline Measurements
20 subjects without LBP were included in the study and Table 1 shows the baseline
data of the subjects. In their sociodemographic background there was little variation in
working status, with the subjects consisting mainly of students (90%) and the minority of
subjects being employed (10%). The participants were tested for ROM on their left side,
but knee extension angle was recorded for both legs. Norris and Matthews (2005)
reported that between 5º and 15º of knee extension is desirable when performing the
LKEA test. However, Table 5 demonstrates that the average left knee extension angles
(LKEA), taken from supine with the hip at 90°, for males (19.7°) and females (26.9°)
were less than the desirable range. This infers that on average all of the participants
(N=20) had shortened or tight hamstring muscles.
There were no adverse effects of the testing performance. However, there were issues
with the participants’ ability to perform the testing with no feedback from the practitioner,
especially during the waiters bow testing. More attempts by the participants than the

Key: MCD; Motor Control Dysfunction, WB; Waiters Bow, SKE; Seated Knee Extension, SFL; Sitting
Forward Lean, RBFPK; Rocking Back in Four Point Kneeling, ROM; Range of Movement, EG;
Electrogoniometry, KROM; Knee ROM, HROM; Hip ROM, LSROMLOC; Lumbar Spine ROM to the point
of Loss of Control, TLSROM; Total Lumbar Spine ROM, LHROM; Lateral Hip ROM, LLSROM; Lateral
Lumbar Spine ROM.
31 Chapter 3
originally planned 5 times were required to gain a good level of proficiency for the
recorded attempts (Table 6), which was based on the therapists’ subjective decision.
Table 5. Baseline Measurements
Participants without LBP (N = 20)
Males Females Average/Total
Age years (Mean, SD) 25.8 (7.1) 25.7 (6.9) 25.75 (7)
Height cm (Mean, SD) 181.3 (6.4) 163.6 (6.2) 172.45 (6.3)
Weight kg (Mean, SD) 74.9 (8) 60.5 (7.3) 67.7 (7.65)
BMI (Mean, SD) 22.8 (2.3) 22.6 (2.4) 22.7 (2.35)
Gender (N. %) 10 (50%) 10 (50%) 20 (100%)
LKEA (Mean, SD) 19.7 (10.7) 26.9 (14.8) 23.3 (12.75)
RKEA (Mean, SD)
Student (N. %)
Working (N. %)
20.5 (10.5)
9 (90%)
1 (10%)
24.3 (14.5)
9 (90%)
1 (10%)
22.4 (12.5)
18 (90%)
2 (10%)
Table 6. Average Number of Test Attempts
Male Female Average
Waiters Bow (Mean, SD)
Seated Knee Extension (Mean, SD)
Sitting Forward Lean (Mean, SD)
Rocking Back in Four Point Kneeling (Mean, SD)
6.9 (1.4)
5.2 (0.4)
5.2 (0.4)
5.7 (1.1)
6.7 (1.1)
5.3 (1)
5.8 (0.6)
5.3 (0.5)
6.8 (1.3)
5.3 (0.7)
5.5 (0.5)
5.5 (0.8)

Key: MCD; Motor Control Dysfunction, WB; Waiters Bow, SKE; Seated Knee Extension, SFL; Sitting
Forward Lean, RBFPK; Rocking Back in Four Point Kneeling, ROM; Range of Movement, EG;
Electrogoniometry, KROM; Knee ROM, HROM; Hip ROM, LSROMLOC; Lumbar Spine ROM to the point
of Loss of Control, TLSROM; Total Lumbar Spine ROM, LHROM; Lateral Hip ROM, LLSROM; Lateral
Lumbar Spine ROM.
32 Chapter 3
3.2 Lumbar Flexion Control Tests
The summarized ROM results shown in Table 7 indicate that the mean ROM’s of the
tests were all 10-15° less than the previously reported ROM degrees; HROM during WB
(30-70°), KROM during SKE (30-80°), HROM during SFL (30°) and HROM during
RBFPK (30°) (Table 1). The particular ROM’s of interest for comparison to previously
reported ROM values were; HROM during WB (16.06°; CI 11.63-20.49), KROM during
SKE (65.09°; CI 60.10-70.08), HROM during SFL (15.35°; CI 12.02-18.67) and HROM
during RBFPK (19.68°; CI 15.24-24.12). However, there were large standard deviation’s
(SD) between many of the ROM values as high as 17.21°, which means the differences
in ROM between attempts (1-3) were large and clinically significant (i.e. >5°)
(Chaudhary, Beaupre and Johnston, 2008, Stuss, Winocur and Robertson, 1999).
Table 7 demonstrates that the D’Agostino-Pearson test for normal distribution was
rejected (r) in five ROM aspects for attempts 1-3, which is due to the skewness and
kurtosis of the data. Three of the ROM aspects had a statistically significant skewness
(<0.05); LHROM during SFL, KROM during WB and LSROMLOC during RBFPK.
Distribution was skewed indicating that the most extreme values were located on the
right (positive value) or left (negative value), which was demonstrated in the Bland-
Altman plots (Figures 2, 4 and 5). Four ROM aspects had a statistically significant
kurtosis (<0.05). LSROMLOC during SFL, LHROM during RBFPK and LLSROM during
WB had a platykurtic distribution (<3), which means that the probability for extreme
values was less than for a normal distribution and the ROM measurements were
widespread around the mean. LLSROM during RBFPK had a leptokurtic distribution
(>3), which means that the ROM measurements had a high probability for extreme
values as the majority of the measurements were concentrated around the mean
(Figure 5).

Key: MCD; Motor Control Dysfunction, WB; Waiters Bow, SKE; Seated Knee Extension, SFL; Sitting
Forward Lean, RBFPK; Rocking Back in Four Point Kneeling, ROM; Range of Movement, EG;
Electrogoniometry, KROM; Knee ROM, HROM; Hip ROM, LSROMLOC; Lumbar Spine ROM to the point
of Loss of Control, TLSROM; Total Lumbar Spine ROM, LHROM; Lateral Hip ROM, LLSROM; Lateral
Lumbar Spine ROM.
33 Chapter 3
The Bland-Altman plots (attempts 2-3) demonstrate that the several of ROM variables
that had rejected normal distribution over the 3 attempts (i.e. KROM during WB,
LSROMLOC and LHROM during SFL and LSROMLOC during RBFPK) had a
distribution of 95% of the differences within 95% LoA (Figures 2-5) which implies normal
distribution during the last 2 attempts (Bland and Altman, 1986). Only LHROM during
SKE maintained rejected normal distribution over the 3 attempts (Figure 3).
The large SD’s and variability of normality of the data over the 3 attempts indicated
that reliability analysis was required. Due to the rejected normality non-parametric data
analysis was performed i.e. Spearman’s rank correlation coefficient (rho).

Key: MCD; Motor Control Dysfunction, WB; Waiters Bow, SKE; Seated Knee Extension, SFL; Sitting Forward Lean, RBFPK; Rocking Back in Four Point Kneeling, ROM;
Range of Movement, EG; Electrogoniometry, KROM; Knee ROM, HROM; Hip ROM, LSROMLOC; Lumbar Spine ROM to the point of Loss of Control, TLSROM; Total
Lumbar Spine ROM, LHROM; Lateral Hip ROM, LLSROM; Lateral Lumbar Spine ROM. 34
Table 7. Summary of Descriptive Data for Lumbar Flexion Control Test ROM (Attempts 1 -3)
Test Outcome Variable
Mean (Degrees)
Standard Deviation
(SD) (Degrees)
95% confidence interval (Degrees)
Lower Upper
Range (Min, Max) (Degrees)
Standard Error
(Degrees)
Coefficient of Skewness (p value)
Coefficient of
Kurtosis (p value)
Normality (p value)
WB KROM 2.06 3.51 0.42 3.70 -2.4, 10.37 0.78 1.23 (0.02) 0.62 (0.41) 0.05 (r)
HROM 16.06 9.47 11.63 20.49 3, 35.03 2.12 0.52 (0.29) -0.43 (0.76) 0.55
LSROMLOC 5.57 0.97 5.12 6.03 3.9, 8 0.22 0.86 (0.09) 0.73 (0.36) 0.16
TLSROM 29.73 17.21 21.67 37.78 4.37, 59.73 3.85 -0.04 (0.94) -1.24 (0.07) 0.19
LHROM 2.06 4.58 -0.08 4.21 7.77, 11.53 1.02 -0.08 (0.87) 0.32 (0.58) 0.85
LLSROM 0.17 2.11 -0.82 1.16 -3.3, 3.3 0.47 -0.09 (0.85) -1.38 (0.03) 0.09
SKE KROM 65.09 10.66 60.10 70.08 44.2, 82 2.38 -0.07 (0.89) -0.81 (0.37) 0.66
HROM -0.72 3.74 -2.47 1.03 7.53, 6 0.84 -0.44 (0.37) -0.47 (0.72) 0.63
LSROMLOC 4.28 1.15 3.74 4.82 2.1, 6.7 0.26 0.06 (0.90) 0.13 (0.71) 0.93
TLSROM 6.33 2.83 5 7.65 2.43, 12.77 0.63 0.84 (0.10) 1.13 (0.23) 0.12
LHROM 4.76 4.18 2.80 6.71 3.57, 16.17 0.93 0.86 (0.09) 2.37 (0.06) 0.04 (r)
LLSROM -1.53 1.79 -2.36 -0.69 -4.53, 1.53 0.4 0.24 (0.62) -0.85 (0.34) 0.56
SFL KROM 0.12 1.35 -0.51 0.75 -2.43, 2.37 0.3 -0.15 (0.75) -0.82 (0.37) 0.63
HROM 15.35 7.10 12.02 18.67 3.17, 33.83 1.59 0.64 (0.20) 1.10 (0.24) 0.22
LSROMLOC 5.60 1.36 4.96 6.23 2.6, 8.8 0.3 0.79 (0.12) 2.60 (0.04) 0.04 (r)
TLSROM 21.20 10.22 16.41 25.98 6.43, 40.8 2.28 0.44 (0.37) -0.90 (0.29) 0.38
LHROM 5.59 7.50 2.08 9.10 4.13, 24.73 1.68 1.27 (0.02) 1.38 (0.17) 0.02 (r)
LLSROM -1.47 2.17 -2.48 -0.45 -6, 1.93 0.48 -0.39 (0.42) -0.41 (0.79) 0.70
RBFPK KROM 23.71 7.57 20.17 27.26 7.87, 34 1.69 -0.64 (0.20) -0.34 (0.86) 0.43
HROM 19.68 9.48 15.24 24.12 5.1, 36.9 2.12 0.38 (0.44) -0.68 (0.51) 0.60
LSROMLOC 5.03 0.87 4.62 5.44 2.83, 6.13 0.19 -1.40 (0.01) 1.91 (0.09) 0.01 (r)
TLSROM 16.37 7.60 12.82 19.93 6.47, 30.9 1.70 0.30 (0.54) -1.22 (0.08) 0.18
LHROM 4.02 7.18 0.66 7.38 -12.37, 23.27
1.61 0.55 (0.27) 2.60 (0.04) 0.07
LLSROM 0.22 1.30 -0.39 0.83 -3.37, 3.23 0.29 -0.41 (0.41) 3.13 (0.03) 0.06
[Normality; D'Agostino-Pearson test for normal distribution (r = reject normality). Significant finding; P<0.05]

35
HIP ROM KNEE ROM TOTAL LUMBAR SPINE ROM
LATERAL LUMBAR SPINE ROM LATERAL HIP ROM LUMBAR SPINE ROM TO LOSS OF CONTROL
FIGURE 2. Waiters Bow Bland-Altman Plots (Attempt 2 and 3)
0 10 20 30 40
-25
-20
-15
-10
-5
0
5
10
15
20
25
Average of Attempt 2 and Attempt 3
Attem
pt 2 -
Attem
pt 3
Mean
2.6
-1.96 SD
-14.8
+1.96 SD
20.1
-2 0 2 4 6 8 10 12 14
-8
-6
-4
-2
0
2
4
Average of Attempt 2 and Attempt_3
Attem
pt 2 -
Attem
pt_
3
Mean
-1.0
-1.96 SD
-5.1
+1.96 SD
3.2
0 10 20 30 40 50 60 70
-25
-20
-15
-10
-5
0
5
10
15
20
Average of Attempt 2 and Attempt 3
Attem
pt 2 -
Attem
pt 3
Mean
-0.7
-1.96 SD
-18.5
+1.96 SD
17.0
-4 -2 0 2 4 6
-8
-6
-4
-2
0
2
4
6
Average of Attempt 2 and Attempt 3
Attem
pt 2 -
Attem
pt 3
Mean
0.2
-1.96 SD
-3.9
+1.96 SD
4.2
-10 -5 0 5 10 15
-10
-8
-6
-4
-2
0
2
4
6
8
Average of Attempt 2 and Attempt 3
Attem
pt 2 -
Attem
pt 3
Mean
-0.5
-1.96 SD
-7.6
+1.96 SD
6.6
2 3 4 5 6 7 8 9
-6
-4
-2
0
2
4
6
8
Average of Attempt 2 and Attempt 3
Attem
pt 2 -
Attem
pt 3
Mean
0.5
-1.96 SD
-3.7
+1.96 SD
4.7

36
HIP ROM KNEE ROM TOTAL LUMBAR SPINE ROM
LATERAL LUMBAR SPINE ROM LATERAL HIP ROM LUMBAR SPINE ROM TO LOSS OF CONTROL
FIGURE 3. Seated Knee Extension Bland-Altman Plots (Attempts 2 and 3)
-10 -5 0 5 10
-6
-4
-2
0
2
4
Average of Attempt 2 and Attempt 3
Att
em
pt
2 -
Att
em
pt
3
Mean
-0.3
-1.96 SD
-3.8
+1.96 SD
3.1
40 50 60 70 80 90
-15
-10
-5
0
5
10
15
20
Average of Attempt 2 and Attempt_3
Att
em
pt
2 -
Att
em
pt_
3Mean
0.8
-1.96 SD
-10.0
+1.96 SD
11.7
2 4 6 8 10 12 14 16
-6
-4
-2
0
2
4
6
Average of Attmept 2 and Attempt 3
Att
me
pt
2 -
Att
em
pt
3
Mean
-0.1
-1.96 SD
-4.9
+1.96 SD
4.7
-6 -4 -2 0 2 4
-3
-2
-1
0
1
2
3
Average of Attempt 2 and Attempt 3
Att
em
pt
2 -
Att
em
pt
3
Mean
0.1
-1.96 SD
-2.0
+1.96 SD
2.2
-10 -5 0 5 10 15
-20
-15
-10
-5
0
5
10
15
Average of Attempt 2 and Attempt 3
Att
em
pt
2 -
Att
em
pt
3
Mean
1.0
-1.96 SD
-10.3
+1.96 SD
12.4
2 3 4 5 6 7 8
-8
-6
-4
-2
0
2
4
6
Average of Attempt 2 and Attempt 3
Att
em
pt
2 -
Att
em
pt
3
Mean
0.4
-1.96 SD
-3.7
+1.96 SD
4.5

37
HIP ROM KNEE ROM TOTAL LUMBAR SPINE ROM
LATERAL LUMBAR SPINE ROM LATERAL HIP ROM LUMBAR SPINE ROM TO LOSS OF CONTROL
FIGURE 4. Sitting Forward Lean Bland-Altman Plots (Attempts 2 and 3)
0 5 10 15 20 25 30 35
-10
-5
0
5
10
15
Average of Attempt 2 and Attempt 3
Att
em
pt
2 -
Att
em
pt
3
Mean
0.9
-1.96 SD
-8.2
+1.96 SD
10.0
-3 -2 -1 0 1 2 3 4
-4
-3
-2
-1
0
1
2
3
4
5
6
Average of Attempt 2 and Attempt 3
Att
em
pt
2 -
Att
em
pt
3
Mean
0.4
-1.96 SD
-2.6
+1.96 SD
3.4
0 10 20 30 40 50
-10
-5
0
5
10
15
Average of Attempt 2 and Attempt 3
Atte
mp
t 2
- A
tte
mp
t 3
Mean
1.3
-1.96 SD
-8.2
+1.96 SD
10.9
-6 -4 -2 0 2 4
-6
-4
-2
0
2
4
6
Average of Attempt 2 and Attempt 3
Att
em
pt
2 -
Att
em
pt
3
Mean
-0.2
-1.96 SD
-4.1
+1.96 SD
3.7
-10 0 10 20 30 40
-20
-15
-10
-5
0
5
10
15
Average of Attempt 2 and Attempt 3
Att
em
pt
2 -
Att
em
pt
3
Mean
-0.5
-1.96 SD
-10.7
+1.96 SD
9.7
0 2 4 6 8 10
-4
-3
-2
-1
0
1
2
3
4
5
Average of Attempt 2 and Attempt 3
Att
em
pt
2 -
Att
em
pt
3
Mean
0.3
-1.96 SD
-3.3
+1.96 SD
4.0
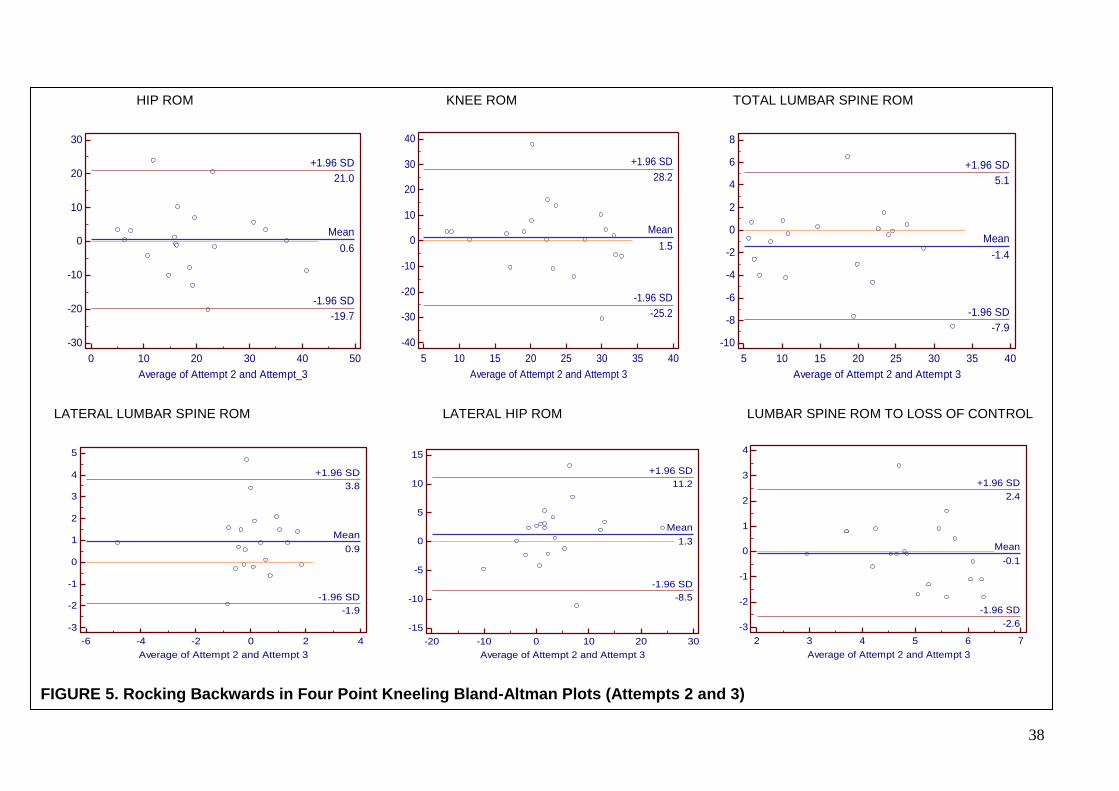
38
HIP ROM KNEE ROM TOTAL LUMBAR SPINE ROM
LATERAL LUMBAR SPINE ROM LATERAL HIP ROM LUMBAR SPINE ROM TO LOSS OF CONTROL
FIGURE 5. Rocking Backwards in Four Point Kneeling Bland-Altman Plots (Attempts 2 and 3)
0 10 20 30 40 50
-30
-20
-10
0
10
20
30
Average of Attempt 2 and Attempt_3
Att
em
pt
2 -
Att
em
pt_
3
Mean
0.6
-1.96 SD
-19.7
+1.96 SD
21.0
5 10 15 20 25 30 35 40
-40
-30
-20
-10
0
10
20
30
40
Average of Attempt 2 and Attempt 3
Atte
mp
t 2
- A
tte
mp
t 3
Mean
1.5
-1.96 SD
-25.2
+1.96 SD
28.2
5 10 15 20 25 30 35 40
-10
-8
-6
-4
-2
0
2
4
6
8
Average of Attempt 2 and Attempt 3
Att
em
pt
2 -
Att
em
pt
3
Mean
-1.4
-1.96 SD
-7.9
+1.96 SD
5.1
-6 -4 -2 0 2 4
-3
-2
-1
0
1
2
3
4
5
Average of Attempt 2 and Attempt 3
Att
em
pt
2 -
Att
em
pt
3
Mean
0.9
-1.96 SD
-1.9
+1.96 SD
3.8
-20 -10 0 10 20 30
-15
-10
-5
0
5
10
15
Average of Attempt 2 and Attempt 3
Atte
mp
t 2
- A
tte
mp
t 3
Mean
1.3
-1.96 SD
-8.5
+1.96 SD
11.2
2 3 4 5 6 7
-3
-2
-1
0
1
2
3
4
Average of Attempt 2 and Attempt 3
Atte
mp
t 2
- A
tte
mp
t 3
Mean
-0.1
-1.96 SD
-2.6
+1.96 SD
2.4

Key: MCD; Motor Control Dysfunction, WB; Waiters Bow, SKE; Seated Knee Extension, SFL; Sitting Forward Lean, RBFPK; Rocking Back in Four Point Kneeling, ROM;
Range of Movement, EG; Electrogoniometry, KROM; Knee ROM, HROM; Hip ROM, LSROMLOC; Lumbar Spine ROM to the point of Loss of Control, TLSROM; Total
Lumbar Spine ROM, LHROM; Lateral Hip ROM, LLSROM; Lateral Lumbar Spine ROM. 39
Table 8. Summary of Intra-measure Data for Lumbar Flexion Control Tests (Attempts 2-3)
Test Outcome Variable Spearmans Coefficient Correlation (rho)
rho (p value) 95% Confidence Interval
rho (p value) 95% CI
Mean Difference (SD) LOA (95%) SEM MDC
WB KROM 0.59 (0.01) 0.20 to 0.82 1 (2.12) -3.16 to 5.15 1.50 4.16
HROM 0.78 (0.00) 0.52 to 0.91 -2.64 (8.89) -20.06 to 14.78 6.31 17.50
LSROMLOC 0.07 (0.77) -0.38 to 0.50 -0.48 (2.15) -4.68 to 3.73 1.53 4.24
TLSROM 0.88 (0.00) 0.71 to 0.95 0.75 (9.05) -16.99 to 18.48 6.42 17.80
LHROM 0.81 (0.00) 0.57 to 0.92 0.51 (3.62) -4.22 to 3.86 2.57 7.12
LLSROM 0.73 (0.00) 0.42 to 0.88 -0.18 (2.06) -6.58 to 7.61 1.46 4.05
Mean 0.64 0.34 to 0.83
SKE KROM 0.85 (0.00) 0.66 to 0.94 -1.96 (7.31) -16.29 to 12.36 10.34 20.27
HROM 0.83 (0.00) 0.61 to 0.93 0.20 (2.39) -4.48 to 4.88 3.38 6.63
LSROMLOC 0.56 (0.01) 0.16 to 0.80 -0.13 (1.23) -2.55 to 2.28 1.74 3.41
TLSROM 0.70 (0.00) 0.36 to 0.87 0.85 (2.27) -3.60 to 5.30 3.21 6.29
LHROM 0.68 (0.00) 0.34 to 0.86 1.41 (5.47) -9.33 to 12.14 7.34 14.39
LLSROM 0.46 (0.04) 0.03 to 0.75 -0.54 (2.01) -4.48 to 3.41 2.84 5.57
Mean 0.68 0.36 to 0.86
SFL KROM 0.63 (0.00) 0.25 to 0.84 -0.38 (1.54) -3.40 to 2.64 1.09 3.02
HROM 0.61 (0.01) 0.22 to 0.83 0.54 (4.31) -7.92 to 8.99 3.05 8.45
LSROMLOC 0.22 (0.34) -0.24 to 0.61 -0.33 (1.86) -3.98 to 3.32 1.32 3.66
TLSROM 0.92 (0.00) 0.81 to 0.97 -1.33 (4.89) -10.91 to 8.24 3.46 9.59
LHROM 0.80 (0.00) 0.55 to 0.92 0.54 (5.20) -9.65 to 10.74 3.68 10.20
LLSROM 0.72 (0.00) 0.41 to 0.88 0.22 (2.00) -3.69 to 4.14 1.41 3.91
Mean 0.65 0.33 to 0.84
RBFPK KROM 0.17 (0.46) -0.29 to 0.57 -1.51 (13.61) -28.18 to 25.17 9.62 26.67
HROM 0.48 (0.03) 0.05 to 0.76 -0.62 (10.39) -20.98 to 19.74 7.35 20.37
LSROMLOC 0.41 (0.08) -0.05 to 0.72 0.07 (1.28) -2.45 to 2.58 0.91 2.52
TLSROM 0.94 (0.00) 0.85 to 0.98 1.41 (3.33) -5.12 to 7.94 2.36 6.54
LHROM 0.65 (0.00) 0.29 to 0.85 -1.33 (5.01) -11.15 to 8.48 3.54 9.81
LLSROM 0.32 (0.17) -1.41 to 0.67 -0.95 (1.45) -3.80 to 1.90 1.03 2.86
Mean 0.50 0.39 to 0.76
[95% Confidence Interval for rho (95% CI), Standard Deviation of the Difference (SD), Limits of Agreement 95% (LOA 95%), Standard error of Measurement (SEM),
Minimal Detectable Change (MDC)]
Key: MCD; Motor Control Dysfunction, WB; Waiters Bow, SKE; Seated Knee Extension, SFL; Sitting
Forward Lean, RBFPK; Rocking Back in Four Point Kneeling, ROM; Range of Movement, EG;
Electrogoniometry, KROM; Knee ROM, HROM; Hip ROM, LSROMLOC; Lumbar Spine ROM to the point
of Loss of Control, TLSROM; Total Lumbar Spine ROM, LHROM; Lateral Hip ROM, LLSROM; Lateral
Lumbar Spine ROM.
40 Chapter 3
3.2 Intra-measure Repeatability
Minimal detectable change (MDC) is defined as “the minimal change that falls outside
the measurement error in the score of an instrument used to measure a symptom”
(Kovacs et al. 2008). The results in Table 8 indicate that the MDC between attempts 2-3
ranged from approx. 2.1° to 26.7°, depending upon the ROM variable. Meaning that in
order to detect a real difference between the attempts that is not due to measurement
error the ROM must reach at least these differences (Damstra et al. 2011). Therefore,
the higher results such as KROM during RBFPK (26.7°), HROM during RBFPK (20.4°)
and KROM during SKE (20.3°) indicate that a large difference in ROM must be made
between attempts 2-3 to be sure of a change. This coincides with the large standard
error mean (SEM) for the same ROM variables between attempts 2-3 (i.e. 9.62°, 7.35°
and 10.34° respectively). The low MDC results (i.e. 2.52°) also mean that only small
differences have to be made to be sure of a real change not due to error. These low
values are seen mainly in the lumbar spine results (Table 8) which ideally should be low
due to the small amount of movement expected to be made in this area. The variation
between the two measures from large to small shows that certain tests may be more
accurate than others (i.e. SFL overall had smaller MDC results than any other test).
Large SEM and MDC coincided with the mean difference (bias) results between
attempts 2-3 (i.e. large SEM and MDC meant a large bias; Table 8). The mean
differences are shown to have be different (over ±0.50°) from zero in a number of the
ROM results, which Bland and Altman (1986) stated should not happen if the results are
repeated measures. All of the mean differences for lateral hip ROM are shown to be
greater than ±0.50° (WB: 0.51, SKE: 1.41, SFL: 0.54, RBFPK: -1.33) and the RBFPK
test in particular has all ROM variables except LSROMLOC mean difference results
above ±0.50° (HROM: -0.62, KROM: -1.51, LSROME: -1.44, LHROM: -1.33, LLSROM: -
0.95). The largest mean bias were seen in HROM during the WB (-2.64), KROM during

Key: MCD; Motor Control Dysfunction, WB; Waiters Bow, SKE; Seated Knee Extension, SFL; Sitting
Forward Lean, RBFPK; Rocking Back in Four Point Kneeling, ROM; Range of Movement, EG;
Electrogoniometry, KROM; Knee ROM, HROM; Hip ROM, LSROMLOC; Lumbar Spine ROM to the point
of Loss of Control, TLSROM; Total Lumbar Spine ROM, LHROM; Lateral Hip ROM, LLSROM; Lateral
Lumbar Spine ROM.
41 Chapter 3
SKE (-1.96) and KROM during RBFPK (-1.51), indicating that on average attempt 3 was
lower than attempt 2 in these variables. This indicates that the repeated ROM results
were not 100% accurate due to the bias in the measurements caused by measurement
errors (Challis, 2008).
The Bland-Altman plots and Table 8 show that there were some large limits of
agreement (LoA) (95%) up to -28° to 25° (KROMRBFPK), which represents the
absolute differences in measurements in relation to the mean of the measurements
(Enoch et al. 2011). However, the majority of the differences were within a smaller inner
range for each test then the LoA (95%); SKE (±1°-±5°) and SFL (±2°-±5°), WB (±3°-
±10°) and RBFPK (±2°-±10°). Therefore, the large variations in the differences and the
outliers of up to ±30° (RBFPK) created the large LoA (95%).
Altman and Bland (1983) stated that the definition of a repeatability coefficient, as
adopted by the British Standards Institution, is that 95% of the differences should be
less than ±2SD (or 95% LoA). They also stated that if the differences are normally
distributed then 95% of the differences will be within the LoA (95%). The Bland-Altman
plots (Figures 2-5) showed that 90-100% of all the differences between attempts 2 and
3 for all 4 tests were within the LoA (95%). SFL was the only test to have 95% or more
of all the ROM differences within the LoA (95%), with the other tests showing variable
distribution. In particular the RBFPK test had 90% of the differences within LoA (95%)
for 5 of the 6 ROM variables. The only ROM variable to have an average of 95% of all
the differences within the LoA (95%) in each test was the LLSROM. Therefore, the
Bland-Altman data suggests that between attempts 2-3 SFL was the only normally
distributed test and LLSROM was consistently normally distributed. However, the other
tests had varied distribution normality and the results from all 3 attempts (Table 7) show
that several of the ROM variables are not normally distributed and therefore non-
parametric analysis was performed.
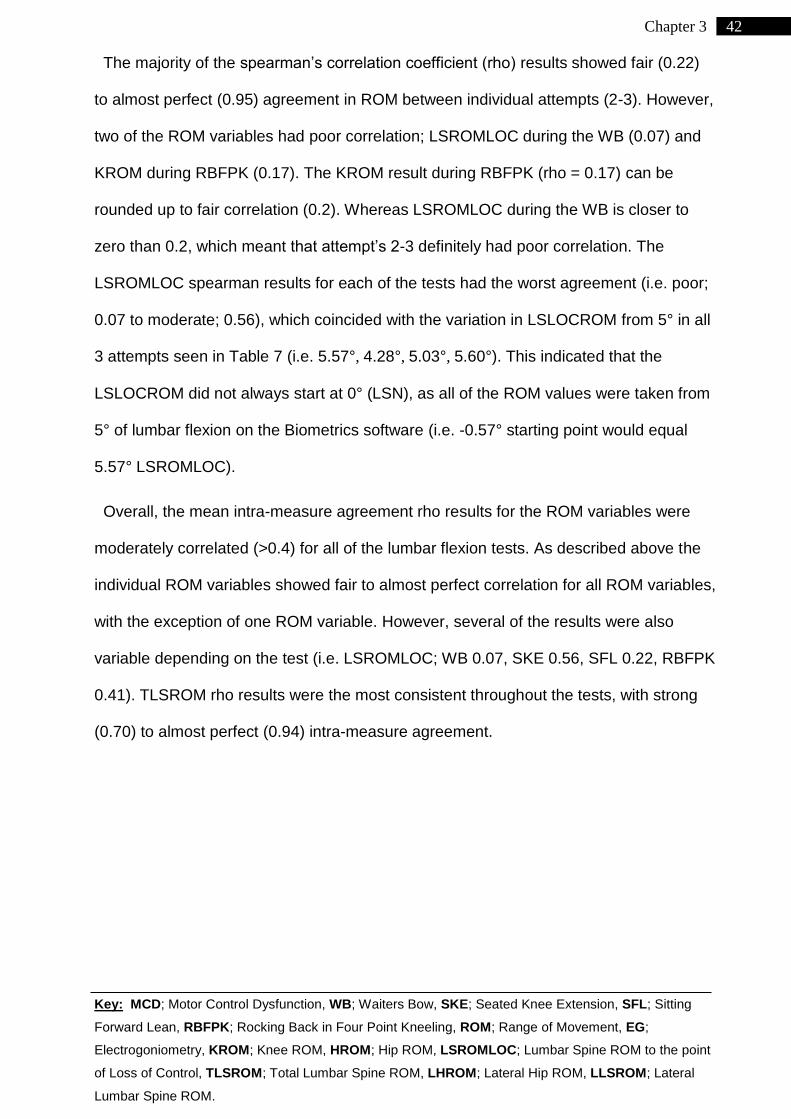
Key: MCD; Motor Control Dysfunction, WB; Waiters Bow, SKE; Seated Knee Extension, SFL; Sitting
Forward Lean, RBFPK; Rocking Back in Four Point Kneeling, ROM; Range of Movement, EG;
Electrogoniometry, KROM; Knee ROM, HROM; Hip ROM, LSROMLOC; Lumbar Spine ROM to the point
of Loss of Control, TLSROM; Total Lumbar Spine ROM, LHROM; Lateral Hip ROM, LLSROM; Lateral
Lumbar Spine ROM.
42 Chapter 3
The majority of the spearman’s correlation coefficient (rho) results showed fair (0.22)
to almost perfect (0.95) agreement in ROM between individual attempts (2-3). However,
two of the ROM variables had poor correlation; LSROMLOC during the WB (0.07) and
KROM during RBFPK (0.17). The KROM result during RBFPK (rho = 0.17) can be
rounded up to fair correlation (0.2). Whereas LSROMLOC during the WB is closer to
zero than 0.2, which meant that attempt’s 2-3 definitely had poor correlation. The
LSROMLOC spearman results for each of the tests had the worst agreement (i.e. poor;
0.07 to moderate; 0.56), which coincided with the variation in LSLOCROM from 5° in all
3 attempts seen in Table 7 (i.e. 5.57°, 4.28°, 5.03°, 5.60°). This indicated that the
LSLOCROM did not always start at 0° (LSN), as all of the ROM values were taken from
5° of lumbar flexion on the Biometrics software (i.e. -0.57° starting point would equal
5.57° LSROMLOC).
Overall, the mean intra-measure agreement rho results for the ROM variables were
moderately correlated (>0.4) for all of the lumbar flexion tests. As described above the
individual ROM variables showed fair to almost perfect correlation for all ROM variables,
with the exception of one ROM variable. However, several of the results were also
variable depending on the test (i.e. LSROMLOC; WB 0.07, SKE 0.56, SFL 0.22, RBFPK
0.41). TLSROM rho results were the most consistent throughout the tests, with strong
(0.70) to almost perfect (0.94) intra-measure agreement.

Key: MCD; Motor Control Dysfunction, WB; Waiters Bow, SKE; Seated Knee Extension, SFL; Sitting
Forward Lean, RBFPK; Rocking Back in Four Point Kneeling, ROM; Range of Movement, EG;
Electrogoniometry, KROM; Knee ROM, HROM; Hip ROM, LSROMLOC; Lumbar Spine ROM to the point
of Loss of Control, TLSROM; Total Lumbar Spine ROM, LHROM; Lateral Hip ROM, LLSROM; Lateral
Lumbar Spine ROM.
43 Chapter 3
3.3 Inter-Rater Agreement
Table 9. Inter-Rater ROM Agreement for Lumbar Flexion Tests (attempts 1-3)
KROM kappa (CI)
HROM kappa (CI)
LSROMLOC kappa (CI)
TLSROM kappa (CI)
LHROM kappa (CI)
LLSROM kappa (CI)
Mean kappa (CI)
WB 0.64
(0.51 to 0.77)
0.64 (0.51 to
0.77)
0.67 (0.53 to
0.80)
0.64 (0.51 to
0.77)
0.64 (0.51 to
0.77)
0.64 (0.51 to
0.77)
0.65 (0.51 to
0.77
SKE 0.30
(-0.15 to 0.76)
0.64 (0.51 to
0.77)
0.63 (0.51 to
0.77)
0.48 (0.17 to
0.78)
0.46 (0.22 to
0.69)
0.30 (0.07 to
0.53)
0.47 (0.22 to
0.72)
SFL 0.67
(0.53 to 0.80)
0.46 (0.08 to
0.83)
0.64 (0.51 to
0.77)
0.52 (0.32 to
0.73)
0.48 (0.17 to
0.78)
0.46 (0.04 to
0.87)
0.54 (0.28 to
0.80)
RBFPK 0.64
(0.51 to 0.77)
0.46 (0.16 to
0.75)
0.64 (0.51 to
0.77)
0.64 (0.51 to
0.77)
0.64 (0.51 to
0.77)
0.70 (0.50 to
0.91)
0.62 (0.45 to
0.79) [95 % Confidence interval (CI), Weighted Kappa Correlation (kappa)]
Table 9 shows that the attained inter-rater agreement on the ROM results ranged from
fair (k = 0.30) to strong (k = 0.70). All of the correlations are positive which means that
when one judges ROM score increased so did the other judges; therefore agreement
was made on the ROM variable. Overall, the mean inter-rater agreement results were
moderately correlated (k = 0.47 – 0.65).
The best inter-rater agreement was shown in the WB test, with moderate correlation (k
>0.60) for each ROM variable. The LLSROM during RBFPK had the highest correlation
(0.70) and both LLSROM and KROM during the SKE had the lowest correlation (0.30)
between judges. The ROM variable LSROMLOC was the most consistent variable
throughout the tests (k > 0.60). This is due to the data analysis protocol involving taking
the ROM values from 5° of lumbar flexion (point of loss of control), which should be the
same or a similar point for both judges.

Key: MCD; Motor Control Dysfunction, WB; Waiters Bow, SKE; Seated Knee Extension, SFL; Sitting
Forward Lean, RBFPK; Rocking Back in Four Point Kneeling, ROM; Range of Movement, EG;
Electrogoniometry, KROM; Knee ROM, HROM; Hip ROM, LSROMLOC; Lumbar Spine ROM to the point
of Loss of Control, TLSROM; Total Lumbar Spine ROM, LHROM; Lateral Hip ROM, LLSROM; Lateral
Lumbar Spine ROM.
44 Chapter 3
3.4 Association of Other Parameters
The electrodes were placed on the left side of each individual’s body was tested due to
limitations of the equipment (i.e. not enough electrode attachments) and for
consistency. Therefore a comparison of the LKEA and joint ROM was made rather than
RKEA. Table 10 shows this comparison along with BMI, and age correlations, which
have been associated with influencing lumbar spine ROM. The rho results demonstrate
that for the majority of the test ROM variables there is poor (0-0.2) to fair (0.2-0.4)
positive or negative correlation, but several of the results show moderate (rho 0.4-0.7)
to almost perfect (rho >0.8) correlation (Table 10, Appendix 7.0).
There were two almost perfect correlations (rho >80) seen in the female participants;
between LKEA and LSROMLOC (rho = -0.94) during the RBFPK test, and BMI and
KROM (rho = 0.81) during the SFL test. There were also four strong correlations (0.7-
0.8) seen in the female participants between age and TLSROM during both the WB test
(rho -0.78) and SFL (rho -0.72), and LHROM (rho 0.78) during the RBFPK test.
TLSROM also had strong correlation with BMI (rho 0.76) during the SKE test in the
female participants. The female participants had many moderate or above correlations
related to lumbar spine movement (Table 10). Female subjects had increased lumbar
spine ROM with increased BMI (LSROMLOC during RBFPK; rho 0.59, TLSROM during
SKE; rho 0.76), but generally female lumbar spine ROM decreased with age (TLSROM
during WB; -0.78, TLSROM during SFL; -0.72, TLSROM during RBFPK; -0.46).
However, during the SKE female subjects had increased lumbar spine ROM with
increased age (TLSROM; rho 0.44), which could be due to many participants not
reaching 5° of lumbar flexion.
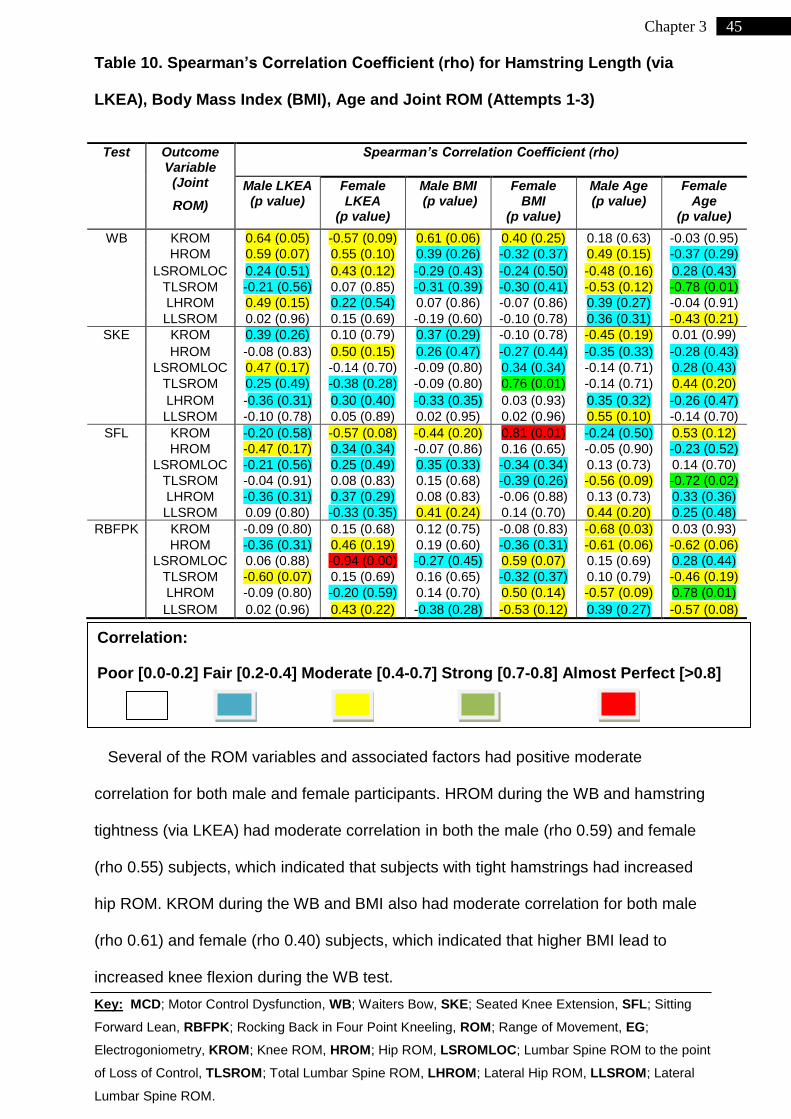
Key: MCD; Motor Control Dysfunction, WB; Waiters Bow, SKE; Seated Knee Extension, SFL; Sitting
Forward Lean, RBFPK; Rocking Back in Four Point Kneeling, ROM; Range of Movement, EG;
Electrogoniometry, KROM; Knee ROM, HROM; Hip ROM, LSROMLOC; Lumbar Spine ROM to the point
of Loss of Control, TLSROM; Total Lumbar Spine ROM, LHROM; Lateral Hip ROM, LLSROM; Lateral
Lumbar Spine ROM.
45 Chapter 3
Table 10. Spearman’s Correlation Coefficient (rho) for Hamstring Length (via
LKEA), Body Mass Index (BMI), Age and Joint ROM (Attempts 1-3)
Test Outcome Variable
(Joint
ROM)
Spearman’s Correlation Coefficient (rho)
Male LKEA (p value)
Female LKEA
(p value)
Male BMI (p value)
Female BMI
(p value)
Male Age (p value)
Female Age
(p value)
WB KROM 0.64 (0.05) -0.57 (0.09) 0.61 (0.06) 0.40 (0.25) 0.18 (0.63) -0.03 (0.95)
HROM 0.59 (0.07) 0.55 (0.10) 0.39 (0.26) -0.32 (0.37) 0.49 (0.15) -0.37 (0.29)
LSROMLOC 0.24 (0.51) 0.43 (0.12) -0.29 (0.43) -0.24 (0.50) -0.48 (0.16) 0.28 (0.43)
TLSROM -0.21 (0.56) 0.07 (0.85) -0.31 (0.39) -0.30 (0.41) -0.53 (0.12) -0.78 (0.01)
LHROM 0.49 (0.15) 0.22 (0.54) 0.07 (0.86) -0.07 (0.86) 0.39 (0.27) -0.04 (0.91)
LLSROM 0.02 (0.96) 0.15 (0.69) -0.19 (0.60) -0.10 (0.78) 0.36 (0.31) -0.43 (0.21)
SKE KROM 0.39 (0.26) 0.10 (0.79) 0.37 (0.29) -0.10 (0.78) -0.45 (0.19) 0.01 (0.99)
HROM -0.08 (0.83) 0.50 (0.15) 0.26 (0.47) -0.27 (0.44) -0.35 (0.33) -0.28 (0.43)
LSROMLOC 0.47 (0.17) -0.14 (0.70) -0.09 (0.80) 0.34 (0.34) -0.14 (0.71) 0.28 (0.43)
TLSROM 0.25 (0.49) -0.38 (0.28) -0.09 (0.80) 0.76 (0.01) -0.14 (0.71) 0.44 (0.20)
LHROM -0.36 (0.31) 0.30 (0.40) -0.33 (0.35) 0.03 (0.93) 0.35 (0.32) -0.26 (0.47)
LLSROM -0.10 (0.78) 0.05 (0.89) 0.02 (0.95) 0.02 (0.96) 0.55 (0.10) -0.14 (0.70)
SFL KROM -0.20 (0.58) -0.57 (0.08) -0.44 (0.20) 0.81 (0.01) -0.24 (0.50) 0.53 (0.12)
HROM -0.47 (0.17) 0.34 (0.34) -0.07 (0.86) 0.16 (0.65) -0.05 (0.90) -0.23 (0.52)
LSROMLOC -0.21 (0.56) 0.25 (0.49) 0.35 (0.33) -0.34 (0.34) 0.13 (0.73) 0.14 (0.70)
TLSROM -0.04 (0.91) 0.08 (0.83) 0.15 (0.68) -0.39 (0.26) -0.56 (0.09) -0.72 (0.02)
LHROM -0.36 (0.31) 0.37 (0.29) 0.08 (0.83) -0.06 (0.88) 0.13 (0.73) 0.33 (0.36)
LLSROM 0.09 (0.80) -0.33 (0.35) 0.41 (0.24) 0.14 (0.70) 0.44 (0.20) 0.25 (0.48)
RBFPK KROM -0.09 (0.80) 0.15 (0.68) 0.12 (0.75) -0.08 (0.83) -0.68 (0.03) 0.03 (0.93)
HROM -0.36 (0.31) 0.46 (0.19) 0.19 (0.60) -0.36 (0.31) -0.61 (0.06) -0.62 (0.06)
LSROMLOC 0.06 (0.88) -0.94 (0.00) -0.27 (0.45) 0.59 (0.07) 0.15 (0.69) 0.28 (0.44)
TLSROM -0.60 (0.07) 0.15 (0.69) 0.16 (0.65) -0.32 (0.37) 0.10 (0.79) -0.46 (0.19)
LHROM -0.09 (0.80) -0.20 (0.59) 0.14 (0.70) 0.50 (0.14) -0.57 (0.09) 0.78 (0.01)
LLSROM 0.02 (0.96) 0.43 (0.22) -0.38 (0.28) -0.53 (0.12) 0.39 (0.27) -0.57 (0.08)
Several of the ROM variables and associated factors had positive moderate
correlation for both male and female participants. HROM during the WB and hamstring
tightness (via LKEA) had moderate correlation in both the male (rho 0.59) and female
(rho 0.55) subjects, which indicated that subjects with tight hamstrings had increased
hip ROM. KROM during the WB and BMI also had moderate correlation for both male
(rho 0.61) and female (rho 0.40) subjects, which indicated that higher BMI lead to
increased knee flexion during the WB test.
Correlation:
Poor [0.0-0.2] Fair [0.2-0.4] Moderate [0.4-0.7] Strong [0.7-0.8] Almost Perfect [>0.8]

Key: MCD; Motor Control Dysfunction, WB; Waiters Bow, SKE; Seated Knee Extension, SFL; Sitting
Forward Lean, RBFPK; Rocking Back in Four Point Kneeling, ROM; Range of Movement, EG;
Electrogoniometry, KROM; Knee ROM, HROM; Hip ROM, LSROMLOC; Lumbar Spine ROM to the point
of Loss of Control, TLSROM; Total Lumbar Spine ROM, LHROM; Lateral Hip ROM, LLSROM; Lateral
Lumbar Spine ROM.
46 Chapter 3
Table 10 also shows that for several of the ROM variables age was negatively
correlated for both male and female subjects, indicating that with increasing age there
was decreased ROM at certain joints. Total lumbar spine ROM (TLSROM) during both
the WB and SFL tests was shown to decrease with increased age in male and female
subjects. Hip ROM was also decreased in older subjects during the RBFPK test in both
male (rho 0.61) and female (rho 0.62) subjects.
3.4.1 Lumbar Spine Movement
FIGURE 6. Lumbar Spine ROM during Flexion Control Tests
Figure 6 demonstrates that lumbar spine loss of control (5° LS flexion) occurs at a
variety of percentages of total LS ROM during the different tests (i.e. 31.4%, 73.7%,
34.9%, 38.2%). With some of the participants not loosing control of their LS during the
SKE test (i.e. average of 4.28°, Table 7), the average percentage of movement to loss
of control was high (73.7%). However, the other three tests showed that LS flexion
occurred at below 40% of the total LS movement for the majority of the flexion control
tests.
0
5
10
15
20
25
30
35
WB SKE SFL RBFPK
LSROMLOC
Total LS ROM
73.71%
34.85%
38.18%
31.41%

Key: MCD; Motor Control Dysfunction, WB; Waiters Bow, SKE; Seated Knee Extension, SFL; Sitting
Forward Lean, RBFPK; Rocking Back in Four Point Kneeling, ROM; Range of Movement, EG;
Electrogoniometry, KROM; Knee ROM, HROM; Hip ROM, LSROMLOC; Lumbar Spine ROM to the point
of Loss of Control, TLSROM; Total Lumbar Spine ROM, LHROM; Lateral Hip ROM, LLSROM; Lateral
Lumbar Spine ROM.
47 Chapter 4
4 Chapter 4
Discussion
4.1 Normative Range of Movement
Motor control is an area of interest in LBP research, as maladaptive motor control can
compromise lumbar stability and can perpetuate LBP (Barr et al. 2005, Luomajoki et al.
2008). In the past, biomechanical movement pattern assessment of the low back has
been investigated for reliability and validity, with clear differences between patients with
or without LBP during motor control tests (Luomajoki et al. 2008). However, the majority
of the previous studies relied on qualitative data (i.e. subjective observations) and many
assessed diagnostic reliability based on a whole battery of tests. Of the motor control
tests involved no studies have provided evidence-based ‘normative’ ROM values or
used biomechanical monitoring devices. To the knowledge of the researchers involved
this is only the second study to utilize a quantitative method for analyzing lumbar motor
control tests, secondary to Enoch et al. (2011). Thus no previous studies are directly
comparable with the methodology in this study.
The accuracy of ‘normative’ ROM values has been reported to be important in human
spinal movement assessment, as interventions are provided to individuals who fall
outside the ‘normative’ boundaries (Comerford and Mottram 2001a, b). Luomajoki et al.
(2007) and Enoch et al. (2011) stated that normative ROM values for correctly
performed MCD tests require establishment, as on review of the previous research on
MCD it is clear that there has been little to no evidence to support the previously
reported ROM values (Table 1). Therefore, no clear consensus has been made for
‘normative’ ROM values. The findings of this study show that the previously reported
‘normative’ ROM variables may not be accurate when measured by a quantitative
methodology. Table 7 demonstrates that the average evidence-based ROM values

Key: MCD; Motor Control Dysfunction, WB; Waiters Bow, SKE; Seated Knee Extension, SFL; Sitting
Forward Lean, RBFPK; Rocking Back in Four Point Kneeling, ROM; Range of Movement, EG;
Electrogoniometry, KROM; Knee ROM, HROM; Hip ROM, LSROMLOC; Lumbar Spine ROM to the point
of Loss of Control, TLSROM; Total Lumbar Spine ROM, LHROM; Lateral Hip ROM, LLSROM; Lateral
Lumbar Spine ROM.
48 Chapter 4
were shown to be 10-15° less than the previously reported values (Table 1). However,
the limitations of the methodology influenced the reliability of the evidence-based
‘normative’ ROM values. Therefore, the reliability and limitations of the methodology will
be the focus of this section.
4.2 Methodological Reliability
The methodological reliability is important, as with a reliable data collection and
analysis method ‘normative’ ROM values can be determined. To evaluate reliability this
study included intra-measure and inter-rater agreement. It also included standard error
of measurement (SEM) and minimal detectable change (MDC). The MDC results
provide practitioners with an estimate for the acceptable variations between two
attempts (attempts 2-3) and may indicate the accuracy of certain tests and ROM
variables. However, MDC computation relies on the assumption of data being drawn
from a normally distributed population (Kovacs et al. 2008). In this study the data was
not normally distributed, therefore SEM and MDC are presented in the results for clinical
practice and comparison with other work.
The principle findings of this study were that the majority of the lumbar flexion test
ROM variables had moderate or above (>0.4) correlation for both intra-measure and
inter-rater agreement. However, four of the ROM variables (LSROMLOC WB,
LSROMLOC SFL, KROM RBFPK and LLSROM RBFPK; Table 8) had poor (rho <0.2)
to fair (>0.2 – 0.4) intra-measure agreement and the SKE test had fair (k = 0.30) inter-
rater agreement for two of the ROM variables. Previous researchers in the area of
motor control tests for LBP have accepted that intra and inter agreement results above
moderate correlation (>0.4) are clinically relevant and reliable (Paatelma et al. 2010,
Luomajoki et al. 2007). Only 1 of the 4 tests (SKE) had moderate or above (rho >0.4)

Key: MCD; Motor Control Dysfunction, WB; Waiters Bow, SKE; Seated Knee Extension, SFL; Sitting
Forward Lean, RBFPK; Rocking Back in Four Point Kneeling, ROM; Range of Movement, EG;
Electrogoniometry, KROM; Knee ROM, HROM; Hip ROM, LSROMLOC; Lumbar Spine ROM to the point
of Loss of Control, TLSROM; Total Lumbar Spine ROM, LHROM; Lateral Hip ROM, LLSROM; Lateral
Lumbar Spine ROM.
49 Chapter 4
intra-measure agreement for all of the ROM variables (Table 8) and only 1 of the 4 tests
(SFL) had moderate or above (k >0.4) inter-rater agreement (Table 9). The spearman’s
correlation coefficient results indicated that there was variability in the method used, but
on average the tests had moderate intra and inter reliability (>0.4, Tables 8, 9). The
poor to fair results during the WB, SKE and RBFPK (Table 8) testing could have been
due to a number of issues within the methodology. Therefore, modifications to the
methodology of the study could improve the level of agreement during all of the tests
involved.
The spearman correlation coefficients (rho) used for reliability could easily disguise
large differences in the ROM measurements (Enoch et al. 2011) therefore this study
also utilized Bland-Altman plots. Bland-Altman plots demonstrate the true differences
between two individual measures (Altman and Bland, 1983). Enoch et al. (2011)
showed that Bland-Altman plots for MCD tests had the majority of the differences within
a smaller range than the limits of agreement (LoA). With the LBP group values being at
the outer range of the LoA even though the correlation coefficient results were the same
for subjects with and without LBP. This study had similar results, with the majority of the
differences being within a smaller range (i.e. from ±1° to ±10°) for all of the ROM
variables during all of the tests (Figures 2-5). However, even though only non-LBP
subjects were used there were still large variations between some of the single
measures up to approx. ±20° - 30° and large LoA, which had moderate to almost
perfect correlation coefficients (Table 8, Figures 2-5). Therefore, the Bland-Altman plots
demonstrate that there was a true variation between certain single measures (attempts
2 and 3) of up to approx. ±30° by a single examiner, which should be used as a
supplement to the correlation coefficients. Many of the ROM variables had differences
within a smaller range therefore it is possible that the outliers may be accounted for by
Key: MCD; Motor Control Dysfunction, WB; Waiters Bow, SKE; Seated Knee Extension, SFL; Sitting
Forward Lean, RBFPK; Rocking Back in Four Point Kneeling, ROM; Range of Movement, EG;
Electrogoniometry, KROM; Knee ROM, HROM; Hip ROM, LSROMLOC; Lumbar Spine ROM to the point
of Loss of Control, TLSROM; Total Lumbar Spine ROM, LHROM; Lateral Hip ROM, LLSROM; Lateral
Lumbar Spine ROM.
50 Chapter 4
the study limitations and could be improved with further adjustments to the protocols
involved.
4.3 Novice-Expert Variation
It is worth commenting that for the therapists involved in this study better protocol
training could have been performed beforehand. Dankearts et al. (2006) stated that
increased familiarity with the motor control tests can increase reliability, which may be
the same for this studies data collection and analysis process. Enoch et al. (2011),
Henry et al. (2012) and Dankearts et al. (2006) all reported that a specific training phase
can improve agreement between practitioners. Training could be useful as O’Sullivan et
al. (2010) reported that reliability may vary according to experience of those involved.
Within this study the main researcher was a novice physiotherapist, but there was also
a secondary experienced physiotherapist involved in the data analysis. During the data
analysis process there was fair (k = 0.30) to strong (k = 0.70) agreement between the
novice and expert practitioners (Table 9). This is much less than the almost perfect (k =
0.90, CI 0.74-1.04) agreement between novice practitioners Henry et al. (2012) found in
motor control tests. However, the ‘novices’ in the study by Henry et al. (2012)
underwent a training period prior to the assessments. The variation between novice and
expert practitioners in this study was similar to the research of Dankearts et al. (2006),
Enoch et al. (2011) and Luomajoki et al. (2007) who all demonstrated that
inexperienced practitioners had poor agreement with experts, due to the reliance on
‘expert opinion’ in the testing. However, the standardized data analysis protocol used in
this study (Appendix 3.0) allowed the two practitioners to on average reach moderate
agreement (k = 0.47 to 0.65), which is a step in the right direction for the methodology
being of use in a clinical or research setting (Dankearts et al. 2006).
Key: MCD; Motor Control Dysfunction, WB; Waiters Bow, SKE; Seated Knee Extension, SFL; Sitting
Forward Lean, RBFPK; Rocking Back in Four Point Kneeling, ROM; Range of Movement, EG;
Electrogoniometry, KROM; Knee ROM, HROM; Hip ROM, LSROMLOC; Lumbar Spine ROM to the point
of Loss of Control, TLSROM; Total Lumbar Spine ROM, LHROM; Lateral Hip ROM, LLSROM; Lateral
Lumbar Spine ROM.
51 Chapter 4
The novice practitioner performed the data collection which involved teaching the
tests; however their inexperience influenced participant performance of the tests. As
previously stated the researcher involved in the data collection was a novice practitioner
who had little training in the use of MCD testing. This influenced the reliability of the
testing, as the average number of attempts that had to be made by each subject to
proficiently perform the WB was shown to approximately 7 (i.e. 4 practice with the
researcher giving feedback and 3 recorded with no feedback) and the other tests had
an average of 5-6 attempts (Table 6). The protocol initially stated that 5 attempts would
be adequate (i.e. 2 practice attempts with feedback and 3 recorded attempts with no
feedback), which was underestimated by the researcher. Although, Comerford and
Mottram (2012) reported that 3-8 repetitions should be sufficient for teaching, learning
and familiarization of the test movements. This indicated that a higher level of expertise
may be required in order to help the participants perform MCD tests correctly within 3-5
attempts, which could be achieved via a training period (Enoch et al. 2011, Dankearts et
al. 2006, O’Sullivan et al. 2010). Alternatively more teaching repetitions (i.e. 8+) could
have been performed with feedback before 3 attempts without feedback, as Comerford
and Mottram (2012) stated that the test should involve reproducing the movement
without feedback. Improvement in reliability would be due to the test being tested and
not the practitioners’ ability to instruct the test (Comerford and Mottram, 2012).
4.4 Feed-Forward and Feed-Back Mechanisms
The worst reliability for both intra and inter-agreement was during the WB, where the
lumbar spine range of movement to the point of loss of control (LSROMLOC) variable
had poor correlation (rho 0.07). However, the inter-rater agreement for the WB was
shown to be moderately (k >0.6) correlated for all of the ROM variables. The intra-
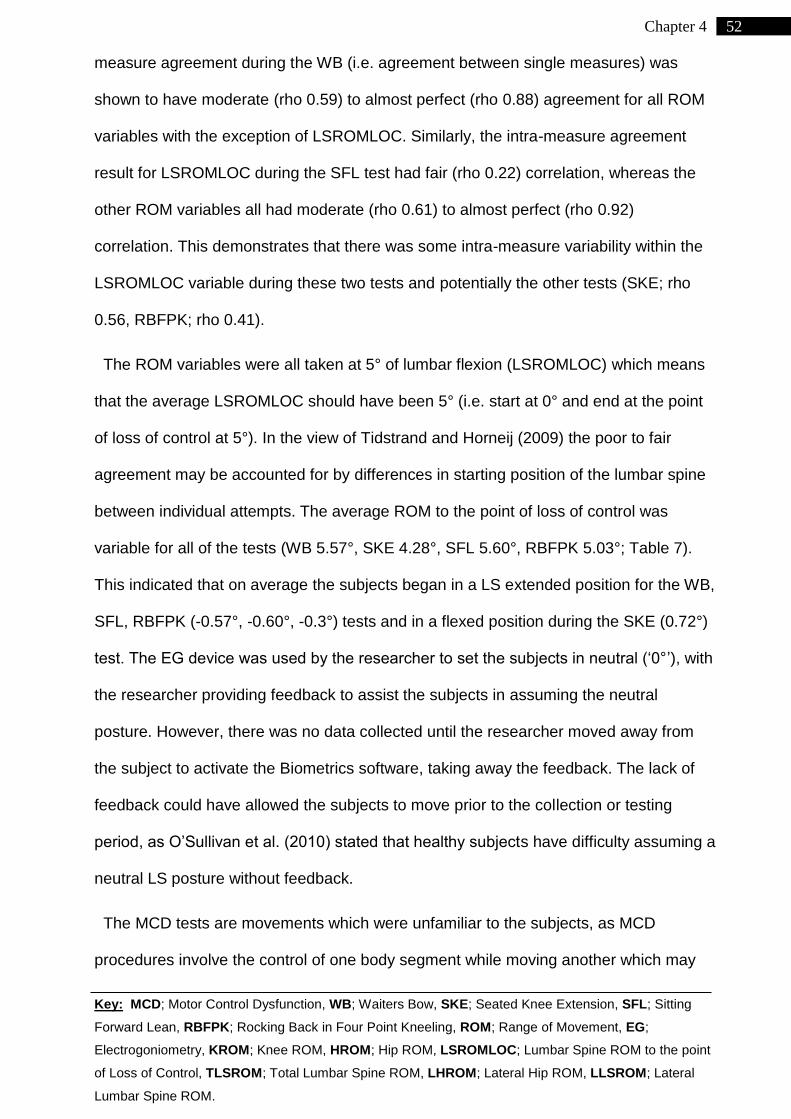
Key: MCD; Motor Control Dysfunction, WB; Waiters Bow, SKE; Seated Knee Extension, SFL; Sitting
Forward Lean, RBFPK; Rocking Back in Four Point Kneeling, ROM; Range of Movement, EG;
Electrogoniometry, KROM; Knee ROM, HROM; Hip ROM, LSROMLOC; Lumbar Spine ROM to the point
of Loss of Control, TLSROM; Total Lumbar Spine ROM, LHROM; Lateral Hip ROM, LLSROM; Lateral
Lumbar Spine ROM.
52 Chapter 4
measure agreement during the WB (i.e. agreement between single measures) was
shown to have moderate (rho 0.59) to almost perfect (rho 0.88) agreement for all ROM
variables with the exception of LSROMLOC. Similarly, the intra-measure agreement
result for LSROMLOC during the SFL test had fair (rho 0.22) correlation, whereas the
other ROM variables all had moderate (rho 0.61) to almost perfect (rho 0.92)
correlation. This demonstrates that there was some intra-measure variability within the
LSROMLOC variable during these two tests and potentially the other tests (SKE; rho
0.56, RBFPK; rho 0.41).
The ROM variables were all taken at 5° of lumbar flexion (LSROMLOC) which means
that the average LSROMLOC should have been 5° (i.e. start at 0° and end at the point
of loss of control at 5°). In the view of Tidstrand and Horneij (2009) the poor to fair
agreement may be accounted for by differences in starting position of the lumbar spine
between individual attempts. The average ROM to the point of loss of control was
variable for all of the tests (WB 5.57°, SKE 4.28°, SFL 5.60°, RBFPK 5.03°; Table 7).
This indicated that on average the subjects began in a LS extended position for the WB,
SFL, RBFPK (-0.57°, -0.60°, -0.3°) tests and in a flexed position during the SKE (0.72°)
test. The EG device was used by the researcher to set the subjects in neutral (‘0°’), with
the researcher providing feedback to assist the subjects in assuming the neutral
posture. However, there was no data collected until the researcher moved away from
the subject to activate the Biometrics software, taking away the feedback. The lack of
feedback could have allowed the subjects to move prior to the collection or testing
period, as O’Sullivan et al. (2010) stated that healthy subjects have difficulty assuming a
neutral LS posture without feedback.
The MCD tests are movements which were unfamiliar to the subjects, as MCD
procedures involve the control of one body segment while moving another which may

Key: MCD; Motor Control Dysfunction, WB; Waiters Bow, SKE; Seated Knee Extension, SFL; Sitting
Forward Lean, RBFPK; Rocking Back in Four Point Kneeling, ROM; Range of Movement, EG;
Electrogoniometry, KROM; Knee ROM, HROM; Hip ROM, LSROMLOC; Lumbar Spine ROM to the point
of Loss of Control, TLSROM; Total Lumbar Spine ROM, LHROM; Lateral Hip ROM, LLSROM; Lateral
Lumbar Spine ROM.
53 Chapter 4
not regularly done in daily activities (Sahrmann, 2002, Comerford and Mottram, 2012).
Therefore, the external tactile and auditory feedback given by the researcher may also
have been a factor in the subjects’ ability to perform the tests, as during the recorded
attempts there was no feedback. O’Sullivan et al. (2010) reported that even subjects
without LBP find it difficult to assume postural positions with no feedback. Studies
involving local segmental muscle control state that feedback via tactile, verbal and
visual means is a critically important to aid patient performance (Hides, Richardson and
Hodges, 2004, Herbert, Heiss and Basso, 2008). Radebold et al. (2001) and Lee et al.
(2012) reported that LBP patients performed postural control tests worse with their eyes
closed, which they believed was due to proprioception damage leading to increased
reliance on visual feedback. Feedback therefore is a key factor to correct performance
of the motor control tests involved in this study in both healthy and LBP subjects. Wand
et al. (2012) demonstrated that visualization can also improve performance of repeated
spinal movements. Mirror visual feedback could have been utilised during test
performance to allow patients to visualize their movement (Wand et al. 2012).
The movement prior to the subject performing the test may also have been due to
feed-forward anticipatory movement once the feed-back had been removed (Zeinali-
Davarani, et al. 2008, Brumagne et al. 2008). The change in pressure on inter-vertebral
discs (i.e. 100% pressure is normal standing; 150% standing flexion; 140% normal
sitting; 185% sitting flexion) could have triggered an initial feed-forward response
(Norris, 2000, Indahl, Holm and Bogduk, 2009). After performing several of the test
movements prior to recording the data pre-programmed feed-forward adjustments, firing
patterns, amplitudes of activation and re-organisation of trunk muscle representation at
the motor cortex would have been made by the participants (Muthukrishnan et al. 2010,
Hodges, 2004). These short-term motor memory factors become predictable and

Key: MCD; Motor Control Dysfunction, WB; Waiters Bow, SKE; Seated Knee Extension, SFL; Sitting
Forward Lean, RBFPK; Rocking Back in Four Point Kneeling, ROM; Range of Movement, EG;
Electrogoniometry, KROM; Knee ROM, HROM; Hip ROM, LSROMLOC; Lumbar Spine ROM to the point
of Loss of Control, TLSROM; Total Lumbar Spine ROM, LHROM; Lateral Hip ROM, LLSROM; Lateral
Lumbar Spine ROM.
54 Chapter 4
possibly led to feed-forward anticipatory activation of deep local (e.g. deep multifidus,
transverse abdominals) and superficial global muscles (e.g. erector spinae, latissimuss
dorsi, gluetius maximus), with movement being made in advance of the imposed forces
(Gill and Callaghan, 1998, Hodges, 2004). However, anticipatory adjustments are based
on a prediction and are therefore suboptimal (Latash, 2012). Anticipation (e.g. hip
strategy) in this study was a subjective observation, as no data was collected while the
subject was positioned into neutral or before voluntary movement occurred. Anticipatory
adjustments usually occur at 100ms prior to muscle activation whereas voluntary task
specific corrections in posture occur after 150ms (Latash, 2012). Therefore with no
electrogoniometry (EG) or electromyography (EMG) activity recorded it is difficult to
definitively comment on this issue. Gill and Callaghan (1998) showed that there was no
difference in short-term motor memory between subjects with or without LBP; therefore
altered muscle activation, feed-forward mechanisms and difficulty in performing the
tests would be the same for LBP groups.
4.5 Skin Movement
During the RBFPK, SFL and WB tests several ROM variables showed poor (rho >0.2)
to fair (rho <0.2 – 0.4) intra-measure agreement (Table 8), which indicated that there
were issues with the reliability of the data collection. The low agreement could be
accounted for by skin movement during the attempts, which has not been reported in
other low back motor control studies. Skin movement was the main limitation of this
study and was observed during all of the MCD tests and meant that true angles could
not be assessed (Appendix 3.0), therefore knee, hip and lumbar spine ROM made
during the tests was analyzed. This has implications on the tests themselves as skin

Key: MCD; Motor Control Dysfunction, WB; Waiters Bow, SKE; Seated Knee Extension, SFL; Sitting
Forward Lean, RBFPK; Rocking Back in Four Point Kneeling, ROM; Range of Movement, EG;
Electrogoniometry, KROM; Knee ROM, HROM; Hip ROM, LSROMLOC; Lumbar Spine ROM to the point
of Loss of Control, TLSROM; Total Lumbar Spine ROM, LHROM; Lateral Hip ROM, LLSROM; Lateral
Lumbar Spine ROM.
55 Chapter 4
movement can adversely affect findings when measured with skin mounted devices
(Chockalingam et al. 2002).
Skin movement creates electrode displacement, which is an issue because the
measurement of a joint ROM by electrogoniometry (EG) depends on a change in
voltage between the two end blocks of each electrode. Kiran et al. (2010) reported that
skin movement during flexion of the knee and hip interferes with the change in voltage
between the two blocks and alters the ROM values obtained. Similarly, Rowe et al.
(2001) stated when using EG as much as 20° of movement can be made purely from
skin movement during flexion or extension. Therefore, in order to reduce the movement
of the electrodes Rowe et al. (2001) used long plastic strips attached to the EG and to
the lateral borders of the skin. They also utilized stiff foam blocks under the electrodes
to account for abduction or adduction due to body shape and elastic straps to apply
pressure on the electrodes. However, Piriyaprasarth et al. (2008) stated that the use of
the adaptations Rowe et al. (2001) still encounter inaccuracies due to skin slippage. The
foam blocks actually increased skin movement causing substantial errors in abduction
and adduction. Although, Rowe et al. (2001) overall reported reduced measurement
error they still found 1°-2° variation between 3D Vicon system and EG. However,
Pomeroy et al. (2006) demonstrated that these two devices are not interchangeable
measures of ROM. Therefore, accurate attachment of the EG electrodes is vital in order
to obtain valid measurements of ROM (Piriyaprasarth et al. 2008).
Skin movement is affected by BMI (Table 9); larger BMI may cause larger skin
movement error (Kuo, Tully and Galea, 2008). Larger BMI in the female group was
shown to have moderate to almost perfect correlation with increased ROM in several of
the ROM variables (e.g. LSROMLOC; 0.59, LHROM; 0.50 during RBFPK, KROM; 0.81
during SFL, TLSROM; 0.76 during SKE and KROM; 0.40 during WB in the females).

Key: MCD; Motor Control Dysfunction, WB; Waiters Bow, SKE; Seated Knee Extension, SFL; Sitting
Forward Lean, RBFPK; Rocking Back in Four Point Kneeling, ROM; Range of Movement, EG;
Electrogoniometry, KROM; Knee ROM, HROM; Hip ROM, LSROMLOC; Lumbar Spine ROM to the point
of Loss of Control, TLSROM; Total Lumbar Spine ROM, LHROM; Lateral Hip ROM, LLSROM; Lateral
Lumbar Spine ROM.
56 Chapter 4
Only two ROM variables were increased with larger BMI in the male group (e.g. KROM;
0.61 during WB and LLSROM; 0.41 during SFL). In particular, during the WB (rho 0.61,
0.40) and SFL (rho -0.44, 0.81) tests skin movement due to larger BMI may have
affected the KROM results for both males and females. Previous studies which have
utilized EG to measure knee flexion and extension have shown that skin movement can
adversely affect results. Cappozzo et al. (1996) reported that lateral femoral epicondyle
markers can be displaced posteriorly up to 4 cm during knee flexion. Similarly a study
by Kiran et al. (2010) showed that EG analysis of the knee joint can be adversely
affected by skin distraction during flexion and extension activities. Kuo, Tully and Galea
(2008) also reported that lateral thigh skin markers can be displaced during hip and
knee flexion, which could account for the deviations in the WB, SFL and RBFPK results
(Appendix 6.0).
With increased age there was decreased TLSROM in the WB (male; -0.53, female; -
0.78), SFL (male; -0.56, female; -0.72) and RBFPK (female; -0.46) tests. This agreed
with previous research that has shown that LS ROM decreases with age (Intolo et al.
2009). However, the age of the participants had moderate to strong positive (rho 0.4>)
or negative (rho <-0.4) correlation with many of the other ROM variables (Table 10)
indicating that ROM increased or decreased with increased age at certain joints. This
could be due to older aged participants having looser, softer skin creating skin
movement (Kuo, Tully and Galea, 2008). The affected ROM values were at known
areas of displacement; the lateral thigh, knee and lumbar spine (Table 10) (Kuo, Tully
and Galea, 2008). However, there was a lack of variation in age due to the small
sample size (n=20) and convenience of the sample, therefore this study is unable to
make definitive conclusions about the influence of age on the ROM variables.

Key: MCD; Motor Control Dysfunction, WB; Waiters Bow, SKE; Seated Knee Extension, SFL; Sitting
Forward Lean, RBFPK; Rocking Back in Four Point Kneeling, ROM; Range of Movement, EG;
Electrogoniometry, KROM; Knee ROM, HROM; Hip ROM, LSROMLOC; Lumbar Spine ROM to the point
of Loss of Control, TLSROM; Total Lumbar Spine ROM, LHROM; Lateral Hip ROM, LLSROM; Lateral
Lumbar Spine ROM.
57 Chapter 4
In the view of Rowe et al. (2001) due to skin movement the results of this study may
be invalid measures of the ROM of the underlying structures. Therefore, other
biomechanical devices may be more accurate when monitoring ROM during motor
control tests; such as the 3D Vicon system, skeletal mounted devices, magnetic
resonance imaging (MRI) etc. However, these devices are invasive, costly, require more
time and could not be easily used in a clinical setting by physiotherapists, but could be
used in future studies to establish ‘normative’ ROM values (O’Sullivan et al. 2010,
Paatelma, Karvonen and Heinonen, 2010, Borghuis, Hof and Lemmink, 2008, Fritz,
Erhard and Hagen, 1998).
4.6 Fasciae Influence on Range of Movement
The LS ROM measurements were potentially influenced by feed-forward mechanisms
tensioning the fasciae of the lumbar region. In the view of Chen et al. (2012) and
Alexander (2007) passive treatments such as fascial taping and massage work to
reduce pain because underlying fasciae and skin are interconnected, which can
influence skin movement (Tozzi, Bongiorno and Vitturini, 2012). The thoraco-lumbar
fasciae (TLF) encloses the muscles of the lumbar spine and has three sections;
posterior, anterior and middle (Gilchrist et al. 2003). Fascial tension in these sections
contributes to spinal stability, but there remains debate on its possible influences on
spinal control (Hodges, 2004b). TLF is influenced by proprioception (Barker and Briggs,
2007) which causes activation of muscles. Findley and Schleip (2007) stated that
lumbar fasciae transmits tension between trunk and leg muscles (i.e. latissimus dorsi on
one side and gluteus maximus on the other side), which possibly influenced the LS
ROM results. Feed-forward early activation of muscles can tension fascia and stimulate
connected muscles prior to voluntary muscle contraction during test performance (Tesh

Key: MCD; Motor Control Dysfunction, WB; Waiters Bow, SKE; Seated Knee Extension, SFL; Sitting
Forward Lean, RBFPK; Rocking Back in Four Point Kneeling, ROM; Range of Movement, EG;
Electrogoniometry, KROM; Knee ROM, HROM; Hip ROM, LSROMLOC; Lumbar Spine ROM to the point
of Loss of Control, TLSROM; Total Lumbar Spine ROM, LHROM; Lateral Hip ROM, LLSROM; Lateral
Lumbar Spine ROM.
58 Chapter 4
et al., 1987), which could alter skin position. This could have contributed to the variation
in lumbar spine ROM during the MCD tests.
The posterior layer of the TLF regulates tension between both local (i.e. internal and
external obliques) and global muscles (i.e. latissimuss dorsi and gluetius maximus), as it
has extensive muscular attachments (Stevens et al. 2007). However, the transverse
abdominals (TrA) may have had the largest influence on tensioning fascia due to its
extensive attachments and known feed-forward anticipatory activation during trunk
movements in healthy subjects (Massé-Alarie et al. 2012, Hodges, 2004a, b).
Anticipatory activation of TrA maintains fascial influence on segmental neutral zone
motion (Barker and Briggs, 2007). Tension in the TrA aponeurosis occurs during spinal
flexion and is transmitted to the vertebrae via the posterior lumbar fasciae (PLF), which
indicates that PLF has a role in spinal control (Barker et al., 2004, Barker et al. 2006).
Therefore, tension of the PLF influences movement and produces extension moments,
which could account for the extended lumbar starting positions for several of the tests
(Table 7; WB -0.57°, SFL -0.60°, RBFPK, -0.3°) (Barker et al. 2006, Tesh et al. 1987,
Hodges and Richardson, 1997). When tension is applied by the TrA and latissimus
dorsi, 50% of the force passes transversely in the PLF (Barker et al. 2004). This could
account for the variable intra (rho 0.32-0.73) and inter (k = 0.30-0.70) agreement in
lateral lumbar spine movement (Table 8, 9). In combination the multifidus (MF) may
have also been activated, as several studies have shown that TrA and MF activation is
linked to form a ‘corset’ around the waist to stabilize the spine (Kavcic, Grenier and
McGill, 2004, Danneels et al. 2001, Hides et al. 2001). Therefore, the use of
electromyography (EMG) on key muscles (e.g. TrA, MF, Latissimus dorsi, internal and
external obliques etc.) during the tests could be used to assess their influence on
lumbar spine ROM.

Key: MCD; Motor Control Dysfunction, WB; Waiters Bow, SKE; Seated Knee Extension, SFL; Sitting
Forward Lean, RBFPK; Rocking Back in Four Point Kneeling, ROM; Range of Movement, EG;
Electrogoniometry, KROM; Knee ROM, HROM; Hip ROM, LSROMLOC; Lumbar Spine ROM to the point
of Loss of Control, TLSROM; Total Lumbar Spine ROM, LHROM; Lateral Hip ROM, LLSROM; Lateral
Lumbar Spine ROM.
59 Chapter 4
4.7 Lumbar Spine Neutral Zone Range of Movement
Lumbar spine ROM to the point of loss of control was variable depending on the test
(i.e. WB; 31.4%, SKE; 73.7%, SFL; 34.85% and RBFPK; 38.18%; Figure 6). Grauer et
al. (2000) reported that the lumbar spine (LS) neutral zone ROM is usually around 25%
of total LS ROM in human subjects. Although, the LS neutral zone according to Panjabi
(1992b) involves inter-vertebral motion where little resistance is offered by the passive
spinal column when muscular and neurological factors are removed (Tidstrand and
Horneij, 2009). Therefore, it is not accurate to simply assume that 25% of spinal
movement during these tests is NZ, as all of the tests involve muscular and neurological
control.
The results of the lumbar percentage ROM to loss of control indicated that some tests
may be easier to pass than others. Several of the subjects were able to complete the
SKE test without failing (i.e. flexion of spine passed 5°), which was demonstrated by the
mean LSROMLOC result being below 5° (i.e. 4.28°; Table 7). This increased the
percentage of lumbar movement to the point of loss of control to 73.7%, which
coincided with the SKE test to be the only test to have moderate or above intra-measure
correlation for all ROM variables (Table 8). Whereas, during other tests such as the
RBFPK test the average percentage LS ROM (38.18%) would be classed as
dysfunctional by Sarhmann (2002) who stated that lumbar spine flexion should occur
after 50% of full lumbar spine movement during the RBFPK test. After observation of
the RBFPK tests Sahrmann (2002) would provide an intervention to reduce pain and
faulty movement (i.e. reducing lumbar flexion and increasing hip flexion). However, due
to the limitations previously discussed in this section (i.e. skin movement, fasciae
tensioning etc.) the accuracy of the percentage of LS ROM to loss of control (5°) may
have been influenced. The variation in percentage of movement to loss of control also
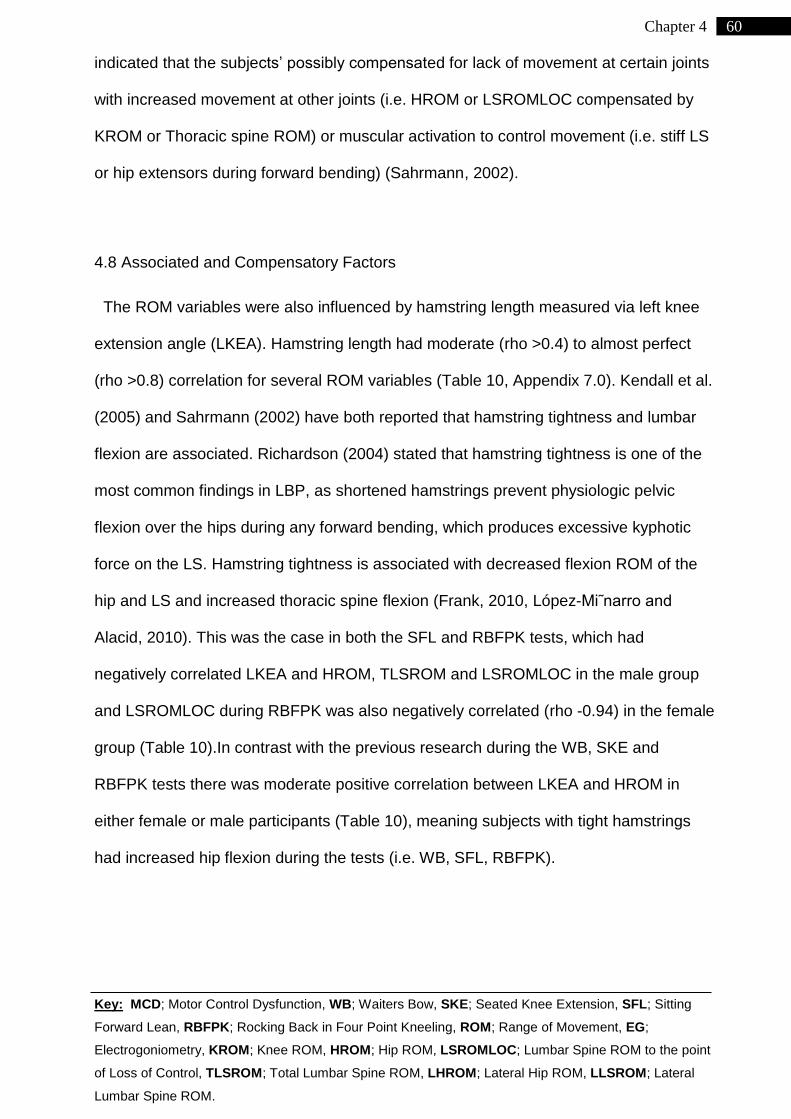
Key: MCD; Motor Control Dysfunction, WB; Waiters Bow, SKE; Seated Knee Extension, SFL; Sitting
Forward Lean, RBFPK; Rocking Back in Four Point Kneeling, ROM; Range of Movement, EG;
Electrogoniometry, KROM; Knee ROM, HROM; Hip ROM, LSROMLOC; Lumbar Spine ROM to the point
of Loss of Control, TLSROM; Total Lumbar Spine ROM, LHROM; Lateral Hip ROM, LLSROM; Lateral
Lumbar Spine ROM.
60 Chapter 4
indicated that the subjects’ possibly compensated for lack of movement at certain joints
with increased movement at other joints (i.e. HROM or LSROMLOC compensated by
KROM or Thoracic spine ROM) or muscular activation to control movement (i.e. stiff LS
or hip extensors during forward bending) (Sahrmann, 2002).
4.8 Associated and Compensatory Factors
The ROM variables were also influenced by hamstring length measured via left knee
extension angle (LKEA). Hamstring length had moderate (rho >0.4) to almost perfect
(rho >0.8) correlation for several ROM variables (Table 10, Appendix 7.0). Kendall et al.
(2005) and Sahrmann (2002) have both reported that hamstring tightness and lumbar
flexion are associated. Richardson (2004) stated that hamstring tightness is one of the
most common findings in LBP, as shortened hamstrings prevent physiologic pelvic
flexion over the hips during any forward bending, which produces excessive kyphotic
force on the LS. Hamstring tightness is associated with decreased flexion ROM of the
hip and LS and increased thoracic spine flexion (Frank, 2010, López-Mi˜narro and
Alacid, 2010). This was the case in both the SFL and RBFPK tests, which had
negatively correlated LKEA and HROM, TLSROM and LSROMLOC in the male group
and LSROMLOC during RBFPK was also negatively correlated (rho -0.94) in the female
group (Table 10).In contrast with the previous research during the WB, SKE and
RBFPK tests there was moderate positive correlation between LKEA and HROM in
either female or male participants (Table 10), meaning subjects with tight hamstrings
had increased hip flexion during the tests (i.e. WB, SFL, RBFPK).

Key: MCD; Motor Control Dysfunction, WB; Waiters Bow, SKE; Seated Knee Extension, SFL; Sitting
Forward Lean, RBFPK; Rocking Back in Four Point Kneeling, ROM; Range of Movement, EG;
Electrogoniometry, KROM; Knee ROM, HROM; Hip ROM, LSROMLOC; Lumbar Spine ROM to the point
of Loss of Control, TLSROM; Total Lumbar Spine ROM, LHROM; Lateral Hip ROM, LLSROM; Lateral
Lumbar Spine ROM.
61 Chapter 4
Knee flexion by the male subjects and possibly increased thoracic spine flexion by the
female subjects may have compensated for hamstring tightness in the WB and RBFPK
tests. Male KROM during the WB (rho 0.64) had a moderate correlation with LKEA,
which meant that males flexed their knees with their hips during the WB. Sahrmann
(2002) stated knee flexion is important in male subjects in order to prevent faulty
hamstring strategy. Sahrmann (2002) believed that males should simultaneously flex
their hips and knees during any forward bending due to the increased load of their
upper body. Increased load was demonstrated in the increased knee ROM in higher
BMI subjects during the WB test (rho 0.64). Sahrmann (2002) also stated that for many
males it is not an issue of hamstring length but rather a motor control issue of the trunk
and pelvis, due to the large upper body which increases the activity of the hamstrings.
Increased activity of the hamstrings was likely to have occurred in a feed-forward
manner within the asymptomatic participants, but may be delayed in LBP patients
(Richardson, 2004). However, hamstring activity was not recorded and should be
included in any future studies.
Female LSROMLOC during the WB (rho 0.43) test also had a moderate correlation
with LKEA, which indicated that participants with tight hamstrings had larger lumbar
Figure 7 – Example of Lumbar Spine Electrode Placement
Sacrum
Lumbar
spine
Thoracic
spine

Key: MCD; Motor Control Dysfunction, WB; Waiters Bow, SKE; Seated Knee Extension, SFL; Sitting
Forward Lean, RBFPK; Rocking Back in Four Point Kneeling, ROM; Range of Movement, EG;
Electrogoniometry, KROM; Knee ROM, HROM; Hip ROM, LSROMLOC; Lumbar Spine ROM to the point
of Loss of Control, TLSROM; Total Lumbar Spine ROM, LHROM; Lateral Hip ROM, LLSROM; Lateral
Lumbar Spine ROM.
62 Chapter 4
flexion ROM to the point of loss of control (5°). On average the female group had
smaller height than the male group, which has implications with the Biometrics device
used. The Lumbar spine EG skin marker used was place with one electrode on the first
sacral vertebra and one in a longitudinal line on the spine (Figure 7). However, with a lot
of the participants, especially the shorter females, the 2nd electrode was placed either
on first lumbar vertebra or into the thoracic spine (Figure 7). Lumbar pelvic rhythm
during trunk flexion involves the co-ordination of lumbar and thoracic flexion with
anterior pelvic tilt. To control this co-ordination the thoracic spine can increase in flexion
to compensate for tight hamstrings (López-Mi˜narro and Alacid, 2010). Therefore,
participants with tight hamstrings may have had increased thoracic spine flexion and
this was recorded rather than increased LS ROM, which would have affected ROM
acquired.
4.9 Recommendations for Future Studies
This study was unable to meet its overall aims, as there was some variation in the
reliability of the testing. However several aspects have been discussed in this section
which require consideration and analysis in the future. Ideally future studies should use
other more accurate biomechanical devices (i.e. 3D Vicon system, magnetic resonance
imaging (MRI), skeletal markers etc.) to develop ‘normative’ ROM values for lumbar
flexion control tests. However, this study informs modifications for future work using the
methodology involved in this study to accurately provide normative ROM values using
electrongoniometry (EG). This would allow inexperienced practitioners to utilise EG in a
clinical setting and potentially improve the accuracy of MCD assessment.
Recommendations for modifications include utilising a similar protocol to Rowe et al.
(2001) to prevent electrode slippage and reduce skin movement errors. Other

Key: MCD; Motor Control Dysfunction, WB; Waiters Bow, SKE; Seated Knee Extension, SFL; Sitting
Forward Lean, RBFPK; Rocking Back in Four Point Kneeling, ROM; Range of Movement, EG;
Electrogoniometry, KROM; Knee ROM, HROM; Hip ROM, LSROMLOC; Lumbar Spine ROM to the point
of Loss of Control, TLSROM; Total Lumbar Spine ROM, LHROM; Lateral Hip ROM, LLSROM; Lateral
Lumbar Spine ROM.
63 Chapter 4
recommendations involve a training period being performed prior to the testing, with
both the expert and novice practitioners being involved in the testing for comparison.
Due to feed-forward anticipatory responses occurring prior to recorded test movement,
data recording should begin before the subjects are set into a neutral posture.
Feedback from the practitioner (i.e. tactile, verbal or visual) and from visual devices (i.e.
ultrasound, video or mirror) is also important for each subject to perform each test
optimally. During each test Electromyography is required on key local (e.g. TrA, MF
etc.) and global (e.g. erector spinae, hamstrings etc.) muscles to assess their activation
patterns and influence on ROM.
Test validity was not assessed in this or other recent studies, which needs
establishment in order to provide accurate clinical assessments (Enoch et al. 2011,
Luomajoki et al. 2007, 2008). Validity is important as the test movements involve many
other factors such as skin movement, fascial tensioning, hamstring tightness and
muscle activity etc. which need to be investigated in future validity studies possibly
utilizing functional MRI, ultrasound or the 3D Vicon system (Hidalgo et al. 2012).

Key: MCD; Motor Control Dysfunction, WB; Waiters Bow, SKE; Seated Knee Extension, SFL; Sitting
Forward Lean, RBFPK; Rocking Back in Four Point Kneeling, ROM; Range of Movement, EG;
Electrogoniometry, KROM; Knee ROM, HROM; Hip ROM, LSROMLOC; Lumbar Spine ROM to the point
of Loss of Control, TLSROM; Total Lumbar Spine ROM, LHROM; Lateral Hip ROM, LLSROM; Lateral
Lumbar Spine ROM.
64 Chapter 5
5 Chapter 5
Conclusions
The overall aim of this study was to create a ‘normative’ data set for ROM variables
during lumbar flexion control tests. However, this study was not able to provide accurate
‘normative’ ROM values due to the limitations within the methodology i.e. skin
movement etc. The studies limitations adversely affected the reliability of the ROM
results, however the majority of the results had moderate or above reliability. Only four
of the ROM variables had below moderate reliability. Therefore, the conclusion of this
study was that the MCD testing methodology is feasible but requires modifications in
future studies.
The modifications required involve a more rigorous data collection protocol, which will
allow for testing accuracy. Specific recommendations for further study included rigorous
attachment of surface electrodes, increased training for both the practitioners involved
and the subjects, feedback to participants during testing, recording of data prior to test
performance and the use of electromyography on key muscles. However, these
modifications need to take into account other influences on lumbar ROM and overall
study reliability.
Subsequent studies need to have larger cohorts of subjects, as this was a pilot study
and that the overall study limitations may not be an issue in larger studies. The small
number of participants (n=20) may have affected the level of correlation between some
of the results i.e. over or under estimation. However, the number of non-LBP
participants was similar to previous MCD research (Luomajoki et al. 2007, Enoch et al.
2011, Roussel et al. 2009a, Paatelma, Karvonen and Heinonen, 2010). With larger
studies age and socioeconomic background diversity is required as lumbar ROM control
may differ across age groups, whereas this study consisted mainly of university

Key: MCD; Motor Control Dysfunction, WB; Waiters Bow, SKE; Seated Knee Extension, SFL; Sitting
Forward Lean, RBFPK; Rocking Back in Four Point Kneeling, ROM; Range of Movement, EG;
Electrogoniometry, KROM; Knee ROM, HROM; Hip ROM, LSROMLOC; Lumbar Spine ROM to the point
of Loss of Control, TLSROM; Total Lumbar Spine ROM, LHROM; Lateral Hip ROM, LLSROM; Lateral
Lumbar Spine ROM.
65 Chapter 5
students. The participants also had to volunteer for the study which may not represent a
true normal population sample.
Acknowledgements
The author would like to thank all the volunteers involved in the study and to the people
who provided support throughout the project.
66 Chapter 5
References
Alexander, R. (2007) Functional Fascial Taping, SportEx Dynamics, 12(Apr), pp. 10-13.
Altman, D.G. and Bland, J.M. (1983) Measurement in Medicine: the Analysis of Method
Comparison Studies, The Statistician, 32(3), pp. 307-317.
Barker, P.J. and Briggs, C.A. (2007) Anatomy and Biomechanics of the Lumbar
Fasciae: Implications for Lumbopelvic Control and Clinical Practice. In: Vleeming, A.,
Mooney, V. and Stoeckart, S. (2007) ‘Movement, Stability and Lumbopelvic Pain:
Integration of Research and Therapy’, London, Churchill Livingstone Elsevier, Ch 3, pp.
63-73.
Barker, P.J., Briggs, C.A. and Bogeski, G. (2004) Tensile Transmission across the
Lumbar Fasciae in Unembalmed Cadavers: Effects of Tension to Various Muscular
Attachments, Spine, 29(2): pp. 129-138.
Barker, P.J., Guggenheimer, K.T., Grkovic, I., Briggs, C.A., Jones, D.C., Thomas, C.D.
and Hodges, P.W. (2006) Effects of Tensioning the Lumbar Fasciae on Segmental
Stiffness during Flexion and Extension, Spine, 31(4), pp. 397-405.
Barr, K.P., Griggs, M. and Cadby, T. (2005) Lumbar Stabilization: Core Concepts and
Current Literature, Part 1, American Journal Physical Medicine and Rehabilitation,
84(6), pp. 473-480.
Ben-Masaud, A., Solomonow, D., Davidson, B., He Zhou, B., Lu, Y., Patel, V. and
Solomonow, M. (2009) Motor Control of Lumbar Instability Following Exposure to Cyclic
Load Magnitudes, European Spine Journal, 18(7), pp. 1022-1034.
Bible, J.E., Biswas, D., Miller, C.P., Whang, P.G. and Grauer, J.N. (2010) Normal
Functional Range of Motion of the Lumbar Spine During 15 Activities of Daily Living,
Journal of Spinal Disorders and Techniques, 23(2), pp. 106-112.
67 Chapter 5
Biely, S., Smith, S. and Silfies, S. (2006) Clinical Instability of the Lumbar Spine:
Diagnosis and Intervention, Orthopeadic Practice, 18(3), pp. 11-18.
Biometrics Ltd. (2011) [Online] Available at: http://www.biometricsltd.com/gonio.htm.
(Accessed: 2nd October 2011).
Bisdas, S., Bohning, D.E., Besˇenski, N., Nicholas, J.S., Rumboldt, Z. (2008)
Reproducibility, Interrater Agreement, and Age-Related Changes of Fractional
Anisotropy Measures at 3T in Healthy Subjects: Effect of the Applied b-Value, American
Journal of Neuroradiology, 29, pp. 1128-1133.
Bland J.M. and Altman D.G. (2003) Applying the Right Statistics: Analyses of
Measurement Studies. Ultrasound in Obstetrics and Gynecology, 22, 85-93.
Bland, J.M. and Altman, D.G. (1986) Statistical methods for assessing agreement
between two methods of clinical measurement, Lancet, 1(8476), pp. 307-310.
Borghuis, J., Hof, A.L. and Lemmink, A.P.M. (2008) The Importance of Sensory-Motor
Control in Providing Core Stability, Journal of Sports Medicine, 38(11), pp. 893-916.
Borman, N., Trudelle-Jackson, E. and Smith, S. (2011) Effect of stretch positions on
hamstring muscle length, lumbar flexion range of motion, and lumbar curvature in
healthy adults, Physiotherapy theory and practice, 27(2), pp. 146-154.
Braun, C., Heinz, U., Schweizer, R., Wiech, K., Birbaumer, N., Topka, H. (2001)
Dynamic Organisation of the Saomatosensory Cortex Induced by Motor Acitivity, Brain,
124, pp. 2259-2267.
Bronner, S., Agraharasamakulam, S. and Ojofeitimi, S. (2010) Reliability and validity of
electrogoniometry measurement of lower extremity movement, Journal of Medical
Engineering Technology, 34(3), pp. 232-242.

68 Chapter 5
Brumagne, S., Janssens, L., Janssens, E. and Goddyn, L. (2008) Altered Postural
Control in Anticipation of Postural Instability in Persons with Recurrent Low Back Pain,
Gait and Posture, 28(4), pp. 657-662.
Cappozzo A, Catani F, Leardini A, Benedetti MG, DellaCroce U. (1996) Position and
orientation in space of bones during movement: experimental artefacts. Clinical
Biomechanics, 11, pp. 90–100.
Carregaro, R. and Gilcoury, H. (2009) Does reduced hamstring flexibility affect trunk
and pelvic movement strategies during manual handling? International Journal of
Industrial Ergonomics, 39(1), pp. 115-120.
Challis, J.H. (2008) Data Processing and Error Estimation: In: Payton, C.J. and Bartlett,
R.M., ‘Biomechanical Evaluation of Movement in Sport and Exercise, The British
Association of Sport and Exercise Science Guidelines’, Oxford, United Kingdom,
Routledge, Ch. 7, pp. 129-152.
Chaudhary, R., Beaupre, L.A., Johnston, D.W.C. (2008) Knee Range of Motion During
the First Two Years After Use of Posterior Cruciate-Stabilizing or Posterior Cruciate-
Retaining Total Knee Prostheses: A Randomized Clinical Trial, The Journal of Bone and
Joint Surgery, 90(12), pp. 2579-2586.
Chen, S., Alexander, R., Kai Lo, S. and Cook, J. (2012) Effects of Functional Fascial
Taping on Pain and Function in Patients with Non-Specific Low Back Pain: A Pilot
Randomized Controlled Trial, Clinical Rehabilitation, 0(0), pp. 1-10.
Chockalingam, N., Dangerfield, P.H., Giakas, G. and Cochrane, T. (2002) Study of
Marker Placements in the Back for Opto-Eletronic Motion Analysis, Studies in Health
technology and Informatics, 88, pp. 105-109.

69 Chapter 5
Comerford, M.J. and Mottram, S.L. (2012) ‘Kinetic Control: The Management of
Uncontrolled Movement’, Sydney N.S.W., Australia, Churchill Livingstone Elsevier.
Comerford, MJ and Mottram, SL. (2001a) Movement and Stability Dysfunction –
Contemporary Developments, Manual Therapy, 6(1), pp. 15-26.
Comerford, MJ and Mottram, SL. (2001b) Functional Stability Re-training: Principles and
Strategies for Managing Mechanical Dysfunction, Manual therapy, 6(1), pp. 3-14.
Comerford, MJ and Mottram, SL. (2003) Functional stability retraining: Principles and
strategies for managing mechanical dysfunction. In: K.S. Beeton, Editor, Manual
therapy masterclasses—The vertebral column, Churchill Livingstone, UK, pp. 155–175.
Cook, C., Brismee, J.M. and Sizer, P.S. Jr. (2006) Subjective and objective descriptors
of clinical lumbar spine instability: a Delphi study, Manual Therapy, 11(1), pp. 11-21.
Damstra, J., Fourie, Z., Huddleston-Slater, J. and Ren, Y. (2011) Reliability and the
smallest detectable difference of measurements on 3-dimensional cone-beam
computed tomography images, American journal of orthodontics and dentofacial
orthopedics, 140(3), pp. e107-114.
Dankaerts, W., O’Sullivan, P.B., Straker, L.M., Burnett, A.F. and Skouen, J.S. (2006)
The Inter-examiner Reliability of a Classification Method for Non-specific Chronic Low
Back Pain Patients with Motor Control Impairment, Manual Therapy, 11(1), pp. 28-39.
Danneels, L.A., Vanderstraeten, G.G., Cambier, D.C., Witvrouw, E.E., Bourgois, J.,
Dankaerts, W. and De Cuyper, H.J. (2001) Effects of three different training modalities
on the cross sectional area of the lumbar multifidus muscle in patients with chronic low
back pain. British Journal of Sports Medicine, 35, pp. 186-191.
Davis, S.D., Quinn, R.O., Whiteman, C.T., Williams, J.D. and Young, C.R. (2008)
Concurrent validity of four clinical tests used to measure hamstring flexibility, Journal of
Strength and Conditioning Research, 22(2), pp. 583-588.

70 Chapter 5
Demoulin, C., Distree, V., Tomasella, M., Crielaard, J.M. and Vanderthommen, M.
(2007) Lumbar Functional Instability: A Critical Appraisal of the Literature, Annales de
Readaptation et de Medecine Physique, 50(8), pp. 677-684.
Desmurget, M. and Grafton, S. (2000) Forward Modelling allows Feedback Control for
Fast Raching Movments, Trends in Cognitive Neurosciences, 4(11), pp. 423-431.
Enoch, F., Kjaer, P., Elkjaer, A., Remvig, L. and Juul-Kristensen, B. (2011) Inter-
examiner reproducibility of tests for lumbar motor control, BMC Musculoskeletal
Disorders, 12(1), pp. 114.
Falla, D., Jull, G. Hodges, P.W. (2004) Feedforward Actvitity of the Cervical Flexor
Muscles during Voluntary Arm Movements is Delayed in Chronic Neck Pain,
Experimental Brain Research, 157(1), pp. 43-48.
Findley, T.W. and Schleip, R. (2007) ‘Fascia Research; Basic Science and Implications
for Conventional and Complementary Health Care’, Elsevier GmbH, Munich.
Flor, H. (2003) Cortical Reorganisation and Chronic Pain: Implications for Rehabilitation,
Journal of Rehabilitation Medicine, 41, pp. 66-72.
Frank, L.W. (2010) Postoperative Rehabilitation of Lumbar Spine Patients. In: Phillips,
F.M. and Lauryssen, C. (2010) ‘The Lumbar Intervertebral Disc’, New York, Thieme
Medical Publishers.
Fritz, J.M., Erhard, R.E. and Hagen, B.F. (1998) Segmental Instability of the Lumbar
Spine, Physical Therapy, 78(8), pp. 889-896.
Gajdosik, R. and Bohannon, R. (1987) Clinical measurement of range of motion.
Review of goniometry emphasizing reliability and validity, Physical Therapy, 67(12), pp.
1867-1872.
71 Chapter 5
Gay, R.E., Ilharreborde, B., Zhao, K., Zhao, C. and An, K. (2006) Sagittal plane motion
in the human lumbarspine: Comparison of the in vitro quasistatic neutral zone and
dynamic motion parameters, Clinical Biomechanics, 21(9), pp. 914-919.
Gibson, J. and McCarron, T. (2004) Feedforward Muscle Activity: An Investigation into
the Onset and Activity of Internal Oblique During Two Functional Reaching Tasks,
Journal of Bodywork and Movement Therapies, 8(2), pp. 104-113.
Gilchrist, R., Frey, M., Nadler, S. (2003) Muscular Control of the Lumbar Spine, Pain
Physician, 6(3), pp. 361-368.
Gill, KP and Callaghan, MJ (1998) The Measurement of Lumbar Proprioception in
Individuals With and Without Low Back Pain, Neuroscience, 23(3), pp. 371-377.
Goertzen, D.J., Lane, C. and Oxland, T.R. (2004) Neutral zone and range of motion in
the spine are greater with stepwise loading than with a continuous loading protocol. An
in vitro porcine investigation, Journal of Biomechanics, 37(2), pp. 257-261.
Goldby, L., Moore, A., Doust, J., Trew, M. (2006) A randomised controlled trial
investigating the efficiency of musculoskeletal physiotherapy on chronic low back
disorder, Spine, 31(10), pp. 1083-1093.
Granata, K. And Orishimo, K. (2001) Response of trunk muscle coactivation to changes
in spinal stability, Journal of Biomechanics, 34(9), pp. 1117-1123.
Grauer, J.N., Erulkar, J.S., Patel, T.C. and Panjabi, M.M. (2000) Biomechanical
evaluation of the New Zealand white rabbit lumbar spine: a physiologic characterization,
European Spine Journal, 9(3), pp. 250-255.

72 Chapter 5
Grimshaw, J., Eccles, M. and Tetroe, J. (2004) Implementing clinical guidelines: current
evidence and future implications, Journal of continuing education in Health, 24, pp. 31-
37.
Hall, L., Tsao, H., MscDonald, D., Coppieters, M. and Hodges, P.W. (2009) Immediate
effects of co-contraction training on motor control of the trunk muscles in people with
recurrent low back pain, Journal of Electromyography and Kinesiology, 19(5), pp. 763-
773.
Henry, S.M., Van Dillen, L.R., Trombley, A.R., Dee, J.M. and Bunn, J.Y. (2012)
Reliability of novice raters in using the movement system impairment approach to
classify people with low back pain, Manual Therapy, In press.
Herbert, W.J., Heiss, D.G. and Basso, D.M. (2008) Influence of Feedback Schedule in
Motor Performance and Learning of a Lumbar Multifidus Muscle Task Using
Rehabilitative Ultrasound Imaging: A Randomized Clinical Trial, Physical Therapy,
88(2), pp. 261-269.
Hidalgo, B., Gilliaux, M., Poncin, W. and Detrembleur, C. (2012) Reliability and Validity
of a Kinematic Spine Model During Active Trunk Movement in Healthy Subjects and
Patients with Chronic Non-Specific Low Back Pain, Journal of Rehabilitation Medicine,
In Press.
Hides, J., Gwendolen, A. and Richardson, C.A. (2001) Long-Term Effects of Specific
Stabilizing Exercises for First-Episode Low Back Pain, Exercise Physiology and
Physical Exam, 26(11), pp. E243-E248.
Hides, J., Stanton, S., Wilson, S., Freke, M., McMahon, S. and Sims, K. (2010)
Retraining motor control of abdominal muscles among elite cricketers with low back
pain, Scandinavian journal of medicine & science in sports, 20(6), pp. 834-842.
73 Chapter 5
Hides, J., Stanton, W., Mendis, M. and Gildea, J. (2011) Effect of stabilisation training
on trunk muscle size, motor control, low back pain and player availability among elite
australian rules football players, British Journal of Sports Medicine, 45(4), pp. 320.
Hides, J.A., Richardson, C.A. and Hodges, P.W. (2004) Local Segmental Control. In:
Richardson, C.A., Hodges, P.W. (2004) ‘Therapeutic Exercise for Lumbopelvic
Stabilisation: a Motor Control Approach for the Treatment and Prevention of Low Back
Pain’, New York, Churchill Livingstone, pp. 185-220.
Hodges, P.W. (2001) Changes in Motor Planning of Feedforward Postural Responses
of the Trunk Muscles in Low Back Pain, Experimental Brain research, 141, pp. 261-266.
Hodges, P.W. (2004a) Specific Joint Protection of the Spinal Segments. In: Richardson,
C., Hodges, P. and Hides, J. (2004) ‘Therapeutic Exercise for Lumbopelvic Stabilisation:
A Motor Control Approach for the Treatment and Prevention of Low Back Pain’, London,
Churchill Livingstone, Ch 2, pp. 13-28.
Hodges, P.W. (2004b) Abdominal Mechanism and Support of the Lumbar Spine and
Pelvis. In: Richardson, C., Hodges, P. and Hides, J. (2004) ‘Therapeutic Exercise for
Lumbopelvic Stabilisation: A Motor Control Approach for the Treatment and Prevention
of Low Back Pain’, London, Churchill Livingstone, Ch 3, pp. 31-57.
Hodges, P.W. (2011) Pain and Motor control: From the Laboratory to Rehabilitation,
Journal of Electromyography and Kinesiology, 21(2), pp. 220-228.
Hodges, P.W. and Moseley, G.L. (2003) Pain and motor control of the lumbropelvic
region: effect and possible mechanisms, Journal of Electromyography and Kinesiology,
13(4), pp. 361-370.
Hodges, P.W. and Richardson, C. (1997) Feedforward Contraction of Transverse
Abdominis is not Influenced by the Direction of Arm Movement, Experimental Brain
Research, 114(2), pp. 362-370.

74 Chapter 5
Hodges, P.W., Moseley, G.L., Gabrielsson, A. and Gandevia, S.C. (2003) Experimental
muscle pain changes feedforward postural responses of the trunk muscles,
Experimental Brain Research, 151(2), pp. 262-271.
Hoffman, S.L., Johnson, M.B., Zou, D. and Van Dillen, L.R. (2012) Differences in End-
range Lumbar Flexion During Slumped and Forward Bending Between Low Back Pain
Subgroups and Genders, Manual Therapy, 17(2), pp. 157-163.
Indahl, A., Holm, S.H. and Bogduk, N. (2009) Sensory Motor Control of the Spine – A
Key to Low Back Pain, European Musculoskeletal Review, 4(1), pp. 44-47.
Intolo, P., Milosavljevic, S., Baxter, D. G., Carman, A. B., Pal, P. and Munn, J. (2009)
The effect of age on lumbar range of motion: A systematic review, Manual Therapy,
14(6), pp. 595-604.
Kavcic, N., Grenier, S. and McGill, S. (2004) Determining the stabilizing role of
individual torso muscles during rehabilitation exercises, Spine, 29(11), pp. 1254-1265.
Kendall FP, McCreary EK, Provance PG, Rodgers MM, Romani WA. (2005) ‘Muscles:
testing and function with posture and pain’, 5th ed. Baltimore, Lippincott Williams &
Wilkins.
Kiran, D., Carlson, M., Medrano, D. and Smith, D.R. (2010) Correlation of Three
Different Knee Joint Position Sense Measures, Physical Therapy in Sport, 11(3), pp. 81-
85.
Koley, S., Kaur, N. and Sandhu, J.J. (2009) Relationship of Obesity with Lumbar Range
of Motion in School going Children of Amritsar, Punjab, India, The Internet Journal of
Biological Anthropology, 3(1), (Available at:
http://www.ispub.com/journal/the_internet_journal_of_biological_anthropology/volume_3
_number_1_63/article_printable/relationship-of-obesity-with-lumbar-range-of-motion-in-
school-going-children-of-amritsar-punjab-india.html, Accessed: 11/10/2009).

75 Chapter 5
Kovacs, F.M., Abraira, V., Royuela, A., Corcoll, J., Alegre, L., Tomas, M., Mir, M.A.,
Cano, A., Muriel, A., Zamora, J., Gil del Real, M.T., Gestoso, M. and Mufraggi, N.
(2008) Minimum Detectable and Minimal Clinically Important Changes for Pain in
Patients with Nonspecific Neck Pain, BMC Musculoskeletal Disorders, 9, pp. 43.
Kuo, Y., Tully, E. and Galea, M. (2008) Skin movement errors in measurement of sagittal
lumbar and hip angles in young and elderly subjects, Gait and Posture, 27, pp. 264-270.
Lancaster, G.A., Dodd, S. and Williamson, P.R. (2002) Design and analysis of pilot
studies: recommendations for good practice, Journal of Evaluation in Clinical Practice,
10(2), pp. 307-312.
Latash, M.L. (2012) ‘Fundamentals of Motor Control’, London, Elsevier, pp. 220.
Lederman, E. (2011) The fall of the postural-structural-biomechanical model in manual
and physical therapies: exemplified by lower back pain, Journal of bodywork and
movement therapies, 15(2), pp. 131-138.
Lee, D.C., Ham, Y.W. and Sung, P.S. (2012) Effect of Visual Input on Normalized
Standing Stability in Subjects with Recurrent Low Back Pain, Gait and Posture, 36(3),
pp. 580-585.
Liebenson, C., Karpowicz, A.M., Brown, S.H., Howarth, S.J., McGill, S.M. (2009) The
Active Straight Leg Raise Test and Lumbar Spine Stability, Physical Medicine and
Rehabilitation, 1(6), pp. 530-535.
López-Mi˜narro, P.A. and Alacid, F. (2010) Influence of hamstring muscle extensibility
on spinal curvatures in young athletes, Science and Sport, 25, pp. 188-193.
Luomajoki, H., Kool, J., de Bruin, E.D. and Airaksinen, O. (2007) Reliability of
Movement Control Tests in the Lumbar Spine, BMC Musculoskeletal Disorders, 8(90),
pp. 1471-2474.

76 Chapter 5
Luomajoki, H., Kool, J., de Bruin, E.D. and Airaksinen, O. (2008) Movement Control
Tests of the Low Back; Evaluation of the Difference Between Patients with Low Back
Pain and Healthy Controls, BMC Musculoskeletal Disorders, 9, pp. 170-182.
Luomajoki, H., Kool, J., de Bruin, E.D. and Airaksinen, O. (2010) Improvement in Low
Back Movement Control, Decreased Pain and Disability, Resulting from Specific
Exercise Intervention, Sports Medicine, Arthroscopy, Rehabilitation, Therapy and
Technology, 2, pp. 11-18.
Marras, W., Davis, K., Ferguson, S., Lucas, B. and Gupta, P. (2001) Spine Loading
characteristics of patients with Low Back Pain compared with asymptomatic individuals,
Spine, 26, pp. 2566-2574.
Marras, W.S. and Wongsam, P.E. (1986) Flexibility and Velocity of the Normal and
Impaired Lumbar Spine, The Archives of Physical Medicine and Rehabilitation, 67, pp.
213-217.
Massé-Alarie, H., Flamand, V.H., Moffet, H. and Schneider, C. (2012) Corticomotor
control of deep abdominal muscles in chronic low back pain and anticipatory postural
adjustments, Experimental Brain Research, 218(1), pp. 99-109.
Mayhew, T.P., Norton, B.J. and Sahrmann, S.A. (1983) Electromyographic study of the
relationship between hamstring and abdominal muscles during a unilateral straight leg
raise, Physical Therapy, 63(11), pp. 1769-1773.
McGil, SM., Grenier, S., Kavcic, N. and Cholewicki, J. (2003) Coordination of muscle
activity to assure stability of the lumbar spine, Journal of Electromyography and
Kinesiology, 13(4), pp. 353-359.
McGill, S. (2007) ‘Low Back Pain Disorders: evidence based practice and rehabilitation’,
Champaign, USA, Human Kinetics.
Mead, J. (2006) ‘Responsibilities of being a Physiotherapist’, In: Porter, S. (2008) (14th
ed.) ‘Tidy’s Physiotherapy’, London, Butterworth Heineman, pp. 1-19.

77 Chapter 5
Mottram, SL and Comerford, MJ (2008) A new perspective on risk assessment,
Physical Therapy in Sport, 9(1), pp. 40-51.
Mulholland, R.C. (2008) The Myth of Lumbar Instability: The Importance of Abnormal
Loading as a Cause of Low Back Pain, European Spine Journal, 17(5), pp. 619-625.
Murphy, D.R., Byfield, D., McCarthy, P., Humphreys, K., Gregory, A.A. and Rochon, R.
(2006) Interexaminer Reliability of the Hip Extension Test for Suspected Impaired Motor
Control of the Lumbar Spine, Journal of Manipulative and Physiological Therapeutics,
29(5), pp. 374-377.
Muthukrishnan, R., Shenoy, S., Jaspal, S., Nellikunja, S. and Fernandes, S. (2010) The
Differential Effects of Core Stabilization Exercise Regime and Conventional
Physiotherapy Regime on Postural Control Parameters During Perturbation in Patients
with Movement and Control Impairment Chronic Low Back Pain, Sport Medicine,
Arthroscopy, Rehabilitation, Therapy and Technology, 2, pp. 13.
Nakipoglu, G.F., Karagoz, A. and Ozgirgin, N. (2008) The Biomechanics of the
Lumbosacral Region in Acute and Chronic Low Back Pain Patients, Pain Physician,
11(4), pp. 505-511.
Norris, C.M. (2000) ‘Back Stability’, United States of America, Human Kinetics.
Norris, C.M. and Matthews, M. (2005) Inter-tester reliability of a self-monitored active
knee extension test, Journal of Bodywork and Movement Therapies, 9(4), pp. 256-259.
O’Sullivan, K., O’Dea, P., Dankaerts, W., O’Sullivan, P., Clifford, A. and O’Sullivan, L.
(2010) Neutral Lumbar Spine Sitting Posture in Pain-Free Subjects, Manual Therapy,
15(6), pp. 557-561.
O’Sullivan, P.B. (2000) Lumbar Segmental ‘instability’: Clinical Presentation and
Specific Stabilizing Exercise Management, Manual therapy, 5(1), pp. 2-12.

78 Chapter 5
O’Sullivan, P.B. (2005) Diagnosis and classification of chronic low back pain disorders:
maladaptive movement and motor control impairments as underlying mechanism,
Manual therapy, 10(4), pp. 242-255.
Paatelma, M., Karvonen, E. And Heinonen, A. (2010) Inter- and intra-tester reliability of
selected clinical tests in examining patients with early phase lumbar spine and sacroiliac
joint pain and dysfunction, Advances in Physiotherapy, 12, pp. 74-80.
Pal, P., Milosavljevic, S., Sole, G. and Johnson, G. (2007) Hip and lumbar continuous
motion characteristics during flexion and return in young healthy males, European spine
journal, 16(6), pp. 741-747.
Panjabi, M.M. (1992a), The stabilisation of the spine. Part 1. Function, dysfunction,
adaptation and enhancement, Journal of spinal disorders, 5(4), pp. 383-389.
Panjabi, M.M. (1992b), The stabilisation of the spine. Part 2. Neutral zone and instability
hypothesis, Journal of spinal disorders, 5(4), pp. 390-396.
Panjabi, M.M. (2003) Clinical Spinal Instability and Low Back Pain, Journal of
Electromyography and Kinesiology, 13(4), pp. 371-379.
Panjabi, M.M. (2006) A Hypothesis of Chronic Back Pain: Ligament Subfailure Lead to
Muscle Control Dysfunction, European Spine Journal, 15(5), pp. 668-676.
Panjabi, M.M., Goel, V.K., Kaigle-Holm, A.M. and Pope, M.H. (2004) Clinical Spinal
Instability Resulting from Injuery and Degeneration. In: Herowitz, H.N., Dvorak, J., Bell,
G., Nordin, M. and Grob, D. (2004) ‘The Lumbar Spine’ (3rd Ed.), Lippincott Williams
and Wilkins, Philidelphia, USA.
Pennal, G.F, Conn, C.S., McDonald, G., Dale, G. and Garside, H. (1972) Motion
Studies of the Lumbar Spine: a Preliminary Report, Journal of Bone and Joint Surgery,
British Volume, 54(3), pp. 442-452.

79 Chapter 5
Piriyaprasarth, P., Morris, M.E., Winter, A. and Bialocerkowski, A.E. (2008) The
Reliability of Knee Joint Position Testing using Electrogoniometry, BMC Musculoskeletal
Disorders, 9(6), pp. 1-10.
Pomeroy, V.M., Evans, E. and Richards, J.D. (2006) Agreement between an
electrogoniometer and motion analysis system measuring angular velocity of the knee
during walking after stroke, Physiotherapy, 92(3), pp. 159-165.
Pope, M. and Panjabi, M. (1985) Biomechanical Definition of Spinal Instability, Spine,
10, pp. 255-256.
Radebold, A., Cholewicki, J., Polzhofer, G.K. and Greene, H.S. (2001) Impaired
Postural Control of the Lumbar Spine Is Associated With Delayed Muscle Response
Times in Patients With Chronic Idiopathic Low Back Pain, Spine: Biomechanics, 26(7),
pp. 724-730.
Renkawitz, T., Boluki, D. and Grifka, J. (2006) The association of low back pain,
neuromuscular imbalance, and trunk extension strength in athletes, The Spine Journal,
6: 673-683
Richardson, C. (2004) Impairments in Muscles Controlling Pelvic Orientation and
Weightbearing. In: Richardson, C., Hodges, P. and Hides, J. (2004) ‘Therapeutic
Exercise for Lumbopelvic Stabilisation: A Motor Control Approach for the Treatment and
Prevention of Low Back Pain’, London, Churchill Livingstone, Ch 12, pp. 163-171.
Roussel, N.A., Nijis, J., Truijen, S., Vervecken, L., Mottram, S. and Stassijns, G. (2009b)
Altered breathing patterns during lumbopelvic motor control tests in chronic low back
pain: a case-control study, European spine journal, 18(7), pp. 1066-1073.
Roussel, N.A., Nijs, J., Mottram, S., Moorsel, A.V., Truijen, S. and Stassijns, G. (2009a)
Altered lumbopelvic movement control but not generalized joint hypermobility is

80 Chapter 5
associated with increased injury in dancers. A prospective study, Manual Therapy, 14,
pp. 530-535.
Rowe, P.J., Myles, C.M., Hillmann, S.J. and Hazlewood, M.E. (2001) Validation of
Flexible Electrogoniometry as a measure of Joint Kinematics, Physiotherapy, 87(9), pp.
479-488.
Sahrmann, S. A. (2002). ‘Diagnosis and treatment of movement impairment syndrome’,
1st ed. USA, Mosby.
Schreiber, J. and Stern, P. (2005) A Review of the Literature on Evidence-Based
Practice in Physical Therapy, The Internet Journal of Allied Health Sciences and
Practice, 3(4), pp. 1-10.
Schulz, K.F. and Grimes, D.A. (2005) Sample Size Calculations in Randomised Trials:
Mandatory and Mystical, The Lancet, 365(9467), pp. 1348-1353.
Shin, G., Shu, Y., Li, Z., Jiang, Z. and Mirka, G. (2004) Influence of knee angle and
individual flexibility on the flexion-relaxation response of the low back musculature,
Journal of Electromyography and Kinesiology, 14(4), pp. 485-494.
Shumway-cook, A. and Woollacot, M.H. (2001) ‘Motor Control: Theory and Practical
Applications’ (2nd Ed.), Baltimore, USA, Lippincott Williams and Wilkins, pp. 26-29.
Sterling, M., Jull, G. and Wright, A. (2001) The effect of musculoskeletal pain on motor
activity and control, The journal of pain: official journal of the American Pain Society,
2(3), pp. 135-145.
Stevens, V., Vleeming, A., Bouche, K., Mahieu, N., Vanderstraeten, G., & Danneels, L.
(2007). Electromyographic activity of trunk and hip muscles during stabilization
exercises in four-point kneeling in healthy volunteers. European spine journal official
publication of the European Spine Society the European Spinal Deformity Society and
the European Section of the Cervical Spine Research Society, 16(5), 711-718.

81 Chapter 5
Stuss, D.T., Winocur, G. and Robertson, I.H. (1999) ‘Cognitive Neurorehabilitation’,
Cambridge University Press, Cambridge, pp. 220.
Suni, J., Rinne, M., Natri, A., Pasanen, M., Parkkari, J. and Alaranta, H. (2006) Control
of the Lumbar Neutral Zone Decreases Low Back Pain and Improves Self-Evaluated
Work Abilit: A 12-Month Randomized Controlled Study, Spine, 31(18), pp. E611-E620.
Szulc, P., Lewandowski, J. and Marecki, B. (2000) Verification of selected anatomic
landmarks used as reference points for universal goniometer positioning during knee
joint mobility range measurements, Journal of Diagnostics and Medical Technology,
7(2), pp. 312-315.
Tesh, K.M., Dunn, J.S. and Evans, J.H. (1987) The Abdominal Muscles and Vertebral
Stability, Spine, 12(5), pp. 501-508.
Tidstrand, J. and Horneij, E. (2009) Inter-rater Reliability of Three Standardized
Functional Tests in Patients with Low Back Pain, BMC Musculoskeletal Disorders,
10(1), pp. 58-65.
Tozzi, P., Bongiorno, D. and Vitturini, C. (2012) Low back pain and kidney mobility: local
osteopathic fascial manipulation decreases pain perception and improves renal mobility,
Journal of Bodywork and Movement Therapies, 16(3), pp. 381-391.
Uswatte, G. and Taub, E. (1999) Constraint-induced movement therapy: new
approaches to outcome measurement in rehabilitation. In: Stuss, D.T., Winocur, G and
Robertson, I.H. (1999) ‘Cognitive neuroscience’, Cambridge University Press,
Cambridge, United Kingdom, pp. 220.
van Dillen, L. R., Sahrmann, S. A., Norton, B. J., Caldwell, C. A., Fleming, D. A.,
McDonnell, M. K. & Woolsey, N. B. (1998). Reliability of physical examination items
used for classification of patients with low back pain. Physical Therapy, 78, pp. 979‐
988.

82 Chapter 5
van Vliet, P.M. and Heneghan, N.R. (2006) Motor Control and the Management of
Musculoskeletal Dysfunction, Manual Therapy, 11(3), pp. 208-213.
Vet, H.C., Terwee, C.B., Knol, D.L. and Bouter, L.M. (2006) When to use Agreement
verus Reliability Measures, Journal of Clinical Epidemiology, 59, pp. 1033-1039.
Vibe Fersum, K., OʹSullivan, P. B., Kvale, A. and Skouen, J. S. (2009). Inter-examiner
reliability of a classification system for patients with non-specific low back pain. Manual
Therapy, 14, pp. 555-561.
Wagner, H., Anders, C., Puta, C., Petrovitch, A., Morl, F., Schilling, N., Witte, H. and
Blickhan, R. (2005) Musculoskeletal Support of Lumbar Spine Stability,
Pathophysiology, 12(4), pp. 257-265.
Wand, B.M., Tulloch, V.M., George, P.J., Smith, A.J., Goucke, R., O’Connell, N.E. and
Moseley, G.L. (2012) Seeing it Helps: Movement-related Back Pain id Reduced by
Visualization of the Back During Movement, Clinical Journal of Pain, 29(7), pp. 602-608.
Wang, P.T., King, C.E., Do, A.H. and Nenadic, Z. (2011) A durable, low-cost
electrogoniometer for dynamic measurement of joint trajectories, Mechanical
Engineering and Physics, 33(5), pp. 546-552.
White, L.J. and Thomas, S.T. (2002) The rater reliability of assessments of symptom
provocation in patients with low back pain. Journal of Back and Musculoskeletal
Rehabilitation, 16(2), pp. 83-90.
Williams, J.M., Haq, I. and Lee, R.Y. (2010) Is Pain the Cause of Altered Biomechanical
Functions in Low Back Pain Sufferers? Human Movement Science, 29(2), pp. 311-325.
Woolsey, NB, Sahrmann, SA, and Dixon, L. (1988), Triaxial movement of the pelvis
during prone knee flexion, Physical Therapy, 68, pp. 827.
83 Chapter 5
Wrigley, A.T., Albert, W.J., Deluzio, K.J. and Stevenson, J.M. (2005) Differentiating
lifting technique between those who develop low back pain and those who do not,
Clinical Biomechanics, 20(3), pp. 254-263.
Yamamoto, I., Panjabi, M.M., Crisco, T. and Oxland, T. (1989) Three-dimensional
movements of the whole lumbar spine and lumbosacral joint, Spine, 14(11), pp. 1256-
1260.
Zeinali-Davarani, S., Hemami, H., Barin, K., Shirazi-Adl, A. and Parnianpour, M. (2008)
Dynamic stability of spine using stability-based optimization and muscle spindle reflex,
IEEE transactions on neural systems and rehabilitation engineering : a publication of the
IEEE Engineering in Medicine and Biology Society, 16(1), pp. 106-118.
Zigler, J.E. (2004) Lumbar Spine Arthroplasty using the ProDisc II, The Spine Journal,
4(6), pp. 260-267.

84 Chapter 5
Appendix 1 Data Collection Protocol
1. Baseline measurements: age, weight, gender, knee extension angle.
2. Laser spirit level: placed on flat table and used to find horizontal and vertical and
mark on subject.
3. Use lines to mark (with removable pen) place on subject where EG electrodes
are to be placed:
1st EG fixed to the exposed lateral femoral condyle and tibial anatomical bony
landmarks.
2nd EG fixed to exposed greater trochanter and along a longitudinal axis on the
trunk.
3rd EG fixed to first sacrum and to spine along a longitudinal axis.
4. Tape electrodes to patient, with adequate tension; there are no fixed rules
governing which size of sensor is most suitable for a particular joint; this depends
on the size of the subject. The sensor must be capable of reaching across the
joint so that the two end blocks can be mounted where least movement occurs
between the skin and underlying skeletal structure.
Electrodes will be labelled with their appropriate location.
5. Twin axis electrodes are to be used for lumbar spine and hip, whereas a single
axis electrode will be used for knee. They will be attached on the dorsal surface
using double sided tape, while the joint is in a neutral position at the start of each
test.
The “SG” series twin axis goniometers simultaneously measure angles in up to
two planes of movement. The goniometer has two separate output connectors,
which measure in two separate planes of movement. When used to measure a
single axis joint such as the knee or elbow, or when measuring a single plane of
a twin axis joint, simply connect one channel, the other remains redundant. All

85 Chapter 5
twin axis SG series goniometers function the same way, the difference being
physical size.
knee SG150 flexion/extension, valgus/varus
hip SG150 flexion/extension, abduction/adduction
back SG150B flexion/extension, lateral flexion
6. Connect electrodes to Biometrics kit and laptop.
7. Ideally 5 performances of the four tests involved but have to make sure
participant is relatively competent; with the last 3 recordings of each test for each
participant: average of the 3. First attempts are adjusted by the practitioner and
feedback is verbally and proprioceptively given via manual handling.
8. Record data on software; setting alarm for 5° of lumbar flexion from neutral
position (loss of control) so that marker can be placed at this point. Reset neutral
for lumbar spine just prior to each individual attempt.
9. Record the degrees at which the lumbar spine leaves neutral at the hip, knee and
lumbar spine; in notebook and transfer to Excel/SPSS spreadsheet.
10. Excel/SPSS spreadsheet used to show descriptive statistics.

86 Chapter 5
Appendix 2 Data Collection Sheet
Participant number................
Age
Gender
Height
Weight
BMI
KEA
Work Y/N or Student (Circle)
ROM Attempt 1 Attempt 2 Attempt 3 Average
KROMWB
HROMWB
LSROMLOCWB
LSROMEWB
LHROMWB
LLSROMWB
KROMSKE
HROMSKE
LSROMLOCSKE
LSROMESKE
LHROMSKE
LLSROMSKE
KROMSFL
HROMSFL
LSROMLOCSFL
LSROMESFL
LHROMSFL
LLSROMSFL
KROMRBFPK
HROMRBFPK
LSROMLOCRBFPK
LSROMERBFPK
LHROMRBFPK
LLSROMRBFPK

87 Chapter 5
Appendix 3 Data Analysis Protocol
1. Biometrics Datalog software used to get raw data from electrogoniometry device.
2. There should be 3 Attempts for each flexion control movement, which should
have knee (pink), hip (blue), lumbar spine (green), lateral hip (organge) and
lateral lumbar spine angles (red).
3. In order to view the point where we know that the lumbar spine has gone into a
flexion range of movement, select the lumbar spine trace on the Axis/Markers
Key.
4. Then follow the LS trace to the first point that the trace goes to 5° or above (i.e.
5.1°). This entails zooming in on the trace and finding a positive fluctuation in the
trace, which will be an average of 2 blocks of time due to the software (between
0.00.002 and 0.00.006 of a second).
[5° was used as a loss of flexion control indicator on this Biometrics system as
Panjabi (1992b) showed that the neutral zone (NZ) for lumbar flexion was 1.5°
and the elastic zone (EZ) was 6.1° and the overall range of movement (ROM)
was 7.6°. Also, between L5 and S1 the flexion results were; NZ 3°, EZ 7° and
ROM 10°. We attached the EG electrodes to S1 and L1/T12. The Biometrics
system has a margin of error of ± 2°, therefore looking for 5° will allow us to find
the point where the spine is either out of the neutral zone (3°-5°) or out of the
elastic zone (5°-7°) and starting to go into a flexion ROM (7°+)]
5. Then zoom back out once this has been marked to check that the overall lumbar
spine trace has gone into flexion (i.e. positive increase/moment close to event
marker trace), if it has not then go to the next point where a flexion angle of 5° or
more has been made and repeat steps 4 and 5.
6. Then note down on a spreadsheet the knee, hip, lumbar spine (5 or 5.1°), lateral
hip and lateral lumbar spine angles.
7. Next, zoom into the first 2 blocks of time on the trace in order to get an average
of the two blocks for each trace. Note down the knee, hip, lumbar spine (should
ideally be 0, but can fluctuate due to pre-emptive movement), lateral hip and
lateral lumbar spine angles.

88 Chapter 5
Example of Full Electrogoniometer Trace for RBFPK (Participant 1)
Example of Zoomed in RBFPK Trace to View Loss of Control (Praticipant 1)
Lu
mb
ar s
pin
e R
OM
0:00.000 0:02.000 0:04.000 0:06.000 0:08.000 0:10.000 0:12.000
180
-180
-150
-100
-50
(deg) 0
50
100
150
Lu
mb
ar s
pin
e R
OM
0:06.400 0:06.600 0:06.800 0:07.000 0:07.200 0:07.400 0:07.600 0:07.800 0:08.000 0:08.200
180
-180
-150
-100
-50
(deg) 0
50
100
150
Lumbar spine ROMLumbar spine ROMHip ROMHip ROMKnee ROM
Graph Key (degrees)
Lumbar spine ROMLumbar spine ROMHip ROMHip ROMKnee ROM
Graph Key (degrees)
5°
5°
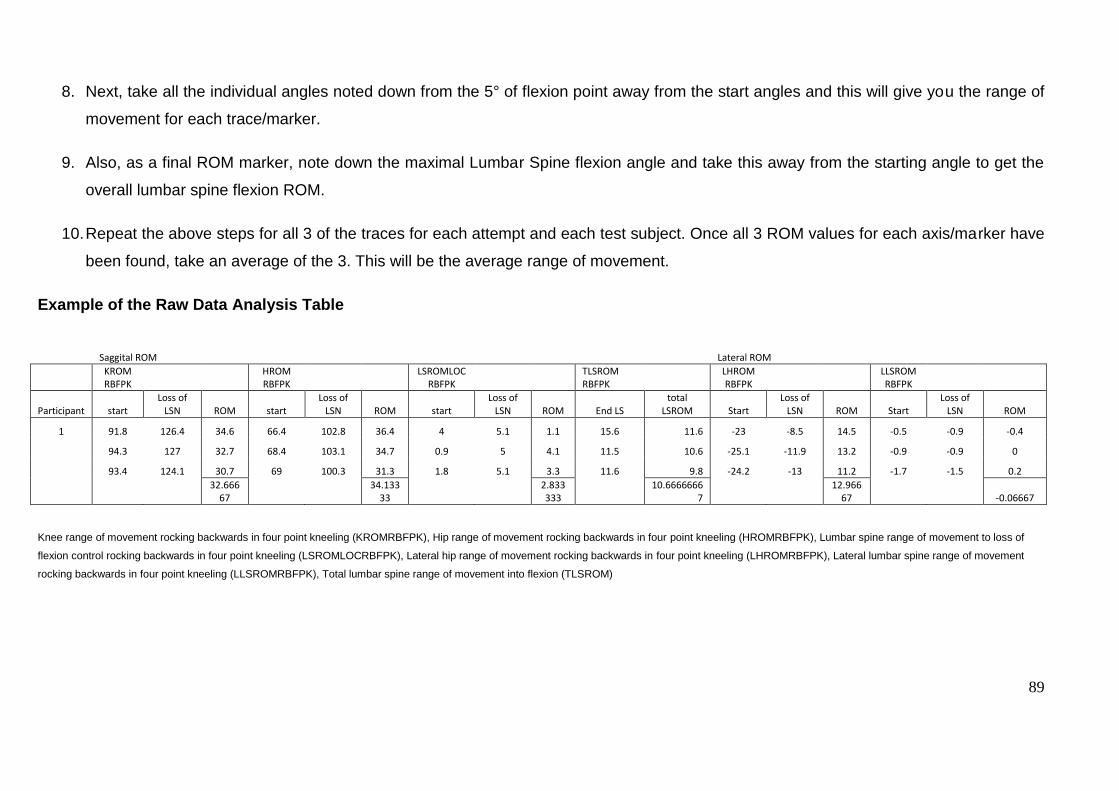
89
8. Next, take all the individual angles noted down from the 5° of flexion point away from the start angles and this will give you the range of
movement for each trace/marker.
9. Also, as a final ROM marker, note down the maximal Lumbar Spine flexion angle and take this away from the starting angle to get the
overall lumbar spine flexion ROM.
10. Repeat the above steps for all 3 of the traces for each attempt and each test subject. Once all 3 ROM values for each axis/marker have
been found, take an average of the 3. This will be the average range of movement.
Example of the Raw Data Analysis Table
Knee range of movement rocking backwards in four point kneeling (KROMRBFPK), Hip range of movement rocking backwards in four point kneeling (HROMRBFPK), Lumbar spine range of movement to loss of
flexion control rocking backwards in four point kneeling (LSROMLOCRBFPK), Lateral hip range of movement rocking backwards in four point kneeling (LHROMRBFPK), Lateral lumbar spine range of movement
rocking backwards in four point kneeling (LLSROMRBFPK), Total lumbar spine range of movement into flexion (TLSROM)
Saggital ROM
Lateral ROM
KROM RBFPK
HROM RBFPK
LSROMLOCRBFPK
TLSROM RBFPK
LHROM RBFPK
LLSROM RBFPK
Participant start Loss of
LSN ROM start Loss of
LSN ROM start Loss of
LSN ROM End LS total
LSROM Start Loss of
LSN ROM Start Loss of
LSN ROM
1 91.8 126.4 34.6 66.4 102.8 36.4 4 5.1 1.1 15.6 11.6 -23 -8.5 14.5 -0.5 -0.9 -0.4
94.3 127 32.7 68.4 103.1 34.7 0.9 5 4.1 11.5 10.6 -25.1 -11.9 13.2 -0.9 -0.9 0
93.4 124.1 30.7 69 100.3 31.3 1.8 5.1 3.3 11.6 9.8 -24.2 -13 11.2 -1.7 -1.5 0.2
32.666
67
34.13333
2.833333
10.66666667
12.96667 -0.06667

90 Chapter 5
Appendix 4 Baseline Measures Raw Data
Participant Gender Age Height Weight BMI LKEA RKEA
1 m 24 188 82 23.2 18 20
2 m 25 185 64 18.7 21 19
3 f 44 157 64 25.96 7 5
4 m 45 175 70 22.86 9 8
5 f 24 152 54 23.37 19 7
6 m 24 183 78 23.29 15 12
7 m 24 175 71 23.18 16 12
8 m 25 178 87 27.46 35 33
9 f 23 160 53 20.7 30 28
10 m 25 188 85 24.05 39 42
11 f 27 172 76 25.69 6 30
12 f 21 162 59 22.48 14 17
13 f 22 169 58.5 20.48 28 33
14 f 22 170 58.7 20.31 45 38
15 f 22 164 69 25.65 35 8
16 f 23 163 54.5 20.51 45 48
17 m 24 170 66.5 23.01 6 18
18 m 24 187 76 21.73 13 15
19 m 18 184 69 20.38 25 26
20 f 29 167 58.5 20.98 40 29
Mean
25.8 172.5 67.7 22.7 23.3 22.4
SD
6.8 10.9 10.4 2.3 13.1 12.4

91
Appendix 5. Inter-Rater Agreement Raw Data
WB KROM HROM LSROMLOC TLSROM LHROM LLSROM
KROM2 HROM2 LSROMLOC2 TLSROM2 LHROM2 LLSROM2
9 -1.8 13.36667 5.733333333 41.73333 5.233333 -3.46667
-2.4 12.43 5.83 42.66667 5.8 -3.3
10 7.8 33 4.766666667 12.46667 8.1 -0.5
8.4 34.2 4.83 13.16667 8.93 -0.53
18 -0.56667 4.533333 6.866666667 45.06667 -1.2 -0.26667
-0.46667 5.766667 6.966666667 45.43333 -1.03333 -0.36667
19 0.466667 6.1 6.366666667 35.76667 1.066667 1.533333
0.866667 6.233333 6.366666667 36.1 1 1.7
SKE KROM HROM LSROMLOC TLSROM LHROM LLSROM
KROM2 HROM2 LSROMLOC2 TLSROM2 LHROM2 LLSROM2
9 -45.5667 6.433333 3.966666667 6.733333 0.066667 -1.9
-44.2 6 4 7.033333 1.4 -2.8
10 -68.4 -6.83333 4.766666667 6.7 2.166667 -1.96667
-68.33 -7 4.63 6.8 2.33 -1.9
18 -80.0333 -7.36667 3.033333333 2.8 5.6 -3.7
-80.1667 -7.53333 3.066666667 3.066667 6.033333 -3.66667
19 -80.2667 -6.1 4.866666667 10.97 1.666667 -3.23333
-51.3 -1.06667 6.7 12.76667 0.733333 -3.83333
SFL KROM HROM LSROMLOC TLSROM LHROM LLSROM
KROM2 HROM2 LSROMLOC2 TLSROM2 LHROM2 LLSROM2
9 -3.03333 1.933333 5.9 33.9 0.266667 -2.2
-2.43333 6.3 6.1 34.63333 0.533333 -2.13333
10 -0.83333 12.6 4.4 13.53333 11.66667 1
-0.83333 12.46667 4.366666667 13.8 11.63333 1.233333
18 -1.2 21.33333 5.3 13.53333 1.966667 -5.23333
-0.96667 21.8 5.333333333 13.9 2.3 -5.16667
19 2.1 12.56667 4.633333333 23.26667 1.633333 -0.7
2.366667 12.73333 4.733333333 23.63333 2.033333 -2.76667
RBFPK KROM HROM LSROMLOC TLSROM LHROM LLSROM
KROM2 HROM2 LSROMLOC2 TLSROM2 LHROM2 LLSROM2
9 20.33333 15.16667 5.433333333 11.66667 -0.3 -0.46667
20 14.53333 5.533333333 12.26667 -0.2 -0.53333
10 11.3 9.266667 5.233333333 14.8 0.966667 -0.16667
10.46667 8.2 5.4 15.5 3.633333 -0.13333
18 18.76667 17.16667 4.766666667 26.13333 8.266667 1.833333
19 17.26667 4.8 26.43333 8.2 1.833333
19 29.83333 17.33333 5.1 8.666667 7.533333 0.5
29.43333 16.83333 5.166666667 7.35 7.466667 0.133333

92 Chapter 5
Appendix 6.0 Electorgoniometry Kit and Placement Examples
Joint Electrode placement
Knee 1st EG electrode fixed to the exposed lateral femoral condyle and tibial
anatomical bony landmarks (Szulc, Lewandowski and Marecki, 2000).
Example of WB Knee EG Electrode Placement
Hip 2nd EG electrode fixed to exposed greater trochanter and along a
longitudinal axis on the trunk (Mayhew, Norton and Sahrmann, 1983).
Example of Hip Electrode Placement During RBFPK Test

93 Chapter 5
Example of SFL Hip Example of Hip WB EG
EG Electrode Placement Electrode Placement
Lumbar
spine
3rd EG electrode fixed to first sacrum and to spine along a longitudinal
axis (Marras and Wongsam, 1986).

94 Chapter 5
Example of Lumbar Spine EG Electrode Placement
Example of EG Computer set up
Example of EG kit set up

95 Chapter 5
Appendix 7.0 Other Associated Parameters (LKEA, BMI, Age and Joint ROM)
7.1 LKEA correlation with Joint ROM
FIGURE 8. Correlation between KROM during WB and LKEA
Figure 8 shows that male KROM and LKEA had a high moderate positive correlaton
during the WB test, meaning that when KROM increased so did LKEA. Figure 6 also
shows that female KROM and LKEA had moderately negative correlation during the WB
test, which means that when LKEA increased KROM decreased.
FIGURE 9. Correlation between HROM during WB and LKEA
rho = 0.59
(p = 0.07)
rho = 0.55
(p = 0.10)
rho = -0.57 (p = 0.09)
rho = 0.64
(p = 0.05)

96 Chapter 5
Figure 9 shows that male and female HROM during the WB and LKEA had a high
moderate positive correlation, which means that as LKEA increased so did HROM
during the WB.
FIGURE 10. Correlation between Female HROM during SFL and LKEA
Figure 10 shows that during the SFL, HROM and LKEA had a high moderate positive
correlation. Therefore as LKEA increased so did HROM during the SFL test.
FIGURE 11. Correlation between Female LSROMLOC during RBFPK and LKEA
Figure 11 shows that LSROMLOC had almost perfect negative correlation with LKEA,
which means that when LKEA increased LSROMLOC decreased.
0
10
20
30
40
50
0 5 10 15 20 25
LKEA
HROM SFL
Female
Female
Linear (Female)
0
10
20
30
40
50
60
0 2 4 6 8
LKEA
LSROMLOC RBFPK
Female
Female
Linear (Female)
rho = -0.94 (p = >0.0001)
rho = 0.59 (p = 0.07)

97 Chapter 5
FIGURE 12. Correlation between TLSROM during RBFPK and LKEA
Figure 12 shows that TLSROM during RBFPK and LKEA had a high moderate
negative correlation, which means that as LKEA increased TLSROM during RBFPK
decreased.
7.2 BMI Correlation with Joint ROM
Figure 13. Correlation between Male KROM during WB and BMI
Figure 13 shows that in KROM during the WB test had a high moderate positive
correlation with BMI in the male participants. Therefore, during the WB test the male
0
5
10
15
20
25
30
35
40
45
0 5 10 15 20 25 30
LKEA
TLSROM RBFPK
Male
Male
Linear (Male )
18
19
20
21
22
23
24
25
26
27
28
-1 0 1 2 3 4 5 6 7 8 9
BM
I
KROM WB
Male
Male
Linear (Male)
rho = -0.60 (p = 0.07)
rho = 0.64 (p = 0.05)

98 Chapter 5
participants with higher BMI flexed their knees more. Several participants are also
shown to have hyperextended their knees during the WB test.
Figure 14. Correlation between Female LSROMLOC during SKE and BMI
Figure 14 shows that there was a strong positive correlation between LSROMLOC
during SKE and BMI in the female participants. This means that with higher BMI the
female participants had greater ROM to loss of control (5° of lumbar flexion). Therefore,
the female participants with higher BMI’s must have been starting the SKE test in an
extended position and not neutral (i.e. 7° LSROMLOC would mean a starting position of
-2° of lumbar flexion or 2° of lumbar extension).
Figure 15. Correlation between Female KROM during SFL and BMI
18
20
22
24
26
28
0 1 2 3 4 5 6 7 8
BM
I
LSROMLOC SKE
Female
Female
Linear (Female)
18
20
22
24
26
28
-3 -2 -1 0 1 2 3
BM
I (w
eig
ht/
he
igh
t²)
KROM SFL (Degrees)
Female
Female
Linear (Female)
rho = 0.76 (p = 0.01)
rho = 0.81 (p = 0.01)

99 Chapter 5
Figure 15 shows that there was an almost perfect positive correlation between KROM
during the SKE test and BMI in the female participants. This demonstrates that the
female participants with high BMI’s flexed their knees during the test, while the females
with low BMI’s extended their knees.
Figure 16. Correlation between Female LSROMLOC during RBFPK and BMI
Figure 16 demonstrates that there was a high moderate positive correlation between
LSROMLOC and BMI during the RBFPK test in the female participants. This means that
the females with higher BMI’s began the test in an extended position (1-2° extension
which would equal 6-7° ROM to 5° of lumbar flexion), whereas the females with low
BMI’s started in a neutral or slightly flexed position (i.e. 1° of flexion equals 4° ROM).
Therefore, many of the female participants did not start at the neutral (‘0°’) position they
were put into by the researcher using the EG before the test began to be recorded.
15
20
25
30
35
40
45
50
4 4.5 5 5.5 6 6.5
Age
(ye
ars)
LSROMLOC RBFPK (Degrees)
Female
Female
Linear (Female)
rho = 0.59 (p = 0.07)

100 Chapter 5
Figure 17. Correlation between Female LHROM during RBFPK and BMI
Figure 17 shows that LHROM during RBFPK had a high moderate positive correlation
with BMI, which means that males with higher BMI had increased LHROM during the
RBFPK test.
Figure 18. Correlation between Female LLSROM during RBFPK and BMI
Figure 18 shows that there was a high moderate negative correlation between
LLSROM during RBFPK and BMI in female participants. Therefore, the females with
high BMI had less LLSROM during RBFPK.
7.3 Age Correlation with Joint ROM
18
20
22
24
26
28
-5 0 5 10 15
BM
I (w
eig
ht/
he
igh
t²)
LHROM RBFPK (Degrees)
Female
Female
Linear (Female)
18
20
22
24
26
28
-1 0 1 2 3 4
BM
I (w
eig
ht/
he
igh
t²)
LLSROM RBFPK (Degrees)
Female
Female
Linear (Female)
rho = 0.50 (p = 0.14)
rho = -0.53 (p = 0.12)
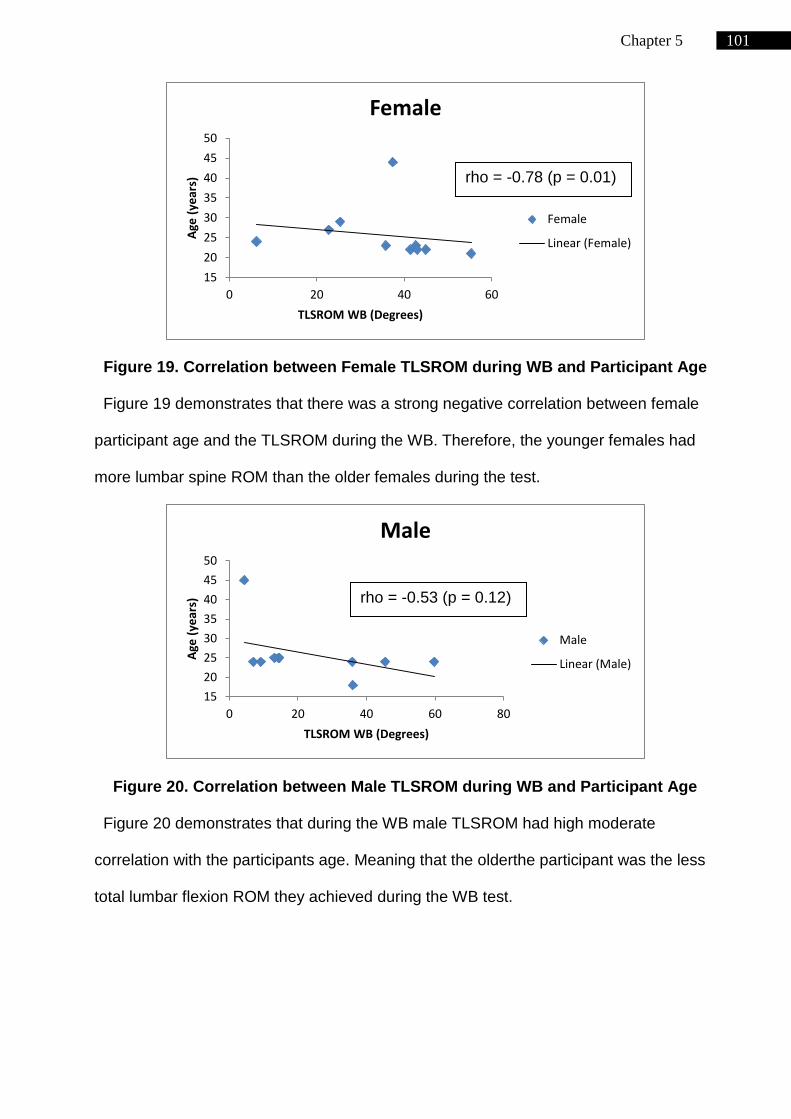
101 Chapter 5
Figure 19. Correlation between Female TLSROM during WB and Participant Age
Figure 19 demonstrates that there was a strong negative correlation between female
participant age and the TLSROM during the WB. Therefore, the younger females had
more lumbar spine ROM than the older females during the test.
Figure 20. Correlation between Male TLSROM during WB and Participant Age
Figure 20 demonstrates that during the WB male TLSROM had high moderate
correlation with the participants age. Meaning that the olderthe participant was the less
total lumbar flexion ROM they achieved during the WB test.
15
20
25
30
35
40
45
50
0 20 40 60
Age
(ye
ars)
TLSROM WB (Degrees)
Female
Female
Linear (Female)
15
20
25
30
35
40
45
50
0 20 40 60 80
Age
(ye
ars)
TLSROM WB (Degrees)
Male
Male
Linear (Male)
rho = -0.78 (p = 0.01)
rho = -0.53 (p = 0.12)

102 Chapter 5
Figure 21. Correlation between Male LLSROM during SKE and Participant Age
Figure 21 shows that there was a high moderate positive correlation between male
age and LLSROM during SKE. This indicates that increased age lead to lumbar spine
movement to the right, as negative ROM was movement to the left and positive was
movement to the right.
Figure 22. Correlation between Male TLSROM during SFL and Participant Age
Figure 22 shows that there was a high moderate negative correlation between male
participant age and TLSROM during SFL test. This indicates that the younger
participants were able to flex their lumbar spine further than older participants.
15
20
25
30
35
40
45
50
-5 -4 -3 -2 -1 0 1 2
Age
(ye
ars)
LLSROM SKE (Degrees)
Male
Male
Linear (Male)
15
20
25
30
35
40
45
50
0 5 10 15 20 25
Age
(ye
ars)
TLSROM SFL (Degrees)
Male
Male
Linear (Male)
rho = 0.55 (p = 0.10)
rho = -0.56 (p = 0.09)

103 Chapter 5
Figure 23. Correlation between Female TLSROM during SFL and Participant Age
Figure 23 demonstrates that there was a borderline strong negative correlation
between female age and TLSROM during the SFL test. Which indicates the same result
as the male participants; that older females had lower TLSROM and vice versa.
Figure 24. Correlation between Female KROM during SFL and Participant Age
Figure 24 demonstrates that there was a high moderate positive correlation between
female participant age and KROM during the SFL test. This indicated that older females
flexed there knees during the SFL test and vice versa.
15
20
25
30
35
40
45
50
0 10 20 30 40 50
Age
(ye
ars)
TLSROM SFL (Degrees)
Female
Female
Linear (Female)
15
20
25
30
35
40
45
50
-3 -2 -1 0 1 2 3
Age
(ye
ars)
KROM SFL (Degrees)
Female
Female
Linear (Female)
rho = -0.68 (p = 0.03)
rho = 0.53 (p = 0.12)

104 Chapter 5
Figure 25. Correlation between Male LHROM during RBFPK and Participant Age
Figure 25 indicates that there was a high moderate negative correlation between male
participant age and LHROM during the RBFPK test. This indicated that older males had
less LHROM than younger male participants.
Figure 26. Correlation between Male HROM during RBFPK and Participant Age
Figure 26 demonstrates that there was a high moderate negative correlation between
male participants age and HROM during the RBFPK test. This indicated that older male
participants had lower HROM to the point of loss of lumbar flexion control during the
RBFPK test and vice versa.
15
20
25
30
35
40
45
50
-20 -10 0 10 20 30
Age
(ye
ars)
LHROM RBFPK (Degrees)
Male
Male
Linear (Male)
15
20
25
30
35
40
45
50
0 10 20 30 40
Age
(ye
ars)
HROM RBFPK (Degrees)
Male
Male
Linear (Male)
rho = -0.57 (p = 0.09)
rho = -0.62 (p = 0.06)

105 Chapter 5
Figure 27. Correlation between Male KROM during RBFPK and Participant Age
Figure 27 demonstrates that there was a strong negative correlation between male
participant age and KROM during the RBFPK test. This indicated that older male
participants had less KROM than younger males to the point of loss of lumbar flexion
control and vice versa.
Figure 28. Correlation between Female HROM during RBFPK and Participant Age
Figure 28 shows that the female participant age had a high moderate negative
correlation with HROM during the RBFPK test. This indicated that older females had
less HROM at the point of loss of control that the younger females.
15
25
35
45
55
0 10 20 30 40
Age
(ye
ars)
KROM RBFPK (Degrees)
Male
Male
Linear (Male)
15
20
25
30
35
40
45
50
0 10 20 30 40
Age
(ye
ars)
HROM RBFPK (Degrees)
Female
Female
Linear (Female)
rho = -0.72 (p = 0.02)
rho = -0.62 (p = 0.06)

106 Chapter 5
Figure 29. Correlation between Female LHROM during RBFPK and Participant
Age
Figure 29 shows that there was a borderline strong positive correlation between
female participant age and LHROM during the RBFPK test. This indicated that younger
female participants had less LHROM at the point of loss of control during the RBFPK
test than the older females.
Figure 30. Correlation between Female LLSROM during RBFPK and Participant
Age
Figure 30 demonstrates that there was a high moderate negative correlation between
female participant age and LLSROM during the RBFPK test. This indicated that younger
female participants had more LLSROM to the right (positive ROM value) at the point of
15
25
35
45
55
-5 0 5 10 15
Age
(ye
ars)
LHROM RBFPK (Degrees)
Female
Female
Linear (Female)
15
25
35
45
55
-1 0 1 2 3 4
Age
(ye
ars)
LLSROM RBFPK (Degrees)
Female
Female
Linear (Female)
rho = 0.78 (p = 0.01)
rho = -0.57 (p = 0.08)

107 Chapter 5
loss of lumbar flexion control. Whereas the older female participants had more LLSROM
to the left (negative ROM value) at the point of loss of flexion control.

108 Chapter 5