Food Insecurity within the Island Lake First Nation ... - MSpace
186
Food Insecurity within the Island Lake First Nation Communities in Northern Manitoba, Canada by Shauna Zahariuk A Thesis submitted to the Faculty for Graduate Studies of The University of Manitoba in partial fulfilment of the requirements of the degree of MASTER OF ENVIRONMENT CLAYTON H. RIDDELL FACULTY OF ENVIRONMENT, EARTH, AND RESOURCES University of Manitoba Winnipeg Copyright © 2014 by Shauna Zahariuk
-
Upload
khangminh22 -
Category
Documents
-
view
2 -
download
0
Transcript of Food Insecurity within the Island Lake First Nation ... - MSpace

Food Insecurity within the
Island Lake First Nation Communities in Northern Manitoba, Canada
by
Shauna Zahariuk
A Thesis submitted to the Faculty for Graduate Studies of
The University of Manitoba
in partial fulfilment of the requirements of the degree of
MASTER OF ENVIRONMENT
CLAYTON H. RIDDELL FACULTY OF ENVIRONMENT, EARTH, AND RESOURCES
University of Manitoba
Winnipeg
Copyright © 2014 by Shauna Zahariuk

ii

ABSTRACT
Conditions of hunger and lack of access to affordable healthy foods exists within Canada.
Canada has committed itself to international Declarations, Covenants, and Conventions
focused on reducing world hunger; however, it has neglected to address domestic hunger
issues.
Using mixed methods, this study quantified food insecurity rates and severity within four
First Nation communities in northern Manitoba. The study also explored the
communities’ perspectives regarding barriers to healthy eating and potential solutions to
addressing this multi-faceted problem.
Results indicate that the four First Nation communities within this study are amongst the
most food insecure and hungry within Manitoba and Canada, with 92% of households
experiencing some form of food insecurity and 50% of households experiencing severe
food insecurity. The research has revealed that solutions for improving food security
must be embedded within the realm of food sovereignty and be led by First Nation
communities.
iii

ACKNOWLEDGEMENTS
I wish to extend a thank you to my husband for being understanding of my time
constraints and for lending an ear, and helping to guide me through the Masters process.
Thank you so much for your unwavering support, encouragement, and love. I also wish
to thank my parents, brother, sister-in-laws, my grandmother, and my friends for their
encouragement and support. A thank you as well to my Newfoundland-mix dog, who
accompanied my every step along the way; even if his tail occasionally found its way
under my castor-equipped desk chair – my apologies Gus!
And a heartfelt thank you to the First Nation communities of Island Lake, Manitoba.
Wasagamack; thank you for taking me fishing and all the wonderful conversations. St.
Theresa Point, thank you to the Manoakeesick family for allowing me to stay in your
home and inviting me to a family potluck and candy throw; very fun! Thank you to
Garden Hill and Island Lake Lodge for the accommodations and learning how to identify
wild mint! And, thank you to Red Sucker Lake for the moose meat meal, and the
hospitality. Also, a very special thank you to Linda Manoakeesick for her assistance,
guidance, and friendship along the way.
I also wish to thank my advisor for her help and guidance, and the rest of my advisory
committee for their words of wisdom.
iv

DEDICATION
This study and its results are dedicated to the First Nation communities of Wasagamack,
St. Theresa Point, Garden Hill and Red Sucker Lake. Thank you for sharing your
experiences with me.
v

TABLE OF CONTENTS
CHAPTER ONE: INTRODUCTION 1
1.1 BACKGROUND 1 1.2 PURPOSE OF THE RESEARCH 7 1.3 OBJECTIVES 8 1.4 RESEARCH STUDY AREA 9 1.4.1 COMMUNITY ACCESSIBILITY 9 1.5 ORGANIZATION OF THESIS 13 1.6 RESEARCHER’S REFLECTION 13
CHAPTER TWO: REVIEW OF RELATED LITERATURE 16
2.1 WHAT IS FOOD (IN)SECURITY? 16 2.2 FOOD INSECURITY IN A FIRST NATIONS CONTEXT 19 2.2.1 ACCESS, AVAILABILITY, AND AFFORDABILITY 22 2.3 MEASUREMENT FOOD SECURITY IN CANADA 29 2.4 MEASURING FOOD INSECURITY IN FIRST NATIONS COMMUNITIES IN CANADA 33 2.5 FOOD-BASED INITIATIVES 40 2.5.1 NUTRITION NORTH CANADA 42 2.5.2 NORTHERN HEALTHY FOOD INITIATIVE 45 2.5.3 COUNTRY FOOD PROGRAMS 49 2.5.4 COOPERATIVES 52 2.5.5 FOOD BUYING CLUBS 53 2.6 CHAPTER SUMMARY 53
CHAPTER THREE: METHODS 56
3.1 RESEARCH ETHICS APPROVAL 57 3.2 INTRODUCING THE RESEARCHER TO THE COMMUNITY 59 3.3 FOOD COSTING SURVEY 60 3.3.1 CALCULATING COST 61 3.3.2 CALCULATING AFFORDABILITY 62 3.3.3 LIMITATIONS 63 3.4 HOUSEHOLD FOOD SECURITY SURVEY 65 3.4.1 SURVEY DESIGN 66 3.4.2 SURVEY DATA ANALYSIS 69 3.4.3 SURVEY LIMITATIONS 71 3.5 SEMI-STRUCTURED INTERVIEWS 72 3.5.1 INTERVIEW DATA ANALYSIS 73 3.5.2 INTERVIEW LIMITATIONS 74
CHAPTER FOUR: RESULTS 76
4.1 FOOD ACCESSIBILITY 76 4.1.1 STORE LOCATIONS 76 4.1.2 PREVALENCE OF HOUSEHOLD GARDENING, HUNTING AND FISHING 81 4.1.3 PERCEIVED BARRIERS TO ACCESSING HEALTHY FOODS 83 4.1.3 COMMUNITY PERSPECTIVES ON SOLUTIONS TO ACCESSING HEALTHY FOODS 87 4.2 FOOD COSTING AND FOOD AVAILABILITY RESULTS 91 4.3 FOOD BASKET AFFORDABILITY 95
vi

4.4 HOUSEHOLD FOOD SECURITY SURVEY 96 4.4.1 HOUSEHOLD FOOD SECURITY STATUS IN ISLAND LAKE 97 4.5 COMMUNITY INITIATIVES IN ISLAND LAKE FIRST NATIONS 104 4.6 CHAPTER SUMMARY 106
CHAPTER FIVE: DISCUSSION 108
5.1 ACCESSIBILITY AND AFFORDABILITY OF THE REVISED NORTHERN FOOD BASKET 109 5.1.1 ACCESSIBILITY 109 5.2 HIGH FOOD COSTS 110 5.2.1 IS THE REVISED NORTHERN FOOD BASKET AN APPROPRIATE FOOD COSTING TOOL? 114 5.2.2. LARGE PERCENTAGES OF HOUSEHOLD BUDGETS ARE DEVOTED TO FOOD COSTS 117 5.3 PREVALENCE OF FOOD INSECURITY IN THE ISLAND LAKE FIRST NATION COMMUNITIES 119 5.3.1 IS THE HOUSEHOLD FOOD SECURITY SURVEY A CULTURALLY APPROPRIATE MEASURE? 122 5.4 EVALUATION OF COMMUNITY INITIATIVES 124 5.5 CHAPTER SUMMARY 128
CHAPTER SIX: SUMMARY, CONCLUSIONS, AND RECOMMENDATIONS 130
6.1 THE CRUX OF THE PROBLEM 131 6.2 OPTIONS AND SOLUTIONS 132 6.3 CONCLUSION 135
REFERENCES 137
vii
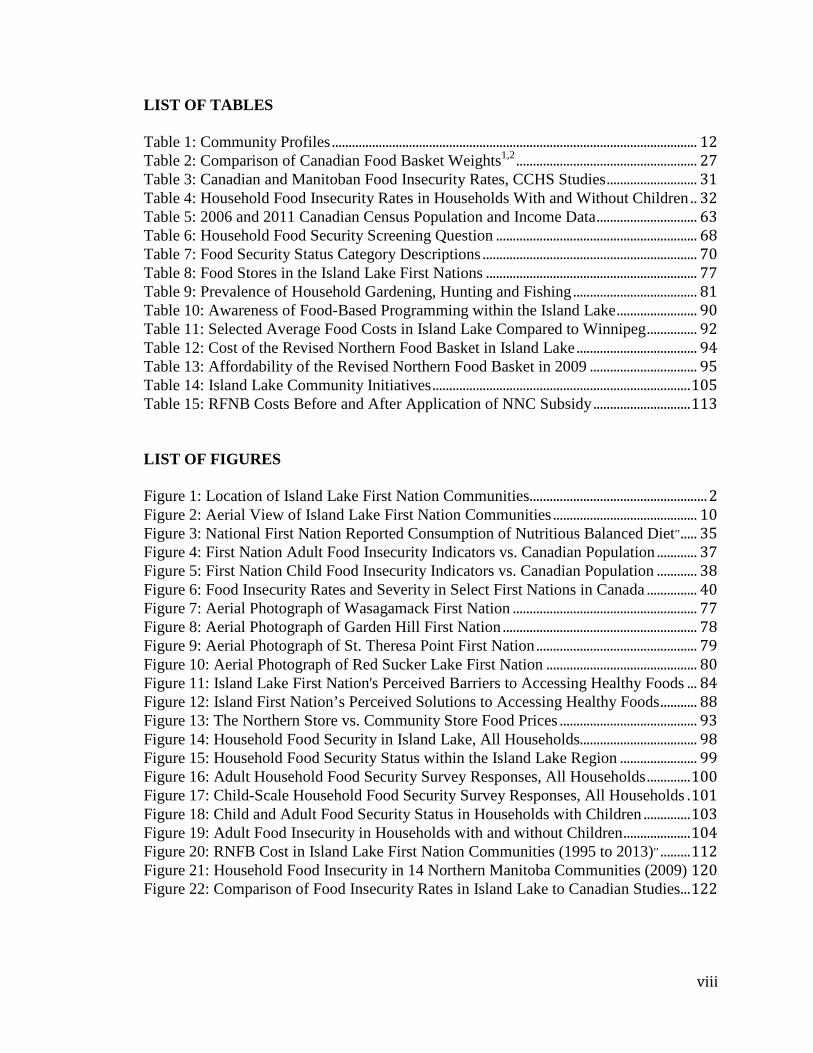
LIST OF TABLES Table 1: Community Profiles ............................................................................................................. 12 Table 2: Comparison of Canadian Food Basket Weights1,2 ...................................................... 27 Table 3: Canadian and Manitoban Food Insecurity Rates, CCHS Studies ........................... 31 Table 4: Household Food Insecurity Rates in Households With and Without Children .. 32 Table 5: 2006 and 2011 Canadian Census Population and Income Data .............................. 63 Table 6: Household Food Security Screening Question ............................................................ 68 Table 7: Food Security Status Category Descriptions ................................................................ 70 Table 8: Food Stores in the Island Lake First Nations ............................................................... 77 Table 9: Prevalence of Household Gardening, Hunting and Fishing ..................................... 81 Table 10: Awareness of Food-Based Programming within the Island Lake ........................ 90 Table 11: Selected Average Food Costs in Island Lake Compared to Winnipeg ............... 92 Table 12: Cost of the Revised Northern Food Basket in Island Lake .................................... 94 Table 13: Affordability of the Revised Northern Food Basket in 2009 ................................ 95 Table 14: Island Lake Community Initiatives ............................................................................. 105 Table 15: RFNB Costs Before and After Application of NNC Subsidy ............................. 113 LIST OF FIGURES Figure 1: Location of Island Lake First Nation Communities ..................................................... 2 Figure 2: Aerial View of Island Lake First Nation Communities ........................................... 10 Figure 3: National First Nation Reported Consumption of Nutritious Balanced Diet,, ..... 35 Figure 4: First Nation Adult Food Insecurity Indicators vs. Canadian Population ............ 37 Figure 5: First Nation Child Food Insecurity Indicators vs. Canadian Population ............ 38 Figure 6: Food Insecurity Rates and Severity in Select First Nations in Canada ............... 40 Figure 7: Aerial Photograph of Wasagamack First Nation ....................................................... 77 Figure 8: Aerial Photograph of Garden Hill First Nation .......................................................... 78 Figure 9: Aerial Photograph of St. Theresa Point First Nation ................................................ 79 Figure 10: Aerial Photograph of Red Sucker Lake First Nation ............................................. 80 Figure 11: Island Lake First Nation's Perceived Barriers to Accessing Healthy Foods ... 84 Figure 12: Island First Nation’s Perceived Solutions to Accessing Healthy Foods ........... 88 Figure 13: The Northern Store vs. Community Store Food Prices ......................................... 93 Figure 14: Household Food Security in Island Lake, All Households................................... 98 Figure 15: Household Food Security Status within the Island Lake Region ....................... 99 Figure 16: Adult Household Food Security Survey Responses, All Households ............. 100 Figure 17: Child-Scale Household Food Security Survey Responses, All Households . 101 Figure 18: Child and Adult Food Security Status in Households with Children .............. 103 Figure 19: Adult Food Insecurity in Households with and without Children .................... 104 Figure 20: RNFB Cost in Island Lake First Nation Communities (1995 to 2013),, ......... 112 Figure 21: Household Food Insecurity in 14 Northern Manitoba Communities (2009) 120 Figure 22: Comparison of Food Insecurity Rates in Island Lake to Canadian Studies ... 122
viii

LIST OF PHOTOGRAPHS Photograph 1-4: Household Gardens in the Island Lake First Nations .................................. 82 Photograph 25: Bannock and Moose in Red Sucker Lake .......................................................... 83 (All photographs captured by author) LIST OF APPENDICES Appendix A Revised Northern Food Basket 67-Item Food List and Volumes and
Comparison of Revised Northern Food Basket Items to National Nutritious Food Basket
Appendix B Revised Northern Food Basket Price Selection Procedure Appendix C Household Food Security Survey Appendix D Summary of Individual Food Item Costs and Revised Northern Food
Basket Costs for Each Community Appendix E Community Responses to the Household Food Security Survey
ix

LIST OF ACRONYMS AND ABBREVIATIONS AANDC Aboriginal Affairs and Northern Development Canada, formerly Indian
and Northern Affairs Canada (INAC)
CCHS Canadian Community Health Survey
FNFNES First Nations Food, Nutrition and Environment Study
INAC Indian and Northern Affairs Canada
NHFI Northern Healthy Food Initiative
RHS Regional Health Survey
x

CHAPTER ONE: INTRODUCTION
1.1 Background
When Canadians think about hunger issues and limited access to healthy foods, thoughts
of famines and conditions in war-torn and poorer countries typically come to mind.
However, many may not realize that conditions of hunger and lack of access to affordable
healthy foods exists in a wealthy country such as Canada. Although the conditions are not
as grave as the deprivation which exists in many poorer countries, the lack of access to
healthy foods has created serious physical and mental health issues in many northern
First Nation communities (Young, 2000; Tonn, 2011), including the communities of
Island Lake Region (Wasagamack, St. Theresa Point, Garden Hill, and Red Sucker Lake
Ojibway Cree First Nations), the study area.
Recent studies have confirmed that First Nation communities in northern Manitoba lack
access to healthy affordable foods, in particular fruits and vegetables (Chan et al., 2012;
FNIGC, 2012; Thompson et al. 2011; and Thompson et al., 2012). The following factors
are also contributing to a state of food insecurity: lack of selection of healthy foods;
expensive prices and shipping costs as well as high unemployment rates and subsequently
high poverty rates; and, a decrease in the consumption of country foods (Government of
Manitoba, 2003).
Food insecurity is characterized by deficient or insecure access to “sufficient, nutritious,
and personally acceptable food” (Davis and Tarasuk, 1994, p. 51) and can be measured at
the household, community and national scales, along a continuum, from food secure to
severely food insecure. Food insecurity has been defined as “the inability to acquire or
1

consume an adequate diet quality or sufficient quantity of food in socially acceptable
ways, or the uncertainty that one will be able to do so” (Davis and Tarasuk, 1994, p. 50).
In Canada food insecurity manifests itself in unhealthy eating patterns and behaviors,
including a diminished intake of fresh fruits and vegetables (Che and Chen, 2001;
Thompson, 2012).
Figure 1: Location of Island Lake First Nation Communities1
The remoteness of many First Nation communities, especially fly-in only communities
such as those in the Island Lake Region (see Figure 1), directly affects the price of
healthy foods and the ability to access those foods, especially as shipping costs continue
1 Four Arrows Regional Health Authority, June 2013.
2

to increase and winter road systems1 continue to become less predictable due to climate
change (Manitoba Department of Transportation and Government Services, 2003).
The lack of healthy affordable foods in remote First Nation communities in Manitoba has
contributed to a rise in diabetes and other nutrition-related diseases (Che, and Chen,
2001; Thompson et al., 2010), and negatively affects general and psycho-social health
(Tonn, 2011). Indeed, the prevalence of type 2-diabetes among First Nations populations
is approximately four to five times greater than experienced by non-Aboriginal
populations in Manitoba and the rest of Canada (Government of Manitoba, 2003; Young,
2000). Within the Island Lake Region, children as young as eight years old have been
diagnosed with type 2-diabetes (Young, 2000).
Fittingly, food insecurity has been recognized as a determinant of health by the Public
Health Agency of Canada and Health Canada (Health Canada, 2007). In response, federal
and provincial government programs have been created to address the problem through
various initiatives and studies such as the Northern Healthy Food Initiative (NHFI), the
Young Rural Aboriginal Entrepreneurship Initiative, and Aboriginal Head Start Program.
Health Canada began studying the issue of food security in 2004, as part of the Canadian
Community Health Survey (CCHS), an initiative that began in 2001. Although the CCHS
studies ironically exclude at-risk First Nation and remote communities, “off-reserve2”
1 Winter road systems in Manitoba are temporary routes to remote northern communities. Manitoba’s approximate 2180 km winter road system is constructed on frozen lakes, rivers, and land during the winter season. Winter roads usually open in mid-January to early February and close in March. 2“Off-reserve” is a term used to describe people, organizations, objects, etc., which are not located on a First Nations reservation (reserve) or community.
3

households were included. The 2004 CCHS study revealed that 33% of Aboriginal1
households compared to 9% of non-Aboriginal households in Canada were food insecure,
and that approximately 18% of Aboriginal households compared to 3.5% of non-
Aboriginal households in Canada received social assistance (Health Canada, 2007). The
2007-2008 CCHS found that 20.9% of “off-reserve” Aboriginal households in Canada
were food insecure, with 8.4% of those households experiencing severe food insecurity,
compared to non-Aboriginal household which exhibited a food insecurity rate of 7.2%,
this almost three times lower than Aboriginal households (Tarasuk et al., 2013). The
authors attributed the higher prevalence of food insecurity among Aboriginal households
to the greater degree of poverty experienced by that population (Health Canada, 2007;
Tarasuk, 2013; Willows et al., 2008). Within Manitoba, the 2009-2010 CCHS data reveal
that 10.8% and 10.0% of all households experienced some level of food insecurity in
2009 and 2010, respectively (Health Canada, 2011). While “off-reserve” Aboriginal
households in Manitoba experienced food insecurity at a rate of 21.4% compared to 5.4%
for non-Aboriginal households in 2009 and 2010, four times lower than Aboriginal
households (Health Canada, 2011).
In 2002, the issue of food security was researched within the isolated fly-in and winter
road Cree community of Fort Severn in northwestern Ontario. The study revealed that
food costs were 82% higher than in Ottawa, and that 67% of households within the
community were food insecure, with 25% of families experiencing hunger (Lawn and
Harvey, 2004). Households indicated that the barriers to accessing healthy affordable
1 An Aboriginal person is defined under the Canadian Constitution Act (35)(2) as, First Nation, Inuit and Métis people.
4

foods include high cost, poor quality, and lack availability and variety. The researchers
found that “households which received social assistance and households that were
described as working poor, were significantly more food insecure than those relatively
well off” (Lawn and Harvey, 2004, p.ix). Similarly, a study completed in the remote fly-
in Inuit community of Kugaaruk, Nunavut in 2001 revealed that 83% of households
within the community were food insecure, with 50% of households experiencing hunger
(Lawn and Harvey, 2003). Households indicated the barriers to accessing healthy
affordable foods included the high cost, poor quality, poor availability, and lack of
variety (Lawn and Harvey, 2003). Researchers indicated that lack of employment
opportunities, low income, and the prevalence of households receiving social assistance
places Kugaaruk’s population at risk of food insecurity.
Prior to studies lead by the University of Manitoba in 2009 (documented in Thompson et
al., 2010; Thompson et al., 2011; Thompson et al., 2012) and including this research, and
the 2002/03 Manitoba First Nation Regional Longitudinal Health Survey, the prevalence
of food insecurity within northern Manitoba First Nation1 communities was unknown.
However, it was suspected to be “moderate” to “severe” given the high levels of poverty
experienced in most First Nation communities. Research in Ontario and Nunavut
supports this hypothesis.
The issue of food security within nine Manitoba First Nation communities was also
studied a year following this thesis research, as part of the 2010 Manitoba First Nations
Food Nutrition and Environment Study (FNFNES). The Manitoba FNFNES 2010 study,
1 A First Nation is also known as a “First Nation Reservation”, and is a parcel of land set aside by the Government of Canada for the use and benefit of an Aboriginal community.
5

included nine First Nation communities throughout the province, and revealed that 38%
of households experienced some level of food insecurity, with 32% and 6% of those
households experiencing moderate and severe food insecurity, respectively. In the most
northern communities (Tadoule Lake and Lac Brochet, located less than 100 km from the
Nunavut boarder), food insecurity rates climbed to 73% (Chan et al., 2012).
There are several national and provincial programs and community-based programs that
are endeavoring to address the issue of food security and its related health outcomes. The
national Nutrition North Canada (NNC) Program is a healthy food shipping subsidy
program, which operates under the goal of reducing the price of healthy foods by
subsidizing registered retailers who are responsible for passing the subsidy onto the
customer. The NNC replaced the former Food Mail Program in 2011.
The Northern Healthy Food Initiative (NHFI) is a provincial initiative created in 2005 by
the Government of Manitoba to increase access to affordable healthy foods in northern
Manitoba. The NHFI is a collection of initiatives and programs working to increase local
sustainable food production through gardening and greenhouses, poultry production,
country food programs, food preservation, and school nutrition programs. Additionally,
several communities have implemented food-buying clubs where groups of people and/or
institutions organize to buy food in bulk to save on cost and shipping.
In Nunavut and Nunavik, Arctic Cooperative stores and La Fédération des coopératives
du Nouveau-Québec (FCNQ) have been successful, however there are no member stores
in Manitoba. The FCNQ has 14 member cooperatives and is the largest non-government
employer within the region, employing over 310 people within Nunavik and 120 in
6

Montreal; the FCNQ and its cooperatives are managed by Inuit and Cree staff (FCNQ,
n.d.). The Arctic Cooperatives have 31 independently owned and controlled stores,
employing over 900 people (Arctic Cooperatives Limited, n.d.). Both the FCNQ and
Arctic Cooperatives have several arms to their business including retail,
accommodations, cable television and internet operations, construction, outfitting, and
arts production and marketing.
1.2 Purpose of the Research
The study asks the following question: What is the food security status of the Island Lake
First Nation communities and why? The intent of this study is to determine the
prevalence of household food insecurity within the Island Lake First Nation communities.
This research explores and determines the variables affecting food security, including the
cost of a healthy food basket, access to store-bought and country foods, and geographical
location and degree of isolation. This study will also explore current initiatives that are in
employed to increase food security within the Island Lake First Nation communities.
The 2010 Manitoba FNFNES studied the rates of food insecurity within Aboriginal
households within nine First Nation communities, presenting the results regionally. While
all CCHS studies excluded First Nation communities in the nation-wide study, “off-
reserve” Aboriginal households (Aboriginal people living outside of First Nation
communities) were included. Food security rates from the Island Lake First Nation
communities will be compared to the 2009-2010 CCHS and 2010 FNFNES Manitoba
results, as well as the Thompson et al. 2011 results. The comparison will provide an
interpretation of food security status in Island Lake, highlighting the gap that exists
7

between First Nation communities and people, and non-First Nation communities and
non-Aboriginal people.
Information presented in this thesis will contribute to forming a greater knowledge base
regarding First Nation food security in Northern Manitoba, and will provide a baseline
for future studies within the area. It is also hoped that the Island Lake communities will
be able to use the information as a means to secure funding for food security projects.
The results from this study have the potential to inform food security policy development
and community initiatives. Additionally, information collected during the summer 2009
field research presented in this thesis was used to review the effectiveness of the Northern
Health Foods Initiative program (Thompson et al., 2010), and has been included in
several published academic journal articles (Thompson et al., 2011; Thompson et al.,
2012).
1.3 Objectives
In order to satisfy the purpose of this research project, the specific research objectives
included the following:
1. Determine to what degree First Nation households within the Island Lake First
Nation communities have access and can afford the 2007 Revised Northern Food
Basket as define by the Government of Canada (Indian and Northern Affairs), and
what issues may be influencing accessibility and affordability.
8

2. Determine the household food security status within the Island Lake First Nation
communities.
3. Explore initiatives that are being employed in the Island Lake First Nation
communities and other northern Manitoba First Nation communities to address
food insecurity.
1.4 Research Study Area
1.4.1 Community Accessibility
Four northern isolated First Nation communities in the Island Lake Region
(Wasagamack, St. Theresa Point, Garden Hill and Red Sucker Lake) were part of a study
to determine the level of household food security in terms of affordability and
accessibility of healthy foods; see Figure 2 below for geographical locations. Three of the
four communities, excluding Red Sucker Lake, are located on the sixth largest lake in
Manitoba, Island Lake; and are located approximately 605 km northeast of Winnipeg and
325 km southeast of Thompson. Red Sucker Lake First Nation is located approximately
75 km northeast of Garden Hill on Red Sucker Lake, approximately 530 km southeast of
Thompson.
9

Figure 2: Aerial View of Island Lake First Nation Communities
Wasagamack is accessible via boat from St. Theresa Point and Garden Hill, or via winter
road. There is no airport in Wasagamack, therefore residents and visitors must fly to St.
Theresa Point, approximately 12 km north of Wasagamack and take a $30 water taxi in
the open-water season to the community (2009 cost). During the winter, Wasagamack
can be accessed via truck and snow machine. Airports in St. Theresa Point and Garden
Hill are located on islands outside of the main community, which are accessible via boat
or winter road. In 2009, the water taxi from St. Theresa Point’s airport on St. Mary Island
to the main community was $10 per trip, while in Garden Hill the trip from the airport
located on Stevenson Island to the First Nation was eight dollars.
Mobility issues permeate life in these air/winter-road access only communities. Winter
roads are generally available for an eight-week period, from late January to mid-March
(ESRA, 2013); however, this mode of access is becoming increasing unpredictable due to
10

late lake freeze-up and early spring thaw, thereby truncating the window for winter road
access (ESRA, 2013; Kuryk, 2003).
Shipping via winter road to the communities is more favorable, as it is generally less
expensive than air transportation (ESRA, 2013). Winter roads are extremely important
for remote communities in Manitoba for the shipment of non-perishable foods, building
supplies, fuel, as well as employment and personal travel for community members. For
example, in 2005, the Northern Stores and Island Lake Trading Company, the two largest
food stores in the area, transported approximately 1.15 million kilograms of non-
perishable foods to the Island Lake area (Flood, 2005). As the winter road system
becomes increasing unreliable, the cost of shipping healthy foods will likely increase, due
to an increased reliance on air transportation (ESRA, 2013).
Community profiles are presented in Table 1. As illustrated in the Table, St. Theresa
Point has the greatest median family income and largest population amongst the four
communities, and also the greatest educational attainment. However, St. Theresa Point
also has the highest percentage of social assistance income. All communities with the
exception of Garden Hill have experience large population increases since 2006. All
communities with the exception of Wasagamack have a greater number of census
families than households revealing that some household may be comprised of an
extended family. Approximately 472 homes within St. Theresa Point and 267 homes
within Garden Hill First Nations do not have residential access to treated water. These
residences either collect treated water from access points within the community, or utilize
lake water. Homes in all four communities mostly use pit privies (outhouses).
11

Table 1: Community Profiles
Parameters Wasagamack St. Theresa Point Garden Hill Red Sucker Lake Population, 2011 14111 28711 27761 7811 Population change since 2006
22% increase1 21% increase1 6.1% decrease1 34.4% increase1
No. households 2741 5241 5451 1721 No. census families 2652 6251 6401 1901 Ave. persons per family
4.12 4.31 41 3.81
Ave. persons per household
4.52 5.51 5.11 4.61
Median family income
$26,4322 $29,9202 $24,3202 $26,8916
Rate of employment
28% of adults employed2
27% of adults employed2
36% of adults employed2
N.A.
Social assistance rates
41% social assistance2
43% social assistance2
37% social assistance3
38% social assistance 3
Aboriginal Population, %
100%2 99.9%2 100%2 At least 87%1
Population >15 yrs old, %
61%1 60%1 58%1 60%1
Educational attainment
24% of adults have completed
high school2
28% of adults have completed high school; 5% have university
education2
18% of adults have completed high school; 5%
had college education2
19% of adults have completed high
school; 6.3% have college or university education
Residential water treatment
Homes have water trucked to
cisterns or barrels4,5
10% of homes have water
trucked to cisterns or barrels; 90%
have no service4,5
54% of homes have water
trucked to cisterns or barrels; 49%
have no service4,5
Homes have water trucked to cisterns
or barrels4,5
Residential sewage treatment
Pit privies4,5 7% of homes have trucked septic
service; 93% use pit privies4,5
Pit privies4,5 Pit privies4,5
Transportation Boat or winter road
Boat, winter road, plane
Boat, winter road, plane
Boat, winter road, plane
1Statistics Canada, 2012a,b,c,d 2Statistics Canada, 2007a,b,c,d 3Statistics Canada, 2001a,b,c,d 4FARHA, 2013 5Kitayan, 2013 6Average between Wasagamack, St. Theresa Point, and Garden Hill 2006 median family incomes.
12

1.5 Organization of Thesis
Chapter One has introduced the background, context, purpose, objectives, and need for
the research. Chapter Two provides a discussion of relevant literature surrounding food
security within First Nation communities, within the Aboriginal population living “off-
reserve”, and within the rest of the population of Canada, and discusses current initiatives
that are employed in First Nation communities to increase food security. Chapter Three
provides a framework for the research and explains the data collection methods. Chapter
Four describes the results of the household food security surveys and food costing
research. Chapter Five offers the authors insight into the results, and Chapter Six presents
final conclusions and recommendations related to the objectives based on the findings.
1.6 Researcher’s Reflection
Since 2001, I have had the opportunity to travel throughout the Canadian Arctic, northern
Manitoba, and northern Ontario, visiting and working in many First Nation and
Aboriginal communities. During my visits I was always shocked by the high cost of food,
low employment opportunities and noticeable monetary-poverty that I saw around me. I
often thought to myself, “How could a family afford to eat healthy foods”?
Like destiny, I had the good fortune to hear about a study which was to be undertaken in
communities and First Nations in northern Manitoba, looking into the issue of food
insecurity and food costs. I thought that this would be my chance to understand the
problems I often saw around me in my travels, and to hopefully find some solutions and
provide much needed data to communities struggling to secure funding for programs.
13

In the summer of 2009, I travelled to the Island Lake Region landing in St. Theresa Point
with my co-worker, who calls St. Theresa Point her hometown. From the airport we
hauled our luggage to the community dock and took a water taxi to Wasagamack. We
went door-to-door conducting interviews and administering the household food security
survey. We also visited all of the community’s stores pricing food items. We then took
another boat taxi to The Northern Store, which was located on an Island. Why is the only
grocery store on an Island I thought? Considering the high cost of food how does the
requirement to travel via boat taxi to the only full grocery store impact food accessibility?
We travelled back to St. Theresa Point a few days later. The prices in the stores were
outrageous; how could a family afford to eat? We continued to interview families and
administer the survey; however, after visiting one family I was forever changed. A
mother lamented that she could not afford to feed her children healthy food. The mother
disclosed that she knows what food is healthy and what she ought to be feeding the
children; however, if she buys those healthy foods instead of the less-healthy foods, her
children will be hungry again. She said that she buys what she can in order to satiate
hunger, even though it is not healthy. Is this really Canada?
This study pulled at my hearts strings and made me realize that hunger exists within
Canada, and that our Government ought to be acting with haste to remedy this grave
situation. To stand motionless and mute when one understands the gravity and the
consequences would be immoral and unethical. In light of this study, it is my thought that
14

Canada has failed to act with an ethical conscience in elevating hunger in First Nation
communities.
15

CHAPTER TWO: REVIEW OF RELATED LITERATURE
This chapter provides a review of relevant academic literature and seminal articles,
government reports and documents, and recent news articles, in order to provide context
regarding the issue of food insecurity First Nation communities, and to provide support
and dialogue for subsequent interpretation of research results.
The chapter defines the concepts of food security and food insecurity, and provides a
discussion of food insecurity rates within Canada, Manitoba, and within First Nation
communities. A review of issues concerning food availability and accessibility within
First Nations including remoteness, employment and poverty, restrictions on the use of
country foods is provided, in addition to current tools available for food costing and
current food-based initiatives employed with First Nations. A summary of food security
studies in Canada and within First Nation communities is also provided.
2.1 What is Food (In)Security?
Food is a basic human need. The right to food is also a fundamental human right. It was
recognized as such by the United Nations in the 1948 Universal Declaration of Human
Rights. Canada has recognized the 1976 International Covenant on Economic Social and
Cultural Rights, the Convention on the Elimination of Discrimination Against Women,
and the Convention on the Rights of the Child under which, “Canada has a duty to
respect, protect and fulfill the right to food” (United Nations, 2012, p.5). Some would
also argue that, Canada’s own Charter of Rights and Freedoms in section 15(1) (the
equality provision) and section 7 (right to life, liberty, and security of the person);
although the Charter does not explicitly state that Canadians enjoy the ‘right to food’.
16

Food security has been defined by the World Food Summit (1996) in the Rome
Declaration on World Food Security as,
“existing when all people, at all times, have physical and economic
access to sufficient, safe and nutritious food that meets their dietary
needs and food preferences for an active and healthy life”.
This definition comprises concerns including economics, food safety, accessibility, and
culture, which contribute to the idea of possessing appropriate food access for individuals
and households. The World Health Organization (WHO) notes that food security
comprises three core ideas: food availability (consistently being able to maintain a
reliable quantity of food); food access (possessing adequate resources to obtain healthy
and culturally appropriate foods, and having geographical access to those healthy foods);
and food literacy (knowledge of food preparation and basic nutrition, and access to
sufficient quantities of clean water and sanitation) (WHO, n.d.).
On the opposite end of the scale, food insecurity is characterized by deficient or
inadequate access to “sufficient, nutritious, and personally acceptable food” (Davis and
Tarasuk, 1994, p. 50), and can be defined as “the inability to acquire or consume an
adequate diet quality or sufficient quantity of food in socially acceptable ways, or the
uncertainty that one will be able to do so” (Davis and Tarasuk, 1994, p.51). Food
insecurity is often associated with poverty (Health Canada, 2007), and encompasses
varying degrees of intensity located on a continuum. Health Canada (2007) and Tarasuk
et al. (2013) describe the three intensities of food insecurity as “marginal”, “moderate”
and “severe”. “Marginal” food insecurity is described by Tarasuk et al. (2013) as having
17
some indication of anxiety, worry, or income-related barrier to acquiring an adequate
supply of food. A compromise in the quality and/or quality of food is an indication of
“moderate” food insecurity, and those who experience “severe” food insecurity reduce
their food intake and exhibit disrupted eating patterns, and/or hunger (Health Canada,
2007; Tarasuk et al., 2013).
The Rome Declaration declared that “poverty is a major source of food insecurity” and
that the eradication of poverty is required in order to ensure that all people have access to
food” (World Food Summit, 1996). Nationally, family income is recognized as one of the
most important determinants of level of food security and subsequently health (Federal,
Provincial and Territorial Advisory Committee on Population Health, 1994; Government
of Canada, Agriculture and Agri-Food, 2008;WHO, 2003; Health Canada, 2007).
The depth of poverty in First Nation communities is alarming even though many First
Nation families share their resources. The 2006 Canadian Census data revealed that 50%
of Status First Nation children in Canada live below the poverty line (the after-tax Low-
Income-Measure); in Manitoba the rate increases to 62%; while the average national
child poverty rate is 17% (Canadian Centre for Policy Alternatives, 2013).
Low-income households are limited in the choices they can make regarding food
procurement, as low-income households possess limited purchasing power. Households
that are food insecure are more likely to purchase processed foods, which are typically
low in cost, as opposed to more healthy and expensive foods such as lean meats, fresh
fruits and vegetables, and dairy products (Vozoris and Tarasuk, 2003). Research has
correlated inadequate nutrition with food insecurity, which has also illustrated that “a
18

prolonged state of inadequate nutrition can have serious health implications” (Che and
Chen, 2001, p. 18). Indeed, food insecurity is linked to both physical and mental health
problems, including type 2-diabetes, obesity, cardiovascular disease, depression, anxiety,
among other problems (Che & Chen, 2001; Kirkpatrick and Tarasuk, 2008; Tonn, 2011;
Young, 2000; Vozoris and Tarasuk, 2003).
2.2 Food Insecurity in a First Nations Context
The Aboriginal subsistence economy has experienced considerable change during and
following the fur-trade era marked by the effects of colonialism and the policies and
systems imposed, which ushered communities and families into a wage economy and
subsequent reliance on market-foods (Churchill, 1999; NRI, 2011; Thompson et al.,
2004). Underdevelopment and appropriation of lands for resource development in and
near many northern Aboriginal communities has continued to have a negative effect and
has resulted in impoverished conditions (LaDuke, 2002; Thompson et al., 2011).
“As late as the 1950’s, northern communities were relatively self-sufficient, except for
flour, sugar and similar products. It was not uncommon to have had market gardens,
canning and other locally produced foods” (Government of Manitoba, 2003, p. 13),
where locally produced foods included country foods; such as fish, wild meats, berries,
and medicinal plants harvested locally, which were part of the First Nation community’s
subsistence based economy. As a result of the shift in economic base, over the past 70
years Aboriginal people have been settled into permanent communities, which decreased
reliance on country foods (Fieldhouse and Thompson, 2012). Additionally, younger
people today are not as interested in consuming country foods, and prefer the store-
19
bought foods (Fieldhouse and Thompson, 2012). However, this may be the result of a
loss of intergenerational transfer of traditional knowledge and language due to the
residential schools experience (Rudolph and McLachlan, 2013)
Although the younger people are ostensibly less interested in country foods, these foods
are recognized as essential to the social, cultural, economic and spiritual wellbeing of
Aboriginal First Nation Communities (Bell-Sheeter, 2004; Chan et al., 2011; Chan et al.,
2012) in addition to being a nutritious and healthy food source. Health Canada’s Food
Guide for First Nation, Inuit and Métis people, indicates that wild meats are considered to
be leaner and have more essential nutrients required for a healthy diet than store-bought
meats.
Policies and other instruments employed by the Canadian and provincial governments in
the past and present have also affected the consumption of country foods. Under current
health regulations, country foods cannot be provided for school lunch programs, Elder
programs, or other community public events (NRI, 2011). Under The Wildlife Act of
Manitoba, wild meat may be given to First Nation people by First Nation people for food.
However, legislation has created restrictions on the use of the wild meat; since wild meat
that has not been federally inspected cannot be “utilized in any way for food in a food
handling establishment”, under Manitoba’s Food and Food Handling Establishment
Regulation and Public Health Act. This regulation restricts the ability for wild meat to be
used in school lunch and Elder meal programs; which would greatly reduce costs and
increase health benefits to a community struggling with healthy eating. For the
community to succeed in such an endeavor, their meat processing facility would need to
20

be either federally regulated or provincial registered. This would also allow the
community to sell wild meats, should they wish to do so (Thompson et al, 2012).
In addition to low-income and the inability to afford healthy foods, many First Nation
communities including those of Island Lake, face challenges in obtaining clean drinking
water in sufficient quantities to ensure a standard of healthy living. Over 3000 First
Nation households across Canada are without running water, and are not connected to a
water treatment plant but instead are provided potable water via truck, which is stored in
cisterns or barrels at the households (Winnipeg Free Press, 2010). Approximately 49%
(n=739) of households in the Island Lake First Nation communities have no access to
trucked potable water services (FARHA, 2013; Kitayan, 2013), resulting in a lack of
access to sufficient amounts of potable water for cooking, drinking and cleaning. In 2010
it was estimated that households in Island Lake depend on 10 liters of treated and 20
liters of untreated water per day per person for drinking water and domestic uses
(Winnipeg Free Press, 2010). The United Nations has recognized the right of every
human to have access to a sufficient amount of safe, acceptable, affordable and
physically accessible water for personal and domestic uses in the volume of 50 to 100
liters per person per day (UN, n.d.; Winnipeg Free Press, 2010); well above the 10 liters
per person per day that many First Nation households are receiving now. Since water is
requirement for cleaning, cooking and the preparation of foods, the inaccessibility of
clean and safe water adversely affects the ability to provide healthy food for many
households.
21

2.2.1 Access, Availability, and Affordability
In many Canadian and Northern Manitoban First Nations achieving food security is
challenging. The pillars upon which food security rests (food access, food availability and
food literacy) are fractured (Government of Manitoba, 2003; INAC, 2003; NRI, 2011;
Thompson et al., 2010; Thompson et al., 2011; Thompson et al., 2012). A lack of stores
and commercial competition, in addition to access to country foods, geographical
location, degree of isolation and proximity to larger urban areas, and a lack of monetary
resources can decrease access to food and increase levels of food insecurity (Thompson
et al., 2011). Many First Nation communities in Canada and Manitoba are remote and
plagued by access problems, and approximately 4% of the 491,000 First Nation people in
Canada are lacking all-season road access to their communities. In northern Manitoba, 23
First Nation communities (36.5%) are without all-season road access and rely on either
rail or air for transportation. The remoteness of these communities, especially fly-in only
communities, directly affects the price of healthy foods and access to those foods as
shipping is expensive and winter road systems have become less predictable (Manitoba
Department of Transportation and Government Services, 2003; Government of Manitoba,
2003).
Elevated Food Prices in the North
“Why is alcohol priced the same at Churchill as in Winnipeg, but milk is much more
expensive?” Indeed, why? This question engaged the Province of Manitoba to visit the
problem and study the issue of high food costs in the north. The study cumulated in the
2003 Northern Food Prices Report, which provided insight into the problem and made
recommendations. The price of milk is often used as an indicator of overall food prices in
22

northern and remote communities, mainly by the media; however, the price of most store-
bought foods in Canada’s northern and remote First Nations are significantly higher than
those in southern Canada, due to elevated shipping costs, high store overheads, and high
energy costs (Government of Manitoba, 2003; Manitoba Food Charter, 2009). In addition
to higher costs, the availability of fresh foods such as vegetables and fruit is usually low,
and what is available is often in poor condition (Lawn and Harvey, 2004; Thompson et
al., 2011). The elevated cost of foods has had a great impact on the ability of northern and
remote First Nations to provide enough healthy food for their families (Government of
Manitoba, 2003; Thompson et al., 2011).
For most First Nation families, the Northern Store is their only option for groceries. The
Northern Store is owned and operated by the North West Company (NWC), formally
operated by the Hudson Bay Company, a business with a long and controversial history
in Canada’s northern communities. The Northern Store offers a wide variety of services
including a full grocery and general merchandise, fast food outlet, and banking; and in
most First Nation communities in Manitoba, they are a monopoly regarding the offering
of fruits, vegetables, and meats. Depending on the degree of isolation of the community
and connectedness to larger urban areas, the Northern Store may need to barge, fly, or
transport by ground food and supplies to the communities. In the Island Lake First Nation
communities, food and supplies are flown into the communities during the spring,
summer and fall, and transported via truck on unreliable winter roads during the winter
months. Due to the mode and duration of transportation food to the community, fresh
foods such as fruits and vegetables are often bruised or spoiled before they are on the
shelves (Thompson et al, 2011).
23

Without reliable and affordable transportation and shipping, the prices of market-foods
within fly-in only communities are dependent on favorable winter road conditions.
Thompson et al. (2012) found that road access and public transit, such as bus or rail, are
positively correlated with increased food security. Thompson also found that rates of
food insecurity associated with road access only, plane access only, train access only
were 70%, 78%, and 80% respectively as documented in the film Harvesting Hope (NRI,
2011), further illustrating that the degree of isolation and associated accessibility directly
affects the rate of food security.
Putting Food on the Table
According to the 2006 Canadian Census (the most recent data available), the median on-
reserve family income in Canada was approximately $14,000. In Manitoba the average
median “on-reserve” income was $9,345 in 2001 (AANDC, n.d.(a)), compared to the
median Canadian and Manitoban family incomes of $23,307 and $21,805 after-tax,
respectively. The Low-Income Measure (LIM)1 in 2005 for an individual with no
children or spouse was $14,604, and for an individual with two children and no spouse,
$24,827 for (Statistics Canada, 2007e). This illustrates that on-reserve income was well
below the stated LIM, which results in food access and affordability problems due to the
high cost of food and supplies in First Nation communities. One of the reasons for the
gap in income, is that there are limited full-time employment opportunities within First
Nations communities, results in people working seasonally or part-time (AANDC,
n.d.(a)). Subsequently, there are also higher rates of dependency on social assistance
1 The Low Income Measure (LIM) is one measure of poverty in Canada, and is commonly used for making international comparisons. The LIM is calculated as 50% of median income, adjusted for household size.
24

programs (which include pension). In 2005/06, 47% of people living in First Nations
communities in Manitoba were dependent on social assistance, compared to the average
for individuals living in First Nations across Canada at 36%, and the general Canadian
population at 5.5% (INAC, 2007a).
Measuring Food Costs
Canada has several tools available for pricing a healthy basket. The National Nutritious
Food Basket (NNFB) was first created in 1974 by Agriculture Canada and is now under
the jurisdiction of Health Canada. A revised edition of the NNFB was created by Health
Canada in 2008 to keep up with changes in the Canadian diet. The NNFB includes 67
items for a family of four (two adults, male and female, ages 30-51; and two children,
male and female, ages 9-13) for one week and weighs approximately 59 kg. While Health
Canada develops the NNFB, it does not collect information on the cost of the Basket or
provide a costing protocol for collecting pricing data, as this is the responsibility of
individual provinces. The NNFB is most commonly used for costing purposes in urban
and southern Canadian locations.
In addition to Health Canada’s National food basket, the Northern Food Basket (NFB) is
also available for food costing purposes and is based on a family of four. The NFB was
developed in 1990 by Indian and Northern Affairs Canada (INAC), (Aboriginal Affairs
and Northern Development Canada (AANDC)) to monitor and report on the cost of foods
in northern and remote communities throughout Canada. In 2007 the NFB was revised to
incorporate the changes made by Health Canada to the Canadian Food Guide and the
First Nations, Inuit and Métis Food Guide, and based on food consumption surveys
25

within First Nation and Inuit communities to reflecting the types of foods consumed by
northern families across Canada. The NFB was also revised to easy convert purchase
sizes into edible portions. The resulting 2007 Revised Northern Food Basket (RNFB)
comprises 67 perishable and non-perishable food items and is surveyed on an annual or
seasonal basis by AANDC. The basket is intended to provide a diet for two adults (male
and female) ages 30-51, and two children (male and female) ages 9-13), and weights 52
kg. The RNFB does not contain measures for country foods, and is based only on market-
foods. The RNFB was not created to be a grocery list for healthy food consumption, but
rather a benchmark for comparing food costs over time and between different
communities (INAC, 2007).
A comparison of the two baskets illustrates that the RNFB contains more canned and
frozen meat, fruits, and vegetables than the Health Canada NNFB, as well as powered
milk and canned milk. The RNFB also contains less than Health Canada’s recommended
amount for grain servings and milk (INAC, 2007).The NNFB does not contain flour,
sugar, lard, or butter; however, does have additional grain products including pita bread
and buns. The NNFB weighs approximately 7 kg more than the RNFB, and contains
considerably more dairy products (see Table 2). The RNFB also contains an additional
5% (in addition to the miscellaneous food) “to compensate for the additional energy
needs of the cold climate” (INAC, 2007, p.9) in the north. For a full comparison of items
in each of the baskets and their associated food weights see Appendix A.
26

Table 2: Comparison of Canadian Food Basket Weights1,2
Food Category Revised Northern Food Basket
National Nutritious Food Basket
Food Weight Difference
Dairy 9.2 kg 22.06 kg 12.86 kg Eggs 0.45 kg 0.78 kg 0.33 kg Meat and Meat Alternatives 7.7 kg 6.49 kg 1.21 kg Grains 5.5 kg 5.79 kg 0.29 kg Fruit and Vegetables 26.75 kg 22.06 kg 4.69 kg Fat and Oils 1.05 kg 1.37 kg 0.32 kg Sugar 0.6 kg N.A. 0.6 kg Miscellaneous 5% 5% Total Weight 52 kg 59 kg 1INAC, 2007 2Health Canada, 2008
Cost of Market-Food in Northern Manitoba
Aboriginal Affairs and Northern Development Canada collects food costing data for most
First Nation communities throughout Canada as a part of the former Food Mail Program
and now, the Nutrition North Canada program. In the past, AANDC collected this data
with the communities using the RNFB. Under the NNC program, participating stores now
collect this information and report it to AANDC. The average costs of the RNFB (a
family of four, for one week) in the Island Lake Region were $413 (2010); $426 (2011);
$393 (2012); and in March 2013, $410 (Government of Canada, Nutrition North Canada,
n.d.(a)(b)). In comparison to a cost of $243 in Winnipeg in 2010 (the only data available
for Winnipeg), a difference of $170 (Government of Canada, Nutrition North Canada,
n.d.(a)(b)).
A food-costing audit in 14 northern communities and First Nations in Manitoba using
Health Canada’s NNFB in 2009 revealed that the Basket costs $418 in fly-in only
communities, $302 in northern rural communities, and $233 in stores within southern
27

Manitoba (Thompson et al., 2012) for a family of four for one week. The study found that
the NNFB in fly-in only communities were 38% more costly compared to communities
with road-access, and that the NNFB is approximately $185 more expensive in fly-in
only communities than in Southern Manitoba (Thompson et al. 2012). This price gap is
similar to the difference ($170) between the RNFB costs in Island Lake from 2010 to
2013 compared to Winnipeg. Thompson also concluded that families in northern
Manitoba are spending 50% to 80% of their income on food alone (Thompson et al.,
2011).
The 2010 Manitoba FNFNES also measured the cost of Health Canada’s NNFB (family
of four for one week), amongst other parameters including food insecurity rates in nine
Manitoba First Nation communities1. The study found that the cost of the NNFB varied
depending on the location and accessibility of the communities. In southern First Nation
communities the basket cost between $62 and $70 more than in Winnipeg, while mid-
Manitoba First Nations basket cost $57 over the Winnipeg costs, and more northern First
Nations with a similar degree of isolation as the Island Lake First Nations cost $182 more
than Winnipeg (Chan et al. 2012). This price gap agrees with Thompson et al. (2012) and
the RNFB costing data from Nutrition North Canada.
A recent report published in May 2012 by the Winnipeg Regional Health Authority
investigated the cost of Health Canada’s NNFB throughout Winnipeg and within
Manitoba’s Health Regions. In the Burntwood Region (the area in which the Island Lake
1 First Nation communities included in the Manitoba FNFNES study include: Swan Lake, Sandy Bay, Pine Creek, Chemawawin, Sagkeeng, Hollow Water, Cross Lake, Sayisi Dene, and Northlands Denesuline First Nations.
28

First Nation communities are located, and included two stores within the Island Lakes
area of the six stores that were audited) the cost of the NNFB in May 2011 was
approximately $273 for a family of four per week, in Winnipeg the cost was between
$179 and $198, a difference of approximately $75 to $94 (WHRA, 2012). The study also
found that 29.4% of foods within the National Nutritious Food Basket were unavailable
within the Burntwood Region, comprising 26% of meats; 25% of fresh vegetables and
fruits, among other missing items. The cost of the food basket is likely lower in this
region as it includes several First Nations and communities with road access in addition
to the City of Thompson.
The high price of food coupled with limited household income has lead to threatened
food security, and consequently a crisis of poor health outcomes, including type-2
diabetes (Thompson et al., 2011). In 1996, the Minister of Health acknowledged diabetes
to be “both a major public health issue and an epidemic among Aboriginal people”
(Government of Manitoba, 2003. p. 14). Sadly, Manitoba has one of the highest rates of
pediatric type-2 diabetes in Canada, with children as young as eight years old being
diagnosed with the disease within the Island Lake First Nation communities (WRHA,
2012; Young, 2000). The rate of diabetes amongst Aboriginal people in Manitoba is
18.9% compared to 4.5% for non-Aboriginal people (Government of Manitoba, 2003).
2.3 Measurement Food Security in Canada
Food insecurity can be measured at various levels including the individual level,
household level, and community level. In Canada, food security has been measured at the
household and community levels, where household food security measures the ability of
29

a household to acquire food at the household level; and, community food security is
broader and incorporates the social and economic factors that concern the availability and
quality of foods, as well as any programs available to counteract food insecurity that exist
within a community (Cohen, 2002). At the community level and beyond, food insecurity
can have a negative impact on the health care system, and can affect children’s abilities to
succeed in school and within society (Che and Chen, 2001).
The first Canadian food security survey was supplementary to the 1998/1999 National
Population Health Survey, and consisted of only three questions. Since 2004, food
insecurity has been monitored on a consistent basis by Health Canada as part of the
CCHS, however not all provinces choose to partake every year in the food security
module. The 2004 CCHS was the first survey attempting to quantify the prevalence of
food insecurity within Canada using a validated research tool (18-question survey
module), developed by the Unites States Department of Agriculture (USDA) and used by
the USDA since 1995. The survey is designed to capture “self-reports of uncertain,
insufficient, or inadequate food access, availability and utilization due to limited financial
resources” (Health Canada, 2007, p.8), as a measure of household food insecurity and
measures food security on a continuum from food secure to severely food insecure.
The CCHS focuses on nutrition throughout Canada with the exception of First Nation
communities; however, the surveys do include Aboriginal households living “off-
reserve”. Beginning in 2015, the food insecurity component questionnaire will be a
regular comment of the larger study.
30
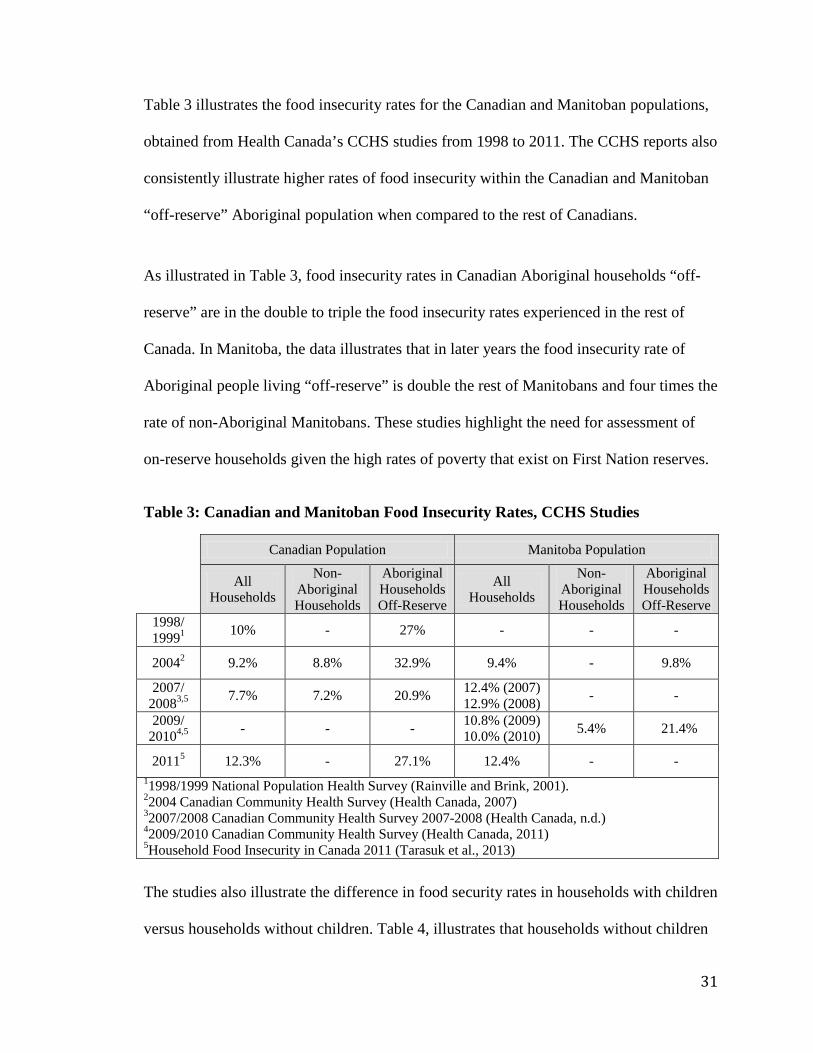
Table 3 illustrates the food insecurity rates for the Canadian and Manitoban populations,
obtained from Health Canada’s CCHS studies from 1998 to 2011. The CCHS reports also
consistently illustrate higher rates of food insecurity within the Canadian and Manitoban
“off-reserve” Aboriginal population when compared to the rest of Canadians.
As illustrated in Table 3, food insecurity rates in Canadian Aboriginal households “off-
reserve” are in the double to triple the food insecurity rates experienced in the rest of
Canada. In Manitoba, the data illustrates that in later years the food insecurity rate of
Aboriginal people living “off-reserve” is double the rest of Manitobans and four times the
rate of non-Aboriginal Manitobans. These studies highlight the need for assessment of
on-reserve households given the high rates of poverty that exist on First Nation reserves.
Table 3: Canadian and Manitoban Food Insecurity Rates, CCHS Studies
Canadian Population Manitoba Population
All Households
Non-Aboriginal Households
Aboriginal Households Off-Reserve
All Households
Non-Aboriginal Households
Aboriginal Households Off-Reserve
1998/ 19991 10% - 27% - - -
20042 9.2% 8.8% 32.9% 9.4% - 9.8%
2007/ 20083,5 7.7% 7.2% 20.9% 12.4% (2007)
12.9% (2008) - -
2009/ 20104,5 - - - 10.8% (2009)
10.0% (2010) 5.4% 21.4%
20115 12.3% - 27.1% 12.4% - - 11998/1999 National Population Health Survey (Rainville and Brink, 2001). 22004 Canadian Community Health Survey (Health Canada, 2007) 32007/2008 Canadian Community Health Survey 2007-2008 (Health Canada, n.d.) 42009/2010 Canadian Community Health Survey (Health Canada, 2011) 5Household Food Insecurity in Canada 2011 (Tarasuk et al., 2013)
The studies also illustrate the difference in food security rates in households with children
versus households without children. Table 4, illustrates that households without children
31

are more food secure than those with children. Food insecurity rates are similar in both
the general population and the Aboriginal population living “off-reserve”. The 2011
CCHS also revealed that households are more likely to be food insecure if they are lead
by a female lone parent (35%), have an income below the Low-Income Measure (LIM)
(33%), are Aboriginal (27%), or rent their home (25%) (Tarasuk et al., 2013).
Table 4: Household Food Insecurity Rates in Households With and Without Children
General Canadian Population “Off-Reserve” Aboriginal Population Households with
Children Household
without Children Households with
Children Household
without Children 1998/ 19991 8.5% 5.5% 20042 10.4% 8.6% 10.3%6 / 13%7 7.4%6 / 6.8%7 2007/ 20083,5 9.7% 6.8% 2009/ 20104,5 9.5%7 6.1%7 20115 16% 10.7% 11998/1999 National Population Health Survey (Rainville and Brink, 2001). 22004 Canadian Community Health Survey (Health Canada, 2007) 32007/2008 Canadian Community Health Survey 2007-2008 (Health Canada, n.d.) 42009/2010 Canadian Community Health Survey (Health Canada, 2011) 5Household Food Insecurity in Canada 2011 (Tarasuk et al., 2013) 6Canadian Population 7Manitoban Population only
The CCHS reports and Tarasuk et al. (2013) also reveal that household food insecurity
grew in Canada, from approximately 1.4 million households in 2008 to 1.6 million
households in 2011.
While there is limited government documentation regarding food insecurity rates within
First Nation communities, the CCHS reports offer some insight into the dichotomy that
exists between Aboriginal and non-Aboriginal households in Canada. Given that many
Northern Canadian households have lower incomes due to unemployment, seasonal
employment, or low wages (Butler Walker et al., 2009), and suffer systemic racism,
32

impacts of the residential schools, and other social determinants of health (Rudolph,
2012; Willows, 2005), the rate of food insecurity within First Nation Communities is
likely greater than “off-reserve” statistics presented. These studies highlight the need to
include the assessment of food insecurity within First Nation communities given the high
rates of poverty that exist within these communities. Additionally, it is likely that by
excluding First Nations from the national assessment of food insecurity, that the statistics
are incorrect and present lower food insecurity rates than what actually exist (Tarasuk et
al., 2013).
2.4 Measuring Food Insecurity in First Nations Communities in Canada
While the Government of Canada has excluded First Nation communities from their
Canadian Community Health Studies, there are several studies that have been conducted
by academics and Aboriginal organizations documenting nutrition and food security
within First Nation communities throughout Canada including several First Nations
within Manitoba, Fort Severn First Nation in northern Ontario, the Inuit hamlet of
Kugaaruk, Nunavut, and several First Nations in British Columbia.
There are several studies that have been conducted at the National level by First Nation
organizations. The First Nations Regional Longitudinal Health Survey (RHS), a national
survey collecting information on health indicators, for Aboriginal peoples living within
First Nation communities throughout Canada was administered in 19971, with subsequent
1 The 1997 study comprised 14,008 individual surveys in 188 communities, and included both Wasagamack and Garden Hill First Nations.
33

national surveys conducted in 2002/031 and 2008/102, which focused much of its
attention on nutrition and did not utilize the CCHS food security survey tool. The
national 2008/10 RHS however, used the 6-item subset of the United States Household
Food Security Survey Core Module (US HFSSM) tool to assess adult food security,
which has been shown to approximate closely the three main categories of food
insecurity: food secure, moderately food insecure, and severely food insecure (Bickel et
al., 2000). Additional national RHS surveys are scheduled to be undertaken in 2013 and
2016.
Although the national RHS 2002/2003 and 2008/10 studies and the 2002/03 Manitoba
First Nation Regional Longitudinal Health Survey3 did not utilize the 18-item household
food security questionnaire used in the CCHS studies, the studies did collect information
regarding household behaviors that can be used as indictors of household food security
status, for example the consumption of a balanced diet. Results from these studies are
presented in Figure 3. Lawn and Harvey (2004) have, however, found that the phrase
“balanced meal” may not be appropriate within First Nation communities, and that
“healthy meals” may be more meaningful to Aboriginal communities. It is unknown if
terminology could have skewed results in any way.
Figure 3 reveals that the majority of adults “sometimes” consumed a balanced diet within
the National survey, while the majority of children are reported as “always or almost
1 The 2002/03 national RHS study comprised 22,602 individual surveys in 238 communities, and included both St. Theresa Point and Garden Hill First Nations. 2 The 2008/10 national RHS study comprised 21,757 individual surveys in 216 communities and included Garden Hill First Nation. 3 The 2002/03 regional RHS study comprised 5,615 individual surveys in 26 Manitoba First Nations.
34
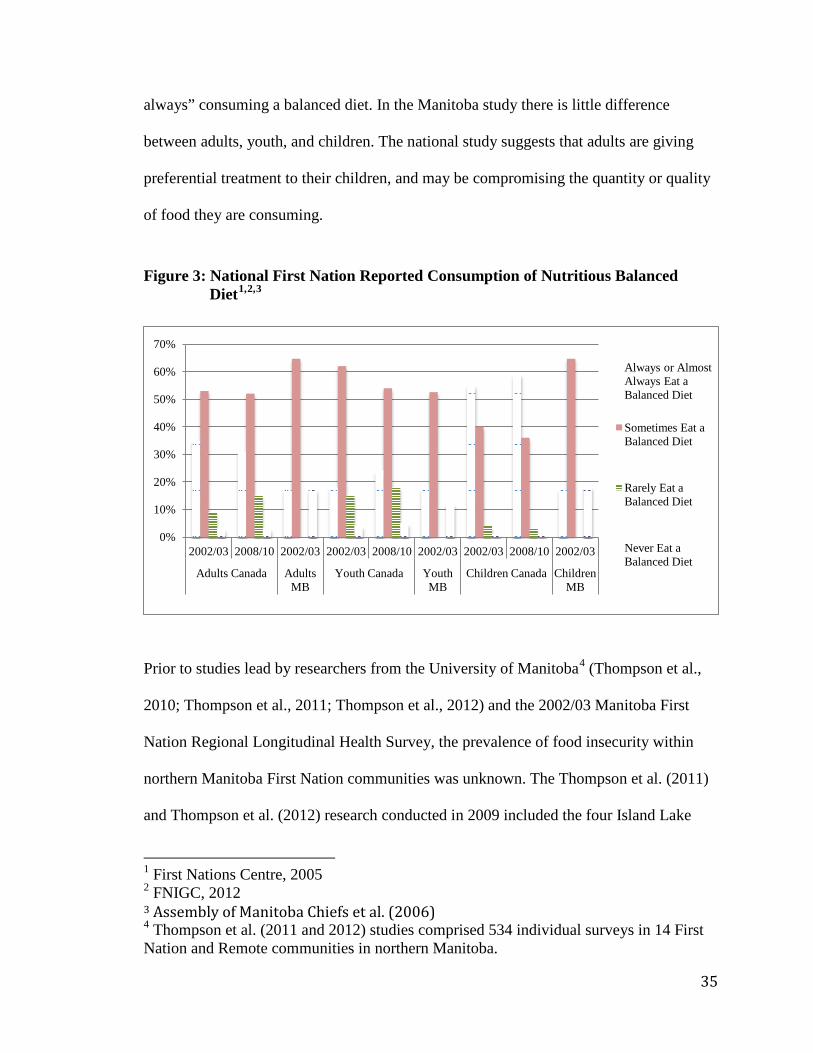
always” consuming a balanced diet. In the Manitoba study there is little difference
between adults, youth, and children. The national study suggests that adults are giving
preferential treatment to their children, and may be compromising the quantity or quality
of food they are consuming.
Figure 3: National First Nation Reported Consumption of Nutritious Balanced Diet1,2,3
Prior to studies lead by researchers from the University of Manitoba4 (Thompson et al.,
2010; Thompson et al., 2011; Thompson et al., 2012) and the 2002/03 Manitoba First
Nation Regional Longitudinal Health Survey, the prevalence of food insecurity within
northern Manitoba First Nation communities was unknown. The Thompson et al. (2011)
and Thompson et al. (2012) research conducted in 2009 included the four Island Lake
1 First Nations Centre, 2005 2 FNIGC, 2012 3 Assembly of Manitoba Chiefs et al. (2006) 4 Thompson et al. (2011 and 2012) studies comprised 534 individual surveys in 14 First Nation and Remote communities in northern Manitoba.
0%
10%
20%
30%
40%
50%
60%
70%
2002/03 2008/10 2002/03 2002/03 2008/10 2002/03 2002/03 2008/10 2002/03
Adults Canada Adults MB
Youth Canada Youth MB
Children Canada Children MB
Always or Almost Always Eat a Balanced Diet
Sometimes Eat a Balanced Diet
Rarely Eat a Balanced Diet
Never Eat a Balanced Diet
35
communities of Wasagamack, St. Theresa Point, Garden Hill and Red Sucker Lake, in
addition to ten other northern Manitoba First Nation communities north of Thompson,
Manitoba. The results gathered as part of this thesis, are included in Thompson et al.
2011 and 2012 analysis and journal articles.
Since 2009 several additional studies led by First Nation organizations have been
conducted within First Nation communities, including the First Nation Food, Nutrition
and Environment Study conducted in 2010 within Manitoba by Chan et al. (2012)1, and
the First Nations RHS Phase 2 (Manitoba)2 undertaken between 2008-2010 by the
Assembly of Manitoba Chiefs. Both Thompson’s studies and Chan et al. (2012) have
used the full CCHS household food security tool. Additionally, studies conducted in First
Nation communities in Nunavut, Northern Ontario, Manitoba and British Columbia have
also used the CCHS household food security surveys, which allows for direct comparison
across studies and populations, as well as to comparison to “off-reserve” Aboriginal
population documented in the CCHS studies.
The CCHS survey questions are structured in a way to reveal behaviors that are
consistent with marginal, moderate, or severe food insecurity and are measured on an
adult and child scale (Health Canada, 2007; Tarasuk, 2013). Figure 4 illustrates questions
pertaining to the three intensities of adult food insecurity, and reveals that 35% to 63% of
adults in Manitoba First Nation communities worried that food would run out before
there was money available to buy more, indicating behaviors representing marginal food
1 The Manitoba FNFNES Study comprised 646 individual surveys in nine Manitoba First Nation communities throughout Manitoba. 2 The First Nations RHS Phase 2 (Manitoba) study comprised 3,390 individual surveys in 34 First Nation communities throughout Manitoba.
36

insecurity. Compared to Fort Severn First Nation, Ontario and Kugaaruk, Nunavut where
76% and 92% of adults worried about having enough money for food, respectively.
Cutting the size of a meal or skipping meals because there isn’t enough money to buy
food is indicative of moderate food insecurity. In Manitoba the Thompson et al. (2011)
study indicated the highest rate of this behavior at 46%, while 30% Fort Severn adults
and 60% of Kugaaruk adults reported this behavior. Severe food insecurity is marked by
hunger. In Manitoba the Thompson et al. (2011) and 2002/03 RHS studies revealed rates
of 22% to 35%. Kugaaruk revealed the highest rates of hunger. Rates of hunger amongst
the general Canadian population were in the order of 3%, revealing adult hunger rates 11
times the Canadian norm in Manitoba.
Figure 4: First Nation Adult Food Insecurity Indicators vs. Canadian Population
Figure 5 illustrates questions pertaining to child food insecurity focusing on moderate and
severe food insecurity behaviors, and reveals similar results to the adult scale figure. In
0% 20% 40% 60% 80% 100%
RHS 2002/03
Thompson et al., 2011
FNFNES 2010
AMC, 2012
RHS 2008/10
FNFNES 2008
Lawn and Harvey, 2004
Lawn and Harvey, 2003
2011 CCHS
2004 CCHS
Man
itoba
C
AN
BC
O
N
NU
Firs
t Nat
ion
Com
mun
ities
Gen
eral
C
anad
ian
Popu
latio
n
Worried that food would run out
Cut the size of meal or skipped meals, could not afford more food
Hungry but didn't eat, could not afford food
37

Manitoba, the 2002/03 RHS and Thompson et al. (2011) study reveal that 23% to 63% of
children are not getting enough to eat, because there isn’t enough money for food. Similar
albeit slightly higher results are observed in Fort Severn and Kugaaruk. Similar results
regarding hunger were observed in Manitoba (27%) and Fort Severn (31%), while rates
of hunger increased to 56% in Kugaaruk. Shockingly, 22% and 28% of children were
reported to have not eaten for an entire day, because there was no money for more food in
Manitoba and Kugaaruk, respectively. These three measures were all below 1% in the
general Canadian population, revealing appalling conditions for children in these First
Nations.
Figure 5: First Nation Child Food Insecurity Indicators vs. Canadian Population
The Thompson 2009 study revealed that three out of four homes (75%) are food insecure,
of which 42% are moderately food insecure, and 33% are severely food insecure. Within
0 0.1 0.2 0.3 0.4 0.5 0.6 0.7 0.8
RHS 2002/03
Thompson et al., 2011
FNFNES 2010
FNFNES 2008
Lawn and Harvey, 2004
Lawn and Harvey, 2003
2011 CCHS
2004 CCHS
Man
itoba
B
C
ON
N
U
Firs
t Nat
ion
Com
mun
ties
Gen
eral
C
anad
ian
Popu
latio
n
Not eating enough, could not afford more food
Were hungry, could not afford more food
Did not eat for a whole day, not enough money for food
38

the 14 communities the level of household food security ranged from 47% in Nelson
House First Nation to 100% in South Indian Lake First Nation (Thompson et al., 2011).
The 2010 Manitoba FNFNES results revealed similar results to the Thompson et al.
(2011) study; however the intensity of severe food insecurity was not as great (6%) (Chan
et al., 2012). The Manitoba FNFNES report, also examined food insecurity by
geographical regions. Household food insecurity was experienced in 44% of First Nations
households near the geographical location of Island Lake, with 35% of those households
experiencing moderate food insecurity and 9% facing severe food insecurity (Chan et al.,
2012). In more northern First Nations near the border of Nunavut, which are a better
representation of the isolation that characterizes the Island Lake First Nations (air and
winter road access only), food insecurity was experienced in 73% of households, with
60% and 13% of those households experiencing moderate and severe food insecurity,
respectively (Chan et al., 2012). These findings are consistent with the food insecurity
rates published in Thompson et al. (2011) and Thompson et al. (2012).
Since the Thompson et al. (2011) and the Manitoba FNFNES 2010 study utilized the
CCHS household food security survey it is easy to compare the results to other national,
provincial and territorial studies. Figure 6 illustrates food insecurity rates and intensives
in First Nation communities in studies throughout Canada, and compares these rates to
the CCHS “off-reserve” Aboriginal results. The figure clearly illustrates that Aboriginal
people living “off-reserve” enjoy higher rates of food security.
Figure 6 also illustrates that the small hamlet of Kugaaruk, Nunavut and Manitoba
exhibit the highest rates of overall food insecurity at 83% and 75%, respectively. While
39

Kugaaruk exhibits the greatest severe food insecurity rate at 59%; Manitoba and Fort
Severn are similar at 33% and 26%, respectively. It is surprising that Kugaaruk and
isolated hamlet of approximately 600 people is similar to Manitoba First Nations.
However, during the summer Kugaaruk receives goods via barge, and in winter
Manitoba’s fly-in only communities receive goods via winter road. Both of these
alternate forms of shipping are highly dependent on freeze and thawing conditions, which
may explain some of the similarities.
Figure 6: Food Insecurity Rates and Severity in Select First Nations in Canada
2.5 Food-Based Initiatives
Successful initiatives to increase access to healthy food in Indigenous communities
around the globe have four common characteristics: Traditional harvesting, agriculture
and gardening activities, education about food production and nutrition, and growing
0%
20%
40%
60%
80%
100%
Thompson et al., 2011
FNFNES 2010
RHS 2008/10
FNFNES 2008
Lawn & Harvey,
2004
Lawn & Harvey,
2003
2011 CCHS
2011 CCHS
2009 CCHS
2009 CCHS
Manitoba Canada British Columbia
Fort Severn, ON
Kugaaruk, NU
General Canadian
Population
Canadian Aboriginal "Off-Reserve"
Households
Canadian Non-
Aboriginal Households
First Nation Communities Excluding First Nations
Severe Food Insecurity Moderate Food Insecurity Food Insecurity, All Food Secure
40

community food plans through collaboration (Thompson et al., 2012). Successful
initiatives can also incorporate food-related community economic development for a
more holistic approach to address the reality of high food costs and low employment
opportunities within many First Nations. Food-related community economic development
employs a participatory and community-lead approach (Thompson et al., 2012) that
strives to build local capacity to address issues of poverty, hunger and inequality
(Shragge, 2003; Thompson et al., 2012). These are also characteristics of “food
sovereignty”.
Food sovereignty can be defined as “people’s right to define their own policies and
strategies for the sustainable production, distribution and consumption of food that
guarantees the right to food for the entire population, on the basis of small and medium-
size production, respecting their own culture and the diversity of peasant, fishing and
indigenous forms of agricultural production, marketing and management of rural areas, in
which women play a fundamental role” (Fisher and Ponniah, 2003, p.166). Food
sovereignty as also been defined as “the right of peoples to healthy and culturally
appropriate food produced through ecologically sound and sustainable methods, and their
right to define their own food and agricultural systems” (International Planning
Committee for Food Sovereignty, 2007, p.1). Food security is similar in that it is
concerned with the access and availability of affordable foods; however, it does not
concern itself with the source of foods and if programs implemented to increase food
security are rooted in colonialist ideas, which may remove First Nations people further
away from their traditions (Rudolph, 2012).
41

Thompson et al. (2010), Thompson et al. (2011), Thompson et al. (2012), and Fieldhouse
and Thompson (2012) discuss how several northern and remote communities and First
Nations in Manitoba, including the Island Lake First Nation communities, South Indian
Lake First Nation, Brochet and Granville Lake have begun to respond to this crisis by
growing household and community gardens, raising poultry, creating and implementing
diabetes programs and school-meal programs, implementing meal programs for elders,
and in Nelson House First Nation – creating the Country Foods Program, among other
initiatives. These are some examples of food-related community economic development
that are aiding to de-commodify food production and distribution, and re-invigorate local
food production, with the benefit of increasing food access in northern Manitoba.
A number of national and provincial programs focus on increasing food security within
First Nation and other remote communities in Manitoba, including the national food
subsidy program Nutrition North Canada; the Northern Healthy Food Initiative (NHFI),
country foods programs, and market-based solutions (co-operatives and food-buying
clubs). Not all initiatives are employed in every community; however, this summary
provides an understanding of initiatives that have the potential to be employed in each
community.
2.5.1 Nutrition North Canada
Nutrition North Canada (NNC) is a healthy food subsidy program that was introduced
April 2011, to replace the former Food Mail Program, which was initially created to
reduce costs for federal employees in the Canadian Territories. The goal of the NNC
program is to reduce the price of healthy foods by subsidizing registered retailers who are
42

responsible for passing the subsidy onto the consumer. Currently, only the North West
Company is registered for this program within the Island Lake First Nation communities.
The program receives a budget of $53.9M (Government of Canada, n.d.).
For communities to be eligible for the NNC program they must lack year round road-
access and must have used the former Food Mail program. Currently, in Manitoba, there
are 14 First Nations that are eligible for the program, including the four Island Lake First
Nations. Communities are eligible for either a full subsidy or partial subsidy, and this
affects the final cost passed onto the consumer. First Nations that used the former Food
Mail program in the past extensively were awarded a full subsidy; communities, which
used the program moderately, were awarded the partial subsidy. Additionally, eligible
food and non-food items have a “per kilogram subsidy level” applied (either ‘high’ or
‘low’), and this also affects the end-price for the consumer. Retailers pass on the subsidy
to the consumer through lower food prices, and claim the subsidy from the Government
of Canada.
The program subsidizes perishable foods including fresh fruits and vegetables, meat,
milk, eggs, frozen vegetables, bread, infant formula, country foods (if purchased through
a store), flour and pre-made foods (i.e., pizza, lasagna). The program also subsidizes non-
perishable foods and non-food items such as dried and canned goods, toilet paper,
diapers, feminine-hygiene products, soaps and cleaners (Government of Canada, n.d.).
The NNC program however, does not subsidize hunting, fishing, or gardening supplies.
Currently only commercially produced country foods qualify for the subsidy, and there
43
are only three country food processing facilities that meet the program’s requirements, all
of which are located in Nunavut.
The program indicated that since its inception it has lowered prices in communities
receiving the full subsidy by approximately 5.6% (Government of Canada, Nutrition
North Canada, n.d. (b)). However, there are mixed reviews regarding the efficacy of the
NNC program. While retailers have stated that the new program allows for more control
over the delivery dates of products, types of products brought in, and allows for cost
savings (CBC, 2013a), consumers and Members of Parliament in northern Canada have
stated that the NNC program is inefficient, expensive and that retailers are not passing on
any savings to consumers (CBC, 2012; CBC, 2013b; Thompson et al, 2012). In response
the Government of Canada indicates that there are processes and controls in place to
monitor the program’s performance and several grocery stores and suppliers have been
audited to ensure that cost-savings are past onto the consumer. In some cases the
however, audits have revealed that savings were not being reflected in the end price for
consumers. (Government of Canada, Nutrition North Canada, (n.d.(c)). Currently, stores
and suppliers are not obligated to share their shipping costs, and under the NNC stores
are auditing themselves and self-report price savings to the government resulting in little
transparency and oversight of this program.
At the request of the three Territorial legislatures in addition to several provincial
Members of Parliament, a review of the NNC program by the Auditor General of Canada
was completed in June 2013. The audit found that the controls in place were adequate,
however there were opportunities for improvement including: governance, cost
44

containment measures, compliance reviews, and performance measurement, among
others (AANDC, 2013a).
Since the NNC program is unsustainable, not-ecologically sound, lacks equality, lack
opportunity for human development, and was not created by the communities in which
the program is aimed, it does not offer a pathway to food sovereignty or to food-related
economic development. However, if the program does achieve lowering of healthy-foods,
it may achieve to some extent improved food security.
2.5.2 Northern Healthy Food Initiative
The Northern Healthy Food Initiative (NHFI) was created in 2005 by the Government of
Manitoba to increase access to affordable healthy foods in Northern Manitoba
communities, to address the recommendations from the 2003 Northern Food Prices
Report and is run by Manitoba’s Department of Aboriginal and Northern Affairs (ANA).
In response to the Report, the NHFI adopted its goal to create and implement a program
that addresses the food self-sufficiency needs of northern Manitobans, and to harmonize
government resources dedicated to food-programs in the north.
The NHFI programming was informed by the 2003 Northern Food Prices Report which
revealed that there is an appreciable level of food insecurity in many northern Manitoba
communities; a broad range of strategic options are needed to address the problem of
high costs and improve nutritional health in northern Manitoba; and, community capacity
building and holistic solutions are essential to the success of any strategic option
(Government of Manitoba, 2003). “The NHFI assists northern communities to build
45
capacity in local production of food for local consumption, choose nutritional foods,
implement strategies to lower the cost for healthy foods, leverage funding for projects
and create food-based economic development opportunities” (Fieldhouse and Thompson,
2013 p. 219).
This community-based initiative comprises six strategies, including: community gardens;
greenhouses; increasing access to healthy commercial foods; school nutrition; increasing
access to country foods and poultry/other production; and food preservation which
includes loans for the purchase of freezers (Thompson et al., 2010).
Gardening and Greenhouses
Gardening used to be popular in northern Manitoba, ensuring there were fresh vegetables
available and playing an important role in achieving food security. Families used to have
gardens in their communities and at their trap lines; however, over the last 30 years
gardening has dwindled (Thompson et al., 2010). The NHFI provides gardening tools
and, such as rototillers, ploughs, and other supplies for community members to share.
The NFHI also provides materials and training to build greenhouses.
With the help of the NHFI, gardening is becoming popular again and is being recognized
as a means to providing more affordable healthy food on the table. Community and home
gardens are also becoming a part of the education offered in Island Lake schools and is
recognized by community members as strengthening community and getting people more
physically active (Thompson et al., 2010). To-date the NHFI has provided plant lights for
at least 20 schools, helped to build 59 greenhouses, and supported the creation of
46

approximately over 1000 gardens with 1200 gardeners in 80 different First Nation and
northern communities in Manitoba (Fieldhouse and Thompson, 2012; Thompson et al.,
2010). Increased gardening may be one piece of a pathway to food sovereignty in First
Nation communities, as gardening is a traditional practice and is successfully producing
food (albeit on a household scale), and increasing availability and accessibility of fresh
foods.
However, the potential for market-gardens does exist. Flying Dust Cree Nation in
Saskatchewan have successfully operated their Flying Dust Cree 8 Worker Coop market
garden since 2009, growing 20 acres of potatoes which are sold to First Nation members
at cost the remainder being sold at a market (Flying Dust Cree Nation, November 2013).
The Riverside Market Garden employs 8 to 15 people seasonally, and has a training
program. Such an endeavor requires large funding and considerable management, which
is a barrier for some communities.
Freezer Loans
Freezers are a necessity to increase the ability of households to store country foods and
buy meats and other foods in bulk. The NHFI administers the household “freezer loan”
which is a revolving loan program where the cost of a freezer is paid back (fully or
partially) by households in small monthly payments. This type of funding allows for
additional households to purchase freezers once loans are paid back. In 2010 the program
purchased 435 freezers within 22 participating communities (Fieldhouse and Thompson,
2012; Thompson et al., 2010; Thompson et al, 2012). The NHFI also provides food-
47

preservation training, and holds various workshops in canning and other food
preservation techniques.
Poultry Raising
Raising poultry is a viable option for increasing food security levels in First Nation
communities, as meat is expensive. Additionally, poultry can provide a great source of
fertilizer for gardening. The NHFI provides interested families with a poultry production
manual, 60 chickens or ten turkeys, grain, feeders, and fencing material. Families must
have a chicken coop built, but the NHFI does not fund the coops.
In 2010, the Island Lake First Nation communities received funding for raising chickens.
With aid from the Four Arrows Regional Health Authority, the communities began
raising chickens from 2010 to 2012, with a total of 142 chickens raised for meat and eggs
(FARHA, 2012). Currently, the project is being reviewed; however there is interest in the
communities to continue with raising chickens and other livestock. In the seven Bayline
Region communities and First Nations have raised 1080 chickens and 54 turkeys between
2006 and 2009 (Thompson et al., 2010). In 2011-2012, there were 13 First Nation and
northern communities (29 households) raising poultry (Fieldhouse and Thompson, 2012).
Poultry-raising as a pathway to food sovereignty within First Nation communities has
been criticized, as it takes individuals away from traditional hunting practices and takes
considerable time and effort to raise poultry (Rudolph, 2012).
48
School Nutrition
The NHFI works closely with the Frontier School Division, and helps to provide school
nutrition projects, such as harvesting and cooking education, integrating gardening, plant
sciences and nutrition into the school curriculum. The NFHI also aids in providing
healthy breakfasts, lunches and snacks, and works alongside Health Canada’s Aboriginal
Head Start Program.
2.5.3 Country Food Programs
Country foods are recognized as intrinsic to the social, cultural, economic and spiritual
wellbeing of Aboriginal First Nation Communities, in addition to being a healthy food
source. Currently Nisichawayasihk Cree Nation (NCN) has the only operating country
foods program in Manitoba however, Garden Hill and South Indian Lake First Nations
are currently developing country foods programs (Thompson et al., 2011; Thompson et
al, 2012).
The Country Foods Program in NCN provides hunted and harvested foods to members of
the community through the Country Food Distribution Centre. Harvested foods include
garden-produce, hunted animals, fish, and gathered berries. The Country Foods Program
has been in existence for approximately 22 years. The Program provides all equipment
needed for hunting, gathering, fishing, and distributing the foods.
All country food and garden-produce (mostly potatoes) is distributed via the NCN
Country Foods Distribution Centre. The Distribution Centre, houses the cutting machine,
sausage maker, scales, cleaning and cutting areas, and chest freezers. The Program also
49

has a smokehouse for smoking fish and meat, a storage building and garage for the
snowmobiles, sleighs, trucks, nets and sideline, and gas. Country foods at the Distribution
Centre are for everyone within the community; however, the Program does target
community members older than 55, low-income families and individuals, and single
mothers. The Program has been quite successful in distributing large amounts of wild
meat, fish, and berries to the community. Records available through the Nisichawayasihk
Trust Annual Reports and the Wuskwatim Generation Project Environmental Impact
Statement (Manitoba Hydro, 2003) reveal that the Program has collected approximately
139,435 kg of country foods.
Weighing and tracking the distribution of wild meat, also satisfies the intention of various
regulations that have the ability to impair the Program. Under The Wildlife Act of
Manitoba, wild meat may be given to First Nation people by First Nation people for food.
However, legislation has created restrictions on the use of the wild meat; since the wild
meat that has not been federally inspected cannot be “utilized in any way for food in a
food handling establishment”, under Section 20(3) of Manitoba’s Food and Food
Handling Establishment Regulation and Public Health Act. This Regulation restricts the
ability for wild meat to be used in school lunch programs and elder meal programs, which
would greatly reduce costs and increase health benefits to a community struggling with
healthy eating. For the community to succeed in such an endeavor, their meat processing
facility would need to be either federally regulated or provincial registered. This would
also allow the community to sell wild meats, should they choose to.
50
Until 2009, the Program employed one manager, one field coordinator, and five field
workers/hunters on a full-time and year-round basis; however, depending on available
funding the employment numbers can go up or down. Since 2009, the Program has
employed one manager and four field workers/hunters. The field workers/hunters are
responsible for the manual labour, including gardening and cleaning, packaging and
weighing of country foods, and are also involved in a number of other activities that the
Program provides. The manager is responsible for ensuring that the distribution of
country foods is tracked and ensures that the Program complies with all provincial and
federal legislation. The manager is also responsible for the budget and purchasing of
goods, in addition to helping the workers/hunters with hunting and transportation.
The Program also employs summer students as funds allow. This helps to build interest in
the Program as well as building cultural capital by exposing youth to traditional skills and
country foods. Hiring students also allows for mentorship and growth of management
capacity.
The Program also employs hunters on a “contract basis”, which also aids to build
capacity within the community. The Program reimburses hunters for their supplies if they
donate the meat to the Program. The Program also purchases fish from the First Nation’s
commercial fisherman to distribute among NCN members, and reimburses community
members who gather berries. The Country Foods Program Manager indicates that a
moose donated to the program can cost upwards of $800, as hunters need to go further
and further to hunt successfully and the Program must reimburse for the escalating costs
of fuel and transportation.
51

According to Thompson et al. (2012), who assessed household food security in relation to
food programming and community accessibility in 14 northern Manitoba communities,
the country foods program is related to increased food security. The Thompson et al.
(2012) study illustrated that when a country foods program, similar to NCN’s, is coupled
with road access, the rate of food security increases to 95%; higher than the Canadian
average of 92%. A community without road access, but with a country foods program
was predicted to have a food security rate of 40% (Thompson et al., 2012). The Country
Foods Program in NCN is a good example of a program built on food sovereignty.
2.5.4 Cooperatives
While currently there are no First Nation communities that operate large cooperatives in
Manitoba, the models that the Arctic Cooperative and la Fédération des Coopératives du
Nouveau-Québec (FCNQ) employ and their success in Northern Canada, warrants their
discussion as a potential initiative that could be employed within Manitoba.
Arctic Cooperatives can be found in most Inuit and Dene communities within Nunavut
and Northwest Territories, with 31 stores employing over 900 people, and are
independently owned and controlled by the communities in which they reside (Arctic Co-
operatives Limited, n.d.). Similarly, the FCNQ Cooperatives are located within Nunavik,
the northern territory of Quebec, and have 14 member cooperatives within Inuit and Cree
communities. The FCNQ is the largest non-government employer within Nunavik, and
employs over 310 people within the communities, and 120 people within Montreal. The
FCNQ is owned, managed, and controlled by the Inuit and Cree, and operates under the
52

objective to unite the community and to act as a spokesperson for the community’s
interests (FCNQ, n.d.).
The Cooperatives have several arms to their business including retail, accommodations,
cable operations, construction, outfitting, arts and crafts production property rentals, and
joint ventures with shipping companies. The Cooperative model of business, help to built
capacity in communities, and retain money within the communities, and give control to
the communities in terms of what foods it offers and what price they are offered at.
While cooperatives are for-profit, a portion of these profits is re-distributed amongst its
members annually, and a portion of the profit is re-invested into the cooperative. Inflated
prices do not make sense, as the money would be distributed back to the members who
initially paid the inflated prices (NAHO, 2004).
2.5.5 Food Buying Clubs
Food buying clubs are community clubs that consist of people or institutions who
organize to buy food in bulk to save on cost and shipping. Schools and First Nation
Social Assistance Departments organize the largest food-buying clubs in northern
Manitoba (Thompson et al., 2012). This allows schools to provide healthy foods and
allows families on social assistance greater access to fresh meats and other healthy foods.
2.6 Chapter Summary
First Nation communities in Manitoba are food insecure. Recent research conducted in
2009 and 2010 demonstrates that food insecurity rates are three to four times greater in
53

First Nation communities in Manitoba than in the rest of Manitoba and Canada (Chan et
al, 2012; Health Canada, 2007; Health Canada, 2011; Tarasuk et al., 2013; Thompson et
al., 2011; Thompson et al., 2012). The core issues contributing to the high rates of food
insecurity include high rates of poverty and subsequently the inability to afford healthy
foods, in addition to geographical isolation and subsequent lack of access to larger urban
centers.
In response to this problem, there are a number of initiatives that are working towards
reducing the rates of food insecurity by increasing the number of gardens and gardeners,
providing support for poultry-raising projects, providing loans for procurement of
freezers, and the implementation of country food programs to provide foods to
community members in need, in addition to employment opportunities.
The first Canadian food security survey was supplementary to the 1998/1999 National
Population Health Survey and consisted of three questions. Since 2004 the CCHS has
regularly collected food security information using a validated research tool (18-question
survey module), developed by the Unites States Department of Agriculture (USDA).
While the CCHS has collected information from most provinces, it does not collect
information regarding food insecurity rates for First Nations people living on-reserve, one
of the most at-risk populations in Canada.
Prior to studies lead by researchers from the University of Manitoba (Thompson et al.,
2010; Thompson et al., 2011; Thompson et al., 2012) beginning in 2009 and the
2003/2003 Manitoba First Nation Longitudinal Health Survey, the prevalence of food
insecurity within northern Manitoba First Nation communities was essentially unknown.
54

Since 2009, additional studies have been conducted, notably the 2010 FNFNES study
conducted in nine First Nation communities in Manitoba. This research contributes to this
growing body of knowledge.
55

CHAPTER THREE: METHODS
A literature review was conducted to determine the existing knowledge base regarding
food security issues within First Nation communities in Manitoba. The review was
expanded to include provincial and nation-wide studies, to build understanding regarding
food security measurement and household food security status, and to allow comparison
of this research to provincial, national and international jurisdictions.
This research was conducted using a mixed methods research approach (Creswell, 2003),
as both a quantitative and qualitative methods were used to collect research data, and a
qualitative approach to data analysis was employed. A mixed methods research paradigm
was employed for the purpose of allowing the researcher to quantify the prevalence of
food insecurity, in addition to identifying the underlying reasons and barriers to limiting
access to healthy affordable foods. A quantitative validated household food security
questionnaire was administered door-to-door in order to determine the prevalence and
severity of food insecurity in each of the four communities. Following the administration
of the questionnaire, a qualitative semi-structured interview was completed for the
purpose of understanding household access to country foods, household gardening
practices, perceived barriers to obtaining healthy foods, and ideas to improve access. A
quantitative food costing survey was also conducted in each of the food stores within the
four communities and within one store in Winnipeg for comparison purposes.
This research is conducted from within a pragmatic knowledge claim (Creswell, 2003), as
the goals of this research were to draw attention to the elevated levels of food security
within First Nation communities; draw attention to the disparity and imbalance that exists
56
between First Nation communities and non-Aboriginal communities within Manitoba;
and to ensure that the voices of the communities were heard in order to create change.
The four Island Lake communities in this study were assessed as part of a larger sample
of 14 remote Manitoba communities. The four communities are also isolated in terms of
their geographical location and accessibility. The four communities are only accessible
via air (year round) and via winter road, for approximately six to eight weeks per year. It
is important to study the prevalence of food insecurity within such isolated communities,
as geographical location and degree of isolation are associated with increased food costs
due to elevated shipping costs and increased food insecurity, resulting from limited
employment opportunities and consequently high rates of poverty (Government of
Manitoba, 2003; INAC, 2009).
3.1 Research Ethics Approval
This research required approval from the University of Manitoba’s Research Ethics
Board. An ethics protocol for human subject research was submitted to the Board in
August 2008 with approval granted (J2008:114) in September 2008.
The protocol identifies and describes the 2004 CCHS Cycle 2.2 food security survey
(research instrument), which was employed to gather information regarding food security
status within each of the four First Nation communities. I administered the survey from
door-to-door along with a paid representative from the Four Arrows Regional Health
Authority who was familiar with each of the communities.
57

Prior to administering the survey, participants were made aware of the intentions of the
survey and how the information would be used. Participants were ensured a guarantee of
confidentiality and anonymity; no names or addresses were recorded and all results were
to be summarized for the community. To ensure understanding of research intentions,
ethical considerations, and survey questions, communication was offered in both Ojibway
Cree and English. Participants were also informed that they could stop the interview,
should they wish to, at any time during the questionnaire and interview process.
Participants either agreed to participate or refused to participate at this point. Everyone
who answered the door was given a small gift of nectarines for their family to thank them
for their time and information, regardless of their agreement or disagreement to
participate in the survey. The participation rate shared between the communities was
95%, with individual community participation rates of 90% in Wasagamack, 95% in St.
Theresa Point, 98% in Garden Hill and 98% in Red Sucker Lake First Nations.
Participants were also informed that results of the food security survey would be made
available via a poster, summarizing their community's household food security survey
results. The posters were submitted to the community’s Chief and Council for
distribution and display within the community approximately three months after the
survey was administered. The posters were also presented at the Northern Harvest Forum
(a food security education and networking forum), in Thompson, Manitoba in October
2009, which was attended my community members from the Island Lake First Nations
and other Manitoba First Nations, Aboriginal organizations, academia, and government.
58
3.2 Introducing the Researcher to the Community
It is important to ensure that the First Nation community approves of the research and is
aware of how the research and associated data will be used. The administration of the
food security survey was completed in association with the Four Arrows Regional
Healthy Authority (FARHA), who provided a community liaison and interpreter for
research activities in the communities. This individual was paid by FARHA, as part of
their normal duties.
Prior to visiting the Island Lakes area, the Chief and Council for each community was
contacted, and a letter was subsequently mailed introducing the intention of the food
security survey, how the survey was to be administered, and how the results of the survey
may be used. A copy of the food security survey was appended. The letter also discussed
the food-cost audit, which was proposed to take place in each store in the communities, in
order to assess availably of healthy food and its associated cost.
Upon arriving in each community, a meeting with Chief and Council was conducted to
get final permission to administer the survey door-to-door and to discuss any concerns or
comments Chief and Council may have had. A guarantee of confidentiality and
anonymity amongst the respondents was also discussed. Once gaining the community’s
permission, the food security survey was also introduced on the local community
television station in both Ojibway Cree and English. A telephone line was available for
community members to call in and ask any questions prior to the survey being
administered door-to-door within the communities.
59

Prior to conducting food costing surveys, the manager and/or owner of the store was
contacted to discuss the intention of the survey and how the food costing information
would be used. The store manager and/or owner were informed that the survey would not
disrupt business or involve staff.
3.3 Food Costing Survey
A community food-costing survey was completed in all food stores, including
convenience stores, in each of the four communities to help determine food accessibility
and affordability. The number of stores, store type, location, and price and available of
healthy food was recorded. The RNFB was used to determine the level of food
accessibility and affordability by recording available food basket items in each
community and their associated price. One full-service grocery store in Winnipeg was
also audited for food costs for comparison purposes.
The RNFB contains 67 perishable and non-perishable food items, and weighs
approximately 37 kilograms. The Basket represents nutritious diet for a family of four
comprising a man and woman between ages 31 and 50, and a boy and girl between the
ages of 9 and 13 for one week. The Basket contents were selected based on Aboriginal
community food consumption surveys conducted by Aboriginal Affairs and Northern
Development Canada (formerly Indian and Northern Affairs Canada), and “was designed
to meet the Recommended Dietary Allowances or the Adequate Intakes proposed by
Health Canada’s Dietary Reference Intake Committee” (INAC, 2007, p.9). The RNFB
however, is not intended as a recommended diet; the Basket was solely created as a tool
for food costing in First Nation and northern communities in Canada (INAC, 2007).
60

3.3.1 Calculating Cost
All stores in each of the four communities were audited for availability and price of each
of the perishable and non-perishable food items listed within the RNFB (see Appendix A
for a list of foods included in the RNFB), in addition to one full-grocery store in
Winnipeg. The RNFB Price Selection Procedure (see Appendix B) was used to guide the
pricing methodology. Where several brands of food items were available within a single
store, the lowest price was recorded; however, at the time of data collection availability
of more than one brand for a single food item was rare. For items that were offered on-
sale or at a reduced-price during the food costing exercise, their regular price was
recorded; however, this was an uncommon occurrence. Products that were on sale were
items that were nearing their expiry date or were of poor quality. Using the regular price
ensured that the cost of the Basket was more representative of what consumers would
expect to pay on average for that particular food stuff. Also, using the regular prices
aided in comparing individual food items and the Basket costs between communities, as
promotions may have differed between communities.
For costing purposes, each food item had a standard purchase size (volume) or weight
assigned. If a specific purchase size was not available within the stores, the food item size
available within the store was recorded (weight/volume, and cost). The cost of this item
was subsequently converted to the standard purchase size, prior to entering it into a
costing spreadsheet.
For food items that were not available within the community, the weight or volume
assigned to those specific items was divided evenly amongst available food items within
61

that food category to account for the missing weight or volume. This method of weight or
volume allocation was employed as to not bias one food item price, and to represent the
whole food category. This method differs from the RNFB Price Selection Procedure for
entering prices, which suggest using prices from recent costing survey’s in the
community or from nearby communities; however, the procedure does indicate that the
methodology should be adapted to account for the circumstances within the communities.
In the Island Lake area, several food items were not available in the four communities.
Therefore, reallocating the weight or volume of the missing items was deemed most
appropriate, in order to respect the total weight of the RNFB. Where vegetables and fruits
were priced per item in stores, three items were weighed and the average weight was used
to calculate the cost per kilogram.
Once costs of individual food items were collected, the average cost per item per
community was then calculated, as outlined in the RNFB Price Selection Procedure. An
additional 5% was added to the total of the Basket to account for miscellaneous foods,
such as tea, coffee, spices and baking powder, as outlined in the RNFB Price Selection
Procedure.
3.3.2 Calculating Affordability
To determine the affordability of the RNFB for a family of four, the cost of the Basket
was extrapolated to reflect the annual cost. This cost was compared to the annual median
income per family as reported in the 2006 Canadian Census, for Wasagamack, St.
Theresa Point and Garden Hill First Nations. The median family income for Red Sucker
Lake First Nation was suppressed by Statistics Canada and is therefore unavailable to the
62
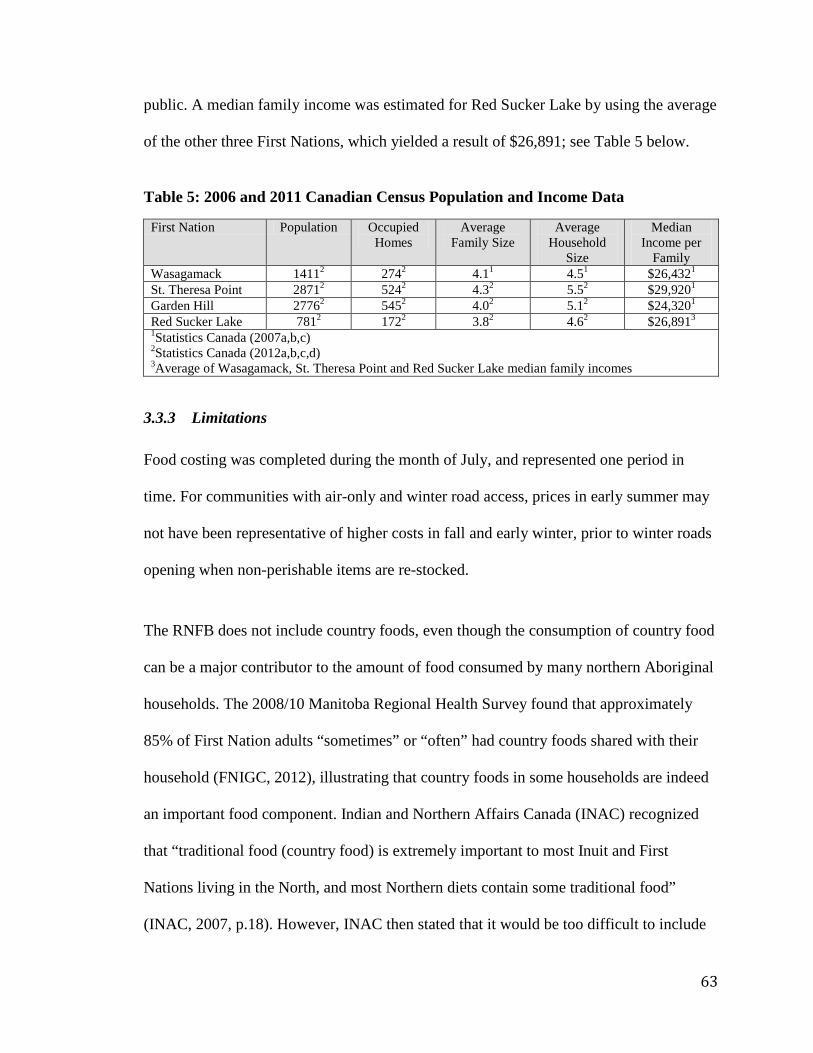
public. A median family income was estimated for Red Sucker Lake by using the average
of the other three First Nations, which yielded a result of $26,891; see Table 5 below.
Table 5: 2006 and 2011 Canadian Census Population and Income Data
First Nation Population Occupied Homes
Average Family Size
Average Household
Size
Median Income per
Family Wasagamack 14112 2742 4.11 4.51 $26,4321 St. Theresa Point 28712 5242 4.32 5.52 $29,9201 Garden Hill 27762 5452 4.02 5.12 $24,3201 Red Sucker Lake 7812 1722 3.82 4.62 $26,8913 1Statistics Canada (2007a,b,c)
2Statistics Canada (2012a,b,c,d)
3Average of Wasagamack, St. Theresa Point and Red Sucker Lake median family incomes
3.3.3 Limitations
Food costing was completed during the month of July, and represented one period in
time. For communities with air-only and winter road access, prices in early summer may
not have been representative of higher costs in fall and early winter, prior to winter roads
opening when non-perishable items are re-stocked.
The RNFB does not include country foods, even though the consumption of country food
can be a major contributor to the amount of food consumed by many northern Aboriginal
households. The 2008/10 Manitoba Regional Health Survey found that approximately
85% of First Nation adults “sometimes” or “often” had country foods shared with their
household (FNIGC, 2012), illustrating that country foods in some households are indeed
an important food component. Indian and Northern Affairs Canada (INAC) recognized
that “traditional food (country food) is extremely important to most Inuit and First
Nations living in the North, and most Northern diets contain some traditional food”
(INAC, 2007, p.18). However, INAC then stated that it would be too difficult to include
63

country foods within the RNFB, as the types of foods consumed by Aboriginal people
throughout Canada differ greatly. Since country foods are obtained via subsistence
activities, pricing would need to be based on “species harvested, distances that must be
traveled, cost of equipment and supplies, and existence and type of hunter support
programs” (INAC, 2007, p.18). For households that consume a significant quantity of
country foods, the RNFB may not be appropriate for estimating the cost of food
consumed. Consequently, the RNFB is a tool used to illustrate the cost of a market-based
food basket (store-bought foods).
The RNFB indicates that while it is consistent with current food consumption practices in
the north, the Basket does not contain a representational quantity of prepared foods and
does not include the cost of dining in a restaurant. The Basket does not account for family
members whom may require special diets, and may not be representative of individual
food preferences, and also assumes that individuals have some knowledge of food
preparation.
The RNFB weight is based on a family of four, which may not be representative of all
families in each community. According to Statistics Canada, Wasagamack and St.
Theresa Point have an average family size of 4.1 and 5.3, respectively; and the average
family size in Red Sucker Lake is 3.8. However, the average household size in each of
the four First Nations was greater than 4, see Table 5. Therefore, actual costs incurred to
provide food for family members may differ from what is presented.
64

3.4 Household Food Security Survey
To evaluate household food security, the 18-question validated food security survey (see
Appendix C) used in the CCHS reports, was administered in either English or Ojibway
Cree to approximately 40 households in each community. Although the questions were
read aloud in either language, many individuals requested to follow the questions on a
copy of the survey, which was written in English only. A target sample size of 10% to
20% of households was used; a larger sample not pursued due to the limited field time
available. Households were chosen at random throughout the community using a
community map and satellite photographs where community maps were unavailable. The
survey was cross-sectional with data collected at one point in time; however, participants
were asked to recall food security situations within the last twelve months.
Households and individuals were not identified on the surveys in any way, and personal
information was not recorded in order to ensure that participant confidentiality was
respected. The survey was administered to an adult household member responsible for
the regular food purchases. The surveys were analyzed using the methodology
recommended within Health Canada’s 2007 CCHS report and Tarasuk et al. (2013).
Information regarding the size of the household, number of children, age of residence,
income, source of income, etc. was not obtained as part of this study. Demographic data
was obtained through Statistics Canada as needed.
65

3.4.1 Survey Design
In their CCHS studies, Health Canada employed the United States Household Food
Security Survey Module (US HFSSM) to assess household food security status in
Canada. The survey is designed to capture “self-reports of uncertain, insufficient, or
inadequate food access, availability and utilization due to limited financial resources”
(Health Canada, 2007, p.8), as a measure of household food insecurity.
The 18-question survey was adapted to reflect research completed by Tarasuk (2001) and
advice received from “leading experts in nutrition and food security” (Health Canada,
2007). The Canadian research suggested that the food insecurity thresholds used in the
United States were overly conservative. Such that the United States survey used three or
more affirmative responses to denote the presence of food insecurity, and Health Canada
used the threshold of two or more responses to indicate some degree of food insecurity.
Health Canada indicates that these changes help to identify marginally food insecure
households. However, Health Canada also recognizes that even with the adaptation to a
less conservative threshold, there may be a small percentage of households that the
survey considers as food secure, while they may actually experience marginal food
insecurity (Health Canada, 2007). Subsequently, indicating less food insecurity within the
population.
Health Canada also altered the US HFSSM to assess child and adult household food
security status separately, as suggested in research completed in isolated northern
66

Canadian communities by Lawn and Harvey123. Health Canada altered the survey by
creating two scales, a 10-question adult scale focused on adult food security, which also
addressed food security in homes without children, and an 8-question child scale focused
on children (eighteen years old and younger) within the household. This approach
allowed for the comparison of the prevalence and severity of food insecurity experienced
by adults and children within the same household, which the US HFSSM did not allow
for (Health Canada, 2007)
The surveys were administered to an adult within the household who was normally
responsible for purchasing groceries. Each participant was informed that the questions
were framed to examine food consumption and purchasing patterns with regard to
financial constraints and not personal preference. The survey began with a screening
question to determine if there is some condition that indicates that household members
are less than food secure (see Table 6). If the household confirmed that there was some
level of food insecurity, the remaining questions in the survey were asked.
1 Lawn, J. and Harvey, D. (2003). Nutrition and Food Security in Kugaaruk, Nunavut: Baseline Survey for the Food Mail Pilot Project. Ottawa: Indian and Northern Affairs Canada. 2 Lawn, J. and Harvey, D. (2004). Nutrition and Food Security in Fort Severn, Ontario: Baseline Survey for the Food Mail Pilot Project. Ottawa: Indian and Northern Affairs Canada. 3 Lawn, J. and Harvey, D. (2004). Nutrition and Food Security in Kangiqsujuaq, Nunavik: Baseline Survey for the Food Mail Pilot Project. Ottawa: Indian and Northern Affairs Canada.
67

Table 6: Household Food Security Screening Question
Screening Question1: Which of the following statements best describes the food eaten in
your household in the past 12 months? (1) You and other household members always had
enough of the kinds of food you wanted to eat. (2) You and other household members had
enough to eat, but not always the kinds of food you wanted. (3) Sometimes you and other
household members did not have enough to eat. (4) Often you and other household
members didn’t have enough to eat. (5) Don’t know/refuse to answer.
Research completed in the United States, “has shown that a very small proportion of
higher-income households screened out by [the screening question], will register food
insecurity if administered the full [questionnaire]” (Bickel et al., 2000, p.21). Answers to
the screening question indicating some level of food insecurity were not included in the
assessment of food security results, as the intensity of food insecurity is determined by
subsequent questions within the survey. Answers to the screening question indicating
food security were included within the assessment of food security results.
Each question in the survey focuses on the ability to afford food as the reason for a
specific condition or behavior framed in the question. Potential answers to questions are
structured using categorical (i.e., “yes”; “no”; “don’t know/refuse to answer”) and
continuous scales (i.e., “often true”; “sometimes true”; “never true”; “don’t know/refuse
to answer”, and “almost every month”; “some months but not every month”; “only 1 or 2
months”; “don’t know/refuse to answer”) (Health Canada, 2007). Questions were ordered
1 Bickel, G., Nord, M., Price, C., Hamilton, W., and Cook, J. (2000). Guide to measuring household food security, revised 2000. U.S. Department of Agriculture, Food and Nutrition Service, Alexandria VA.
68
in a sequence of increasing food insecurity, from worrying about not having enough
money to purchase food, to not eating for an entire day.
It is unlikely that an answer indicating some level of food insecurity within the screening
question will result in exaggerated food insecurity levels for the community, since each
subsequent question within the survey allows the participant to indicate that the behavior
or condition is “never true” for household members.
3.4.2 Survey Data Analysis
Answers to the survey questions were analyzed to determine adult, child, and household
food security status using the food security scales and methodology derived by Health
Canada in their CCHS reports. Two scales were used to determine both adult food
security and child food security. Based on the number of responses indicating some level
of food insecurity, households were classified into three categories: “food secure”,
“marginally food insecure”, “moderately food insecure” and “severely food insecure” as
illustrated in Table 7. Responses were considered affirmative if the following were
indicated: “yes”; “often” or “sometimes”; “almost every month” or “some months but not
every month”.
For households containing children, the greatest level of food insecurity experienced
either the children or adult, was assigned to that household. For example, if an adult
experienced severe food insecurity and the children in the household experienced
moderate food insecurity, the household is described as experience severe food
insecurity.
69

Table 7: Food Security Status Category Descriptions
Status Interpretation 10-Item Adult Food Security Scale
8-Item Child Food Security Scale
Food Secure No indication of difficulty with income-related food access
No items affirmed/ absence of food insecurity in screening question
Marginal food insecurity
Some indication of worry or an income-related barrier to adequate, secure food access
No more than 1 affirmed response
Moderate Food Insecurity
Indication of compromise in quality and/or quantity of food consumed
2 to 5 affirmed responses
2 to 4 affirmed responses
Severe Food Insecurity
Indication of reduced food intake and disrupted eating patterns
≥6 affirmed responses
≥5 affirmed responses
Source: Health Canada (2007); Tarasuk et al (2013)
Survey results were compared to the CCHS (2009-10) data for Aboriginal households
living “off-reserve”, in addition to the 2009 household food security survey data for an
additional 10 northern and remote communities in Manitoba documented in Thompson et
al. (2011) and Thompson et al. (2012). Survey results were also compared to the 2010
Manitoba First Nations Food, Nutrition and Environment Study (FNFNES), and the
national 2008/10 First Nations Regional Health Survey (RHS). The 2009-2010 CCHS,
Thompson et al. (2011), Thompson et al. (2012), and the 2009/10 FNFNES studies
utilized the 18-question US HFSSM survey tool. The 2008/10 RHS used the 6-item
subset of the US HFSSM Core Module survey tool to assess adult food security. The 6-
item subset has been shown in United States studies to approximate closely the three
main categories of food insecurity, food secure, moderately food insecure, and severely
food insecure (food insecure with hunger) (Bickel et al., 2000). The 2008/10 RHS did not
assess child or youth food security specifically and instead focused on nutritional
questions.
70

3.4.3 Survey Limitations
Although the CCHS (2009-2010) food security survey, derived from the USDA’s
Measuring Food Security in the United States (2000) Report, is observed as “the best
available instrument for assessing household-level food insecurity in the context of
financial resource constraint” (Health Canada, 2007, p.32; Tarasuk, 2001, p.28) it does
have some limitations. The survey requests participants to recall a 12-month period;
however, the survey does not capture the frequency or duration of the condition or
behavior (Health Canada, 2007; Tarasuk et al., 2013). In First Nation communities it may
be more appropriate to measure food security according to seasons. This method of recall
may capture price fluctuation in market-food and seasons where traditional foods are
more abundant.
Although the survey was modified by Health Canada (2007) and Tarasuk (2001), the
phrasing of the questions and potential answers to those questions are framed within an
urban western social context and may not be culturally appropriate for use in First Nation
and other Aboriginal communities. Prior to administering the household food security
survey in the Inuit hamlet of Kugaaruk, Nunavut, Lawn and Harvey (2003) tested the
questions with local Inuit interviewers. They found that to be more culturally appropriate,
the questions should be less direct and should begin with “Some families might say”.
Additionally, Lawn and Harvey (2003) modified potential answers from “always true”,
“sometimes true” and “never true” to “often”, “sometimes”, and “never”. Finally, they
modified the survey to reference “healthy meals”, which respondents found more
meaningful than the term “balanced meal”. It was noted that during the administration of
the surveys in each of the Island Lake First Nation communities, the term “balanced
71

meal” needed further explanation. This term was explained as “a healthy meal, usually
containing three food groups such as a meat, a vegetable, and pasta, potato, bannock or
bread”.
Also, “the food security scale does not measure food safety, nutrition, availability of food
through socially acceptable channels, or community-level factors including the nature
and sources of the available food supply” (Bickel et al., 2000, p.16).
Finally, the survey does not have open-ended questions allowing participants to further
explain their condition or behavior, which could potentially provide additional
information and context allowing the researcher to understand the complexities within the
community; these questions must be added by the researcher and can be tailored to the
community that is being surveyed, which this study did.
3.5 Semi-structured Interviews
Semi-structured interviewed were conducted in either English or Ojibway Cree with
community workers and community gardeners, to determine the number of community
and home gardens, and other food-related initiatives. A semi-structured interview format
was used to help facilitate discussion. Contact with community NHFI workers and
Aboriginal Diabetics Initiative (ADI) workers, was initiated through the Four Arrows
Regional Healthy Authority to introduce the research and ensure that individuals would
be available during the community visits. The NHFI and ADI workers were asked about
the prevalence and popularity of food-related initiatives including, educational, food
preservation, community food production, and food access programs.
72

During the administration of the door-to-door food security survey, a semi-structured
interview was conducted, and asked six questions (semi-structured interview questions
are presented in Appendix C) to better understand household access to country foods,
household gardening practices, perceived barriers to obtaining healthy foods, and ideas
on how to improve access to healthy foods. Using a qualitative data collection technique
alongside the quantitative household food security questionnaire, allowed participants to
provide addition information regarding their answers within the questionnaire and
provided a forum for their ideas to be heard and documented. This information was used
to gauge the consumption of additional food supplies that are not accounted for in the
RNFB and to gauge community interest in gardening and country foods as a whole.
3.5.1 Interview Data Analysis
Answers to the household semi-structured interview questions were documented in the
interview questionnaires and subsequently entered into a spreadsheet. The questions were
structured in themes (prevalence of household gardening and hunting, ideas regarding the
barriers to accessing healthy food within the community, ideas to improve access to
healthy food within the community, etc.), which allowed for straightforward organization
of answers. Participant’s answers were subsequently compared to the household food
security survey, food costing data, and observations in the community, and the literature
review to clarify relationships in the data. Representative comments have been selected to
support the common ideas and thoughts that emerged through the interviews, which also
supported the results of the household food security survey and food-costing analysis.
73

Semi-structured interviews with NHFI and ADI workers were used to understand the
number and types of programs available to community members within each community.
This information was sought to provide insight into the resources available within each
community with regards to healthy eating and living. No further analysis was conducted
with regards to this information.
3.5.2 Interview Limitations
There are several limitations inherent when using a semi-structured interview method, or
any interview method. Individuals may have been reluctant to speak, and had offered
very short or “yes” “no” answers. Although the questions were structured in a way to
allow for elaboration and explanation, not all individuals were comfortable with
providing additional context to their immediate answer. Some participants were
comfortable discussing the topics and had asked additional questions of the interviewers;
additional questions and explanations were most welcomed. For these reasons each
individual interview was not repeated exactly in every household.
Although I am familiar with Manitoba Cree and Ojibwa culture, it is possible that the real
meaning of comments was not effectively captured when recording the interviews. In
some cases, the Four Arrows Regional Health Authority worker who was present for each
interview provided additional context or explanation.
Care was taken to ensure that bias was not introduced during the analysis and reduction
of interview data; however, potential existed for bias to be introduced by the potential
elimination of a comment, or interpreting answers incorrectly. Analysis of the data was
74

completed by the field researcher, which aids in reducing bias as the field researcher was
present for each interview and understood the context in which the comments were
provided.
75

CHAPTER FOUR: RESULTS
Chapter Four presents the data that was collected with the methods outlined in Chapter
Three. Key results from the household food security survey illustrate the prevalence and
level of food insecurity within each of the four Island Lake First Nation communities.
This chapter also presents information collected during the semi-structured interviews
with household members regarding perceived barriers to healthy food access, country
food consumption, gardening practices, and ideas for improving access to healthy food
within the community. Results from data collected during the food costing and food
availability audit, as well as information regarding food-based community initiatives
revealed during unstructured interviews with community workers, are also presented.
4.1 Food Accessibility
4.1.1 Store Locations
In all Island Lake First Nation communities, with the exception of Garden Hill, there is
one full-service grocery (The Northern Store) and two or three convenience stores located
throughout each of the communities (see Table 8). Garden Hill is also served by the full-
service Mikisew grocery store, located within the main community.
As illustrated in Figures 7 and 8, in Wasagamack and Garden Hill, the Northern Stores
are located on islands away from the main community, impeding easy access to healthy
foods. During the open-water seasons, a trip to the Northern Store can cost residents an
additional four to eight dollars per shopping trip for water taxi access to the Wasagamack
Northern Store and Garden Hill Northern Store, respectively. Access to the Northern
Stores in these communities is particularly difficult during the spring thaw and winter
76

freeze-up when conditions are unsafe for travel. During these times, the islands and stores
are only accessible via helicopter or hovercraft.
Table 8: Food Stores in the Island Lake First Nations
Parameters Wasagamack St. Theresa Point Garden Hill Red Sucker Lake Number of full service grocery stores
One: The Northern Store
One: The Northern Store
Two: The Northern Store and Mikisew
One: The Northern Store
Location of full-service grocery store
On its own island; $4 water taxi
In main community
The Northern Store is on Stevenson Island ($8 water taxi); Mikisew in main community
In main community
Number of convenience stores
Three Three Three Two
Location of convenience stores
In main community
One in main community; two on St. Mary Island (near airport)
One in main community; two on Stevenson Island (near airport)
One in main community; one on Despro Island ($5 water taxi)
Figure 7: Aerial Photograph of Wasagamack First Nation
77

In 2009, in addition to the Northern Store, there were also three convenience stores
located on the mainland serving Wasagamack; these convenience stores were owned and
operated by community members. Garden Hill also had three convenience stores, one
located on the First Nation’s mainland and the remaining two on Stevenson Island, “off-
reserve”, north of the airport (see Figure 8).
Figure 8: Aerial Photograph of Garden Hill First Nation
The Northern Store in St. Theresa Point was located within the main community, and was
by far the largest store in the Island Lake area. In 2009, the community also had a small
convenience store located on the mainland, and a small convenience store and snack shop
located on St. Mary Island, near the airport; see Figure 9. While the Northern Store is
located on the mainland providing year-round access for residents, for those who ordered
78

groceries from Winnipeg, there was an added ten-dollar cost to travel to the airport on St.
Mary Island to obtain the items.
Figure 9: Aerial Photograph of St. Theresa Point First Nation
The Northern Store, the only full-service grocer in Red Sucker Lake is located within the
main community (see Figure 10). The Northern Store servicing Red Sucker Lake is small
and consisted of portable trailers, as the original store was damaged in a fire. A small
convenience store is also located on the main land, and a larger convenience store was
located on Despro Island, nearby. A water taxi to Despro Island was approximately five
dollars for a one-way trip.
79

Figure 10: Aerial Photograph of Red Sucker Lake First Nation
Perishable foods are flown in from Winnipeg to the communities (with the exception of
Wasagamack, which does not have an airport) year-round by registered grocers and
suppliers under the Government of Canada’s Food Mail Program (now the Nutrition
North Canada Program, which provides a subsidy for healthy foods to retailers and
suppliers). In Wasagamack, perishable foods are transported via air to St. Theresa Point,
the nearest airport, and subsequently transported by boat to stores in the community.
Non-perishable foods are generally resupplied annually via truck on the winter road
system.
80

4.1.2 Prevalence of Household Gardening, Hunting and Fishing
Following the administration of the household food security surveys, participants were
asked questions regarding the prevalence of gardening, hunting, and fishing activities,
including family sharing, within their households.
Garden Hill had the most individual household gardens (30), while Wasagamack
participants reported the highest involvement in gardening activities at 43% participation
(of those interviewed). There was only one household greenhouse in the region, located
within Garden Hill First Nation (see Table 9). Household gardens within the each of the
communities were of varying size, and potatoes were a popular crop (see Photographs 1-
4) for photographs of household gardens within the communities).
Table 9: Prevalence of Household Gardening, Hunting and Fishing
Question Wasagamack St. Theresa Point
Garden Hill Red Sucker Lake
Number of household gardens 15 12 30 10 Number of household greenhouses 0 0 1 0 Percent of participants who garden 43% 30% 22% 27% Percent of participants who hunt, fish or are gifted country foods
88% 90% 68% 85%
81
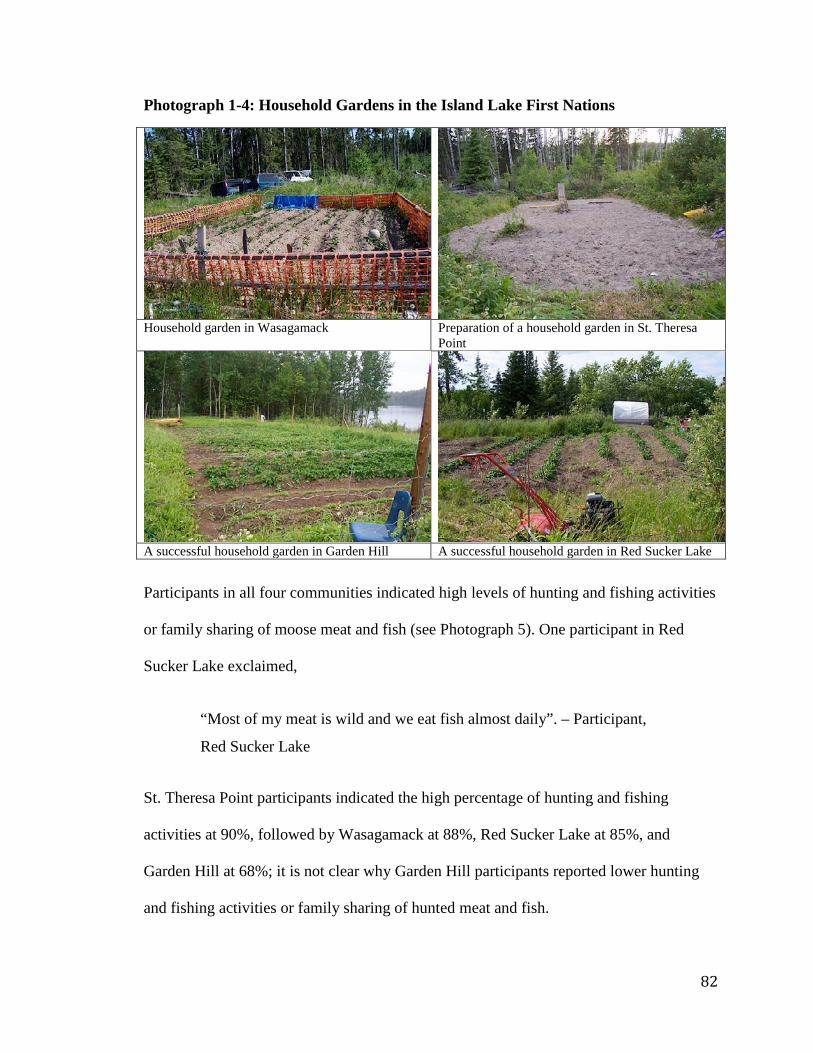
Photograph 1-4: Household Gardens in the Island Lake First Nations
Household garden in Wasagamack Preparation of a household garden in St. Theresa
Point
A successful household garden in Garden Hill A successful household garden in Red Sucker Lake
Participants in all four communities indicated high levels of hunting and fishing activities
or family sharing of moose meat and fish (see Photograph 5). One participant in Red
Sucker Lake exclaimed,
“Most of my meat is wild and we eat fish almost daily”. – Participant,
Red Sucker Lake
St. Theresa Point participants indicated the high percentage of hunting and fishing
activities at 90%, followed by Wasagamack at 88%, Red Sucker Lake at 85%, and
Garden Hill at 68%; it is not clear why Garden Hill participants reported lower hunting
and fishing activities or family sharing of hunted meat and fish.
82

Photograph 25: Bannock and Moose in Red Sucker Lake
4.1.3 Perceived Barriers to Accessing Healthy Foods
Participants in each community were asked to share their perspectives regarding what
barriers existed to accessing healthy foods in their community. The barriers identified by
participants were similar throughout the communities, and included the cost of foods and
shipping; the lack of fresh produce and variety; inadequate income and employment
opportunities; and the cost of hunting equipment and fuel. See Figure 11 for a comparison
across communities.
Sixty-six of participants within all four communities identified the cost of foods and
shipping as the largest barrier to accessing healthy foods in their communities.
Participants lamented the cost of healthy foods in their communities and said that the
high costs of healthy foods especially fresh fruits, vegetables, and milk, prevented them
from buying those foods.
83
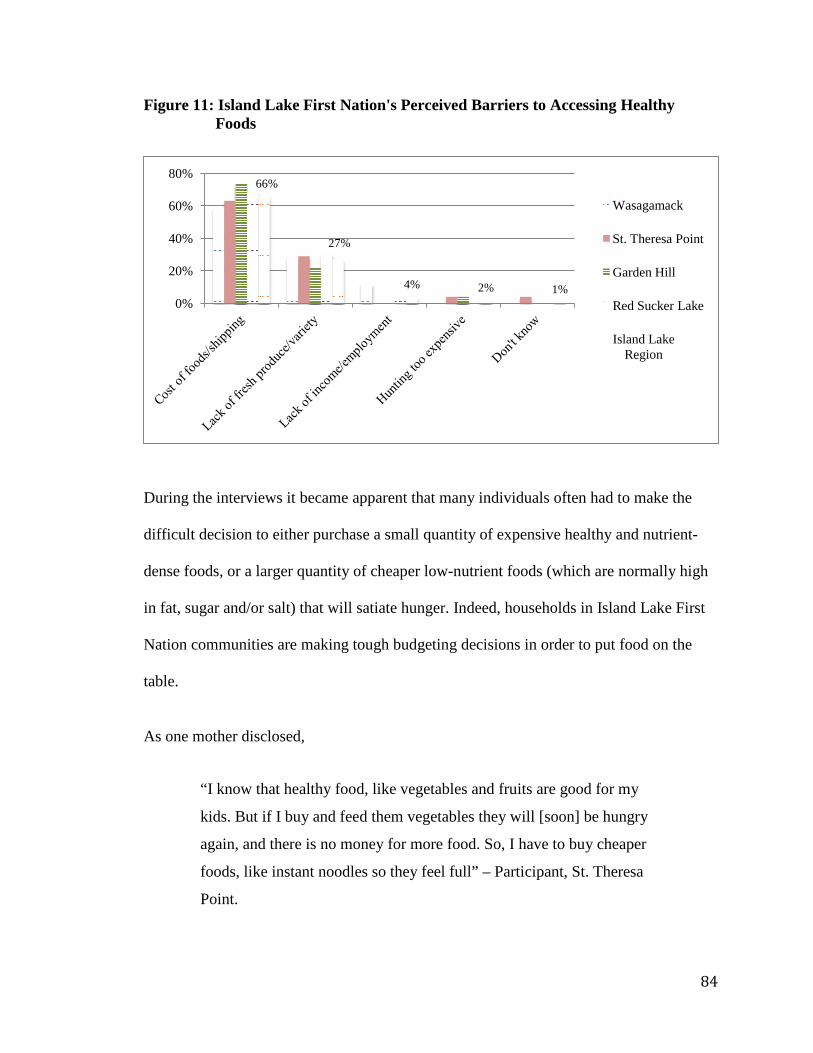
Figure 11: Island Lake First Nation's Perceived Barriers to Accessing Healthy Foods
During the interviews it became apparent that many individuals often had to make the
difficult decision to either purchase a small quantity of expensive healthy and nutrient-
dense foods, or a larger quantity of cheaper low-nutrient foods (which are normally high
in fat, sugar and/or salt) that will satiate hunger. Indeed, households in Island Lake First
Nation communities are making tough budgeting decisions in order to put food on the
table.
As one mother disclosed,
“I know that healthy food, like vegetables and fruits are good for my
kids. But if I buy and feed them vegetables they will [soon] be hungry
again, and there is no money for more food. So, I have to buy cheaper
foods, like instant noodles so they feel full” – Participant, St. Theresa
Point.
66%
27%
4% 2% 1% 0%
20%
40%
60%
80%
Wasagamack
St. Theresa Point
Garden Hill
Red Sucker Lake
Island Lake Region
84

Participants within the communities had also offered the following comments with
regards to the high cost of foods and shipping:
“They charge us too much just to eat and feed the kids. You should go
shop at the Northern and see for yourself. One little white bag can
easily go anywhere from 50 to 100 dollars.” – Participant, Wasagamack
“The biggest barrier is cost. Healthy food costs too much and [there is
a] lack of nutritious food. Mostly, I can't afford healthy food.” –
Participant – St. Theresa Point
“The fruit and vegetables cost so much. When you order [food] from
the city, sometimes they rot because it takes so long for it to get to you.
Sometimes the fruit and vegetables are [not fresh] at the Northern Store.
It’s hard to have fresh fruit, and the milk prices are outrageous. All the
food prices at the Northern Store are outrageous.” – Participant, Garden
Hill
“The high cost of food is the biggest barrier to eating healthy. The cost
of milk and [infant formula] is high. I can't afford to buy fruits and
vegetables all the time.” – Participant, Garden Hill
“The biggest barrier to eating healthy is the cost of food. I can never
afford good meals or healthy foods.” – Participant, Garden Hill
“The cost of healthy foods, like veggies, milk, and fruits are a barrier to
eating healthy; most of the time the store doesn't have any.” –
Participant, Red Sucker Lake
“We spend a lot of money to order food and fruit for my family. It's like
I pay three times as much when I buy food (including freight). My
children grew up without fruit and vegetables because not having them
85

supplied in the community. If it was [available] it was always expensive
to buy. We need a store that sells fresh fruit and vegetables in our
community.” – Participant, Red Sucker Lake
Some of the comments offered by participants above also indicated that there was an
issue regarding the supply of healthy foods, especially fruits and vegetables within the
communities. Twenty-seven percent of participants indicated that the lack of fresh
produce and the lack of variety in the stores prevented them from purchasing theses
foods. During interviews, the issue of low quality produce was identified frequently.
Some participants thought that the reason for low-quality produce within their
communities was inadequate refrigeration during shipping and/or that stores purchased or
received low quality (bruised, rotten) produce which is subsequently shipped to their
communities. Further discussion with suppliers and shippers is required in order to
validate these opinions. Participants within the communities offered the following
comments with low-quality produce and lack of variety:
“When ordering by food mail, half of your order you can't eat. Ground
beef is thawed out and smelly. It's gone bad by the time you get it. You
get rotten or not fresh foods by mail.” – Participant, Wasagamack
“Produce runs out every second day at the Northern. [The] cost of food
is expensive, three times more than in Winnipeg. Supplies always run
out. Cost of food for babies is three times higher.” – Participant, St.
Theresa Point
“[We need] fresher produce. [By the time it gets here] it is already
rotten.” – Participant, Wasagamack
86

“Food gets here right before the expiry date. They sell it when it is old,
and the price is lowered when the expiry date is past. We have to buy it
no matter what.” – Participant, Red Sucker Lake
The high cost of hunting and fishing was also identified as a barrier by approximately 4%
of participants within St. Theresa Point and Garden Hill; however, participants from other
each community identified that it is becoming increasingly difficult to hunt and fish:
“In the past there were traditional foods, but not so much now. We are
struggling with foods now.” – Participant, Wasagamack
“Lots of money spent to go hunting, fishing and trapping; and we need
to bring foods to go hunting and trapping”. – Participant, Wasagamack
“In our tradition, you need to be a strong man and eat from the land. We
can’t do that now. It is hard to get the game now.” – Participant, St.
Theresa Point
“My family gets food from hunting, but it is getting hard to hunt
because of the costs”. – Participant, Garden Hill
4.1.3 Community Perspectives on Solutions to Accessing Healthy Foods
Participants in each community were asked to share their perspectives regarding what is
required in their communities to increase access to healthy foods in their community. The
most common solutions identified by participants within the communities were the
construction of an all season road (26%) and lower food prices (25%). See Figure 12 for
a comparison across communities.
87

Figure 12: Island First Nation’s Perceived Solutions to Accessing Healthy Foods
Twenty-six percent of participants within all four communities thought that the
construction of an all-season road would increase access to healthy foods and would
decrease the cost of those foods, as revealed in the following comments from
participants:
“We need an accessible road to the south, instead of air freight
subsidies (food mail/nutrition north) for groceries. Shopping for food is
ridiculously [expensive], like three times higher [than Winnipeg].” –
Participant, St. Theresa Point
“An all-season road would improve food access, but elders are worried
about drugs and alcohol [coming into the community] and accidents on
the road. [A road] might also increase mining and resource extraction
activities; there is nickel ore around here.” – Participant, St. Theresa
Point
26% 25%
16% 12%
9%
5% 4% 1% 1% 1%
0%
5%
10%
15%
20%
25%
30%
35% Wasagamack
St. Theresa Point
Garden Hill
Red Sucker Lake
Island Lake Region
88

As noted within the above comments, there are concerns that a road into the Island Lake
area could increase access for mining and other resource-extracting companies, as well as
increasing access to drugs and alcohol within these communities where alcohol is banned.
Twenty-five percent of participants also indicated that lower prices for healthy foods are
required, and 12% of participants indicated that access to a variety of fresh produce is
needed to increase access to healthy foods in the communities. The communities also
identified high prices, poor quality and variety as barriers to accessing healthy foods. One
participant exclaimed,
"As soon as possible we need a change. [Food] is too expensive.
Whatever we have we'll eat to get our stomachs filled." – Participant,
St. Theresa Point
One participant from Red Sucker Lake indicated that a community group should
be formed to record food quality within the community, which could be used as
leverage by the community to petition the stores to provide higher quality food
within the community:
“[Red Sucker Lake] should have a community watchdog to monitor
food quality. To watch for and track spoiled foods and expiry dates.”
Twenty-four percent of participants in Wasagamack and 8% of participants in
St. Theresa Point identified the need for an airport within their community.
Since Wasagamack is without an airport all foods that are destined for the
community are removed from the aircraft and trucked to the dock in St. Theresa
Point, where they are loaded onto a boat and transported to the Wasagamack
89

community dock, where foods are again loaded onto trucks for their final
destination. Excessive handing of perishable foods can increase the potential for
bruising and decreasing shelf life. As well, during intercommunity shipping, the
foods are not refrigerated. A smaller percentage (5%) of participants within the
communities identified the need for additional subsidies, food-initiatives, and
food-based policies.
Participants were also asked if they were familiar with food-access programs in their
community (see Table 10).
Table 10: Awareness of Food-Based Programming within the Island Lake
Wasagamack St. Theresa Point
Garden Hill
Red Sucker Lake
Island Lake Region
Participant awareness of food-based programs and initiatives in their community
85% 60% 45% 72% 67%
Wasagamack participants reported the greatest awareness of food-based programming in
their community, at 85%. In Island Lake First Nation communities as a whole, 67% of
participants were aware of food-based programs within their communities. Many
individuals mentioned that they were most familiar with gardening initiatives and the
former national Food Mail Program. One participant offered the following:
“Food mail is a very good program, and it works for this house. If we
didn't have this, the house would have to cut back on meals.” –
Participant, Red Sucker Lake
90

4.2 Food Costing and Food Availability Results
All food stores within the Island Lake First Nation communities were audited in July
2009 to determine the cost of a healthy food basket as defined by the 67-item RNFB, and
subsequently compared with prices obtained from a large Winnipeg grocer audited in
August 2009. The average price for food items in each community was calculated as the
mean price of that item between all of the community stores in which that food item was
available. The average Island Lake Regional food costs are also provided and compared
to the Winnipeg food costing audit results, to illustrate the large price gap that exists (see
Table 11).
Often the cost of milk in northern and remote communities is used in the media as an
indicator of the elevated cost of food. Indeed, the audit revealed that a 4 L jug of 2% milk
had a cost that ranged between $9.99 in Wasagamack and $14.17 in Garden Hill, with an
average price of $12.46 between the four First Nations. In Winnipeg a 4 L jug of 2% milk
cost $4.69, resulting in a difference of $7.77 and an increase in price of 167% when
compared to the average price in Island Lake (see Table 11). Other food items had larger
price gaps, including bananas, potatoes, and carrots, among others. Bananas were over
four times more expensive in Island Lake than in Winnipeg, with an average price of
$7.40 per kilogram in Island Lake compared to $1.70 per kilogram in Winnipeg, resulting
in a price difference of $5.70 per kilogram and a price increase of 335%. Potatoes and
carrots, staples in most Canadian diets, were over three and half times more expensive in
the Island Lake First Nations than in Winnipeg with a price difference of $13.11 per 4.54
kg bag and a price increase of 274%. Common items missing from the RNFB in the
communities included frozen fish fillets, canned sardines, frozen orange juice, frozen
91
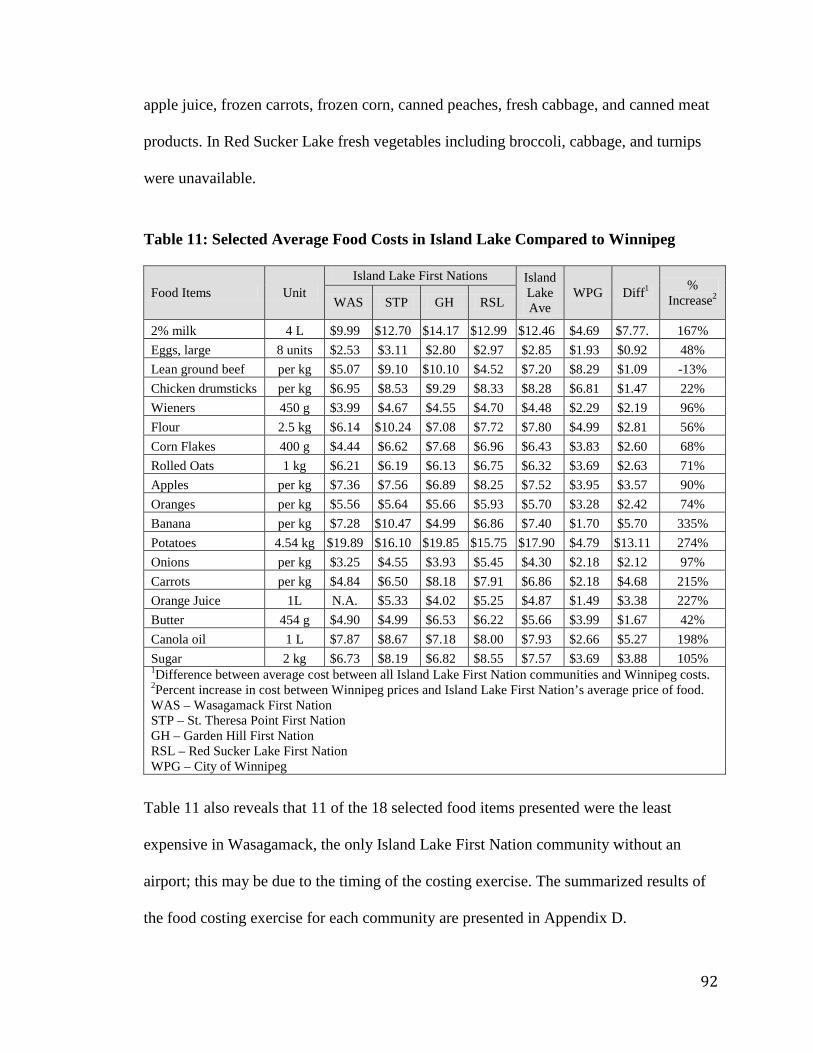
apple juice, frozen carrots, frozen corn, canned peaches, fresh cabbage, and canned meat
products. In Red Sucker Lake fresh vegetables including broccoli, cabbage, and turnips
were unavailable.
Table 11: Selected Average Food Costs in Island Lake Compared to Winnipeg
Table 11 also reveals that 11 of the 18 selected food items presented were the least
expensive in Wasagamack, the only Island Lake First Nation community without an
airport; this may be due to the timing of the costing exercise. The summarized results of
the food costing exercise for each community are presented in Appendix D.
Food Items Unit Island Lake First Nations Island
Lake Ave
WPG Diff1 % Increase2 WAS STP GH RSL
2% milk 4 L $9.99 $12.70 $14.17 $12.99 $12.46 $4.69 $7.77. 167% Eggs, large 8 units $2.53 $3.11 $2.80 $2.97 $2.85 $1.93 $0.92 48% Lean ground beef per kg $5.07 $9.10 $10.10 $4.52 $7.20 $8.29 $1.09 -13% Chicken drumsticks per kg $6.95 $8.53 $9.29 $8.33 $8.28 $6.81 $1.47 22% Wieners 450 g $3.99 $4.67 $4.55 $4.70 $4.48 $2.29 $2.19 96% Flour 2.5 kg $6.14 $10.24 $7.08 $7.72 $7.80 $4.99 $2.81 56% Corn Flakes 400 g $4.44 $6.62 $7.68 $6.96 $6.43 $3.83 $2.60 68% Rolled Oats 1 kg $6.21 $6.19 $6.13 $6.75 $6.32 $3.69 $2.63 71% Apples per kg $7.36 $7.56 $6.89 $8.25 $7.52 $3.95 $3.57 90% Oranges per kg $5.56 $5.64 $5.66 $5.93 $5.70 $3.28 $2.42 74% Banana per kg $7.28 $10.47 $4.99 $6.86 $7.40 $1.70 $5.70 335% Potatoes 4.54 kg $19.89 $16.10 $19.85 $15.75 $17.90 $4.79 $13.11 274% Onions per kg $3.25 $4.55 $3.93 $5.45 $4.30 $2.18 $2.12 97% Carrots per kg $4.84 $6.50 $8.18 $7.91 $6.86 $2.18 $4.68 215% Orange Juice 1L N.A. $5.33 $4.02 $5.25 $4.87 $1.49 $3.38 227% Butter 454 g $4.90 $4.99 $6.53 $6.22 $5.66 $3.99 $1.67 42% Canola oil 1 L $7.87 $8.67 $7.18 $8.00 $7.93 $2.66 $5.27 198% Sugar 2 kg $6.73 $8.19 $6.82 $8.55 $7.57 $3.69 $3.88 105% 1Difference between average cost between all Island Lake First Nation communities and Winnipeg costs. 2Percent increase in cost between Winnipeg prices and Island Lake First Nation’s average price of food. WAS – Wasagamack First Nation STP – St. Theresa Point First Nation GH – Garden Hill First Nation RSL – Red Sucker Lake First Nation WPG – City of Winnipeg
92

Several food items including potatoes, four, and oranges, among others, were least
expensive at community owned and operated stores than at The Northern Store (see
Figure 13); as one participant indicated,
“The Northern is more expensive than the other stores. Smaller stores
are more competitive. – Participant, Garden Hill
Figure 13: The Northern Store vs. Community Store Food Prices
Wasagamack Selected Food Prices St. Theresa Point Selected Food Prices
Garden Hill Selected Food Prices Red Sucker Lake Selected Food Prices
$-
$5.00
$10.00
$15.00
$20.00
$25.00
Milk Flour Oranges Potatos Oil
4L 2.5 kg per kg 4.54 kg 1 L
NWC Harper Tee Pee
$-
$5.00
$10.00
$15.00
$20.00
$25.00
Milk Flour Oranges Potatos Oil
4L 2.5 kg per kg 4.54 kg 1 L
NWC Rogers Monias Snack Shop
$-
$5.00
$10.00
$15.00
$20.00
$25.00
Milk Flour Oranges Potatos Oil
4L 2.5 kg per kg 4.54 kg 1 L
NWC Mikisew Convenience Store Ministic Laundry Ministic Place
$-
$5.00
$10.00
$15.00
$20.00
$25.00
Milk Flour Oranges Potatos Oil
4L 2.5 kg per kg 4.54 kg 1 L
NWC Island Lake Trading Company Cash & Carry
93

The RNFB divides the 67 perishables and non-perishables food items into their
food groups to aid in comparing prices and Basket totals across communities. In
Table 12, the 2009 food prices are illustrated within the RNFB food groups, and
Basket totals in the Island Lake First Nation communities have be compared to
the 2009 Winnipeg prices.
Table 12: Cost of the Revised Northern Food Basket in Island Lake
Food Group Island Lake First Nations Island
Lake Ave
WPG Diff2 % Increase4 WAS STP GH RSL
Dairy products $70.32 $66.53 $68.64 $67.78 $52.57 $36.73 $15.84 43% Eggs $2.53 $3.11 $2.80 $2.97 $2.85 $1.93 $0.92 48% Meat $57.76 $77.70 $80.74 $67.63 $85.22 $57.04 $28.18 49% Meat alt. $9.45 $9.80 $9.81 $10.67 $9.93 $6.20 $3.73 60% Grain products $36.76 $39.84 $37.42 $44.03 $39.51 $22.18 $17.33 78% Citrus/tomatoes $16.80 $20.62 $18.68 $19.59 $18.92 $9.45 $9.47 100% Other fruit $78.15 $87.68 $65.55 $80.06 $77.86 $35.73 $42.13 118% Potatoes $17.18 $16.45 $17.39 $14.51 $16.38 $5.05 $11.33 224% Vegetables $68.43 $65.25 $69.37 $68.12 $67.79 $31.40 $36.39 116% Oils & fats $11.18 $8.98 $10.11 $10.69 $10.24 $6.88 $3.36 49% Sugar $2.02 $2.46 $2.05 $2.56 $2.27 $1.11 $1.16 105% Misc. (add 5%)1 $18.53 $19.82 $19.13 $19.42 $19.22 $10.64 $8.58 81% Total $389.11 $418.32 $401.68 $407.91 $404.26 $224.40 $179.86 80% Difference From Winnipeg Cost3 $164.71 $193.92 $177.28 $183.81 $179.86 - - -
% Increase4 73% 86% 79% 82% 82% - - - 1Miscellaneous items include coffee, tea, spices, condiments, and baking supplies. 2Cost difference between the average price of the RNFB food group in Island Stores and Winnipeg. 3Cost difference between the RNFB price in each First Nation and Winnipeg. 4Percent increase in cost between Winnipeg prices and Island Lake First Nation’s average price of food. WAS – Wasagamack First Nation STP – St. Theresa Point First Nation GH – Garden Hill First Nation RSL – Red Sucker Lake First Nation WPG – City of Winnipeg
The total cost of the RNFB ranged from a maximum of approximately $418 in St.
Theresa Point to $389 in Wasagamack, with an average RNFB cost of $404 for the Island
Lake First Nation communities. Wasagamack’s cost is also 7% less than St. Theresa
Point, where Wasagamack’s foods are initially unloaded and shipped to the community.
The total cost of the RNFB in Winnipeg was approximately $224. Consequently, the
94

RNFB in Island Lake costs between $194 and $165 more than Winnipeg, which is an
increase in price of 86% to 73%.
4.3 Food Basket Affordability
In order to demonstrate affordability, the cost of the RNFB was compared to median
family incomes for each of the four Island lake First Nation communities and was used to
determine the percent of family income spent solely on food, if that family was to use the
RNFB as a guide for food purchasing, and only purchased market-food (see Table 13).
The 67-item Basket, as discussed in Chapter Three is based on a family of four and is
representative of a regular diet, where there are no special dietary requirements for either
medical needs or personal-belief systems. The RNFB may not be an accurate reflection of
what is consumed in the average home; however, it does allow for price and affordability
comparisons between communities and regions, and therefore aids in illustrating the
disparity in healthy food prices between northern Manitoba and Winnipeg.
Table 13: Affordability of the Revised Northern Food Basket in 2009
Location Cost per Week
Cost per Year
Median Family Income
Average Family
Size
Average Household
Size
Income Spent on Food (%)
Wasagamack $398 $20,312 $26,4321 4.11 4.51 77% St. Theresa Point $418 $21,836 $29,9201 4.32 5.52 73% Garden Hill $402 $20,968 $24,3201 4.02 5.12 86% Red Sucker Lake $408 $21,293 $26,8913 3.82 4.62 79% Winnipeg $224 $11,714 $52,6411 2.42 2.92 22% 1Statstics Canada, 2007a,b,c,e 2Statistics Canada, 2012b,c,d,e 3Average of Wasagamack, St. Theresa Point, and Garden Hill median family incomes
In Wasagamack the RNFB costs approximately $20,312 per year for a family of four. On
a median family income of $26,432 (Statistics Canada, 2007a), this cost represents
approximately 77% of a family’s annual income. In St. Theresa Point, the RNFB costs
95

$21,836 per year, representing 73% of a family’s income. In Garden Hill, the RNFB costs
$20,968 and represents 86% of a family’s income. In Red Sucker Lake, the RNFB costs
$21,293 and represents 79% of a family’s income. While the National Nutritious Basket
is usually used to determine the costs of a basket of healthy food for Winnipeg families,
for comparison purposes, the cost of the RNFB was determined. In Winnipeg the RNFB
costs approximately $11,713 and represents 22% of a family’s income. Consequently, the
cost of the RNFB would represent 40% to 48% of a family’s income in the Island Lake
First Nation communities, if the price of foods were the same as in Winnipeg.
Note that the average family size is slightly greater than four in Wasagamack and St.
Theresa Point, and that the average household size is greater than four in all four
communities. Subsequently, the four-person RNFB may not be representative of annual
costs for families with more than four persons. And, therefore the amount of income
required to purchase the additional food is greater, potentially indicating a household
food and/or income deficit, if families depended solely on market-foods.
4.4 Household Food Security Survey
A total of 162 household food security surveys were administered within the four Island
Lake First Nation communities in July 2009, representing approximately 11% of
households (n=1515) in the Island Lake First Nation Communities, with an overall
response rate of 95%. In Wasagamack, 40 surveys were administered representing
approximately 15% of the households (n=274). In St. Theresa Point, 40 surveys were
administered representing approximately 8% of the households (n=524). In Garden Hill,
41 surveys were administered representing approximately 8% of the households (n=545).
96

And, in Red Sucker Lake, 41 surveys were administered representing approximately 24%
of the households (n=172).
Marginal food insecurity is indicated by one positive response to the food security
questionnaire, and can be indicated by positive responses concerning worrying or anxiety
that the household would run out of food and/or relying on low-cost foods to feed
children. Moderate food insecurity is indicated by 2 to 5 positive responses for adults and
2 to 4 positive responses for children, and is illustrated by behaviors including a
compromise in either quantity or quality of food, not eating balanced meals and/or
skipping meals because there wasn’t enough money for food. Severe food insecurity is
indicated by 6 or more affirmed responses for adults and 5 or more affirmed responses
for children, and is marked by behaviors including feelings of hunger, losing weight, and
not eating for day(s) because there wasn’t enough money for food. Severe food insecurity
can also be indicated by positive responses to questions concerning hunger, losing
weight, and not eating for at least a day almost or some months (Health Canada, 2007;
Tarasuk et al., 2013). A full description of the methods is offered in Chapter Three.
4.4.1 Household Food Security Status in Island Lake
As illustrated in Figure 14, individuals that participated in the household food security
survey in Wasagamack exhibited the highest rates of food security at 21%, compared to
5% in Garden Hill and Red Sucker Lake, and 3% in St. Theresa Point. Consequently,
participants in Wasagamack exhibited the lowest overall food insecurity rate (including
marginal, moderate, and severe food insecurity) at 79%, while participants in St. Theresa
Point exhibited the greatest overall food insecurity rate at 97%. Participants in Red
97

Sucker Lake exhibited the greatest intensity of food insecurity, with a severe food
insecurity rate of 65%, indicating that individuals within households are hungry, skipping
meals, and/or not eating every day because there isn’t enough money for food.
Participants in Wasagamack households exhibited the lowest intensity of severe food
insecurity at 35%.
Figure 14: Household Food Security in Island Lake, All Households
Wasagamack Household Food Security Status St. Theresa Point Household Food Security
Status
Garden Hill Household Food Security Status Red Sucker Lake Household Food Security
Status Food Secure Moderate Food Insecurity Marginal Food Insecurity Severe Food Insecurity
21%
3%
41%
35% Food insecure, All 79%
3%
5%
46%
46% Food insecure All 97%
5% 2%
38% 55%
Food insecure, All 95%
5%
30%
65%
Food insecure, All 95%
98

Food security status information is also presented regionally in Figure 12, compiling the
data from the four individual communities. The regional assessment revealed an average
overall food insecurity rate of 92%, with 50%, 40%, and 3% of individuals within the
participating households identifying as severely, moderately, and marginally food
insecure, respectively as illustrated in Figure 15.
Figure 15: Household Food Security Status within the Island Lake Region
Responses to the household food security survey for both the adult and child scale for
each community and the Island Lake Region are presented in Figures 16 and 17.
Individual community responses to the household surveys are also appended in Appendix
E. One hundred and nineteen of the participants interviewed had children residing within
the households (77% of households that were part of the study), and 35 households
comprised only adults (23%). The child’s parent who was responsible for purchasing
food for the household answered the child-scale household food security survey.
Food secure
8%
Moderate food
insecurity 40%
Severe food
insecurity 50%
Food insecure, All 92%
Marginal food
insecurity 2%
99

The adult household food security scale responses reveal that the majority of participants
(78%) in all four communities worried about running out of foods, a behavior indicative
of marginal food insecurity. The survey also revealed that the majority of participant’s
(78%) had run out of food and were unable to purchase more, and were unable to afford
balanced meals (78%) behaviors indicative of moderate food insecurity. There was little
variation between communities for these coping behaviors.
Figure 16: Adult Household Food Security Survey Responses, All Households
Figure 16 also reveals that 43%, 38%, 34%, and 22% of individuals interviewed in Red
Sucker Lake, Garden Hill, St. Theresa Point, and Wasagamack, respectively, indicated
that they have been hungry but could not afford to purchase more food (regionally 34%)
a condition indicative of severe food insecurity. Likewise 38%, 26%, 20% and 19% of
individuals interviewed in Garden Hill, St. Theresa Point, Red Sucker Lake, and
78% 78% 78%
39% 38% 46%
34% 31% 26% 23%
0%
20%
40%
60%
80%
100%
Wor
ried
food
wou
ld ru
n ou
t
Run
out
of f
ood,
una
ble
to
purc
hase
mor
e
Una
ble
to a
fford
bal
ance
d m
eals
Skip
ped
mea
ls, n
ot e
noug
h m
oney
for f
ood
Cut
/ski
pped
mea
ls a
lmos
t ev
ery/
som
e m
onth
s
Ate
less
than
felt
shou
ld
Was
hun
gry
but c
ould
not
af
ford
to e
at
Lost
wei
ght,
no m
oney
to
buy
food
Did
not
eat
for a
who
le d
ay
Did
not
eat
for w
hole
day
al
mos
t eve
ry/s
ome
mon
ths
Wasagamack St. Theresa Point Garden Hill Red Sucker Lake Island Lake Region
100

Wasagamack, respectively, revealed that they have not eaten for a whole day because
there was not enough money for food (regionally 26%); 40%, 26%, 15%, and 11%
indicated this behavior occurred almost every month or some months (but not every
month) (regionally 23%). Although Red Sucker Lake participants experienced the highest
rate of severe food insecurity, Garden Hill participants exhibited the highest rate of not
eating for a day at 40%.
The child-scale survey reveals that the majority of participants in all four communities
(62%) who have children in their homes relied on a few low cost foods to feed the
children, a behavior indicative of marginal food insecurity (see Figure 17). There was
some variation within the communities; 73% of participants in Garden Hill exhibited this
coping behavior, while 53% did in Wasagamack.
Figure 17: Child-Scale Household Food Security Survey Responses, All Households
62% 61%
54%
32% 32% 32% 29% 25%
0%
20%
40%
60%
80%
Relied on few low cost foods to feed
children
Could not feed
children a balanced
meal
Not eating enough because
could not afford food
Cut the size of children's
meals
Skipped meals, not
enough money for
food
Skipped meals
almost every or some months
Hungry, unable to buy more
food
Did not eat for a whole
day
Wasagamack St. Theresa Point Garden Hill Red Sucker Lake Island Lake Region
101

The survey also revealed that the majority of participants (61%) were unable to feed the
children a balanced meal, and that children were not eating enough because there was not
enough money for food (54%), these behaviors that are indicative of moderate food
insecurity. The survey also reveals that participants in Garden Hill and Red Sucker Lake
exhibited the highest rates of behaviors associated with severe food insecurity and
hunger. Participants revealed that 40%, 30%, 26%, and 19% of children were hungry in
Garden Hill, Red Sucker Lake, St. Theresa Point and Wasagamack, respectively, because
there was not enough money to purchase more food (regionally 29%). Likewise, 33%,
30%, 21% and 6% of participants in Garden Hill, Red Sucker Lake, St. Theresa Point and
Wasagamack, respectively, indicated that children had gone without food for an entire
day, because there was no food available and they were unable to purchase more
(regionally, 25%). Indicators of severe child food insecurity within the four First Nation
communities are consistently the lowest in Wasagamack.
The household food security survey revealed that 97% (n=115) of Island Lake
households with children were food insecure: 42% (n=48) experienced moderate food
insecurity and 58% (n=67) were experienced severe food insecurity. Food insecurity was
experienced by both adult and child household members in 94% of Island Lake
households that took part in the survey (see Figure 18). In 5% of those households only
adults experienced food insecurity, and the child or children were food secure, and in 1%
of the food insecure households only the child or children experienced food insecurity,
while the adult members of the household were food secure, revealing that overall food
insecurity is experienced by all members within food insecure households. Individual
community results were similar to the Island Lake Regional results.
102
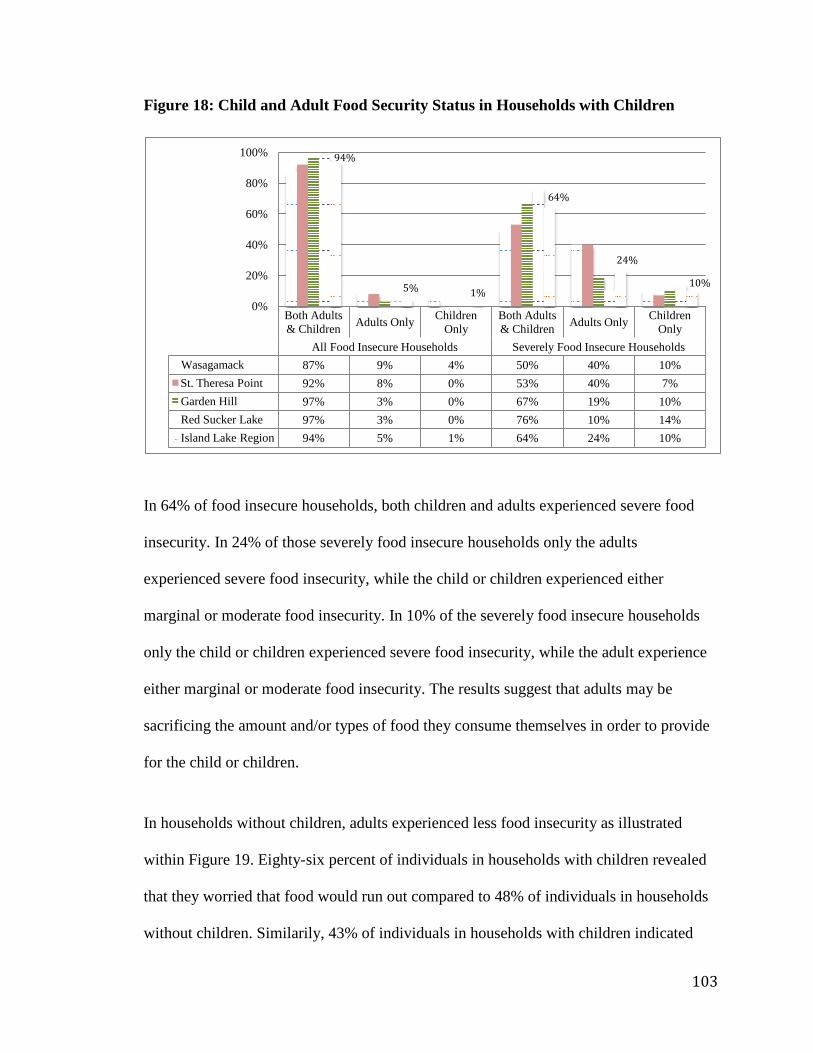
Figure 18: Child and Adult Food Security Status in Households with Children
In 64% of food insecure households, both children and adults experienced severe food
insecurity. In 24% of those severely food insecure households only the adults
experienced severe food insecurity, while the child or children experienced either
marginal or moderate food insecurity. In 10% of the severely food insecure households
only the child or children experienced severe food insecurity, while the adult experience
either marginal or moderate food insecurity. The results suggest that adults may be
sacrificing the amount and/or types of food they consume themselves in order to provide
for the child or children.
In households without children, adults experienced less food insecurity as illustrated
within Figure 19. Eighty-six percent of individuals in households with children revealed
that they worried that food would run out compared to 48% of individuals in households
without children. Similarily, 43% of individuals in households with children indicated
Both Adults & Children Adults Only Children
Only Both Adults & Children Adults Only Children
Only All Food Insecure Households Severely Food Insecure Households
Wasagamack 87% 9% 4% 50% 40% 10% St. Theresa Point 92% 8% 0% 53% 40% 7% Garden Hill 97% 3% 0% 67% 19% 10% Red Sucker Lake 97% 3% 0% 76% 10% 14% Island Lake Region 94% 5% 1% 64% 24% 10%
94%
5% 1%
64%
24%
10%
0%
20%
40%
60%
80%
100%
103

that they have been hungry and unable to purchase more food, compared to 3% of
individuals in households without children.
Figure 19: Adult Food Insecurity in Households with and without Children
4.5 Community Initiatives in Island Lake First Nations
Semi-structured interviews were conducted with NHFI workers and ADI workers,
regarding the prevalence and popularity of food-related initiatives; however, the
effectiveness of the programs and initiatives within the communities was not specifically
addressed and is considered out of the scope of this research.
In 2009, there was a variety of food and health related community initiatives within each
of the four Island Lake First Nation communities. The NFHI, HEIFER International, and
Manitoba Agriculture, Food and Rural Initiatives (MAFRI) fund many of the programs
within the communities that have succeeded in increasing access to healthy food and
0%
20%
40%
60%
80%
100%
Wor
ried
food
wou
ld ru
n ou
t
Run
out
of f
ood,
una
ble
to
purc
hase
mor
e
Una
ble
to a
fford
bal
ance
d m
eals
Skip
ped
mea
ls, n
ot e
noug
h m
oney
for f
ood
Cut
/ski
pped
mea
ls a
lmos
t ev
ery/
som
e m
onth
s
Ate
less
than
felt
shou
ld
Was
hun
gry
but c
ould
not
af
ford
to e
at
Lost
wei
ght,
no m
oney
to
buy
food
Did
not
eat
for a
who
le d
ay
Did
not
eat
for w
hole
day
al
mos
t eve
ry/s
ome
mon
ths
Island Lake Households with Children
Island Lake Households without Children
104

reducing the cost of healthy food. Table 14 provides a summary of the programs that are
available in each community during the summer of 2009.
Table 14: Island Lake Community Initiatives
Program Wasagamack St. Theresa Point
Garden Hill
Red Sucker Lake
School garden 0 1 0 1 School Greenhouse 0 1 Planned 1 Community gardens 1 1 0 0 Berry cultivation Yes Yes Yes Yes Poultry/egg production1 Yes Yes Yes Yes Household hunting, fishing, gathering2 88% 90% 68% 85% Freezer loans Yes Yes Yes Yes Airport Walk-in Freezers No Yes Yes Yes School and/or snacks Yes Yes Yes Yes Traditional potlucks Yes Yes Yes Yes Community kitchens/meal programs No Yes Yes Yes Food Mail/Nutrition North Canada Yes Yes Yes Yes Cooking classes and/or nutrition classes Yes No Yes No Agricultural training, tools Yes Yes Yes Yes 1Implemented 2007 to 2012, and under review in 2013 2Percent of individuals interviewed
St. Theresa Point has cooking circles that allow individuals to get together and cook and
share healthy food for the week. Garden Hill has a “Meals on Wheels” program for
Elders, serves an Elder lunch every second week, and has other Elder meal programs.
Red Sucker Lake has a prenatal hamper program, providing healthy foods to expectant
mothers.
Wasagamack has weekly cooking and nutrition classes. Garden Hill has a multitude of
classes including, weekly healthy cooking classes; food preservation classes; a weekly
diabetes clinic; and also hosts annual diabetes awareness walks for the community and
105

annual diabetes camps for the children. Several of the communities now have additional
programs available.
4.6 Chapter Summary
This chapter presented data from household food security surveys and questions
regarding the prevalence of hunting, fishing and gardening, barriers to food accessibility,
and current initiatives to address food insecurity within the communities. The data
presented in this chapter is congruent with the existing literature and provides the results
to address the Objectives of this thesis.
The cost of the RNFB ranges from $389 to $418 per week for a family of four, with an
average cost of $404 within the Island Lake communities, compared to $224 in Winnipeg
presenting a difference of $180. Surprisingly, without an airport Wasagamack had the
lowest cost of food, possibly due to the timing of the pricing exercise.
There was also difference between prices in Island Lake communities compared to those
in Winnipeg. For example bananas and potatoes cost approximately four and one-half
and four times as much in Island Lake than in Winnipeg, respectively. Milk costs almost
three times as much in Island Lake than in Winnipeg. Also, several food items including
potatoes, four, and oranges, among others, were least expensive at First Nation owned
and operated stores than at The Northern Store.
The top three barriers to accessing healthy food as identified by households were as
follows: the elevated cost of healthy food and shipping (66%), a lack of fresh produce
and variety (27%), and the lack of employment opportunities within the communities
106

(4%). The RNFB food costing audit and subsequent comparison of food costs to median
annual family income further illustrate that healthy food, when it is available, is
unaffordable.
The household food security survey revealed high levels of food insecurity in all four
communities, with 92% of households in Island Lake communities experiencing some
level of food insecurity, ranging from anxiety and worry that food would run out to
hunger. Fifty percent of households experienced severe food insecurity characterized by a
reduced intake of food and disrupted eating patterns. The survey results also illustrated
that households with children experienced a greater level and severity of food insecurity
than households without children. The results also suggest that adults may be sacrificing
the amount and/or types of food they consume themselves in order to provide for the
child or children.
It is obvious that food insecurity rates are very high within the Island Lake First Nation
communities. However, communities and funding agencies have begun to respond to the
widespread problem with a number of initiatives to address food insecurity and the
associated health complications. Communities have begun to embrace gardening and
poultry production, and families continue to hunt and fish for sustenance. Additionally,
there are a number of breakfast/lunch and snack programs that target school-age children,
the most vulnerable population.
107
CHAPTER FIVE: DISCUSSION
The results of the household food security survey, food-costing audit and interview reveal
that household food insecurity rates are elevated, with 92% of participants within the
Island Lake First Nation communities indicating some degree of food insecurity. These
results parallel and agree with the results of other food security studies in First Nations
communities within Manitoba, Northern Ontario, British Columbia, and Nunavut.
Additionally, the results of the food-costing audit revealed that the Island Lake
communities may be devoting upwards of 86% of their annual income to food alone.
Considering that the cost of the RNFB does not include personal care products, cleaning
supplies, special dietary food products (diabetes-appropriate foods or gluten-free foods),
convenience/take out foods, or the cost of hunting or fishing equipment, the true cost of
consuming a healthy diet in the Island Lake First Nation communities is likely greater
than presented, further supporting the notion that healthy food and the RNFB is
unaffordable.
This Chapter will reflect on the disparity that exists in food costs and income devoted to
food, between remote northern communities and southern urban locations and will also
consider the appropriateness of the RNFB, and potential solutions to make it more
effective. This chapter will also compare the results of the household food security survey
to other studies including the “off-reserve” Aboriginal population included in Health
Canada’s latest national CCHS studies.
108

5.1 Accessibility and Affordability of the Revised Northern Food Basket
Is a healthy diet, represented by the RNFB, accessible and affordable for most families
within the Island Lake First Nation communities? The short answer is no. Healthy food is
not affordable and geography, policy decisions, education, and socio-economic realities
comprise a large and diverse role in supporting this answer.
5.1.1 Accessibility
The three major barriers to accessing healthy food within the Island Lake First Nation
communities as identified by households is this study were as follows: the costs of
healthy food and shipping (66%), a lack of fresh produce and variety (28%), and a lack of
income and employment (4%). Community members in Fort Severn First Nation and
Kugaaruk, Nunavut also indicated that food costs (85-89%), the lack of fresh healthy
food and variety (64-68%), and poor quality (64-66%), were key barriers to accessing
healthy foods in their community. The Manitoba FNFNES 2010 study also reported that
the high cost of food and lack of retail competition are barriers to accessing nutrition and
healthy food in First Nation communities in Manitoba, however there are no statistics
provided. Ultimately, these concerns are similar in many First Nation communities and
often that healthy food, when it is available, is unaffordable.
Participants in the Island Lake communities indicated that more stores are required to
increase food security within their communities. Recent research agrees with this
communities’ hypothesis. Thompson et al. (2012) predicts that an increase in number of
full grocery stores in a community has the potential to increase the level of food security
from 25% where there is no store in the community, to 69% where there are three full
109

grocery stores in a community. This could have a significant economical and social
impact on the communities if stores were First Nation-owned and operated as a
cooperative. Currently, the Northern Store, owned by the North West Company (NWC),
enjoys a food-monopoly in most northern and remote communities in Manitoba. While
the Northern Store does offer some employment to community members, its parent
company, NWC, has policy of hiring managers external to the community (Thompson et
al., 2012). In addition to filtering money out of the communities, the NWC management
model limits the ability for human resource and capacity development. A cooperative
model-run store has the potential to have significant impact on food pricing, human
development and economic opportunity within the First Nations and “may be more
consistent with community values of sharing and reciprocity than the Northern Store”
(Socha, 2011, p.50) as illustrated by the Nunavik experience discussed in Chapter Two.
5.2 High Food Costs
In 2009 the RNFB total was between $398 and $418 per family of four per week (average
$404), potentially occupying 73% to 86% (average 79%) of a family’s income in the
Island Lake First Nations. After healthy food is purchased (using the RNFB as a guide),
families have between $3109 (Red Sucker Lake) to $8804 (St. Theresa Point) left in their
annual household budget for other household and personal essentials. Comparatively, the
cost of the RNFB in Winnipeg declines to $224 per week for a family of four,
representing 22% of a family’s annual income; a difference in cost of $180 compared to
the Island Lake communities.
110

Similar results have been documented. The Thompson et al. (2011) and Thompson et al.
(2012) studies documented the price of Health Canada’s NNFB to and discovered that
northern and remote First Nation families in Manitoba are spending 50% to 80% of their
income on food alone. The Manitoba FNFNES 2010 found that the cost of the NNFB in
northern and remote First Nation communities was $327 compared to a cost in Winnipeg
of $145 per week, resulting in a cost difference of $182 (Chan et al., 2012). Similarly, the
RNFB costs tracked by AANDC since 2010 in the Island Lake communities have
revealed an average difference of $170 when compared to Winnipeg, further supporting
the observations of this study. Although the price gaps between the north and Winnipeg
are consistent with this study, we cannot be sure if samples collected by other researchers
are representative of each community and/or region. For example, all costing exercises
within the Island Lake communities completed by INAC, only take into account food
costs and availability at the Northern Stores. Additionally, the RNFB and NNFB consist
of different items potentially impacting the utility of the Chan et al. (2012) and
Thompson et al. (2011 and 2012) reports for comparison purposes, as discussed in
Chapter Two.
Costs obtained by AANDC for the RNFB within the Island Lake First Nations are
presented in Figure 20 below (the 2009 data were obtained as part of this thesis research).
Red Sucker Lake on average has the highest food costs. The graph illustrates that food
costs are lower in the winter months and peak during the summer periods, likely due to
winter road access and consequently cheaper shipping costs during this time.
111
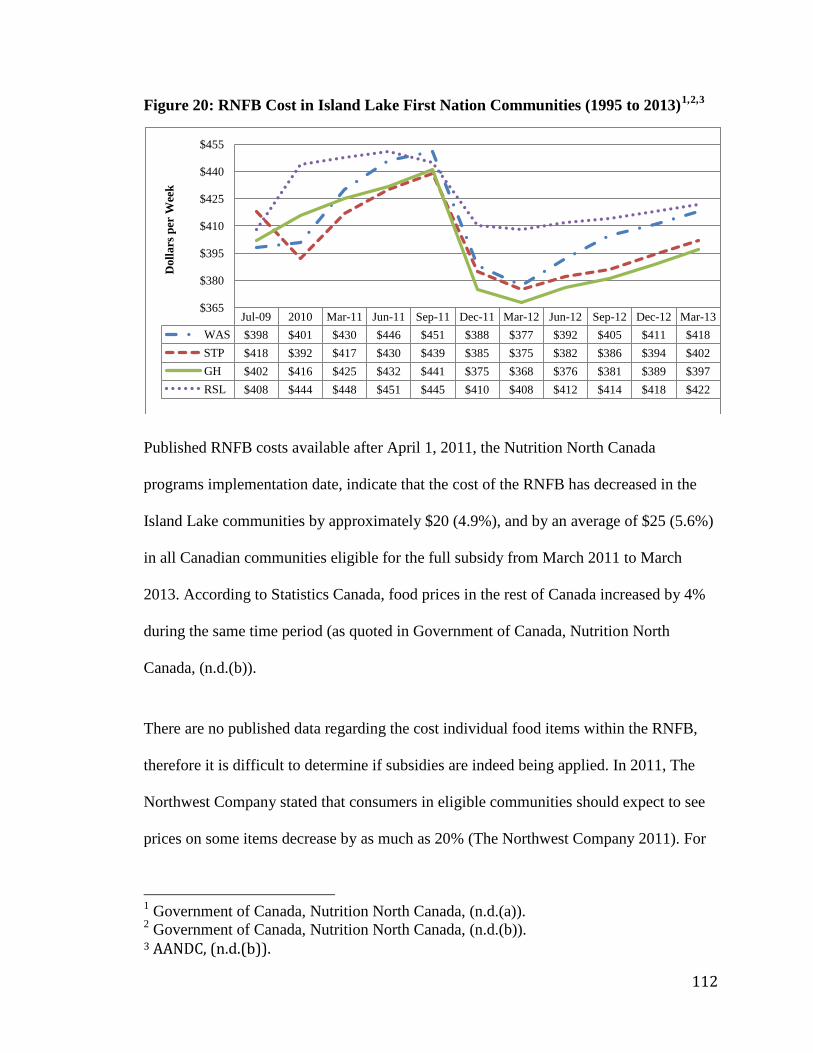
Figure 20: RNFB Cost in Island Lake First Nation Communities (1995 to 2013)1,2,3
Published RNFB costs available after April 1, 2011, the Nutrition North Canada
programs implementation date, indicate that the cost of the RNFB has decreased in the
Island Lake communities by approximately $20 (4.9%), and by an average of $25 (5.6%)
in all Canadian communities eligible for the full subsidy from March 2011 to March
2013. According to Statistics Canada, food prices in the rest of Canada increased by 4%
during the same time period (as quoted in Government of Canada, Nutrition North
Canada, (n.d.(b)).
There are no published data regarding the cost individual food items within the RNFB,
therefore it is difficult to determine if subsidies are indeed being applied. In 2011, The
Northwest Company stated that consumers in eligible communities should expect to see
prices on some items decrease by as much as 20% (The Northwest Company 2011). For
1 Government of Canada, Nutrition North Canada, (n.d.(a)). 2 Government of Canada, Nutrition North Canada, (n.d.(b)). 3 AANDC, (n.d.(b)).
Jul-09 2010 Mar-11 Jun-11 Sep-11 Dec-11 Mar-12 Jun-12 Sep-12 Dec-12 Mar-13 WAS $398 $401 $430 $446 $451 $388 $377 $392 $405 $411 $418 STP $418 $392 $417 $430 $439 $385 $375 $382 $386 $394 $402 GH $402 $416 $425 $432 $441 $375 $368 $376 $381 $389 $397 RSL $408 $444 $448 $451 $445 $410 $408 $412 $414 $418 $422
$365
$380
$395
$410
$425
$440
$455
Dol
lars
per
Wee
k
112

discussion purposes, the NNC subsidy was applied to the RNFB eligible foods and
associated weights to determine the potential savings that could be realized by
households in the Island Lake communities using the 2009 food costing data (see Table
15).
Table 15: RFNB Costs Before and After Application of NNC Subsidy
Location Cost per
Week Prior to Subsidy
Cost per Week After
Subsidy
Subsidy Savings per Year
Median Family Income
Income Spent on Food Prior to Subsidy (%)
Income Spent on
Food After Subsidy (%)
Wasagamack $389 $332 $2,964 $26,4321 77% 66% St. Theresa Point $418 $358 $3,160 $29,9201 73% 62% Garden Hill $402 $344 $3,017 $24,3201 86% 74% Red Sucker Lake $408 $352 $2,909 $26,8913 79% 68% Winnipeg $224 N.A. N.A. $52,6411 22% N.A. 1Statstics Canada, 2007a,b,c,e 2Statistics Canada, 2012b,c,d,e 3Average of Wasagamack, St. Theresa Point and Garden median family incomes
Currently eligible foods have two subsidy rates, “high” and “low” set at $1.60 and $0.05
per kilogram respectively, within the Island Lake First Nation communities. Once the
subsidy is applied, we can see that the cost of the RNFB would decrease by
approximately $3,013 (approximately 17% overall), and the potential income spent on
food if using the RNFB as a guide decreases by approximately 12%. The RNFB data
from AANDC reveal that the basket prices have been consistently over the cost predicted
after the application of the subsidy. Additional data throughout 2013 and beyond are
required to determine what effect on food costs the subsidy may have in the long term
within the Island Lake First Nation communities.
113

5.2.1 Is the Revised Northern Food Basket an Appropriate Food Costing Tool?
While the RNFB is a good indicator of the cost of market-based food, it has several major
limitations, some of which were discussed in Chapter Three. One of the largest pitfalls of
the food costing tool is that is does not include country foods. In the study area, 68% to
90% of participants said their household hunts, fishes, or otherwise receives country
foods. Other Manitoba studies have shown that 85% of adults consume country food
(FNIGC, 2012) and the average First Nation person consumes 45g of country foods per
day per person (Chan et al., 2012), accounting for ~4% of the RNFB weight. Studies in
British Columbia First Nation communities indicate that First Nations people are
consuming between 37g to 118g of country food per day per person (average 67g)
accounting for 3% to 9% of the RNFB weight (Chan et al. 2011). Other studies have also
shown country food consumption to account for 11% of the RNFB weight (Lawn and
Harvey, 2003). These consumption patterns illustrate that country foods in home
households are an important food component, and in order to understand food security in
its entirety within First Nation communities, country foods need to be considered in both
a food costing tool and household food security survey. Many First Nations people also
recognize that meeting food requirements solely through the supply of country foods
would be difficult, due to population growth, the decline the abundance of wildlife, and
the presence of contaminants within some country foods (Chan et al., 2012; Rudolph and
McLachlan, 2013). Indeed, even though 68% to 90% of Island Lake households revealed
that they consumed country foods, the food insecurity rate was very high. Subsequently,
there are critical barriers to obtaining enough country foods for a balanced healthy diet
114
such as the cost of equipment, declining habitat, and increasing distances to hunting
areas, among others.
A more culturally appropriate food-costing tool would include the costs associated with
hunting and fishing, such as the cost of equipment, cost of travel, distance travelled, and
level of effort required, for not every hunt is successful. The tool should also be specific
to the region to reflect food consumption preferences and environmental realities. For
example, sardines and fish sticks are included within the RNFB; however, most
individuals within the Island Lakes region do not consume these products, as they live on
a large fresh water lake with plenty of fish available either through fishing or through
traditional family sharing practices. Also, if resource development and other industry
have affected traditional hunting, fishing and gathering areas within a First Nations
Resource Management Area and/or Traditional Area, costs associated with increased
travel could also be taken into account. Such a tool would need to be created by
individual communities and/or regions to allow for adaptation to lifestyles within those
areas and to reflect on foods available within the communities and their consumption
patterns, and to make it meaningful to the communities in which the tool is ideally
supposed to serve.
The RNFB was created by government and has been perceived as a colonialist tool by
Socha et al., 2011. The list of foods is determined by AANDC and encompasses a
truncated list of 67 food items, which may not be representative of what individuals are
consuming and what is available in the community. Additionally, it does not include
convenience foods such as frozen pizza, which has shown to be a high frequency food
115

purchase with 75% to 93% of households purchasing this product (Lawn and Harvey,
2003; Lawn and Harvey, 2004). The RNFB also does not include cleaning supplies and
food storage supplies that are necessary for safe food handling. A First Nations led food
expenditure study would aid in creating a more appropriate list of market-foods to be
monitored, and would be more reflective of First Nations and Northern communities food
preferences and food availability.
Given that many of the available fresh foods are reported to be in poor quality, it would
be helpful to supplement the tool with food quality ratings and the collection of
information regarding percent of foods offered for sale that are past their ‘best before
date’ and food availability, to get a more accurate representation. I believe this would be
a welcomed tool by the Island Lake communities, especially Red Sucker Lake where
participants indicated that the Northern Store often ran out of fresh produce, and when it
was available it was in poor quality.
While the changes suggested above may be more appropriate for First Nations
communities and provide a more accurate reflection of food costs within specific
communities, such a specific food-costing tool may lose its utility for comparing across
communities in the north and to the south, and could complicate the tracking of market-
food costs over time. The use of one tool over another would depend on what one is
attempting to accomplish by the costing exercise.
116

5.2.2. Large Percentages of Household Budgets are Devoted to Food Costs
Many food security reports and academic research have linked food insecurity to
inadequate household income. Family income can be used as one indicator of poverty and
as such to determine purchasing power for market-based food baskets. There are several
measures of poverty available in Canada including the Low-Income Cut-Off (LICO), the
Low-Income Measure after tax (LIM-AT) and the Market Basket Measure (MBM);
however, the LICO depends on the consumer price index, and does not take into account
the higher costs of goods and services in northern Canada and may not a representative
measure.
The LIM-AT for a family of four consisting of two adults and two children was $30,358
in 2006 (Statistics Canada, 2008) and the 2006 MBM1 for rural Manitoba four-person
family was $27,535 (Statistics Canada, 2013). Family incomes within the Island Lake
First Nation communities ranged between $24,320 and $29,920 (Statistics Canada,
2007a,b,c,d) in 2006, revealing that Island Lake communities are below the LIM-AT and
MBM thresholds (with the exception of St. Theresa Point), and indicating that the
average family in the communities cannot afford the required basic necessities to enjoy a
basic standard of living.
Generally, low-income families devote a larger percentage of their income to basic
necessities including food, shelter and clothing (Statistics Canada, 2008). But what is a
reasonable percentage of income to devote solely to food costs? The Dietitians of Canada
1 The Market Basket Measure “is a measure of low-income based on the cost of a specific basket of goods and services (food, clothing and shelter) representing a modest, basic standard of living” (Statistics Canada, 2013, p. 9) for a family of four, with measures for each province and size of community.
117
indicate that “a monthly household food cost of not more than 15% of household net
income is considered affordable” (Alberta Community/Public Health Nutritionists Food
Security Subcommittee and Dietitians of Canada, 2008, p.1). According to the most
recent base for low-income cut-off (LICO), “the average family spent 43% of its after-tax
income on food, shelter, and clothing” (basic necessities) (Statistics Canada, 2013, p.6).
Families in Island Lake First Nation communities are potentially devoting upwards of
86% of their annual family income to food alone, which surpasses the Dietitians of
Canada standard and Statistics Canada’s LICO spending threshold, further supporting
that the Island Lake First Nation communities are unable to afford the RNFB and the
basic necessities required for a healthy life.
In order to place Island Lake’s food costs in perspective, we can compare the potential
upper limit of 86% income devoted to food, on a provincial, national and an international
scale. Statistics Canada’s Survey of Household Spending, 2010 report found that
Manitoban households spent approximately $7,100 annually on food expenditures,
representing 11% of Manitoban’s median annual after-tax income (or 15% of their annual
expenditures) for a family of two or more persons (Statistics Canada, 2010)1. Canadians
on average spent approximately $7,422 on food in 2010, representing approximately 11%
of their family income after tax, (or 14% of their annual expenditures) (Statistics Canada,
2010).
Internationally, households in the United States allocated approximately 7% of their
annual expenditures on food, the United Kingdom 10%, Australia 11%, Sweden 13%,
1 Median after-tax income of a Manitoban family of two or more persons was $64,500 in 2010. Statistics Canada. (2010).
118
Japan 15%, Mexico and China 23%, Bolivia 28%, Kenya and Pakistan 42% and the
highest percentage of household expenditures devoted to food in 2010 were in Cameroon
at 47% (Meade, 2011). The Island Lake First Nations and other northern and remote First
Nations and communities devote a higher percentage of their income and consequently
their expenditures to food, than any other country reviewed, including less developed
countries. Additionally, Island lake First Nations and other northern and remote First
Nations devote greater than 63% of their income to food alone, surpassing the
Government of Canada’s low-income cutoff level.
5.3 Prevalence of Food Insecurity in the Island Lake First Nation Communities
To provide an evaluation of the prevalence of food insecurity in northern Manitoba, the
Island Lake results have been compared to Thompson et al. (2011) and Thompson et al.
(2012) food security results; and to other provincial and national studies, including
Health Canada’s CCHS 2011 study. Figure 21 illustrates the levels food insecurity within
14 northern and First Nation communities, and reveals that all of the Island Lake
communities with the exception of Wasagamack are amongst the top five communities
experiencing the highest rates of food insecurity. The prevalence of food insecurity is
significantly associated with geographic location and degree of isolation (Thompson et al,
2011; Thompson et al, 2012; Tonn, 2011). Communities connected via all-season road
(Lynne Lake, Leaf Rapids and Nelson House First Nation), with the exception of South
Indian Lake First Nation have the lowest rates of food insecurity; albeit still elevated
when compared to “off-reserve” Aboriginal households and non-Aboriginal households
in Manitoba.
119

Figure 21: Household Food Insecurity in 14 Northern Manitoba Communities (2009)1
An all-season road linking the Island Lake communities to Norway House Cree Nation,
which 26% of Island Lake participants that identified the need for, is being planned and
will elevate some of the pressures of high food costs. However, the completion date of
the primary road is between 2035 and 2045; with the final road being completed by the
end of the century (ESRA, personal communication, February 28, 2013).
The assumption by the community and government is that once an all-season road is
constructed, the prices of foods will decline due to less expensive shipping costs. While
Thompson et al. (2012) predicted that access to all-season roads had a significant positive
effect on the level of food security; however, it does not hold true for every community
1 Derived from Thompson et al. (2011). The four communities of Lynne Lake, Leaf Rapids, Nelson House First Nation, and South Indian Lake First Nation are connected to an all-season road. The communities of Ilford, Thicket Portage and War Lake First Nation are connected to larger centers via rail, air or winter road access. All remaining communities have air and winter road access. Berens River First Nation, is also connected via barge access to the south in the ice-free seasons.
73% 41%
85% 46%
26% 30% 29%
51% 56%
60% 13%
38% 36% 37%
7% 35%
5% 43%
74% 65%
18% 18%
13% 0%
75% 55% 58%
18%
0% 10% 20% 30% 40% 50% 60% 70% 80% 90% 100%
War Lake FN (15) Wasagamack FN (40)
Thicket Portage (20) St. Theresa Point FN (40)
South Indian Lake FN (46) Red Sucker Lake FN (41)
Nelson House FN (49) Leaf Rapids (97)
Lynn Lake (45) Ilford FN (10)
Granville Lake (8) Garden Hill FN (41)
Brochet FN (50) Berens River FN (49)
Moderate Food Insecurity Severe Food Insecurity
120

and is not the “silver bullet” for elevating high food cost and food insecurity rates in First
Nation communities. Food insecurity is a complex issue within First Nation communities,
which is steeped in racism, colonialism, and underdevelopment. For example, South
Indian Lake First Nation is connected by an all-season road with the nearest urban center
located 345 km south; however, the community experiences 100% food insecurity, with a
74% severe food insecurity rate (Thompson et al., 2011). South Indian Lake First Nation
attributes their food insecurity to the relocation of their community in the 1970’s due to
hydro-electrical development and resulting flooding of their community and surrounding
lands, which also impacted their commercial fishery and subsistence economy
(Thompson et al., 2011). Thompson’s study also illustrates that communities located in
closer proximity to urban centers have decreased food security rates, further illustrating
that food security issues are complex and requires a diverse initiatives to elevate food
insecurity.
A comparison of the Island Lake results to other First Nation food security studies in
Manitoba, Northern Ontario, and British Columbia, illustrate that the Island Lake area
experiences higher rates and greater depths of food security that the First Nation
communities represented in these studies (see Figure 22). The contrast between
Aboriginal people living on and “off-reserve” is shocking. Aboriginal people living “off-
reserve”, enjoy a food security rate of approximately 73% compared to a dismal rate of
8% in the Island Lake Region. However, “off-reserve” Aboriginal people still sustain a
food security rate 15% below the general population of Canada.
121

Figure 22: Comparison of Food Insecurity Rates in Island Lake to Canadian Studies
This evaluation has demonstrated that the communities within the study area are amongst
the most food insecure and hungry in Canada. The high costs of fresh healthy food, low
availability of healthy foods, poor quality of healthy foods, and lack of a living
wage/income reinforces the high levels of food insecurity, and may explain why children
in Island Lake have the highest rate of pediatric diabetes in North America (Amed et al.,
2010; Government of Manitoba, 2003; Thompson et al., 2011).
5.3.1 Is the Household Food Security Survey a Culturally Appropriate Measure?
Similar to the RNFB, the household food security survey is useful for making
comparisons between communities and different populations. Complications for
comparisons between Aboriginal communities and non-Aboriginal communities may
92%
75%
38%
54%
41%
67%
83%
12%
27%
0%
20%
40%
60%
80%
100%
Island Lake Region
Thompson et al., 2011
FNFNES 2010
RHS 2008/10
FNFNES 2008
Lawn and Harvey, 2004
Lawn and Harvey, 2003
2011 CCHS 2011 CCHS
Manitoba Canada British Columbia
Fort Severn, Ontario
Kugaaruk, Nunavut
All Canadian Households
"Off-Reserve" Canadian
Households
First Nation Communities Excluding First Nations
Severe Food Insecurity Moderate Food Insecurity Food Insecurity, All Food Secure
122

arise however, due to the way in which the questions were phrase and developed. During
the administration of the surveys in each of the Island Lake First Nation communities, the
term “balanced meal” needed further explanation and on occasion the phrase “skipping
meals” also need further explanation, which led the researcher to question the utility of
the survey tool within First Nation communities. Lawn and Harvey (2003) tested the
survey with Inuit interviewers and found that several modifications were required in
order to make the tool more culturally appropriate within the Inuit community. Lawn and
Harvey (2003) found that to be more culturally appropriate, the questions should be less
direct and prefaced with “Some families might say”. Additionally, they modified the
survey to reference “healthy meals”, which respondents found more meaningful than the
term “balanced meal”.
Additionally, “the food security scale does not measure food safety, nutrition, availability
of food through socially acceptable channels, or community-led factors including the
nature and sources of the available food supply” (Bickel et al., 2000, p.16). A food
security measure employed within First Nation communities should include traditional
resource and food sharing practices, as this can be an important channel for food
acquisition.
For this survey to provide a true reflection of household food security within Aboriginal
communities, the survey needs to be vetted by an Aboriginal organization, to make it
more culturally appropriate. For example, the survey requests participants to recall a 12-
month period; however, in First Nation communities it may be more appropriate to
measure food security according to seasons. This method of recall may capture market
123

based price fluctuation in food commodities and seasons where traditional foods are more
abundant.
The survey needs to allow for further explanation of conditions and behavior, and should
also incorporate questions regarding traditional food-sharing practices to understand
other coping mechanisms that are unique to First Nation communities. Households in
First Nation communities are more likely to be multi-generational than southern
households. Therefore several surveys may need to be administered in each household if
each family is purchasing their own market-foods. To address multi-generational
household and food security status, a separate scale should be created for senior citizens
(Elders), as Elders may rely on traditional food sharing practices and community food
initiatives, such as “meals on wheels” more so than other age-groups, and as a result may
be a vulnerable population.
The survey should also capture the frequency or duration of coping behavior to fully
understand the depth and severity of food insecurity. Finally, the survey would offer
better insight if demographic and income data was collected alongside, which would help
identify particularly vulnerable populations within the greater population.
5.4 Evaluation of Community Initiatives
Gardening can have a significant effect on access to healthy and nutritious foods, which
are otherwise too expensive or unavailable aiding to de-commodify food. Gardening is a
traditional source of food for Aboriginal people, a practice that had been absent due to the
effects of the residential school system, and appropriation of lands, among other causes
124

(LaDuke, 2002; Rudolph and McLachlan, 2013; Thompson et al., 2012). However,
gardening in northern Manitoba is gaining in popularity and has grown 45% since 2009
(Fieldhouse and Thompson, 2012). Schools have been leaders in gardening programs in
the north by working healthy eating and gardening into their curriculums and activities,
introducing children to foods they may not normally wish to eat, and encouraging
excitement about eating healthy foods and gardening.
Gardening in the north has its unique challenges including: a shortened growing season,
making some vegetables and fruit impossible to grow; the need for soil amendments and
equipment; lack of consistent available funding; and an ongoing commitment from
gardeners throughout the growing season (Thompson et al., 2010; Thompson et al.,
2011). Even with all of these requirements satisfied, gardens may not produce enough
foods to alleviate the high cost of food throughout the year. Gardens do however have
positive outcomes and spins-offs that include community building, sharing of knowledge
between youth and Elders, physical activity, and momentum for positive change within
the community (Rudolph and McLachlan, 2013). Increased gardening is a pathway to
food sovereignty in First Nation communities, as gardening is a traditional practice and is
successfully producing food (albeit on a household scale).
The NHFI has implemented funding towards the creation of small-scale livestock
projects including the raising of poultry, allowing communities increased access to eggs,
fresh meat and fertilizer for gardens. Raising poultry as a pathway to First Nation food
sovereignty has been criticized however, for removing individuals from traditional
125

hunting practices and potentially undermining country foods, and taking considerable
time and effort (Rudolph and McLachlan, 2013; Rudolph, 2012).
An initiative currently not implemented with the Island Lake First Nation communities,
which has a significant potential to increase food security, is a country foods program.
Country foods programs promote the consumption of traditional foods, by supporting
hunters and gatherers who provide food for the community (Thompson et al., 2011), and
promotes food sovereignty within the community.
Thompson et al. (2012) found a significant positive effect on food security when a
community implemented a country foods program, which was more influential on food
security status than any of the other parameters measured. Thompson et al. (2012)
predicts that “a community with a country foods program but no [rail or bus
transportation] or [all-season] roads would enjoy 40% food security; however, when a
country foods program is paired with access to rail or bus, and an all-season road the rate
of food security could increase to 95%, surpassing the Canadian average of 92%
(Thompson et al, 2012). Indeed, Nelson House First Nation, which enjoys all-season road
access and has a country foods program, has the lowest rate of overall food insecurity
measured in northern Manitoba First Nations and communities at 47% (See Figure 21).
Although this food security rate is impressive in the context of First Nations in Manitoba,
it is still elevated when compared with non-Aboriginal households and Aboriginal
households living “off-reserve” in Manitoba (Health Canada, 2011). Clearly, country
foods programs have great potential to increase food security within a community, in
126

addition to providing employment opportunities and strengthening cultural connections
within a food sovereignty lens.
Each of the four Island Lake First Nation communities has implemented school nutrition
programs, cooking classes, cooking circles, and elder meal programs. These programs
help to educate community members that may not be familiar with the preparation of
some of the healthy foods available at the grocery stores or grown in gardens as well as
traditional food, and also helps to highlight the link between diet, diabetes, and obesity,
while addressing food security and food sovereignty.
School nutrition programs and elder meal programs would be stronger, more affordable,
and more culturally appropriate if country food use was allowed. Given the high rates of
food insecurity and obesity within Island Lake and other First Nations, applicable
regulations need to be revisited and a mutually beneficial agreement drawn in its place
that satisfies the intent of food safety regulations given the lack of infrastructure in the
north.
Arctic Cooperative stores have also had a positive impact in northern Aboriginal
Canadian communities. Cooperative stores are independently owned, operated, and
controlled by the community in which they reside. Cooperative stores focus on building
human capacity and retain money within the community. Since the cooperative model
takes its profits and re-distributes a portion amongst its members, and subsequently re-
invests the remainder back into the cooperative, inflated prices do not make good long-
term business sense (NAHO, 2004). Developing cooperative stores within the Island
Lake communities could help to provide better access to foods, if constructed within the
127

main community (i.e., not on an island). Additionally, a cooperative store could provide
the community with some control over the type of healthy and unhealthy foods that are
imported into the community, which may have a positive impact on food insecurity and
its negative health outcomes.
5.5 Chapter Summary
The Island lake First Nations and other northern and remote First Nations devote greater
than 63% of their income to food alone, surpassing the Government of Canada’s low-
income cutoff level. Further, these communities also devote a higher percentage of their
income and consequently their expenditures to food than many less developed countries,
revealing that the average family within the four communities cannot afford the RNFB
and the basic necessities to enjoy a basic standard of living and healthy life.
A comparison of Island Lake’s regional household food security results to other First
Nation food security studies in Manitoba, Northern Ontario, and British Columbia,
illustrate that the Island Lake area experiences higher rates and greater depths of food
security than many other First Nation communities represented in these studies. This
evaluation has demonstrated that the Island Lake communities are amongst the most food
insecure and hungry in Canada.
The high costs of fresh healthy food, low availability of healthy foods, poor quality of
healthy foods, and lack of employment and income, are the key factors influencing the
high levels of food insecurity; and, may also be contributing factors for children in Island
128

Lake possessing some of the highest rates of pediatric diabetes in North America (Amed
et al., 2010; Government of Manitoba, 2003; Thompson et al., 2011)
Northern and remote First Nations in Manitoba have begun to respond to this crisis by
growing household and community gardens, creating and implementing diabetes
programs and school-meal programs, implementing meal programs for elders, and
developing country food programs, among other initiatives. These are some examples of
food-related community economic development initiatives that are aiding to de-
commodify food production and distribution, and re-invigorate local food production and
while moving towards a more sustainable and community-controlled food system.
129

CHAPTER SIX: SUMMARY, CONCLUSIONS, AND RECOMMENDATIONS
While the objectives of this thesis are presented independently, the results of this research
indicate that the issue of food security has many layers that are not independent of each
other. In examining factors that influence and determine the degree and depth of food
insecurity, a holistic view needs to be employed taking into account issues including
geographical location, access to and affordability of foods, access to employment and
income levels, as wells as programs and initiatives to support food security and their
cultural appropriateness. However, as one reviews this information additional themes
regarding colonialization, commodification of food, equity and equality, and political
environment emerge. While the following Chapter reflects on these issues, they require
further study and consideration and should be considered in future food security and
sovereignty research.
The disparity between southern Manitoba and northern Manitoba First Nations generates
the need for ongoing food-costing studies and initiatives aimed at decreasing food costs
and increasing access to healthy foods through community led programs. It also
illustrates the requirement for increased funding and community led economic
development initiatives to increase culturally appropriate employment opportunities
within First Nation communities. Underneath the numbers, there lies systemic racism that
perpetuates the poverty within First Nation communities, resulting in high rates of food
insecurity and hunger.
130

6.1 The Crux of the Problem
The high rate of food insecurity within the Island Lake First Nation communities and
within other northern remote communities and First Nations is unacceptable.
Food costs in the Island Lake communities are double what Winnipeg families have to
bare, and Winnipeg’s median family income is double that of the average Island Lake
family. This inequitable situation results in hunger as families within the Island Lake
First Nation communities cannot afford the Revised Northern Food Basket and the basic
necessities required to enjoy a basic standard of living in Canada. For if households
within the Island Lake First Nation communities consumed food according to the RNFB,
the percent of their annual expenditures devoted to food would be greater than some of
the poorest and under-developed countries in the world (Meade, 2011). A truly
inequitable situation, illustrating that food insecurity is directly linked to inadequate
household income. Social assistance rates need to be reflective of true cost of living in the
northern communities, and communities need to be actively pursuing their own source
revenue in order to provide employment opportunities to their members.
The degree and intensity of household food insecurity observed within the Island Lake
First Nation communities is extremely concerning when compared with other First
Nations Provincially and Nationally. The Island Lake household food security results
show that the communities experience higher rates and greater depths of food security
than that of many other First Nation communities in Manitoba, Northern Ontario, and
British Columbia. Consequently the Island Lake communities are amongst the most food
insecure and hungry in Canada.
131

These high rates of food insecurity and the associated high cost of healthy foods increase
the risk of diabetes, obesity, and other related health aliments, as families try to stretch
their dollar by purchasing cheaper processed and less nutrient-dense foods, many of
which are laden with salt, fat, preservatives, and highly refined carbohydrates. Because
food insecurity is directly linked to increased health risks, communities may wish to
consider limiting the importation of unhealthy foods in their communities by passing
Band Council Resolutions (by-laws) and promoting healthy food consumption.
Previous First Nation food security studies have revealed the need for improved
assessment of household food insecurity within First Nations across Canada, and at the
very least, inclusion within Health Canada’s annual CCHS studies. By excluding First
Nation’s communities within their CCHS, Health Canada paints an inaccurate picture of
the state of food insecurity within Canada and amongst Canada’s most vulnerable
populations. This exclusion is indicative of the colonialist paradigm that permeates the
policies and tools available to make progress in this area. It is this thought paradigm that
must change, so that the accuracy and appropriateness of the tools can be improved.
6.2 Options and Solutions
An all-season road may be one of multiple layers of solutions that are required to increase
food security and food sovereignty within First Nation communities. Roads improve
predictable food and fuel delivery, and reduce shipping costs for market-foods and other
essential supplies; but roads are not the “silver-bullet”, and complementary programs are
required to reduce food insecurity. Furthermore, roads can have negative impacts on
traditional hunting and gathering areas and can gnaw at the fabric of community
132

wellness. One quarter of community participants identified an all-season road as their top
priority to increasing food access and availability. Building an all-season road is an
extremely costly endeavor, and more locally grown and community-led solutions may be
more viable, especially in the short term.
Country food programs have been shown to have a positive influence on food security
rates. Country food programs are also controlled and operated by the community, employ
community members, and promote traditional foods and culture. Therefore, country food
programs also increase food sovereignty by offering an alternative to commoditized
foods that are produced and transported by external companies, while retaining money
within the community. However, restrictive legislation preventing the use of wild meat
for school lunch and elder meal programs needs to be re-visited. Communities may wish
to investigate the potential for a regional federally or provincially registered meat
processing facility, which would allow the use of wild meat in meal programs, and would
also allow the sale of wild meat, should the communities wish to do so. The challenge is
creating policies that can be universally applied, but are still appropriate at the
community level.
There is also potential for traditional trading to take place between other First Nation
communities, where country foods may be traded for agricultural foods, providing
communities with more control over their food source and supporting the economic
development of First Nations.
Household gardens may offer some support to individual families; however, it is unlikely
that gardens will provide a significant reduction in food insecurity rates. That being said,
133

gardens have proven to help build community and reconnect the youth and Elders, while
concurrently improving physical fitness. This reiterates the need for multi-faceted
approaches that include social and culture and well as economic aspects.
It is recognized by First Nation communities that some form of market food will be
required, and that country foods alone will not be able to sustain communities due to the
growing population and reductions in wildlife quantity and quality. As such, solutions
must include interaction with the market-system. Developing cooperative stores within
the Island Lake communities and beyond could help to provide better access to affordable
foods by increasing purchasing power, while providing opportunity for employment and
control over the types of foods imported into the community. Money would also stay
within the community, allowing for re-investment to improve quality of life. The Island
Lake food costing results have revealed that community-run stores can be less expensive
than the large corporate-run Northern Store, and provide a viable option for consumers.
There needs to be greater awareness of the potential alternatives to the Northern Store
monopoly, and sharing of this knowledge between First Nation and Aboriginal
communities throughout Canada.
The solutions to improving food security and food sovereignty within First Nation
communities are multi-faceted. Successful programs and initiatives will come from
within the communities, as illustrated by the success of the country foods program,
instead of being handed down by governments. Additionally, many of these programs
suffer from the unpredictable nature of funding, which compromises the ability of the
programs to have long-term plans and reach eventual stability and self-sufficiency. The
134

Canadian and Provincial Governments need to prioritize and encourage community led
solutions and make the subsequent financial commitments required to begin to address
and implement them.
6.3 Conclusion
In the words of former Prime Minister Jean Crétien, Canada pledged as part of the Rome
Declaration on World Food Security, “to a world that was free from hunger, free from
want, with enough food for all” (Government of Canada, 1998). While Canada’s Charter
of Rights and Freedoms does not explicitly state that Canadians enjoy this right, Canada’s
acknowledgment of the Declaration and of the 1976 International Covenant on
Economic Social and Cultural Rights, The Convention on the Elimination of
Discrimination Against Women, and the Convention on the Rights of the Child, as well as
subsequent Federal progress reports on food security, illustrate Canada’s intentions,
especially abroad. Canada, a country which has strived to reduce hunger abroad, has
neglected the Aboriginal people of Canada and has failed to embrace its Fiduciary duty
and obligations, and to act with an ethical conscience in working to elevate hunger in
First Nation communities.
According to the United Nations Human Development Index, which measures indices
such as life expectancy, education, and adult literacy, First Nations people have a quality
of life ranked 134th internationally, among developing-world conditions (AANDC, 2013;
United Nations, 2007). Additionally, the Community Well Being Index for First Nations,
developed by AANDC, which measures education, employment, income, and housing,
135

revealed that Aboriginal communities represent 96 of the 100 unhealthiest Canadian
communities (AANDC, 2013).
The Government of Canada must sincerely address household food insecurity, hunger
and associated inequality, and work with haste to close the gap between First Nation
people and the general Canadian population. For ultimately,
“a lack of food security points to the deeper social ills we struggle to
contain” Gary Bloch, MD, Chair of the Ontario College of Family
Physicians (as quoted in Tarasuk, 2013))
136

REFERENCES Aboriginal Affairs and Northern Development Canada (AANDC). (n.d.(a)). 2011-2012 Report on Plans and Priorities: Demographic Description, Aboriginal Population Profile. Retrieved on August 2013 from http://www.gov.mb.ca/ana/pdf/apm2006.pdf Aboriginal Affairs and Northern Development Canada (AANDC). (n.d.(b)). Regional results of price surveys. Retrieved July 2013 from http://www.aadnc-aandc.gc.ca/eng/1100100035986/1100100035987 Aboriginal Affairs and Northern Development Canada (AANDC). (2013). Aboriginal Demographics and Well-Being. Retrieved September 2013 from http://www.aadnc-aandc.gc.ca/DAM/DAM-INTER-HQ-AI/STAGING/texte-text/rs_re_pubs_demograph_wellbeing_PDF_1358863272403_eng.pdf Aboriginal Affairs and Northern Development Canada (AANDC). (2013a). Internal audit report: Audit of nutrition north Canada. Retrieved October 2013 from http://www.aadnc-aandc.gc.ca/DAM/DAM-INTER-HQ-AEV/STAGING/texte-text/au_nn_1375886798629_eng.pdf Alberta Community/Public Health Nutritionists Food Security Subcommittee and Dietitians of Canada. (2008). Cost of Eating in Alberta, 2008. Retrieved on June 2013 from http://www.dietitians.ca/Downloadable-Content/Public/Alberta---Cost-of-Eating-2008.aspx Alberta Community/Public Health Nutritionists Food Security Subcommittee and Dietitians of Canada. (2008). Cost of Eating in Alberta, 2008. Amed, S., Dean, L., Panagiotopoulos, C., Seller, E., Hadjiyanakis, S., Laubscher, T., Dannenbaum, D., Shah, B., Booth, G., and Hamilton, J. (2010). Type 2 diabetes, medication-induced diabetes, and monogenic diabetes in Canadian children: A prospective national surveillance study. Diabetes Care, 33(4), 786-791. Arctic Co-operatives Limited. (n.d.) Retrieved September 2013 from http://www.arcticco-op.com Assembly of Manitoba Chiefs. (2006). Manitoba First Nation regional longitudinal health survey (RHS) report 2002/03. Retrieved August 2013 from http://amc.manitobachiefs.com/images/pdf/mb_fns_rhs_report_2002_03.pdf Bickel, G., Nord, M., Price, C., Hamilton, W., and Cook, J. (2000). Measuring food security in the United States. Guide to measuring household food security, revised 2000. United States Department of Agriculture, Alexandria VA. Retrieved November 2013 from http://www.fns.usda.gov/fsec/files/fsguide.pdf
137

Butler Walker, J., Kassi, N., Eamer, C. (2009). Food security in times of change. Retrieved on August 2013 from http://www.aicbr.ca/ourPriorities/foodSecurity/home Canadian Broadcasting Corporation (CBC). (2010, February 20). Nutrition North food subsidy program under fire. CBC News. Retrieved June 2013 from http://www.cbc.ca/news/canada/north/nutrition-north-food-subsidy-program-under-fire-1.1294032 Canadian Broadcasting Corporation (CBC). (2013a, May 1). Nutrition North changing how northern retailers do business. CBC News. Retrieved June 2013 from http://www.cbc.ca/news/canada/north/nutrition-north-changing-how-northern-retailers-do-business-1.1303757?cmp=rss Canadian Broadcasting Corporation (CBC). (2013b, July 30). Auditor General to review Nutrition North program. CBC News. Retrieved August 2013 from http://www.cbc.ca/news/canada/north/auditor-general-to-review-nutrition-north-program-1.1323254 Chan, L., Receveur, O., Sharp, D., Schwartz, H., Ing, A., Fediuk, K., Black, A., and Tikhonov, C. (2012). First Nations Food, Nutrition and Environment Study: Results from Manitoba, 2010. Prince George: University of Northern British Columbia. Retrieved on August 2013 from http://www.fnfnes.ca/docs/MB%20Reports/FNFNES%20Report-MB_WEB_rev.pdf Che, J. and Chen, J. (2001). Food insecurity in Canadian Households. Health Reports, 12(4), 11-22. Churchill, W. (1999). Struggle for the land: Native North American resistance to genocide, ecocide and colonization. Winnipeg, Manitoba: Arbiter Ring Publishers. Cohen, B. (2002). Community Food Assessment Toolkit. EFAN. USDA. Retrieved June 2013 from http://www.ers.usda.gov/media/327699/efan02013_1_.pdf Davis, B. and Tarasuk, V. (1994). Hunger in Canada. Agriculture and Human Values, 11(4), 50-57. Dietitians of Canada. (2007). The cost of eating in B.C. 2007: The bite nutritious food takes from the income pie. Retrieved August 2013 from http://www.dietitians.ca/Downloadable-Content/Public/BC_CostofEating_2007.aspx East Side Road Authority (ESRA). (2013). Transportation Challenges on the East Side. Retrieved June 2013 from http://www.eastsideroadauthority.mb.ca/vision-transportation.html Fédération des Coopératives du Nouveau-Québec (FCNQ). (n.d.). Retrieved November 2013 from http://www.fcnq.ca/webconcepteur/web/fcnq/en/nav/federation.html
138

Fieldhouse, P. and Thompson, S. (2012). Tackling food security issues in indigenous communities in Canada: The Manitoba experience. Nutrition & Dietetics, 69, 217-221 First Nations & Inuit Regional Health Survey National Steering Committee. (1999). First Nations & Inuit regional health survey. Retrieved August 2013 from http://www.rhs-ers.ca/sites/default/files/ENpdf/RHS_1997/rhs_1997_final_report.pdf First Nations Centre. (2005). First Nations regional longitudinal health survey (RHS) 2002/03. Retrieved August 2013 from http://www.rhs-ers.ca/sites/default/files/ENpdf/RHS_2002/rhs2002-03-technical_report.pdf First Nations Information Governance Centre (FNIGC). (2012). First Nations regional health survey (RHS) 2008/10: National report on adults, youth and children living in First Nation communities. Ottawa: FNIGC. Retrieved August 2013 from http://www.fnigc.ca/sites/default/files/First%20Nations%20Regional%20Health%20Survey%20(RHS)%202008-10%20-%20National%20Report.pdf Fisher, W.F. and Ponniah, T. (2003). Another world is possible: Popular alternatives to globalization at the world social forum. Fernwood Publishing, Nova Scotia. Flood, G. (2005, March 19). Cost of living driven up out here: transportation challenges force massive markup on goods. The Winnipeg Free Press, pp. A1. Flying Dust Cree Nation. (2013, November). Flying Dust Cree 8 Worker Coop Ltd. Presentation conducted at the Environmental Contaminants and Traditional Food Conference (Assembly of Manitoba Chiefs) on November 4 & 5, 2013, Winnipeg, MB. FOA (1996). World Food Summit: Rome declaration on world food security and world food summit plan of action. FAO: Special Advisers to the Director-General. Retrieved January 2013 from http://www.fao.org/docrep/003/w3613e/w3613e00.htm Four Arrows Regional Health Authority Inc. (FARHA). (2013). Wasagamach First Nation. Retrieved May 2013 from http://www.fourarrowsrha.ca/wasagamack-first-nation/ Four Arrows Regional Health Authority Inc. (FARHA). (2013). St. Theresa Point First Nation. Retrieved May 2013 from http://www.fourarrowsrha.ca/st-theresa-point-first-nation/ Four Arrows Regional Health Authority Inc. (FARHA). (2013). Garden Hill First Nation. Retrieved May 2013 from http://www.fourarrowsrha.ca/profiles/ Four Arrows Regional Health Authority Inc. (FARHA). (2013). Red Sucker Lake First Nation. Retrieved May 2013 from http://www.fourarrowsrha.ca/red-sucker-lake-first-nation/
139

Four Arrows Regional Health Authority Inc. (FARHA) (Producer). (2012). Chicken’s of the north [Video]. Retrieved on May 2013 from http://www.youtube.com/watch?v=giOmhPOSDo4 Glaser, B.G. and Strauss, A.L. (1967). The discovery of grounded theory: Strategies for qualitative research. New York: Aldine de Gruyter. Government of Canada. (1998). Canada’s Action Plan for Food Security. Retrieved August 2013 from http://www.agr.gc.ca/misb/fsec-seca/pdf/action_e.pdf Government of Canada, Agriculture and Agri-Food Canada. (2008). Canada’s fifth progress report on food security. Retrieved October 2013 from http://www4.agr.gc.ca/resources/prod/doc/misb/fsec-seca/pdf/1245790426228_rpt_5_e.pdf Government of Canada. (n.d.). Nutrition North Canada. Fact sheet: The Nutrition North Canada program. Retrieved May 2013 from http://www.nutritionnorthcanada.gc.ca/eng/1367932314461/1367932387670 Government of Canada, Nutrition North Canada. (n.d.(a)). Cost of revised northern food basket in 2011-2012. Retrieved July 2013 from http://www.nutritionnorthcanada.gc.ca/eng/1369313901161/1369313917620 Government of Canada, Nutrition North Canada. (n.d.(b)). Cost of the revised northern food basket in 2012-2013. Retrieved July 2013 from http://www.nutritionnorthcanada.gc.ca/eng/1369313792863/1369313809684 Government of Canada, Nutrition North Canada. (n.d.(c)). Compliance Reports 2011-2012. Retrieved November 2013 from http://www.nutritionnorthcanada.gc.ca/eng/1369314171405/1369314181554 Government of Manitoba, Healthy Child Committee of Cabinet. Northern Food Prices Steering Committee. (2003). Northern Food Prices Project Report. Retrieved February 2013 from http://www.gov.mb.ca/ana/food_prices/2003_northern_food_prices_report.pdf Health Canada. (2007). Income-related household food security in Canada, Canadian Community Health Survey Cycle 2.2, Nutrition. Ottawa, Health Canada. HC publication. No.4696. Retrieved January 2013 from http://www.hc-sc.gc.ca/fn-an/alt_formats/hpfb-dgpsa/pdf/surveill/income_food_sec-sec_alim-eng.pdf Health Canada (n.d.). Household Food Insecurity in Canada in 2007-2008: Key Statistics and Graphics. Retrieved October 2013 from http://www.hc-sc.gc.ca/fn-an/surveill/nutrition/commun/insecurit/key-stats-cles-2007-2008-eng.php#d
140
Health Canada. (2008). Questions and Answers on the 2008 National Nutritious Food Basket. Retrieved November 2013 from http://www.hc-sc.gc.ca/fn-an/surveill/basket-panier/qa-qr-eng.php Health Canada. (2011). Canadian Community Health Survey (CCHS) 2009-2010 Food Security Share Files. Ottawa, Health Canada. Indian and Northern Affairs Canada (INAC). (2003). Nutrition and food security in Kugaaruk ,Nunavut. Catalogue No. R2-265/2003E. Retrieved on August 2013 from https://www.aadnc-aandc.gc.ca/DAM/DAM-INTER-HQ/STAGING/texte-text/kg03_1100100035822_eng.pdf Indian and Northern Affairs Canada (INAC). (2007). The revised northern food basket. Retrieved April 2013 from http://publications.gc.ca/pub?id=317334&sl=0 Indian and Northern Affairs Canada. (2007a). Evaluation of the Income Assistance Program. Retrieved November 2013 from http://www.aadnc-aandc.gc.ca/DAM/DAM-INTER-HQ/STAGING/texte-text/eiap07_1100100011749_eng.pdf Indian and Northern Affairs Canada (INAC). (2009). Food mail review – interim report. Retrieved October 2013 from http://caid.ca/FoodMailIntRev031509.pdf International Planning Committee for Food Sovereignty. (2007). Declaration of Nyelini. Retrieved November 2013 from http://www.nyeleni.org/spip.php?article290 Kirkpatrick, S. and Tarasuk, V. (2008). Food insecurity in Canada - Considerations for monitoring. Canadian Journal of Public Health, 99(4), 324-327. Kitayan. (2013). Communities. Retrieved September 2013 from http://kitayan.ca/?page_id=45 Kuryk, D. (2003). Winter roads in Manitoba. Proceedings from CGU HS committee on river ice processes and the environment, 12th workshop on the hydraulics of ice covered rivers. Edmonton, AB. Retrieved May 2013 from http://cripe.civil.ualberta.ca/Downloads/12th_Workshop/Kuryk-2003.pdf LaDuke, W. (2002). The Winona LaDuke reader: A collection of essential writings. Penticton Indian Reserve: Theytus Books. Lawn, J. and Harvey, D. (2003). Nutrition and food security in Kugaaruk, Nunavut. Baseline survey for the food mail pilot project. Ottawa: Indian and Northern Affairs. Retrieved November 2013 from http://www.aadnc-aandc.gc.ca/DAM/DAM-INTER-HQ/STAGING/texte-text/kg03_1100100035822_eng.pdf Lawn, J. and Harvey, D. (2004). Nutrition and food security in Fort Severn, Ontario. Baseline survey for the food mail pilot project. Ottawa: Indian and Northern Affairs.
141

Retrieved November 2013 from http://publications.gc.ca/collections/Collection/R2-350-2004E.pdf Manitoba Department of Transportation and Government Services. (2003). Winter Roads in Manitoba. Retrieved June 2013 from http://cripe.civil.ualberta.ca/Downloads/12th_Workshop/Kuryk-2003.pdf Manitoba Hydro. (2003). Wuskwatim Generation and Transmission Projects Environmental Impact Statement. Manitoba Food Charter. (2009). Northern grocers forum report. Retrieved May 2013 from http://foodmattersmanitoba.ca/sites/default/files/Northern%20Grocers'%20Forums%20report.pdf Meade, B. (2011). Table 97-percent of household final consumption expenditures spent on food, alcohol beverages, and tobacco that were consumed at home by select countries, 2010. Retrieved August 2013 from http://www.google.ca/url?sa=t&rct=j&q=&esrc=s&frm=1&source=web&cd=4&ved=0CDoQFjAD&url=http%3A%2F%2Fwww.fooddialogues.com%2Fsites%2Fdefault%2Ffiles%2Ffact_data_link%2F2d44f5519bc0b7b38016a476e31fb6c6_0.xls&ei=uJQoUpa2KtLtqQGokYHQDg&usg=AFQjCNGjEThZRG9l1y_FcDiaG7fRVly27Q&bvm=bv.51773540,d.aWc National Aboriginal Health Organization (NAHO). (2004). Hunger in the Arctic: Food (in)security in Inuit communities, a discussion paper. Retrieved July 2013 from http://www.naho.ca/documents/it/2004_Inuit_Food_Security.pdf Natural Resources Institute (NRI), University of Manitoba. (2011). Harvesting hope: In northern Manitoba communities. [Video file]. Retrieved from http://home.cc.umanitoba.ca/~thompso4/harvestinghope_doc.html Rabson, M. (2010, November 3). Red Sucker Lake water woes boil over: Testing uncovers harmful bacteria in holding tanks. The Winnipeg Free Press, pp. A5. Rainville, B. and Brink, S. (2001). Food Insecurity in Canada. Ottawa: Human Resources Development Canada, Applied Research Branch. Retrieved November 2013 from http://publications.gc.ca/collections/Collection/MP32-29-01-2E.pdf Reading, C.L., and Wien, F. (2009). Health inequalities and social determinants of Aboriginal people’s health. Retrieved August 2013 from http://www.nccah-ccnsa.ca/docs/nccah%20reports/LoppieWien-2.pdf Rudolph, K. (2012). Close to the land: Connecting northern indigenous communities and southern farming communities through food sovereignty. (Master of Environment
142

Thesis). Retrieve November 2013 from MSpace Thesis Database at http://hdl.handle.net/1993/5231 Rudolph, K. and McLachlan, S. (2013). Seeking Indigenous food sovereignty: origins of and responses to the food crisis in northern Manitoba, Canada. Local Environment: The International Journal of Justice and Sustainability, (18)9, 1079-1098 Shragge, E. (2003). Activism and social change: Lessons for community and local organizing. Toronto, ON: University of Toronto Press. Socha, T.; Chambers, L.; Zahaf, M; Abraham, R.; Fiddler, T. (2011). Food availability, food store management, and food pricing in a northern First Nation community. International Journal of Humanities and Social Science, (1)11, 49-61 Social Planning Council of Winnipeg. (2012). Child and family poverty, 2012 report card. Campaign 2000 (Manitoba). Retrieved on August 2013 from http://www.spcw.mb.ca/files/4013/5414/7237/C2000_Child_Poverty_Report_Card-2012.pdf Statistics Canada. (2001a). 2001 Wasagamack, Manitoba. 2001 Community Profiles. 2001 Census. Retrieved November 2013 from http://www12.statcan.ca/english/Profil01/CP01/Details/Page.cfm?Lang=E&Geo1=CSD&Code1=4622800&Geo2=PR&Code2=46&Data=Count&SearchText=wasagamack&SearchType=Begins&SearchPR=01&B1=All&Custom= Statistics Canada. (2001b). 2001 St. Theresa Point, Manitoba. 2001 Community Profiles. 2001 Census. Retrieved November 2013 from http://www12.statcan.ca/english/Profil01/CP01/Details/Page.cfm?Lang=E&Geo1=CSD&Code1=4622801&Geo2=PR&Code2=46&Data=Count&SearchText=st.%20theresa%20point&SearchType=Begins&SearchPR=01&B1=All&Custom Statistics Canada. (2001c). 2001 Garden Hill, Manitoba. 2001 Community Profiles. 2001 Census. Retrieved November 2013 from http://www12.statcan.ca/english/Profil01/CP01/Details/Page.cfm?Lang=E&Geo1=CSD&Code1=4622048&Geo2=PR&Code2=46&Data=Count&SearchText=garden%20Hill&SearchType=Begins&SearchPR=01&B1=All&Custom= Statistics Canada. (2001d). 2001 Red Sucker Lake, Manitoba. 2001 Community Profiles. 2001 Census. Retrieved November 2013 from http://www12.statcan.ca/english/profil01/CP01/Details/Page.cfm?Lang=E&Geo1=CSD&Code1=4622056&Geo2=PR&Code2=46&Data=Count&SearchText=red%20sucker%20lake&SearchType=Begins&SearchPR=01&B1=All&Custom= Statistics Canada. (2007a). 2006 Wasagamach, Manitoba (Code 4622800)(table). 2006 Community Profiles. 2006 Census. Statistics Catalogue no. 92-591-XWE. Ottawa. Released March 13, 2007. Retrieved May 2013 from http://www12.statcan.gc.ca/census-
143

recensement/2006/dp-pd/prof/92-591/details/page.cfm?Lang=E&Geo1=CSD&Code1=4622800&Geo2=PR&Code2=46&Data=Count&SearchText=Wasagamack&SearchType=Begins&SearchPR=01&B1=All&GeoLevel=PR&GeoCode=4622800 Statistics Canada. (2007b). St. Theresa Point, Manitoba (Code 4622801)(table). 2006 Community Profiles. 2006 Census. Statistics Canada Catalogue no. 92-591-XWE. Ottawa. Released March 13, 2007. Retrieved May 2013 from http://www12.statcan.gc.ca/census-recensement/2006/dp-pd/prof/92-591/details/page.cfm?Lang=E&Geo1=CSD&Code1=4622801&Geo2=PR&Code2=46&Data=Count&SearchText=St.%20Theresa%20Point&SearchType=Begins&SearchPR=01&B1=All&GeoLevel=PR&GeoCode=4622801 Statistics Canada. (2007c). Garden Hill First Nation, Manitoba (Code 4622048)(table). 2006 Community Profiles. 2006 Census. Statistics Canada Catalogue no. 92-591-XWE. Ottawa. Released March 13, 2007. Retrieved May 2013 from http://www12.statcan.gc.ca/census-recensement/2006/dp-pd/prof/92-591/details/page.cfm?Lang=E&Geo1=CSD&Code1=4622048&Geo2=PR&Code2=46&Data=Count&SearchText=Garden%20Hill%20First%20Nation&SearchType=Begins&SearchPR=01&B1=All&GeoLevel=PR&GeoCode=4622048 Statistics Canada. (2007d). Red Sucker Lake 1976, Manitoba (Code 4622056)(table). 2006 Community Profiles. 2006 Census. Statistics Canada Catalogue no. 92-591-XWE. Ottawa. Released March 13, 2007. Retrieved May 2013 from http://www12.statcan.gc.ca/census-recensement/2006/dp-pd/prof/92-591/details/page.cfm?Lang=E&Geo1=CSD&Code1=4622056&Geo2=PR&Code2=46&Data=Count&SearchText=Red%20Sucker%20Lake%201976&SearchType=Begins&SearchPR=01&B1=All&GeoLevel=PR&GeoCode=4622056 Statistics Canada. (2007e). Low income cut-offs for 2006 and low income measures for 2005. Catalogue no. 75F0002MIE-No. 004. Retrieved August 2013 from http://www.statcan.gc.ca/pub/75f0002m/75f0002m2007004-eng.pdf Statistics Canada. (2008). Low income cut-offs for 2007 and low income measures for 2006, 2006/2007. Catalogue no. 75F0002M, no. 004. Retrieved August 2013 from http://www.statcan.gc.ca/pub/75f0002m/75f0002m2008004-eng.pdf Statistics Canada. (2010). Income in Canada, 2010. Retrieved on August 2013 from http://www.statcan.gc.ca/pub/75-202-x/75-202-x2010000-eng.htm Statistics Canada. (2012a). Wasagamack, Manitoba (Code 4622800) and Division No. 22, Manitoba (Code 4622) (table). Census Profile. 2011 Census. Statistics Canada Catalogue no. 98-316-XWE. Ottawa. Released October 24, 2012. Retrieved August 2013 from http://www12.statcan.gc.ca/census-recensement/2011/dp-pd/prof/index.cfm?Lang=E
144

Statistics Canada. (2012b). St. Theresa Point, Manitoba (Code 4622801) and Division No. 22, Manitoba (Code 4622) (table). Census Profile. 2011 Census. Statistics Canada Catalogue no. 98-316-XWE. Ottawa. Released October 24, 2012. Retrieved August 2013 from http://www12.statcan.gc.ca/census-recensement/2011/dp-pd/prof/index.cfm?Lang=E Statistics Canada. (2012c). Garden Hill First Nation, Manitoba (Code 4622048) and Division No. 22, Manitoba (Code 4622) (table). Census Profile. 2011 Census. Statistics Canada Catalogue no. 98-316-XWE. Ottawa. Released October 24, 2012. Retrieved August 2013 from http://www12.statcan.gc.ca/census-recensement/2011/dp-pd/prof/index.cfm?Lang=E Statistics Canada. (2012d). Red Sucker Lake 1976, Manitoba (Code 4622056) and Division No. 22, Manitoba (Code 4622) (table). Census Profile. 2011 Census. Statistics Canada Catalogue no. 98-316-XWE. Ottawa. Released October 24, 2012. Retrieved August 2013 from http://www12.statcan.gc.ca/census-recensement/2011/dp-pd/prof/index.cfm?Lang=E Statistics Canada. (2012e). Winnipeg, Manitoba (Code 4611040) and Division No. 11, Manitoba (Code 4611) (table). Census Profile. 2011 Census. Statistics Canada Catalogue no. 98-316-XWE. Ottawa. Released October 24, 2012. Retrieved August 2013 from http://www12.statcan.gc.ca/census-recensement/2011/dp-pd/prof/index.cfm?Lang=E Statistics Canada. (2012f). Survey of Household Spending, 2010. Released April 25, 2012 in The Daily. Retrieved August 2013 from http://www.statcan.gc.ca/daily-quotidien/120425/dq120425a-eng.pdf Statistics Canada. (2012g). User Guide for the Survey of Household Spending, 2010. Catalogue no. 62F0026M, no.1. Retrieved August 2013 from http://www.statcan.gc.ca/pub/62f0026m/62f0026m2012001-eng.pdf Statistics Canada. (2013). Low Income Lines, 2011 to 2012. Catalogue no. 75F00002M, no. 002. Retrieved August 2013 from http://www.statcan.gc.ca/pub/75f0002m/75f0002m2013002-eng.pdf Tarasuk, V. (2001). Discussion paper on household and individual food insecurity. Retrieved on June 2013 from http://www.hsfspark.com/sites/default/files/Tarasuk-%20Discussion%20paper%20on%20food%20security.pdf Tarasuk, V. (2005). Household food insecurity in Canada. Topics in Clinical Nutrition, 20(4), 299-312. Tarasuk, V., Mitchell, A., and Dachner, N. Research to identify policy options to reduce food insecurity (PROOF). (2013). Household Food Insecurity in Canada 2011. Retrieved
145
August 2013 from http://nutritionalsciences.lamp.utoronto.ca/wp-content/uploads/2013/07/Household-Food-Insecurity-in-Canada-2011.pdf The Manitoba Public Health Act (C.C.S.M. c. P210) (2006), Retrieved September 2013 from http://web2.gov.mb.ca/laws/statutes/ccsm/p210e.php The Manitoba Public Health Act: Food and Food Handling Establishment Regulation (C.C.S.M. c. P210). (1988). Retrieved September 2013 from http://web2.gov.mb.ca/laws/regs/pdf/p210-339.88r.pdf The Manitoba Wildlife Act. (C.C.S.M. c. W130). (2010). Retrieved September 2013 from http://web2.gov.mb.ca/laws/statutes/ccsm/w130e.php The North West Company. (2011). Changes in the north means cheaper food [Press Release]. Retrieved November 2013 from http://www.northwest.ca/content/news_releases/Press%20Release%20-%20Changes%20in%20the%20north%20means%20cheaper%20food.pdf The North West Company. (n.d.). The North West Company update on the success of the Nutrition North Canada (NNC) program in the communities we serve [Press Release]. Retrieved November 2013 from http://www.northernstores.ca/nnc/2013/Fall%20Update%20on%20NNC%20in%20NWC%20Markets.pdf Thompson, S. (2004). Sustainability and vulnerability: Aboriginal arctic food security in a toxic world. In F. Berkes, A. Diduck, H. Fast, R. Huebert, & M. Manseau (Eds): Integrated management, complexity and diversity of resource use: Responding and adapting to change (pp. 47-69). Calgary: University of Calgary Press. Thompson, S., Gulrukh, A., and Wong, K. (2010). Is healthy food on the table in northern Manitoba? Evaluating northern healthy foods initiative for sustainability and food access. Winnipeg, MB: Natural Resources Institute, University of Manitoba. Thompson, S., Gulrukh, A., Ballard, M., Beardy, B., Islam, D., Lozeznik, V., and Wong, K. (2011). Is community economic development putting healthy food on the table? Food sovereignty in Northern Manitoba's Aboriginal communities. The Journal of Aboriginal Economic Development, 7(2), 14-39. Thompson, S., Kamal, A., Alam, M., Wiebe, J. (2012). Community development to feed the family in northern Manitoba communities: Evaluating food activities based on their food sovereignty, food security, and sustainable livelihood outcomes. Canadian Journal of Nonprofit and Social Economy Research, 3(2), 43-66. Tonn, N. (2011). Food insecurity and self-reported pysco-social health status in Manitoba first nation communities: Results from the Manitoba first nations regional
146

longitudinal health survey 2002/2003. (Master of Science Thesis). Retrieve January 2013 from MSpace Thesis Database at http://hdl.handle.net/1993/5061 United Nations. (n.d.). Water. Retrieved September 2013 from http://www.un.org/en/globalissues/water/ United Nations. (2007). Human Development Report 2007/2008. Retrieved November 2013 from http://hdr.undp.org/en/media/HDR_20072008_EN_Complete.pdf United Nations. (2012). Report of the special rapporteur on the right to food, Oliver De Schutter. Addendum: Mission to Canada. Retrieved October 2013 from http://www.ohchr.org/Documents/HRBodies/HRCouncil/RegularSession/Session22/AHRC2250Add.1_English.PDF Vozoris, N. and Tarasuk, V. (2003). Household food insufficiency is associated with poorer health. The Journal of Nutrition, 133(1), 120-126. Willows, N.D., Veugelers, P., Raine, K., and Kuhle, S. (2008). Prevalence and sociodemographic risk factors related to household food security in Aboriginal peoples in Canada. Public Health Nutrition, 12(8), 1150-1156. Willows, N.D. (2005). Determinants of healthy eating in Aboriginal Peoples in Canada: The current state of knowledge and research gaps. Canadian Journal of Public Health, 93, 32-36. Winnipeg Free Press. (2010). No running water. [Video File]. Retrieved on August 2013 from www.winnipegfreepress.com/no-running-water/video Winnipeg Regional Health Authority (WRHA). (2012). The cost of eating according to the National Food Basket in Manitoba, May 2011. Retrieved May 2013 from http://www.wrha.mb.ca/extranet/nutrition/files/Professionals_Reports_FoodBasketReport.pdf Winnipeg Regional Health Authority (WRHA). (2012). Dealing with diabetes. WAVE: Winnipeg health and wellness magazine, 4(5), 26.35. Retrieved October 2013 from http://www.wrha.mb.ca/wave/2012/09/files/WaveFull-1209.pdf World Health Organization (WHO). (n.d.). Food Security. Retrieved July 2013 from http://www.who.int/trade/glossary/story028/en/ World Health Organization (WHO). (2003). Social determinants of health: The solid facts, 2nd edition. Retrieved May 2013 from http://www.euro.who.int/__data/assets/pdf_file/0005/98438/e81384.pdf Young, T.K. (2000). Type 2 diabetes mellitus in Canada’s First Nations: status of an epidemic in progress. Canadian Medical Association Journal, 163(5), 561-566.
147

APPENDIX A
Revised Northern Food Basket 67-Item Food List and Volumes

Revised Northern Food Basket (2007) for a family of four for one week
Category Perishables Non-Perishables Dairy Products 2% Milk, fresh or UHT 4.76 L Evaporated 2% milk 1.58 L (Total 15.35 L or 9.2 kg) Mozzarella cheese 0.485 kg Skim milk powder 0.09 kg
Processed cheese slices 0.385 kg Yogurt 1.67 kg Eggs Large eggs 8 Meat Chicken drumsticks 2.68 kg Canned pink salmon 0.27 kg (Total 6.7 kg) Pork chops, loin centre-cut 1.21 kg Canned sardines in soya oil 0.27 kg Ground beef, lean 1.34 kg Canned ham 0.2 kg T-bone steak 0.47 kg Sliced ham 0.135 kg Frozen fish sticks 0.135 kg Meat Bologna 0.06 kg Canned pork-based luncheon meat 0.05 kg Alternatives Wieners 0.1 kg Canned corn beef 0.04 kg (Total 1 kg) Peanut butter 0.09 kg Canned beans with pork 0.29 L Canned beef stew 0.18 kg Canned spaghetti sauce with meat 0.155 L Grain products Bead, enriched white 0.66 kg Flour, all purpose 1.92 kg (Total 5.5 kg) Bread, 100% whole wheat 0.66 kg Pilot biscuts 0.275 kg Macaroni or spaghetti 0.385 kg Rice, long-grained parboiled white 0.33nkg Rolled oats 0.275 kg Corn flakes 0.44 kg Macaroni and cheese dinner 0.55 kg Citrus Fruit and Oranges 1.23 kg Apple juice, Tetrapak 0.88 L Tomatoes Apple juice, frozen 0.033 L Orange juice, Tetrapak 0.375 L (Total 4.4 kg) Orange juice, frozen 0.282 L Canned whole tomatoes 0.215 L Canned tomato sauce 0.3 L Other Fruit Apples 4.38 kg Canned fruit cocktail in juice 0.855 L (Total 9.95 kg) Bananas 3.58 kg Canned peaches in juice 0.285 L Grape 0.5 kg Canned pineapple in juice 0.285 L Potatoes Fresh potatoes 3 kg Instant potato flakes 0.22 kg (Total 3.7 kg) Frozen French fries 0.48 kg Other Vegetables Carrots 2 kg Canned green peas 0.9 L (Total 8.7 kg) Onions 0.695 kg Canned kernel corn 1.09 L Cabbage 0.52 kg Canned green beans 0.315 L Turnips 0.35 kg Canned carrots 0.325 L Frozen broccoli 0.695 kg Canned mixed vegetables 0.545 L Frozen carrots 0.26 kg Frozen corn 0.26 kg Frozen mixed vegetables 1.74 kg Oils and Fats Margarine, non-
hydrogenated 0.715 kg Canola oil 0.185 L
Butter 0.065 kg Lard 0.105 kg Sugar Sugar, white 0.6 kg (Total 600 g) Miscellaneous 5% added to cost Note: The foods in the basket weigh approximately 52 kg in total.

RNFB NNFB RNFB NNFBItem Item Item Item
DairyChedder Cheese Yes Yes Apple Juice Yes YesProcessed Cheese slices Yes Yes Apples Yes YesMilk Yes Yes Bananas Yes YesYogurt Yes Yes Cantaloupe No YesMozarella cheese Yes Yes Tomato, fresh No YesEvaporated milk Yes No Tomato, canned whole Yes YesSkim milk powder Yes No Raisins No Yes
Dairy Total Weight 9.2 kg 22.06 kg Pears, fresh No YesPeaches, canned Yes Yes
Eggs Yes Yes Orange juice Yes YesEgg Total Weight 0.45 kg 0.78 kg Oranges Yes Yes
Grapes Yes YesBaked beans, canned Yes Yes Strawberries, frozen No YesLean Ground Beef Yes Yes Tomato juice No YesBeef Roast No Yes Tomato sauce Yes NoBeef Steak Yes Yes Fruit cocktail, canned Yes NoChicken Legs Yes Yes Pineapple, canned Yes NoFish, frozen Yes Yes Broccoli, fresh No YesSalmon, canned Yes Yes Broccoli, frozen Yes NoTuna, canned No Yes Cabbage Yes YesSardines Yes No Carrots, Fresh Yes YesPork chops Yes Yes Carrots, canned Yes NoHam, sliced Yes Yes Carrots, frozens Yes NoHam, canned Yes No Celery No YesPeanuts No Yes Corn, canned Yes YesPeanut butter Yes Yes Corn, frozen Yes NoLentils, dry No Yes Green pepper No YesBolonga Yes No Iceberg lettuce No YesWieners Yes No Mixed frozen vegetables Yes YesCanned pork-based luncheon meat Yes No Mixed vegetables, canned Yes NoCanned corned beef Yes No Mushrooms No YesCanned beef stew Yes No Onions Yes YesCanned spaghetti sauce with meat Yes No Peas, frozen No Yes
Meat and Alternatives Total Weight 7.7 kg 6.49 kg Peas, canned Yes NoInstant potato flakes Yes No
Bread, white Yes Yes Potatoes Yes YesBread, whole wheat Yes Yes French fries, frozen Yes NoBuns No Yes Romaine lettuce No YesCorn Flakes Yes Yes Rutabaga/turnip Yes YesWheat Squares No Yes String beans, frozen Yes YesCrackers/pilot biscuts Yes Yes Sweet potatoes No YesOatmeal Yes Yes Cucumber No YesPasta Yes Yes Fruits and Vegetables Total Weight 26.75 kg 22.06 kgPita bread, whole wheat No YesRice Yes Yes Plain cookies No YesFlour Yes No Sugar Yes NoMacaroni and cheese dinner Yes No Sugar Total Weight 0.6 kg N.A.
Grains Total Weight 5.5 kg 5.79 kg Miscellaneous 5% 5%
Canola Oil Yes YesSalad dressing, Italian No YesMargarine Yes Yes RNFB NNFBMayonnaise No Yes 52 kg 59 kgLard Yes NoButter Yes No
Fats and Oils Total Weight 1.05 kg 1.37 kg
Fats and Oils
Total Basket Weight
Compairson of Food Items Included within theRevised Northern Food Basket (RNFB) and National Nutritious Food Basket (NNFB)
Grains
Fruits and Vegetables
Eggs
Meat and Alternatives
Sugar
Category and Food Items Category and Food Items

APPENDIX B
Revised Northern Food Basket Price Selection Procedure
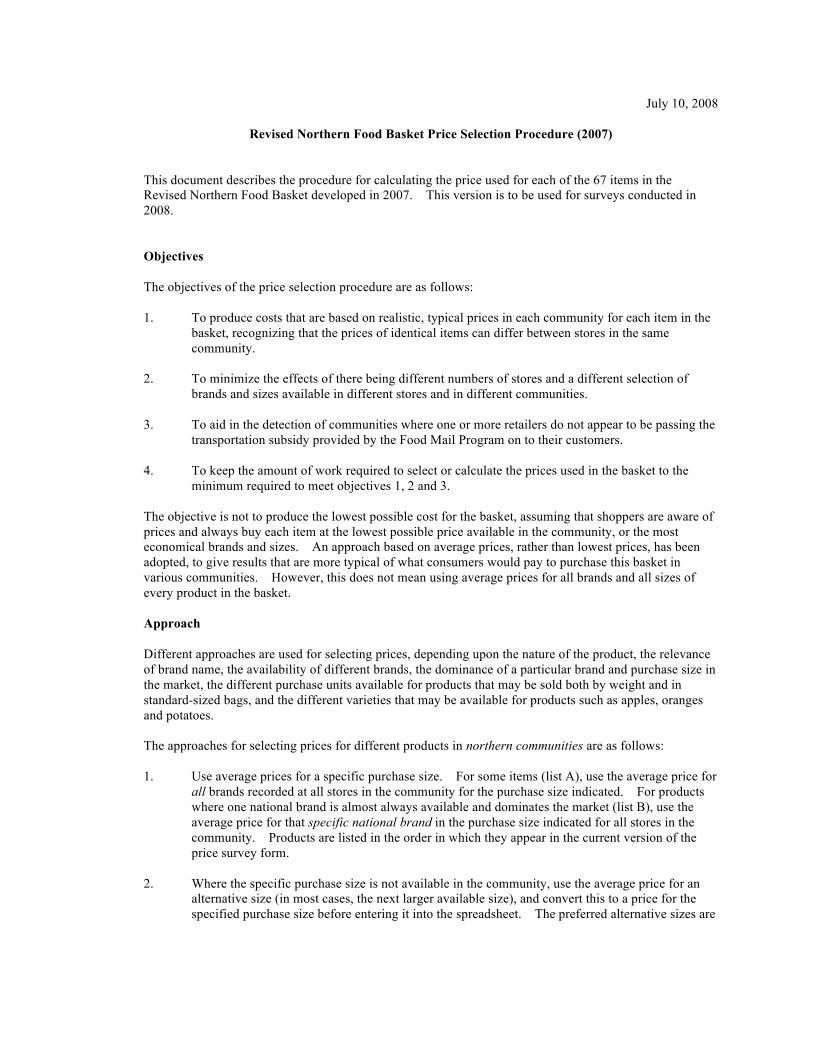
July 10, 2008
Revised Northern Food Basket Price Selection Procedure (2007) This document describes the procedure for calculating the price used for each of the 67 items in the Revised Northern Food Basket developed in 2007. This version is to be used for surveys conducted in 2008. Objectives The objectives of the price selection procedure are as follows: 1. To produce costs that are based on realistic, typical prices in each community for each item in the
basket, recognizing that the prices of identical items can differ between stores in the same community.
2. To minimize the effects of there being different numbers of stores and a different selection of
brands and sizes available in different stores and in different communities. 3. To aid in the detection of communities where one or more retailers do not appear to be passing the
transportation subsidy provided by the Food Mail Program on to their customers. 4. To keep the amount of work required to select or calculate the prices used in the basket to the
minimum required to meet objectives 1, 2 and 3. The objective is not to produce the lowest possible cost for the basket, assuming that shoppers are aware of prices and always buy each item at the lowest possible price available in the community, or the most economical brands and sizes. An approach based on average prices, rather than lowest prices, has been adopted, to give results that are more typical of what consumers would pay to purchase this basket in various communities. However, this does not mean using average prices for all brands and all sizes of every product in the basket. Approach Different approaches are used for selecting prices, depending upon the nature of the product, the relevance of brand name, the availability of different brands, the dominance of a particular brand and purchase size in the market, the different purchase units available for products that may be sold both by weight and in standard-sized bags, and the different varieties that may be available for products such as apples, oranges and potatoes. The approaches for selecting prices for different products in northern communities are as follows: 1. Use average prices for a specific purchase size. For some items (list A), use the average price for
all brands recorded at all stores in the community for the purchase size indicated. For products where one national brand is almost always available and dominates the market (list B), use the average price for that specific national brand in the purchase size indicated for all stores in the community. Products are listed in the order in which they appear in the current version of the price survey form.
2. Where the specific purchase size is not available in the community, use the average price for an
alternative size (in most cases, the next larger available size), and convert this to a price for the specified purchase size before entering it into the spreadsheet. The preferred alternative sizes are

shown in lists A and B. If the preferred alternative size is not available, substitute other sizes. Under no circumstances should scalars or purchase units be changed on the spreadsheet.
3. For products where one national brand was specified (list B) but was not available in the
community in the specified purchase size, use the average price for all other national brands available in the community in the specified size. If no national brands are available, use store brands. If the product was not available in the specified size for any brand, use the average price for the specified brand in an alternative size, if available. Otherwise, use the average price for all other brands available in an alternative size.
4. Special procedures are to be used for certain products (see list C). 5. Enter the number of price quotes from the community that were used to calculate the price for
each product on the spreadsheet in column K. In southern communities, use the same procedure, but based on the prices in one supermarket. Where a product in the basket is not available at that supermarket, or is not available in the specified size, an effort should be made to obtain a price from another supermarket. Our practice in recent years has been to survey in only one store in Whitehorse, Val-d’Or, Timmins and most large southern cities (Winnipeg, Ottawa, Gatineau, Montréal, Edmonton) but to survey in all stores in other entry points: Yellowknife (i.e., at both the co-op and an Extra Foods store since 2005), Happy Valley - Goose Bay, Churchill (which now has only one store), Thompson, Inuvik and St. Anthony. We have normally conducted surveys in two stores in St. John’s, but used the results from only one store for our published data series. In some years, surveys were also conducted in two stores in Timmins. In the future, it would be preferable to conduct surveys in two supermarkets in all southern cities where we survey and to use average prices from these stores, as we will do for northern communities, to ensure that results are typical of southern prices and that we can minimize the amount of substitution of sizes (and of brands, where this is a factor). However, this may not be possible, because of the additional time required. A test in a number of southern cities could determine whether this makes enough difference in the results to justify the additional time and expense of surveying in more than one supermarket in these cities on an ongoing basis. Stores to include In northern communities, all grocery stores and other stores (regardless of their name) that sell a wide variety of food are normally to be included in the price selection. However, in certain circumstances, convenience stores that sell a very limited range of perishable food, have very high prices, are likely to have a very small share of the local market, or are only open in the afternoons and evenings, will be excluded from the survey results, even if a price survey has been conducted there. Specials Special prices should be used, including those in northern communities where only regular prices were used in the original NFB. If the only price or prices used for a particular product are special prices, put “special” in column I on the spreadsheet. Prices for Multiples Occasionally, stores have different unit prices when a customer purchases more than a certain quantity of an item. The prices for multiples may be higher or lower than the unit price for a customer purchasing less than a specified quantity of that item.

Prices for multiples should not be used, even if the quantities required to be purchased to get the lower price are reasonable amounts to be purchased at one time (e.g., three cans of corn or loaves of bread), and not case lots. Where customers can buy only a certain number of units at a low price (e.g., a limit of one per customer) and have to pay more if more units are purchased, the low price should still be used. Out of Stock Items Prices for items that are out of stock at the time of the survey should be included in the calculation only if the item is not available anywhere in the community. Imputed Prices For items which are not available in the community in any brand or size, prices must be imputed using the most appropriate method under the circumstances (for example, a price from another community, from another recent survey in the same community, or by applying the ratio of prices between similar products in another community to the price of one of those products in the community where a price must be imputed). The exact procedure should be documented. When prices are imputed, the word “imputed” should be entered in column I on the spreadsheet in the row corresponding to the item concerned, and the imputation method entered at the bottom of the relevant page. In some cases, similar products that are likely to be priced the same as a missing product can be used when the item was not available (for example, whole evaporated milk when 2% is not available). Prices for these substitutes are not considered to be “imputed,” but details of the product substituted should be entered in column J on the spreadsheet. Documentation of Prices Selected When prices are selected using sizes which are not the “preferred” sizes (or “preferred” brands, for items in List B), the relevant size and brand information should be recorded in column J of the spreadsheet, in the row corresponding to the item concerned. This step facilitates checking and analysis of the results, without having to search through the price survey forms to see whether unusual results reflect “unusual” brands or sizes.

List A Use the average price for all national and store brands in a specified size for these products: Where a size range is specified, or where a different size must be substituted, prices must be converted to a price for the purchase unit indicated on the pricing spreadsheet.
Product
Size
Alternative size
Ham, sliced1
175 g
375 g
Bologna, beef and pork, sliced2
175 g
375 g
Wieners, beef and pork3
450 g
Fish sticks4
700 g
350 g
Frozen French fries5
900 g - 1 kg
750 g
Frozen corn
1 kg
Use the closest smaller size for these products.
Frozen carrots6
1 kg
Frozen mixed vegetables (corn, peas, carrots, green beans)7
1 kg
Frozen broccoli8
1 kg
1 Exclude Black Forest ham unless this is the only type available in the community.
2 Use all beef bologna only if no regular (beef and pork) bologna is available in the community.
3 Use all beef wieners only if no regular (beef and pork) wieners are available in the community. Exclude prices for barbecue style wieners, unless this is the only type available in the community.
4 Use the average price for 700 g packages of frozen fish sticks made from a mixture of minced fish. Fish sticks in a 700 g package are made from a mixture of minced fish, while those in 350 g packages are normally from one species. Fish “krisps”, fish cakes and similar products made from a mixture of minced fish should be considered to be the equivalent of fish sticks, and should be used if no “fish sticks” made from a mixture of minced fish are available. If no fish sticks, fish “krisps” or fish cakes made from a mixture of minced fish are available, substitute, in order of preference, fish sticks made from one species of fish, plain fish fillets, and fish in batter.
5 For frozen French fries, corn, carrots, mixed vegetables and broccoli, include prices for B grade brands.
6 If no frozen carrots are available, substitute peas and carrots, or frozen mixed vegetables with carrots if no peas and carrots are available.
7 If no frozen mixed vegetables are available in the 1 kg size, use frozen peas and carrots.
8 If no frozen broccoli is available, use frozen mixed vegetables containing broccoli.

Product
Size
Alternative size
Frozen apple juice
341 - 355 ml
Frozen orange juice
341 - 355 ml
Mozzarella cheese9
200 - 227 g
300 - 340 g
Process cheese slices10
500 g
250 g
Fruit yogurt
175 g
150 g
Canned fruit cocktail with juice11
398 ml
540 ml
Canned peaches with juice
398 ml
540 ml
Canned pineapple with juice12
398 ml
540 ml
Canned peas
398 ml
540 ml
Canned corn
341 ml
540 ml
Canned carrots
398 ml
540 ml
Canned green beans13
398 ml
540 ml
Canned tomatoes
540 ml
796 ml
Canned mixed vegetables
398 ml
540 ml
Canned tomato sauce14
398 ml
Apple juice, Tetra Pak15
960 ml - 1 L
1.36 L canned
Orange juice, Tetra Pak16
960 ml - 1 L
9 Do not include shredded unless this is the only type available in the community.
10 Do not include Kraft Extra Cheddar slices unless these are the only cheese slices available in any size in the community.
11 Include prices for chunky mixed fruit in juice.
12 Use chunks or crushed only if no sliced pineapple is available.
13 Include cut, whole and French style.
14 Include Italian.
15 For apple juice in Tetra Paks, prices for 960 ml must first be converted to a price for 1 L, and then combined with prices for 1 L Tetra Paks.
16 For orange juice in Tetra Paks, prices for 960 ml must first be converted to a price for 1 L, and then combined with prices for 1 L Tetra Paks.
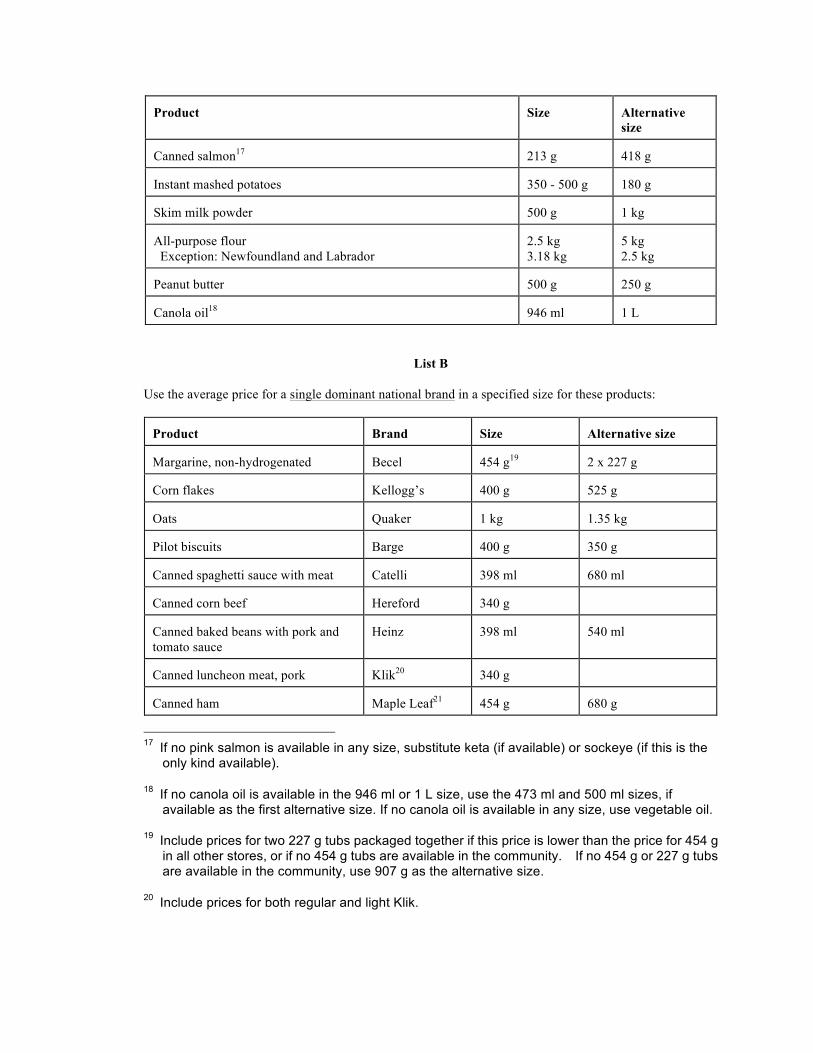
Product
Size
Alternative size
Canned salmon17
213 g
418 g
Instant mashed potatoes
350 - 500 g
180 g
Skim milk powder
500 g
1 kg
All-purpose flour Exception: Newfoundland and Labrador
2.5 kg 3.18 kg
5 kg 2.5 kg
Peanut butter
500 g
250 g
Canola oil18
946 ml
1 L
List B Use the average price for a single dominant national brand in a specified size for these products:
Product
Brand
Size
Alternative size
Margarine, non-hydrogenated
Becel
454 g19
2 x 227 g
Corn flakes
Kellogg’s
400 g
525 g
Oats
Quaker
1 kg
1.35 kg
Pilot biscuits
Barge
400 g
350 g
Canned spaghetti sauce with meat
Catelli
398 ml
680 ml
Canned corn beef
Hereford
340 g
Canned baked beans with pork and tomato sauce
Heinz
398 ml
540 ml
Canned luncheon meat, pork
Klik20
340 g
Canned ham
Maple Leaf21
454 g
680 g
17 If no pink salmon is available in any size, substitute keta (if available) or sockeye (if this is the
only kind available).
18 If no canola oil is available in the 946 ml or 1 L size, use the 473 ml and 500 ml sizes, if available as the first alternative size. If no canola oil is available in any size, use vegetable oil.
19 Include prices for two 227 g tubs packaged together if this price is lower than the price for 454 g in all other stores, or if no 454 g tubs are available in the community. If no 454 g or 227 g tubs are available in the community, use 907 g as the alternative size.
20 Include prices for both regular and light Klik.
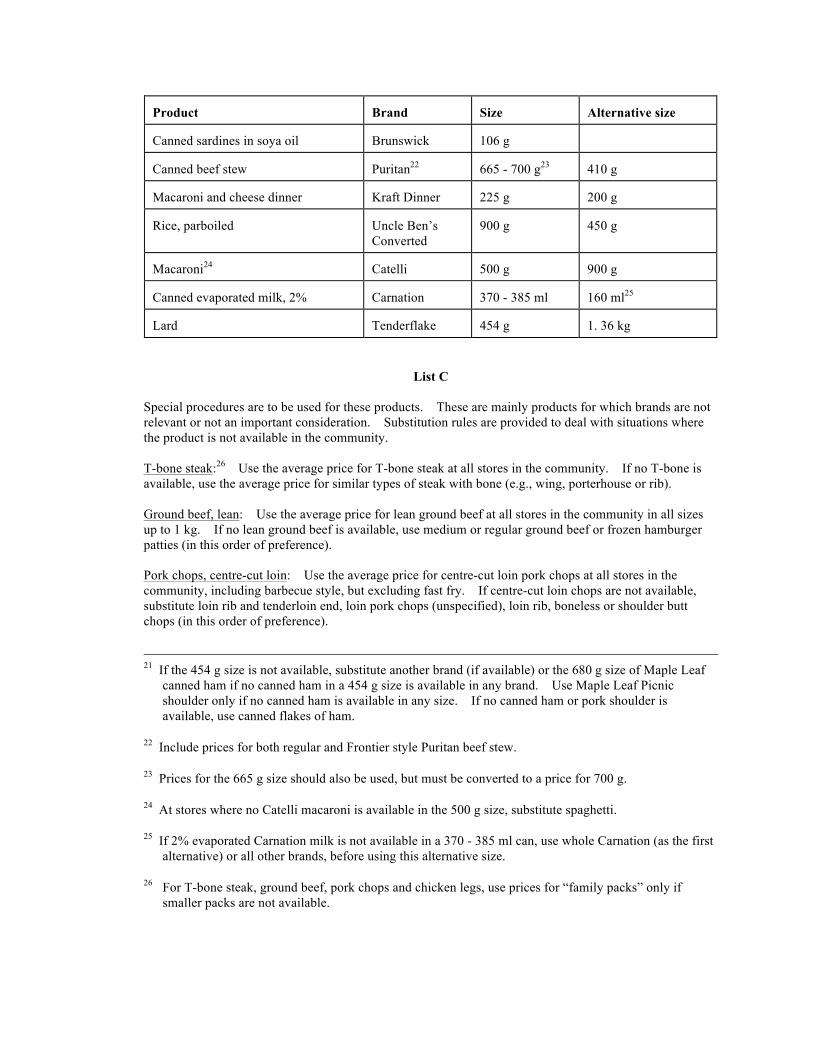
Product
Brand
Size
Alternative size
Canned sardines in soya oil
Brunswick
106 g
Canned beef stew
Puritan22
665 - 700 g23
410 g
Macaroni and cheese dinner
Kraft Dinner
225 g
200 g
Rice, parboiled
Uncle Ben’s Converted
900 g
450 g
Macaroni24
Catelli
500 g
900 g
Canned evaporated milk, 2%
Carnation
370 - 385 ml
160 ml25
Lard
Tenderflake
454 g
1. 36 kg
List C Special procedures are to be used for these products. These are mainly products for which brands are not relevant or not an important consideration. Substitution rules are provided to deal with situations where the product is not available in the community. T-bone steak:26 Use the average price for T-bone steak at all stores in the community. If no T-bone is available, use the average price for similar types of steak with bone (e.g., wing, porterhouse or rib). Ground beef, lean: Use the average price for lean ground beef at all stores in the community in all sizes up to 1 kg. If no lean ground beef is available, use medium or regular ground beef or frozen hamburger patties (in this order of preference). Pork chops, centre-cut loin: Use the average price for centre-cut loin pork chops at all stores in the community, including barbecue style, but excluding fast fry. If centre-cut loin chops are not available, substitute loin rib and tenderloin end, loin pork chops (unspecified), loin rib, boneless or shoulder butt chops (in this order of preference).
21 If the 454 g size is not available, substitute another brand (if available) or the 680 g size of Maple Leaf
canned ham if no canned ham in a 454 g size is available in any brand. Use Maple Leaf Picnic shoulder only if no canned ham is available in any size. If no canned ham or pork shoulder is available, use canned flakes of ham.
22 Include prices for both regular and Frontier style Puritan beef stew.
23 Prices for the 665 g size should also be used, but must be converted to a price for 700 g.
24 At stores where no Catelli macaroni is available in the 500 g size, substitute spaghetti.
25 If 2% evaporated Carnation milk is not available in a 370 - 385 ml can, use whole Carnation (as the first alternative) or all other brands, before using this alternative size.
26 For T-bone steak, ground beef, pork chops and chicken legs, use prices for “family packs” only if smaller packs are not available.

Chicken drumsticks: First, select or estimate a price for chicken drumsticks by following this procedure at each store: 1. Use drumsticks if available. 2. If no drumsticks are available, use the price for chicken legs without backs, divided by 1.1, if
available, or the price of chicken legs with backs, divided by 1.02, to provide a cost for the same edible quantity of chicken.
3. If no chicken legs with or without backs are available, use the price for thighs without backs, divided by 1.22.
4. Omit stores that have no drumsticks, thighs or legs. However, if no drumsticks, thighs or legs are available in the community, use the price of chicken breasts, divided by 1.27, at each store that has them.
Once you have selected or estimated a price for chicken drumsticks at all stores, calculate the average of these prices. This procedure ensures that a price for chicken drumsticks is normally available for each store, and that the cost of the chicken in this basket is consistent with the edible portion represented by the “as purchased” quantity of chicken drumsticks contained in the basket. Milk: At each store, calculate the average price for 2 L of regular milk in cartons and jugs and the average price for micro-filtered 2% milk in cartons and jugs (if both types are available). Then select the lower of these two at each store and calculate the average price. (Exclude stores where this size is not available.) If a 2 L size of 2% milk is not available in the community, substitute 2 L of 1%, skim or homogenized milk in that order of preference. If no milk is available in a 2 L size, use the average price for 1 L of fresh 2% milk (converted to price for 2 L) if available, or for 4 L if the 1 L size is not available. If no fresh milk is available, use the average price for all brands of UHT milk (converted to price for 2 L), and put “UHT” in column J. Eggs: At each store, select the lowest price for 1 dozen large eggs. Then calculate the average of the prices selected. If no large eggs are available in the community, use the average price for medium eggs. Butter: At each store, select the lowest price for 1 lb. of butter. Then calculate the average of the prices selected. Apples: Calculate the average of all prices per kilogram for different varieties of apples sold in bags up to 5 lbs., loose or individually. Do not include prices for apples sold individually if the weight is unknown. Oranges: Use the same procedure as for apples, including bags up to 5 lbs. or one dozen oranges. Do not include prices for oranges sold individually if the weight is unknown. Bananas: Calculate the average of prices per kilogram recorded at each store. Grapes: Calculate the average price for green, red and black grapes at all stores in the community. Potatoes: Calculate the average of all prices recorded for 5 lb. (2.27 kg) bags of all varieties of potatoes, excluding sweet potatoes, baking potatoes, new potatoes and B grade potatoes. If no 5 lb bags are available, calculate the average of all prices recorded for loose potatoes. Do not use prices for 10 lb. bags unless there are no potatoes in the community sold loose or in 5 lb. bags. Carrots: Calculate the average price for 2 lb. bags of unpeeled carrots recorded at all stores. If no 2 lb. bags are available in the community, use larger bags and loose carrots, and convert the price to a price for 2 lbs.

Onions: Calculate the average of all prices per kilogram for yellow cooking onions and jumbo onions sold loose or in 2 lb. or 3 lb. bags. Do not include Spanish onions, white onions or red onions unless no yellow or jumbo onions are available. If no yellow or jumbo onions are available in the community, use the cheapest price for Spanish, white or red onions. Turnips: Calculate the average of prices per kilogram recorded at each store. Include rutabagas, but not swedes. Cabbage: Calculate the average of prices per kilogram for green cabbage recorded at each store. White bread: At each store, select the lowest price for 675 g of white bread, after converting prices for all loaves, regardless of size, to a price for 675 g. Then calculate the average of the prices selected at each store. Whole wheat bread: At each store, select the lowest price for 675 g of 100% whole wheat bread, after converting prices for all loaves, regardless of size, to a price for 675 g. Then calculate the average of the prices selected at each store. If no 100% whole wheat bread is available in the community, substitute 60% whole wheat. Sugar: At each store, select the lowest price for 2 kg of sugar. (Normally, there will be only one price at each store.) Then calculate the average of the prices selected at each store. If no sugar is available in the community in this size, substitute 4 kg, if available, converted to a price for 2 kg. If neither of these sizes is available, use prices for 1 kg, multiplied by 2.

APPENDIX C
Household Food Security Survey
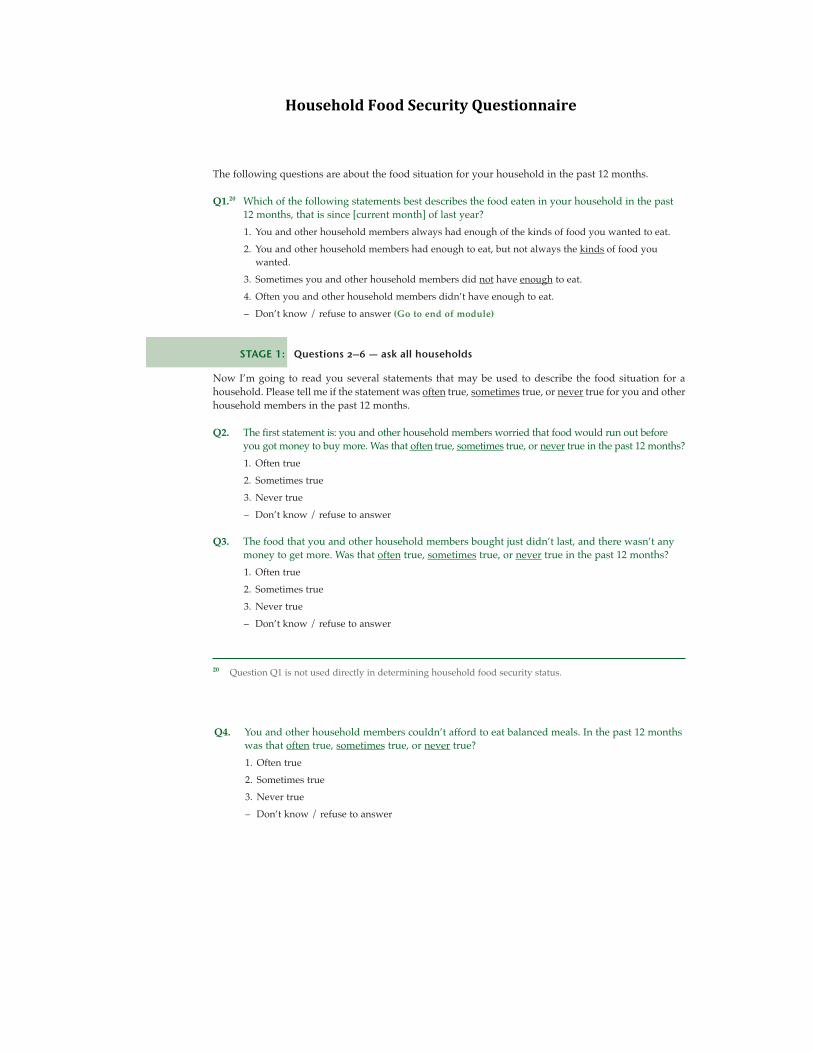
Household Food Security Questionnaire
Income-Related Household Food Security in Canada 45
Appendix A: CCHS Household Food Security Survey Module
The following questions are about the food situation for your household in the past 12 months.
Q1.20 Which of the following statements best describes the food eaten in your household in the past 12 months, that is since [current month] of last year?1. You and other household members always had enough of the kinds of food you wanted to eat. 2. You and other household members had enough to eat, but not always the kinds of food you
wanted. 3. Sometimes you and other household members did not have enough to eat. 4. Often you and other household members didn’t have enough to eat. – Don’t know / refuse to answer (Go to end of module)
STAGE 1: Questions 2–6 — ask all households
Now I’m going to read you several statements that may be used to describe the food situation for ahousehold. Please tell me if the statement was often true, sometimes true, or never true for you and otherhousehold members in the past 12 months.
Q2. The first statement is: you and other household members worried that food would run out beforeyou got money to buy more. Was that often true, sometimes true, or never true in the past 12 months?1. Often true2. Sometimes true3. Never true– Don’t know / refuse to answer
Q3. The food that you and other household members bought just didn’t last, and there wasn’t anymoney to get more. Was that often true, sometimes true, or never true in the past 12 months? 1. Often true2. Sometimes true3. Never true– Don’t know / refuse to answer
20 Question Q1 is not used directly in determining household food security status.
HCFoodSecurity_eng.qxd 4/11/07 4:19 PM Page 45
46 Canadian Community Health Survey, Cycle 2.2, Nutrition (2004)
Q4. You and other household members couldn’t afford to eat balanced meals. In the past 12 monthswas that often true, sometimes true, or never true?1. Often true2. Sometimes true3. Never true– Don’t know / refuse to answer
IF CHILDREN UNDER 18 IN HOUSEHOLD, ASK Q5 AND Q6; OTHERWISE, SKIP TO FIRST-LEVEL SCREEN
Now I’m going to read a few statements that may describe the food situation for households withchildren.
Q5. You or other adults in your household relied on only a few kinds of low-cost food to feed thechildren because you were running out of money to buy food. Was that often true, sometimestrue, or never true in the past 12 months?1. Often true2. Sometimes true3. Never true– Don’t know / refuse to answer
Q6. You or other adults in your household couldn’t feed the children a balanced meal, because youcouldn’t afford it. Was that often true, sometimes true, or never true in the past 12 months?1. Often true2. Sometimes true3. Never true– Don’t know / refuse to answer
FIRST-LEVEL SCREEN (screener for Stage 2):If AFFIRMATIVE RESPONSE to ANY ONE of Q2–Q6 (i.e. "often true" or "sometimes true")
OR response [3] or [4] to Q1, then continue to STAGE 2; otherwise, skip to end.
HCFoodSecurity_eng.qxd 4/11/07 4:19 PM Page 46
Income-Related Household Food Security in Canada 47
STAGE 2: Questions 7–11 — ask households passing the First-Level Screen
IF CHILDREN UNDER 18 IN HOUSEHOLD, ASK Q7; OTHERWISE SKIP TO Q8
Q7. The children were not eating enough because you or other adults in your household justcouldn’t afford enough food. Was that often, sometimes or never true in the past 12 months?1. Often true2. Sometimes true3. Never true– Don’t know / refuse to answer
The following few questions are about the food situation in the past 12 months for you or any otheradults in your household.
Q8. In the past 12 months, since last [current month] did you or other adults in your household evercut the size of your meals or skip meals because there wasn’t enough money for food?1. Yes 2. No (Go to Q9)– Don’t know / refuse to answer
Q8b. How often did this happen?1. Almost every month2. Some months but not every month3. Only 1 or 2 months– Don’t know / refuse to answer
Q9. In the past 12 months, did you (personally) ever eat less than you felt you should because therewasn’t enough money to buy food?1. Yes 2. No – Don’t know / refuse to answer
HCFoodSecurity_eng.qxd 4/11/07 4:19 PM Page 47
48 Canadian Community Health Survey, Cycle 2.2, Nutrition (2004)
Q10. In the past 12 months, were you (personally) ever hungry but didn’t eat because you couldn’tafford enough food?1. Yes 2. No – Don’t know / refuse to answer
Q11. In the past 12 months, did you (personally) lose weight because you didn’t have enough moneyfor food?1. Yes 2. No – Don’t know / refuse to answer
SECOND-LEVEL SCREEN (screener for Stage 3):If AFFIRMATIVE RESPONSE to ANY ONE of Q7–Q11,
then continue to STAGE 3; otherwise, skip to end.
STAGE 3: Questions 12–16 — ask households passing the Second-Level Screen
Q12. In the past 12 months, did you or other adults in your household ever not eat for a whole daybecause there wasn’t enough money for food?1. Yes2. No (IF CHILDREN UNDER 18 IN HOUSEHOLD, ASK Q13; OTHERWISE SKIP TO END)
– Don’t know / refuse to answer
Q12b. How often did this happen?1. Almost every month2. Some months but not every month3. Only 1 or 2 months– Don’t know / refuse to answer
HCFoodSecurity_eng.qxd 4/11/07 4:19 PM Page 48
Income-Related Household Food Security in Canada 49
IF CHILDREN UNDER 18 IN HOUSEHOLD, ASK Q13–16; OTHERWISE SKIP TO END
Now, a few questions on the food experiences for children in your household.
Q13. In the past 12 months, did you or other adults in your household ever cut the size of any of thechildren’s meals because there wasn’t enough money for food?1. Yes 2. No – Don’t know / refuse to answer
Q14. In the past 12 months, did any of the children ever skip meals because there wasn’t enoughmoney for food?1. Yes 2. No – Don’t know / refuse to answer
Q14b. How often did this happen?1. Almost every month2. Some months but not every month3. Only 1 or 2 months– Don’t know / refuse to answer
Q15. In the past 12 months, were any of the children ever hungry but you just couldn’t afford morefood?1. Yes 2. No – Don’t know / refuse to answer
Q16. In the past 12 months, did any of the children ever not eat for a whole day because there wasn’tenough money for food?1. Yes 2. No – Don’t know / refuse to answer
End of module
HCFoodSecurity_eng.qxd 4/11/07 4:19 PM Page 49

Open-ended questions Q17. Do you garden to produce food? How much of the food your family easts comes from
your garden? Q18. Does your family get food from hunting or fishing or have chickens to supply food? How
much of the food your family eats comes from hunting or fishing? Q19. Do you have a freezer to store the food? Do you need one? Q20. Are you familiar with any programs to help food access? Q21. What would you like to see in your community to improve food access? Q22. What is the biggest to eating healthy in your community?
Income-Related Household Food Security in Canada 49
IF CHILDREN UNDER 18 IN HOUSEHOLD, ASK Q13–16; OTHERWISE SKIP TO END
Now, a few questions on the food experiences for children in your household.
Q13. In the past 12 months, did you or other adults in your household ever cut the size of any of thechildren’s meals because there wasn’t enough money for food?1. Yes 2. No – Don’t know / refuse to answer
Q14. In the past 12 months, did any of the children ever skip meals because there wasn’t enoughmoney for food?1. Yes 2. No – Don’t know / refuse to answer
Q14b. How often did this happen?1. Almost every month2. Some months but not every month3. Only 1 or 2 months– Don’t know / refuse to answer
Q15. In the past 12 months, were any of the children ever hungry but you just couldn’t afford morefood?1. Yes 2. No – Don’t know / refuse to answer
Q16. In the past 12 months, did any of the children ever not eat for a whole day because there wasn’tenough money for food?1. Yes 2. No – Don’t know / refuse to answer
End of module
HCFoodSecurity_eng.qxd 4/11/07 4:19 PM Page 49
APPENDIX D
Summary of Individual Food Item Costs and
Revised Northern Food Basket Costs For Each Community

2% milk 4.76 L 11.89 15.11Evaporated milk, prepared 1.58 L2 11.03 12.69Skim milk powder 90 g 1.94 1.96Yoghurt 1.67 kg 25.65 16.70Processed cheese 385 g 6.44 6.92Mozzarella cheese 485 g 13.36 13.15
Food Group Total 70.31 66.53Eggs Eggs 8 2.53 3.11
Steak 470 g N.A. 8.33Ground beef, lean 1.34 kg 7.88 12.83Pork chops 1.21 kg 10.53 18.05Chicken drumsticks 2.68 kg 20.11 23.44Sliced ham 135 g 5.69 5.51Frozen fish fillets 135 g N.A. 2.24Canned salmon 270 g 13.55 7.30Canned ham 200 g N.A. N.A.Sardines 270 g N.A. N.A.
Food Group Total 57.76 77.7Wieners 100 g 1.68 1.97Bologna 60 g 2.17 2.30Peanut butter 90 g 2.08 2.29Caned baked beans with pork 290 mL 3.51 3.24Canned pork-based luncheon meat 50 g N.A. N.A.Canned corn beef 40 g N.A. N.A.Canned beef stew 180 g N.A. N.A.Canned spaghetti sauce with meat 155 mL N.A. N.A.
Food Group Total 9.44 9.80White enriched bread 660 g 5.56 4.83Whole wheat bread 660 g 3.82 3.41All purpose flour 1.92 kg 4.72 7.86Macaroni or spaghetti 385 g 2.85 2.93White long-grained rice 330 g 3.04 3.42Macaroni and cheese dinner 550 g 5.99 5.64Rolled oats 275 g 1.71 1.70Corn flakes 440 g 4.44 6.62Pilot biscuts 275 g 4.63 3.42
Food Group Total 36.76 39.83Oranges 1.23 kg 6.84 6.94Apple juice, tetra pack 880 mL N.A. 2.27Apple juice, frozen, prepared 130 mL3 N.A. N.A.Orange juice, frozen, prepared 1.13 L3 6.35 N.A.Orange juice, tetra pack 375 mL N.A. 8.01Canned whole tomatoes 215 mL 1.57 1.32Canned tomato sauce 300 mL 2.04 2.08
Food Group Total 16.80 20.62
Wasagamack St. Theresa Point
Revised Northern Food Basket Cost in Island Lake First Nations and Winnipeg, 2009
Meat
INAC Standard
Unit1Food Group Food Items
Dairy Products
Meat Alternatives
Grain Products
Citrus Fruit and Tomatoes

Apples 4.38 kg 32.25 33.11Bananas 3.58 kg 26.07 37.48Grapes 500 g 6.25 3.85Canned fruit cocktail in juice 855 mL 10.46 8.44Canned peaches in juice 285 mL N.A. 2.31Canned pineapple in juice 285 mL 3.11 2.48
Food Group Total 78.14 87.67Potatoes 3 kg 13.63 11.03French fries 480 mL 3.56 5.42Instant potatoes 220 mL N.A. N.A.
Food Group Total 17.19 16.45Cabbage 520 g 2.42 N.A.Carrots 2 kg 10.12 13.48Onions 695 g 2.54 3.50Turnips 350 g 3.74 2.37Frozen mixed vegetables 1.74 kg 10.05 11.77Frozen broccoli 695 g 6.37 6.53Frozen corn 260 g N.A. 2.34Frozen carrot 260 g N.A. 5.11Canned corn 1.09 L 10.05 8.19Canned peas 900 mL 7.12 5.56Canned mix vegetables 545 mL 6.28 3.59Canned beans 315 mL 9.74 1.18Canned carrot 325 mL N.A. 1.63
Food Group Total 68.43 65.25Margarine 715 g 8.65 6.25Butter 65 g 0.70 0.71Canola oil 185 mL 1.46 1.60Lard 105 g 0.38 0.41
Food Group Total 11.19 8.97Sugar Sugar 600 g 2.02 2.46Miscellaneous
etc. 5% 18.53 19.92
389.10 418.31
Notes:1Standard unit-family of fourN.A. - Not available
St. Theresa PointWasagamack
Total Basket Cost
To account for food items missing in any food groups, the weights assigned to those missing foods were equally divided amongst the remaining items within that food group, and costed accordingly.
Other Fruits
Potatoes
Other Vegetables
Fats and Oils
Revised Northern Food Basket Cost in Island Lake First Nations and Winnipeg, 2009
Food Group Food ItemsINAC
Standard Unit1

2% milk 4.76 L 16.86 15.46 5.58Evaporated milk, prepared 1.58 L2 11.91 12.04 7.64Skim milk powder 90 g 1.50 1.96 1.26Yoghurt 1.67 kg 17.62 16.07 8.88Processed cheese 385 g 6.33 7.93 3.69Mozzarella cheese 485 g 14.42 14.33 9.68
Food Group Total 68.64 67.79 36.73Eggs Eggs 8 2.80 2.97 1.93
Steak 470 g 10.00 9.77 7.10Ground beef, lean 1.34 kg 14.24 6.51 11.69Pork chops 1.21 kg 17.52 14.92 9.72Chicken drumsticks 2.68 kg 25.55 23.16 18.73Sliced ham 135 g 3.83 7.54 2.88Frozen fish fillets 135 g 3.68 N.A. 2.20Canned salmon 270 g 5.91 5.73 4.73Canned ham 200 g N.A. N.A. N.A.Sardines 270 g N.A. N.A. N.A.
Food Group Total 80.73 67.63 57.05Wieners 100 g 1.92 1.98 0.97Bologna 60 g 2.66 3.42 2.13Peanut butter 90 g 1.81 1.90 1.44Caned baked beans with pork 290 mL 3.42 3.33 1.67Canned pork-based luncheon meat 50 g N.A. N.A. N.A.Canned corn beef 40 g N.A. N.A. N.A.Canned beef stew 180 g N.A. N.A. N.A.Canned spaghetti sauce with meat 155 mL N.A. N.A. N.A.
Food Group Total 9.81 10.63 6.21White enriched bread 660 g 4.36 6.48 3.59Whole wheat bread 660 g 4.00 6.71 3.59All purpose flour 1.92 kg 5.43 5.93 3.90Macaroni or spaghetti 385 g 2.78 2.85 1.16White long-grained rice 330 g 3.06 3.07 1.62Macaroni and cheese dinner 550 g 4.88 6.10 3.35Rolled oats 275 g 1.69 1.86 1.14Corn flakes 440 g 7.67 6.96 3.83Pilot biscuts 275 g 3.54 4.09 N.A.
Food Group Total 37.41 44.05 22.18Oranges 1.23 kg 6.96 7.29 4.03Apple juice, tetra pack 880 mL 3.53 3.36 1.51Apple juice, frozen, prepared 130 mL3 N.A. N.A. N.A.Orange juice, frozen, prepared 1.13 L3 2.66 3.45 1.95Orange juice, tetra pack 375 mL 1.51 1.97 0.56Canned whole tomatoes 215 mL 1.42 1.28 0.51Canned tomato sauce 300 mL 2.60 2.24 0.90
Food Group Total 18.68 19.59 9.46
Revised Northern Food Basket Cost in Island Lake First Nations and Winnipeg, 2009
WinnipegGarden Hill
Red Sucker Lake
Meat Alternatives
Grain Products
Citrus Fruit and Tomatoes
Food Group Food ItemsINAC
Standard Unit1
Dairy Products
Meat

Apples 4.38 kg 30.19 36.14 17.30Bananas 3.58 kg 17.85 24.56 6.09Grapes 500 g 4.76 5.00 1.64Canned fruit cocktail in juice 855 mL 7.45 11.20 6.42Canned peaches in juice 285 mL 2.22 N.A. 2.14Canned pineapple in juice 285 mL 3.09 3.17 2.14
Food Group Total 65.56 80.07 35.73Potatoes 3 kg 13.59 10.79 3.28French fries 480 mL 3.80 3.73 1.76Instant potatoes 220 mL N.A. N.A. N.A.
Food Group Total 17.39 14.52 5.04Cabbage 520 g 5.87 N.A. 0.89Carrots 2 kg 17.67 21.32 4.36Onions 695 g 3.36 7.58 1.52Turnips 350 g 2.64 N.A. 1.15Frozen mixed vegetables 1.74 kg 15.14 17.58 8.09Frozen broccoli 695 g N.A. N.A. 3.05Frozen corn 260 g 3.47 N.A. 1.21Frozen carrot 260 g N.A. N.A. 1.21Canned corn 1.09 L 7.83 10.10 3.52Canned peas 900 mL 5.45 5.60 2.68Canned mix vegetables 545 mL 4.43 3.57 1.71Canned beans 315 mL 1.89 2.38 0.99Canned carrot 325 mL 1.63 N.A. 1.02
Food Group Total 69.38 68.13 31.40Margarine 715 g 7.48 7.82 5.50Butter 65 g 0.93 0.89 0.57Canola oil 185 mL 1.33 1.48 0.49Lard 105 g 0.36 0.41 0.32
Food Group Total 10.10 10.60 6.88Sugar Sugar 600 g 2.05 2.56 1.11Miscellaneous
etc. 5% 19.13 19.42 10.69
401.68 407.96 224.41
Notes:1Standard unit-family of fourN.A. - Not available
Other Vegetables
Fats and Oils
Other Fruits
Food Group Food ItemsINAC
Standard Unit1
Garden Hill
Total Basket Cost
Potatoes
Revised Northern Food Basket Cost in Island Lake First Nations and Winnipeg, 2009
Red Sucker Lake
Winnipeg
To account for food items missing in any food groups, the weights assigned to those missing foods were equally divided amongst the remaining items within that food group, and costed accordingly.

APPENDIX E
Community Responses to the
Household Food Security Survey

Wasagamack Household Food Security Survey Responses
Survey Question All Households
Households with
Children
Households without Children
n % n % n % Adult food security scale Worried food would run out 26 72% 21 88% 5 42% Run out of food and unable to purchase more 26 72% 20 83% 6 50% Unable to afford balanced meals 25 69% 21 88% 4 33% Adult ever skip meals because wasn't enough money for food 9 25% 9 38% 0 0% Adult cut or skipped meals almost every or some months 10 28% 10 42% 0 0% Ate less than felt should 11 31% 10 42% 1 8% Was hungry but could not afford to eat 8 22% 8 33% 0 0% Lost weight, no money to buy food 5 14% 4 17% 1 8% Adults did not eat for a whole day 7 19% 6 25% 1 8% Adults did not eat for a whole day almost every or some months 4 11% 4 17% 0 0% Child food security scale Relied on a few kinds of low cost foods to feed children 19 53% 19 79% n.a. n.a Could not afford to feed children a balanced meal 19 53% 19 79% n.a. n.a Children were not eating enough because could not afford food 17 47% 17 71% n.a. n.a Adults cut the size of children's meals because they could not afford food 6 17% 6 25% n.a. n.a Child ever skip meals because there wasn't enough money for food 6 17% 6 25% n.a. n.a Child skipped meals almost every or some months 9 25% 9 38% n.a. n.a Children were hungry but could not afford to buy more food 7 19% 7 29% n.a. n.a Children did not eat for a whole day 2 6% 2 8% n.a. n.a
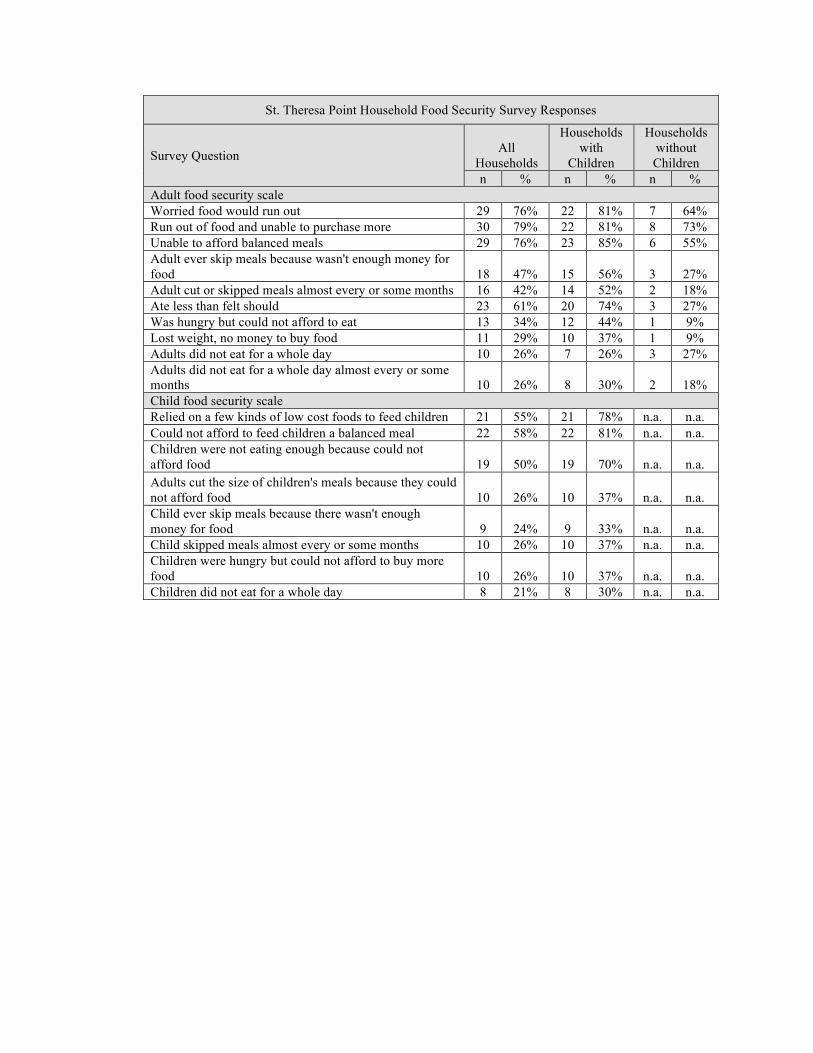
St. Theresa Point Household Food Security Survey Responses
Survey Question All Households
Households with
Children
Households without Children
n % n % n % Adult food security scale Worried food would run out 29 76% 22 81% 7 64% Run out of food and unable to purchase more 30 79% 22 81% 8 73% Unable to afford balanced meals 29 76% 23 85% 6 55% Adult ever skip meals because wasn't enough money for food 18 47% 15 56% 3 27% Adult cut or skipped meals almost every or some months 16 42% 14 52% 2 18% Ate less than felt should 23 61% 20 74% 3 27% Was hungry but could not afford to eat 13 34% 12 44% 1 9% Lost weight, no money to buy food 11 29% 10 37% 1 9% Adults did not eat for a whole day 10 26% 7 26% 3 27% Adults did not eat for a whole day almost every or some months 10 26% 8 30% 2 18% Child food security scale Relied on a few kinds of low cost foods to feed children 21 55% 21 78% n.a. n.a. Could not afford to feed children a balanced meal 22 58% 22 81% n.a. n.a. Children were not eating enough because could not afford food 19 50% 19 70% n.a. n.a. Adults cut the size of children's meals because they could not afford food 10 26% 10 37% n.a. n.a. Child ever skip meals because there wasn't enough money for food 9 24% 9 33% n.a. n.a. Child skipped meals almost every or some months 10 26% 10 37% n.a. n.a. Children were hungry but could not afford to buy more food 10 26% 10 37% n.a. n.a. Children did not eat for a whole day 8 21% 8 30% n.a. n.a.

Garden Hill Household Food Security Responses
Survey Question All Households
Households with
Children
Households without Children
n % n % n % Adult food security scale Worried food would run out 35 88% 34 97% 1 20% Run out of food and unable to purchase more 35 88% 34 97% 1 20% Unable to afford balanced meals 35 88% 33 94% 2 40% Adult ever skip meals because wasn't enough money for food 15 38% 15 43% 0 0% Adult cut or skipped meals almost every or some months 15 38% 15 43% 0 0% Ate less than felt should 18 45% 18 51% 0 0% Was hungry but could not afford to eat 15 38% 15 43% 0 0% Lost weight, no money to buy food 15 38% 15 43% 0 0% Adults did not eat for a whole day 15 38% 15 43% 0 0% Adults did not eat for a whole day almost every or some months 16 40% 16 46% 0 0% Child food security scale Relied on a few kinds of low cost foods to feed children 29 73% 29 83% n.a. n.a. Could not afford to feed children a balanced meal 30 75% 30 86% n.a. n.a. Children were not eating enough because could not afford food 27 68% 27 77% n.a. n.a. Adults cut the size of children's meals because they could not afford food 15 38% 15 43% n.a. n.a. Child ever skip meals because there wasn't enough money for food 15 38% 15 43% n.a. n.a. Child skipped meals almost every or some months 16 40% 16 46% n.a. n.a. Children were hungry but could not afford to buy more food 16 40% 16 46% n.a. n.a. Children did not eat for a whole day 13 33% 13 37% n.a. n.a.

Red Sucker Lake Household Food Security Responses
Survey Question All Households
Households with
Children
Households without Children
n % n % n % Adult food security scale Worried food would run out 30 75% 27 77% 3 38% Run out of food and unable to purchase more 29 73% 27 77% 2 25% Unable to afford balanced meals 31 78% 28 80% 3 38% Adult ever skip meals because wasn't enough money for food 18 45% 16 46% 2 25% Adult cut or skipped meals almost every or some months 18 45% 17 49% 1 13% Ate less than felt should 19 48% 17 49% 2 25% Was hungry but could not afford to eat 17 43% 17 49% 0 0% Lost weight, no money to buy food 16 40% 15 43% 1 13% Adults did not eat for a whole day 8 20% 7 20% 1 13% Adults did not eat for a whole day almost every or some months 6 15% 6 17% 0 0% Child food security scale Relied on a few kinds of low cost foods to feed children 27 68% 27 77% n.a. n.a Could not afford to feed children a balanced meal 23 58% 23 66% n.a. n.a Children were not eating enough because could not afford food 20 50% 20 57% n.a. n.a Adults cut the size of children's meals because they could not afford food 18 45% 18 51% n.a. n.a Child ever skip meals because there wasn't enough money for food 20 50% 20 57% n.a. n.a Child skipped meals almost every or some months 14 35% 14 40% n.a. n.a Children were hungry but could not afford to buy more food 12 30% 12 34% n.a. n.a Children did not eat for a whole day 15 38% 15 43% n.a. n.a

Island Lake Regional Household Food Security Survey Responses
Survey Question All Households
Households with
Children
Households without Children
n % n % n % Adult food security scale Worried food would run out 120 78% 104 86% 16 48% Run out of food and unable to purchase more 120 78% 103 85% 17 52% Unable to afford balanced meals 120 78% 105 87% 15 45% Adult ever skip meals because wasn't enough money for food 60 39% 55 45% 5 15% Adult cut or skipped meals almost every or some months 59 38% 56 46% 3 9% Ate less than felt should 71 46% 65 54% 6 18% Was hungry but could not afford to eat 53 34% 52 43% 1 3% Lost weight, no money to buy food 47 31% 44 36% 3 9% Adults did not eat for a whole day 40 26% 35 29% 5 15% Adults did not eat for a whole day almost every or some months 36 23% 34 28% 2 6% Child food security scale Relied on a few kinds of low cost foods to feed children 96 62% 96 79% n.a. n.a Could not afford to feed children a balanced meal 94 61% 94 78% n.a. n.a Children were not eating enough because could not afford food 83 54% 83 69% n.a. n.a Adults cut the size of children's meals because they could not afford food 49 32% 49 40% n.a. n.a Child ever skip meals because there wasn't enough money for food 50 32% 50 41% n.a. n.a Child skipped meals almost every or some months 49 32% 49 40% n.a. n.a Children were hungry but could not afford to buy more food 45 29% 45 37% n.a. n.a Children did not eat for a whole day 38 25% 38 31% n.a. n.a