a model to facilitate transformative learning in learner nurses

NEUROSYSTEMS
Fluoxetine and serotonin facilitate attractive-adaptation-induced orientation plasticity in adult cat visual cortex
Lyes Bachatene, Vishal Bharmauria, Sarah Cattan and St�ephane MolotchnikoffDepartment of Biological Sciences, University of Montreal, Montreal, QC, Canada
Keywords: adaptation, fluoxetine, plasticity, serotonin, visual cortex
Abstract
Neurons in V1 display orientation selectivity by responding optimally to a preferred orientation edge when it is presented withintheir receptive fields. Orientation plasticity in striate cortex occurs either by ocular deprivation or by imposition of a non-preferredstimulus for several minutes. Adaptation of neurons to a non-optimal orientation induces shifts of tuning curves towards the adapt-ing orientation (attractive shift) or away from it (repulsive shift). Here, we investigated the effects of the neurotransmitter serotoninand antidepressant fluoxetine (a selective serotonin reuptake inhibitor) on the modulation of adaptation-induced orientation plastic-ity. We show that serotonin and fluoxetine promote mostly attractive shifts. Attractive shifts augmented in magnitude towardsadapter, whereas repulsive neurons reversed their behavior in the direction of the forced orientation. Furthermore, neurons whichretained their original preferred orientation expressed plasticity by shifting their tuning curves after drug administration mostlytowards adapter. Our data suggest a pre-eminent role of fluoxetine by inducing and facilitating short-term plasticity in V1.
Introduction
Neurons in the primary visual cortex are selective to stimulus prop-erties such as orientation (Hubel & Wiesel, 1959, 1968). Cellsrespond optimally when the preferred stimulus is applied withintheir respective receptive fields. Properties that deviate from the pre-ferred characteristics evoke weaker responses. Over a range of axesof orientation, it is common to obtain a typical Gaussian fit of thetuning curve that reveals the preferred orientation. Such curves areestablished during the critical period that follows birth (Chiu & We-liki, 2003; Tanaka et al., 2009). Several laboratories have demon-strated that frequent or prolonged presentation of a non-preferredorientation induces modifications of the tuning curves of neurons(Dragoi et al., 2000; Ghisovan et al., 2009; Nemri et al., 2009;Bachatene et al., 2012). This presented non-preferred stimulus towhich a neuron generally responds poorly is called an adapter andthe process of stimulus presentation for a specific period is referredto as adaptation. In this framework, adaptation is a method thatpoints towards the ‘forced’ application of a non-preferred orientation(Krekelberg et al., 2006; Stroud et al., 2012). After adaptation, thepeak of a neuron’s tuning curve shifts either towards the adaptingorientation (attractive shifts) or away from it (repulsive shifts). Simi-lar results have been obtained for other features, namely spatial fre-quency (Marshansky et al., 2011), direction of motion (Kohn &Movshon, 2004) and speed (Movshon, 1975). Interestingly, theadaptation-induced plasticity occurs in the adult, and hence in afully mature brain well beyond the critical period that follows birth.Investigations have concluded that visual plasticity can be restored
after ocular deprivation by electrical stimulation of the locus coeru-leus (Kasamatsu et al., 1985), or can be modulated by several sub-stances such as acetylcholine and noradrenaline (Bear & Singer,1986), and L-threo-DOPS (Mataga et al., 1992). Moreover, it hasbeen shown that over- expression of the protein Lynx1 restricts plas-ticity in V1 by contributing to the stability of cortical networks inthe presence of cholinergic innervations. Conversely, ablating Lynx1improves cholinergic circuitries and may restore plasticity inmice (Morishita et al., 2010). In monocular deprived adult rats, ocu-lar dominance plasticity may be reinstated by a decline of bothGABAergic transmission and expression of chondroitin sulfate pro-teoglycans (Harauzov et al., 2010). Some authors have shown thatdown-regulation of chondroitin sulfate proteoglycans coupled withreverse lid-suturing in adult rats restores ocular dominance (Piz-zorusso et al., 2002, 2006). This is supported by an augmentationof both visual acuity and dendritic spine density (Pizzorusso et al.,2006). However, in adult cat V1, the recovery from monoculardeprivation is insufficiently re-established after administration ofchondroitinase (Vorobyov et al., 2013). Such physiological andmolecular mechanisms of visual plasticity are of high therapeuticimportance for visual system pathologies, e.g. amblyopia (Maya-Vetencourt & Origlia, 2012).Recently, Maya-Vetencourt et al. (2008, 2011) have shown that
in adult rats, ocular-dominance plasticity is restored after long-termtreatment with the antidepressant fluoxetine. Furthermore, it hasbeen shown that administration of fluoxetine to patients with ische-mic stroke leads to an increase of motor recovery in comparisonwith placebo subjects (Chollet et al., 2011). In line with the abovepublished data, we sought to examine the effects of serotonin andfluoxetine on shifts of orientation tuning curves of neurons follow-ing adaptation in adult anesthetized cats. We show that serotonin
Correspondence: Dr S. Molotchnikoff, as above.E-mail: [email protected]
Received 2 January 2013, revised 26 February 2013, accepted 28 February 2013
© 2013 Federation of European Neuroscience Societies and John Wiley & Sons Ltd
European Journal of Neuroscience, Vol. 38, pp. 2065–2077, 2013 doi:10.1111/ejn.12206
European Journal of Neuroscience

and fluoxetine mostly potentiate attractive shifts, suggesting a facili-tatory effect on orientation plasticity after adaptation.
Material and methods
Ethical approval
Electrophysiological recordings were performed on the primaryvisual cortex of nine adult domestic cats (Felis catus). Animal sur-gery procedures and electrophysiological recordings followed theguidelines of the Canadian Council on Animal Care and wereapproved by the Institutional Animal Care and Use Committee ofthe University of Montreal. Animals were supplied by the Divisionof Animal Resources of the University of Montreal.
Animals, anesthesia and surgical procedures
Adult cats (2.5–3.5 kg, age 12–24 months) of either sex, sedatedwith acepromazine maleate (1 mg/kg, i.m., Atravet; Wyeth-Ayerst,Guelph, ON, Canada) and atropine sulfate (0.04 mg/kg, i.m.,ATRO-SA; Rafter, Calgary, AB, Canada), were anesthetized withketamine hydrochloride (25 mg/kg, i.m., Rogarsetic; Pfizer,Kirkland, QC, Canada) maintained with 0.3% isoflurane (AErrane;Baxter, Toronto, ON, Canada). Lidocaine hydrochloride (2%,Xylocaine; AstraZeneca, Missis-sauga, ON, Canada) was injectedsubcutaneously as a local anesthetic during surgery. A tracheotomywas performed for artificial ventilation, and one forelimb vein wascannulated. Animals were then placed in a stereotaxic apparatus.Xylocaine gel (5%; Astra Pharma, Mississauga, ON, Canada) wasapplied on the pressure points. For the remaining preparations andrecording, paralysis was induced with 40 mg and maintained with10 mg/kg/h gallamine triethiodide (i.v., Flaxedil; Sigma Chemical,St. Louis, MO, USA) administered in 5% dextrose lactated Ringer’snutritive solution. General anesthesia was maintained by artificialventilation with a mixture of N2O/O2 (70 : 30) supplemented with0.5% isoflurane (AErrane; Baxter) for the duration of the experi-ment. Proper depth of anesthesia was ensured throughout the experi-ment by monitoring the EEG, the electrocardiogram and expiredCO2. In addition, heart rate remained unmodified after skin stimula-tion. End-tidal CO2 partial pressure was kept constant between 25and 30 mmHg. A heated pad was used to maintain a body tempera-ture of 37.5 °C. Tribrissen (30 mg/kg/day, s.c.; Schering-Plough,Pointe-Claire, QC, Canada) and Duplocillin (0.1 mL/kg, i.m.; Inter-vet, Withby, ON, Canada) were administered to the animals to pre-vent bacterial infection. The pupils were dilated with atropinesulfate (1%, Isopto-Atropine; Alcon, Mississauga, ON, Canada) andthe nictitating membranes were retracted with phenylephrine hydro-chloride (2.5%, Mydfrin; Alcon). The loci of the area centrales wereinferred from the positions of the blind spots, which were ophthal-moscopically focused and back projected onto a translucent screen.To verify the stability of the eye this procedure was repeated at theend of tests. Plano contact lenses with artificial pupils (5 mm diame-ter) were placed on the cat’s eyes to prevent the cornea from drying(University of Montr�eal, PQ, Canada).At the end of each experiment, the animals were killed via a
lethal dose of pentobarbital sodium (100 mg/kg, Somnotol; MTCPharmaceuticals, Cambridge, ON, Canada) by intravenous injection.
Electrophysiological recordings
Multi-unit activity in the primary visual cortex was carried outwith tungsten microelectrodes (2–10 MO at 1 kHz; Frederick Haer
& Co, Bowdoinham, ME, USA). Each set of electrodes, consistingof four microelectrodes in linear array (inter-electrode spacing400 lm) enclosed in stainless steel tubing, was controlled by aseparate micromanipulator. The signal from the microelectrodeswas amplified, band-pass filtered (300 Hz–3 kHz), digitized andrecorded with a 0.05-ms temporal resolution (Spike2, CED, Cam-bridge, UK). We recorded at an average of 400–500 lm corticaldepth from two recording sites. Each recording site yielded up toeight neurons. Action potentials were sorted using a window dis-criminator for further off-line analyses. Multi-unit signals from oneelectrode usually included up to seven well-isolated single units.The spike sorting method was based on cluster classification inreduced space (Spike2, CED). The stability of each cell’s activityacross conditions was verified qualitatively by visual control of thecluster disposition and of the waveform shape. Auto-correlogramswere systematically performed to ensure proper single-cell capture(deep at zero).
Visual stimulation (adaptation protocol) and drugadministration
Stimulation was monocular (dominant eye, the opposite eye wasshut). After clearly detectable activity was obtained, the multiunitreceptive fields (RFs) were mapped as the minimum response fields(Barlow et al., 1967) by using a hand-held ophthalmoscope. RFedges were determined by moving a light bar from the peripherytowards the centre until a response was elicited. Eye–screen distancewas 57 cm. These preliminary tests revealed qualitative propertiessuch as dimensions, velocity preference, orientation and directionalselectivity. Visual stimuli were generated with a VSG 2/5 graphicboard (Cambridge Research Systems, Rochester, UK) and displayedon a 21-inch monitor (Sony GDM-F520 Trinitron, Tokyo, Japan)placed 57 cm from the cat’s eyes, with 1024 9 768 pixels, runningat 100 Hz frame refresh. Stimuli were drifting sine-wave gratingpatches (~2° to 5°) covering the excitatory RF (Maffei & Fiorentini,1973).Patch characteristics were set to evoke optimal responses: contrast
at 80%, mean luminance at 40 cd/m2, optimal spatial and temporalfrequencies set within 0.1–0.5 cycles/degree and 1.0–2.0 Hz, respec-tively. The blank screen was uniformly gray (~ 35 cd/m2). In allcases the above parameters were chosen with the aim of evokingmaximal discharges. V1 neurons are known to respond well to sinewave drifting gratings (Bardy et al., 2006). After manual RF charac-terization, nine oriented stimuli centered on the preferred orientationwere selected and used for the rest of the experiment. With a22.5° interval between orientations, tuning curves covered 180°.Test orientations were applied in random order. Each oriented stimu-lus was presented in blocks of 25 trials lasting 4.1 s each, with arandom inter-trial interval (1.0–3.0 s) during which no stimuli werepresented. Thus, a recording session lasted for 25–30 min. Peri-stimulus time histograms were recorded. Once control orientationtuning curves were characterized, an adapting non-preferred stimuluswas presented continuously for 12 min. The adapting stimulus wasa drifting grating whose orientation was randomly selected in therange 22.5–67.5° from the neuron’s preferred orientation. It hasbeen shown previously that larger gaps between optimal and adapt-ing orientations are less efficient in inducing orientation shifts (Ghi-sovan et al., 2009). All other stimulus parameters were keptconstant, at control values, throughout the recordings. During thisadaptation period no recordings were performed. Immediately afteradaptation, orientation tuning curves was measured starting with theadapting and control preferred orientations to prevent an unlikely
© 2013 Federation of European Neuroscience Societies and John Wiley & Sons LtdEuropean Journal of Neuroscience, 38, 2065–2077
2066 L. Bachatene et al.

premature recovery, as these two orientations were the center ofinterest, while the remaining orientations were recorded in randomorder. Following a recovery period of 60–90 min, another tuningcurve measurement was performed.After the recovery period, we applied topically on the cortical sur-
face a custom-cut filter paper (1 9 1 mm) soaked in 10 mM seroto-nin or fluoxetine; we also used c-aminobutyric acid (GABA) as acontrol test for drug diffusion as this drug suppresses all electricalactivity (see Results).
Data analysis
Once single cells were sorted off-line from multi-unit spike trainsaccumulated during data acquisition, orientation tuning curves wereconstructed from the raw data. Because orientation tuning is bestdescribed by Gaussian-like functions, we fitted our raw data withthe von Mises function (Swindale, 1998). This allowed us to deter-mine with precision the preferred orientation of neurons and thenmeasure shifts in orientation preference. The von Mises function isdefined as M(h) = A.e b[cos(h�c)]+d, where A is the value of thefunction at the preferred orientation, c, and b is a width parameter.An additional parameter, d, represents the spontaneous firing rateof the cell (Swindale, 1998; Kohn & Movshon, 2004). The abovecalculations are necessary because tuning curves derived from rawdata may be imperfect in determining the preferred orientationgiven that the interval between the stimulus orientations is rela-tively large, 22.5°. In the cat, over 90% of V1 neurons are welltuned to stimulus orientation (Bishop & Henry, 1972). It was,however, necessary to ensure that cells in our sample were prop-erly tuned for orientation. We measured an orientation selectivityindex (OSI) by dividing the firing rate at orthogonal orientationsby the firing rate for the preferred orientation, and subtracting theresult from 1 (Ramoa et al., 2001; Liao et al., 2004). The closerthe OSI is to 1, the stronger the orientation selectivity. To com-pare the mean OSI between control, post-adaptation and post-drugadministration, a one-way ANOVA statistical test was performed witha significance level of 95%. We also correlated the OSI of eachneuron with the amplitude of shift and used linear regression with95% confidence interval to verify the relation. Adaptation-inducedshifts were measured as the distance between peak positions of thefitted tuning curves before and after conditioning. To assess thestatistical significance of tuning shifts, curve fits were generatedseparately for each of the 25 trials, and the mean difference wastested by a paired t-test. Shifts in preferred orientation larger than5° were statistically significant (paired sample two-tailed t-test,P < 0.01). Furthermore, paired two-tailed Student’s tests were car-ried out to verify the significance of differences between experi-mental conditions. In addition to the amplitude of shifts, wecomputed the modulation of responses for orientation classes (ori-ginal optimal, adapter, new optimal and a flank orientation beforeand after adaptation). We used a one-tailed Wilcoxon rank testwith 95% confidence interval to compare the response amplitudebefore and after the tests. Thereafter, we compared the amplitudeof response between two specific classes of orientations (prior todrug administration versus post-drug administration, see Fig. 6)using a two-way ANOVA statistical test (95% significance level).Moreover, the firing rate of spontaneous activity (firing rate of theneurons when a black screen was presented, no stimulus) wascompared between control, post-adaptation, recovery and drug con-ditions and a one-way ANOVA statistical test was used to comparethe mean firing response between these conditions with a 95% sig-nificance level. All statistical tests described in the results were
computed using the numerical software GraphPad Prism version 5(GraphPad Software Inc., La Jolla, CA, USA).
Results
The present experiments were aimed at investigating the effects ofthe neurotransmitter serotonin and antidepressant fluoxetine (a selec-tive serotonin reuptake inhibitor, SSRI) on shifts of orientation tun-ing curves of neurons following adaptation on adult cats of eithersex. No difference was observed between males and females in theresults presented below. After a classical visual stimulation protocolto determine the Gaussian orientation tuning curves, we establishedthe shifts of tunings of the recorded neurons after adaptation prior todrug application. Thereafter, we proceeded with drug testing on thesame neurons. After the recovery period from the first adaptation,we administered serotonin or fluoxetine topically with a custom-cutfilter paper soaked in 10 mM solution deposited on the surface ofthe primary visual cortex (adjacent to the recording electrode shaft).In addition, drug diffusion was assessed by recording responsesfrom neighboring sites. Moreover, we used the potent inhibitoryGABA (10�2 mM) to supplement our results regarding substancediffusion. Figure 1 illustrates the experiments aimed at showing thatthe drug’s effect is limited to a tissue volume inferior to 400–500 lm. The general set-up is displayed in Fig. 1A. A typicalexample of multi-unit recordings is shown in Fig. 1B. It demon-strates that the diffusion of drugs was restricted to a volume inferiorto ~ 400–500 lm. On the left, we show two electrodes positionedlaterally (inter-electrode distance 400 lm), while on the right, therecording tips are vertically spaced along the electrode shank (inter-recording site distance 500 lm). The application of GABA next toelectrode #2 (E2) reduced considerably the multi-neuronal activitywhile the electrical activity under electrode #1 (E1) remained unaf-fected. Similarly, in depth recordings (right side), the most superfi-cial site (site 2) illustrates the firing decline, whereas 500 lm below,the multi-neuronal firing remains unmodified by serotonin. Althoughserotonin may decrease the general activity of neurons (Licata et al.,1993; Zhong & Yan, 2011; Avesar & Gulledge, 2012), these cellsmaintain a tuning curve as one specific orientation evokes the maxi-mal firing rate relative to other orientations. The experimental proto-col is shown schematically in Fig. 1C. The test began bydetermining the orientation tuning curves by randomly presentingsine-wave gratings at eight orientations wherein the preferred orien-tation evokes the highest firing rate. In the next phase, a non-pre-ferred orientation is applied uninterruptedly for 12 min to induceadaptation. This initial step, for most cells, ascertains the shift of thepeak of the tuning curve for the unit under investigation. The recov-ery of the original tuning curve is achieved about 60–90 min afterthe cessation of first adaptation: consequently, the original tuningcurve is reinstated. After the recovery period, the drug was topicallyapplied. Immediately after administration of the substance, we car-ried out a second adaptation for the same duration (12 min) with thesame non-preferred orientation (as the first adaptation), and theentire process was repeated.The present paper describes data recorded from single unit analy-
sis. Of 139 isolated neurons, 68 were tested with serotonin (fourcells were eliminated and eight units were unclassified) and 71 neu-rons were investigated with fluoxetine (one unit was eliminated and10 were unclassified). Neurons were eliminated when their firingactivity was lost during the experiment, and as a consequence theycould not be traced. Unclassified neurons refer to neurons for whichthe tuning curve could not be determined. We also calculated theOSI of each neuron as 1 – (firing rate at orthogonal orientation/firing
© 2013 Federation of European Neuroscience Societies and John Wiley & Sons LtdEuropean Journal of Neuroscience, 38, 2065–2077
Fluoxetine and serotonin promote visual plasticity 2067

rate at preferred orientation); the closer the OSI is to 1, the strongerthe orientation-selectivity. We also correlated the orientation selec-tivity index with the amplitude of shift for each neuron. The meanOSI was superior to 0.7 for each condition (OSIcontrol = 0.78,OSIpost-adaptation = 0.73, OSIpost-drug administration = 0.82), and no sig-nificant difference was observed between these conditions (one-wayANOVA: F = 1.77, P = 0.17, see Supporting Information Fig. S2A).Results from the correlation between the OSI and the amplitude ofshifts showed no significant correlation after adaptation (linearregression: F = 0.05, P = 0.81) or after drug administration (linearregression: F = 0.02, P = 0.88).
Serotonin and fluoxetine facilitate adaptation-induced plasticity
Previous studies have shown that prolonged adaptation of 12 min toa non-preferred stimulus leads to shifts of peaks of orientation tuningcurves towards the adapting orientation in most of cases (attractiveshift) (Ghisovan et al., 2008, 2009; Nemri et al., 2009; Bachateneet al., 2012). Figure 2A and B present an example of the effect ofserotonin on the attractive shifts. In these figures, the spike waveformat every stage of the study is shown in rectangular boxes, i.e. the neu-ron was traced throughout all steps of the recording. The red trianglerepresents the adapting orientation in this and all subsequent figures.The upper two plots show the orientation tuning curve of a cell asderived from the raw data, i.e. spike counts. Horizontal orientation(optimal orientation = 1.65°, derived from Gaussian fits) evoked thehighest firing rate specifying the preferred orientation of the neuron(blue curve). The adapting orientation (112.5°), applied uninterrupt-edly for 12 min, induced a new optimal orientation (red curve) at46.82°. In this case, the amplitude of the attractive shift was 45.17°.The lower curves are obtained after Gaussian fits as derived from rawvalues (Control R2 = 0.7, Adaptation R2 = 0.9, Recovery R2 = 0.9,Serotonin R2 = 0.5). Following the recovery (green curve) of the ori-ginal preferred orientation (1.31°), serotonin was applied over thecortex (see Fig. 1). The impact of the drug resulted in an increase of
shift by 110.29° from 1.31° to 111.6° (Fig. 2B). Indeed, in the pres-ence of serotonin, the new preferred orientation coincided with theadapter (shift increased from 45.17° to 110.29°).Comparable results were obtained with fluoxetine (Fig. 2C and D,
Control R2 = 0.5, Adaptation R2 = 0.6, Recovery R2 = 0.8, Fluoxe-tine R2 = 0.6). Prior to fluoxetine application, the attractive shiftwas 23.06° (original preferred: 65.98°, adapter set at 135°, followingadaptation optimal axis = 89.04°). Fluoxetine administrationincreased the attractive shift to 106.13°, which displaced the peak ofthe tuning curve further towards the adapting orientation (Fig. 2D).It is worth underlining that adaptation declines the responses
evoked by the initial optimal orientation (Ghisovan et al., 2008).Interestingly, in some cases the attractive translation is partial, i.e.the adaptation-induced shift failed to reach the adapter (Fig. 2A andC), particularly if the gaps separating adapting and the initial opti-mal orientations were too large. Following the adaptation procedureaccompanied by serotonin or fluoxetine (Fig. 2B and D, respec-tively), the amplitude of the attractive shift increased (amplified shifteffect) in the presence of the drug and attained that of the adapter,suggesting the effectiveness of both drugs in driving the peak of thetuning curve towards the adapter. The new optimal orientation coin-cided with the imposed orientation in 74% of neurons treated withserotonin, and in 73% of neurons treated with fluoxetine. No spe-cific properties (cortical depth, firing rate or specific receptive field)were found for neurons which acquired a new preferred orientationsimilar to the adapter.
Refractory neurons
Twenty-two per cent of neurons that we term ‘refractory’ did notdisplay any significant shift of their orientation tuning curves afterfirst adaptation, i.e. they maintained their original preferred orienta-tion following the first adaptation. In our experiments, a shift is con-sidered significant if it is > 5° (shifts below to this threshold areinsignificant, paired sample two-tailed t-test, P > 0.01, Ghisovan
A B
C
Fig. 1. Experimental procedures and drug diffusion. (A) Visual stimulation on adult cat striate cortex. (B) Electrophysiological recordings using multi elec-trodes (left cortex) and multisite electrode (right cortex); small square beside the electrode (E2 and site 2) represents the filter paper soaked with the drug.Below are shown the firing rates of multi-unit activity using GABA (left cortex) and serotonin (right cortex) for drug diffusion. (C) Experimental time course.All the orientations are randomly presented on the screen in 25 trials with arbitrary intervals.
© 2013 Federation of European Neuroscience Societies and John Wiley & Sons LtdEuropean Journal of Neuroscience, 38, 2065–2077
2068 L. Bachatene et al.

et al., 2009). Thus, refractory neurons retained their original optimalorientation following an initial adaptation period to a non-preferredstimulus or showed a very small jitter of their peak inferior to 5°.Figure 3 illustrates that administration of serotonin (Fig. 3A and B,
Control R2 = 0.9, Adaptation R2 = 0.9, Recovery R2 = 0.9, Seroto-nin R2 = 0.8) or fluoxetine (Fig. 3C and 3D, Control R2 = 0.8,Adaptation R2 = 0.8, Recovery R2 = 0.7, Fluoxetine R2 = 0.9)prompted a significant shift of the peaks in the post-adaptation
A B
C D
Fig. 2. Amplified attractive effect of serotonin and fluoxetine. (A) Raw data and Gaussian fit of normalized responses of one neuron for control (blue) andpost-adaptation (red). Red triangle represents adapting orientation. Gaussian fits show shift of the tuning curve (attractive shift, 45.17°). (B) Raw data andGaussian fit of normalized responses of the same neuron for recovery (green) and after the second adaptation during serotonin application (purple); the newattractive shift is 110.29°. Orange spikes represent waveforms of the same neuron for all conditions. (C, D) Same results for a different neuron, during fluoxe-tine administration (attractive shift post-adaptation 23.06°, amplified attractive shift during fluoxetine application 106.13°). Green spikes show the waveforms ofthe same cell.
© 2013 Federation of European Neuroscience Societies and John Wiley & Sons LtdEuropean Journal of Neuroscience, 38, 2065–2077
Fluoxetine and serotonin promote visual plasticity 2069

period. In sections B and D, administration of serotonin (B) and flu-oxetine (D) displaced the orientation tuning curves towards theadapting orientation (attractive shift 42.33° and 48.02°, respectively).
In most refractory cells, shifts were attractive (91%, n = 11 for sero-tonin experiments, 93%, n = 14 for fluoxetine experiments) (seealso Fig. 5).
A B
C D
Fig. 3. Induction of attractive shift by the action of serotonin and fluoxetine. (A) Raw data and Gaussian fit of normalized responses of one neuron for controland post-adaptation conditions (blue and red curves, respectively). Red triangle represents the adapter. Gaussian fits below show a non-significant shift after thefirst adaptation. (B) Raw data and Gaussian fit of normalized responses of the same cell for recovery and second adaptation in the presence of serotonin (greenand purple curves, respectively). Pink spikes represent waveforms of the same cell for the entire procedure. The tuning curve shifted toward the adapter in thepresence of the drug. (C, D) Similar induction of an attractive shift for another neuron during fluoxetine administration. Red spikes represent waveforms of thesame neuron.
© 2013 Federation of European Neuroscience Societies and John Wiley & Sons LtdEuropean Journal of Neuroscience, 38, 2065–2077
2070 L. Bachatene et al.

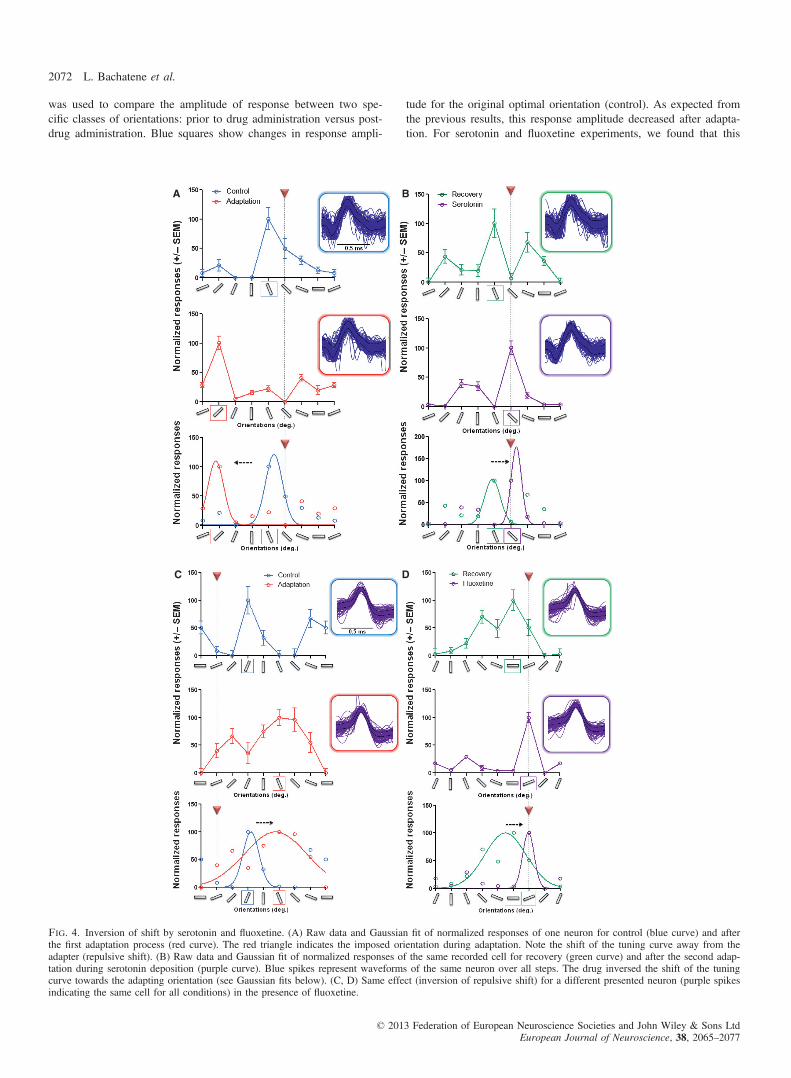
Serotonin and fluoxetine reverse the repulsive shifts
Although 12 min of adaptation induces attractive shifts in abouttwo-third of neurons, a fairly large number of units do exhibit repul-sive shifts. In the present investigation, 32% of neurons (n = 56,serotonin experiments) and 25% of neurons (n = 60, fluoxetineexperiments) responded with repulsive shifts after the first adapta-tion. In the following section, comparative effects of serotonin andfluoxetine are described, wherein the repulsive shifts post-first adap-tation were reversed towards the adapter. Figure 4 illustrates suchreversal of the orientation-selectivity (Control R2 = 0.8, AdaptationR2 = 0.5, Recovery R2 = 0.5, Serotonin R2 = 0.6). For instance, inFig. 4A the first adaptation displaced the peak of the tuning curveby 79.32° away from the adapter (optimal orientation 119.7°, adap-ter set at 135° and new optimal orientation 40.38°). During seroto-nin application, a repeated adaptation resulted in optimal orientationcorresponding to the adapter: 142.5° (Fig. 4B). Comparable resultswere recorded with fluoxetine (Control R2 = 0.5, AdaptationR2 = 0.6, Recovery R2 = 0.7, Fluoxetine R2 = 0.8). Indeed, Fig. 4Cshows a repulsive shift (31.68° as obtained from Gaussian fits) afterthe first adaptation for the illustrated neuron (purple spike). Follow-ing the second adaptation in the presence of fluoxetine (Fig. 4D),we observed an attractive effect towards the imposed orientation(adapter set at 22.5°), and thus fluoxetine cancels the repulsive shiftand induces an attractive change of the peak of the orientation tun-ing curve (attractive shift 8.25°, from Gaussian fit).
Modulations of shifts following serotonin and fluoxetineapplications
Figure 5A and B display for every analysed cell the changes of shiftmagnitudes and displacement direction of orientation tuning curvepeak induced by serotonin and fluoxetine. Cells are grouped intothree major classes according to the direction of the shift followingthe first adaptation: from left to right these are repulsive to attrac-tive, attractive to attractive (increase of attractive shift) and no shiftto attractive, whereas the other two groups with very few neurons(six units for serotonin experiments in Fig. 5A, and ten units for flu-oxetine experiments in Fig. 5B) did not display an attractive facilita-tory effect. Drugs were applied after the first adaptation followingrecovery of the original orientation-selectivity. The shifts followingthe first adaptation are depicted by red circles, whereas shifts in thepresence of serotonin or fluoxetine are indicated by purple squares(serotonin) and purple circles (fluoxetine). Paired two-tailed Stu-dent’s tests were used to compare the amplitude of shifts after thefirst adaptation versus the second adaptation with administration ofthe drug. The effects of serotonin are displayed in Fig. 5A. Eighteenneurons (32%, n = 56) reacted with a repulsive shift after the firstadaptation with an average amplitude shift of 25.4 � 19.4°. Seven-teen of these neurons reversed the initial repulsive shift towards theopposite direction: attractive, the average amplitude of the new shiftwas 24 � 19.2° (paired two-tailed t-test: t = 7.9, P < 0.0001, seeFig. 5A, first column from left), and one neuron remained unaf-fected by the drug (see proportion of unaffected neurons). Twenty-seven neurons (48%, n = 56) reacted attractively as a result of thefirst adaptation. Twenty-three of these neurons responded with sig-nificant augmented shifts (averaged shift following the first adapta-tion 15.1 � 9.6°, averaged shift with serotonin reached 33 � 29.4°;paired two-tailed t-test: t = 3.4, P = 0.002, second column fromleft). Interestingly, 11 neurons (20%, n = 56) that retained their ori-entation-selectivity after the first adaptation (averaged shift ampli-tude = 2.2 � 2.0°, i.e. not significant) exhibited a large attractive
shift for 10 neurons (new averaged shift amplitude = 23 � 17.1°,paired two-tailed t-test: t = 3.8, P = 0.0039), although one neuronremained unaffected. This suggests a facilitating role of serotonin ininducing attractive shifts. In addition to these three major classes, afew cells (3%, n = 56) reacted by shifting their peak from attractiveto repulsive translation (fourth column from left) and four units(7%, n = 56) remained unaffected by the drug (right column). Thehorizontal bars underline the mean values of tuning shifts.In Fig. 5B, on a cell-by-cell basis, we show the changes of shift
magnitudes after the second adaptation while fluoxetine was appliedto the cortex. The same global trend of results was obtained: thedrug potentiates attractive shifts, i.e. repulsive displacement reversedto attractive shifts (25%, n = 60), attractive shifts remaining attrac-tive although the increase is insignificant (averaged shift after thefirst adaptation equals 22 � 11.1°, and the averaged shift after thesecond adaptation with fluoxetine administration is 27 � 25.4°;paired two-tailed t-test: t = 0.9, P = 0.37). Thirteen cells failed tochange their orientation-selectivity once the first adaptation was car-ried out, and these cells exhibited strong attractive displacements asfluoxetine was deposited (2.6 � 1.3° shift after the first adaptation,this shift reached 23.5 � 14.2° post-adaptation and fluoxetineadministration; paired two-tailed t-test: t = 4.9, P = 0.0003).Thus, these results suggest that serotonin and fluoxetine (an SSRI)
(Manji et al., 2001; Castr�en, 2005; Kaneko et al., 2007; Briscoeet al., 2008) potentiate attractive shifts following adaptation, and asa consequence these drugs facilitate the emergence of responses to anew preferred orientation close to the adapter.The results presented above show the important role of these two
drugs in facilitating neuronal adaptation-induced plasticity within theprimary visual cortex. Note that for the amplified effect of the drugs(attractive to attractive), tests were significant for serotonin (pairedtwo-tailed t-test: t = 3.4, P = 0.002) with an increase in amplitudeof shifts of more than 50%, whereas for fluoxetine, attractive shiftmodifications were not significant (paired two-tailed t-test: t = 0.9,P = 0.37), suggesting that the facilitatory effect is due to direct sero-toninergic actions, while the smaller effect of fluoxetine would bedue to an indirect path such as inhibition of serotonin reuptake,which is pronounced after chronic administration (Maya-Vetencourtet al., 2008; Wang et al., 2008). Indeed, in a recent investigation, ithas been shown that the effect of fluoxetine on polysynaptic trans-mission is relatively small in comparison with the action of seroto-nin (Komlosi et al., 2012).
Modulations of response magnitude following serotonin andfluoxetine applications
Figure 6A and B compare response modulations during serotoninand fluoxetine applications for the group of neurons that increasedthe attractive effect during drug administration. In addition toresponses obtained at the flanks of the tuning curve, we focusedthese analyses on the evoked discharges in response to three orienta-tions: original optimal orientation, the adapter and new optimal ori-entation. Colored squares (in accordance with the orientationclasses) represent average changes in response amplitude relative tothe baseline, which corresponds to the response magnitude recordedbefore testing. These control responses are normalized (100%) inthe computations of Fig. 6. As indicated in the Methods, in theabsence of drugs, we carried out an adaptation protocol to ensurethat indeed the unit is shifting the peak of its orientation curve.One-tailed Wilcoxon rank tests (95% confidence interval) were com-puted to compare the response amplitude before and after adaptationfor each orientation class. Two-way ANOVA (95% significance level)
© 2013 Federation of European Neuroscience Societies and John Wiley & Sons LtdEuropean Journal of Neuroscience, 38, 2065–2077
Fluoxetine and serotonin promote visual plasticity 2071
was used to compare the amplitude of response between two spe-cific classes of orientations: prior to drug administration versus post-drug administration. Blue squares show changes in response ampli-
tude for the original optimal orientation (control). As expected fromthe previous results, this response amplitude decreased after adapta-tion. For serotonin and fluoxetine experiments, we found that this
A B
C D
Fig. 4. Inversion of shift by serotonin and fluoxetine. (A) Raw data and Gaussian fit of normalized responses of one neuron for control (blue curve) and afterthe first adaptation process (red curve). The red triangle indicates the imposed orientation during adaptation. Note the shift of the tuning curve away from theadapter (repulsive shift). (B) Raw data and Gaussian fit of normalized responses of the same recorded cell for recovery (green curve) and after the second adap-tation during serotonin deposition (purple curve). Blue spikes represent waveforms of the same neuron over all steps. The drug inversed the shift of the tuningcurve towards the adapting orientation (see Gaussian fits below). (C, D) Same effect (inversion of repulsive shift) for a different presented neuron (purple spikesindicating the same cell for all conditions) in the presence of fluoxetine.
© 2013 Federation of European Neuroscience Societies and John Wiley & Sons LtdEuropean Journal of Neuroscience, 38, 2065–2077
2072 L. Bachatene et al.

A
B
Fig. 5. Modulation of shift-magnitudes for every analysed neuron. (A) Global distribution of neurons for serotonin experiments. Red circles represent shifts ofeach neuron after the first adaptation, and purple squares represent shifts of the same neurons after the second adaptation during serotonin administration. Hori-zontal bars indicate the average shift of each group for both conditions. The lower side represents the repulsive side, i.e. the shifts away from the adapter, andthe upper side represents the attractive side, i.e. the shifts towards the adapter. The first group (left) shows the reversal effect of serotonin from repulsive toattractive shift (for values see Results). The second group shows the amplified attractive effect. The third group represents refractory neurons; the drug inducedan attractive shift (see Results). The fourth group represents a small proportion of neurons which reverse their shifts from attractive to repulsive (two neurons).The last group (right) shows the population of neurons which was not affected by serotonin (no effect). (B) Fluoxetine showed a similar tendency. Red circlesshow shifts of each analysed cell after the first adaptation, and purple circles represent shifts of the same cells after the second adaptation during fluoxetineadministration, stars (***) indicate the significance level of the statistical test (see text).
© 2013 Federation of European Neuroscience Societies and John Wiley & Sons LtdEuropean Journal of Neuroscience, 38, 2065–2077
Fluoxetine and serotonin promote visual plasticity 2073

original optimal response decreased in response magnitudes by�19% (Wilcoxon matched-paired signed rank test, P = 0.020) and�28% (Wilcoxon matched-paired signed rank test, P = 0.004) priorto their application, respectively. Red squares show mean responseenhancements to the adapter: attractive shifts + 4.08% (Wilcoxon
matched-paired signed rank test, P = 0.46) for serotonin experi-ments and + 5% (Wilcoxon matched-paired signed rank test,P = 0.20) for fluoxetine experiments. Brown squares indicate theaverage change in response amplitude for the new preferred orienta-tion. These discharges increased by 17% (Wilcoxon matched-pairedsigned rank test, P = 0.002) after adaptation for serotonin experi-ments, and augmented by 42% (Wilcoxon matched-paired signedrank test, P = 0.0003) post-adaptation for fluoxetine experiments.The modulation of response magnitude during the drug administra-tion is shown by the three colored squares of the right side in eachfigure. Green squares represent the original optimal orientation, andin a fashion similar to the first step (before drug administration) theseresponses declined by 29% (Wilcoxon matched-paired signed ranktest, P = 0.001) for serotonin tests and 24% (Wilcoxon matched-paired signed rank test, P = 0.0001) for fluoxetine experiments.Purple squares represent modifications in firing amplitude for thenew preferred orientation after application of serotonin (Fig. 6A) orfluoxetine (Fig. 6B). The magnitude of these responses increasedby 44% (Wilcoxon matched-paired signed rank test, P = 0.04) forneurons administered with serotonin, and by 22% (Wilcoxonmatched-paired signed rank test, P = 0.0005) for neurons adminis-tered with fluoxetine. Gray squares indicate flank orientations (67.5–90° from the optimal orientation); these weak responses fail to changefollowing drug application. Thus, this suggests that the influence of
Fig. 7. Proposed model for adaptation andaction of drug mechanisms. Example of arefractory neuron based on results with respectivetuning curves for each condition: control (blue),post-adaptation (red) and post-administration ofthe drug (purple). White bars represent all thepreferred orientations for each segment of thedendrite. After the first adaptation, the preferredorientation remained as for the control (horizon-tal). After the second adaptation during drugadministration, the synaptic weight for theadapter increased and the synaptic weight for theoriginal optimal decreased (push–pull).
A
B
Fig. 6. Graph representing changes in response amplitudes for different ori-entations. (A) Graph of response amplitudes for serotonin experiments. Col-ored squares represent averaged changes in response amplitude following aspecific stimulus (orientation) in several conditions relative to baseline (nor-malized firing rate before adaptation = 100%). Blue squares show the changein response amplitude for the original optimal orientation (control), whichdecreased after adaptation. Red squares show the change in response ampli-tude for the adapter, which increased post-adaptation. Brown squares showmodifications in response amplitude for the new optimal orientation, whichincreased after adaptation. Green squares represent the new original optimalorientation, which decreased post-adaptation. Purple squares show the changein response amplitude for the preferred orientation during application ofserotonin; the response amplitude increased. Gray squares illustrate an exam-ple of flank orientation; the response amplitude remained mainly similar.(B) Similar to A, for fluoxetine experiments.
© 2013 Federation of European Neuroscience Societies and John Wiley & Sons LtdEuropean Journal of Neuroscience, 38, 2065–2077
2074 L. Bachatene et al.

serotonin as well as fluoxetine on response amplitude is limited toadapted and original orientations, i.e. it is not a global effect.It is noticeable that the response magnitude of neurons is consid-
erably modulated throughout the experiments for specific orienta-tions (described above), but it is interesting that firing magnitudes ofneurons post-drug administration adaptation (purple square) are notsignificantly changed in comparison with prior to drug administra-tion (brown square) (two-way ANOVA test: F = 1.33, P = 0.25 forserotonin experiments, F = 1.7, P = 0.30 for fluoxetine experi-ments). In particular, no additional strengthening was observed.Hence, it is worth noting that the effect of both drugs is overwhelm-ing on the shift magnitude rather than firing rates. It may be due tosaturation of the discharge rates. It can be inferred that both drugsmodulate the plasticity by affecting mostly the selectivity range of aneuron rather than its evoked firing. Furthermore, spontaneous activ-ity remained unchanged after administration of the drug (one-wayANOVA: F = 0.11, P = 0.95, see Supporting Information Fig. S2B).
Discussion
The results described may be summarized as follows: the neuro-transmitter serotonin and SSRI fluoxetine facilitate movement ofthe peak of orientation tuning curve in the direction of the adapter,thus producing attractive shifts. Indeed, in the absence of drugs,about 30% of cells displaced their optimal orientation in the repul-sive direction, whereas in the presence of both drugs, the propor-tion of repulsive shifts is quite small: only a few cells exhibitedrepulsive direction. In addition, the magnitude of attractive shiftsincreased under the influence of both agents and particularly withserotonin. Interestingly, the firing rates were not increased in a sig-nificant fashion. The differential effects suggest that both drugspromote orientation-selectivity rather than the strength of theevoked discharges.
Comparative results
In previous studies, we have shown that successive adaptationenhances the firing rate of responses to the new optimal orientation.Consequently, the responses following the second adaptation (drugapplication) may be partially due to reiteration of the adaptation pro-cedures and not entirely attributed to the presence of drugs. How-ever, in these previous reports (Ghisovan et al., 2008), shifts in theorientation tuning curves following the second adaptation were rela-tively small in magnitude (magnitude of shifts between the twoadaptation periods were ~ 15.7–19.5° and ~ 15.6–13.6° for attrac-tive and repulsive shifts, respectively). This contrasts strikingly withthe present results. The average attractive shift was 24° under theinfluence of serotonin and 23.4° under the influence of fluoxetine inthe case of reversal from repulsive to attractive displacements,whereas the shift increased on average to 33° with serotonin and27° with fluoxetine for cells displaying an attractive shift after thefirst attempt. Furthermore, and notably during drug deposition, onlyvery few neurons displayed repulsive shifts after adaptation: 5% forboth serotonin and fluoxetine experiments. Without drugs, the pro-portion of repulsive shifts remained much higher: 16% (Ghisovanet al., 2008). Neurons which maintained their original preferred ori-entation after the first adaptation protocol changed their refractoryreaction under the influence of both drugs. Indeed, for neuronstested with serotonin, the average shift increased significantly(paired two-tailed t-test: t = 3.8, P = 0.0039), and for neurons testedwith the antidepressant fluoxetine, neurons that were refractory afterthe first adaptation showed a significant shift (paired two-tailed
t-test: t = 4.9, P = 0.0003) after the second adaptation during drugadministration. Thus, serotonin and fluoxetine induce attractiveshifts, promoting sensitization of refractory neurons to ‘learn’ theimposed stimulus. This suggests that the action of both substancesis biasing the synaptic drive in favor of the adapter. It can beattained by changing the cellular threshold resulting in a higher fir-ing rate of the neurons with a preferred orientation similar to that ofthe adapter. This could explain why the spontaneous activityremained unchanged. There seems to be a dual effect of the secondadaptation: without drugs it is the response magnitude that isenhanced (to the adapter) while displacement of the peak of the ori-entation tuning curve remained to a large extent unmodified (seeabove). In the presence of drugs, it is the magnitude of the shiftsthat is augmented, with a strong bias towards attractive direction.Interestingly, response magnitudes evoked by flank orientations
are not significantly changed; the influence of drugs is restricted tothe adapter and to the original preferred orientation.
Sensitization to the adapter
Both drugs were closely associated with reactivation of brain plastic-ity. Maya-Vetencourt et al. (2008) unambiguously showed in ratsthat long-term chronic treatment of fluoxetine (in drinking water)reduces GABAergic inhibition and simultaneously increases brain-derived neurotrophic factor (BDNF) expression, allowing the rein-statement of ocular dominance plasticity in adult rats. It appears thatthis antidepressant compound increases glutamatergic synaptic trans-mission. It has also been suggested that fluoxetine restructuresbranches of dendritic extremities (Chen et al., 2011), has neurode-velopmental effects (Homberg et al., 2010), and potentiates neuronmaturation and synaptic plasticity (Wang et al., 2008). In adult rats,serotonin reinstates the induction of N-methyl-D-aspartate (NMDA)-dependent long-term potentiation (Park et al., 2012). Furthermore,an increase of serotonin transmission augments the BDNF-trkB sig-naling path, which in turn promotes processes of plasticity (Maya-Vetencourt et al., 2011). In addition, it is suggested that the 5-HT1A
receptor is associated with epigenetic remodeling of chromatin struc-ture, leading to reactivation of cortical plasticity (Maya-Vetencourtet al., 2011).As we deposited serotonin, it is very likely that we increased the
amount of serotonin in the tissue volume open to synaptic transmis-sion and corresponding receptors. If their model (Maya-Vetencourtet al., 2011) is applied to our data, this would suggest that bothdrugs lead to new equilibrium of the synaptic inputs, which in turnallows functional modification of neuronal circuits (Jaffer et al.,2012). Results suggest that both drugs act on most active synapses(Chen et al., 2011). Application of the adapter certainly produces asurge of action potentials during a brief time-window and high prob-ability of synchronizing inputs upon the recipient neurons (Ghisovanet al., 2008). Hence our protocol implies that cells driven by theadapter for several minutes impact the dendritic membrane in such away that clusters of dendritic spines prevail in pushing the cell tofire maximally in response to orientations close to the adapter. Fur-thermore, our data suggest that these modifications may occur in arelatively short period of time, compatible with the time course ofmolecular cascades described above. Because our results show thatthe responses are roughly limited to the orientations close to theadapter, they are reminiscent of the stimulus-selective responsepotentiation (SRP) described by Frenkel et al. (2006), whichrequires activation of NMDA receptors. In support of this, it hasbeen shown that serotonin enhances responses to the NMDA recep-tors in adult rats (Reynolds et al., 1988).
© 2013 Federation of European Neuroscience Societies and John Wiley & Sons LtdEuropean Journal of Neuroscience, 38, 2065–2077
Fluoxetine and serotonin promote visual plasticity 2075

Serotonin and fluoxetine fail to influence firing rates
Several investigations have been reported on neuronal selectivity toorientation for different species such as cats (Carandini & Ferster,2000; Kisv�arday et al., 2000) and rodents (Jia et al., 2010). Com-bining high-speed two-photon imaging with electrophysiologicalrecordings (Jia et al., 2010) and functional mapping with electro-physiological recordings or optical imaging followed by three-dimensional anatomical reconstruction (Kisv�arday et al., 2000), ithas been demonstrated that a single dendritic branch receives synap-tic connections from neurons selective to different orientations(Kisv�arday et al., 2000; Jia et al., 2010). Such a large range indi-cates that many or all orientations may be efficient in exciting a sin-gle cortical cell. Although dendritic branches show synaptic contactsassociated with a particular axis of orientation, these studies demon-strate that various orientations are interspersed and representedthroughout the dendritic tree (Kisv�arday et al., 2000; Jia et al.,2010). Therefore, activating an alternative group of synapses shiftsthe optimal orientation but not necessarily the discharge rates. Thefiring rate that is the neuronal output is susceptible to saturation(Carandini & Ferster, 2000) and hence once available receptors aresaturated then the maximal rate of action potential firing is reachedand no further increase is possible. It is also possible that the restric-tion of the firing rates may be due to inhibition.Because weak responses evoked by unpreferred orientation (flank
orientations) are barely modified by both drugs, it appears that eachdrug’s action is constrained almost to the initial optimal orientation(decline) and the new acquired orientation (facilitation). It has beensuggested that this dual modulation is attributed to a push–pullmechanism (Palmer & Davis, 1981; Ferster, 1988, 1992; Tolhurst &Dean, 1990; Troyer et al., 1998; Shapley et al., 2003; Ghisovanet al., 2009), which appears to be sensitive to SSRIs.
Proposed model
Based on our findings, we suggest a model for how adaptation mecha-nisms might occur in the primary visual cortex at the neuronal leveland how serotonin and fluoxetine could regulate post-adaptationmechanisms. The model takes into consideration that the output ofprimary visual cortex neurons is due to synaptic weight distributionswithin the dendritic tree of a neuron for every orientation. As a conse-quence, the maximum discharge occurs for specific orientations thatsolicit predominantly the corresponding synaptic links. The adaptationprocess tends to reorganize this distribution such that neurons changetheir synaptic weight favoring the imposed orientation or in the direc-tion opposite to it, as has been described previously.Based on our results, we show in the proposed model (Fig. 7) an
example of a refractory neuron (same neuron as in Fig. 3). As tun-ing curves overlapped pre- and post-adaptation, this could be attrib-uted to the same synaptic equilibrium, which is not disturbed andmaintained post-adaptation (here 0° is the optimal for control andpost-adaptation, no shift). Interestingly, serotonin or fluoxetineappears to recalibrate the synaptic cross-influence by a push–pullmechanism, possibly associated with the corresponding decrease andincrease of synaptic strengths for the original optimal orientationand the adapter, respectively, thus leading to a shift. This mecha-nism could involve specific receptors to induce this push–pull effect.Plasticity within the primary visual cortex is a key property which
can contribute to cerebral treatments or cognitive mechanisms suchas memory or learning. We have shown that the neurotransmitterserotonin and antidepressant fluoxetine (an SSRI) promote attractiveshifts to an imposed stimulus and facilitate neuronal property
changes in learning process of a new feature, thus facilitating cere-bral plasticity in primary visual cortex neurons. We have revealed apre-eminent role of serotonin, which could be involved in a push–pull mechanism responsible for response modulations due to seroto-ninergic affinity to its receptors. Fluoxetine would act either byinhibiting serotoninergic recapture, or by direct actions on thechanges of properties of specialized neurons for orientation in V1.Our experiments showed a predominant role of serotonin and fluo-xetine by improving the “training” capacity of the refractory neu-rons, as well as a facilitation of plasticity for the repulsive neuronsin relation to adaptation, by guiding the primary visual neurons tolearn an unfamiliar feature of an image.
Supporting Information
Additional supporting information can be found in the online ver-sion of this article:Fig. S1. Example tuning curves showing the local effect of the drug.Fig. S2. Orientation selectivity index and spontaneous activity.
Acknowledgement
This study was supported by grants to S.M. (NSERC, FQRNT).
Abbreviations
5-HT, 5-hydroxytryptamine; BDNF, brain-derived neurotrophic factor; GABA,c-aminobutyric acid; NMDA, N-methyl-D-aspartate; OSI, orientation selectiv-ity index; RF, receptive field; SRP, stimulus-selective response potentiation;SSRI, selective serotonin reuptake inhibitor; trkB, tyrosine-related kinase B.
References
Avesar, D. & Gulledge, A.T. (2012) Selective serotonergic excitation ofcallosal projection neurons. Front. Neural Circuits, 6, 12.
Bachatene, L., Bharmauria, V., Rouat, J. & Molotchnikoff, S. (2012) Adapta-tion-induced plasticity and spike waveforms in cat visual cortex. NeuroRe-port, 23, 88–92.
Bardy, C., Huang, J.Y., Wang, C., FitzGibbon, T. & Dreher, B. (2006) “Sim-plification” of responses of complex cells in cat striate cortex: suppressivesurrounds and “feedback” inactivation. J. Physiol., 574, 731–750.
Barlow, H.B., Blakemore, C. & Pettigrew, J.D. (1967) The neural mecha-nism of binocular depth discrimination. J. Physiol., 193, 327–342.
Bear, M.F. & Singer, W. (1986) Modulation of visual cortical plasticity byacetylcholine and noradrenaline. Nature, 320, 172–176.
Bishop, P.O. & Henry, G.H. (1972) Striate neurons: receptive field concepts.Invest. Ophthalmol., 11, 346–354.
Briscoe, V.J., Ertl, A.C., Tate, D.B., Dawling, S. & Davis, S.N. (2008)Effects of a selective serotonin reuptake inhibitor, fluoxetine, on counter-regulatory responses to hypoglycemia in healthy individuals. Diabetes, 57,2453–2460.
Carandini, M. & Ferster, D. (2000) Membrane potential and firing rate in catprimary visual cortex. J. Neurosci., 20, 470–484.
Castr�en, E. (2005) Is mood chemistry? Nat. Rev. Neurosci., 6, 241–246.Chen, J.L., Lin, W.C., Cha, J.W., So, P.T., Kubota, Y. & Nedivi, E. (2011)Structural basis for the role of inhibition in facilitating adult brain plastic-ity. Nat. Neurosci., 14, 587–594.
Chiu, C. & Weliki, M. (2003) The role of neural activity in the developmentof orientation selectivity. In Chalupa, L.M. & Werner, J. (Eds), The VisualNeurosciences. MIT Press, Cambridge, MA, pp. 117–125.
Chollet, F., Tardy, J., Albucher, J.F., Thalamas, C., Berard, E., Lamy, C.,Bejot, Y., Deltour, S., Jaillard, A., Niclot, P., Guillon, B., Moulin, T.,Marque, P., Pariente, J., Arnaud, C. & Loubinoux, I. (2011) Fluoxetine formotor recovery after acute ischaemic stroke (FLAME): a randomised pla-cebo-controlled trial. Lancet Neurol., 10, 123–130.
Dragoi, V., Sharma, J. & Sur, M. (2000) Adaptation-induced plasticity of ori-entation tuning in adult visual cortex. Neuron, 28, 287–298.
© 2013 Federation of European Neuroscience Societies and John Wiley & Sons LtdEuropean Journal of Neuroscience, 38, 2065–2077
2076 L. Bachatene et al.

Ferster, D. (1988) Spatially opponent excitation and inhibition in simple cellsof the cat visual cortex. J. Neurosci., 8, 1172–1180.
Ferster, D. (1992) The synaptic inputs to simple cells of the cat visual cortex.Prog. Brain Res., 90, 423–441.
Frenkel, M.Y., Sawtell, N.B., Diogo, A.C.M., Yoon, B., Neve, R.L. & Bear,M.F. (2006) Instructive effect of visual experience in mouse visual cortex.Neuron, 51, 339–349.
Ghisovan, N., Nemri, A., Shumikhina, S. & Molotchnikoff, S. (2008) Visualcells remember earlier applied target: plasticity of orientation selectivity.PLoS ONE, 3, e3689.
Ghisovan, N., Nemri, A., Shumikhina, S. & Molotchnikoff, S. (2009) Longadaptation reveals mostly attractive shifts of orientation tuning in cat pri-mary visual cortex. Neuroscience, 164, 1274–1283.
Harauzov, A., Spolidoro, M., DiCristo, G., De Pasquale, R., Cancedda, L.,Pizzorusso, T., Viegi, A., Berardi, N. & Maffei, L. (2010) Reducing intra-cortical inhibition in the adult visual cortex promotes ocular dominanceplasticity. J. Neurosci., 30, 361–371.
Homberg, J.R., Schubert, D. & Gaspar, P. (2010) New perspectives on theneurodevelopmental effects of SSRIs. Trends Pharmacol. Sci., 31, 60–65.
Hubel, D.H. & Wiesel, T.N. (1959) Receptive fields of single neurones inthe cat’s striate cortex. J. Physiol., 148, 574–591.
Hubel, D.H. & Wiesel, T.N. (1968) Receptive fields and functional architec-ture of monkey striate cortex. J. Physiol., 195, 215–243.
Jaffer, S., Vorobyov, V., Kind, P.C. & Sengpiel, F. (2012) Experience-dependent regulation of functional maps and synaptic protein expression inthe cat visual cortex. Eur. J. Neurosci., 35, 1281–1294.
Jia, H., Rochefort, N.L., Chen, X. & Konnerth, A. (2010) Dendritic organiza-tion of sensory input to cortical neurons in vivo. Nature, 464, 1307–1312.
Kaneko, Y., Kashiwa, A., Ito, T., Ishii, S., Umino, A. & Nishikawa, T.(2007) Selective serotonin reuptake inhibitors, fluoxetine and paroxetine,attenuate the expression of the established behavioral sensitization inducedby methamphetamine. Neuropsychopharmacol., 32, 658–664.
Kasamatsu, T., Watabe, K., Heggelund, P. & Scholler, E. (1985) Plasticity incat visual cortex restored by electrical stimulation of the locus coeruleus.Neurosci. Res., 2, 365–386.
Kisv�arday, Z.F., Crook, J.M., Buz�as, P. & Eysel, U.T. (2000) Combinedphysiological–anatomical approaches to study lateral inhibition. J. Neuro-sci. Meth., 103, 91–106.
Kohn, A. & Movshon, J.A. (2004) Adaptation changes the direction tuningof macaque MT neurons. Nat. Neurosci., 7, 764–772.
Komlosi, G., Molnar, G., Rozsa, M., Olah, S., Barzo, P. & Tamas, G. (2012)Fluoxetine (prozac) and serotonin act on excitatory synaptic transmissionto suppress single layer 2/3 pyramidal neuron-triggered cell assemblies inthe human prefrontal cortex. J. Neurosci., 32, 16369–16378.
Krekelberg, B., Van Wezel, R.J. & Albright, T.D. (2006) Adaptation inmacaque MT reduces perceived speed and improves speed discrimination.J. Neurophysiol., 95, 255–270.
Liao, D.S., Krahe, T.E., Prusky, G.T., Medina, A.E. & Ramoa, A.S. (2004)Recovery of cortical binocularity and orientation selectivity after the criticalperiod for ocular dominance plasticity. J. Neurophysiol., 92, 2113–2121.
Licata, F., Li Volsi, G., Maugeri, G., Ciranna, L. & Santangelo, F. (1993) Seroto-nin-evoked modifications of the neuronal firing rate in the superior vestibularnucleus: a microiontophoretic study in the rat.Neuroscience, 52, 941–949.
Maffei, L. & Fiorentini, A. (1973) The visual cortex as a spatial frequencyanalyser. Vision Res., 13, 1255–1267.
Manji, H.K., Drevets, W.C. & Charney, D.S. (2001) The cellular neurobiol-ogy of depression. Nat. Med., 7, 541–547.
Marshansky, S., Shumikhina, S. & Molotchnikoff, S. (2011) Repetitive adap-tation induces plasticity of spatial frequency tuning in cat primary visualcortex. Neuroscience, 172, 355–365.
Mataga, N., Imamura, K. & Watanabe, Y. (1992) L-threo-3,4-dihydroxyphe-nylserine enhanced ocular dominance plasticity in adult cats. Neurosci.Lett., 142, 115–118.
Maya-Vetencourt, J.F. & Origlia, N. (2012) Visual cortex plasticity: a com-plex interplay of genetic and environmental influences. Neural Plast.,2012, 631965.
Maya-Vetencourt, J.F., Sale, A., Viegi, A., Baroncelli, L., De Pasquale, R.,O’Leary, O.F., Castr�en, E. & Maffei, L. (2008) The antidepressant fluoxe-tine restores plasticity in the adult visual cortex. Science, 320, 385–388.
Maya-Vetencourt, J.F., Tiraboschi, E., Spolidoro, M., Castr�en, E. & Maffei,L. (2011) Serotonin triggers a transient epigenetic mechanism that rein-states adult visual cortex plasticity in rats. Eur. J. Neurosci., 33, 49–57.
Morishita, H., Miwa, J.M., Heintz, N. & Hensch, T.K. (2010) Lynx1,a cholinergic brake, limits plasticity in adult visual cortex. Science, 330,1238–1240.
Movshon, J.A. (1975) The velocity tuning of single units in cat striate cortex.J. Physiol., 249, 445–468.
Nemri, A., Ghisovan, N., Shumikhina, S. & Molotchnikoff, S. (2009) Adap-tive behavior of neighboring neurons during adaptation-induced plasticityof orientation tuning in VI. BMC Neurosci., 10, 147.
Palmer, L.A. & Davis, T.L. (1981) Receptive-field structure in cat striate cor-tex. J. Neurophysiol., 46, 260–276.
Park, S.W., Jang, H.J., Cho, K.H., Kim, M.J., Yoon, S.H. & Rhie, D.J.(2012) Developmental switch of the serotonergic role in the induction ofsynaptic long-term potentiation in the rat visual cortex. Korean J. Physiol.Pha., 16, 65–70.
Pizzorusso, T., Medini, P., Berardi, N., Chierzi, S., Fawcett, J.W. & Maffei,L. (2002) Reactivation of ocular dominance plasticity in the adult visualcortex. Science, 298, 1248–1251.
Pizzorusso, T., Medini, P., Landi, S., Baldini, S., Berardi, N. & Maffei, L.(2006) Structural and functional recovery from early monocular depriva-tion in adult rats. Proc. Natl. Acad. Sci. USA, 103, 8517–8522.
Ramoa, A.S., Mower, A.F., Liao, D. & Jafri, S.I.A. (2001) Suppressionof cortical NMDA receptor function prevents development of orienta-tion selectivity in the primary visual cortex. J. Neurosci., 21, 4299–4309.
Reynolds, J.N., Baskys, A. & Carlen, P.L. (1988) The effects of serotonin onN-methyl-D-aspartate and synaptically evoked depolarizations in rat neo-cortical neurons. Brain Res., 456, 286–292.
Shapley, R., Hawken, M. & Ringach, D.L. (2003) Dynamics of orientationselectivity in the primary visual cortex and the importance of cortical inhi-bition. Neuron, 38, 689–699.
Stroud, A.C., Ledue, E.E. & Crowder, N.A. (2012) Orientation specificity ofcontrast adaptation in mouse primary visual cortex. J. Neurophysiol., 108,1381–1391.
Swindale, N.V. (1998) Orientation tuning curves: empirical description andestimation of parameters. Biol. Cybern., 78, 45–56.
Tanaka, S., Tani, T., Ribot, J., O’Hashi, K. & Imamura, K. (2009) A postna-tal critical period for orientation plasticity in the cat visual cortex. PLoSONE, 4, e5380.
Tolhurst, D.J. & Dean, A.F. (1990) The effects of contrast on the linearity ofspatial summation of simple cells in the cat’s striate cortex. Exp. BrainRes., 79, 582–588.
Troyer, T.W., Krukowski, A.E., Priebe, N.J. & Miller, K.D. (1998) Contrast-invariant orientation tuning in cat visual cortex: thalamocortical input tun-ing and correlation-based intracortical connectivity. J. Neurosci., 18,5908–5927.
Vorobyov, V., Kwok, J.C., Fawcett, J.W. & Sengpiel, F. (2013) Effects ofdigesting chondroitin sulfate proteoglycans on plasticity in cat primaryvisual cortex. J. Neurosci., 33, 234–243.
Wang, J.W., David, D.J., Monckton, J.E., Battaglia, F. & Hen, R. (2008)Chronic fluoxetine stimulates maturation and synaptic plasticity of adult-born hippocampal granule cells. J. Neurosci., 28, 1374–1384.
Zhong, P. & Yan, Z. (2011) Differential regulation of the excitability of pre-frontal cortical fast-spiking interneurons and pyramidal neurons by seroto-nin and fluoxetine. PLoS ONE, 6, e16970.
© 2013 Federation of European Neuroscience Societies and John Wiley & Sons LtdEuropean Journal of Neuroscience, 38, 2065–2077
Fluoxetine and serotonin promote visual plasticity 2077
Copyright © 2022 FDOKUMEN