Using software applications to facilitate and enhance strategic ...
108
Calhoun: The NPS Institutional Archive Theses and Dissertations Thesis and Dissertation Collection 1993-09 Using software applications to facilitate and enhance strategic planning Carpenter, Daniel K. Monterey, California. Naval Postgraduate School http://hdl.handle.net/10945/39924
-
Upload
khangminh22 -
Category
Documents
-
view
0 -
download
0
Transcript of Using software applications to facilitate and enhance strategic ...
Calhoun: The NPS Institutional Archive
Theses and Dissertations Thesis and Dissertation Collection
1993-09
Using software applications to facilitate and enhance
strategic planning
Carpenter, Daniel K.
Monterey, California. Naval Postgraduate School
http://hdl.handle.net/10945/39924

NAVAL POSTGRADUATE SCHOOLMonterey, California
(V)
N TIC0 STA? LECTE
•N MAR2 1994
z BTHESI&
Using Software Applicationsto
Facilitate and Enhance Strategic Planning
1n by
oYm Daniel K. Carpenterand
Donald J. Ebner
September, 1993
Thesis Advisor: Nancy RobertsAssociate Advisor: George Conner
Approved for public release; distribution is unlimited.
94 3 24 084 ... ..-
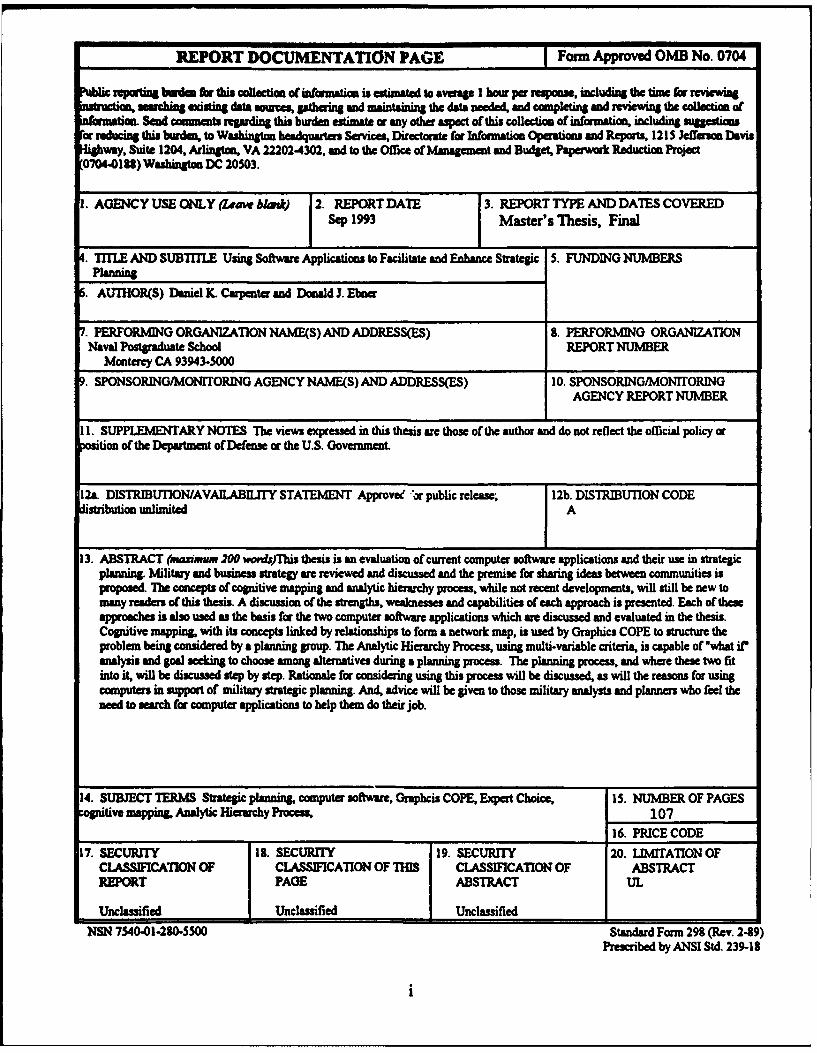
REPORT DOCUMENTATION PAGE Form Approved OMB No. 0704
repoting ulrden forthis collection of information is estimated to average I hour per response, including the time for reviewing-, eachng existing dat sources gathering and maintaining the dafta needed, and completing and revewing the collection of
onmati. Sad comments regarding this burden estimate or any other aspect of this collection of information, including suggestionsor educing this burden, to Washington headquarters Services, Directorate for Information Operations and Reports, 1215 Jefferson Davis
gway, Suite 1204, Arlington, VA 222024302, and to the Office of Management and Budget, Paperok Reduction Project07o4.01 U) Wuhingto DC 20503.
1. AGENCY USE ONLY (Leam bkak) 2. REPORT DATE 3. REPORT TYPE AND DATES COVEREDSep 1993 Master's Thesis, Final
. ITIIE AND SUBITI.E Using Software Applications to Facilitate and Enhance Strategic 5. FUNDING NUMBERSplanning
. AUTHOR(S) Daniel K. Ca ntr and Donald J. Ebner
. PERFORMING ORGANIZATION NAME(S) AND ADDRESS(ES) 8. PERFORMING ORGANIZATIONNaval Postgraduate School REPORT NUMBER
Monterey CA 93943-5000
' SPONSORING/MONITORING AGENCY NAME(S) AND ADDRESS(ES) 10. SPONSORING/MONITORINGAGENCY REPORT NUMBER
11. SUPPLEMENTARY NOTES The views expressed in this thesis are those of the author and do not reflect the official policy orition of the Department of Defense or the U.S. Governmint
12a. DISTRIBUTION/AVALABILITY STATEMENT Approvee "or public release; 12b. DISTRIBUTION CODEstribution unlimited A
13. ABSTRACT (Oaximum 200 wonds)This thesis is an evaluation of current computer software applications and their use in strategicplanning. Military and business strategy are reviewed and discussed and the premise for sharing ideas between communities isproposed. The concepts of cognitive mapping and analytic hierarchy process, while not recent developments, will still be new tomany readers of this thesis. A discussion of the strengths, weaknesses and capabilities of each approach is presented. Each of theseapproaches is also used as the basis for the two computer software applications which are discussed and evaluated in the thesis.Cognitive mapping, with its concepts linked by relationships to form a network map, is used by Graphics COPE to structure theproblem being considered by a planning group. The Analytic Hierarchy Process, using multi-variable criteria, is capable of 'what if"analysis and goal seeking to choose among alternatives during a planning process. The planning process, and where these two fitinto it, will be discussed step by step. Rationale for considering using this process will be discussed, as will the reasons for usingcomputers in support of military strategic planning. And, advice will be given to those military analysts and planners who feel theneed to sarch for computer applications to help them do their job.
14. SUBJECT TERMS Strategic planning, computer software, Gpaphcis COPE, Expert Choice, 15. NUMBER OF PAGESmpin Analytic i-erirchy Proc, 107
16. PRICE CODE
17. SECURITY 18. SECURITY 19. SECURITY 20. LIMTATION OFCLASSIFICATION OF CLASSIFICATION OF THIS CLASSIFICATION OF ABSTRACTREPORT PAGE ABSTRACT UL
Unclassified Unclassified Unclassified
NSN 7540-01-280-5500 Standard Form 298 (Rev. 249)Prescribed by ANSI Std. 239-19

Approved for public release; distribution is unlimited.
Using Software Applications to Facilitate and Enhance Strategic Planning
by
Daniel K. CarpenterMajor, United States Marine Corps
B.A., University of Mississippi, 1979and
Donald J. EbnerLieutenant, United States Navy
B.S., University of Pittsburgh, 1985
Submitted in partial fulfillmentof the requirements for the degree of
MASTER OF SCIENCE IN INFORMATION TECHNOLOGY MANAGEMENT
from the
NAVAL POSTGRADUATE SCHOOL
Authors:
,Onald
Approved by: Nan6'Roberts, Thesis Advisor
ý-eorge Conner, Associate Thesis Advisor
David R. *hippl manDepartment of Administra tve Sciences
ii

ABSTRACT
This thesis is an evaluation of current computer software applications and their use
in strategic planning. Military and business strategy are reviewed and discussed and the
premise for sharing ideas between communities is proposed. The concepts of cognitive
mapping and analytic hierarchy process, while not recent developments, will still be new
to many readers of this thesis. A discussion of the strengths, weaknesses and capabilities
of each approach is presented.
Each of these approaches is also used as the basis for the two computer software
applications which are discussed and evaluated in the thesis. Cognitive mapping, with its
concepts linked by relationships to form a network map, is used by Graphics COPE to
structure the problem being considered by a planning group. The Analytic Hierarchy
Process, using multi-variable criteria, is capable of "what if" analysis and goal seeking to
choose among alternatives during a planning process.
The planning process, and where these two fit into it, will be discussed step by step.
Rationale for considering using this process will be discussed, as will the reasons for
using computers in support of military strategic planning. And, advice will be given to
those military analysts and planners who feel the need to search for computer
applications to help them do their job. FAooeasuon For
TIS% f£ Aif- griD~TI( TAB 53Uuarino,,med 11
By.D I st r t
iiiDist Spacial

I. INTRODUCTION ............................................... IA . P urpo se ..................................................................... 1
B . S tructure .................................................................... 2C. Reference to Literature ...................................................... 3
II. STRATEGIC THINKING AND PLANNING ........................ 4A . Background ................................................................. 4
1. The long tradition of strategy formulation ............................... 4
a. Military examples of strategy ......................................... 4
b. Business examples of strategy ....................................... 6
2. How military and business strategy diverge .............................. 8a. Military strategy focuses on the battle ................................. 8b. Business strategy focuses on organizational capability ................ 8
B. The Military Borrows from Business ........................................ 10
1. P P B S ................................................................... 10
2. PPBS not delivering strategic planning ................................ 113. Search continues for strategic planning approaches and tools ........... 12
C. Basic Steps in Strategic Planning ........................................... 12
1. Bryson's strategic planning model easier to use ......................... 13
2. Considers political issues .............................................. 133. Focus is on managing change ......................................... 13
4. Bryson's model for strategic issues management ....................... 15
D . C onclusions ............................................................... 20
II1. STRATEGIC THINKING WITH COMPUTERS ................... 22A . D SS/G D SS ................................................................. 22
1. DSS and GDSS defined ................................................ 22
2. Major components of a DSS ............................................ 243. Benefits of using DSS/GDSS ........................................... 264. Strategic planning software design approaches ......................... 28
B. Prominent Approaches to Design of Strategic Planning Software ............ 301. Problem Structuring ..................................................... 30
a. Cognitive mapping ................................................. 30b. Strategic Options Development and Analysis ........................ 33
c. G raphics CO PE tie-in ............................................... 35
2. Structuring through Hierarchy ........................................... 35
iv

a. The Analytic Hierarchy Process .................................... 36b. Making judgments through comparisons ............................. 37c. Advantages of AHP ................................................. 39d. Tie-in to Expert Choice .............................................. 40
C. Bryson's Model and Software .............................................. 40IV. GRAPHICS COPE ............................................ 42
A . Introduction ................................................................ 42B . M ap Building ............................................................... 43
1. C reating a m odel ....................................................... 442. Entering Concepts into the computer .................................... 44
3. Linking concepts ........................................................ 47
4 . S ets ................................................................. . . 4 8
5. M ap editing ............................................................. 49
C . A na lysis ................................................................... 51D . L ists .................................................................... . . 55E. Printing and Exporting ..................................................... 56F. System Requirements ...................................................... 57
G . Documentation and Help ................................................... 57
H . S um m ary .................................................................. 58
V. EXPERT CHOICE ............................................ 60A . Introduction ................................................................ 60
B. Structuring the Model .................................................. . 61
C. Comparisons and Judgments .............................................. 64D . Synthesis ................................................................ 72
E. Sensitivity Analysis ....................................................... 73
F. Absolute Measurement and the Ratings Approach ......................... 79
G. Printing, Reporting, and Linking ........................................... 79
H. System Requirements ..................................................... 80
I. Sum m ary ................................................................. 81
VI. CONCLUSION .............................................. 83A . O verview .................................................................. 83B . C onclusion ................................................................ 86
APPENDIX A .................................................... 88REFERENCES .................................................. 93
V

Initial Distribution List ........................................... 96
vi

EXECUTIVE SUMMARY
This thesis is designed to aid military strategic planners in their efforts to improve
their planning capability. Whether they are looking for a strategic planning model to
employ, a computer application to automate their process, or simply assistance in the
decision making portion of the cycle, it is covered here. As military budgets continue to
dwindle, prudent planning and wise use of assets will be the highest priority for military
planners. These efforts can be greatly aided by computer applications and an issue-driven
planning process.
In an effort to help the busy planner, evaluations on two strategic planning computer
software applications are offered in this thesis. Graphics COPE is a window
environment software package that is designed to help structure problems through the use
of cognitive mapping and is considered a group decision support system. Cognitive
mapping and COPE are more fully explained in the Thesis. Expert Choice is a decision
support software which uses The Analytic Hierarchy Process created by Dr. T.L. Saaty.
It can do inferencing and rank ordering of multi-attribute variables to choose among
decision alternatives.
The names of additional software packages, with their company addresses, are
included in the appendix to aid further interest. The list is small in comparison to many
other business software applications that are available on the market, but it is felt that
more design of strategic planning packages will be undertaken in the near future. Many
of these companies will send demonstration disks upon request.
vii

The proliferation of the personal computer on the desktops, and in the homes, of
many military members--sometimes even the commanding officer--has lead to greater
awareness of the power and capability of the PC. This awareness has lead to the search
for software applications that will enable a shrinking personnel pool to accomplish many
of the same tasks previously done by more people. This thesis offers advice on features
to search for, what steps in the strategic planning process are supported, and what the
user can be expected to do with the packages.
The military has several options as it enters this period of downsizing and declining
budgets. The one proposed in this thesis is to work smarter, in essence more effectively
and more efficiently, by tapping into the capabilities of the computer. Using the computer
not to replace the decision making process of humans, but rather to use the power of the
computer to supplement and complement the thinking of humans. This thesis does not
provide answers to all of the questions. That is not its aim. Its aim is to arm the reader
with a process, some knowledge and to point in the right direction.
viii
I. INTRODUCTION
A. PURPOSE
The research questions this thesis set out to answer are: (1) what computer
software capabilities are currently available to strategic planners, and (2) how can they be
used by military strategic thinkers and planners?
The authors chose two software packages and evaluated their features, capabilities
and limitations. This smaller subset of packages, from those available, was used to
evaluate whether or not software packages could be of any use in a strategic planning
process. Graphics COPE, the first package evaluated, deals more with problem
structuring--setting the problem up. Expert Choice, the second package evaluated,
provides the means to choose from alternatives--after the problem is set up.
Our aim is to provide the reader with the background and technical information
necessary to evaluate the use of computer applications in support of strategic planning.
There are volumes of background information which we did not have the space to
include. Likewise, it would be possible to delve even more deeply into the technical side
of computers and their software applications. Again, this is not our aim. The reader
should be comfortable with the level of information presented here. Should a more
in-depth study be stirred, the references provide more information on the major topics.
B. STRUCTURE
The tfesis is divided into four sections: Strategic Thinking and Planning, Strategic
Thinvmng with Computers, Graphics COPE, and Expert Choice. These chapters will lay a
foundation for strategy and its military and business uses; show how the power of
computers can be used to aid the decision making process; and provide details of the
capabilities of Graphics COPE and Expert Choice and their use by strategic planners.
Strategic 7hinking and Planning provides a background in military strategy,
business examples of strategy and the distinctions between the two. It discusses how the
military has borrowed concepts from business in the past and it presents an eight-step
strategic planning process for use by the military. This is Chapter 1I in the thesis.
Strategic Thinking with Computers defines Decision Support and Group Decision
Support Systems and how they facilitate storing and using data to support decision
making. Prominent approaches to the design of strategic planning software are discussed
and two of the approaches--problem structuring and multi-attribute analysis--are
discussed in detail in Chapter III.
Graphics COPE is a computer software application which is very useful in
supporting the problem structuring function. Concepts and issues that participants can
verbalize are entered into the computer. Concepts which are related to each other are
linked and a cognitive map is constructed by the computer. This process--along with the
capabilities, strengths and weaknesses of the software--will be discussed in Chapter IV.
Expert Choice is based on the Analytic Hierarchy Process and is a multi-attribute
software package which formulates the problem into a hierarchy by breaking it down
2
into related elements. From there, the user is allowed to conduct comparisons to seek
solutions to the problem. This approach and its capabilities, strengths and weaknesses are
discussed in Chapter V.
C. REFERENCE TO LITERATURE
Although there are only a small number of strategic planning applications
available, and the scope of this thesis considered an even smaller subset of that number,
their mention in the literature has steadily increased over the last three years. Buede
(1991) feels the greatest deficiency in these applications is the problem structuring
ability. We feel that this is because the designers of strategic planning applications either
(1) already have the problem structured in their own mind and do not need this
assistance, or (2) have always been handed this information and do not realize the
muddy, swirling waters of the political process which must be navigated to achieve a
well-structured problem.
Dr. Dennis Buede (1991), has done the most exhaustive evaluation that we came
across in our literature search. Our efforts to learn the two packages discussed here
mirrored his discussion of their ease of use. Graphics COPE, the first package evaluated,
is probably easier to use in its Windows format than its older DOS version, but it is not
what is termed "user friendly." Expert Choice, the second package, was much easier to
negotiate and enter variables. But then again, the problem is well-defined and structured
before it is in a form that Expert Choice can accept.
3

II. STRATEGIC THINKING AND PLANNING
The study and development of strategy consumes the efforts of military and business
planners alike. Each strives to gain the edge over their competitors by formulating and
implementing successful strategies. Sometimes there is crossover of successful processes
or philosophies from one discipline to the other. To discuss how computers can assist in
strategic planning, we must define military and business strategy, cite examples of each
and discuss how they differ. With the proper foundation laid, we can discuss the use of
business software applications in the military strategic planning process. Bryson's (1988)
Strategic Planning Process will be proposed as model because of its relative ease of use
for large public bureaus.
A. BACKGROUND1. The long tradition of strategy formulation
Strategic thought and philosophy have progressed and evolved through the
centuries until today there are as many disciplines as there are disciples willing to take up
the cause. From military strategy to strategic planning to strategic issues management,
the spectrum subdivides and branches out into a field spanning from corporate
boardrooms to the smallest warfighting unit in the armed services.
a. Military examples of strategy
Military applications of strategy and its study have a long, documented
past. This study has traveled from Sun Tzu, and his ancient Chinese writings, to modem
strategies considering the use of nuclear missiles versus conventional war--or at the other
4

end of the spectrum, trying to define the low-intensity conflict and its myriad variations.
There is a rich historical base of military operations on which strategists can study,
dissect, and theorize. Successful military operations down through the centuries have
depended on their leaders to be well versed in strategy and its effective implementation.
Written well over two thousand years ago, "The Tao-te Ching, or The Way
and Its Power, applies the same strategy to society that Sun Tzu attributes to warriors of
ancient times:"
Plan for what is difficult while it is easy, do what is great while it is small. Themost difficult things in the world must be done while they are still easy, thegreatest things in the world must be done while they are still small. (Sun Tzu1988, p. 2)
A quick analysis of this Taoist logic reveals its basic wisdom--that it is
best to plan now for the rough times ahead and when this planning is done, accomplish
those necessary tasks while they are still relatively easy. The Taoist philosophy suggests
that it becomes harder to plan when tasks are upon you and presenting conflicts for
resolution.
A more recent example of military strategy is embodied in War Plan
Orange. This was a Naval effort, aided some by the Army, undertaken for over 40 years
to script the inevitable war in the Pacific with Imperial Japan. The Orange Plan consisted
of a three-phase plan to deal with Japan's aggression in the Pacific during what became
World War II. The assumption may be made that this planning was done at the highest
levels and then sent down the chain of command for compliance. But, as is normally the
case in the military, and increasingly so in the corporate world, "Orange Plans more often
5

reflected the personal convictions of talented midlevel officers who were recruited for the
elite duty than the dicta of higher authorities ." (Miller 1991, p. 8)
How successful was this military strategy? "The Orange Plan, fallacious in
every detail of large naval encounters, was nevertheless correct in strategic principle."
(Miller 1991, p. 355) It incorrectly predicted: the preeminence of battleships and gun
battles, a one-ocean, two-nation war, and the number of ground troops which were
involved, yet these divergences did not "negate the validity of the plan, which was
implemented almost in its entirety in the course of the war. " (Miller 1991, p. 5, emphasis
added)
Miller (1991, p. 9) best sums up the American military way of planning
by quoting a chief of naval operations 40 years after the war. "A robust plan, he
observed, flows best from 'plurality of perspective and the resulting competition of ideas.
... The process may be somewhat untidy, but it is distinctly American. It works.'"
Planning done at levels below the top has been done by the military for many years and
does not seem to differ very much from what some in the corporate world are striving
toward.
b. Business examples of strategy
Businesses too, have been involved in strategy making since the late
1950's when a more systematic approach to doing business was invented (Ansoff 1984).
Two examples of business applications of strategy are generic and competitive strategies
(Mintzberg 1991). An example of a generic application would be a forecast from the
planners that gas-guzzling cars would no longer be in demand in ten years. The message
6

to the car manufacturers would be: shift your efforts to more economical cars. Here the
threat would be to all car manufacturers--not to a particular car company or competitive
position but to the generic mission. To counter that threat, the manufacturer would devise
a plan with the long-range aspects being given prime consideration. The second
application of strategy is that the firm must compete with other firms in the market which
is called competitive strategy. Using our car manufacturing example, it would detail
which strategy would enable one firm to gain a competitive advantage over another in
manufacturing economy cars. (Mintzberg 1991)
Thompson (1984) provides an illustration of a corporation which worked
both its long-term strategy and its competitive strategy to its advantage. Pillsbury, in
evaluating its strategic situation in 1973, found itself holding some low-growth, cyclical
business interests when a new chairman of the board assumed power. By the end of the
decade they had divested the low-growth companies and acquired several dominant food
manufacturers holding the number one or two position in fast growing areas. The
long-term strategy was to focus direction on becoming an international food company.
One acquisition, Green Giant, even helped Pillsbury to gain supermarket
shelf space for its less widely distributed lines and improve its competitive strategy
against its competitors. With their restaurant business they used a "grow-and-build
strategy" to improve the competitive standing of Pillsbury-owned Burger King, Steak
and Ale, and Poppin Fresh Pie Shops. Their goal was to double the number of outlets and
triple earnings. One successful example was the Steak and Ale restaurants growing from
7

52 outlets in 1973 to 165 outlets in 1978. Pillsbury is an example of a corporation which
worked its long-term and competitive strategies effectively.
2. How military and business strategy diverge
a. Military strategy focuses on the battle
Military strategy, although mostly looking long range, is not the same as
organizational strategic planning. Military strategy has various definitions. The American
Heritage Dictionary defines it as, "the science and art of military command as applied to
the overall planning and conduct of large-scale combat operations." Clausewitz
distinguished it from tactics as follows, 'Tactics constitutes the theory of the use of
armed forces in battle; strategy forms the theory of using battle for the purposes of war."
(Paret 1986)
In comparison, Carl Builder (1989) considers strategy as a "concept for
relating means to ends." He believes military strategy takes two forms:
"* In war or contingency plans, the means are existing military forces and the ends arethose military objectives which political leaderships might authorize in the event ofa conflict.
"* In force planning, the means are taken to be future military forces and the ends arethe expected purposes for which those military capabilities are to be acquired.(Builder 1989, p. 53)
Thus, whatever definition is used, military strategy focuses much more on
the warfighting capability and war planning of our force levels than on any
organizational planning.
b. Business strategy focuses on organizational capability
Bryson defines strategic planning as: "a disciplined effort to produce
fundamental decisions and actions that shape and guide what an organization is, what it
8

does, and why it does it." (1988, p. 20) Building more o this definition, organizational
strategic planning involves assessing an organization, figuring out what it needs to do,
developing a plan to do that and then implementing that plan. A corporation conducts
strategic planning to help it identify threats against its place in the market and
opportunities which it wants to exploit to gain a higher market share and return on
investment. It wants to use strategic planning to be able to react to market changes by
having a plan with built-in flexibility--a mechanism which allows it to shift its
competitive strategy and not scuttle the generic aspects of its long-term plan.
An effective argument could be made that the Department of the Navy,
not realizing the difference between generic and competitive strategies, was caught when
the Union of Soviet Republics was disintegrating as a threatening conventional military
force. During this historic period, in an article entitled, "The Way Ahead," the military
chiefs of the Navy and Marine Corps wrote that although the "winds of change" were
blowing throughout the world, "our fundamental interests remain unchanged," leading
one observer to comment that "The Way Ahead," "looked and sounded a lot like the
past." (George 1992, p. 29)
Competitive strategy is something all military planners understood for the
past 45 years of the Cold War as we tried to match or better the Soviet Union's military.
In being overly concerned with the competitive strategy, however, we may have missed
out on some important generic strategies--for which we need an organizational strategic
planning process.
9
When one looks at the changes that have taken place in recent global
politics and the economic fluctuations which have caused deficit pressures here in the
states, the military needs to look to organizational strategic planning to complement its
military strategic planning to ensure that is has organizational resources and capabilities
to meet its missions. The business world is rich with examples of strategy formulation
and implementation which have been successful, from which the military can borrow.
B. THE MILITARY BORROWS FROMBUSINESS1. PPBS
The military has recognized the need for organizational strategic planning in
the past. A good example of the military adoption of a process from the business sector
was Robert McNamara's introduction, as Secretary of Defense, of the Planning,
Programming and Budgeting system into DoD. The PPBS was supposed to be, "an
advanced version of strategic planning." (Ansoff 1984, p. 188)
Keller (1990) states the purpose of the PPBS was "to produce a plan, a
program, and, finally a budget for the Department of Defense." This budget was then to
be forwarded to the president for approval and submission to congress for authorization
and appropriation.
McNamara, as Kennedy's Secretary of Defense, introduced this notion of a
program budget after the Rand Corporation had developed it the previous decade (Keller
1990). Before this time, the SecDef had not been involved in the services' budgeting
10
process other than to split up the total appropriation for DoD. McNamara saw this
process as an avenue to provide department-wide guidance on strategic issues and, of
course, their funding.
The PPBS was an attempt by McNamara to directly link defense expenditures
to missions. It also introduced guidance from the secretary in an attempt to get the
service budgets heading generally in the same direction.
2. PPBS not delivering strategic planning
While McNamara was in office, PPBS was introduced and used mostly as
intended. Once he left his position, however, PPBS lacked a champion. It reverted to
simply a budgeting system. Programs were tied to line items in the budgeting
process--and costs were calculated years out in the future.
The main reason PPBS failed as a strategic planning process was the failure to
convince leaders that it was either useful or doable. Klay (1989, p. 437), for example,
cited a study by Doh (1971) which found, "that those federal agencies that exhibited the
greatest effort to adopt PPBS were those in which senior leaders saw advantages to
themselves or to their agencies in doing so." In the instances where it failed, many felt it
was a threat to their authority. "A key element of both strategic planning and strategic
management is the repeatedly expressed intent to serve the needs of top officials." (Klay
1989, p. 437) A process which is formulated by threatening top leadership instead of
serving them is less likely to be utilized.
It will never be known if PPBS could have been an effective strategic
planning approach for DoD. What is known is that there was never any attempt to enlist
11

the participation of leadership in a manner which might foster ownership or commitment
(Klay 1989). It exists today, with each administration making its own changes to it, as a
functional budgeting tool--providing value in the process but not to the extent envisioned
at its inception.
3. Search continues for strategic planning approaches and tools
Since PPBS failed as an effective strategic planning tool, DoD continues its
search for other business approaches as substitutes. For some, the substitutes are quality
management techniques. For others, it is the use of strategic management. For still
others, it is the application of computer technologies to aid in organizational planning.
There are many alternatives in business from which to choose, but the avenue we wish to
explore in the thesis is the use of computers and software to facilitate organizational
strategic planning. To help the reader understand how computers can support the
planning process, we first must acquaint the reader with the basic steps of strategic
planning. That becomes the focus of the next section.
C. BASIC STEPS IN STRATEGIC PLANNING
There are many different models of organizational strategic planning: long range
planning (Ansoff 1984 ), comprehensive strategic management (Frederickson 1983), and
incremental strategic planning (Mintzberg 1991). Each has its advantages and
disadvantages. (See Byrson 1988, Ch. 2 for a review) We have chosen Bryson's model as
our starting point because it has several attractive features for DoD organizations.
12

1. Bryson's strategic planning model easier to use
Bryson's model relaxes the requirements of comprehensive strategic planning
and Tr-nagement which are difficult to implement in large public bureaus. It deals instead
with issues as they surface rather than attempting to link all organizational decisions in a
hierarchy of goals. Public organizations usually cannot afford the time and effort
necessary to do a full strategic planning process every time an issue becomes strategically
important. Even full-blown annual reviews are too time consuming for management.
Most firms are conducting comprehensive strategy revisions about five years apart and
are filling in the gaps by identifying and resolving the key strategic issues that emerge
from their analyses (Bryson 1988).
2. Considers political issues
Unlike most models, Bryson's model takes into account the political context
of public bureaus. Given our system of governance, policy and strategy formulation are
not the province of one person. Many people are involved in the process and myriad
views must be taken into account. Thus, public bureaus operate in an arena of shared
power. This occurs because historically, the executive branch and congress must share in
the policy-making process. For example, the secretary of defense, in formulating strategy
for the DoD, does not control his own budget, his personnel, or even his organizational
structure. He sets DoD policy with the president, congress and their staffs.
3. Focus is on managing change
Eadie (1989, p. 173) defines a strategic issue as: "a problem or opportunity
that, if action is not taken now, is likely to saddle the organization with unbearable future
13

costs." The purpose of strategic issues management is to provide balance between an
organization and its environment. Selective issues are chosen and dealt with as they
surface opposed to a comprehensive planning process which links decisions through a
rational, formal procedure (Roberts 1991). Strategic issues management focuses on,
"developing and managing a change agenda, whose basic result is the maintenance of a
favorable balance between organization and environment." (Eadie 1989, p. 17 1)
Strategic issues management (Eadie 1989, p. 171) involves:
"* identifying and selecting strategic issues;"• formulating strategies to address the issues;"* and managing implementation of the strategies.
Most strategic plans are done with the realization that benefits are in the future
and that the process will be a long-term commitment--five to seven years is the estimate
from Ansoff (1984, p. 199). Bingman (1989) singles out DoD as a candidate for
strategic issues management, but says it has yet to catch on. Eldridge writes, "Currently,
there are few reasons for government managers to apply the principles of strategic
(issues) management. After all, implementing change is both difficult and threatening."
(1989, p. 333)
14

4. Bryson's model for strategic Issues management'
Bryson's eight-step model of strategic planning (see Figure 2-1).
F.aig 2-1 arysons e.gh..... strategic planning process
2te 1d.Intiain;rgaulandAgeing ondaStates i lnigPoes h ntao
oth pCessimust decidetwonal Mission and Votieto. .ationnd t .. e.r..u eWvrontment: " ppose of th reetsprocess; heroe, f ntions, al envirsiameoth strategic anl tean. and
W6 Xeufin the i stagklitsue faclug an ouauIaomom e Fofnneesary tstrIets to Manage the Issuef.
deisionFmgkre and . Broup nsw beight-step sntraegpanicg plann rocessistenxtak
Step 1. Initiating Orandgeingtional Strdategic Plninhroes.Te aet inisth tiato
ofgaithisproces must decd whyon telkeyvecissionmk are ti e fa ountderthe
oraizationorantd getnthironsens, us onrfcino the proe ofgthezeffort, preerrdastep ins h
prces;theoleuncthispones, andl mebership oft inalna ho-the staeiplnngteam; aperndt
commitentsiofnecessarieourhes toar ceedll wirth ftheeffrati." prdentsyin which a
decisionFmakrs and .group ns wlbeinvolvted inrathegpaning plann rocessistenxtak
Step 2. nlitiapetig aureing O iztonalt an teos. Thse areethein tat anto
orgaizthisPones must do.id who bhelievesithat manyr oraneizainsid fail tofullysuderstand
mraisstion-orintd genvthironmentsut clofcaino theproe orgaiztieefon's manerrdastep is h
prAls;theoleughcthispocess will meberlaid out inalnaaho-the staeiplnngteps; aperngdt
happitentsinfsucessireon-heurces atual pareewth ofatheeffrative proessyin whichca
hraveato multiple.stepsocurng beivsitatmulaneosy. Alsonimpemnations maltofly aertually
begin before all of the steps are completed.
15

important to ensure that all participants in the process understand their mandate and
support it.
Step 3. Clarifying Organizational Mission and Values. "An organization's
mission, in tandem with its mandates, provides its raison d'itre, the social justification
for its existence." Organizations must always be the means to an end, not an end
themselves. For a DoD organization this could be providing security for American
embassies, training entry-level servicemenbers, or providing humanitarian assistance in a
struggling nation.
A stakeholder analysis should be conducted by the organization prior to the
mission statement being written, "because the key to success in public and nonprofit
organizations is the satisfaction of key stakeholders." A stakeholder is defined as, "any
person, group, or organization that can place a claim on an organization's attention,
resources, or output, or is affected by that output." Members of congress, the president,
and the taxpayers would all be considered stakeholders for DoD organizations.
Step 4. Assessing the External Environment. "The planning team should
explore the environment outside the organization to identify the opportunities and threats
the organization faces." The focus should not be only on the threats, as many
organizations do, but also on the positive gains to be realized from opportunities. These
opportunities and threats often are not monitored by organizations. Consequently they
lose track of what is happening in the larger world which might effect the organization.
For a DoD organization this might take the form of community concern over a planned
16

base expansion or closure, or the effects on the civilian populace of conducting training
at night.
Step 5. Assessing the Internal Environment. Strengths and weaknesses are
what the organization should be concerned with internally. Information is needed on
resources such as personnel, equipment and training areas. Organizations sometimes find
it hard to get a clear picture of what their present strategy is--not necessarily what is
documented, but what is actually the practice. Measuring performance is difficult for
most DoD organizations as most mission outputs do not yield quantitative results. Yet,
even though this step is difficult, the DoD will continue to be challenged to prove its
effectiveness and efficiency as a military force. An absence of performance criteria by
which to grade units may also cause more serious organizational conflict--thereby
degrading unit readiness.
Step 6. Identifying the Strategic Issues Facing an Organization. The first five
steps culminate in this step. "Strategic planning focuses on achievement of the best 'fit'
between an organization and its environment." Organizations need to respond quickly to
strategic issues or they will find that they have lost the advantage of an opportunity or
been hurt by a threat.
Strategic issues, virtually by definition, involve conflicts of one sort or another.The conflicts may involve ends (what); means (how); philosophy (why); location(where); timing (when); and the groups that might be advantaged ordisadvantaged by differcat ways of resolving the issue (who). In order for theissues to be raised and resolved effectively, the organization must be prepared todeal with the almost inevitable conflicts that will occur.
The statement of the strategic issue should contain three elements:
17

"* A single paragraph description of the issue--framed as a question which theorganization can do something about.
"* A list of the factors which makes the issue a policy question."* A definition of the consequences of failure to address the issue.
Bryson provides three basic approaches to identifying strategic issues:
"* The direct approach"* The goals approach"* The "vision of success" approach (Barry 1986)
The direct approach involves going straight from a review of the mission;
strengths, weaknesses, opportunities, and threats (SWOTs); and mandate, to identifying
strategic issues. Bryson evaluates this approach as having the best application for
governments and public agencies--when there is no agreement on goals. It is best when
no one authority figure in the hierarchy can impose goals on the other members.
"The goals approach is more in line with (comprehensive strategic planning),
which stipulates that an organization should establish goals and objectives for itself and
then develop strategies to achieve them." When there is traditional authority at the top of
the structure which can impose goals on others, then the issues will involve how best to
translate goals and objectives into actions. This approach is seen as having applicability
to nonprofit or a single-function public organization.
The vision of success is where the organization visualizes its "best" picture of
itself in the future and then moves from where it is now to that vision. This process
works best when it will be difficult to identify goals and objectives. It is seen as having
the most relevance for a nonprofit organization.
Step 7. Formulating Strategies to Manage the Issues. Bryson likes to use a
five-part strategy development process as follows:
• Identifying the practical alternatives and visions for resolving the strategic issues.
18

* List the barriers to achieving those alternatives and visions.* Develop major proposals to achieve the alternatives and vision and to deal with the
barriers.* Identify the actions necessary to implement the proposals (two to three years).* Spell out a detailed work plan to implement the actions (six to 12 months).
Strategies must also be evaluated for their effectiveness based upon political, cultural,
social, ethical, moral and legal factors prior to their implementation.
Step 8. EsWtablishing an Effective Organizational Vision for the Future. This
description of what an organization should look like can include such things as core
values, unit mission, evaluation criteria and important rules and regulations. When this
description is well known by the employees of an organization it frees them to act on their
own initiative in positive ways.
Most organizations are unable to generate a vision of success until they have
gone through several iterations of the planning process. "A challenging yet achievable
vision embodies the tension between what an organization wants and what it can have.
(Bryson 1988, p. 61) This tension is what occurs when we as individuals stretch our
current realities and attempt to move toward our personal vision (Senge 1990).
Organizations want vision that motivates and spurs people to action but not so daunting
that it demoralizes them into nonaction (Bryson 1988). Figure 2-2 (page 21) represents
Bryson's model.
I skate to where I think the puck will be. Wayne Gretzky
Bryson (1988) uses this quote to illustrate his concept of strategic thought.
While Gretzky's quote seems common sense, Bryson feels it is an example of his planning
process. In the context of the strategic planning process just outlined, the comment
19

takes on a fuller meaning. To skate to where the puck is, Gretzky has to know the rules of
the Same, the potential moves of the players, the playability of the ice, the way the puck
moves over the ice and how fast he is. He has to consider the threats, opportunities,
strengths and weaknesses of both teams; the environment; an appropriate vision (winning
perhaps); and what the issues are facing his team. He does many of these
simultaneously-skipping some-and all the while iterating through the process
continuously until the game's end. To those who would say that Grtezky engages in
tactics, adapting Clausewitz's (1976) definition of strategy and tactics reveals
this-Tactics constitutes the theory of the use of hockey players in controlling the puck;
strategy forms the theory of using the puck to win the game.
The two primary challenges instituting this strategic planning process, as with
any under consideration, will be managing the information needed to support the process
and formulating the decision process with a complex set of stakeholders. Assistance in
managing the information is offered in Chapters IV and V of this thesis.
A. CONCLUSIONS
This chapter has set a foundation for strategic thought and planning which can be
used to evaluate the use of computer applications to assist planners. Chapter M will
discuss the various ways computers can assist humans in mapping thoughts, choosing
alternatives and making decisions. It will also introduce approaches currently being used in
the business world to accomplish some of the tasks inherent in strategic planning, as well
as the two packages that this thesis will evaluate.
20

IO
I -.I0
I+
a UL
EI
I .~~~1 .
III. STRATEGIC THINKING WITH COMPUTERS
As computer programs for business applications continue to enter the market in
larger and larger numbers, there exists a larger pool of possible applications for use by
government and Department of Defense (DoD) agencies. As the availability of
microcomputers has proliferated to the desktops of managers and commanders, so has the
demand for applications which can assist in an assortment of tasks--whether it be daily
reminders, word processing or strategic planning.
How do management support systems work and how might they assist in strategic
planning? This chapter will discuss decision support systems, cognitive mapping with
computers, the analytical hierarchy process, and introduce the two software applications
evaluated in this thesis--Graphics COPE and Expert Choice.
A. DSS/GDSS
1. DSS and GDSS defined
Decision Support Systems (DSS) and Group Decision Support Systems
(GDSS) have become valuable tools for decision makers and strategic planners. A
L!cison Support System is an interactive information system that relies on an integrated
set of user friendly hardware and software tools to produce and present information
targeted to support management in the decision making process (Long 1990, p. 288). A
22
Gru Decision Support System is a DSS that can facilitate solutions of problems by a
set of decision makers working together as a group (Turban 1990, p. 834).
The four major characteristics of a DSS are:
"* they incorporate both data and models;"• they are designed to assist managers in the decision making process of
semistructured or unstructured tasks;"* they support, rather than replace, managerial judgment; and"* they are designed with the objective of improving the effectiveness of the decisions
that are made, rather than the efficiency with which they are made. (Turban 1990,p. 9 )
A DSS supports decision making. It is not designed to replace a decision
maker's judgments, but rather it is a tool which should support them. DSS are designed to
support decision making processes involving semistructured and unstructured problems.
It is a set of decision support tools that can be adapted to any decision environment. It
makes general-purpose models, simulation capabilities, and other analytical tools
available to the decision maker. It provides rapid responses to a user's request for
information and has the capability of interfacing with the corporate data base (Long
1990, p. 290).
With advances in technology and the continually increasing use of personal
computers both at home and in the office, the DSS is becoming a popular planning and
decision making tool. Decision makers at tactical and strategic levels are often
confronted with complex decisions that are affected by factors that are beyond a human's
ability to properly synthesize. These are the types of decisions where a DSS should be
utilized (Long 1990, p. 289).
23
2. Major components of a DSS
A DSS is comprised of three major components: Data Management, Model
Management, and the Communication or Dialog subsystem. The Data Management
component includes the database of relevant information and the database management
system that manages it. The Model Management component is the software that includes
the quantitative models that provide the system's analytical capabilities. The
Communication or Dialog subsystem is the system that allows the user to communicate
with and command the DSS.
The data management subsystem is composed of a DSS database, a database
management system, a data directory, and a query facility (Turban 1990, p. 119). The
DSS database is an organized collection of data that is relevant to the needs and structure
of the organization. The database is created, managed, accessed, and updated by a set of
software programs known as the database management system. The data directory is a
list of all data, including data definitions, in the database. The query facility of the data
management subsystem provides a means for the user to access the data. A query
language is used to request, select, and manipulate data.
The model management subsystem of the DSS contains a model base that
consists of financial, statistical, managerial, and other quantitative models. These models
provide the DSS with analytic capabilities. Three types of models in the model base are:
strategic, tactical, and operational (Turban 1990, p. 119).
24

Strategic models are broad in scope and generally cover a time frame of
several years. They are used to support top management's strategic responsibilities.
Developing corporate objectives, planning for mergers and acquisitions, nonroutine
capital budgeting, and environmental impact analysis are examples of strategic model
applications (Turban, p. 119).
Tactical models are often used by middle management of an organization to
assist in allocating and controlling resources. They cover a time frame of one month to
less than two years and are usually only applicable to an organizational subsystem. Labor
requirement planning, sales promotion planning, plant layout determination, and routine
capital budgeting are examples of tactical model applications (Turban, p. 120).
Operational models help first-line managers with decision making in a daily to
monthly time frame. They support day-to-day activities. Production scheduling,
inventory control, and quality control are examples of operational model applications
(Turban, p. 120).
The communication, or dialog, subsystem of the DSS contains the hardware
and software that provide the system with a user interface. The user interface allows for
bi-directional communication between the DSS and the user. The user interface is an
extremely important component of the DSS. An effective user interface provides for
good human-machine interaction and a system that is easy to use or "user friendly."
When the user interface is ineffective or poorly designed, managers become reluctant to
use and rely on the DSS (Turban, p. 124).
25

Figure 3-1 shows the capabilities and characteristics that are provided by the
three major components just described. (Turban 1990, p. 11).
For Groups terdependentland orSeqential
Individuals
For Intellit Differts , Choice
Levels
SSupport Vanietyof Decision Styles
Unstructured and and ProcessesSemustructured rDecisions
Humans Control Effectiveness,
the MachineNoEfficiency
Figure 3-1. DSS Capabilities
3. Benefits of using DSS/GDSS
"Troday's global economy dictates that a world class enterprise have a rich
decision making process." (Dyer, p. 1). Decision support methods and tools are used to
26

gather and process data, and also to assist with the task of mapping large amounts of
information to help the decision maker arrive at the best possible solution.
Information is critical to the decision making and strategic planning processes.
As situations become more complex, greater amounts of data and information must be
considered. Extensive amounts of time must be spent obtaining and analyzing the
information before any planning can be done or a decision can be made. As more
competing factors and alternatives are added to the decision process, more investigation
is required by an organization before a decision can be reached or a solution is obtained.
As factors relating to the situation change, the outcome of the process is sure to be
affected.
DSS enable managers to use modeling techniques for structuring the
information associated with complex problems. They provide statistical analysis tools
that can be used for such common applications as risk analysis and trend analysis (Long
1990, p. 93).
DSS provide the decision maker with the opportunity to engage in "what if'
scenarios to determine what effect a change in one or more decision variables will have
on the outcome. Some DSS provide the ability to "goal seek" or determine that value of a
decision variable that will attain the goal that is desired (Forman 1992, p. 125). These
qualities give the user the ability to try several different strategies under various
situations and configurations, quickly and objectively. This gives the planner the ability
to explore various forecasts for the future.
27

DSS provide tools for presenting data in a variety of reports and graphical
forms. This feature facilitates communication between levels of management in an
organization (Long 1990, p. 91). Many DSS also possess the capability to link or
consolidate data from other software. Some other benefits of a DSS include the ability to
quickly recall ideas and information to allow a problem to be revisited, and the ability for
uncovering the justification for conclusions and recommendations through the use of an
audit trail (Buede 1991, p. 19).
Many organizations have been successful using DSS for a variety of
applications. Some of the most common applications come in the areas of marketing,
financial planning, resource allocation, engineering, manufacturing and operations. Less
work has been done in the area of strategic planning. This is probably because the area is
less well-defined and the payoffs are not as visible, measurable, or immediate as in the
areas listed above (Mockler 1989, p. 104).
4. Strategic planning software design approaches
Strategic planning is a very difficult task for today's managers. The fact that it
involves all functional areas of an organization and many outside factors, along with
uncertainties of the future, makes it an unstructured decision situation and a candidate for
DSS applications (Turban 1990, p. 106). A DSS can help ensure completeness, increase
productivity, and enhance the communication process in any organization (Buede 1991,
p. 19).
As stated earlier, there has not been as much software development in the
strategic planning arena as there has been in other business areas. But planning and
28
allocating of scarce organizational resources--personnel, capital and timt --becomes more
important and use of personal computers more prevalent, more applications will be
developed.
Beude (1991) classifies decision theory software into five categories:
" Structuring--packages that support only the problem-structuring function thatprecedes the analysis function.
"* Multi-attribute utility analysis--packages that automate the hierarchical structuringof evaluation criteria, assignment of weights to criteria and scores to options, andcomputation of weighted scores across all criteria.
"* Value matrix--packages that assist the user in creating a matrix of options andcriteria for the purpose of developing a weighted score for each option across allcriteria.
"• Decision tree--packages that support the analysis of uncertainty, values, and riskfor multiple, sequential decision options.
"* inference--packages that support only the probabilistic analysis of nested orsequential events. (Buede 1991, pp. 25,26)
The first software analyzed in this thesis is Graphics COPE. It is considered a
problem structuring application, and although it has no analytical analysis capability, it
could assist in forming a model that could be analyzed by other packages (Buede 1991).
Buede considers it "a powerful structuring tool for the trained analyst." (1991, p. 41,
emphasis added)
Expert Choice, the second software package evaluated, is considered a
multi-attribute utility analysis package. Its multiple elicitation aids, one-way sensitivity
analysis, rational storage and several other features are considered excellent (Buede
1991). It does no problem structuring.
A selected list of sources for other computer software which have strategic
planning applicability is contained in Appendix A.
29

B. PROMINENT APPROACHES TO DESIGN OF
STRATEGIC PLANNING SOFTWARE
1. Problem Structuring
One of the five software categories (Buede 1991) is problem structuring.
Packages which support this function precede the analysis function and assist in
providing the following:
"* an understanding of the situation;"* an appreciation of what is not known;"* a list of alternative actions that could be taken, and"* a plan for selecting among alternatives. (Buede 1991, p. 3)
Graphics COPE uses cognitive mapping and the SODA technique to structure a problem
so that a group can reach consensus about its issues, goals and an action plan. It does so
by taking individual construct maps and, through the skill of an expert facilitator,
aggregates them into a group map. Through this process, the individuals grasp ownership
of the group situation and see how their individual constructs are linked to other
members' concerns. With individual concerns addressed and "on the table," participants
are much more likely to form a group consensus on problems and their solutions (Eden
1990).
a. Cognitive mapping
As already discussed, a DSS uses a database. For this information to be of
value to the user, it must first be organized into appropriate categories (Mockler 1987).
Cognitive mapping does that for the decision maker by first building a personal construct
map, such as Figure 3-2. By using a physical construct of the issues, goals, options and
other various inputs, it can give a graphical picture of the situation as the planners "see"
30

it. It provides elements of the thoughts rather than the thinking itself (Eden 1992).
It helps participants converse when their concepts and words are identical but the
meanings attached to them are very different. The reality that one person has is not the
same reality for the next person in the group. The facilitator must elicit this reality from
each person and then "construct" a group reality--a starting point for further group
efforts.
17 good model ofproblem ... ý,>poormodel of problem
2 betteranticipation..
1 >client more open..client just ___
S answering the8 demnonstrating an questionsinterest in what theAclient is saying ... /
60 'catching out the34 client knows that client ... allowing
1,.;. -. t ,.client to be human
Figure 3-2. Cognitive map.
Shown above are concepts entered onto the screen in text which are linked
to other concepts. The overall map then reveals one person's view of the reality of the
31

problem. These individual maps can then be aggregated into a group map so that every
person's issues are surfaced, addressed and placed into a larger whole. Once this is done,
ownership of issues can be given up to the group and all individuals can go on to discuss
the "group" situation. The group then needs to sort through their differences and to
establish a map on which they can work. This is what aggregated cognitive mapping does
for issue identification and strategy formulation.
Once a cognitive map is construed, analysis is performed:
"* to establish the goals, options, assumptions, etc., within the map hierarchy and therough shape of the model;
"* to establish where closely connected clusters of argument indicate key elements inthe policy debate;
"* to show how "robust" conclusions were: whether they were weakly or stronglysupported by argumentation; and finally,
"• to identify those potential options that have consequences in many areas V. ithin thepolicy debate.
Mapping information is entered into the database for analysis and
presentation. Cropper (1990, p. 6) says, "analyses are based primarily on the structure
that is created by selective linking of the concepts." In other words, analyses come from
the constructs which are entered into the model--both the positive and negative poles, and
the links which are drawn between nodes.
The aims of cognitive maps are numerous and Eden (1990) lists those
gleaned from workshops and interviews with senior managers as:
"• an instrument to help negotiation towards best solution,"• a way of 'hearing several people at once' by setting the views of one person in the
context of the ideas of the others,"* a method for providing structure to multiple and conflicting aspects of
argumentation,"• a method which is designed to suggest action to resolve issues,• a method for developing a consensus about a system of goals,* a method that does not violate the natural role of discussion,
32

"* an efficient way of avoiding 'group-think' and 'bounded vision,'"* a designed scheme for attending to both the content of issues and to the need for a
recognition that people change organizations"* a designed environment for ensuring effective decision making. (Eden 1990, p. 36)
b. Strategic Options Development and Analysis
SODA is a group decision support system (GDSS) which uses a facilitator
to capture both individual and group views on the issues, information and alternatives of
a problem. Further, SODA:
"* uses the technique of'Cognitive Mapping' to capture wisdom as a qualitativemodel,
"• uses specially designed computer software--Graphics COPE--as a tool to aid therepresentation and analysis of cognitive maps,
"• through the computer software, can act as a GDSS at meetings of the decisionmaking team,
"* provides interactive support to a group by recording, modifying, analyzing andrepresenting in 'real-time.'
The SODA technique can best be represented by talking about the six
stages and the activities which occur in each.
Stage one--the interviews. Interviews are conducted on key individuals
involved in the process, as well as those who could sabotage the outcome. The primary
aim of this stage is eliciting data, which is added to the personal knowledge base as it is
received. This data is added to the cognitive map being constructed so that the map may
be used interactively during the interview. (Eden 1990)
Stage two--computer modeling and analysis using Graphics COPE. The
facilitator(s) use(s) Graphics COPE to construct a "model of the knowledge and
arguments she discovers." (Eden 1990, p. 36) Goals, assumptions and key issues are
identified. Analysis is performed to refine the issues as well as to set the agenda for an
33
action-oriented workshop. The analyses may then be used by the facilitator to gather
some sense of how to run the workshop (Cropper 1990), which is next.
Stage three--workshop one. This workshop, a focus group meeting, is
conducted to promote issue awareness and focus discussion by using the aggregated
individual maps which have been generated by the facilitator. As this process continues,
the personal knowledge base increments into an organizational knowledge base.
Stage four--computer modeling and analysis using Graphics COPE. The
facilitator focuses the group discussion onto the relevant issues through the group
cognitive map and moves the group toward developing consensus and resolving conflict
(Eden 1990). This process begins to yield an organizational memory, or corporate
memory as it is often called, which the group can continue to tap into. "Cluster analysis
can be used to...create groups of constructs which are relatively densely connected within
each group and more weakly connected to members of other groups. Graphics COPE
also provides an analysis of the relationships between each group so that a summary map
of the groups can be created." (Cropper 1990, p. 14)
Stage five--group decision support system workshop. Now that the
cognitive map is fully robust and analyzed for a coherent theme to its contents, it is time
for the group to come up with its action plan. They do this by drawing upon the
organizational memory that has been building the model up to this point, as well as
setting action plans to achieve goals previously identified.
34

Stage six-control and review. This is where the action plan that has been
designed is monitored and evaluated as it is implemented. Changes to the model can be
made as necessary.
Eden (1990) offers the following as typical outcomes of SODA projects:
"* a clear statement of goals and strategic direction,"* a management team with a common understanding and commitment to action to
deliver selected policies,* a focus or specification for research into new areas of business, or key assumptions
revealed through Graphics COPE,"* a comprehensive business model which can be used as a decision support tool by
members of the management team, and"* an action package with time scales and responsibilities identified.
a Graphics COPE tie-in
While SODA is a GDSS in its own right, the powerful analysis tools
available though the processing capability of Graphics COPE make the two a formidable
team. Whether it be analysis of concepts, clustering of sets or map construction, Graphics
COPE has the ability to provide the outcomes just listed.
2. Structuring through Hierarchy
Often, decision making and strategic planning are made difficult by the
diversity of the information that is available. In today's increasingly technological world,
strategic planning is dependent on a complex system of interacting elements. For
example, the economy of a country is highly dependent on its energy and resources. The
available energy is highly dependent on geography and politics. Military strength of the
country has a great influence on politics. Technology plays an important role in the
military strength of a nation, and is itself reliant on ideas and resources. Ideas are
35
contingent on politics for their acceptance and support. It is easy to see that in a
complicated network of factors, causes and effects are not clearly identifiable (Saaty
1990, p. 4).
According to psychological theory, the human brain has a limitation of its
short term memory capacity to about seven items (Miller 1956). When complex
problems are broken into groups and subgroups, the human mind is then more capable of
making judgments and comparisons. The solution to solving complex problems does not
lie in a more complicated way of thinking, but instead in one of organizing the factors of
the problem into a framework that can be understood (Saaty 1990, p. 5). When the
problem is organized into a structured hierarchy, the user or decision maker can then
capitalize on his or her own personal experience and knowledge in solving the problem.
This is the theory behind The Analytic Hierarchy Process (AHP).
a. The Analytic Hierarchy Process
The Analytic Hierarchy Process was developed by mathematician Thomas
L. Saaty in the early 1970's at the Wharton School of the University of Pennsylvania.
Saaty's theory had its beginnings while he was working on problems of contingency
planning for the Department of Defense in the fall of 1971 (Saaty 1980, p. ix). AHP is
designed to assist decision makers in making logical and unbiased decisions while
considering their expertise, preferences, experience, and instincts.
AHP is based on three principles: the principle of constructing hierarchies,
the principle of establishing priorities, and the principle of logical consistency (Saaty
1990, p.17). The principle of constructing hierarchies is based on the concept of breaking
36

down complex problems into like elements or homogenous clusters, usually ranging
between five and nine elements. With this approach, the human mind is better able to
perceive a complete picture of the situation. When attempting to gain a complete
understanding of a situation, it is natural for the human mind to make judgments and
comparisons between similar elements against certain criteria. This is the basis for the
principle of establishing priorities (Saaty 1990, p. 17). The third principle of AHP,
logical consistency, is based on the ability of the human mind to establish relationships
among ideas or objects in such a way that they relate well to each other and their
relations exhibit consistency (Saaty 1990, p. 18).
However, before AHP can be effectively utilized, a complex problem must
be correctly defined and all of the issues and details associated with the problem must be
identified (Saaty 1990, p. 222).
b. Making judgments through comparisons
AHP gives decision makers the ability to model complex problems using a
hierarchical structure that shows the relationships of goals, criteria, uncertainties, and
alternatives (Dyer, p. 12). It provides the user with a framework which formulates the
problem into a hierarchy (Forman 1992, p. 221). The user defines the problem by
grouping elements together that share the same properties until a top level or goal node is
reached. The user then enters all of the separate elements or criteria for the problem.
Criteria can be further subdivided into subcriteria. The user instructs the AHP as to
which variables are the most important by making comparisons among criteria and
37

subcriteria based on their own knowledge, experience, values, and expertise. The user is
asked to pairwise compare all of the criteria and subcriteria. The comparisons are made
on a scale based on the relative importance of the paired criteria. For example, the user is
asked how much more important is criteria A than criteria B with respect to another
criteria. That is, are the criteria equal in importance? Is one moderately, strongly, or
extremely more important than the other? The decision maker makes a verbal judgment
and AHP weights the criteria based on those judgments. Figure 3-3 shows the integer
values assigned for the verbal comparisons.
ng Definition
I Equal importance
3 Moderately more important
5 Strongly more important
7 Very strongly more important
9 Extremely more important
2,4,6,8 Intermediate values for greater accuracy
Figure 3-3. Integer values
AHP incorporates both the qualitative and quantitative aspects of the way
humans think. Defining the problem and the hierarchy is the qualitative part. The ability
to express judgments and preferences concisely comes from the quantitative aspect
(Saaty 1990, p. 18).
38

C. Advantages of AMP
The AHP pursues judgments from people by asking the right question that
produces the intended answer (Saaty 1991, p. 29). If the inappropriate question is asked,
the results are not likely to make sense. Figure 3.4 shows the advantages of using AHP
for problem solving and decision making (Saaty 1990, p. 23).
Processuty Complexity
Repitition
Judgement and InterdependenceConsensus
Tradeoffs A Hierarchic
Synthesis MeasurementConsistency
Figure 3-4. AHP advantages
The advantages displayed in Figure 3-4 are explained in detail as follows:
"* UNITY-The AHP provides a single, easily understood, flexible model for a widerange of unstructured problems.
"* COMPLEXITY-The AHP integrates deductive and systems approaches insolving complex problems.
"* II UERDEPENDENCE-The AHP can deal with the interdependence of elementsin a system and does not insist on linear thinking.
39
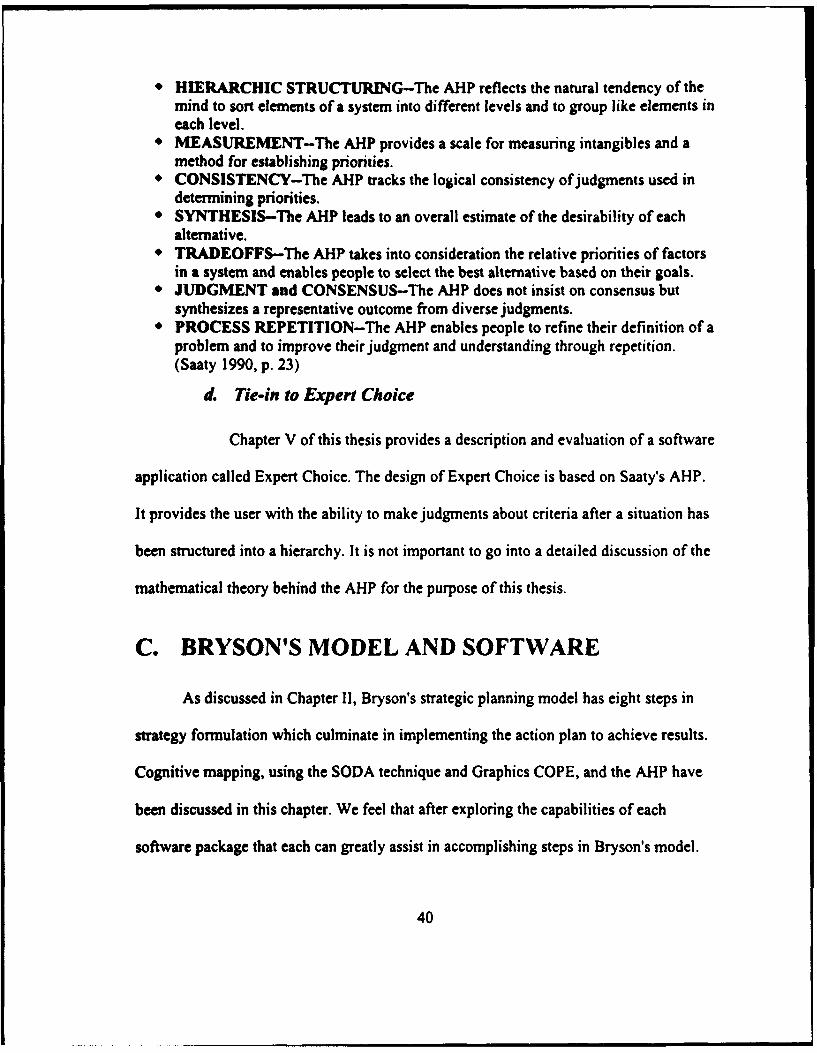
"* HIERARCHIC STRUCTURING-The AHP reflects the natural tendency of themind to sort elements of a system into different levels and to group like elements ineach level.
"* MEASUREMENT-The AHP provides a scale for measuring intangibles and amethod for establishing priorities.
"* CONSISTENCY-The AHP tracks the logical consistency of judgments used indetermining priorities.
"* SYNTHESIS-The AHP leads to an overall estimate of the desirability of eachalternative.
"• TRADEOFFS-The AHP takes into consideration the relative priorities of factorsin a system and enables people to select the best alternative based on their goals.
"* JUDGMENT and CONSENSUS-The AHP does not insist on consensus butsynthesizes a representative outcome from diverse judgments.
"* PROCESS REPETITION-The AHP enables people to refine their definition of aproblem and to improve their judgment and understanding through repetition.(Saaty 1990, p. 23)
I Tie-in to Expert Choice
Chapter V of this thesis provides a description and evaluation of a software
application called Expert Choice. The design of Expert Choice is based on Saaty's AHP.
It provides the user with the ability to make judgments about criteria after a situation has
been structured into a hierarchy. It is not important to go into a detailed discussion of the
mathematical theory behind the AHP for the purpose of this thesis.
C. BRYSON'S MODEL AND SOFTWARE
As discussed in Chapter II, Bryson's strategic planning model has eight steps in
strategy formulation which culminate in implementing the action plan to achieve results.
Cognitive mapping, using the SODA technique and Graphics COPE, and the AHP have
been discussed in this chapter. We feel that after exploring the capabilities of each
software package that each can greatly assist in accomplishing steps in Bryson's model.
40

Graphics COPE, as a problem structuring program, can be applied to the first six
steps of the model. These steps deal with identifying mission and values, mandates,
strengths, weaknesses, opportunities and threats, and issues. They involve people inside
and outside the organization. This portion of the process enables participants to have
graphical representation of the issues and the possible alternatives to solve them.
The 7th step could use cognitive mapping to identify practical alternatives,
barriers to those alternatives, and proposals to overcome those barriers. But Graphics
COPE provides no capability to do any ranking, inferencing or strategizing. This portion
of the process could be handled by Expert Choice. Expert Choice can handle ranking and
inference problems. Once the issues and alternatives are decided upon, then Expert
Choice is one of the most powerful analytical tools for ranking or inferencing problems
(Buede 1991).
The strengths and weaknesses of each application should be more clearly detailed
in the evaluation chapters--Chapters IV and V.
41

IV. GRAPHICS COPE
A. INTRODUCTION
This chapter provides an evaluation and description of the computer software
application named Graphics COPE. It is designed to aid in building cognitive maps but
has uses in other areas as well. The cognitive map may be entered in Graphics COPE and
then analyzed using tools Graphics COPE provides. Although Graphics COPE allows
constructs and interconnections to be shown, it is a text based program and thus has its
limits. It does not provide the capability for quantitative analysis.
COPE (DOS application) is a command-line driven software application in use
for over ten years to build and analyze cognitive maps. After the cognitive map is entered
into the computer, the user can use the various tools available to analyze the map and
explore other avenues or links of the map. Graphics COPE (Windows application)
builds on this beginning by using the power of graphical interface of windows
presentations to display the maps in various font sizes and graphical representations of
arrows to represent links between concepts. Although a command line is also available in
Graphics COPE, it is less necessary because commands, such as concept entry and
editing, can be done directly on the map. (Moriarty 1992, p. 7)
As discussed in Chapter Ill, cognitive mapping is relating perceptions of the
problem, or issue, together, in order to construct a view, or map, of the interrelationships
42

formed by the identification of the goals, issues, strategies and actions. The Graphics
COPE model consists of concepts, which usually have positive and negative
poles-referred to as bipolar concepts--and the links which connect them (Figure 4-1). As
stated earlier, Graphics COPE is not a quantitative application, rather it is an application
designed to enable the user to identify and better understand the issues which are
important and how they are linked to each other to imply consequences and explanations.
Referring to Bryson's model discussed in Chapter III, Graphics COPE is very well
suited for use in steps I through 6. Its strength lies in assisting the user identify the
mandates, environment, missions, values and strategic issues which are involved in the
strategic planning process. Because Graphics COPE involves constructing a network
rather than a hierarchy, it is not effective in giving guidance for the outright selection of
the best option or even rank ordering the options available. It therefore is limited to a
support role in step 7 of Bryson's model--an identifier of the many factors which will
affect the choice of strategy.
By virtue of its graphical representation of the issues under consideration, it
assists greatly in the description of the organizations' "vision of success" (Bryson 1988,
p. 51), step 8 in the model--and the last step before strategy implementation.
B. MAP BUILDING
The key element of Graphics COPE is its "permanent graphical mapping."
(Moriarty 1992, p. 9) The user inputs ideas and relationships into a graphical map on the
screen. The model is permanent because it can be saved and retrieved to be viewed or
43

edited. The following sections are abridged from the Graphics COPE Reference Manual
(Moriarty 1992).
Graphics COPE has a powerful analysis programming language built into it. GCL
is aimed at two target audiences: the end users and the support programmers. The end
users are given powerful commands to assist in analysis and to allow easy access to data.
Through GCL, the programmer has access to the heart of Graphics COPE and capacity
for advanced analysis and modification.
1. Creating a model
From the File menu, select New Model option to create a new model. If there
is a model of the same name you enter, you will be asked if you want to open that model.
Graphics COPE will not overwrite an existing model. Otherwise, it will present you with
an empty model with the name you have requested. To load an existing model you select
the Open Model option and choose the name of the model from the model dialog box.
Graphics COPE will then load that model onto the screen and is now ready to receive
concepts or edit existing ones.
2. Entering Concepts into the computer
Once a group or individual has determined the issues that affect the problem
under consideration, it is relatively easy to enter these concepts into the computer. The
user merely double-clicks the left mouse button anywhere on the screen and then
proceeds to type in the text of the issue and hit the [Enter] key. Concepts are
44

automatically numbered sequentially as they are entered into the computer, although you
may manually override this system and edit any numbered concept you choose.
Concepts are entered into Graphics COPE as a short statement with two
contrasting parts.
HAPPY rather than SAD
This would be an example of a concept with two poles. The first is referred to as the
emergent (or positive) and the latter is the contrasting (or negative) pole. Concepts are
entered with a single dot separating the poles.
HAPPY.SAD
Concepts are limited to 159 characters each. Although this may seem to limit
the size of the concepts, it actually should not take 159 characters to express a single
concept. If more than 159 characters are needed, then there is probably more than one
concept contained in the text. As mentioned, text numbering is automatic and lies in the
range from I to 29,999. (Moriarty 1992)
Bipolar concepts have already been described, but there are five other
concepts which Graphics COPE uses. Assertions do not naturally have an opposite pole
and are entered as follows:
...The dollar is falling
and will be displayed as:
The dollar is falling ... The dollar is falling
45
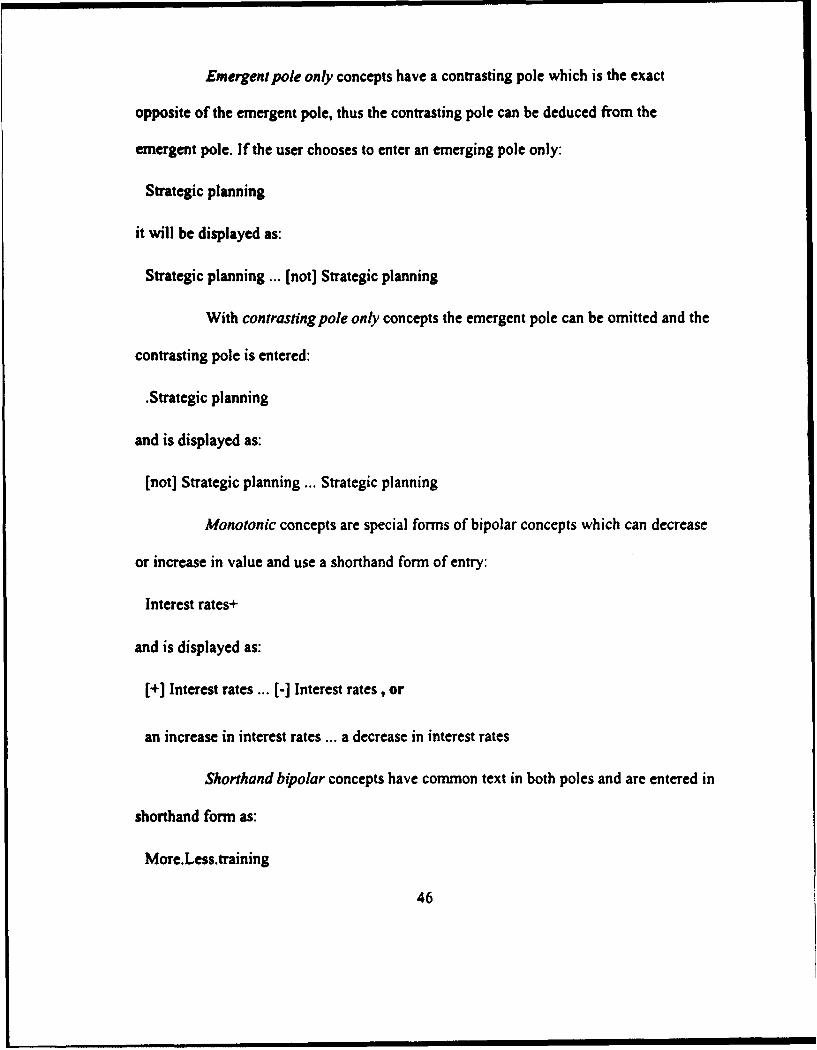
Emergent pole only concepts have a contrasting pole which is the exact
opposite of the emergent pole, thus the contrasting pole can be deduced from the
emergent pole. If the user chooses to enter an emerging pole only:
Strategic planning
it will be displayed as:
Strategic planning ... [not] Strategic planning
With contrasting pole only concepts the emergent pole can be omitted and the
contrasting pole is entered:
.Strategic planning
and is displayed as:
[not] Strategic planning ... Strategic planning
Monotonic concepts are special forms of bipolar concepts which can decrease
or increase in value and use a shorthand form of entry:
Interest rates+
and is displayed as:
[+] Interest rates ... [-] Interest rates , or
an increase in interest rates ... a decrease in interest rates
Shorthand bipolar concepts have common text in both poles and are entered in
shorthand form as:
More.Less.training
46

and will be displayed as:
More training ... Less training
3. Linking concepts
To build a model in Graphics COPE, concepts are usually linked together to
construct the problem under consideration. The two primary types of links that are used
are causal and connotative. Causal links are more frequently used and they indicate that
one concept caused or "leads to" to another concept. A simple problem follows:
I never have enough time to work. I think it is because 1 seldom plan my work andtherefore I don't work efficiently, but I really would like to get more work done.
This problem would be entered using causal links in the following manner:
Not enough time to work. Would like to get more work done
Don't plan.Work efficiently
These are two separate concepts which can be linked to show how you view the problem.
"Not planning leads to not enough time to work" yet if you "work efficiently" it may lead
to getting "more work done." The causal belief here is that "not enough time to work" is
caused by "not planning."
This link is represented on the map by an arrow and in text as "+". Now that
the concepts have been entered, we can link them by clicking and holding on the first
concept and then dragging the mouse to the second concept. A rubber band will follow
the mouse cursor. As concepts and links are added and the model expands, the user will
47

want to explore the capabilities of the analysis functions of Graphics COPE (more on
analysis later).
Connotative links are represented by the "." character in text and by a single
straight line (an arrow with no head). This type of link merely associates the two
concepts in some way and are therefore bi-directional. The link 3.4 also implies the link
4.3 (using concept numbers here instead of text).
Temporal links are used to show that one concept follows another in time. It is
represented on the map by an arrow with a T in it. In text the letter 't' is used.
User-defined links are for whatever purpose the user desires and may be
different for each model. They are represented on the map by a I or a 2 by default. Link
logic, using the OR and AND type of concept, is supported by using the LOGIC
command.
4. Sets
In Graphics COPE, "a set is a method of classifying concepts that constitute an
arbitrary set of concepts, such as the set of concepts which are the company objectives."
(Moriarty 1992, p. 17) The user gives each set a unique name which can be used as the
basis for further analysis by GCL. Sets must be whole words, with no spaces, and cannot
use the word "model." Three classes of set names are used, one created by the user, the
second consists of styles in the model (allows user to specify style for analysis), and the
third is three special names which refer to the current model.
48

5. Map editing
During editing the user can add or delete text from a concept, change concept
numbers, (if you changed number I to number 100, the next new concept would be 101
and so forth) delete an entire concept, and change or move links. Graphics COPE uses
the Windows clipboard so text and data can be cut or copied and then pasted. The most
recent version will also allow the user to copy/cut to the clipboard for import into other
windows applications. Figure 4-1 (also Figures 4-3,4) is a map that was copied to the
clipboard in Graphics COPE and then pasted into a frame in Ami Pro for Windows. It is
also an example of a cluster of concepts which are related--in this case each is related to
concept number 1.
Notice that concept number 20 is not all of the way on the screen. In Graphics
COPE that could be remedied either by scrolling the screen to the right or by "fishing
reel" the link to bring it closer to the other concepts. This is done by manipulation of the
mouse and the [Ctrl] key. Once the model is built, then the user is ready to use Graphics
COPE's powerful analytical tools.
The Edit Menu is very similar to an edit menu found in all windows-type
applications. It can do the standard cut, copy, paste, delete, undelete and other functions.
It also contains two functions that are special to Graphics COPE. Mix is used to integrate
numbered concepts from multiple models so that the source models are not known.
Renumber is used to tidy models by specifying a range of numbers to be renumbered.
49

I..94a
cl_
5 0
50

C. ANALYSIS
The analysis menu is shown in Figure 4-2.
Map concept IMAPIi AIt-MEzplore concept IXI Alt-XClusterExplanations... IE]Consequences... [el
%uster otons..
Figure 4-2. Analysis Menu
The analysis menu is one way to access some of Graphics COPE's analytical power. The
top box in Figure 4-2 shows the initial pull-down menu with the options available. Map
Concept is available when a single concept is selected and it cause a new map to be
drawn around that concept. To activate Explore concept a concept must be selected.
When executed, this command will reveal those concepts linked to the selected concept.
Cluster performs a cluster analysis on the model. Figure 4-3 (next page) is an example
of a cluster analysis. The results of a cluster are placed in sets called "Ciusterl ",
"Cluster2", etc. By typing the MAP command and the name of the cluster, the user can
view the sets.
Configure reveals the lower two menu selections which actually display to the
right of the Configure selection. Mapping options produces a dialog box which allows
the user to determine what map options are desired. Options include banded or fanned
maps, spacing and levels. Banded maps include concepts linked to the central concept up
51

52u

to branch points and concepts linked to those concepts up to branch points, and so on up
to the level specified. Banded maps result from a complex algorithim and can become
too large if too many levels are specified. Fanned maps are simpler, with each concept
directly linked to the central concept and each concept directly linked to those concepts,
up to the level specified. Cluster options allows the user to set the cluster analysis
options, such as using consequences or explanations to direct the analysis, the concepts to
bound the analysis, and the size to limit the analysis.
One form of cluster analysis is Hieset, which looks at the "root" concepts in the
Set (e.g., "Clusterl") designated, and traces all of the explanations of each concept until
either a tail or another concept in the Set is reached. Figure 4-4 (next page) is an example
of a Hieset. Notice the dotted line which runs vertically down the right one-third of the
page. This is a page break, meaning this Hieset would take two full pages to print out, as
concepts can be viewed extending off the screen available in this view.
There are also 15 analysis commands which can be utilized at the command line
(i.e., entered at the keyboard). LOGIC, which changes Boolean logic status of a concept,
ZOOM, which focuses on a set, and BAND, which displays Taylor banding levels
around a concept, are a few examples of the commands which may be invoked.
53

ItI
*FA
SAin
40
Ak)
U
=
a._
4ý_
54
, nlininilu lia iIN iI •Nitr Re~iN/ i il ~mm

D. LISTS
The List Menu provides the user with various lists of the categories contained in
Figure 4-5.
Heads ILHIlails ILTINew concepts ILN!
Sets ILS]AU links [LR]
Selected links...
Find text in concepts [FINDI
Figure 4-5. List Menu
AU concepts provides a textual listing, in sequential order, of all the concepts
which have been entered into that model. This list is shown down the left edge of the
screen and can span more than one screen. To view multiple screens, the user can use the
mouse to scroll the pages. Heads provides a list of the heads of each concept, and Tails
provides the list of tails for the concepts. New Concepts produces a list of concepts that
have been added since the last session. Sets gives a list of all the sets which have been
created and if the user has added descriptions to the sets, this too, is provided. AU links
gives the user a numbered list of each concept which has links. Here is a three-number
example of links:
* I> +2+17* 2>+3* 4 >-35-33
55

Concept number one is linked to the positive pole of concepts 2 and 17. Concept number
2 is linked to the positive pole of 3 and 4 is linked to the negative poles of concepts 35
and 33. Selected links allows the user to specify the concepts to be listed with their links.
Find text in concepts allows the user to do a word search through all of the concepts.
The Ust Menu allows the user to verify which concepts the model contains
during any one evolution of the model building, as well as providing different forms with
which to separate the concepts into more precise categories. It is seen as a valuable model
management tool, as well as an aid for participants who have difficulty understanding
graphical representation and desire more traditional information formats.
E. PRINTING AND EXPORTING
Graphics COPE provides the capability to print entire maps, as well as just the
current window. When an entire map is printed--and it runs over more than one page--it
is read from the upper left and prints all of the leftmost pages until it reaches the bottom
of the map. Then it repeats this process until the rightmost pages are printed and the
entire map can then be pieced together. A page break print option exists to help with
aligning multi-page maps once they are printed.
Copying map views to the Windows clipboard and then pasting them into Ami
Pro was very effective for the purposes of this thesis (see Figures 4-1, 4-3, and 4-4).
Graphics COPE can export to COPE but since GC is more powerful than COPE, some
concepts could be truncated to fit into COPE. Also, the user is allowed to export a set
from one model to another within Graphics COPE.
56

F. SYSTEM REQUIREMENTS
The following is required to run Graphics COPE:
"* IBM PC/AT compatible, or better, PC compatible computer. 386sx, 386dx, 486sx,or 486dx processor is required. It will use a math coprocessor if installed.
"* VGA graphics card, or better."* As much RAM memory as possible, 2Mb absolute minimum, 4Mb recommended
minimum and 8Mb if you are running multiple applications. Windows 3.x allowsfull use of all memory in the computer.
"* Mouse"* Hard disk drive with 3Mb free."* High density (1.2Mb) 5.25 inch or (l.44Mb) 3.5 floppy disk drive.
Graphics COPE requires DOS 3.x, 4.x or 5.x (MS-DOS or PC-DOS) and
Windows 3.x. It will no longer run in Windows 2.0. Graphics COPE is available from:
Strategic Decision Support Research UnitDepartment of Management Science,Strathclyde Business School,Livingstone Tower,26 Richmond Street,Glasgow, G I IXH.Scotland
International telephone: +44 41 552 4400 extension 3141Telex 77472 UNSLIB GFax 041-552 6686E-mail [email protected]
G. DOCUMENTATION AND HELP
The Graphics COPE Reference Manual is very well organized and covers the
mechanics of the application adequately. The manual used was written for version 1.0
and the latest disk was version 1.1.4. Updated information was contained in
README.TXT and README.WRI files on the disk. The manual is a three-ring binder
in which the material is attractively presented. Graphics of menus and screens are used to
57

match word descriptions of functions. It lists the commands alphabetically and provides
descriptions and examples. It contains an index.
The on-screen help function allows the user to call up all of the command-line
commands for review, and learn what each pull-down menu contains and the function of
each selection. It can conduct searches for specific topics and defines what each function
key does. It even offers help in using Help.
H. SUMMARY
Graphics COPE is a visually stimulating software application which holds great
potential in the hands of an experienced analyst or facilitator. Its many analytical features
provide it with much more capability than a simple mapping tool. The ability to cluster
sets (Figure 4-3), create hierarchical sets (Figure 4-4), and construct multiple map views
are all very valuable to the analyst. Graphics COPE provides the facilitator the very real
ability to shape the cognitive map to the reality of the problem confronting the group or
organization in a way which will allow those involved in the group decision process to
view the problem's issues and their links.
The tasks of facilitating (conducting interviews to identify issues then building
individual maps into an aggregated group map), and the entering and manipulating of the
data in the computer, require a very high skill level. According to one user who has
attended a workshop conducted by the software designers, "Graphics COPE is not a 'user
friendly' application." Thus, the user should weigh the potential benefits of the
application against the costs of training personnel and the time necessary to learn the
58

system. Before an organization attempts to "map" its cognitive world, it would be well
served to obtain training in facilitating and constructing cognitive maps.
59
V. EXPERT CHOICE
A. INTRODUCTION
This chapter provides an evaluation and description of the computer software
application known as Expert Choice (Version 8.0). The software is designed to assist the
user in solving complex problems that have many criteria and several courses of action.
This chapter demonstrates the capabilities of Expert Choice through the use of a simple
example model. It guides the reader through the processes of building a model, making
judgments through comparisons, synthesizing the model, and conducting sensitivity
analysis. The printing, linking and reporting features of the software package will also be
discussed.
Expert Choice is an application software for use in multi-criteria or
multi-objective decision making. This software package is designed to assist the user in
organizing information involved with the solving of a complex problem. When dealing
with complex problems involving numerous interacting elemcnts, the human mind
usually has difficulty structuring and solving them. According to psychological theory,
the human brain has a limitation of its short term memory capacity to about seven items
(Miller 1956). When complex problems are broken into groups and subgroups, the
human mind is then more capable of making judgments and comparisons. The solution to
solving complex problems does not lie in a more complicated way of thinking, but
instead in one of organizing the factors of the problem into a framework that can be
60

understood. When the problem is organized into a structured hierarchy, the user or
decision maker can then capitalize on his or her own personal experience and knowledge
in solving the problem. This is the theory behind Expert Choice.
Expert Choice is designed to help the user organize the factors of a complex
problem. It gives the user the ability to organize decisions into a hierarchy structure. It
models the way a human mind thinks. Expert Choice enables the user to make tradeoffs
and comparisons among competing objectives. It provides for a means of evaluating and
measuring every aspect of the decision. The user has the ability to incorporate his or her
judgments into every facet of any complex decision (Forman 1992, p. 2). The solution to
the problem will reflect the expertise of the decision maker and not the computer. The
software is based on Saaty's Analytic Hierarchy Process (AHP) that was discussed in
chapter III and is programmed by Ernest Forman (Bahouth 1993, p. 64).
B. STRUCTURING THE MODEL
Once an individual has completed the process of defining a problem and
identifying its criteria, subcriteria, and alternatives, he or she can then begin to build a
model using Expert Choice. An example problem that will be used here is the one of
selecting military installations for realignment and closure. Although this is a simple
model compared to a typical strategic planning problem, it is sufficient for demonstrating
the use and capabilities of Expert Choice.
61

The first step in creating this model is entering the goal node and its description.
In this model the goal node is "Select Base For Realignment/Closure". The goal node is
defined as node zero at level zero (See Figure 5-1). When building a model it is
important to keep in mind the relation of the node to the nodes above it and below it
(Forman 1992, P. 21). The node above any node is referred to as a parent node. The
nodes below a parent node are referred to as children nodes and the nodes below the
children nodes are descendants. By selecting INSERT from the EDIT menu, the user is
able to enter criteria as children under the goal node. The criteria for the Base Closure
Model are:
"* VALUE-The military value of the installation. It includes the current and futuremission requirements and the impact on operational readiness of DoD's total force;the availability and condition of land, facilities and associated airspace at theexisting and potential receiving locations; the ability to accommodate contingency,mobilization and future total force requirements at existing and potential receivinglocations; and cost and manpower implications.
"* ROI-(Return On Investment) the extent and timing of potential costs and savings,including the number of years, beginning with the date of completion of the closureor realignment, for savings to exceed the costs.
" IMPACTS-The economic impact on communities; the ability of the existing andpotential receiving communities' infrastructure to support forces, missions andpersonnel; and the environmental impact.
Although this is a fictitious model developed strictly for demonstration purposes,
the criteria listed above are actual criteria adapted by the DoD in 1991 from the 1988
Base Realignment and Closure Commission (McMillan 1991, p. 21). The criteria nodes
make up level one of the example model. In a realistic model, these criteria would be
divided into many subcriteria and would be represented by several layers in the model.
62

It is very easy to navigate through an Expert Choice model by using the mouse to
select the desired node or by using the up, down, left, and right arrow keys. In this
model, by selecting one of the three level one nodes (VALUE, ROI, or IMPACTS) and
the INSERT command from the EDIT menu, the user is able to add alternatives as
children nodes. For this example model, the three alternatives being compared are the
fictitious military installations Fort X, Fort Y and Fort Z. Once the alternatives are
inserted under one of the level one nodes, they can be replicated to its peers (other level
one nodes). The alternatives in this model make up level two. Figure 5-1 displays the
completed model.
Select Base for Realignment/Closure
GO1. 000G 1.000
L0.596 IL 0.239 IL 0.165G 0.59 G 0. 239 G0
E16 El
FORT X -FORT X -FORT XL 0.429 L 0.387 L 0.558G 0.255 G 0.093 G 0.092
-FORT Y -FORT Y -FORT YL 0.429 L 0.169 L 0.320G 0.255 G 0.041 G 0.053-FORT Z -FORT Z -FORT Z
L 0.143 L 0.443 L 0.122G 0.085 G 0.106 G 0.020
Figure 5-1. Base closure model
63

The goal node of the model has a priority of 1.000. For any set of branch nodes,
the sum of the priorities is 1.000. In level one of the model, each of the three criteria has
a local and global priority of 0.333. It is derived by dividing the parent node priority of
1.000 by three, since that is the number of children nodes. In level two of the model, the
local priority is 0.333 because there are three alternatives under each criteria node. These
local priorities are with respect to the parent node. The global priorities however are now
different. Global priorities are calculated by multiplying a node's local priority by the
global priority of its parent (0.333 multiplied by 0.333 - 0.111). At this point in the
model, the initial priorities of all the alternatives (each Fort) are the same since no
judgments have yet been entered. Models in Expert Choice can be created as large as six
levels and each node at any level can branch into as many as seven nodes in the next
level. This gives the user the ability to create very large models. Information screens can
be created that contain descriptive information about each node in the model and can be
saved in separate files.
C. COMPARISONS AND JUDGMENTS
Once the problem is structured into a hierarchy and the model is complete, the user
is able to start making comparisons and judgments. Expert Choice gives the decision
maker the ability to look at elements of the problem in isolation: one element compared
against another with respect to a single criterion (Forman 1992, p. 41). The judgments of
the decision maker are the basis for the process of solving the problem in Expert Choice.
Priorities of the nodes of the model are determined by making comparisons among the
64

criteria and alternatives or by entering the priorities by specifically assigning values for
the elements of the model. Pairwise comparisons can then be made from the ratios
formed by the assigned values. The pairwise comparison method of the Expert Choice
model generally leads to more accurate results (Forman 1992, p. 242). Priorities are
derived from the value system of the decision maker and therefore, each decision maker
will obtain priorities that reflect their own views after comparisons are made among the
criteria for each particular problem. For example, a $10,000 difference in the price of a
new car, for the decision maker who is weighing criteria and alternatives for the problem
of selecting a new car, will probably be very significant. On the other hand, a $10,000
difference in the price of a computer system for a data processing purchaser of a major
corporation could very well be insignificant.
When making comparisons in Expert Choice, the user has the option of starting at
the top of the model and working down or starting at the bottom and working up.
Comparisons are made on groups of nodes with respect to their parent node. To start
making comparisons, the user simply moves to the parent node and selects it as the
current node. Then, the user selects one of three modes from the COMPARE menu: the
Verbal Comparison Mode; the Numerical Comparison Mode; or the Graphical
Comparison Mode.
The Verbal Comparison Mode is the default mode for conducting pairwise
comparisons in Expert Choice. The user is asked two preliminary questions about each
pair of nodes being compared. First the user is asked if the nodes are equal. If the answer
is no, the user is then asked which node is more important, preferable, or likely,
65
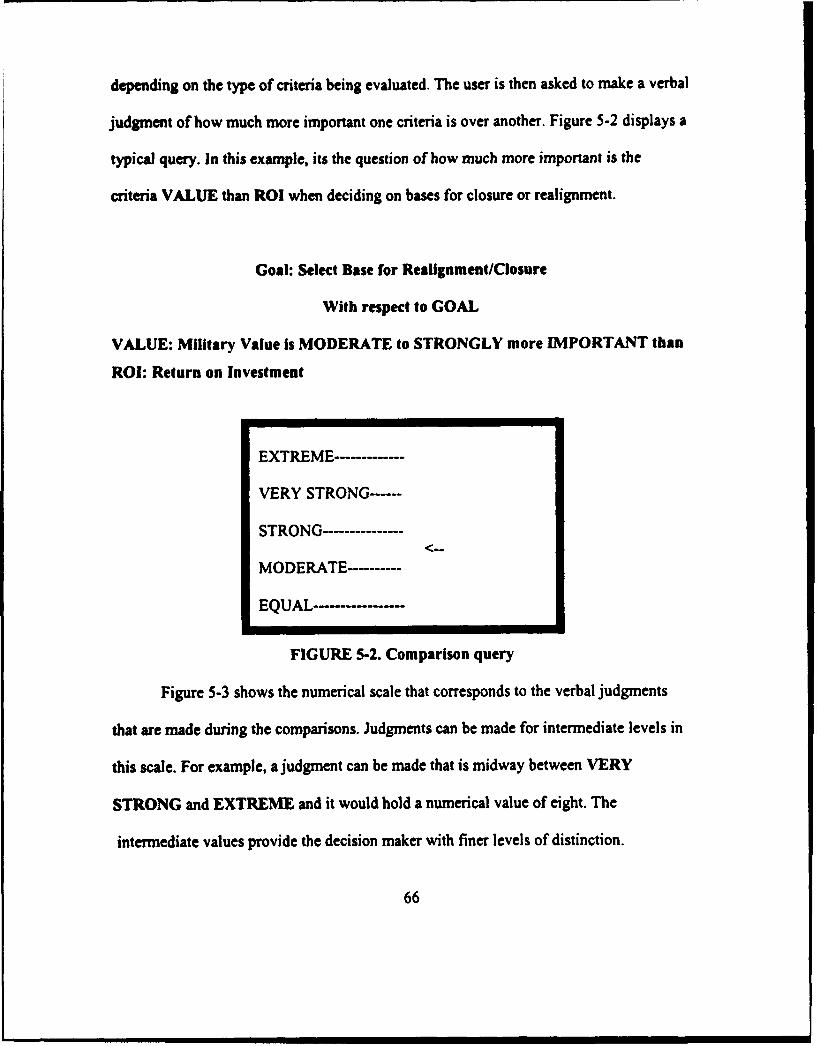
depending on the type of criteria being evaluated. The user is then asked to make a verbal
judgment of how much more important one criteria is over another. Figure 5-2 displays a
typical query. In this example, its the question of how much more important is the
criteria VALUE than ROI when deciding on bases for closure or realignment.
Goal: Select Base for Realignment/Closure
With respect to GOAL
VALUE: Military Value is MODERATE to STRONGLY more IMPORTANT than
ROI: Return on Investment
EXTREME -...........
VERY STRONG-----
STRONG ---------------
0<.EMODERATE ----------
EQUAL -----------------
FIGURE 5-2. Comparison query
Figure 5-3 shows the numerical scale that corresponds to the verbal judgments
that are made during the comparisons. Judgments can be made for intermediate levels in
this scale. For example, a judgment can be made that is midway between VERY
STRONG and EXTREME and it would hold a numerical value of eight. The
intermediate values provide the decision maker with finer levels of distinction.
66

Yd Scl NumM'Uil Scale
Extreme 9
Very strong 7
Strong 5
Moderate 3
Equal 1
IntermediateValues 2,4,6,8
FIGURE 5-3. Integer values
In the example Bise Closure model, the criteria VALUE was judged to be
moderately more important than the criteria ROI. It was then judged to be moderately
more important than the criteria IMPACTS. ROI was judged to be equally as, to
moderately more important than the criteria IMPACTS. Expert Choice provides the user
with the ability to easily return to the previous comparison to correct any mistakes that
might have been made. After the last judgment is entered, Expert Choice automatically
calculates priorities of the criteria based on the user's judgments and displays them as a
bar chart (see Figure 5-4). For this example, VALUE is judged to be the most important
criteria (about 59%), followed by ROI (about 25%), and then IMPACTS (about 16%).
67

Verbal judgments of IMPORTANCE with respect to:
GOAL Nod.: 0
VALUE 9 a 7 6 5 4 2 1 2 3 4 5 6 7 8 9 RoI
2 VALUE 9 & 7 6 S 4 2 1 2 3 4 567S 6 9 IMPACTS
3 ROa 9 9 7 6 5 4 3 § 1 2 3 4 5 6 7 9 9 IMPACTS
IOEQUAL 3=MOM[RATE S=STRONG 7rVERY STRONG 9wEXTREME
GOAL: Select Gasse for Realignment/ClOsurO
IMPACTS --- Economic/Envlronmental ImpactROl --- Return On InvestmentVALUE --- Military value
PRIORITIES
0.594VALUE0.249ROl0.157
IMPACTS
INCONSISTENCY RATIO - 0.051.
FIGURE 5-4. Judgments and priorities
Expert Choice provides a measure of inconsistency for the comparisons made
among the criteria. In Figure 5-4, the inconsistency ratio is measured to be 0.051 for the
comparisons that were made. An inconsistency ratio of 0.000 would indicate that all
comparisons are perfectly consistent. As models grow in complexity and number of
comparisons, so does the possibility of judgments being made that are inconsistent. An
inconsistency ratio greater than zero indicates that there is some inconsistency in the
judgments. Since the real world is not perfectly consistent, some inconsistency is
expeed and a value less than 0.100 is tolerable (Forman 1992, p. 63). If the
inconsistency ratio is more than 0.100, the user can reexamine his judgments and ask
Expert Choice where the inconsistency has occurred and then can correct that judgment
(Bahouth 1993, p. 62).
68

When building a model in which criteria have measurable factors such as cost,
weight, or length, the Numerical Comparison Mode may be preferred. The user is able to
enter numerical values for making comparisons among criteria. If a certain criteria costs
three times as much as another, or is three times heavier, that criteria would be assigned a
value 3.0. The user has the ability to distinguish to a tenth of a point by entering values
that range from 1.0 to 9.9.
Figure 5-5 is a screen display of a comparison between VALUE and ROI in the
Numerical Comparison Mode. The values of 3.0, 3.0, and 2.0 are the values that were
entered when the comparisons were made in the Verbal Comparison Mode. Here in the
Numerical Mode, the decision maker can change the value of 3.0 for a criteria to 2.9 or
3.1 or some other value that more accurately reflects his judgments. For this example, the
original judgments will hold and the priorities calculated at the end of the Verbal Mode
remain the same.
JUDGMENTS WITH RESPECT TO GOAL
VALUE ROI IMPACTS
VALUE 3.0 3.0
ROI 2.0
IMPACTS IMatrix entry indicates that ROW element isI EQUALLY 3 MODERATELY 5 STRONGLY 7 VERY STRONGLY 9 EXTREMELY
more IMPORTANT than COLUMN element unless enclosed in parenthesis
FIGURE 5-5 Numerical comparison
69

A useful feature of the Numerical Mode is the Geometric Mean feature. This
feature calculates the geometric mean of several judgments when dealing with a group of
decision makers who are unable to reach a consensus on a judgment.
The third comparison mode of Expert Choice is the Graphical Comparison Mode.
The Graphical Comparison Mode is useful when "fuzzy" judgments are made and there is
not much redundancy, such as when verbal judgments are made with only two factors or
there are many missing judgments (Forman 1992, p. 59). The three submodes of the
Graphical Comparison Mode are the pie chart, the horizontal bar, or both. The left and
right arrow keys or a mouse can be used to easily change the priorities in the Graphical
Mode. Using the Verbal Comparison Mode with the Base Closure model, Military
Installations X, Y, and Z were compared with respect to each of the three criteria. Figure
5-6 gives a summary of the comparisons that were made.
CRITERIA JUDMENVALUE
Fort X vs. Fort Y EqualFort X vs. Fort Y ModerateFort Y vs. Fort Z Moderate
Fort X vs. Fort Y Equal to ModerateFort X vs. Fort Z EqualFort Z vs. Fort Y Moderate
IMP~ACTSFort X vs. Fort Y Equal to ModerateFort X vs. Fort Z Moderate to StrongFort Y vs. Fort Z Moderate
The preferred installation is listed first
FIGURE 5-6. Comparison summary
70

r L PU.I
Now that all judgments for all pairs have been made, synthesis can be performed on the
model to arrive at an overall decision. Figure 5-7 is a display of the completed model
after all the judgments have been made. The local and global priorities are now different
than those of the model shown in Figure 5-1, before judgments had been made.
Select Base for Realignment/Closure
L .000
G1000
L 5961 239 IL 0.165 IG .56 0239 G 0.1651
-FORT X -FORT X -FORT XL 0.429 L 0.387 L 0.558G 0.255 G 0.093 G 0.092
-FORT Y -FORT Y -FORT YL 0.429 L 0.169 L 0.320G 0.255 G 0.041 G 0.053FORT Z FORT Z FORT ZL 0.143 L 0.443 L 0.122
G 0.085 G 0.106 G 0.020
FIGURE 5-7. Completed model
71

D. SYNTHESIS
Synthesis in Expert Choice is a process that converts the decision maker's priorities
into global priorities throughout the model to give a final weight to each of the criteria.
The software package does this by calculating, for each alternative, the sum of its global
priorities under all the criteria (Forman 1992, p. 261). Synthesis will select the best
alternative, prioritize alternatives, or forecast depending on the desires of the decision
maker. There are two modes of synthesis to select from: the Distributive Mode and the
Ideal Mode. The user can select either mode to synthesize the model and the synthesis
will not change the model in any way (Forman 1992, p. 85).
The Distributive Mode of Expert Choice is used when the purpose of the model is
to derive priorities for all alternatives or when the purpose is to forecast what is likely to
happen in the future. It can also be used when the purpose is to choose the highest
priority alternative and when the alternatives not chosen continue to be relevant after the
choice is made. The Distributive Mode allows for rank reversal to occur when
alternatives are added to or removed from the model.
The Ideal Mode is the appropriate synthesis mode when the purpose of the r Adel
is to choose the highest priority alternative and when the alternatives not chosen are no
longer relevant after the choice is made. The Ideal Mode is a new feature that was added
to Version 8.0 of Expert Choice. The Ideal Mode prevents rank reversal from occurring.
The situation of rank reversal occurring when alternatives are added or deleted had been
a criticism of previous versions of Expert Choice.
72

For the example Base Closure model, the Distributive Mode was selected to
prioritize all of the alternatives. Figure 5-8 shows the priorities of the alternatives after
synthesis has been completed. The results of the synthesis show that Fort X is the most
preferable of the three installations with respect to the criteria VALUE, ROI, and
IMPACTS. Since Fort Z is the least desirable, the decision maker or strategic planner
would select it as the base to close.
Select Base for Realignment/Closure
Syntn@sis of Leaf Nodes with respect to GOAL
DISTRIBUTIVE MODE
OVERALL INCONSISTENCY INDEX a 0.02
FORT X 0.440
FORT Y 0.34Q
FORT Z 0.211
FORT X --- Military Installation -- XFORT Y --- Military Installation -" Y
FORT Z --- Military Installation "" Z
FIGURE 5-8. Priorities after synthesis
E. SENSITIVITY ANALYSIS
Sensitivity analysis can be used on Expert Choice models to investigate the
sensitivity of the alternatives to changes in criteria importance. Expert Choice possesses
excellent interactive sensitivity analysis tools in the form of graphical output
73

accompanied by numerical values (Bahouth 1993, p. 63). The four graphical sensitivity
analysis modes are: the Dynamic Mode, the Gradient Mode, the Performance Mode, and
the Two-Dimensional Mode. Changes made in any one mode will be reflected in any of
the other three modes when the user goes directly from one mode to another. However,
these changes are not permanent and will not be reflected when the user returns to the
model. Sensitivity analysis can be performed on any node in the hierarchy.
The Dynamic sensitivity analysis mode shows the decision maker how the
prioritis of the alternatives change as the priorities of the criteria are increased or
decreased. Changes can easily be made by dragging the mouse or using the arrow keys
on the bars for the criteria that the user wants to change. The original priorities can be
restored quickly by selecting HOME. Figure 5-9 is a display of the graphical and
numerical output of the Dynamic Mode.
€IA2104 (DIST! !ftTITIE ile) ALTOMIfUn
FMI xA96 .440
I101 IRMlT V/- 23 .3mI~lq• F=T 2E
165 .211
FIGURE 5-9. Dynamic mode
74

In the Gradient sensitivity analysis mode, a gradient graph shows how the weights
of the alternatives will change as the weight of the criterion changes. Each criterion of
the model is represented on a separate graph. Figure 5-10 is a display of the gradient
sensitivity graph for the criterion VALUE.
Alttx SENSITIVITY NITH RESPECT TO GOAL FOR NODES BELOW: COAL.50
"-'-ORT X
.40
.30
.20
FORT Z
.10
PRIORITY of VALUE (DISTRIBUTIVE NODE)
FIGURE 5-10. Gradient sensitivity graph
The vertical line represents the priority of the criterion VALUE and the diagonal
lines represent the alternatives. The priorities of the alternatives are given by the
intersection of that line representing the alternative and the vertical line representing the
75

criterion priority, read from the Y-axis. The decision maker can use the mouse or the left
and right arrow keys to increase or decrease the priority of the criterion (shift the vertical
line right or left). As the vertical line shifts right or left, the priorities of the alternatives
will change. The points at which alternative lines cross each other are the "trade-off
points". These are the points at which the weight of one alternative outweighs the other
when the weight of the criterion is changed (Forman 1992, p. 100). The up and down
arrow keys are used to display the gradient sensitivities for the other criteria.
When changes are made to one gradient sensitivity screen, the changes will affect
the slopes of all of the alternatives and the location of the vertical line on the other
graphs. This feature shows the decision maker how changes in the weight of the criteria
will affect the weights of other criteria and alternatives under those criteria. The user can
prevent this from happening by selecting HOME to reset each gradient graph before
moving on to another one. Changes to priorities in the Gradient mode will not affect the
original model.
The most interesting sensitivity mode is the Performance Mode (Bahouth 1993, p.
63). This mode shows how each alternative performs on each criterion. This is
represented by the inter section of the alternative graph and the vertical lines. Changes in
the criteria priorities will cause instantaneous changes in the overall composite priorities.
The overall priorities are shown on the rightmost vertical line and read from the
right-hand Y-axis.
76

Figure 5-11 is a display of the performance sensitivity graph for the example
model. The scale on the right-hand Y-axis is different from the scale on the left-hand
Y-axis and is used to give the alternatives' final composite priorities. As in the other
modes, HOME can be selected to restore original priorities.
Critx PERFORMANCE WITH RESPECT TO GOAL FOR NODES BELOM: GOAL Altx-. 60
.. 50.5.4
.50°• %m .,B°jl' 30
.40 - ,' ".
.30 %% S.20
-. 10
.10
.M 00VALAJE RO! IMPACTS Overa I I
I I---Cr |tar ia- (DISTRIBUTIVE NODE)
-- FORT X ... FORT V MT- ZR Z
FIGURE 5-11. Performance sensitivity graph
77
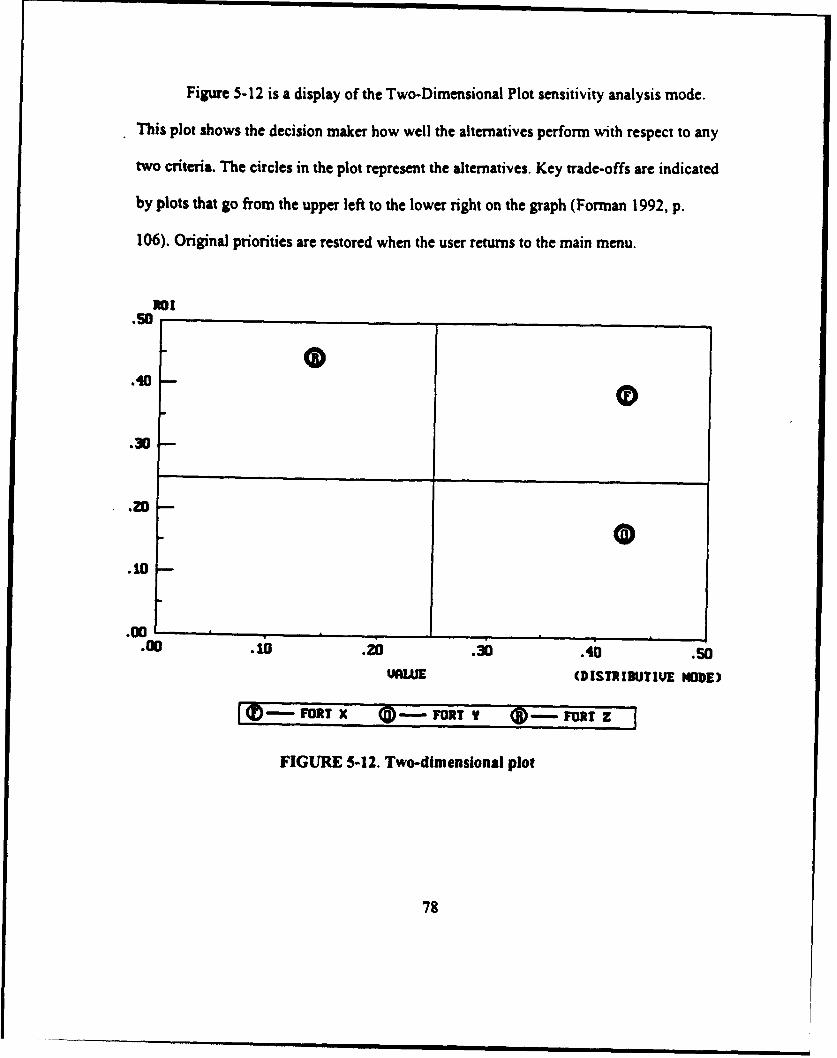
Figure 5-12 is a display of the Two-Dimensional Plot sensitivity analysis mode.
This plot shows the decision maker how well the alternatives perform with respect to any
two criteria. The circles in the plot represent the alternatives. Key trade-offs are indicated
by plots that go from the upper left to the lower right on the graph (Forman 1992, p.
106). Original priorities are restored when the user returns to the main menu.
.50
.401
.30
..z0
.10 -°•--
.00 .10 .20 .30 .40 .50VJALUJE (DISTRIBUTIVE NODE)
(- FORT X Q -FORT Y FORT Z
FIGURE 5-12. Two-dimensional plot
78

F. ABSOLUTE MEASUREMENT AND THERATINGS APPROACH
Up to now, the discussion of the prioritizing of alternatives in an Expert Choice
model has concentrated on relative measurement. That is, the alternatives are weighted
after being compared to all the other alternatives in the model. Another way to rank
alternatives in an Expert Choice model is accomplished with absolute measurement. With
absolute measurement, standards are set by inserting a set of nodes under each criterion
that are referred to as "intensities". Each alternative can be rated as to its intensity under
each criterion. This is known as the Ratings Approach in Expert Choice (Forman 1992,
p. 155). The Ratings Approach for entering judgments is used when the user is evaluating
the alternatives against standards, rather than against each other (Forman 1992, p. 68).
The Ratings Approach can be particularly useful with very large models that possess
hundreds of alternatives. It would be very difficult and time consuming to perform
pairwise comparisons for all of the alternatives. A second benefit of using the Ratings
Approach is the prevention of rank reversal. Rank reversal cannot occur using this
method of comparison (Forman 1992, p. 154).
G. PRINTING, REPORTING, AND LINKING
Expert Choice provides good printing capabilities. It is possible to print from
almost any screen in Expert Choice (Forman 1992, p. 115). A printer with graphics
79

capability is required to print the sensitivity analysis graphs. Printing can be done quickly
and easily by selecting GO from the REPORTING menu.
The questionnaire feature that is provided allows the user to produce a
questionnaire from any node in the model. It allows the user to collect judgments about
criterion being compared from people in widely scattered locations or from a large group
of people (Forman 1992, p. 119). When the questionnaires have been completed and
collected, all the judgments can be entered into one model using the Geometric Mean
feature of the software package.
One of the excellent features is the report generating utility ... One of thereports that can be generated is a questionnaire for comparing all pairs in thehierarchy. This questionnaire can be given or mailed to experts, requesting theirinput. I find this automatic questionnaire generating facility to be very useful.(Bahouth 1993, p. 64)
The Link utility of Expert Choice can be used to export priorities and results from
one or more Expert Choice models to spreadsheet programs such as Lotus or Excel
(Forman 1992, p. 109).
H. SYSTEM REQUIREMENTS
Expert Choice Version 8.0 will run on an IBM or compatible PC. DOS 5.0 or
greater and a minimum of 640KB RAM are required to run the program. Expert Choice
rzquires a hard disk with at least 1.4 MB for the program files and 1.6 MB for the
sample models. The program can be used with Windows 3.1. The package comes with an
installation program that automatically installs both the sample models and program files.
80

L SUMMARY
Expert Choice is easy to use. "... a user who is familiar with the PC environment
and knows the basic theory of AHP will be able to use Expert Choice even without
documentation." (Bahouth 1993, p. 64) Expert Choice is an excellent decision support
tool when dealing with ranking and inferencing problems. It has a well designed user
interface and effective sensitivity analysis and reporting tools (Bahouth 1993, p. 65).
The biggest drawback to the use of Expert Choice in strategic planning is its lack
of support for problem structuring (Buede 1991, p. 52). This is a common problem of a
large percentage of the software tools that are currently available in this field. Since
many of these packages have been designed by professional decision analysts with vast
experience in problem structuring, they tend to focus on computation and analysis of
values and uncertainties, rather than problem structuring (Buede 1991, p. xiv). Before a
planner or decision maker can use Expert Choice to build a hierarchical model, the
difficult task of problem structuring must be completed. As outlined in Chapter 111, this
task involves the identification of mission and values, mandates, strengths, weaknesses,
opportunities and threats, and issues. Expert Choice does not provide support in this area.
Expert Choice, Inc. is currently conducting beta testing of a groupware version of
Expert Choice, called Team Expert Choice. With this groupware version, several
decision makers can enter judgments simultaneously and anonymously, if desired
(Bahouth 1993, p. 65).
81

Expert Choice sells for $495 for a single user version and is available through
Expert Choice, Inc., 4922 Ellsworth Avenue, Pittsburgh, PA 15213; telephone: (412)
682-3844; fax: (412) 682-7008. A demonstration version disk can be ordered for $10.
82

VI. CONCLUSION
A. OVERVIEW
This thesis has discussed the application of computer software as a tool to aid in
strategic thinking and planning. Specifically, it introduced, described and evaluated two
software packages--Graphics COPE and Expert Choice--as to their effectiveness as tools
for aiding the strategic planning process. These two packages were from the larger, but
still not extensive, business strategic planning software market.
The research questions we set out to answer were: (1) what computer software
capabilities are currently available to strategic planners, and (2) how can they be used by
military strategic thinkers and planners? The first question has been answered through
our discussion of the five categories of strategic planning software (Beude 1991), and the
more in-depth evaluations of Graphics COPE and Expert Choice. We have answered the
second question by proposing the use of Bryson's strategic planning process in
conjunction with software applications from each end of the continuum. We feel that
Graphics COPE can assist at the beginning, in the problem structuring stage of the
strategic planning process. At the other end of the spectrum, the decision making step,
we feel that Expert Choice will lead the analyst to order the problem so that alternatives
can be evaluated and ranked.
Because tremendous amounts of information are gathered and evaluated
throughout this strategic planning process, we believe that computers and computer
software can be helpful in managing and structuring this information. Using computers to
83

aid in the strategic planning process provides help: (1) structuring the problem, (2)
selecting alternatives, and (3) enabling changes to be made quickly as the situation
changes. Thus, the use of strategic planning software can lend flexibility and
thoroughness to the strategic planning process.
Chapter II has provided the foundation for military and business strategy. It
provides the rationale for the military to conduct organizational strategic planning.
During our research we found no strategic planning model which properly fit the
Department of Defense. Thus, Bryson's model was presented as one for use because of its
ease of use, its focus is on managing change, and its consideration of political factors.
Chapter III has defined Decision Support Systems (DSS). It lists the major
characteristics, components, and benefits of DSS. These systems can provide the decision
maker with analysis tools, "what if" and goal seeking cavdbilities, and with modeling
techniques to assist in problem structuring.
One of the most attractive features of these software applications for use in
strategic planning is the data management component. The data management component
contains the database that provides the storage and manipulation capabilities that are
extremely useful in the strategic planning process.
Other attractive features of the use of DSS to aid in the strategic planning process
are the capabilities for presenting data in a variety of reports and graphical forms. These
can enhance communication between levels of management in an organization. Also, the
ability to quickly recall ideas or revisit problems, even years down the road, make DSS
an attractive aid to the strategic planning process.
84
Problem structuring is one of two approaches for the design of strategic planning
software that is described in this thesis. Problem structuring is breaking down the
problem into issues, related elements, and alternative courses of action, and then
modeling the relationships among factors or elements that affect the problem.
Unfortunately, many of the software packages currently being offered for use in strategic
planning lack adequate support in the area of problem structuring. Graphics COPE is
considered a problem structuring package. It uses cognitive mapping and Strategic
Options Development and Analysis (SODA) to structure complex problems.
Cognitive mapping is described as a method for modeling ideas about a problem.
The model is a collection of related issues, objects, or ideas that are linked together to
indicate how one concept causes, or leads to, another concept. Cognitive maps are a way
of channeling the participants' thoughts to the template the group has chosen for its
situation. The mapping information can be entered into software which acts as a database
that stores it for analysis and presentation. The SODA method uses the technique of
cognitive mapping to capture the views of a group and to reach a consensus on issues,
information, and alternatives to a problem.
The second approach for designing strategic planning software is that of
organizing a problem into a hierarchy. The Analytic Hierarchy Process (AHP) was
developed by Thomas L. Saaty to assist decision makers in making logical and unbiased
decisions while considering their expertise, preferences, experience, and instincts. The
AHP provides the foundation for Expert Choice. Expert Choice gives the user or decision
maker the ability to organize a problem and its related elements and criteria into a
85

hierarchy. The decision maker can then instruct Expert Choice as to which criteria are the
most important by conducting pairwise comparisons among criteria at all levels of the
hierarchy.
B. CONCLUSION
We believe that Graphics COPE (SODA) and Expert Choice (AHP) offer several
advantages to the planners and analysts who are devoting time and energy to information
processing with the intent of formulating an action plan. To the staff or group which
must first find its group consensus on issues, mandate and alternatives, SODA offers a
method for structuring the problem situation--with or without the use of computer. When
coupled with the powerful computing capabilities of Graphics COPE, an in-depth
analysis of the issues and their related concepts can be conducted. A drawback of
Graphics COPE is the need for a trained facilitator to conduct the interviews and have
functional knowledge of COPE and its workings.
AHP provides the ability to make judgments and comparisons among criteria or
related elements of a problem. Its many tools provide the analyst the ability to rank
criteria, select the best alternative, and even forecast future scenarios. Expert Choice is an
easy package to learn and use, even for the user with little to no experience using
personal computers.
Our recommendation to planners considering jumping into the computer
application arena would be to evaluate your needs before you leap. Should you need
significant assistance in mapping your situation and structuring the problem and you
86

have a person to send for training in their nuances, SODA and COPE could well be your
answer. If you need help in choosing among alternatives and would like to change
variables, goal seek, and do "what if" analysis in a logical, powerful manner, then AHP
and Expert Choice fit the bill. When you need help doing both and you don't have the
time or the money to learn, you may be better off waiting for the technology to reach
your level rather than taking your level to the technology.
The nature of computer technology makes it subject to rapid changes. Further
studies in this area are almost mandated by the need to be aware of the current state of
the business. And as this state moves more and more to applications which are easier for
the user, more users will move to embrace the technology.
The wise user will explore the options carefully and use the technology
appropriate for the task at hand. You now should be more aware of the strategic planning
software capabilities which are out there, as well as the technology currently available in
the two applications which we reviewed. Ultimately, users will have to determine if any
of these packages fit their needs.
87

"APPENDIX A
ALPHABETICAL LISTING OF SOFTWARE VENDORS
ArboristTEXAS Instruments, Inc.Data Systems GroupP.O. Box 100137800-847-2787
Arizona StateProfessor Craig W. KirkwoodDepartment of Decision and Information SystemsCollege of BusinessArizona State UniversityTempe, AZ 85287-4206602-965-6350
Auto-IntelligenceIntelligence Ware, Inc.9800 S. Sepulveda Boulevard, Suite 730Los Angeles, CA 90045213-417-8896
Best ChoiceSterling Castle Software702 Washington Street, Suite 174Marina del Rey, CA 90292213-306-3020 or 800-722-7853
Cope 10.8Strategic Decision Support Research UnitDepartment of Management ScienceStrathclyde Business SchoolUniversity of StrathclydeLivingstone Tower,26 Richmond StreetGlasgow,Scotland GI I XH44 41 552-4400 ext. 3141
88
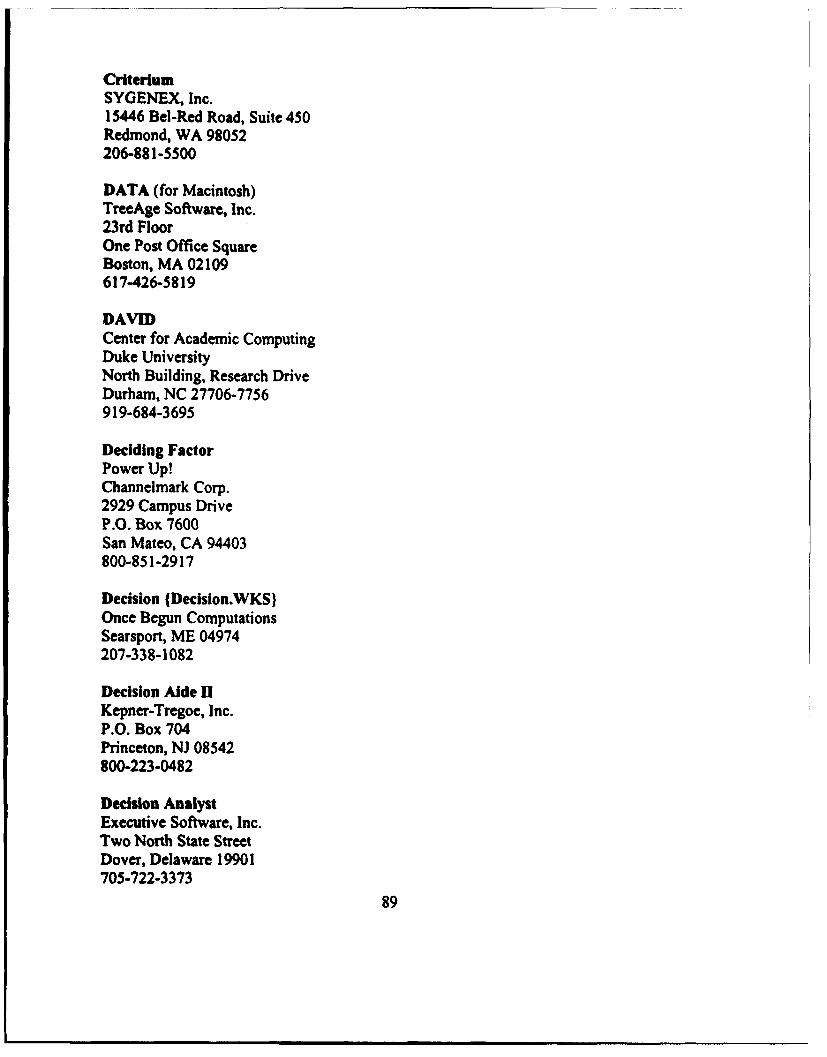
CriteriumSYGENEX, Inc.15446 Bel-Red Road, Suite 450Redmond, WA 98052206-881-5500
DATA (for Macintosh)TreeAge Software, Inc.23rd FloorOne Post Office SquareBoston, MA 02109617-426-5819
DAVIDCenter for Academic ComputingDuke UniversityNorth Building, Research DriveDurham, NC 27706-7756919-684-3695
Deciding FactorPower Up!Channelmark Corp.2929 Campus DriveP.O. Box 7600San Mateo, CA 94403800-851-2917
Decision (Decision.WKS}Once Begun ComputationsSearsport, ME 04974207-338-1082
Decision Aide IIKepner-Tregoe, Inc.P.O. Box 704Princeton, NJ 08542800-223-0482
Decision AnalystExecutive Software, Inc.Two North State StreetDover, Delaware 19901705-722-3373
89
Dedsia MapSoftstyle7192 Kalanianaole HighwaySuite 205Honolulu, HI 96825808-396-6368
Decision PadApian SoftwareP.O. Box 1114Menlo Park, CA 94016-1114415-851-8496
Expert 87Magic7 Software Company101 First Street Suite 237Los Altos, CA 94022415-941-2616
Expert ChoiceDecision Support Software, Inc.4922 Ellsworth Ave.Pittsburgh, PA 14213412-681-3844
Graphics COPE(same as COPE)
HiViewDecision Analysis UnitThe London School of EconomicsHoughton StreetLondon, England WC2A 2AE01-405 7686
Idea Generator PlusExperience in Software2000 Hearst AvenueBerkeley, CA 94704800-678-7008
90
LightyearThoughtware, Inc.1699 South Bayshore DriveCoconut Grove, FL 33133800-848-9173
MAUA 2.0Booz-Allen & Hamilton, Inc.1953 Gallows RoadVienna, VA 11180703-893-0040
MAUDDecision Analysis UnitThe London School of EconomicsHoughton StreetLondon, England WC2A 2AE01-405 7686
P/G%Decision Aids, Inc.1720 ParkhavenChampaign, IL 61820217-359-8541
PASSMr. Jim PeerenboomArgonne National Laboratory9700 South Cass AvenueArgonne, IL 60439312-972-8994
Planning Tools 2.0ATR, Inc.900 Artesia Blvd., Suite 110Redondo Beach, CA 90278-2704213-379-1205
PREFCALCEuro-DecisionB.P. 57-78530Buc, France33-3-956-37-05
91

Smartedge 3.0Haviland-Lee, Inc.P.O. Box 5036Pasadena, CA 91107714-611-1610
SMLTree 2.0Dr. James P. Hollenberg445 East 68th StreetNew York, NY 10011111-734-5681
Stella for Business 2.1High Performance Systems, Inc.13 Dartmouth College HighwayLyme, NH 03768-9989603-795-4857
StratatreeDecision Support Software, Inc.4922 Ellsworth Ave.Pittsburgh, PA 14213412-681-3844
SupertreeSDG Decision Systems3000 Sand Hill RoadMenlo Park, CA 94025415-854-9000
TreeValDecision Analysis GroupISSM MC-0021University of Southern CaliforniaLos Angeles, CA 90089-0021213-743-3083
XIA 2.0Booz-Allen & Hamilton, Inc.1953 Gallows RoadVienna, VA 11180703-893-0040
92

REFERENCES
Ansoff, H. Igor, Implanting Strategic Management, Prentice Hall, New Jersey, 1984.
Bahouth, S.B., "Expert Choice: Version 8 of Decision-Making Software Is Easier ToLearn," OR/MS Today, pp. 62-65, June 1993.
Bingman, Charles F. and Kee, James E., "Strategic Management in FederalGovernment," chapter in, Handbook of Strategic Management, ed., Jack Rabin, MarcelDekker, New York, 1989.
Bryson, John M., Strategic Planning for Public and Nonprofit Organizations,Jossey-Bass, San Francisco, 1988.
Builder, Carl H., The Masks of War: American Military Styles in Strategy and Analysis,Johns Hopkins University Press, Baltimore, 1989.
Buede, D.M. and Feder, Dr. S. A., "Decision Support Software for Intelligence Analysts:A Review of Commercially Available Products," Office Of Research and Development,RD-91-10002, January 1991.
Clausewitz von, Carl, On War, edited and translated by Michael Howard and Peter Paret,Princeton University Press, Princeton, New Jersey, 1976.
Cropper, Steve, Eden, Colin and Ackermann, Fran, "COPE-ing with Complexity:Computer-Based Storage and Retrieval of Cognitive Maps," Working Paper, March1990.
Dyer, R., Eyrich, H.G., and Forman, E., "Competitive Advantage Through the DecisionMaking Process," Working Paper, George Washington University.
Eadie, Douglas C., "Identifying and Managing Strategic Issues: From Design to Action,"chapter in, Handbook of Strategic Management, ed., Jack Rabin, Marcel Dekker, NewYork, 1989.
Eden, Colin, "On the Nature of Cognitive Maps," Journal ofManagement Studies, pp.261-265, May 1992.
Eden, Colin, "Strategic Thinking with Computers," Long Range Planning, Vol. 23, No.6, pp. 35-43, December 1990.
93
Eldridge, William H., "Why Angels Fear to Tread: A Practitioner's Observations andSolutions on Introducing Strategic Management to a Government Culture," chapter in,Handbook of Strategic Management, ed., Jack Rabin, Marcel Dekker, New York, 1989.
Forman, E., Expert Choice Version 8.0 User Manual, Expert Choice, Inc., and DecisionSupport Software, Inc., McLean, Virginia, 1992.
Frederickson, J. W., "Strategic Process Research: Questions and Recommendations."Academy of Management Review, Vol. 8, No. 4, pp. 565-575, 1983
George, James L., The U.S. Navy in the 1990s, Naval Institute Press, Annapolis,Maryland, 1992.
Keller, William C. (Cdr., USN), "Defense Resource Allocation Process," paper publishedby Naval War College, Newport, Rhode Island, 1990.
Klay, William E., "The Future of Strategic Management," chapter in Handbook ofStrategic Management, ed., Jack Rabin, Marcel Dekker, New York, 1989.
Long, Larry, and Long, Nancy, Computers, Prentice Hall, New Jersey, 1990.
McMillan, C., "The Tough Job Someone Has To Do," Defense, pp. 16-23, May/June1991.
Mann Robert I., and others, "Accommodating Cognitive Style through DSS Hardwareand Software," chapter in Decision Support Systems, eds., Sprague, Ralph H. andWatson, Hugh J., Prentice Hall, New Jersey, 1986.
Miller, G., "The Magical Number Seven Plus or Minus Two: Some Limits on OurCapacity for Processing Information," The Psychological Bulletin, Vol. 63, No. 2, pp.81-97, March 1956.
Miller, Edward S., War Plan Orange, Naval Institute Press, Annapolis, Maryland, 1991.
Mintzberg, Henry and Quinn, James Brian, The Strategy Process, Prentice Hall, NewJersey, 1991.
Mockler, Robert J., Knowledge-Based Systems for Strategic Planning, Prentice Hall,New Jersey, 1989.
Moriarty, Kenneth and Jones, Matthew, Graphics COPE Reference Manual, Universityof Strathclyde, Glasgow, Scotland, 1992.
94

Paret, Peter, "Clausewitz," chapter in, Makers of Modern Strategy, ed. Peter Paret,Princeton University Press, New Jersey, 1986.
Roberts, Nancy C., "Limitations of Strategic Management in Bureaus: The Case of TheDepartment of Defense," paper presented at the National Public Management ResearchConference, Syracuse, New York, 20 September 1991.
Saaty, T.L. and Vargas, L.G., Prediction, Projection and Forecasting, Kiuwer Academic
Publishers, 1991.
Saaty, T.L., Decision Making For Leaders, RWS Publications, 1990.
Saaty, T.L., The Analytical Hierarchy Process, McGraw-Hill, Inc., 1980.
Senge, Peter M., The Fifth Discipline, Doubleday/Currency, New York, 1990.
Sun Tzu, The Art of War, translated by Thomas Cleary, Shambhala, Boston, 1988.
Thompson, Arthur A. and Strickland, A. J., Strategic Management, BusinessPublications, Inc., Piano Texas, 1984.
Turban, Efraim, Decision Support and Expert Systems, Macmillan Publishing, NewYork, 1990.
95

INITIAL DISTRIBUTION LIST
Number of Copies1. Defense Technical Information Center 2
Cameron StationAlexandria, Virginia 22304-6145
2. Library, Code 052 2Naval Postgraduate SchoolMonterey, California 93943-5002
3. Nancy C. Roberts, Code AS/RC 2Department of Administrative SciencesNaval Postgraduate SchoolMonterey, California 93943-5002
4. CAPT George Conner, Code OR/CO 2Department of Operations ResearchNaval Postgraduate SchoolMonterey, California 93943-5002
5. Major Daniel K. Carpenter, USMC 2Marine Corps Command and Staff CollegeMarine Corps Combat Development CommandQuantico, Virginia 22134-5001
6. Lieutenant Donald J. Ebner, USN 2Department Head SchoolNewport, Rhode Island 02841
7. Joint Staff, J-8/ASD IRoom 1D929 (Mr. Arthur Paarmann)PentagonWashington, DC 20318-8000
8. CAPT Peter W. Buckley, USN IDirector, Naval Doctrine DevelopmentNaval Doctrine Command8952 First Street, Suite 200Norfolk, Virginia 23511-3790
96

9. CDR Mitch Brown IDepartment of National Security AffairsNaval Postgraduate SchoolMonterey, California 93943-5002
10. CDR Jan SmithNaval War College/Code 303686 Cushing RoadNewport, Rhode Island 02841-1207
I1. LCDR W. Michael Bently, USCGCommandant (G-REP-I)2100 Second Street, S.W.Washington, DC 20593-0001
12. LTC Fred M. RawcliffeUSTRANSCOM/TCJ5-AM508 Scott Drive, Room 120Scott AFB, Illinois 62225-5357
13. Director, Command and Staff College 2Marine Corps Combat Development CommandQuantico, Virginia 22134-5001
14. Major Howard M. Hachida, USAFIJoint Staff/J-8/NFADPentagon, Room I D 18937Washington, DC 20318
15. Director, Training and EducationMarine Corps Combat Development CommandCode C461019 Elliott RoadQuantico, Virginia 22134-5027
16. John SaundersInformation Resources Management CollegeMarshall Hall, Bldg. 62, Room 130Fort McNairWashington, DC 20319-6000
97
17. Lee Frost-KumpfPSU-Public Administration205 BurroughsUniversity Park, Pennsylvania 16802
18. Director, Plans DivisionMilitary Sealift CommandDepartment of the NavyBldg. 210, WNYWashington, DC 20398
19. Expert ChoiceDecision Support Software4922 Ellsworth Ave.Pittsburgh, Pennsylvania 14213
20. LCDR John QuigleyCNO Executive Panel (N-OOK)Office of the Chief of Naval Operations4401 Ford Ave.Alexandria, Virginia 22302-0268
98