
A NEAR-DUPLICATE DETECTION ALGORITHM TO FACILITATE DOCUMENT CLUSTERING
Upload
khangminh22Category
view
2download
0
i
Development and Application of
Quantitative Liquid Chromatography – Mass
Spectrometry Techniques to Facilitate
Enhanced Bioprocessing of Therapeutic
Proteins
A thesis submitted to Dublin City University for the degree of Ph.D.
By
Amy Farrell BSc. PgDip.
Student Number: 53096777
School of Biotechnology, Faculty of Science and Health
The research described in this thesis was performed under the supervision of
Dr. Jonathan Bones, National Institute for Bioprocessing Research and Training
(NIBRT), Co. Dublin and Dr. Niall Barron, School of Biotechnology, DCU.
September 2016


ii
Declaration
I hereby certify that this material, which I now submit for assessment on the programme of
study leading to the award of Doctor of Philosophy is entirely my own work, and that I have
exercised reasonable care to ensure that the work is original, and does not to the best of my
knowledge breach any law of copyright, and has not been taken from the work of others save
and to the extent that such work has been cited and acknowledged within the text of my
work.
Signed: __________________________
Amy Farrell
Student ID: 53096777
Date: __________________________


iii
Acknowledgements
First and foremost I would like to express my eternal gratitude to a great supervisor, mentor
and friend, Dr. Jonathan Bones. Thank you for entrusting me with this project and for being an
endless source of guidance and encouragement, for always having an open door and for
saying ‘It will be fine!’, sorry for having to say it so often! Thanks to both of my co-supervisors,
Prof. Ian Marison for your help with the initial stages of the project and to Dr. Niall Barron for
all of your advice and assistance.
A huge thank you to all of my NIBRT friends! It has been a pleasure to work with you all. To the
research team, thanks for all the coffee, laughs and encouragement that have kept me going
over the last four years. Thanks to Brian, Stefan, Csaba and Silvia for all of your analytical-
related advice and to Colin, Craig and Krishna in the Bioinformatics team for all of your
assistance. I would like to especially thank the training team, past and present, especially
Shada, Chris, Gavin, Martin, Stephen and Kate for all of your help with cell culture and
bioreactor set-up. Also thanks to my fellow CCL PhD candidates, my weekend companion Josh
and neighbour Anne, best of luck!
Thanks to Science Foundation Ireland for enabling this research. I would like to thank Ken, Kai,
Simon, Peter and Jenny in Thermo Fisher Scientific for all of their help over the last year.
I am blessed with a wonderful, supportive and encouraging family. Thank you to my brilliant
parents, Carmel and Thomas, for years of endless love and reassurance. Thanks to my sisters
Lynn and Emily for being best friends as well as sisters and thanks to my big brothers Fergus
and Eoin and to my wonderful nephews, Anthony, Luke, Kevin, Aidan and Arthur for always
putting a smile on my face.
Thanks to my friends for the little distractions, especially Orla, Ciara and Adrienne. A special
thank you to Charissa for inspiring me to start this and for repeatedly telling me it will all come
together! Last but by no means least I would like to thank my partner Gary, for all of your love
and support and for putting up with my absence and tiredness over the years. This would have
been a lot harder with out you. Now that it’s done, I can’t wait to work on our next project…
together! Lots of love xx

iv
Publications and Conference Presentations
Publications
Farrell, A., McLoughlin, N., Milne, J. J., Marison, I. W., Bones, J., Application of Multi-
Omics Techniques for Bioprocess Design and Optimisation in Chinese Hamster Ovary
Cells. Journal of Proteome Research, 2014. 13(7): p. 3144-59.
Farrell, A., Mittermayr, S., Morrissey, B., McLoughlin, N., Navas Iglesias, N., Marison, I.
W., Bones, J., Quantitative Host Cell Protein Analysis using Two Dimensional Data
Independent LC-MSE. Analytical Chemistry. Submitted Manuscript ID: ac-2015-01377h.
Millan Martin, S., Delporte, C., Farrell, A., Navas Iglesias, N., McLoughlin, N., Bones, J.,
Comparative analysis of monoclonal antibody N-glycosylation using stable isotope
labelling and UPLC-fluorescence-MS. Analyst, 2015. 140(5): p. 1442-7.
Conference Presentations
Farrell, A., Bones, J., Host-Cell Protein Analysis of Therapeutic Monoclonal Antibodies
Following Protein A Chromatography using Data Independent 2D-LC-MSE.
Presented as both an oral and poster presentation at the 11th Symposium on the
Practical Applications of Mass Spectrometry in the Biotechnology Industry (CASSS
Mass Spec 2014). Napa, California. September 9th to 12th 2014.
Farrell, A., Mittermayr, S., Morrissey, B., McLoughlin, N., Bones, J., Quantitative Host
Cell Protein Analysis using Two Dimensional Data Independent LC-MSE.
Presented as a poster presentation at Opportunities in Biopharma Research. NIBRT,
29th September 2015.
v
Farrell, A., Scheffler, K., Ho, J., Mowlds, P., Pankert, P., Williamson, A., Cook, K., Bones,
J., Application of Quantitative Liquid Chromatography-Mass Spectrometry Techniques
to Facilitate Enhanced Bioprocessing of Therapeutic Proteins.
Accepted: Presentation at the 13th Symposium on the Practical Applications of Mass
Spectrometry in the Biotechnology Industry (CASSS Mass Spec 2016) to be held in San
Diego, CA, USA from 27th to 30th September 2016.
Awards
CASSS Travel Reimbursement Grant to facilitate a research presentation at the 11th
Symposium on the Practical Applications of Mass Spectrometry in the Biotechnology
Industry (CASSS Mass Spec 2014). Napa, California. September 9th to 12th 2014.
CASSS Travel Reimbursement Grant to facilitate a research presentation at the 13th
Symposium on the Practical Applications of Mass Spectrometry in the Biotechnology
Industry (CASSS Mass Spec 2014). San Diego, California. September 27th to 30th 2016.

vi
Table of Contents
Declaration ......................................................................................................................... i
Acknowledgements ............................................................................................................ iii
Publications and Conference Presentations ......................................................................... iv
Publications .............................................................................................................................. iv
Conference Presentations ........................................................................................................ iv
Awards ....................................................................................................................................... v
Abbreviations ..................................................................................................................... xi
A List of Figures ................................................................................................................ xiii
A List of Tables ............................................................................................................... xxiv
Abstract .......................................................................................................................... xxv
1.0 A Review of Analytical Technologies used for Quantitative CHO Cell Proteomics ....... 1
1.1 Introduction ......................................................................................................... 1
1.2 Sample Preparation for Proteome Analysis ......................................................... 2
1.3 Separation Technologies ...................................................................................... 4
1.4 Detection by Mass Spectrometry......................................................................... 5
1.4.1 Ionisation of Biomolecules ................................................................................... 5
1.4.2 Mass Analyser Configuration for Quantitative Proteomics and Product
Characterisation ................................................................................................... 7
1.4.3 Tandem Mass Spectrometry .............................................................................. 10
1.4.4 Data dependent versus Data independent Acquisition in Mass Spectrometry . 12
1.5 Bioinformatics .................................................................................................... 14
1.6 Quantitation ....................................................................................................... 16
1.6.1 Label-free Quantitation ...................................................................................... 16
1.6.2 Labelled Quantitation ........................................................................................ 17
1.7 Proteomic Profiling of CHO Behaviour ............................................................... 20
1.8 Future Perspectives ............................................................................................ 28
1.9 Conclusions ........................................................................................................ 28
1.10 Associated Publication and Author Contributions ............................................. 29
1.11 Aims of Thesis .................................................................................................... 29
1.12 References.......................................................................................................... 30
vii
2.0 Quantitative Proteomics Analysis of CHO Cells Following Culture under Altered
Bioprocessing Conditions ....................................................................................... 43
2.1 Introduction ........................................................................................................43
2.2 Experimental .......................................................................................................45
2.2.1 Reagents and Consumables ................................................................................45
2.2.2 Cell Culture ..........................................................................................................46
2.2.2.1 Aseptic Technique ...............................................................................................46
2.2.2.2 Adaption of CHO DP-12 to Serum-Free Media and Suspension Culture ............46
2.2.2.3 Thawing of Cryopreserved Cell Banks and Cell Culture of Fully-Adapted CHO DP-
12 Cell Lines in Protein-Free, Suspension Culture ..............................................47
2.2.2.4 Maintenance of the Cell Lines .............................................................................47
2.2.2.5 Cell Culture using Disposable Single Use Bioreactors .........................................48
2.2.2.6 Determination of Nutrient and Metabolite Concentration, Cell Count and Cell
Viability ...............................................................................................................48
2.2.2.7 Culture of Naïve CHO K1 Cells .............................................................................49
2.2.3 Proteomic Analysis of CHO Cells using High pH- Low pH 2D-LC-MS/MS ............49
2.2.3.1 CHO Proteome Sample Preparation ...................................................................49
2.2.3.2 First Dimensional Fractionation ..........................................................................50
2.2.3.3 Second Dimension nano-LC-MS Method Development .....................................51
2.2.3.4 Bioinformatics .....................................................................................................52
2.3 Results and Discussion. .......................................................................................53
2.3.1 Experimental Design for Anti-IL8 Production under Altered Bioprocessing
Conditions ...........................................................................................................53
2.3.2 Bioprocess Monitoring ........................................................................................56
2.3.3 Proteomic Method Performance ........................................................................61
2.3.3.1 Evaluation of Method Reproducibility ................................................................61
2.3.3.2 Quantitative Proteomics Experimental Design and Platform Performance .......62
2.3.3.3 Identification of CHO Cell Proteins .....................................................................70
2.3.3.4 Gene Ontology Analysis ......................................................................................72
2.3.4 Quantitative CHO DP-12 Proteomics Following Altered Bioprocessing .............75
2.3.5 Application of Quantitative Proteomics to Determine Bystander Response:
Naïve CHO K1 ......................................................................................................83
2.4 Conclusions and Future Work .............................................................................86
2.5 Author Contributions ..........................................................................................87
2.6 References ..........................................................................................................87
viii
3.0 Characterisation of Monoclonal Antibodies Following Production under Altered
Bioprocessing Conditions ........................................................................................ 93
3.1 Introduction ....................................................................................................... 93
3.2 Experimental ...................................................................................................... 96
3.2.1 Reagents and Consumables ............................................................................... 96
3.2.2 Purification of Anti-IL 8 from CHO DP12 ............................................................ 96
3.2.3 Size Exclusion Chromatography ......................................................................... 96
3.2.4 Cation Exchange Chromatography ..................................................................... 97
3.2.5 Hydrophobic Interaction Chromatography ........................................................ 97
3.2.6 Middle Down Analysis of IdeS-digested mAb .................................................... 97
3.2.7 Peptide Mapping ................................................................................................ 98
3.3 Results and Discussion ....................................................................................... 99
3.3.1 Intact Anti-IL8 Analysis ..................................................................................... 101
3.3.2 Middle-down Analysis of IdeS Digested Anti-IL8 IgG1 ..................................... 110
3.3.3 Peptide Mapping Analysis of Anti-IL8 Produced Under Altered Bioprocessing
Conditions ........................................................................................................ 123
3.4 Conclusions ...................................................................................................... 132
3.5 Author Contributions ....................................................................................... 132
3.6 References........................................................................................................ 133
4.0 Comparative Analysis of Monoclonal Antibody N-Glycosylation using Stable Isotope
Tagging and UPLC-Fluorescence-MS ...................................................................... 138
4.1 Introduction ..................................................................................................... 138
4.2 Experimental .................................................................................................... 140
4.2.1 Reagents and Consumables ............................................................................. 140
4.2.2 Glycoprotein Deglycosylation .......................................................................... 140
4.2.3 Derivatisation of free glycans with 12C6 / 13C6 2-aminobenzoic acid ................ 141
4.2.4 Separation of 2AA-labeled glycans UPLC-FLR-MS ............................................ 141
4.2.5 Determination of Glycosylation Site Occupancy using LC-MSE ........................ 142
4.3 Results and Discussion ..................................................................................... 143
4.3.1 Optimisation and Evaluation of 12/13C6 2-AA Performance .............................. 143
4.3.2 Comparability Assessment of Different Lots of a Commercial mAb using 12/13C6
2-AA N-Glycan UPLC-Fluorescence-MS ............................................................ 148
4.4 Conclusions ...................................................................................................... 155
4.5 Associated Publication and Author Contributions ........................................... 156
ix
4.6 References ........................................................................................................157
5.0 Structural and Functional Characterisation of Monoclonal Antibodies Following
Production under Altered Bioprocessing Conditions............................................... 160
5.1 Introduction ......................................................................................................160
5.2 Experimental .....................................................................................................163
5.2.1 Reagents and Consumables ..............................................................................163
5.2.2 Hydrogen-Deuterium Exchange Mass Spectrometry .......................................163
5.2.3 Surface Plasmon Resonance .............................................................................165
5.2.3.1 Determination of FcRn-Anti-IL8 Binding Affinity ..............................................165
5.2.3.2 Evaluation of Anti-IL8 – Interleukin 8 Binding Kinetics .....................................166
5.3 Results and Discussion ......................................................................................166
5.3.1 HDX-MS .............................................................................................................166
5.3.2 SPR Analysis Using Biacore ...............................................................................185
5.3.2.1 Determination of FcRn-Anti-IL8 IgG1 Binding for Anti-IL8 IgG1 Produced Using
Altered Bioprocessing .......................................................................................185
5.3.2.2 Determination of Binding Kinetics for Interleukin-8 and Anti-IL8 IgG1 Produced
Using Altered Bioprocessing Conditions ...........................................................192
5.4 Conclusions .......................................................................................................198
5.5 Author Contributions ........................................................................................198
5.6 References ........................................................................................................199
6.0 Identification and Quantitation of Bioprocess-related Host Cell Protein Impurities
following Downstream Processing of Therapeutic Monoclonal Antibodies ............. 203
6.1 Introduction ......................................................................................................203
6.2 Experimental .....................................................................................................205
6.2.1 Reagents and Consumables ..............................................................................205
6.2.2 Cell Culture ........................................................................................................206
6.2.3 IgG Purification..................................................................................................206
6.2.3.1 Protein A Affinity Chromatography ..................................................................206
6.2.3.2 Multimodal Chromatography Purification via CaptoTM Adhere ImpRes ...........207
6.2.4 High pH- Low pH 2D-LC-MSE Analysis of HCPs ..................................................207
6.2.5 Intact Protein Analysis of mAb Critical Quality Attributes ................................209
6.2.6 Glycan Analysis ..................................................................................................209
6.2.7 Anti-Host Cell Protein ELISA ..............................................................................210
x
6.3 Results and Discussion ..................................................................................... 210
6.3.1 Analytical Platform Performance ..................................................................... 210
6.3.2 Evaluation of Protein A Elution Buffers on mAb HCP Load .............................. 212
6.3.3 Evaluation of Impact of Harvest Time on HCP Repertoire ............................... 222
6.3.4 Evaluation of Additional Downstream Processing Steps ................................. 224
6.4 Conclusions ...................................................................................................... 226
6.5 Associated Publication and Author Contributions ........................................... 226
6.6 References........................................................................................................ 227
7.0 Overall Conclusions and Future Research Direction ................................................ 232
7.1 Overall Conclusions .......................................................................................... 232
7.2 Future Research Direction ............................................................................... 235
Supplementary Data ........................................................................................................- 1 -
Appendix A............................................................................................................................ - 1 -
Appendix B .......................................................................................................................... - 60 -

xi
Abbreviations
2-AA 2-Aminobenzoic Acid
2-AB 2-Aminobenzamide
2D-DIGE Two-dimensional Difference in Gel Electrophoresis
2-DE Two-dimensional Gel Electrophoresis
2D-LC-MS Two-dimensional Liquid Chromatography Mass Spectrometry
ANOVA Analysis of Variance
Anti-IL8 Anti-interleukin 8
AUC Analytical Ultracentrifuge
CDR Complementarity Determining Region
CHO Chinese Hamster Ovary
CID Collision Induced Dissociation
CQA Critical Quality Attribute
DDA Data Dependent Acquisition
DIA Data Independent Acquisition
DMSO Dimethyl Sulfoxide
DNA Deoxyribonucleic Acid
DO Dissolved Oxygen
DSP Downstream Processing
DTT Dithiothreitol
ELISA Enzyme-linked Immunosorbent Assay
EPO Erythropoietin
ESI Electrospray Ionisation
ETD Electron Transfer Dissociation
FASP Filter-aided Sample Preparation
FDA Food and Drug Administration
FDR False Discovery Rate
FLR Fluorescence Detector
FT-ICR Fourier Transform Ion Cyclotron Resonance
GO Gene Ontology
GRAVY Grand Average of Hydropathy
HCD High Energy Collision Dissociation
HCP Host Cell Protein
HDX Hydrogen Deuterium Exchange
HIC Hydrophobic Interaction Chromatography
HILIC Hydrophilic Interaction Chromatography
IAA Iodoacetamide
IEX Ion Exchange chromatography

xii
IgG Immunoglobulin G
IL8 Interleukin-8
IMS Ion Mobility Separation
IPA Ingenuity Pathway Analysis
iTRAQ Isobaric Tag for Relative and Absolute Quantitation
LC Liquid Chromatography
LTQ Linear Trap Quadrupole Mass Spectrometer
m/z Mass-to-charge Ratio
MALDI Matrix Assisted Laser Desorption Ionisation
MS Mass Spectrometry
MS/MS Tandem Mass Spectrometry
MWCO Molecular Weight Cut Off
NMR Nuclear Magnetic Resonance
PLGS ProteinLynx Global Server
PTM Post Translational Modification
QbD Quality by Design
QLIT Quadrupole-Linear Ion Trap Mass Spectrometer
qP Specific Productivity
QQQ Triple Quadrupole Mass Spectrometer
QTOF Quadrupole-Time-of-Flight Mass Spectrometer
RNA Ribonucleic acid
SAX Strong Anion Exchange
SCX Strong Cation Exchange
SDS-PAGE Sodium Dodecyl Sulphate-Polyacrylamide Gel Electrophoresis
SEC Size Exclusion Chromatography
SELDI Surface Enhanced Laser Desorption Ionisation
SILAC Stable Isotope Labelling of Amino Acids in Cell Culture
SPR Surface Plasmon Resonance
SPS Synchronous Precursor Selection
SWATH Sequential Window Acquisition of all Theoretical Spectra
TCEP Tris(2-carboxyethyl)phosphine
TEAB Triethylammonium Bicarbonate
Temp. Temperature
TFA Trifluoroacetic Acid
TMT Tandem Mass Tag
TOF Time-of-Flight
TPP Trans-Proteomic Pipeline
UPLC Ultra-high Performance Liquid Chromatography
UV Ultra-violet

xiii
A List of Figures
Figures Caption
1.1 A. Schematic diagram of electrospray ionisation process. B. The relationship
between ionisation efficiency and flow rate. ESI current is directly proportional to
the square root of the flow rate (V) while the analyte mass flow (Mf) is directly
proportional to V. Hence, the ionisation efficiency (i.e. the ratio of the ESI current
and mass flow rate) is proportional to the inverse square root of V resulting in a
dramatic improvement in ionisation efficiency at very low flow rates.
1.2 MS/MS spectrum generated from tryptic peptide AIDLIDEAASSIR from the E. coli
protein chaperone ClpB (Hi3 E. coli standard peptides purchased from Waters
(Dublin, Ireland)). Data was acquired using a Waters Xevo G2 QTof coupled to a
Waters nanoAcquity UPLC system equipped with a nanoAcquity UPLC 2G-V/M
Trap 5 µm symmetry C18, 180 µm x 20 mm trapping column and a nanoAcquity
UPLC 1.8 µm HSS T3, 75 µm x 200 mm analytical column.
1.3 Diagram of potential peptide fragmentation pattern following CID (b-, y- and a-
ions) and ETD (c-, z- and x-ions).
1.4 A. Depiction of LC-MSE analysis on a QToF mass spectrometer. All precursor ions
are transferred into a collision cell for CID fragmentation using alternated low
and elevated collision energy, providing precursor and product ion spectra from
every ion above the limit of detection of the MS instrument. B. Representation of
DIA operating in SWATH mode. All precursor ions within successive precursor ion
windows over the mass range of the experiment are transmitted into a collision
cell for fragmentation by CID.
1.5 Schematic of a data acquisition and database search workflow for proteomics.
Experimental MS/MS spectra are matched against (A) predicted fragment ions or
(B) theoretical MS/MS spectra from in-silico digested proteins, before reporting
of best-matched peptides and related score.
1.6 A. Schematic of quantitative proteomic analysis workflow using 6-plex TMT
reagents. Following sample preparation incorporating TMT reagents, samples are
combined before analysis using LC-MS/MS. The ratio of peak heights for reporter
fragment ions may then be used to determine the relative quantitation of
peptides in the samples under comparison. B. Structure of 6-plex TMT reagents,
adapted from [91]. 13C and 15N heavy isotopes are highlighted by red asterisks.

xiv
1.7 Schematic of the CHO proteome sample preparation and analysis approach
utilised by Baycin-Hizal et al. Proteins were extracted from both cell lysates and
spent media prior to in-gel separation and proteolysis or in-solution digestion
and reversed phase-LC. Sample fractions were subsequently analysed by LC-
MS/MS. In addition glycosylated peptides were analysed by solid phase
extraction coupled to LC-MS/MS
2.1 Experimental design for the determination of changes to CHO cell proteome in
response to altered bioprocessing. For each parameter studied (temperature, pH,
dissolved oxygen (DO)), three concurrent cultures were prepared and maintained
at standard culture conditions (37.0oC, pH 7.0, 85% DO) for the duration of th
exponential growth phase. When cultures entered the stationary phase of cell
growth (Day 5), one parameter was altered in two of the cultures as outlined in
Table 2.1. Bioprocessing was continued for a further 2 days before harvesting of
the cultures and separation of cells from spent cuture medium. An aliquot of
media was then applied for culture or naïve CHO-K1 cells for a period of 24
hours. Anti-IL8 IgG1 was purified from the remaining media samples using
Protien A affinity chromatography.
2.2 Graphs showing cell viability and viable cell counts and also metabolite and
nutrient concentrations recorded for CHO DP-12 cultures prepared to study the
effects of culture temperature. All measurements were performed using a Cedex
Bioanalyser via photometric analysis (n=1).
2.3 Graphs showing cell viability and viable cell counts and also metabolite and
nutrient concentrations recorded for CHO DP-12 cultures prepared to study the
effects of culture pH. All measurements were performed using a Cedex
Bioanalyser via photometric analysis (n=1).
2.4 Graphs showing cell viability and viable cell counts and also metabolite and
nutrient concentrations recorded for CHO DP-12 cultures prepared to study the
effects of dissolved oxygen content of culture media. All measurements were
performed using a Cedex Bioanalyser via photometric analysis (n=1).
2.5 Scatter plots prepared from TMT abundance data for identified and quantified
proteins from CHO DP-12 cell lysate, analysed using the 2D-LC-MS3 method,
showing linear correlation between triplicate technical replicates prepared.
2.6 Scatter plots showing linear correlation between biological triplicate replicates
prepared from different CHO DP-12 cell samples, cultured using identical
bioprocess conditions, and subsequently TMT labelled and analysed as part of
Set A or Set D (Table 2.2) using the 2D-LC-MS3 method described.
2.7 Scatter plots showing linear correlation between biological triplicate replicates
prepared from different CHO DP-12 cell samples, cultured using identical
bioprocess conditions, and subsequently TMT labelled and analysed using
different 2D-LC-MS3 runs.
xv
2.8 A. First dimensional chromatogram showing high pH reversed phase separation
of sample peptides from Set D. B. Total ion chromatograms obtained during
second-dimensional LC-MS3 analysis of Set D sample fractions.
2.9 Scatter plots showing linear correlation between biological triplicate replicates
prepared from different CHO K1 cell samples, cultured without application of
conditioned media samples, and subsequently TMT labelled and analysed using
the 2D-LC-MS3 method described.
2.10 Scatter plots showing linear correlation between biological triplicate replicates
prepared from different CHO K1 cell samples, cultured using CHO DP-12 spent
media produced under identical bioprocess conditions, and subsequently TMT
labelled and analysed using the 2D-LC-MS3 method described.
2.11 Scatter plots showing linear correlation between biological triplicate replicates
prepared from different CHO K1 cell samples cultured using CHO DP-12 spent
media produced under identical bioprocess conditions, and subsequently
analysed using the 2D-LC-MS3 method described.
2.12 2D-LC-MS3 method performance. A. Charge state distribution of peptides used
for identification of grouped proteins; B. Number of peptides identified for each
CHO protein reported; C. Sequence coverage profile for all protein groups
determined.
2.13 Identified CHO DP-12 proteins were processed using DAVID for determination of
potential associated biological functions. Enriched biological processes
associated with proteins identified in CHO DP-12 cell lysate, identified using
DAVID with p-values >0.05, were visualised using REVIGO. The complexity of the
graph and absence of clustering signifys the broad proteome coverage achieved.
2.14 Identified CHO DP-12 proteins were processed using DAVID for determination of
potential associated biological functions. Enriched molecular functions associated
with proteins identified in CHO DP-12 cell lysate, identified using DAVID with
results set to a 1% FDR and P-value > 0.05, were visualised using REVIGO. A
number of distinct clusters were observed, all of which were found to be
functions of growing cells.
2.15 Identified CHO DP-12 proteins were processed using DAVID for determination of
potential associated biological functions. Enriched cellular compartments
associated with proteins identified in CHO DP-12 cell lysate, identified usign
DAVID with results set to 1% FDR and P-vallue >0.05, are depicted. A description
of a portion of the annotated cellular compartments are shown. Cellular
compartments were visualised using REVIGO. For each cellular compartment
shown, the colour of the represenatative circle depicts Log 10 of the related p-
value, as shown in the legend.
xvi
2.16 Volcano plots showing fold changes plotted against –Log10 of p-values calculated
for CHO DP-12 proteins quantified. Significant proteins with fold changes >1.2
and p-value <0.05 are shown in black, green dots represent proteins with p-value
>0.05 and >1.2 fold change; blue dots represent proteins with p value >0.05, <1.2
fold change; red dots signify proteins with p value <0.05, <1.2 fold change.
2.17 Volcano plots showing fold changes plotted against –Log10 of p-values calculated
for CHO DP-12 proteins quantified. Significant proteins with fold changes >1.2
and p-value <0.05 are shown in blue, red dots represent proteins with p-value
>0.05 and >1.2 fold change; green dots represent proteins with p value >0.05,
<1.2 fold change; black dots signify proteins with p value <0.05, <1.2 fold change.
2.18 Heat map displaying the top canonical pathways identified for each CHO K1
proteomic sample using IPA. Using IPA, differentially regulated proteins with p
values <0.05 and having >1.2 log fold change and associated with different
known cellular pathways, were used to identify the top significantly differentially
regulated pathways in each of the CHO K1 samples following application of spent
media from CHO DP-12 cells cultured under altered bioprocessing conditions.
3.1 Schematic of a mAb, showing sites of potential sequence modifications denoted
by symbols outlined in the corresponding legend. The number of modification
sites for each half antibody multiplied by the number of possible variations at
each site is shown in the parenthesis. Assuming variants on each side of the
antibody are independent, each mAb has 108 potential variations.
3.2 Chromatograms corresponding to triplicate SCX-UV analysis of A. anti-IL8
produced at 39.5oC, B. anti-IL8 produced at 32.0oC, C. anti-IL8 produced using
110% DO media content. Sample separation was performed using a MAbPac SCX-
10 RS analytical column, 5 µm, 2.1 x 50mm, on a Vanquish Flex UHPLC using a
diode array detector at 280 nm. Data was acquired using Chromeleon version 7.2
software; peak areas were integrated manually.
3.3 Chromatograms corresponding to SCX-UV analysis (n=3) of A. anti-IL8 produced
using 60% DO media content, B. mAb produced at pH 7.2, C. mAb produced at
pH 6.8. Sample separation was performed using a MAbPac SCX-10 RS analytical
column, 5 µm, 2.1 x 50mm, on a Vanquish Flex UHPLC using a diode array
detector at 280 nm. Data was acquired using Chromeleon version 7.2 software;
peak areas were integrated manually.
3.4 Chromatograms corresponding to HIC-UV analysis (n=3) of A. anti-IL8 produced
at 39.5oC, B. anti-IL8 produced at 32.0oC, C. anti-IL8 produced using 110% DO
media content. Sample separation was performed using a MAbPac SEC-1
analytical column, 5 µm, 4.0 x 300mm, on a Vanquish Flex UHPLC using a diode
array detector at 280 nm. Data was acquired using Chromeleon version 7.2
software; peak areas were integrated manually.

xvii
3.5 Chromatograms corresponding to HIC-UV analysis (n=3) of A. anti-IL8 produced
using 60% DO media content, B. mAb produced at pH 7.2, C. mAb produced at
pH 6.8. Sample separation was performed using a MAbPac SEC-1 analytical
column, 5 µm, 4.0 x 300mm, on a Vanquish Flex UHPLC using a diode array
detector at 280 nm. Data was acquired using Chromeleon version 7.2 software;
peak areas were integrated manually.
3.6 Limited proteolysis of IgG1 by IdeS (FabRICATOR). [43] FabRICATOR cleaves IgG1
with high specificity at the hinge region between two glycine residues.
Subsequent disulfide bond reduction results in the formation of three
polypeptide populations of approximately 25 kDa in size.
3.7 Middle down analysis of Standard 1, replicate 1. A. Total Ion Chromatogram
(TIC); B. MS spectra corresponding to each highlighted TIC peak; C.
Deconvolution of charge envelopes shown in MS spectra to reveal monoisotopic
masses of mAb species.
3.8 Middle down analysis of Standard 1, replicate 2. A. Total Ion Chromatogram
(TIC); B. MS spectra corresponding to each highlighted TIC peak; C.
Deconvolution of charge envelopes shown in MS spectra to reveal monoisotopic
masses of mAb species.
3.9 Middle down analysis of Standard 1, replicate 3. A. Total Ion Chromatogram
(TIC); B. MS spectra corresponding to each highlighted TIC peak; C.
Deconvolution of charge envelopes shown in MS spectra to reveal monoisotopic
masses of mAb species.
3.10 Middle down analysis of Standard 2. A. Total Ion Chromatogram (TIC); B. MS
spectra corresponding to each highlighted TIC peak; C. Deconvolution of charge
envelopes shown in MS spectra to reveal monoisotopic masses of mAb species.
3.11 Middle down analysis of Standard 3. A. Total Ion Chromatogram (TIC); B. MS
spectra corresponding to each highlighted TIC peak; C. Deconvolution of charge
envelopes shown in MS spectra to reveal monoisotopic masses of mAb species.
3.12 Middle down analysis of anti-IL8 produced in culture maintained at 110% DO. A.
Total Ion Chromatogram (TIC); B. MS spectra corresponding to each highlighted
TIC peak; C. Deconvolution of charge envelopes shown in MS spectra to reveal
monoisotopic masses of mAb species.
3.13 Middle down analysis of anti-IL8 produced in culture maintained at 60% DO. A.
Total Ion Chromatogram (TIC); B. MS spectra corresponding to each highlighted
TIC peak; C. Deconvolution of charge envelopes shown in MS spectra to reveal
monoisotopic masses of mAb species.
xviii
3.14 Middle down analysis of anti-IL8 produced using increased culture temperature
of 39.5oC. A. Total Ion Chromatogram (TIC); B. MS spectra corresponding to each
highlighted TIC peak; C. Deconvolution of charge envelopes shown in MS spectra
to reveal monoisotopic masses of mAb species.
3.15 Middle down analysis of anti-IL8 produced using increased culture temperature
of 32.0oC. A. Total Ion Chromatogram (TIC); B. MS spectra corresponding to each
highlighted TIC peak; C. Deconvolution of charge envelopes shown in MS spectra
to reveal monoisotopic masses of mAb species.
3.16 Middle down analysis of anti-IL8 produced in culture maintained at pH 7.2. A.
Total Ion Chromatogram (TIC); B. MS spectra corresponding to each highlighted
TIC peak; C. Deconvolution of charge envelopes shown in MS spectra to reveal
monoisotopic masses of mAb species.
3.17 Middle down analysis of anti-IL8 produced in culture maintained at pH 6.8. A.
Total Ion Chromatogram (TIC); B. MS spectra corresponding to each highlighted
TIC peak; C. Deconvolution of charge envelopes shown in MS spectra to reveal
monoisotopic masses of mAb species.
3.18 Base peak chromatogram corresponding to LC-MS peptide mapping analysis of
tryptic peptides prepared from anti-IL8 mAb produced using 110% DO in culture
media.
3.19 Sequence coverage obtained following peptide mapping analysis of Standard 1
sample, injection 1. A: Light chain peptides identified, B: Heavy chain peptides
identified. Following LC-MS analysis of tryptic peptides, resultant data was
searched using Biopharma Finder software for identification and visualisation of
peptides. Each peptide identified is signified by a coloured bar. Red bars
represent peptides with a signal intensity of > 4.9 x 10⁶; Yellow bars represent
peptides with a signal intensity of > 1.4 x 10⁵; Green bars represent peptides with
a signal intensity of > 3.8 x 10³. Each number shown within each bar equals to the
retention time of that peptide.
3.20 Anti-IL-8 IgG1 heavy and light chain protein sequence. Amino acid residues that
were determined to have been modified following peptide mapping analysis are
highlighted: deamidation residues are coloured green; oxidised residues are red;
C-terminal truncated lysine is blue. CDR regions are underlined.
4.1 Labelling of glycans using 2-aminobenzoic acid (2-AA). Glycans are labelled using
a two-step reductive amination reaction, wherein the primary amide group of 2-
AA reacts with the aldehyde group of a glycan in a condensation reaction to form
a Schiff’s base. The resulting imine group is then reduced using sodium
cyanoborohydride to form a stable labeled glycans.

xix
4.2 Optimisation of 2-AA labelling reaction time. Oligomannose N-glycans released
from RNase B and complex sialylated N-glycans released from bovine fetuin were
incubated with 0.37 M 2-AA containing 1 M sodium cyanoborohydride in 70:30
DMSO acetic acid using a range of incubation times. The optimum incubation
time determined was 5 hours at 65 oC. Above this time desialylation of sialylated
N-glycans was observed.
4.3 Evaluation of the purity of the 13C6 2-AA reagent. The graph shows the relative
response of N-glycan samples labelled with the same concentration of the heavy
or light 2-AA labelling reagent (dark blue) and relative response of samples
labelled with light label and increased concentration of the heavy label to
account for label purity (light blue); B. Evaluation of relative quantitation
performance using stable isotope tagging.
4.4 Annotated fluorescence and base peak intensity chromatograms for N-glycans
released from polyclonal human serum IgG. The bar chart underneath the
chromatograms depicts the mean light to heavy relative ratio as experimentally
determined for the six technical replicates analyzed, y-error bars are also
included at ± the standard deviation of the six technical replicates.
4.5 Determination of glycosylation site occupancy. A. Representative base peak
chromatogram obtained following LC-MSE analysis of tryptic peptides, B.
Extracted ion chromatogram for EEQYDSTYR, C. MS spectrum corresponding to
EEQYDSTYR, D. MS/MS spectrum for EEQYDSTYR showing identified b and y ions
and amino acid sequence.
4.6 Annotated fluorescence and base peak intensity chromatograms for N-glycans
released from anti-IL8 IgG1. The bar chart underneath the chromatograms
depicts the mean light to heavy relative ratio as experimentally determined for
the five technical replicates analysed, y-error bars are also included at ± the
standard deviation of the five technical replicates.
5.1 Typical HDX-MS workflow. Proteins in solution at room temperature are diluted
in excess deuterated solution and HDX is allowed to occur for a specified amount
of time before the reaction is quenched in a low pH denaturation buffer. Protein
sample is then injected into a pepsin column for low temperature digestion.
Resultant peptides are separated using a fast separation gradient and detected
via mass spectrometry. Finally the mass shift of analysed peptides due to
deuterium uptake is determined and information regarding higher order
structure of the protein may be deduced.

xx
5.2 Deuterium uptake chart for FPPKPKDTLM (low temperature mAb - one MS
spectrum from each time-point only is shown for brevity). Each IgG1 sample
analysed was exposed to deuterated buffer for different lengths of time ranging
from 0 to 240 minutes, before undergoing proteolysis and MS analysis. MS
spectra corresponding to the same peptide (FPPKPKDTLM) determined in the
same sample that had been exposed to deuterated buffer for various durations
are shown. A characteristic mass shift is observed in the spectra following HDX
corresponding to the increased peptide mass, resulting from the replacement of
the peptide’s backbone amide hydrogen atoms with deuterium.
5.3 Peptic peptides identified across all experiments for anti-IL8 IgG1 produced at
standard conditions, 110% DO and 60% DO in mAb A. light chain and B. heavy
chain. Each peptide is represented by a blue bar.
5.4 Peptic peptides identified across all experiments for anti-IL8 IgG1 produced at
standard conditions, pH 7.2 and pH 6.8 in mAb A. light chain and B. heavy chain.
Each peptide is represented by a blue bar.
5.5 Peptic peptides identified across all experiments for anti-IL8 IgG1 produced at
standard conditions, 32.0oC and 39.5oC in mAb A. light chain and B. heavy chain.
Each peptide is represented by a blue bar.
5.6 Relative fractional uptake of deuterium for A. light chain and B. heavy chain anti-
IL8, produced under standard (85% DO), low DO (60% DO) and high DO (110%
DO) bioprocess conditions.
5.7 Relative fractional uptake of deuterium for A. light chain and B. heavy chain anti-
IL8, produced under standard (pH 7.0), low pH (pH 6.8) and high pH (pH 7.2)
bioprocess conditions.
5.8 Relative fractional uptake of deuterium for A. light chain and B. heavy chain anti-
IL8, produced under standard (37.0oC), low temperature (32.0oC) and high
temperature (39.5oC) bioprocess conditions.
5.9 Mirror plot showing the relative fractional uptake for mAb heavy chain from
samples produced using standard and altered bioprocess conditions of pH 6.8.
5.10 Mirror plot showing the relative fractional uptake for mAb light chain from
samples produced using standard and altered bioprocess conditions of pH 6.8.
5.11 Mirror plot showing the relative fractional uptake for mAb heavy chain from
samples produced using standard and altered bioprocess conditions of pH 7.2.
5.12 Mirror plot showing the relative fractional uptake for mAb light chain from
samples produced using standard and altered bioprocess conditions of pH 7.2.
5.13 Mirror plot showing the relative fractional uptake for mAb heavy chain from
samples produced using standard and altered bioprocess conditions of 39.5oC.

xxi
5.14 Mirror plot showing the relative fractional uptake for mAb light chain from
samples produced using standard and altered bioprocess conditions of 39.5oC.
5.15 Mirror plot showing the relative fractional uptake for mAb heavy chain from
samples produced using standard and altered bioprocess conditions of 32.0oC.
5.16 Mirror plot showing the relative fractional uptake for mAb light chain from
samples produced using standard and altered bioprocess conditions of 32.0oC.
5.17 Mirror plot showing the relative fractional uptake for mAb heavy chain from
samples produced using standard and altered bioprocess conditions of 110% DO.
5.18 Mirror plot showing the relative fractional uptake for mAb light chain from
samples produced using standard and altered bioprocess conditions of 110% DO.
5.19 Mirror plot showing the relative fractional uptake for mAb heavy chain from
samples produced using standard and altered bioprocess conditions of 60% DO.
5.20 Mirror plot showing the relative fractional uptake for mAb light chain from
samples produced using standard and altered bioprocess conditions of 60% DO.
5.21 Difference index plots showing differences in deuterium uptake between
standard mAb and A. high temperature mAb heavy chain, B. high temperature
mAb light chain, C. low temperature mAb heavy chain and D. low temperature
mAb light chain.
5.22 Difference index plots showing differences in deuterium uptake between
standard mAb and A. high temperature mAb heavy chain, B. high temperature
mAb light chain, C. low temperature mAb heavy chain and D. low temperature
mAb light chain.
5.23 Difference index plots showing differences in deuterium uptake between
standard mAb and A. high DO mAb heavy chain, B. high DO mAb light chain, C.
low DO mAb heavy chain and D. low DO mAb light chain.
5.24 Sensograms and residual plots from triplicate affinity analysis of FcRn binding to
anti-IL8 IgG1 produced in cell culture maintained at 110% DO (A-C) and 60% DO
(D-F).
5.25 Sensograms and residual plots from triplicate affinity analysis of FcRn binding to
anti-IL8 IgG1 produced in cell culture maintained at 39.5oC (A-C) and 32.0oC (D-F).
5.26 Sensograms and residual plots from triplicate affinity analysis of FcRn binding to
anti-IL8 IgG1 produced in cell culture maintained at pH 7.2 (A-C) and pH 6.8 (D-F).
5.27 Sensograms and residual plots from triplicate affinity analysis of FcRn binding to
anti-IL8 IgG1 produced in cell culture maintained at standard conditions:
standard 1 (A-C), standard 2 (D-F).

xxii
5.28 Sensograms and residual plots from triplicate affinity analysis of FcRn binding to
anti-IL8 IgG1 produced in cell culture maintained at standard conditions:
standard 3 (A-C).
5.29 Box-plot showing FcRn binding dissociation constants determined for anti-IL8
IgG1 produced using different bioprocessing conditions of pH, DO and
temperature (T).
5.30 Resulting Sensograms and residual plots from triplicate affinity analysis of
interleukin 8 binding to anti-IL8 IgG1 produced in cell culture maintained at
39.5oC (A-C) and 32.0oC (D-F).
5.31 Resulting Sensograms and residual plots from triplicate affinity analysis of
interleukin 8 binding to anti-IL8 IgG1 produced in cell culture maintained at pH
7.2 (A-C) and pH 6.8 (D-F).
5.32 Resulting Sensograms and residual plots from triplicate affinity analysis of
interleukin 8 binding to anti-IL8 IgG1 produced in cell culture maintained at 110%
DO (A-C) and 60% DO (D-F).
5.33 Resulting Sensograms and residual plots from triplicate affinity analysis of
interleukin 8 binding to anti-IL8 IgG1 produced in cell culture maintained at
standard conditions: standard 1 (A-C), standard 2 (D-F).
5.34 Resulting Sensograms and residual plots from triplicate affinity analysis of
interleukin 8 binding to anti-IL8 IgG1 produced in cell culture maintained at
standard conditions: standard 3 (A-C).
5.35 Box-plot showing interleukin-8 binding dissociation constants determined for
anti-IL8 IgG1 produced using different bioprocessing conditions of pH, DO and
temperature (T).
6.1 Schematic of workflow for discovery proteomic analysis of HCPs in
biotherapeutic protein samples.
6.2 Extracted ion chromatogram displaying ion peaks for each of the standard
peptides used for Hi3 quantitation.
6.3 Venn diagram showing the distribution of HCPs identified in mAb samples eluted
from Protein A resin using various buffers under study. A description of the
protein entries shown in the Venn diagram may be found in Table 6.2.
6.4 Chromatographic profiles obtained from (A) charge variant analysis and (B) SEC,
both shown in expanded scale, for mAb1 samples purified from Protein A resin
using acetate-, arginine-, citrate- and glycine-based buffers. Reference Table 6.4
for numerical values obtained from these analyses.

xxiii
6.5 Overlay of chromatgrams displaying N-glycan profiles of mAb1 processed from
Protein A resin using elution buffers 100 mM sodium acetate, pH 3.5, 100 mM
arginine, pH 3.5, 100 mM citrate, pH 3.5 and 100 mM glycine, pH 3.5.
6.6 Graphic of anti-Interleukin 8 IgG1 (mAb1) structure. MAb1 peptides, which were
identified in sample fractions also containing Calreticulin peptides, are
highlighted in the heavy chain (blue) and light chain (green) portions of the
structure.

xxiv
A List of Tables
Tables Caption
1.1 Advantages and disadvantages associated with in-gel and in-solution digestion of
proteomic samples.
1.2 Common hybrid mass spectrometers used in proteomics.
1.3 Determination of proteome changes following culture under productivity-enhancing
conditions and productivity-enhancing genetic interventions in CHO cells.
2.1 Bioprocessing conditions used to prepare CHO DP-12 cell cultures in Sartorius
Cultibag Disposable Bioreactors.
2.2 Experimental design for CHO DP-12 cultures prepared in Cultibag disposable
bioreactors.
2.3 Experimental design for CHO K1 cultures treated with conditioned media obtained
from CHO DP-12 cultures. Three untreated ‘blank’ CHO K1 cultures were also
prepared.
2.4 Top up- or down-regulated pathways for CHO DP-12 cells cultured under various
altered bioprocessing conditions, as determined using IPA. The top three pathways
with an absolute z-score of >1.0 and identified using a minimum of 4 proteins are
shown; gene names coloured green were found to be up-regulated whereas those
in red were identified as being down-regulated.
2.5 Differentially regulated proteins identified following IPA analysis using an absolute
Z-score > 2.0.
2.6 Individual protein (|Z-score|> 2.0) associated with >10 differentially regulated
pathways observed following IPA analysis of CHO K1 proteomic data.
3.1 Description of anti-IL8 samples for product characterisation analysis.
3.2 Results from SEC-UV analysis of differentially produced mAb samples.
3.3 Percentage area of peaks observed following SCX analysis of differentially produced
anti-IL8; standard deviation between replicates is shown in the parenthesis.
3.4 Percentage area of main mAb peak observed following HIC-UV analysis of
differentially produced anti-IL8 IgG1.
3.5 Common modifications observed for monoclonal antibodies and applied for peptide
mapping analysis of anti-IL8.
xxv
3.6 Average percentage abundance values for light chain mAb modifications
determined following peptide mapping analysis; standard deviation between
replicate analyses is shown in the parenthesis.
3.7 Average percentage abundance values for heavy chain mAb modifications
determined following peptide mapping analysis; standard deviation between
replicate analyses is shown in the parenthesis.
3.8 Ratio of light chain and heavy chain modifications determined in mAb produced
under different bioprocessing conditions relative to average % abundance of each
modification in mAb produced under standard conditions.
4.1 Relative light to heavy ratios determined for the analysis of the individual lots of
mAb analysed as indicated in the table header.
4.2 Relative light to heavy ratios determined for the analysis of anti-IL8 IgG1. N-glycan
species released from IgG1 cultured under standard conditions with one parameter
varied, as outline in the table header information, were labelled using 12C6 2-AA,
while those from cultures maintained at standard conditions (37oC, 85% DO, pH7.0)
were labelled using 13C6 2-AA.
5.1 Peptides displaying altered deuterium uptake compared to standard mAb samples
analysed and related peptide modifications identified.
5.2 Dissociation constants determined following SPR binding affinity analysis of anti-IL8
IgG1 and FcRn.
5.3 Affinity constants obtained following single-cycle SPR analysis of anti-IL8 IgG1 and
interleukin-8 binding kinetics.
6.1 Resulting P-values from ANOVA determination of peak heights for each standard
peptide ion in extracted ion chromatograms analysed.
6.2 Summary of identified HCPs and related concentrations in combined sample sets
processed from Protein A resin with different elution buffers.
6.3 Whole protein immunogenicity score reported by the CHOPPI web tool for
assessment of immunogenicity risk from HCPs in CHO-based protein production.
Proteins with an immunogenicity score of > 20 are considered to be a high risk for
immunogenicity, while proteins with a score < -20 are reportedly immunologically
inert.
6.4 Analytical results from charge variant and size exclusion analysis of intact mAb1.
6.5 Host cell proteins identified and quantified in Protein A purified mAb1 samples
harvested at different stages of cell culture growth.
6.6 Host cell protein profile of mAb1 samples taken before and after mixed-mode
chromatographic polishing using Capto Adhere ImpResTM.


xxvi
Abstract
Title: Development and Application of Quantitative Liquid Chromatography – Mass
Spectrometry Techniques to Facilitate Enhanced Bioprocessing of Therapeutic
Proteins
Candidate: Amy Farrell
Biopharmaceutical manufacturing is currently the principal growth sector within the
pharmaceutical industry. Predominantly formed in mammalian cells, these therapeutic
proteins exist as a spectrum of different isoforms and hence pose a unique set of challenges
that must be addressed to ensure optimum product quality. To better understand whether the
product really is the process, quantitative peptide centred multidimensional liquid
chromatography tandem mass spectrometry (LC-MS) based proteomics studies were
performed using a Chinese Hamster Ovary (CHO) cell line that expressed an anti-Interleukin-8
IgG1 monoclonal antibody (mAb). Following serum free suspension batch culture under varied
bioprocess conditions, quantitative proteomics was completed on the producer CHO cells to
elucidate the cellular response to altered culture conditions of pH, temperature and dissolved
oxygen. The developed platform was also applied for the analysis of naïve CHO K1 cells
following their exposure to spent culture media from the various production runs. Complete
characterisation of the expressed mAb was performed, using advanced LC-MS methods
including high resolution middle down mass spectrometry; intact protein analysis of critical
quality attributes, stable isotope based quantitative glycan analysis and hydrogen deuterium
exchange mass spectrometry for structural comparability analysis. In addition data
independent LC-MS quantitative proteomics of residual host cell protein impurities was also
carried out to evaluate the effect of downstream processing on the quality of the final drug
substance. Combined, the findings herein provide a holistic insight into the effect of various
upstream and downstream parameters on the quality of therapeutic proteins and facilitate a
greater understanding of the molecular mechanisms governing biopharmaceutical production
systems, thereby creating a hypothesis for improved future cell line development using
various engineering strategies.


Chapter 1
1
1.0
A Review of Analytical Technologies used
for Quantitative CHO Cell Proteomics
1.1 Introduction
Chinese hamster ovary (CHO) cell lines are currently the dominant expression system for
biotherapeutic proteins produced in mammalian cell lines and are utilised in the production of
six of the top ten-selling biopharmaceutical products.[1] CHO cells lines are widely used due to
their ability to facilitate correct protein folding and human-like post-translational
modifications (e.g. glycosylation) of recombinant therapeutic proteins. In addition, CHO cell
lines are amenable to serum-free suspension cultivation and are readily adaptable to different
media compositions, both critical features for protein production in large-scale bioreactors.
Since regulatory approval for the first therapeutic protein, which was produced in a CHO cell
line, was achieved, considerable efforts have been made to improve recombinant protein
production. Initially the bulk of research was focused on increasing productivity and
therapeutic protein quality by altering various bioprocessing parameters. More recently,
advances in analytical instrumentation have enabled a deeper understanding of the cellular-
level mechanisms that effect protein production in these important cell lines. In particular
developments in liquid chromatography (LC) and mass spectrometry (MS) have facilitated the
emergence of ‘omics’ tools which have allowed us to gain a depth of understanding of CHO
cell proteomes, the functional units of the cell, that previously had not been possible.
Mass spectrometry coupled with technologies for sample preparation and separation, along
with data analysis software for protein identification and quantitation, provide a powerful
platform for analysis of proteomes from biologically relevant samples. Traditionally, CHO
proteomics was driven by research using two-dimensional gel electrophoresis combined with
mass spectrometry. The majority of these studies consisted of separation and isolation of
proteins in gel ‘spots’ and ionisation and detection of peptides using matrix-assisted laser
desorption ionisation – Time of flight (MALDI-ToF) mass spectrometry. More recently, major
advances in gel-free peptide separation technologies, mass spectrometry and bioinformatics,
augmented by the CHO genomic revolution have allowed LC-based proteomics to flourish.

Chapter 1
2
Two-dimensional liquid chromatography coupled to mass spectrometry (2D-LC-MS) now
routinely facilitates the identification of thousands of proteins from complex samples.
Due to improvements in MS and bioinformatics, comprehensive characterisation and
quantification of proteins within biologically relevant samples using quantitative proteomics is
now achievable, enabling the classification of CHO cell proteins that play key roles in
recombinant protein production, including those involved in growth, metabolism, protein
processing, glycosylation and cell death.[2] Hence, knowledge gained through CHO cell
proteomics have the potential to lead to further advances in therapeutic protein production in
CHO cells, including improved media and bioprocess development, advanced elimination of
bioprocess impurities, characterisation of critical quality attributes and by identifying features
that lead to desired phenotypes for biopharmaceutical production of therapeutic proteins. [3]
In Chapter 1, analytical technologies that are currently applied for proteomic profiling of CHO
cell line behaviour and characterisation of therapeutic proteins will be discussed. A particular
focus is applied to LC-MS separation and detection strategies and related quantitative and
bioinformatics tools. Subsequently, a review of the application of these techniques to better
understand the CHO cell proteome will be outlined.
1.2 Sample Preparation for Proteome Analysis
Two typical proteomics approaches are used for analysis of large biomolecules by mass
spectrometry; these are ‘Top-down’ and ‘Bottom-up’ approaches. In a bottom-up strategy,
specific peptide bonds are cleaved to produce peptides composed typically of <20 amino acid
residues, which are subsequently analysed using a mass spectrometer. Conversely, in a top-
down experiment, the complete undigested protein is analysed. In proteomics, the former
approach is most frequently used as mass spectrometers are more efficient in deriving
sequence information from peptides rather than whole proteins. [4]
Traditionally, a bottom-up proteomic strategy consisted of ‘in-gel’ digestion, in which proteins
were denatured and separated using sodium dodecyl sulphate – polyacrylamide gel
electrophoresis (SDS-PAGE), followed by visualisation of proteins in a gel and excising of
protein-containing gel plugs before reduction, alkylation, digestion and extraction from the gel
matrix for MS analysis. [5] Alternatively ‘in-solution digestion’ was developed wherein direct
solubilisation and denaturation of proteins in a digestion buffer was followed by disulphide
reduction and alkylation of free sulfhydryl groups on cysteine residues before digestion with

Chapter 1
3
an endoproteinase. Both ‘in-gel’ and ‘in-solution’ sample preparation methods have various
advantages and drawbacks, as outlined in Table 1.1.
Table 1.1: Advantages and disadvantages associated with in-gel and in-solution digestion of
proteomic samples. [6]
In-gel digestion
Advantages Visual indication of relative abundance or proteins in a sample
Robustness against impurities interfering with digestion
Universal solubilisation of proteome using SDS
Disadvantages Proteins trapped in a gel may be inaccessible to digest reagent
Peptide recovery may be hampered by gel matrix
In-solution digestion
Advantages No detergents needed
Minimal sample handling
Rapid sample preparation
Easily automated
Reduced sample requirement
Disadvantages Digestion may be inhibited by interfering substances
Risk of incomplete solubilisation of proteome (e.g. membrane proteins)
In order to overcome limitations associated with the sample preparation methods outlined,
Mann and colleagues developed an alternative method for proteome sample preparation that
reportedly combined the advantages of both ‘in-gel’ and ‘in-solution’ digestion approaches,
known as filter-aided sample preparation (FASP). [7] Using FASP, solubilisation of proteins is
achieved using SDS before application of the entire protein sample to a filtration device. The
filtration device then serves as a vessel for detergent removal, buffer exchange, reduction and
alkylation of proteins and finally protein digestion in solution. FASP therefore combines the
solubilisation efficiency of in-gel digestion with the digestion efficiency of in-solution digestion
methods.
Several enzymes are available for protein digestion in bottom-up proteomics, however the
most commonly used protease in proteomics is Trypsin. Trypsin has a well-defined specificity,
hydrolysing only the peptide bonds in which a carbonyl group is followed by either arginine (R)
or lysine (K) (except when R or K is N-linked to an aspartic acid residue). Due to the frequency
of R and K residues within the proteome, Trypsin generates peptides with the preferred mass
range for MS sequencing. [8] Additionally, tryptic peptides terminating in basic R and K
Chapter 1
4
residues form prominent, easily detectable fragment ions. [9] In some instances, additional
digestions are required for optimal proteomic sample preparation. The endoprotease Lys-C is
often used prior to trypsin digestion producing larger peptide fragments than trypsinization.
[10] Similarly, proteases such as Asp-N and Glu-C, may be used to produce peptides
complementary to tryptic peptides for MS analysis. [4]
1.3 Separation Technologies
Two-dimensional gel electrophoresis (2-DE) has traditionally been the workhorse for
proteomics, facilitating the separation of proteins based on differences in protein size and net
charge at different pH values. Although 2-DE is renowned for its excellent resolving power, it
has a number of limitations including poor reproducibility, co-migration of proteins, poor
representation of low abundant, highly acidic or highly basic proteins and difficulty in
automation. [11] To overcome low reproducibility in 2-DE, two-dimensional differential in-gel
electrophoresis (2D-DIGE) was developed, allowing for differentially labelled samples to be
separated and visualised on the same 2D gel. [12] However like 2-DE, 2D-DIGE is cumbersome
and is limited by dynamic range for protein separation. Due to advances in ionisation
techniques for mass spectrometry, liquid chromatography has emerged as a leading technique
for proteomic separations over the last decade. Reversed phase (RP) chromatography, in
which analytes are partitioned based on their interaction with a hydrophobic stationary phase
while being carried in a polar hydrophilic mobile phase with increasing organic modifier
content, is the most widely used gel-free chromatography method for proteomic sample
preparation. [13] Like gel separation technologies, LC approaches often use a two dimensional
(2D) separation strategy to ensure sufficient separation of peptides or proteins for detection.
Use of orthogonal separation methods permits the resolution of peptides in highly complex
samples on the basis of different physiochemical properties, thereby increasing overall peak
capacity. [13] Frequently, orthogonal 2D-LC configurations consist of RP, [14] strong cation
exchange (SCX), [15] strong anion exchange (SAX), [16] hydrophilic interactions
chromatography (HILIC) [17] and other specific chemistries in the first dimension, coupled to
RP-nano-LC in the second dimension. The use of nano-LC directly interfaced with MS was of
great significance in regards to advances in proteomic analysis, as a reduction in internal
diameter of analytical separation columns enabled increased separation efficiency, reduced
solvent consumption, smaller sample requirements and ease of coupling to a mass
spectrometer. [18] Furthermore, nano-LC systems incorporating split-less pumps ensure a

Chapter 1
5
continuous flow required for electrospray ionisation (ESI) and hence are becoming a mainstay
of proteomics research. [19]
1.4 Detection by Mass Spectrometry
MS detection has become a key enabler of in-depth proteomics over the last two decades,
resulting from major advancements in mass spectrometry. A mass spectrometer measures the
mass-to-charge (m/z) ratio of gas-phase ions, typically consisting of an ion source, for the
production of gaseous ions from a sample; a minimum of one mass analyser, for separation of
ions based on their m/z ratios and a detector to record ion data. The MS platform is
completed by an inlet feature for introduction of sample into the ion source and a computer
to process sample information and generate mass spectra.
1.4.1 Ionisation of Biomolecules
The application of MS to the analysis of biomolecules and emergence as an indispensable tool
for protein analysis was facilitated by the development of ‘soft ionisation’ techniques, e.g.
MALDI or ESI. Proteins and peptides are non-volatile, polar and thermally labile species that,
for MS analysis, require an ionisation technique to transfer the analyte to gas phase without
resulting in over fragmentation or extensive degradation of the biomolecule. [20] MALDI,
classically used in combination with gel-separation strategies, is particularly applicable to top-
down analysis of high molecular weight proteins in simple sample mixtures as it
predominantly generates singly-charged ions. However, MALDI-associated drawbacks include
poor shot-to-shot reproducibility, potential signal suppression, limited detectable mass range
and reliance on efficient sample preparation techniques. [20, 21] Due to recent analytical
technological advances, LC-ESI-MS capabilities now far surpass those of gel-based MALDI-MS
techniques.
The concept of ESI, visualised in Figure 1.1-A, was developed by Fenn et al. in 1984 for the MS
analysis of biological macromolecules. [22] During ESI, proteins or peptides in solution are
pumped through a metal capillary maintained at a high voltage (2-6 kV) and nebulised at the
tip of the capillary to produce a fine spray of charged droplets. The charged droplets strongly
repel each other to form a conical shape known as a ‘Taylor cone’ and are quickly evaporated
following the application of heat and a nebulising gas. [23] The reduction in droplet size results
in a build-up of ions of one polarity on the surface of the drop and, at the point when the

Chapter 1
6
forces of electrostatic repulsion are greater than the surface tension (i.e. the ‘Rayleigh limit’)
the droplet explodes, culminating in the production of gas phase ions. The ions are then
subsequently transferred into the mass spectrometer. [23, 24]
Figure 1.1: A. Schematic diagram of electrospray ionisation process. [25] B. The relationship
between ionisation efficiency and flow rate. ESI current is directly proportional to the square
root of the flow rate (V) while the analyte mass flow (Mf) is directly proportional to V. Hence,
the ionisation efficiency (i.e. the ratio of the ESI current and mass flow rate) is proportional to
the inverse square root of V resulting in a dramatic improvement in ionisation efficiency at
very low flow rates. [26, 27]
ESI has a number of advantages rendering the technique particularly suitable for the analysis
of biomolecules. Significantly, ESI is carried out at close to ambient temperatures, and hence
thermally labile, polar molecules such as proteins and peptides may be ionised without
decomposition. In addition as the ions are produced in solution, analytes with several
ionisable sites may produce multiply-charged species, successfully extending the effective
mass range of the instrument. [23] However, conventional ESI was greatly affected by
fluctuation in flow rate and due to the size of the droplets emerging from the ESI capillary and
requirement for nebulising gas, only a small portion of the sample is transferred into the mass
analyser, as is shown in Figure 1.1-A.
ESI-associated caveats were addressed by Wilm and Mann, when they first described their
innovative nano-electrospray ion (nanoESI) source. [28] Wilm and Mann used glass capillaries
pulled into sharp tips with a 1-2 μm spraying orifice to reduce the size of droplets formed at
the tip of the capillary. Since droplets produced in the nanoESI source are relatively small and
have high surface-to-volume ratios, a desolvation gas is not required for solvent evaporation.

Chapter 1
7
[29] Additionally, the small droplet size has resulted in an increased tolerance of buffer salts
and other impurities. Use of capillaries with a small spraying orifice also facilitated low flow
rates (20 nL.min-1) resulting in increased ionisation efficiency as depicted in Figure 1.1-B.
Furthermore, the use of low flow rates permits the positioning of the nanoESI capillary close to
the MS inlet orifice, resulting in increased ion transmission in comparison to conventional ESI.
Ultimately the use of a nano-scale ESI source resulted in a reportedly 100-fold improvement in
ionisation efficiency enabling high sensitivity analysis while using low sample amounts.
Initial use of nanoESI instrumentation involved placing sample into a needle and spraying the
sample into the MS inlet. Although this resulted in an increase in overall ionisation efficiency,
the absence of analytical separation made manipulation of the ion within the mass
spectrometer difficult for MS/MS analysis. Fortuitously, the development of nanoESI coincided
with progress in the miniaturisation of LC systems. The suitability of nanoESI for coupling to
liquid separation techniques and the development of nano-LC pumps facilitating low flow
rates have resulted in greatly advanced separation of peptide ion peaks and hence superior
proteome coverage when coupled to mass spectrometers. Due to ease of automation and
successful application to highly complex protein samples, integrated nano-LC-ESI-MS systems
are now extensively applied in the field of proteomics research.
1.4.2 Mass Analyser Configuration for Quantitative Proteomics and Product
Characterisation
As peptides typically have multiple charge states (z = 2, 3, 4), the ability of the mass analyser
to resolve ions with minute differences in m/z is critical for accurate identification of protein
and peptide species. Hence, many of the advancements in mass spectrometry in recent years
have focused on increasing the resolving power of the mass analyser. Several mass analysers
are available, including the first generation low resolution (<10,000) quadrupole, time-of-flight
and ion trap mass analysers. However in recent years proteomics has been almost exclusively
performed on high resolution hybrid instruments due to their capabilities for high mass
accuracy, resolution, sensitivity and extended mass range. Table 1.2 depicts a number of
available hybrid instruments, which usually incorporate two or more mass analysers. In these
instruments ions from an ion source are focused and transmitted using a quadrupole or linear
ion trap and separated and analysed using a ToF, fourier transform ion cyclotron resonance
(FT-ICR) or Orbitrap analyser, thereby combining the advantages of each individual mass

Chapter 1
8
analyser. The power of these hybrid instruments is most notably reflected when operated in
tandem MS mode, as will be discussed in section 1.4.3.
Due to high resolution and broad mass range capabilities, in addition to more favourable start-
up costs in comparison to alternative high resolution instruments, the quadrupole time-of-
flight (QToF) mass spectrometer has been widely applied for the identification of CHO cell
proteins. A QToF consists of a quadrupole, which serves to selectively transmit ions according
to their mass to charge (m/z) ratios by varying the RF potential applied to four parallel poles,
into a time-of-flight mass analyser. Ions are then directed towards a detector and measured
according to the time taken to move through a field-free region between the inlet and the
detector.
High resolution instruments incorporating an Orbitrap mass analyser are capable of achieving
the greatest resolving power when compared to other hybrid mass spectrometers. Pioneered
by Makarov et al., the Orbitrap is an ion trap mass analyser composed of an outer barrel-like
electrode encasing a co-axial spindle-like electrode, which traps ions in an orbital motion. An
ion’s m/z ratio is measured from the frequency of harmonic oscillations undertaken by
orbitally trapped ions along the axis of the electric field. [30] In-depth proteomics utilising
Orbitrap-containing hybrid MS routinely lead to the identification of >4,000 proteins in a single
MS analysis. [31] The concept of hybrid MS has been further expanded by the development of
a tribrid MS incorporating three mass analysers (i.e. a quadrupole mass filter, an ultra-high
field Orbitrap analyser and a dual pressure linear ion trap analyser (Table 1.2). This instrument
has significantly improved capabilities for quantitative proteomics as will be discussed in
Section 1.6.

Chapter 1
9
Table 1.2: Common hybrid mass spectrometers used in proteomics. [32-35]
Instrument Type
Schematic of MS Typical Specifications
QTof
e.g. Waters Xevo G2
QToF
Resolution: 0.04 ∆m/z
Mass accuracy: <1 ppm
m/z range: 50-20,000
QQQ
e.g. Agilent 6460
Resolution: 0.4 ∆m/z
Mass accuracy: 5 ppm
m/z range: 10-3000
Q-LIT
e.g. AB SCIEX
QTRAP 5500
Resolution: 0.1 ∆m/z
m/z range: 5-1250
Q-Orbitrap
e.g. Thermo Fisher
Scientific Q Exactive
Resolution: 0.001 ∆m/z
Mass accuracy: <1 ppm
m/z range: 50-4000
LTQ-Orbitrap
e.g. Thermo Fisher
Scientific Orbitrap
Elite
Resolution: 0.002 ∆m/z
Mass accuracy: <1 ppm
m/z range: 50-4000
Q-LIT-Orbitrap
e.g. Thermo Fisher
Scientific Orbitrap Fusion Lumos Tribrid
Resolution: 0.0004 ∆m/z
Mass accuracy: <1 ppm
m/z range: 50-6000

Chapter 1
10
1.4.3 Tandem Mass Spectrometry
Identification of proteins following MS analysis was traditionally achieved using peptide mass
fingerprinting, a technique whereby a peptide mass profile detected by MS analysis is
compared with all predicted peptide digests in a database of known proteins, to identify the
best possible protein match. [36] This method however is not suitable for the analysis of
complex protein samples, as frequently common peptide sequences will exist across multiple
proteins. The requirement for additional identification methods for analysis of protein
mixtures led to the development of tandem MS; (MS/MS), facilitated by the construction of
hybrid or tandem mass spectrometers combining two or more mass analysers (section 1.4.2).
In MS/MS instrumentation, a single (precursor) ion is selected in the first mass analyser and
subsequently fragmented to produce fragment (product) ions which are separated in the
second mass analyser according to their mass. Resulting MS/MS spectra consist only of
product ions from the selected precursor ion as displayed in Figure 1.2. The mass difference
between peaks in the MS/MS spectrum may be correlated to the mass of an amino acid,
hence the amino acid sequence of the peptide may be deduced.
Figure 1.2: MS/MS spectrum generated from tryptic peptide AIDLIDEAASSIR from the E. coli
protein chaperone ClpB (Hi3 E. coli standard peptides purchased from Waters (Dublin,
Ireland)). Data was acquired using a Waters Xevo G2 QTof coupled to a Waters nanoAcquity
UPLC system equipped with a nanoAcquity UPLC 2G-V/M Trap 5 µm symmetry C18, 180 µm x
20 mm trapping column and a nanoAcquity UPLC 1.8 µm HSS T3, 75 µm x 200 mm analytical
column.
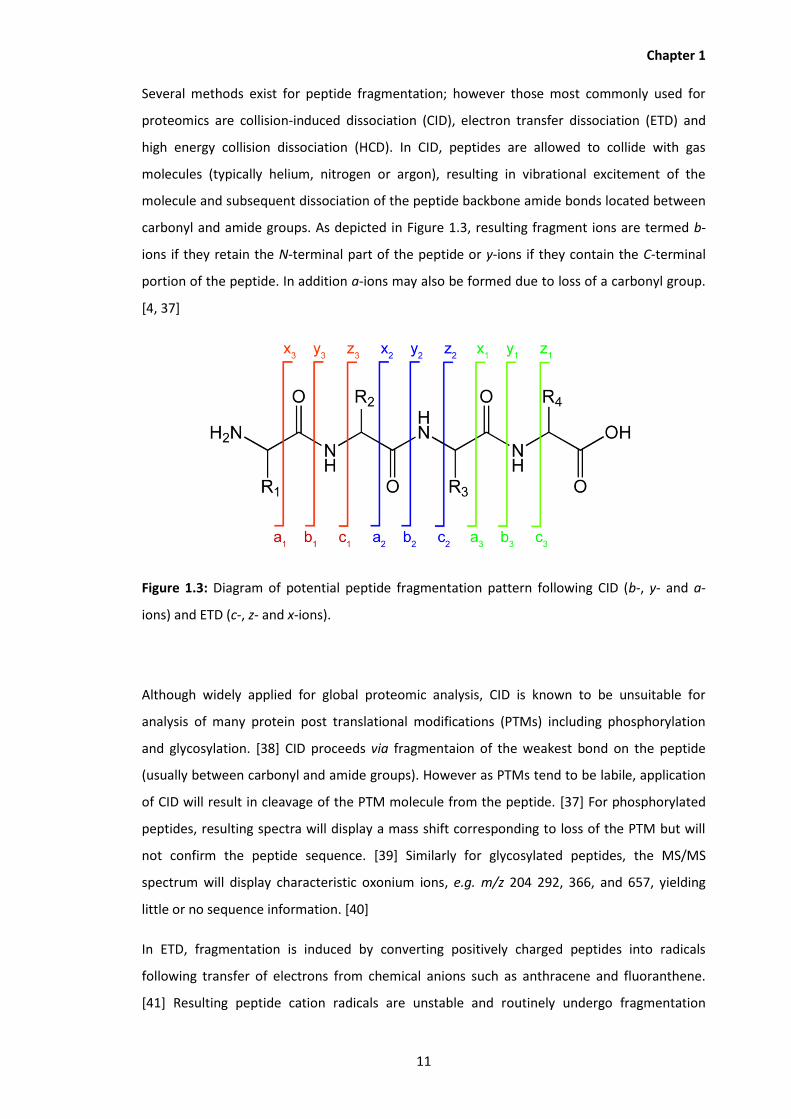
Chapter 1
11
Several methods exist for peptide fragmentation; however those most commonly used for
proteomics are collision-induced dissociation (CID), electron transfer dissociation (ETD) and
high energy collision dissociation (HCD). In CID, peptides are allowed to collide with gas
molecules (typically helium, nitrogen or argon), resulting in vibrational excitement of the
molecule and subsequent dissociation of the peptide backbone amide bonds located between
carbonyl and amide groups. As depicted in Figure 1.3, resulting fragment ions are termed b-
ions if they retain the N-terminal part of the peptide or y-ions if they contain the C-terminal
portion of the peptide. In addition a-ions may also be formed due to loss of a carbonyl group.
[4, 37]
Figure 1.3: Diagram of potential peptide fragmentation pattern following CID (b-, y- and a-
ions) and ETD (c-, z- and x-ions).
Although widely applied for global proteomic analysis, CID is known to be unsuitable for
analysis of many protein post translational modifications (PTMs) including phosphorylation
and glycosylation. [38] CID proceeds via fragmentaion of the weakest bond on the peptide
(usually between carbonyl and amide groups). However as PTMs tend to be labile, application
of CID will result in cleavage of the PTM molecule from the peptide. [37] For phosphorylated
peptides, resulting spectra will display a mass shift corresponding to loss of the PTM but will
not confirm the peptide sequence. [39] Similarly for glycosylated peptides, the MS/MS
spectrum will display characteristic oxonium ions, e.g. m/z 204 292, 366, and 657, yielding
little or no sequence information. [40]
In ETD, fragmentation is induced by converting positively charged peptides into radicals
following transfer of electrons from chemical anions such as anthracene and fluoranthene.
[41] Resulting peptide cation radicals are unstable and routinely undergo fragmentation
Chapter 1
12
following dissociation of bonds between amide groups and α-carbons to produce
characteristic c- and z-ions (Figure 1.3). [42] Due to the rapid nature of ETD, it is capable of
retaining modifications and hence is ideal for the study of PTMs. [38] Furthermore, as ETD
provides information on the location of PTMs, it is an important technique for advanced
structural characterisation of proteins.
CID is generally carried out using high energy beam instruments such as QToF and QQQ mass
spectrometers for global proteomics, as peptides containing labile PTMs are less amenable to
low energy, resonate excitation MS/MS analysis. [43] For this reason Makarov et al. developed
HCD [44] for use alongside Orbitrap mass analysers to compete with high-beam instruments.
In addition to achieving increased fragment ion efficiency when compared to other traditional
trapping mass analysers, use of HCD results in an extended detection mass range for MS/MS
fragments enabling MS/MS-based quantitation using stable isotopes (to be discussed in
section 1.6).
1.4.4 Data dependent versus Data independent Acquisition in Mass Spectrometry
In mass spectrometry, peptide data is acquired in one of two general modes: data dependent
acquisition (DDA) or data independent acquisition (DIA) mode. Traditionally DDA has been the
gold standard for MS analysis. In DDA ionised peptides are analysed to generate a list of
precursor masses then, depending on particular MS settings chosen (e.g. peak intensity), a
certain number of precursor ions are selected for MS/MS fragmentation. Interpretation of
resultant MS/MS spectra yields sequence information which may then be compared with a
peptide database for protein identification. [45] As all fragment ions are detected and the
precursor ion related to the fragments is known, an analyst may have confidence in the quality
of peptide identifications from complex protein mixtures. However, since only a small number
of precursor ions are selected in a defined period of time, DDA may display bias towards more
abundant proteins in the sample being analysed. As peptides enzymatically derived from
proteins will have varying ionisation efficiencies and proteins in a complex sample will have
concentrations spanning a wide dynamic range (with the majority existing at concentrations at
least two orders of magnitude lower than the most abundant protein), many of the low
abundant proteins may not be identified. [46, 47] In order to combat this limitation, dynamic
exclusion is often employed wherein previously selected precursor ions are excluded from
subsequent ion selection for MS/MS fragmentation, thereby increasing proteome coverage in
DDA analysis. [48]

Chapter 1
13
The first DIA method was pioneered by Silva and co-workers, who described a MS acquisition
method wherein no selection bias of precursor ions is used, later named MSE acquisition. [49,
50] In MSE, the first mass analyser (shown as a quadrupole in Figure 1.4-A) transfers all
precursor ions into a collision cell for fragmentation by CID. Collision energy applied is
alternated between low and elevated energy, providing precursor (MS 1) and product (MS 2)
ion spectra from every ion above the limit of detection of the instrument as low energy scans
measure intact peptide ions while fragment ions are measured in high energy scans. [51]
Bioinformatics software is then used to correlate fragment ions to their corresponding
precursor ions based on retention time, mass accuracy and other physicochemical properties
including fragment to precursor ratios and peptide fragmentation prediction. [52]
Figure 1.4: A. Depiction of LC-MSE analysis on a QToF mass spectrometer. All precursor ions
are transferred into a collision cell for CID fragmentation using alternated low and elevated
collision energy, providing precursor and product ion spectra from every ion above the limit of
detection of the MS instrument. [53] B. Representation of DIA operating in SWATH mode,
adapted from [54]. All precursor ions within successive precursor ion windows over the mass
range of the experiment are transmitted into a collision cell for fragmentation by CID.
During MSE, fragment ions peaks are aligned with the chromatographic profile of the precursor
by determination of chromatographic peak characteristics such as apex peak retention time,
start and end time of the peak and peak width at half maximum. [47] Therefore the success of
the method is highly dependent on chromatographic proficiency. Despite improving the
dynamic range for protein identification, limitations of MSE include its incompatibility with

Chapter 1
14
some quantitative experiments, including those using isobaric tags (to be discussed in section
1.6).
Gillet et al. described an alternative strategy for DIA of proteome samples known as SWATH
(sequential window acquisition of all theoretical spectra). [55] Similar to MSE, SWATH also
involves the transmission of all precursor ions detected during the MS survey scan (MS 1), for
fragmentation by CID. However, in SWATH mode the mass spectrometer repeatedly cycles
through a set of precursor acquisition windows over the mass range 400-1200 m/z (i.e. 32
successive 25 Da precursor isolation windows). As shown in Figure 1.4-B, during each cycle the
mass spectrometer fragments all precursor ions in a specific mass range (e.g. 400-425 m/z,
then 425-450 m/z etc.) and produces a MS/MS spectrum of all precursors in that isolation
window. As the range of precursor ion windows is cycled throughout the entire
chromatographic process, fragment ion spectra for all analytes in the specified mass range are
also time-resolved.
1.5 Bioinformatics
Widespread use of MS in proteomics would not be possible without the availability of protein
sequence databases and bioinformatics tools for protein identification and function
assignment. Three main types of search engines for protein identification exist including de
novo search engines (which derive peptide identifications based on peak patterns in MS/MS
spectra without use of reference material, e.g. PEAKS [56]); spectral library search engines
(that use a library of reference spectra to match MS/MS sample spectra, e.g. X!Hunter [57])
and sequence search engines. Various proprietary and non-proprietary sequence search
engines are available for protein identification using different algorithms including SEQUEST
[58], MASCOT [59], X!Tandem [60], Andromeda [61] and ProteinLynx Global Server [62]. Two
main approaches for peptide sequencing using a search engine are shown in Figure 1.5.
Probability-based matching is used in many of these (e.g. Mascot), where predicted peptide
fragments are matched to experimentally observed fragment ion peaks. Alternatively, auto-
correlation may be used to determine the over-lap between an experimentally derived
spectrum and a theoretical spectrum derived from each sequence in a reference database
(e.g. SEQUEST). These tools often include the use of decoy databases to estimate false
discovery rates for statistical validation of identification results.
As the output of different mass spectrometers and alternative sequence search engines is
produced in a variety of proprietary formats, the wide variety of data types produced can be
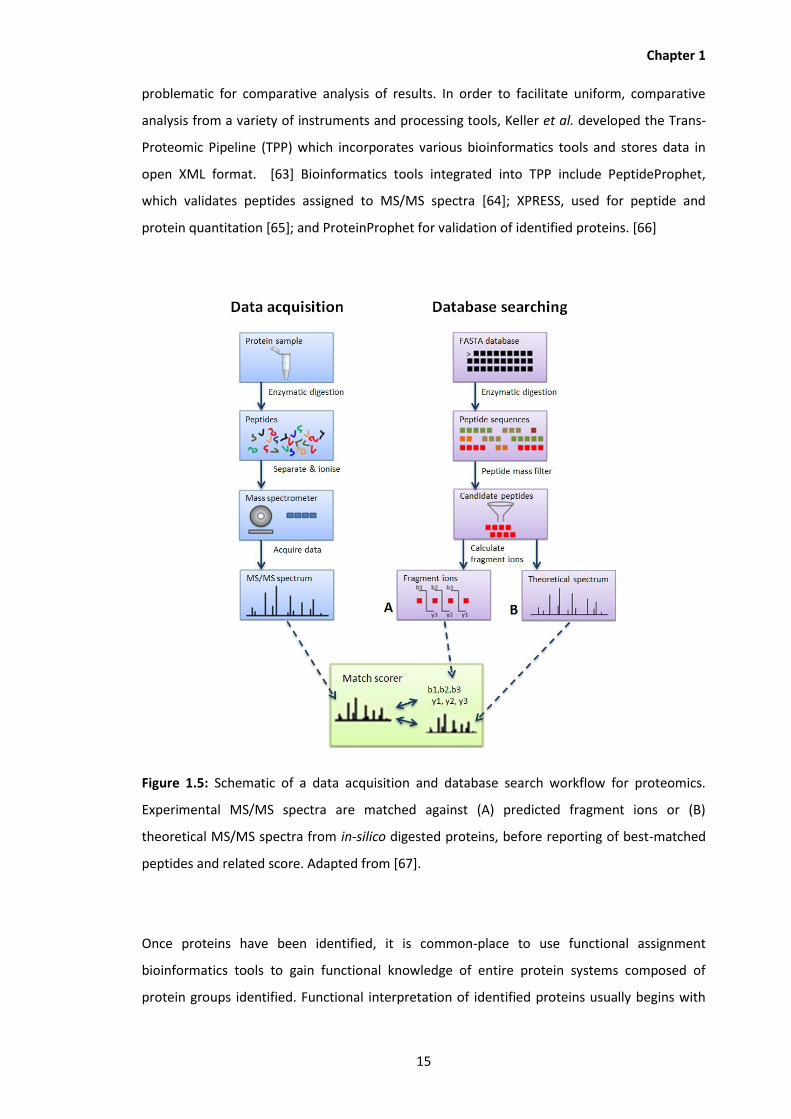
Chapter 1
15
problematic for comparative analysis of results. In order to facilitate uniform, comparative
analysis from a variety of instruments and processing tools, Keller et al. developed the Trans-
Proteomic Pipeline (TPP) which incorporates various bioinformatics tools and stores data in
open XML format. [63] Bioinformatics tools integrated into TPP include PeptideProphet,
which validates peptides assigned to MS/MS spectra [64]; XPRESS, used for peptide and
protein quantitation [65]; and ProteinProphet for validation of identified proteins. [66]
Figure 1.5: Schematic of a data acquisition and database search workflow for proteomics.
Experimental MS/MS spectra are matched against (A) predicted fragment ions or (B)
theoretical MS/MS spectra from in-silico digested proteins, before reporting of best-matched
peptides and related score. Adapted from [67].
Once proteins have been identified, it is common-place to use functional assignment
bioinformatics tools to gain functional knowledge of entire protein systems composed of
protein groups identified. Functional interpretation of identified proteins usually begins with

Chapter 1
16
the association of a protein list with gene ontology (GO) terms that describe related biological
processes, molecular functions and cellular components. Following GO term annotation, the
abundance of specific GO terms, associated with an identified protein list, is compared with
the natural abundance in the organism using a reference database. A probability value (p-
value) is then generated to show potential over-representation of a specific GO term in the
test sample compared to the reference database [68]. More than 60 tools exist for GO-term
enrichment, e.g. the database for annotation, visualisation and integrated discovery, DAVID
[69, 70]. However care must be taken when choosing a tool for GO annotation as a wide
discrepancy in reported GO-terms has been observed when using tools with different
algorithms for annotation [71].
Other resources useful for evaluating proteomic results in a biological context include
interaction databases for pathway analysis e.g. KEGG [72] and Ingenuity pathway analysis
(IPA). [73] Proteins that are directly involved or that contribute to regulation of a cellular
reaction are contained in pathway databases, [68] which describe a series of cellular reactions
that produce an observable biological effect. Using these comprehensive pathway databases,
proteomic results may be scrutinised for involvement in biological processes.
1.6 Quantitation
Quantitative information regarding changes in protein expression levels, which may be
provoked by pharmacological, environmental or genetic factors, is a key element in
understanding disease mechanisms, productivity in bioprocessing and other biological
processes. Several strategies for quantitative proteomics, each having specific strengths and
limitations, have been described and may be categorised as either label-free or labelling
methods.
1.6.1 Label-free Quantitation
Spectral counting and spectral indexing are label-free, relative quantitation strategies for
determination of protein concentration by LC-MS/MS, wherein a protein abundance is
estimated based on the number of tandem mass spectra obtained for each protein group in a
mixture [74, 75]. Spectral counting methods are highly dependent on chromatographic
separation reproducibility and require replication of experiments to ensure statistically
significant results and hence may be limited by the availability of appropriate instrumentation.

Chapter 1
17
In addition, the potential for detector saturation at high spectral counts and masking of low
abundant proteins by high-abundance proteins may lead to erroneous quantitation results
[76]. The demonstration of a linear correlation between ion concentration and ion current
signal has led to the development of ion accounting based label-free quantitative proteomic
methods. Silva et al. established a method for absolute quantitation of proteins by LC-MSE by
demonstrating that for all proteins in a sample, the average MS signal for the three most
intense tryptic peptides is constant per mole of protein, with a coefficient of variation of less
than ± 10% [50]. Hence, using an internal standard of known quantitation, a universal signal
response factor may be calculated and subsequently used to accurately determine the
absolute quantitation for all proteins in a sample. This approach, known as ‘Hi3 quantitation’,
is capable of accurately quantifying proteins across the entire dynamic range of the mass
spectrometer in both simple and complex protein mixtures [77], albeit for data-independent
MS analyses only. Label-free quantitative approaches are now commonly applied for clinical
proteomics, wherein comparison of >102 samples are frequently required. However, excellent
reproducibility of all experimental steps is essential for accurate and reliable quantification
using label-free methods. [78]
1.6.2 Labelled Quantitation
Labelled quantitation approaches rely on the successful incorporation of a label into multiple
protein samples and may be performed in either MS (comparing ion intensities of peptide
peaks) or in MS/MS mode (utilising isobaric chemical labels). Quantitative proteomics
measured in the MS 1 mode are most accurately achieved using stable isotopes for relative
quantitation of identified proteins. Isotopic labelling is based on the assumption that two
forms of a molecule, differing only as a result of a stable-isotope substitution, will behave
identically in an MS experiment. Hence, the ratio of two sample peaks, separated by a
characteristic mass shift equivalent to the difference in isotopic mass, directly indicates the
relative concentration of a protein in comparative samples. In stable isotope labelling with
amino acids in cell culture (SILAC), cells are grown in medium lacking an essential amino acid
but supplemented with an isotopically labelled version of that amino acid, which is
incorporated into the cell during culture. [79] Following MS analysis, the relative quantitation
of proteins in differently labelled samples may be estimated. Initially, SILAC experiments were
limited to samples prepared in cell culture as complete metabolic labelling of the proteome is
required. However, since SILAC has proven to be an accurate and robust technique for
quantifying proteomes, efforts have been made to extend this powerful technique to higher

Chapter 1
18
organisms. SILAC model systems, which enable the determination of protein functions under
complex in-vivo conditions, have been prepared by feeding lysine auxotrophic animals with a
diet containing the natural or 13C6 (and/or 15N2)-substituted version of lysine. Reported SILAC
model-systems currently available include mouse, [80] fruit fly [81] and zebra-fish. [82]
Despite the applicability of available SILAC model systems, these can be costly and time-
consuming to prepare. Furthermore, it is unlikely that SILAC-modelling will be extended to
human systems. However, Geiger and colleagues developed a novel ‘super-SILAC’ mix that
facilitated the analysis of human tissue samples. [83] By mixing five SILAC-labelled cell lines
with a human carcinoma tissue sample, hundreds of thousands of isotopically labelled
peptides were incorporated as internal standards facilitating human tumour tissue proteome
quantitation, hence broadening the scope of SILAC-based proteomics.
In addition to metabolic-labelled strategies for MS-level quantitation, chemical labelling
techniques e.g. stable isotope dimethyl labelling, have been applied for quantitative
proteomics. Hsu and co-workers first introduced dimethyl-labelling as a quantitative
proteomics technology, in which reductive amination using isotopomers of formaldehyde and
cyanoborohydride results in highly selective dimethylation of primary amines. [84] A relative
mass shift of 4 Da is observed for each derivatised site upon MS analysis in samples treated
with formaldehyde and formaldehyde-D2, thereby facilitating relative quantitation of proteins
in two sample populations. Later Boersema et al. built upon the dimethylation approach
described by additionally labelling a third sample with 13C-formaldehyde-D2, facilitating the
simultaneous analysis of three proteomic samples. [85] In both SILAC and dimethyl-labelling
approaches the physicochemical properties of ions are conserved, therefore MS/MS sequence
profiling and hence protein identification is not affected. However both methods were limited
to three samples for comparative proteomics.
Multiplexed relative quantitation of proteomes within a single MS experiment was first
enabled by the development of isobaric tagging methods, e.g. iTRAQ and TMT. Isobaric tags
for relative and absolute quantitation (iTRAQ) are a set of amine reactive isobaric labels that
derivatise peptides in lysine side chains and at the N-terminus, hence labelling all peptides in a
tryptic digest mixture. [86] Currently iTRAQ reagents are available for 4-plex and 8-plex
experiments, composed of a reporter group, a balance group and an amine specific peptide
reactive group. [86, 87] In MS 1, peptides labelled with iTRAQ reagents are indistinguishable
(isobaric), however upon MS/MS fragmentation, signature ions (m/z 114 – 119 and m/z 121)
are formed which when compared, allow for relative quantitation of all labelled sample
peptides. [88] Similar to iTRAQ, tandem mass tags (TMT) are also a commercially available set

Chapter 1
19
of isobaric chemical labels, developed by Thompson and co-workers. [89] TMT reagents,
composed of a mass reporter group, a balance group, a cleavable linker and a peptide reactive
group, were initially produced as duplex labels but are now available in 6-plex and 10-plex
forms. [90] Recently, further extension of multiplexing capabilities have been reported,
potentially enabling 16-plex reagents with 1 Da spacing between reporter ions, although these
have yet to be commercialised. [91] A typical workflow for quantitative proteomics using TMT
reagents is shown in Figure 1.6.
A.
B.
Figure 1.6: A. Schematic of quantitative proteomic analysis workflow using 6-plex TMT
reagents. Following sample preparation incorporating TMT reagents, samples are combined
before analysis using LC-MS/MS. The ratio of peak heights for reporter fragment ions may
then be used to determine the relative quantitation of peptides in the samples under
comparison. B. Structure of 6-plex TMT reagents. 13C and 15N heavy isotopes are highlighted by
red asterisks. [92]
In addition to enabling multiplexing of samples in a single MS experiment, isobaric tagging
methods provide potentially increased precision in quantitative proteomics as measurements
are performed at the fragment mass spectra level (MS 2). [93] However, the number of
labelling reagents that may be used within a single experiment are limited, hence the quantity

Chapter 1
20
of samples that may be compared within a single experiment is also restricted (<10
comparative samples). Furthermore, isobaric tagging methods may potentially be limited by
ratio compression, i.e. distortion of peptide quantitation ratios due to interference in MS/MS
spectra, from multiple precursors within a selected precursor isolation window. Ratio
compression has been addressed by combining a narrower precursor isolation window with
fragmentation at the LC peak apex, [94] by using a MS3 experiment on an LTQ Orbitrap mass
spectrometer [95, 96] and alleviated using high-resolution sample fractionation. [97]
Further improvements were made by McAllister and co-workers by isolating multiple fragment
ions in the MS2 spectrum using isolation waveforms with multiple frequency notches (e.g.
synchronous precursor selection (SPS)). Co-isolation and fragmentation of multiple MS2
fragment ions resulted in a 10-fold increase in reporter ion signals thereby reducing reporter
ion variance, enhancing the dynamic range of reporter ion quantitation and ultimately
generating better-quality quantitative measurements. [98] The SPS-MS3 method was later
applied for a quantitative phosphopeptide analysis incorporating 10-plex TMT labelling and
analysed using a tribrid mass spectrometer (Thermo Fisher Scientific Orbitrap Fusion). An
enhanced TMT reporter ion intensity and accuracy, with elimination of ratio distortion of
reporter ions, was outlined. [99]
Recently, a method for quantitative proteomics has been described that combines the multi-
plexing capability of isobaric tags with the accuracy of SILAC methods, termed neutron
encoding (NeuCode) SILAC. [100] NeuCode SILAC exploits subtle mass differences in common
stable isotopes caused by neutron-binding energy variation, effectively compressing isotopic
information into very narrow m/z windows, which may be revealed when using ultra-high
resolution mass spectrometers. Thus, NeuCode SILAC is capable of high levels of multiplexing
(>10 samples) with high accuracy and broad dynamic range but is limited to mass
spectrometers with very high resolving power (> 480,000).
1.7 Proteomic Profiling of CHO Behaviour
Reflecting their importance in the biopharmaceutical industry, numerous CHO proteomic
studies have been undertaken to better understand these important expression systems.
Proteomics has been used to directly identify and measure hundreds to thousands of proteins
present in CHO cells that play key roles in recombinant protein production, including those
involved in growth, protein processing, metabolism, glycosylation and cell death [2]. CHO cell
proteomics can be broadly partitioned into a number of approaches, namely evaluation of
Chapter 1
21
CHO cell proteomes following culture in conditions known to increase specific productivity
(qP) or in response to other variations in bioprocessing conditions; profiling of CHO cells with
desired phenotypes often following cellular engineering to achieve a desired phenotype;
evaluation of secreted proteins and their effect on surrounding cells and to determine host
cell protein (HCP) impurities that may be found in purified therapeutic drug substance.
Proteomics can provide powerful insights into alterations in cell physiology following
expression of an exogenous recombinant protein or variations in culture conditions, leading to
further advancements in CHO cell production through possible genetic or environmental
manipulations. As depicted in Table 1.3, many proteomic studies have been performed to
determine differential protein expression following cell culture under qP-enhancing conditions
compared to standard conditions. These studies aim to identify key regulatory proteins and
pathways that may be used as targets for CHO cell engineering to further improve
recombinant protein production. Table 1.3 also outlines CHO cell engineering strategies, which
have been successfully applied to improve specific productivity in CHO cells. Proteomic
approaches have been employed to assess the impact of down-regulation or over-expression
of effector proteins used in CHO cell engineering, to enhance biopharmaceutical production
[101].
In addition to proteomic studies evaluating changes to protein regulation following culture in
conditions that increase qP, numerous studies have been performed to determine molecular
changes in response to altered feeding strategies. Metabolic shift through controlled nutrient
feeding sustaining low glucose and glutamine concentrations reduces the production of toxic
metabolites in cell culture and thereby results in higher viable cell concentrations without
impacting qP [102, 103]. Pascoe et al. compared two different mAb-producing CHO cell lines
with different lactate profiles under the same fed-batch culture conditions to determine
changes in the CHO cell proteome linked to metabolism [104]. A substantial proportion of the
differentially expressed proteins observed were found to be glycolytic enzymes, although
structural proteins and proteins related to mAb production and protein processing were also
observed. Notably, a proteomic investigation by Seow and co-workers showed how a feeding
strategy, wherein low concentrations of glucose and glutamine were maintained, led to a
reduction in metabolite production, altered expression of metabolic enzymes and changes to
cellular metabolism. [103] This was further investigated by both Fan et al. and Wingens and
co-workers who determined the effects of a metabolic shift from glucose surplus to glucose
limitation on CHO cellular equipment. [105, 106] Wingens et al. found that changes in cellular
machinery may be due to epigenetic effects, a conclusion also hinted at by Pascoe and co-

Chapter 1
22
workers who suggested that proteins expressed in cultures, displaying different metabolic
profiles, may depend on how the nutrient limited conditions were generated. [104] A more in-
depth proteomics investigation of cellular responses to media glucose concentration was
recently performed by Liu and colleagues using 2D-LC-MS/MS, resulting in the identification of
potential cell engineering targets that may ultimately lead to increased qP along with
prevention of apoptosis at standard glucose levels (5 g/L). [107]
The vast majority of CHO proteomic studies have endeavoured to profile CHO proteomes of
industrial relevant cell lines, [108, 109] (e.g. those exhibiting a high qP, [110, 111] an elevated
growth rate phenotype [112]), or to comparatively evaluate various CHO cell lines including
high and low recombinant protein producers. [113-115] Additionally research relating to
bioprocessing strategies including proteomic profiling of CHO cells undergoing apoptosis
during prolonged cultivation or following high passage cultivation have been performed. [116,
117] However, following the publication of the first CHO genome sequenced by Xu et al., [118]
Baycin-Hizal and colleagues, published the most significant CHO cell proteomics study of
recent years, the first to be published reporting protein groups exclusively identified using a
CHO cell genome thereby affording more accurate identification of proteins. [2] Cellular and
secreted proteins were isolated by 2D LC and glycoproteins by solid phase extraction prior to
LC-MS/MS analysis on an LTQ-Orbitrap Velos mass spectrometer, as depicted in Figure 1.7,
yielding a total of 6,164 identified protein groups with a 4.2% false discovery rate. To further
enhance knowledge of CHO cell physiology relevant to exogenous protein expression, the
codon frequency of all experimentally detected CHO proteins was elucidated. This information
facilitates the optimisation of codons for human proteins relevant to the codon frequency of
CHO cells and may result in increased recombinant protein expression in CHO cell lines.
Analysis of combined transcriptomic and proteomic data sets revealed an enrichment of a
number of pathways, including apoptosis and protein processing, and also a reduction in
proteins involved in glycosphingolipid and steroid hormone metabolism [2].

Chapter 1
23
Table 1.3: Determination of proteome changes following culture under productivity-enhancing conditions and productivity-enhancing genetic
interventions in CHO cells.
Productivity-enhancing condition Therapeutic Product
Cell line Analytical Technique
Alterations in Proteome Reference
Temperature shift (37oC to 30oC)
SEAP CHO-K1 2DE Altered expression levels of unidentified proteins following temperature downshift.
[119]
Temperature shift (37oC to 31oC)
- CHO-K1 2D-DIGE and MALDI-ToF-MS
Differentially expressed protein involved in growth regulation, apoptosis, cap-independent translation and glycoprotein quality control.
[120]
Temperature shift (37oC to 33oC)
EPO CHO-DUKX 2DE & MALDI-ToF-MS
Increased expression of proteins involved in protein folding and secretion, growth regulation and metabolism. Down regulation of proteins involved in some signalling pathways.
[121]
Temperature shift (37oC to 33oC) & 2mM NaBu
IgG CHO-EcIn 2DE & nano-LC-MS/MS
Cellular secretory capacity-associated proteins differentially expressed.
[122]
3 mM Sodium butyrate hTPO CHO-DUKX-B11
2DE & MALDI-ToF-MS & MS/MS
Proteins associated with protein folding and secretion, growth regulation and metabolism differentially expressed.
[123]
1 mM Sodium butyrate IFN-γ CHO- IFN-γ 2DE & nano-LC-MS/MS
Differentially expressed proteins involved in protein metabolism and degradation, translation, apoptosis and fatty acid beta-oxidation.
[124]
0.5mM Sodium butyrate & 80 µM zinc sulphate
hGH CHO-K1 2D-DIGE and MALDI-Tof-MS
Observed induction of proteins with metabolic and stress protection functions.
[125]
Hyperosmolarity (300 to 450 mOsm/kg)
Antibody CHO-DG44 2-DE Up-regulation of glycotic enzymes, resulting in increased metabolic energy for mAb synthesis. Down-regulation of tubulin, reflecting a reduction in growth rate.
[126]
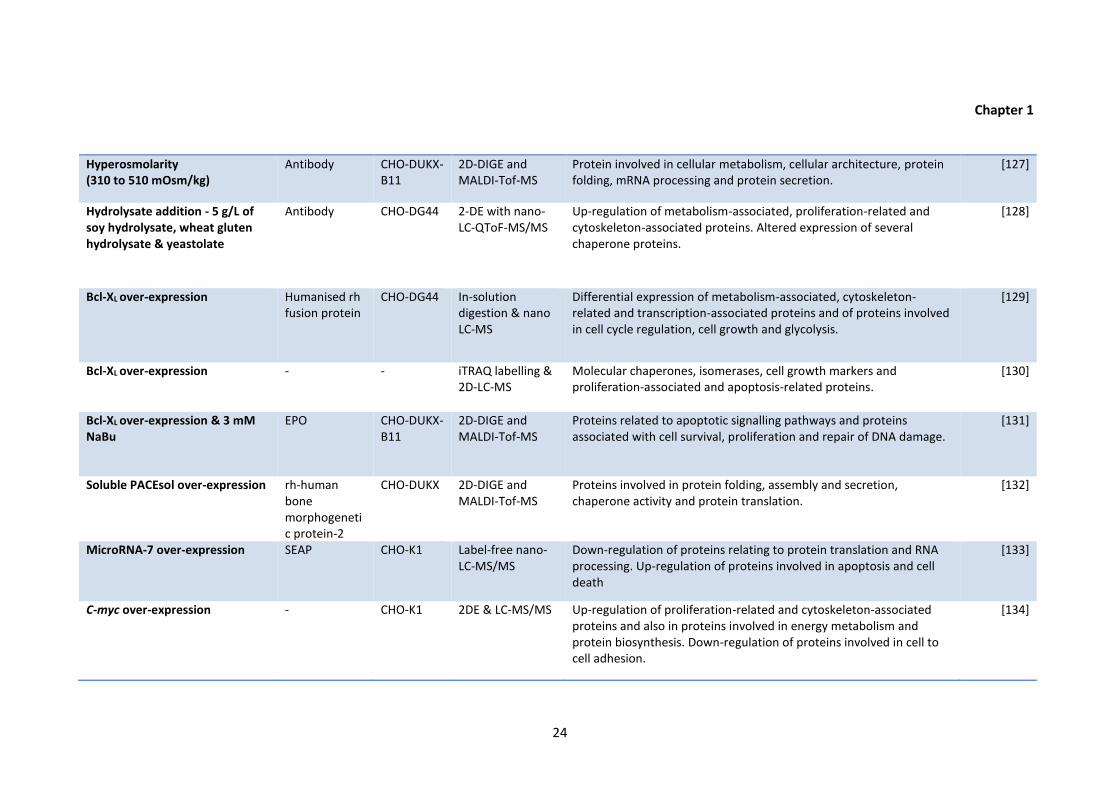
Chapter 1
24
Hyperosmolarity (310 to 510 mOsm/kg)
Antibody CHO-DUKX-B11
2D-DIGE and MALDI-Tof-MS
Protein involved in cellular metabolism, cellular architecture, protein folding, mRNA processing and protein secretion.
[127]
Hydrolysate addition - 5 g/L of soy hydrolysate, wheat gluten hydrolysate & yeastolate
Antibody CHO-DG44 2-DE with nano-LC-QToF-MS/MS
Up-regulation of metabolism-associated, proliferation-related and cytoskeleton-associated proteins. Altered expression of several chaperone proteins.
[128]
Bcl-XL over-expression Humanised rh fusion protein
CHO-DG44 In-solution digestion & nano LC-MS
Differential expression of metabolism-associated, cytoskeleton- related and transcription-associated proteins and of proteins involved in cell cycle regulation, cell growth and glycolysis.
[129]
Bcl-XL over-expression - - iTRAQ labelling & 2D-LC-MS
Molecular chaperones, isomerases, cell growth markers and proliferation-associated and apoptosis-related proteins.
[130]
Bcl-XL over-expression & 3 mM NaBu
EPO CHO-DUKX-B11
2D-DIGE and MALDI-Tof-MS
Proteins related to apoptotic signalling pathways and proteins associated with cell survival, proliferation and repair of DNA damage.
[131]
Soluble PACEsol over-expression rh-human bone morphogenetic protein-2
CHO-DUKX 2D-DIGE and MALDI-Tof-MS
Proteins involved in protein folding, assembly and secretion, chaperone activity and protein translation.
[132]
MicroRNA-7 over-expression SEAP CHO-K1 Label-free nano-LC-MS/MS
Down-regulation of proteins relating to protein translation and RNA processing. Up-regulation of proteins involved in apoptosis and cell death
[133]
C-myc over-expression - CHO-K1 2DE & LC-MS/MS Up-regulation of proliferation-related and cytoskeleton-associated proteins and also in proteins involved in energy metabolism and protein biosynthesis. Down-regulation of proteins involved in cell to cell adhesion.
[134]
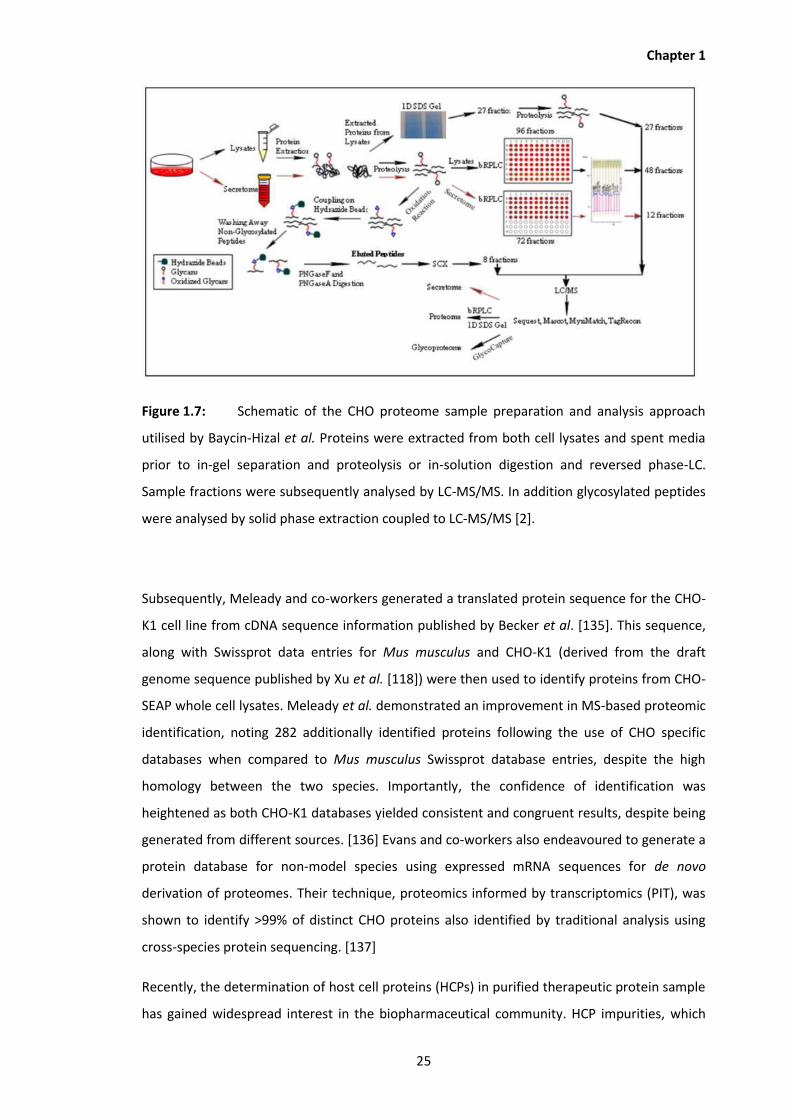
Chapter 1
25
Figure 1.7: Schematic of the CHO proteome sample preparation and analysis approach
utilised by Baycin-Hizal et al. Proteins were extracted from both cell lysates and spent media
prior to in-gel separation and proteolysis or in-solution digestion and reversed phase-LC.
Sample fractions were subsequently analysed by LC-MS/MS. In addition glycosylated peptides
were analysed by solid phase extraction coupled to LC-MS/MS [2].
Subsequently, Meleady and co-workers generated a translated protein sequence for the CHO-
K1 cell line from cDNA sequence information published by Becker et al. [135]. This sequence,
along with Swissprot data entries for Mus musculus and CHO-K1 (derived from the draft
genome sequence published by Xu et al. [118]) were then used to identify proteins from CHO-
SEAP whole cell lysates. Meleady et al. demonstrated an improvement in MS-based proteomic
identification, noting 282 additionally identified proteins following the use of CHO specific
databases when compared to Mus musculus Swissprot database entries, despite the high
homology between the two species. Importantly, the confidence of identification was
heightened as both CHO-K1 databases yielded consistent and congruent results, despite being
generated from different sources. [136] Evans and co-workers also endeavoured to generate a
protein database for non-model species using expressed mRNA sequences for de novo
derivation of proteomes. Their technique, proteomics informed by transcriptomics (PIT), was
shown to identify >99% of distinct CHO proteins also identified by traditional analysis using
cross-species protein sequencing. [137]
Recently, the determination of host cell proteins (HCPs) in purified therapeutic protein sample
has gained widespread interest in the biopharmaceutical community. HCP impurities, which
Chapter 1
26
may be introduced into the harvest stream through cell lysis or secretion from host cells and
are considered to be process-related impurities. [138, 139] Due to potential adverse clinical
reactions in humans relating to HCPs, regulatory requirements necessitate their removal from
therapeutic protein preparations to below detectable levels of highly sensitive analytical
methods. [140] Although classically measured using immunosorbent assays, (e.g. enzyme-
linked immunosorbent assay (ELISA), [141]) which have been validated to provide a good
quantitative estimation of the total HCP concentration, immunosorbent assays may under-
estimate weakly or non-immunoreactive proteins. [142] Proteomic techniques have been
utilised to determine HCP profiles to further elucidate cellular processes occurring in CHO cells
over the course of a production cycle. The vast advances in analytical technologies have now
enabled a more in-depth understanding of the nature of individual HCPs that pass through
downstream processing into final drug substances.
Jin et al. used 2D-DIGE in a proteomic study to determine changes in HCP profiles following
culture under altered upstream processing conditions. [142] Of the upstream processing
parameters investigated including cell culture media, feeding strategy, cell viability at harvest
and cell duration, cell viability was found to generate the most significant changes in HCP
profile. This information could be used to implement upstream process analytical technologies
to create more robust upstream process control, assist in the design of downstream
purification processes and to ensure greater process consistency. A subsequent study by Tait
and co-workers used 2-DE and LC-MS/MS to characterise HCP profiles in the supernatant of
mAb-producing and null CHO cell lines, throughout different stages of cell culture. [139] A
correlation between the day of harvest and high levels of HCPs present in the process
supernatant was observed suggesting the majority of HCPs in the process stream resulted
from the lysis of cells associated with viability loss. More recently, Doneanu et al. developed
an online two-dimensional LC-MSE method for the analysis of HCPs in biotherapeutic proteins.
[143] Using label-free ‘Hi3’ based quantitation, 33 HCPs with the lowest concentration of 16
ppm, were identified from six IgG preparations. Similarly, Schenauer and co-workers also used
2D-LC-MSE with label-free ‘Hi3’ quantitation for the identification and quantification of HCPs in
therapeutic proteins. [144] The capability of the method to identify HCPs present at 13 ± 4
ppm, with less than 2-fold quantitative error was demonstrated.
During cell culture various types of proteins that can modify cell growth in culture, including
ligands, receptors, waste products and endogenous growth factors, may be secreted by host
cells [145, 146]. Accordingly, qualitative and quantitative information regarding secreted
proteins at different stages of cell culture may aid bioprocess development. Recognising this

Chapter 1
27
opportunity for improvement in bioprocessing operations, Kumar et al. used surface enhanced
laser desorption ionisation (SELDI)-Tof MS to monitor secreted proteins in CHO culture media
during different stages of the growth cycle [145]. Twenty-four proteins were observed to be
differentially expressed over the course of the culture and were also found to accumulate in
the process media over time. These secreted proteins represent potential targets for
monitoring the removal of host cell proteins (HCPs) from the therapeutic protein product.
Woolley and co-workers also evaluated the CHO secretome for possible identification of
biomarkers, in this case to serve as an indication of stress and viability loss in CHO culture.
[147] Also using SELDI-ToF, the intensity of a peak at 7.7 kDa corresponding to Galectin-1 was
found to correlate with the degree of viability loss in triplicate cultures.
Many secreted proteins serve as a mechanism to facilitate communication between cells in
culture, with potential positive or negative outcomes. The identification of autocrine growth
factors secreted by CHO cells has led to the generation of a protein-free basal media
improving cell growth in culture. [148] However, following exposure to detrimental conditions
cells may secrete proteins, such as cytokines, that may result in cytotoxicity and genomic
instability in surrounding cells. This ‘bystander effect’ was investigated by Ahram et al. who
initiated a proteomic study to investigate global changes in secreted proteins collected from
conditioned CHO cell culture media samples subsequent to radiation exposure [146]. No
evidence of changes in the type of proteins secreted was determined, possibly resulting from a
weak response of CHO cells to low amounts of radiation.
Despite many studies investigating the effect of qP enhancing culture conditions and cell
engineering strategies on the quality and yield of therapeutic proteins, relatively few studies
have examined how physicochemical properties of the recombinant therapeutic protein itself
influence the CHO host cell. Sommeregger and colleagues demonstrated how distinct
recombinant proteins evoke different proteomic responses within the host cell by performing
label-free LC-MS/MS proteomic analysis of different CHO cells prepared from the same
expression system but adapted to express different recombinant proteins. [149]

Chapter 1
28
1.8 Future Perspectives
Considerable progress in high-throughput proteomic analysis over the past decade has been
fuelled to a large degree by continuous improvements in instrumentation. In particular, the
advent of nano-scale separations, high-resolution tandem mass analysers and application of
2D-LC-MS/MS has enabled the optimisation of proteomics. Further improvements in precursor
ion resolution will be achievable with the emergence of new capabilities, e.g. ion mobility
separation (IMS). When coupled to LC, IMS enables an additional dimension of precursor ion
separation in the gas-phase, with the potential to increase proteome coverage by enhanced
deconvolution of peptides occupying the same retention time and m/z space, for instance
chimeric peptides. [150] Although the strengths of this technique have potentially not been
fully realised, the extra dimension of separation is likely to be more-widely incorporated into
future LC-MS configurations. Other emerging techniques for proteome analysis include protein
structural characterisation technologies, e.g. hydrogen-deuterium exchange (HDX) mass
spectrometry. HDX-MS is likely to provide product-quality information regarding protein
dynamics, which when combined with functional annotation may potentially enable a more
thorough understanding of protein systems. [151] One of the big challenges remaining in
proteomics today centres on the processing of vast quantities of data generated using high
resolution MS/MS. Improvements to overcome data analysis bottlenecks and ensure the
quality of results achieved is likely to remain a focus for improved quantitative proteomics.
1.9 Conclusions
CHO cell expression systems are currently a significant area of research due to their
widespread use in the production of therapeutic biomolecules. Although initial improvements
in CHO bioprocessing centered on cell and bioprocess engineering strategies, more recent
developments have been achieved through greater cellular-level understanding of these
important production systems. Much of the knowledge gained has been achieved through in-
depth proteomic studies facilitated by key advancements in associated analytical technologies.
Future progression in quantitative proteomics will undoubtedly arise from additional advances
in instrumentation, data processing and quantitation technologies, allowing us to delve deeper
into the proteome, leading to potential improvements in biologically significant areas of
research including biopharmaceutical production and therapeutic protein characterisation.

Chapter 1
29
1.10 Associated Publication and Author Contributions
Published in part: Farrell, A., et al., Application of multi-omics techniques for bioprocess design
and optimisation in Chinese hamster ovary cells. Journal of Proteome Research, 2014,
13(7):3144-59.
Literature review topic devised by Amy Farrell and Jonathan Bones; Literature review prepared
by Amy Farrell and reviewed by Jonathan Bones; Related paper was written by Amy Farrell and
reviewed by John J. Milne, Ian W Marison, Niaobh McLoughlin and Jonathan Bones.
1.11 Aims of Thesis
The goals of this work were to determine the impact of variation in the conditions used for
bioprocessing of Chinese hamster ovary production cells on both the quality of the therapeutic
monoclonal antibody product and on the production cells themselves.
The specific aims of this thesis were:
• To apply state-of-the-art quantitative proteomic techniques to determine potential changes
to the proteome of monoclonal antibody producing CHO cells in response to the bioprocessing
conditions used for cell culture;
• To determine changes to CHO cells in culture in response to exposure to the secretome of
adjacent cells when grown under conditions of altered bioprocessing;
• To develop analytical platforms to extensively characterise differentially produced
therapeutic monoclonal antibodies through application of analytical methods for
determination of sequence-level modifications, variations in N-glycosylation profile and
changes to the structure and function of the therapeutic biomolecules, thereby evaluating
alterations in the safety, quality and efficacy of the mAb;
• To develop an analytical platform to enable the identification of host cell proteins in
therapeutic monoclonal antibody samples following downstream processing to enable
optimisation of processing parameters for clearance of impurities from finished drug
substances.

Chapter 1
30
1.12 References
1. Walsh, G., Biopharmaceutical benchmarks 2014. Nat Biotechnol, 2014. 32(10): p. 992-
1000.
2. Baycin-Hizal, D., et al., Proteomic analysis of Chinese hamster ovary cells. J Proteome
Res, 2012. 11(11): p. 5265-76.
3. Heffner, K.M., et al., Exploiting the proteomics revolution in biotechnology: from
disease and antibody targets to optimizing bioprocess development. Curr Opin
Biotechnol, 2014. 30: p. 80-6.
4. Steen, H. and M. Mann, The ABC's (and XYZ's) of peptide sequencing. Nat Rev Mol Cell
Biol, 2004. 5(9): p. 699-711.
5. Shevchenko, A., et al., Mass spectrometric sequencing of proteins silver-stained
polyacrylamide gels. Anal Chem, 1996. 68(5): p. 850-8.
6. Canas, B., et al., Trends in sample preparation for classical and second generation
proteomics. J Chromatogr A, 2007. 1153(1-2): p. 235-58.
7. Wisniewski, J.R., et al., Universal sample preparation method for proteome analysis.
Nat Methods, 2009. 6(5): p. 359-62.
8. Vandermarliere, E., M. Mueller, and L. Martens, Getting intimate with trypsin, the
leading protease in proteomics. Mass Spectrom Rev, 2013. 32(6): p. 453-65.
9. Tabb, D.L., et al., Influence of basic residue content on fragment ion peak intensities in
low-energy collision-induced dissociation spectra of peptides. Anal Chem, 2004. 76(5):
p. 1243-8.
10. Washburn, M.P., D. Wolters, and J.R. Yates, 3rd, Large-scale analysis of the yeast
proteome by multidimensional protein identification technology. Nat Biotechnol, 2001.
19(3): p. 242-7.
11. Abdallah, C., et al., Gel-based and gel-free quantitative proteomics approaches at a
glance. Int J Plant Genomics, 2012. 2012: p. 494572.
12. Timms, J.F. and R. Cramer, Difference gel electrophoresis. Proteomics, 2008. 8(23-24):
p. 4886-97.

Chapter 1
31
13. Di Palma, S., et al., Recent advances in peptide separation by multidimensional liquid
chromatography for proteome analysis. J Proteomics, 2012. 75(13): p. 3791-813.
14. Gilar, M., et al., Two-dimensional separation of peptides using RP-RP-HPLC system with
different pH in first and second separation dimensions. J Sep Sci, 2005. 28(14): p. 1694-
703.
15. Peng, J., et al., Evaluation of multidimensional chromatography coupled with tandem
mass spectrometry (LC/LC-MS/MS) for large-scale protein analysis: the yeast
proteome. J Proteome Res, 2003. 2(1): p. 43-50.
16. Ritorto, M.S., et al., Hydrophilic strong anion exchange (hSAX) chromatography for
highly orthogonal peptide separation of complex proteomes. J Proteome Res, 2013.
12(6): p. 2449-57.
17. Boersema, P.J., et al., Evaluation and optimization of ZIC-HILIC-RP as an alternative
MudPIT strategy. J Proteome Res, 2007. 6(3): p. 937-46.
18. Gama, M.R., C.H. Collins, and C.B. Bottoli, Nano-liquid chromatography in
pharmaceutical and biomedical research. J Chromatogr Sci, 2013. 51(7): p. 694-703.
19. Rieux, L., et al., Nano LC: Principles, Evolution, and State-of-the-Art of the Technique.
LC GC North America, 2011. 29(10): p. 926-+.
20. Yates, J.R., C.I. Ruse, and A. Nakorchevsky, Proteomics by mass spectrometry:
approaches, advances, and applications. Annu Rev Biomed Eng, 2009. 11: p. 49-79.
21. Annesley, T.M., Ion suppression in mass spectrometry. Clin Chem, 2003. 49(7): p. 1041-
4.
22. Whitehouse, C.M., et al., Electrospray interface for liquid chromatographs and mass
spectrometers. Anal Chem, 1985. 57(3): p. 675-9.
23. Lane, C.S., Mass spectrometry-based proteomics in the life sciences. Cell Mol Life Sci,
2005. 62(7-8): p. 848-69.
24. Pitt, J.J., Principles and applications of liquid chromatography-mass spectrometry in
clinical biochemistry. Clin Biochem Rev, 2009. 30(1): p. 19-34.
Chapter 1
32
25. Banerjee, S. and S. Mazumdar, Electrospray ionization mass spectrometry: a technique
to access the information beyond the molecular weight of the analyte. Int J Anal Chem,
2012. 2012: p. 282574.
26. Schmidt, A., M. Karas, and T. Dulcks, Effect of different solution flow rates on analyte
ion signals in nano-ESI MS, or: when does ESI turn into nano-ESI? J Am Soc Mass
Spectrom, 2003. 14(5): p. 492-500.
27. Juraschek, R., T. Dulcks, and M. Karas, Nanoelectrospray--more than just a minimized-
flow electrospray ionization source. J Am Soc Mass Spectrom, 1999. 10(4): p. 300-8.
28. Wilm, M. and M. Mann, Analytical properties of the nanoelectrospray ion source. Anal
Chem, 1996. 68(1): p. 1-8.
29. Wilm, M.S., Mann, M., Electrospray and Taylor-Cone theory, Dole's beam of
macromolecules at last? International Journal of Mass Spectrometry and Ion
Processes, 1994. 136(2-3): p. 167-180.
30. Hu, Q., et al., The Orbitrap: a new mass spectrometer. J Mass Spectrom, 2005. 40(4): p.
430-43.
31. Hebert, A.S., et al., The one hour yeast proteome. Mol Cell Proteomics, 2014. 13(1): p.
339-47.
32. Holcapek, M., R. Jirasko, and M. Lisa, Recent developments in liquid chromatography-
mass spectrometry and related techniques. J Chromatogr A, 2012. 1259: p. 3-15.
33. Thermo Fisher Sciencitific Ltd. 2015. LTQ Orbitrap XL Hybrid Ion Trap Mass
Spectrometer. [ONLINE] Available at http://planetorbitrap.com/ltq-orbitrap-
xl#tab:schematic [Accessed 03 April 2015].
34. Thermo Fisher Sciencitific Ltd. 2015.Q Exactive Hybrid Quadrupole Orbitrap Mass
Spectrometer. [ONLINE] Available at http://planetorbitrap.com/q-
exactive#tab:schematic [Accessed 03 April 2015].
35. Senko, M.W., et al., Novel parallelized quadrupole/linear ion trap/Orbitrap tribrid mass
spectrometer improving proteome coverage and peptide identification rates. Anal
Chem, 2013. 85(24): p. 11710-4.
36. Hoffmann, E.d., Stroobant, V., Mass Spectrometry: Principles and applications. 3
ed2007, West Sussex, England: Wiley.

Chapter 1
33
37. Jones, A.W. and H.J. Cooper, Dissociation techniques in mass spectrometry-based
proteomics. Analyst, 2011. 136(17): p. 3419-29.
38. Mikesh, L.M., et al., The utility of ETD mass spectrometry in proteomic analysis.
Biochim Biophys Acta, 2006. 1764(12): p. 1811-22.
39. Zhou, Y., J. Dong, and R.W. Vachet, Electron transfer dissociation of modified peptides
and proteins. Curr Pharm Biotechnol, 2011. 12(10): p. 1558-67.
40. Wuhrer, M., et al., Glycoproteomics based on tandem mass spectrometry of
glycopeptides. J Chromatogr B Analyt Technol Biomed Life Sci, 2007. 849(1-2): p. 115-
28.
41. Syka, J.E., et al., Peptide and protein sequence analysis by electron transfer dissociation
mass spectrometry. Proc Natl Acad Sci U S A, 2004. 101(26): p. 9528-33.
42. Molina, H., et al., Comprehensive comparison of collision induced dissociation and
electron transfer dissociation. Anal Chem, 2008. 80(13): p. 4825-35.
43. Zhang, Y., et al., Optimized Orbitrap HCD for quantitative analysis of phosphopeptides.
J Am Soc Mass Spectrom, 2009. 20(8): p. 1425-34.
44. Olsen, J.V., et al., Higher-energy C-trap dissociation for peptide modification analysis.
Nat Methods, 2007. 4(9): p. 709-12.
45. Gillette, M.A. and S.A. Carr, Quantitative analysis of peptides and proteins in
biomedicine by targeted mass spectrometry. Nat Methods, 2013. 10(1): p. 28-34.
46. Ishihama, Y., et al., Exponentially modified protein abundance index (emPAI) for
estimation of absolute protein amount in proteomics by the number of sequenced
peptides per protein. Mol Cell Proteomics, 2005. 4(9): p. 1265-72.
47. Geromanos, S.J., et al., The detection, correlation, and comparison of peptide
precursor and product ions from data independent LC-MS with data dependant LC-
MS/MS. Proteomics, 2009. 9(6): p. 1683-95.
48. Kohli, B.M., et al., An alternative sampling algorithm for use in liquid
chromatography/tandem mass spectrometry experiments. Rapid Commun Mass
Spectrom, 2005. 19(5): p. 589-96.
Chapter 1
34
49. Silva, J.C., et al., Quantitative proteomic analysis by accurate mass retention time
pairs. Anal Chem, 2005. 77(7): p. 2187-200.
50. Silva, J.C., et al., Absolute quantification of proteins by LCMSE: a virtue of parallel MS
acquisition. Mol Cell Proteomics, 2006. 5(1): p. 144-56.
51. Levin, Y., E. Hradetzky, and S. Bahn, Quantification of proteins using data-independent
analysis (MSE) in simple andcomplex samples: a systematic evaluation. Proteomics,
2011. 11(16): p. 3273-87.
52. Li, G.Z., et al., Database searching and accounting of multiplexed precursor and
product ion spectra from the data independent analysis of simple and complex peptide
mixtures. Proteomics, 2009. 9(6): p. 1696-719.
53. Chakraborty, A.B., S.J. Berger, and J.C. Gebler, Use of an integrated MS--multiplexed
MS/MS data acquisition strategy for high-coverage peptide mapping studies. Rapid
Commun Mass Spectrom, 2007. 21(5): p. 730-44.
54. SWATH quantitative proteomic analysis.
http://www.biodiscover.com/product/detail.html?id=322 Accessed 29/03/15 16:16
55. Gillet, L.C., et al., Targeted data extraction of the MS/MS spectra generated by data-
independent acquisition: a new concept for consistent and accurate proteome analysis.
Mol Cell Proteomics, 2012. 11(6): p. O111 016717.
56. Ma, B., et al., PEAKS: powerful software for peptide de novo sequencing by tandem
mass spectrometry. Rapid Commun Mass Spectrom, 2003. 17(20): p. 2337-42.
57. Craig, R., et al., Using annotated peptide mass spectrum libraries for protein
identification. J Proteome Res, 2006. 5(8): p. 1843-9.
58. Eng, J.K., A.L. McCormack, and J.R. Yates, An approach to correlate tandem mass
spectral data of peptides with amino acid sequences in a protein database. J Am Soc
Mass Spectrom, 1994. 5(11): p. 976-89.
59. Perkins, D.N., et al., Probability-based protein identification by searching sequence
databases using mass spectrometry data. Electrophoresis, 1999. 20(18): p. 3551-67.
60. Craig, R. and R.C. Beavis, TANDEM: matching proteins with tandem mass spectra.
Bioinformatics, 2004. 20(9): p. 1466-7.

Chapter 1
35
61. Cox, J., et al., Andromeda: a peptide search engine integrated into the MaxQuant
environment. J Proteome Res, 2011. 10(4): p. 1794-805.
62. Waters Corporation. 2006. ProteinLynx Global Server Version 2.2.5 User's Guide.
[ONLINE] Available at:
http://www.embl.de/proteomics/proteomics_services/instrumentation/71500125602
ra.pdf. [Accessed 30 March 15]
63. Keller, A., et al., A uniform proteomics MS/MS analysis platform utilizing open XML file
formats. Mol Syst Biol, 2005. 1: p. 2005 0017.
64. Keller, A., et al., Empirical statistical model to estimate the accuracy of peptide
identifications made by MS/MS and database search. Anal Chem, 2002. 74(20): p.
5383-92.
65. Han, D.K., et al., Quantitative profiling of differentiation-induced microsomal proteins
using isotope-coded affinity tags and mass spectrometry. Nat Biotechnol, 2001.
19(10): p. 946-51.
66. Nesvizhskii, A.I., et al., A statistical model for identifying proteins by tandem mass
spectrometry. Anal Chem, 2003. 75(17): p. 4646-58.
67. Eng, J.K., et al., A face in the crowd: recognizing peptides through database search.
Mol Cell Proteomics, 2011. 10(11): p. R111 009522.
68. Schmidt, A., I. Forne, and A. Imhof, Bioinformatic analysis of proteomics data. BMC
Syst Biol, 2014. 8 Suppl 2: p. S3.
69. Dennis, G., Jr., et al., DAVID: Database for Annotation, Visualization, and Integrated
Discovery. Genome Biol, 2003. 4(5): p. P3.
70. Huang da, W., B.T. Sherman, and R.A. Lempicki, Systematic and integrative analysis of
large gene lists using DAVID bioinformatics resources. Nat Protoc, 2009. 4(1): p. 44-57.
71. Khatri, P. and S. Draghici, Ontological analysis of gene expression data: current tools,
limitations, and open problems. Bioinformatics, 2005. 21(18): p. 3587-95.
72. Kanehisa, M., et al., KEGG for integration and interpretation of large-scale molecular
data sets. Nucleic Acids Res, 2012. 40(Database issue): p. D109-14.

Chapter 1
36
73. Kumar, A., et al., Elucidation of the CHO Super-Ome (CHO-SO) by Proteoinformatics. J
Proteome Res, 2015. 14(11): p. 4687-703.
74. Liu, H., R.G. Sadygov, and J.R. Yates, 3rd, A model for random sampling and estimation
of relative protein abundance in shotgun proteomics. Anal Chem, 2004. 76(14): p.
4193-201.
75. Cha, S., et al., In situ proteomic analysis of human breast cancer epithelial cells using
laser capture microdissection: annotation by protein set enrichment analysis and gene
ontology. Mol Cell Proteomics, 2010. 9(11): p. 2529-44.
76. Elliott, M.H., et al., Current trends in quantitative proteomics. J Mass Spectrom, 2009.
44(12): p. 1637-60.
77. Bond, N.J., et al., Improving qualitative and quantitative performance for MS(E)-based
label-free proteomics. J Proteome Res, 2013. 12(6): p. 2340-53.
78. Megger, D.A., et al., Label-free quantification in clinical proteomics. Biochim Biophys
Acta, 2013. 1834(8): p. 1581-90.
79. Ong, S.E., et al., Stable isotope labeling by amino acids in cell culture, SILAC, as a
simple and accurate approach to expression proteomics. Mol Cell Proteomics, 2002.
1(5): p. 376-86.
80. Kruger, M., et al., SILAC mouse for quantitative proteomics uncovers kindlin-3 as an
essential factor for red blood cell function. Cell, 2008. 134(2): p. 353-64.
81. Sury, M.D., J.X. Chen, and M. Selbach, The SILAC fly allows for accurate protein
quantification in vivo. Mol Cell Proteomics, 2010. 9(10): p. 2173-83.
82. Westman-Brinkmalm, A., et al., SILAC zebrafish for quantitative analysis of protein
turnover and tissue regeneration. J Proteomics, 2011. 75(2): p. 425-34.
83. Geiger, T., et al., Super-SILAC mix for quantitative proteomics of human tumor tissue.
Nat Methods, 2010. 7(5): p. 383-5.
84. Hsu, J.L., et al., Stable-isotope dimethyl labeling for quantitative proteomics. Anal
Chem, 2003. 75(24): p. 6843-52.
Chapter 1
37
85. Boersema, P.J., et al., Triplex protein quantification based on stable isotope labeling by
peptide dimethylation applied to cell and tissue lysates. Proteomics, 2008. 8(22): p.
4624-32.
86. Ross, P.L., et al., Multiplexed protein quantitation in Saccharomyces cerevisiae using
amine-reactive isobaric tagging reagents. Mol Cell Proteomics, 2004. 3(12): p. 1154-
69.
87. Pottiez, G., et al., Comparison of 4-plex to 8-plex iTRAQ quantitative measurements of
proteins in human plasma samples. J Proteome Res, 2012. 11(7): p. 3774-81.
88. Wu, W.W., et al., Comparative study of three proteomic quantitative methods, DIGE,
cICAT, and iTRAQ, using 2D gel- or LC-MALDI TOF/TOF. J Proteome Res, 2006. 5(3): p.
651-8.
89. Thompson, A., et al., Tandem mass tags: a novel quantification strategy for
comparative analysis of complex protein mixtures by MS/MS. Anal Chem, 2003. 75(8):
p. 1895-904.
90. Keshishian, H., et al., Multiplexed, Quantitative Workflow for Sensitive Biomarker
Discovery in Plasma Yields Novel Candidates for Early Myocardial Injury. Mol Cell
Proteomics, 2015.
91. Braun, C.R., et al., Generation of multiple reporter ions from a single isobaric reagent
increases multiplexing capacity for quantitative proteomics. Anal Chem, 2015. 87(19):
p. 9855-63.
92. Thermo Fisher Scientific Inc. 2014.Instructions: TMT Mass Tagging Kits and Reagents.
[ONLINE] Available at:
https://tools.lifetechnologies.com/content/sfs/manuals/MAN0011639_TMT_Mass_Ta
gging_Reag_UG.pdf [Accessed 01 March 2015]
93. Savitski, M.M., et al., Measuring and managing ratio compression for accurate
iTRAQ/TMT quantification. J Proteome Res, 2013. 12(8): p. 3586-98.
94. Savitski, M.M., et al., Delayed fragmentation and optimized isolation width settings for
improvement of protein identification and accuracy of isobaric mass tag quantification
on Orbitrap-type mass spectrometers. Anal Chem, 2011. 83(23): p. 8959-67.
Chapter 1
38
95. Wenger, C.D., et al., Gas-phase purification enables accurate, multiplexed proteome
quantification with isobaric tagging. Nat Methods, 2011. 8(11): p. 933-5.
96. Ting, L., et al., MS3 eliminates ratio distortion in isobaric multiplexed quantitative
proteomics. Nat Methods, 2011. 8(11): p. 937-40.
97. Ow, S.Y., et al., Minimising iTRAQ ratio compression through understanding LC-MS
elution dependence and high-resolution HILIC fractionation. Proteomics, 2011. 11(11):
p. 2341-6.
98. McAlister, G.C., et al., MultiNotch MS3 enables accurate, sensitive, and multiplexed
detection of differential expression across cancer cell line proteomes. Anal Chem, 2014.
86(14): p. 7150-8.
99. Erickson, B.K., et al., Evaluating multiplexed quantitative phosphopeptide analysis on a
hybrid quadrupole mass filter/linear ion trap/orbitrap mass spectrometer. Anal Chem,
2015. 87(2): p. 1241-9.
100. Hebert, A.S., et al., Neutron-encoded mass signatures for multiplexed proteome
quantification. Nat Methods, 2013. 10(4): p. 332-4.
101. Kim, J.Y., Y.G. Kim, and G.M. Lee, CHO cells in biotechnology for production of
recombinant proteins: current state and further potential. Appl Microbiol Biotechnol,
2012. 93(3): p. 917-30.
102. Chee Furng Wong, D., et al., Impact of dynamic online fed-batch strategies on
metabolism, productivity and N-glycosylation quality in CHO cell cultures. Biotechnol
Bioeng, 2005. 89(2): p. 164-77.
103. Seow, T.K., et al., Proteomic investigation of metabolic shift in mammalian cell culture.
Biotechnol Prog, 2001. 17(6): p. 1137-44.
104. Pascoe, D.E., et al., Proteome analysis of antibody-producing CHO cell lines with
different metabolic profiles. Biotechnol Bioeng, 2007. 98(2): p. 391-410.
105. Fan, Y., et al., A multi-pronged investigation into the effect of glucose starvation and
culture duration on fed-batch CHO cell culture. Biotechnol Bioeng, 2015.
106. Wingens, M., et al., 2D-DIGE screening of high-productive CHO cells under glucose
limitation--basic changes in the proteome equipment and hints for epigenetic effects. J
Biotechnol, 2015. 201: p. 86-97.

Chapter 1
39
107. Liu, Z., et al., A quantitative proteomic analysis of cellular responses to high glucose
media in Chinese hamster ovary cells. Biotechnol Prog, 2015.
108. Hayduk, E.J., L.H. Choe, and K.H. Lee, A two-dimensional electrophoresis map of
Chinese hamster ovary cell proteins based on fluorescence staining. Electrophoresis,
2004. 25(15): p. 2545-56.
109. Lee, J.S., et al., Protein reference mapping of dihydrofolate reductase-deficient CHO
DG44 cell lines using 2-dimensional electrophoresis. Proteomics, 2010. 10(12): p. 2292-
302.
110. Nissom, P.M., et al., Transcriptome and proteome profiling to understanding the
biology of high productivity CHO cells. Mol Biotechnol, 2006. 34(2): p. 125-40.
111. Meleady, P., et al., Sustained productivity in recombinant Chinese hamster ovary (CHO)
cell lines: proteome analysis of the molecular basis for a process-related phenotype.
BMC Biotechnol, 2011. 11: p. 78.
112. Doolan, P., et al., Microarray and proteomics expression profiling identifies several
candidates, including the valosin-containing protein (VCP), involved in regulating high
cellular growth rate in production CHO cell lines. Biotechnol Bioeng, 2010. 106(1): p.
42-56.
113. Feng, H.T., et al., Rapid characterization of high/low producer CHO cells using matrix-
assisted laser desorption/ionization time-of-flight. Rapid Commun Mass Spectrom,
2010. 24(9): p. 1226-30.
114. Kang, S., et al., Cell line profiling to improve monoclonal antibody production.
Biotechnol Bioeng, 2014. 111(4): p. 748-60.
115. Orellana, C.A., et al., High-antibody-producing Chinese hamster ovary cells up-regulate
intracellular protein transport and glutathione synthesis. J Proteome Res, 2015. 14(2):
p. 609-18.
116. Wei, Y.Y., et al., Proteomics analysis of chinese hamster ovary cells undergoing
apoptosis during prolonged cultivation. Cytotechnology, 2011. 63(6): p. 663-77.
117. Beckmann, T.F., et al., Effects of high passage cultivation on CHO cells: a global
analysis. Appl Microbiol Biotechnol, 2012. 94(3): p. 659-71.

Chapter 1
40
118. Xu, X., et al., The genomic sequence of the Chinese hamster ovary (CHO)-K1 cell line.
Nat Biotechnol, 2011. 29(8): p. 735-41.
119. Kaufmann, H., et al., Influence of low temperature on productivity, proteome and
protein phosphorylation of CHO cells. Biotechnol Bioeng, 1999. 63(5): p. 573-82.
120. Kumar, N., et al., Differential protein expression following low temperature culture of
suspension CHO-K1 cells. BMC Biotechnol, 2008. 8: p. 42.
121. Baik, J.Y., et al., Initial transcriptome and proteome analyses of low culture
temperature-induced expression in CHO cells producing erythropoietin. Biotechnol
Bioeng, 2006. 93(2): p. 361-71.
122. Kantardjieff, A., et al., Transcriptome and proteome analysis of Chinese hamster ovary
cells under low temperature and butyrate treatment. J Biotechnol, 2010. 145(2): p.
143-59.
123. Baik, J.Y., et al., Limitations to the comparative proteomic analysis of thrombopoietin
producing Chinese hamster ovary cells treated with sodium butyrate. J Biotechnol,
2008. 133(4): p. 461-8.
124. Yee, J.C., et al., Genomic and proteomic exploration of CHO and hybridoma cells under
sodium butyrate treatment. Biotechnol Bioeng, 2008. 99(5): p. 1186-204.
125. Van Dyk, D.D., et al., Identification of cellular changes associated with increased
production of human growth hormone in a recombinant Chinese hamster ovary cell
line. Proteomics, 2003. 3(2): p. 147-56.
126. Lee, M.S., et al., Proteome analysis of antibody-expressing CHO cells in response to
hyperosmotic pressure. Biotechnol Prog, 2003. 19(6): p. 1734-41.
127. Kim, J.Y., Y.G. Kim, and G.M. Lee, Differential in-gel electrophoresis (DIGE) analysis of
CHO cells under hyperosmotic pressure: osmoprotective effect of glycine betaine
addition. Biotechnol Bioeng, 2012. 109(6): p. 1395-403.
128. Kim, J.Y., et al., Proteomic understanding of intracellular responses of recombinant
Chinese hamster ovary cells cultivated in serum-free medium supplemented with
hydrolysates. Appl Microbiol Biotechnol, 2011. 89(6): p. 1917-28.
129. Carlage, T., et al., Proteomic profiling of a high-producing Chinese hamster ovary cell
culture. Anal Chem, 2009. 81(17): p. 7357-62.

Chapter 1
41
130. Carlage, T., et al., Analysis of dynamic changes in the proteome of a Bcl-XL
overexpressing Chinese hamster ovary cell culture during exponential and stationary
phases. Biotechnol Prog, 2012. 28(3): p. 814-23.
131. Baik, J.Y. and G.M. Lee, A DIGE approach for the assessment of differential expression
of the CHO proteome under sodium butyrate addition: Effect of Bcl-x(L) overexpression.
Biotechnol Bioeng, 2010. 105(2): p. 358-67.
132. Meleady, P., et al., Proteomic profiling of CHO cells with enhanced rhBMP-2
productivity following co-expression of PACEsol. Proteomics, 2008. 8(13): p. 2611-24.
133. Meleady, P., et al., Impact of miR-7 over-expression on the proteome of Chinese
hamster ovary cells. J Biotechnol, 2012. 160(3-4): p. 251-62.
134. Kuystermans, D., M.J. Dunn, and M. Al-Rubeai, A proteomic study of cMyc
improvement of CHO culture. BMC Biotechnol, 2010. 10: p. 25.
135. Becker, J., et al., Unraveling the Chinese hamster ovary cell line transcriptome by next-
generation sequencing. J Biotechnol, 2011. 156(3): p. 227-35.
136. Meleady, P., et al., Utilization and evaluation of CHO-specific sequence databases for
mass spectrometry based proteomics. Biotechnol Bioeng, 2012. 109(6): p. 1386-94.
137. Evans, V.C., et al., De novo derivation of proteomes from transcriptomes for transcript
and protein identification. Nat Methods, 2012. 9(12): p. 1207-11.
138. Valente, K.N., et al., Recovery of Chinese hamster ovary host cell proteins for proteomic
analysis. Biotechnol J, 2013.
139. Tait, A.S., et al., Host cell protein dynamics in the supernatant of a mAb producing CHO
cell line. Biotechnol Bioeng, 2012. 109(4): p. 971-82.
140. Food and Drug administration. 1997. Points to Consider in the Manufacture and
Testing of Monoclonal Antibody Products for Human Use.
141. Krawitz, D.C., et al., Proteomic studies support the use of multi-product immunoassays
to monitor host cell protein impurities. Proteomics, 2006. 6(1): p. 94-110.
142. Jin, M., et al., Profiling of host cell proteins by two-dimensional difference gel
electrophoresis (2D-DIGE): Implications for downstream process development.
Biotechnol Bioeng, 2010. 105(2): p. 306-16.

Chapter 1
42
143. Doneanu, C.E., et al., Analysis of host-cell proteins in biotherapeutic proteins by
comprehensive online two-dimensional liquid chromatography/mass spectrometry.
MAbs, 2012. 4(1): p. 24-44.
144. Schenauer, M.R., G.C. Flynn, and A.M. Goetze, Identification and quantification of host
cell protein impurities in biotherapeutics using mass spectrometry. Anal Biochem,
2012. 428(2): p. 150-7.
145. Kumar, N., et al., Proteomic profiling of secreted proteins from CHO cells using Surface-
Enhanced Laser desorption ionization time-of-flight mass spectrometry. Biotechnol
Prog, 2008. 24(1): p. 273-8.
146. Ahram, M., et al., Identification of shed proteins from Chinese hamster ovary cells:
application of statistical confidence using human and mouse protein databases.
Proteomics, 2005. 5(7): p. 1815-26.
147. Woolley, J.F. and M. Al-Rubeai, The isolation and identification of a secreted biomarker
associated with cell stress in serum-free CHO cell culture. Biotechnol Bioeng, 2009.
104(3): p. 590-600.
148. Lim, U.M., et al., Identification of autocrine growth factors secreted by CHO cells for
applications in single-cell cloning media. J Proteome Res, 2013. 12(7): p. 3496-510.
149. Sommeregger, W., et al., Proteomic differences in recombinant CHO cells producing
two similar antibody fragments. Biotechnol Bioeng, 2016.
150. Shliaha, P.V., et al., Effects of traveling wave ion mobility separation on data
independent acquisition in proteomics studies. J Proteome Res, 2013. 12(6): p. 2323-
39.
151. Wales, T.E. and J.R. Engen, Hydrogen exchange mass spectrometry for the analysis of
protein dynamics. Mass Spectrom Rev, 2006. 25(1): p. 158-70.
Chapter 2
43
2.0
Quantitative Proteomics Analysis of CHO
Cells Following Culture under Altered
Bioprocessing Conditions
2.1 Introduction
Chinese hamster ovary (CHO) cell lines are the primary expression system currently used in the
biopharmaceutical industry and have been engineered to produce a wide range of
recombinant therapeutic biomolecules, including those used to treat cancer, haemophilia,
diabetes mellitus, inflammation-related conditions, neutropenia and metabolic disorders. [1]
Anti-Interleukin 8 (anti-IL8), a therapeutic monoclonal antibody (mAb), has the potential for
use in the treatment and diagnosis of metastatic melanoma and inflammatory disorders, e.g.
adult respiratory distress syndrome, multiple organ failure and septic shock. [2, 3] Anti-IL8
exerts its effect by binding to the cytokine interleukin 8 (IL8) thereby preventing the activity of
IL8 in-vivo. IL8 has been shown to contribute to human melanoma advancement by
functioning as a mitogenic and angiogenic factor, while IL8 concentration in serum was found
to correlate with tumour load. [4-9] Additionally, IL8 is known to be involved in inflammatory
responses, possibly due to induction of neutrophils [10] and is associated with adverse
dermatological reactions in response to epidermal growth factor receptor inhibitors used in
cancer treatment. [11] In this thesis, an anti-IL8 producing CHO DP-12 cell line is used to
investigate the impact of altered bioprocessing on both an industrial relevant expression
system and on the therapeutic product produced. Although the anti-IL8 IgG1 studied is not
currently marketed as a therapeutic biomolecule it is similar to mAbs undergoing
biopharmaceutical development for potential pharmacological indications. [12][13]
Since the establishment of the biopharmaceutical industry, great strides have been made for
optimisation of CHO cell bioprocessing. Continuous improvements of industrial bioprocesses
and associated optimisation in bioreactor design and media formulation has resulted in
considerable increases in product yields. [14] Many of the strategies to enhance bioprocessing
have incorporated a reduction in temperature from 37oC to 30-32oC, [15-17] an increase in
osmolarity, e.g. 300 to 450 mOSm.kg-1 [18] or a reduction in media pH. [17] Alternative
approaches have included the addition of media supplements [19, 20] or the use of a

Chapter 2
44
controlled feeding strategy. [21] These strategies have been shown to result in desirable
outcomes with respect to bioprocessing, such as high cell viability, increased specific
productivity and reduced accumulation of waste by-products. Cell engineering approaches
have also been employed for the optimisation of specific productivity (qP), enhancing culture
longevity and improving specific growth rate following CHO bioprocessing. By manipulation of
genes involved in growth proliferation, [22] protein secretion, [23, 24] metabolic pathways
[25] and apoptosis, [26-30] extended culture viability and increased qP have been achieved.
Traditionally the majority of improvements to CHO bioprocessing have been realised by
observing empirical responses to process changes. Despite two decades of CHO bioprocessing,
there is still very poor comprehension of the cellular mechanisms that govern recombinant
protein production in these important cell lines. Similarly little understanding exists regarding
the impact of bioprocessing on the cellular machinery of the production cells. As proteins are
the functional components of a cell, they have the potential to change cellular outputs. Hence,
characterisation of the fundamental biological mechanisms of CHO cells in industrial cell
culture may provide a foundation for further knowledge-driven improvements to
manufacturing processes [31]. Increased understanding of the CHO proteome may lead to
production of therapeutics that have guaranteed critical quality attributes and consequently
reduced attrition rates often associated with biopharmaceutical production and process
development.
Recent technological achievements in analytical instrumentation have enabled profiling of the
CHO proteome to a depth that was previously not possible. In particular advances in liquid
chromatography and mass spectrometry have resulted in the identification of thousands of
CHO proteins that play key roles in bioprocessing including those involved in cell growth,
protein processing, glycosylation and metabolism. [32] Augmented by the publication of the
CHO genome, [33] investigation of the cellular pathways involved in bioprocessing or
pathways enhanced in CHO cells with desirable phenotypes is now achievable. As discussed in
Chapter 1, use of high resolution hybrid mass spectrometers permit increasingly broad
proteome coverage due to the high mass accuracy and resolving power of MS survey scan
acquisition combined with fast, sensitive MS/MS analyses. State-of-the-art instruments
incorporating a third mass analyser further enhance the dynamic range of detection
achievable. By enabling synchronous precursor selection (SPS) prior to MS3 determination,
inclusion of multiplexed quantitative strategies in proteomic experiments (e.g. use of tandem
mass tag (TMT) reagents) has the ability to fully describe the dynamic processes that drive

Chapter 2
45
recombinant protein production. In addition to comprehensively cataloguing proteins within a
cell, use of LC-MS3 may provide insights into molecular interactions within the cell.
In this chapter, a study is described wherein concurrent CHO DP-12 cell cultures, expressing
anti-IL8, were initially prepared using standard bioprocessing conditions and later with altered
bioprocessing conditions of pH, dissolved oxygen and temperature. Quantitative proteomics
analysis of produced CHO cell lysate was performed using a two dimensional high pH low pH
reversed phase nano liquid chromatography - mass spectrometry platform to facilitate
comparison of the effects of individual culture characteristics on the CHO cell proteome. An
Orbitrap Fusion Lumos tribrid mass spectrometer was employed enabling the identification
and subsequent relative quantitation of, and hence, determination of altered protein
expression in CHO DP-12 cells in response to the bioprocessing conditions utilised. Ingenuity
pathway analysis (IPA) was subsequently applied for determination of enriched biological
pathways within the differentially bioprocessed CHO cells. Furthermore, the method was also
used to determine bystander responses resulting from changes to the secretome of CHO cells
following bioprocessing under altered conditions. In this case naïve CHO K1 cultures were
prepared and subsequently exposed to spent media from each of the CHO DP-12 cultures.
Thus, by evaluating changes to naïve CHO K1 proteomes, a further layer of understanding
regarding CHO bioprocessing could be achieved.
2.2 Experimental
2.2.1 Reagents and Consumables
Sodium chloride (NaCl), sodium phosphate monobasic dihydrate (NaH2PO4 · 2H2O), sodium
phosphate dibasic heptahydrate (Na2HPO4 · 7H2O), sodium hydroxide (NaOH), dithiothreitol
(DTT), iodoacetamide (IAA), acetonitrile, formic acid, triethylammonium bicarbonate (TEAB),
ammonium hydroxide, L-arginine, phosphate buffered saline, Excell 325 PF CHO media, fetal
bovine serum (FBS), methotrexate, recombinant human insulin, trypan blue, dimethyl-
sulfoxide, Dulbecco’s phosphate buffered saline (D-PBS), Tris buffer, hydrochloric acid, sodium
dodecyl sulphate, urea, ammonium bicarbonate, trifluoroacetic acid (TFA), Bradford reagent,
Bovine serum albumin (BSA), urea, Trizma-base and Amicon Ultra 0.5 mL centrifugal filters
MWCO 10 kDa were purchased from Sigma Aldrich (Wicklow, Ireland). 0.1% formic acid in
water (LC-MS Optima), acetonitrile, 0.1% formic acid (LC-MS Optima), 0.1% TFA in water (LC-
MS Optima), TMT sixplex isobaric mass tag reagents and penicillin-streptomycin were
obtained from Fisher Scientific (Dublin, Ireland). Promega sequencing grade modified trypsin

Chapter 2
46
was from MyBio Ltd. (Kilkenny, Ireland). L-glutamine and trypsin/EDTA solution were
purchased from Biosciences Ltd. (Dublin, Ireland). 100% acetic acid (AnalaR NORMAPUR) was
obtained from VWR (Dublin, Ireland).
2.2.2 Cell Culture
2.2.2.1 Aseptic Technique
Cell culture work was carried out in a BioAir SafeMate 1.2 class II biological safety cabinet.
Prior to use the laminar airflow cabinet was sterilised with UV light for one hour and
thoroughly cleaned with 70% (v/v) ethanol. Subsequently, air in the laminar airflow cabinet
was to allowed to circulate for a minimum of 15 minutes before cell culture commenced to
ensure aseptic conditions were achieved. Any items placed in the cabinet were also swabbed
with 70% (v/v) ethanol prior to entry into the cabinet. During use, one cell line only was
introduced into the laminar airflow cabinet and upon completion of work with any given cell
line, the laminar airflow cabinet was allowed to clear for at least 15 minutes before further
use. This was to eliminate any possibility of cross-contamination between cell lines. The
cabinets were cleaned weekly with Virkon and operation validated annually by a certified
contractor.
2.2.2.2 Adaption of CHO DP-12 to Serum-Free Media and Suspension Culture
A Chinese hamster ovary cell line (CHO DP-12 clone#1934 [CHO DP-12, clone#1934 aIL8.92 NB
28605/14] (ATCC® CRL-12445TM) producing recombinant human anti-IL-8 IgG1 antibody, was
purchased from LGC standards (Middlesex, UK). Recommended culturing conditions for the
CHO DP-12 cell line involved preparing adherent cell culture in DMEM, supplemented with
10% fetal bovine serum (FBS), 200 nM methotrexate and 2 mg.L-1 recombinant human insulin
in a T75 cm2 culture flask. As the CHO DP-12 cell line was purchased for use in proteomic
studies, adaption of the cell line to grow in protein-free media was required to ensure no
impact on proteomic results due to media components and also to facilitate simplified
purification of the expressed mAb for subsequent product characterisation as described
Chapters 3, 4 and 5. Initially, cells were grown adherently in supplier-recommended media
formulation at 37 °C (5% CO2). Adaption to serum-free conditions was achieved by reducing
the FBS concentration in the media to 5%, 2.5% and 1% over five passages. Once growing in
1% FBS, the cells were transferred from a T75 cm2 flask to serum-free conditions in a 125 ml

Chapter 2
47
Erlenmeyer shake flask. In an effort to ensure the growth medium was completely protein-
free, cells were subsequently further adapted to grow in a commercially available protein-free
media recommended for CHO DP-12 cell cultures, namely ExcellTM 325 PF CHO. Adaption to
protein-free media was accomplished by altering the composition of the culture medium from
100:0, 75:25, 50:50, 25:75, 0:100 DMEM/ ExcellTM 325 PF CHO, over five passages. At each
stage, the culture medium was supplemented with 10 mg.L-1 recombinant human insulin, 4
mM L-glutamine, 200 nM methotrexate and 20,000 Units of Penicillin-Streptomycin. Finally, to
ensure selection pressure for CHO DP-12 clones producing anti-IL-8 IgG1, the concentration of
methotrexate was increased from 200 nM to 1 µM over two passages.
2.2.2.3 Thawing of Cryopreserved Cell Banks and Cell Culture of Fully-Adapted CHO DP-12
Cell Lines in Protein-Free, Suspension Culture
CHO DP-12 cells, from a working cell bank stored at -196 °C, were rapidly thawed at 37 °C.
Cells were re-constituted in 10 mL of pre-warmed complete media (ExcellTM 325 PF CHO, 10
mg.L-1 recombinant human Insulin, 4 mM L-glutamine, 1 µM methotrexate and 20,000 Units of
Penicillin-Streptomycin), before centrifugation at 800 rpm for five minutes. The resultant cell
pellet was re-suspended in a 10 mL aliquot of fresh complete media, before cell counting using
the trypan blue exclusion method and a haemocytometer. Cells were seeded at an initial
viable cell density of 3 x 10⁵ cells per mL of complete media in a 125 mL Erlenmeyer shake
flask and were incubated at 37°C (5% CO2, 125 rpm). Passaging of cells was performed while
cell cultures were in an exponential growth phase.
2.2.2.4 Maintenance of the Cell Lines
Cells for cryopreservation were harvested in the exponential phase of growth. Cell pellets
were re-suspended in a suitable volume of ExcellTM 325 PF CHO supplemented with 10 mg.L-1
recombinant human insulin, 4 mM L-glutamine and 5% DMSO and 1 mL aliquots of the
suspension were placed in cryovials. Vials were then placed in a slow-freezing container at -
80oC to achieve cooling of cells at a rate of approximately -1oC per minute. After a period of
five hours, vials were transferred to a Dewar containing liquid nitrogen for storage (-196°C).
Cell lines were tested in-house for possible mycoplasma contamination using a Roche
MycoTool mycoplasma real-time polymerase chain reaction kit with MagNa Pure LC2.0 and
Chapter 2
48
the Roche LightCycler 480 instrumentation. No mycoplasma infection was determined in
samples analysed.
2.2.2.5 Cell Culture using Disposable Single Use Bioreactors
All bioprocessing studies were performed using Sartorius Stedim Cultibag systems equipped
with a 2L Optical Cultibag single use bioreactor. Bioreactors were placed on temperature
controlled rocker stations and fitted with a gas line, dissolved oxygen and pH sensors and a
base addition line. pH was initially set to pH 7.0 and maintained by the automated addition of
sterile 1 M sodium hydroxide or by purging 0.22 µm sterile filtered CO2 gas into the head-
space of the disposable bioreactor. The rocker station angle was set to 7.0o. Gas flow was set
to 0.3 L.min-1. The rocker also served as a heating element used to maintain the culture at the
initial set-point of 37.0oC. Dissolved oxygen (DO) levels were maintained by purging a mixture
of purified air and oxygen into the head-space of the bioreactor and also by altering the
rocking speed of the disposable bioreactor (3 to 14 rocks per minute). 950 mL of media,
composed of ExcellTM 325 PF CHO, 10 mg.L-1 recombinant human Insulin, 4 mM L-glutamine, 1
µM methotrexate and 20,000 Units of Penicillin-Streptomycin, was added to each of three
disposable bioreactors and were allowed to equilibrate to initial conditions of 37.0oC, pH 7.0
and 85% DO overnight. Prior to inoculation with 50 mL of CHO DP-12 culture, pH readings
were verified by removing an aliquot of media from the bioreactor and measuring the pH
value using a calibrated pH electrode. CHO DP-12 cells were inoculated at a starting viable cell
density of 3 x 10⁵ cells.mL-1. Cell culture harvest was performed after 7 days of culture. Culture
harvest was completed by transferring each culture into a sterile 1 L Duran bottle, before sub-
dividing the cultures into sterile falcon tubes and centrifuging at 125 x g for 5 minutes. Spent
media was subsequently pipetted into fresh sterile falcon tubes. 50 mL aliquots of the spent
media were retained for subsequent application to naïve CHO K1 cell cultures. The remaining
spent media and all CHO DP-12 cell pellets were immediately placed at -80oC pending further
analysis.
2.2.2.6 Determination of Nutrient and Metabolite Concentration, Cell Count and Cell
Viability
A 5 mL aliquot of cell culture was removed from each of the bioreactors daily. Cell counting
was performed using the trypan blue exclusion method and a haemocytometer. 1 mL of each

Chapter 2
49
culture was centrifuged (5,000 x g, 10 minutes) to remove cellular material before
measurement of IgG, L-glutamine, glucose, glutamate, ammonia and lactate concentration
and also LDH activity in the clarified culture media using a Cedex Bioanalyser via photometric
analysis.
2.2.2.7 Culture of Naïve CHO K1 Cells
A non-recombinant protein producing cell line (CHO K1 - ATCC® CCL-61TM) was purchased from
LGC standards (Middlesex, UK). Initially grown in recommended F-12K media supplemented
with 10% FBS and 4 mM L-glutamine, adaption to serum-free conditions was achieved by
reducing the FBS concentration in the media to 5%, 2.5% and 1% over five passages. Once
growing in 1% FBS, the cells were transferred from a T75 cm2 flask to serum-free conditions in
a 125 ml Erlenmeyer shake flask. The CHO K1 cells were adapted to growth in commercial
protein-free media by altering the composition of the culture medium from 100:0, 75:25,
50:50, 25:75, 0:100 F-12K/ ExcellTM 325 PF CHO over five passages. For each bioprocess
parameter studied, CHO K1 cultures were seeded in 12 x 125 mL Erlenmeyer culture flasks and
allowed to grow for two days in Excell 325 PF medium supplemented with 10 mg.L-1
recombinant human insulin, 4 mM L-glutamine, 200 nM methotrexate and 20,000 Units of
Penicillin-Streptomycin. Once in the exponential growth phase spent media from each CHO
DP-12 altered bioprocessing culture were applied to one of nine CHO K1 cultures. Three
remaining CHO K1 cell cultures were maintained using the same media components but not
exposed to spent media samples. The cells were exposed to the spent media for 24 hours
before harvest via centrifugation (125 x g, 5 minutes). Cell pellets were immediately frozen at -
80oC pending further analysis.
2.2.3 Proteomic Analysis of CHO Cells using High pH- Low pH 2D-LC-MS/MS
2.2.3.1 CHO Proteome Sample Preparation
Cell pellets were thawed on ice and rinsed with three 1 mL aliquots of PBS to ensure complete
removal of culture medium. Freshly prepared 8M Urea in 100 mM Tris, pH 8.0 was added to
reconstitute each cell pellet to an approximate final concentration of 1 x 10⁷ cells.mL-1.
Subsequently cells were homogenised via sonication for 30 seconds using a sonic
dismembrator (Fisher Scientific) set to 20 V and centrifuged (16,000 x g, 10 minutes).
Supernatant was placed in a fresh tube and assayed for protein content using a Bradford

Chapter 2
50
protein assay, wherein samples were diluted 50-fold with Bradford reagent and incubated for
30 minutes at room temperature before recording the sample absorbance using a
spectrophotometer at 595 nm. Sample concentration was calculated using a standard curve
prepared from BSA standards of known concentration, diluted with Bradford reagent and
inclubated concurrent to the CHO protein samples. Proteomic samples were prepared using
the filter-aided sample preparation (FASP) method described previously. [34] Briefly, 100 µg of
CHO cell lysate was added to a pre-rinsed 10 kDa MWCO filters and reduced with 5 mM DTT at
25oC for 30 minutes, before alkylation with 15 mM IAA for 30 minutes at 20oC in darkness.
Following buffer exchange into 100 mM TEAB, enzymatic digestion was performed overnight
with trypsin at 37oC using a 1:50 (w/w, enzyme: protein) ratio. Subsequently sample peptides
were retrieved from the filters by centrifugation before labelling with TMT-sixplex reagents as
per manufacturer’s instructions. [35] 0.8 mg of each TMT labelling reagent dissolved in 41 µL
of anhydrous acetonitrile was added to 100 µg of CHO tryptic peptides, before incubation for
one hour at room temperature. The reaction was quenched by addition of 8 µL of 5%
hydroxylamine prior to incubation for 15 minutes. Tryptic peptide samples from CHO DP-12
and CHO K1 cultures were labelled as per the experimental design outlined in Tables 2.2 and
2.3, respectively. Samples labelled with each set of TMT-sixplex labels were pooled into eight
combined samples sets and reduced to dryness via vacuum centrifugation.
2.2.3.2 First Dimensional Fractionation
First dimensional separation of the peptide sample sets was carried out using high pH (pH 10)
reversed-phase chromatography on a Waters Acquity H-Class UPLC instrument with UV
detection. Separations were performed on an Acquity UPLC BEH 130 C18 1.7 µm 2.1 x 150 mm
analytical column using a binary gradient of 10 mM ammonium formate in water, pH 10 (A)
and 10 mM ammonium formate in 95% acetonitrile, pH 10 (B). Before separation analysis,
samples were diluted to 500 µL with 0.1% formic acid and loaded onto the analytical column,
using 3% B, over three injections. Sample separation was accomplished using gradient
conditions as follows: 3% B initially for 2 minutes, increased to 10% B in 2 minutes with a
further increase to 45% B over 33 minutes followed by a final increase to 100% B in two
minutes with a two minute isocratic hold. Initial conditions were restored in one minute and
held for an additional 10 minutes to ensure column re-equilibration. The column temperature
was maintained at 40oC throughout and UV absorbance recorded at 214 nm. The flow rate was
sustained at 200 µL.min-1. Sample eluate was collected at minute intervals over the course of
the gradient and subsequently recombined to 10 sample fractions of equal concentration as
Chapter 2
51
estimated based on the UV response. Finally sample fractions obtained for each sample set
were reduced to dryness via vacuum centrifugation.
2.2.3.3 Second Dimension nano-LC-MS Method Development
All spectra were acquired on an Orbitrap Fusion Lumos (Thermo Fisher Scientific) coupled to a
Dionex Ultimate® 3000 RSLCnano system. Peptides were separated on an Acclaim PepMap
RSLC C18, 100 Å, 75µm x 50 cm, easy-spray column (Thermo Fisher Scientific) using a binary
gradient of 0.1% (v/v) formic acid in water (C) and 0.1% (v/v) formic acid in acetonitrile (D).
Gradient conditions were as follows: 5% D initially for 5 minutes, increased to 25% D in 85
minutes with a further increase to 60% D over 20 minutes followed by a final increase to 90%
D in 5 minutes with a 5 minute isocratic hold. Initial conditions were restored in one minute
and held for an additional 29 minutes to ensure column re-equilibration. The column
temperature was maintained at 40oC and the flow rate was 300 µL.min-1. Injection volume was
1 µL, corresponding to 1 µg of labelled tryptic peptides.
The mass spectrometer was operated in data dependent mode. Survey scans of peptide
precursors were performed from 350 to 1500 m/z at 120,000 FWHM resolution (at 200 m/z) in
the Orbitrap with a 4 x 10⁵ ion count target and a maximum injection time of 50 ms. The
instrument was set to run in top speed mode (considering only the most intense charge state
for fragmentation) with 3 second cycles for the survey and the MS/MS scans. Following a
survey scan, tandem MS was performed on the most intense precursors exhibiting a charge
state from 2 to 7 and of greater than 5 x 10³ intensity by isolation in the quadrupole using a
mass filter width of 0.7 Th. Dynamic exclusion was set to each precursor for 60 seconds
subsequent to acquisition ensuring a 10 ppm mass tolerance around the precursor and its
isotopes. CID fragmentation was applied with 35% normalised collision energy and resulting
fragments were detected using the turbo scan rate in the ion trap mass analyser. The AGC
target for MS/MS was set to 104 and the maximum injection time limited to 50 ms. Precursor
selection mass range was performed from 400 to 1200 m/z for MS2 and isobaric tag loss
exclusion set for TMT. Synchronous precursor selection was enabled to include the top five
fragment ions for the MS3 scan using an isolation window of 0.7 m/z. HCD fragmentation was
applied with 65% collision energy to ensure maximal TMT reporter ion yield and resulting
fragments were detected using the Orbitrap from 100 to 500 m/z at 30,000 FWHM resolution
(at 200 m/z). The AGC target for MS/MS was set to 105 and the maximum injection time
limited to 105 ms.

Chapter 2
52
2.2.3.4 Bioinformatics
Raw data was processed using Thermo Scientific™ Proteome Discoverer™ software version
2.1.0.81. Proteome Discoverer™ software is a bioinformatics tool used to interpret Thermo
Fisher Scientific mass spectrometry data acquired from complex biological samples. Proteome
Discoverer™ software enables the identification and quantitation of proteins using various
database search algorithms, e.g. Mascot and SEQUEST®, and supports multiple dissociation
techniques, e.g. collision induced dissocation. MS2 spectra were searched with the SEQUEST®
HT engine against the Cricetulus griseus, NCBI FASTA database
(http://www.ncbi.nlm.nih.gov/assembly/GCF_000419365.1/, downloaded 12th August 2015)
and also a CHO DG44 proteome database, translated from CHO DG44 transcriptome
sequences, additionally annotated with mus musculus RefSeq notation. [36] Search
parameters included an in silico tryptic digestion permitting ≤2 missed cleavages, fixed
modifications including carbamidomethylation (+57.021 Da) of cysteine residues and TMT
sixplex (+229.163 Da) of the N-terminus and K side chain and a variable modification set to
oxidation of methionine residues (+15.9949 Da). Mass tolerances were set to 10 ppm for
precursors and 0.6 Da for product ions. Peptide spectral matches (PSM) were validated using
the Percolator® algorithm, based on q-values at a 1% FDR. For both the CHO DP-12 and CHO
K1 studies, each set of 10 samples were grouped as fractions using Proteome Discoverer™
software and subsequent data merged to produce a single result file outlining all peptides and
protein groups identified along with corresponding TMT reporter abundance values and
sequence information.
TMT reporter intensity values relating to peptides from each culture prepared under altered
bioprocessing conditions were compared to corresponding TMT reporter abundances from
peptides prepared under standard culture conditions. Log fold changes and p-values for the
CHO DG44 proteome database-searched data were determined using InfernoRDN version
1.1.5970.31895. [37] InfernoRDN is a statistical tool for quantitative analysis of ‘omics’ data
sets and may be applied for normalisation of data, hypothesis testing, clustering and
generation of heat-maps. Using InfernoRDN, peptide level abundance values corresponding to
the TMT reporter ion for each peptide were log 2 transformed, median centered and grouped
together according to their related protein group using the ‘ZRollup’ function. ANOVA analysis
was performed at the protein level to determine related p-values and fold changes were
calculated. Proteins with a p-value <0.05 and greater than 1.2 log fold change in the test
samples compared to the control standard samples were listed as differentially regulated in
the samples produced under altered bioprocessing conditions

Chapter 2
53
Gene Ontology (GO) annotation terms of cell components were determined for identified
proteins using the online tool, the database for annotation, visualisation and integrated
discovery (DAVID) (http://david.abcc.ncifcrf.gov). [38, 39] DAVID is a bioinformatics tool that
enables functional annotation of lists of genes or proteins to facilitate a better understanding
of biological function relating to large protein data sets or list of genes. Mouse homologue
RefSeq annotation correlating to identified CHO proteins, were used to determine the function
of quantified CHO cell proteins in DAVID. Gene ontology terms, obtained using DAVID
software, were visualised using REVIGO online software. REVIGO functions as a tool to
summarise and interpret lists of GO terms through use of a clustering algorithm, which relies
on semantic similarity measurements (http://revigo.irb.hr). [40] Ingenuity Pathway Analysis
(IPA) version 27216297 (QIAGEN, Redwood City, CA, USA) was utilised to map significantly
differentially regulated proteins into biological networks and pathway maps. IPA is a tool for
analysis, modelling and understanding of complex biological systems through provision of
insights into potential relationships, mechanisms, functions and relevant molecular and
protein pathways. In this work, experimental data from human, mouse and rat were used for
determination of protein pathways and networks in IPA, incorporating a significance threshold
of p<0.01 and greater than 1.2 log fold change of test samples compared to the control
standard samples. Biological functions for proteins statistically significant with a |Z score| ≥
1.0 for activation or repression were reported
2.3 Results and Discussion.
2.3.1 Experimental Design for Anti-IL8 Production under Altered Bioprocessing Conditions
Since the realisation of CHO cells as recombinant protein expression systems for the
biopharmaceutical industry, vast improvements in production strategies have resulted in high
product titres and improved therapeutic protein quality in response to empirical
improvements following measured changes to bioprocessing. In particular, changes to culture
temperature, pH, dissolved oxygen, osmolarity and feeding strategies have been effective
approaches used to halt apoptosis, stimulate protein secretion and alter cellular metabolism.
[17, 41-44] Several studies have endeavoured to understand the cellular processes that effect
change to protein secretion from CHO cells in response to some of the known productivity-
enhancing culture conditions. [36, 45-49] By investigating changes to the proteome of
recombinant protein producing cells, various differentially regulated proteins have been
identified which suggest potential pathways that may be in play when bioreactor settings have
been optimised for protein production. However, advances in analytical technology,
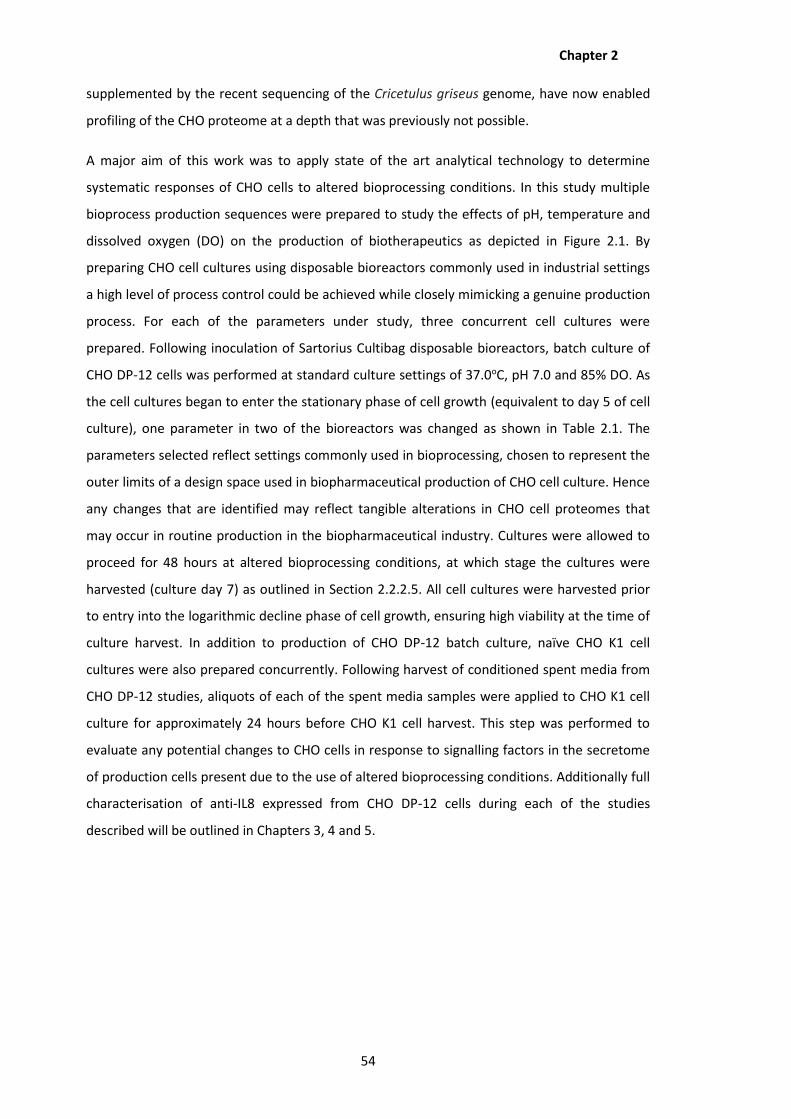
Chapter 2
54
supplemented by the recent sequencing of the Cricetulus griseus genome, have now enabled
profiling of the CHO proteome at a depth that was previously not possible.
A major aim of this work was to apply state of the art analytical technology to determine
systematic responses of CHO cells to altered bioprocessing conditions. In this study multiple
bioprocess production sequences were prepared to study the effects of pH, temperature and
dissolved oxygen (DO) on the production of biotherapeutics as depicted in Figure 2.1. By
preparing CHO cell cultures using disposable bioreactors commonly used in industrial settings
a high level of process control could be achieved while closely mimicking a genuine production
process. For each of the parameters under study, three concurrent cell cultures were
prepared. Following inoculation of Sartorius Cultibag disposable bioreactors, batch culture of
CHO DP-12 cells was performed at standard culture settings of 37.0oC, pH 7.0 and 85% DO. As
the cell cultures began to enter the stationary phase of cell growth (equivalent to day 5 of cell
culture), one parameter in two of the bioreactors was changed as shown in Table 2.1. The
parameters selected reflect settings commonly used in bioprocessing, chosen to represent the
outer limits of a design space used in biopharmaceutical production of CHO cell culture. Hence
any changes that are identified may reflect tangible alterations in CHO cell proteomes that
may occur in routine production in the biopharmaceutical industry. Cultures were allowed to
proceed for 48 hours at altered bioprocessing conditions, at which stage the cultures were
harvested (culture day 7) as outlined in Section 2.2.2.5. All cell cultures were harvested prior
to entry into the logarithmic decline phase of cell growth, ensuring high viability at the time of
culture harvest. In addition to production of CHO DP-12 batch culture, naïve CHO K1 cell
cultures were also prepared concurrently. Following harvest of conditioned spent media from
CHO DP-12 studies, aliquots of each of the spent media samples were applied to CHO K1 cell
culture for approximately 24 hours before CHO K1 cell harvest. This step was performed to
evaluate any potential changes to CHO cells in response to signalling factors in the secretome
of production cells present due to the use of altered bioprocessing conditions. Additionally full
characterisation of anti-IL8 expressed from CHO DP-12 cells during each of the studies
described will be outlined in Chapters 3, 4 and 5.

Chapter 2
55
Figure 2.1: Experimental design for the determination of changes to CHO cell proteome in
response to altered bioprocessing. For each parameter studied (temperature, pH, dissolved
oxygen (DO)), three concurrent cultures were prepared and maintained at standard culture
conditions (37.0oC, pH 7.0, 85% DO) for the duration of th exponential growth phase. When
cultures entered the stationary phase of cell growth (Day 5), one parameter was altered in two
of the cultures as outlined in Table 2.1. Bioprocessing was continued for a further 2 days
before harvesting of the cultures and separation of cells from spent cuture medium. An
aliquot of media was then applied for culture or naïve CHO-K1 cells for a period of 24 hours.
Anti-IL8 IgG1 was purified from the remaining media samples using Protien A affinity
chromatography.

Chapter 2
56
Table 2.1: Bioprocessing conditions used to prepare CHO DP-12 cell cultures in Sartorius
Cultibag Disposable Bioreactors.
Parameter Studied
Bioreactor Settings applied for Stationary Phase Growth
A B C
Temperature High Temperature: 39.5oC, pH 7.0,
85% DO
Standard 1: 37.0oC, pH 7.0,
85% DO
Low Temperature: 32.0oC, pH 7.0,
85% DO pH High pH:
37.0oC, pH 7.2, 85% DO
Standard 2: 37.0oC, pH 7.0,
85% DO
Low pH: 37.0oC, pH 6.8,
85% DO Dissolved Oxygen
High DO: 37.0oC, pH 7.0,
110% DO
Standard 3: 37.0oC, pH 7.0,
85% DO
Low DO: 37.0oC, pH 7.0,
60% DO
2.3.2 Bioprocess Monitoring
Throughout the duration of CHO DP-12 batch culture, aliquots of cell culture were sampled
daily for determination of cell count, viability and concentration of nutrients and metabolites
in each bioreactor; corresponding results are displayed in Figures 2.2 to 2.4. As the Figures
show, high cell viability was maintained for the duration of batch culture (>85%). Viable cell
count (cells.mL-1) and nutrient concentration profiles were found to follow expected trends
based on published literature. The influence of temperature on growth rate, recombinant
protein quality and expression, nutrient consumption and metabolite production in CHO cells
has been intensively studied. [16, 42, 43, 50-52] As a consequence it is now widely accepted
that a biphasic approach to setting culture temperature, incorporating initial culture at 37oC to
increase cell density, followed by a reduction in culture temperature, results in inhibited
growth rate, maintenance of high cell viability, reduced nutrient consumption, decreased
metabolite production and ultimately enhanced specific productivity of recombinant proteins.
Although there are some exceptions to these observations, [53] the current study was found
to be in-line with general trends as following application of a temperature shift from 37.0oC to
32.0oC, IgG concentration increased, glucose and glutamine consumption was reduced and
ammonia and lactate production decreased. Additionally, the viable cell count did not change
considerably when compared to an increase in viable cell count observed for cultures
maintained at 37oC or increased to 39.5oC. Conversely, CHO DP-12 cells prepared at 39.5oC
were found to have an elevation in nutrient consumption and metabolite production. These
observations suggest the cellular machinery shifted towards cell growth rather than
recombinant protein expression at elevated temperatures compared to reduced settings.

Chapter 2
57
Cell growth, metabolism and recombinant protein production are known to be significantly
influenced by culture pH, [17] however variations in the observed effects have been reported,
including optimum growth at pH 7.6, [54] or conversely between pH 6.8 -7.0 [55] and between
pH 7.0 - 7.2. [44] In this case the viable cell count for cultures maintained at pH 6.8 was found
to be lower than that of cultures processed using higher pH settings. IgG concentration was
increased following culture at pH 6.8 compared to pH 7.0-7.2, whilst a reduction in glucose
and glutamine consumption and associated reduction in ammonia and lactate production
were also observed. In correlation with reduced lactate concentration, lactate dehydrogenase
(LDH) activity was also decreased at pH 6.8 when compared to pH 7.0 – 7.2. While distinct
differences could be noted in viable cell count, IgG concentration and nutrient and metabolite
profiles whilst altering pH and temperature settings, variation in DO content of culture media
between 60 and 110% DO was not perceived to result in any distinct elevated or reduced
trends for the analytes measured. This finding is in accordance with observations made by
Trummer and co-workers, who found no significant impact to culture performance when DO
levels were maintained between 30 and 90% of air saturation. [17]

Chapter 2
58
Figure 2.2: Graphs showing cell viability and viable cell counts and also metabolite and nutrient concentrations recorded for CHO DP-12 cultures prepared to
study the effects of culture temperature. All measurements were performed using a Cedex Bioanalyser via photometric analysis (n=1).

Chapter 2
59
Figure 2.3: Graphs showing cell viability and viable cell counts and also metabolite and nutrient concentrations recorded for CHO DP-12 cultures prepared to
study the effects of culture pH. All measurements were performed using a Cedex Bioanalyser via photometric analysis (n=1).

Chapter 2
60
Figure 2.4: Graphs showing cell viability and viable cell counts and also metabolite and nutrient concentrations recorded for CHO DP-12 cultures prepared to
study the effects of dissolved oxygen content of culture media. All measurements were performed using a Cedex Bioanalyser via photometric analysis (n=1).
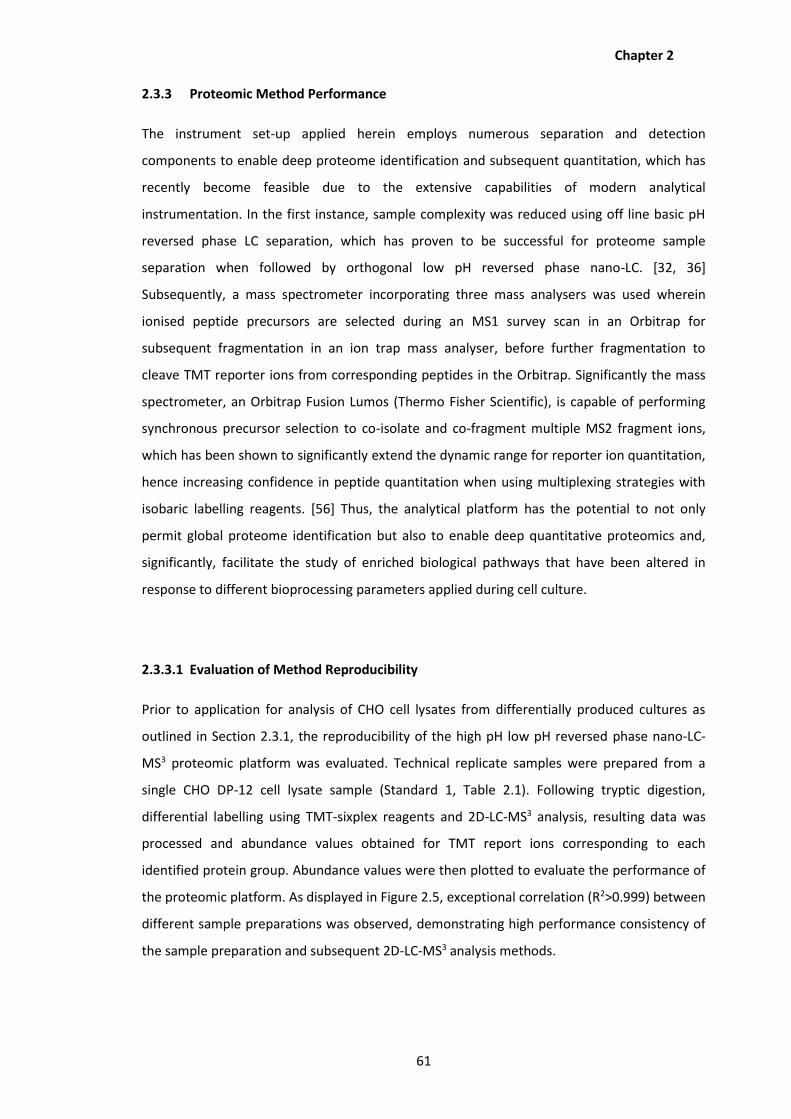
Chapter 2
61
2.3.3 Proteomic Method Performance
The instrument set-up applied herein employs numerous separation and detection
components to enable deep proteome identification and subsequent quantitation, which has
recently become feasible due to the extensive capabilities of modern analytical
instrumentation. In the first instance, sample complexity was reduced using off line basic pH
reversed phase LC separation, which has proven to be successful for proteome sample
separation when followed by orthogonal low pH reversed phase nano-LC. [32, 36]
Subsequently, a mass spectrometer incorporating three mass analysers was used wherein
ionised peptide precursors are selected during an MS1 survey scan in an Orbitrap for
subsequent fragmentation in an ion trap mass analyser, before further fragmentation to
cleave TMT reporter ions from corresponding peptides in the Orbitrap. Significantly the mass
spectrometer, an Orbitrap Fusion Lumos (Thermo Fisher Scientific), is capable of performing
synchronous precursor selection to co-isolate and co-fragment multiple MS2 fragment ions,
which has been shown to significantly extend the dynamic range for reporter ion quantitation,
hence increasing confidence in peptide quantitation when using multiplexing strategies with
isobaric labelling reagents. [56] Thus, the analytical platform has the potential to not only
permit global proteome identification but also to enable deep quantitative proteomics and,
significantly, facilitate the study of enriched biological pathways that have been altered in
response to different bioprocessing parameters applied during cell culture.
2.3.3.1 Evaluation of Method Reproducibility
Prior to application for analysis of CHO cell lysates from differentially produced cultures as
outlined in Section 2.3.1, the reproducibility of the high pH low pH reversed phase nano-LC-
MS3 proteomic platform was evaluated. Technical replicate samples were prepared from a
single CHO DP-12 cell lysate sample (Standard 1, Table 2.1). Following tryptic digestion,
differential labelling using TMT-sixplex reagents and 2D-LC-MS3 analysis, resulting data was
processed and abundance values obtained for TMT report ions corresponding to each
identified protein group. Abundance values were then plotted to evaluate the performance of
the proteomic platform. As displayed in Figure 2.5, exceptional correlation (R2>0.999) between
different sample preparations was observed, demonstrating high performance consistency of
the sample preparation and subsequent 2D-LC-MS3 analysis methods.

Chapter 2
62
Figure 2.5: Scatter plots prepared from TMT abundance data for identified and quantified
proteins from CHO DP-12 cell lysate, analysed using the 2D-LC-MS3 method, showing linear
correlation between triplicate technical replicates prepared.
2.3.3.2 Quantitative Proteomics Experimental Design and Platform Performance
Having confirmed the reproducibility of the proteomic platform, samples were subsequently
prepared from each of the CHO DP12 cultures as outline in Table 2.2. Each sample was
prepared in duplicate and labelled in a manner which allowed for each condition (i.e. an
elevated or reduced setting for each parameter) to be compared to a proteome sample from
CHO DP-12 cells cultured in parallel using standard conditions. In addition, proteomic samples
prepared from biological replicate cultures, produced under standard bioprocessing conditions
during each study, were also included in the experimental design in order to establish

Chapter 2
63
consistency of the proteomic platform from upstream bioprocessing of CHO cell cultures to
the final data analysis steps of the proteomic platform. Using this approach for combination of
differentially labelled samples, the method consistency could be evaluated by determining
variation within each combined set of TMT-sixplex labelled samples and also between sets,
e.g. by comparison of TMT6-127 abundance values corresponding to Standards 1 – 3 (Table
2.2). Furthermore, duplicate samples prepared from altered bioprocessing conditions were
included in different sample sets to add further confidence by ensuring results were not
impacted by variations in instrument performance from day to day. As displayed in Figures 2.6
and 2.7, high consistency in relative quantitation was demonstrated both within the same 2D-
LC-MS3 analysis (R2>0.98) and across different 2D-LC-MS3 analysis (R2>0.95). Figure 2.8 shows
examples of first and second dimensional chromatograms acquired during 2D-LC-MS3 analysis,
showing broad separation over the gradients applied as was typical of all samples analysed.
Table 2.2: Experimental design for CHO DP-12 cultures prepared in Cultibag disposable
bioreactors. CHO-DP12 culture conditions are outlined in more detail in Table 2.1.
TMT label
applied TMT6-126 TMT6-127 TMT6-128 TMT6-129 TMT6-130 TMT6-131
Set A High Temp.
Study: 39.5oC
Standard 1
Low Temp. Study: 32.0oC
Standard 1
Standard 2
Standard 3
Set B High pH
Study: pH 7.2
Standard 2
Low pH Study: pH
6.8
High Temp. Study: 39.5oC
Standard 1
Low Temp. Study: 32.0oC
Set C High DO Study:
110% DO
Standard 3
Low DO Study: 60%
DO
High pH Study: pH
7.2
Standard 2
Low pH Study: pH
6.8
Set D Standard
1 Standard
2 Standard
3
High DO Study:
110% DO
Standard 3
Low DO Study: 60%
DO

Chapter 2
64
Figure 2.6: Scatter plots showing linear correlation between biological triplicate replicates prepared from different CHO DP-12 cell samples, cultured using
identical bioprocess conditions, and subsequently TMT labelled and analysed as part of Set A or Set D (Table 2.2) using the 2D-LC-MS3 method described.

Chapter 2
65
Figure 2.7: Scatter plots showing linear correlation between biological triplicate replicates prepared from different CHO DP-12 cell samples, cultured using
identical bioprocess conditions, and subsequently TMT labelled and analysed using different 2D-LC-MS3 runs.

Chapter 2
66
Figure 2.8: A. First dimensional chromatogram showing high pH reversed phase separation of
sample peptides from Set D. B. Total ion chromatograms obtained during second-dimensional
LC-MS3 analysis of Set D sample fractions.

Chapter 2
67
A similar experimental approach was employed for proteomic analysis of naïve CHO K1 cells
which were exposed to conditioned media samples, as displayed in Table 2.3. However, in this
instance, only one set of biological replicates (to be analysed using the same 2D-LC-MS3
analysis run) were generated. Three CHO K1 cultures that were prepared alongside cultures
exposed to spent media were also analysed, these are described as Blank 1 to 3 in Table 2.3.
The method performance was further confirmed by determining the correlation of abundance
values obtained for reporter ions associated with protein groups identified and quantified in
CHO K1 samples. Scatter plots were prepared using TMT ion abundances reported for
untreated CHO K1 cultures revealing high correlation between quantified protein groups
(Figure 2.9, R2> 0.99). Furthermore, samples cultured using spent media produced in CHO DP-
12 cultures prepared under standard conditions, also displayed high levels of correlation both
within the same 2D-LC-MS3 analysis (Figure 10, R2> 0.99) and across different experiments
(Figure 11, R2>0.95 ).
Table 2.3: Experimental design for CHO K1 cultures treated with conditioned media obtained
from CHO DP-12 cultures. Three untreated ‘blank’ CHO K1 cultures were also prepared.
TMT label applied
TMT6-126 TMT6-127 TMT6-128 TMT6-129 TMT6-130 TMT6-131
Set E High Temp.
Study: 39.5oC
Standard 1
Low Temp. Study: 32.0oC
Blank 1 Blank 2 Blank 3
Set F High pH
Study: pH 7.2
Standard 2
Low pH Study: pH
6.8
High Temp. Study: 39.5oC
Standard 1
Low Temp. Study: 32.0oC
Set G High DO Study:
110% DO
Standard 3
Low DO Study:
60% DO
High pH Study: pH
7.2
Standard 2
Low pH Study: pH
6.8
Set H Standard
1 Standard
2 Standard
3
High DO Study:
110% DO
Standard 3
Low DO Study:
60% DO
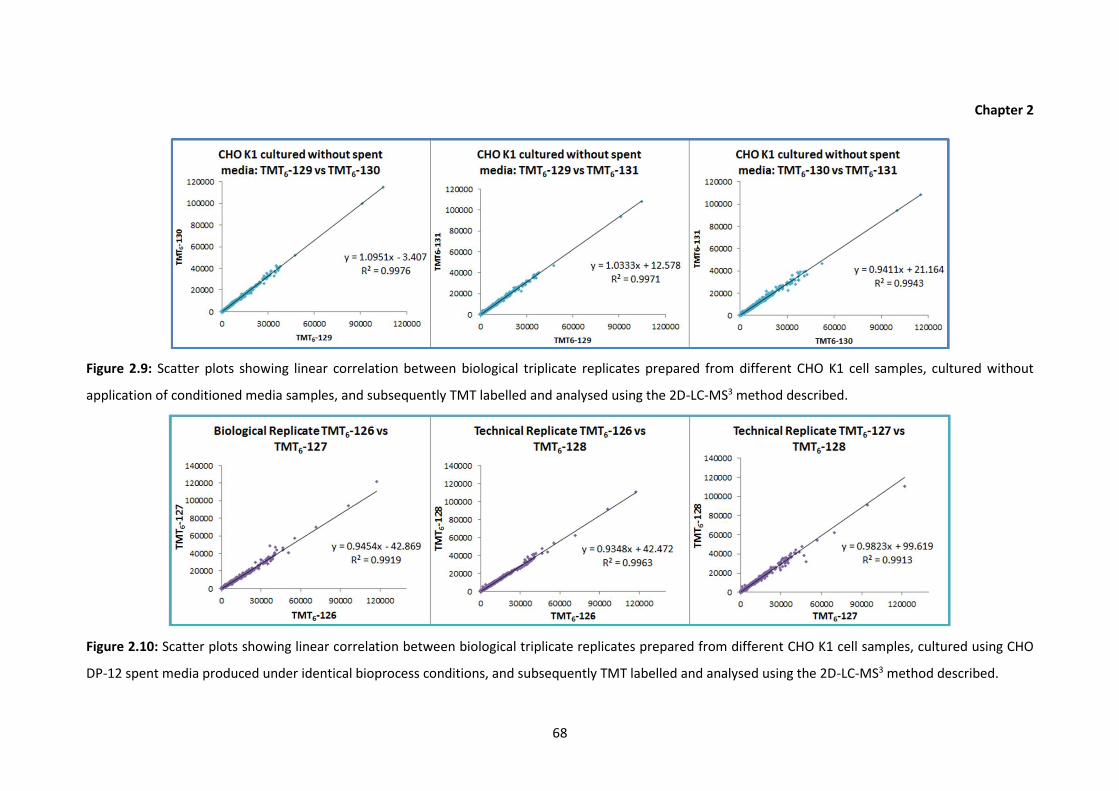
Chapter 2
68
Figure 2.9: Scatter plots showing linear correlation between biological triplicate replicates prepared from different CHO K1 cell samples, cultured without
application of conditioned media samples, and subsequently TMT labelled and analysed using the 2D-LC-MS3 method described.
Figure 2.10: Scatter plots showing linear correlation between biological triplicate replicates prepared from different CHO K1 cell samples, cultured using CHO
DP-12 spent media produced under identical bioprocess conditions, and subsequently TMT labelled and analysed using the 2D-LC-MS3 method described.

Chapter 2
69
Figure 2.11: Scatter plots showing linear correlation between biological triplicate replicates prepared from different CHO K1 cell samples cultured using CHO
DP-12 spent media produced under identical bioprocess conditions, and subsequently analysed using the 2D-LC-MS3 method described.

Chapter 2
70
2.3.3.3 Identification of CHO Cell Proteins
In total 6,821 CHO DP-12 protein groups and 7,082 CHO K1 protein groups were identified and
quantified across all proteomic analyses with <1% false discovery rate (FDR) and using a
minimum of 2 peptides for protein identification. Within CHO DP-12 data sets the number of
protein groups quantified ranged from 6,276 to 6,503, whilst the amount of protein groups
measured within sets of CHO K1 proteomes ranged from 6,703 to 6,835. The majority of
peptides identified had charges states of +2, +3 or +4, as is typical of tryptic peptides (Figure
2.12). Broad sequence coverage was also achieved for the majority of protein groups
quantified, >84% of proteins were identified using more than four peptides while >10%
sequence coverage was achieved for over 83% of the protein groups determined for all sample
sets (Figure 2.12). The CHO cell proteome coverage attained represents a significant extension
to the number of CHO cell proteins that have been identified in previous CHO quantitative
proteomics studies. Baycin-Hizal et al. identified 5,782 grouped proteins in the first proteomic
analysis of CHO cells using the CHO genome exclusively, [32] however 48 first dimensional
fractions were required for LC-MS/MS analysis, compared to ten used in this study, and a
quantitative strategy was not incorporated into the method design. Quantitative proteomics
of CHO cells was performed by Liu and co-workers used an mRNA CHO DG44 database for
protein identification. [36] Using 22 fractions, separated over a 260 minute LC-MS/MS
gradient, 4,986 CHO protein groups were identified; including 2,800 proteins quantified with a
minimum of two peptides. In the current study, use of a tribrid mass spectrometer permits the
use of a reduced first dimensional sample fractionation as the unmatched mass accuracy,
resolution and detectable mass range capabilities of the instrument enables in-depth
proteome coverage without extensive first dimensional fractionation.
Chapter 2
71
Figure 2.12: 2D-LC-MS3 method performance. A. Charge state distribution of peptides used
for identification of grouped proteins; B. Number of peptides identified for each CHO protein
reported; C. Sequence coverage profile for all protein groups determined.

Chapter 2
72
2.3.3.4 Gene Ontology Analysis
In an effort to investigate if any bias exists in proteome coverage for proteins identified using
the high pH low pH 2D-LC-MS3 method, the DAVID bioinformatics resource was used to
determine gene ontology (GO) terms associated with the identified CHO DP-12 protein groups.
[38, 39] Associated GO terms with <1% FDR were visualised using REVIGO and resultant
interaction graphs representing enriched biological processes and molecular functions are
shown in Figures 2.13 and 2.14, respectively, and a scatter plot showing related cellular
compartments is displayed in Figure 2.15.
Figure 2.13: Identified CHO DP-12 proteins were processed using DAVID for determination of
potential associated biological functions. Enriched biological processes associated with
proteins identified in CHO DP-12 cell lysate, identified using DAVID with p-values >0.05 and
<1% FDR, were visualised using REVIGO. [38-40] The complexity of the graph and absence of
clustering signifys the broad proteome coverage achieved.
From the complexity of the graph showing biological processes related to protein groups
identified and the absence of clustering of GO terms in this graph, it may be deduced that
broad proteome coverage was achieved. Furthermore, all components of the cell, including
nuclear, cytosolic and membrane compartments are well represented, as depicted in Figure

Chapter 2
73
2.15. In terms of molecular function, a number of distinct clusters were observed (Figure 2.14),
including RNA/DNA binding, ATPase and helicase activity, kinase and ligase activity and
oxidoreductase activity, all of which are functions of growing cells. Hence it was deduced that
wide proteome coverage was achieved using the optimised proteomic 2D-LC-MS3 platform.
Figure 2.14: Identified CHO DP-12 proteins were processed using DAVID for determination of
potential associated biological functions. Enriched molecular functions associated with
proteins identified in CHO DP-12 cell lysate, identified using DAVID with results set to a 1% FDR
and P-value > 0.05, were visualised using REVIGO. [38-40] A number of distinct clusters were
observed, all of which were found to be functions of growing cells.
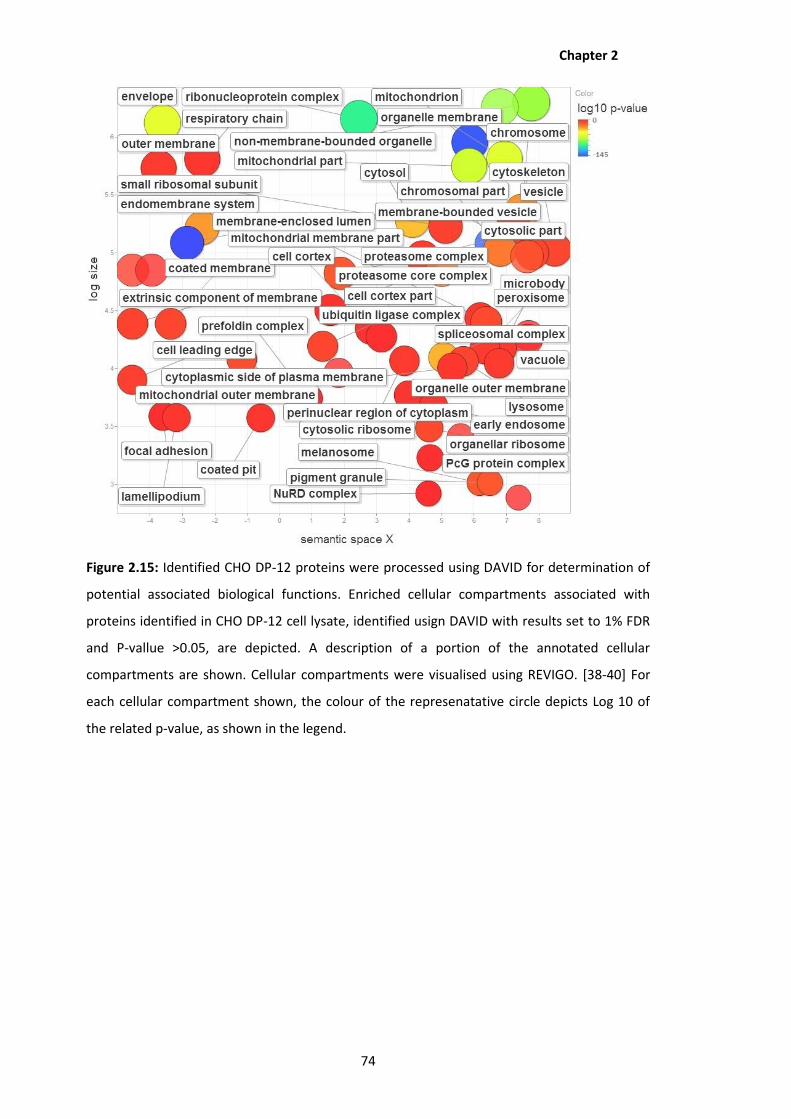
Chapter 2
74
Figure 2.15: Identified CHO DP-12 proteins were processed using DAVID for determination of
potential associated biological functions. Enriched cellular compartments associated with
proteins identified in CHO DP-12 cell lysate, identified usign DAVID with results set to 1% FDR
and P-vallue >0.05, are depicted. A description of a portion of the annotated cellular
compartments are shown. Cellular compartments were visualised using REVIGO. [38-40] For
each cellular compartment shown, the colour of the represenatative circle depicts Log 10 of
the related p-value, as shown in the legend.

Chapter 2
75
2.3.4 Quantitative CHO DP-12 Proteomics Following Altered Bioprocessing
For each altered bioprocessing condition studied, peptide abundance data was compared to
corresponding proteome samples produced from CHO cell lysate subsequent to culture under
standard bioprocessing conditions. Using InfernoRDN fold changes and p-values were
calculated and subsequently used to prepare volcano plots to investigate differential
expression as shown in Figure 2.16. In order to evaluate differentially regulated proteins, a
frequently selected threshold for significant change, within samples derived from the same
cell line, of 1.2 fold change was utilised. [45, 47, 48, 57] As the overall number of proteins was
so large, the individual protein data for all identified protein groups are not included in this
thesis. Identified grouped proteins that were found to be differentially regulated are listed in
Appendix 1. A range of 175 – 788 differentially regulated grouped proteins were determined in
CHO DP-12 samples cultured under the altered bioprocessing conditions studied. Complete
proteome data may be accessed on the National Institute of Bioprocessing Research and
Training (NIBRT) server.

Chapter 2
76
Figure 2.16: Volcano plots showing fold changes plotted against –Log10 of p-values calculated
for CHO DP-12 proteins quantified. Significant proteins with fold changes >1.2 and p-value
<0.05 are shown in black, green dots represent proteins with p-value >0.05 and >1.2 fold
change; blue dots represent proteins with p value >0.05, <1.2 fold change; red dots signify
proteins with p value <0.05, <1.2 fold change.

Chapter 2
77
Significant proteins identified for each study were correlated with potential cellular pathways
using Ingenuity pathway analysis (IPA) for determination of enriched or decreased pathways
as a consequence of CHO DP-12 cell culture under conditions of altered bioprocessing. IPA
uses information stored in a knowledgebase to generate cellular and molecular networks for
identified proteins and uses a statistical algorithm to assign a significance score for the
association (Z-score). [34] A higher score signifies greater statistical significance to support the
correlation of those proteins in the network. For each study, the top three positively or
negatively altered pathways having a |Z score| ≥ 1.0, and identified using a minimum of four
proteins were determined and are reported in Table 2.4. The vast majority of potentially
altered pathways determined across all samples were found to be involved in cellular
signalling, e.g. PTEN signalling, NF-kappa-B signalling and 14-3-3-mediated signalling.
Reflecting the high cell viability at the point of cell harvest, the majority of the cells were not
found to have apoptotic activity. However, proteome samples generated from cells produced
at pH 7.2 displayed down-regulation of prostaglandin G/H synthase 2 (PTGS2), which is
involved in apoptosis resistance and up-regulation of tumour necrosis factor receptor
superfamily member 3 (LTBR), an apoptotic promoter. These proteins may be related to a
reduction in viability in cells cultured at pH 7.2 when compared to those maintained at pH 7.0.
The CHO DP-12 cells produced at 60% DO were found to have increased signalling activity by
Rho family GTPases, which are involved in a variety of cellular activities including actin
cytoskeleton reorganisation and transcriptional regulation. Interestingly, NADPH oxidase 4
(NOX4), which may function as an oxygen sensor, was found to be up-regulated. Potentially
related to excess oxygen levels in the culture media, the oxidoreductase, superoxide
dismutase (SOD1) was observed to be up-regulated (fold change = 1.609) in CHO DP-12
proteome corresponding to cell culture at 110% DO. Unsurprisingly, a large number of heat
shock proteins were up-regulated in CHO DP-12 cells produced at 39.5oC, including the DnaJ
heat shock protein family members A1, C3, C8, C13, C16, C17 (DNAJA1, DNAJC3, DNAJC8,
DNAJC13, DNAJC16, DNAJC17) and heat shock protein HSP 90-α (HSP90AA1). Conversely, heat
shock protein HSP 90-β (HSP90AB1) was down-regulated (fold change = -1.217) in CHO cells
produced at 32oC.
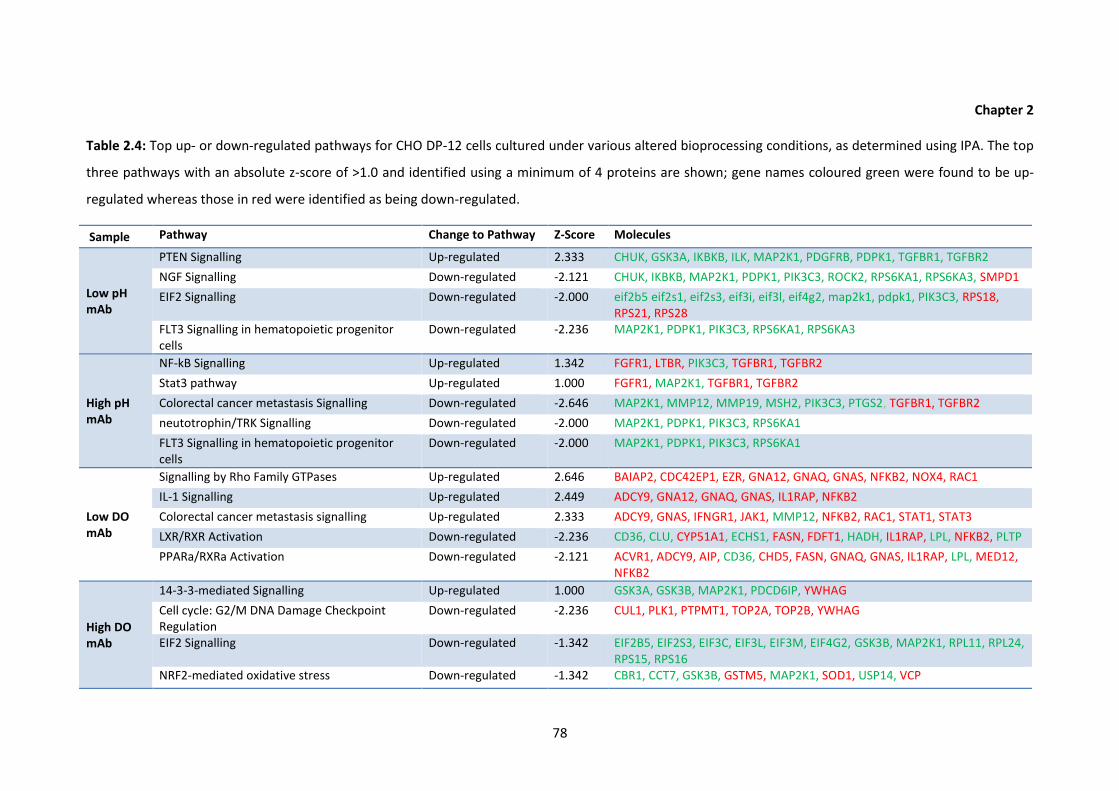
Chapter 2
78
Table 2.4: Top up- or down-regulated pathways for CHO DP-12 cells cultured under various altered bioprocessing conditions, as determined using IPA. The top
three pathways with an absolute z-score of >1.0 and identified using a minimum of 4 proteins are shown; gene names coloured green were found to be up-
regulated whereas those in red were identified as being down-regulated.
Sample Pathway Change to Pathway Z-Score Molecules
Low pH mAb
PTEN Signalling Up-regulated 2.333 CHUK, GSK3A, IKBKB, ILK, MAP2K1, PDGFRB, PDPK1, TGFBR1, TGFBR2
NGF Signalling Down-regulated -2.121 CHUK, IKBKB, MAP2K1, PDPK1, PIK3C3, ROCK2, RPS6KA1, RPS6KA3, SMPD1
EIF2 Signalling Down-regulated -2.000 eif2b5 eif2s1, eif2s3, eif3i, eif3l, eif4g2, map2k1, pdpk1, PIK3C3, RPS18, RPS21, RPS28
FLT3 Signalling in hematopoietic progenitor cells
Down-regulated -2.236 MAP2K1, PDPK1, PIK3C3, RPS6KA1, RPS6KA3
High pH mAb
NF-kB Signalling Up-regulated 1.342 FGFR1, LTBR, PIK3C3, TGFBR1, TGFBR2
Stat3 pathway Up-regulated 1.000 FGFR1, MAP2K1, TGFBR1, TGFBR2
Colorectal cancer metastasis Signalling Down-regulated -2.646 MAP2K1, MMP12, MMP19, MSH2, PIK3C3, PTGS2, TGFBR1, TGFBR2
neutotrophin/TRK Signalling Down-regulated -2.000 MAP2K1, PDPK1, PIK3C3, RPS6KA1
FLT3 Signalling in hematopoietic progenitor cells
Down-regulated -2.000 MAP2K1, PDPK1, PIK3C3, RPS6KA1
Low DO mAb
Signalling by Rho Family GTPases Up-regulated 2.646 BAIAP2, CDC42EP1, EZR, GNA12, GNAQ, GNAS, NFKB2, NOX4, RAC1
IL-1 Signalling Up-regulated 2.449 ADCY9, GNA12, GNAQ, GNAS, IL1RAP, NFKB2
Colorectal cancer metastasis signalling Up-regulated 2.333 ADCY9, GNAS, IFNGR1, JAK1, MMP12, NFKB2, RAC1, STAT1, STAT3
LXR/RXR Activation Down-regulated -2.236 CD36, CLU, CYP51A1, ECHS1, FASN, FDFT1, HADH, IL1RAP, LPL, NFKB2, PLTP
PPARa/RXRa Activation Down-regulated -2.121 ACVR1, ADCY9, AIP, CD36, CHD5, FASN, GNAQ, GNAS, IL1RAP, LPL, MED12, NFKB2
High DO mAb
14-3-3-mediated Signalling Up-regulated 1.000 GSK3A, GSK3B, MAP2K1, PDCD6IP, YWHAG
Cell cycle: G2/M DNA Damage Checkpoint Regulation
Down-regulated -2.236 CUL1, PLK1, PTPMT1, TOP2A, TOP2B, YWHAG
EIF2 Signalling Down-regulated -1.342 EIF2B5, EIF2S3, EIF3C, EIF3L, EIF3M, EIF4G2, GSK3B, MAP2K1, RPL11, RPL24, RPS15, RPS16
NRF2-mediated oxidative stress Down-regulated -1.342 CBR1, CCT7, GSK3B, GSTM5, MAP2K1, SOD1, USP14, VCP
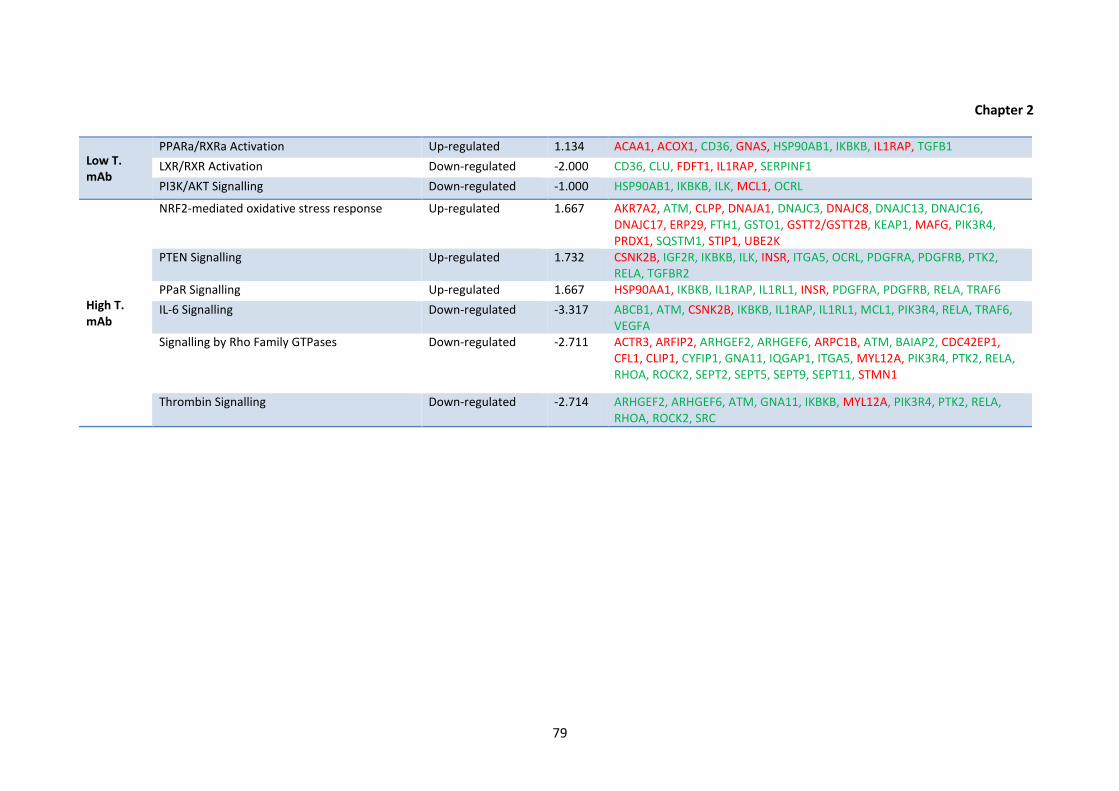
Chapter 2
79
Low T. mAb
PPARa/RXRa Activation Up-regulated 1.134 ACAA1, ACOX1, CD36, GNAS, HSP90AB1, IKBKB, IL1RAP, TGFB1
LXR/RXR Activation Down-regulated -2.000 CD36, CLU, FDFT1, IL1RAP, SERPINF1
PI3K/AKT Signalling Down-regulated -1.000 HSP90AB1, IKBKB, ILK, MCL1, OCRL
High T. mAb
NRF2-mediated oxidative stress response Up-regulated 1.667 AKR7A2, ATM, CLPP, DNAJA1, DNAJC3, DNAJC8, DNAJC13, DNAJC16, DNAJC17, ERP29, FTH1, GSTO1, GSTT2/GSTT2B, KEAP1, MAFG, PIK3R4, PRDX1, SQSTM1, STIP1, UBE2K
PTEN Signalling Up-regulated 1.732 CSNK2B, IGF2R, IKBKB, ILK, INSR, ITGA5, OCRL, PDGFRA, PDGFRB, PTK2, RELA, TGFBR2
PPaR Signalling Up-regulated 1.667 HSP90AA1, IKBKB, IL1RAP, IL1RL1, INSR, PDGFRA, PDGFRB, RELA, TRAF6
IL-6 Signalling Down-regulated -3.317 ABCB1, ATM, CSNK2B, IKBKB, IL1RAP, IL1RL1, MCL1, PIK3R4, RELA, TRAF6, VEGFA
Signalling by Rho Family GTPases Down-regulated -2.711 ACTR3, ARFIP2, ARHGEF2, ARHGEF6, ARPC1B, ATM, BAIAP2, CDC42EP1, CFL1, CLIP1, CYFIP1, GNA11, IQGAP1, ITGA5, MYL12A, PIK3R4, PTK2, RELA, RHOA, ROCK2, SEPT2, SEPT5, SEPT9, SEPT11, STMN1
Thrombin Signalling Down-regulated -2.714 ARHGEF2, ARHGEF6, ATM, GNA11, IKBKB, MYL12A, PIK3R4, PTK2, RELA, RHOA, ROCK2, SRC

Chapter 2
80
In addition to cellular pathways, individual proteins that were found to be significantly
differentially altered across the different samples analysed, were also investigated. In this
case, proteins determined to have an absolute Z-score > 2.0 were highlighted are shown in
Table 2.5. A large proportion of differentially regulated proteins identified are thought to be
involved in transcription and phosphorylation mechanisms associated with actively growing
and protein producing cells, illustrating the activity of the cell undergoing normal processes
during production. These observations reflect the results obtained while monitoring IgG and
metabolite production and growth trends during CHO DP-12 bioprocessing as the cells were
actively growing and expressing recombinant therapeutic proteins at the time of culture
harvest. These findings indicate the ruggedness of the bioprocess in response to the induced
pH, temperature and DO variations. However, the minor changes that were applied were not
designed to induce stress, but rather to mimic an industrial process in an attempt to decipher
what cellular-level changes have occurred and may occur in routine biopharmaceutical
manufacture. Of the bioprocess parameters studied temperature shift is one of the most
widely used methods in bioprocessing for induction of recombinant protein expression. [16,
17, 41-44, 58] In this study differential expression on a cellular level appeared to be low for
proteins that could be correlated with cellular pathways for CHO DP-12 cells produced at
32.0oC when compared to those produced at 37.0oC. Despite the vastness of the dataset for
quantitative proteomics, showing high reproducibility and incorporating high quantitation
confidence due to the use of SPS-MS3, no obvious pathways that could be correlated with
increased recombinant protein expression were determined. However, a number of caveats
regarding data processing with IPA may be noted. Firstly, human, mouse and rat models were
used for determination of protein pathways as no Chinese hamster model is available.
Secondly, there were many proteins which were not assigned a Z-score and could not be
correlated with pathways using IPA. Hence, it is possible that further data mining may yield
additional information regarding the cellular activity of the CHO cells studied.

Chapter 2
81
Table 2.5: Differentially regulated proteins identified in CHO DP-12 proteomes following 2D-
LC-MS3 and IPA analysis using an absolute Z-score > 2.0.
Bioprocess Condition
Upstream Regulator
Molecule Type Predicted Activation State
Activation z-score
Low pH SSMAD4 Transcription regulator Inhibited -2.224
OLR1 Transmembrane receptor Inhibited -2.000
MGEA5 Deglycosylation enzyme Activated 2.673
RIPK2 Kinase Activated 2.213
ACOX1 Enzyme Activated 2.621
LEP Growth factor Activated 2.372
INSR Kinase Activated 2.164
LGALS3 Involved in differentiation Activated 2.219
MAPK1 Kinase Activated 3.208
High pH RICTOR Subunit of mTORC2 Inhibited -2.236
SYVN1 Component of ER-associated degradation
Activated 2.236
Low DO Lh Complex (proliferation, transcription, apoptosis)
Inhibited -2.000
PTEN phosphatase Inhibited -2.415
NUPR1 Transcription regulator Inhibited -2.138
NFE2L2 Transcription regulator Inhibited -2.054
APOE Transporter Inhibited -2.423
RB1 Transcription regulator Inhibited -2.828
RICTOR Subunit of mTORC2 Activated 3.162
RABL6 cellular proliferation Activated 2.449
ATP7B copper transport Activated 2.236
CCND1 cell division Activated 2.200
MTOR serine threonine protein kinase, up regulates protein synthesis
Activated 2.236
PTGER2 cell signalling, proliferation Activated 2.236
CEBPB transcription factor Activated 2.359
KDM5A transcription regulator Activated 2.449
PLAU cellular response to fluid shear stress and glucose stimulus
Activated 2.000
CSF2 cytokine - kinase activity Activated 3.146
MITF transcription factor Activated 2.720
MAP4K4 serine threonine protein kinase, response to environmental stress and cytokines
Activated 2.132
High DO NUPR1 Transcription regulator Inhibited -2.668
CD38 Enzyme Inhibited -2.219
CST5 Cysteine protease inhibitor Inhibited -2.333
EBF1 Transcription regulator Inhibited -2.449
IGF1R Transmembrane receptor Activated 2.138
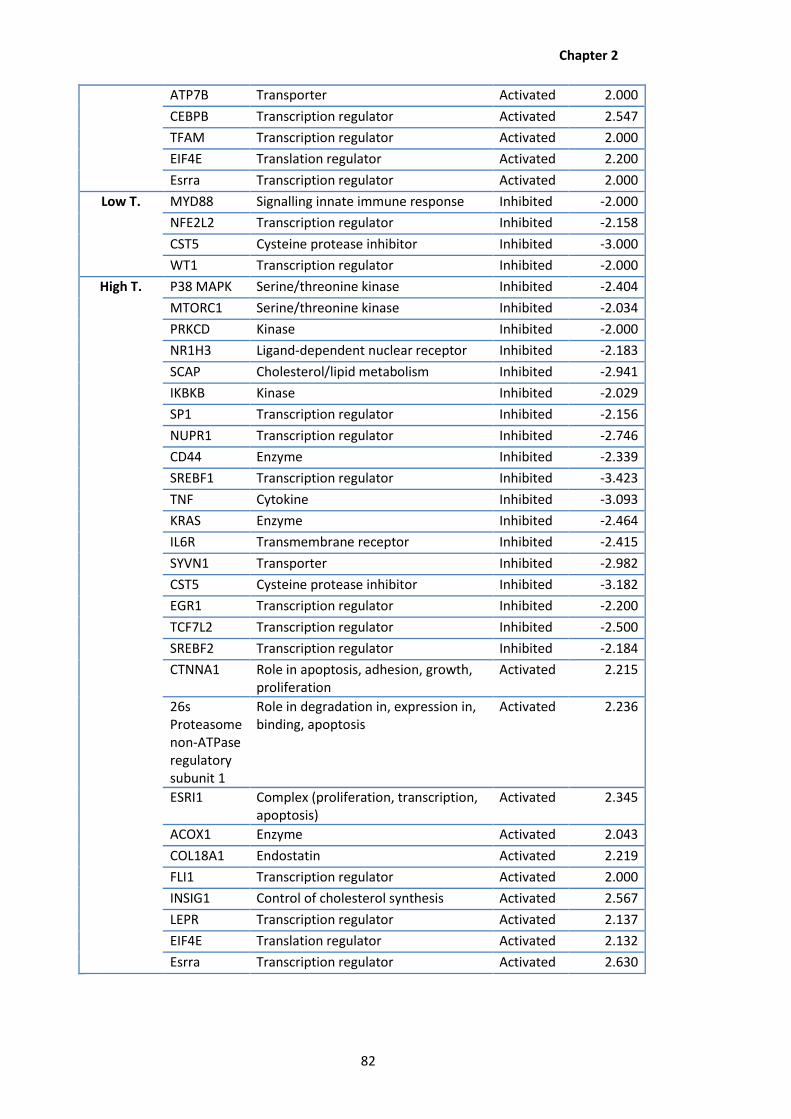
Chapter 2
82
ATP7B Transporter Activated 2.000
CEBPB Transcription regulator Activated 2.547
TFAM Transcription regulator Activated 2.000
EIF4E Translation regulator Activated 2.200
Esrra Transcription regulator Activated 2.000
Low T. MYD88 Signalling innate immune response Inhibited -2.000
NFE2L2 Transcription regulator Inhibited -2.158
CST5 Cysteine protease inhibitor Inhibited -3.000
WT1 Transcription regulator Inhibited -2.000
High T. P38 MAPK Serine/threonine kinase Inhibited -2.404
MTORC1 Serine/threonine kinase Inhibited -2.034
PRKCD Kinase Inhibited -2.000
NR1H3 Ligand-dependent nuclear receptor Inhibited -2.183
SCAP Cholesterol/lipid metabolism Inhibited -2.941
IKBKB Kinase Inhibited -2.029
SP1 Transcription regulator Inhibited -2.156
NUPR1 Transcription regulator Inhibited -2.746
CD44 Enzyme Inhibited -2.339
SREBF1 Transcription regulator Inhibited -3.423
TNF Cytokine Inhibited -3.093
KRAS Enzyme Inhibited -2.464
IL6R Transmembrane receptor Inhibited -2.415
SYVN1 Transporter Inhibited -2.982
CST5 Cysteine protease inhibitor Inhibited -3.182
EGR1 Transcription regulator Inhibited -2.200
TCF7L2 Transcription regulator Inhibited -2.500
SREBF2 Transcription regulator Inhibited -2.184
CTNNA1 Role in apoptosis, adhesion, growth, proliferation
Activated 2.215
26s Proteasome non-ATPase regulatory subunit 1
Role in degradation in, expression in, binding, apoptosis
Activated 2.236
ESRI1 Complex (proliferation, transcription, apoptosis)
Activated 2.345
ACOX1 Enzyme Activated 2.043
COL18A1 Endostatin Activated 2.219
FLI1 Transcription regulator Activated 2.000
INSIG1 Control of cholesterol synthesis Activated 2.567
LEPR Transcription regulator Activated 2.137
EIF4E Translation regulator Activated 2.132
Esrra Transcription regulator Activated 2.630

Chapter 2
83
2.3.5 Application of Quantitative Proteomics to Determine Bystander Response: Naïve
CHO K1
In addition to evaluating changes to proteomes of recombinant protein expressing CHO cells in
response to altered bioprocessing conditions, a further study was performed wherein the
media obtained from CHO DP-12 cell culture post-harvest was applied to non-producing CHO
K1 cell culture. By identifying cellular-level variations in CHO K1 proteomes, an assessment
regarding the impact of the secretome of production cells following altered bioprocessing may
be made. For this study CHO K1 cell culture was prepared and treated with spent media,
before proteomic analysis using the optimised 2D-nano-LC-MS3 platform and data processing
methods as outlined in Section 2.2. InfernoRDN software was utilised for the determination of
p-values and fold changes for CHO K1 proteins treated with media from altered bioprocessing
CHO DP-12 cell cultures, compared to media used for culture under standard bioprocessing
conditions. Significance thresholds for differentially regulated proteins were set to |fold
change| > 1.2 and p-value < 0.05. Corresponding data, illustrated in volcano plots in Figure
2.17, detail a high level of differentially regulated proteins in CHO K1 cells treated with media
used to culture CHO DP-12 cells at 39.5oC (352 significant proteins) and at 110% DO (399
significant proteins), compared to other samples (57 – 187 significant proteins determined).
All differentially regulated CHO K1 protein groups identified are listed in Appendix 2. To
evaluate potential cellular pathways that may be associated with differentially regulated
proteins in all CHO K1 proteome samples investigated, data was processed using IPA. The top
30 altered pathways determined following IPA analysis, with an absolute Z-score >1.0 and
requiring a minimum of four proteins for pathway identification, are displayed in Figure 2.18.
A high number of signalling pathways appear to have been activated in the CHO K1 cell
cultures, in particular for the samples treated with media from high DO and high temperature
culture studies. However, upon closer inspection it was noted that a number of up-regulated
proteins are associated with multiple pathways. Proteins contributing to the Z-score of >10
pathways identified are outlined in Table 2.6.

Chapter 2
84
Figure 2.17: Volcano plots showing fold changes plotted against –Log10 of p-values calculated
for CHO DP-12 proteins quantified. Significant proteins with fold changes >1.2 and p-value
<0.05 are shown in blue, red dots represent proteins with p-value >0.05 and >1.2 fold change;
green dots represent proteins with p value >0.05, <1.2 fold change; black dots signify proteins
with p value <0.05, <1.2 fold change.
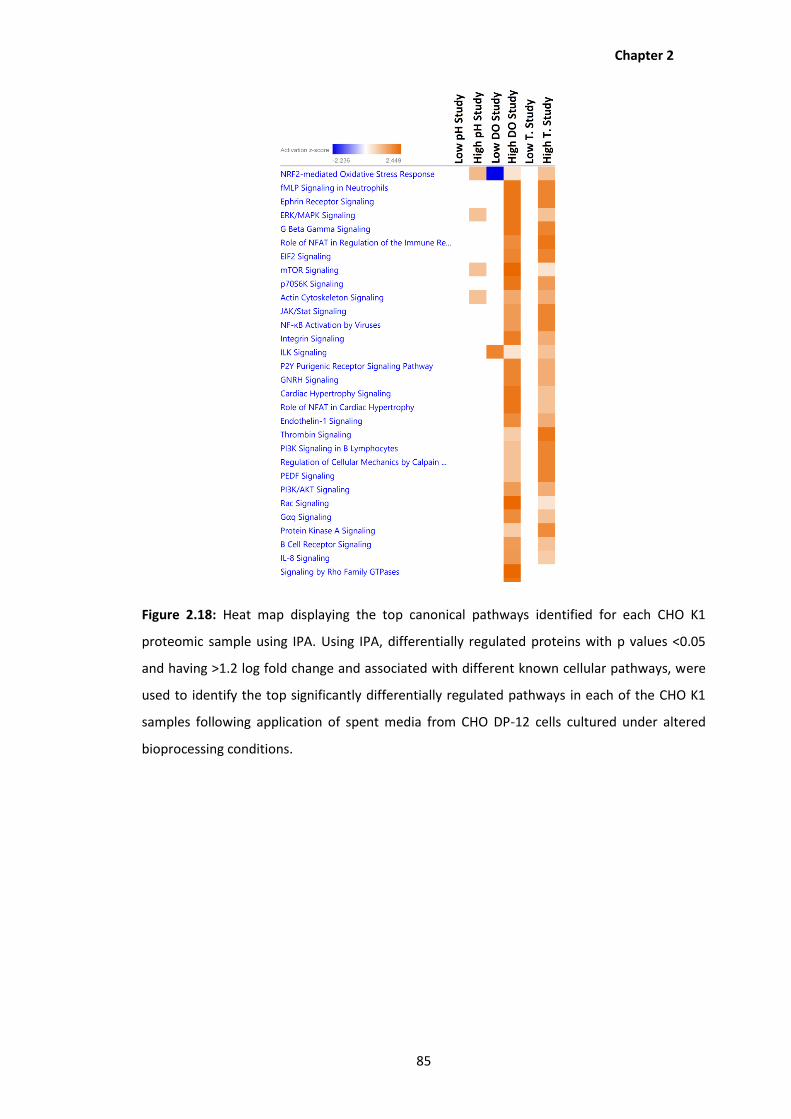
Chapter 2
85
Figure 2.18: Heat map displaying the top canonical pathways identified for each CHO K1
proteomic sample using IPA. Using IPA, differentially regulated proteins with p values <0.05
and having >1.2 log fold change and associated with different known cellular pathways, were
used to identify the top significantly differentially regulated pathways in each of the CHO K1
samples following application of spent media from CHO DP-12 cells cultured under altered
bioprocessing conditions.

Chapter 2
86
Table 2.6: Individual protein (|Z-score|> 2.0) associated with >10 differentially regulated
pathways observed following IPA analysis of CHO K1 proteomic data.
Gene Protein Biological Activity NFKB1 Nuclear factor NF-kappa-B p 105 subunit Transcription factor, endpoint of signal
transduction RRAS2 Ras-related protein R-Ras2 GTPase activity, intracellular protein
transport GNAI2 Guanine nucleotide-binding protein G (i)
subunit alpha-2 Transmembrane signalling, GTP-binding
GNAQ Guanine nucleotide-binding protein G (q) subunit alpha
Transmembrane signalling, GTP-binding
GNB2 Guanine nucleotide-binding protein G(1)/G(S)/G(T) subunit beta-2
Transmembrane signalling, GTP-binding
GNB4 Guanine nucleotide-binding protein subunit beta-4
Transmembrane signalling, GTP-binding
PPP2R2A Serine-threonine-protein phosphatase 2A 55 kDa regulatory subunit B alpha
Protein de-phosphorylation
2.4 Conclusions and Future Work
In this Chapter, a high pH low pH 2D LC-MS3 proteomic platform incorporating SPS-MS3 for
identification and quantitation of TMT sixplex labelled proteomic samples was applied for
determination of differentially regulated proteins and cellular pathways in CHO cells
undergoing altered bioprocessing. The platform was found to be highly reproducible and
capable of identification and quantitation of >6,200 protein groups with >1% FDR for all
sample sets, ensuring high confidence in the data acquired. However, based on the pathways
identified as having increased or decreased activity, it appears that proteomic analysis on its
own may not provide enough of an insight into the molecular activities of these CHO cells.
Many of the pathway changes observed were related to the activity of kinases, transcription
factors whose activity may be modulated by phosphorylation. Despite determination of
physical changes to their concentration, in the absence of phosphoproteome analysis an
assumption must be made in regards to their activity. Thus to truly understand the cellular
level activities of CHO cells producing recombinant therapeutics, a more global omics
approach would be useful, in particular the addition of metabolomics and phosphoproteomics
would be highly beneficial to gain a more in-depth understanding of these important
production systems. Furthermore, augmentation of bioinformatics resources for CHO, in line
with model systems such as human, mouse and rat, may enable more relevant biological
findings to be made. Finally, in order to determine whether the product is the process,
complementary characterisation of the therapeutic protein produced is required for a more
Chapter 2
87
thorough assessment of the impact of altered bioprocessing on therapeutic protein
production from CHO cell lines.
2.5 Author Contributions
Research study devised by Amy Farrell and Jonathan Bones; Bioprocessing of cell cultures
performed by Amy Farrell; Sample preparation performed by Amy Farrell; LC-MS analysis of
samples performed by Amy Farrell and Jenny Ho (Thermo Fisher Scientific, Hemel Hempstead,
UK); CHO DG44 proteome database was supplied by Somak Ray and Barry Karger (Barnett
Institute, Northeastern University, Boston, USA); Data analysis performed by Amy Farrell;
Chapter written by Amy Farrell and reviewed by Jonathan Bones.
2.6 References
1. Walsh, G., Biopharmaceutical benchmarks 2014. Nat Biotechnol, 2014. 32(10): p. 992-
1000.
2. Huang, S., et al., Fully humanized neutralizing antibodies to interleukin-8 (ABX-IL8)
inhibit angiogenesis, tumor growth, and metastasis of human melanoma. Am J Pathol,
2002. 161(1): p. 125-34.
3. Gonzalez, T.N., Leong, S. R., Presta, L. G., Humanized Anti-IL8 monoclonal antibodies.
September 12th 2000. [Accessed from http://www.google.com/patents/US6117980 on
12th June 2016.]. 2000.
4. Bar-Eli, M., Role of interleukin-8 in tumor growth and metastasis of human melanoma.
Pathobiology, 1999. 67(1): p. 12-8.
5. Nurnberg, W., et al., Expression of interleukin-8 detected by in situ hybridization
correlates with worse prognosis in primary cutaneous melanoma. J Pathol, 1999.
189(4): p. 546-51.
6. Scheibenbogen, C., et al., Serum interleukin-8 (IL-8) is elevated in patients with
metastatic melanoma and correlates with tumour load. Melanoma Res, 1995. 5(3): p.
179-81.

Chapter 2
88
7. Singh, R.K., et al., Expression of interleukin 8 correlates with the metastatic potential of
human melanoma cells in nude mice. Cancer Res, 1994. 54(12): p. 3242-7.
8. Singh, R.K., et al., Expression of interleukin-8 in primary and metastatic malignant
melanoma of the skin. Melanoma Res, 1999. 9(4): p. 383-7.
9. Ugurel, S., et al., Increased serum concentration of angiogenic factors in malignant
melanoma patients correlates with tumor progression and survival. J Clin Oncol, 2001.
19(2): p. 577-83.
10. Yang, X.D., et al., Fully human anti-interleukin-8 monoclonal antibodies: potential
therapeutics for the treatment of inflammatory disease states. J Leukoc Biol, 1999.
66(3): p. 401-10.
11. Bangsgaard, N., et al., Neutralization of IL-8 prevents the induction of dermatologic
adverse events associated with the inhibition of epidermal growth factor receptor.
PLoS One, 2012. 7(6): p. e39706.
12. Tappeiner, C., et al., New biologic drugs: anti-interleukin therapy. Dev Ophthalmol,
2012. 51: p. 79-89.
13. US National Institute of Health. ClinicalTrials.gov Identifier NCT02536469 - HuMax-IL8
(Interleukin8) in Patients with Advanced Malignant Solid Tumors. [Information
accessed from https://clinicaltrials.gov/ct2/show/NCT02536469 on 12th June 2016].
14. Wurm, F.M., Production of recombinant protein therapeutics in cultivated mammalian
cells. Nat Biotechnol, 2004. 22(11): p. 1393-8.
15. Furukawa, K. and K. Ohsuye, Enhancement of productivity of recombinant alpha-
amidating enzyme by low temperature culture. Cytotechnology, 1999. 31(1-2): p. 85-
94.
16. Moore, A., et al., Effects of temperature shift on cell cycle, apoptosis and nucleotide
pools in CHO cell batch cultues. Cytotechnology, 1997. 23(1-3): p. 47-54.
17. Trummer, E., et al., Process parameter shifting: Part I. Effect of DOT, pH, and
temperature on the performance of Epo-Fc expressing CHO cells cultivated in
controlled batch bioreactors. Biotechnol Bioeng, 2006. 94(6): p. 1033-44.
Chapter 2
89
18. Zhu, M.M., et al., Effects of elevated pCO2 and osmolality on growth of CHO cells and
production of antibody-fusion protein B1: a case study. Biotechnol Prog, 2005. 21(1): p.
70-7.
19. Xie, L. and D.I. Wang, High cell density and high monoclonal antibody production
through medium design and rational control in a bioreactor. Biotechnol Bioeng, 1996.
51(6): p. 725-9.
20. Castro, P.M., et al., Application of a statistical design to the optimization of culture
medium for recombinant interferon-gamma production by Chinese hamster ovary
cells. Appl Microbiol Biotechnol, 1992. 38(1): p. 84-90.
21. Sellick, C.A., et al., Metabolite profiling of recombinant CHO cells: designing tailored
feeding regimes that enhance recombinant antibody production. Biotechnol Bioeng,
2011. 108(12): p. 3025-31.
22. Kuystermans, D., M.J. Dunn, and M. Al-Rubeai, A proteomic study of cMyc
improvement of CHO culture. BMC Biotechnol, 2010. 10: p. 25.
23. Ku, S.C., et al., Effects of overexpression of X-box binding protein 1 on recombinant
protein production in Chinese hamster ovary and NS0 myeloma cells. Biotechnol
Bioeng, 2008. 99(1): p. 155-64.
24. Ku, S.C., et al., Regulation of XBP-1 signaling during transient and stable recombinant
protein production in CHO cells. Biotechnol Prog, 2010. 26(2): p. 517-26.
25. Baik, J.Y., et al., Metabolic engineering of Chinese hamster ovary cells: towards a
bioengineered heparin. Metab Eng, 2012. 14(2): p. 81-90.
26. Carlage, T., et al., Proteomic profiling of a high-producing Chinese hamster ovary cell
culture. Anal Chem, 2009. 81(17): p. 7357-62.
27. Lee, Y.Y., et al., Overexpression of heat shock proteins (HSPs) in CHO cells for extended
culture viability and improved recombinant protein production. J Biotechnol, 2009.
143(1): p. 34-43.
28. Lim, S.F., et al., RNAi suppression of Bax and Bak enhances viability in fed-batch
cultures of CHO cells. Metab Eng, 2006. 8(6): p. 509-22.
29. Wong, D.C., et al., Targeting early apoptotic genes in batch and fed-batch CHO cell
cultures. Biotechnol Bioeng, 2006. 95(3): p. 350-61.
Chapter 2
90
30. Yun, C.Y., et al., Specific inhibition of caspase-8 and -9 in CHO cells enhances cell
viability in batch and fed-batch cultures. Metab Eng, 2007. 9(5-6): p. 406-18.
31. Meleady, P., et al., Utilization and evaluation of CHO-specific sequence databases for
mass spectrometry based proteomics. Biotechnol Bioeng, 2012. 109(6): p. 1386-94.
32. Baycin-Hizal, D., et al., Proteomic analysis of Chinese hamster ovary cells. J Proteome
Res, 2012. 11(11): p. 5265-76.
33. Xu, X., et al., The genomic sequence of the Chinese hamster oveary (CHO)-K1 cell line.
Nature Biotechnology, 2011. 29(8):p. 735-41.
34. Tambor, V., et al., Proteomics and bioinformatics analysis reveal underlying pathways
of infection associated histologic chorioamnionitis in pPROM. Placenta, 2013. 34(2): p.
155-61.
35. Thermo Fisher Scientific Inc. 2014. Instructions: TMT mass tagging kits and reagents.
[ONLINE] Available at
https://tools.lifetechnologies.com/content/sfs/manuals/MAN0011639_TMT_Mass_Ta
gging_Reag_UG.pdf [Accessed 09 April 2015].
36. Liu, Z., et al., A quantitative proteomic analysis of cellular responses to high glucose
media in Chinese hamster ovary cells. Biotechnol Prog, 2015. 31(4): p. 1026-38.
37. Pacific Northwest National Laboratory. InfernoRDN v 1.1.5970. Downloaded from
https://omics.pnl.gov/software/infernordn on 20th May 2016.
38. Wu, S., et al., Employment of tandem mass spectrometry for the accurate and specific
identification of oligosaccharide structures. Anal Chem. 84(17): p. 7456-62.
39. Huang da, W., B.T. Sherman, and R.A. Lempicki, Bioinformatics enrichment tools: paths
toward the comprehensive functional analysis of large gene lists. Nucleic Acids Res,
2009. 37(1): p. 1-13.
40. Supek, F., et al., REVIGO summarizes and visualizes long lists of gene ontology terms.
PLoS One, 2011. 6(7): p. e21800.
41. Chuppa, S., et al., Fermentor temperature as a tool for control of high-density
perfusion cultures of mammalian cells. Biotechnol Bioeng, 1997. 55(2): p. 328-38.

Chapter 2
91
42. Fogolin, M.B., et al., Impact of temperature reduction and expression of yeast pyruvate
carboxylase on hGM-CSF-producing CHO cells. J Biotechnol, 2004. 109(1-2): p. 179-91.
43. Fox, S.R., et al., Maximizing interferon-gamma production by Chinese hamster ovary
cells through temperature shift optimization: experimental and modeling. Biotechnol
Bioeng, 2004. 85(2): p. 177-84.
44. Kaufmann, H., et al., Influence of low temperature on productivity, proteome and
protein phosphorylation of CHO cells. Biotechnol Bioeng, 1999. 63(5): p. 573-82.
45. Moulder, R., et al., Quantitative proteomics analysis of the nuclear fraction of human
CD4+ cells in the early phases of IL-4-induced Th2 differentiation. Mol Cell Proteomics,
2010. 9(9): p. 1937-53.
46. Link, T., et al., Bioprocess development for the production of a recombinant MUC1
fusion protein expressed by CHO-K1 cells in protein-free medium. J Biotechnol, 2004.
110(1): p. 51-62.
47. Unwin, R.D., et al., Quantitative proteomics reveals posttranslational control as a
regulatory factor in primary hematopoietic stem cells. Blood, 2006. 107(12): p. 4687-
94.
48. Salem, M., et al., Proteomic signature of muscle atrophy in rainbow trout. J
Proteomics, 2010. 73(4): p. 778-89.
49. Dowling, P., et al., Proteomic screening of glucose-responsive and glucose non-
responsive MIN-6 beta cells reveals differential expression of proteins involved in
protein folding, secretion and oxidative stress. Proteomics, 2006. 6(24): p. 6578-87.
50. Borys, M.C., D.I. Linzer, and E.T. Papoutsakis, Culture pH affects expression rates and
glycosylation of recombinant mouse placental lactogen proteins by Chinese hamster
ovary (CHO) cells. Biotechnology (N Y), 1993. 11(6): p. 720-4.
51. Baik, J.Y., et al., Initial transcriptome and proteome analyses of low culture
temperature-induced expression in CHO cells producing erythropoietin. Biotechnol
Bioeng, 2006. 93(2): p. 361-71.
52. Kantardjieff, A., et al., Transcriptome and proteome analysis of Chinese hamster ovary
cells under low temperature and butyrate treatment. J Biotechnol, 2010. 145(2): p.
143-59.

Chapter 2
92
53. Yoon, S.K., S.H. Kim, and G.M. Lee, Effect of low culture temperature on specific
productivity and transcription level of anti-4-1BB antibody in recombinant Chinese
hamster ovary cells. Biotechnol Prog, 2003. 19(4): p. 1383-6.
54. Yee, J.C., et al., Genomic and proteomic exploration of CHO and hybridoma cells under
sodium butyrate treatment. Biotechnol Bioeng, 2008. 99(5): p. 1186-204.
55. Lee, M.S., et al., Proteome analysis of antibody-expressing CHO cells in response to
hyperosmotic pressure. Biotechnol Prog, 2003. 19(6): p. 1734-41.
56. McAlister, G.C., et al., MultiNotch MS3 enables accurate, sensitive, and multiplexed
detection of differential expression across cancer cell line proteomes. Anal Chem, 2014.
86(14): p. 7150-8.
57. Rathore, A.S. and H. Winkle, Quality by design for biopharmaceuticals. Nat Biotechnol,
2009. 27(1): p. 26-34.
58. Furukawa, K. and K. Ohsuye, Effect of culture temperature on a recombinant CHO cell
line producing a C-terminal alpha-amidating enzyme. Cytotechnology, 1998. 26(2): p.
153-64.

Chapter 3
93
3.0
Characterisation of Monoclonal Antibodies
Following Production under Altered
Bioprocessing Conditions
3.1 Introduction
Recombinant monoclonal antibodies (mAbs) are well-established pharmacological
therapeutics featuring high specificity to target antigens, long serum half-life in humans and
capabilities for the treatment of a wide range of ailments, such as inflammatory diseases and
cancer. MAbs are large tetrameric glycoproteins, structurally composed of four polypeptide
chains: two identical heavy chains (~50 kDa in size) and two identical light chains (~25 kDa in
size), connected via disulfide bonds at their hinge region. Each mAb comprises of two variable
antigen-binding fragments (Fab) and a crystallisable fragment (Fc), responsible for effector
function via interaction with the Fcγ receptor family. [1] Inherently heterogeneous
biomolecules, mAbs may undergo a broad range of both enzymatic and non-enzymatic
modifications during biopharmaceutical production. [2] Protein modifications have the
potential to alter the safety and efficacy profile of mAbs by impacting protein binding,
reducing drug activity and giving rise to adverse toxicological and immunological responses in-
vivo. [3] Consequently, therapeutic protein characterisation is an essential component of drug
development and manufacture, as outlined in the U.S. Food and Drug Administration’s
initiatives including pharmaceutical cGMPs for the 21st century [4], process analytical
technology (PAT) [5] and the International Conference on Harmonisation (ICH) tripartite
guidelines on product development and quality. [6, 7] Critical quality attributes (CQAs) that
must be determined include protein identity (primary sequence), and frequently encountered
host cell- and process-related modifications including deamidation, oxidation, N-terminal
glutamine cyclization, C-terminal lysine truncation, glycosylation, isomerisation and
incomplete disulfide bond formation. [8] Combinations of these modifications have been
theorised to result in 108 potential mAb variants for each therapeutic mAb, [9] resulting in
biomolecules with differences in size, charge, hydrophobicity, structure and potentially,
therapeutic function. As no single analytical technique exists to determine all of these

Chapter 3
94
attributes, a wide range of analytical technologies are required for the complete
characterisation of therapeutic mAbs.
Biophysical properties, including heterogeneity in size, net charge of the biomolecule and
hydrophobic properties are most commonly determined using chromatographic techniques
coupled with ultra-violet (UV) detection. Size exclusion chromatography (SEC-UV) is the most
widely applied method for the determination of protein aggregation and formation of particles
in response to structural, environmental and bioprocessing factors. [10] Concerns regarding
the potential of protein aggregates to produce immunogenic reactions and alter the actual
dosing concentration of drug substances, have led to interest in alternative methods for
evaluating aggregation concentrations. [3] Hence complementary techniques, such as
analytical ultracentrifugation (AUC) and hydrophobic interaction chromatography (HIC-UV)
have been evaluated. HIC has shown promise for the determination of mAb isoforms including
small aggregates (1- 10 µm), which are undetectable using SEC-UV. [11] Additionally, HIC has
been applied for monitoring of modifications such as methionine or tryptophan oxidations,
which result in a change in mAb hydrophobicity. [11] Ion exchange chromatography (IEX-UV),
or more frequently, cation exchange chromatography (SCX-UV) using either a salt or pH
separation gradient, is the gold standard for determination of the charge variant profile of
therapeutic mAbs. [12] Different charge variants of mAbs may be formed as a result of a
variety of modifications including C-terminal lysine processing of the mAb heavy chain,
deamidation of asparagine or glutamine, cyclisation of N-terminal glutamic acid to form
pyroglutamate and peptide bond cleavage. [2]
Although chromatographic techniques are useful for the evaluation of potential changes to
mAb sequence, they are not capable of identifying exact sequence changes, determining
alterations to protein mass or of evaluating the relative concentration of mAb variants. High
resolution mass spectrometry (MS) is a key technique for biotherapeutic characterisation,
capable of providing sequence-level information that is crucial for the evaluation of
therapeutic protein quality. Three general approaches are used for reversed-phase liquid
chromatography-mass spectrometry, namely top-down, middle-down and peptide mapping
strategies. Top-down approaches involve the analysis of intact mAb species and are capable of
evaluating changes to protein mass caused by sequence modification and determination of
post-translational modifications, e.g. glycosylation. However, top-down strategies frequently
suffer from low sensitivity due to poor ionisation efficiencies of large biomolecules and low
sequence coverage caused by poor fragmentation of peptide bonds in complex
biotherapeutics. [13-15] Middle-down analysis of mAbs refers to the mass measurements of

Chapter 3
95
mAb subunits following limited proteolysis to generate polypeptides that are more amenable
to chromatographic separation and have higher MS ionisation efficiencies when compared to
the large intact biomolecule (~150 kDa). Proteolytic enzymes Lys-C [16] and papain [17] have
been applied for mAb subunit generation, however, the recently discover IdeS
(immunoglobulin-degrading enzyme of Streptococcus pyrogenes) is fast becoming the go-to
protease for middle-down analysis due to its simple, rapid and robust digestion procedure and
high specificity, cleaving at the mAb hinge region between two glycine amino acid residues in
IgG1. [18, 19] IdeS digestion is frequently followed by disulfide bond reduction to generate
light chain (LC), scFc and Fd’ fragments as depicted in Figure 3.6. Middle down analysis may be
applied for determination of changes to mAbs, wherein protein mass has been altered (e.g.
from amino acid insertions or deletions or following sequence level modifications).
Peptide mapping of mAbs is the most common approach for determination of protein amino
acid sequence, [20] and generally involves initial protein denaturation using reagents such as
guanidine-HCl, dithiothreitol or tris(2-carboxyethyl)phosphine (TCEP), followed by digestion
with one or more proteases (e.g. trypsin or Lys-C). [12] Resulting peptides may be analysed
using LC-MS/MS, enabling the identification of sequence-level modifications that result in
distinctive mass shifts upon data analysis (e.g. N-terminal pyroglutamate results in a mass
reduction of 17 Da). [2] Recent advances in high resolution MS instrumentation have
significantly increased the power of this technique by enabling the determination of small
mass shifts corresponding to peptide modifications that may impact product quality, such as
an increase in peptide mass of 0.984 Da corresponding to deamidation of an amino acid
residue. [21] Using peptide mapping, the quantity of a modified peptide relative to the total
amount of that peptide in a therapeutic protein sample may be deduced.
In this Chapter, characterisation of anti-interleukin 8 IgG1 (anti-IL8) produced from CHO DP-12
cells processed under altered conditions of temperature, pH or dissolved oxygen (DO), is
described. Comparative analysis of anti-IL8 produced under altered conditions and anti-IL8
produced using standard bioprocessing conditions, may reveal changes to the primary
sequence of recombinant mAbs that could be attributed to the change in the bioprocess used
for their production. Hence application of chromatographic and mass spectrometry techniques
may enable a better understanding of the role of bioprocessing in achieving desired protein
critical quality attributed essential for recombinant therapeutic protein safety, quality and
efficacy.

Chapter 3
96
3.2 Experimental
3.2.1 Reagents and Consumables
Phosphate buffered saline (PBS), dithiothreitol (DTT), iodoacetamide (IAA), ammonium
bicarbonate (ABC), L-arginine, guanidine-hydrochloride, tris(2-carboxyethyl)phosphine (TCEP),
Trizma-hydrochloride (Tris), sodium phosphate dibasic (Na2HPO4), sodium phosphate
monobasic (NaH2PO4), sodium chloride (NaCl), ammonium sulphate ((NH4)2SO4) and Amicon
Ultra centrifugal filter units 10 kDa MWCO were obtained from Sigma Aldrich (Wicklow,
Ireland). Water (LC-MS Optima), water, 0.1% (v/v) formic acid (LC-MS Optima) and
acetonitrile, 0.1% (v/v) formic acid (LC-MS Optima) were purchased from Fisher Scientific. CX-
1, pH gradient buffer A (pH 5.6), CX-1, pH gradient buffer B (pH 10.2), BCA assay kit and 0.45
µm and 0.2 µm bottle top filter units were acquired from Thermo Fisher Scientific (Dublin,
Ireland). Promega sequencing grade modified trypsin was from MyBio Ltd. (Kilkenny, Ireland).
FabRICATOR (IdeS) was purchased from Genovis (Lund, Sweden).
3.2.2 Purification of Anti-IL 8 from CHO DP12
Anti-IL8 mAb was produced in Sartorius Cultibag disposable bioreactors as outlined in Chapter
2, Section 2.2.2.5. Spent media from CHO DP-12 cell culture were retrieved from -80oC freezer
and thawed before clarification of media samples by sequential filtration through 0.45 µm and
0.2 µm syringe filters (VWR). Samples of clarified media were then passed through a HiTrap
Protein A column (GE Healthcare) at a flow rate of 1 mL.min-1 and subsequently washed with
PBS to ensure complete removal of all unretained material. Elution of anti-IL8 from the Protein
A column was performed using 100 mM arginine, pH 3.5. The pH of eluate, collected in
Amicon Ultra centrifugal filter units with a 10 kDa cut-off membrane (Sigma Aldrich), was
neutralized using 0.5 M Tris buffer and buffer-exchanged into PBS (4,000 rpm for 20 min). An
aliquot of the concentrated and buffer exchanged IgG1 sample was assayed for IgG content
using a BCA protein assay. The remainder of the samples were divided into 100 µg portions
and stored at -30oC pending further analysis.
3.2.3 Size Exclusion Chromatography
SEC-UV analysis was performed on a Vanquish Flex UHPLC (Thermo Scientific) using a diode
array detector at 280 nm. The presence protein aggregates, monomers and fragment moieties
Chapter 3
97
was determined using a MAbPacTM SEC-1, 5 µm, 300 Å, 4.0 x 300 mm analytical column
(Thermo Scientific) under isocratic conditions of 50mM sodium phosphate buffer, 300 mM
NaCl, pH 6.8 at 0.2 mL.min-1 for 25 minutes. The column temperature was 30oC. Triplicate
analysis of 10 µg of each mAb sample was performed. Chromeleon version 7.2 software was
used for data acquisition and analysis.
3.2.4 Cation Exchange Chromatography
Charge variant analysis of intact mAb was performed using a Vanquish Flex UHPLC using a
diode array detector at 280 nm. pH gradient based separation on a MAbPacTM SCX-10 RS
analytical column, 5 µm, 2.1 x 50 mm (Thermo Scientific) using CX-1 pH gradient buffer A, pH
5.6 and CX-1 pH gradient buffer B, pH 10.2 (Thermo scientific). Elution of sample peaks was
achieved using a linear gradient of 35 - 55% CX-1 pH gradient buffer B, pH 10.2 in 30 minutes.
Column temperature was 25oC and flow rate was 0.5 mL.min-1. Chromeleon version 7.2
software was used for data acquisition and analysis.
3.2.5 Hydrophobic Interaction Chromatography
HIC-UV analysis was performed on a Vanquish Flex UHPLC using a diode array detector at 280
nm. To achieve sufficient separation of mAb species, two MabPacTM HIC-10, 5 µm, 4.6 x 100
mm analytical columns (Thermo Scientific) were set up in sequence. Separation buffers used
were 2 M ammonium sulphate, 100 mM sodium phosphate, pH 7.0 (A) and 100 mM sodium
phosphate, pH 7.0 (B). Gradient conditions were as follows: 60% B for 2 minutes followed by
an increase to 100% B over 38 minutes; solvent composition was maintained at 100% B for 5
minutes before reduction to 60% B in 0.1 minute; column equilibration was achieved over 6
minutes. Column temperature was maintained at 30oC. Flow rate was 1.0 mL.min-1. Triplicate
analysis of 25 µg of each mAb sample was performed. Chromeleon version 7.2 software was
used for data acquisition and analysis.
3.2.6 Middle Down Analysis of IdeS-digested mAb
One µL of the FacRICATOR enzymatic digestion solution (67 units IdeS µL-1 in Optima grade
water) was combined with 50 µL of anti-IL8 in PBS (~100 µg) and incubated at 37°C for 2 hours
at 500 rpm using an Eppendorf Thermomixer. Reduction of disulphide bonds was achieved

Chapter 3
98
with 4 M guanidine hydrochloride/ 50 mM TCEP for 45 minutes at 56oC. Following incubation,
samples were reduced to dryness via vacuum centrifugation. Each sample was reconstituted in
100 µL 0.1% formic acid in water. Middle down analyses were perfromed using a MabPacTM
RP, 4 µm, 2.1 x 100 mm analytical column on a Vanquish UHPLC coupled to a Q Exactive HF
mass spectrometer (Thermo Fisher Scientific, Bremen, Germany). Separation of mAb subunits
was performed using a binary gradient of 0.1% (v/v) formic acid in water (C) and 0.1% (v/v)
formic acid in acetonitrile (D). Gradient conditions were as follows: 25% D initially for one
minute, increased to 32% D in 15 minutes with a further increase to 80% D in one minute with
a one minute isocratic hold. Initial conditions were restored in 0.5 minutes and held for an
additional 9.5 minutes to ensure column re-equilibration. The column temperature was
maintained at 80oC throughout and flow rate was sustained at 250 µL.min-1. The mass
spectrometer was operated in positive ion mode with MS scans ranging from 600 to 2400 m/z
with a mass resolution of 240,000 at m/z 400. Briefly, MS instrumental paramters were set as
follows: spray voltage was 3.8 kV sheath gas flow rate was 25 arbitrary units (AU), auxillary gas
flow rate was 10 AU, spray current was 13 µA, capillary temperature was 320oC. Data was
processed using Biopharma Finder version 1.0.76.10, using the Auto Xtract algorithm set to
deconvolute spectra with a charge of 5 to 50 in the range 600 to 2000 m/z. Biopharma Finder
software is an informatics platform used for the analysis of protein characterisation data
acquired on Thermo Fisher Scientific mass spectrometers. Biopharma Finder enables the
confirmation of amino acid sequence, identification of the site and type of post translational
modifications and facilitates the determintion of relative amounts of mAb peptide varients.
3.2.7 Peptide Mapping
Peptide sequence mapping of anti-IL-8 IgG1 samples was performed on a Vanquish UHPLC
coupled to a Q Exactive Plus mass spectrometer (Thermo Fisher Scientific, Bremen, Germany).
Sample preparation was performed using the filter-aided sample preparation (FASP) method
described previously. [22] 50 µg of mAb was diluted in 8 M urea in 100 mM Tris-HCl and added
to a pre-rinsed 10 kDa MWCO filters. Samples were reduced with 5 mM DTT at 65oC for 30
minutes, before alkylation with 15 mM IAA for 30 minutes at 20oC in darkness. Following
buffer exchange into 50 mM ABC, enzymatic digestion was performed overnight with trypsin
at 37oC using a 1:50 (w/w, enzyme: protein) ratio. Samples were eluted from the filters by
centrifugation and subsequently reduced to dryness via vacuum centrifugation.
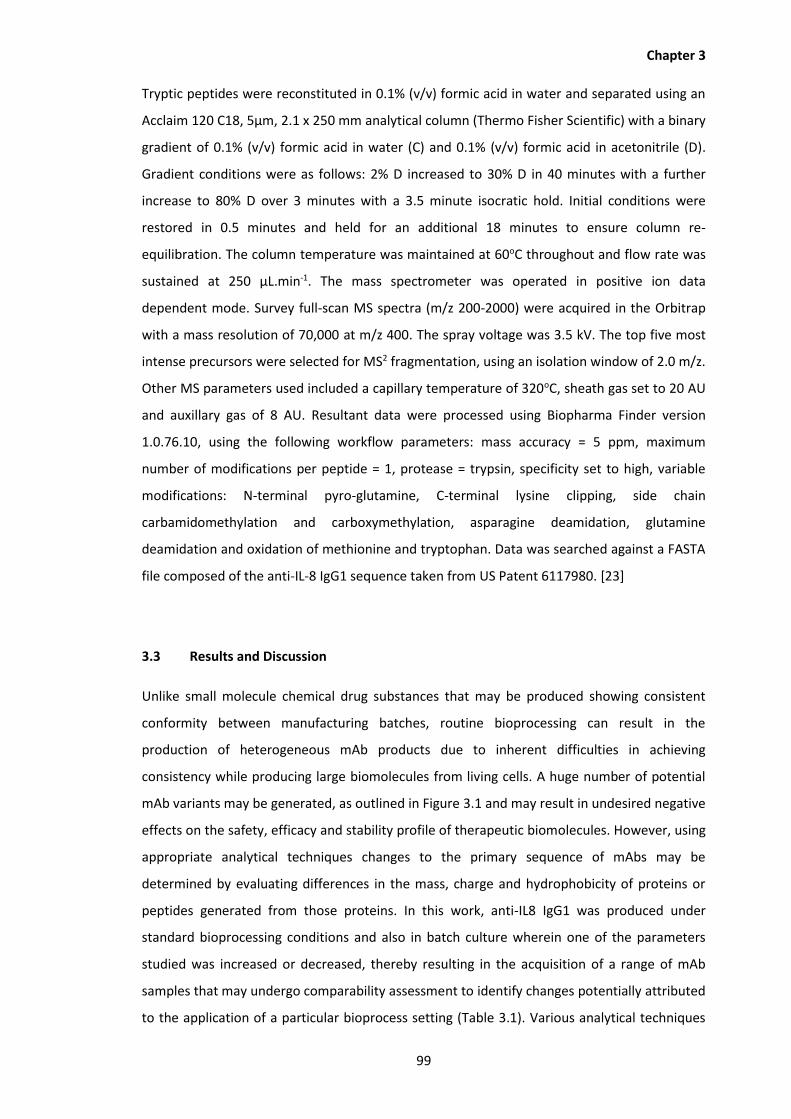
Chapter 3
99
Tryptic peptides were reconstituted in 0.1% (v/v) formic acid in water and separated using an
Acclaim 120 C18, 5µm, 2.1 x 250 mm analytical column (Thermo Fisher Scientific) with a binary
gradient of 0.1% (v/v) formic acid in water (C) and 0.1% (v/v) formic acid in acetonitrile (D).
Gradient conditions were as follows: 2% D increased to 30% D in 40 minutes with a further
increase to 80% D over 3 minutes with a 3.5 minute isocratic hold. Initial conditions were
restored in 0.5 minutes and held for an additional 18 minutes to ensure column re-
equilibration. The column temperature was maintained at 60oC throughout and flow rate was
sustained at 250 µL.min-1. The mass spectrometer was operated in positive ion data
dependent mode. Survey full-scan MS spectra (m/z 200-2000) were acquired in the Orbitrap
with a mass resolution of 70,000 at m/z 400. The spray voltage was 3.5 kV. The top five most
intense precursors were selected for MS2 fragmentation, using an isolation window of 2.0 m/z.
Other MS parameters used included a capillary temperature of 320oC, sheath gas set to 20 AU
and auxillary gas of 8 AU. Resultant data were processed using Biopharma Finder version
1.0.76.10, using the following workflow parameters: mass accuracy = 5 ppm, maximum
number of modifications per peptide = 1, protease = trypsin, specificity set to high, variable
modifications: N-terminal pyro-glutamine, C-terminal lysine clipping, side chain
carbamidomethylation and carboxymethylation, asparagine deamidation, glutamine
deamidation and oxidation of methionine and tryptophan. Data was searched against a FASTA
file composed of the anti-IL-8 IgG1 sequence taken from US Patent 6117980. [23]
3.3 Results and Discussion
Unlike small molecule chemical drug substances that may be produced showing consistent
conformity between manufacturing batches, routine bioprocessing can result in the
production of heterogeneous mAb products due to inherent difficulties in achieving
consistency while producing large biomolecules from living cells. A huge number of potential
mAb variants may be generated, as outlined in Figure 3.1 and may result in undesired negative
effects on the safety, efficacy and stability profile of therapeutic biomolecules. However, using
appropriate analytical techniques changes to the primary sequence of mAbs may be
determined by evaluating differences in the mass, charge and hydrophobicity of proteins or
peptides generated from those proteins. In this work, anti-IL8 IgG1 was produced under
standard bioprocessing conditions and also in batch culture wherein one of the parameters
studied was increased or decreased, thereby resulting in the acquisition of a range of mAb
samples that may undergo comparability assessment to identify changes potentially attributed
to the application of a particular bioprocess setting (Table 3.1). Various analytical techniques
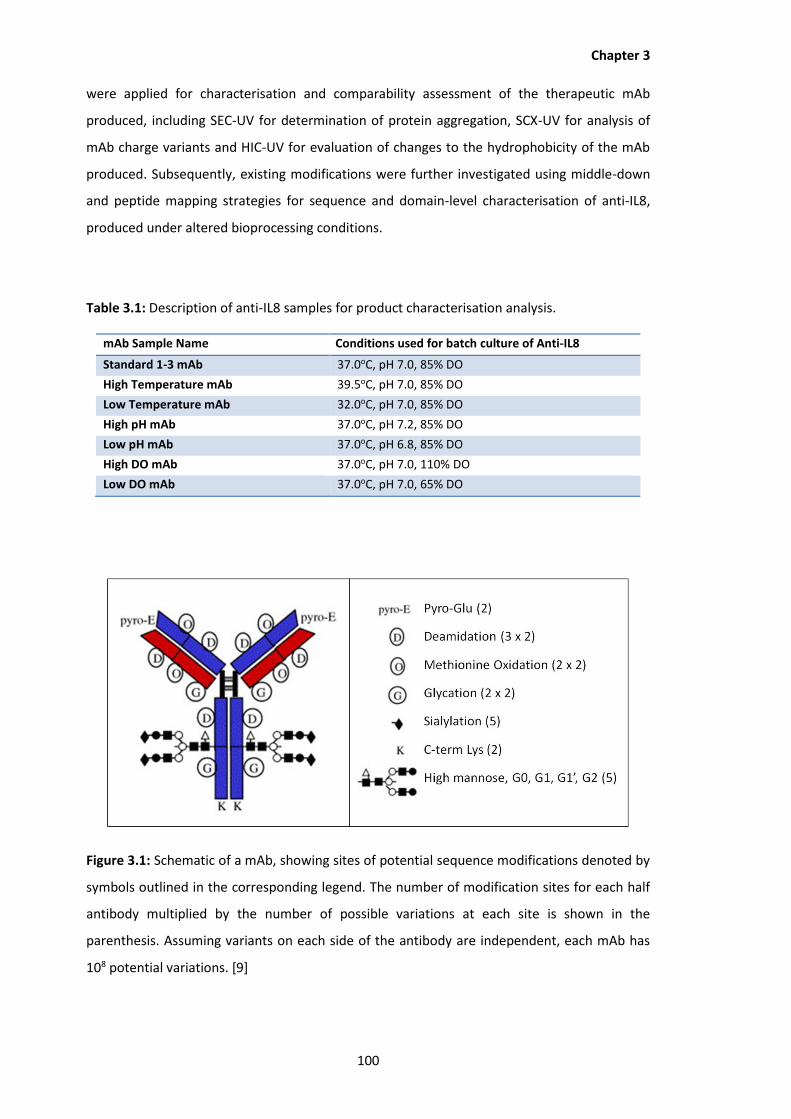
Chapter 3
100
were applied for characterisation and comparability assessment of the therapeutic mAb
produced, including SEC-UV for determination of protein aggregation, SCX-UV for analysis of
mAb charge variants and HIC-UV for evaluation of changes to the hydrophobicity of the mAb
produced. Subsequently, existing modifications were further investigated using middle-down
and peptide mapping strategies for sequence and domain-level characterisation of anti-IL8,
produced under altered bioprocessing conditions.
Table 3.1: Description of anti-IL8 samples for product characterisation analysis.
mAb Sample Name Conditions used for batch culture of Anti-IL8
Standard 1-3 mAb 37.0oC, pH 7.0, 85% DO
High Temperature mAb 39.5oC, pH 7.0, 85% DO
Low Temperature mAb 32.0oC, pH 7.0, 85% DO
High pH mAb 37.0oC, pH 7.2, 85% DO
Low pH mAb 37.0oC, pH 6.8, 85% DO
High DO mAb 37.0oC, pH 7.0, 110% DO
Low DO mAb 37.0oC, pH 7.0, 65% DO
Figure 3.1: Schematic of a mAb, showing sites of potential sequence modifications denoted by
symbols outlined in the corresponding legend. The number of modification sites for each half
antibody multiplied by the number of possible variations at each site is shown in the
parenthesis. Assuming variants on each side of the antibody are independent, each mAb has
108 potential variations. [9]

Chapter 3
101
3.3.1 Intact Anti-IL8 Analysis
Size exclusion chromatography (SEC) is frequently applied for the evaluation of protein
aggregation due to its simplicity, low cost and low sample requirements. [24-26]
Administration of protein aggregates have the potential to cause adverse immune responses
in patients and hence levels of protein aggregation is a CQA that must be monitored in
biotherapeutic proteins. [27] Cleavage of peptide bonds to produce smaller subunit fragments
and/or subsequent erroneous re-formation of mAb tertiary structure and creation of dimers
or trimers may be indicated by separation of non-monomeric species using SEC. [28] Other
sequence-level modifications that may be highlighted using SEC include the oxidation of
tryptophan residues, which reportedly result in the earlier elution of mAbs from SEC columns,
attributed to a reduction in non-specific hydrophobic stationary phase interactions rather than
a change in mAb size. [29] To determine changes to the aggregation profile of anti-IL8 in
response to altered bioprocessing conditions, triplicate analysis of each of the samples
produced were performed using the method outlined in Section 3.2.3. Following SEC analysis,
chromatographic peaks were integrated to determine the % area of the monomer and
aggregate peaks. Corresponding results are shown in Table 3.2. Size-related heterogeneity
observed across all samples following SEC-UV analysis was found to be comparable, with levels
of differentially sized species ranging from 0.18 – 0.34% of the entire mAb sample. From the
results obtained using SEC analysis it may deduced that the levels of protein aggregation are
not widely impacted by production within the range of bioprocessing parameters investigated.
Table 3.2: Results from SEC-UV analysis of differentially produced mAb samples (n=3).
Replicate 1 Replicate 2 Replicate 3
Sample % Area of Monomer
% Area of Aggregate
% Area of Monomer
% Area of Aggregate
% Area of Monomer
% Area of Aggregate
Standard 1 99.72 0.28 99.73 0.27 99.72 0.28
Standard 2 99.75 0.25 99.75 0.25 99.74 0.26 Standard 3 99.70 0.30 99.70 0.30 99.70 0.30 High T mAb 99.68 0.32 99.67 0.33 99.66 0.34 Low T mAb 99.72 0.28 99.72 0.28 99.73 0.27
High DO mAb 99.69 0.31 99.70 0.30 99.70 0.30 Low DO mAb 99.77 0.23 99.76 0.24 99.77 0.23 High pH mAb 99.70 0.30 99.71 0.29 99.69 0.31 Low pH mAb 99.82 0.18 99.80 0.20 99.78 0.22

Chapter 3
102
Charge-related microheterogeneity of mAbs is frequently observed following bioprocessing
due to both enzymatic processes and non-enzymatic degradation of therapeutic proteins. [30]
Chemical modifications, such as deamidations and impart a negative charge onto mAbs
thereby decreasing their isoelectric point (pI) and resulting in the formation of acidic mAb
variants. [31, 32] Similarly, C-terminal cleavage of lysine residues results in the loss of
positively charged amino acids on the mAb also creating acidic protein variants. [33]
Conversely, the presence of one or more lysine amino acids or oxidation of mAb residues may
result in an increase in mAb pI value and thus in the formation of basic mAb variants. [34, 35]
To determine the charge variant profile of anti-IL8 IgG1 samples following production using
different bioprocessing parameters, triplicate SCX-UV analysis of each mAb sample was
performed enabling the separation of species according to differences in their pI. A number of
distinct peaks, in addition to the main mAb peak, were observed in resulting chromatograms
indicating the existence of greater than seven mAb variants within each sample, (Figures 3.2
and 3.3). Chromatographic peaks were integrated manually and the area of each peak as a
percentage of the total area was calculated (Table 3.3). Large disparities between the charge
variant profiles for all of the samples were observed potentially relating to a variety of mAb
modifications including asparagine deamidation, oxidation of methionine, tryptophan
oxidation, glycation, sialylation and non-classical disulfide bond formation. [36] Two likely mAb
variants include moieties incorporating either one or two C-terminal lysine residues, which are
known to produce distinctive peaks eluting after the main mAb peak upon SCX analysis, such
as those observed in the chromatograms shown in Figures 3.2 and 3.3. [37] Samples produced
at pH 7.2 displayed higher levels of both acidic and basic variants, while samples produced at
110% DO, pH 6.8 and 39.5oC resulted in an observed reduction in both acidic and basic
variants when compared to mAb produced at standard conditions. In agreement with Zhang et
al. [38] we determined a decrease in acidic variants and an increase in basic variant profile in
mAb produced from batch culture maintained at 32.0oC when compared to mAb generated in
culture at 37.0oC.
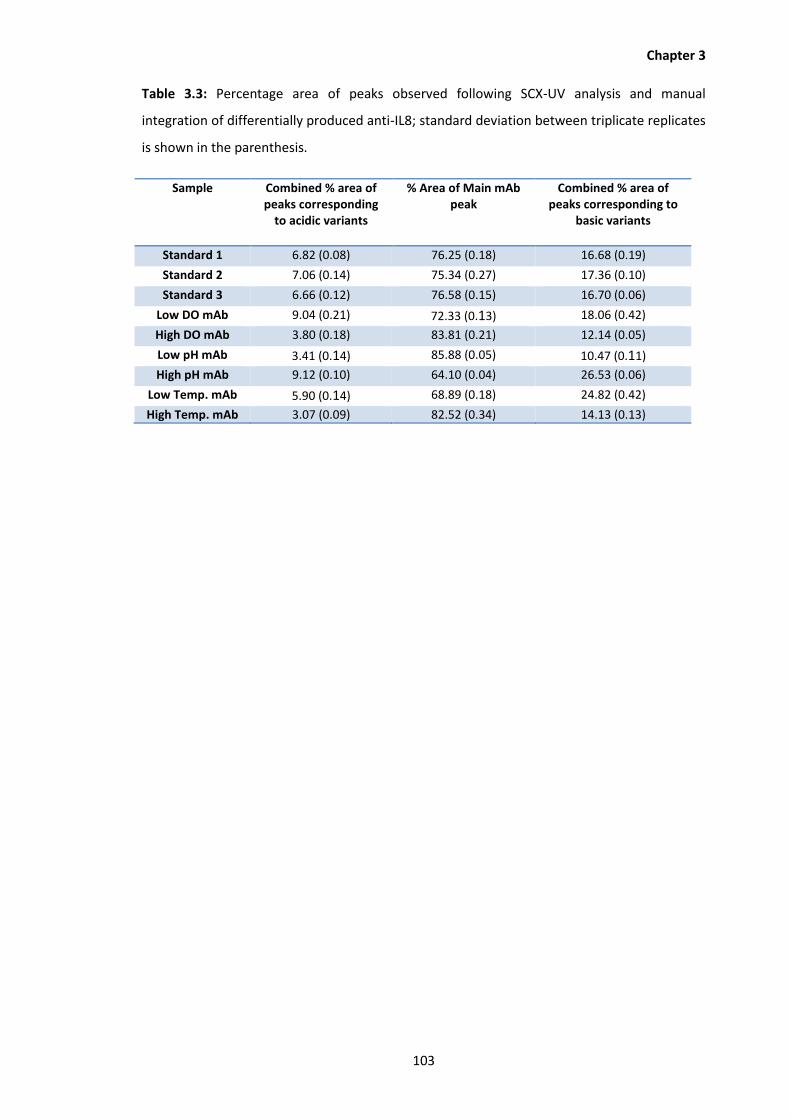
Chapter 3
103
Table 3.3: Percentage area of peaks observed following SCX-UV analysis and manual
integration of differentially produced anti-IL8; standard deviation between triplicate replicates
is shown in the parenthesis.
Sample Combined % area of peaks corresponding
to acidic variants
% Area of Main mAb peak
Combined % area of peaks corresponding to
basic variants
Standard 1 6.82 (0.08) 76.25 (0.18) 16.68 (0.19)
Standard 2 7.06 (0.14) 75.34 (0.27) 17.36 (0.10)
Standard 3 6.66 (0.12) 76.58 (0.15) 16.70 (0.06)
Low DO mAb 9.04 (0.21) 72.33 (0.13) 18.06 (0.42)
High DO mAb 3.80 (0.18) 83.81 (0.21) 12.14 (0.05)
Low pH mAb 3.41 (0.14) 85.88 (0.05) 10.47 (0.11)
High pH mAb 9.12 (0.10) 64.10 (0.04) 26.53 (0.06)
Low Temp. mAb 5.90 (0.14) 68.89 (0.18) 24.82 (0.42)
High Temp. mAb 3.07 (0.09) 82.52 (0.34) 14.13 (0.13)
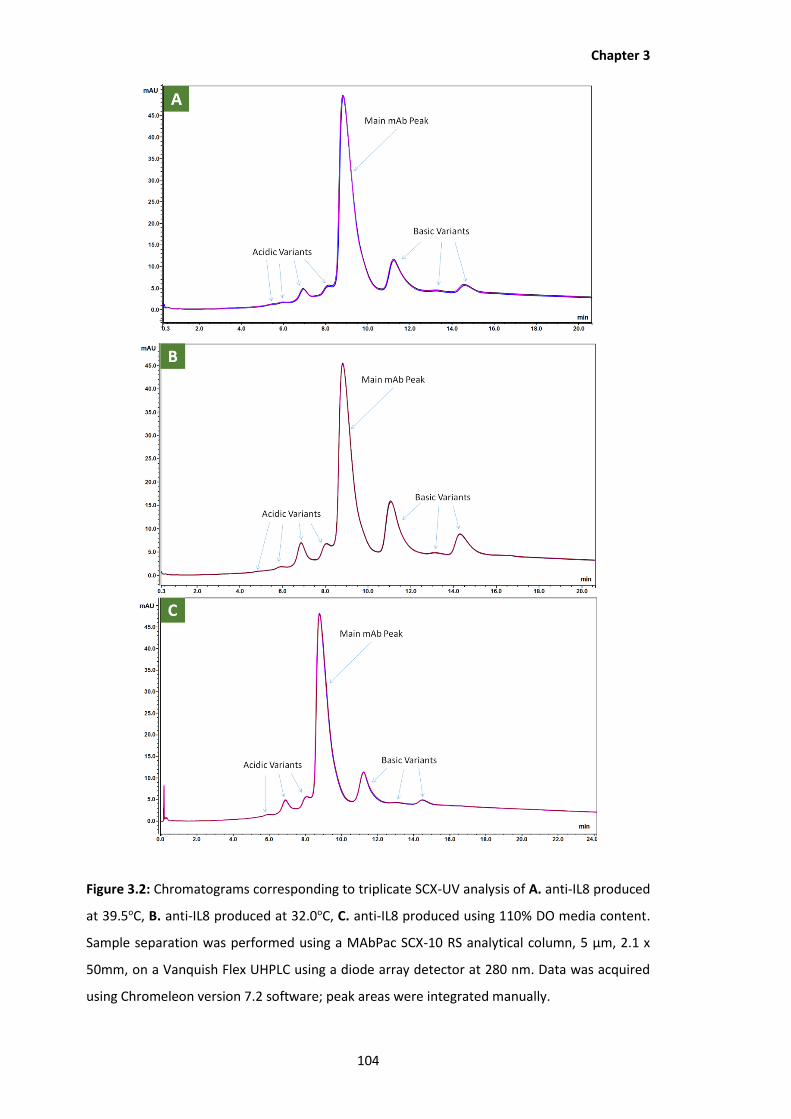
Chapter 3
104
Figure 3.2: Chromatograms corresponding to triplicate SCX-UV analysis of A. anti-IL8 produced
at 39.5oC, B. anti-IL8 produced at 32.0oC, C. anti-IL8 produced using 110% DO media content.
Sample separation was performed using a MAbPac SCX-10 RS analytical column, 5 µm, 2.1 x
50mm, on a Vanquish Flex UHPLC using a diode array detector at 280 nm. Data was acquired
using Chromeleon version 7.2 software; peak areas were integrated manually.

Chapter 3
105
Figure 3.3: Chromatograms corresponding to SCX-UV analysis (n=3) of A. anti-IL8 produced
using 60% DO media content, B. mAb produced at pH 7.2, C. mAb produced at pH 6.8. Sample
separation was performed using a MAbPac SCX-10 RS analytical column, 5 µm, 2.1 x 50mm, on
a Vanquish Flex UHPLC using a diode array detector at 280 nm. Data was acquired using
Chromeleon version 7.2 software; peak areas were integrated manually.

Chapter 3
106
In addition to evaluating mAb microheterogeneity in terms of charge and size, separation of
mAb variants according to their over-all hydrophobicity is now commonly applied for
characterisation of therapeutic mAb products. Unlike reversed-phase chromatography, which
also separates molecules based on hydrophobicity, HIC enables the elucidation of additional
mAb characteristics as retention of biomolecules on the HIC column matrix is solely attributed
to interaction with amino acid residues on the surface of the molecule and hence differences
in HIC retention profile may allude to changes in mAb tertiary structure. [11] Many common
modifications may potentially alter mAb hydrophobicity, most notable oxidation of
methionine or tryptophan, [39, 40] but also aspartic acid isomerization, formation of cyclic
imide and domain misfolding. [11] To determine the hydrophobicity profile of anti-IL8 mAb in
response to altered bioprocessing conditions of temperature, pH and DO, triplicate analysis of
all produced mAb samples (Table 3.1) were performed using the method outlined in Section
3.2.5. Resulting chromatograms produced for each of the mAb samples cultured under altered
bioprocessing conditions are shown in Figures 3.4 and 3.5. Peaks were integrated to
determine the percentage area of the main peak relative to all peaks in the chromatogram;
corresponding data is shown in Table 3.4. The most notable changes were observed for anti-
IL8 produced at 110% DO and pH 6.8, both of which showed less heterogeneity in mAb
hydrophobicity than mAb produced under standard conditions, and also for mAb produced at
pH 7.2, as this sample was found to contain species with a wide range of hydrophobicities
when compared to mAb generated from standard cell culture conditions. These differences
may signify changes to the levels of amino acid oxidations or possible changes to mAb higher
order structure. When combined with SEC analysis findings, it may be deduced that changes
observed following HIC-UV analysis may not be attributed to variations in mAb
aggregation/higher order structure profile thereby suggesting that the differences observed
are a result of post translational modification of the primary sequence.

Chapter 3
107
Table 3.4: Percentage area of main mAb peak observed following HIC-UV analysis of
differentially produced anti-IL8 IgG1. Sample separation was performed using a MAbPac SEC-1
analytical column, 5 µm, 4.0 x 300mm, on a Vanquish Flex UHPLC using a diode array detector
at 280 nm. Data was acquired using Chromeleon version 7.2 software; peak areas were
integrated manually.
mAb sample analysed % Area of main peak
Analysis 1
Analysis 2
Analysis 3
Average Standard deviation
Standard 1 mAb 86.93 87.38 87.84 87.38 0.46
Standard 2 mAb 85.42 85.78 85.35 85.52 0.23 Standard 3 mAb 86.65 87.23 87.53 87.14 0.45
Low DO mAb 86.38 85.45 86.02 85.95 0.47
High DO mAb 92.97 91.69 93.68 92.78 1.01
Low pH mAb 93.66 92.54 92.47 92.89 0.67
High pH mAb 77.48 77.47 81.11 78.69 2.10
Low Temp. mAb 86.10 84.61 84.76 85.16 0.82
High Temp. mAb 90.55 89.82 89.25 89.87 0.65

Chapter 3
108
Figure 3.4: Chromatograms corresponding to HIC-UV analysis (n=3) of A. anti-IL8 produced at
39.5oC, B. anti-IL8 produced at 32.0oC, C. anti-IL8 produced using 110% DO media content.
Sample separation was performed using a MAbPac SEC-1 analytical column, 5 µm, 4.0 x
300mm, on a Vanquish Flex UHPLC using a diode array detector at 280 nm. Data was acquired
using Chromeleon version 7.2 software; peak areas were integrated manually.

Chapter 3
109
Figure 3.5: Chromatograms corresponding to HIC-UV analysis (n=3) of A. anti-IL8 produced
using 60% DO media content, B. mAb produced at pH 7.2, C. mAb produced at pH 6.8. Sample
separation was performed using a MAbPac SEC-1 analytical column, 5 µm, 4.0 x 300mm, on a
Vanquish Flex UHPLC using a diode array detector at 280 nm. Data was acquired using
Chromeleon version 7.2 software; peak areas were integrated manually.

Chapter 3
110
3.3.2 Middle-down Analysis of IdeS Digested Anti-IL8 IgG1
Despite the wide range of information regarding mAb heterogeneity that may be attained
using HPLC-UV, mass spectrometry (MS) is required to provide essential information regarding
mAb primary structure including amino acid sequence, protein mass and sequence-level
modifications. Like top-down analysis of intact biomolecules, middle-down MS approaches
enable the determination of protein mass and sequence modifications, by identification of
differences in mass upon MS analyses. However, in contrast to top-down methodology,
limited proteolysis of proteins incorporated into middle-down approaches results in the
generation of polypeptides which are more suited to MS detection than intact biomolecules.
To evaluate protein mass and domain-level changes to differentially produced anti-IL8 mAb
under study (Table 3.1), antibody samples were digested using IdeS (FabRICATOR, Genovis), a
cysteine protease with high specificity for the hinge region of IgG. [41, 42] IdeS cleaves IgG1 at
the linkage between (ELL)G and G(PSVF) on the mAb heavy chain, as illustrated in Figure 3.6.
[18] Following subsequent disulfide bond reduction, three polypeptide populations are
formed: the intact light chain (LC), a heavy chain fragment containing the N-terminus (Fd’) and
the remaining heavy chain portion containing the asparagine-293 N-glycosylation site and the
C-terminus (scFc). In addition to determination of the exact mass for each of these subunits,
MS analysis may also reveal potential modifications on each of these polypeptide fragments,
e.g. different N-glycosylation moieties on scFC and various other enzymatic and non-
enzymatic modifications that produce distinctive mass shifts upon MS analysis.
Figure 3.6: Limited proteolysis of IgG1 by IdeS (FabRICATOR). [43] FabRICATOR cleaves IgG1
with high specificity at the hinge region between two glycine residues. Subsequent disulfide
bond reduction results in the formation of three polypeptide populations of approximately 25
kDa in size.

Chapter 3
111
Anti-IL8 IgG1 produced under standard and altered bioprocess conditions (Table 3.1) were
prepared as described in Section 3.2.6. In an effort to evaluate method performance, standard
1 mAb was prepared in triplicate and analysed in conjunction with the remaining mAb
samples. Following MS acquisition, data was processed using the AutoExtract algorithm in
BioPharma Finder (Thermo Fisher Scientific). Deconvolution of mass spectra obtained for each
peak in the total ion chromatogram (TIC) acquired resulted in the generation of spectra
corresponding to each of the mAb subunits produced following IdeS digestion. The mass of the
polypeptide and related variants in each of the samples could then be deduced from the
deconvoluted spectra. TIC traces, spectra showing charge envelope profiles corresponding to
each peak and deconvoluted mass spectra for each sample analysis are shown in Figures 3.7 to
3.17. As the figures show, interpretation of the deconvoluted mass spectra confirms the
identity of three polypeptides corresponding to the mass of the LC, scFc and Fd’ mAb subunits.
For each technical replicate, the difference in mass for each subunit identified was found to be
< 2 ppm (0.99, 1.13 and 1.78 ppm, respectively for scFc, LC and Fd’ mAb subunits) showing
good precision across all experimental analyses. Various other peaks were observed in the
spectra confirming the existence of modified versions of these polypeptides. The
monoisotopic mass of the scFc fragment (~25220 Da) corresponds to the theoretical mass of
this subunit combined with the mass of FA2 (~1462.5 Da), the most abundant N-glycan moiety
attached to humanised IgG1. Other variants that may be deduced from the deconvoluted
spectra include scFc with N-glycan species including FA2G1 (~25383 Da), FA2G2 (~25545 Da),
A2 (~25073 Da) and Man5 (~24991 Da). Due to the importance of glycosylation in modulating
the structural stability and functional activity of mAbs, [44, 45] and because of the huge
variation in potential N-glycans present on the mAb Fc region, the N-glycosylation profile of
anti-IL8 is specifically investigated in more detail in Chapter 4. Modifications observed across
all samples for the LC and Fd’ subunits were not as easily deduced, as common mass shifts,
such as those outlined in Table 3.5 were not observed. For example, the peak of mass
24000.888 Da observed in the deconvoluted mass spectrum corresponding to LC of Standard 2
(Figure 3.10) was ~59.0 Da greater in mass than the main LC peak, possibly corresponding to
multiple modifications on the same mAb fragment. Hence, for thorough evaluation of the
exact modifications that are present on the mAb samples analysed peptide mapping analysis
must be performed. However, as the reported masses for the most abundant peak in each of
the deconvoluted mass spectra was not significantly changed across all samples analysed, it
may be concluded that the application of different bioprocess parameters during batch culture
of CHO DP-12 cells did not result in alterations to the primary sequence of the anti-IL8 IgG1
produced.

Chapter 3
112
Figure 3.7: Middle down analysis of Standard 1, replicate 1. A. Total Ion Chromatogram (TIC); B. MS spectra corresponding to each highlighted TIC peak; C.
Deconvolution of charge envelopes shown in MS spectra to reveal monoisotopic masses of mAb species.

Chapter 3
113
Figure 3.8: Middle down analysis of Standard 1, replicate 2. A. Total Ion Chromatogram (TIC); B. MS spectra corresponding to each highlighted TIC peak; C.
Deconvolution of charge envelopes shown in MS spectra to reveal monoisotopic masses of mAb species.
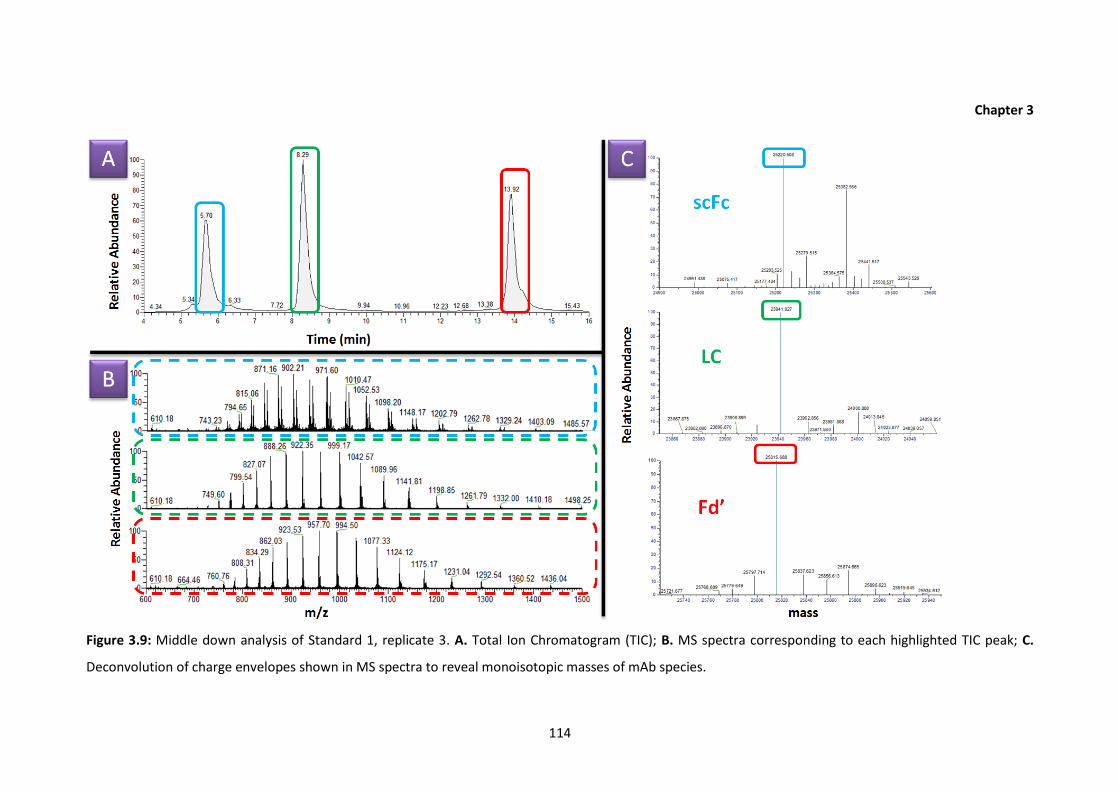
Chapter 3
114
Figure 3.9: Middle down analysis of Standard 1, replicate 3. A. Total Ion Chromatogram (TIC); B. MS spectra corresponding to each highlighted TIC peak; C.
Deconvolution of charge envelopes shown in MS spectra to reveal monoisotopic masses of mAb species.

Chapter 3
115
Figure 3.10: Middle down analysis of Standard 2. A. Total Ion Chromatogram (TIC); B. MS spectra corresponding to each highlighted TIC peak; C. Deconvolution
of charge envelopes shown in MS spectra to reveal monoisotopic masses of mAb species.

Chapter 3
116
Figure 3.11: Middle down analysis of Standard 3. A. Total Ion Chromatogram (TIC); B. MS spectra corresponding to each highlighted TIC peak; C. Deconvolution
of charge envelopes shown in MS spectra to reveal monoisotopic masses of mAb species.
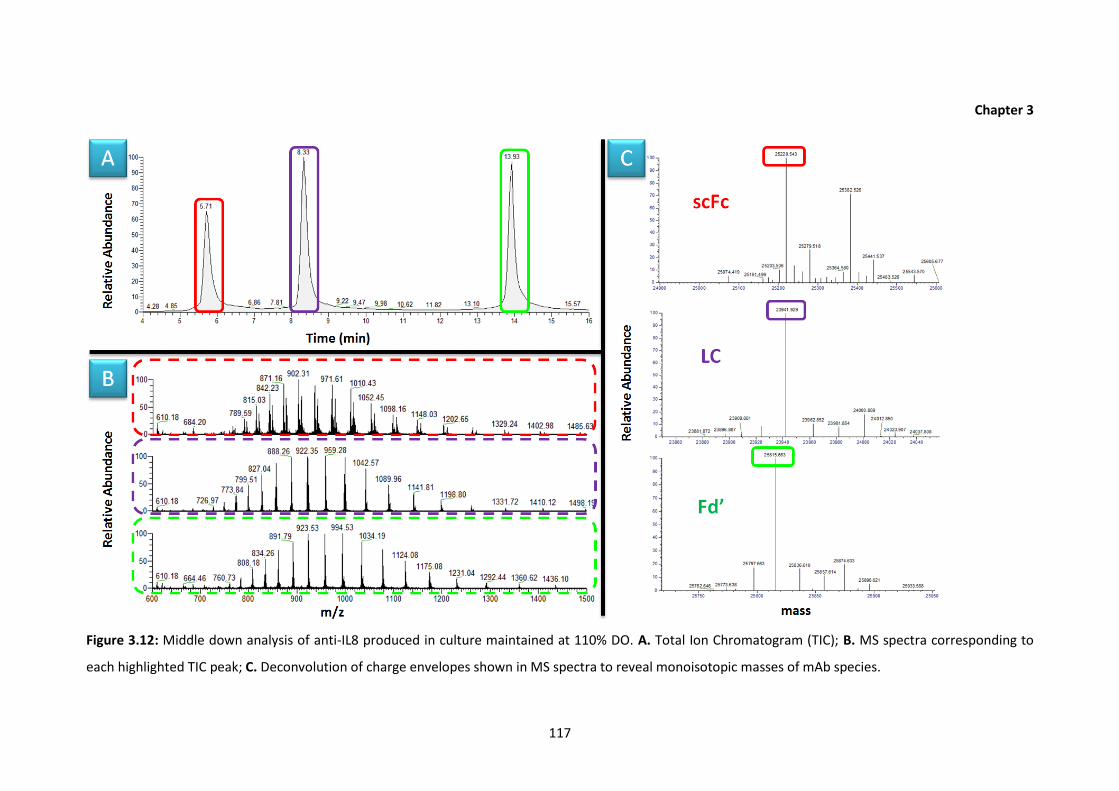
Chapter 3
117
Figure 3.12: Middle down analysis of anti-IL8 produced in culture maintained at 110% DO. A. Total Ion Chromatogram (TIC); B. MS spectra corresponding to
each highlighted TIC peak; C. Deconvolution of charge envelopes shown in MS spectra to reveal monoisotopic masses of mAb species.

Chapter 3
118
Figure 3.13: Middle down analysis of anti-IL8 produced in culture maintained at 60% DO. A. Total Ion Chromatogram (TIC); B. MS spectra corresponding to
each highlighted TIC peak; C. Deconvolution of charge envelopes shown in MS spectra to reveal monoisotopic masses of mAb species.

Chapter 3
119
Figure 3.14: Middle down analysis of anti-IL8 produced using increased culture temperature of 39.5oC. A. Total Ion Chromatogram (TIC); B. MS spectra
corresponding to each highlighted TIC peak; C. Deconvolution of charge envelopes shown in MS spectra to reveal monoisotopic masses of mAb species.
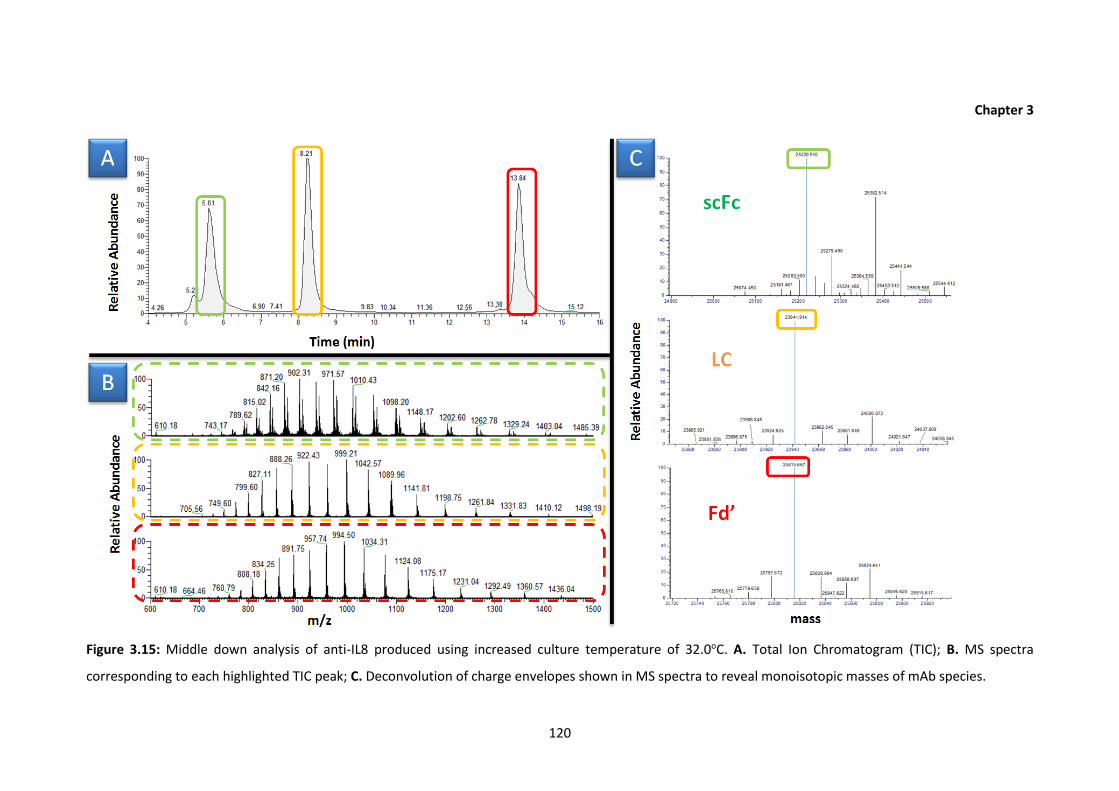
Chapter 3
120
Figure 3.15: Middle down analysis of anti-IL8 produced using increased culture temperature of 32.0oC. A. Total Ion Chromatogram (TIC); B. MS spectra
corresponding to each highlighted TIC peak; C. Deconvolution of charge envelopes shown in MS spectra to reveal monoisotopic masses of mAb species.

Chapter 3
121
Figure 3.16: Middle down analysis of anti-IL8 produced in culture maintained at pH 7.2. A. Total Ion Chromatogram (TIC); B. MS spectra corresponding to each
highlighted TIC peak; C. Deconvolution of charge envelopes shown in MS spectra to reveal monoisotopic masses of mAb species.

Chapter 3
122
Figure 3.17: Middle down analysis of anti-IL8 produced in culture maintained at pH 6.8. A. Total Ion Chromatogram (TIC); B. MS spectra corresponding to each
highlighted TIC peak; C. Deconvolution of charge envelopes shown in MS spectra to reveal monoisotopic masses of mAb species.
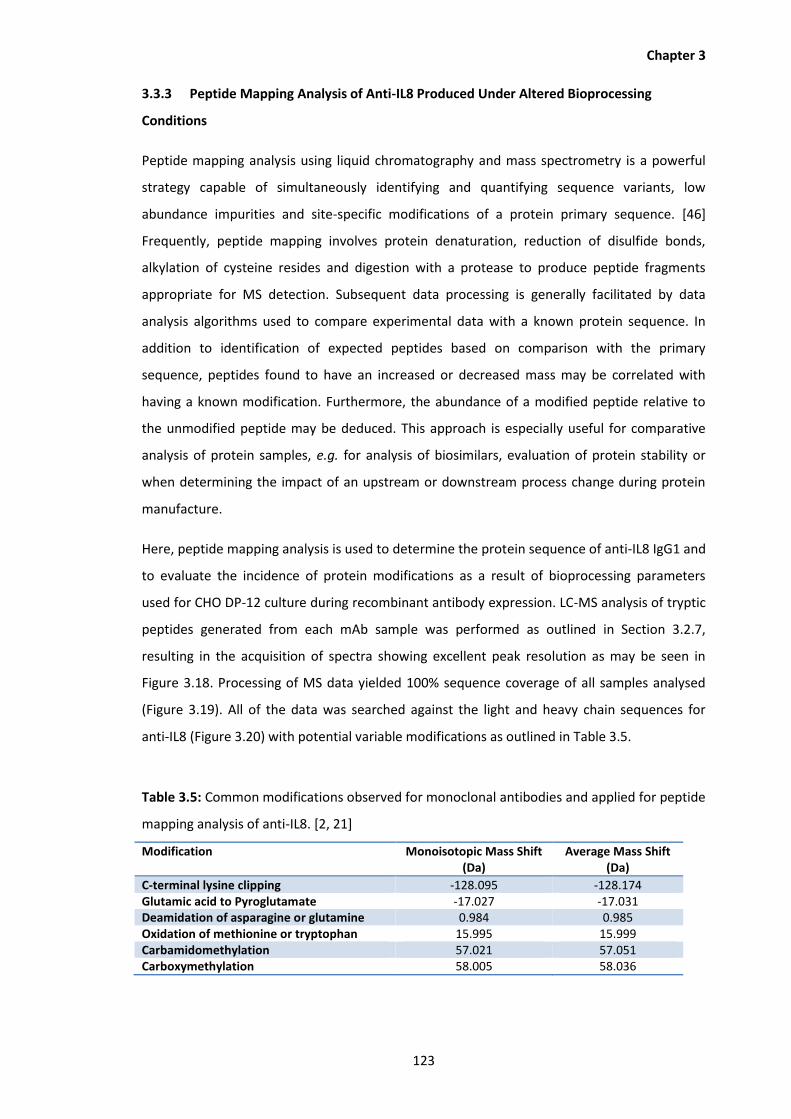
Chapter 3
123
3.3.3 Peptide Mapping Analysis of Anti-IL8 Produced Under Altered Bioprocessing
Conditions
Peptide mapping analysis using liquid chromatography and mass spectrometry is a powerful
strategy capable of simultaneously identifying and quantifying sequence variants, low
abundance impurities and site-specific modifications of a protein primary sequence. [46]
Frequently, peptide mapping involves protein denaturation, reduction of disulfide bonds,
alkylation of cysteine resides and digestion with a protease to produce peptide fragments
appropriate for MS detection. Subsequent data processing is generally facilitated by data
analysis algorithms used to compare experimental data with a known protein sequence. In
addition to identification of expected peptides based on comparison with the primary
sequence, peptides found to have an increased or decreased mass may be correlated with
having a known modification. Furthermore, the abundance of a modified peptide relative to
the unmodified peptide may be deduced. This approach is especially useful for comparative
analysis of protein samples, e.g. for analysis of biosimilars, evaluation of protein stability or
when determining the impact of an upstream or downstream process change during protein
manufacture.
Here, peptide mapping analysis is used to determine the protein sequence of anti-IL8 IgG1 and
to evaluate the incidence of protein modifications as a result of bioprocessing parameters
used for CHO DP-12 culture during recombinant antibody expression. LC-MS analysis of tryptic
peptides generated from each mAb sample was performed as outlined in Section 3.2.7,
resulting in the acquisition of spectra showing excellent peak resolution as may be seen in
Figure 3.18. Processing of MS data yielded 100% sequence coverage of all samples analysed
(Figure 3.19). All of the data was searched against the light and heavy chain sequences for
anti-IL8 (Figure 3.20) with potential variable modifications as outlined in Table 3.5.
Table 3.5: Common modifications observed for monoclonal antibodies and applied for peptide
mapping analysis of anti-IL8. [2, 21]
Modification Monoisotopic Mass Shift (Da)
Average Mass Shift (Da)
C-terminal lysine clipping -128.095 -128.174 Glutamic acid to Pyroglutamate -17.027 -17.031 Deamidation of asparagine or glutamine 0.984 0.985 Oxidation of methionine or tryptophan 15.995 15.999 Carbamidomethylation 57.021 57.051 Carboxymethylation 58.005 58.036
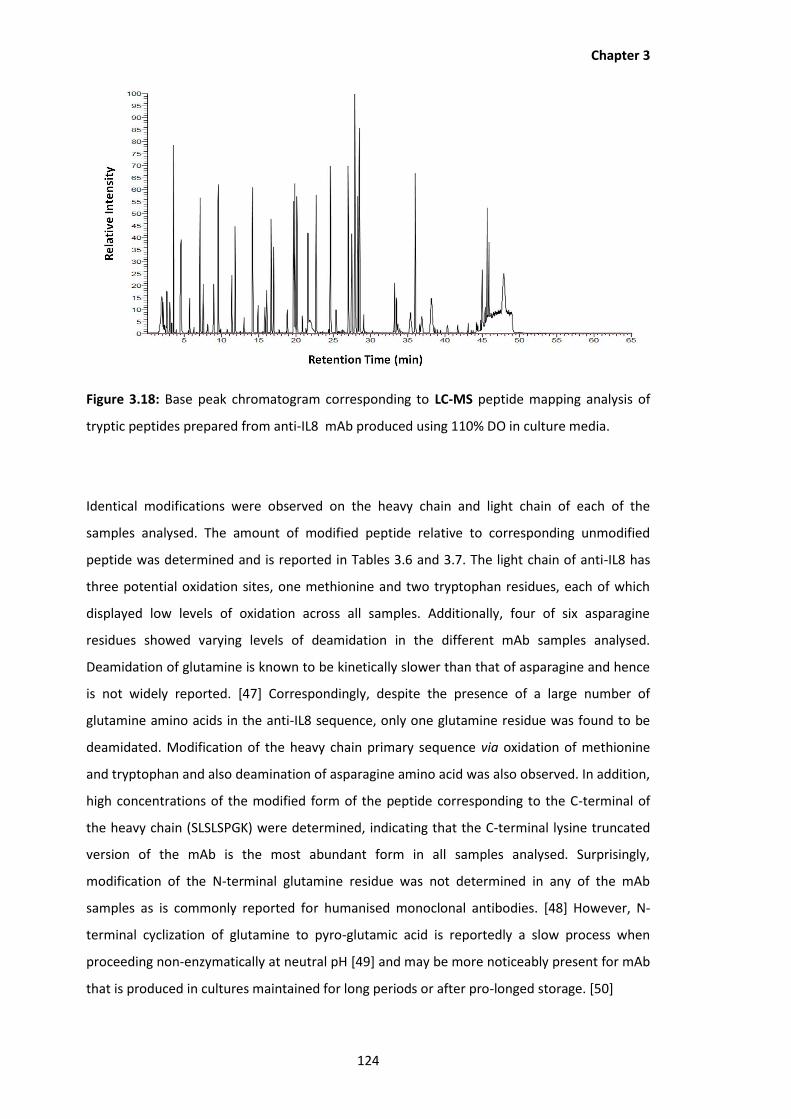
Chapter 3
124
Figure 3.18: Base peak chromatogram corresponding to LC-MS peptide mapping analysis of
tryptic peptides prepared from anti-IL8 mAb produced using 110% DO in culture media.
Identical modifications were observed on the heavy chain and light chain of each of the
samples analysed. The amount of modified peptide relative to corresponding unmodified
peptide was determined and is reported in Tables 3.6 and 3.7. The light chain of anti-IL8 has
three potential oxidation sites, one methionine and two tryptophan residues, each of which
displayed low levels of oxidation across all samples. Additionally, four of six asparagine
residues showed varying levels of deamidation in the different mAb samples analysed.
Deamidation of glutamine is known to be kinetically slower than that of asparagine and hence
is not widely reported. [47] Correspondingly, despite the presence of a large number of
glutamine amino acids in the anti-IL8 sequence, only one glutamine residue was found to be
deamidated. Modification of the heavy chain primary sequence via oxidation of methionine
and tryptophan and also deamination of asparagine amino acid was also observed. In addition,
high concentrations of the modified form of the peptide corresponding to the C-terminal of
the heavy chain (SLSLSPGK) were determined, indicating that the C-terminal lysine truncated
version of the mAb is the most abundant form in all samples analysed. Surprisingly,
modification of the N-terminal glutamine residue was not determined in any of the mAb
samples as is commonly reported for humanised monoclonal antibodies. [48] However, N-
terminal cyclization of glutamine to pyro-glutamic acid is reportedly a slow process when
proceeding non-enzymatically at neutral pH [49] and may be more noticeably present for mAb
that is produced in cultures maintained for long periods or after pro-longed storage. [50]
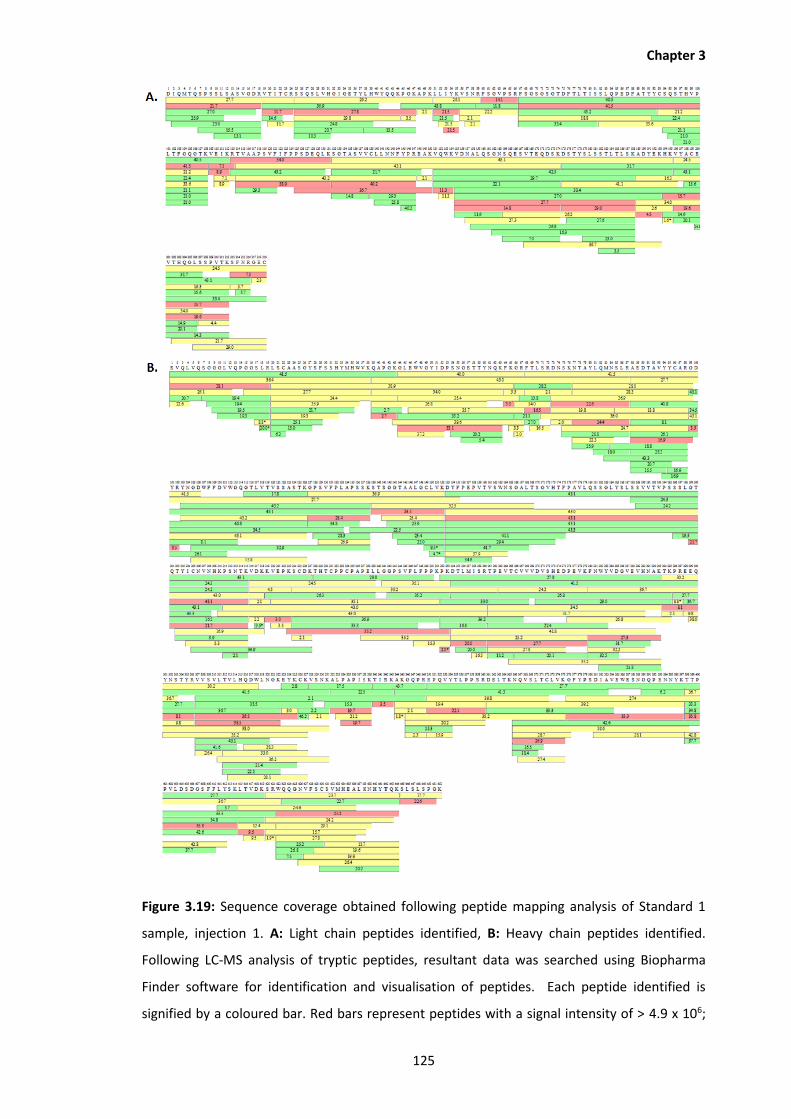
Chapter 3
125
Figure 3.19: Sequence coverage obtained following peptide mapping analysis of Standard 1
sample, injection 1. A: Light chain peptides identified, B: Heavy chain peptides identified.
Following LC-MS analysis of tryptic peptides, resultant data was searched using Biopharma
Finder software for identification and visualisation of peptides. Each peptide identified is
signified by a coloured bar. Red bars represent peptides with a signal intensity of > 4.9 x 10⁶;

Chapter 3
126
Yellow bars represent peptides with a signal intensity of > 1.4 x 10⁵; Green bars represent
peptides with a signal intensity of > 3.8 x 10³. Each number shown within each bar equals to
the retention time of that peptide.
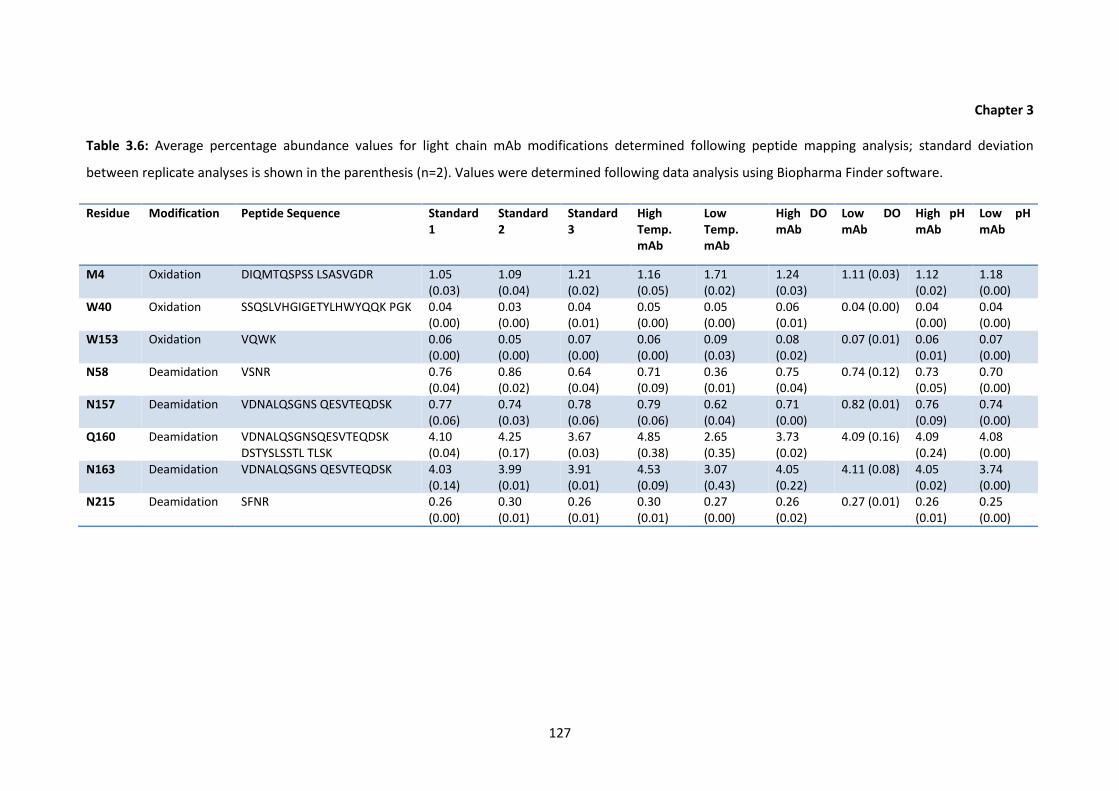
Chapter 3
127
Table 3.6: Average percentage abundance values for light chain mAb modifications determined following peptide mapping analysis; standard deviation
between replicate analyses is shown in the parenthesis (n=2). Values were determined following data analysis using Biopharma Finder software.
Residue Modification Peptide Sequence Standard 1
Standard 2
Standard 3
High Temp. mAb
Low Temp. mAb
High DO mAb
Low DO mAb
High pH mAb
Low pH mAb
M4 Oxidation DIQMTQSPSS LSASVGDR 1.05 (0.03)
1.09 (0.04)
1.21 (0.02)
1.16 (0.05)
1.71 (0.02)
1.24 (0.03)
1.11 (0.03) 1.12 (0.02)
1.18 (0.00)
W40 Oxidation SSQSLVHGIGETYLHWYQQK PGK 0.04 (0.00)
0.03 (0.00)
0.04 (0.01)
0.05 (0.00)
0.05 (0.00)
0.06 (0.01)
0.04 (0.00) 0.04 (0.00)
0.04 (0.00)
W153 Oxidation VQWK 0.06 (0.00)
0.05 (0.00)
0.07 (0.00)
0.06 (0.00)
0.09 (0.03)
0.08 (0.02)
0.07 (0.01) 0.06 (0.01)
0.07 (0.00)
N58 Deamidation VSNR 0.76 (0.04)
0.86 (0.02)
0.64 (0.04)
0.71 (0.09)
0.36 (0.01)
0.75 (0.04)
0.74 (0.12) 0.73 (0.05)
0.70 (0.00)
N157 Deamidation VDNALQSGNS QESVTEQDSK 0.77 (0.06)
0.74 (0.03)
0.78 (0.06)
0.79 (0.06)
0.62 (0.04)
0.71 (0.00)
0.82 (0.01) 0.76 (0.09)
0.74 (0.00)
Q160 Deamidation VDNALQSGNSQESVTEQDSK DSTYSLSSTL TLSK
4.10 (0.04)
4.25 (0.17)
3.67 (0.03)
4.85 (0.38)
2.65 (0.35)
3.73 (0.02)
4.09 (0.16) 4.09 (0.24)
4.08 (0.00)
N163 Deamidation VDNALQSGNS QESVTEQDSK 4.03 (0.14)
3.99 (0.01)
3.91 (0.01)
4.53 (0.09)
3.07 (0.43)
4.05 (0.22)
4.11 (0.08) 4.05 (0.02)
3.74 (0.00)
N215 Deamidation SFNR 0.26 (0.00)
0.30 (0.01)
0.26 (0.01)
0.30 (0.01)
0.27 (0.00)
0.26 (0.02)
0.27 (0.01) 0.26 (0.01)
0.25 (0.00)
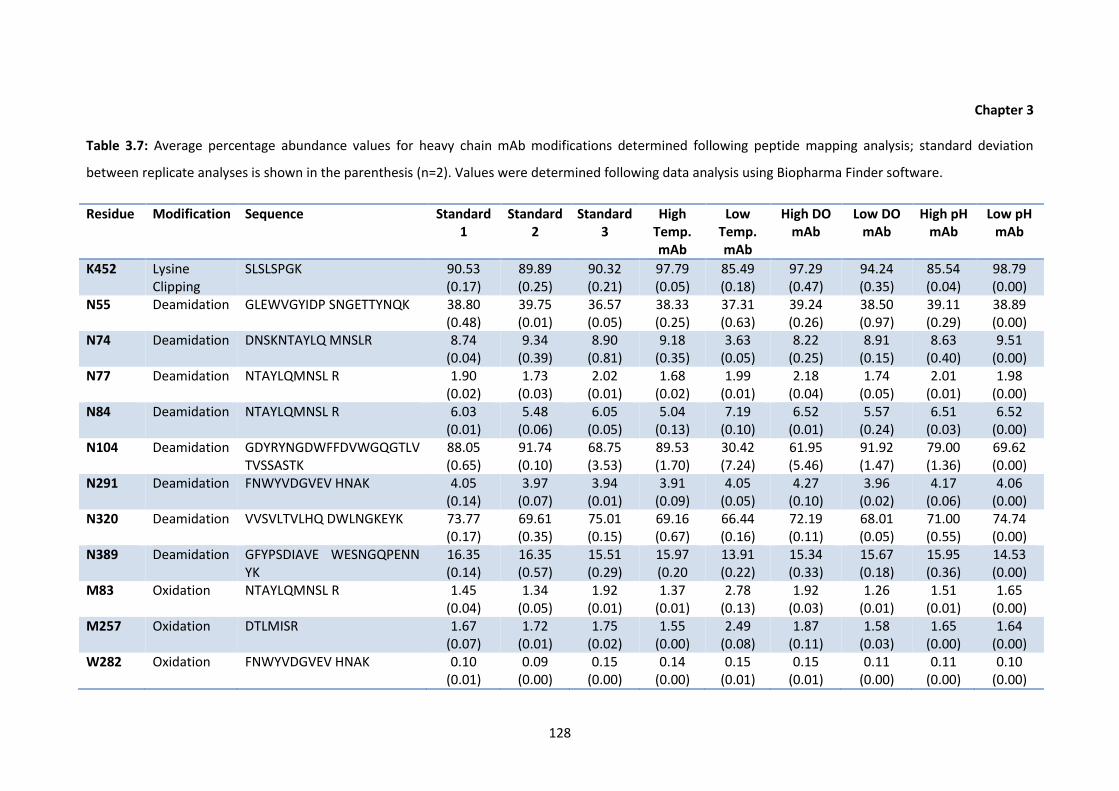
Chapter 3
128
Table 3.7: Average percentage abundance values for heavy chain mAb modifications determined following peptide mapping analysis; standard deviation
between replicate analyses is shown in the parenthesis (n=2). Values were determined following data analysis using Biopharma Finder software.
Residue Modification Sequence Standard 1
Standard 2
Standard 3
High Temp. mAb
Low Temp. mAb
High DO mAb
Low DO mAb
High pH mAb
Low pH mAb
K452 Lysine Clipping
SLSLSPGK 90.53 (0.17)
89.89 (0.25)
90.32 (0.21)
97.79 (0.05)
85.49 (0.18)
97.29 (0.47)
94.24 (0.35)
85.54 (0.04)
98.79 (0.00)
N55 Deamidation GLEWVGYIDP SNGETTYNQK 38.80 (0.48)
39.75 (0.01)
36.57 (0.05)
38.33 (0.25)
37.31 (0.63)
39.24 (0.26)
38.50 (0.97)
39.11 (0.29)
38.89 (0.00)
N74 Deamidation DNSKNTAYLQ MNSLR 8.74 (0.04)
9.34 (0.39)
8.90 (0.81)
9.18 (0.35)
3.63 (0.05)
8.22 (0.25)
8.91 (0.15)
8.63 (0.40)
9.51 (0.00)
N77 Deamidation NTAYLQMNSL R 1.90 (0.02)
1.73 (0.03)
2.02 (0.01)
1.68 (0.02)
1.99 (0.01)
2.18 (0.04)
1.74 (0.05)
2.01 (0.01)
1.98 (0.00)
N84 Deamidation NTAYLQMNSL R 6.03 (0.01)
5.48 (0.06)
6.05 (0.05)
5.04 (0.13)
7.19 (0.10)
6.52 (0.01)
5.57 (0.24)
6.51 (0.03)
6.52 (0.00)
N104 Deamidation GDYRYNGDWFFDVWGQGTLV TVSSASTK
88.05 (0.65)
91.74 (0.10)
68.75 (3.53)
89.53 (1.70)
30.42 (7.24)
61.95 (5.46)
91.92 (1.47)
79.00 (1.36)
69.62 (0.00)
N291 Deamidation FNWYVDGVEV HNAK 4.05 (0.14)
3.97 (0.07)
3.94 (0.01)
3.91 (0.09)
4.05 (0.05)
4.27 (0.10)
3.96 (0.02)
4.17 (0.06)
4.06 (0.00)
N320 Deamidation VVSVLTVLHQ DWLNGKEYK 73.77 (0.17)
69.61 (0.35)
75.01 (0.15)
69.16 (0.67)
66.44 (0.16)
72.19 (0.11)
68.01 (0.05)
71.00 (0.55)
74.74 (0.00)
N389 Deamidation GFYPSDIAVE WESNGQPENN YK
16.35 (0.14)
16.35 (0.57)
15.51 (0.29)
15.97 (0.20
13.91 (0.22)
15.34 (0.33)
15.67 (0.18)
15.95 (0.36)
14.53 (0.00)
M83 Oxidation NTAYLQMNSL R 1.45 (0.04)
1.34 (0.05)
1.92 (0.01)
1.37 (0.01)
2.78 (0.13)
1.92 (0.03)
1.26 (0.01)
1.51 (0.01)
1.65 (0.00)
M257 Oxidation DTLMISR 1.67 (0.07)
1.72 (0.01)
1.75 (0.02)
1.55 (0.00)
2.49 (0.08)
1.87 (0.11)
1.58 (0.03)
1.65 (0.00)
1.64 (0.00)
W282 Oxidation FNWYVDGVEV HNAK 0.10 (0.01)
0.09 (0.00)
0.15 (0.00)
0.14 (0.00)
0.15 (0.01)
0.15 (0.01)
0.11 (0.00)
0.11 (0.00)
0.10 (0.00)

Chapter 3
129
In order to estimate potential changes to the concentrations of sequence-level modifications
in response to the conditions used for mAb production, the percentage abundance of each of
the modifications in samples produced under altered bioprocess conditions were compared to
the levels of corresponding modifications in mAb samples produced using standard bioprocess
conditions. For each of the modifications the ratio of the percentage abundance of that
modification in the differentially produced mAb compared to the average percentage
abundance of that modification found in the standard cultured-mAb samples was determined
and is reported in Table 3.8. The mAb samples produced at pH 6.8, pH 7.2 and at 60% DO did
not appear to have greatly altered levels of amino acid modifications for the heavy or light
chain of anti-IL8. Deamidation of glutamine appeared to be increased in mAb produced at
39.5oC but reduced at 32.0oC, suggesting a possible effect on the kinetics of glutamine
deamidation due to culture temperature. An increase in the methionine and tryptophan
oxidation levels in mAb produced at 110% compared to mAb produced at 85% was not
reflected in the corresponding HIC or SCX traces possibly signifying the conformation of the
modified residues is contained within the internal part of the mAb tertiary structure. The most
pronounced change in sequence-level modifications were found to exist in mAb samples
expressed in media maintained at 32oC, which showed comparatively low levels of
deamidated peptides on the mAb light chain and on the N74 residue on the mAb heavy chain.
Conversely, the levels of methionine and tryptophan oxidation were elevated on both the
heavy and light chain sequences. Although the high levels of primary sequence oxidation
observed for the mAb produced at low temperature may appear to correlate with the HIC and
SCX data, showing both greater levels of basic and polar species, the same levels of oxidation
were not observed for the mAb produced at pH 7.2, despite a similar charge and hydrophobic
variant profile. Hence it is possible that there are additional factors at play that may influence
the critical quality attributes of the mAb produced.
Although sequence level modifications frequently are present on therapeutic proteins, the
goal of product characterisation is to ensure that existing variants do not alter the safely,
potency and efficacy profile of the drug substance. A modification to the primary sequence of
a mAb may potentially impact the proteins CQAs if that modification occurs in one of the
complementarity determining regions (CDR) of the antibody, which are responsible for target
antigen binding and hence mAb therapeutic function. [51] Following peptide mapping analysis
one modified amino acid residue, namely N55, which formed part of a CDR was identified.
Although studies have revealed that deamidation of N55 may reduce ligand binding activity
resulting in reduced mAb potency, [52] the levels of deamidation of N55 were not found to be
relatively altered in the mAb samples determined.

Chapter 3
130
Table 3.8: Ratio of light chain and heavy chain modifications determined in mAb produced under different bioprocessing conditions relative to average %
abundance of each modification in mAb produced under standard conditions.
Residue Modification Sequence High DO mAb
High pH mAb
High Temp. mAb
Low DO mAb
Low pH mAb
Low Temp. mAb
Ligh
t C
hai
n
N58 Deamidation VSNR 1.00 0.97 0.95 0.98 0.94 0.48
N157 Deamidation VDNALQSGNSQESVTEQDSK 0.93 0.99 1.04 1.08 0.97 0.82
Q160 Deamidation VDNALQSGNSQESVTEQDSKDSTYSLSSTLTLSK 0.93 1.02 1.21 1.02 1.02 0.66
N163 Deamidation VDNALQSGNSQESVTEQDSK 1.02 1.02 1.14 1.03 0.94 0.77
N215 Deamidation SFNR 0.95 0.96 1.10 1.01 0.91 1.02
M4 Oxidation DIQMTQSPSSLSASVGDR 1.10 1.00 1.04 0.99 1.06 1.52
W40 Oxidation SSQSLVHGIGETYLHWYQQKPGK 1.57 1.12 1.24 1.02 1.07 1.26
W153 Oxidation VQWK 1.34 1.07 1.01 1.16 1.13 1.60
He
avy
Ch
ain
N55 Deamidation GLEWVGYIDPSNGETTYNQK 1.02 1.02 1.00 1.00 1.01 0.97
N74 Deamidation DNSKNTAYLQMNSLR 0.91 0.96 1.02 0.99 1.06 0.40
N77 Deamidation NTAYLQMNSLR 1.16 1.07 0.89 0.92 1.05 1.06
N84 Deamidation NTAYLQMNSLR 1.11 1.11 0.86 0.95 1.11 1.23
N291 Deamidation FNWYVDGVEVHNAK 1.07 1.05 0.98 0.99 1.02 1.02
N320 Deamidation VVSVLTVLHQDWLNGKEYK 0.99 0.98 0.95 0.93 1.03 0.91
N389 Deamidation GFYPSDIAVEWESNGQPENNYK 0.95 0.99 0.99 0.98 0.90 0.87
M83 Oxidation NTAYLQMNSLR 1.22 0.96 0.87 0.80 1.05 1.77
M257 Oxidation DTLMISR 1.09 0.96 0.90 0.92 0.96 1.45
W282 Oxidation FNWYVDGVEVHNAK 1.27 0.94 1.23 0.94 0.90 1.30
K452 Lysine clipping SLSLSPGK 1.08 0.95 1.08 1.04 1.09 0.95

Chapter 3
131
Figure 3.20 Anti-IL-8 IgG1 heavy and light chain protein sequence. Amino acid residues that
were determined to have been modified following peptide mapping analysis are highlighted:
deamidation residues are coloured green; oxidised residues are red; C-terminal truncated
lysine is blue. CDR regions are underlined. [23]

Chapter 3
132
3.4 Conclusions
Monoclonal antibodies are highly complex biomolecules, which have the potential to undergo
a range of modifications resulting in extensive microheterogeneity for each mAb entity. Since
the incidence of primary structure modification may be impacted by environmental factors,
e.g. bioprocessing, wide-ranging characterisation of therapeutic protein samples are required.
In this study, domain and sequence-level characterisation of differentially produced anti-IL8
IgG1 was performed. Although SEC-UV and middle down MS analysis did not signify changes to
the mass of protein samples analysed, application of SCX-UV and HIC-UV for intact protein
analysis and also use of high resolution MS instrumentation for peptide mapping of the
protein primary sequence, revealed differences in peptide-level modifications, protein variant
charge and hydrophobicity. Interestingly, previously reported correlations between peptide
level modifications, e.g. oxidation and deamidation, and changes to the hydrophobicity and
charge characteristics of the IgG1 samples analysed were not clear-cut. These findings suggest
that there is a fundamental need to further evaluate therapeutic mAbs, as improvements in
chromatographic stationary phases and in high resolution MS analysis may reveal new
features of therapeutic biomolecules that have not previously been determined. With the
advent of increasing complex biotherapeutics, such as biosimilars, bispecific antibodies,
antibody drug conjugates and other new drug therapies, it is now increasingly important to
apply intuitive orthogonal analytical technologies to achieve a deeper understanding of
therapeutic biomolecules at the sequence level. The results herein show, that in order to
predict the safety, quality and efficacy of a therapeutic protein sample, a more holistic
approach must be taken as prediction of potential protein properties based on sequence
quality assessment may not be appropriate. Ultimately to fully characterise a proteins CQAs, a
thorough evaluation of sequence and domain-level features, combined with structural and
functional characterisation must be performed.
3.5 Author Contributions
Research study devised by Amy Farrell and Jonathan Bones; Sample preparation performed by
Amy Farrell; Chromatography analysis performed by Amy Farrell; Mass spectrometry analysis
performed by Amy Farrell and Kai Scheffler; Data analysis performed by Amy Farrell; Data
reviewed by Jonathan Bones.
Chapter 3
133
3.6 References
1. Stracke, J., et al., A novel approach to investigate the effect of methionine oxidation on
pharmacokinetic properties of therapeutic antibodies. MAbs, 2014. 6(5): p. 1229-42.
2. Liu, H., et al., Heterogeneity of monoclonal antibodies. J Pharm Sci, 2008. 97(7): p.
2426-47.
3. Berkowitz, S.A., et al., Analytical tools for characterizing biopharmaceuticals and the
implications for biosimilars. Nat Rev Drug Discov, 2012. 11(7): p. 527-40.
4. US Food and Drug Administration. September 2004. Pharmaceutical cGMPs for the
21st century - A risk based approach. [Retrieved 14 June 2016 from
http://www.fda.gov/downloads/Drugs/DevelopmentApprovalProcess/Manufacturing/
QuestionsandAnswersonCurrentGoodManufacturingPracticescGMPforDrugs/UCM176
374.pdf.]
5. US Food and Drug Administration. September 2004. Guidance for Industry, PAT -A
framework for innovative pharmaceutical development, manufacturing and quality
assurance. [Retrieved 14 June 2016 from
http://www.fda.gov/downloads/Drugs/GuidanceComplianceRegulatoryInformation/G
uidances/UCM070305.pdf.]
6. International Conference on Harmonisation. ICH Harmonised Tripartite Guideline,
Pharmaceutical Development Q8 (R2). [Retrieved 14 June 2016 from
http://www.ich.org/fileadmin/Public_Web_Site/ICH_Products/Guidelines/Quality/Q8_
R1/Step4/Q8_R2_Guideline.pdf]. August 2009.
7. International Conference on Harmonisation. ICH Harmonised Tripartite Guideline,
Comparability of biotechnological/biological products subject to changes in their
manufacturing process Q5E. [Retrieved 14 June 2016 from
http://www.ich.org/fileadmin/Public_Web_Site/ICH_Products/Guidelines/Quality/Q5E
/Step4/Q5E_Guideline.pdf]. November 2004.
8. Rathore, A.S., Roadmap for implementation of quality by design (QbD) for
biotechnology products. Trends Biotechnol, 2009. 27(9): p. 546-53.
9. Kozlowski, S. and P. Swann, Current and future issues in the manufacturing and
development of monoclonal antibodies. Adv Drug Deliv Rev, 2006. 58(5-6): p. 707-22.

Chapter 3
134
10. Kunert, R. and D. Reinhart, Advances in recombinant antibody manufacturing. Appl
Microbiol Biotechnol, 2016. 100(8): p. 3451-61.
11. Haverick, M., et al., Separation of mAbs molecular variants by analytical hydrophobic
interaction chromatography HPLC: overview and applications. MAbs, 2014. 6(4): p.
852-8.
12. Parr, M.K., O. Montacir, and H. Montacir, Physicochemical characterization of
biopharmaceuticals. J Pharm Biomed Anal, 2016.
13. Liu, Z. and K.L. Schey, Fragmentation of multiply-charged intact protein ions using
MALDI TOF-TOF mass spectrometry. J Am Soc Mass Spectrom, 2008. 19(2): p. 231-8.
14. Valeja, S.G., et al., New reagents for enhanced liquid chromatographic separation and
charging of intact protein ions for electrospray ionization mass spectrometry. Anal
Chem, 2010. 82(17): p. 7515-9.
15. Wu, S., et al., Top-Down Characterization of the Post-Translationally Modified Intact
Periplasmic Proteome from the Bacterium Novosphingobium aromaticivorans. Int J
Proteomics, 2013. 2013: p. 279590.
16. Gadgil, H.S., et al., Identification of cysteinylation of a free cysteine in the Fab region of
a recombinant monoclonal IgG1 antibody using Lys-C limited proteolysis coupled with
LC/MS analysis. Anal Biochem, 2006. 355(2): p. 165-74.
17. Yan, B., et al., Analysis of post-translational modifications in recombinant monoclonal
antibody IgG1 by reversed-phase liquid chromatography/mass spectrometry. J
Chromatogr A, 2007. 1164(1-2): p. 153-61.
18. Wang, B., et al., Structural comparison of two anti-CD20 monoclonal antibody drug
products using middle-down mass spectrometry. Analyst, 2013. 138(10): p. 3058-65.
19. An, Y., et al., A new tool for monoclonal antibody analysis: application of IdeS
proteolysis in IgG domain-specific characterization. MAbs, 2014. 6(4): p. 879-93.
20. Bongers, J., et al., Validation of a peptide mapping method for a therapeutic
monoclonal antibody: what could we possibly learn about a method we have run 100
times? J Pharm Biomed Anal, 2000. 21(6): p. 1099-128.
21. Yang, H. and R.A. Zubarev, Mass spectrometric analysis of asparagine deamidation and
aspartate isomerization in polypeptides. Electrophoresis, 2010. 31(11): p. 1764-72.

Chapter 3
135
22. Wisniewski, J.R., et al., Universal sample preparation method for proteome analysis.
Nat Methods, 2009. 6(5): p. 359-62.
23. Gonzalez, T.N., Leong, S. R., Presta, L. G., Humanized Anti-IL-8 Monoclonal Antibodies.
US Patent 6117980. 12 September 2000.
24. den Engelsman, J., et al., Strategies for the assessment of protein aggregates in
pharmaceutical biotech product development. Pharm Res, 2011. 28(4): p. 920-33.
25. Philo, J.S., A critical review of methods for size characterization of non-particulate
protein aggregates. Curr Pharm Biotechnol, 2009. 10(4): p. 359-72.
26. Yang, R., et al., High resolution separation of recombinant monoclonal antibodies by
size-exclusion ultra-high performance liquid chromatography (SE-UHPLC). J Pharm
Biomed Anal, 2015. 109: p. 52-61.
27. Carpenter, J.F., et al., Overlooking subvisible particles in therapeutic protein products:
gaps that may compromise product quality. J Pharm Sci, 2009. 98(4): p. 1201-5.
28. Szabolcs Fekete, A.-L.G., Serge Rudaz, Julie Schappler, Davy Guillarme, Analytical
strategies for the characterization of therapeutic monoclonal antibodies. Trends in
Analytical Chemistry, 2013. 42: p. 74-83.
29. Yang, J., et al., Determination of tryptophan oxidation of monoclonal antibody by
reversed phase high performance liquid chromatography. J Chromatogr A, 2007.
1156(1-2): p. 174-82.
30. Khawli, L.A., et al., Charge variants in IgG1: Isolation, characterization, in vitro binding
properties and pharmacokinetics in rats. MAbs, 2010. 2(6): p. 613-24.
31. Zheng, J.Y. and L.J. Janis, Influence of pH, buffer species, and storage temperature on
physicochemical stability of a humanized monoclonal antibody LA298. Int J Pharm,
2006. 308(1-2): p. 46-51.
32. Huang, L., et al., In vivo deamidation characterization of monoclonal antibody by
LC/MS/MS. Anal Chem, 2005. 77(5): p. 1432-9.
33. Antes, B., et al., Analysis of lysine clipping of a humanized Lewis-Y specific IgG antibody
and its relation to Fc-mediated effector function. J Chromatogr B Analyt Technol
Biomed Life Sci, 2007. 852(1-2): p. 250-6.
Chapter 3
136
34. Chumsae, C., et al., Comparison of methionine oxidation in thermal stability and
chemically stressed samples of a fully human monoclonal antibody. J Chromatogr B
Analyt Technol Biomed Life Sci, 2007. 850(1-2): p. 285-94.
35. Johnson, K.A., et al., Cation exchange-HPLC and mass spectrometry reveal C-terminal
amidation of an IgG1 heavy chain. Anal Biochem, 2007. 360(1): p. 75-83.
36. Du, Y., et al., Chromatographic analysis of the acidic and basic species of recombinant
monoclonal antibodies. MAbs, 2012. 4(5): p. 578-85.
37. Dick, L.W., Jr., et al., C-terminal lysine variants in fully human monoclonal antibodies:
investigation of test methods and possible causes. Biotechnol Bioeng, 2008. 100(6): p.
1132-43.
38. Zhang, X., et al., Culture temperature modulates monoclonal antibody charge variation
distribution in Chinese hamster ovary cell cultures. Biotechnol Lett, 2015. 37(11): p.
2151-7.
39. Lam, X.M., J.Y. Yang, and J.L. Cleland, Antioxidants for prevention of methionine
oxidation in recombinant monoclonal antibody HER2. J Pharm Sci, 1997. 86(11): p.
1250-5.
40. Boyd, D., T. Kaschak, and B. Yan, HIC resolution of an IgG1 with an oxidized Trp in a
complementarity determining region. J Chromatogr B Analyt Technol Biomed Life Sci,
2011. 879(13-14): p. 955-60.
41. Vincents, B., et al., Enzymatic characterization of the streptococcal endopeptidase,
IdeS, reveals that it is a cysteine protease with strict specificity for IgG cleavage due to
exosite binding. Biochemistry, 2004. 43(49): p. 15540-9.
42. Chevreux, G., N. Tilly, and N. Bihoreau, Fast analysis of recombinant monoclonal
antibodies using IdeS proteolytic digestion and electrospray mass spectrometry. Anal
Biochem, 2011. 415(2): p. 212-4.
43. Graphic created by Genovis. Accessed from http://www.genovis.com/antibody-
oxidation on 26th June 2016.
44. Nimmerjahn, F. and J.V. Ravetch, Fcgamma receptors as regulators of immune
responses. Nat Rev Immunol, 2008. 8(1): p. 34-47.

Chapter 3
137
45. Walsh, G. and R. Jefferis, Post-translational modifications in the context of therapeutic
proteins. Nat Biotechnol, 2006. 24(10): p. 1241-52.
46. Xie, H., et al., Rapid comparison of a candidate biosimilar to an innovator monoclonal
antibody with advanced liquid chromatography and mass spectrometry technologies.
MAbs, 2010. 2(4): p. 379-94.
47. Robinson, A.B., J.W. Scotchler, and J.H. McKerrow, Rates of nonenzymatic deamidation
of glutaminyl and asparaginyl residues in pentapeptides. J Am Chem Soc, 1973. 95(24):
p. 8156-9.
48. Liu, Y.D., et al., N-terminal glutamate to pyroglutamate conversion in vivo for human
IgG2 antibodies. J Biol Chem, 2011. 286(13): p. 11211-7.
49. Dick, L.W., Jr., et al., Determination of the origin of the N-terminal pyro-glutamate
variation in monoclonal antibodies using model peptides. Biotechnol Bioeng, 2007.
97(3): p. 544-53.
50. Yu, L., et al., Investigation of N-terminal glutamate cyclization of recombinant
monoclonal antibody in formulation development. J Pharm Biomed Anal, 2006. 42(4):
p. 455-63.
51. Haberger, M., et al., Assessment of chemical modifications of sites in the CDRs of
recombinant antibodies: Susceptibility vs. functionality of critical quality attributes.
MAbs, 2014. 6(2): p. 327-39.
52. Yan, B., et al., Succinimide formation at Asn 55 in the complementarity determining
region of a recombinant monoclonal antibody IgG1 heavy chain. J Pharm Sci, 2009.
98(10): p. 3509-21.
Chapter 4
138
4.0
Comparative Analysis of Monoclonal
Antibody N-Glycosylation using Stable
Isotope Tagging and UPLC-Fluorescence-MS
4.1 Introduction
Monoclonal antibody (mAb) N-glycosylation is a common post-translational modification,
present on each mAb heavy chain at the highly conserved asparagine 297 residue in the CH2
region of the Fc portion of mAbs. [1-3] In addition to preserving structural stability of the CH2
domain, glycosylation has been shown to play a critical role in the effector function of mAbs,
facilitating interaction with Fcγ receptors present on cells of the innate immune system. [4, 5]
Hence N-glycans are important in modulating therapeutic mAb efficacy e.g. by facilitating
antibody-dependent cell-mediated cytotoxicity, complement-dependent cytotoxicity and by
extending serum half-life. [6, 7] As glycosylation is a critical quality attribute (CQA),
quantitative structural characterisation of N-glycans present on antibody therapeutics is a
regulatory requirement as outlined in ICH Q6B. [8] Characterisation of N-glycans is normally
performed using liquid phase separation techniques with optical detection following
enzymatic liberation of N-glycans from the antibody and derivatisation with a fluorophore to
increase detection sensitivity. [9, 10] Despite recent advances in separation chemistries for
oligosaccharides, peak area based quantitation remains a subjective and laborious process due
to integration challenges for distorted peaks containing poorly or partially resolved N-glycans,
or due to the presence of multiple glycans within a single chromatographic peak. [11] Such
effects can result in either under reporting of a particular N-glycan or difficulties in the
alignment of data for subsequent statistical evaluation.
Relative or absolute quantitation, for the elucidation of protein differential expression, using
stable isotope labelling technology has become widely used in proteomics. Methods employed
include those in which a heavy analogue is either incorporated into the peptide metabolically,
e.g. stable isotope labelling with amino acids in cell culture (SILAC), or via chemical
derivatisation, e.g. stable isotope dimethylation of peptides. [12, 13] Quantitation is
performed by determining the levels of ‘light’ and ‘heavy’ analyte pairs present following a
single stage mass spectrometric analysis (MS1). Alternatively, isobaric tagging of analytes may

Chapter 4
139
be performed, wherein analytes are derivatised with reagents bearing the same nominal mass.
Using isobaric mass tags, quantitation is facilitated following the release of low mass reporter
ions during tandem mass spectrometric analysis of the precursor ion. [14] Isobaric tagging
offers the ability to multiplex higher numbers of experiments, however, problems with the
associated quantitative performance have been reported in cases where multiple ions with
mass to charge ratios (m/z) within the isolation window are selected and fragmented
simultaneously. [15, 16] Application of stable isotope methods for quantitative glycomics has
attracted attention with many published reports focusing upon heavy isotope incorporation
during permethylation of oligosaccharides prior to MALDI-MS analysis. [17-19] This approach
may be limited due to potential variance in light-heavy mass difference resulting from
inconsistencies in the number of available methylation sites for isotope incorporation on the
oligosaccharide. Recently, this limitation has been overcome by labelling of oligosaccharide
samples for comparison with either 13CH3I or 12CH2DI, respectively, which introduces a mass
difference of 2.922 mDa per methylation site. [20, 21] High resolution mass analysis using FT-
ICR or Orbitrap mass analysers are required to distinguish the resulting isotopic pair. Stable
isotope incorporation using reductive amination has also been reported prior to MALDI-MS
analysis using 13C6 or deuterated analogues of commonly used reagents for high sensitivity
fluorescence detection. [22-29]
In this Chapter, the development of a two-plex method for the quantitative analysis of N-
glycans present on a chimeric IgG1 monoclonal antibody is described, wherein released
oligosaccharides are labeled with light (12C6) or heavy (13C6) 2-aminobenzoic acid (2-AA) prior to
ultra-performance liquid chromatography (UPLC) with sequential fluorescence and accurate
mass quadrupole time of flight (QToF) mass spectrometric detection. Optimisation and
evaluation of the 12/13C6 2-AA tag was performed, which revealed a high level of technical
precision determined using both N-glycan standards and oligosaccharides released from
complex glycoproteins. The combination of isotopic labelling, UPLC separation and MS
detection facilitated full quantitative evaluation and structural annotation of N-glycans
present within the glycan pool under investigation. Minimisation of technical variation and
operator subjectivity is achieved through multiplexing reference and analytical samples into a
single LC-MS injection, demonstrating the suitability of the developed method for
comparability analysis of N-glycosylation on therapeutic glycoproteins.
The developed method was applied for comparability assessment of different commercial lots
of a chimeric IgG1 mAb. Comparison of different lots revealed notable differences in the levels
of sialylated N-glycans and N-glycans bearing galactose α1-3 linked galactose (α-gal) epitopes.

Chapter 4
140
Finally, considering the importance of N-glycosylation on the structural stability and effector
function of therapeutic mAbs, the developed method was also applied to determine potential
variations of the N-glycan profile on anti-Interleukin 8 (anti-IL8), a recombinant humanised
IgG1, following production under varied culture conditions. Variation of bioprocessing
conditions was found to results in changes to the glycoform profile, in particular changes to
galactosylation in response to culture pH and changes to fucosylation levels following
alterations in culture temperature.
4.2 Experimental
4.2.1 Reagents and Consumables
Standard N-glycans (A2F, NA2F, Man5, NA2) and Peptide-N-glycosidase F (PNGase F) were
purchased from Prozyme (San Leandro, CA). Bovine ribonuclease B (RNase B), Bovine fetuin,
Human serum IgG, 12C6 2-aminobenzoic acid, 13C6 2-aminobenzoic acid, Dimethyl sulfoxide
(DMSO), Acetic acid, Dithiothreitol (DTT), Iodoacetamide (IAA), and Formic acid were
purchased from Sigma-Aldrich (Wicklow, Ireland). Sodium cyanoborohydride, Water, 0.1 %
formic acid (LC-MS Optima), Acetonitrile, 0.1 % formic acid (LC-MS Optima) were purchased
from Fisher Scientific, (Dublin, Ireland). Nanosep 10 kDa centrifugal devices were obtained
from Pall (Port Washington, NY). Promega sequencing grade modified trypsin was from MyBio
Ltd. (Kilkenny, Ireland). Different commercial lots of the chimeric IgG1 monoclonal antibody
(mAb) for analysis were generously provided by San Cecilio University Hospital (Granada,
Spain).
4.2.2 Glycoprotein Deglycosylation
100 μg aliquots of each standard glycoprotein (RNase B, bovine fetuin and human serum IgG),
500 μg aliquots of commercial chimeric IgG1 and 250 μg aliquots of anti-IL8 IgG1 (produced in-
house using CHO DP12 cells and purified using Protein A affinity chromatography - Chapter 2,
Section 2.2.2.5), were reduced with 1 mM DTT for 10 minutes at 65oC and alkylated by
incubation with 5 mM IAA at room temperature in the dark for 30 minutes. N-glycans were
enzymatically released by overnight (16 hour) incubation with 500 Units of PNGase F at 37 °C
in 20 mM sodium bicarbonate buffer pH 7.0. The deglycosylation mixture was then
centrifuged through a 10 kDa molecular weight cut-off (MWCO) to remove the protein. The
filtrate containing the released glycans was reduced to dryness via vacuum centrifugation.

Chapter 4
141
Once dry, the released glycans were treated with 50 μL of 1% v/v aqueous formic acid to
ensure complete conversion to the reducing sugar form prior to derivatisation.
4.2.3 Derivatisation of free glycans with 12C6 / 13C6 2-aminobenzoic acid
Glycan samples were derivatised with either light or heavy 2-AA by reductive amination in the
presence of sodium cyanoborohydride. 5 µL of a freshly prepared solution of 0.37M 12C6 2-AA
or 13C6 2-AA containing 1 M NaCNBH3 prepared in DMSO/acetic acid (70:30), were added to
the dried glycans and incubated for 5 hours at 65 °C. Following labelling the light and heavy
samples were mixed together and prepared with 5 µL of purified water and 85 µL of
acetonitrile. N-glycans were purified by HILIC chromatography using a Thermo Ultimate 3000
RS UHPLC equipped with a BEH Glycan 2.1 x 50 mm, 1.7 µm analytical column (Waters). Briefly
samples were introduced onto the column using a mobile phase composition of 32.5% 50 mM
Ammonium formate, pH 4.5 and 67.5% acetonitrile. Following removal of excess fluorophore,
the gradient composition was switched to 20% acetonitrile to enable elution of 2-AA
derivatised N-glycans. Subsequently samples were dried via vacuum centrifugation. The
cleaned N-glycans were re-suspended in 25 µL of purified water and stored at -40 °C pending
analysis.
4.2.4 Separation of 2AA-labeled glycans UPLC-FLR-MS
Labeled N-glycans were separated using a Waters Acquity UPLC BEH Amide (1.0 x 150 mm, 1.7
µm) column coupled to an Acquity UPLC equipped with online fluorescence detection (Waters
Corporation, Milford, MA, USA). The fluorescence excitation and emission wavelength
parameters were 350 and 425 nm, respectively. The flow rate was 0.150 mL.min-1 and column
temperature was maintained at 60°C. A binary gradient of 50 mM ammonium formate, pH 4.4
(A) and acetonitrile (B) was used as follows: 28% A for 1 min, 28-43% A for 30 minutes, 43-70
% A for 1 minute, 70 % A for 3 min, 70-28% solvent A for 1 min and finally 28 % A for 4
minutes. Samples were diluted in 75% acetonitrile prior to analysis and sample injection
volume was 8 μL. The outlet of the chromatographic system was directly coupled to a Waters
Xevo G2 QToF mass spectrometer (Milford, MA, USA) equipped with an electrospray ionisation
interface. The instrument was operated in negative ion mode with a capillary voltage of 1.80
kV. The ion source and nitrogen desolvation gas temperatures were set at 120°C and 400°C,
respectively. The desolvation gas flow rate was 600 L/h. The cone voltage was maintained at
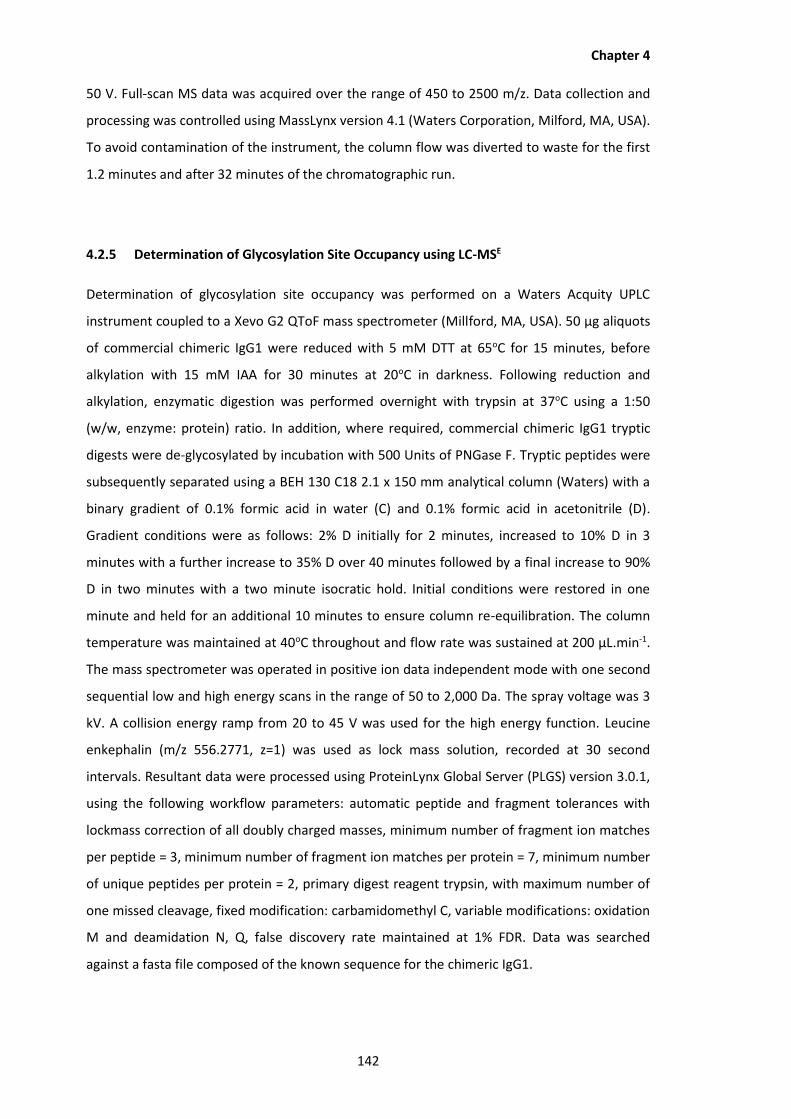
Chapter 4
142
50 V. Full-scan MS data was acquired over the range of 450 to 2500 m/z. Data collection and
processing was controlled using MassLynx version 4.1 (Waters Corporation, Milford, MA, USA).
To avoid contamination of the instrument, the column flow was diverted to waste for the first
1.2 minutes and after 32 minutes of the chromatographic run.
4.2.5 Determination of Glycosylation Site Occupancy using LC-MSE
Determination of glycosylation site occupancy was performed on a Waters Acquity UPLC
instrument coupled to a Xevo G2 QToF mass spectrometer (Millford, MA, USA). 50 μg aliquots
of commercial chimeric IgG1 were reduced with 5 mM DTT at 65oC for 15 minutes, before
alkylation with 15 mM IAA for 30 minutes at 20oC in darkness. Following reduction and
alkylation, enzymatic digestion was performed overnight with trypsin at 37oC using a 1:50
(w/w, enzyme: protein) ratio. In addition, where required, commercial chimeric IgG1 tryptic
digests were de-glycosylated by incubation with 500 Units of PNGase F. Tryptic peptides were
subsequently separated using a BEH 130 C18 2.1 x 150 mm analytical column (Waters) with a
binary gradient of 0.1% formic acid in water (C) and 0.1% formic acid in acetonitrile (D).
Gradient conditions were as follows: 2% D initially for 2 minutes, increased to 10% D in 3
minutes with a further increase to 35% D over 40 minutes followed by a final increase to 90%
D in two minutes with a two minute isocratic hold. Initial conditions were restored in one
minute and held for an additional 10 minutes to ensure column re-equilibration. The column
temperature was maintained at 40oC throughout and flow rate was sustained at 200 µL.min-1.
The mass spectrometer was operated in positive ion data independent mode with one second
sequential low and high energy scans in the range of 50 to 2,000 Da. The spray voltage was 3
kV. A collision energy ramp from 20 to 45 V was used for the high energy function. Leucine
enkephalin (m/z 556.2771, z=1) was used as lock mass solution, recorded at 30 second
intervals. Resultant data were processed using ProteinLynx Global Server (PLGS) version 3.0.1,
using the following workflow parameters: automatic peptide and fragment tolerances with
lockmass correction of all doubly charged masses, minimum number of fragment ion matches
per peptide = 3, minimum number of fragment ion matches per protein = 7, minimum number
of unique peptides per protein = 2, primary digest reagent trypsin, with maximum number of
one missed cleavage, fixed modification: carbamidomethyl C, variable modifications: oxidation
M and deamidation N, Q, false discovery rate maintained at 1% FDR. Data was searched
against a fasta file composed of the known sequence for the chimeric IgG1.

Chapter 4
143
4.3 Results and Discussion
Quantitative structural analysis of N-glycans present on therapeutic glycoproteins is required
by regulatory agencies for new drug applications and to demonstrate correlation between
different manufacture batches, biosimilars or following changes to a bioprocess. Despite
advances in separation chemistries for glycosylation profiling, the presence of multiple glycan
structures in a single peak or peak distortion as a result of partial or poor resolution of closely
eluting oligosaccharide structures, can affect relative peak area based quantitation. Although
LC-MS analysis of N-glycans may overcome these challenges, potential differences with
ionisation efficiencies or instrument response factors may lead to distorted results. These
issues may be circumvented using stable isotope tagging methods as comparative samples are
combined following labelling and analysed in a single LC-MS injection. Hence, technical
variation of the measurement is minimized and comparability assessment based upon the
relative ratio of the light and heavy peaks for each glycan present may be facilitated. In this
Chapter, the development and application of a two-plex stable isotope labelling strategy for
the comparability assessment of N-glycans present on commercial chimeric IgG1 using 12/13C6
2-AA labelling prior to hydrophilic interaction UPLC with sequential fluorescence and accurate
mass QToF-MS detection is described. Application of the method for the determination of lot-
to-lot consistency of the N-glycans present on the chimeric IgG1 and to evaluate changes to
the N-glycan profile on anti-IL8 IgG1 following culture under varied bioprocessing conditions is
described.
4.3.1 Optimisation and Evaluation of 12/13C6 2-AA Performance
Initial investigations focused upon the optimisation of the 2-AA conjugation reaction to ensure
complete N-glycan derivatisation. Glycans are labelled using a two-step reductive amination
reaction, wherein the primary amide group of 2-AA reacts with the aldehyde group of a glycan
in a condensation reaction to form a Schiff’s base. The resulting imine group is then reduced
using sodium cyanoborohydride to form a stable labeled glycans, as shown in Figure 4.1.

Chapter 4
144
Figure 4.1: Labelling of glycans using 2-aminobenzoic acid (2-AA). Glycans are labelled using a
two-step reductive amination reaction, wherein the primary amide group of 2-AA reacts with
the aldehyde group of a glycan in a condensation reaction to form a Schiff’s base. The resulting
imine group is then reduced using sodium cyanoborohydride to form a stable labeled glycans.
Hydrophilic interaction UPLC with sequential fluorescence and MS detection was employed to
facilitate the detection of the fluorescent oligosaccharide 2-AA conjugate and also any
underivatised N-glycans present following the derivatisation reaction. Reaction time was
systematically optimised using a combination of oligomannose N-glycans release from RNase B
and complex sialylated N-glycans released from bovine fetuin to ensure complete
derivatisation whilst maintaining oligosaccharide integrity. Figure 4.2 shows the determined
conjugation efficiency following incubation for various reaction times. From this data it was
determined that the optimum incubation time for labelling was 5 hours at 65oC in 0.37 M 2-AA
containing 1 M sodium cyanoborohydride in 70:30 DMSO acetic acid.

Chapter 4
145
Figure 4.2: Optimisation of 2-AA labelling reaction time. Oligomannose N-glycans released
from RNase B and complex sialylated N-glycans released from bovine fetuin were incubated
with 0.37 M 2-AA containing 1 M sodium cyanoborohydride in 70:30 DMSO acetic acid using a
range of incubation times. The optimum incubation time determined was 5 hours at 65 oC.
Above this time desialylation of sialylated N-glycans was observed.
Following optimisation of the N-glycan derivatisation conditions, the quantitative response of
the 12/13C6 2-AA analogues was then determined using N-glycan standards labeled and mixed in
a 1:1 light: heavy molar ratio. Quantitation of the resulting LC-MS, i.e. the ratio of the sum of
the extracted mass chromatogram peak areas generated using the combination of the 12C6
isotopes relative to the 13C6 isotopic data for the [M-2H]2- pseudomolecular ion, [25] did not
provide the expected 1:1 ratio. To investigate the root cause of this observation the purity of
the 12C6 2-AA and the 13C6 2-AA reagents was evaluated using reversed phase liquid
chromatography with UV and MS detection which revealed the presence of an impurity in the
13C6 2-AA reagent (~33%). This impurity exhibited low solubility in 70:30 DMSO/acetic acid and
did not react with the N-glycans to form a conjugated product. Correction for the purity of the
13C6 2-AA reagent facilitated the experimental achievement of the expected 1:1 ratio for
equimolar concentrations of N-glycan standards labeled with the light and heavy reagents
(Figure 4.3-A).
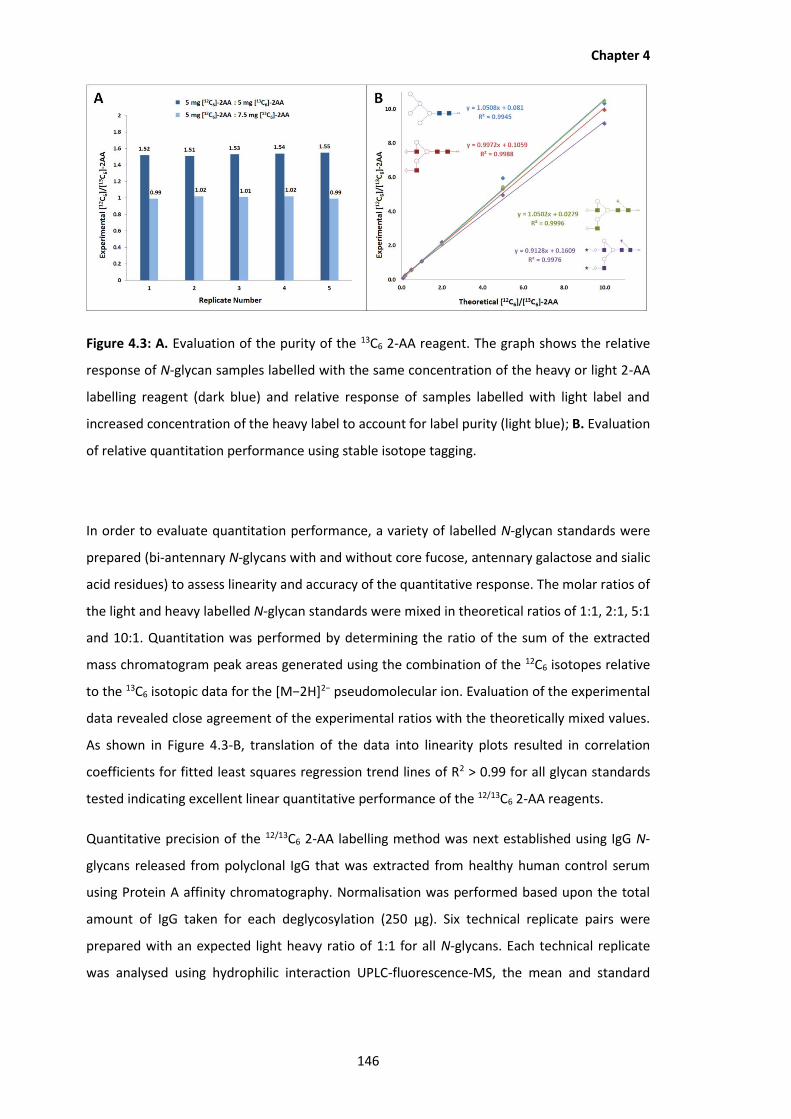
Chapter 4
146
Figure 4.3: A. Evaluation of the purity of the 13C6 2-AA reagent. The graph shows the relative
response of N-glycan samples labelled with the same concentration of the heavy or light 2-AA
labelling reagent (dark blue) and relative response of samples labelled with light label and
increased concentration of the heavy label to account for label purity (light blue); B. Evaluation
of relative quantitation performance using stable isotope tagging.
In order to evaluate quantitation performance, a variety of labelled N-glycan standards were
prepared (bi-antennary N-glycans with and without core fucose, antennary galactose and sialic
acid residues) to assess linearity and accuracy of the quantitative response. The molar ratios of
the light and heavy labelled N-glycan standards were mixed in theoretical ratios of 1:1, 2:1, 5:1
and 10:1. Quantitation was performed by determining the ratio of the sum of the extracted
mass chromatogram peak areas generated using the combination of the 12C6 isotopes relative
to the 13C6 isotopic data for the [M−2H]2− pseudomolecular ion. Evaluation of the experimental
data revealed close agreement of the experimental ratios with the theoretically mixed values.
As shown in Figure 4.3-B, translation of the data into linearity plots resulted in correlation
coefficients for fitted least squares regression trend lines of R2 > 0.99 for all glycan standards
tested indicating excellent linear quantitative performance of the 12/13C6 2-AA reagents.
Quantitative precision of the 12/13C6 2-AA labelling method was next established using IgG N-
glycans released from polyclonal IgG that was extracted from healthy human control serum
using Protein A affinity chromatography. Normalisation was performed based upon the total
amount of IgG taken for each deglycosylation (250 μg). Six technical replicate pairs were
prepared with an expected light heavy ratio of 1:1 for all N-glycans. Each technical replicate
was analysed using hydrophilic interaction UPLC-fluorescence-MS, the mean and standard

Chapter 4
147
deviation of the six technical replicates was determined, resulting data is depicted in Figure
4.4.
Figure 4.4: Annotated fluorescence and base peak intensity chromatograms for N-glycans
released from polyclonal human serum IgG. The bar chart underneath the chromatograms
depicts the mean light to heavy relative ratio as experimentally determined for the six
technical replicates analyzed, y-error bars are also included at ± the standard deviation of the
six technical replicates.
Annotation of the N-glycans present in each chromatographic peak was based upon the
oligosaccharide composition as derived from the m/z value, expression of the retention time
as a glucose unit value, comparison with an in-house database and MS/MS analysis for
structural confirmation where required. Excellent precision was established for the six
replicate analysis of the light heavy pairs with the expected 1:1 light-heavy ratio obtained and

Chapter 4
148
with an average percentage error of ~5% across all N-glycans annotated, (range 2-9%),
demonstrating the excellent precision of the described approach.
4.3.2 Comparability Assessment of Different Lots of a Commercial mAb using 12/13C6 2-AA
N-Glycan UPLC-Fluorescence-MS
The developed two-plex 12/13C6 2-AA labelling hydrophilic interaction UPLC-fluorescence-MS
approach was applied to investigate the consistency of N-glycans present on two different
commercial lots of a chimeric IgG1 mAb. To ensure validity of the generated data, the
experimental design focused upon triplicate analysis of technical replicates (lot 1 versus lot 1,
lot 2 versus lot 2 and finally, lot 1 versus lot 2), with each comparison normalised based upon
the amount of mAb taken for deglycosylation (500 μg). Twenty four structures were annotated
and relative quantitation was inferred from the light to heavy ratios for each oligosaccharide
present. Resulting data is displayed in Table 4.1, which lists the mean light-heavy ratio for each
N-glycan and the standard deviation of the triplicate measurement (displayed in parenthesis).
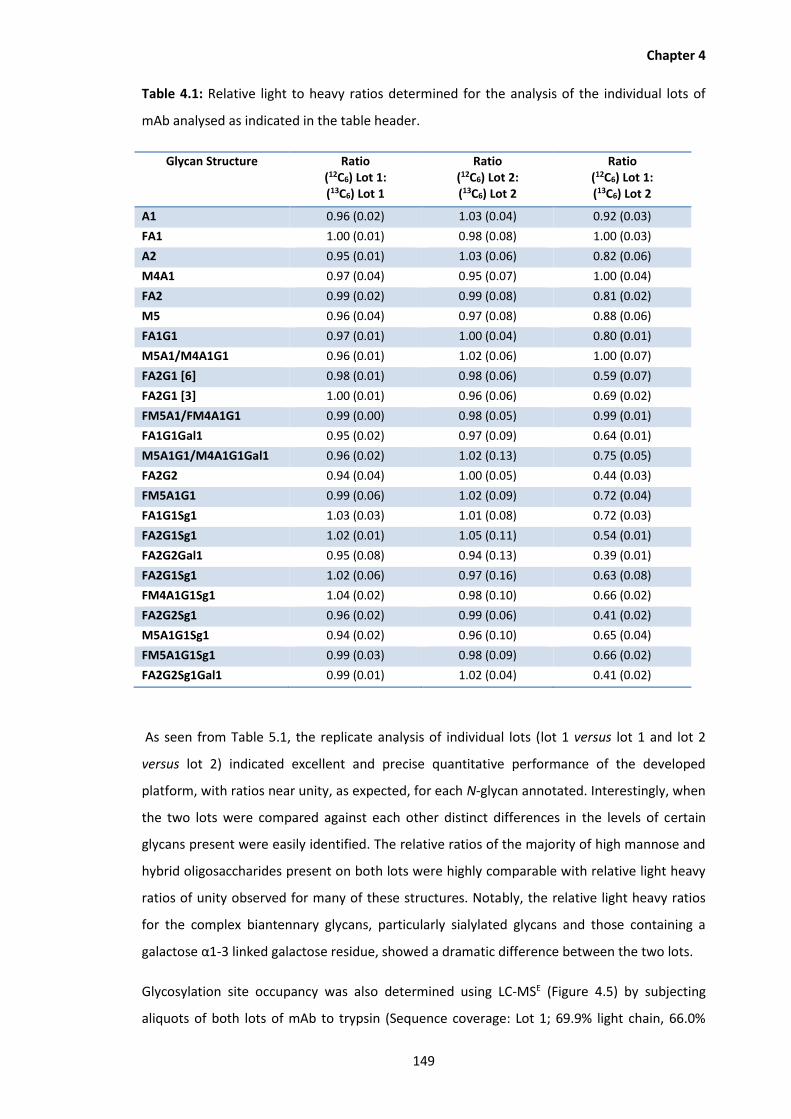
Chapter 4
149
Table 4.1: Relative light to heavy ratios determined for the analysis of the individual lots of
mAb analysed as indicated in the table header.
Glycan Structure Ratio (12C6) Lot 1: (13C6) Lot 1
Ratio (12C6) Lot 2: (13C6) Lot 2
Ratio (12C6) Lot 1: (13C6) Lot 2
A1 0.96 (0.02) 1.03 (0.04) 0.92 (0.03)
FA1 1.00 (0.01) 0.98 (0.08) 1.00 (0.03)
A2 0.95 (0.01) 1.03 (0.06) 0.82 (0.06)
M4A1 0.97 (0.04) 0.95 (0.07) 1.00 (0.04)
FA2 0.99 (0.02) 0.99 (0.08) 0.81 (0.02)
M5 0.96 (0.04) 0.97 (0.08) 0.88 (0.06)
FA1G1 0.97 (0.01) 1.00 (0.04) 0.80 (0.01)
M5A1/M4A1G1 0.96 (0.01) 1.02 (0.06) 1.00 (0.07)
FA2G1 [6] 0.98 (0.01) 0.98 (0.06) 0.59 (0.07)
FA2G1 [3] 1.00 (0.01) 0.96 (0.06) 0.69 (0.02)
FM5A1/FM4A1G1 0.99 (0.00) 0.98 (0.05) 0.99 (0.01)
FA1G1Gal1 0.95 (0.02) 0.97 (0.09) 0.64 (0.01)
M5A1G1/M4A1G1Gal1 0.96 (0.02) 1.02 (0.13) 0.75 (0.05)
FA2G2 0.94 (0.04) 1.00 (0.05) 0.44 (0.03)
FM5A1G1 0.99 (0.06) 1.02 (0.09) 0.72 (0.04)
FA1G1Sg1 1.03 (0.03) 1.01 (0.08) 0.72 (0.03)
FA2G1Sg1 1.02 (0.01) 1.05 (0.11) 0.54 (0.01)
FA2G2Gal1 0.95 (0.08) 0.94 (0.13) 0.39 (0.01)
FA2G1Sg1 1.02 (0.06) 0.97 (0.16) 0.63 (0.08)
FM4A1G1Sg1 1.04 (0.02) 0.98 (0.10) 0.66 (0.02)
FA2G2Sg1 0.96 (0.02) 0.99 (0.06) 0.41 (0.02)
M5A1G1Sg1 0.94 (0.02) 0.96 (0.10) 0.65 (0.04)
FM5A1G1Sg1 0.99 (0.03) 0.98 (0.09) 0.66 (0.02)
FA2G2Sg1Gal1 0.99 (0.01) 1.02 (0.04) 0.41 (0.02)
As seen from Table 5.1, the replicate analysis of individual lots (lot 1 versus lot 1 and lot 2
versus lot 2) indicated excellent and precise quantitative performance of the developed
platform, with ratios near unity, as expected, for each N-glycan annotated. Interestingly, when
the two lots were compared against each other distinct differences in the levels of certain
glycans present were easily identified. The relative ratios of the majority of high mannose and
hybrid oligosaccharides present on both lots were highly comparable with relative light heavy
ratios of unity observed for many of these structures. Notably, the relative light heavy ratios
for the complex biantennary glycans, particularly sialylated glycans and those containing a
galactose α1-3 linked galactose residue, showed a dramatic difference between the two lots.
Glycosylation site occupancy was also determined using LC-MSE (Figure 4.5) by subjecting
aliquots of both lots of mAb to trypsin (Sequence coverage: Lot 1; 69.9% light chain, 66.0%
Chapter 4
150
heavy chain, Lot 2; 66.2% light chain, 56.2% heavy chain) and PNGase F followed by trypsin
(Sequence coverage: Lot 1; 50.9% light chain, 52.0% heavy chain, Lot 2; 44.4% light chain,
39.1% heavy chain). The relative peak area of the unoccupied glycopeptide (EEQYNSTYR) and
the deamidated glycopeptide (EEQYDSTYR) generated following enzymatic deglycosylation
were evaluated, enabling N-glycosylation site occupancy of 99.92 and 99.90% to be
determined for lot 1 and lot 2, respectively. The reason for the difference in N-glycosylation
between the two commercial lots is unclear but may be process related, for example, cellular
age at time of harvest has been previously demonstrated to exhibit a similar effect of the
glycosylation of an IgG4 mAb produced in CHO. [30] Process manufacturing changes have also
been shown to be detectable through the analysis of different lots of drug product. [31] It is
acknowledged that many more drug product lots would need to be analysed to deduce such a
conclusion; however, the presented two-plex 12/13C6 2-AA labelling method represents a simple
and eloquent solution for glycosylation comparability analysis, capable of detecting substantial
differences between products as demonstrated due to the minimisation of technical variability
and operator subjectivity from the analysis.

Chapter 4
151
Figure 4.5: Determination of glycosylation site occupancy. A. Representative base peak
chromatogram obtained following LC-MSE analysis of tryptic peptides, B. Extracted ion
chromatogram for EEQYDSTYR, C. MS spectrum corresponding to EEQYDSTYR, D. MS/MS
spectrum for EEQYDSTYR showing identified b and y ions and amino acid sequence.
4.3.3 Comparability Assessment of Anti-IL8 IgG1 N-glycan Profile in Response to
Conditions of Altered Bioprocessing Using 12/13C6 2-AA N-Glycan UPLC-Fluorescence-
MS
Glycosylation is a CQA of therapeutic proteins, which can modulate the efficacy of mAbs in-
vivo, hence an ability to achieve a consistent glycoform profile is desired in biopharmaceutical
production. In recent times, regulatory agencies including the U.S. Food and Drug
Administration (FDA) have suggested a quality by design (QbD) approach to biopharmaceutical
manufacture, wherein quality is designed into a drug product through greater understanding
of the processes that are used in their manufacture. [32] In the QbD paradigm, a product is
produced using process parameters that are maintained within a ‘design space’, in which the
CQA’s of a drug product are consistently achieved. In this section the developed 12/13C6 2-AA N-
Glycan UPLC-Fluorescence-MS platform was applied to evaluate changes to the N-
glycosylation profile of a mAb that has been produced under bioprocessing conditions that
were altered but maintained within typical limits of a design-space for upstream

Chapter 4
152
bioprocessing. Anti-IL8 was produced in CHO DP-12 cells that were prepared in cultures
maintained at various pH, temperature and dissolved oxygen (DO) settings as described in
Chapter 2, Section 2.2. N-glycans released from Protein A-purified mAb produced in each of
these cultures were prepared as described in section 4.2.
Method performance of the 12/13C6 2-AA N-Glycan UPLC-Fluorescence-MS platform was
confirmed using mAb N-glycans released from anti-IL8 that had been secreted from CHO DP12
cells cultured using standard conditions (pH 7.0, 85% DO, 37oC). Normalisation was performed
based upon the total amount of IgG used for each deglycosylation (250 µg). Five technical
replicate pairs were prepared with an expected light heavy ratio of 1:1 for all N-glycans. Each
technical replicate was analysed using hydrophilic interaction UPLC-fluorescence-MS and the
mean and standard deviation of the five technical replicates was determined (data shown in
Figure 4.6). Composition of N-glycans present in each chromatographic peak was derived from
the m/z value, expression of the retention time as a glucose unit value and comparison with
an in-house database. Acceptable accuracy and precision was established for the five replicate
analyses with the expected 1:1 light-heavy ratio obtained for all N-glycans annotated with the
exception of one species, namely MAN5. MAN5 was present at levels that were too low to
facilitate accurate quantitation and hence this species will not be considered for quantitation
when reporting N-glycan species present in anti-IL8 IgG1 samples. The remaining annotated N-
glycan species were found to have an average percentage error of <3% (range 1-8%)
confirming excellent method performance.
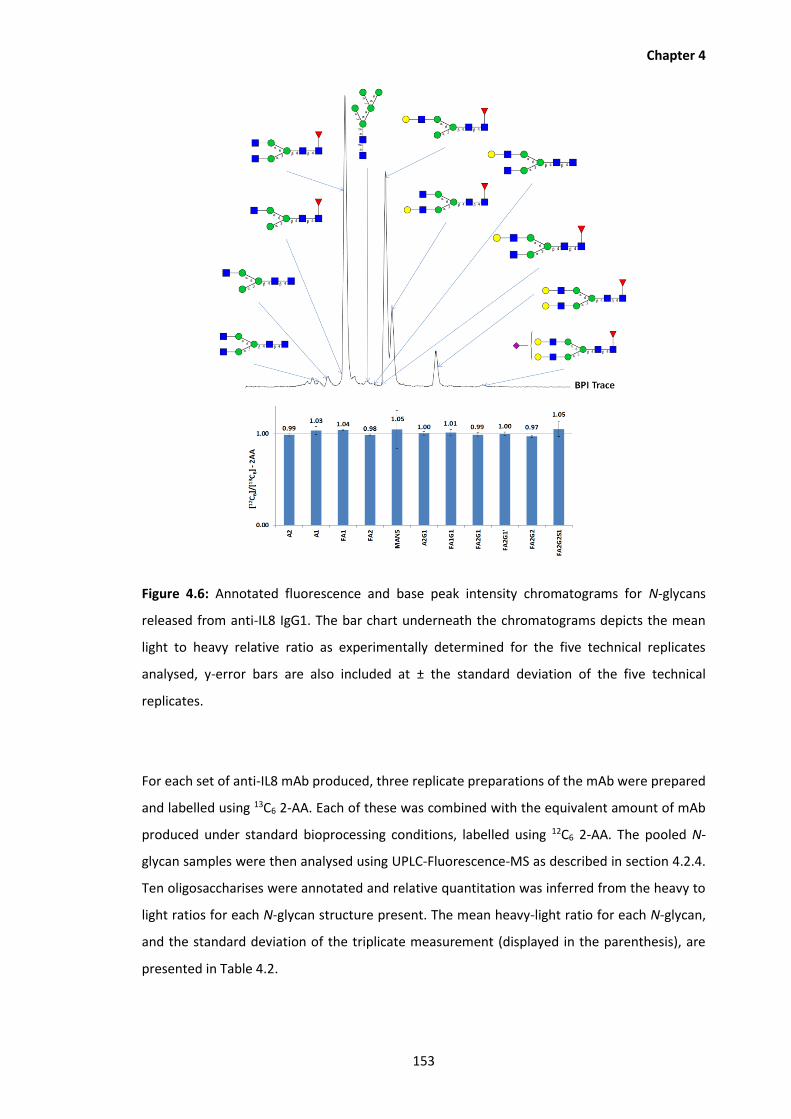
Chapter 4
153
Figure 4.6: Annotated fluorescence and base peak intensity chromatograms for N-glycans
released from anti-IL8 IgG1. The bar chart underneath the chromatograms depicts the mean
light to heavy relative ratio as experimentally determined for the five technical replicates
analysed, y-error bars are also included at ± the standard deviation of the five technical
replicates.
For each set of anti-IL8 mAb produced, three replicate preparations of the mAb were prepared
and labelled using 13C6 2-AA. Each of these was combined with the equivalent amount of mAb
produced under standard bioprocessing conditions, labelled using 12C6 2-AA. The pooled N-
glycan samples were then analysed using UPLC-Fluorescence-MS as described in section 4.2.4.
Ten oligosaccharises were annotated and relative quantitation was inferred from the heavy to
light ratios for each N-glycan structure present. The mean heavy-light ratio for each N-glycan,
and the standard deviation of the triplicate measurement (displayed in the parenthesis), are
presented in Table 4.2.

Chapter 4
154
Distinct differences in the N-glycoform profile of anti-IL8 were observed following production
in a range of bioprocessing conditions. The most obvious trend in glycoform profile changes
were observed for those mAbs that were cultured with increased or decreased pH settings.
Anti-IL8 produced in culture maintained at pH 7.2 was found to contain higher levels of
galactosylation compared to cultures maintained at pH 7.0, whereas a shift towards decreased
galactosylation of glycan chains was observed at pH 6.8. Both cell culture at 39.5oC and also at
110% DO resulted in higher proportions of afucosylated species.
Changes to the levels of therapeutic protein N-glycans in response to bioprocessing conditions
has been a focus of several studies, most notably for erythropoietin (EPO) producing cell lines
due to potential effect on serum half-life of EPO. [2] In this study, the greatest proportion of
sialylated N-glycans were observed on anti-IL8 mAb produced at pH 7.2 when compared to
those secreted at pH 7.0, whereas a reduction in sialylated species was observed for mAb
samples produced at a higher temperature (39.5oC) or at higher DO levels (110%). Trummer et
al. [33] found the highest concentration of sialylated species at pH 7.0, on CHO-produced
homodimeric fusion protein Epo-Fc, compared to those produced at higher and lower pH
settings. A reduction in sialic acid content of the glycoform profile for EPO under conditions of
both reduced temperature (30-35oC) and high dissolved oxygen (70-100%) were also noted.
Conversely, Yoon et al. [34] detected a decrease in sialic acid content as pH was increased in
EPO-producing CHO cultures.
As trends in glycoprofile changes observed herein, and changes in glycan profiles in response
to variations in bioprocess conditions reported in the literature do not correlate, it may be
suggested that the effects of alterations of various bioprocess parameters are cell line or
product dependent rather than exclusively bioprocess dependent. Hence, incorporation of
QbD into a final drug product may require a more holistic understanding of the effects of
culture process, cell type and the therapeutic protein itself, along with a greater
understanding of metabolic pathways to gain physiological insights.

Chapter 4
155
Table 4.2: Relative light to heavy ratios determined for the analysis of anti-IL8 IgG1. N-glycan
species released from IgG1 cultured under standard conditions with one parameter varied, as
outline in the table header information, were labelled using 12C6 2-AA, while those from
cultures maintained at standard conditions (37oC, 85% DO, pH7.0) were labelled using 13C6 2-
AA.
Glycan Structure
m/z Altered Bioprocessing Condition
High T. mAb (39.5oC)
Low T. mAb (32.0oC)
High pH mAb (pH 7.2)
Low pH mAb (pH 6.8) (pH 6.8)
High DO mAb (110%)
Low DO mAb (65%)
A1 616.230 1.09 (0.09)
0.90 (0.11)
0.98 (0.04)
0.84 (0.02)
1.15 (0.07)
1.01 (0.11)
FA1 689.259 0.82 (0.05)
1.03 (0.05)
0.96 (0.01)
0.78 (0.01)
0.89 (0.01)
1.05 (0.02)
FA1G1 770.285 0.97 (0.10)
0.95 (0.02)
1.16 (0.04)
0.95 (0.03)
0.91 (0.07)
0.92 (0.15)
A2 717.770 1.17 (0.12)
0.93 (0.05)
0.91 (0.02)
0.84 (0.03)
1.21 (0.03)
1.17 (0.15)
FA2 790.799 0.89 (0.04)
1.12 (0.06)
0.87 (0.00)
0.86 (0.01)
0.96 (0.03)
1.16 (0.04)
A2G1 798.796 1.07 (0.04)
0.87 (0.09)
1.11 (0.12)
1.00 (0.02)
1.18 (0.05)
0.82 (0.06)
FA2G1 871.825 0.99 (0.05)
1.08 (0.06)
1.09 (0.01)
0.99 (0.01)
0.95 (0.03)
1.06 (0.03)
FA2G1' 871.825 0.96 (0.06)
1.03 (0.03)
1.13 (0.05)
0.98 (0.04)
1.00 (0.05)
1.04 (0.04)
FA2G2 952.851 1.18 (0.06)
1.02 (0.03)
1.26 (0.02)
1.07 (0.04)
0.92 (0.02)
1.01 (0.04)
FA2G2S1 1098.392 0.83 (0.05)
1.07 (0.17)
1.35 (0.04)
1.09 (0.06)
0.84 (0.07)
1.09 (0.01)
4.4 Conclusions
The development and application of a two-plex method for comparative glycomics of N-
glycosylation present on mAbs, based upon the differential labelling of samples for
comparison with either ‘light’ 12C6 2-AA or ‘heavy’ 13C6 2-AA prior to hydrophilic interaction
UPLC with sequential fluorescence and accurate mass QToF-MS detection, is described.
Optimisation of 2-AA conjugation was investigated followed by an evaluation of the
quantitative performance of the 12/13C6 2-AA labeled N-glycans. The method was found to be
linear, evaluated using reference N-glycan standards, and precise with expected light heavy
relative ratios of approximately unity determined for six technical replicate analyses of the N-

Chapter 4
156
glycans present on polyclonal serum IgG. Application of the method for lot-to-lot
comparability analysis of a commercial chimeric IgG1 mAb revealed alterations in the levels of
certain glycans, in particular sialylated bi-antennary glycans and glycans bearing galactose α1-
3 linked galactose residues between the two drug product lots. Additionally a comparability
assessment of anti-IL8 IgG1 N-glycan profile in response to conditions of altered bioprocessing
using the developed platform revealed changes to the glycoform profile of anti-IL8, notably for
galactose-containing N-glycans produced in cultures at pH 7.2 and afucosylated species
produced in cultures maintained at 110% DO.
The presented method is ideally suited for comparability analyses due to the minimisation of
technical variation and operator subjectivity from the analysis, combined with the ability to
perform full quantitative structural characterisation of all oligosaccharides, including isomeric
species, present in the glycan pool. The method builds on widely used and understood
chemistry and concepts but adds an additional dimension through the application of the stable
isotope labelling based quantitation. The described platform can be readily employed for
physiochemical demonstration of molecular comparability following process or manufacturing
changes, or for the assessment of similarity between innovator and biosimilar candidate
molecules.
4.5 Associated Publication and Author Contributions
Published in part: Millán Martín, S., et al., Comparative analysis of monoclonal antibody N-
glycosylation using stable isotope labelling and UPLC-fluorescence-MS. Analyst, 2015, 140(5):
1442-7.
Research study devised by Amy Farrell, Silvia Millán Martín and Jonathan Bones; Research
performed by Amy Farrell, Silvia Millán Martín and Cedric Delporte; Natalia Navas Iglesias
provided commercial samples; Data and related paper were reviewed by Jonathan Bones and
Niaobh McLoughlin.

Chapter 4
157
4.6 References
1. Nimmerjahn, F. and J.V. Ravetch, Fcgamma receptors as regulators of immune
responses. Nat Rev Immunol, 2008. 8(1): p. 34-47.
2. Walsh, G. and R. Jefferis, Post-translational modifications in the context of therapeutic
proteins. Nat Biotechnol, 2006. 24(10): p. 1241-52.
3. Zheng, K., C. Bantog, and R. Bayer, The impact of glycosylation on monoclonal antibody
conformation and stability. MAbs, 2011. 3(6): p. 568-76.
4. Arnold, J.N., et al., The impact of glycosylation on the biological function and structure
of human immunoglobulins. Annu Rev Immunol, 2007. 25: p. 21-50.
5. Krapp, S., et al., Structural analysis of human IgG-Fc glycoforms reveals a correlation
between glycosylation and structural integrity. J Mol Biol, 2003. 325(5): p. 979-89.
6. Hodoniczky, J., Y.Z. Zheng, and D.C. James, Control of recombinant monoclonal
antibody effector functions by Fc N-glycan remodeling in vitro. Biotechnol Prog, 2005.
21(6): p. 1644-52.
7. Elliott, S., et al., Enhancement of therapeutic protein in vivo activities through
glycoengineering. Nat Biotechnol, 2003. 21(4): p. 414-21.
8. International Conference on Harmonisation, 2012, ICH Harmonised Tripartite
Guideline, Development and Manufacture of Drug Substances (Chemical Entities and
Biotechnological/Biological Entities) Q11. Retrieved 28 May 2016 from
http://www.ich.org/fileadmin/Public_Web_Site/ICH_Products/Guidelines/Quality/Q1
1/Q11_Step_4.pdf.
9. Marino, K., et al., A systematic approach to protein glycosylation analysis: a path
through the maze. Nat Chem Biol, 2010. 6(10): p. 713-23.
10. Mittermayr, S., et al., Multiplexed analytical glycomics: rapid and confident IgG N-
glycan structural elucidation. J Proteome Res, 2011. 10(8): p. 3820-9.
11. Zauner, G., A.M. Deelder, and M. Wuhrer, Recent advances in hydrophilic interaction
liquid chromatography (HILIC) for structural glycomics. Electrophoresis, 2011. 32(24):
p. 3456-66.

Chapter 4
158
12. Boersema, P.J., et al., Triplex protein quantification based on stable isotope labeling by
peptide dimethylation applied to cell and tissue lysates. Proteomics, 2008. 8(22): p.
4624-32.
13. Ong, S.E., et al., Stable isotope labeling by amino acids in cell culture, SILAC, as a
simple and accurate approach to expression proteomics. Mol Cell Proteomics, 2002.
1(5): p. 376-86.
14. Christoforou, A.L. and K.S. Lilley, Isobaric tagging approaches in quantitative
proteomics: the ups and downs. Anal Bioanal Chem, 2012. 404(4): p. 1029-37.
15. Ow, S.Y., et al., iTRAQ underestimation in simple and complex mixtures: "the good, the
bad and the ugly". J Proteome Res, 2009. 8(11): p. 5347-55.
16. Savitski, M.M., et al., Measuring and managing ratio compression for accurate
iTRAQ/TMT quantification. J Proteome Res, 2013. 12(8): p. 3586-98.
17. Alvarez-Manilla, G., et al., Tools for glycomics: relative quantitation of glycans by
isotopic permethylation using 13CH3I. Glycobiology, 2007. 17(7): p. 677-87.
18. Kang, P., et al., Comparative glycomic mapping through quantitative permethylation
and stable-isotope labeling. Anal Chem, 2007. 79(16): p. 6064-73.
19. Hu, Y., J.L. Desantos-Garcia, and Y. Mechref, Comparative glycomic profiling of
isotopically permethylated N-glycans by liquid chromatography/electrospray ionization
mass spectrometry. Rapid Commun Mass Spectrom, 2013. 27(8): p. 865-77.
20. Atwood, J.A., 3rd, et al., Quantitation by isobaric labeling: applications to glycomics. J
Proteome Res, 2008. 7(1): p. 367-74.
21. Botelho, J.C., et al., Quantification by isobaric labeling (QUIBL) for the comparative
glycomic study of O-linked glycans. International Journal of Mass Spectrometry, 2008.
278: p. 137–142.
22. Gimenez, E., V. Sanz-Nebot, and A. Rizzi, Relative quantitation of glycosylation variants
by stable isotope labeling of enzymatically released N-glycans using [12C]/[13C] aniline
and ZIC-HILIC-ESI-TOF-MS. Anal Bioanal Chem, 2013. 405(23): p. 7307-19.
23. Hitchcock, A.M., C.E. Costello, and J. Zaia, Glycoform quantification of
chondroitin/dermatan sulfate using a liquid chromatography-tandem mass
spectrometry platform. Biochemistry, 2006. 45(7): p. 2350-61.

Chapter 4
159
24. Hitchcock, A.M., et al., Optimized extraction of glycosaminoglycans from normal and
osteoarthritic cartilage for glycomics profiling. Glycobiology, 2007. 17(1): p. 25-35.
25. Prien, J.M., et al., Mass spectrometric-based stable isotopic 2-aminobenzoic acid
glycan mapping for rapid glycan screening of biotherapeutics. Anal Chem, 2010. 82(4):
p. 1498-508.
26. Tep, S., M. Hincapie, and W.S. Hancock, The characterization and quantitation of
glycomic changes in CHO cells during a bioreactor campaign. Biotechnol Bioeng, 2012.
109(12): p. 3007-17.
27. Tep, S., M. Hincapie, and W.S. Hancock, A general approach for the purification and
quantitative glycomic analysis of human plasma. Anal Bioanal Chem, 2012. 402(9): p.
2687-700.
28. Xia, B., et al., Glycan reductive isotope labeling for quantitative glycomics. Anal
Biochem, 2009. 387(2): p. 162-70.
29. Yuan, J., et al., Isotope tag method for quantitative analysis of carbohydrates by liquid
chromatography-mass spectrometry. J Chromatogr A, 2005. 1067(1-2): p. 145-152.
30. Reid, C.Q., et al., Rapid whole monoclonal antibody analysis by mass spectrometry: An
ultra scale-down study of the effect of harvesting by centrifugation on the post-
translational modification profile. Biotechnol Bioeng, 2010. 107(1): p. 85-95.
31. Schiestl, M., et al., Acceptable changes in quality attributes of glycosylated
biopharmaceuticals. Nat Biotechnol, 2011. 29(4): p. 310-2.
32. Rathore, A.S. and H. Winkle, Quality by design for biopharmaceuticals. Nat Biotechnol,
2009. 27(1): p. 26-34.
33. Trummer, E., et al., Process parameter shifting: Part I. Effect of DOT, pH, and
temperature on the performance of Epo-Fc expressing CHO cells cultivated in
controlled batch bioreactors. Biotechnol Bioeng, 2006. 94(6): p. 1033-44.
34. Yoon, S.K., et al., Effect of culture pH on erythropoietin production by Chinese hamster
ovary cells grown in suspension at 32.5 and 37.0 degrees C. Biotechnol Bioeng, 2005.
89(3): p. 345-56.

Chapter 5
160
5.0
Structural and Functional Characterisation
of Monoclonal Antibodies Following
Production under Altered Bioprocessing
Conditions
5.1 Introduction
Therapeutic monoclonal antibodies (mAbs) are large, complex macromolecules, consisting of
thousands of atoms intricately connected to form unique three-dimensional structures.
Conformation of protein higher order structure may have a profound effect on the mAb
function as conformational changes have the potential to alter the accessibility of binding sites
to cellular or antigen targets. Protein structure is maintained by various interactions, including
hydrogen bonds and electrostatic forces, which impart significant structural flexibility enabling
dynamic motion in solution. [1] Sequence-level protein modifications may interrupt the
interactions that are critical to protein structure and, hence, may affect the functional activity
of mAbs in-vivo. In particular, changes to mAb higher order structure may alter the
accessibility of the Fc binding site, responsible for non-antigen binding activity and in vivo half-
life, or similarly may modify the complementarity-determining regions (CDRs) leading to a
reduction in antigen binding affinity, ultimately affecting potency and therapeutic efficacy of
mAbs. Consequently, in addition to primary sequence characterisation, elucidation of the
structure and structure-function relationship for a protein should be determined during
product or bioprocess development, when evaluating biosimilar therapeutic proteins or
following changes to a bioprocess. [2] Regulatory agencies recommend for comparability
purposes, that an attempt should be made to determine the higher order structure of a
protein. Alternatively if structural characterisation is not possible, changes to a protein tertiary
structure should be assessed by determining the biological activity of the therapeutic drug
substance. [3]
Numerous techniques are available for structural characterisation of proteins, including the
well-established nuclear magnetic resonance (NMR) spectroscopy [4, 5] and X-ray
crystallography. [6] Although widely applied, practical limitations exist for the application of

Chapter 5
161
NMR to intact protein characterisation, including difficult spectral annotation attributed to the
large molecule size and a requirement for isotopic labelling. [7] X-ray crystallography
applications may be limited due to the necessity for generation of antibody crystals and also
resulting from reservations regarding the impact of complex sample preparation buffers on
the protein under analysis. [8] Other biophysical characterisation techniques are available,
including analytical ultracentrifugation (AUC), size exclusion chromatography (SEC),
differential scanning calorimetry and circular dichroism. [8] However these methods only
provide limited data and are incapable of providing information regarding the location of a
change on a protein molecule or of identifying subtle alterations to a protein’s higher order
structure. Hydrogen deuterium exchange mass spectrometry (HDX-MS) has become an
increasingly popular alternative technique for determination of protein structure. Backbone
amide hydrogen’s located at the surface of the protein or involved in weak hydrogen bonds
exchange rapidly with deuterium when place in a deuterated solvent, whereas those
contained within the interior of the protein structure or forming stabilising hydrogen bonds
exchange at a much slower rate. [9] Following HDX, the labelling reaction may be quenched
using a low pH denaturation buffer and the protein digested by means of an acid-resistant
protease (e.g. pepsin). Analysis of resulting peptides is performed using a rapid liquid
chromatography separation method followed by mass spectrometry detection for evaluation
of deuterium uptake and hence determination of protein tertiary structure. A typical HDX-MS
workflow is illustrated in Figure 5.1.
Analysis of chemical composition (amino acid sequence) and higher order structure may
provide extensive information regarding potential changes to a therapeutic mAb, e.g. in
response to bioprocess changes or for biosimilar comparability. However, to fully characterise
a mAb the functional capabilities of the protein must also be assessed. Antibody therapeutics
may be classified as having two general mechanisms of action. Therapeutic mAbs may exert
their effect by binding directly to their cellular target (e.g. cell surface tumour antigens),
thereby enabling immune mediated effects to take place. Alternatively, mAbs may be directed
against soluble molecules (e.g. cytokines) and function by binding to and inhibiting the action
of the target molecule. [10] In this work, a humanised anti-interleukin 8 (anti-IL8) IgG1 was
produced from CHO DP-12 culture. Anti-IL8 IgG1 functions in humans by binding to the
cytokine interleukin-8 forming a complex which may be recognised by the immune system
thereby facilitating clearance from the body. Hence, for anti-IL8 IgG1 to produce a
pharmacological effect, the antibody must be allowed to circulate for a sufficient period of
time in human serum. Fortuitously, the success of IgG1 mAbs as drug therapies may in part be
attributed to a long serum half-life in humans as a result of their ability to bind to the neonatal

Chapter 5
162
Fc receptor (FcRn), a soluble receptor expressed by cells of endothelial, epithelial and myeloid
lineages. [11, 12] Binding of IgG1 to FcRn is exquisitely pH dependent: FcRn forms a complex
with IgG1 at acidic pH (<pH 6.5) protecting mAbs from degradation inside the endosomal
compartment and facilitating recycling of the mAb to the cell surface, where upon the FcRn-
IgG1 complex dissociates at neutral pH (or higher). [13] Many new drug therapies, e.g.
antibody drug conjugates and Fc-fusion proteins, have been engineered to exploit the high
binding specificity of FcRn-IgG1 and hence, create a long serum half-life. [14, 15]
FcRn-IgG binding has also been widely applied for the evaluation of IgG antibody
pharmacokinetics in drug development, to estimate the serum half-life of new drug products
and for comparability assessment of mAbs following process changes. [16, 17] Different
analytical strategies exist for the determination of IgG binding and function, including cell-
based assays or ligand binding assays. As a general rule-of-thumb, mAbs that function by
binding to cellular targets are usually assessed using cell based assays while those that interact
with soluble receptors are determined using a technique based on ligand binding wherein
ligand interaction is normally the first step in protein-induced cellular response. [18] Since
anti-IL8 IgG1 functions by binding to soluble interleukin-8, and is circulated in the body as a
result of binding to soluble FcRn receptors, determination of ligand binding is an appropriate
strategy to investigate its functional activity. Surface plasmon resonance (SPR) biosensor
binding assays are widely applied for the determination of mAb functional activity. In SPR,
changes in reflected polarised light are measured following binding of analytes to ligands
embedded in a dextran matrix on the surface of a gold plated sensor chip. [19] Using SPR the
rate of association and dissociation of an antigen to a mAb and also their binding affinity may
be assessed. Thus, structural alterations to a therapeutic protein impacting antigen binding,
which transpire following environmental changes, degradation or exist between biosimilar
products, may be identified by measuring the binding affinity or binding rates of the
therapeutic protein.
In this chapter, potential changes to the structural conformation and the function of anti-IL8
mAb produced from CHO DP-12 cells under conditions of altered bioprocessing, as outlined in
Chapter 2 (pH, temperature, dissolved oxygen (DO)), are investigated. HDX-MSE is applied to
identify which regions, if any, of the mAb higher order structure are potentially altered as a
result of variations in bioprocessing parameters. In addition SPR-based binding assays are
applied to determine potential changes to serum half-life caused by culture under different
conditions by evaluating the binding affinity of FcRn to differentially cultured mAbs.
Chapter 5
163
Additionally, by determining the binding dynamics of anti-IL8 IgG1 to interleukin 8, possible
changes to the function of anti-IL8 mAbs are evaluated.
5.2 Experimental
5.2.1 Reagents and Consumables
Deuterium oxide (D2O), Deuterium chloride (DCl), Potassium phosphate dibasic, Potassium
phosphate monobasic, Tris(2-carboxyethyl)phosphine (TCEP), Guanidine hydrochloride,
Hydrochloric acid, [Glu1]-Fibrinopeptide B, Monosodium phosphate monohydrate,
Tris(hydroxymethyl)-aminomethane (Tris), Sodium chloride (NaCl), Acetonitrile, Formic acid
and Methanol were obtained from Sigma Aldrich (Wicklow, Ireland). Sodium iodide and
Leucine enkephalin were received from Waters (Dublin, Ireland). Water, 0.1% formic acid (LC-
MS Optima), Acetonitrile, 0.1% formic acid (LC-MS Optima), and Water, 0.1% TFA (LC-MS
Optima) were obtained from Fisher Scientific (Dublin, Ireland). Recombinant human CXCL8/IL-
8 protein and Recombinant human FcRn protein were purchased from R&D systems
(Minnesota, USA). Biacore series S sensor chip CM5, Biacore series S Protein A sensor chip, 10
mM sodium acetate, pH 5.0, Glycine-hydrochloride, HBS-EP+ buffer and amine coupling
reagents (1-ethyl-3-(3-dimethylaminopropyl)carbodimide hydrochloride (EDC), N-
hydroxysuccinimide (NHS) and 1.0 M ethanolamine-HCL pH 8.5) were obtained from GE
Healthcare (Dublin, Ireland).
5.2.2 Hydrogen-Deuterium Exchange Mass Spectrometry
Hydrogen-Deuterium Exchange Mass Spectrometry (HDX-MS) was performed using a
nanoAcquity UPLC M-class system with a LEAP HDX automation manager coupled to a Waters
Synapt G2 HDMS QToF. The HDX-MS platform was equipped with an Enzymate BEH pepsin
column, 2.1 x 30 mm (Waters), an Acquity UPLC BEH C18 1.7 µm VanGuard Pre-Column, 2.1 x
5 mm (Waters) and an Acquity UPLC BEH C18 1.7 µm, 1.0 x 100 mm analytical column
(Waters). Purified anti-IL8 IgG1 produced under conditions of altered bioprocessing (Section
2.2.2.5) and later purified and quantified (Section 3.2.2) were diluted to a concentration of 5
mg. mL-1 in 10 mM potassium phosphate, pH 7.0. For each labelling time point, 4.8 µL of anti-
IL8 IgG1 was diluted with 20-fold 10 mM potassium phosphate in D2O, pH 6.6 at room
temperature and incubated for a pre-defined time (20 s, 1 min, 2 min, 10 min, 30 min, 1 hr, 2
hr, 4 hr). Following incubation, the reaction was quenched by the addition of 50 mM

Chapter 5
164
potassium phosphate, 2 M guanidine-HCl, 200 mM TCEP, pH 2.30 before on-line pepsin
digestion. The digestion temperature was set to 20oC. All subsequent chromatographic
separations were performed in a cooling chamber maintained at 0.0 ± 0.1oC to prevent back
exchange of deuterium. To minimise carry-over between each sample preparation, a blank
injection and a pepsin column wash, using 1.5 M guanidine-HCl, 4% acetonitrile, 0.8% formic
acid, 200 mM TCEP, pH 2.5, were performed.
Eluting peptides were loaded via trapping column for 3 minutes at 200 µL.min-1, using an
isocratic gradient of 0.1% (v/v) formic acid in water (A) and 0.1% (v/v) formic acid in
acetonitrile (B). Peptides were subsequently directly sampled onto a C18 analytical column and
separated using the following gradient conditions: 5% to 35% B in 6 minutes, followed by a
further increase to 95% B over 1 minute and a 3 minute isocratic hold. Subsequently the
column was washed three times by decreasing mobile phase composition to 5% B in 1 minute
followed by increase to 95% B. Initial conditions were restored in one minute and held for an
additional 2 minutes to ensure column re-equilibration. The flow rate was 40 µL.min-1. Eluate
from the chromatographic system was sampled directly into a Synapt G2 HDMS QTof mass
spectrometer (Millford, MA, USA) via an electrospray ion source. The mass spectrometer was
operated in positive ion data independent resolution mode with 0.3 second sequential low
and high energy scans in the range of 50 to 2,000 Da. The spray voltage was 3 kV. A collision
energy ramp from 15 to 35 V was used for the high energy function. Glu-fibrinopeptide (m/z
785.8426, z=2) was used as lockmass solution, recorded at 30 second intervals. Non-
deuterated control experiments were also carried out to identify all peptides produced during
enzymatic digestion.
Following analysis unlabelled samples were processed using ProteinLynx Global Server
software (PLGS, version 3.0.1) for identification of sample peptides. Workflow parameters
used include automatic peptide and fragment tolerances with lockmass correction of all
doubly charged masses, minimum number of fragment ion matches per peptide = 2, minimum
number of fragment ion matches per protein = 5, minimum number of unique peptides per
protein = 1, primary digest reagent trypsin, with maximum number of one missed cleavage,
fixed modification: carbamidomethyl C, variable modifications: oxidation M, deamidation N
and deamidation Q, false discovery rate maintained at 1% FDR. Data was searched against a
fasta file composed of known mAb sequence described in US patent 6117980 A. [20] All HDX-
MS data were processed using DynamX® HDX data analysis software version 3.0.0 (Waters)
with additional manual verification of the raw spectra. DynamX® is a software tool designed to
automate visualisation and sorting of data acquired using a Waters HDX-MS platform. The
Chapter 5
165
following settings were used for filtering of the data: minimum intensity of 1000, minimum
sequence length of 6, maximum sequence length of 30, file threshold = 3 and retention time
RSD of 5%. Deuterium uptake for each peptide was calculated by subtracting the centroid of
the isotopic distribution for non-labelled peptide ions from the centroid of the isotopic
distribution for peptide ions for each deuterated sample. A minimum sequence coverage of
70% and average redundancy of <5 was required for all data. HDX comparability profiles were
plotted using an algorithm developed by Houde et al. incorporated into DynamX software. [1]
5.2.3 Surface Plasmon Resonance
All SPR experiments were carried out on a Biacore T100 instrument (GE Healthcare, Uppsala,
Sweden) using Biacore T100 Control Software version 2.0.4. Processing of acquired data was
perfumed using Biacore Evaluation software version 2.0.4.
5.2.3.1 Determination of FcRn-Anti-IL8 Binding Affinity
Standard amine coupling was performed to immobilise FcRn on to the surface of a Series S
CM5 chip. Briefly, the dextran surface of two flow cells was activated by injecting a 1:1
solution of EDC/NHS for 420 s at 10 µL.min-1. FcRn molecules were diluted to 2.5 µg.mL-1 in 10
mM sodium acetate, pH 5.0 and injected at a flow rate of 5 µL.min-1 (onto the test flow cell
only) until the target response level of 500 RU was reached. Subsequently, the surface of both
flow cells was blocked by injecting 1 M ethanolamine pH 8.5 for 420 s at 10 µL.min-1. The
running buffer, 50 mM sodium phosphate/150 mM NaCl, pH 6.0, was allowed to flow at a rate
of 30 µL.min-1. For each anti-IL8 sample studied, a range of concentrations of the mAb were
prepared in triplicate in running buffer (0, 10, 25, 50, 100, 150 and 200 µg.mL-1) and injected at
25oC using a multi-cycle approach. Regeneration of the immobilised FcRn surface was achieved
following each mAb sample introduction using 100 mM Tris/200 mM NaCl, pH 8.0, injected for
60 seconds at 30 µL.min-1. For each analysis, the response was calculated at a position 4
seconds before the injection stop, with a 5 second window. A steady state affinity fit model
was applied for determination of the dissociation constant.

Chapter 5
166
5.2.3.2 Evaluation of Anti-IL8 – Interleukin 8 Binding Kinetics
A Series S Protein A chip was utilised for the determination of changes to the binding kinetics
of anti-IL8 IgG1 to the cytokine interleukin-8 using a single-cycle kinetics procedure. Before
use the Protein A chip was primed with HBS-EP+ running buffer and conditioned via triplicate
injection of 10 mM glycine, pH 1.5 for 60 seconds using a flow rate of 30 µL.min-1. For each
analysis, a 10 µg.mL-1 solution of mAb was passed over the active sample flow cell for 30 s at 5
µL.min-1 to enable capture of the protein on the protein A chip surface. Interleukin 8, prepared
at a range of concentrations (0.625, 1.25, 2.5, 5 and 10 nM), was then injected in order of
increasing concentration over reference and active flow cell using five 150 s injections at 30
µL.min-1, applying a single cycle kinetics approach. [21] Following the final interleukin-8
injection, a 1200 s dissociation time was applied. Regeneration of the chip surface was
achieved using a 30 s injection of 10 mM glycine, pH 1.5 at 30 µL.min-1. Data was referenced
by subtraction of the response from the reference flow cell before kinetic fit analysis was
performed via Biacore Evaluation software using a 1:1 binding fit model.
5.3 Results and Discussion
5.3.1 HDX-MS
Hydrogen/deuterium exchange-mass spectrometry (HDX-MS) is a useful method for structural
characterisation of therapeutic mAbs, as it may potentially generate information regarding
locations of conformation differences and conformational dynamics of proteins in solution. [1,
22-27] By monitoring the HDX of a protein’s backbone amide hydrogen for deuterium as a
function of time, information regarding the protein structure and conformation in solution
may be deduced. HDX-MS poses a number of significant analytical challenges. Firstly, due to
the labile nature of the deuterium label, a quenching step must be incorporated into the
analytical workflow to ensure no back-exchange of deuterium occurs. Frequently, the HDX
reaction is quenched via a reduction in solution temperature and pH (<pH 3) as other methods
such as use of organic solvents may be incompatible with biomolecules or with subsequent
analytical steps. [28-30] Secondly, protein digestion must be performed under quench
conditions; hence a protease that exhibits activity at low temperature and in low pH
conditions is required. Pepsin fulfils these criteria, while additionally enabling automation of
HDX-MS experiments as it is commercially available immobilised on analytical columns.
However, sequence coverage obtained following MS analyses of peptic digests can be
suboptimal depending on conditions used (e.g. temperature, exposure time, enzyme-protein

Chapter 5
167
ratio) and most importantly on the protein itself. [31] Unlike other frequently used proteases
for sample preparation prior to MS analyses (e.g. Trypsin, Lys-C, Asp-N) pepsin does not cleave
with high specificity. [31, 32] Although pepsin tends to cleave after bulky hydrophobic amino
acid residues (e.g. phenylalanine), the digestion pattern of pepsin is reportedly most
influenced by the molten globule conformation of a protein in acidic conditions. [31] Various
approaches to improving sequence coverage achievable have been reported, including the use
of denaturants (e.g. guanidine hydrochloride) and reducing agents (e.g. TCEP), and increasing
back pressure to facilitate enhanced digestion efficiency. [30, 33] In this study, HDX-MS was
employed for the comparative structural evaluation of anti-IL8 IgG1 following production using
a variety of bioprocessing conditions frequently used in therapeutic Chinese hamster ovary
(CHO) cell culture (described in Chapter 2). Conformational changes in protein therapeutics
are reportedly triggered by a variety of factors including chemical modification, thermal or pH
denaturation and mutation caused by disparities in bioprocessing and may occur with or
without a change in primary structure. [9] Hence, by determination of protein high order
structure for each anti-IL8 IgG1 sample produced, potential changes to mAb tertiary structure
caused by alterations in bioprocessing may be deduced. For each mAb sample analysed,
triplicate HDX samples were prepared for each time-point, digested and separated using a
short chromatographic gradient before undergoing MSE analysis, as described in Section 5.2.2.
Data generated was subsequently analysed for determination of changes to the mass of
peptides in samples exposed to deuterated buffer for increasing periods of time. Peptides
found to have exchanged deuterium in place of hydrogen atoms produced a MS spectrum
showing distinctive mass shifts corresponding to the levels of deuterium incorporated into
each peptide, as shown in Figure 5.2.

Chapter 5
168
Figure 5.1: Typical HDX-MS workflow, adapted from [30]. Proteins in solution at room
temperature are diluted in excess deuterated solution and HDX is allowed to occur for a
specified amount of time before the reaction is quenched in a low pH denaturation buffer.
Protein sample is then injected into a pepsin column for low temperature digestion. Resultant
peptides are separated using a fast separation gradient and detected via mass spectrometry.
Finally the mass shift of analysed peptides due to deuterium uptake is determined and
information regarding higher order structure of the protein may be deduced.
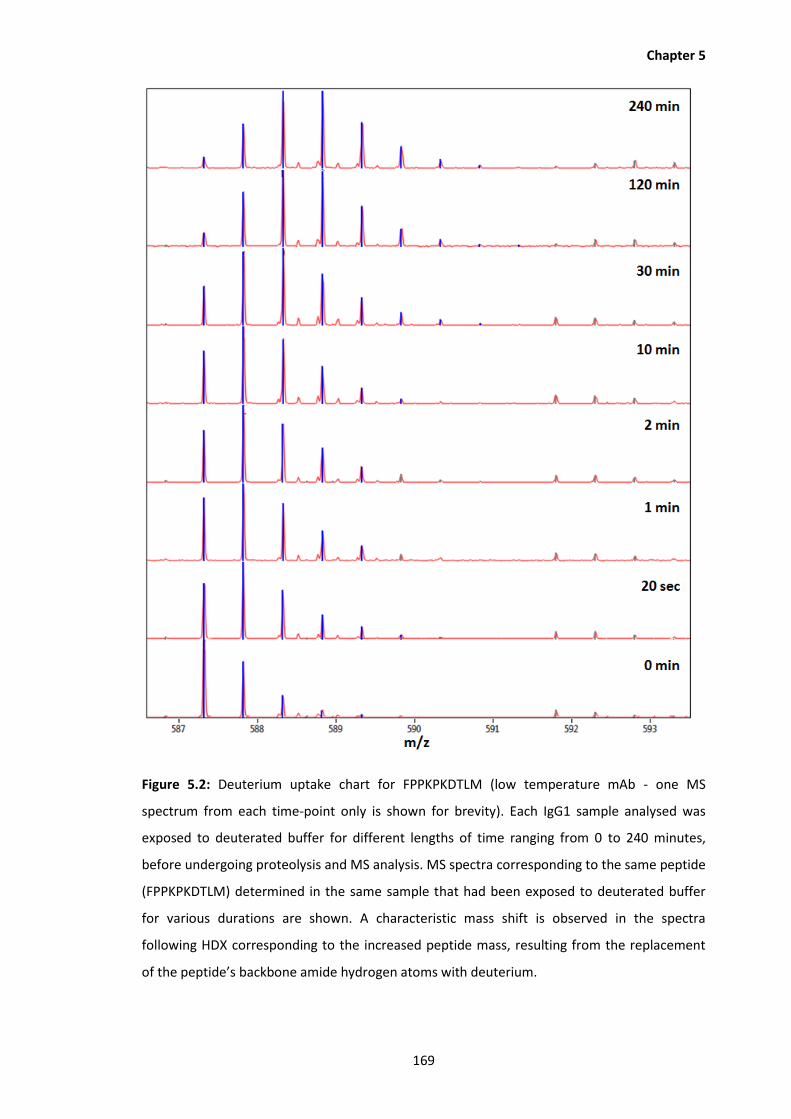
Chapter 5
169
Figure 5.2: Deuterium uptake chart for FPPKPKDTLM (low temperature mAb - one MS
spectrum from each time-point only is shown for brevity). Each IgG1 sample analysed was
exposed to deuterated buffer for different lengths of time ranging from 0 to 240 minutes,
before undergoing proteolysis and MS analysis. MS spectra corresponding to the same peptide
(FPPKPKDTLM) determined in the same sample that had been exposed to deuterated buffer
for various durations are shown. A characteristic mass shift is observed in the spectra
following HDX corresponding to the increased peptide mass, resulting from the replacement
of the peptide’s backbone amide hydrogen atoms with deuterium.

Chapter 5
170
Initial experiments resulted in poor mAb digestion efficiencies for samples analysed (~65%
sequence coverage for mAb light chain, ~70% sequence coverage for mAb heavy chain). To
ensure as broad coverage as possible for the mAb samples studied, optimisation of the
experimental platform was achieved by increasing the TCEP concentration of the quench
buffer from 50 M to 200 M, increasing the digestion temperature from 15oC to 20oC and by
placing a BEH C18, 1.7 µm, 2.1 x 50 mm analytical column on the UPLC waste line for the
purposes of increasing back-pressure to the pepsin column. Following these modifications the
sequence coverage achievable was increased to >72% for mAb light chain and >83% for mAb
heavy chain. Similar peptides were generated across all experiments, showing reproducible
peptic digestion profiles for anti-IL8 IgG1 within different sample preparations; sequence
coverage maps displaying peptides produced are shown in Figures 5.3 to 5.5. In each
experiment, a minimum of 147 peptic peptides were unambiguously identified with a
maximum redundancy of 4.12, representing a minimum of 72.6% of the total light chain and
81.2% of the total heavy chain amino acid sequence for anti-IL8 IgG1.
Figure 5.3: Peptic peptides identified across all experiments for anti-IL8 IgG1 produced at
standard conditions, 110% DO and 60% DO in mAb A. light chain and B. heavy chain. Each
peptide is represented by a blue bar.
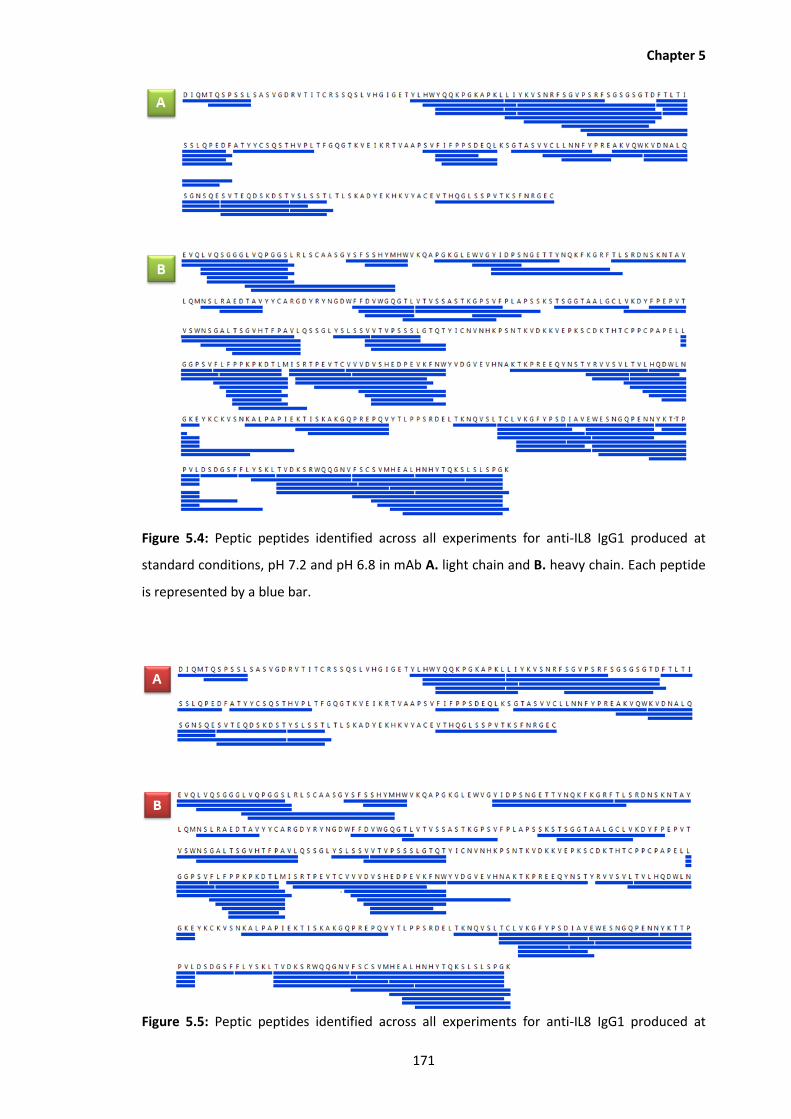
Chapter 5
171
Figure 5.4: Peptic peptides identified across all experiments for anti-IL8 IgG1 produced at
standard conditions, pH 7.2 and pH 6.8 in mAb A. light chain and B. heavy chain. Each peptide
is represented by a blue bar.
Figure 5.5: Peptic peptides identified across all experiments for anti-IL8 IgG1 produced at

Chapter 5
172
standard conditions, 32.0oC and 39.5oC in mAb A. light chain and B. heavy chain. Each peptide
is represented by a blue bar.
The relative fractional uptake of deuterium for peptides produced from mAb cultures from
each study (i.e. DO, pH and temperature study cultures) at each time-point was determined by
comparison of the centroid mass from peptides produced at each time-point to the mass of
un-deuterated peptide ions. To evaluate deuterium incorporation in different parts of the mAb
structure, heat maps and mirror plots showing the relative fractional uptake of deuterium for
a particular peptide as a function of time were generated. Figures 5.6 to 5.8 show
corresponding heat-maps for each study. Peptides that are enclosed within the protein
structure and therefore, not exposed to deuterium do not undergo HDX and, hence, do not
exhibit an increase in relative fractional uptake for deuterium over-time. Conversely peptides
on the outer part of the mAb higher order structure readily exchange their backbone amide
hydrogen atoms for deuterium and thus display a high deuterium fractional uptake relative to
un-deuterated samples. Finally, peptides that are partially exposed to the deuterated buffer
undergo a slower rate of HDX and hence produce a relative fractional uptake profile wherein
the uptake of deuterium is observed to increase as a function of time. Heat maps
corresponding to anti-IL8 produced in each study clearly visualise the regions of the mAb that
are encased within the protein structure as these show poor uptake of deuterium overall the
time-points analysed, appearing as green in the heat maps, whereas portions of IgG1 that
comprise the outer part of the structure readily incorporate deuterium across the time-points
and are displayed in red. Portions of mAb that are partially enclosed within the mAb higher
order structure display increased deuterium uptake over time, displayed as changing colour
over time according to the scale shown in the corresponding figures.

Chapter 5
173
Figure 5.6: Relative fractional uptake of deuterium for A. light chain and B. heavy chain anti-
IL8, produced under standard (85% DO), low DO (60% DO) and high DO (110% DO) bioprocess
conditions.

Chapter 5
174
Figure 5.7: Relative fractional uptake of deuterium for A. light chain and B. heavy chain anti-
IL8, produced under standard (pH 7.0), low pH (pH 6.8) and high pH (pH 7.2) bioprocess
conditions.

Chapter 5
175
Figure 5.8: Relative fractional uptake of deuterium for A. light chain and B. heavy chain anti-
IL8, produced under standard (37.0oC), low temperature (32.0oC) and high temperature
(39.5oC) bioprocess conditions.
Figures 5.9 to 5.14 show mirror plots depicting the average relative fractional uptake for heavy
or light chain mAb from each condition compared to standard mAb that was produced during
the same production run. In all mirror plots the horizontal axis denotes each peptide, shown
as differentially coloured dots each colour representing the duration of HDX as shown in the
accompanying legend, sorted in ascending order from the N-terminus to the C-terminus for
each mAb chain. Distance from the mid-point represents increased deuterium uptake,
described as the ratio of the mass of the deuterated peptide relative to the mass of the
corresponding un-deuterated sample. The grey area depicts the standard deviation for relative
fractional uptake for each peptide across all time-points.

Chapter 5
176
Figure 5.9: Mirror plot showing the relative fractional uptake for mAb heavy chain from
samples produced using standard and altered bioprocess conditions of pH 6.8.
Figure 5.10: Mirror plot showing the relative fractional uptake for mAb light chain from
samples produced using standard and altered bioprocess conditions of pH 6.8.
Figure 5.11: Mirror plot showing the relative fractional uptake for mAb heavy chain from
samples produced using standard and altered bioprocess conditions of pH 7.2.

Chapter 5
177
Figure 5.12: Mirror plot showing the relative fractional uptake for mAb light chain from
samples produced using standard and altered bioprocess conditions of pH 7.2.
Figure 5.13: Mirror plot showing the relative fractional uptake for mAb heavy chain from
samples produced using standard and altered bioprocess conditions of 39.5oC.
Figure 5.14: Mirror plot showing the relative fractional uptake for mAb light chain from
samples produced using standard and altered bioprocess conditions of 39.5oC.
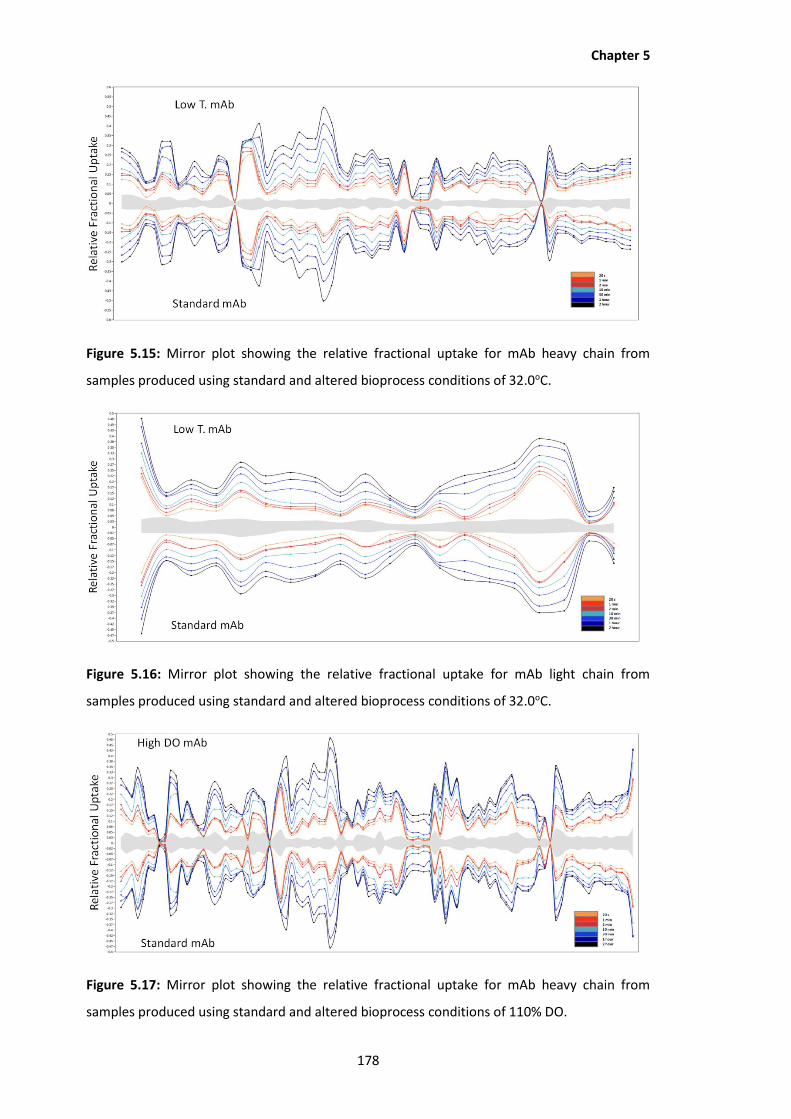
Chapter 5
178
Figure 5.15: Mirror plot showing the relative fractional uptake for mAb heavy chain from
samples produced using standard and altered bioprocess conditions of 32.0oC.
Figure 5.16: Mirror plot showing the relative fractional uptake for mAb light chain from
samples produced using standard and altered bioprocess conditions of 32.0oC.
Figure 5.17: Mirror plot showing the relative fractional uptake for mAb heavy chain from
samples produced using standard and altered bioprocess conditions of 110% DO.

Chapter 5
179
Figure 5.18: Mirror plot showing the relative fractional uptake for mAb light chain from
samples produced using standard and altered bioprocess conditions of 110% DO.
Figure 5.19: Mirror plot showing the relative fractional uptake for mAb heavy chain from
samples produced using standard and altered bioprocess conditions of 60% DO.
Figure 5.20: Mirror plot showing the relative fractional uptake for mAb light chain from
samples produced using standard and altered bioprocess conditions of 60% DO.

Chapter 5
180
Finally, to determine whether the relative fractional uptake of each peptide was changed
between mAb produced at standard conditions and mAb produced under conditions of altered
bioprocessing, the difference in deuterium incorporation for peptides in comparative samples
were determined and used to prepare difference index plots as shown in Figures 5.21 to 5.23.
The differential value for each peptide (shown along x-axis) for each HDX reaction was
calculated by subtracting the deuterium uptake value of the altered bioprocessing sample
from that of the mAb produced under standard bioprocess conditions. The summed difference
for all HDX time-points for all peptides are signified by the vertical grey bars in each difference
index plot. Criteria for determining statistically significant HDX differences between the
peptides from altered bioprocessing and standard mAb samples were evaluated as described
previously. [25] The standard deviation (SD) of summed difference values for each peptide
across different experiments was determined and averaged; 3 × average SD was set as the
difference limit for significance determination. As the average SD of summed difference values
for each peptide was calculated to be 0.37 Da, the limit outside of which difference values
were deemed to be significant was set as ±1.1 Da (represented by dashed lines in Figures 5.21
to 5.23). Positive difference index values signify increased HDX in anti-IL8 IgG1 samples
produced under altered bioprocessing conditions compared to samples produced under
standard conditions, while negative values represent decreased relative HDX for altered mAb
samples. For each of the samples determined no distinct regions were found to be significantly
changed in mAb produced under altered bioprocessing conditions compared to mAb produced
at standard conditions. However, a number of individual peptides, detailed in Table 5.1,
displayed alterations in deuterium uptake which were found to be different based on the
significance criteria applied. Three of the seven peptides identified as having altered
conformation within the mAb higher order structure, across all experiments, were found to
incorporate amino acids previously determined to contain sequence-level modifications
(Chapter 3). However, those regions of the mAb that were found to contain both alterations to
the the mAb structure and also a primary sequence modification were identified solely on the
light chain of anti-IL8 IgG1 samples produced under low temperature conditions of 32.0oC.
Interestingly, three peptides determined for mAb heavy chain for anti-IL8 IgG1 produced at
32.0oC displayed altered deuterium uptake but were not correlated with having sequence-
level modifications. However, the low temperature mAb sample was found to exhibit the
greatest changes to levels of modified amino acids when compared to other samples analysed.
Thus, it is possible that changes in protein conformation, may not necessarily result from
changes to protein primary sequence at the site of conformational change, but may be an
outcome of modifications to adjacent or spatially close sequence-level modifications.

Chapter 5
181
Table 5.1: Peptides displaying altered deuterium uptake compared to standard mAb samples
analysed and related peptide modifications identified.
Sample mAb Chain
Peptide Position Peptide Modification
Low T mAb Light HWYQQKPGKAPKLLI H39-I53 Oxidation W40
High pH mAb Light AKVQWKVDNALQSGNSQE A149-E166 Oxidation W153, Deamidation N157, Deamidation Q160, Deamidation Q163
High DO mAb Heavy VQSGGGLVQPGGS V5-S17 n/a
Low DO mAb Heavy TLSRDNSKNTAY T69-Y80 Deamidation N74, Deamidation N77
Low T mAb Heavy VSWNSGALTSGVHTFPAVL V161-L179 n/a
Low T mAb Heavy NSGALTSGVHTFPAVL N164-L179 n/a
Low T mAb Heavy TVDKSRWQQGNVFSCSVM T416-M433 n/a
It has been been widely reported that changes to a the higher order structure of a therapeutic
protein have the potential to alter the safety, potency and efficiacy characteristics of that
protein by reducing or inhibiting accessibility to mAb binding sites. [23, 25, 26, 34] Hence for
IgG1, sequence or structural modificiations of CDRs or the highly conserved CH3 domain,
responsible for FcRn binding, may have a profound effect on the physiological activities of
therapeutic mAbs. Changes in the primary sequence or higher order structure may allude to
alterations in the physiological activity of a therapeutic mAb, however, to confidently assess
the impact of these CQAs to protein activity determination of the functional activity must be
performed.

Chapter 5
182
Figure 5.21: Difference index plots showing differences in deuterium uptake between
standard mAb and A. high temperature mAb heavy chain, B. high temperature mAb light
chain, C. low temperature mAb heavy chain and D. low temperature mAb light chain.

Chapter 5
183
Figure 5.22: Difference index plots showing differences in deuterium uptake between
standard mAb and A. high temperature mAb heavy chain, B. high temperature mAb light
chain, C. low temperature mAb heavy chain and D. low temperature mAb light chain.

Chapter 5
184
Figure 5.23: Difference index plots showing differences in deuterium uptake between
standard mAb and A. high DO mAb heavy chain, B. high DO mAb light chain, C. low DO mAb
heavy chain and D. low DO mAb light chain.
Chapter 5
185
5.3.2 SPR Analysis Using Biacore
Surface plasmon resonance (SPR) enables the elucidation of alterations in the binding
capabilities of proteins by measuring the affinity, or rate of association and dissociation, of a
protein to a target antigen which has been immobilised onto a gold-plated sensor chip.
Conversely, a protein may be captured onto a surface and the rate of an antigen binding to the
protein determined. By measuring changes in reflected polarised light following protein-
antigen binding, changes to binding characteristics may be assessed. Anti-IL8 IgG1 is
pharmacologically active due to its ability to bind to interleukin-8 facilitating its removal from
the body, and to bind to the neonatal Fc receptor, ensuring extended serum half-life in
humans. Both of these features were evaluated to assess changes to the functional
characteristics of anti-IL8 IgG1 following production under conditions of altered bioprocessing.
5.3.2.1 Determination of FcRn-Anti-IL8 IgG1 Binding for Anti-IL8 IgG1 Produced Using
Altered Bioprocessing
FcRn is a heterodimeric protein consisting of a major histocompatibility complex class 1-like
protein and a β2-microglobulin subunit. [13, 16] It is expressed by endothelial, epithelial and
myeloid cells, which internalise serum constituents including mAbs from the blood stream by
pinocytosis. [13] FcRn binds with high affinity to the Fc domain of IgG1 at the highly conserved
CH2-CH3 region in a strictly pH dependent manner, resulting in a 2:1 stoichiometry. [11, 16, 35]
The pH dependent nature of the interaction enables the FcRn-mediated protection of IgG1
from intracellular degradation by binding to the receptor within the acidic endosomal
environment. Subsequently, FcRn facilitates the recycling of IgG to the cell surface and release
into the blood stream for re-circulation. As FcRn is strongly correlated with serum half-life of
IgG1 in-vivo, it is frequently used during drug development for in-vitro assessment of the
pharmacokinetic capabilities of therapeutic mAbs. [12] Additionally, lab-based evaluation of
the effects of primary sequence modifications on IgG-FcRn binding affinities have been
studied, e.g. charge heterogeneity was found to have little or no effect on IgG1-FcRn binding,
[36] whereas methionine oxidation in mAb CH2-CH3 regions significantly reduced IgG1-FcRn
binding. [34, 37] In the current study, determination of FcRn binding affinity to anti-IL8 IgG1 is
used to assess changes to the functional capabilities of mAb that has been produced under
conditions of altered pH, temperature and DO. Using multi-cycle affinity SPR analysis, FcRn
was immobilised onto a Biacore CM5 chip before passing over different concentrations of anti-
IL8 IgG1. The affinity constants (KD) for each triplicate analysis of the IgG1-FcRn binding

Chapter 5
186
interaction were determined and are reported in Table 5.2. Increasing KD values signify low
affinity and hence weak binding interactions. Corresponding sensograms and steady state fit
graphs for triplicate analysis of mAb samples produced under standard and altered
bioprocessing conditions are shown in Figures 5.24 to 5.28.
Table 5.2: Dissociation constants determined following SPR binding affinity analysis of anti-IL8
IgG1 and FcRn.
Anti-IL8 sample Analysis 1 - KD (nM) Analysis 2 - KD (nM) Analysis 3 - KD (nM)
Low DO mAb 697.6 736.2 677.9
High DO mAb 742.2 728.4 687.7
Low pH mAb 675.2 704.2 665.7
High pH mAb 695.1 703.0 725.0
Low T mAb 819.1 807.0 858.2
High T mAb 739.7 718.2 712.8
Standard 1 694.8 675.0 756.1
Standard 2 691.8 699.5 680.8
Standard 3 686.2 738.0 698.0
A box-plot depicting the binding affinity values determined for each IgG1 sample analysed is
displayed in Figure 5.29. A distinct difference in the binding affinity for anti-IL8 IgG1 produced
at 32.0oC compared to mAb expressed in CHO DP-12 culture using all other parameters
investigated was observed. It is possible that a correlation between the reduction in FcRn
binding affinity and heavy chain conformational changes for mAb produced at 32.0oC may
exist. Furthermore, primary sequence modifications determined for mAb produced at 32.0oC
may also play a role in the reduced FcRn affinity for this IgG1 sample. Anti-IL8 IgG1 produced
at 32.0oC was determined to have a higher proportion of oxidised methionine-257 when
compared to other mAb samples analysed (Chapter 3). This would appear to correlate with the
findings of Bertolotti-Ciarlet et al. and Pan and colleagues, who associated a reduction in FcRn
binding affinity with methionine oxidation on mAb heavy chain. [37, 38]
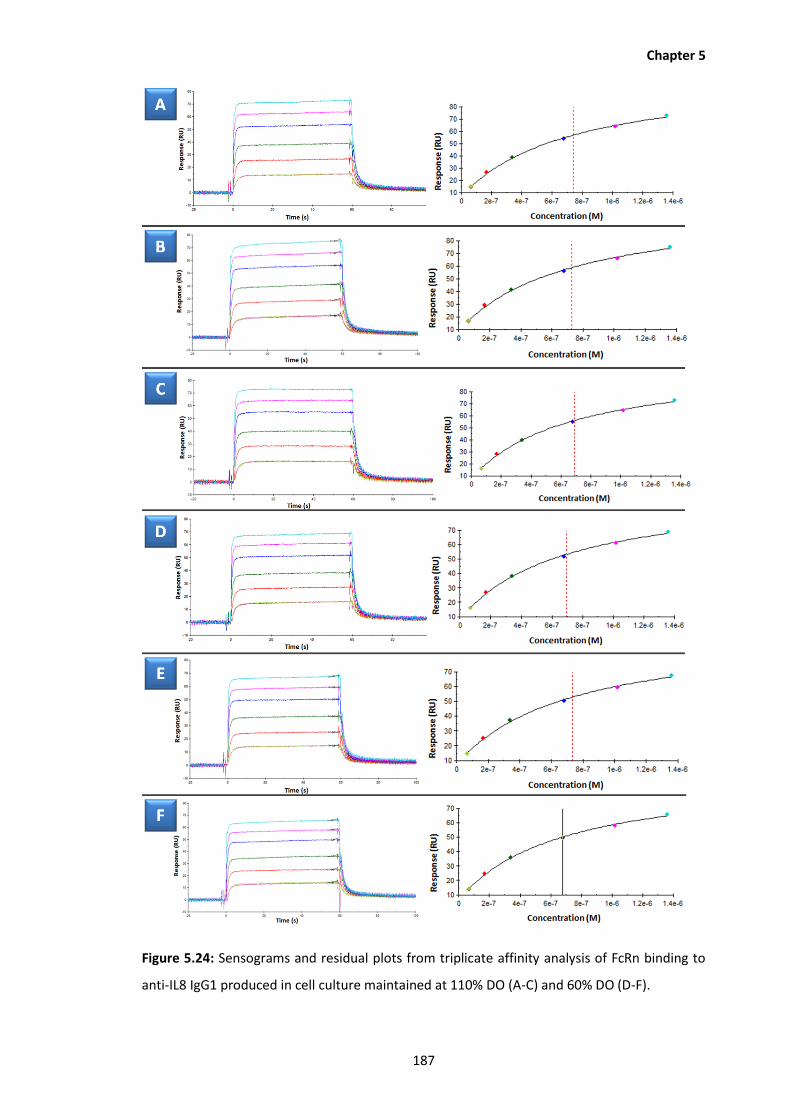
Chapter 5
187
Figure 5.24: Sensograms and residual plots from triplicate affinity analysis of FcRn binding to
anti-IL8 IgG1 produced in cell culture maintained at 110% DO (A-C) and 60% DO (D-F).

Chapter 5
188
Figure 5.25: Sensograms and residual plots from triplicate affinity analysis of FcRn binding to
anti-IL8 IgG1 produced in cell culture maintained at 39.5oC (A-C) and 32.0oC (D-F).

Chapter 5
189
Figure 5.26: Sensograms and residual plots from triplicate affinity analysis of FcRn binding to
anti-IL8 IgG1 produced in cell culture maintained at pH 7.2 (A-C) and pH 6.8 (D-F).

Chapter 5
190
Figure 5.27: Sensograms and residual plots from triplicate affinity analysis of FcRn binding to
anti-IL8 IgG1 produced in cell culture maintained at standard conditions: standard 1 (A-C),
standard 2 (D-F).

Chapter 5
191
Figure 5.28: Sensograms and residual plots from triplicate affinity analysis of FcRn binding to
anti-IL8 IgG1 produced in cell culture maintained at standard conditions: standard 3 (A-C).
Figure 5.29: Box-plot showing FcRn binding dissociation constants determined for anti-IL8 IgG1
produced using different bioprocessing conditions of pH, DO and temperature (T).

Chapter 5
192
5.3.2.2 Determination of Binding Kinetics for Interleukin-8 and Anti-IL8 IgG1 Produced Using
Altered Bioprocessing Conditions
Having assessed the binding affinity to its cellular receptor FcRn, changes to the binding
affinity of anti-IL8 IgG1 following production under altered bioprocess conditions to the target
antigen interleukin-8 were assessed. In this instance a single-cycle SPR analysis approach was
used, wherein the anti-IL8 samples under study were captured onto a Protein a SPR chip
before the introduction of interleukin-8 for determination of binding affinity. Affinity
constants determined following single-cycle SPR analysis of anti-IL8 IgG1 and interleukin-8
binding kinetics are displayed in Table 5.3. Corresponding sensograms and residual plots for
each analysis are shown in Figures 5.30 to 5.34. Finally, box-plots depicting the data displayed
in Table 5.3 are presented in Figure 5.35. The box plot shows a slight decrease in the binding
affinity of anti-IL8 IgG1 produced in culture maintained at 110% DO. It is possible that this
change in binding affinity may be related to a change in the conformation of the mAb heavy
chain adjacent to the CDR1 region, observed for the anti-IL8 sample produced at 110% DO. An
observed increase in the proportion of oxidised tryptophan-40 residues, located close to the
CDR1 and CDR2 regions of the light chain for this sample, may also potentially have
contributed to the altered binding affinity of anti-IL8 IgG1 to interleukin-8.
Table 5.3: Affinity constants obtained following single-cycle SPR analysis of anti-IL8 IgG1 and
interleukin-8 binding kinetics.
Anti-IL8 sample Analysis 1 - KD (nM) Analysis 2 - KD (nM) Analysis 3 - KD (nM)
Low DO mAb 18.0 19.4 17.9
High DO mAb 27.3 28.7 25.4
Low pH mAb 17.2 17.5 17.6
High pH mAb 21.1 20.4 18.7
Low T mAb 19.5 22.4 20.8
High T mAb 18.2 18.0 16.5
Standard 1 21.5 21.8 20.3
Standard 2 22.4 23.4 22.5
Standard 3 22.2 22.8 21.0

Chapter 5
193
Figure 5.30: Resulting Sensograms and residual plots from triplicate affinity analysis of
interleukin 8 binding to anti-IL8 IgG1 produced in cell culture maintained at 39.5oC (A-C) and
32.0oC (D-F).
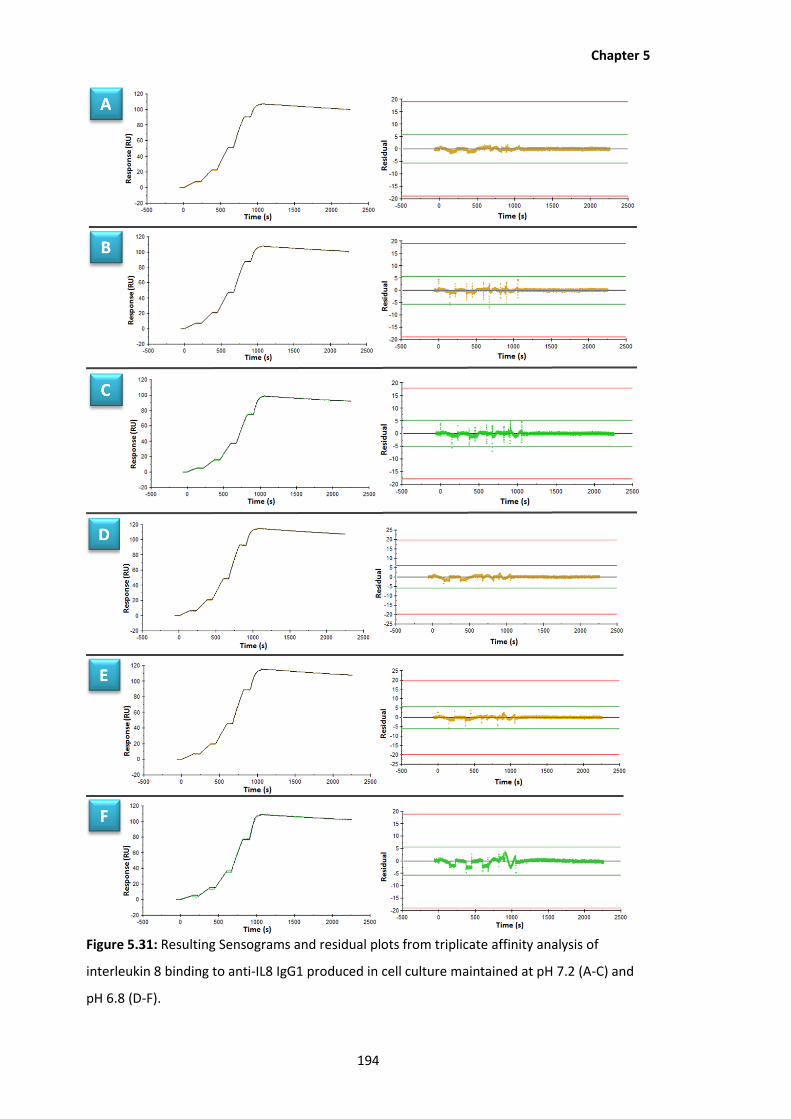
Chapter 5
194
Figure 5.31: Resulting Sensograms and residual plots from triplicate affinity analysis of
interleukin 8 binding to anti-IL8 IgG1 produced in cell culture maintained at pH 7.2 (A-C) and
pH 6.8 (D-F).

Chapter 5
195
Figure 5.32: Resulting Sensograms and residual plots from triplicate affinity analysis of
interleukin 8 binding to anti-IL8 IgG1 produced in cell culture maintained at 110% DO (A-C) and
60% DO (D-F).

Chapter 5
196
Figure 5.33: Resulting Sensograms and residual plots from triplicate affinity analysis of
interleukin 8 binding to anti-IL8 IgG1 produced in cell culture maintained at standard
conditions: standard 1 (A-C), standard 2 (D-F).
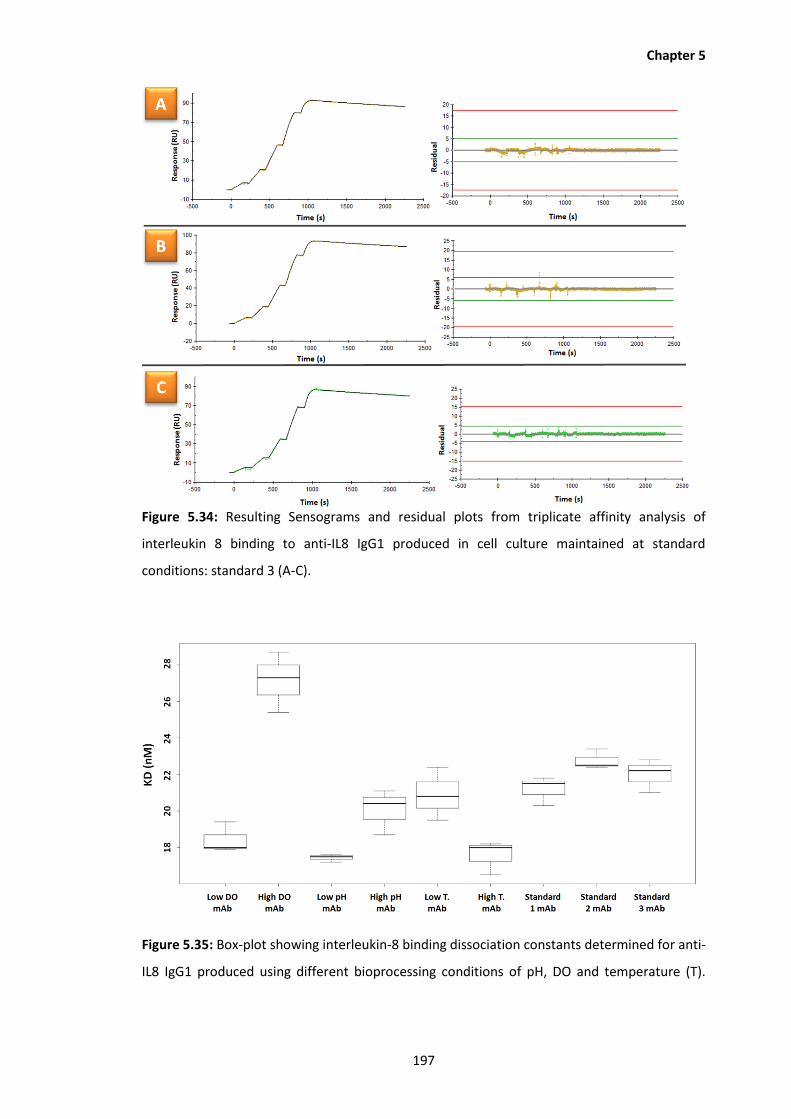
Chapter 5
197
Figure 5.34: Resulting Sensograms and residual plots from triplicate affinity analysis of
interleukin 8 binding to anti-IL8 IgG1 produced in cell culture maintained at standard
conditions: standard 3 (A-C).
Figure 5.35: Box-plot showing interleukin-8 binding dissociation constants determined for anti-
IL8 IgG1 produced using different bioprocessing conditions of pH, DO and temperature (T).

Chapter 5
198
5.4 Conclusions
In this Chapter, the effect of altering bioprocess conditions of pH, temperature and DO on the
structure and function of therapeutic anti-IL8 IgG1 was evaluated. HDX-MS was used for in-
depth structural characterisation of the biomolecule revealing conformational changes to
some portions of anti-IL8 IgG1 in response to expression in CHO DP-12 culture maintained
under different bioprocess parameters, namely 32.0oC, pH 7.2, 60% DO and 110% DO. Almost
half of these observed structural modifications could be aligned with sequence level
modifications determined previously. Although structural changes at both primary sequence
level and to the higher order structure may indicate potential variations in therapeutic mAb
function, to fully characterise the potential effects of altered bioprocessing on the quality of
the mAb, a functional assessment using SPR analysis was also performed. Following SPR
analysis to determine mAb binding to FcRn, the cellular receptor responsible for re-circulation
of mAb in the body and hence serum half-life of mAbs, variations in the binding affinities of
FcRn and mAb produced at 32.0oC were determined. These results indicate a possible
reduction in serum half-life for anti-IL8 IgG1 produced at 32.0oC and may be potentially related
to conformational changes and primary sequence changes observed for this mAb sample.
Additional SPR analysis to assess the binding characteristics of anti-IL8 IgG1 produced using
different bioprocessing conditions to the target antigen interleukin-8 revealed an observed
change in binding affinity for mAb produced using 110% DO content of culture media. Despite
scope for improvement, in particular for HDX digestion efficiency, these two techniques
epitomise powerful analytical tools that may be applied for comparability assessment of
biosimilars or to determine changes to function, efficacy and safety of protein
biopharmaceuticals in response to changes in production. Furthermore, the combined results
highlight the need for multiple analytical strategies to fully evaluate changes to recombinant
protein products in response to manufacture changes.
5.5 Author Contributions
Research study devised by Amy Farrell and Jonathan Bones; research performed by Amy
Farrell; Chapter written by Amy Farrell and reviewed by Jonathan Bones.
Chapter 5
199
5.6 References
1. Houde, D., S.A. Berkowitz, and J.R. Engen, The utility of hydrogen/deuterium exchange
mass spectrometry in biopharmaceutical comparability studies. J Pharm Sci, 2011.
100(6): p. 2071-86.
2. International Conference on Harmonisation, 2012, ICH Harmonised Tripartite
Guideline, Development and Manufacture of Drug Substances (Chemical Entities and
Biotechnological/Biological Entities) Q11. Retrieved 10 June 2016 from
http://www.ich.org/fileadmin/Public_Web_Site/ICH_Products/Guidelines/Quality/Q1
1/Q11_Step_4.pdf.
3. International Conference on Harmonisation, 2004, ICH Harmonised Tripartite
Guideline, Comparability of Biotechnological/Biological Products Subject to Changes in
Their Manufacturing Process Q5E. Retrieved 10 June 2016 from
http://www.ich.org/fileadmin/Public_Web_Site/ICH_Products/Guidelines/Quality/Q5
E/Step4/Q5E_Guideline.pdf.
4. Panjwani, N., et al., Assessment of the effects of pH, formulation and deformulation on
the conformation of interferon alpha-2 by NMR. J Pharm Sci, 2010. 99(8): p. 3334-42.
5. Amezcua, C.A. and C.M. Szabo, Assessment of higher order structure comparability in
therapeutic proteins using nuclear magnetic resonance spectroscopy. J Pharm Sci,
2013. 102(6): p. 1724-33.
6. Norrman, M. and G. Schluckebier, Crystallographic characterization of two novel
crystal forms of human insulin induced by chaotropic agents and a shift in pH. BMC
Struct Biol, 2007. 7: p. 83.
7. Majumdar, R., et al., Hydrogen-deuterium exchange mass spectrometry as an
emerging analytical tool for stabilization and formulation development of therapeutic
monoclonal antibodies. J Pharm Sci, 2015. 104(2): p. 327-45.
8. Berkowitz, S.A., et al., Analytical tools for characterizing biopharmaceuticals and the
implications for biosimilars. Nat Rev Drug Discov, 2012. 11(7): p. 527-40.
9. Wei, H., et al., Hydrogen/deuterium exchange mass spectrometry for probing higher
order structure of protein therapeutics: methodology and applications. Drug Discov
Today, 2014. 19(1): p. 95-102.
Chapter 5
200
10. Golay, J. and M. Introna, Mechanism of action of therapeutic monoclonal antibodies:
promises and pitfalls of in vitro and in vivo assays. Arch Biochem Biophys, 2012.
526(2): p. 146-53.
11. Roopenian, D.C. and S. Akilesh, FcRn: the neonatal Fc receptor comes of age. Nat Rev
Immunol, 2007. 7(9): p. 715-25.
12. Abdiche, Y.N., et al., The neonatal Fc receptor (FcRn) binds independently to both sites
of the IgG homodimer with identical affinity. MAbs, 2015. 7(2): p. 331-43.
13. Neuber, T., et al., Characterization and screening of IgG binding to the neonatal Fc
receptor. MAbs, 2014. 6(4): p. 928-42.
14. Hamblett, K.J., et al., Altering antibody drug conjugate binding to the Neonatal Fc
Receptor impacts efficacy and tolerability. Mol Pharm, 2016.
15. Suzuki, T., et al., Importance of neonatal FcR in regulating the serum half-life of
therapeutic proteins containing the Fc domain of human IgG1: a comparative study of
the affinity of monoclonal antibodies and Fc-fusion proteins to human neonatal FcR. J
Immunol, 2010. 184(4): p. 1968-76.
16. Schlothauer, T., et al., Analytical FcRn affinity chromatography for functional
characterization of monoclonal antibodies. MAbs, 2013. 5(4): p. 576-86.
17. Wu, Q., et al., Development and applications of AlphaScreen-based FcRn binding assay
to characterize monoclonal antibodies. J Immunol Methods, 2015. 420: p. 31-7.
18. Manta, B., et al., Tools to evaluate the conformation of protein products. Biotechnol J,
2011. 6(6): p. 731-41.
19. Leonard, P., S. Hearty, and R. O'Kennedy, Measuring protein-protein interactions using
Biacore. Methods Mol Biol, 2011. 681: p. 403-18.
20. US patent 6117980 A, Humanized anti-IL-8 monoclonal antibodies.
[http://www.google.com/patents/US6117980
21. Karlsson, R., et al., Analyzing a kinetic titration series using affinity biosensors. Anal
Biochem, 2006. 349(1): p. 136-47.

Chapter 5
201
22. Iacob, R.E., et al., Investigating monoclonal antibody aggregation using a combination
of H/DX-MS and other biophysical measurements. J Pharm Sci, 2013. 102(12): p. 4315-
29.
23. Houde, D., et al., Post-translational modifications differentially affect IgG1
conformation and receptor binding. Mol Cell Proteomics, 2010. 9(8): p. 1716-28.
24. Houde, D., et al., Characterization of IgG1 conformation and conformational dynamics
by hydrogen/deuterium exchange mass spectrometry. Anal Chem, 2009. 81(7): p.
2644-51.
25. Yan, Y., et al., Isomerization and Oxidation in the Complementarity-Determining
Regions of a Monoclonal Antibody: A Study of the Modification-Structure-Function
Correlations by Hydrogen-Deuterium Exchange Mass Spectrometry. Anal Chem, 2016.
88(4): p. 2041-50.
26. Jensen, P.F., et al., Investigating the interaction between the neonatal Fc receptor and
monoclonal antibody variants by hydrogen/deuterium exchange mass spectrometry.
Mol Cell Proteomics, 2015. 14(1): p. 148-61.
27. Fang, J., et al., Effect of Fc-Glycan Structure on the Conformational Stability of IgG
Revealed by Hydrogen/Deuterium Exchange and Limited Proteolysis. Biochemistry,
2016. 55(6): p. 860-8.
28. Klotz, I.M. and D.D. Mueller, Local environment effects on hydrogen--deuterium
exchange. Biochemistry, 1969. 8(1): p. 12-6.
29. Venable, J.D., et al., Subzero temperature chromatography for reduced back-exchange
and improved dynamic range in amide hydrogen/deuterium exchange mass
spectrometry. Anal Chem, 2012. 84(21): p. 9601-8.
30. Engen, J.R. and T.E. Wales, Analytical Aspects of Hydrogen Exchange Mass
Spectrometry. Annu Rev Anal Chem (Palo Alto Calif), 2015. 8: p. 127-48.
31. Ahn, J., et al., Accessing the reproducibility and specificity of pepsin and other aspartic
proteases. Biochim Biophys Acta, 2013. 1834(6): p. 1222-9.
32. Dykstra, A.B., M. Chen, and K.D. Cook, Complementary peptide sequence coverage
using alternative enzymes for on-line digestion with a triaxial electrospray probe. J Am
Soc Mass Spectrom, 2009. 20(11): p. 1983-7.

Chapter 5
202
33. Ahn, J., et al., Pepsin immobilized on high-strength hybrid particles for continuous flow
online digestion at 10,000 psi. Anal Chem, 2012. 84(16): p. 7256-62.
34. Wang, W., et al., Impact of methionine oxidation in human IgG1 Fc on serum half-life
of monoclonal antibodies. Mol Immunol, 2011. 48(6-7): p. 860-6.
35. Goebl, N.A., et al., Neonatal Fc receptor mediates internalization of Fc in transfected
human endothelial cells. Mol Biol Cell, 2008. 19(12): p. 5490-505.
36. Khawli, L.A., et al., Charge variants in IgG1: Isolation, characterization, in vitro binding
properties and pharmacokinetics in rats. MAbs, 2010. 2(6): p. 613-24.
37. Bertolotti-Ciarlet, A., et al., Impact of methionine oxidation on the binding of human
IgG1 to Fc Rn and Fc gamma receptors. Mol Immunol, 2009. 46(8-9): p. 1878-82.
38. Pan, H., et al., Methionine oxidation in human IgG2 Fc decreases binding affinities to
protein A and FcRn. Protein Sci, 2009. 18(2): p. 424-33.
Chapter 6
203
6.0
Identification and Quantitation of
Bioprocess-related Host Cell Protein
Impurities following Downstream
Processing of Therapeutic Monoclonal
Antibodies
6.1 Introduction
Monoclonal antibodies (mAbs), the largest class of recombinant biotherapeutic proteins
currently marketed, are secreted from host cells during fermentation and subsequently
purified using an optimised downstream processing (DSP) platform. Host cell proteins (HCPs)
may be co-purified with therapeutic mAbs and hence are considered as a major class of
bioprocess-related impurities and categorised as a critical quality attribute in the International
Conference on Harmonisation (ICH) guideline Q11 - Development and manufacture of drug
substances. [1] Due to their potential impact on drug product safety, including their potential
to cause adverse events or antigenic effects in patients, it is a regulatory requirement to
remove these impurities from therapeutic mAb products to below detectable levels when
measured using highly sensitive analytical methods. [2][3] As HCPs have a diverse range of
immunological and physiochemical properties, downstream processing (DSP) of mAbs requires
multiple orthogonal purification steps, often comprised of Protein A affinity capture followed
by additional chromatographic polishing. [4, 5] Protein A chromatography is capable of
removing >98% of HCPs directly from the product stream and hence has become a standard
component of downstream processing platforms for monoclonal antibodies and Fc fusion
proteins. HCPs that are not removed via Protein A affinity chromatography have been shown
to be retained due to their interaction with bound mAb rather than association with the
Protein A resin itself. [6] The concentration and composition of HCPs in the harvest stream has
been shown to be dependent on the host cell line and culturing process, cell viability at the
time of harvest, the choice of downstream processing techniques and on the sequence of mAb
under production. [4, 7-11] Considerable work has been undertaken to develop robust and
sensitive analytical methods for HCP detection and quantitation due to the importance in

Chapter 6
204
detecting HCPs during process development, biopharmaceutical production and in the final
drug product.
The HCP content of in-process and final mAb drug product samples are typically quantified
using anti-HCP enzyme-linked immuno-sorbent assays (ELISA). However, as the generation of
antibodies used for ELISA is dependent on the immune response of the species used for anti-
HCP antibody generation, HCPs that do not provoke an immune response or that produce a
low immune response may not be detected. [9] Nevertheless, anti-HCP ELISA is highly
sensitive (1-100 ppm) and is recommended by regulatory agencies for quantitation of total
HCP content within in-process samples and in final drug product. [12] While quantitative
information of the total HCP content provided by ELISA analysis is currently acceptable for lot-
release, it does not provide any information on the profile or properties of HCPs, which may
be used for process design improvement. Hence methods that facilitate identification of
individual HCPs have gained prominence in recent years, most notable those incorporating
mass spectrometry-based detection. Two dimensional gel electrophoresis (2-DE) with
subsequent mass spectrometry-based protein identification has been used to determine HCPs
present in products produced by different CHO cell lines.[6, 13-15] While more recently, LC-
MS techniques have been applied to evaluate the clearance of HCPs from the process stream
following various downstream processing steps. [16-18]
Quantitative proteomic approaches involving liquid chromatography coupled to mass
spectrometry (LC-MS) operated in the data dependent acquisition (DDA) mode are widely
used for detection of proteins in complex biological mixtures. However, as mAb concentration
in biopharmaceutical samples are typically more than three orders of magnitude greater than
HCP species, low intensity HCP peptides are not selected for fragmentation by DDA due to the
intensity bias of the mAb peptides. Consequently, data independent acquisition (DIA) modes,
such as multiplexed data acquisition (MSE), have proven to be more suitable for the detection
and quantitation of low abundance HCPs. [3, 19-22] The use of multidimensional
chromatographic separation methods, in conjunction with MSE detection allows for the
analysis of a broad dynamic range of proteins [23] and when combined with label free Hi3
quantitation, [24] LC-MSE represents a powerful approach for the quantitative analysis of
HCPs. [19] Unlike alternative proteomic methods for HCP analysis that require the
incorporation of a HCP enrichment step, [3, 25, 26] the 2D-LC-MSE method has the added
advantage of enabling the analysis of HCPs in the presence of the biotherapeutic protein
product.

Chapter 6
205
In this study, we applied an offline 2D-LC-MSE proteomic platform with Hi3 quantitation to
evaluate the suitability of four different elution buffers for the removal of HCPs from mAb
samples following Protein A purification. In the first dimension a high pH reversed-phase HPLC
method was used to generate a peptide map. Collected fractions were subsequently further
separated using low pH reversed-phase nano-LC with hyphenated MS detection operated in
the data independent MSE mode. The effect of elution buffer choice on the quality of the
therapeutic protein was evaluated by determination of critical quality attributes (CQAs)
including aggregation profile, charge variant analysis and N-glycosylation analysis. In addition,
the developed proteomic platform was used to investigate the impact of the time of cell
culture harvest on the HCP repertoire of a therapeutic protein following Protein A purification.
Subsequently, the incorporation of additional DSP procedures to compliment Protein A
purification in removing HCPs from the product stream was evaluated.
6.2 Experimental
6.2.1 Reagents and Consumables
Dithiothreitol (DTT), Iodoacetamide (IAA), Acetonitrile, Formic acid, Triethylammonium
bicarbonate (TAB), Ammonium hydroxide, Sodium acetate, Trisodium citrate dehydrate, L-
arginine, Phosphate buffered saline, [Glu1]-Fibrinopeptide B, Trifluoroacetic acid (TFA), Sodium
hydroxide (NaOH), Acetone, Acetic acid, Trichloroacetic acid (TCA), Ammonium Bicarbonate,
Sodium chloride (NaCl), dimethyl sulfoxide (DMSO), 2-aminobenzamide (2-AB), Sodium
Cyanoborohydride, Phosphate Buffered Saline (PBS), Sodium phosphate monobasic dihydrate
(NaH2PO4 · 2H2O) and Sodium phosphate dibasic heptahydrate (Na2HPO4 · 7H2O) were
purchased from Sigma Aldrich and were ACS reagent grade or better (Wicklow, Ireland).
Water, 0.1 % formic acid (LC-MS Optima), Acetonitrile, 0.1 % formic acid (LC-MS Optima) and
Water, 0.1 % TFA (LC-MS Optima) were obtained from Fisher Scientific (Dublin, Ireland). pH
gradient buffers CX-1, pH gradient buffer A (pH 5.6) and CX-1, pH gradient buffer B (pH 10.2)
were acquired from Thermo Scientific. Promega sequencing grade modified trypsin was from
MyBio Ltd. (Kilkenny, Ireland). New England Biolabs Glycerol Free PNGase F, (exoglycosidase
enzymes) were purchased from Brennan and Co. (Dublin, Ireland). Glycine was obtained from
USB Corporation (Ohio, USA). A BioRad QuickStartTM Bradford Protein Assay Kit with Bovine γ-
globulin standard sets was acquired from Fannin Ltd. (Dublin, Ireland). A CHO HCP ELISA kit
was purchased from Cygnus Technologies (North Carolina, USA). 100% Acetic acid (AnalaR
NORMAPUR) was from VWR (Dublin, Ireland). RapiGest SF surfactant and Hi3 E. coli standard
Chapter 6
206
peptides were purchased from Waters (Dublin, Ireland). New Objectives Silica Tip Pico Tip
emitters were obtained from Aquilant scientific UK Ltd. (Hampshire, UK).
6.2.2 Cell Culture
A Chinese hamster ovary cell line (CHO DP-12 clone#1934 [CHO DP-12, clone#1934 aIL8.92 NB
28605/14] (ATCC® CRL-12445TM) producing recombinant human anti-interleukin 8 IgG1
antibody, mAb1, was purchased from LGC standards (Middlesex, UK) and adapted to grow in
serum-free suspension culture. CHO DP-12 cells were grown in 200 mL (shake flask, 125 rpm)
of Excell 325 PF CHO serum-free cell culture medium (Sigma Aldrich) supplemented with 10
mg.L-1 recombinant human Insulin (Sigma Aldrich), 1 µM Methotrexate (Sigma Aldrich), 4 mM
L-glutamine (Biosciences) and 20,000 Units of Penicillin-Streptomycin (Fisher Scientific) at
37 °C (5% CO2). Viability and viable cell density were measured using the trypan blue exclusion
method and a haemocytometer. Culture supernatant was obtained by centrifuging the cell
suspension (4000 rpm, 5 minutes) and was stored at -30oC pending further analysis.
6.2.3 IgG Purification
6.2.3.1 Protein A Affinity Chromatography
Aliquots of cell culture supernatant were clarified prior to Protein A purification by sequential
filtration through 0.45 µm and 0.2 µm syringe filters (VWR). Samples were then purified via
Protein A chromatography using a 1 mL HiTrap Protein A column (GE Healthcare). Samples of
clarified media were passed through the Protein A column at a flow rate of 1 mL.min-1 and
subsequently washed with PBS to ensure complete removal of all un-retained material. Elution
of mAb1 from the Protein A column was performed using one of four buffers, namely 100 mM
sodium acetate, pH 3.5; 100 mM glycine, pH 3.5; 100 mM citrate, pH 3.5 or 100 mM arginine,
pH 3.5. The pH of eluate, collected in Amicon Ultra centrifugal filter units with a 10 kDa cut-off
membrane (Sigma Aldrich), was neutralized using 0.5 M Tris and buffer-exchanged into PBS
(4,000 rpm for 20 min). An aliquot of the concentrated and buffer exchanged mAb1 sample
was assayed for IgG content using the Bradford assay, wherein samples were diluted 50-fold
with Bradford reagent and incubated for 30 minutes at room temperature before recording
the sample absorbance using a spectrophotometer at 595 nm. Sample concentration was
calculated using a standard curve prepared from BSA standards of known concentration
Chapter 6
207
prepared at the same time The remainder of the samples were stored at -30oC pending further
analysis.
6.2.3.2 Multimodal Chromatography Purification via CaptoTM Adhere ImpRes
Following Protein A purification, 2 mg of mAb1 was further purified using a multimodal strong
anion exchange resin, CaptoTM adhere ImpRes (GE Healthcare), operating in flow-through
mode. Following sample application, the column was washed with PBS until mAb1 had fully
eluted from the column. Adsorbed material was eluted using 100 mM acetic acid, pH 3.0. The
flow-through mAb1 was collected in Amicon Ultra 10 kDa centrifugal filter units (Sigma
Aldrich) and centrifuged (4,000 rpm for 20 min). An aliquot of mAb1 sample was assayed for
IgG content using the Bradford assay. The remainder of the sample was stored at -30oC
pending further analysis.
6.2.4 High pH- Low pH 2D-LC-MSE Analysis of HCPs
1 mg of mAb was denatured with 0.1% (w/v) Rapigest, reduced with 5 mM DTT for 60 minutes
at 20oC, alkylated with 15 mM IAA for 30 minutes at 20oC in darkness and enzymatically
digested overnight (37 oC) with trypsin using a 1:50 (w/w, enzyme: protein) ratio. Following
digestion the Rapigest surfactant was hydrolysed by the addition of an equal volume of 1%
(v/v) formic acid in 10% acetonitrile. Samples were incubated for 10 minutes at 20oC and
centrifuged (10 minutes, 16,000 x g) for removal of the insoluble constituent of the hydrolysed
Rapigest. The supernatant was reduced to dryness via vacuum centrifugation.
Dried peptides were reconstituted in 500 µL of 0.1% formic acid and analysed using a Waters
2695 Alliance HPLC instrument with UV detection for first dimension separation. Peptide
separations were performed on a Waters XBridge BEH 130 C18 3.5 µm 2.1 x 150 mm analytical
column using a binary gradient of 20 mM ammonium formate in water, pH 10 (A) and 20 mM
ammonium formate in 90% acetonitrile, pH 10 (B). Gradient conditions were as follows: 3% B
initially for 2 minutes, increased to 10% B in 2 minutes with a further increase to 45% B over
33 minutes followed by a final increase to 100% B in two minutes with a two minute isocratic
hold. Initial conditions were restored in one minute and held for an additional 10 minutes to
ensure column re-equilibration. The column temperature was maintained at 40oC and the flow
rate was 200 µL.min-1. Sample fractions were collected at minute intervals over the course of
the gradient and subsequently recombined to 20 samples in such a way as to ensure that
Chapter 6
208
resulting samples contained peptides with a range of hydrophobicity and a similar peptide
concentration, estimated based on UV absorbance at 214 nm. Resulting samples were reduced
to dryness via vacuum centrifugation.
A Waters nanoAcquityTM UPLC® instrument equipped with a nanoAcquity UPLC 2G-V/M Trap 5
µm symmetry C18, 180 µm x 20 mm trapping column and a nanoAcquity UPLC 1.8 µm HSS T3,
75 µm x 200 mm analytical column was used for the second dimension low pH LC-MS
separation of peptides. Prior to loading, peptide samples were reconstituted in 1.6 µL 0.1% FA
and 6.4 µL of 1 pmol.µL-1 Hi3 E. coli standard peptides and loaded onto the trapping column at
a flow rate of 10 µL.min-1 using 0.1% (v/v) formic acid in water (C) and 0.1% (v/v) formic acid in
acetonitrile (D). Trapping conditions were maintained at 99.9% C for 5 minutes. Subsequent
analytical separation of peptides was achieved using the following gradient conditions: 3% D
initially for 2 minutes, increased to 6% D in 2 minutes with a further increase to 25% D over 88
minutes followed by a final increase to 85% B in two minutes with a two minute isocratic hold.
Initial conditions were restored in 11 minutes and held for an additional 15 minutes to ensure
column re-equilibration. The column temperature was maintained at 30oC throughout and the
flow rate at 0.3 µL.min-1. Injection volume was 2.5 µL.
Eluate from the chromatographic system was sampled directly into a Synapt G2 HDMS QTof
mass spectrometer (Millford, MA, USA) via a NanoLockSprayTM dual electrospray ion source
equipped with a nanoflow sprayer using 10 ± 1 µm PicoTip emitters. The mass spectrometer
was operated in positive ion data independent mode with one second sequential low and high
energy scans in the range of 50 to 2,000 Da. The spray voltage was 3 kV. A collision energy
ramp from 20 to 45 V was used for the high energy function. Glu-fibrinopeptide (m/z
785.8426, z=2) was used as lockmass solution, recorded at 30 second intervals.
Resultant data were processed using ProteinLynx Global Server (PLGS) version 3.0.1. for
identification and quantitation of HCPs, using the following workflow parameters: automatic
peptide and fragment tolerances with lockmass correction of all doubly charged masses,
minimum number of fragment ion matches per peptide = 3, minimum number of fragment ion
matches per protein = 7, minimum number of unique peptides per protein = 2, primary digest
reagent trypsin, with maximum number of one missed cleavage, fixed modification:
carbamidomethyl C, variable modifications: oxidation M and deamidation N, Q, false discovery
rate maintained at 1% FDR. Data was searched against the Cricetulus griseus, NCBI FASTA
database (http://www.ncbi.nlm.nih.gov/assembly/GCF_000419365.1/, downloaded 12th June
2015), appended with Hi3 standard protein sequence (E. coli chaperone protein ClpB) and the
known mAb sequence. Processing parameters were optimized using Waters PLGS Threshold
Chapter 6
209
Inspector software version 2.0. Processed data for each sample fraction were combined using
the ‘Merge data’ function in PLGS. A minimum of two unique peptides was required for
protein identification. Three unique peptides were necessary for Hi3 quantitation of individual
proteins. For each identified protein, PLGS software reported absolute quantitation in terms of
femtomoles and nanograms of protein in each sample. Given that one milligram of mAb was
prepared; it was possible to determine the amount of each HCP expressed in nanograms per
milligram of mAb, i.e. ppm of HCP in mAb sample.
6.2.5 Intact Protein Analysis of mAb Critical Quality Attributes
MAb critical quality attributes (CQAs) including aggregation profile and charge variant analysis
were determined using a Waters Acquity H-Class Bio UPLC instrument with UV detection at
280 nm. The presence of protein aggregates and higher order structures was determined via
size exclusion chromatography, SEC-UV, using an Acquity UPLC BEH200 SEC 1.7 µm, 2.1 x 150
mm (Waters) column under isocratic conditions of 100 mM sodium phosphate buffer, 150 mM
NaCl, pH 6.8 at 0.3 mL.min-1. Charge variant analysis of intact mAb was performed using a pH
gradient based separation on a MAbPac SCX-10 RS analytical column, 5 µm, 2.1 x 50 mm
(Thermo Scientific) using CX-1 pH gradient buffer A, pH 5.6 and CX-1 pH gradient buffer B, pH
10.2 (Thermo scientific). Elution of sample peaks was achieved using a linear gradient of 37 -
55% CX-1 pH gradient buffer B, pH 10.2 in 10 minutes.
6.2.6 Glycan Analysis
50 µg of Protein A purified mAb1 was prepared in 50 mM ammonium bicarbonate, reduced
with 1 mM DTT for 10 minutes at 65oC and alkylated by incubation with 5 mM IAA at room
temperature in the dark for 30 minutes. N-glycans were enzymatically released by overnight
(16 hour) incubation with 500 Units of PNGase F. Following digestion, the mAb was removed
from solution using ice cold ethanol precipitation. The liquid phase containing the glycans was
reduced to dryness via vacuum centrifugation. Released glycans were then fluorescently
derivatised via reductive amination using 5 µL of 0.37 M 2-aminobenzamide (2AB) and 0.95 M
sodium cyanoborohydride in 30% v/v acetic acid in DMSO at 65oC for two hours. Upon
completion of the labelling reaction, 10 µL of water and 85 µL of acetonitrile were added to
the sample. Excess fluorophore was removed by HILIC chromatography using a Thermo
Ultimate 3000 RS HPLC equipped with an Acquity BEH Glycan analytical column, 1.7 µm, 2.1 x

Chapter 6
210
50 mm (Waters). Purified N-glycans were collected and reduced to dryness by vacuum
centrifugation. 2AB-derivatised N-glycan samples were subsequently reconstituted in 50 µL of
80% acetonitrile and analysed using a Waters Acquity I-Class UPLC instrument with
fluorescence detection. Separations were performed using a BEH Glycan, 1.7 µm, 2.1 x 100
mm analytical column using a gradient of 50 mM ammonium formate, pH 4.5 and acetonitrile,
70 to 53% acetonitrile at 0.561 mL.min-1 in 15.5 minutes. Column temperature was maintained
at 40oC. Excitation and emission wavelengths for fluorescence detection were λex = 330 nm
and λem = 420 nm. Exoglycosidase digestion of N-glycans was performed using an adaption of
the method described by Royle and co-workers. [27]
6.2.7 Anti-Host Cell Protein ELISA
HCPs were quantified by ELISA using a CHO HCP ELISA kit (Cygnus technologies) according to
the high sensitivity protocol recommended by the manufacturer. Optical density was
measured using a Perkin Elmer Victor X3 Multi-label plate reader at 450 nm.
6.3 Results and Discussion
6.3.1 Analytical Platform Performance
Figure 6.1: Schematic of workflow for discovery proteomic analysis of HCPs in biotherapeutic
protein samples.
A standard schematic of the workflow used for processing of HCP samples is shown in Figure
6.1. To determine the performance of the proteomic platform, cell culture media containing
mAb1, HCPs and other contaminants was harvested and processed using Protein A affinity
chromatography. In total 1 mg of mAb1 was reduced, alkylated and digested with trypsin
before undergoing offline 2D high pH/low pH reversed phase separation. Unlike previous

Chapter 6
211
studies which utilised online 2D-LC-MSE for the analysis of HCPs in biopharmaceutical samples,
[19, 28] the use of offline high pH separation in the first dimension allows for the generation
of a high performance peptide map at pH 10. As will be discussed later in this Section, the
formation of a peptide separation map permits the subsequent investigation of potential sites
of interaction between HCPs and individual mAb peptides. Following high pH fractionation, the
sample fractions were combined such that approximately the same amount of peptides was
contained in each of 20 samples for low pH nano-LC-MSE analysis. As previously noted the use
of the data independent MSE approach allows us to investigate the HCPs attached to the
actual therapeutic protein itself, by enabling a broad dynamic range for protein detection and
by eliminating any selection bias for ions as is characteristic of data dependent MS acquisition
modes. Due to the complexity of the method, incorporating multi-dimensional separation and
long run times, the precision of the proteomic method was evaluated in terms of repeatability,
based on the response of Hi3 standard peptides added to each of the prepared samples.
Following MS analysis, the peak heights of five Hi3 standard peptides in extracted ion
chromatograms for each of 20 second dimensional LC-MSE injections across three
experiments, shown in Figure 6.2, were evaluated using the ANOVA statistical test. Using
ANOVA it was determined that at 95% confidence level, no significant difference (P-value >
0.05) in the peak heights of the Hi3 standards was determined across multiple experiments.
Actual P-values from ANOVA analysis of standard peptide ion peak height in different samples
and experiments are displayed in Table 6.1. The Hi3 quantitation method was used to ensure
stringency with the resultant proteomic data, wherein a minimum requirement of three
unique identified peptides per protein was needed for quantitation. In addition to ensuring
the accurate quantitation of proteins, previously proven by Silva et al.[24], the necessity for a
minimum of three unique peptides also ensures specificity of protein identifications.

Chapter 6
212
Figure 6.2: Extracted ion chromatogram displaying ion peaks for each of the standard peptides
used for Hi3 quantitation.
Table 6.1: Resulting P-values from ANOVA determination of peak heights for each standard
peptide ion in extracted ion chromatograms analysed.
Hi3 Standard Peptide Sequence
Average Molecular Weight
m/z P-value
NNPVLIGEPGVGK 1293.4863 647.38 0.13770 LPQVEGTGGDVQPSQDLVR 1995.1776 998.54 0.12817
VIGQNEAVDAVSNAIR 1655.8292 828.47 0.07979 VTDAEIAEVLAR 1286.4484 643.88 0.55885 AIDLIDEAASSIR 1373.5266 687.39 0.14309
6.3.2 Evaluation of Protein A Elution Buffers on mAb HCP Load
DSP of mAbs generally involves the use of Protein A affinity chromatography in the first stage
of the purification process, wherein the mAb is retained and washed at neutral pH and
subsequently eluted from the Protein A resin by exposure to low pH (2.8-4.0) elution buffers.
A variety of elution buffers for Protein A purification are frequently used in industry including
acetate, arginine, citrate and glycine based buffers. [29, 30] The choice of elution buffer and
also pH and volume of elution buffer form a large portion of DSP development. [31]
To determine the criticality of the Protein A elution buffer for elimination of HCPs from the
product stream, the developed proteomic platform was applied to evaluate the effect of
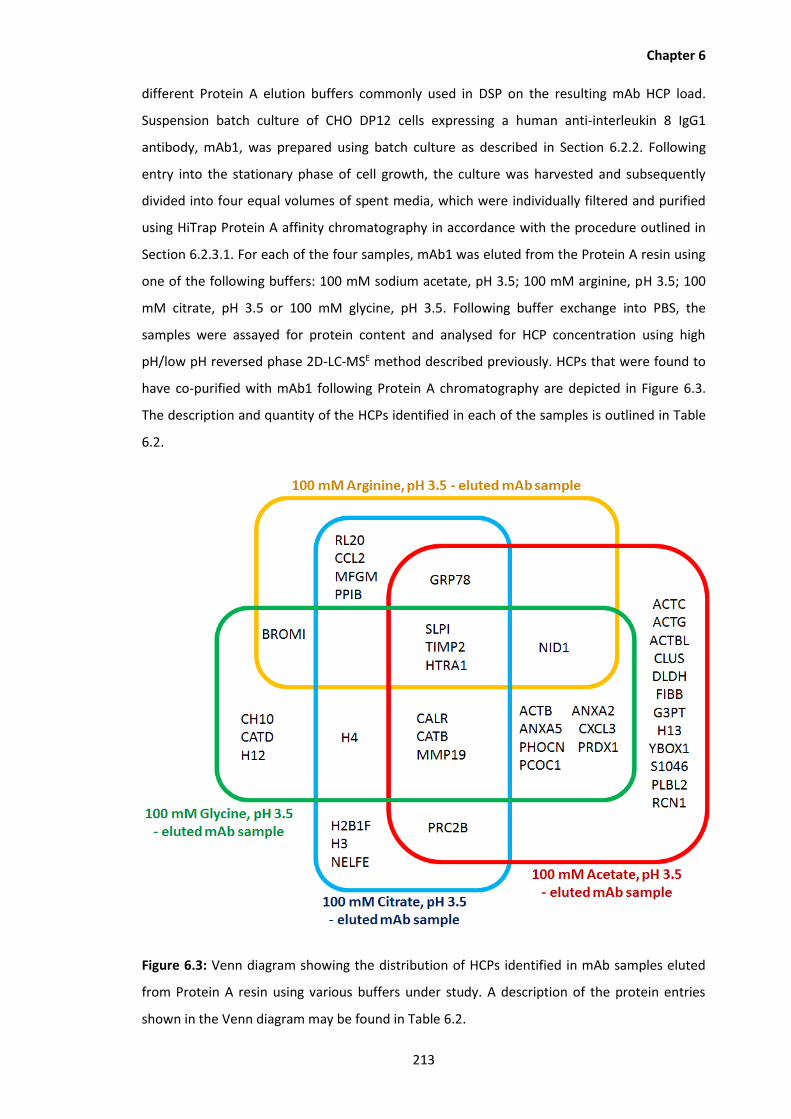
Chapter 6
213
different Protein A elution buffers commonly used in DSP on the resulting mAb HCP load.
Suspension batch culture of CHO DP12 cells expressing a human anti-interleukin 8 IgG1
antibody, mAb1, was prepared using batch culture as described in Section 6.2.2. Following
entry into the stationary phase of cell growth, the culture was harvested and subsequently
divided into four equal volumes of spent media, which were individually filtered and purified
using HiTrap Protein A affinity chromatography in accordance with the procedure outlined in
Section 6.2.3.1. For each of the four samples, mAb1 was eluted from the Protein A resin using
one of the following buffers: 100 mM sodium acetate, pH 3.5; 100 mM arginine, pH 3.5; 100
mM citrate, pH 3.5 or 100 mM glycine, pH 3.5. Following buffer exchange into PBS, the
samples were assayed for protein content and analysed for HCP concentration using high
pH/low pH reversed phase 2D-LC-MSE method described previously. HCPs that were found to
have co-purified with mAb1 following Protein A chromatography are depicted in Figure 6.3.
The description and quantity of the HCPs identified in each of the samples is outlined in Table
6.2.
Figure 6.3: Venn diagram showing the distribution of HCPs identified in mAb samples eluted
from Protein A resin using various buffers under study. A description of the protein entries
shown in the Venn diagram may be found in Table 6.2.
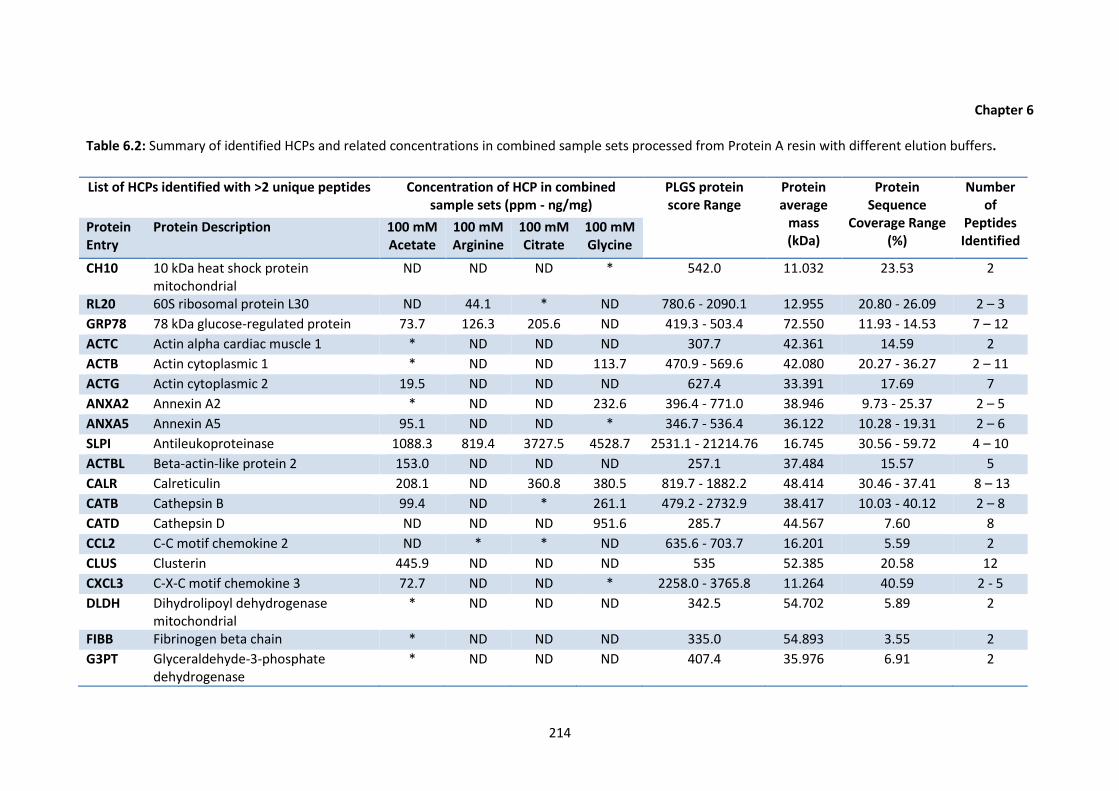
Chapter 6
214
Table 6.2: Summary of identified HCPs and related concentrations in combined sample sets processed from Protein A resin with different elution buffers.
List of HCPs identified with >2 unique peptides Concentration of HCP in combined sample sets (ppm - ng/mg)
PLGS protein score Range
Protein average
mass (kDa)
Protein Sequence
Coverage Range (%)
Number of
Peptides Identified
Protein Entry
Protein Description 100 mM Acetate
100 mM Arginine
100 mM Citrate
100 mM Glycine
CH10 10 kDa heat shock protein mitochondrial
ND ND ND * 542.0 11.032 23.53 2
RL20 60S ribosomal protein L30 ND 44.1 * ND 780.6 - 2090.1 12.955 20.80 - 26.09 2 – 3
GRP78 78 kDa glucose-regulated protein 73.7 126.3 205.6 ND 419.3 - 503.4 72.550 11.93 - 14.53 7 – 12
ACTC Actin alpha cardiac muscle 1 * ND ND ND 307.7 42.361 14.59 2
ACTB Actin cytoplasmic 1 * ND ND 113.7 470.9 - 569.6 42.080 20.27 - 36.27 2 – 11
ACTG Actin cytoplasmic 2 19.5 ND ND ND 627.4 33.391 17.69 7
ANXA2 Annexin A2 * ND ND 232.6 396.4 - 771.0 38.946 9.73 - 25.37 2 – 5
ANXA5 Annexin A5 95.1 ND ND * 346.7 - 536.4 36.122 10.28 - 19.31 2 – 6
SLPI Antileukoproteinase 1088.3 819.4 3727.5 4528.7 2531.1 - 21214.76 16.745 30.56 - 59.72 4 – 10
ACTBL Beta-actin-like protein 2 153.0 ND ND ND 257.1 37.484 15.57 5
CALR Calreticulin 208.1 ND 360.8 380.5 819.7 - 1882.2 48.414 30.46 - 37.41 8 – 13
CATB Cathepsin B 99.4 ND * 261.1 479.2 - 2732.9 38.417 10.03 - 40.12 2 – 8
CATD Cathepsin D ND ND ND 951.6 285.7 44.567 7.60 8
CCL2 C-C motif chemokine 2 ND * * ND 635.6 - 703.7 16.201 5.59 2
CLUS Clusterin 445.9 ND ND ND 535 52.385 20.58 12
CXCL3 C-X-C motif chemokine 3 72.7 ND ND * 2258.0 - 3765.8 11.264 40.59 2 - 5
DLDH Dihydrolipoyl dehydrogenase mitochondrial
* ND ND ND 342.5 54.702 5.89 2
FIBB Fibrinogen beta chain * ND ND ND 335.0 54.893 3.55 2
G3PT Glyceraldehyde-3-phosphate dehydrogenase
* ND ND ND 407.4 35.976 6.91 2

Chapter 6
215
H12 Histone H1.2 ND ND ND 82 1212.3 21.285 17.92 5
H13 Histone H1.3 * ND ND ND 1196.2 20.512 17.87 2
H2B1F Histone H2B type 1-F/J/L ND ND * ND 2297.5 11.158 27.45 2
H3 Histone H3 ND ND * ND 951.4 24.371 11.93 2
H4 Histone H4 ND ND * 86.3 782.6 - 1301.0 8.983 24.69 - 37.04 2 – 3
MFGM Lactadherin ND 207.1 419.6 ND 2639.8 - 3598.1 48.284 43.56 - 52.22 9 – 15
MMP19 Matrix metalloproteinase-19 * ND 210.0 449.8 462.7 - 584.3 59.170 12.57 - 20.38 2 – 8
TIMP2 Metalloproteinase inhibitor 2 358.7 298.0 346.9 1583.4 507.5 - 2285.2 27.486 17.62 - 52.46 6 – 9
PHOCN MOB-like protein phocein isoformX2 627.4 ND ND * 540.8 - 2205.8 32.759 20.28 - 25.17 2 – 8
NELFE Negative elongation factor E ND ND * ND 755.8 42.788 26.26 2
NID1 Nidogen-1 3357.9 * ND 2516 308.9 - 744.5 135.143 14.19 - 25.91 2 – 26
YBOX1 Nuclease-sensitive element-binding protein 1
318.6 ND ND ND 565.7 32.776 31.03 8
PPIB Peptidyl-prolyl cis-trans isomerase B ND * 85.3 ND 619.8 - 1464.6 23.692 21.76 - 22.22 2 – 6
PRDX1 Peroxiredoxin-1 * ND ND * 210.0 - 653.6 22.548 9.17 - 16.08 2
PCOC1 Procollagen C-endopeptidase enhancer
98.8 ND ND 1210 222.8 - 1109.1 51.131 16.45 - 33.55 7 – 11
PRC2B Proline-rich protein 2-like 1940.1 ND * ND 1310.9 - 1512.2 52.585 62.63 - 63.93 2 - 52
BROMI Protein Broad minded isoform X3 ND * ND * 374.5 - 415.7 146.423 4.77 - 5.16 2
S1046 Protein S100-A6 1.4 ND ND ND 1187.4 10.108 61.80 6
PLBL2 Putative phospholipase B-like 2 * ND ND ND 313.2 65.940 9.40 2
RCN1 Reticulocalbin-1 * ND ND ND 741.6 19.539 55.76 2
HTRA1 Serine Protease HTRA1 247.6 781.0 1247.9 2119.5 592.1.2 - 1530.7 48.697 24.94 - 38.98 7 - 13
Total concentration (ppm - ng HCP/mg IgG)
9206.2 2275.9 6603.6 14515.2
HCPs identified using a minimum of 2 peptides are denoted by the symbol ‘*’, while undetected HCPs are represented by ‘ND’.
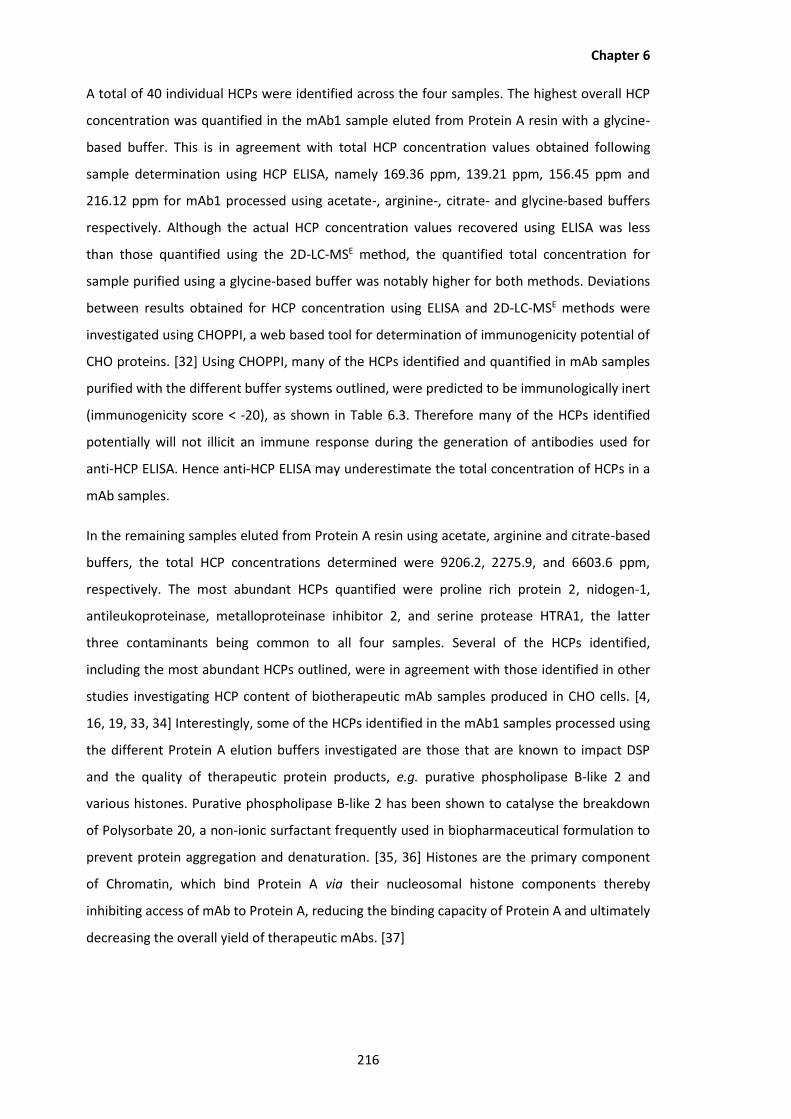
Chapter 6
216
A total of 40 individual HCPs were identified across the four samples. The highest overall HCP
concentration was quantified in the mAb1 sample eluted from Protein A resin with a glycine-
based buffer. This is in agreement with total HCP concentration values obtained following
sample determination using HCP ELISA, namely 169.36 ppm, 139.21 ppm, 156.45 ppm and
216.12 ppm for mAb1 processed using acetate-, arginine-, citrate- and glycine-based buffers
respectively. Although the actual HCP concentration values recovered using ELISA was less
than those quantified using the 2D-LC-MSE method, the quantified total concentration for
sample purified using a glycine-based buffer was notably higher for both methods. Deviations
between results obtained for HCP concentration using ELISA and 2D-LC-MSE methods were
investigated using CHOPPI, a web based tool for determination of immunogenicity potential of
CHO proteins. [32] Using CHOPPI, many of the HCPs identified and quantified in mAb samples
purified with the different buffer systems outlined, were predicted to be immunologically inert
(immunogenicity score < -20), as shown in Table 6.3. Therefore many of the HCPs identified
potentially will not illicit an immune response during the generation of antibodies used for
anti-HCP ELISA. Hence anti-HCP ELISA may underestimate the total concentration of HCPs in a
mAb samples.
In the remaining samples eluted from Protein A resin using acetate, arginine and citrate-based
buffers, the total HCP concentrations determined were 9206.2, 2275.9, and 6603.6 ppm,
respectively. The most abundant HCPs quantified were proline rich protein 2, nidogen-1,
antileukoproteinase, metalloproteinase inhibitor 2, and serine protease HTRA1, the latter
three contaminants being common to all four samples. Several of the HCPs identified,
including the most abundant HCPs outlined, were in agreement with those identified in other
studies investigating HCP content of biotherapeutic mAb samples produced in CHO cells. [4,
16, 19, 33, 34] Interestingly, some of the HCPs identified in the mAb1 samples processed using
the different Protein A elution buffers investigated are those that are known to impact DSP
and the quality of therapeutic protein products, e.g. purative phospholipase B-like 2 and
various histones. Purative phospholipase B-like 2 has been shown to catalyse the breakdown
of Polysorbate 20, a non-ionic surfactant frequently used in biopharmaceutical formulation to
prevent protein aggregation and denaturation. [35, 36] Histones are the primary component
of Chromatin, which bind Protein A via their nucleosomal histone components thereby
inhibiting access of mAb to Protein A, reducing the binding capacity of Protein A and ultimately
decreasing the overall yield of therapeutic mAbs. [37]
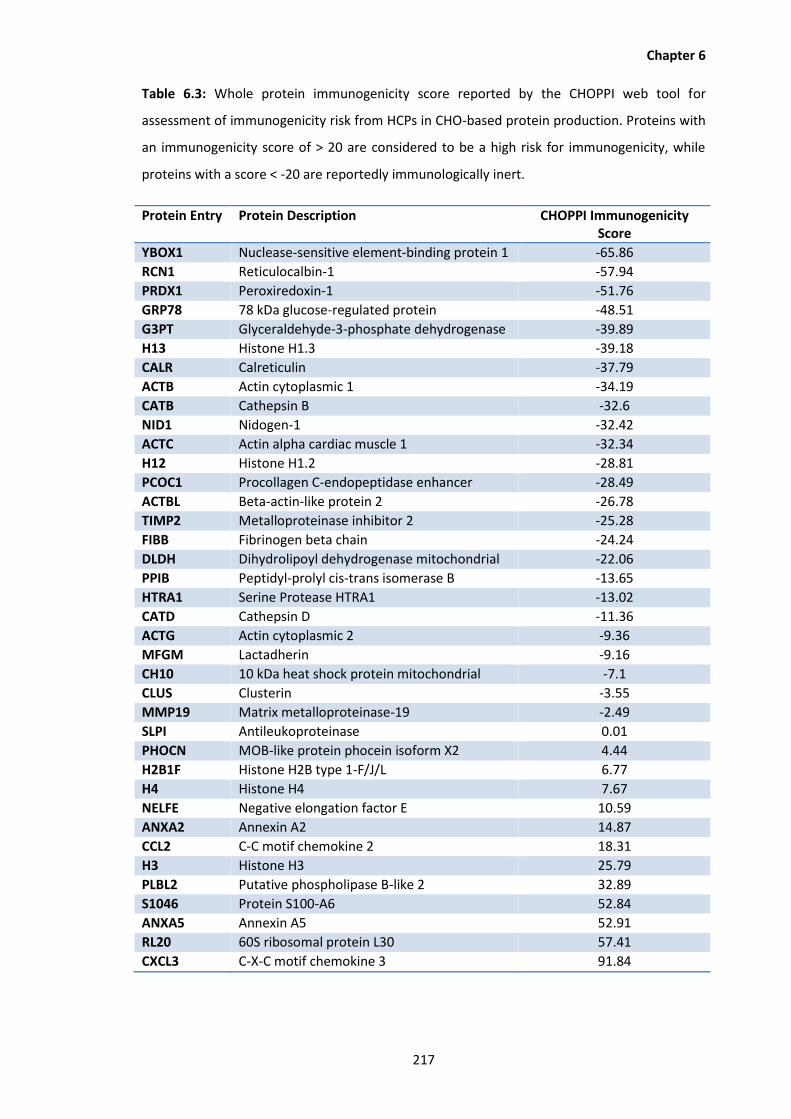
Chapter 6
217
Table 6.3: Whole protein immunogenicity score reported by the CHOPPI web tool for
assessment of immunogenicity risk from HCPs in CHO-based protein production. Proteins with
an immunogenicity score of > 20 are considered to be a high risk for immunogenicity, while
proteins with a score < -20 are reportedly immunologically inert.
Protein Entry Protein Description CHOPPI Immunogenicity Score
YBOX1 Nuclease-sensitive element-binding protein 1 -65.86
RCN1 Reticulocalbin-1 -57.94
PRDX1 Peroxiredoxin-1 -51.76
GRP78 78 kDa glucose-regulated protein -48.51
G3PT Glyceraldehyde-3-phosphate dehydrogenase -39.89
H13 Histone H1.3 -39.18
CALR Calreticulin -37.79
ACTB Actin cytoplasmic 1 -34.19
CATB Cathepsin B -32.6
NID1 Nidogen-1 -32.42
ACTC Actin alpha cardiac muscle 1 -32.34
H12 Histone H1.2 -28.81
PCOC1 Procollagen C-endopeptidase enhancer -28.49
ACTBL Beta-actin-like protein 2 -26.78
TIMP2 Metalloproteinase inhibitor 2 -25.28
FIBB Fibrinogen beta chain -24.24
DLDH Dihydrolipoyl dehydrogenase mitochondrial -22.06
PPIB Peptidyl-prolyl cis-trans isomerase B -13.65
HTRA1 Serine Protease HTRA1 -13.02
CATD Cathepsin D -11.36
ACTG Actin cytoplasmic 2 -9.36
MFGM Lactadherin -9.16
CH10 10 kDa heat shock protein mitochondrial -7.1
CLUS Clusterin -3.55
MMP19 Matrix metalloproteinase-19 -2.49
SLPI Antileukoproteinase 0.01
PHOCN MOB-like protein phocein isoform X2 4.44
H2B1F Histone H2B type 1-F/J/L 6.77
H4 Histone H4 7.67
NELFE Negative elongation factor E 10.59
ANXA2 Annexin A2 14.87
CCL2 C-C motif chemokine 2 18.31
H3 Histone H3 25.79
PLBL2 Putative phospholipase B-like 2 32.89
S1046 Protein S100-A6 52.84
ANXA5 Annexin A5 52.91
RL20 60S ribosomal protein L30 57.41
CXCL3 C-X-C motif chemokine 3 91.84
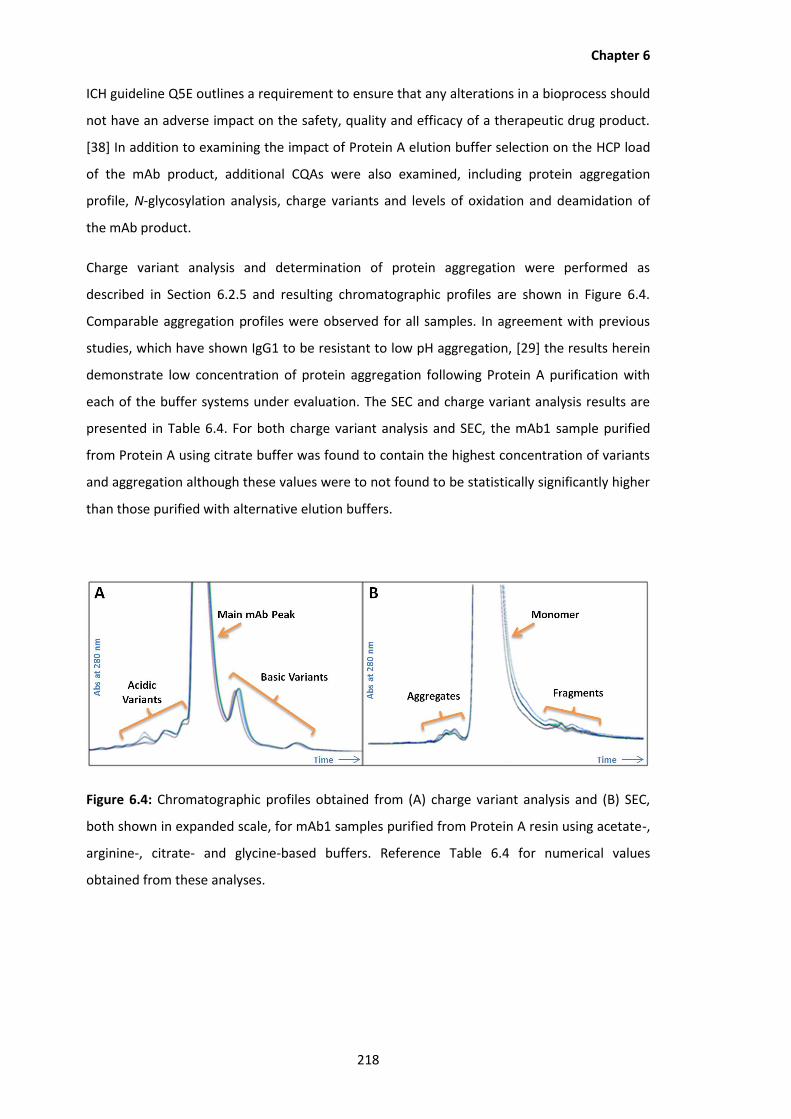
Chapter 6
218
ICH guideline Q5E outlines a requirement to ensure that any alterations in a bioprocess should
not have an adverse impact on the safety, quality and efficacy of a therapeutic drug product.
[38] In addition to examining the impact of Protein A elution buffer selection on the HCP load
of the mAb product, additional CQAs were also examined, including protein aggregation
profile, N-glycosylation analysis, charge variants and levels of oxidation and deamidation of
the mAb product.
Charge variant analysis and determination of protein aggregation were performed as
described in Section 6.2.5 and resulting chromatographic profiles are shown in Figure 6.4.
Comparable aggregation profiles were observed for all samples. In agreement with previous
studies, which have shown IgG1 to be resistant to low pH aggregation, [29] the results herein
demonstrate low concentration of protein aggregation following Protein A purification with
each of the buffer systems under evaluation. The SEC and charge variant analysis results are
presented in Table 6.4. For both charge variant analysis and SEC, the mAb1 sample purified
from Protein A using citrate buffer was found to contain the highest concentration of variants
and aggregation although these values were to not found to be statistically significantly higher
than those purified with alternative elution buffers.
Figure 6.4: Chromatographic profiles obtained from (A) charge variant analysis and (B) SEC,
both shown in expanded scale, for mAb1 samples purified from Protein A resin using acetate-,
arginine-, citrate- and glycine-based buffers. Reference Table 6.4 for numerical values
obtained from these analyses.

Chapter 6
219
Table 6.4: Analytical results from charge variant and size exclusion analysis of intact mAb1.
Buffer under evaluation
Charge variant analysis Size exclusion analysis
% acidic variants
% main % basic variants
% aggregates
% monomer
% fragment
100 mM sodium acetate, pH3.5
2.75 ± 0.23
87.61 ± 0.14
9.64 ± 0.94
0.10 ± 0.94
99.87 ± 0.12
0.03 ± 10.57
100 mM arginine, pH3.5
2.14 ±1.64
88.72 ± 0.14
9.14 ±0.59
0.10 ± 3.08
99.87 ± 0.06
0.03 ± 15.59
100 mM citrate, pH3.5
3.43 ± 1.36
87.21 ± 0.21
9.37 ± 0.26
0.19 ± 0.95
99.76 ± 0.10
0.05 ± 13.74
100 mM glycine, pH3.5
1.94 ± 2.15
88.76 ± 0.22
9.30 ± 0.57
0.12 ± 3.24
99.84 ± 0.05
0.04 ± 3.49
Analysis of N-glycans present on mAb1 samples eluted from Protein A resin with the different
buffer systems was also performed as per Section 6.2.6; resulting chromatograms are shown
in Figure 6.5. Peaks corresponding to the N-glycans released from the mAb1 samples were
integrated and compared based on relative percentage areas. Differences in the levels of
certain N-glycans identified using a panel of exoglycosidase digestions were found to be those
bearing terminal galactose residues, Figure 6.5, between the mAbs eluted using the different
buffers. Although galactosylation has not been correlated with adverse events in patients
treated with biotherapeutic mAb products, it may impact mAb effector functions [39] and
hence these results suggest, for this particular mAb, the use of glycine-based buffers in DSP
may have an effect on product efficacy.
Levels of deamidation and oxidation on the mAb peptide identified following LC-MSE analysis
of Protein A purified mAb1 samples eluted with the four aforementioned buffer systems were
also examined. A total of 13, 10, 10 and 9 modified peptides were identified in mAb1 samples
processed using acetate-, arginine- citrate- and glycine-based buffers, respectively, eight of
which were common to all samples (data not shown).

Chapter 6
220
Figure 6.5: Overlay of chromatgrams displaying N-glycan profiles of mAb1 processed from
Protein A resin using elution buffers 100 mM sodium acetate, pH 3.5, 100 mM arginine, pH
3.5, 100 mM citrate, pH 3.5 and 100 mM glycine, pH 3.5.
As each of the mAb1 samples purified using Protein A resin were produced using the same cell
culture, resulting data from HCP analysis and determination of CQAs should in theory be
identical across all samples. As the difference in Protein A elution buffer remained the single
variable in DSP of the mAbs, any disparity in HCP profile or quality attributes of the mAb could
be associated with the choice of the Protein A elution buffer. The glycine elution buffer
resulted in the highest overall concentration of HCPs and also revealed a negative impact on
mAb CQAs relative to the other buffers investigated. The greatest number of individual HCPs
identified and the highest number of modified mAb1 peptides were found in mAb1 purified
using an acetate buffer. Samples purified using the arginine buffer were found to contain
fewer individual HCP species and a considerably lower overall concentration of HCPs when
compared to othe purified mAb1 samples. Arginine buffers have recently attracted increased
interest for the elution of mAbs from Protein A resins due to their ability to suppress protein-
protein interactions and protein-surface interactions [40] resulting in desirable characteristics
including enhancement of virus inactivation. [41] The arginine-based elution buffer was used
for all subsequent Protein A purifications of mAb1 in this study.

Chapter 6
221
As offline high performance peptide maps were generated while fractionating the mAb1
samples, the possibility of relating the carriage of HCP through DSP to specific portions of the
mAb itself was investigated. Calreticulin, a HCP identified in multiple samples, was selected for
further investigation to determine possible interactions with mAb1. Calreticulin was identified
and quantified in a single fraction of three of the mAb samples analysed using 2D-LC-MSE.
MAb1 peptides also contained within these fractions were noted and are highlighted in Figure
6.6. As the Figure shows, the peptides contained within the fractions are not confined to one
particular portion of the mAb, inhibiting any potential correlation of interaction of Calreticulin
with a specific mAb sequence region. Grand average of hydropathy (GRAVY) score for each of
the mAb1 and HCP peptides was also evaluated resulting in no significant enrichment of
GRAVY scores suggesting that the retention of HCPs is not hydrophobicity based (data not
shown).
Figure 6.6: Graphic of anti-Interleukin 8 IgG1 (mAb1) structure. MAb1 peptides, which were
identified in sample fractions also containing Calreticulin peptides, are highlighted in the heavy
chain (blue) and light chain (green) portions of the structure. [42]
Chapter 6
222
6.3.3 Evaluation of Impact of Harvest Time on HCP Repertoire
Cell culture duration and cell viability are interrelated factors that may have a significant effect
on the composition and quantity of HCPs in biotherapeutic products. [9, 14, 15, 34] To
investigate the impact of cell culture harvest time, the developed 2D-LC-MSE proteomic
platform was applied in a temporal manner to determine changes in the HCP repertoire of
purified mAb samples, following harvest at different stages of cell culture. Replicate cell
cultures producing mAb1 were prepared concurrently and batch cultured under identical
conditions for five days. On day five, having reached the stationary phase of cell growth, the
first culture was harvested. The second cell culture was continued for a further two days, until
such a time as the culture had reached the end of the stationary phase of cell growth and at
which time the viability of the cells had begun to decrease. Resultant mAb1 samples were
analysed for HCP content using the high pH low pH 2D-LC-MSE method described in Section
6.2.4. Identified and quantified HCPs in the mAb1 samples are outlined in Table 6.5.
HCPs identified at the onset of stationary phase samples are predominantly secreted proteins
while the majority (>70%) of HCPs identified in the end of stationary phase samples are
characterised as intracellular proteins. [43] In addition, the mAb1 samples, from culture
harvested at the beginning of the stationary phase were found to contain lower levels of HCPs
when compared to mAb harvested at the end of the stationary phase. The increased instances
of intracellular proteins in mAb1 samples harvested at the end of the stationary phase may be
attributed to a loss in viability of cell culture (98.5% to 90.8%) likely resulting from lysis or
rupture of cells rather than secretion of protein material from within the cell.

Chapter 6
223
Table 6.5: Host cell proteins identified and quantified in Protein A purified mAb1 samples
harvested at different stages of cell culture growth.
Protein Entry
Protein Description Cellular Location Cell Culture Harvest time
HCP concentration (ppm) - Start of stationary phase
HCP concentration (ppm) - End of stationary phase
GRP78 78 kDa glucose-regulated protein
Cytoplasm, Endoplasmic reticulum
ND 329.6
ACTB Actin (cytoplasmic 1) Cytoplasm ND 83.5
ATL4 ADAMTS-like protein 4 Secreted *
SLPI Antileukoproteinase Secreted * 25.9
ABCG3 ATP-binding cassette sub-family G member 3
Cell membrane ND *
DHX8 ATP-dependent RNA helicase DHX8
Nucleus, cytoplasm ND *
CALR Calreticulin Endoplasmic reticulum
ND *
CLUS Clusterin Secreted, nucleus, cytoplasm
* 288.6
G3P Glyceraldehyde-3-phosphate dehydrogenase
Cytoplasm, nucleus ND 67.7
H2AX Histone H2AX Nucleus, chromosome ND *
MFGM Lactadherin Secreted 21.3 ND
MMP19 Matrix metalloproteinase-19
Secreted 43.5 *
TIMP2 Metalloproteinase inhibitor 2
Secreted ND *
NID1 Nidogen-1 Secreted 1189.7 772.3
PRDX1 Peroxiredoxin-1 Cytoplasm, nucleus 559.8 343.2
PAIRB Plasminogen activator inhibitor 1 RNA-binding protein
Cytoplasm, nucleus * ND
PCOC1 Procollagen C-endopeptidase enhancer
Secreted * ND
HTRA1 Serine Protease HTRA1 Secreted, cytoplasm ND 111.2
TPA Tissue-type plasminogen activator
Secreted, cytoplasm * ND
Total HCP concentration (ppm - ng of HCP/ mg of mAb) 1814 2022
HCPs identified using a minimum of 2 peptides are denoted by the symbol ‘*’, while undetected HCPs are represented by ‘ND’.

Chapter 6
224
6.3.4 Evaluation of Additional Downstream Processing Steps
Purification of mAbs requires multiple complimentary DSP steps to remove HCPs and other
contaminants with potentially wide ranging physicochemical and physiological properties. As
previously discussed, the first step usually involves the use of Protein A resin to extract mAbs
from the harvest stream. Subsequently, the product undergoes one or two additional
chromatography polishing steps to guarantee a highly pure product. These additional steps are
aimed at reducing HCPs, host cell DNA, low molecular weight clipped species, high molecular
weight aggregates and also leached Protein A resin, to acceptable levels. [31] Common
polishing steps include cation exchange chromatography, anion exchange chromatography,
hydrophobic interaction chromatography or a combination of multiple chromatographic resin
interactions known as mixed mode chromatography. The choice of chromatography mode
depends on the properties of the host expression system and the biotherapeutic protein, the
impurities that require clearance and difficulty involved in impurity removal. [44] As common
DSP unit operations for mAbs dictate the use of subsequent chromatographic steps to
compliment Protein A purification, the effect of integrating a multi-modal chromatography
step on the profile and concentration of HCPs in a purified mAb sample was evaluated. A
mixed mode strong anion exchange resin with hydrophobic properties, Capto Adhere
ImpResTM (GE Healthcare), was incorporated as a second DSP step to evaluate the capability of
this additional DSP step for removal of HCP impurities. Capto Adhere ImpResTM resin contains
a quaternary ammonium group for anion exchange mediated retention of negatively charged
sample components such as host cell DNA, an aromatic functionality and small alkyl chain that
may facilitate retention of sample components through hydrophobic interactions. [5]
To evaluate the effect of the additional multi-modal step, an aliquot of mAb1-containing
culture harvest was purified using Protein A chromatography. Subsequently, a portion of the
purified mAb1 was further processed using mixed-mode Capto Adhere ImpResTM
chromatography conducted in flow-through mode as outlined in Section 6.2.3.2. Comparative
analysis of both samples was then performed by 2D-LC-MSE. HCPs identified and quantified in
samples taken before and after the multi-modal chromatography step are shown in Table 6.6.
Unsurprisingly, the addition of the second purification step resulted in a dramatic reduction in
HCP profile concentration. A singular HCP, namely Histone H2AX, was found to be present in
the Capto Adhere ImpResTM-purified mAb1 sample but not at levels that could facilitate
quantitation.

Chapter 6
225
Table 6.6: Host cell protein profile of mAb1 samples taken before and after mixed-mode
chromatographic polishing using Capto Adhere ImpResTM.
Protein Entry
Protein Description
Concentration of HCP in combined sample sets (ppm - ng/mg)
Following Protein A purification
Following Protein A and Capto adhere
ImpRes purification
GRP78 78 kDa glucose-regulated protein 329.6 ND
ACTB Actin (cytoplasmic 1) 83.5 ND
SLPI Antileukoproteinase 25.9 ND
ABCG3 ATP-binding cassette sub-family G member 3
* ND
DHX8 ATP-dependent RNA helicase DHX8 * ND
CALR Calreticulin * ND
CLUS Clusterin 288.6 ND
G3P Glyceraldehyde-3-phosphate dehydrogenase
67.7 ND
H2AX Histone H2AX * *
MMP19 Matrix metalloproteinase-19 * ND
TIMP2 Metalloproteinase inhibitor 2 * ND
NID1 Nidogen-1 772.3 ND
PRDX1 Peroxiredoxin-1 343.2 ND
HTRA1 Serine Protease HTRA1 111.2 ND
Total HCP concentration (ppm - ng of HCP/ mg of mAb)
2022 ND
HCPs identified using a minimum of 2 peptides are denoted by the symbol ‘*’, while
undetected HCPs are represented by ‘ND’.

Chapter 6
226
6.4 Conclusions
A high pH/low pH reversed phase nano-2D-LC-MSE method with Hi3 quantitation for the
determination of HCPs in purified mAb samples is described. The use of off-line high pH
fractionation facilitates a more thorough investigation of potential interactions that may have
resulted in the carriage of HCPs through Protein A purification during DSP. No specific
correlations of HCPs with regions of the mAb were identified; however, presented data
suggests that the interaction of HCPs with mAb was not hydrophobicity based. The choice of
Protein A elution buffer was demonstrated to exhibit a potential impact on the HCP repertoire
of purified mAb samples. A link between the time of culture harvest and the abundance of
HCPs present following a Protein A affinity capture step was verified, and is thought to result
from a loss of cell viability in samples harvested at a later stage of cell culture. Inclusion of
additional DSP demonstrated how complementary polishing successfully removed HCPs in the
process stream to very low levels. Taken together these results show the importance in
optimising components of downstream processing including choice of buffers used for
purification and viability or age of cell culture at the time of harvest. This data shows how
mass spectrometry methods are capable of providing a wealth of information that provides
valuable insights for DSP. Compared to ELISA, mass-spectrometry-based methods may provide
a more comprehensive characterisation of HCPs, not only facilitating a more efficient removal
strategy for DSP, but also allowing for a more rational assessment of potential safety risks
posed by individual HCPs.
6.5 Associated Publication and Author Contributions
Adapted from Farrell, A., et al., Quantitative host cell protein analysis using two dimensional
data independent LC-MSE. Analytical Chemistry, 2015, 87(18):9186-93.
Research study devised by Amy Farrell and Jonathan Bones; research performed by Amy
Farrell; Stefan Mittermayr contributed to N-glycan analysis; Brian Morrissey and Niaobh
McLoughlin provided advice regarding industrial relevance; Natalia Navas Iglesias provided
commercial samples that were not included in the final study; data and related paper were
reviewed by Jonathan Bones, Ian Marison, Brian Morrissey and Niaobh McLoughlin.

Chapter 6
227
6.6 References
1. International Conference on Harmonisation, 2012, ICH Harmonised Tripartite
Guideline, Development and Manufacture of Drug Substances (Chemical Entities and
Biotechnological/Biological Entities) Q11. Retrieved 28 May 2016 from
http://www.ich.org/fileadmin/Public_Web_Site/ICH_Products/Guidelines/Quality/Q1
1/Q11_Step_4.pdf.
2. U.S. Food and Drug Administration. 1997. Points to Consider in the Manufacture and
Testing of Monoclonal Antibody Products for Human Use. Centre for Biologics
Evaluation and Research, Food and Administration.
3. Thompson, J.H., et al., Improved detection of host cell proteins (HCPs) in a mammalian
cell-derived antibody drug using liquid chromatography/mass spectrometry in
conjunction with an HCP-enrichment strategy. Rapid Commun Mass Spectrom, 2014.
28(8): p. 855-60.
4. Levy, N.E., et al., Identification and characterization of host cell protein product-
associated impurities in monoclonal antibody bioprocessing. Biotechnol Bioeng, 2014.
111(5): p. 904-12.
5. Pezzini, J., et al., Antibody capture by mixed-mode chromatography: a comprehensive
study from determination of optimal purification conditions to identification of
contaminating host cell proteins. J Chromatogr A, 2011. 1218(45): p. 8197-208.
6. Tarrant, R.D., et al., Host cell protein adsorption characteristics during protein A
chromatography. Biotechnol Prog, 2012. 28(4): p. 1037-44.
7. Sisodiya, V.N., et al., Studying host cell protein interactions with monoclonal antibodies
using high throughput protein A chromatography. Biotechnol J, 2012. 7(10): p. 1233-
41.
8. Hogwood, C.E., D.G. Bracewell, and C.M. Smales, Measurement and control of host cell
proteins (HCPs) in CHO cell bioprocesses. Curr Opin Biotechnol, 2014. 30: p. 153-60.
9. Tait, A.S., et al., Host cell protein dynamics in the supernatant of a mAb producing CHO
cell line. Biotechnol Bioeng, 2012. 109(4): p. 971-82.

Chapter 6
228
10. Hogwood, C.E., et al., The dynamics of the CHO host cell protein profile during
clarification and protein A capture in a platform antibody purification process.
Biotechnol Bioeng, 2013. 110(1): p. 240-51.
11. Hogwood, C.E., et al., An ultra scale-down approach identifies host cell protein
differences across a panel of mAb producing CHO cell line variants. Biotechnol J, 2016.
11(3): p. 415-24.
12. International Conference on Harmonisation. 1999. ICH Harmonised Tripartite
Guideline, Specifications: Test Procedures and Acceptance Criteria for
Biotechnological/ Biological Products Q6B. Retrieved 28 May 2016 from
http://www.ich.org/fileadmin/Public_Web_Site/ICH_Products/Guidelines/Quality/Q6
B/Step4/Q6B_Guideline.pdf.
13. Krawitz, D.C., et al., Proteomic studies support the use of multi-product immunoassays
to monitor host cell protein impurities. Proteomics, 2006. 6(1): p. 94-110.
14. Jin, M., et al., Profiling of host cell proteins by two-dimensional difference gel
electrophoresis (2D-DIGE): Implications for downstream process development.
Biotechnol Bioeng, 2010. 105(2): p. 306-16.
15. Grzeskowiak, J.K., et al., 2-D DIGE to expedite downstream process development for
human monoclonal antibody purification. Protein Expr Purif, 2009. 66(1): p. 58-65.
16. Zhang, Q., et al., Comprehensive tracking of host cell proteins during monoclonal
antibody purifications using mass spectrometry. MAbs, 2014. 6(3): p. 659-70.
17. Levy, N.E., et al., Host cell protein impurities in chromatographic polishing steps for
monoclonal antibody purification. Biotechnol Bioeng, 2016. 113(6): p. 1260-72.
18. Chiverton, L.M., et al., Quantitative definition and monitoring of the host cell protein
proteome using iTRAQ - a study of an industrial mAb producing CHO-S cell line.
Biotechnol J, 2016.
19. Doneanu, C.E., et al., Analysis of host-cell proteins in biotherapeutic proteins by
comprehensive online two-dimensional liquid chromatography/mass spectrometry.
MAbs, 2012. 4(1): p. 24-44.

Chapter 6
229
20. Geromanos, S.J., et al., The detection, correlation, and comparison of peptide
precursor and product ions from data independent LC-MS with data dependant LC-
MS/MS. Proteomics, 2009. 9(6): p. 1683-95.
21. Silva, J.C., et al., Quantitative proteomic analysis by accurate mass retention time
pairs. Anal Chem, 2005. 77(7): p. 2187-200.
22. Levin, Y., E. Hradetzky, and S. Bahn, Quantification of proteins using data-independent
analysis (MSE) in simple andcomplex samples: a systematic evaluation. Proteomics,
2011. 11(16): p. 3273-87.
23. Schenauer, M.R., G.C. Flynn, and A.M. Goetze, Identification and quantification of host
cell protein impurities in biotherapeutics using mass spectrometry. Anal Biochem,
2012. 428(2): p. 150-7.
24. Silva, J.C., et al., Absolute quantification of proteins by LCMSE: a virtue of parallel MS
acquisition. Mol Cell Proteomics, 2006. 5(1): p. 144-56.
25. Bomans, K., et al., Identification and monitoring of host cell proteins by mass
spectrometry combined with high performance immunochemistry testing. PLoS One,
2013. 8(11): p. e81639.
26. Zhu, G., et al., Absolute quantitation of host cell proteins in recombinant human
monoclonal antibodies with an automated CZE-ESI-MS/MS system. Electrophoresis,
2014. 35(10): p. 1448-52.
27. Royle, L., et al., Detailed structural analysis of N-glycans released from glycoproteins in
SDS-PAGE gel bands using HPLC combined with exoglycosidase array digestions.
Methods Mol Biol, 2006. 347: p. 125-43.
28. Schenauer, M.R., G.C. Flynn, and A.M. Goetze, Profiling the effects of process changes
on residual host cell proteins in biotherapeutics by mass spectrometry. Biotechnol
Prog, 2013. 29(4): p. 951-7.
29. Hari, S.B., et al., Acid-induced aggregation of human monoclonal IgG1 and IgG2:
molecular mechanism and the effect of solution composition. Biochemistry, 2010.
49(43): p. 9328-38.

Chapter 6
230
30. Wang, S. and A. Raghani, Arginine as an eluent for automated on-line Protein A/size
exclusion chromatographic analysis of monoclonal antibody aggregates in cell culture.
J Chromatogr B Analyt Technol Biomed Life Sci, 2014. 945-946: p. 115-20.
31. Shukla, A.A., et al., Demonstration of robust host cell protein clearance in
biopharmaceutical downstream processes. Biotechnol Prog, 2008. 24(3): p. 615-22.
32. Bailey-Kellogg, C., et al., CHOPPI: a web tool for the analysis of immunogenicity risk
from host cell proteins in CHO-based protein production. Biotechnol Bioeng, 2014.
111(11): p. 2170-82.
33. Joucla, G., et al., Cation exchange versus multimodal cation exchange resins for
antibody capture from CHO supernatants: identification of contaminating host cell
proteins by mass spectrometry. J Chromatogr B Analyt Technol Biomed Life Sci, 2013.
942-943: p. 126-33.
34. Valente, K.N., A.M. Lenhoff, and K.H. Lee, Expression of difficult-to-remove host cell
protein impurities during extended Chinese hamster ovary cell culture and their impact
on continuous bioprocessing. Biotechnol Bioeng, 2014.
35. Li, Y., et al., Characterization and stability study of polysorbate 20 in therapeutic
monoclonal antibody formulation by multidimensional ultrahigh-performance liquid
chromatography-charged aerosol detection-mass spectrometry. Anal Chem, 2014.
86(10): p. 5150-7.
36. Dixit, N., et al., Residual Host Cell Protein Promotes Polysorbate 20 Degradation in a
Sulfatase Drug Product Leading to Free Fatty Acid Particles. J Pharm Sci, 2016. 105(5):
p. 1657-66.
37. Gagnon, P., et al., Nonspecific interactions of chromatin with immunoglobulin G and
protein A, and their impact on purification performance. J Chromatogr A, 2014. 1340:
p. 68-78.
38. International Conference on Harmonisation, Note for guidance on
biotechnological/biological products subject to changes in their manufacturing process
(CP<P/ICH/5721/03) June 2005. Retrieved 12 February 2015 from
http://www.ema.europa.eu/docs/en_GB/document_library/Scientific_guideline/2009
/09/WC500002805.pdf.

Chapter 6
231
39. Raju, T.S. and R.E. Jordan, Galactosylation variations in marketed therapeutic
antibodies. MAbs, 2012. 4(3): p. 385-91.
40. Arakawa, T. and Y. Kita, Multi-faceted arginine: mechanism of the effects of arginine
on protein. Curr Protein Pept Sci, 2014. 15(6): p. 608-20.
41. Yamasaki, H., et al., Arginine facilitates inactivation of enveloped viruses. J Pharm Sci,
2008. 97(8): p. 3067-73.
42. PyMOL molecular visualisation system version 1.3r1. Downloaded from
http://pymol.org/educational/ on 01 December 2014.
43. UniProt: a hub for protein information. Nucleic Acids Res, 2015. 43(Database issue): p.
D204-12.
44. Wang, X., A.K. Hunter, and N.M. Mozier, Host cell proteins in biologics development:
Identification, quantitation and risk assessment. Biotechnol Bioeng, 2009. 103(3): p.
446-58.
Chapter 7
232
7.0
Overall Conclusions and Future Research
Direction
7.1 Overall Conclusions
CHO cells are important expression systems currently used in the biopharmaceutical industry
for the production of a wide range of therapeutic proteins and thus represent a significant
area of interest for biopharmaceutical research. Although specific production of biomolecules
in CHO cells has previously been optimised using cell and bioprocess engineering strategies,
current and future advances in analytical instrumentation are theorised to contribute to
increased cellular-level understanding of CHO cells and ultimately result in improvements in
biotherapeutic production and product quality. The goals of this work were to apply state-of-
the-art analytical techniques to gain a greater understanding of recombinant protein
producing CHO cells during routine bioprocessing. By preparing concurrent identical CHO DP-
12 cell cultures, in highly controlled bioreactor systems, and altering one bioprocessing
parameter, e.g. pH, temperature or dissolved oxygen, potential changes to the CHO cell
proteomes in response to that particular condition could be identified. Subsequently, through
application of spent media to naïve CHO cells, a further goal to evaluate the effects of CHO
secretome during bioprocessing could be assessed. In addition to evaluation of CHO cells,
extensive product characterisation techniques were developed and applied for determination
of the impact of altered bioprocessing on the therapeutic protein produced. Furthermore,
since the presence of host cell protein (HCP) impurities in therapeutic drug products has the
potential to cause adverse events in patients, a final goal was to develop an analytical method
that could identify HCP impurities in purified drug product.
Chapter 2 focused on the development and application of a state-of-the-art quantitative
proteomics platform, incorporating two dimensional high pH-low pH reversed phase nano
liquid chromatography mass spectrometry with SPS-MS3 detection of TMT-sixplex labelled
proteome samples, to facilitate comparison of the effects of individual culture characteristics
on a CHO cell proteome. In addition to profiling the changes to a recombinant monoclonal
antibody producing CHO cell line, caused by alterations in bioprocessing parameters typically
applied during biopharmaceutical production, the platform was also applied for the evaluation

Chapter 7
233
of the bystander response of CHO cells in culture, to the secretome of production cells
maintained at different bioprocess conditions. The developed proteomic platform displayed
excellent performance capabilities, enabling the identification and relative quantitation of
thousands of proteins with relatively low first dimensional pre-fractionation. Application of the
method for the evaluation of CHO DP-12 cells producing anti-interleukin 8 IgG1 enabled the
realisation of a snapshot into CHO production cells responding to altered bioprocessing,
illustrating the robustness of the bioprocess in terms of the effect on recombinant protein
expressing CHO cells. Observation of increased activity for proteins involved in signalling
pathways for both CHO production cells, and also for naïve CHO cells in response to CHO
secretome, signified a high level of activity within the cells relating to normal growth but also
highlighted the benefit of investigating the cell as a whole, i.e. to use a multi-omics approach
incorporating phosphoproteomics, metabolomics and product characterisation, to obtain a full
picture of the molecular level manifestations within the cell in response to the altered
bioprocessing conditions applied.
The proteomics study was complemented by sequence level characterisation of recombinant
anti-interleukin 8 IgG1 produced during CHO DP-12 culture maintained under different
bioprocessing settings. This work, described in Chapter 3, involved the determination of the
size, hydrophobicity and charge variant profile of mAb samples via evaluation of intact mAb
species using various chromatographic approaches. Although miniscule changes to the size
profile were observed, variations in the hydrophobicity and charge of some mAb samples were
determined. High resolution mass spectrometry analysis was applied for the evaluation of
protein mass following limited proteolysis to produce mAb subunits more amenable to mass
spectrometry detection. Changes to the mass of the most abundant mAb species were not
observed, however mAb heterogeneity was illustrated by the existence of low levels of species
with variations in polypeptide mass, potentially corresponding to differently N-glycan moieties
and sequence-level modifications. Protein heterogeneity was further investigated by high
resolution LC-MS analysis of tryptic peptides for identification of modifications to mAb primary
sequence. Varying levels of modified species were observed for various samples, most notably
for anti-IL8 IgG1 produced at 32.0oC.
Due to the importance of mAb N-glycosylation in regards to the therapeutic function of mAbs
in-vivo, variations in the N-glycosylation profile of anti-IL 8 IgG1 were investigated in Chapter
4. A twoplex method for comparative glycomics of N-glycans present on IgG1 was developed,
based upon the differential labelling of samples for comparison with either ‘light’ 12C6 2-AA or
‘heavy’ 13C6 2-AA prior to hydrophilic interaction UPLC with sequential fluorescence and

Chapter 7
234
accurate mass QToF-MS detection. Application of the developed method for the relative
quantitation of N-glycans attached to mAbs produced under altered bioprocessing conditions
revealed changes to the levels of some N-glycan species, in particular those attached to anti-IL
8 IgG1 produced at pH 7.2 and 110% dissolved oxygen.
The purpose of product characterisation is to estimate potential changes to the therapeutic
function and safety of a drug substance, hence to thoroughly evaluate the effect of altered
bioprocessing on the therapeutic protein produced, characterisation of the changes to the
structure and function of the IgG was performed. In Chapter 5, a developed HDX-MS platform
for the determination of conformation changes to therapeutic mAbs was described.
Identification of changes to the uptake of deuterium by backbone amide hydrogen atoms of
differentially produced anti-IL8 IgG1 as a function of time via MSE detection of peptic peptides
produced form samples following HDX, a number of conformational changes were detected in
mAbs produced under altered conditions of 32.0oC, pH 7.2, 60% DO and 110%DO. Subsequent
surface plasmon resonance analysis of anti-IL8 samples revealed changes to the binding
affinity of mAb produced at 32.0oC for FcRn, the mAb cellular receptor, indicating a potential
alteration in the serum half-life of anti-IL8 IgG1 resulting from low temperature production.
Further surface plasmon resonance analysis to determine changes in the binding affinity of
anti-IL8 to its target antigen interleukin 8 signified a negative impact on the therapeutic
efficacy of mAbs produced using culture media with a dissolved oxygen concentration of
110%.
Finally, in addition to assessing the impact of upstream bioprocessing on therapeutic
biomolecules, the identification and quantitation of bioprocess-related host cell protein
impurities following downstream processing is described in Chapter 6. In this case a high pH
low pH reversed phase nano-liquid chromatography mass spectrometry platform was
developed and applied to evaluate different features of downstream processing including the
choice of buffer used during Protein A purification, influence of multiple downstream
processing steps and the effect of harvest time on the profile of HCPs detected. The developed
platform may be of significance for product and process development as unlike many other
methods described in the literature for HCP analysis, the method described is capable of
identification of low levels of HCP impurities without the requirement for extraction or pre-
concentration, which may artificially alter the actual HCP profile of therapeutic mAbs. Thus
improvements to downstream processing may be made by targeting of HCPs identified using
the platform described.

Chapter 7
235
7.2 Future Research Direction
The following areas have been identified as potential avenues for future research:
The developed high performance analytical platform, capable of quantitative
proteomic analysis of thousands of proteins within a cellular sample, highlighted the
ruggedness of the bioprocess used for CHO DP-12 culture. However, application of the
platform to other molecules could be more informative, in particular for
manufacturing processes wherein product critical quality attributes are difficult to
control. This method could potentially form a key component of process optimisation
and application of quality by design during product development.
Proteomic analysis of CHO DP-12 cells and naïve CHO K1 cells revealed significant
differential regulation of signalling pathways within the cell. Application of a
combination of other omics strategies may provide an enhanced view of the molecular
events within the cells. Specifically use of metabolomics, for determination of cellular
outputs and phosphoproteomics, to evaluate whether variations in protein regulation
observed in this study are attributed to differential signalling or differential
expression, would be beneficial. Should additional markers be identified, a potential
for cellular engineering for phenotype modification may arise, now possible using
technologies such as CRISPR-Cas9.
The advanced mass spectrometry-based analytical platforms developed for product
characterisation were applied exclusively to monoclonal antibody samples, however
as these methods use high resolution accurate mass technology, they may be used for
the characterisation of any molecular entity. Application of the developed methods to
new therapeutic entities, such as Fc fusion proteins, bispecific antibodies and antibody
drug conjugates may be of particular interest. However, despite providing crucial
information, the methods described were based on middle-down and bottom-up
approaches to product characterisation. An ability to acquire high resolution mass
spectrometric data of intact biomolecules could provide additional information
regarding the causes of observed structural, functional or primary sequence
modifications, i.e. to determine if a specific structural modification is a result of a
sequence-level modification or vice versa.
The HCP platform developed, based on MSE, was highly conservative due to criteria
required for Hi3 quantitation (>3 identified peptides for each protein). Future work to
advance the platform further using either an improvement in the informatics platform
to remove any potential bias for spectral intensity or a transformation of the platform

Chapter 7
236
to higher resolution accurate mass platforms e.g. parallel reaction monitoring using an
Orbitrap mass analyser, where accurate quantitation could be acquired based solely
on the precursor may enable further confidence in the data acquired.
The HCP analysis platform could enable the development of targeted analytical
methods that may be used in a Quality Control laboratory to facilitate process
monitoring and process improvements thereby potentially reducing high product
attrition rates often associated with biopharmaceutical production. Skyline, a software
application for building multiple reaction monitoring (MRM) quantitiative MS methods
(https://skyline.gs.washington.edu), may enable the utilisation of data (generated
using the HCP platform described in Chapter 6) for design of targeted MRM methods.
These methods may then be further optimised using a triple-Quadrupole MS
instrument, e.g. Agilent 6460.
HDX is capable of providing useful information regarding protein higher order
structure, however it is based on the reaction of amide hydrogen atoms only, thus
facilitating tertiary structure determination only. If this method was complemented by
the application of biophysical technology e.g. light scattering, fast photochemical
oxidation of proteins (FPOP) or other spectroscopy-based methods, a deeper level of
structural characterisation could be achieved.
Despite some degree of resolution between intact protein species using available
technologies, e.g. hydrophobic interaction and ion exchange chromatography, poor
resolution attributable to low diffusion coefficients is observed. Scope for
improvement exists for chromatographic methods available for intact protein analysis,
in particular to enable efficient mass spectrometry analysis of intact protein species.
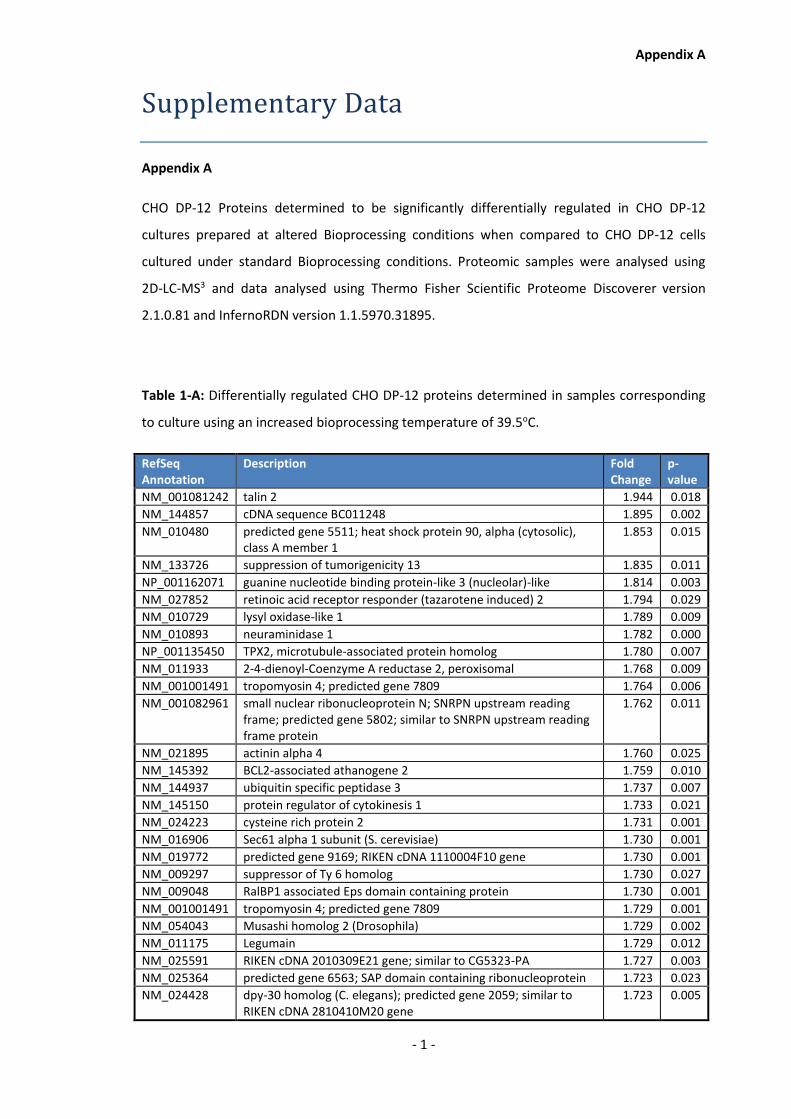
Appendix A
- 1 -
Supplementary Data
Appendix A
CHO DP-12 Proteins determined to be significantly differentially regulated in CHO DP-12
cultures prepared at altered Bioprocessing conditions when compared to CHO DP-12 cells
cultured under standard Bioprocessing conditions. Proteomic samples were analysed using
2D-LC-MS3 and data analysed using Thermo Fisher Scientific Proteome Discoverer version
2.1.0.81 and InfernoRDN version 1.1.5970.31895.
Table 1-A: Differentially regulated CHO DP-12 proteins determined in samples corresponding
to culture using an increased bioprocessing temperature of 39.5oC.
RefSeq Annotation
Description Fold Change
p-value
NM_001081242 talin 2 1.944 0.018
NM_144857 cDNA sequence BC011248 1.895 0.002
NM_010480 predicted gene 5511; heat shock protein 90, alpha (cytosolic), class A member 1
1.853 0.015
NM_133726 suppression of tumorigenicity 13 1.835 0.011
NP_001162071 guanine nucleotide binding protein-like 3 (nucleolar)-like 1.814 0.003
NM_027852 retinoic acid receptor responder (tazarotene induced) 2 1.794 0.029
NM_010729 lysyl oxidase-like 1 1.789 0.009
NM_010893 neuraminidase 1 1.782 0.000
NP_001135450 TPX2, microtubule-associated protein homolog 1.780 0.007
NM_011933 2-4-dienoyl-Coenzyme A reductase 2, peroxisomal 1.768 0.009
NM_001001491 tropomyosin 4; predicted gene 7809 1.764 0.006
NM_001082961 small nuclear ribonucleoprotein N; SNRPN upstream reading frame; predicted gene 5802; similar to SNRPN upstream reading frame protein
1.762 0.011
NM_021895 actinin alpha 4 1.760 0.025
NM_145392 BCL2-associated athanogene 2 1.759 0.010
NM_144937 ubiquitin specific peptidase 3 1.737 0.007
NM_145150 protein regulator of cytokinesis 1 1.733 0.021
NM_024223 cysteine rich protein 2 1.731 0.001
NM_016906 Sec61 alpha 1 subunit (S. cerevisiae) 1.730 0.001
NM_019772 predicted gene 9169; RIKEN cDNA 1110004F10 gene 1.730 0.001
NM_009297 suppressor of Ty 6 homolog 1.730 0.027
NM_009048 RalBP1 associated Eps domain containing protein 1.730 0.001
NM_001001491 tropomyosin 4; predicted gene 7809 1.729 0.001
NM_054043 Musashi homolog 2 (Drosophila) 1.729 0.002
NM_011175 Legumain 1.729 0.012
NM_025591 RIKEN cDNA 2010309E21 gene; similar to CG5323-PA 1.727 0.003
NM_025364 predicted gene 6563; SAP domain containing ribonucleoprotein 1.723 0.023
NM_024428 dpy-30 homolog (C. elegans); predicted gene 2059; similar to RIKEN cDNA 2810410M20 gene
1.723 0.005

Appendix A
- 2 -
NM_008972 predicted gene 12504; predicted gene 9800; predicted gene 4617; predicted gene 6625; predicted gene 7614; similar to prothymosin alpha; prothymosin alpha; predicted gene 9009
1.723 0.006
NM_028871 predicted gene 6159; heterogeneous nuclear ribonucleoprotein R 1.722 0.009
NM_026842 ubiquilin 1 1.719 0.007
NM_011070 prefoldin 2 1.719 0.043
NM_012021 peroxiredoxin 5 1.719 0.031
NM_013897 translocase of inner mitochondrial membrane 8 homolog b (yeast)
1.719 0.008
NM_008866 lysophospholipase 1 1.717 0.005
NM_026572 predicted gene 3672; similar to Glycine cleavage system H protein, mitochondrial precursor; glycine cleavage system protein H (aminomethyl carrier)
1.716 0.009
NM_026623 nudix (nucleoside diphosphate linked moiety X)-type motif 21 1.715 0.004
NM_008683 neural precursor cell expressed, developmentally down-regulated gene 8
1.714 0.011
NM_130889 acidic (leucine-rich) nuclear phosphoprotein 32 family, member B
1.713 0.011
NM_016786 ubiquitin-conjugating enzyme E2K (UBC1 homolog, yeast) 1.713 0.011
NM_133716 stromal membrane-associated GTPase-activating protein 2 1.709 0.005
NM_007466 apoptosis inhibitor 5 1.706 0.002
NM_144897 apolipoprotein A-I binding protein 1.706 0.017
NP_001136216 RIKEN cDNA 2610110G12 gene 1.706 0.003
NM_026020 similar to LOC665931 protein; ribosomal protein, large P2; predicted gene 7852; WD repeat domain 89
1.705 0.016
NM_025657 leucine rich repeat containing 57 1.705 0.043
NM_011801 craniofacial development protein 1 1.703 0.017
NM_172262 amine oxidase, flavin containing 1 1.703 0.014
NM_008520 latent transforming growth factor beta binding protein 3 1.700 0.018
NM_026988 Parathymosin 1.698 0.005
NM_008638 methylenetetrahydrofolate dehydrogenase (NAD+ dependent), methenyltetrahydrofolate cyclohydrolase
1.698 0.018
NM_010023 dodecenoyl-Coenzyme A delta isomerase (3,2 trans-enoyl-Coenyme A isomerase)
1.693 0.005
NM_133934 ISY1 splicing factor homolog (S. cerevisiae) 1.693 0.012
NM_198937 hematological and neurological expressed 1-like 1.692 0.023
NM_080419 immunoglobulin superfamily, member 8 1.692 0.001
NM_023397 RIKEN cDNA 1810034K20 gene 1.692 0.023
NM_011418 SWI/SNF related, matrix associated, actin dependent regulator of chromatin, subfamily b, member 1
1.692 0.023
NM_025337 aldo-keto reductase family 7 1.691 0.015
NM_010479 heat shock protein 1B; heat shock protein 1A 1.691 0.007
NM_010361 glutathione S-transferase, theta 2 1.691 0.024
NM_011623 topoisomerase (DNA) II alpha 1.688 0.000
NM_133795 tetratricopeptide repeat domain 1 1.686 0.002
NM_029752 Bri3 binding protein 1.685 0.010
NM_010398 histocompatibility 2, T region locus 23; similar to RT1 class Ib, locus H2-Q-like, grc region
1.685 0.003
NM_026280 matrix-remodelling associated 7 1.683 0.013
NM_028871 predicted gene 6159; heterogeneous nuclear ribonucleoprotein R
1.683 0.017
NM_176968 5'-nucleotidase domain containing 1 1.682 0.018
NM_172572 rhomboid 5 homolog 2 (Drosophila) 1.682 0.011
NM_011752 zinc finger protein 259 1.682 0.041
NP_001157185 predicted gene 9755; Tu translation elongation factor, 1.681 0.002
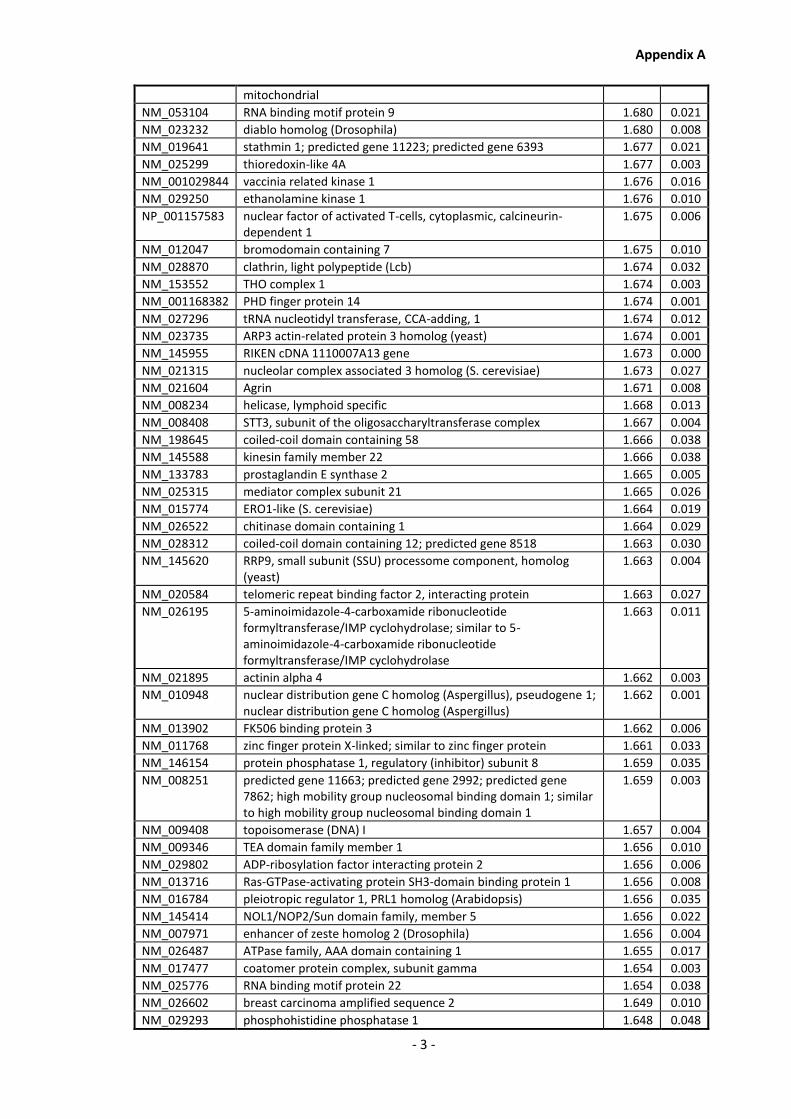
Appendix A
- 3 -
mitochondrial
NM_053104 RNA binding motif protein 9 1.680 0.021
NM_023232 diablo homolog (Drosophila) 1.680 0.008
NM_019641 stathmin 1; predicted gene 11223; predicted gene 6393 1.677 0.021
NM_025299 thioredoxin-like 4A 1.677 0.003
NM_001029844 vaccinia related kinase 1 1.676 0.016
NM_029250 ethanolamine kinase 1 1.676 0.010
NP_001157583 nuclear factor of activated T-cells, cytoplasmic, calcineurin-dependent 1
1.675 0.006
NM_012047 bromodomain containing 7 1.675 0.010
NM_028870 clathrin, light polypeptide (Lcb) 1.674 0.032
NM_153552 THO complex 1 1.674 0.003
NM_001168382 PHD finger protein 14 1.674 0.001
NM_027296 tRNA nucleotidyl transferase, CCA-adding, 1 1.674 0.012
NM_023735 ARP3 actin-related protein 3 homolog (yeast) 1.674 0.001
NM_145955 RIKEN cDNA 1110007A13 gene 1.673 0.000
NM_021315 nucleolar complex associated 3 homolog (S. cerevisiae) 1.673 0.027
NM_021604 Agrin 1.671 0.008
NM_008234 helicase, lymphoid specific 1.668 0.013
NM_008408 STT3, subunit of the oligosaccharyltransferase complex 1.667 0.004
NM_198645 coiled-coil domain containing 58 1.666 0.038
NM_145588 kinesin family member 22 1.666 0.038
NM_133783 prostaglandin E synthase 2 1.665 0.005
NM_025315 mediator complex subunit 21 1.665 0.026
NM_015774 ERO1-like (S. cerevisiae) 1.664 0.019
NM_026522 chitinase domain containing 1 1.664 0.029
NM_028312 coiled-coil domain containing 12; predicted gene 8518 1.663 0.030
NM_145620 RRP9, small subunit (SSU) processome component, homolog (yeast)
1.663 0.004
NM_020584 telomeric repeat binding factor 2, interacting protein 1.663 0.027
NM_026195 5-aminoimidazole-4-carboxamide ribonucleotide formyltransferase/IMP cyclohydrolase; similar to 5-aminoimidazole-4-carboxamide ribonucleotide formyltransferase/IMP cyclohydrolase
1.663 0.011
NM_021895 actinin alpha 4 1.662 0.003
NM_010948 nuclear distribution gene C homolog (Aspergillus), pseudogene 1; nuclear distribution gene C homolog (Aspergillus)
1.662 0.001
NM_013902 FK506 binding protein 3 1.662 0.006
NM_011768 zinc finger protein X-linked; similar to zinc finger protein 1.661 0.033
NM_146154 protein phosphatase 1, regulatory (inhibitor) subunit 8 1.659 0.035
NM_008251 predicted gene 11663; predicted gene 2992; predicted gene 7862; high mobility group nucleosomal binding domain 1; similar to high mobility group nucleosomal binding domain 1
1.659 0.003
NM_009408 topoisomerase (DNA) I 1.657 0.004
NM_009346 TEA domain family member 1 1.656 0.010
NM_029802 ADP-ribosylation factor interacting protein 2 1.656 0.006
NM_013716 Ras-GTPase-activating protein SH3-domain binding protein 1 1.656 0.008
NM_016784 pleiotropic regulator 1, PRL1 homolog (Arabidopsis) 1.656 0.035
NM_145414 NOL1/NOP2/Sun domain family, member 5 1.656 0.022
NM_007971 enhancer of zeste homolog 2 (Drosophila) 1.656 0.004
NM_026487 ATPase family, AAA domain containing 1 1.655 0.017
NM_017477 coatomer protein complex, subunit gamma 1.654 0.003
NM_025776 RNA binding motif protein 22 1.654 0.038
NM_026602 breast carcinoma amplified sequence 2 1.649 0.010
NM_029293 phosphohistidine phosphatase 1 1.648 0.048

Appendix A
- 4 -
NM_016844 similar to 40S ribosomal protein S28; predicted gene 10443; predicted gene 12943; predicted gene 13192; similar to ribosomal protein S28; predicted gene 10263; predicted gene 3511; ribosomal protein S28
1.648 0.033
NM_019673 actin-like 6A 1.648 0.024
NM_026040 serum response factor binding protein 1; similar to SRF-dependent transcription regulation associated protein
1.647 0.003
NM_001013616 tripartite motif-containing 6; similar to Tripartite motif protein 6 1.646 0.046
NM_001033273 RIKEN cDNA 5031439G07 gene 1.646 0.049
NM_008012 aldo-keto reductase family 1, member B8 1.646 0.001
NM_026631 NHP2 ribonucleoprotein homolog (yeast) 1.646 0.002
NM_008249 transcription factor B2, mitochondrial; predicted gene 1818 1.645 0.005
NM_028767 forkhead box P4 1.645 0.020
NM_010756 similar to mafG; v-maf musculoaponeurotic fibrosarcoma oncogene family, protein G (avian)
1.644 0.034
NM_148930 RNA binding motif protein 5 1.644 0.040
NM_015816 LSM4 homolog, U6 small nuclear RNA associated (S. cerevisiae) 1.643 0.031
NM_138599 translocase of outer mitochondrial membrane 70 homolog A 1.642 0.005
NM_153516 BCL2-like 13 (apoptosis facilitator) 1.640 0.038
NM_028597 THO complex 3 1.639 0.017
NM_026120 RIKEN cDNA 2410127L17 gene; predicted gene 7622 1.638 0.021
NM_008907 predicted gene 9234; peptidylprolyl isomerase A 1.638 0.001
NM_030109 splicing factor 3b, subunit 2 1.638 0.007
NM_026063 hypothetical protein LOC675054; RIKEN cDNA 2900010M23 gene 1.635 0.023
NM_021433 syntaxin 6 1.635 0.044
NM_026023 NudC domain containing 2 1.635 0.002
NM_023215 predicted gene 6365; RIKEN cDNA 2500003M10 gene 1.633 0.032
NM_008854 protein kinase, cAMP dependent, catalytic, alpha 1.633 0.039
NM_016737 stress-induced phosphoprotein 1 1.632 0.027
NM_010917 similar to Nidogen precursor (Entactin); nidogen 1; similar to Nid1 protein
1.632 0.004
NM_009786 calcyclin binding protein 1.632 0.004
NM_026422 mitochondrial ribosome recycling factor; similar to mitochondrial ribosome recycling factor; predicted gene 6374
1.631 0.047
NP_085112 histone cluster 1, H1a 1.628 0.020
NM_138747 NOP2 nucleolar protein homolog (yeast) 1.628 0.023
NM_133815 lamin B receptor 1.627 0.008
NM_133757 phosphatidylglycerophosphate synthase 1 1.627 0.004
NM_011958 origin recognition complex, subunit 4-like (S. cerevisiae) 1.626 0.007
NM_022023 glia maturation factor, beta 1.626 0.044
NM_172400 DnaJ (Hsp40) homolog, subfamily C, member 8; predicted gene 4928
1.626 0.008
NM_008881 plexin A1 1.626 0.007
NM_011034 peroxiredoxin 1; predicted gene 7204 1.626 0.046
NM_030721 acyl-Coenzyme A oxidase 3, pristanoyl 1.625 0.004
NM_001044751 Corticosteroid 11-beta-dehydrogenase isozyme 1 1.624 0.010
NM_025351 coiled-coil-helix-coiled-coil-helix domain containing 6 1.623 0.010
NM_008704 similar to Nucleoside diphosphate kinase A (NDK A) (NDP kinase A) (Tumor metastatic process-associated protein) (Metastasis inhibition factor NM23) (NDPK-A) (nm23-M1); non-metastatic cells 1, protein (NM23A) expressed in
1.623 0.007
NP_083939 predicted gene 11675; eukaryotic translation elongation factor 1 delta (guanine nucleotide exchange protein)
1.623 0.010
NM_053179 N-acetylneuraminic acid synthase (sialic acid synthase) 1.620 0.013
NM_010931 ubiquitin-like, containing PHD and RING finger domains, 1; 1.619 0.016

Appendix A
- 5 -
predicted gene 5648; similar to nuclear zinc finger protein Np95
NM_025814 serpine1 mRNA binding protein 1 1.618 0.003
NP_001258827 Peroxisomal acyl-coenzyme A oxidase 1 1.618 0.001
NM_007624 predicted gene 6917; similar to chromobox homolog 3; predicted gene 5792; predicted gene 7469; predicted gene 6901; predicted gene 7721; predicted gene 5196; complement component 7; chromobox homolog 3 (Drosophila HP1 gamma)
1.617 0.030
NM_020506 exportin 4 1.611 0.010
NM_027478 RIKEN cDNA 5730494N06 gene; predicted gene 7368 1.611 0.015
NM_011306 retinoid X receptor beta 1.611 0.045
NP_951062 DEAD (Asp-Glu-Ala-Asp) box polypeptide 17 1.611 0.017
NM_023479 elaC homolog 2 (E. coli) 1.610 0.005
NM_001177658 39S ribosomal protein L15, mitochondrial 1.609 0.001
NM_027226 forty-two-three domain containing 1 1.609 0.019
NM_027219 CDC42 effector protein (Rho GTPase binding) 1 1.609 0.026
NM_011750 splicing factor 1 1.608 0.042
NM_027044 prefoldin 5 1.608 0.041
NM_019796 synaptotagmin binding, cytoplasmic RNA interacting protein 1.607 0.007
XP_619909 predicted gene 5449; small nuclear ribonucleoprotein D2; predicted gene 5848; predicted gene 10120
1.607 0.013
NM_018888 ubiquinol-cytochrome c reductase complex chaperone, CBP3 homolog (yeast)
1.605 0.002
NM_022988 Ngg1 interacting factor 3-like 1 (S. pombe) 1.604 0.003
NM_025994 similar to EF hand domain containing 2; EF hand domain containing 2
1.604 0.038
NM_207176 testis derived transcript 1.601 0.030
NM_021336 small nuclear ribonucleoprotein polypeptide A' 1.601 0.008
NM_019813 drebrin 1 1.600 0.001
NM_134122 nurim (nuclear envelope membrane protein) 1.599 0.018
NP_598452 poly-U binding splicing factor 60 1.599 0.023
NM_011327 sterol carrier protein 2, liver 1.598 0.003
NM_001093753 splicing factor, arginine/serine-rich 11 1.597 0.000
NM_175465 SEC14 and spectrin domains 1; predicted gene 9165 1.595 0.014
NM_146036 AHA1, activator of heat shock protein ATPase homolog 1 (yeast) 1.593 0.001
NM_008991 ATP-binding cassette, sub-family D (ALD), member 3 1.592 0.002
NM_019537 proteasome (prosome, macropain) assembly chaperone 1 1.592 0.036
NM_054081 similar to metastasis-associated protein; metastasis associated 1; similar to MTA1
1.591 0.011
NM_001037756 breast cancer metastasis-suppressor 1-like 1.589 0.015
NM_010219 FK506 binding protein 4 1.588 0.001
NM_008305 perlecan (heparan sulfate proteoglycan 2) 1.587 0.003
NM_172288 nucleoporin 133 1.586 0.009
NM_144930 expressed sequence AU018778 1.585 0.015
NM_023402 Myosin regulatory light chain 12B 1.585 0.003
NM_018868 NOP58 ribonucleoprotein homolog (yeast) 1.582 0.030
NM_021559 zinc finger protein 191 1.581 0.040
NM_053183 predicted gene 8228; DEAD (Asp-Glu-Ala-Asp) box polypeptide 50
1.580 0.001
NM_025292 RIKEN cDNA 1810020G14 gene; synaptojanin 2 binding protein; predicted gene 4116
1.579 0.028
NM_026503 RIKEN cDNA 1110058L19 gene 1.579 0.002
NP_033898 Basigin 1.576 0.022
NM_139236 nucleolar protein family 6 (RNA-associated) 1.576 0.049
NM_025281 Ly1 antibody reactive clone 1.574 0.050
NM_025375 Williams Beuren syndrome chromosome region 22 1.571 0.044

Appendix A
- 6 -
NM_145556 predicted gene 13886; TAR DNA binding protein 1.570 0.008
NM_009881 chromodomain protein, Y chromosome-like; predicted gene 7584
1.569 0.022
NM_152807 coiled-coil domain containing 137 1.568 0.027
NM_013559 heat shock 105kDa/110kDa protein 1 1.564 0.007
NM_020027 HLA-B associated transcript 2 1.561 0.010
NM_134080 filamin, beta 1.560 0.007
NM_025996 translocase of outer mitochondrial membrane 34 1.559 0.011
NM_153571 HscB iron-sulfur cluster co-chaperone homolog (E. coli) 1.559 0.012
NM_021465 stromal antigen 2 1.557 0.036
NM_025349 predicted gene 13182; LSM7 homolog, U6 small nuclear RNA associated (S. cerevisiae); predicted gene 10146
1.554 0.020
NM_026532 similar to Chain A, D92n,D94n Double Point Mutant Of Human Nuclear Transport Factor 2 (Ntf2); predicted gene 10349; predicted gene 4682; nuclear transport factor 2; similar to nuclear transport factor 2; predicted gene 9386; predicted gene 10333
1.552 0.006
NM_053089 NMDA receptor-regulated gene 1 1.551 0.007
NM_009295 syntaxin binding protein 1 1.550 0.012
NM_001081196 heterogeneous nuclear ribonucleoprotein U-like 2 1.549 0.011
NM_001033270 solute carrier family 4, sodium bicarbonate cotransporter, member 7
1.549 0.007
NM_010324 similar to Aspartate aminotransferase, cytoplasmic (Transaminase A) (Glutamate oxaloacetate transaminase 1); glutamate oxaloacetate transaminase 1, soluble
1.548 0.015
NM_007951 predicted gene 6941; predicted gene 10131; enhancer of rudimentary homolog (Drosophila)
1.546 0.007
NM_026483 M-phase phosphoprotein 10 (U3 small nucleolar ribonucleoprotein)
1.545 0.033
NM_010015 defender against cell death 1 1.544 0.046
NM_013492 similar to clusterin; clusterin 1.543 0.014
NM_029688 sulfiredoxin 1 homolog (S. cerevisiae) 1.543 0.040
NM_025507 SNW domain containing 1 1.543 0.009
NM_008722 predicted gene 6477; predicted gene 9118; nucleophosmin 1; similar to Nucleophosmin (NPM) (Nucleolar phosphoprotein B23) (Numatrin) (Nucleolar protein NO38); predicted gene 7289; predicted gene 5611
1.542 0.036
NM_001081071 lysocardiolipin acyltransferase 1 1.542 0.011
NM_023731 coiled-coil domain containing 86 1.541 0.015
NM_133933 ribophorin I 1.539 0.002
NM_145417 arginyl aminopeptidase (aminopeptidase B) 1.535 0.025
NM_078478 growth hormone inducible transmembrane protein 1.534 0.046
NM_015824 origin recognition complex, subunit 3-like (S. cerevisiae) 1.530 0.026
NM_144885 cDNA sequence BC005624; predicted gene 5904 1.530 0.013
NM_010579 eukaryotic translation initiation factor 6 1.528 0.020
NM_008549 mannosidase 2, alpha 1 1.525 0.018
NM_010368 glucuronidase, beta 1.525 0.020
NM_021714 WW domain binding protein 11 1.524 0.033
NM_001078167 splicing factor, arginine/serine-rich 1 (ASF/SF2); similar to splicing factor, arginine/serine-rich 1 (splicing factor 2, alternate splicing factor)
1.523 0.029
NM_019648 methionine aminopeptidase 2 1.523 0.023
NM_144861 regulation of nuclear pre-mRNA domain containing 1A 1.521 0.033
NM_023140 predicted gene 12669; glutaredoxin 3 1.520 0.030
NM_009278 Sjogren syndrome antigen B 1.518 0.013

Appendix A
- 7 -
NM_029157 splicing factor 3a, subunit 3 1.517 0.009
NM_007453 similar to Peroxiredoxin-6 (Antioxidant protein 2) (1-Cys peroxiredoxin) (1-Cys PRX) (Acidic calcium-independent phospholipase A2) (aiPLA2) (Non-selenium glutathione peroxidase) (NSGPx); peroxiredoxin 6
1.517 0.005
NM_016777 nuclear autoantigenic sperm protein (histone-binding); similar to nuclear autoantigenic sperm protein; NASP
1.516 0.043
NM_024448 RAB12, member RAS oncogene family 1.516 0.001
NM_133976 IMP3, U3 small nucleolar ribonucleoprotein, homolog (yeast); RIKEN cDNA 4933427G23 gene
1.515 0.013
NP_001029080 mediator complex subunit 22 1.513 0.041
NM_172666 alkylglycerone phosphate synthase 1.512 0.001
NM_026780 SYF2 homolog, RNA splicing factor (S. cerevisiae) 1.512 0.018
NM_009981 phosphate cytidylyltransferase 1, choline, alpha isoform 1.510 0.039
NP_001095925 amyloid beta (A4) precursor-like protein 2 1.510 0.003
NM_023130 RIKEN cDNA C130057N11 gene; hnRNP-associated with lethal yellow
1.509 0.005
NM_010911 nitrogen fixation gene 1 (S. cerevisiae); similar to Nitrogen fixation gene 1 (S. cerevisiae)
1.508 0.011
NM_026742 NADH dehydrogenase (ubiquinone) 1 alpha subcomplex, assembly factor 4
1.507 0.016
NM_007512 ATPase inhibitory factor 1 1.507 0.043
NP_001158082 sphingomyelin phosphodiesterase 4 1.506 0.033
NM_009033 RNA binding motif protein, X chromosome retrogene 1.505 0.033
NM_178647 CGG triplet repeat binding protein 1 1.503 0.002
NM_021512 nucleoporin 160 1.503 0.006
NM_001103165 poly(rC) binding protein 2 1.503 0.042
NM_001081164 OTU domain containing 4 1.501 0.012
NM_016884 heterogeneous nuclear ribonucleoprotein C 1.499 0.035
NM_198090 predicted gene 7498; hypothetical protein LOC635773; predicted gene 9242; predicted gene 6793; predicted gene 14730; predicted gene 7551; predicted gene 14398; predicted gene 6528; predicted gene 6641; hypothetical protein LOC630507; predicted gene 5550;
1.494 0.008
NM_133780 similar to nuclear pore complex-associated intranuclear coiled-coil protein TPR; translocated promoter region
1.493 0.012
NM_173763 cysteine conjugate-beta lyase 2 1.489 0.011
NP_904359 phospholipase A2, group XIIA 1.489 0.040
NM_010447 heterogeneous nuclear ribonucleoprotein A1-like 2; similar to heterogeneous nuclear ribonucleoprotein A1; predicted gene 13418; predicted gene 5461; predicted gene 8652; predicted gene 5643; similar to Heterogeneous nuclear ribonucleoprotein A1 (Helix-des
1.489 0.001
NM_194342 unc-84 homolog B (C. elegans) 1.488 0.037
NM_134138 proteasome (prosome, macropain) assembly chaperone 2; similar to Clast3 protein
1.485 0.014
NM_198326 NSFL1 (p97) cofactor (p47) 1.483 0.006
NM_031165 similar to heat shock protein 8; heat shock protein 8 1.479 0.021
NM_019816 apoptosis antagonizing transcription factor 1.475 0.045
NM_001013374 lectin, mannose-binding 2-like 1.475 0.018
NM_028599 WD repeat domain 75 1.474 0.015
NM_017374 similar to protein phosphatase 2a, catalytic subunit, beta isoform; protein phosphatase 2 (formerly 2A), catalytic subunit, beta isoform
1.473 0.012
NM_001024806 CCAAT/enhancer binding protein zeta 1.473 0.045

Appendix A
- 8 -
NM_026276 aminoadipate-semialdehyde dehydrogenase-phosphopantetheinyl transferase; hypothetical protein LOC100044211
1.470 0.013
NM_133242 RNA binding motif protein 39 1.469 0.014
NM_008618 malate dehydrogenase 1, NAD (soluble) 1.468 0.034
NM_016776 MYB binding protein (P160) 1a 1.468 0.015
NM_145415 expressed sequence AA408296 1.467 0.002
NM_001127346 NADH dehydrogenase (ubiquinone) 1 alpha subcomplex, assembly factor 2
1.466 0.026
NM_001033297 predicted gene 561 1.464 0.004
NM_175639 WD repeat domain 43; RIKEN cDNA 2610029G23 gene; hypothetical protein LOC674157
1.463 0.004
NM_001081028 signal-induced proliferation-associated 1 like 3 1.463 0.018
NM_138607 family with sequence similarity 50, member A 1.462 0.048
NM_080560 ubiquitin-conjugating enzyme E2N; similar to ubiquitin-conjugating enzyme E2 UbcH-ben; similar to ubiquitin-conjugating enzyme E2N; predicted gene 5943
1.462 0.025
NM_009634 adenylosuccinate lyase 1.462 0.012
NM_053186 cyclin M3 1.461 0.049
NM_027091 predicted gene 4353; nucleoporin 35 1.460 0.001
NM_009025 RAS p21 protein activator 3 1.458 0.025
NM_009798 capping protein (actin filament) muscle Z-line, beta 1.456 0.016
NM_019562 ubiquitin carboxyl-terminal esterase L5 1.456 0.021
NM_001163300 scaffold attachment factor B 1.456 0.016
NM_010752 mitotic arrest deficient 1-like 1 1.455 0.028
NM_134255 ELOVL family member 5, elongation of long chain fatty acids (yeast)
1.455 0.001
NM_007690 chromodomain helicase DNA binding protein 1 1.453 0.002
NM_010613 KH-type splicing regulatory protein 1.453 0.003
NM_026673 similar to Novel transmembrane domain containing protein; apolipoprotein O
1.453 0.041
NM_009089 polymerase (RNA) II (DNA directed) polypeptide A 1.451 0.036
NM_009825 serine (or cysteine) peptidase inhibitor, clade H, member 1 1.450 0.029
NM_024434 leucine aminopeptidase 3 1.448 0.010
NM_001002929 nucleoporin 85 1.447 0.011
NM_008828 phosphoglycerate kinase 1; predicted gene, EG668435 1.446 0.022
NM_025820 Crn, crooked neck-like 1 (Drosophila) 1.446 0.020
NM_026041 ribosomal RNA processing 15 homolog (S. cerevisiae) 1.444 0.014
NM_008774 poly(A) binding protein, cytoplasmic 1 1.443 0.021
NM_026270 AKT1 substrate 1 (proline-rich) 1.440 0.019
NM_178918 UTP15, U3 small nucleolar ribonucleoprotein, homolog (yeast) 1.440 0.013
NM_133928 coiled-coil-helix-coiled-coil-helix domain containing 4 1.439 0.016
NM_024166 coiled-coil-helix-coiled-coil-helix domain containing 2; predicted gene 13202; similar to coiled-coil-helix-coiled-coil-helix domain containing 2; predicted gene 12350
1.438 0.024
NM_001001932 early endosome antigen 1 1.435 0.013
NM_019869 RNA binding motif protein 14 1.433 0.024
NM_008669 N-acetyl galactosaminidase, alpha 1.431 0.047
NP_033778 A kinase (PRKA) anchor protein 1 1.428 0.034
NM_145431 notchless homolog 1 (Drosophila) 1.428 0.010
NM_030743 ring finger protein 114 1.428 0.000
NM_007626 chromobox homolog 5 (Drosophila HP1a) 1.427 0.001
NM_033526 ubiquilin 4 1.427 0.005
NM_026075 SFRS12-interacting protein 1 1.425 0.046
NM_023374 succinate dehydrogenase complex, subunit B, iron sulfur (Ip); 1.423 0.048

Appendix A
- 9 -
similar to succinate dehydrogenase Ip subunit
NM_026305 predicted gene 11401; similar to transcription elongation factor B (SIII), polypeptide 2; predicted gene 8971; transcription elongation factor B (SIII), polypeptide 2
1.422 0.007
NM_007801 cathepsin H 1.421 0.021
NM_016891 protein phosphatase 2 (formerly 2A), regulatory subunit A (PR 65), alpha isoform
1.420 0.022
NM_017393 caseinolytic peptidase, ATP-dependent, proteolytic subunit homolog (E. coli)
1.420 0.023
NM_025700 phosphoglucomutase 1 1.419 0.001
NM_029631 abhydrolase domain containing 14b 1.419 0.023
NM_008292 hydroxysteroid (17-beta) dehydrogenase 4 1.418 0.039
NP_001092280 peptidyl-tRNA hydrolase 2 1.417 0.027
NM_139139 DnaJ (Hsp40) homolog, subfamily C, member 17; predicted gene 6257
1.416 0.030
NM_023153 CWC15 homolog (S. cerevisiae) 1.416 0.005
NM_145706 nucleoporin 43 1.415 0.013
NM_010568 insulin receptor 1.414 0.044
NM_145627 RNA binding motif protein 10; predicted gene 12799 1.410 0.030
NM_011431 elongation factor Tu GTP binding domain containing 2 1.409 0.011
NM_001111279 WD repeat and FYVE domain containing 1 1.408 0.002
NM_009383 Tia1 cytotoxic granule-associated RNA binding protein-like 1 1.404 0.011
NM_172410 similar to nucleoporin 93; nucleoporin 93 1.403 0.008
NM_019758 mitochondrial carrier homolog 2 (C. elegans); predicted gene, 100039384; predicted gene, 100039506
1.401 0.024
NM_028766 transmembrane protein 43 1.397 0.029
NM_025374 glyoxalase 1 1.395 0.019
NM_177420 similar to Phosphoserine aminotransferase 1; phosphoserine aminotransferase 1
1.395 0.028
NM_001045523 bromo adjacent homology domain containing 1 1.392 0.045
NM_001033268 family with sequence similarity 120, member A 1.390 0.002
NM_178216 histone cluster 2, H3b; histone cluster 1, H3f; histone cluster 1, H3e; histone cluster 2, H3c1; histone cluster 1, H3d; histone cluster 1, H3c; histone cluster 1, H3b; histone cluster 2, H3c2; histone cluster 2, H2aa1; histone cluster 2, H2aa2
1.388 0.033
NM_025616 translocase of inner mitochondrial membrane 50 homolog (yeast)
1.387 0.046
NM_010722 lamin B2 1.386 0.045
NM_001005419 2-aminoethanethiol (cysteamine) dioxygenase 1.385 0.026
NM_145575 caldesmon 1 1.382 0.014
NM_026439 coiled-coil domain containing 80 1.382 0.008
NM_011508 predicted gene 5265; similar to suppressor of initiator codon mutations, related sequence 1; predicted gene 4017; predicted gene 6913; predicted gene 7688; predicted gene 6535; predicted gene 6900; predicted gene 5471; predicted gene 7845; predicted gene
1.380 0.021
NM_001013375 UTP18, small subunit (SSU) processome component, homolog (yeast)
1.378 0.001
NM_008388 eukaryotic translation initiation factor 3, subunit E 1.372 0.009
NM_172532 aldhehyde dehydrogenase family 5, subfamily A1 1.371 0.042
NM_027250 RIKEN cDNA 2010305A19 gene 1.369 0.026
NM_016692 inner centromere protein 1.364 0.012
NM_026438 pyrophosphatase (inorganic) 1 1.363 0.002
NM_010322 glyceronephosphate O-acyltransferase 1.361 0.047
NM_019765 CAP-GLY domain containing linker protein 1 1.359 0.032

Appendix A
- 10 -
NM_144804 DEP domain containing 7 1.358 0.018
NM_028112 SEH1-like (S. cerevisiae 1.357 0.023
NP_733486 RNA binding motif protein 12 1.357 0.000
NM_138659 pre-mRNA processing factor 8 1.356 0.007
NM_177253 cleavage stimulation factor, 3' pre-RNA, subunit 3 1.355 0.018
NM_183017 tubulin tyrosine ligase-like family, member 12 1.354 0.005
NM_025860 predicted gene 16433; similar to DEAD (Asp-Glu-Ala-Asp) box polypeptide 18; predicted gene 9214; predicted gene 8173; DEAD (Asp-Glu-Ala-Asp) box polypeptide 18
1.352 0.021
NM_019553 DEAD (Asp-Glu-Ala-Asp) box polypeptide 21 1.345 0.014
NM_011814 fragile X mental retardation, autosomal homolog 2 1.344 0.016
NM_028381 coiled-coil domain containing 94 1.343 0.030
NM_026077 RIKEN cDNA 3110040N11 gene 1.342 0.038
NM_023733 carnitine O-octanoyltransferase 1.342 0.021
NM_026318 RIKEN cDNA 2310003F16 gene 1.341 0.038
NP_001106817 similar to Transcriptional repressor p66 alpha (GATA zinc finger domain-containing protein 2A); GATA zinc finger domain containing 2A
1.340 0.046
NM_009672 acidic (leucine-rich) nuclear phosphoprotein 32 family, member A
1.338 0.027
NM_001080948 La ribonucleoprotein domain family, member 4; predicted gene 14373; predicted gene 8177
1.337 0.044
NM_025482 tumor protein D52-like 2 1.336 0.014
NM_027513 nucleoporin 205 1.335 0.014
NM_025430 mitochondrial ribosomal protein L35 1.334 0.012
NM_178707 zinc finger protein 592 1.334 0.020
NM_001161816 predicted gene 15455 1.333 0.005
NM_026313 RIKEN cDNA 3300001P08 gene 1.330 0.003
NM_183020 ataxin 2-like 1.328 0.028
NM_001081056 exportin, tRNA (nuclear export receptor for tRNAs) 1.328 0.029
NM_009668 bridging integrator 1 1.328 0.004
NM_023142 actin related protein 2/3 complex, subunit 1B 1.326 0.035
NM_009975 casein kinase 2, beta polypeptide 1.325 0.032
NM_028372 metallo-beta-lactamase domain containing 2 1.325 0.039
NM_026452 coenzyme Q9 homolog (yeast) 1.324 0.044
NM_009009 RAD21 homolog (S. pombe) 1.324 0.017
NM_172404 cysteine conjugate-beta lyase 1 1.321 0.012
NM_026578 GAR1 ribonucleoprotein homolog (yeast) 1.319 0.024
NM_009471 uridine monophosphate synthetase 1.317 0.042
NM_178625 transmembrane protein 209 1.317 0.003
NM_001171147 yes-associated protein 1 1.316 0.033
NM_016764 peroxiredoxin 4 1.316 0.021
NM_010726 phytanoyl-CoA hydroxylase 1.314 0.019
NM_007991 similar to Fibrillarin; fibrillarin 1.314 0.029
NM_010123 eukaryotic translation initiation factor 3, subunit A 1.314 0.006
NM_001164671 predicted gene 15542; predicted gene 7816; similar to DnaJ-like protein; predicted gene 6335; DnaJ (Hsp40) homolog, subfamily A, member 1, pseudogene; DnaJ (Hsp40) homolog, subfamily A, member 1
1.313 0.040
NM_133885 oxysterol binding protein-like 9 1.302 0.048
NM_134077 RNA binding motif protein 26 1.301 0.010
NM_026768 mitochondrial ribosomal protein S18A 1.299 0.030
NM_013511 erythrocyte protein band 4.1-like 2 1.296 0.024
NM_009456 predicted gene 7423; predicted gene 5858; predicted gene 6562; similar to ubiquitin-conjugating enzyme UbcH7; predicted gene
1.293 0.026
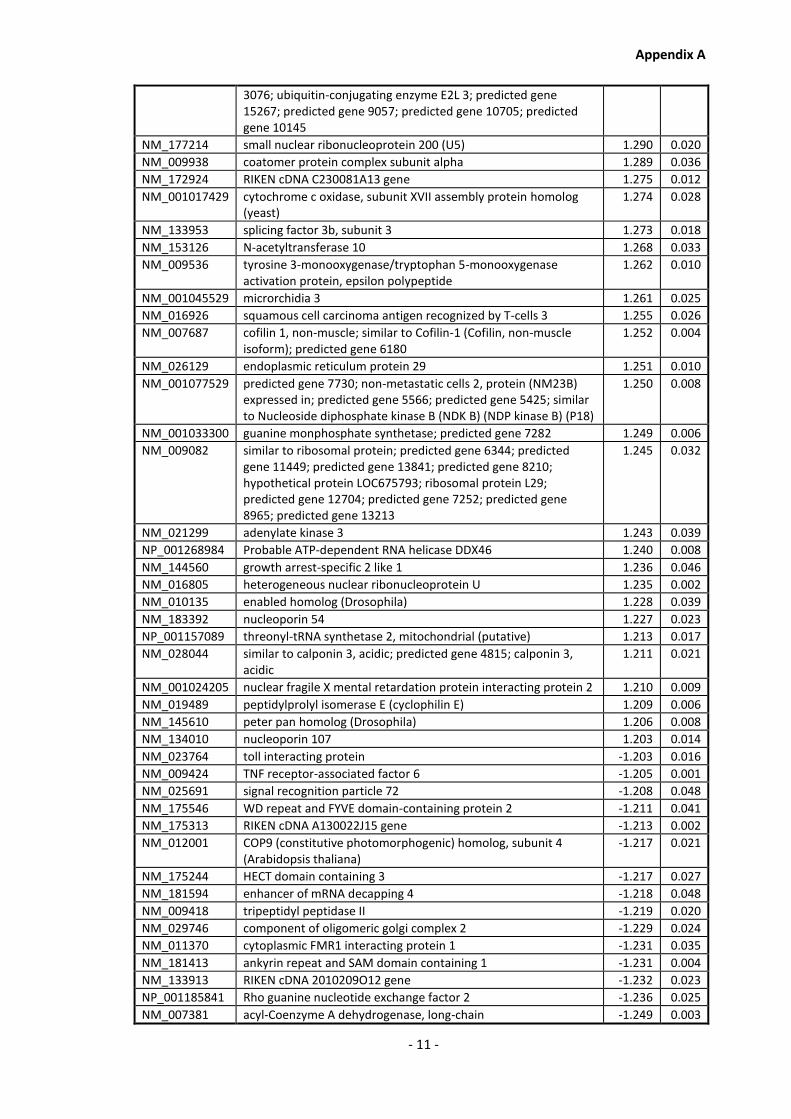
Appendix A
- 11 -
3076; ubiquitin-conjugating enzyme E2L 3; predicted gene 15267; predicted gene 9057; predicted gene 10705; predicted gene 10145
NM_177214 small nuclear ribonucleoprotein 200 (U5) 1.290 0.020
NM_009938 coatomer protein complex subunit alpha 1.289 0.036
NM_172924 RIKEN cDNA C230081A13 gene 1.275 0.012
NM_001017429 cytochrome c oxidase, subunit XVII assembly protein homolog (yeast)
1.274 0.028
NM_133953 splicing factor 3b, subunit 3 1.273 0.018
NM_153126 N-acetyltransferase 10 1.268 0.033
NM_009536 tyrosine 3-monooxygenase/tryptophan 5-monooxygenase activation protein, epsilon polypeptide
1.262 0.010
NM_001045529 microrchidia 3 1.261 0.025
NM_016926 squamous cell carcinoma antigen recognized by T-cells 3 1.255 0.026
NM_007687 cofilin 1, non-muscle; similar to Cofilin-1 (Cofilin, non-muscle isoform); predicted gene 6180
1.252 0.004
NM_026129 endoplasmic reticulum protein 29 1.251 0.010
NM_001077529 predicted gene 7730; non-metastatic cells 2, protein (NM23B) expressed in; predicted gene 5566; predicted gene 5425; similar to Nucleoside diphosphate kinase B (NDK B) (NDP kinase B) (P18)
1.250 0.008
NM_001033300 guanine monphosphate synthetase; predicted gene 7282 1.249 0.006
NM_009082 similar to ribosomal protein; predicted gene 6344; predicted gene 11449; predicted gene 13841; predicted gene 8210; hypothetical protein LOC675793; ribosomal protein L29; predicted gene 12704; predicted gene 7252; predicted gene 8965; predicted gene 13213
1.245 0.032
NM_021299 adenylate kinase 3 1.243 0.039
NP_001268984 Probable ATP-dependent RNA helicase DDX46 1.240 0.008
NM_144560 growth arrest-specific 2 like 1 1.236 0.046
NM_016805 heterogeneous nuclear ribonucleoprotein U 1.235 0.002
NM_010135 enabled homolog (Drosophila) 1.228 0.039
NM_183392 nucleoporin 54 1.227 0.023
NP_001157089 threonyl-tRNA synthetase 2, mitochondrial (putative) 1.213 0.017
NM_028044 similar to calponin 3, acidic; predicted gene 4815; calponin 3, acidic
1.211 0.021
NM_001024205 nuclear fragile X mental retardation protein interacting protein 2 1.210 0.009
NM_019489 peptidylprolyl isomerase E (cyclophilin E) 1.209 0.006
NM_145610 peter pan homolog (Drosophila) 1.206 0.008
NM_134010 nucleoporin 107 1.203 0.014
NM_023764 toll interacting protein -1.203 0.016
NM_009424 TNF receptor-associated factor 6 -1.205 0.001
NM_025691 signal recognition particle 72 -1.208 0.048
NM_175546 WD repeat and FYVE domain-containing protein 2 -1.211 0.041
NM_175313 RIKEN cDNA A130022J15 gene -1.213 0.002
NM_012001 COP9 (constitutive photomorphogenic) homolog, subunit 4 (Arabidopsis thaliana)
-1.217 0.021
NM_175244 HECT domain containing 3 -1.217 0.027
NM_181594 enhancer of mRNA decapping 4 -1.218 0.048
NM_009418 tripeptidyl peptidase II -1.219 0.020
NM_029746 component of oligomeric golgi complex 2 -1.229 0.024
NM_011370 cytoplasmic FMR1 interacting protein 1 -1.231 0.035
NM_181413 ankyrin repeat and SAM domain containing 1 -1.231 0.004
NM_133913 RIKEN cDNA 2010209O12 gene -1.232 0.023
NP_001185841 Rho guanine nucleotide exchange factor 2 -1.236 0.025
NM_007381 acyl-Coenzyme A dehydrogenase, long-chain -1.249 0.003
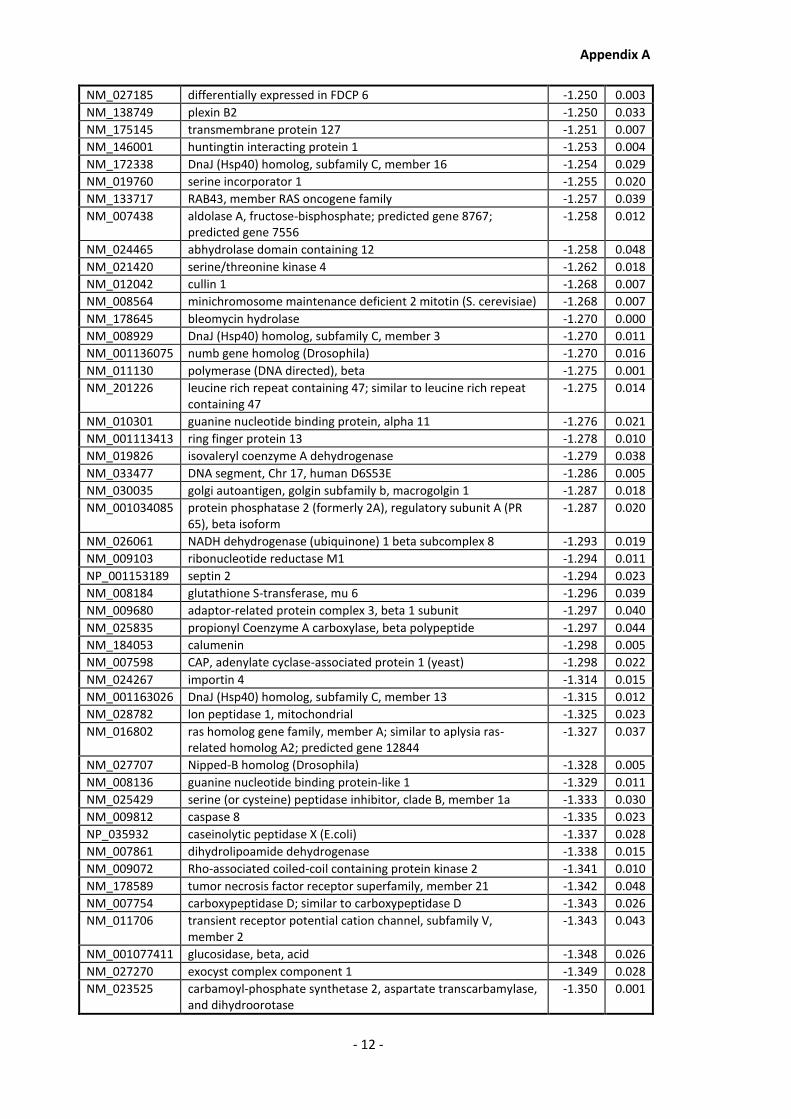
Appendix A
- 12 -
NM_027185 differentially expressed in FDCP 6 -1.250 0.003
NM_138749 plexin B2 -1.250 0.033
NM_175145 transmembrane protein 127 -1.251 0.007
NM_146001 huntingtin interacting protein 1 -1.253 0.004
NM_172338 DnaJ (Hsp40) homolog, subfamily C, member 16 -1.254 0.029
NM_019760 serine incorporator 1 -1.255 0.020
NM_133717 RAB43, member RAS oncogene family -1.257 0.039
NM_007438 aldolase A, fructose-bisphosphate; predicted gene 8767; predicted gene 7556
-1.258 0.012
NM_024465 abhydrolase domain containing 12 -1.258 0.048
NM_021420 serine/threonine kinase 4 -1.262 0.018
NM_012042 cullin 1 -1.268 0.007
NM_008564 minichromosome maintenance deficient 2 mitotin (S. cerevisiae) -1.268 0.007
NM_178645 bleomycin hydrolase -1.270 0.000
NM_008929 DnaJ (Hsp40) homolog, subfamily C, member 3 -1.270 0.011
NM_001136075 numb gene homolog (Drosophila) -1.270 0.016
NM_011130 polymerase (DNA directed), beta -1.275 0.001
NM_201226 leucine rich repeat containing 47; similar to leucine rich repeat containing 47
-1.275 0.014
NM_010301 guanine nucleotide binding protein, alpha 11 -1.276 0.021
NM_001113413 ring finger protein 13 -1.278 0.010
NM_019826 isovaleryl coenzyme A dehydrogenase -1.279 0.038
NM_033477 DNA segment, Chr 17, human D6S53E -1.286 0.005
NM_030035 golgi autoantigen, golgin subfamily b, macrogolgin 1 -1.287 0.018
NM_001034085 protein phosphatase 2 (formerly 2A), regulatory subunit A (PR 65), beta isoform
-1.287 0.020
NM_026061 NADH dehydrogenase (ubiquinone) 1 beta subcomplex 8 -1.293 0.019
NM_009103 ribonucleotide reductase M1 -1.294 0.011
NP_001153189 septin 2 -1.294 0.023
NM_008184 glutathione S-transferase, mu 6 -1.296 0.039
NM_009680 adaptor-related protein complex 3, beta 1 subunit -1.297 0.040
NM_025835 propionyl Coenzyme A carboxylase, beta polypeptide -1.297 0.044
NM_184053 calumenin -1.298 0.005
NM_007598 CAP, adenylate cyclase-associated protein 1 (yeast) -1.298 0.022
NM_024267 importin 4 -1.314 0.015
NM_001163026 DnaJ (Hsp40) homolog, subfamily C, member 13 -1.315 0.012
NM_028782 lon peptidase 1, mitochondrial -1.325 0.023
NM_016802 ras homolog gene family, member A; similar to aplysia ras-related homolog A2; predicted gene 12844
-1.327 0.037
NM_027707 Nipped-B homolog (Drosophila) -1.328 0.005
NM_008136 guanine nucleotide binding protein-like 1 -1.329 0.011
NM_025429 serine (or cysteine) peptidase inhibitor, clade B, member 1a -1.333 0.030
NM_009812 caspase 8 -1.335 0.023
NP_035932 caseinolytic peptidase X (E.coli) -1.337 0.028
NM_007861 dihydrolipoamide dehydrogenase -1.338 0.015
NM_009072 Rho-associated coiled-coil containing protein kinase 2 -1.341 0.010
NM_178589 tumor necrosis factor receptor superfamily, member 21 -1.342 0.048
NM_007754 carboxypeptidase D; similar to carboxypeptidase D -1.343 0.026
NM_011706 transient receptor potential cation channel, subfamily V, member 2
-1.343 0.043
NM_001077411 glucosidase, beta, acid -1.348 0.026
NM_027270 exocyst complex component 1 -1.349 0.028
NM_023525 carbamoyl-phosphate synthetase 2, aspartate transcarbamylase, and dihydroorotase
-1.350 0.001

Appendix A
- 13 -
NM_010163 exostoses (multiple) 2 -1.355 0.028
NM_007399 a disintegrin and metallopeptidase domain 10 -1.362 0.005
NM_008293 hydroxy-delta-5-steroid dehydrogenase, 3 beta- and steroid delta-isomerase 1
-1.363 0.013
NM_007499 ataxia telangiectasia mutated homolog (human) -1.366 0.036
NM_134100 major facilitator superfamily domain containing 5 -1.366 0.014
NM_001081309 phosphatidylinositol 3 kinase, regulatory subunit, polypeptide 4, p150
-1.368 0.011
NM_080287 engulfment and cell motility 2, ced-12 homolog (C. elegans) -1.371 0.015
NM_011874 proteasome (prosome, macropain) 26S subunit, ATPase, 4 -1.376 0.008
NM_007999 flap structure specific endonuclease 1 -1.379 0.029
NM_009373 transglutaminase 2, C polypeptide -1.379 0.004
NM_027357 proteasome (prosome, macropain) 26S subunit, non-ATPase, 1 -1.381 0.000
NM_008947 similar to peptidase (prosome, macropain) 26S subunit, ATPase 1; protease (prosome, macropain) 26S subunit, ATPase 1
-1.384 0.014
NM_178029 SET domain containing 1A -1.385 0.014
NM_213614 similar to CDCrel-1AI; septin 5 -1.387 0.015
NP_001185796 Dynactin subunit 1 -1.390 0.027
NM_001013371 deltex 3-like (Drosophila) -1.395 0.026
NM_007908 eukaryotic elongation factor-2 kinase -1.397 0.035
NM_172767 von Willebrand factor A domain containing 5A -1.397 0.026
NM_011602 talin 1 -1.400 0.009
NM_198249 RIKEN cDNA E130112L23 gene -1.400 0.023
NM_153592 ER lipid raft associated 2 -1.400 0.000
NP_001005331 eukaryotic translation initiation factor 4, gamma 1 -1.401 0.007
NM_011875 proteasome (prosome, macropain) 26S subunit, non-ATPase, 13 -1.403 0.006
NM_133794 glutaminyl-tRNA synthetase -1.404 0.025
NM_013657 sema domain, immunoglobulin domain (Ig), short basic domain, secreted, (semaphorin) 3C
-1.405 0.009
NM_023644 methylcrotonoyl-Coenzyme A carboxylase 1 (alpha) -1.406 0.006
NM_030262 protein O-fucosyltransferase 2 -1.407 0.001
NM_144941 microtubule-associated protein 7 domain containing 1 -1.409 0.001
NM_130862 brain-specific angiogenesis inhibitor 1-associated protein 2 -1.410 0.006
NM_010620 kinesin family member 15 -1.411 0.022
NM_172827 leucyl/cystinyl aminopeptidase -1.414 0.045
NM_153569 cyclin G associated kinase -1.415 0.024
NM_025692 ubiquitin-like modifier activating enzyme 5 -1.415 0.032
NM_008565 minichromosome maintenance deficient 4 homolog (S. cerevisiae)
-1.415 0.022
NM_010763 mannosidase, alpha, class 1A, member 2 -1.416 0.035
NM_011723 xanthine dehydrogenase -1.418 0.026
NM_133995 ureidopropionase, beta -1.418 0.025
NM_008788 procollagen C-endopeptidase enhancer protein -1.420 0.038
NM_080638 major vault protein -1.420 0.018
NM_008149 glycerol-3-phosphate acyltransferase, mitochondrial -1.422 0.034
NM_009795 calpain, small subunit 1 -1.422 0.048
NM_028662 solute carrier family 35, member B2 -1.423 0.032
NM_020332 progressive ankylosis -1.426 0.034
NM_181395 peroxidasin homolog (Drosophila) -1.428 0.001
NM_011787 autocrine motility factor receptor -1.429 0.016
NM_026079 inhibitor of kappa light polypeptide enhancer in B-cells, kinase complex-associated protein
-1.430 0.001
NM_026644 1-acylglycerol-3-phosphate O-acyltransferase 4 (lysophosphatidic acid acyltransferase, delta)
-1.430 0.037
NM_010941 NAD(P) dependent steroid dehydrogenase-like -1.432 0.007

Appendix A
- 14 -
NM_030253 poly (ADP-ribose) polymerase family, member 9 -1.432 0.008
NM_008984 protein tyrosine phosphatase, receptor type, M -1.434 0.035
NM_053110 glycoprotein (transmembrane) nmb -1.435 0.026
NM_011312 S100 calcium binding protein A5 -1.442 0.009
NM_008448 kinesin family member 5B -1.445 0.003
NM_009212 immunoglobulin mu binding protein 2 -1.446 0.044
NM_053262 hydroxysteroid (17-beta) dehydrogenase 11 -1.449 0.044
NM_001160330 molybdenum cofactor synthesis 3 -1.452 0.000
NM_008481 laminin, alpha 2 -1.456 0.022
NM_021429 HCLS1 binding protein 3 -1.456 0.005
NM_001033167 solute carrier family 22, member 23 -1.456 0.048
NM_026545 proteasome (prosome, macropain) 26S subunit, non-ATPase, 8 -1.460 0.027
NM_019519 Rab geranylgeranyl transferase, a subunit -1.462 0.041
NM_133907 ubiquitin protein ligase E3C -1.467 0.031
NM_139144 O-linked N-acetylglucosamine (GlcNAc) transferase (UDP-N-acetylglucosamine:polypeptide-N-acetylglucosaminyl transferase)
-1.469 0.030
NM_023420 collagen, type IV, alpha 3 (Goodpasture antigen) binding protein -1.472 0.029
NM_008364 interleukin 1 receptor accessory protein -1.476 0.025
NM_175193 golgi integral membrane protein 4 -1.477 0.041
NM_030238 dynein cytoplasmic 1 heavy chain 1 -1.477 0.011
NM_013700 ubiquitin specific peptidase 5 (isopeptidase T) -1.483 0.025
NM_013796 N-acetylglucosamine-1-phosphodiester alpha-N-acetylglucosaminidase
-1.484 0.035
NM_008328 similar to Interferon-activatable protein 203 (Ifi-203) (Interferon-inducible protein p203); similar to interferon activated gene 203; interferon activated gene 203
-1.484 0.009
NM_008566 minichromosome maintenance deficient 5, cell division cycle 46 (S. cerevisiae)
-1.487 0.038
NM_198007 activating signal cointegrator 1 complex subunit 3 -1.488 0.002
NM_173443 valosin containing protein (p97)/p47 complex interacting protein 1
-1.495 0.034
NM_010708 lectin, galactose binding, soluble 9 -1.495 0.026
NM_011696 predicted gene 7591; voltage-dependent anion channel 3 -1.498 0.015
NM_177876 vacuolar protein sorting 37B (yeast) -1.500 0.029
NM_009045 v-rel reticuloendotheliosis viral oncogene homolog A (avian) -1.506 0.024
NM_001080968 golgi autoantigen, golgin subfamily a, 2 -1.507 0.028
NM_029572 endoplasmic reticulum protein 44 -1.512 0.014
NM_008255 3-hydroxy-3-methylglutaryl-Coenzyme A reductase -1.514 0.049
NM_133224 ATPase type 13A1 -1.516 0.008
NP_001020566 Rous sarcoma oncogene -1.517 0.015
NM_172769 sterol-C5-desaturase (fungal ERG3, delta-5-desaturase) homolog (S. cerevisae)
-1.517 0.010
NM_026171 nuclear VCP-like -1.517 0.010
NM_198163 RAB35, member RAS oncogene family -1.518 0.013
NM_183106 tetratricopeptide repeat domain 17 -1.518 0.023
NM_010562 integrin linked kinase; predicted gene 6263 -1.518 0.048
NM_013472 annexin A6 -1.519 0.001
NM_001081193 LEM domain containing 3 -1.519 0.006
NM_028264 transmembrane protein 55A -1.520 0.006
NM_013495 carnitine palmitoyltransferase 1a, liver -1.520 0.049
NM_001163126 component of oligomeric golgi complex 5 -1.522 0.024
NM_001081252 UDP-glucose ceramide glucosyltransferase-like 2 -1.522 0.013
NP_001240821 Anion exchange protein 2 -1.522 0.048
NM_013528 glutamine fructose-6-phosphate transaminase 1 -1.523 0.002
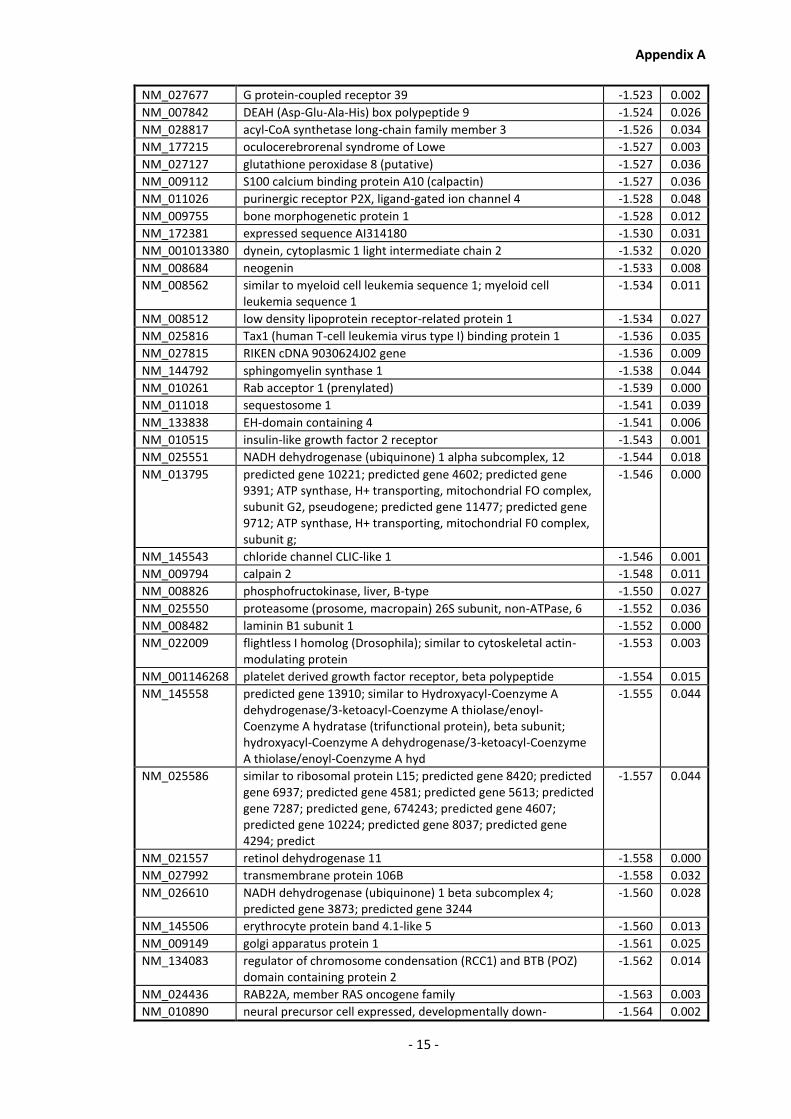
Appendix A
- 15 -
NM_027677 G protein-coupled receptor 39 -1.523 0.002
NM_007842 DEAH (Asp-Glu-Ala-His) box polypeptide 9 -1.524 0.026
NM_028817 acyl-CoA synthetase long-chain family member 3 -1.526 0.034
NM_177215 oculocerebrorenal syndrome of Lowe -1.527 0.003
NM_027127 glutathione peroxidase 8 (putative) -1.527 0.036
NM_009112 S100 calcium binding protein A10 (calpactin) -1.527 0.036
NM_011026 purinergic receptor P2X, ligand-gated ion channel 4 -1.528 0.048
NM_009755 bone morphogenetic protein 1 -1.528 0.012
NM_172381 expressed sequence AI314180 -1.530 0.031
NM_001013380 dynein, cytoplasmic 1 light intermediate chain 2 -1.532 0.020
NM_008684 neogenin -1.533 0.008
NM_008562 similar to myeloid cell leukemia sequence 1; myeloid cell leukemia sequence 1
-1.534 0.011
NM_008512 low density lipoprotein receptor-related protein 1 -1.534 0.027
NM_025816 Tax1 (human T-cell leukemia virus type I) binding protein 1 -1.536 0.035
NM_027815 RIKEN cDNA 9030624J02 gene -1.536 0.009
NM_144792 sphingomyelin synthase 1 -1.538 0.044
NM_010261 Rab acceptor 1 (prenylated) -1.539 0.000
NM_011018 sequestosome 1 -1.541 0.039
NM_133838 EH-domain containing 4 -1.541 0.006
NM_010515 insulin-like growth factor 2 receptor -1.543 0.001
NM_025551 NADH dehydrogenase (ubiquinone) 1 alpha subcomplex, 12 -1.544 0.018
NM_013795 predicted gene 10221; predicted gene 4602; predicted gene 9391; ATP synthase, H+ transporting, mitochondrial FO complex, subunit G2, pseudogene; predicted gene 11477; predicted gene 9712; ATP synthase, H+ transporting, mitochondrial F0 complex, subunit g;
-1.546 0.000
NM_145543 chloride channel CLIC-like 1 -1.546 0.001
NM_009794 calpain 2 -1.548 0.011
NM_008826 phosphofructokinase, liver, B-type -1.550 0.027
NM_025550 proteasome (prosome, macropain) 26S subunit, non-ATPase, 6 -1.552 0.036
NM_008482 laminin B1 subunit 1 -1.552 0.000
NM_022009 flightless I homolog (Drosophila); similar to cytoskeletal actin-modulating protein
-1.553 0.003
NM_001146268 platelet derived growth factor receptor, beta polypeptide -1.554 0.015
NM_145558 predicted gene 13910; similar to Hydroxyacyl-Coenzyme A dehydrogenase/3-ketoacyl-Coenzyme A thiolase/enoyl-Coenzyme A hydratase (trifunctional protein), beta subunit; hydroxyacyl-Coenzyme A dehydrogenase/3-ketoacyl-Coenzyme A thiolase/enoyl-Coenzyme A hyd
-1.555 0.044
NM_025586 similar to ribosomal protein L15; predicted gene 8420; predicted gene 6937; predicted gene 4581; predicted gene 5613; predicted gene 7287; predicted gene, 674243; predicted gene 4607; predicted gene 10224; predicted gene 8037; predicted gene 4294; predict
-1.557 0.044
NM_021557 retinol dehydrogenase 11 -1.558 0.000
NM_027992 transmembrane protein 106B -1.558 0.032
NM_026610 NADH dehydrogenase (ubiquinone) 1 beta subcomplex 4; predicted gene 3873; predicted gene 3244
-1.560 0.028
NM_145506 erythrocyte protein band 4.1-like 5 -1.560 0.013
NM_009149 golgi apparatus protein 1 -1.561 0.025
NM_134083 regulator of chromosome condensation (RCC1) and BTB (POZ) domain containing protein 2
-1.562 0.014
NM_024436 RAB22A, member RAS oncogene family -1.563 0.003
NM_010890 neural precursor cell expressed, developmentally down- -1.564 0.002

Appendix A
- 16 -
regulated 4
NM_176860 ubiquitin associated and SH3 domain containing, B -1.564 0.037
NM_007988 fatty acid synthase -1.565 0.000
NM_030013 cytochrome P450, family 20, subfamily A, polypeptide 1 -1.566 0.015
NM_007508 ATPase, H+ transporting, lysosomal V1 subunit A -1.569 0.010
NM_024226 reticulon 4 -1.569 0.011
NM_010875 neural cell adhesion molecule 1 -1.572 0.002
NM_020586 HERPUD family member 2 -1.572 0.002
NM_173013 microtubule-associated protein 1S -1.573 0.007
NM_011313 S100 calcium binding protein A6 (calcyclin) -1.575 0.043
NM_178772 arylacetamide deacetylase-like 1 -1.575 0.031
NM_011704 vanin 1 -1.577 0.002
NM_001045489 milk fat globule-EGF factor 8 protein -1.577 0.020
NM_152801 Rac/Cdc42 guanine nucleotide exchange factor (GEF) 6 -1.578 0.021
NM_009842 CD151 antigen -1.579 0.029
NM_007509 ATPase, H+ transporting, lysosomal V1 subunit B2 -1.579 0.006
NM_012002 COP9 (constitutive photomorphogenic) homolog, subunit 6 (Arabidopsis thaliana)
-1.579 0.026
NM_010546 inhibitor of kappaB kinase beta -1.580 0.019
NM_080445 similar to UDP-Gal:betaGal beta 1,3-galactosyltransferase, polypeptide 6; UDP-Gal:betaGal beta 1,3-galactosyltransferase, polypeptide 6
-1.582 0.016
NM_008898 P450 (cytochrome) oxidoreductase -1.582 0.008
NM_019703 phosphofructokinase, platelet -1.583 0.004
NM_009530 alpha thalassemia/mental retardation syndrome X-linked homolog (human)
-1.583 0.001
NM_016721 IQ motif containing GTPase activating protein 1 -1.584 0.002
NM_009371 transforming growth factor, beta receptor II -1.585 0.002
NM_011311 hippocampus abundant transcript-like 1; S100 calcium binding protein A4
-1.586 0.007
NM_009933 collagen, type VI, alpha 1 -1.586 0.013
NM_178376 Ras-related GTP binding A -1.591 0.025
NM_175229 serine/arginine repetitive matrix 2; similar to Serine/arginine repetitive matrix protein 2; similar to retinitis pigmentosa GTPase regulator
-1.592 0.012
NM_027410 tectonin beta-propeller repeat containing 1 -1.592 0.011
XM_001475417 similar to cytochrome c oxidase, subunit Vb; predicted gene 11273; cytochrome c oxidase, subunit Vb
-1.592 0.022
NM_138579 TRIO and F-actin binding protein -1.592 0.002
NM_145138 NIMA (never in mitosis gene a)-related expressed kinase 9 -1.593 0.018
NM_008948 proteasome (prosome, macropain) 26S subunit, ATPase 3 -1.595 0.005
NM_011504 syntaxin binding protein 3A -1.596 0.017
NM_025515 similar to Coiled-coil domain containing 90B; coiled-coil domain containing 90B
-1.596 0.031
NM_001081066 DENN/MADD domain containing 3 -1.598 0.006
NM_183162 cDNA sequence BC006779 -1.598 0.039
NM_009465 AXL receptor tyrosine kinase -1.599 0.003
NM_009481 ubiquitin specific peptidase 9, X chromosome -1.601 0.006
NM_008133 glutamate dehydrogenase 1; predicted gene 5902 -1.602 0.002
NM_008325 iduronidase, alpha-L- -1.603 0.008
NM_008451 kinesin light chain 2 -1.604 0.014
NM_010046 diacylglycerol O-acyltransferase 1 -1.605 0.036
NM_175126 zinc finger, CCHC domain containing 3 -1.606 0.043
NM_023220 RIKEN cDNA 2010106G01 gene -1.607 0.012
NM_028248 transmembrane protein 87B -1.608 0.022
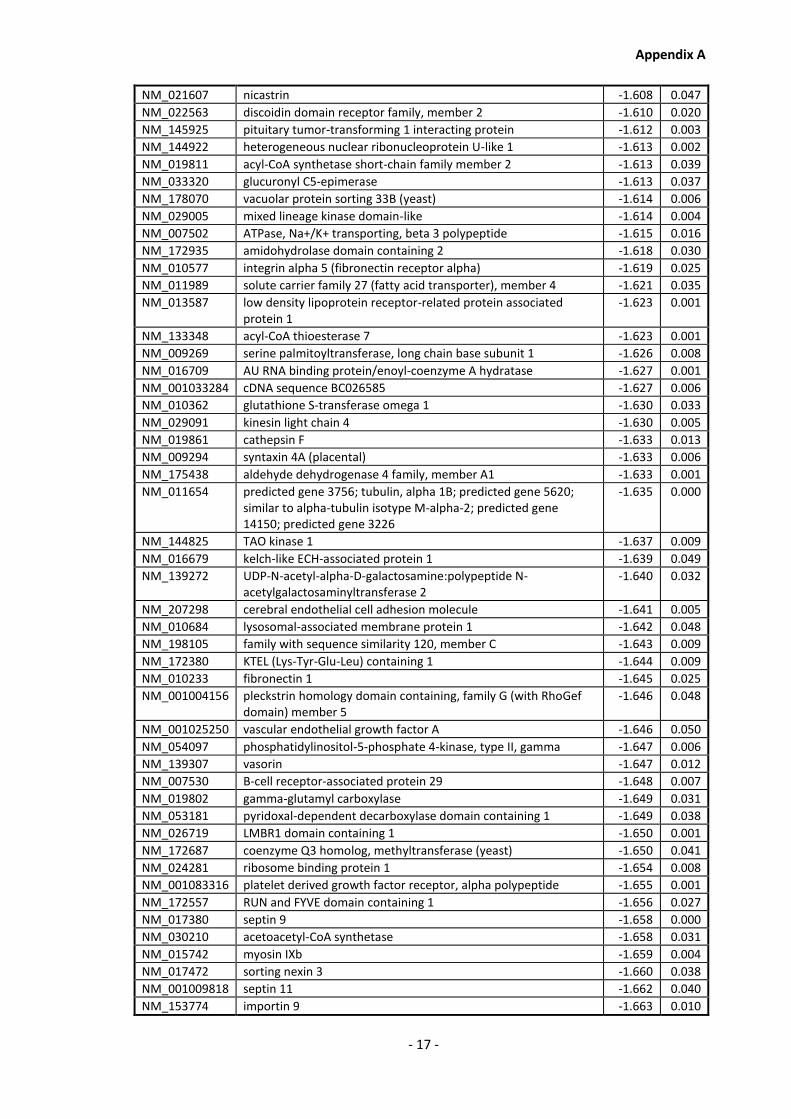
Appendix A
- 17 -
NM_021607 nicastrin -1.608 0.047
NM_022563 discoidin domain receptor family, member 2 -1.610 0.020
NM_145925 pituitary tumor-transforming 1 interacting protein -1.612 0.003
NM_144922 heterogeneous nuclear ribonucleoprotein U-like 1 -1.613 0.002
NM_019811 acyl-CoA synthetase short-chain family member 2 -1.613 0.039
NM_033320 glucuronyl C5-epimerase -1.613 0.037
NM_178070 vacuolar protein sorting 33B (yeast) -1.614 0.006
NM_029005 mixed lineage kinase domain-like -1.614 0.004
NM_007502 ATPase, Na+/K+ transporting, beta 3 polypeptide -1.615 0.016
NM_172935 amidohydrolase domain containing 2 -1.618 0.030
NM_010577 integrin alpha 5 (fibronectin receptor alpha) -1.619 0.025
NM_011989 solute carrier family 27 (fatty acid transporter), member 4 -1.621 0.035
NM_013587 low density lipoprotein receptor-related protein associated protein 1
-1.623 0.001
NM_133348 acyl-CoA thioesterase 7 -1.623 0.001
NM_009269 serine palmitoyltransferase, long chain base subunit 1 -1.626 0.008
NM_016709 AU RNA binding protein/enoyl-coenzyme A hydratase -1.627 0.001
NM_001033284 cDNA sequence BC026585 -1.627 0.006
NM_010362 glutathione S-transferase omega 1 -1.630 0.033
NM_029091 kinesin light chain 4 -1.630 0.005
NM_019861 cathepsin F -1.633 0.013
NM_009294 syntaxin 4A (placental) -1.633 0.006
NM_175438 aldehyde dehydrogenase 4 family, member A1 -1.633 0.001
NM_011654 predicted gene 3756; tubulin, alpha 1B; predicted gene 5620; similar to alpha-tubulin isotype M-alpha-2; predicted gene 14150; predicted gene 3226
-1.635 0.000
NM_144825 TAO kinase 1 -1.637 0.009
NM_016679 kelch-like ECH-associated protein 1 -1.639 0.049
NM_139272 UDP-N-acetyl-alpha-D-galactosamine:polypeptide N-acetylgalactosaminyltransferase 2
-1.640 0.032
NM_207298 cerebral endothelial cell adhesion molecule -1.641 0.005
NM_010684 lysosomal-associated membrane protein 1 -1.642 0.048
NM_198105 family with sequence similarity 120, member C -1.643 0.009
NM_172380 KTEL (Lys-Tyr-Glu-Leu) containing 1 -1.644 0.009
NM_010233 fibronectin 1 -1.645 0.025
NM_001004156 pleckstrin homology domain containing, family G (with RhoGef domain) member 5
-1.646 0.048
NM_001025250 vascular endothelial growth factor A -1.646 0.050
NM_054097 phosphatidylinositol-5-phosphate 4-kinase, type II, gamma -1.647 0.006
NM_139307 vasorin -1.647 0.012
NM_007530 B-cell receptor-associated protein 29 -1.648 0.007
NM_019802 gamma-glutamyl carboxylase -1.649 0.031
NM_053181 pyridoxal-dependent decarboxylase domain containing 1 -1.649 0.038
NM_026719 LMBR1 domain containing 1 -1.650 0.001
NM_172687 coenzyme Q3 homolog, methyltransferase (yeast) -1.650 0.041
NM_024281 ribosome binding protein 1 -1.654 0.008
NM_001083316 platelet derived growth factor receptor, alpha polypeptide -1.655 0.001
NM_172557 RUN and FYVE domain containing 1 -1.656 0.027
NM_017380 septin 9 -1.658 0.000
NM_030210 acetoacetyl-CoA synthetase -1.658 0.031
NM_015742 myosin IXb -1.659 0.004
NM_017472 sorting nexin 3 -1.660 0.038
NM_001009818 septin 11 -1.662 0.040
NM_153774 importin 9 -1.663 0.010

Appendix A
- 18 -
NM_153125 SEC16 homolog A (S. cerevisiae) -1.664 0.017
NM_026698 transmembrane protein 129 -1.665 0.028
NM_011170 prion protein -1.666 0.006
NM_029841 RIKEN cDNA 2510039O18 gene; similar to RIKEN cDNA 2510039O18 gene
-1.666 0.022
NM_011076 ATP-binding cassette, sub-family B (MDR/TAP), member 1A -1.666 0.022
NM_010117 rhomboid family 1 (Drosophila) -1.669 0.036
NM_177304 ectonucleotide pyrophosphatase/phosphodiesterase 6 -1.670 0.003
NM_146121 RAB GTPase activating protein 1 -1.670 0.008
NP_001240839 Protein Nat8f7 -1.671 0.021
NP_001070732 adaptor protein complex AP-2, alpha 1 subunit -1.671 0.022
NM_026228 solute carrier family 39 (metal ion transporter), member 8 -1.672 0.002
NM_133826 ATPase, H+ transporting, lysosomal V1 subunit H -1.674 0.012
NM_001033293 UDP-N-acteylglucosamine pyrophosphorylase 1-like 1 -1.676 0.003
NM_001033202 ubiquitin specific peptidase 30 -1.677 0.006
NM_145619 poly (ADP-ribose) polymerase family, member 3 -1.678 0.008
NM_001081306 protein tyrosine phosphatase, receptor type Z, polypeptide 1 -1.678 0.021
NM_194334 TBC1 domain family, member 2B -1.678 0.017
NM_144878 flavin containing monooxygenase 4 -1.679 0.016
NM_010239 ferritin heavy chain 1 -1.680 0.008
NM_153800 Rho GTPase activating protein 22 -1.682 0.009
NM_011400 solute carrier family 2 (facilitated glucose transporter), member 1
-1.683 0.002
NM_026677 RAB13, member RAS oncogene family -1.683 0.002
NM_053014 1-acylglycerol-3-phosphate O-acyltransferase 3 -1.684 0.002
NM_028428 fucosyltransferase 11 -1.684 0.033
NM_021534 peroxisomal membrane protein 4 -1.685 0.026
NM_009288 serine/threonine kinase 10 -1.687 0.004
NM_010049 dihydrofolate reductase -1.691 0.003
NM_145960 mitochondrial translational release factor 1 -1.692 0.010
NM_172570 tripartite motif-containing 47 -1.693 0.024
NM_024436 RAB22A, member RAS oncogene family -1.697 0.003
NM_133921 nuclear transcription factor, X-box binding-like 1 -1.697 0.012
NM_029884 heparan-alpha-glucosaminide N-acetyltransferase -1.698 0.003
NM_175121 solute carrier family 38, member 2 -1.702 0.011
NM_145540 integrator complex subunit 3 -1.708 0.004
NM_001033534 layilin -1.708 0.016
NM_007653 CD63 antigen -1.711 0.017
NP_001116240 leucine rich repeat containing 8D -1.712 0.006
NM_008980 protein tyrosine phosphatase, receptor type, A -1.712 0.003
NM_008175 granulin -1.713 0.015
NP_062718 Nuclear receptor coactivator 4 -1.713 0.005
NM_013792 alpha-N-acetylglucosaminidase (Sanfilippo disease IIIB) -1.715 0.026
NM_027379 fatty acyl CoA reductase 1 -1.716 0.001
NM_080555 phosphatidic acid phosphatase type 2B -1.725 0.001
NM_153198 high mobility group box transcription factor 1 -1.725 0.004
NM_026825 leucine rich repeat containing 16A -1.727 0.013
NM_008608 matrix metallopeptidase 14 (membrane-inserted) -1.730 0.005
NM_022018 family with sequence similarity 129, member A -1.735 0.003
NM_007387 acid phosphatase 2, lysosomal -1.738 0.009
NM_011577 transforming growth factor, beta 1 -1.739 0.007
NM_007874 receptor accessory protein 5 -1.741 0.040
NP_001258788 Beta-adducin -1.744 0.012
NM_007643 CD36 antigen -1.752 0.004

Appendix A
- 19 -
NM_010106 predicted gene 5869; predicted gene 7161; predicted gene 7105; predicted gene 5822; similar to eukaryotic translation elongation factor 1 alpha 1; predicted gene 6192; predicted gene 6392; predicted gene 6767; predicted gene 6170; predicted gene 6548; pre
-1.754 0.005
NM_010441 predicted gene 7996; high mobility group AT-hook 2 -1.755 0.005
NM_010212 four and a half LIM domains 2 -1.757 0.007
NM_029600 ATP-binding cassette, sub-family C (CFTR/MRP), member 3 -1.758 0.003
NM_031871 GH3 domain containing -1.768 0.003
NM_178337 tubulin-specific chaperone E -1.770 0.000
NP_034873 interleukin 1 receptor-like 1 -1.772 0.010
NM_030201 heat shock protein 70 family, member 13 -1.784 0.027
NM_007982 PTK2 protein tyrosine kinase 2 -1.797 0.002
NM_028431 peptidase (mitochondrial processing) beta -1.803 0.017
NM_172456 endo/exonuclease (5'-3'), endonuclease G-like -1.818 0.005
NM_013477 ATPase, H+ transporting, lysosomal V0 subunit D1 -1.822 0.002
Table 1-B: Differentially regulated CHO DP-12 proteins determined in samples corresponding to
culture using a reduced bioprocessing temperature of 32.0oC
RefSeq Annotation
Description Fold Change
P-Value
NM_011638 transferrin receptor 1.792 0.025
NM_008881 plexin A1 1.782 0.005
NM_023130 RIKEN cDNA C130057N11 gene; hnRNP-associated with lethal yellow
1.728 0.002
NP_001103445 synaptopodin 1.713 0.009
NM_146090 zinc binding alcohol dehydrogenase, domain containing 2 1.701 0.017
NM_011170 prion protein 1.697 0.007
NM_028870 clathrin, light polypeptide (Lcb) 1.692 0.028
NM_026159 retinol saturase (all trans retinol 13,14 reductase) 1.691 0.023
NM_021895 actinin alpha 4 1.680 0.042
NM_008558 similar to Myn protein; Max protein 1.680 0.026
NM_026041 ribosomal RNA processing 15 homolog (S. cerevisiae) 1.679 0.010
NM_025788 nucleus accumbens associated 1, BEN and BTB (POZ) domain containing
1.675 0.002
NM_130862 brain-specific angiogenesis inhibitor 1-associated protein 2 1.673 0.001
NM_011544 transcription factor 12 1.670 0.026
NM_001163662 nucleobindin 1 1.665 0.047
NM_019772 predicted gene 9169; RIKEN cDNA 1110004F10 gene; similar to small acidic protein
1.662 0.033
NM_026277 NIN1/RPN12 binding protein 1 homolog (S. cerevisiae) 1.661 0.000
NM_175126 zinc finger, CCHC domain containing 3 1.660 0.042
NM_009264 small proline-rich protein 1A 1.658 0.043
NM_026623 nudix (nucleoside diphosphate linked moiety X)-type motif 21 1.656 0.002
NM_016844 similar to 40S ribosomal protein S28; predicted gene 10443; predicted gene 12943; predicted gene 13192; similar to ribosomal protein S28; predicted gene 10263; predicted gene 3511; ribosomal protein S28
1.654 0.018
NM_172943 similar to AlkB, alkylation repair homolog 5 (E. coli); alkB, alkylation repair homolog 5 (E. coli)
1.654 0.022
NM_009032 RNA binding motif protein 4 1.653 0.038

Appendix A
- 20 -
NM_008980 protein tyrosine phosphatase, receptor type, A 1.649 0.031
NM_023731 coiled-coil domain containing 86 1.644 0.008
NM_026732 mitochondrial ribosomal protein L14 1.633 0.037
NM_133887 syntaxin 12 1.624 0.015
NM_019813 drebrin 1 1.610 0.003
NM_021895 actinin alpha 4 1.610 0.010
NM_027044 prefoldin 5 1.602 0.040
NM_001033284 cDNA sequence BC026585 1.600 0.000
NM_183020 ataxin 2-like 1.594 0.003
NM_011197 prostaglandin F2 receptor negative regulator 1.591 0.022
NM_008562 similar to myeloid cell leukemia sequence 1; myeloid cell leukemia sequence 1
1.590 0.002
NM_080555 phosphatidic acid phosphatase type 2B 1.587 0.001
NM_033526 ubiquilin 4 1.583 0.029
NM_016690 heterogeneous nuclear ribonucleoprotein D-like 1.580 0.042
NM_021557 retinol dehydrogenase 11 1.576 0.004
NM_010213 four and a half LIM domains 3 1.572 0.018
NM_021336 small nuclear ribonucleoprotein polypeptide A' 1.571 0.039
NM_024166 coiled-coil-helix-coiled-coil-helix domain containing 2; predicted gene 13202; similar to coiled-coil-helix-coiled-coil-helix domain containing 2; predicted gene 12350
1.569 0.047
NM_008972 predicted gene 12504; predicted gene 9800; predicted gene 4617; predicted gene 6625; predicted gene 7614; similar to prothymosin alpha; prothymosin alpha; predicted gene 9009
1.568 0.018
NM_025587 predicted gene 5963; ribosomal protein S21 1.568 0.050
NM_020506 exportin 4 1.561 0.024
NM_010875 neural cell adhesion molecule 1 1.560 0.012
NM_011312 S100 calcium binding protein A5 1.560 0.021
NM_025682 paraspeckle protein 1 1.554 0.006
NM_025315 mediator complex subunit 21 1.552 0.008
NM_016786 ubiquitin-conjugating enzyme E2K (UBC1 homolog, yeast) 1.552 0.029
NM_026677 RAB13, member RAS oncogene family 1.552 0.034
NM_025430 mitochondrial ribosomal protein L35 1.550 0.009
NP_001129553 structure specific recognition protein 1 1.550 0.022
NM_001171147 yes-associated protein 1 1.547 0.041
NM_153787 BCL2-associated transcription factor 1 1.546 0.006
NM_026538 DEAD (Asp-Glu-Ala-Asp) box polypeptide 56 1.546 0.015
NM_172769 sterol-C5-desaturase (fungal ERG3, delta-5-desaturase) homolog (S. cerevisae)
1.541 0.017
NM_144560 growth arrest-specific 2 like 1 1.539 0.016
NM_001024205 nuclear fragile X mental retardation protein interacting protein 2 1.534 0.013
NM_009643 AHNAK nucleoprotein (desmoyokin) 1.521 0.001
NM_144930 expressed sequence AU018778 1.520 0.005
NM_008155 glucose phosphate isomerase 1 1.517 0.013
NM_016696 glypican 1 1.512 0.022
NM_007705 cold inducible RNA binding protein 1.505 0.034
NM_019975 2-hydroxyacyl-CoA lyase 1 1.495 0.014
NM_001080926 low density lipoprotein receptor-related protein 8, apolipoprotein e receptor
1.494 0.038
NM_007840 DEAD (Asp-Glu-Ala-Asp) box polypeptide 5; predicted gene 12183 1.486 0.038
NM_025697 RIKEN cDNA 6330409N04 gene 1.485 0.025
NM_027000 GTP binding protein 4 1.484 0.022
NM_001163540 plectin 1 1.482 0.003
NM_199323 transforming, acidic coiled-coil containing protein 1 1.481 0.041
NM_026228 solute carrier family 39 (metal ion transporter), member 8 1.474 0.011

Appendix A
- 21 -
NM_011768 zinc finger protein X-linked; similar to zinc finger protein 1.472 0.029
NM_026602 breast carcinoma amplified sequence 2 1.469 0.005
NM_153419 glutamate-rich WD repeat containing 1 1.463 0.038
NM_009933 collagen, type VI, alpha 1 1.461 0.006
NM_009295 syntaxin binding protein 1 1.459 0.007
NM_130864 acetyl-Coenzyme A acyltransferase 1A 1.452 0.001
NM_009881 chromodomain protein, Y chromosome-like; predicted gene 7584 1.450 0.026
NM_026020 similar to LOC665931 protein; ribosomal protein, large P2; predicted gene 7852; WD repeat domain 89
1.446 0.028
NM_009510 ezrin; hypothetical protein LOC100044177 1.445 0.024
NM_008684 neogenin 1.445 0.015
NM_025884 zinc finger protein 830 1.437 0.022
NM_026503 RIKEN cDNA 1110058L19 gene 1.429 0.000
NM_025551 NADH dehydrogenase (ubiquinone) 1 alpha subcomplex, 12 1.423 0.013
NM_009048 RalBP1 associated Eps domain containing protein 1.422 0.022
NM_011925 CD97 antigen 1.419 0.020
NM_001082961 small nuclear ribonucleoprotein N; SNRPN upstream reading frame; predicted gene 5802; similar to SNRPN upstream reading frame protein
1.407 0.026
NM_009112 S100 calcium binding protein A10 (calpactin) 1.407 0.039
NM_018796 eukaryotic translation elongation factor 1 beta 2 1.402 0.049
NM_028871 predicted gene 6159; heterogeneous nuclear ribonucleoprotein R 1.400 0.003
NM_011917 5'-3' exoribonuclease 2 1.399 0.033
NM_011479 serine palmitoyltransferase, long chain base subunit 2 1.397 0.011
NM_020586 HERPUD family member 2 1.396 0.021
NM_026737 PHD finger protein 5A 1.393 0.001
NM_145610 peter pan homolog (Drosophila) 1.388 0.029
NM_008133 glutamate dehydrogenase 1; predicted gene 5902 1.386 0.007
NM_080558 sperm specific antigen 2 1.382 0.015
NP_062718 Nuclear receptor coactivator 4 1.377 0.037
NM_001080794 GTPase activating protein (SH3 domain) binding protein 2 1.375 0.016
NM_001037756 breast cancer metastasis-suppressor 1-like 1.374 0.000
NM_017382 RAB11a, member RAS oncogene family 1.372 0.012
NM_008638 methylenetetrahydrofolate dehydrogenase (NAD+ dependent), methenyltetrahydrofolate cyclohydrolase
1.372 0.046
NM_008364 interleukin 1 receptor accessory protein 1.370 0.038
NM_010191 predicted gene 6781; farnesyl diphosphate farnesyl transferase 1 1.370 0.046
NM_026988 parathymosin 1.369 0.022
NM_016753 latexin 1.366 0.028
NM_025814 serpine1 mRNA binding protein 1 1.366 0.020
NM_011327 sterol carrier protein 2, liver 1.363 0.011
NM_023536 predicted gene 9178; MRT4, mRNA turnover 4, homolog (S. cerevisiae); predicted gene 5633
1.361 0.010
NM_011300 similar to 40S ribosomal protein S7 (S8); predicted gene 6252; predicted gene 5055; predicted gene 4761; ribosomal protein S7; predicted gene 7351; predicted gene 6472
1.358 0.046
NM_025864 transmembrane protein 206 1.352 0.007
NM_023144 non-POU-domain-containing, octamer binding protein; predicted gene 8806
1.352 0.029
NP_001158005 death associated protein 3 1.343 0.004
NM_011189 predicted gene 7776; proteasome (prosome, macropain) 28 subunit, alpha
1.342 0.019
NM_026933 TP53 regulated inhibitor of apoptosis 1 1.338 0.049
NM_007842 DEAH (Asp-Glu-Ala-His) box polypeptide 9 1.338 0.019
NM_009530 alpha thalassemia/mental retardation syndrome X-linked homolog 1.337 0.001
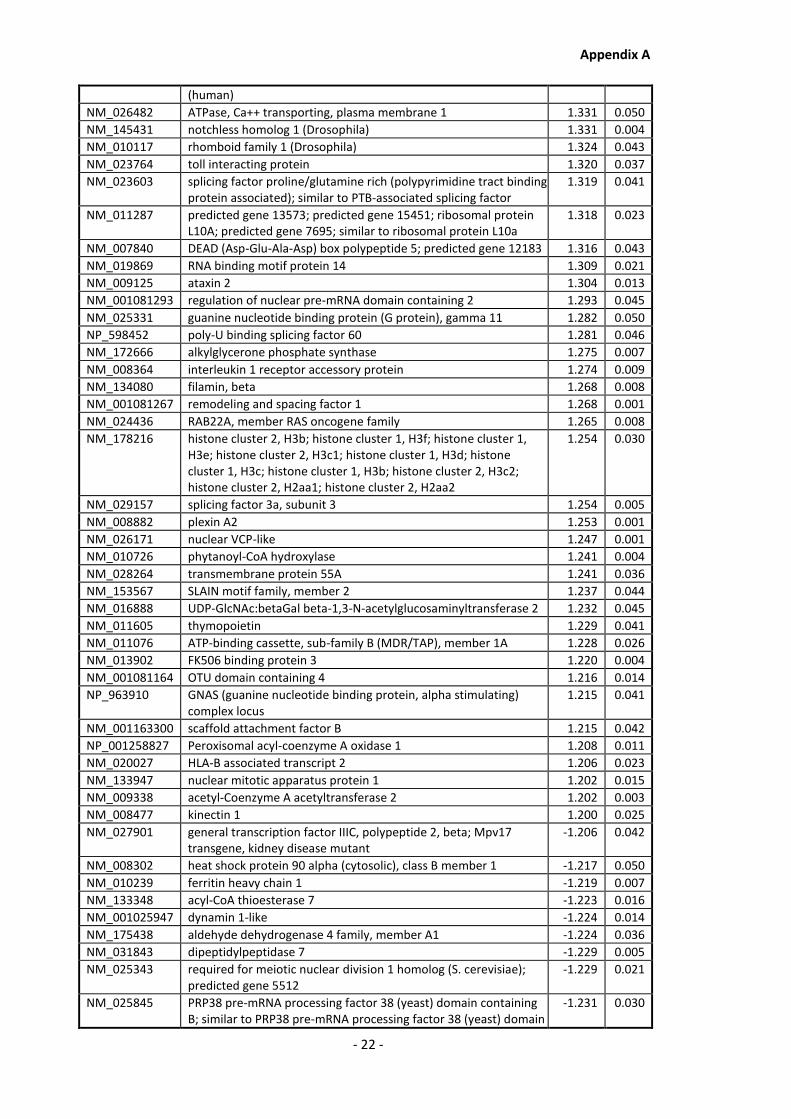
Appendix A
- 22 -
(human)
NM_026482 ATPase, Ca++ transporting, plasma membrane 1 1.331 0.050
NM_145431 notchless homolog 1 (Drosophila) 1.331 0.004
NM_010117 rhomboid family 1 (Drosophila) 1.324 0.043
NM_023764 toll interacting protein 1.320 0.037
NM_023603 splicing factor proline/glutamine rich (polypyrimidine tract binding protein associated); similar to PTB-associated splicing factor
1.319 0.041
NM_011287 predicted gene 13573; predicted gene 15451; ribosomal protein L10A; predicted gene 7695; similar to ribosomal protein L10a
1.318 0.023
NM_007840 DEAD (Asp-Glu-Ala-Asp) box polypeptide 5; predicted gene 12183 1.316 0.043
NM_019869 RNA binding motif protein 14 1.309 0.021
NM_009125 ataxin 2 1.304 0.013
NM_001081293 regulation of nuclear pre-mRNA domain containing 2 1.293 0.045
NM_025331 guanine nucleotide binding protein (G protein), gamma 11 1.282 0.050
NP_598452 poly-U binding splicing factor 60 1.281 0.046
NM_172666 alkylglycerone phosphate synthase 1.275 0.007
NM_008364 interleukin 1 receptor accessory protein 1.274 0.009
NM_134080 filamin, beta 1.268 0.008
NM_001081267 remodeling and spacing factor 1 1.268 0.001
NM_024436 RAB22A, member RAS oncogene family 1.265 0.008
NM_178216 histone cluster 2, H3b; histone cluster 1, H3f; histone cluster 1, H3e; histone cluster 2, H3c1; histone cluster 1, H3d; histone cluster 1, H3c; histone cluster 1, H3b; histone cluster 2, H3c2; histone cluster 2, H2aa1; histone cluster 2, H2aa2
1.254 0.030
NM_029157 splicing factor 3a, subunit 3 1.254 0.005
NM_008882 plexin A2 1.253 0.001
NM_026171 nuclear VCP-like 1.247 0.001
NM_010726 phytanoyl-CoA hydroxylase 1.241 0.004
NM_028264 transmembrane protein 55A 1.241 0.036
NM_153567 SLAIN motif family, member 2 1.237 0.044
NM_016888 UDP-GlcNAc:betaGal beta-1,3-N-acetylglucosaminyltransferase 2 1.232 0.045
NM_011605 thymopoietin 1.229 0.041
NM_011076 ATP-binding cassette, sub-family B (MDR/TAP), member 1A 1.228 0.026
NM_013902 FK506 binding protein 3 1.220 0.004
NM_001081164 OTU domain containing 4 1.216 0.014
NP_963910 GNAS (guanine nucleotide binding protein, alpha stimulating) complex locus
1.215 0.041
NM_001163300 scaffold attachment factor B 1.215 0.042
NP_001258827 Peroxisomal acyl-coenzyme A oxidase 1 1.208 0.011
NM_020027 HLA-B associated transcript 2 1.206 0.023
NM_133947 nuclear mitotic apparatus protein 1 1.202 0.015
NM_009338 acetyl-Coenzyme A acetyltransferase 2 1.202 0.003
NM_008477 kinectin 1 1.200 0.025
NM_027901 general transcription factor IIIC, polypeptide 2, beta; Mpv17 transgene, kidney disease mutant
-1.206 0.042
NM_008302 heat shock protein 90 alpha (cytosolic), class B member 1 -1.217 0.050
NM_010239 ferritin heavy chain 1 -1.219 0.007
NM_133348 acyl-CoA thioesterase 7 -1.223 0.016
NM_001025947 dynamin 1-like -1.224 0.014
NM_175438 aldehyde dehydrogenase 4 family, member A1 -1.224 0.036
NM_031843 dipeptidylpeptidase 7 -1.229 0.005
NM_025343 required for meiotic nuclear division 1 homolog (S. cerevisiae); predicted gene 5512
-1.229 0.021
NM_025845 PRP38 pre-mRNA processing factor 38 (yeast) domain containing B; similar to PRP38 pre-mRNA processing factor 38 (yeast) domain
-1.231 0.030

Appendix A
- 23 -
containing B
NM_019770 transmembrane emp24 domain trafficking protein 2; predicted gene 10698; predicted gene 7318
-1.234 0.031
NM_133794 glutaminyl-tRNA synthetase -1.235 0.026
NM_008442 kinesin family member 2A -1.237 0.049
NM_172674 PHD finger protein 20 -1.238 0.045
NM_026510 FtsJ homolog 2 (E. coli) -1.242 0.048
NM_001033293 UDP-N-acteylglucosamine pyrophosphorylase 1-like 1 -1.253 0.026
NM_001081056 exportin, tRNA (nuclear export receptor for tRNAs) -1.261 0.010
NM_009288 serine/threonine kinase 10 -1.263 0.029
NM_026474 SGT1, suppressor of G2 allele of SKP1 (S. cerevisiae) -1.263 0.041
NM_008136 guanine nucleotide binding protein-like 1 -1.263 0.018
NM_026202 coiled-coil domain containing 50 -1.272 0.049
NM_028782 lon peptidase 1, mitochondrial -1.282 0.025
NM_009373 transglutaminase 2, C polypeptide -1.282 0.004
NM_001160319 ubiquitin protein ligase E3 component n-recognin 4 -1.284 0.046
NM_145506 erythrocyte protein band 4.1-like 5 -1.291 0.015
NM_144897 apolipoprotein A-I binding protein -1.295 0.024
NM_145955 RIKEN cDNA 1110007A13 gene -1.296 0.036
NP_001156418 pyruvate carboxylase -1.305 0.034
NM_175372 retinol dehydrogenase 13 (all-trans and 9-cis) -1.310 0.006
NM_001171582 methionine-tRNA synthetase -1.316 0.013
NM_144818 non-SMC condensin I complex, subunit H -1.316 0.045
NM_010562 integrin linked kinase; predicted gene 6263 -1.316 0.030
NM_025691 signal recognition particle 72 -1.318 0.012
NM_029635 COMM domain containing 9 -1.323 0.033
NM_013492 similar to clusterin; clusterin -1.330 0.008
NM_013691 thrombospondin 3 -1.330 0.014
NM_029023 serine carboxypeptidase 1 -1.334 0.042
NM_013818 GTP binding protein 1 -1.334 0.032
NM_025515 similar to Coiled-coil domain containing 90B; coiled-coil domain containing 90B
-1.341 0.040
NM_008012 aldo-keto reductase family 1, member B8 -1.347 0.013
NM_028762 RNA binding motif protein 19 -1.349 0.007
NM_001164671 predicted gene 15542; predicted gene 7816; similar to DnaJ-like protein; predicted gene 6335; DnaJ (Hsp40) homolog, subfamily A, member 1, pseudogene; DnaJ (Hsp40) homolog, subfamily A, member 1
-1.350 0.003
NM_025544 mitochondrial ribosomal protein S15 -1.357 0.002
NM_018851 hypothetical protein LOC100045969; SAM domain and HD domain, 1
-1.358 0.010
NM_019564 HtrA serine peptidase 1 -1.359 0.011
NM_011486 similar to Stat3B; signal transducer and activator of transcription 3 -1.359 0.048
NM_010421 hexosaminidase A -1.360 0.036
NM_008948 proteasome (prosome, macropain) 26S subunit, ATPase 3 -1.364 0.017
NM_198105 family with sequence similarity 120, member C -1.365 0.024
NM_145507 aspartyl-tRNA synthetase -1.368 0.047
NM_028198 exportin 5 -1.369 0.011
NM_007783 c-src tyrosine kinase -1.371 0.036
NM_030238 dynein cytoplasmic 1 heavy chain 1 -1.379 0.009
NM_011414 secretory leukocyte peptidase inhibitor -1.384 0.039
NM_020520 solute carrier family 25 (mitochondrial carnitine/acylcarnitine translocase), member 20
-1.385 0.047
NM_009190 similar to vacuolar protein sorting 4b; vacuolar protein sorting 4b (yeast)
-1.390 0.037

Appendix A
- 24 -
NM_008520 latent transforming growth factor beta binding protein 3 -1.394 0.010
NM_010546 inhibitor of kappaB kinase beta -1.394 0.012
NM_009471 uridine monophosphate synthetase -1.395 0.011
NM_001081066 DENN/MADD domain containing 3 -1.396 0.025
NM_024267 importin 4 -1.396 0.001
NM_024258 ubiquitin specific peptidase 16 -1.398 0.038
NM_027357 proteasome (prosome, macropain) 26S subunit, non-ATPase, 1 -1.400 0.012
NM_023525 carbamoyl-phosphate synthetase 2, aspartate transcarbamylase, and dihydroorotase
-1.404 0.016
NM_178719 Smith-Magenis syndrome chromosome region, candidate 7-like (human)
-1.404 0.026
NM_172990 pantothenate kinase 4 -1.405 0.035
NM_021295 LanC (bacterial lantibiotic synthetase component C)-like 1 -1.408 0.010
NM_024194 leucine rich repeat containing 40 -1.412 0.026
NP_001095925 amyloid beta (A4) precursor-like protein 2 -1.413 0.025
NP_001157185 predicted gene 9755; Tu translation elongation factor, mitochondrial
-1.421 0.005
NM_010106 predicted gene 5869; predicted gene 7161; predicted gene 7105; predicted gene 5822; similar to eukaryotic translation elongation factor 1 alpha 1; predicted gene 6192; predicted gene 6392; predicted gene 6767; predicted gene 6170; predicted gene 6548; pre
-1.423 0.001
NM_029293 phosphohistidine phosphatase 1 -1.433 0.048
NM_001038589 ubiquitin specific peptidase 14 -1.436 0.009
NM_178070 vacuolar protein sorting 33B (yeast) -1.441 0.006
NM_021299 adenylate kinase 3 -1.443 0.004
NM_019812 sirtuin 1 (silent mating type information regulation 2, homolog) 1 (S. cerevisiae)
-1.444 0.009
NM_007643 CD36 antigen -1.445 0.030
NM_152801 Rac/Cdc42 guanine nucleotide exchange factor (GEF) 6 -1.459 0.038
NM_177727 LSM14 homolog B (SCD6, S. cerevisiae) -1.462 0.008
NM_009981 phosphate cytidylyltransferase 1, choline, alpha isoform -1.463 0.031
NM_011723 xanthine dehydrogenase -1.467 0.012
NM_016748 cytidine 5'-triphosphate synthase -1.480 0.033
NM_008826 phosphofructokinase, liver, B-type -1.480 0.031
NM_172404 cysteine conjugate-beta lyase 1 -1.483 0.026
NM_144915 diacylglycerol lipase, beta -1.492 0.001
NM_001163126 component of oligomeric golgi complex 5 -1.494 0.024
NM_178337 tubulin-specific chaperone E -1.500 0.000
NM_145578 ubiquitin-conjugating enzyme E2M (UBC12 homolog, yeast) -1.501 0.020
NM_080708 predicted gene 4521; BMP2 inducible kinase -1.504 0.009
NM_025921 chromatin modifying protein 1B; RIKEN cDNA 2610002M06 gene -1.505 0.048
NM_144923 biliverdin reductase B (flavin reductase (NADPH)) -1.512 0.016
NM_026276 aminoadipate-semialdehyde dehydrogenase-phosphopantetheinyl transferase; hypothetical protein LOC100044211
-1.515 0.016
NP_808340 transmembrane protein 201 -1.516 0.004
NM_134079 adenosine kinase -1.518 0.039
NM_026079 inhibitor of kappa light polypeptide enhancer in B-cells, kinase complex-associated protein
-1.522 0.007
NM_013792 alpha-N-acetylglucosaminidase (Sanfilippo disease IIIB) -1.524 0.036
NM_027815 RIKEN cDNA 9030624J02 gene -1.541 0.010
NM_177215 oculocerebrorenal syndrome of Lowe -1.546 0.030
NM_025647 cytidine monophosphate (UMP-CMP) kinase 1; predicted gene 5867
-1.547 0.007
NM_001080748 general transcription factor II I; similar to transcription factor TFII- -1.560 0.005

Appendix A
- 25 -
I-gamma
NM_023402 Myosin regulatory light chain 12B -1.563 0.030
NM_025794 electron transferring flavoprotein, dehydrogenase -1.575 0.004
NM_178376 Ras-related GTP binding A -1.576 0.032
NM_016906 Sec61 alpha 1 subunit (S. cerevisiae) -1.582 0.028
NM_053181 pyridoxal-dependent decarboxylase domain containing 1 -1.586 0.000
NM_013528 glutamine fructose-6-phosphate transaminase 1 -1.590 0.003
NM_173443 valosin containing protein (p97)/p47 complex interacting protein 1 -1.591 0.047
NM_009658 aldo-keto reductase family 1, member B3 (aldose reductase) -1.592 0.001
NM_009755 bone morphogenetic protein 1 -1.601 0.009
NM_011340 serine (or cysteine) peptidase inhibitor, clade F, member 1 -1.606 0.009
NM_025918 coiled-coil domain containing 43 -1.617 0.000
NM_008826 phosphofructokinase, liver, B-type -1.624 0.025
NM_029746 component of oligomeric golgi complex 2 -1.637 0.045
NM_001042501 RIKEN cDNA 5830415L20 gene -1.637 0.001
NM_134138 proteasome (prosome, macropain) assembly chaperone 2; similar to Clast3 protein
-1.640 0.012
NM_010049 dihydrofolate reductase -1.648 0.014
NM_011348 sema domain, immunoglobulin domain (Ig), short basic domain, secreted, (semaphorin) 3E; hypothetical protein LOC100044162
-1.650 0.008
NM_008325 iduronidase, alpha-L- -1.653 0.039
NM_144804 DEP domain containing 7 -1.655 0.044
NM_144878 flavin containing monooxygenase 4 -1.656 0.018
NM_029005 mixed lineage kinase domain-like -1.663 0.026
NM_011889 septin 3 -1.666 0.031
NM_008451 kinesin light chain 2 -1.681 0.022
NM_001004156 pleckstrin homology domain containing, family G (with RhoGef domain) member 5
-1.687 0.015
NM_021420 serine/threonine kinase 4 -1.690 0.004
NM_030201 heat shock protein 70 family, member 13 -1.695 0.015
NM_175465 SEC14 and spectrin domains 1; predicted gene 9165 -1.703 0.002
NM_001013380 dynein, cytoplasmic 1 light intermediate chain 2 -1.710 0.013
NP_001136216 RIKEN cDNA 2610110G12 gene -1.712 0.011
NM_001127346 NADH dehydrogenase (ubiquinone) 1 alpha subcomplex, assembly factor 2
-1.714 0.010
NM_008776 platelet-activating factor acetylhydrolase, isoform 1b, subunit 3 -1.718 0.006
NM_175180 WD repeat domain 44 -1.723 0.003
NM_001033318 component of oligomeric golgi complex 7 -1.724 0.005
NM_011577 transforming growth factor, beta 1 -1.808 0.021
Table 1-C: Differentially regulated CHO DP-12 proteins determined in samples corresponding
to culture using increased bioprocess media dissolved oxygen content of 110%.
RefSeq Annotation
Description Fold Change
P-value
NM_025364 predicted gene 6563; SAP domain containing ribonucleoprotein 2.000 0.009
NM_011547 transcription factor AP-2, alpha 1.863 0.018
NM_007647 ectonucleoside triphosphate diphosphohydrolase 5 1.754 0.033
NM_021510 heterogeneous nuclear ribonucleoprotein H1 1.741 0.001
NM_144869 cDNA sequence BC021614 1.739 0.037
NP_001103618 mannoside acetylglucosaminyltransferase 1 1.732 0.004
NM_153516 BCL2-like 13 (apoptosis facilitator) 1.732 0.031
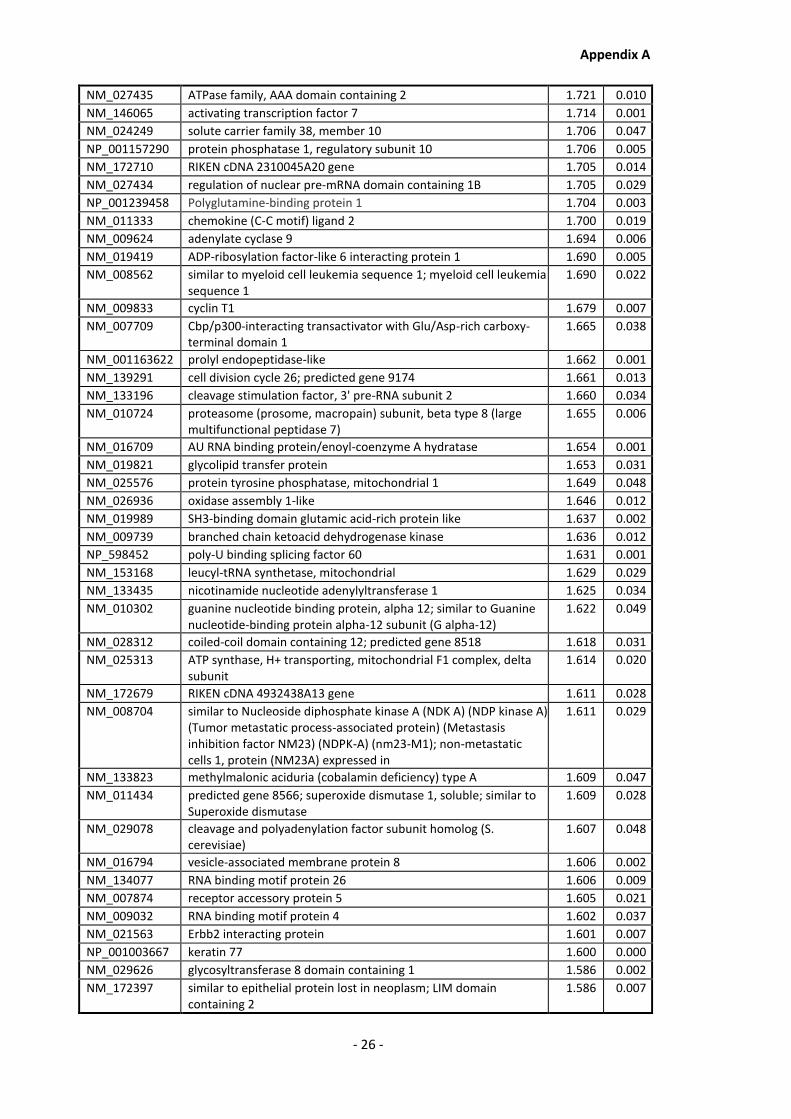
Appendix A
- 26 -
NM_027435 ATPase family, AAA domain containing 2 1.721 0.010
NM_146065 activating transcription factor 7 1.714 0.001
NM_024249 solute carrier family 38, member 10 1.706 0.047
NP_001157290 protein phosphatase 1, regulatory subunit 10 1.706 0.005
NM_172710 RIKEN cDNA 2310045A20 gene 1.705 0.014
NM_027434 regulation of nuclear pre-mRNA domain containing 1B 1.705 0.029
NP_001239458 Polyglutamine-binding protein 1 1.704 0.003
NM_011333 chemokine (C-C motif) ligand 2 1.700 0.019
NM_009624 adenylate cyclase 9 1.694 0.006
NM_019419 ADP-ribosylation factor-like 6 interacting protein 1 1.690 0.005
NM_008562 similar to myeloid cell leukemia sequence 1; myeloid cell leukemia sequence 1
1.690 0.022
NM_009833 cyclin T1 1.679 0.007
NM_007709 Cbp/p300-interacting transactivator with Glu/Asp-rich carboxy-terminal domain 1
1.665 0.038
NM_001163622 prolyl endopeptidase-like 1.662 0.001
NM_139291 cell division cycle 26; predicted gene 9174 1.661 0.013
NM_133196 cleavage stimulation factor, 3' pre-RNA subunit 2 1.660 0.034
NM_010724 proteasome (prosome, macropain) subunit, beta type 8 (large multifunctional peptidase 7)
1.655 0.006
NM_016709 AU RNA binding protein/enoyl-coenzyme A hydratase 1.654 0.001
NM_019821 glycolipid transfer protein 1.653 0.031
NM_025576 protein tyrosine phosphatase, mitochondrial 1 1.649 0.048
NM_026936 oxidase assembly 1-like 1.646 0.012
NM_019989 SH3-binding domain glutamic acid-rich protein like 1.637 0.002
NM_009739 branched chain ketoacid dehydrogenase kinase 1.636 0.012
NP_598452 poly-U binding splicing factor 60 1.631 0.001
NM_153168 leucyl-tRNA synthetase, mitochondrial 1.629 0.029
NM_133435 nicotinamide nucleotide adenylyltransferase 1 1.625 0.034
NM_010302 guanine nucleotide binding protein, alpha 12; similar to Guanine nucleotide-binding protein alpha-12 subunit (G alpha-12)
1.622 0.049
NM_028312 coiled-coil domain containing 12; predicted gene 8518 1.618 0.031
NM_025313 ATP synthase, H+ transporting, mitochondrial F1 complex, delta subunit
1.614 0.020
NM_172679 RIKEN cDNA 4932438A13 gene 1.611 0.028
NM_008704 similar to Nucleoside diphosphate kinase A (NDK A) (NDP kinase A) (Tumor metastatic process-associated protein) (Metastasis inhibition factor NM23) (NDPK-A) (nm23-M1); non-metastatic cells 1, protein (NM23A) expressed in
1.611 0.029
NM_133823 methylmalonic aciduria (cobalamin deficiency) type A 1.609 0.047
NM_011434 predicted gene 8566; superoxide dismutase 1, soluble; similar to Superoxide dismutase
1.609 0.028
NM_029078 cleavage and polyadenylation factor subunit homolog (S. cerevisiae)
1.607 0.048
NM_016794 vesicle-associated membrane protein 8 1.606 0.002
NM_134077 RNA binding motif protein 26 1.606 0.009
NM_007874 receptor accessory protein 5 1.605 0.021
NM_009032 RNA binding motif protein 4 1.602 0.037
NM_021563 Erbb2 interacting protein 1.601 0.007
NP_001003667 keratin 77 1.600 0.000
NM_029626 glycosyltransferase 8 domain containing 1 1.586 0.002
NM_172397 similar to epithelial protein lost in neoplasm; LIM domain containing 2
1.586 0.007

Appendix A
- 27 -
NM_008155 glucose phosphate isomerase 1 1.581 0.023
NM_134048 Casitas B-lineage lymphoma-like 1 1.576 0.032
NM_028767 forkhead box P4 1.574 0.031
NM_030561 cDNA sequence BC004004 1.574 0.026
NM_080556 transmembrane 9 superfamily member 2 1.574 0.005
NM_030004 crystallin, lambda 1 1.572 0.019
NM_133998 RIKEN cDNA 1810008A18 gene 1.569 0.015
NM_181407 malic enzyme 3, NADP(+)-dependent, mitochondrial 1.568 0.010
NM_009031 retinoblastoma binding protein 7; predicted gene 6382 1.563 0.045
NM_010176 fumarylacetoacetate hydrolase 1.563 0.041
NM_028754 RIKEN cDNA 0610037L13 gene 1.561 0.018
NM_175324 nephronophthisis 3 (adolescent); acyl-Coenzyme A dehydrogenase family, member 11
1.555 0.003
NM_153117 RIKEN cDNA 9530068E07 gene 1.554 0.033
NM_009883 CCAAT/enhancer binding protein (C/EBP), beta 1.552 0.040
NM_023041 peroxisomal biogenesis factor 19 1.549 0.035
NM_011528 transaldolase 1 1.548 0.050
NM_134063 cDNA sequence BC016423 1.546 0.013
NM_145553 predicted gene 7527; family with sequence similarity 76, member A
1.535 0.021
NM_027430 brain protein 44; similar to brain protein 44; predicted gene 3982 1.533 0.027
NM_023051 calsyntenin 1 1.533 0.040
NM_019791 melanoma antigen, family D, 1 1.525 0.021
NM_008881 plexin A1 1.524 0.005
NM_018858 phosphatidylethanolamine binding protein 1 1.523 0.002
NM_011933 2-4-dienoyl-Coenzyme A reductase 2, peroxisomal 1.523 0.013
NM_001024205 nuclear fragile X mental retardation protein interacting protein 2 1.521 0.002
NM_009242 secreted acidic cysteine rich glycoprotein; similar to Secreted acidic cysteine rich glycoprotein
1.521 0.033
NM_020618 similar to SWI/SNF related, matrix associated, actin dependent regulator of chromatin, subfamily e, member 1; predicted gene 1815; predicted gene 8494; SWI/SNF related, matrix associated, actin dependent regulator of chromatin, subfamily e, member 1; pred
1.521 0.009
NM_029169 RNA binding motif protein 6 1.520 0.002
NM_023733 carnitine O-octanoyltransferase 1.519 0.022
NM_172472 transcription factor E3 1.517 0.009
NM_009074 macrophage stimulating 1 receptor (c-met-related tyrosine kinase) 1.517 0.026
NM_001171052 metastasis associated 3 1.516 0.035
NM_007383 acyl-Coenzyme A dehydrogenase, short chain 1.516 0.021
NM_182939 similar to protein phosphatase 4, regulatory subunit 2; similar to Protein phosphatase 4, regulatory subunit 2; protein phosphatase 4, regulatory subunit 2
1.514 0.043
NM_009270 squalene epoxidase 1.514 0.008
NM_025952 magnesium transporter 1 1.513 0.002
NM_026068 mediator of RNA polymerase II transcription, subunit 31 homolog (yeast)
1.507 0.004
NM_011121 polo-like kinase 1 (Drosophila) 1.504 0.025
NM_008131 predicted gene 4949; glutamate-ammonia ligase (glutamine synthetase)
1.503 0.025
XP_619909 predicted gene 5449; small nuclear ribonucleoprotein D2; predicted gene 5848; predicted gene 10120
1.497 0.033
NM_001001932 early endosome antigen 1 1.497 0.022
NM_053014 1-acylglycerol-3-phosphate O-acyltransferase 3 1.496 0.035

Appendix A
- 28 -
NM_025797 cytochrome b-5 1.490 0.036
NM_027219 CDC42 effector protein (Rho GTPase binding) 1 1.488 0.037
NM_010191 predicted gene 6781; farnesyl diphosphate farnesyl transferase 1 1.488 0.011
NM_026420 polyadenylate-binding protein-interacting protein 2 1.485 0.040
NM_030732 transducin (beta)-like 1X-linked receptor 1 1.485 0.023
NM_025822 arginine/serine-rich coiled-coil 1 1.485 0.007
NM_078478 growth hormone inducible transmembrane protein 1.482 0.019
NM_010368 glucuronidase, beta 1.481 0.012
NP_001135450 TPX2, microtubule-associated protein homolog (Xenopus laevis) 1.474 0.026
NP_001164215 C-terminal binding protein 2 1.473 0.037
NM_028074 DEAD (Asp-Glu-Ala-Asp) box polypeptide 42 1.472 0.006
NM_013556 hypoxanthine guanine phosphoribosyl transferase 1 1.469 0.011
NM_024274 phenylalanine-tRNA synthetase 2 (mitochondrial) 1.469 0.001
NM_001098225 a disintegrin and metallopeptidase domain 22 1.469 0.010
NM_198937 hematological and neurological expressed 1-like 1.462 0.022
NM_001033534 layilin 1.460 0.034
NM_025682 paraspeckle protein 1 1.456 0.027
NM_144888 mitochondrial antiviral signaling protein 1.455 0.049
NM_009009 RAD21 homolog (S. pombe) 1.454 0.021
NM_010358 similar to Glutathione S-transferase Mu 1 (GST class-mu 1) (Glutathione S-transferase GT8.7) (pmGT10) (GST 1-1); predicted gene 5562; glutathione S-transferase, mu 1
1.446 0.006
NM_138758 trimethyllysine hydroxylase, epsilon 1.445 0.015
NM_177643 Zinc finger protein 281 1.442 0.002
NM_172205 suprabasin 1.441 0.026
NM_009832 cyclin K; similar to cyclin K 1.436 0.034
NM_008717 zinc finger, matrin-like 1.436 0.010
NM_008293 hydroxy-delta-5-steroid dehydrogenase, 3 beta- and steroid delta-isomerase 1
1.430 0.020
NM_013502 similar to CtBP1 protein; C-terminal binding protein 1 1.428 0.006
NM_019693 HLA-B-associated transcript 1A 1.426 0.030
NM_015735 damage specific DNA binding protein 1 1.425 0.002
NM_010070 docking protein 1 1.416 0.015
NM_021521 mediator of RNA polymerase II transcription, subunit 12 homolog (yeast)
1.411 0.030
NM_009033 RNA binding motif protein, X chromosome retrogene 1.408 0.021
NM_013534 leprecan-like 2 1.406 0.001
NM_009503 similar to Transitional endoplasmic reticulum ATPase (TER ATPase) (15S Mg(2+)-ATPase p97 subunit) (Valosin-containing protein) (VCP); valosin containing protein
1.403 0.003
NM_020520 solute carrier family 25 (mitochondrial carnitine/acylcarnitine translocase), member 20
1.402 0.038
NM_026170 endoplasmic reticulum-golgi intermediate compartment (ERGIC) 1 1.402 0.011
NM_001080981 DEAD (Asp-Glu-Ala-Asp) box polypeptide 23 1.400 0.035
NM_026512 biphenyl hydrolase-like (serine hydrolase, breast epithelial mucin-associated antigen)
1.396 0.016
NM_027373 actin filament associated protein 1 1.394 0.016
NM_025573 splicing factor, arginine/serine rich 9 1.391 0.046
NM_153412 pleckstrin homology-like domain, family B, member 2 1.387 0.027
NM_015816 LSM4 homolog, U6 small nuclear RNA associated (S. cerevisiae) 1.385 0.029
NM_007466 apoptosis inhibitor 5 1.383 0.039
NM_007749 similar to cytochrome c oxidase, subunit VIIc; predicted gene 3386; cytochrome c oxidase, subunit VIIc
1.377 0.008

Appendix A
- 29 -
NM_001081422 biorientation of chromosomes in cell division 1-like 1.375 0.002
NM_009409 topoisomerase (DNA) II beta 1.374 0.041
NM_026934 predicted gene 5909; zinc finger CCCH-type containing 15 1.373 0.004
NM_026141 peptidylprolyl isomerase (cyclophilin)-like 4 1.373 0.005
NM_010729 lysyl oxidase-like 1 1.361 0.042
NM_133803 dipeptidylpeptidase 3 1.360 0.032
NM_009774 budding uninhibited by benzimidazoles 3 homolog (S. cerevisiae) 1.358 0.034
NM_011327 sterol carrier protein 2, liver 1.358 0.017
NM_024200 mitofusin 1 1.357 0.015
NM_028793 acyl-Coenzyme A binding domain containing 5 1.357 0.050
NM_018871 tyrosine 3-monooxygenase/tryptophan 5-monooxygenase activation protein, gamma polypeptide
1.349 0.014
NM_011247 retinoblastoma binding protein 6 1.349 0.036
NM_001163570 exosome component 8 1.344 0.043
NM_011378 transcriptional regulator, SIN3A (yeast) 1.342 0.001
NM_023603 splicing factor proline/glutamine rich (polypyrimidine tract binding protein associated); similar to PTB-associated splicing factor
1.341 0.007
NM_146131 similar to Pre-B-cell leukemia transcription factor interacting protein 1; pre-B-cell leukemia transcription factor interacting protein 1
1.341 0.025
NM_001044384 tissue inhibitor of metalloproteinase 1 1.341 0.008
NM_139297 UDP-glucose pyrophosphorylase 2 1.338 0.007
NM_027375 GRIP and coiled-coil domain containing 2 1.336 0.005
NM_153552 THO complex 1 1.335 0.046
NM_008549 mannosidase 2, alpha 1 1.332 0.005
NM_007690 chromodomain helicase DNA binding protein 1 1.332 0.007
NM_001081251 polybromo 1 1.330 0.049
NM_175094 pyruvate dehydrogenase complex, component X; similar to pyruvate dehydrogenase complex, component X
1.326 0.001
NM_008402 integrin alpha V 1.325 0.008
NM_027226 forty-two-three domain containing 1 1.325 0.010
NM_011500 striatin, calmodulin binding protein 1.319 0.042
NM_010497 isocitrate dehydrogenase 1 (NADP+), soluble 1.315 0.013
NM_172266 lysophosphatidylglycerol acyltransferase 1 1.313 0.036
NM_011767 zinc finger RNA binding protein 1.310 0.007
NM_178592 HLA-B associated transcript 5 1.305 0.023
NM_001080926 low density lipoprotein receptor-related protein 8, apolipoprotein e receptor
1.305 0.034
NM_011479 serine palmitoyltransferase, long chain base subunit 2 1.304 0.045
NM_001077403 neuropilin 2 1.303 0.017
NM_001013389 MRS2 magnesium homeostasis factor homolog (S. cerevisiae) 1.302 0.007
NM_008305 perlecan (heparan sulfate proteoglycan 2) 1.302 0.007
NP_035681 upstream binding transcription factor, RNA polymerase I 1.297 0.047
NM_133947 nuclear mitotic apparatus protein 1 1.291 0.004
NM_016666 aryl-hydrocarbon receptor-interacting protein 1.290 0.020
NM_007981 acyl-CoA synthetase long-chain family member 1 1.287 0.013
NM_144831 DEAH (Asp-Glu-Ala-His) box polypeptide 8 1.284 0.014
NP_001185933 Golgin subfamily A member 5 1.281 0.025
NM_133957 nuclear factor of activated T-cells 5 1.280 0.024
NM_021507 sulfide quinone reductase-like (yeast) 1.276 0.023
NM_172965 Sin3A associated protein 1.276 0.023
NM_007840 DEAD (Asp-Glu-Ala-Asp) box polypeptide 5; predicted gene 12183 1.266 0.035
NM_001008422 SR-related CTD-associated factor 1 1.261 0.033

Appendix A
- 30 -
NM_001163300 scaffold attachment factor B 1.257 0.018
NM_021549 polynucleotide kinase 3'- phosphatase 1.256 0.016
NM_011078 PHD finger protein 2 1.256 0.035
NM_144846 family with sequence similarity 49, member B 1.256 0.005
NM_011623 topoisomerase (DNA) II alpha 1.256 0.002
NM_027213 mediator of RNA polymerase II transcription, subunit 6 homolog (yeast)
1.255 0.010
NM_010357 glutathione S-transferase, alpha 4 1.255 0.020
NM_025794 electron transferring flavoprotein, dehydrogenase 1.253 0.020
NM_019869 RNA binding motif protein 14 1.253 0.021
NM_012042 cullin 1 1.253 0.011
NM_138747 NOP2 nucleolar protein homolog (yeast) 1.249 0.043
NM_026644 1-acylglycerol-3-phosphate O-acyltransferase 4 (lysophosphatidic acid acyltransferase, delta)
1.245 0.047
NM_198249 RIKEN cDNA E130112L23 gene 1.243 0.004
NM_008765 origin recognition complex, subunit 2-like (S. cerevisiae) 1.238 0.029
NM_025988 acyl-Coenzyme A binding domain containing 4 1.229 0.040
NM_145991 cell division cycle 73, Paf1/RNA polymerase II complex component, homolog (S. cerevisiae)
1.229 0.035
NM_001166406 kinesin family member 20A 1.227 0.049
NM_011716 Wolfram syndrome 1 homolog (human) 1.226 0.002
NM_021305 Sec61, alpha subunit 2 (S. cerevisiae) 1.223 0.006
NM_010561 interleukin enhancer binding factor 3 1.222 0.006
NM_009011 RAD23b homolog (S. cerevisiae) 1.213 0.039
NM_008612 menage a trois 1 1.213 0.006
NM_009388 transketolase 1.205 0.031
NM_013830 PRP4 pre-mRNA processing factor 4 homolog B (yeast) 1.203 0.034
NM_010515 insulin-like growth factor 2 receptor -1.201 0.031
NM_019816 apoptosis antagonizing transcription factor -1.204 0.024
NM_013559 heat shock 105kDa/110kDa protein 1 -1.207 0.043
NM_013492 similar to clusterin; clusterin -1.209 0.011
NM_008927 mitogen-activated protein kinase kinase 1 -1.211 0.035
NM_001033293 UDP-N-acteylglucosamine pyrophosphorylase 1-like 1 -1.217 0.046
NM_025959 proteasome (prosome, macropain) 26S subunit, ATPase, 6 -1.218 0.029
NM_012010 eukaryotic translation initiation factor 2, subunit 3, structural gene X-linked; similar to translation initiation factor eIF-2 gamma subunit; predicted gene 2223
-1.219 0.042
NM_153125 SEC16 homolog A (S. cerevisiae) -1.220 0.026
NM_013647 predicted gene 8731; predicted gene 7504; similar to Rps16 protein; ribosomal protein S16
-1.221 0.039
NM_008872 plasminogen activator, tissue -1.224 0.041
NM_024261 RIKEN cDNA 1700052N19 gene -1.229 0.016
NM_023060 eukaryotic elongation factor, selenocysteine-tRNA-specific -1.232 0.005
NP_001070732 adaptor protein complex AP-2, alpha 1 subunit -1.233 0.034
NM_024242 RIO kinase 1 (yeast) -1.234 0.029
NM_010615 kinesin family member 11 -1.235 0.002
NM_021514 phosphofructokinase, muscle -1.258 0.018
NM_025691 signal recognition particle 72 -1.264 0.025
NM_023247 NADH dehydrogenase (ubiquinone) 1 alpha subcomplex, assembly factor 3
-1.267 0.036
NM_027896 Coenzyme A synthase -1.272 0.008
NM_172381 expressed sequence AI314180 -1.281 0.015
NM_008788 procollagen C-endopeptidase enhancer protein -1.283 0.011
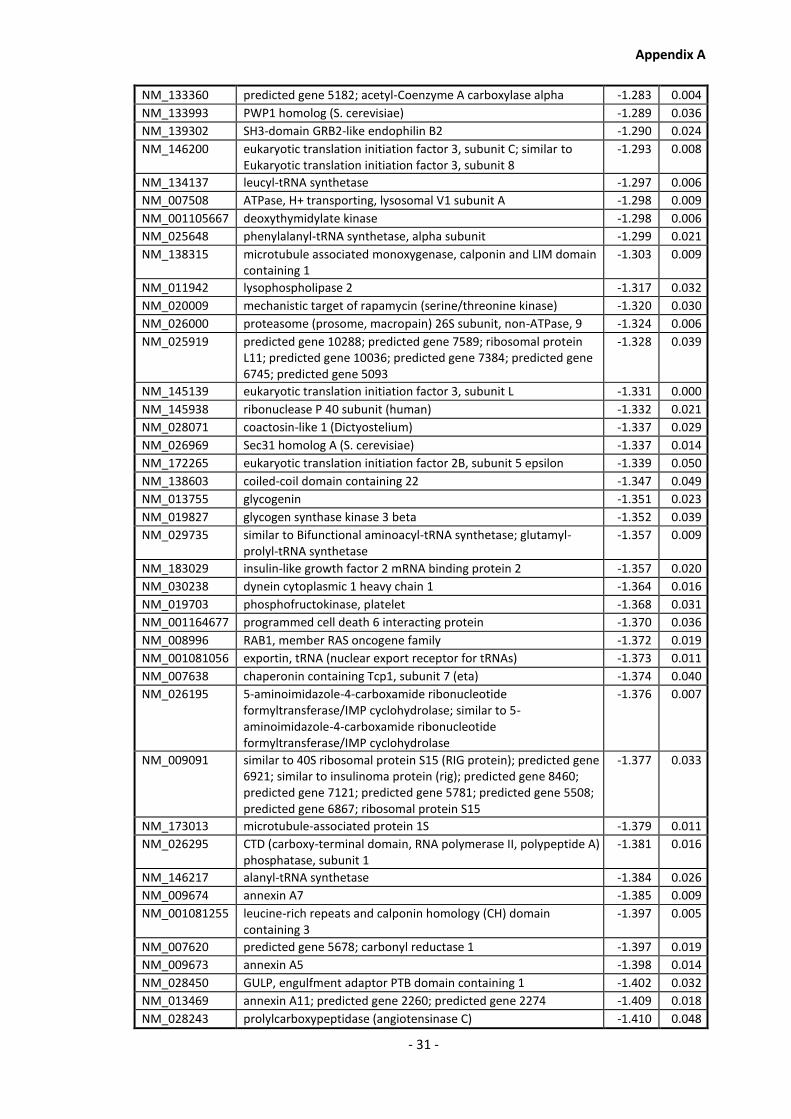
Appendix A
- 31 -
NM_133360 predicted gene 5182; acetyl-Coenzyme A carboxylase alpha -1.283 0.004
NM_133993 PWP1 homolog (S. cerevisiae) -1.289 0.036
NM_139302 SH3-domain GRB2-like endophilin B2 -1.290 0.024
NM_146200 eukaryotic translation initiation factor 3, subunit C; similar to Eukaryotic translation initiation factor 3, subunit 8
-1.293 0.008
NM_134137 leucyl-tRNA synthetase -1.297 0.006
NM_007508 ATPase, H+ transporting, lysosomal V1 subunit A -1.298 0.009
NM_001105667 deoxythymidylate kinase -1.298 0.006
NM_025648 phenylalanyl-tRNA synthetase, alpha subunit -1.299 0.021
NM_138315 microtubule associated monoxygenase, calponin and LIM domain containing 1
-1.303 0.009
NM_011942 lysophospholipase 2 -1.317 0.032
NM_020009 mechanistic target of rapamycin (serine/threonine kinase) -1.320 0.030
NM_026000 proteasome (prosome, macropain) 26S subunit, non-ATPase, 9 -1.324 0.006
NM_025919 predicted gene 10288; predicted gene 7589; ribosomal protein L11; predicted gene 10036; predicted gene 7384; predicted gene 6745; predicted gene 5093
-1.328 0.039
NM_145139 eukaryotic translation initiation factor 3, subunit L -1.331 0.000
NM_145938 ribonuclease P 40 subunit (human) -1.332 0.021
NM_028071 coactosin-like 1 (Dictyostelium) -1.337 0.029
NM_026969 Sec31 homolog A (S. cerevisiae) -1.337 0.014
NM_172265 eukaryotic translation initiation factor 2B, subunit 5 epsilon -1.339 0.050
NM_138603 coiled-coil domain containing 22 -1.347 0.049
NM_013755 glycogenin -1.351 0.023
NM_019827 glycogen synthase kinase 3 beta -1.352 0.039
NM_029735 similar to Bifunctional aminoacyl-tRNA synthetase; glutamyl-prolyl-tRNA synthetase
-1.357 0.009
NM_183029 insulin-like growth factor 2 mRNA binding protein 2 -1.357 0.020
NM_030238 dynein cytoplasmic 1 heavy chain 1 -1.364 0.016
NM_019703 phosphofructokinase, platelet -1.368 0.031
NM_001164677 programmed cell death 6 interacting protein -1.370 0.036
NM_008996 RAB1, member RAS oncogene family -1.372 0.019
NM_001081056 exportin, tRNA (nuclear export receptor for tRNAs) -1.373 0.011
NM_007638 chaperonin containing Tcp1, subunit 7 (eta) -1.374 0.040
NM_026195 5-aminoimidazole-4-carboxamide ribonucleotide formyltransferase/IMP cyclohydrolase; similar to 5-aminoimidazole-4-carboxamide ribonucleotide formyltransferase/IMP cyclohydrolase
-1.376 0.007
NM_009091 similar to 40S ribosomal protein S15 (RIG protein); predicted gene 6921; similar to insulinoma protein (rig); predicted gene 8460; predicted gene 7121; predicted gene 5781; predicted gene 5508; predicted gene 6867; ribosomal protein S15
-1.377 0.033
NM_173013 microtubule-associated protein 1S -1.379 0.011
NM_026295 CTD (carboxy-terminal domain, RNA polymerase II, polypeptide A) phosphatase, subunit 1
-1.381 0.016
NM_146217 alanyl-tRNA synthetase -1.384 0.026
NM_009674 annexin A7 -1.385 0.009
NM_001081255 leucine-rich repeats and calponin homology (CH) domain containing 3
-1.397 0.005
NM_007620 predicted gene 5678; carbonyl reductase 1 -1.397 0.019
NM_009673 annexin A5 -1.398 0.014
NM_028450 GULP, engulfment adaptor PTB domain containing 1 -1.402 0.032
NM_013469 annexin A11; predicted gene 2260; predicted gene 2274 -1.409 0.018
NM_028243 prolylcarboxypeptidase (angiotensinase C) -1.410 0.048

Appendix A
- 32 -
NM_001081028 signal-induced proliferation-associated 1 like 3 -1.412 0.003
NM_001146023 Protein Fam98c -1.414 0.002
NM_011125 phospholipid transfer protein -1.416 0.034
NM_007509 ATPase, H+ transporting, lysosomal V1 subunit B2 -1.419 0.006
NM_008325 iduronidase, alpha-L- -1.420 0.031
NM_011400 solute carrier family 2 (facilitated glucose transporter), member 1 -1.420 0.008
NM_001045489 milk fat globule-EGF factor 8 protein -1.427 0.048
NM_013529 Glutamine--fructose-6-phosphate aminotransferase [isomerizing] 2
-1.428 0.010
NM_178644 OAF homolog (Drosophila) -1.434 0.016
NM_146229 dynein cytoplasmic 1 light intermediate chain 1 -1.435 0.030
NM_009190 similar to vacuolar protein sorting 4b; vacuolar protein sorting 4b -1.441 0.050
NM_009194 similar to solute carrier family 12, member 2; solute carrier family 12, member 2
-1.441 0.025
NM_011811 phenylalanyl-tRNA synthetase, beta subunit -1.443 0.006
NM_010546 inhibitor of kappaB kinase beta -1.445 0.006
NM_001163126 component of oligomeric golgi complex 5 -1.446 0.000
NM_024218 ribosomal protein L24; predicted gene 9385; predicted gene 7380 -1.447 0.027
NM_001033318 component of oligomeric golgi complex 7 -1.455 0.031
NM_172015 isoleucine-tRNA synthetase -1.456 0.006
NM_133786 structural maintenance of chromosomes 4 -1.457 0.010
NM_030678 glycogen synthase 1, muscle -1.457 0.014
NM_181072 myosin IE -1.462 0.019
NM_033074 threonyl-tRNA synthetase -1.463 0.028
NP_001107603 protein phosphatase 4, regulatory subunit 1 -1.463 0.028
NM_133972 armadillo repeat containing 6 -1.467 0.017
NM_013581 component of oligomeric golgi complex 1 -1.477 0.034
NM_028181 cell cycle progression 1 -1.478 0.027
NM_009296 predicted gene 3258; suppressor of Ty 4 homolog 1 (S. cerevisiae) -1.480 0.003
NM_011051 programmed cell death 6 -1.480 0.031
NM_029720 cysteine-rich with EGF-like domains 2 -1.483 0.048
NM_178599 COMM domain containing 8 -1.491 0.039
NM_008509 lipoprotein lipase; similar to Lipoprotein lipase precursor (LPL) -1.498 0.030
NM_178389 galactose-4-epimerase, UDP -1.501 0.047
NM_001038589 ubiquitin specific peptidase 14 -1.503 0.012
NM_016905 galactokinase 1 -1.507 0.017
NM_008481 laminin, alpha 2 -1.508 0.016
NM_017397 DEAD (Asp-Glu-Ala-Asp) box polypeptide 20 -1.512 0.000
NM_027182 thyroid hormone receptor interactor 13 -1.516 0.040
NM_010233 fibronectin 1 -1.517 0.007
NM_015751 ATP-binding cassette, sub-family E (OABP), member 1 -1.518 0.013
NM_008826 phosphofructokinase, liver, B-type -1.520 0.010
NM_001160163 neuraminidase 2 -1.521 0.007
NM_016748 cytidine 5'-triphosphate synthase -1.522 0.004
NM_013507 eukaryotic translation initiation factor 4, gamma 2 -1.522 0.013
NM_001033375 RIKEN cDNA A230046K03 gene -1.526 0.001
NM_011829 inosine 5'-phosphate dehydrogenase 1 -1.529 0.023
NM_028072 sulfatase 2 -1.529 0.044
NM_026742 NADH dehydrogenase (ubiquinone) 1 alpha subcomplex, assembly factor 4
-1.532 0.000
NM_024267 importin 4 -1.537 0.002
NM_026441 penta-EF hand domain containing 1 -1.540 0.028
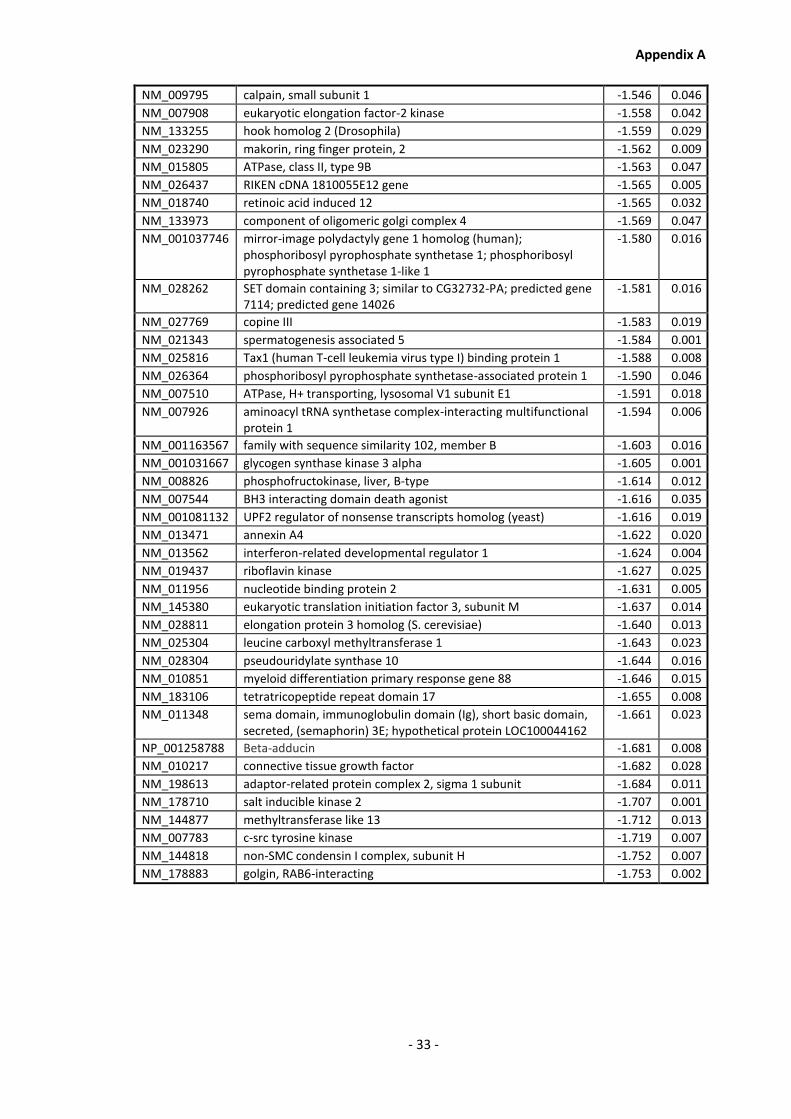
Appendix A
- 33 -
NM_009795 calpain, small subunit 1 -1.546 0.046
NM_007908 eukaryotic elongation factor-2 kinase -1.558 0.042
NM_133255 hook homolog 2 (Drosophila) -1.559 0.029
NM_023290 makorin, ring finger protein, 2 -1.562 0.009
NM_015805 ATPase, class II, type 9B -1.563 0.047
NM_026437 RIKEN cDNA 1810055E12 gene -1.565 0.005
NM_018740 retinoic acid induced 12 -1.565 0.032
NM_133973 component of oligomeric golgi complex 4 -1.569 0.047
NM_001037746 mirror-image polydactyly gene 1 homolog (human); phosphoribosyl pyrophosphate synthetase 1; phosphoribosyl pyrophosphate synthetase 1-like 1
-1.580 0.016
NM_028262 SET domain containing 3; similar to CG32732-PA; predicted gene 7114; predicted gene 14026
-1.581 0.016
NM_027769 copine III -1.583 0.019
NM_021343 spermatogenesis associated 5 -1.584 0.001
NM_025816 Tax1 (human T-cell leukemia virus type I) binding protein 1 -1.588 0.008
NM_026364 phosphoribosyl pyrophosphate synthetase-associated protein 1 -1.590 0.046
NM_007510 ATPase, H+ transporting, lysosomal V1 subunit E1 -1.591 0.018
NM_007926 aminoacyl tRNA synthetase complex-interacting multifunctional protein 1
-1.594 0.006
NM_001163567 family with sequence similarity 102, member B -1.603 0.016
NM_001031667 glycogen synthase kinase 3 alpha -1.605 0.001
NM_008826 phosphofructokinase, liver, B-type -1.614 0.012
NM_007544 BH3 interacting domain death agonist -1.616 0.035
NM_001081132 UPF2 regulator of nonsense transcripts homolog (yeast) -1.616 0.019
NM_013471 annexin A4 -1.622 0.020
NM_013562 interferon-related developmental regulator 1 -1.624 0.004
NM_019437 riboflavin kinase -1.627 0.025
NM_011956 nucleotide binding protein 2 -1.631 0.005
NM_145380 eukaryotic translation initiation factor 3, subunit M -1.637 0.014
NM_028811 elongation protein 3 homolog (S. cerevisiae) -1.640 0.013
NM_025304 leucine carboxyl methyltransferase 1 -1.643 0.023
NM_028304 pseudouridylate synthase 10 -1.644 0.016
NM_010851 myeloid differentiation primary response gene 88 -1.646 0.015
NM_183106 tetratricopeptide repeat domain 17 -1.655 0.008
NM_011348 sema domain, immunoglobulin domain (Ig), short basic domain, secreted, (semaphorin) 3E; hypothetical protein LOC100044162
-1.661 0.023
NP_001258788 Beta-adducin -1.681 0.008
NM_010217 connective tissue growth factor -1.682 0.028
NM_198613 adaptor-related protein complex 2, sigma 1 subunit -1.684 0.011
NM_178710 salt inducible kinase 2 -1.707 0.001
NM_144877 methyltransferase like 13 -1.712 0.013
NM_007783 c-src tyrosine kinase -1.719 0.007
NM_144818 non-SMC condensin I complex, subunit H -1.752 0.007
NM_178883 golgin, RAB6-interacting -1.753 0.002

Appendix A
- 34 -
Table 1-D: Differentially regulated CHO DP-12 proteins determined in samples corresponding
to culture using decreased bioprocess media dissolved oxygen content of 60%.
RefSeq Annotation
Description Fold Change
P-Value
NM_001126047 sema domain, immunoglobulin domain (Ig), transmembrane domain (TM) and short cytoplasmic domain, (semaphorin) 4C
1.894 0.015
NM_175242 RIKEN cDNA 2310014H01 gene 1.852 0.000
NP_001103618 mannoside acetylglucosaminyltransferase 1 1.802 0.000
NM_008681 N-myc downstream regulated gene 1 1.786 0.046
NM_020010 cytochrome P450, family 51 1.742 0.010
NM_010015 defender against cell death 1 1.739 0.035
NM_008562 similar to myeloid cell leukemia sequence 1; myeloid cell leukemia sequence 1
1.728 0.014
NM_001080926 low density lipoprotein receptor-related protein 8, apolipoprotein e receptor
1.720 0.004
NM_130862 brain-specific angiogenesis inhibitor 1-associated protein 2 1.706 0.015
NM_001166024 ADP-ribosylation factor GTPase activating protein 2 1.701 0.005
NM_001081376 chromodomain helicase DNA binding protein 5 1.701 0.002
NM_028767 forkhead box P4 1.699 0.006
NM_145553 predicted gene 7527; family with sequence similarity 76, member A
1.698 0.020
NP_001157290 protein phosphatase 1, regulatory subunit 10 1.694 0.006
NM_080556 transmembrane 9 superfamily member 2 1.688 0.007
NM_010302 guanine nucleotide binding protein, alpha 12; similar to Guanine nucleotide-binding protein alpha-12 subunit (G alpha-12)
1.686 0.025
NM_001024205 nuclear fragile X mental retardation protein interacting protein 2 1.685 0.016
NM_172710 RIKEN cDNA 2310045A20 gene 1.680 0.027
NM_134063 cDNA sequence BC016423 1.680 0.020
NM_010511 interferon gamma receptor 1 1.678 0.031
NM_011333 chemokine (C-C motif) ligand 2 1.678 0.031
NM_010191 predicted gene 6781; farnesyl diphosphate farnesyl transferase 1 1.676 0.006
NM_016666 aryl-hydrocarbon receptor-interacting protein 1.673 0.004
NM_027373 actin filament associated protein 1 1.673 0.022
NM_011284 replication protein A2 1.660 0.045
NM_145946 Fanconi anemia, complementation group I 1.650 0.007
NM_175394 predicted gene 14292; Wilms' tumour 1-associating protein 1.647 0.024
NM_024229 phosphate cytidylyltransferase 2, ethanolamine 1.647 0.037
NM_009125 ataxin 2 1.642 0.045
NM_027435 ATPase family, AAA domain containing 2 1.627 0.012
NM_146065 activating transcription factor 7 1.625 0.001
NM_029078 cleavage and polyadenylation factor subunit homolog (S. cerevisiae)
1.618 0.007
NM_011623 topoisomerase (DNA) II alpha 1.614 0.014
NM_027219 CDC42 effector protein (Rho GTPase binding) 1 1.613 0.032
NM_030743 ring finger protein 114 1.608 0.003
NM_028793 acyl-Coenzyme A binding domain containing 5 1.608 0.027
NM_009242 secreted acidic cysteine rich glycoprotein; similar to Secreted acidic cysteine rich glycoprotein
1.607 0.033
NM_144804 DEP domain containing 7 1.604 0.050
NM_145942 similar to Hmgcs1 protein; 3-hydroxy-3-methylglutaryl-Coenzyme A synthase 1
1.598 0.004
NM_134081 DnaJ (Hsp40) homolog, subfamily C, member 9 1.595 0.028

Appendix A
- 35 -
NM_001081359 ubiquitin protein ligase E3 component n-recognin 5 1.587 0.047
NP_001135450 TPX2, microtubule-associated protein homolog (Xenopus laevis) 1.568 0.021
NM_011121 polo-like kinase 1 (Drosophila) 1.568 0.023
NM_145611 KN motif and ankyrin repeat domains 2 1.567 0.033
NM_009624 adenylate cyclase 9 1.565 0.047
NM_172472 transcription factor E3 1.563 0.021
NM_030561 cDNA sequence BC004004 1.563 0.030
NM_001163570 exosome component 8 1.558 0.005
NM_028390 anillin, actin binding protein 1.555 0.000
NM_008402 integrin alpha V 1.554 0.000
NM_001171052 metastasis associated 3 1.554 0.039
NM_028283 uveal autoantigen with coiled-coil domains and ankyrin repeats 1.553 0.025
NM_172205 suprabasin 1.552 0.031
NM_016963 tropomodulin 3 1.549 0.007
NM_009103 ribonucleotide reductase M1 1.548 0.005
NM_009007 RAS-related C3 botulinum substrate 1 1.547 0.025
NM_008139 guanine nucleotide binding protein, alpha q polypeptide 1.547 0.004
NM_009270 squalene epoxidase 1.543 0.017
NM_144901 predicted gene 5064; cold shock domain containing E1, RNA binding
1.543 0.007
NM_153808 similar to Structural maintenance of chromosomes 5; structural maintenance of chromosomes 5
1.538 0.010
NM_133435 nicotinamide nucleotide adenylyltransferase 1 1.538 0.021
NM_053090 family with sequence similarity 126, member A 1.536 0.038
NM_001044384 tissue inhibitor of metalloproteinase 1 1.535 0.002
NM_028044 similar to calponin 3, acidic; predicted gene 4815; calponin 3, acidic
1.528 0.009
NM_172397 similar to epithelial protein lost in neoplasm; LIM domain containing 2
1.520 0.016
NM_010708 lectin, galactose binding, soluble 9 1.517 0.042
NM_019813 drebrin 1 1.514 0.027
NP_001128624 solute carrier family 39 (zinc transporter), member 14 1.513 0.044
NM_021563 Erbb2 interacting protein 1.513 0.010
NM_009655 activated leukocyte cell adhesion molecule 1.507 0.003
NM_010931 ubiquitin-like, containing PHD and RING finger domains, 1; predicted gene 5648; similar to nuclear zinc finger protein Np95
1.501 0.005
NM_026936 oxidase assembly 1-like 1.501 0.030
NM_012025 Rac GTPase-activating protein 1; predicted gene 1859 1.500 0.034
NM_147201 nuclear receptor binding protein 1 1.497 0.007
NM_028074 DEAD (Asp-Glu-Ala-Asp) box polypeptide 42 1.496 0.000
NM_153117 RIKEN cDNA 9530068E07 gene 1.495 0.046
NM_175313 RIKEN cDNA A130022J15 gene 1.495 0.036
NM_008364 interleukin 1 receptor accessory protein 1.491 0.041
NM_007840 DEAD (Asp-Glu-Ala-Asp) box polypeptide 5; predicted gene 12183 1.490 0.021
NM_198249 RIKEN cDNA E130112L23 gene 1.489 0.001
NM_009074 macrophage stimulating 1 receptor (c-met-related tyrosine kinase)
1.487 0.013
NM_001163622 prolyl endopeptidase-like 1.487 0.039
NM_144788 HECT domain containing 1 1.487 0.021
NP_031641 catenin (cadherin associated protein), delta 1 1.482 0.046
NM_133781 calcium binding protein 39 1.481 0.047
NM_007709 Cbp/p300-interacting transactivator with Glu/Asp-rich carboxy-terminal domain 1
1.476 0.012

Appendix A
- 36 -
NM_029169 RNA binding motif protein 6 1.474 0.002
NM_007602 calpain 5 1.469 0.028
NM_001081251 polybromo 1 1.455 0.017
NM_008567 minichromosome maintenance deficient 6 (MIS5 homolog, S. pombe) (S. cerevisiae)
1.455 0.018
NM_019975 2-hydroxyacyl-CoA lyase 1 1.453 0.044
NM_026101 hect domain and RLD 4 1.447 0.016
NM_007394 activin A receptor, type 1 1.444 0.025
NM_177643 Zinc finger protein 281 1.444 0.001
NP_733486 RNA binding motif protein 12 1.441 0.016
NM_021519 predicted gene 11964; endothelial differentiation-related factor 1 1.440 0.009
NM_025952 magnesium transporter 1 1.437 0.006
NM_008565 minichromosome maintenance deficient 4 homolog (S. cerevisiae)
1.436 0.040
NM_013863 BCL2-associated athanogene 3 1.429 0.024
NM_145139 eukaryotic translation initiation factor 3, subunit L 1.429 0.004
NM_008047 follistatin-like 1 1.429 0.017
NM_010070 docking protein 1 1.428 0.006
NM_028760 centrosomal protein 55 1.427 0.013
NM_026305 predicted gene 11401; similar to transcription elongation factor B (SIII), polypeptide 2; predicted gene 8971; transcription elongation factor B (SIII), polypeptide 2
1.419 0.026
NM_026934 predicted gene 5909; zinc finger CCCH-type containing 15 1.418 0.024
NM_009881 chromodomain protein, Y chromosome-like; predicted gene 7584 1.415 0.049
NM_030113 Rho GTPase activating protein 10 1.414 0.005
NM_146131 similar to Pre-B-cell leukemia transcription factor interacting protein 1; pre-B-cell leukemia transcription factor interacting protein 1
1.412 0.026
NP_001104536 FK506 binding protein 8 1.412 0.004
NM_025682 paraspeckle protein 1 1.409 0.031
NM_197982 DEAD (Asp-Glu-Ala-Asp) box polypeptide 39 1.404 0.024
NM_172666 alkylglycerone phosphate synthase 1.402 0.043
NM_175127 F-box protein 28 1.402 0.040
NM_023063 LIM domain and actin binding 1 1.396 0.015
NM_001166406 kinesin family member 20A 1.396 0.007
NM_146239 PCTAIRE-motif protein kinase 2 1.396 0.005
NP_001239458 Polyglutamine-binding protein 1 1.388 0.016
NM_144831 DEAH (Asp-Glu-Ala-His) box polypeptide 8 1.386 0.040
NM_023603 splicing factor proline/glutamine rich (polypyrimidine tract binding protein associated); similar to PTB-associated splicing factor
1.382 0.001
NM_172679 RIKEN cDNA 4932438A13 gene 1.381 0.015
NM_029402 cullin 2 1.381 0.017
NM_001048267 predicted gene 6493; transportin 1 1.379 0.016
NM_009510 ezrin; hypothetical protein LOC100044177 1.378 0.022
NM_175021 sterile alpha motif domain containing 4B 1.378 0.028
NM_025364 predicted gene 6563; SAP domain containing ribonucleoprotein 1.375 0.005
NP_598452 poly-U binding splicing factor 60 1.371 0.013
NM_016794 vesicle-associated membrane protein 8 1.368 0.018
NM_019408 nuclear factor of kappa light polypeptide gene enhancer in B-cells 2, p49/p100
1.366 0.008
NM_001081242 talin 2 1.364 0.017
NM_028242 HIV TAT specific factor 1 1.361 0.008

Appendix A
- 37 -
NM_146078 ubiquitin protein ligase E3 component n-recognin 2 1.361 0.041
NM_008619 Moloney leukemia virus 10; predicted gene 7357 1.360 0.036
NM_011767 zinc finger RNA binding protein 1.359 0.040
NM_139291 cell division cycle 26; predicted gene 9174 1.357 0.018
NM_020022 replication factor C (activator 1) 2 1.356 0.032
NM_025822 arginine/serine-rich coiled-coil 1 1.355 0.036
NM_183417 cyclin-dependent kinase 2 1.352 0.048
NM_027434 regulation of nuclear pre-mRNA domain containing 1B 1.351 0.048
NM_031165 similar to heat shock protein 8; heat shock protein 8 1.351 0.034
NM_008861 polycystic kidney disease 2 1.344 0.038
NM_015760 NADPH oxidase 4 1.343 0.022
NM_019811 acyl-CoA synthetase short-chain family member 2 1.341 0.006
NM_026653 replication protein A1 1.340 0.017
NM_009283 signal transducer and activator of transcription 1 1.340 0.045
NM_008881 plexin A1 1.330 0.030
NM_080793 SET domain containing (lysine methyltransferase) 7 1.320 0.031
NM_001048267 predicted gene 6493; transportin 1 1.319 0.039
NM_011486 similar to Stat3B; signal transducer and activator of transcription 3
1.318 0.005
NM_177296 transportin 3 1.314 0.016
NM_026497 nudix (nucleoside diphosphate linked moiety X)-type motif 12 1.313 0.008
NM_011716 Wolfram syndrome 1 homolog (human) 1.311 0.016
NM_145937 sulfatase modifying factor 1 1.310 0.016
NM_026872 ubiquitin-associated protein 2 1.305 0.034
NM_007988 fatty acid synthase 1.298 0.012
NM_018748 golgi autoantigen, golgin subfamily a, 4 1.293 0.018
NM_008549 mannosidase 2, alpha 1 1.288 0.018
NP_001005331 eukaryotic translation initiation factor 4, gamma 1 1.288 0.028
NM_015735 damage specific DNA binding protein 1 1.286 0.002
NM_172391 AHA1, activator of heat shock protein ATPase homolog 2 (yeast) 1.285 0.024
NM_207176 testis derived transcript 1.284 0.013
NM_024245 kinesin family member 23 1.280 0.008
NM_010235 fos-like antigen 1 1.277 0.021
NM_007896 predicted gene 8545; microtubule-associated protein, RP/EB family, member 1; similar to Microtubule-associated protein RP/EB family member 1 (APC-binding protein EB1) (End-binding protein 1) (EB1)
1.268 0.013
NM_011378 transcriptional regulator, SIN3A (yeast) 1.267 0.009
NM_133952 unc-45 homolog A (C. elegans) 1.264 0.038
NM_021521 mediator of RNA polymerase II transcription, subunit 12 homolog (yeast)
1.263 0.033
NM_001163540 plectin 1 1.251 0.014
NM_001003909 ankyrin repeat and IBR domain containing 1 1.250 0.019
NM_007798 cathepsin B 1.249 0.015
NM_153774 importin 9 1.245 0.010
NM_008684 neogenin 1.242 0.018
NM_001081255 leucine-rich repeats and calponin homology (CH) domain containing 3
1.237 0.012
NM_008566 minichromosome maintenance deficient 5, cell division cycle 46 (S. cerevisiae)
1.234 0.042
NM_133947 nuclear mitotic apparatus protein 1 1.230 0.001
NM_029582 thioredoxin domain containing 11 1.230 0.048
NP_963910 GNAS (guanine nucleotide binding protein, alpha stimulating) 1.219 0.025
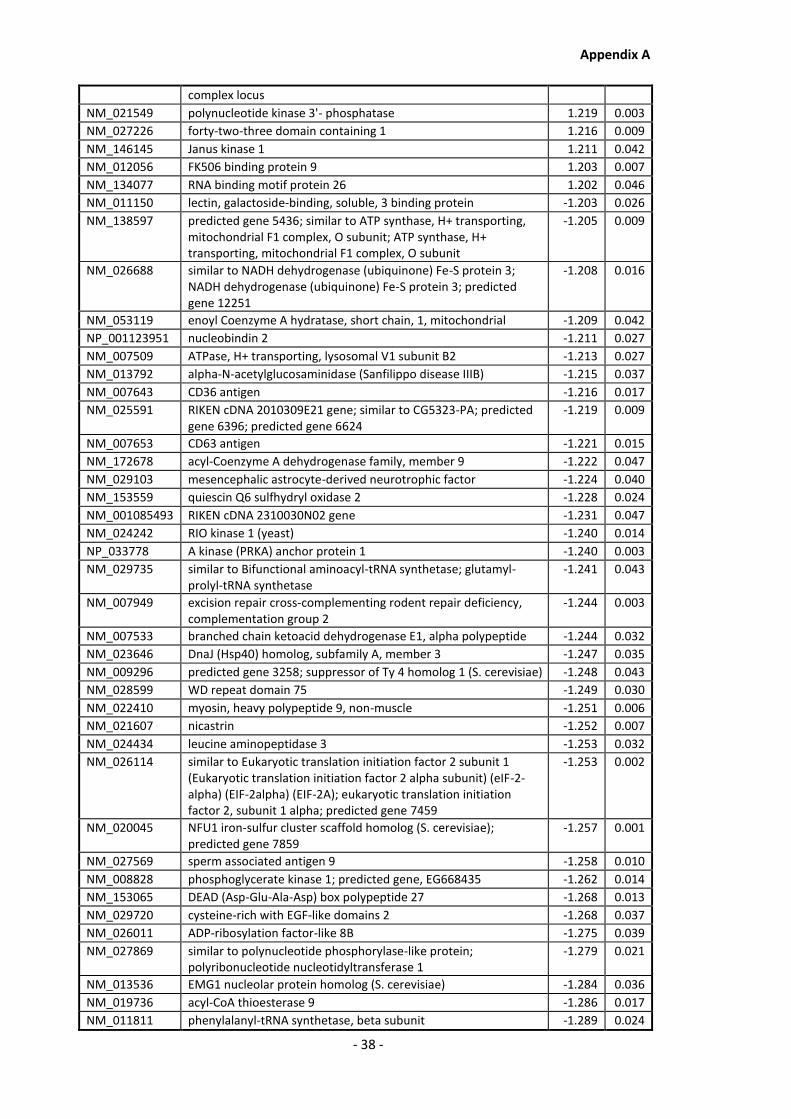
Appendix A
- 38 -
complex locus
NM_021549 polynucleotide kinase 3'- phosphatase 1.219 0.003
NM_027226 forty-two-three domain containing 1 1.216 0.009
NM_146145 Janus kinase 1 1.211 0.042
NM_012056 FK506 binding protein 9 1.203 0.007
NM_134077 RNA binding motif protein 26 1.202 0.046
NM_011150 lectin, galactoside-binding, soluble, 3 binding protein -1.203 0.026
NM_138597 predicted gene 5436; similar to ATP synthase, H+ transporting, mitochondrial F1 complex, O subunit; ATP synthase, H+ transporting, mitochondrial F1 complex, O subunit
-1.205 0.009
NM_026688 similar to NADH dehydrogenase (ubiquinone) Fe-S protein 3; NADH dehydrogenase (ubiquinone) Fe-S protein 3; predicted gene 12251
-1.208 0.016
NM_053119 enoyl Coenzyme A hydratase, short chain, 1, mitochondrial -1.209 0.042
NP_001123951 nucleobindin 2 -1.211 0.027
NM_007509 ATPase, H+ transporting, lysosomal V1 subunit B2 -1.213 0.027
NM_013792 alpha-N-acetylglucosaminidase (Sanfilippo disease IIIB) -1.215 0.037
NM_007643 CD36 antigen -1.216 0.017
NM_025591 RIKEN cDNA 2010309E21 gene; similar to CG5323-PA; predicted gene 6396; predicted gene 6624
-1.219 0.009
NM_007653 CD63 antigen -1.221 0.015
NM_172678 acyl-Coenzyme A dehydrogenase family, member 9 -1.222 0.047
NM_029103 mesencephalic astrocyte-derived neurotrophic factor -1.224 0.040
NM_153559 quiescin Q6 sulfhydryl oxidase 2 -1.228 0.024
NM_001085493 RIKEN cDNA 2310030N02 gene -1.231 0.047
NM_024242 RIO kinase 1 (yeast) -1.240 0.014
NP_033778 A kinase (PRKA) anchor protein 1 -1.240 0.003
NM_029735 similar to Bifunctional aminoacyl-tRNA synthetase; glutamyl-prolyl-tRNA synthetase
-1.241 0.043
NM_007949 excision repair cross-complementing rodent repair deficiency, complementation group 2
-1.244 0.003
NM_007533 branched chain ketoacid dehydrogenase E1, alpha polypeptide -1.244 0.032
NM_023646 DnaJ (Hsp40) homolog, subfamily A, member 3 -1.247 0.035
NM_009296 predicted gene 3258; suppressor of Ty 4 homolog 1 (S. cerevisiae) -1.248 0.043
NM_028599 WD repeat domain 75 -1.249 0.030
NM_022410 myosin, heavy polypeptide 9, non-muscle -1.251 0.006
NM_021607 nicastrin -1.252 0.007
NM_024434 leucine aminopeptidase 3 -1.253 0.032
NM_026114 similar to Eukaryotic translation initiation factor 2 subunit 1 (Eukaryotic translation initiation factor 2 alpha subunit) (eIF-2-alpha) (EIF-2alpha) (EIF-2A); eukaryotic translation initiation factor 2, subunit 1 alpha; predicted gene 7459
-1.253 0.002
NM_020045 NFU1 iron-sulfur cluster scaffold homolog (S. cerevisiae); predicted gene 7859
-1.257 0.001
NM_027569 sperm associated antigen 9 -1.258 0.010
NM_008828 phosphoglycerate kinase 1; predicted gene, EG668435 -1.262 0.014
NM_153065 DEAD (Asp-Glu-Ala-Asp) box polypeptide 27 -1.268 0.013
NM_029720 cysteine-rich with EGF-like domains 2 -1.268 0.037
NM_026011 ADP-ribosylation factor-like 8B -1.275 0.039
NM_027869 similar to polynucleotide phosphorylase-like protein; polyribonucleotide nucleotidyltransferase 1
-1.279 0.021
NM_013536 EMG1 nucleolar protein homolog (S. cerevisiae) -1.284 0.036
NM_019736 acyl-CoA thioesterase 9 -1.286 0.017
NM_011811 phenylalanyl-tRNA synthetase, beta subunit -1.289 0.024

Appendix A
- 39 -
NM_008149 glycerol-3-phosphate acyltransferase, mitochondrial -1.293 0.033
NM_175121 solute carrier family 38, member 2 -1.301 0.027
NM_029673 inner membrane protein, mitochondrial -1.301 0.032
NM_021460 lysosomal acid lipase A -1.302 0.034
NM_023060 eukaryotic elongation factor, selenocysteine-tRNA-specific -1.304 0.030
NP_034918 methyl CpG binding protein 2 -1.304 0.021
NM_018739 retinitis pigmentosa 9 (human) -1.305 0.017
NM_029556 citrate lyase beta like -1.314 0.041
NM_133217 beta-carotene oxygenase 2 -1.315 0.034
NM_007997 ferredoxin reductase -1.316 0.049
NM_019734 N-acylsphingosine amidohydrolase 1 -1.319 0.040
NM_008482 laminin B1 subunit 1 -1.319 0.004
NM_027244 NADH dehydrogenase (ubiquinone) 1 alpha subcomplex 11 -1.320 0.000
NM_010233 fibronectin 1 -1.342 0.004
NM_030225 dihydrolipoamide S-succinyltransferase (E2 component of 2-oxo-glutarate complex)
-1.344 0.026
NM_028243 prolylcarboxypeptidase (angiotensinase C) -1.345 0.011
NM_016763 hydroxysteroid (17-beta) dehydrogenase 10 -1.346 0.027
NM_027906 RIKEN cDNA 1300010F03 gene -1.350 0.001
NM_172015 isoleucine-tRNA synthetase -1.351 0.030
NM_011594 tissue inhibitor of metalloproteinase 2 -1.354 0.027
NM_009264 small proline-rich protein 1A -1.358 0.004
NM_007510 ATPase, H+ transporting, lysosomal V1 subunit E1 -1.359 0.029
NM_026995 carbohydrate kinase domain containing -1.364 0.001
NM_008929 DnaJ (Hsp40) homolog, subfamily C, member 3 -1.369 0.027
NM_013671 superoxide dismutase 2, mitochondrial -1.371 0.040
NM_008231 hepatoma-derived growth factor -1.373 0.009
NM_001030014 similar to mitochondrial malonyltransferase isoform b precursor; malonyl CoA:ACP acyltransferase (mitochondrial)
-1.374 0.020
NM_133895 solute carrier family 15, member 4 -1.377 0.039
NM_008325 iduronidase, alpha-L- -1.378 0.004
NM_026192 calcium binding and coiled coil domain 1 -1.379 0.022
NM_145595 carbonyl reductase 4 -1.380 0.036
NM_134151 tyrosyl-tRNA synthetase -1.388 0.039
NM_008323 isocitrate dehydrogenase 3 (NAD+), gamma -1.397 0.040
NM_133826 ATPase, H+ transporting, lysosomal V1 subunit H -1.401 0.013
NM_178619 predicted gene 5747; RIKEN cDNA 1810026J23 gene -1.401 0.019
NM_016804 metaxin 2 -1.402 0.049
NM_019816 apoptosis antagonizing transcription factor -1.407 0.029
NM_175287 RIKEN cDNA A430005L14 gene; hypothetical protein LOC676530; predicted gene 12247
-1.407 0.009
NM_015805 ATPase, class II, type 9B -1.410 0.026
NM_025816 Tax1 (human T-cell leukemia virus type I) binding protein 1 -1.414 0.009
NM_030678 glycogen synthase 1, muscle -1.417 0.045
NM_011414 secretory leukocyte peptidase inhibitor -1.417 0.046
NM_026969 Sec31 homolog A (S. cerevisiae) -1.429 0.006
NM_025403 NOP10 ribonucleoprotein homolog (yeast) -1.430 0.046
NM_016709 AU RNA binding protein/enoyl-coenzyme A hydratase -1.434 0.024
NM_028900 golgi coiled coil 1 -1.434 0.032
NM_144897 apolipoprotein A-I binding protein -1.436 0.003
NM_024197 NADH dehydrogenase (ubiquinone) 1 alpha subcomplex 10 -1.440 0.027
NM_024201 coiled-coil domain containing 127 -1.449 0.048

Appendix A
- 40 -
NM_172436 solute carrier family 25 (mitochondrial carrier, Aralar), member 12
-1.451 0.035
NM_010239 ferritin heavy chain 1 -1.451 0.013
NM_029364 glucosamine (N-acetyl)-6-sulfatase -1.455 0.024
NM_001177602 Adenylate kinase 4, mitochondrial -1.457 0.039
NM_001171582 methionine-tRNA synthetase -1.457 0.015
NM_001081056 exportin, tRNA (nuclear export receptor for tRNAs) -1.464 0.034
NM_025304 leucine carboxyl methyltransferase 1 -1.472 0.026
NM_001113356 complement component 1, r subcomponent; predicted gene 8551
-1.473 0.042
NM_134007 CDGSH iron sulfur domain 1 -1.473 0.021
NM_008605 matrix metallopeptidase 12 -1.474 0.007
NM_010764 mannosidase 2, alpha B1 -1.481 0.002
NM_013657 sema domain, immunoglobulin domain (Ig), short basic domain, secreted, (semaphorin) 3C
-1.481 0.012
NM_001127338 aldehyde dehydrogenase family 7, member A1 -1.481 0.015
NM_001111121 coiled-coil domain containing 6 -1.485 0.024
NM_172745 predicted gene 9755; Tu translation elongation factor, mitochondrial
-1.487 0.030
NM_026742 NADH dehydrogenase (ubiquinone) 1 alpha subcomplex, assembly factor 4
-1.489 0.022
NM_026452 coenzyme Q9 homolog (yeast) -1.489 0.047
NM_029956 methylmalonic aciduria (cobalamin deficiency) type B homolog (human)
-1.489 0.017
NM_183106 tetratricopeptide repeat domain 17 -1.492 0.014
NM_033074 threonyl-tRNA synthetase -1.505 0.005
NM_011695 similar to Voltage-dependent anion-selective channel protein 2 (VDAC-2) (mVDAC2) (mVDAC6) (Outer mitochondrial membrane protein porin 2); predicted gene 7832; voltage-dependent anion channel 2
-1.507 0.002
NM_145501 phosphatidylinositol 4-kinase type 2 alpha -1.507 0.013
NM_146229 dynein cytoplasmic 1 light intermediate chain 1 -1.511 0.023
NM_134147 MACRO domain containing 1 -1.518 0.011
NM_013768 protein arginine N-methyltransferase 5 -1.521 0.020
NM_008212 hydroxyacyl-Coenzyme A dehydrogenase -1.524 0.033
NM_029023 serine carboxypeptidase 1 -1.524 0.023
NM_030026 methylcrotonoyl-Coenzyme A carboxylase 2 (beta) -1.534 0.006
NM_019758 mitochondrial carrier homolog 2 (C. elegans); predicted gene, 100039384; predicted gene, 100039506
-1.534 0.015
NP_001156418 pyruvate carboxylase -1.534 0.029
NM_008788 procollagen C-endopeptidase enhancer protein -1.535 0.008
NM_023247 NADH dehydrogenase (ubiquinone) 1 alpha subcomplex, assembly factor 3
-1.542 0.022
NM_008131 predicted gene 4949; glutamate-ammonia ligase (glutamine synthetase)
-1.552 0.025
NM_025835 propionyl Coenzyme A carboxylase, beta polypeptide -1.555 0.002
NM_001163126 component of oligomeric golgi complex 5 -1.555 0.000
NM_010438 hexokinase 1 -1.558 0.017
NM_026295 CTD (carboxy-terminal domain, RNA polymerase II, polypeptide A) phosphatase, subunit 1
-1.566 0.011
NM_008509 lipoprotein lipase; similar to Lipoprotein lipase precursor (LPL) -1.569 0.041
NM_024243 fucosidase, alpha-L- 1, tissue -1.570 0.002
NM_007383 acyl-Coenzyme A dehydrogenase, short chain -1.574 0.025
NM_010261 Rab acceptor 1 (prenylated) -1.576 0.023

Appendix A
- 41 -
NM_026744 mitochondrial ribosomal protein L53 -1.580 0.015
NM_029884 heparan-alpha-glucosaminide N-acetyltransferase -1.581 0.004
NM_175109 ribosomal protein S19 binding protein 1 -1.585 0.001
NM_011400 solute carrier family 2 (facilitated glucose transporter), member 1 -1.586 0.002
NM_007861 dihydrolipoamide dehydrogenase -1.591 0.029
NM_008095 glioblastoma amplified sequence -1.593 0.015
NM_001160163 neuraminidase 2 -1.596 0.021
NM_013492 similar to clusterin; clusterin -1.599 0.000
NM_201642 similar to UDP glycosyltransferase 1 family polypeptide A13; similar to UGT1.6; UDP glucuronosyltransferase 1 family, polypeptide A1; UDP glucuronosyltransferase 1 family, polypeptide A2; UDP glycosyltransferase 1 family, polypeptide A10; UDP glucuronosyl
-1.601 0.002
NM_053071 predicted gene 6265; similar to cytochrome c oxidase, subunit VIc; cytochrome c oxidase, subunit VIc
-1.613 0.028
NM_024220 NADH dehydrogenase (ubiquinone) 1, subcomplex unknown, 2; similar to NADH dehydrogenase (ubiquinone) 1, subcomplex unknown, 2
-1.617 0.023
NM_026364 phosphoribosyl pyrophosphate synthetase-associated protein 1 -1.617 0.029
NM_016918 nudix (nucleoside diphosphate linked moiety X)-type motif 5 -1.619 0.005
NM_028876 transmembrane emp24 protein transport domain containing 5; similar to Transmembrane emp24 protein transport domain containing 5
-1.620 0.002
NM_007544 BH3 interacting domain death agonist -1.620 0.001
NM_025859 ADP-ribosylation factor-like 1 -1.623 0.000
NM_010421 hexosaminidase A -1.624 0.001
NM_009194 similar to solute carrier family 12, member 2; solute carrier family 12, member 2
-1.626 0.024
NM_026432 transmembrane protein 66 -1.628 0.002
NM_013556 hypoxanthine guanine phosphoribosyl transferase 1 -1.630 0.001
NM_001045489 milk fat globule-EGF factor 8 protein -1.636 0.005
NM_153561 nudix (nucleoside diphosphate linked moiety X)-type motif 6 -1.643 0.014
NM_009731 aldo-keto reductase family 1, member B7 -1.649 0.037
NM_007639 CD1d1 antigen; CD1d2 antigen -1.655 0.020
NM_008481 laminin, alpha 2 -1.664 0.014
NM_178644 OAF homolog (Drosophila) -1.670 0.001
NM_011348 sema domain, immunoglobulin domain (Ig), short basic domain, secreted, (semaphorin) 3E; hypothetical protein LOC100044162
-1.671 0.031
NM_025369 predicted gene 10078; predicted gene 3544; similar to mitochondrial ribosomal protein S36; mitochondrial ribosomal protein S36; predicted gene 7258; predicted gene 4676
-1.684 0.003
NM_026512 biphenyl hydrolase-like (serine hydrolase, breast epithelial mucin-associated antigen)
-1.686 0.004
NM_011125 phospholipid transfer protein -1.692 0.010
NM_028181 cell cycle progression 1 -1.702 0.016
NM_053179 N-acetylneuraminic acid synthase (sialic acid synthase) -1.704 0.029
NM_017393 caseinolytic peptidase, ATP-dependent, proteolytic subunit homolog (E. coli)
-1.711 0.005
NM_028152 MMS19 (MET18 S. cerevisiae) -1.714 0.010
NM_011942 lysophospholipase 2 -1.715 0.001
NM_013562 interferon-related developmental regulator 1 -1.751 0.006

Appendix A
- 42 -
Table 1-E: Differentially regulated CHO DP-12 proteins determined in samples corresponding
to culture using an increased bioprocess media pH of 7.2.
RefSeq Annotation
Description Fold Change
P-value
NM_011638 transferrin receptor 1.893 0.017
NM_010736 lymphotoxin B receptor 1.776 0.014
NM_011019 oncostatin M receptor 1.725 0.002
NM_144930 expressed sequence AU018778 1.706 0.005
NM_021895 actinin alpha 4 1.650 0.012
NM_009201 solute carrier family 1 (neutral amino acid transporter), member 5 1.648 0.018
NM_010235 fos-like antigen 1 1.644 0.020
NM_009418 tripeptidyl peptidase II 1.623 0.005
NM_026693 gamma-aminobutyric acid (GABA) A receptor-associated protein-like 2; predicted gene 3724
1.620 0.015
NM_011886 secretory carrier membrane protein 3 1.617 0.024
NM_011296 predicted gene 10027; hypothetical protein LOC674425; predicted gene 6794; predicted gene 9175; similar to ribosomal protein S18; similar to ribosomal protein; ribosomal protein S18; predicted gene 11230; predicted gene 5321; predicted gene 10260; predict
1.605 0.003
NM_001024205 nuclear fragile X mental retardation protein interacting protein 2 1.603 0.003
NM_026497 nudix (nucleoside diphosphate linked moiety X)-type motif 12 1.603 0.023
NM_016797 syntaxin 7 1.599 0.028
NM_030248 CDK5 regulatory subunit associated protein 3 1.588 0.003
NP_035863 cold shock domain protein A 1.577 0.013
NM_001081378 kinase D-interacting substrate 220 1.570 0.030
NM_011563 peroxiredoxin 2 1.567 0.003
NM_009842 CD151 antigen 1.563 0.010
NM_001037847 CCR4-NOT transcription complex, subunit 2 1.559 0.016
NM_198631 zinc finger CCCH-type containing 4 1.558 0.012
NM_007643 CD36 antigen 1.556 0.046
NM_007932 endoglin 1.555 0.005
NP_001003667 keratin 77 1.552 0.002
NM_028450 GULP, engulfment adaptor PTB domain containing 1 1.526 0.002
NM_181348 RIKEN cDNA A230083H22 gene 1.525 0.030
NM_029565 transmembrane protein 59 1.517 0.004
NM_016714 nucleoporin 50 1.515 0.030
NM_001111279 WD repeat and FYVE domain containing 1 1.514 0.032
NM_181848 optineurin 1.504 0.002
NM_008684 neogenin 1.500 0.001
NM_009370 transforming growth factor, beta receptor I 1.483 0.033
NM_026842 ubiquilin 1 1.474 0.014
NM_030116 mitochondrial ribosomal protein L9 1.473 0.007
NM_146090 zinc binding alcohol dehydrogenase, domain containing 2 1.463 0.028
NM_007513 solute carrier family 7 (cationic amino acid transporter, y+ system), member 1
1.462 0.020
NP_034336 fibroblast growth factor receptor 1 1.461 0.031
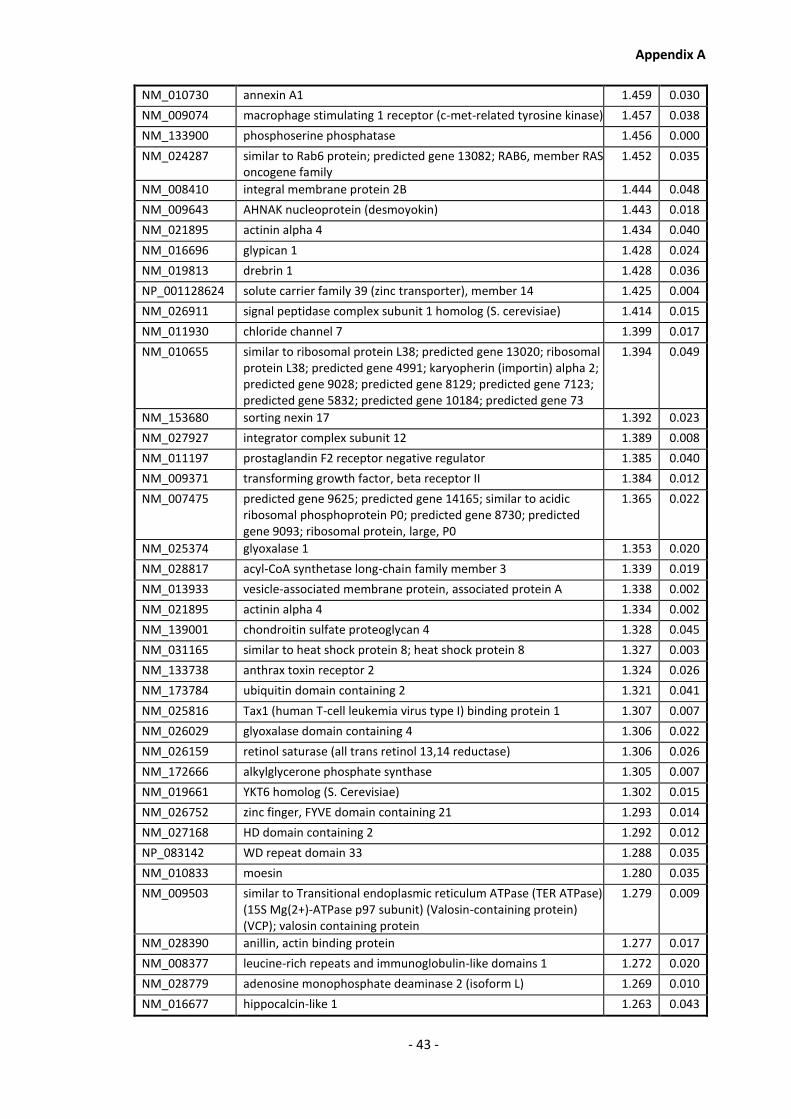
Appendix A
- 43 -
NM_010730 annexin A1 1.459 0.030
NM_009074 macrophage stimulating 1 receptor (c-met-related tyrosine kinase) 1.457 0.038
NM_133900 phosphoserine phosphatase 1.456 0.000
NM_024287 similar to Rab6 protein; predicted gene 13082; RAB6, member RAS oncogene family
1.452 0.035
NM_008410 integral membrane protein 2B 1.444 0.048
NM_009643 AHNAK nucleoprotein (desmoyokin) 1.443 0.018
NM_021895 actinin alpha 4 1.434 0.040
NM_016696 glypican 1 1.428 0.024
NM_019813 drebrin 1 1.428 0.036
NP_001128624 solute carrier family 39 (zinc transporter), member 14 1.425 0.004
NM_026911 signal peptidase complex subunit 1 homolog (S. cerevisiae) 1.414 0.015
NM_011930 chloride channel 7 1.399 0.017
NM_010655 similar to ribosomal protein L38; predicted gene 13020; ribosomal protein L38; predicted gene 4991; karyopherin (importin) alpha 2; predicted gene 9028; predicted gene 8129; predicted gene 7123; predicted gene 5832; predicted gene 10184; predicted gene 73
1.394 0.049
NM_153680 sorting nexin 17 1.392 0.023
NM_027927 integrator complex subunit 12 1.389 0.008
NM_011197 prostaglandin F2 receptor negative regulator 1.385 0.040
NM_009371 transforming growth factor, beta receptor II 1.384 0.012
NM_007475 predicted gene 9625; predicted gene 14165; similar to acidic ribosomal phosphoprotein P0; predicted gene 8730; predicted gene 9093; ribosomal protein, large, P0
1.365 0.022
NM_025374 glyoxalase 1 1.353 0.020
NM_028817 acyl-CoA synthetase long-chain family member 3 1.339 0.019
NM_013933 vesicle-associated membrane protein, associated protein A 1.338 0.002
NM_021895 actinin alpha 4 1.334 0.002
NM_139001 chondroitin sulfate proteoglycan 4 1.328 0.045
NM_031165 similar to heat shock protein 8; heat shock protein 8 1.327 0.003
NM_133738 anthrax toxin receptor 2 1.324 0.026
NM_173784 ubiquitin domain containing 2 1.321 0.041
NM_025816 Tax1 (human T-cell leukemia virus type I) binding protein 1 1.307 0.007
NM_026029 glyoxalase domain containing 4 1.306 0.022
NM_026159 retinol saturase (all trans retinol 13,14 reductase) 1.306 0.026
NM_172666 alkylglycerone phosphate synthase 1.305 0.007
NM_019661 YKT6 homolog (S. Cerevisiae) 1.302 0.015
NM_026752 zinc finger, FYVE domain containing 21 1.293 0.014
NM_027168 HD domain containing 2 1.292 0.012
NP_083142 WD repeat domain 33 1.288 0.035
NM_010833 moesin 1.280 0.035
NM_009503 similar to Transitional endoplasmic reticulum ATPase (TER ATPase) (15S Mg(2+)-ATPase p97 subunit) (Valosin-containing protein) (VCP); valosin containing protein
1.279 0.009
NM_028390 anillin, actin binding protein 1.277 0.017
NM_008377 leucine-rich repeats and immunoglobulin-like domains 1 1.272 0.020
NM_028779 adenosine monophosphate deaminase 2 (isoform L) 1.269 0.010
NM_016677 hippocalcin-like 1 1.263 0.043
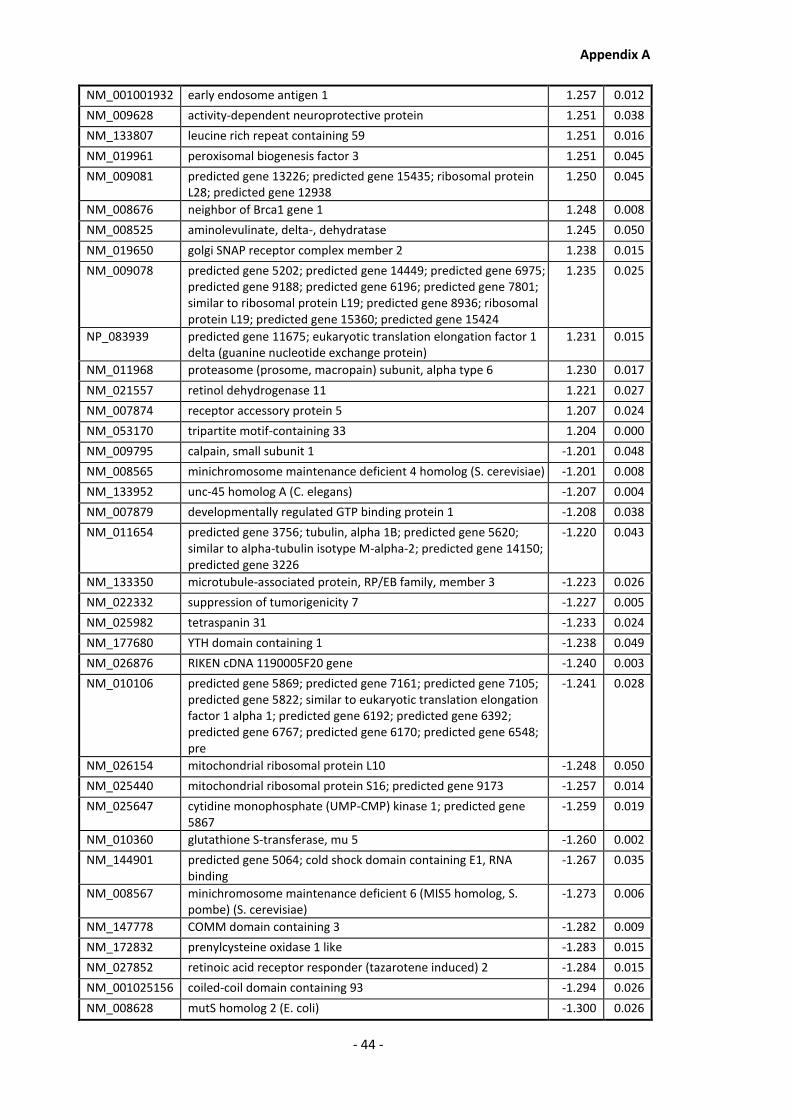
Appendix A
- 44 -
NM_001001932 early endosome antigen 1 1.257 0.012
NM_009628 activity-dependent neuroprotective protein 1.251 0.038
NM_133807 leucine rich repeat containing 59 1.251 0.016
NM_019961 peroxisomal biogenesis factor 3 1.251 0.045
NM_009081 predicted gene 13226; predicted gene 15435; ribosomal protein L28; predicted gene 12938
1.250 0.045
NM_008676 neighbor of Brca1 gene 1 1.248 0.008
NM_008525 aminolevulinate, delta-, dehydratase 1.245 0.050
NM_019650 golgi SNAP receptor complex member 2 1.238 0.015
NM_009078 predicted gene 5202; predicted gene 14449; predicted gene 6975; predicted gene 9188; predicted gene 6196; predicted gene 7801; similar to ribosomal protein L19; predicted gene 8936; ribosomal protein L19; predicted gene 15360; predicted gene 15424
1.235 0.025
NP_083939 predicted gene 11675; eukaryotic translation elongation factor 1 delta (guanine nucleotide exchange protein)
1.231 0.015
NM_011968 proteasome (prosome, macropain) subunit, alpha type 6 1.230 0.017
NM_021557 retinol dehydrogenase 11 1.221 0.027
NM_007874 receptor accessory protein 5 1.207 0.024
NM_053170 tripartite motif-containing 33 1.204 0.000
NM_009795 calpain, small subunit 1 -1.201 0.048
NM_008565 minichromosome maintenance deficient 4 homolog (S. cerevisiae) -1.201 0.008
NM_133952 unc-45 homolog A (C. elegans) -1.207 0.004
NM_007879 developmentally regulated GTP binding protein 1 -1.208 0.038
NM_011654 predicted gene 3756; tubulin, alpha 1B; predicted gene 5620; similar to alpha-tubulin isotype M-alpha-2; predicted gene 14150; predicted gene 3226
-1.220 0.043
NM_133350 microtubule-associated protein, RP/EB family, member 3 -1.223 0.026
NM_022332 suppression of tumorigenicity 7 -1.227 0.005
NM_025982 tetraspanin 31 -1.233 0.024
NM_177680 YTH domain containing 1 -1.238 0.049
NM_026876 RIKEN cDNA 1190005F20 gene -1.240 0.003
NM_010106 predicted gene 5869; predicted gene 7161; predicted gene 7105; predicted gene 5822; similar to eukaryotic translation elongation factor 1 alpha 1; predicted gene 6192; predicted gene 6392; predicted gene 6767; predicted gene 6170; predicted gene 6548; pre
-1.241 0.028
NM_026154 mitochondrial ribosomal protein L10 -1.248 0.050
NM_025440 mitochondrial ribosomal protein S16; predicted gene 9173 -1.257 0.014
NM_025647 cytidine monophosphate (UMP-CMP) kinase 1; predicted gene 5867
-1.259 0.019
NM_010360 glutathione S-transferase, mu 5 -1.260 0.002
NM_144901 predicted gene 5064; cold shock domain containing E1, RNA binding
-1.267 0.035
NM_008567 minichromosome maintenance deficient 6 (MIS5 homolog, S. pombe) (S. cerevisiae)
-1.273 0.006
NM_147778 COMM domain containing 3 -1.282 0.009
NM_172832 prenylcysteine oxidase 1 like -1.283 0.015
NM_027852 retinoic acid receptor responder (tazarotene induced) 2 -1.284 0.015
NM_001025156 coiled-coil domain containing 93 -1.294 0.026
NM_008628 mutS homolog 2 (E. coli) -1.300 0.026

Appendix A
- 45 -
NM_134023 TBC1 domain family, member 10a -1.306 0.009
NM_025392 BRCA2 and CDKN1A interacting protein -1.306 0.004
NM_026318 RIKEN cDNA 2310003F16 gene -1.310 0.005
NP_001186624 Alpha-taxilin -1.313 0.015
NM_025922 inosine triphosphatase (nucleoside triphosphate pyrophosphatase)
-1.316 0.002
NM_008927 mitogen-activated protein kinase kinase 1 -1.317 0.018
NM_026934 predicted gene 5909; zinc finger CCCH-type containing 15 -1.318 0.009
NM_144923 biliverdin reductase B (flavin reductase (NADPH)) -1.318 0.015
NM_013559 heat shock 105kDa/110kDa protein 1 -1.320 0.010
NM_015765 heat shock protein 14 -1.326 0.044
NM_001009947 dedicator of cytokinesis 11 -1.333 0.025
NM_016682 ubiquitin-like modifier activating enzyme 2 -1.346 0.006
NM_028761 poly(A)-specific ribonuclease (deadenylation nuclease) -1.353 0.033
NP_001070830 four and a half LIM domains 1 -1.355 0.043
NM_019758 mitochondrial carrier homolog 2 (C. elegans); predicted gene, 100039384; predicted gene, 100039506
-1.362 0.009
NM_027276 CDC16 cell division cycle 16 homolog (S. cerevisiae) -1.365 0.047
NM_025996 translocase of outer mitochondrial membrane 34 -1.375 0.023
NM_173443 valosin containing protein (p97)/p47 complex interacting protein 1 -1.375 0.042
NM_028299 RIKEN cDNA 2700029M09 gene -1.377 0.017
NM_009755 bone morphogenetic protein 1 -1.381 0.008
NM_009097 ribosomal protein S6 kinase polypeptide 1 -1.387 0.021
NM_001033259 coiled-coil domain containing 109A -1.388 0.016
NM_027475 ecdysoneless homolog (Drosophila) -1.413 0.010
NM_023716 Tubulin beta-2B chain -1.416 0.032
NM_013492 similar to clusterin; clusterin -1.422 0.007
NM_001029979 scaffold attachment factor B2 -1.441 0.014
NM_026512 biphenyl hydrolase-like (serine hydrolase, breast epithelial mucin-associated antigen)
-1.442 0.032
NM_198622 H1 histone family, member X -1.451 0.007
NM_011131 polymerase (DNA directed), delta 1, catalytic subunit -1.458 0.010
NM_010106 predicted gene 5869; predicted gene 7161; predicted gene 7105; predicted gene 5822; similar to eukaryotic translation elongation factor 1 alpha 1; predicted gene 6192; predicted gene 6392; predicted gene 6767; predicted gene 6170; predicted gene 6548; pre
-1.469 0.034
NM_011340 serine (or cysteine) peptidase inhibitor, clade F, member 1 -1.483 0.002
NM_138587 family with sequence similarity 3, member C -1.485 0.015
NM_007620 predicted gene 5678; carbonyl reductase 1 -1.485 0.010
NM_019464 SH3-domain GRB2-like B1 (endophilin) -1.486 0.047
NM_134078 CHMP family, member 7 -1.488 0.005
NM_021412 matrix metallopeptidase 19 -1.488 0.022
NM_008872 plasminogen activator, tissue -1.489 0.043
NM_013529 Glutamine--fructose-6-phosphate aminotransferase [isomerizing] 2
-1.501 0.048
NM_001081130 oxoglutarate dehydrogenase-like -1.509 0.007
NM_009398 similar to TNF-stimulated gene 6 protein; tumor necrosis factor alpha induced protein 6
-1.511 0.007

Appendix A
- 46 -
NM_025599 RIKEN cDNA 2610528E23 gene -1.517 0.016
NM_146171 non-SMC condensin I complex, subunit D2 -1.524 0.026
NM_029023 serine carboxypeptidase 1 -1.538 0.008
NM_173441 IWS1 homolog (S. cerevisiae) -1.540 0.036
NM_147201 nuclear receptor binding protein 1 -1.547 0.038
NM_008605 matrix metallopeptidase 12 -1.552 0.030
NM_181414 phosphoinositide-3-kinase, class 3 -1.553 0.018
NM_001080773 3-phosphoinositide dependent protein kinase-1 -1.560 0.032
NM_008921 DNA primase, p49 subunit -1.569 0.033
NM_011871 protein kinase, interferon inducible double stranded RNA dependent activator
-1.576 0.017
NM_178708 PCI domain containing 2 -1.577 0.003
NM_172703 eukaryotic translation initiation factor 4 gamma, 3; similar to Eukaryotic translation initiation factor 4 gamma 3 (eIF-4-gamma 3) (eIF-4G 3) (eIF4G 3) (eIF-4-gamma II) (eIF4GII)
-1.618 0.021
NM_008788 procollagen C-endopeptidase enhancer protein -1.638 0.045
NM_010217 connective tissue growth factor -1.641 0.015
NM_178919 lipase maturation factor 2 -1.652 0.046
NM_009713 arylsulfatase A -1.652 0.006
NM_007620 predicted gene 5678; carbonyl reductase 1 -1.654 0.028
NM_011198 prostaglandin-endoperoxide synthase 2 -1.685 0.007
NM_183417 cyclin-dependent kinase 2 -1.686 0.001
NM_021605 NIMA (never in mitosis gene a)-related expressed kinase 7 -1.703 0.007
NM_025692 ubiquitin-like modifier activating enzyme 5 -1.711 0.002
NM_080445 similar to UDP-Gal:betaGal beta 1,3-galactosyltransferase, polypeptide 6; UDP-Gal:betaGal beta 1,3-galactosyltransferase, polypeptide 6
-1.770 0.003
Table 1-F: Differentially regulated CHO DP-12 proteins determined in samples corresponding
to culture using a decreased bioprocess media pH of 6.8.
RefSeq Annotation
Description Fold Change
P-value
NM_009075 ribose 5-phosphate isomerase A 1.815 0.004
NM_025797 cytochrome b-5 1.803 0.035
NM_009321 tubulin cofactor A; predicted gene 4374; predicted gene 6142; similar to cofactor A
1.752 0.048
NM_144930 expressed sequence AU018778 1.738 0.012
NM_029556 citrate lyase beta like 1.737 0.004
NM_138587 family with sequence similarity 3, member C 1.721 0.003
NM_010893 neuraminidase 1 1.720 0.036
NM_026842 ubiquilin 1 1.717 0.008
NM_146090 zinc binding alcohol dehydrogenase, domain containing 2 1.716 0.012
NM_011341 stromal cell derived factor 4 1.716 0.018
NM_144896 PET112-like (yeast) 1.716 0.008
NM_026013 transmembrane protein 77 1.716 0.009
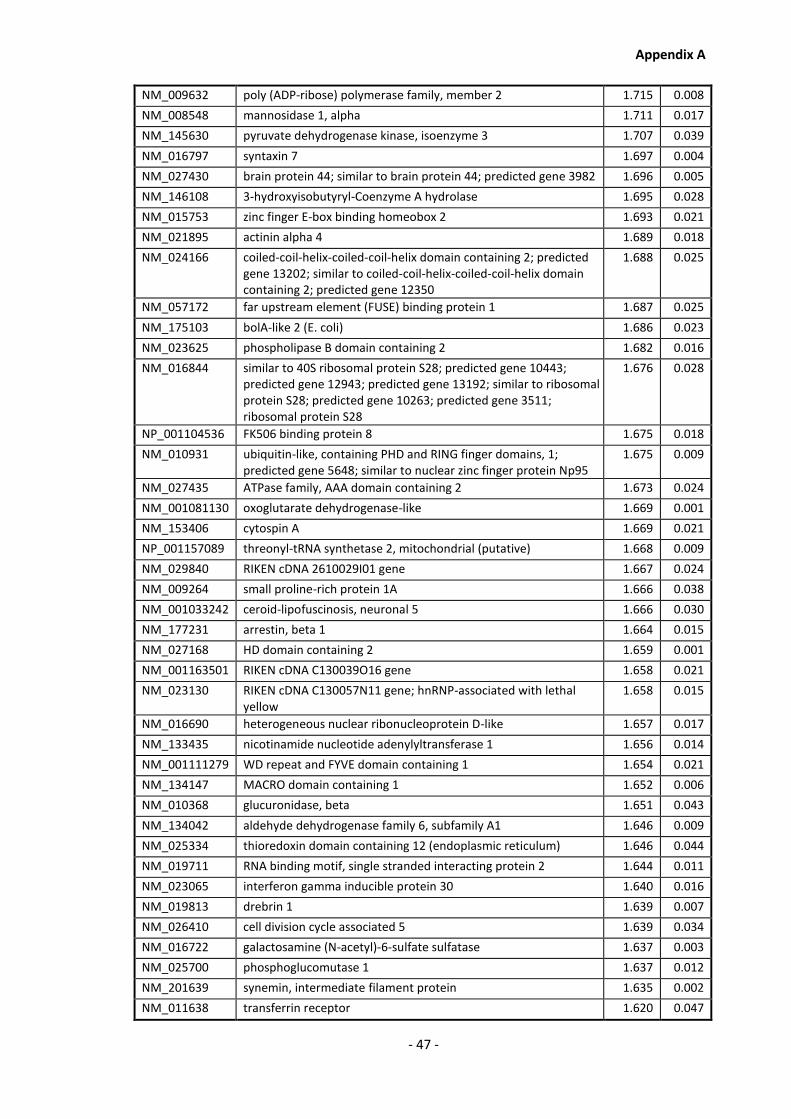
Appendix A
- 47 -
NM_009632 poly (ADP-ribose) polymerase family, member 2 1.715 0.008
NM_008548 mannosidase 1, alpha 1.711 0.017
NM_145630 pyruvate dehydrogenase kinase, isoenzyme 3 1.707 0.039
NM_016797 syntaxin 7 1.697 0.004
NM_027430 brain protein 44; similar to brain protein 44; predicted gene 3982 1.696 0.005
NM_146108 3-hydroxyisobutyryl-Coenzyme A hydrolase 1.695 0.028
NM_015753 zinc finger E-box binding homeobox 2 1.693 0.021
NM_021895 actinin alpha 4 1.689 0.018
NM_024166 coiled-coil-helix-coiled-coil-helix domain containing 2; predicted gene 13202; similar to coiled-coil-helix-coiled-coil-helix domain containing 2; predicted gene 12350
1.688 0.025
NM_057172 far upstream element (FUSE) binding protein 1 1.687 0.025
NM_175103 bolA-like 2 (E. coli) 1.686 0.023
NM_023625 phospholipase B domain containing 2 1.682 0.016
NM_016844 similar to 40S ribosomal protein S28; predicted gene 10443; predicted gene 12943; predicted gene 13192; similar to ribosomal protein S28; predicted gene 10263; predicted gene 3511; ribosomal protein S28
1.676 0.028
NP_001104536 FK506 binding protein 8 1.675 0.018
NM_010931 ubiquitin-like, containing PHD and RING finger domains, 1; predicted gene 5648; similar to nuclear zinc finger protein Np95
1.675 0.009
NM_027435 ATPase family, AAA domain containing 2 1.673 0.024
NM_001081130 oxoglutarate dehydrogenase-like 1.669 0.001
NM_153406 cytospin A 1.669 0.021
NP_001157089 threonyl-tRNA synthetase 2, mitochondrial (putative) 1.668 0.009
NM_029840 RIKEN cDNA 2610029I01 gene 1.667 0.024
NM_009264 small proline-rich protein 1A 1.666 0.038
NM_001033242 ceroid-lipofuscinosis, neuronal 5 1.666 0.030
NM_177231 arrestin, beta 1 1.664 0.015
NM_027168 HD domain containing 2 1.659 0.001
NM_001163501 RIKEN cDNA C130039O16 gene 1.658 0.021
NM_023130 RIKEN cDNA C130057N11 gene; hnRNP-associated with lethal yellow
1.658 0.015
NM_016690 heterogeneous nuclear ribonucleoprotein D-like 1.657 0.017
NM_133435 nicotinamide nucleotide adenylyltransferase 1 1.656 0.014
NM_001111279 WD repeat and FYVE domain containing 1 1.654 0.021
NM_134147 MACRO domain containing 1 1.652 0.006
NM_010368 glucuronidase, beta 1.651 0.043
NM_134042 aldehyde dehydrogenase family 6, subfamily A1 1.646 0.009
NM_025334 thioredoxin domain containing 12 (endoplasmic reticulum) 1.646 0.044
NM_019711 RNA binding motif, single stranded interacting protein 2 1.644 0.011
NM_023065 interferon gamma inducible protein 30 1.640 0.016
NM_019813 drebrin 1 1.639 0.007
NM_026410 cell division cycle associated 5 1.639 0.034
NM_016722 galactosamine (N-acetyl)-6-sulfate sulfatase 1.637 0.003
NM_025700 phosphoglucomutase 1 1.637 0.012
NM_201639 synemin, intermediate filament protein 1.635 0.002
NM_011638 transferrin receptor 1.620 0.047

Appendix A
- 48 -
NM_024249 solute carrier family 38, member 10 1.619 0.038
NM_028767 forkhead box P4 1.618 0.009
NM_026497 nudix (nucleoside diphosphate linked moiety X)-type motif 12 1.617 0.013
NM_029872 heterogeneous nuclear ribonucleoprotein A0 1.613 0.039
NM_009211 SWI/SNF related, matrix associated, actin dependent regulator of chromatin, subfamily c, member 1; predicted gene 7004
1.611 0.010
NM_007803 cortactin; predicted gene 8786 1.609 0.033
NM_177592 transmembrane protein 164 1.607 0.019
NM_025305 mitchondrial ribosomal protein S7 1.607 0.045
NM_025526 IscU iron-sulfur cluster scaffold homolog (E. coli); similar to nitrogen fixation cluster-like
1.607 0.006
NM_010729 lysyl oxidase-like 1 1.606 0.017
NM_001163622 prolyl endopeptidase-like 1.603 0.001
NM_023063 LIM domain and actin binding 1 1.600 0.021
NM_010027 D-dopachrome tautomerase 1.596 0.042
NM_013463 galactosidase, alpha 1.595 0.000
NM_010023 dodecenoyl-Coenzyme A delta isomerase (3,2 trans-enoyl-Coenyme A isomerase)
1.593 0.006
NM_008562 similar to myeloid cell leukemia sequence 1; myeloid cell leukemia sequence 1
1.591 0.002
NM_023733 carnitine O-octanoyltransferase 1.589 0.015
NM_011035 p21 protein (Cdc42/Rac)-activated kinase 1 1.588 0.008
NP_001191902 Bromodomain-containing protein 2 1.587 0.013
NM_080445 similar to UDP-Gal:betaGal beta 1,3-galactosyltransferase, polypeptide 6; UDP-Gal:betaGal beta 1,3-galactosyltransferase, polypeptide 6
1.586 0.005
NM_138753 hexamethylene bis-acetamide inducible 1 1.585 0.004
NM_153561 nudix (nucleoside diphosphate linked moiety X)-type motif 6 1.583 0.045
NM_026080 mitochondrial ribosomal protein S24 1.582 0.033
NM_026988 parathymosin 1.581 0.040
NM_175251 AT rich interactive domain 2 (ARID, RFX-like); RIKEN cDNA 1700124K17 gene
1.578 0.044
NM_008917 palmitoyl-protein thioesterase 1 1.577 0.010
NM_153176 spastic paraplegia 7 homolog (human) 1.574 0.005
NM_027289 5'-nucleotidase domain containing 2 1.571 0.031
NM_011933 2-4-dienoyl-Coenzyme A reductase 2, peroxisomal 1.570 0.001
NM_009074 macrophage stimulating 1 receptor (c-met-related tyrosine kinase) 1.569 0.025
NM_008305 perlecan (heparan sulfate proteoglycan 2) 1.569 0.005
NM_025988 acyl-Coenzyme A binding domain containing 4 1.569 0.001
NM_026672 glutathione S-transferase, mu 7 1.568 0.016
NM_016786 ubiquitin-conjugating enzyme E2K (UBC1 homolog, yeast) 1.567 0.017
NM_008549 mannosidase 2, alpha 1 1.567 0.000
NM_011296 predicted gene 10027; hypothetical protein LOC674425; predicted gene 6794; predicted gene 9175; similar to ribosomal protein S18; similar to ribosomal protein; ribosomal protein S18; predicted gene 11230; predicted gene 5321; predicted gene 10260; predict
1.561 0.010
NM_021278 thymosin, beta 4, X chromosome; similar to thymosin beta-4 1.552 0.035
NM_001045523 bromo adjacent homology domain containing 1 1.551 0.040
NM_009270 squalene epoxidase 1.549 0.002
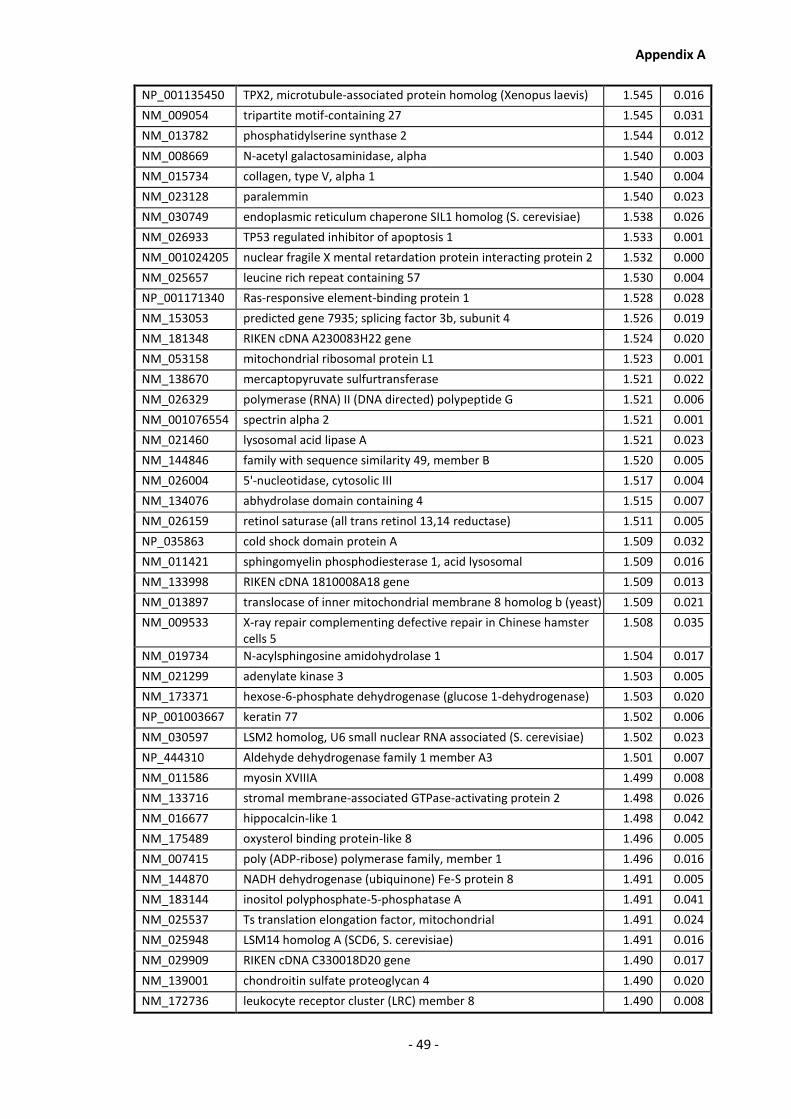
Appendix A
- 49 -
NP_001135450 TPX2, microtubule-associated protein homolog (Xenopus laevis) 1.545 0.016
NM_009054 tripartite motif-containing 27 1.545 0.031
NM_013782 phosphatidylserine synthase 2 1.544 0.012
NM_008669 N-acetyl galactosaminidase, alpha 1.540 0.003
NM_015734 collagen, type V, alpha 1 1.540 0.004
NM_023128 paralemmin 1.540 0.023
NM_030749 endoplasmic reticulum chaperone SIL1 homolog (S. cerevisiae) 1.538 0.026
NM_026933 TP53 regulated inhibitor of apoptosis 1 1.533 0.001
NM_001024205 nuclear fragile X mental retardation protein interacting protein 2 1.532 0.000
NM_025657 leucine rich repeat containing 57 1.530 0.004
NP_001171340 Ras-responsive element-binding protein 1 1.528 0.028
NM_153053 predicted gene 7935; splicing factor 3b, subunit 4 1.526 0.019
NM_181348 RIKEN cDNA A230083H22 gene 1.524 0.020
NM_053158 mitochondrial ribosomal protein L1 1.523 0.001
NM_138670 mercaptopyruvate sulfurtransferase 1.521 0.022
NM_026329 polymerase (RNA) II (DNA directed) polypeptide G 1.521 0.006
NM_001076554 spectrin alpha 2 1.521 0.001
NM_021460 lysosomal acid lipase A 1.521 0.023
NM_144846 family with sequence similarity 49, member B 1.520 0.005
NM_026004 5'-nucleotidase, cytosolic III 1.517 0.004
NM_134076 abhydrolase domain containing 4 1.515 0.007
NM_026159 retinol saturase (all trans retinol 13,14 reductase) 1.511 0.005
NP_035863 cold shock domain protein A 1.509 0.032
NM_011421 sphingomyelin phosphodiesterase 1, acid lysosomal 1.509 0.016
NM_133998 RIKEN cDNA 1810008A18 gene 1.509 0.013
NM_013897 translocase of inner mitochondrial membrane 8 homolog b (yeast) 1.509 0.021
NM_009533 X-ray repair complementing defective repair in Chinese hamster cells 5
1.508 0.035
NM_019734 N-acylsphingosine amidohydrolase 1 1.504 0.017
NM_021299 adenylate kinase 3 1.503 0.005
NM_173371 hexose-6-phosphate dehydrogenase (glucose 1-dehydrogenase) 1.503 0.020
NP_001003667 keratin 77 1.502 0.006
NM_030597 LSM2 homolog, U6 small nuclear RNA associated (S. cerevisiae) 1.502 0.023
NP_444310 Aldehyde dehydrogenase family 1 member A3 1.501 0.007
NM_011586 myosin XVIIIA 1.499 0.008
NM_133716 stromal membrane-associated GTPase-activating protein 2 1.498 0.026
NM_016677 hippocalcin-like 1 1.498 0.042
NM_175489 oxysterol binding protein-like 8 1.496 0.005
NM_007415 poly (ADP-ribose) polymerase family, member 1 1.496 0.016
NM_144870 NADH dehydrogenase (ubiquinone) Fe-S protein 8 1.491 0.005
NM_183144 inositol polyphosphate-5-phosphatase A 1.491 0.041
NM_025537 Ts translation elongation factor, mitochondrial 1.491 0.024
NM_025948 LSM14 homolog A (SCD6, S. cerevisiae) 1.491 0.016
NM_029909 RIKEN cDNA C330018D20 gene 1.490 0.017
NM_139001 chondroitin sulfate proteoglycan 4 1.490 0.020
NM_172736 leukocyte receptor cluster (LRC) member 8 1.490 0.008
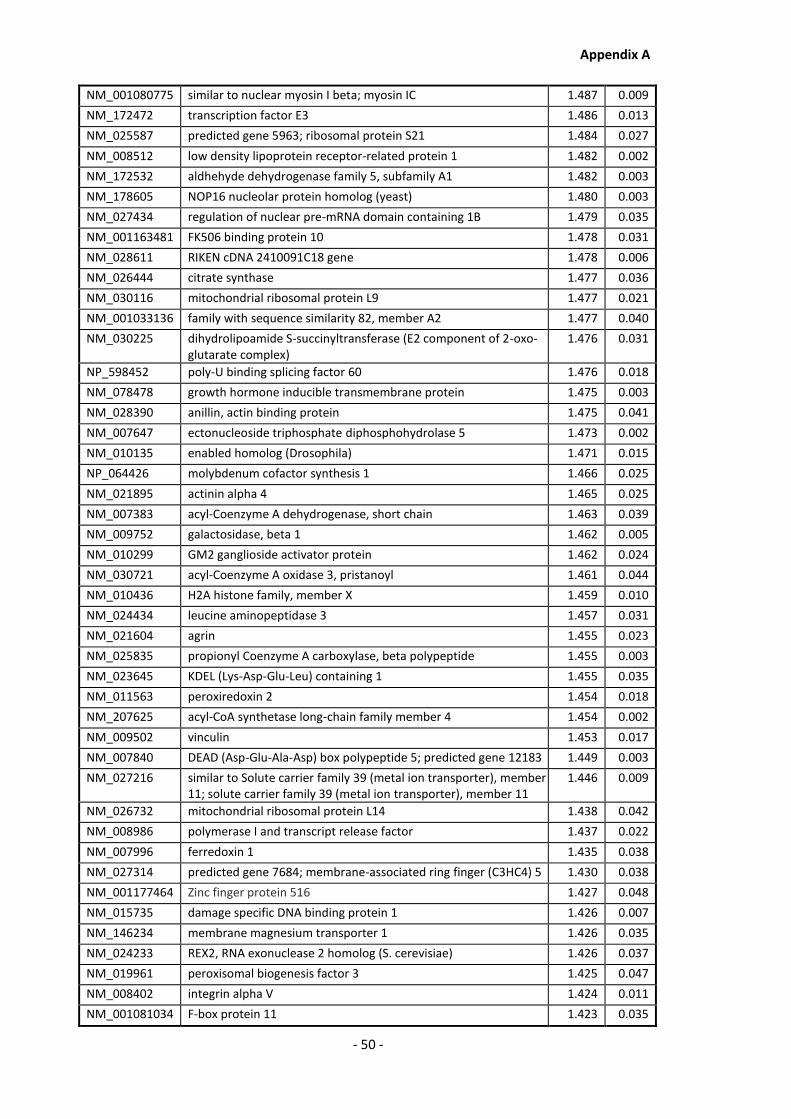
Appendix A
- 50 -
NM_001080775 similar to nuclear myosin I beta; myosin IC 1.487 0.009
NM_172472 transcription factor E3 1.486 0.013
NM_025587 predicted gene 5963; ribosomal protein S21 1.484 0.027
NM_008512 low density lipoprotein receptor-related protein 1 1.482 0.002
NM_172532 aldhehyde dehydrogenase family 5, subfamily A1 1.482 0.003
NM_178605 NOP16 nucleolar protein homolog (yeast) 1.480 0.003
NM_027434 regulation of nuclear pre-mRNA domain containing 1B 1.479 0.035
NM_001163481 FK506 binding protein 10 1.478 0.031
NM_028611 RIKEN cDNA 2410091C18 gene 1.478 0.006
NM_026444 citrate synthase 1.477 0.036
NM_030116 mitochondrial ribosomal protein L9 1.477 0.021
NM_001033136 family with sequence similarity 82, member A2 1.477 0.040
NM_030225 dihydrolipoamide S-succinyltransferase (E2 component of 2-oxo-glutarate complex)
1.476 0.031
NP_598452 poly-U binding splicing factor 60 1.476 0.018
NM_078478 growth hormone inducible transmembrane protein 1.475 0.003
NM_028390 anillin, actin binding protein 1.475 0.041
NM_007647 ectonucleoside triphosphate diphosphohydrolase 5 1.473 0.002
NM_010135 enabled homolog (Drosophila) 1.471 0.015
NP_064426 molybdenum cofactor synthesis 1 1.466 0.025
NM_021895 actinin alpha 4 1.465 0.025
NM_007383 acyl-Coenzyme A dehydrogenase, short chain 1.463 0.039
NM_009752 galactosidase, beta 1 1.462 0.005
NM_010299 GM2 ganglioside activator protein 1.462 0.024
NM_030721 acyl-Coenzyme A oxidase 3, pristanoyl 1.461 0.044
NM_010436 H2A histone family, member X 1.459 0.010
NM_024434 leucine aminopeptidase 3 1.457 0.031
NM_021604 agrin 1.455 0.023
NM_025835 propionyl Coenzyme A carboxylase, beta polypeptide 1.455 0.003
NM_023645 KDEL (Lys-Asp-Glu-Leu) containing 1 1.455 0.035
NM_011563 peroxiredoxin 2 1.454 0.018
NM_207625 acyl-CoA synthetase long-chain family member 4 1.454 0.002
NM_009502 vinculin 1.453 0.017
NM_007840 DEAD (Asp-Glu-Ala-Asp) box polypeptide 5; predicted gene 12183 1.449 0.003
NM_027216 similar to Solute carrier family 39 (metal ion transporter), member 11; solute carrier family 39 (metal ion transporter), member 11
1.446 0.009
NM_026732 mitochondrial ribosomal protein L14 1.438 0.042
NM_008986 polymerase I and transcript release factor 1.437 0.022
NM_007996 ferredoxin 1 1.435 0.038
NM_027314 predicted gene 7684; membrane-associated ring finger (C3HC4) 5 1.430 0.038
NM_001177464 Zinc finger protein 516 1.427 0.048
NM_015735 damage specific DNA binding protein 1 1.426 0.007
NM_146234 membrane magnesium transporter 1 1.426 0.035
NM_024233 REX2, RNA exonuclease 2 homolog (S. cerevisiae) 1.426 0.037
NM_019961 peroxisomal biogenesis factor 3 1.425 0.047
NM_008402 integrin alpha V 1.424 0.011
NM_001081034 F-box protein 11 1.423 0.035
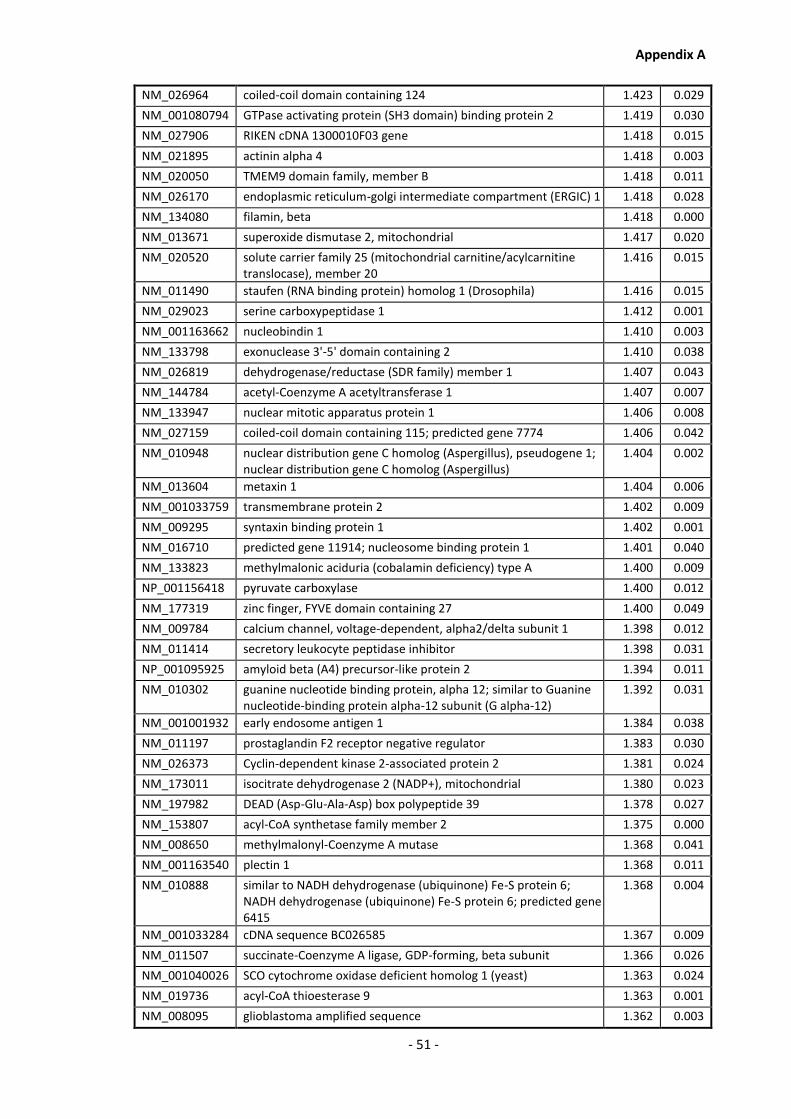
Appendix A
- 51 -
NM_026964 coiled-coil domain containing 124 1.423 0.029
NM_001080794 GTPase activating protein (SH3 domain) binding protein 2 1.419 0.030
NM_027906 RIKEN cDNA 1300010F03 gene 1.418 0.015
NM_021895 actinin alpha 4 1.418 0.003
NM_020050 TMEM9 domain family, member B 1.418 0.011
NM_026170 endoplasmic reticulum-golgi intermediate compartment (ERGIC) 1 1.418 0.028
NM_134080 filamin, beta 1.418 0.000
NM_013671 superoxide dismutase 2, mitochondrial 1.417 0.020
NM_020520 solute carrier family 25 (mitochondrial carnitine/acylcarnitine translocase), member 20
1.416 0.015
NM_011490 staufen (RNA binding protein) homolog 1 (Drosophila) 1.416 0.015
NM_029023 serine carboxypeptidase 1 1.412 0.001
NM_001163662 nucleobindin 1 1.410 0.003
NM_133798 exonuclease 3'-5' domain containing 2 1.410 0.038
NM_026819 dehydrogenase/reductase (SDR family) member 1 1.407 0.043
NM_144784 acetyl-Coenzyme A acetyltransferase 1 1.407 0.007
NM_133947 nuclear mitotic apparatus protein 1 1.406 0.008
NM_027159 coiled-coil domain containing 115; predicted gene 7774 1.406 0.042
NM_010948 nuclear distribution gene C homolog (Aspergillus), pseudogene 1; nuclear distribution gene C homolog (Aspergillus)
1.404 0.002
NM_013604 metaxin 1 1.404 0.006
NM_001033759 transmembrane protein 2 1.402 0.009
NM_009295 syntaxin binding protein 1 1.402 0.001
NM_016710 predicted gene 11914; nucleosome binding protein 1 1.401 0.040
NM_133823 methylmalonic aciduria (cobalamin deficiency) type A 1.400 0.009
NP_001156418 pyruvate carboxylase 1.400 0.012
NM_177319 zinc finger, FYVE domain containing 27 1.400 0.049
NM_009784 calcium channel, voltage-dependent, alpha2/delta subunit 1 1.398 0.012
NM_011414 secretory leukocyte peptidase inhibitor 1.398 0.031
NP_001095925 amyloid beta (A4) precursor-like protein 2 1.394 0.011
NM_010302 guanine nucleotide binding protein, alpha 12; similar to Guanine nucleotide-binding protein alpha-12 subunit (G alpha-12)
1.392 0.031
NM_001001932 early endosome antigen 1 1.384 0.038
NM_011197 prostaglandin F2 receptor negative regulator 1.383 0.030
NM_026373 Cyclin-dependent kinase 2-associated protein 2 1.381 0.024
NM_173011 isocitrate dehydrogenase 2 (NADP+), mitochondrial 1.380 0.023
NM_197982 DEAD (Asp-Glu-Ala-Asp) box polypeptide 39 1.378 0.027
NM_153807 acyl-CoA synthetase family member 2 1.375 0.000
NM_008650 methylmalonyl-Coenzyme A mutase 1.368 0.041
NM_001163540 plectin 1 1.368 0.011
NM_010888 similar to NADH dehydrogenase (ubiquinone) Fe-S protein 6; NADH dehydrogenase (ubiquinone) Fe-S protein 6; predicted gene 6415
1.368 0.004
NM_001033284 cDNA sequence BC026585 1.367 0.009
NM_011507 succinate-Coenzyme A ligase, GDP-forming, beta subunit 1.366 0.026
NM_001040026 SCO cytochrome oxidase deficient homolog 1 (yeast) 1.363 0.024
NM_019736 acyl-CoA thioesterase 9 1.363 0.001
NM_008095 glioblastoma amplified sequence 1.362 0.003
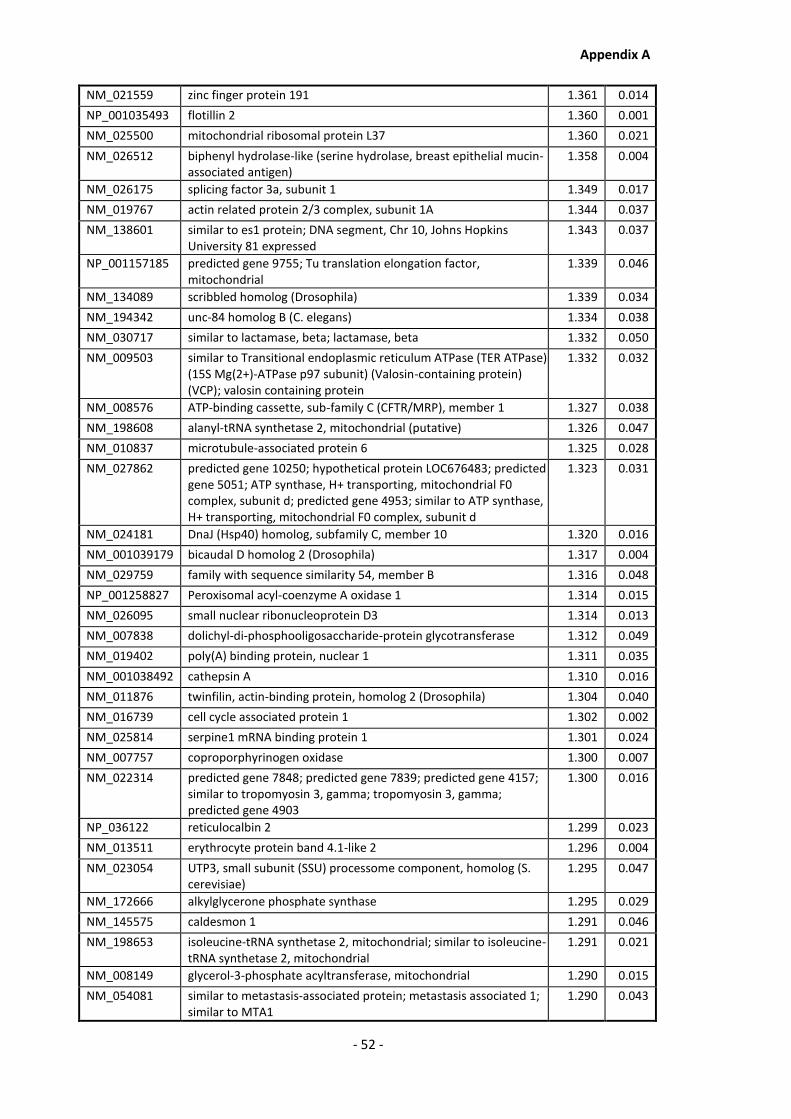
Appendix A
- 52 -
NM_021559 zinc finger protein 191 1.361 0.014
NP_001035493 flotillin 2 1.360 0.001
NM_025500 mitochondrial ribosomal protein L37 1.360 0.021
NM_026512 biphenyl hydrolase-like (serine hydrolase, breast epithelial mucin-associated antigen)
1.358 0.004
NM_026175 splicing factor 3a, subunit 1 1.349 0.017
NM_019767 actin related protein 2/3 complex, subunit 1A 1.344 0.037
NM_138601 similar to es1 protein; DNA segment, Chr 10, Johns Hopkins University 81 expressed
1.343 0.037
NP_001157185 predicted gene 9755; Tu translation elongation factor, mitochondrial
1.339 0.046
NM_134089 scribbled homolog (Drosophila) 1.339 0.034
NM_194342 unc-84 homolog B (C. elegans) 1.334 0.038
NM_030717 similar to lactamase, beta; lactamase, beta 1.332 0.050
NM_009503 similar to Transitional endoplasmic reticulum ATPase (TER ATPase) (15S Mg(2+)-ATPase p97 subunit) (Valosin-containing protein) (VCP); valosin containing protein
1.332 0.032
NM_008576 ATP-binding cassette, sub-family C (CFTR/MRP), member 1 1.327 0.038
NM_198608 alanyl-tRNA synthetase 2, mitochondrial (putative) 1.326 0.047
NM_010837 microtubule-associated protein 6 1.325 0.028
NM_027862 predicted gene 10250; hypothetical protein LOC676483; predicted gene 5051; ATP synthase, H+ transporting, mitochondrial F0 complex, subunit d; predicted gene 4953; similar to ATP synthase, H+ transporting, mitochondrial F0 complex, subunit d
1.323 0.031
NM_024181 DnaJ (Hsp40) homolog, subfamily C, member 10 1.320 0.016
NM_001039179 bicaudal D homolog 2 (Drosophila) 1.317 0.004
NM_029759 family with sequence similarity 54, member B 1.316 0.048
NP_001258827 Peroxisomal acyl-coenzyme A oxidase 1 1.314 0.015
NM_026095 small nuclear ribonucleoprotein D3 1.314 0.013
NM_007838 dolichyl-di-phosphooligosaccharide-protein glycotransferase 1.312 0.049
NM_019402 poly(A) binding protein, nuclear 1 1.311 0.035
NM_001038492 cathepsin A 1.310 0.016
NM_011876 twinfilin, actin-binding protein, homolog 2 (Drosophila) 1.304 0.040
NM_016739 cell cycle associated protein 1 1.302 0.002
NM_025814 serpine1 mRNA binding protein 1 1.301 0.024
NM_007757 coproporphyrinogen oxidase 1.300 0.007
NM_022314 predicted gene 7848; predicted gene 7839; predicted gene 4157; similar to tropomyosin 3, gamma; tropomyosin 3, gamma; predicted gene 4903
1.300 0.016
NP_036122 reticulocalbin 2 1.299 0.023
NM_013511 erythrocyte protein band 4.1-like 2 1.296 0.004
NM_023054 UTP3, small subunit (SSU) processome component, homolog (S. cerevisiae)
1.295 0.047
NM_172666 alkylglycerone phosphate synthase 1.295 0.029
NM_145575 caldesmon 1 1.291 0.046
NM_198653 isoleucine-tRNA synthetase 2, mitochondrial; similar to isoleucine-tRNA synthetase 2, mitochondrial
1.291 0.021
NM_008149 glycerol-3-phosphate acyltransferase, mitochondrial 1.290 0.015
NM_054081 similar to metastasis-associated protein; metastasis associated 1; similar to MTA1
1.290 0.043

Appendix A
- 53 -
NM_013651 splicing factor 3a, subunit 2 1.289 0.036
NM_001081260 tankyrase 1 binding protein 1 1.288 0.014
NM_172698 RIKEN cDNA 4732418C07 gene 1.284 0.022
NM_053123 SWI/SNF related, matrix associated, actin dependent regulator of chromatin, subfamily a, member 1
1.280 0.004
NM_025366 coiled-coil-helix-coiled-coil-helix domain containing 1 1.279 0.019
NM_011378 transcriptional regulator, SIN3A (yeast) 1.276 0.002
NM_026172 2,4-dienoyl CoA reductase 1, mitochondrial 1.274 0.004
NM_146176 CCR4-NOT transcription complex, subunit 3 1.269 0.003
NM_011173 protein S (alpha) 1.266 0.032
NM_019783 leprecan 1 1.265 0.032
NM_172591 FCH domain only 2 1.261 0.043
NM_021345 protein tyrosine phosphatase-like A domain containing 1 1.261 0.036
NM_025429 serine (or cysteine) peptidase inhibitor, clade B, member 1a 1.256 0.040
NM_016804 metaxin 2 1.249 0.000
NM_146034 CTAGE family, member 5 1.248 0.018
NM_146211 glycosyltransferase 25 domain containing 1 1.248 0.012
NM_016714 nucleoporin 50 1.243 0.044
NM_138747 NOP2 nucleolar protein homolog (yeast) 1.236 0.011
NM_011431 elongation factor Tu GTP binding domain containing 2 1.230 0.006
NM_175372 retinol dehydrogenase 13 (all-trans and 9-cis) 1.226 0.024
NM_019823 cytochrome P450, family 2, subfamily d, polypeptide 22 1.224 0.033
NM_008638 methylenetetrahydrofolate dehydrogenase (NAD+ dependent), methenyltetrahydrofolate cyclohydrolase
1.219 0.005
NM_009409 topoisomerase (DNA) II beta 1.217 0.020
NM_011333 chemokine (C-C motif) ligand 2 1.214 0.018
NM_009315 TAF6 RNA polymerase II, TATA box binding protein (TBP)-associated factor
1.212 0.001
NM_198326 NSFL1 (p97) cofactor (p47) 1.212 0.031
NM_007798 cathepsin B 1.210 0.010
NM_023409 Niemann Pick type C2 1.207 0.005
NM_172205 suprabasin 1.205 0.011
NM_019584 beclin 1, autophagy related -1.202 0.045
NM_009418 tripeptidyl peptidase II -1.202 0.011
NM_178405 ATPase, Na+/K+ transporting, alpha 2 polypeptide -1.204 0.013
NM_178347 CDC23 (cell division cycle 23, yeast, homolog) -1.207 0.038
NM_007414 ADP-ribosylarginine hydrolase -1.208 0.025
NM_007700 conserved helix-loop-helix ubiquitous kinase -1.210 0.025
NM_010546 inhibitor of kappaB kinase beta -1.212 0.035
NM_010890 neural precursor cell expressed, developmentally down-regulated 4
-1.213 0.004
NM_024172 HSPA (heat shock 70kDa) binding protein, cytoplasmic cochaperone 1
-1.216 0.041
NM_011099 predicted gene 6560; predicted gene 2124; predicted gene 6992; pyruvate kinase, muscle; similar to M2-type pyruvate kinase
-1.221 0.009
NM_198249 RIKEN cDNA E130112L23 gene -1.228 0.010
NM_007638 chaperonin containing Tcp1, subunit 7 (eta) -1.230 0.042
NM_001081193 LEM domain containing 3 -1.248 0.025

Appendix A
- 54 -
NM_181848 optineurin -1.249 0.016
NM_133708 GDP-mannose pyrophosphorylase A -1.250 0.037
NM_183417 cyclin-dependent kinase 2 -1.266 0.007
NM_134014 exportin 1, CRM1 homolog (yeast) -1.266 0.002
NM_153800 Rho GTPase activating protein 22 -1.269 0.041
NM_008684 neogenin -1.279 0.014
NM_001081011 SLIT-ROBO Rho GTPase activating protein 2 -1.279 0.012
NP_001116240 leucine rich repeat containing 8D -1.281 0.005
NM_013560 heat shock protein 1 -1.283 0.030
NM_001160319 ubiquitin protein ligase E3 component n-recognin 4 -1.287 0.047
NM_001163126 component of oligomeric golgi complex 5 -1.291 0.016
NM_025647 cytidine monophosphate (UMP-CMP) kinase 1; predicted gene 5867
-1.296 0.014
NM_001077363 polypyrimidine tract binding protein 1; predicted gene 4900 -1.302 0.023
NM_144913 methylphosphate capping enzyme -1.304 0.001
NM_133884 GPN-loop GTPase 2 -1.304 0.050
NM_029332 A kinase (PRKA) anchor protein 13 -1.304 0.019
NM_015765 heat shock protein 14 -1.306 0.015
NM_172277 sorting nexin 8 -1.310 0.022
NM_008302 heat shock protein 90 alpha (cytosolic), class B member 1 -1.310 0.017
NM_011018 sequestosome 1 -1.310 0.024
NM_008563 minichromosome maintenance deficient 3 (S. cerevisiae) -1.314 0.003
NM_008300 heat shock protein 4 -1.314 0.044
NM_001146268 platelet derived growth factor receptor, beta polypeptide -1.315 0.032
NM_133794 glutaminyl-tRNA synthetase -1.318 0.010
NM_133714 RIKEN cDNA 2310037I24 gene -1.318 0.015
NM_027350 asparaginyl-tRNA synthetase -1.319 0.009
NM_178616 predicted gene 14048; proteasome (prosome, macropain) 26S subunit, non-ATPase, 11
-1.319 0.037
NM_021884 tumor susceptibility gene 101 -1.319 0.041
NM_025599 RIKEN cDNA 2610528E23 gene -1.319 0.036
NM_146229 dynein cytoplasmic 1 light intermediate chain 1 -1.323 0.049
NM_145942 similar to Hmgcs1 protein; 3-hydroxy-3-methylglutaryl-Coenzyme A synthase 1
-1.328 0.045
NM_008328 similar to Interferon-activatable protein 203 (Ifi-203) (Interferon-inducible protein p203); similar to interferon activated gene 203; interferon activated gene 203
-1.339 0.013
NM_133838 EH-domain containing 4 -1.348 0.039
NM_023294 NDC80 homolog, kinetochore complex component (S. cerevisiae) -1.349 0.026
NM_009398 similar to TNF-stimulated gene 6 protein; tumor necrosis factor alpha induced protein 6
-1.351 0.009
NM_133360 predicted gene 5182; acetyl-Coenzyme A carboxylase alpha -1.353 0.015
NM_130862 brain-specific angiogenesis inhibitor 1-associated protein 2 -1.354 0.017
NM_033444 chloride intracellular channel 1 -1.354 0.032
NM_022410 myosin, heavy polypeptide 9, non-muscle -1.355 0.035
NM_008826 phosphofructokinase, liver, B-type -1.356 0.007
NM_026114 similar to Eukaryotic translation initiation factor 2 subunit 1 (Eukaryotic translation initiation factor 2 alpha subunit) (eIF-2-alpha) (EIF-2alpha) (EIF-2A); eukaryotic translation initiation factor
-1.357 0.017

Appendix A
- 55 -
2, subunit 1 alpha; predicted gene 7459
NM_025691 signal recognition particle 72 -1.364 0.029
NM_011035 p21 protein (Cdc42/Rac)-activated kinase 1 -1.364 0.022
NM_026370 MYST histone acetyltransferase 1 -1.365 0.036
NM_009673 annexin A5 -1.371 0.011
NM_026879 chromatin modifying protein 2B -1.371 0.001
NM_008565 minichromosome maintenance deficient 4 homolog (S. cerevisiae) -1.377 0.023
NM_012025 Rac GTPase-activating protein 1; predicted gene 1859 -1.383 0.000
NM_009840 chaperonin containing Tcp1, subunit 8 (theta) -1.384 0.029
NM_022022 ubiquitination factor E4B, UFD2 homolog (S. cerevisiae) -1.391 0.046
NM_009272 spermidine synthase -1.391 0.008
NM_180678 glycyl-tRNA synthetase -1.394 0.014
NM_009097 ribosomal protein S6 kinase polypeptide 1 -1.395 0.015
NM_030238 dynein cytoplasmic 1 heavy chain 1 -1.396 0.015
NM_001029895 arginyltransferase 1 -1.398 0.024
NM_144923 biliverdin reductase B (flavin reductase (NADPH)) -1.400 0.031
NM_080638 major vault protein -1.400 0.002
NM_025304 leucine carboxyl methyltransferase 1 -1.403 0.016
NM_027236 eukaryotic translation initiation factor 1A domain containing -1.403 0.038
NM_027807 cullin 5 -1.403 0.043
NM_008410 integral membrane protein 2B -1.410 0.034
NM_011830 predicted gene 15210; inosine 5'-phosphate dehydrogenase 2 -1.410 0.020
NM_145139 eukaryotic translation initiation factor 3, subunit L -1.411 0.025
NM_133826 ATPase, H+ transporting, lysosomal V1 subunit H -1.415 0.003
NM_001009947 dedicator of cytokinesis 11 -1.417 0.038
NM_025380 eukaryotic translation elongation factor 1 epsilon 1 -1.418 0.029
NM_016843 ataxin 10 -1.418 0.019
NM_013854 ATP-binding cassette, sub-family F (GCN20), member 1 -1.421 0.004
NM_007835 dynactin 1 -1.422 0.024
NM_029735 similar to Bifunctional aminoacyl-tRNA synthetase; glutamyl-prolyl-tRNA synthetase
-1.423 0.000
NM_201226 leucine rich repeat containing 47; similar to leucine rich repeat containing 47
-1.425 0.020
NM_009481 ubiquitin specific peptidase 9, X chromosome -1.426 0.011
NM_024267 importin 4 -1.426 0.011
NM_013477 ATPase, H+ transporting, lysosomal V0 subunit D1 -1.427 0.040
NM_026007 predicted gene 4462; similar to eukaryotic translation elongation factor 1 gamma; predicted gene 9276; predicted gene 5525; eukaryotic translation elongation factor 1 gamma; similar to Elongation factor 1-gamma (EF-1-gamma) (eEF-1B gamma); predicted gene
-1.427 0.010
NM_139144 O-linked N-acetylglucosamine (GlcNAc) transferase (UDP-N-acetylglucosamine:polypeptide-N-acetylglucosaminyl transferase)
-1.428 0.039
NM_013559 heat shock 105kDa/110kDa protein 1 -1.429 0.023
NM_025864 transmembrane protein 206 -1.430 0.034
NM_022563 discoidin domain receptor family, member 2 -1.431 0.007
NM_152801 Rac/Cdc42 guanine nucleotide exchange factor (GEF) 6 -1.432 0.013
NM_027498 similar to Serine/threonine-protein kinase QSK; cDNA sequence -1.433 0.033

Appendix A
- 56 -
BC033915
NM_008567 minichromosome maintenance deficient 6 (MIS5 homolog, S. pombe) (S. cerevisiae)
-1.435 0.001
NM_009842 CD151 antigen -1.435 0.008
NM_028864 zinc finger CCCH type, antiviral 1 -1.437 0.003
NM_027896 Coenzyme A synthase -1.439 0.043
NM_019780 vacuolar protein sorting 29 (S. pombe) -1.440 0.045
NM_021473 aldo-keto reductase family 1, member A4 (aldehyde reductase) -1.444 0.025
NP_663401 Microfibril-associated glycoprotein 3 -1.445 0.021
NM_010724 proteasome (prosome, macropain) subunit, beta type 8 (large multifunctional peptidase 7)
-1.447 0.008
NM_173010 ubiquitin protein ligase E3A -1.449 0.014
NM_146171 non-SMC condensin I complex, subunit D2 -1.451 0.024
NM_025697 RIKEN cDNA 6330409N04 gene -1.453 0.022
NM_016966 predicted gene 7669; predicted gene 5207; predicted gene 9252; predicted gene 8096; predicted gene 13337; predicted gene 9210; predicted gene 8341; predicted gene 5847; predicted gene 7901; predicted gene 9347; predicted gene, EG627427; similar to 3-phosp
-1.453 0.013
NM_012010 eukaryotic translation initiation factor 2, subunit 3, structural gene X-linked; similar to translation initiation factor eIF-2 gamma subunit; predicted gene 2223
-1.455 0.001
NM_172265 eukaryotic translation initiation factor 2B, subunit 5 epsilon -1.457 0.017
NM_177045 coiled-coil and C2 domain containing 1B -1.460 0.002
NM_026693 gamma-aminobutyric acid (GABA) A receptor-associated protein-like 2; predicted gene 3724
-1.468 0.007
NM_030210 acetoacetyl-CoA synthetase -1.468 0.018
NM_009072 Rho-associated coiled-coil containing protein kinase 2 -1.468 0.006
NM_028198 exportin 5 -1.471 0.005
NM_008084 predicted gene 4691; predicted gene 6944; predicted gene 10290; predicted gene 10566; predicted gene 10291; predicted gene 3200; predicted gene 12070; predicted gene 7286; predicted gene 6946; predicted gene 8825; predicted gene 9081; glyceraldehyde-3-pho
-1.476 0.012
NM_026295 CTD (carboxy-terminal domain, RNA polymerase II, polypeptide A) phosphatase, subunit 1
-1.478 0.006
NM_008605 matrix metallopeptidase 12 -1.478 0.028
NM_145527 MAP-kinase activating death domain -1.480 0.032
NM_008921 DNA primase, p49 subunit -1.486 0.048
NM_130862 brain-specific angiogenesis inhibitor 1-associated protein 2 -1.488 0.026
NM_134078 CHMP family, member 7 -1.491 0.021
NM_013471 annexin A4 -1.492 0.005
NM_021504 N-glycanase 1 -1.493 0.015
NM_177876 vacuolar protein sorting 37B (yeast) -1.494 0.007
NM_033074 threonyl-tRNA synthetase -1.494 0.007
XM_001479591 similar to Eukaryotic translation initiation factor 5; eukaryotic translation initiation factor 5
-1.495 0.036
NM_025816 Tax1 (human T-cell leukemia virus type I) binding protein 1 -1.495 0.012
NM_028032 protein phosphatase 2 (formerly 2A), regulatory subunit B (PR 52), alpha isoform
-1.496 0.022
NM_001031667 glycogen synthase kinase 3 alpha -1.497 0.035
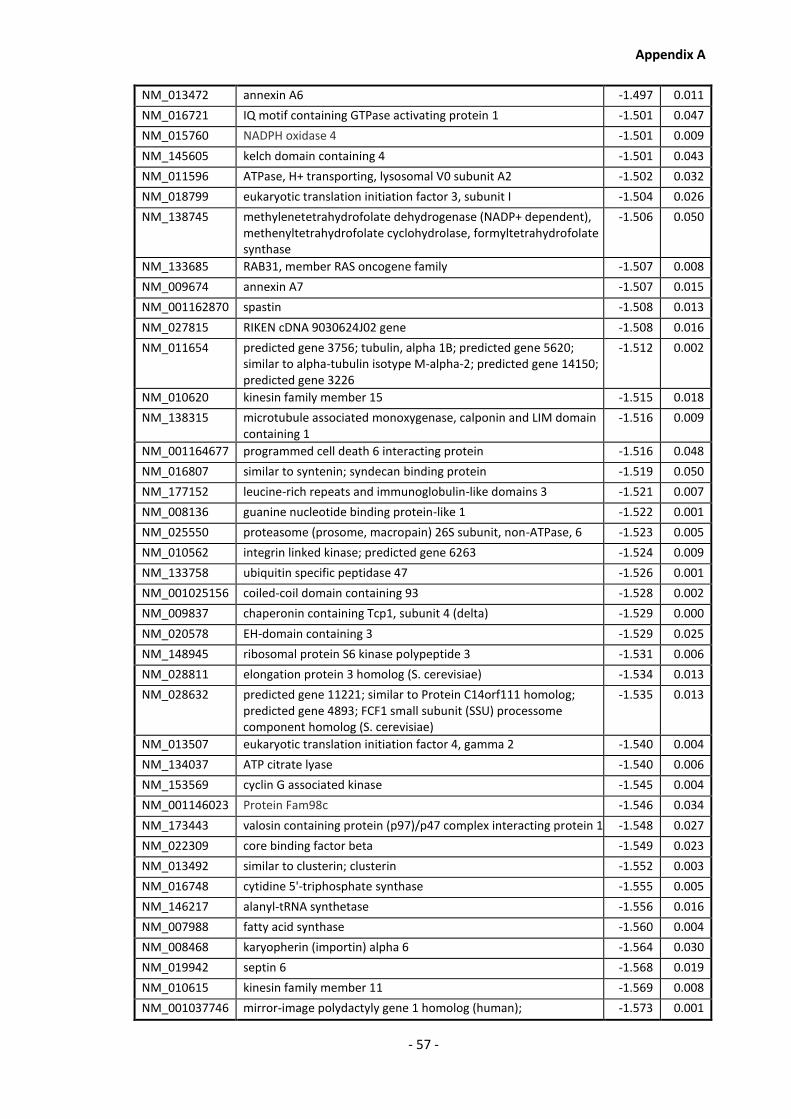
Appendix A
- 57 -
NM_013472 annexin A6 -1.497 0.011
NM_016721 IQ motif containing GTPase activating protein 1 -1.501 0.047
NM_015760 NADPH oxidase 4 -1.501 0.009
NM_145605 kelch domain containing 4 -1.501 0.043
NM_011596 ATPase, H+ transporting, lysosomal V0 subunit A2 -1.502 0.032
NM_018799 eukaryotic translation initiation factor 3, subunit I -1.504 0.026
NM_138745 methylenetetrahydrofolate dehydrogenase (NADP+ dependent), methenyltetrahydrofolate cyclohydrolase, formyltetrahydrofolate synthase
-1.506 0.050
NM_133685 RAB31, member RAS oncogene family -1.507 0.008
NM_009674 annexin A7 -1.507 0.015
NM_001162870 spastin -1.508 0.013
NM_027815 RIKEN cDNA 9030624J02 gene -1.508 0.016
NM_011654 predicted gene 3756; tubulin, alpha 1B; predicted gene 5620; similar to alpha-tubulin isotype M-alpha-2; predicted gene 14150; predicted gene 3226
-1.512 0.002
NM_010620 kinesin family member 15 -1.515 0.018
NM_138315 microtubule associated monoxygenase, calponin and LIM domain containing 1
-1.516 0.009
NM_001164677 programmed cell death 6 interacting protein -1.516 0.048
NM_016807 similar to syntenin; syndecan binding protein -1.519 0.050
NM_177152 leucine-rich repeats and immunoglobulin-like domains 3 -1.521 0.007
NM_008136 guanine nucleotide binding protein-like 1 -1.522 0.001
NM_025550 proteasome (prosome, macropain) 26S subunit, non-ATPase, 6 -1.523 0.005
NM_010562 integrin linked kinase; predicted gene 6263 -1.524 0.009
NM_133758 ubiquitin specific peptidase 47 -1.526 0.001
NM_001025156 coiled-coil domain containing 93 -1.528 0.002
NM_009837 chaperonin containing Tcp1, subunit 4 (delta) -1.529 0.000
NM_020578 EH-domain containing 3 -1.529 0.025
NM_148945 ribosomal protein S6 kinase polypeptide 3 -1.531 0.006
NM_028811 elongation protein 3 homolog (S. cerevisiae) -1.534 0.013
NM_028632 predicted gene 11221; similar to Protein C14orf111 homolog; predicted gene 4893; FCF1 small subunit (SSU) processome component homolog (S. cerevisiae)
-1.535 0.013
NM_013507 eukaryotic translation initiation factor 4, gamma 2 -1.540 0.004
NM_134037 ATP citrate lyase -1.540 0.006
NM_153569 cyclin G associated kinase -1.545 0.004
NM_001146023 Protein Fam98c -1.546 0.034
NM_173443 valosin containing protein (p97)/p47 complex interacting protein 1 -1.548 0.027
NM_022309 core binding factor beta -1.549 0.023
NM_013492 similar to clusterin; clusterin -1.552 0.003
NM_016748 cytidine 5'-triphosphate synthase -1.555 0.005
NM_146217 alanyl-tRNA synthetase -1.556 0.016
NM_007988 fatty acid synthase -1.560 0.004
NM_008468 karyopherin (importin) alpha 6 -1.564 0.030
NM_019942 septin 6 -1.568 0.019
NM_010615 kinesin family member 11 -1.569 0.008
NM_001037746 mirror-image polydactyly gene 1 homolog (human); -1.573 0.001

Appendix A
- 58 -
phosphoribosyl pyrophosphate synthetase 1; phosphoribosyl pyrophosphate synthetase 1-like 1
NM_080555 phosphatidic acid phosphatase type 2B -1.575 0.032
NM_013818 GTP binding protein 1 -1.575 0.042
NM_024281 ribosome binding protein 1 -1.576 0.004
NM_133786 structural maintenance of chromosomes 4 -1.578 0.035
NM_009370 transforming growth factor, beta receptor I -1.584 0.012
NM_008927 mitogen-activated protein kinase kinase 1 -1.584 0.035
NM_175195 RIKEN cDNA 3110056O03 gene -1.585 0.017
NM_023716 Tubulin beta-2B chain -1.590 0.029
NM_028724 similar to Ras and Rab interactor 2; Ras and Rab interactor 2 -1.592 0.015
NM_178376 Ras-related GTP binding A -1.592 0.004
NM_019795 DnaJ (Hsp40) homolog, subfamily C, member 7 -1.593 0.005
NM_009371 transforming growth factor, beta receptor II -1.600 0.009
NM_008788 procollagen C-endopeptidase enhancer protein -1.603 0.026
NM_029565 transmembrane protein 59 -1.605 0.000
NM_013529 Glutamine--fructose-6-phosphate aminotransferase [isomerizing] 2
-1.609 0.039
NM_030201 heat shock protein 70 family, member 13 -1.610 0.024
NM_001080773 3-phosphoinositide dependent protein kinase-1 -1.611 0.039
NM_172558 gem (nuclear organelle) associated protein 5 -1.616 0.013
NM_026662 phosphoribosyl pyrophosphate synthetase 2 -1.619 0.024
NM_153680 sorting nexin 17 -1.621 0.031
NM_008708 N-myristoyltransferase 2 -1.622 0.016
NM_025664 similar to Sorting nexin 9; sorting nexin 9 -1.624 0.000
NM_134100 major facilitator superfamily domain containing 5 -1.630 0.010
NM_009068 receptor (TNFRSF)-interacting serine-threonine kinase 1 -1.631 0.011
NM_009795 calpain, small subunit 1 -1.632 0.006
NM_198710 synaptophysin-like protein -1.645 0.022
NM_010233 fibronectin 1 -1.646 0.001
NM_007502 ATPase, Na+/K+ transporting, beta 3 polypeptide -1.649 0.010
NM_024229 phosphate cytidylyltransferase 2, ethanolamine -1.651 0.050
NM_013562 interferon-related developmental regulator 1 -1.653 0.006
NM_013469 annexin A11; predicted gene 2260; predicted gene 2274 -1.654 0.002
NM_147778 COMM domain containing 3 -1.661 0.024
NM_015747 solute carrier family 20, member 1 -1.662 0.022
NM_026969 Sec31 homolog A (S. cerevisiae) -1.663 0.007
NM_008668 Ngfi-A binding protein 2 -1.665 0.039
NM_146121 RAB GTPase activating protein 1 -1.666 0.009
NM_001102565 neural regeneration protein; alkB, alkylation repair homolog 1 (E. coli)
-1.671 0.009
NM_022332 suppression of tumorigenicity 7 -1.674 0.002
NM_010217 connective tissue growth factor -1.678 0.014
NM_007653 CD63 antigen -1.680 0.026
NM_028181 cell cycle progression 1 -1.681 0.006
NM_010684 lysosomal-associated membrane protein 1 -1.687 0.020
NM_153774 importin 9 -1.687 0.015

Appendix A
- 59 -
NM_007620 predicted gene 5678; carbonyl reductase 1 -1.697 0.020
NM_001159519 phosphoribosylformylglycinamidine synthase (FGAR amidotransferase)
-1.703 0.045
NM_026441 penta-EF hand domain containing 1 -1.710 0.027
NM_177304 ectonucleotide pyrophosphatase/phosphodiesterase 6 -1.712 0.000
NM_175121 solute carrier family 38, member 2 -1.714 0.011
NM_025343 required for meiotic nuclear division 1 homolog (S. cerevisiae); predicted gene 5512
-1.715 0.001
NM_012032 serine incorporator 3 -1.719 0.008
NM_181414 phosphoinositide-3-kinase, class 3 -1.720 0.007
NM_010169 coagulation factor II (thrombin) receptor -1.720 0.007
NM_010106 predicted gene 5869; predicted gene 7161; predicted gene 7105; predicted gene 5822; similar to eukaryotic translation elongation factor 1 alpha 1; predicted gene 6192; predicted gene 6392; predicted gene 6767; predicted gene 6170; predicted gene 6548; pre
-1.721 0.005
NP_062718 Nuclear receptor coactivator 4 -1.726 0.018
NM_018737 cytidine 5'-triphosphate synthase 2 -1.752 0.040
NM_010212 four and a half LIM domains 2 -1.754 0.011
NM_008676 neighbor of Brca1 gene 1 -1.771 0.005
NM_011930 chloride channel 7 -1.787 0.040
NM_153507 copine II -1.787 0.012

Appendix B
- 60 -
Appendix B
CHO K1 proteins determined to be significantly differentially regulated in CHO K1 cultures
prepared using spent media from CHO DP-12 cells cultured at altered Bioprocessing conditions
when compared to CHO K1 cells cultured using spent media from CHO DP-12 cells cultured
using standard Bioprocessing conditions. Proteomic samples were analysed using 2D-LC-MS3
and data analysed using Thermo Fisher ScientificTM Proteome DiscovererTM version 2.1.0.81
and InfernoRDN version 1.1.5970.31895.
Table 2-A: Differentially regulated CHO K1 proteins determined in samples corresponding to
culture using spent media from CHO DP-12 cells prepared under an increased bioprocess
temperature of 39.5oC.
RefSeq Annotation
Description Fold Change
P-value
NM_008669 N-acetyl galactosaminidase, alpha 1.809 0.002
NM_009082 similar to ribosomal protein; predicted gene 6344; predicted gene 11449; predicted gene 13841; predicted gene 8210; hypothetical protein LOC675793; ribosomal protein L29; predicted gene 12704; predicted gene 7252; predicted gene 8965; predicted gene 13213
1.768 0.026
NM_007737 collagen, type V, alpha 2 1.761 0.005
NM_015734 collagen, type V, alpha 1 1.751 0.005
NM_021519 predicted gene 11964; endothelial differentiation-related factor 1 1.749 0.011
NM_172262 amine oxidase, flavin containing 1 1.745 0.035
NM_177068 olfactomedin-like 2B 1.742 0.014
NM_028266 collagen, type XVI, alpha 1 1.718 0.003
NM_008047 follistatin-like 1 1.717 0.002
NM_207298 cerebral endothelial cell adhesion molecule 1.717 0.005
NM_009981 phosphate cytidylyltransferase 1, choline, alpha isoform 1.711 0.001
NM_011146 peroxisome proliferator activated receptor gamma 1.708 0.000
NP_001020788 calcium activated nucleotidase 1 1.706 0.015
NM_133886 expressed sequence AU040320 1.702 0.003
NM_001003949 open reading frame 61 1.698 0.014
NM_010191 predicted gene 6781; farnesyl diphosphate farnesyl transferase 1 1.692 0.008
NM_011341 stromal cell derived factor 4 1.691 0.015
NM_023232 diablo homolog (Drosophila) 1.686 0.027
NM_008675 neuroblastoma, suppression of tumorigenicity 1 1.683 0.028
NP_080444 ERGIC and golgi 2 1.681 0.030
NM_025571 predicted gene 9803; mitochondria-associated protein involved in granulocyte-macrophage colony-stimulating factor signal transduction
1.678 0.001
NM_026560 cell division cycle associated 8 1.677 0.011
NM_009346 TEA domain family member 1 1.671 0.035
NM_010756 similar to mafG; v-maf musculoaponeurotic fibrosarcoma 1.671 0.015

Appendix B
- 61 -
oncogene family, protein G (avian)
NM_133766 EFR3 homolog A (S. cerevisiae) 1.669 0.022
NM_011333 chemokine (C-C motif) ligand 2 1.669 0.006
NM_172205 suprabasin 1.664 0.031
NM_011173 protein S (alpha) 1.659 0.001
NP_663432 polyadenylate binding protein-interacting protein 1; similar to poly(A) binding protein interacting protein 1
1.659 0.012
NM_145606 chromatin modifying protein 1A; predicted gene 8515 1.650 0.038
NM_010517 insulin-like growth factor binding protein 4 1.646 0.042
NM_027478 RIKEN cDNA 5730494N06 gene; predicted gene 7368 1.644 0.000
NM_175021 sterile alpha motif domain containing 4B 1.633 0.004
NM_007801 cathepsin H 1.628 0.020
NM_010516 cysteine rich protein 61 1.624 0.003
NP_082223 zinc finger and BTB domain containing 43 1.624 0.037
NM_010380 histocompatibility 2, D region; histocompatibility 2, D region locus 1
1.623 0.014
NM_026752 zinc finger, FYVE domain containing 21 1.623 0.016
NM_008689 nuclear factor of kappa light polypeptide gene enhancer in B-cells 1, p105
1.623 0.043
NM_009101 Harvey rat sarcoma oncogene, subgroup R 1.621 0.006
NM_027852 retinoic acid receptor responder (tazarotene induced) 2 1.620 0.045
NM_010917 similar to Nidogen precursor (Entactin); nidogen 1; similar to Nid1 protein
1.616 0.016
NM_146065 activating transcription factor 7 1.616 0.040
NM_008305 perlecan (heparan sulfate proteoglycan 2) 1.615 0.003
NM_028945 DNA segment, Chr 14, Abbott 1 expressed 1.614 0.010
NM_144857 cDNA sequence BC011248 1.608 0.016
NM_130888 nuclear RNA export factor 7 1.606 0.015
NM_020010 cytochrome P450, family 51 1.604 0.034
NM_010592 Jun proto-oncogene related gene d 1.602 0.043
NM_012056 FK506 binding protein 9 1.601 0.019
NM_001039644 ER degradation enhancer, mannosidase alpha-like 3 1.596 0.016
NM_008139 guanine nucleotide binding protein, alpha q polypeptide 1.596 0.044
NM_022985 zinc finger, AN1-type domain 6 1.594 0.025
NM_028017 N-ethylmaleimide sensitive fusion protein attachment protein gamma
1.592 0.003
NM_015804 ATPase, class VI, type 11A 1.588 0.002
NM_181070 RAB18, member RAS oncogene family 1.583 0.013
NM_181278 RIKEN cDNA B230219D22 gene 1.577 0.015
NM_010931 ubiquitin-like, containing PHD and RING finger domains, 1; predicted gene 5648; similar to nuclear zinc finger protein Np95
1.576 0.010
NM_017478 coatomer protein complex, subunit gamma 2 1.574 0.024
NM_001037166 predicted gene 4925 1.574 0.016
NM_029658 family with sequence similarity 101, member B 1.572 0.015
NM_013866 zinc finger protein 385A 1.553 0.019
NM_025573 splicing factor, arginine/serine rich 9 1.550 0.020
NM_011961 procollagen lysine, 2-oxoglutarate 5-dioxygenase 2 1.548 0.040
NM_022328 myeloid/lymphoid or mixed-lineage leukemia (trithorax homolog, 1.548 0.001
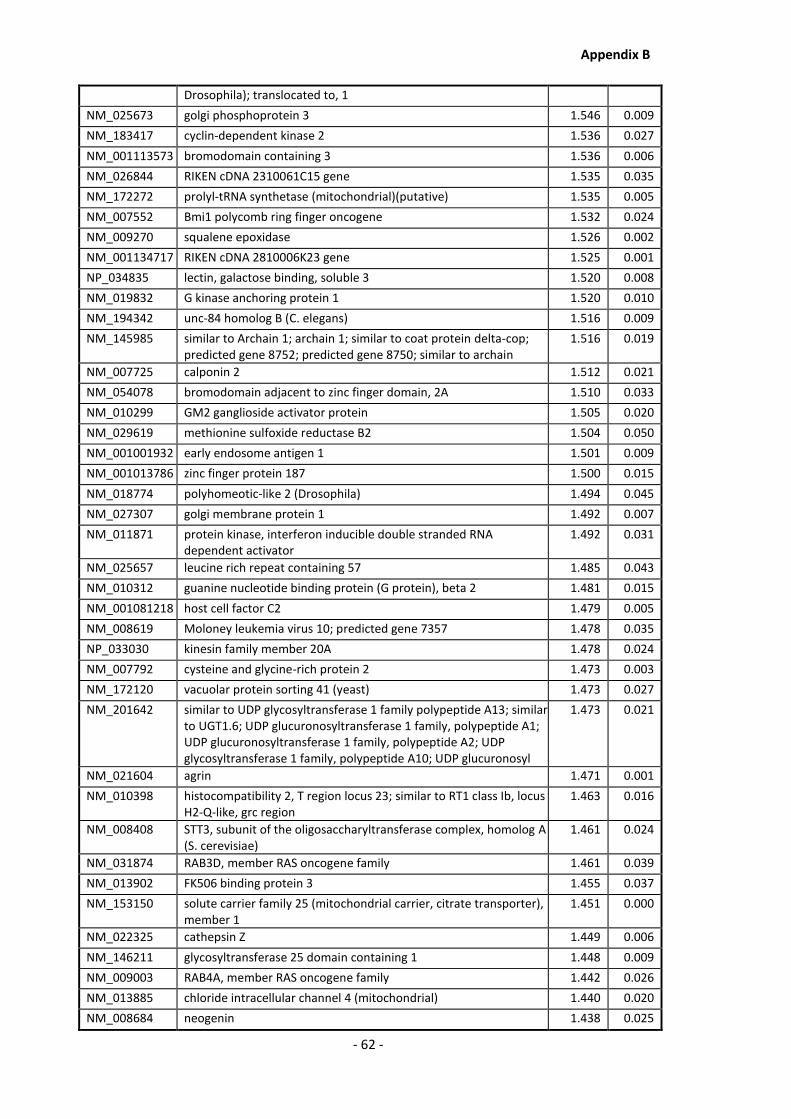
Appendix B
- 62 -
Drosophila); translocated to, 1
NM_025673 golgi phosphoprotein 3 1.546 0.009
NM_183417 cyclin-dependent kinase 2 1.536 0.027
NM_001113573 bromodomain containing 3 1.536 0.006
NM_026844 RIKEN cDNA 2310061C15 gene 1.535 0.035
NM_172272 prolyl-tRNA synthetase (mitochondrial)(putative) 1.535 0.005
NM_007552 Bmi1 polycomb ring finger oncogene 1.532 0.024
NM_009270 squalene epoxidase 1.526 0.002
NM_001134717 RIKEN cDNA 2810006K23 gene 1.525 0.001
NP_034835 lectin, galactose binding, soluble 3 1.520 0.008
NM_019832 G kinase anchoring protein 1 1.520 0.010
NM_194342 unc-84 homolog B (C. elegans) 1.516 0.009
NM_145985 similar to Archain 1; archain 1; similar to coat protein delta-cop; predicted gene 8752; predicted gene 8750; similar to archain
1.516 0.019
NM_007725 calponin 2 1.512 0.021
NM_054078 bromodomain adjacent to zinc finger domain, 2A 1.510 0.033
NM_010299 GM2 ganglioside activator protein 1.505 0.020
NM_029619 methionine sulfoxide reductase B2 1.504 0.050
NM_001001932 early endosome antigen 1 1.501 0.009
NM_001013786 zinc finger protein 187 1.500 0.015
NM_018774 polyhomeotic-like 2 (Drosophila) 1.494 0.045
NM_027307 golgi membrane protein 1 1.492 0.007
NM_011871 protein kinase, interferon inducible double stranded RNA dependent activator
1.492 0.031
NM_025657 leucine rich repeat containing 57 1.485 0.043
NM_010312 guanine nucleotide binding protein (G protein), beta 2 1.481 0.015
NM_001081218 host cell factor C2 1.479 0.005
NM_008619 Moloney leukemia virus 10; predicted gene 7357 1.478 0.035
NP_033030 kinesin family member 20A 1.478 0.024
NM_007792 cysteine and glycine-rich protein 2 1.473 0.003
NM_172120 vacuolar protein sorting 41 (yeast) 1.473 0.027
NM_201642 similar to UDP glycosyltransferase 1 family polypeptide A13; similar to UGT1.6; UDP glucuronosyltransferase 1 family, polypeptide A1; UDP glucuronosyltransferase 1 family, polypeptide A2; UDP glycosyltransferase 1 family, polypeptide A10; UDP glucuronosyl
1.473 0.021
NM_021604 agrin 1.471 0.001
NM_010398 histocompatibility 2, T region locus 23; similar to RT1 class Ib, locus H2-Q-like, grc region
1.463 0.016
NM_008408 STT3, subunit of the oligosaccharyltransferase complex, homolog A (S. cerevisiae)
1.461 0.024
NM_031874 RAB3D, member RAS oncogene family 1.461 0.039
NM_013902 FK506 binding protein 3 1.455 0.037
NM_153150 solute carrier family 25 (mitochondrial carrier, citrate transporter), member 1
1.451 0.000
NM_022325 cathepsin Z 1.449 0.006
NM_146211 glycosyltransferase 25 domain containing 1 1.448 0.009
NM_009003 RAB4A, member RAS oncogene family 1.442 0.026
NM_013885 chloride intracellular channel 4 (mitochondrial) 1.440 0.020
NM_008684 neogenin 1.438 0.025
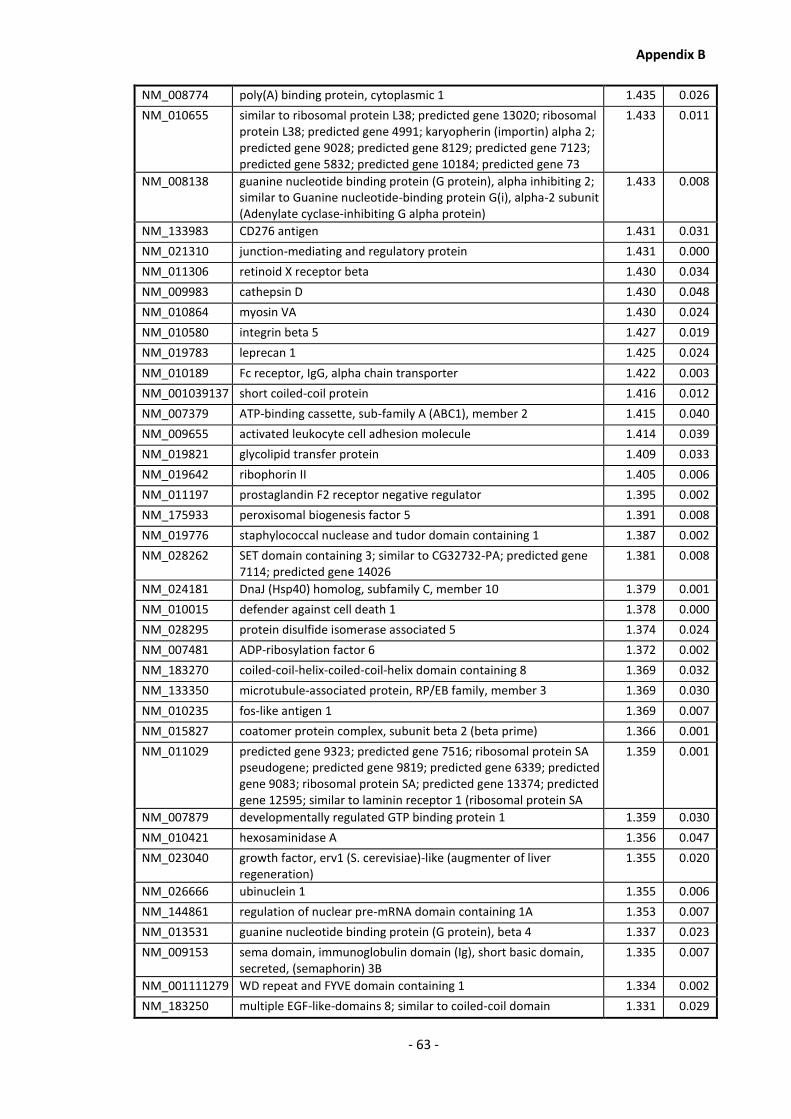
Appendix B
- 63 -
NM_008774 poly(A) binding protein, cytoplasmic 1 1.435 0.026
NM_010655 similar to ribosomal protein L38; predicted gene 13020; ribosomal protein L38; predicted gene 4991; karyopherin (importin) alpha 2; predicted gene 9028; predicted gene 8129; predicted gene 7123; predicted gene 5832; predicted gene 10184; predicted gene 73
1.433 0.011
NM_008138 guanine nucleotide binding protein (G protein), alpha inhibiting 2; similar to Guanine nucleotide-binding protein G(i), alpha-2 subunit (Adenylate cyclase-inhibiting G alpha protein)
1.433 0.008
NM_133983 CD276 antigen 1.431 0.031
NM_021310 junction-mediating and regulatory protein 1.431 0.000
NM_011306 retinoid X receptor beta 1.430 0.034
NM_009983 cathepsin D 1.430 0.048
NM_010864 myosin VA 1.430 0.024
NM_010580 integrin beta 5 1.427 0.019
NM_019783 leprecan 1 1.425 0.024
NM_010189 Fc receptor, IgG, alpha chain transporter 1.422 0.003
NM_001039137 short coiled-coil protein 1.416 0.012
NM_007379 ATP-binding cassette, sub-family A (ABC1), member 2 1.415 0.040
NM_009655 activated leukocyte cell adhesion molecule 1.414 0.039
NM_019821 glycolipid transfer protein 1.409 0.033
NM_019642 ribophorin II 1.405 0.006
NM_011197 prostaglandin F2 receptor negative regulator 1.395 0.002
NM_175933 peroxisomal biogenesis factor 5 1.391 0.008
NM_019776 staphylococcal nuclease and tudor domain containing 1 1.387 0.002
NM_028262 SET domain containing 3; similar to CG32732-PA; predicted gene 7114; predicted gene 14026
1.381 0.008
NM_024181 DnaJ (Hsp40) homolog, subfamily C, member 10 1.379 0.001
NM_010015 defender against cell death 1 1.378 0.000
NM_028295 protein disulfide isomerase associated 5 1.374 0.024
NM_007481 ADP-ribosylation factor 6 1.372 0.002
NM_183270 coiled-coil-helix-coiled-coil-helix domain containing 8 1.369 0.032
NM_133350 microtubule-associated protein, RP/EB family, member 3 1.369 0.030
NM_010235 fos-like antigen 1 1.369 0.007
NM_015827 coatomer protein complex, subunit beta 2 (beta prime) 1.366 0.001
NM_011029 predicted gene 9323; predicted gene 7516; ribosomal protein SA pseudogene; predicted gene 9819; predicted gene 6339; predicted gene 9083; ribosomal protein SA; predicted gene 13374; predicted gene 12595; similar to laminin receptor 1 (ribosomal protein SA
1.359 0.001
NM_007879 developmentally regulated GTP binding protein 1 1.359 0.030
NM_010421 hexosaminidase A 1.356 0.047
NM_023040 growth factor, erv1 (S. cerevisiae)-like (augmenter of liver regeneration)
1.355 0.020
NM_026666 ubinuclein 1 1.355 0.006
NM_144861 regulation of nuclear pre-mRNA domain containing 1A 1.353 0.007
NM_013531 guanine nucleotide binding protein (G protein), beta 4 1.337 0.023
NM_009153 sema domain, immunoglobulin domain (Ig), short basic domain, secreted, (semaphorin) 3B
1.335 0.007
NM_001111279 WD repeat and FYVE domain containing 1 1.334 0.002
NM_183250 multiple EGF-like-domains 8; similar to coiled-coil domain 1.331 0.029

Appendix B
- 64 -
containing 72; coiled-coil domain containing 72; predicted gene 7526; predicted gene 9613; predicted gene 15235; predicted gene 14200
NM_007798 cathepsin B 1.330 0.034
NM_001076554 spectrin alpha 2 1.321 0.017
NM_008686 nuclear factor, erythroid derived 2,-like 1 1.319 0.018
NM_019734 N-acylsphingosine amidohydrolase 1 1.318 0.031
NM_133808 high density lipoprotein (HDL) binding protein 1.318 0.045
NM_026533 similar to ribosomal protein S13; predicted gene 12270; predicted gene 6834; predicted gene 15483; predicted gene 6573; ribosomal protein S13; predicted gene 10159
1.311 0.016
NM_009033 RNA binding motif protein, X chromosome retrogene 1.307 0.015
NM_178628 predicted gene 3086; atlastin GTPase 1; similar to Spg3a protein 1.300 0.006
NM_010368 glucuronidase, beta 1.297 0.021
NM_011127 paired related homeobox 1 1.296 0.048
NM_010757 v-maf musculoaponeurotic fibrosarcoma oncogene family, protein K (avian)
1.293 0.018
NP_001029138 similar to adenylate kinase 2; adenylate kinase 2 1.286 0.011
NM_010435 histone cell cycle regulation defective homolog A (S. cerevisiae) 1.286 0.016
NM_033370 coatomer protein complex, subunit beta 1 1.280 0.001
NM_008064 glucosidase, alpha, acid 1.270 0.016
NM_007475 predicted gene 9625; predicted gene 14165; similar to acidic ribosomal phosphoprotein P0; predicted gene 8730; predicted gene 9093; ribosomal protein, large, P0
1.269 0.044
NM_020296 RNA binding motif, single stranded interacting protein 1 1.264 0.022
NM_001163481 FK506 binding protein 10 1.262 0.018
NP_001164011 predicted gene 9308; basic transcription factor 3; predicted gene 3531; predicted gene 7973
1.256 0.026
NM_178660 RNA binding motif, single stranded interacting protein 1.254 0.016
NM_145553 predicted gene 7527; family with sequence similarity 76, member A
1.251 0.041
NM_007602 calpain 5 1.250 0.007
NM_001168488 multiple endocrine neoplasia 1 1.247 0.030
NM_019806 vesicle-associated membrane protein, associated protein B and C 1.242 0.021
NM_175115 IKAROS family zinc finger 5 1.239 0.017
NM_009784 calcium channel, voltage-dependent, alpha2/delta subunit 1 1.239 0.008
NM_173371 hexose-6-phosphate dehydrogenase (glucose 1-dehydrogenase) 1.237 0.006
NM_023348 synaptosomal-associated protein 29 1.229 0.021
NM_133933 ribophorin I 1.228 0.026
NM_207176 testis derived transcript 1.228 0.039
NM_009938 coatomer protein complex subunit alpha 1.225 0.002
NM_007886 dystrobrevin, beta 1.223 0.028
NM_022997 vacuolar protein sorting 35 1.222 0.022
NM_011289 predicted gene 6599; predicted gene 6199; predicted gene 6341; predicted gene 6301; predicted gene 11518; similar to ribosomal protein L27; ribosomal protein L27; predicted gene 7053; predicted gene 11552; predicted gene 15730
1.222 0.036
NM_008416 Jun-B oncogene 1.212 0.040
NM_026620 family with sequence similarity 98, member B 1.211 0.032
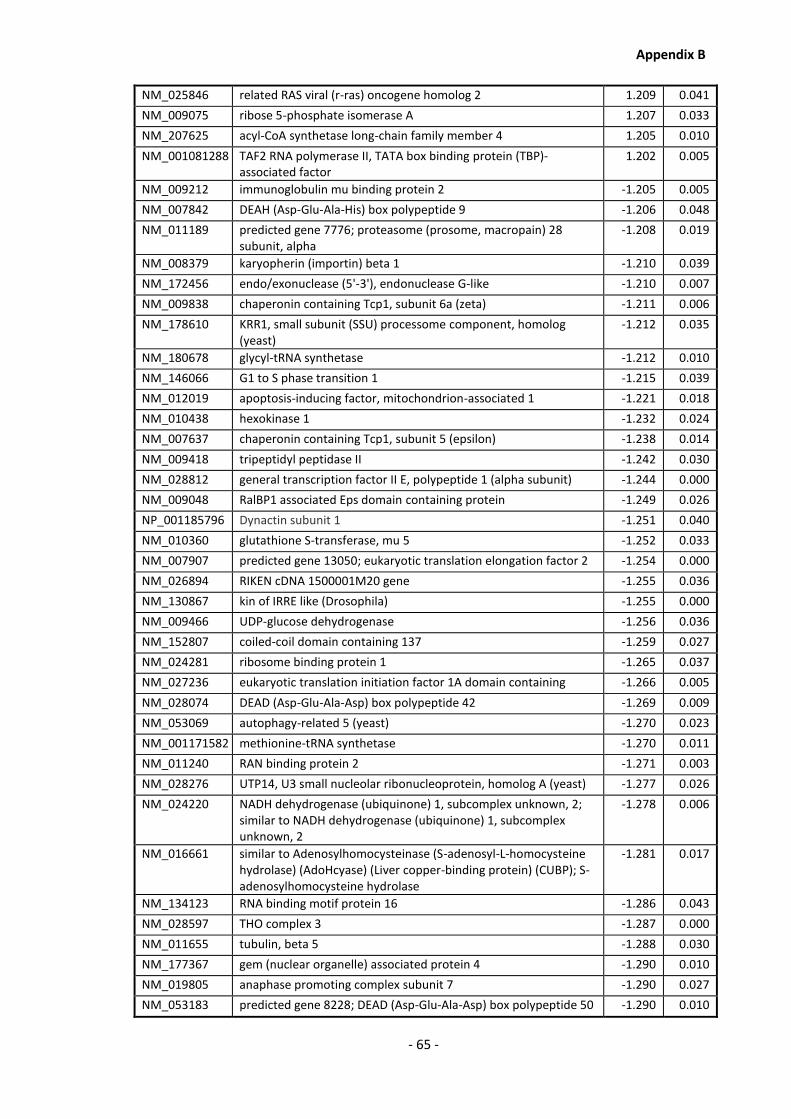
Appendix B
- 65 -
NM_025846 related RAS viral (r-ras) oncogene homolog 2 1.209 0.041
NM_009075 ribose 5-phosphate isomerase A 1.207 0.033
NM_207625 acyl-CoA synthetase long-chain family member 4 1.205 0.010
NM_001081288 TAF2 RNA polymerase II, TATA box binding protein (TBP)-associated factor
1.202 0.005
NM_009212 immunoglobulin mu binding protein 2 -1.205 0.005
NM_007842 DEAH (Asp-Glu-Ala-His) box polypeptide 9 -1.206 0.048
NM_011189 predicted gene 7776; proteasome (prosome, macropain) 28 subunit, alpha
-1.208 0.019
NM_008379 karyopherin (importin) beta 1 -1.210 0.039
NM_172456 endo/exonuclease (5'-3'), endonuclease G-like -1.210 0.007
NM_009838 chaperonin containing Tcp1, subunit 6a (zeta) -1.211 0.006
NM_178610 KRR1, small subunit (SSU) processome component, homolog (yeast)
-1.212 0.035
NM_180678 glycyl-tRNA synthetase -1.212 0.010
NM_146066 G1 to S phase transition 1 -1.215 0.039
NM_012019 apoptosis-inducing factor, mitochondrion-associated 1 -1.221 0.018
NM_010438 hexokinase 1 -1.232 0.024
NM_007637 chaperonin containing Tcp1, subunit 5 (epsilon) -1.238 0.014
NM_009418 tripeptidyl peptidase II -1.242 0.030
NM_028812 general transcription factor II E, polypeptide 1 (alpha subunit) -1.244 0.000
NM_009048 RalBP1 associated Eps domain containing protein -1.249 0.026
NP_001185796 Dynactin subunit 1 -1.251 0.040
NM_010360 glutathione S-transferase, mu 5 -1.252 0.033
NM_007907 predicted gene 13050; eukaryotic translation elongation factor 2 -1.254 0.000
NM_026894 RIKEN cDNA 1500001M20 gene -1.255 0.036
NM_130867 kin of IRRE like (Drosophila) -1.255 0.000
NM_009466 UDP-glucose dehydrogenase -1.256 0.036
NM_152807 coiled-coil domain containing 137 -1.259 0.027
NM_024281 ribosome binding protein 1 -1.265 0.037
NM_027236 eukaryotic translation initiation factor 1A domain containing -1.266 0.005
NM_028074 DEAD (Asp-Glu-Ala-Asp) box polypeptide 42 -1.269 0.009
NM_053069 autophagy-related 5 (yeast) -1.270 0.023
NM_001171582 methionine-tRNA synthetase -1.270 0.011
NM_011240 RAN binding protein 2 -1.271 0.003
NM_028276 UTP14, U3 small nucleolar ribonucleoprotein, homolog A (yeast) -1.277 0.026
NM_024220 NADH dehydrogenase (ubiquinone) 1, subcomplex unknown, 2; similar to NADH dehydrogenase (ubiquinone) 1, subcomplex unknown, 2
-1.278 0.006
NM_016661 similar to Adenosylhomocysteinase (S-adenosyl-L-homocysteine hydrolase) (AdoHcyase) (Liver copper-binding protein) (CUBP); S-adenosylhomocysteine hydrolase
-1.281 0.017
NM_134123 RNA binding motif protein 16 -1.286 0.043
NM_028597 THO complex 3 -1.287 0.000
NM_011655 tubulin, beta 5 -1.288 0.030
NM_177367 gem (nuclear organelle) associated protein 4 -1.290 0.010
NM_019805 anaphase promoting complex subunit 7 -1.290 0.027
NM_053183 predicted gene 8228; DEAD (Asp-Glu-Ala-Asp) box polypeptide 50 -1.290 0.010

Appendix B
- 66 -
NM_025824 predicted gene 11652; predicted gene 5191; basic leucine zipper and W2 domains 1
-1.291 0.002
NM_011680 similar to USF2; upstream transcription factor 2 -1.292 0.033
NM_001039474 transcription elongation regulator 1 (CA150) -1.293 0.022
NM_010173 fatty acid amide hydrolase -1.296 0.043
NM_029525 phosphatidylinositol-3,4,5-trisphosphate-dependent Rac exchange factor 2
-1.297 0.004
NM_178700 G-rich RNA sequence binding factor 1 -1.298 0.005
NM_007687 cofilin 1, non-muscle; similar to Cofilin-1 (Cofilin, non-muscle isoform); predicted gene 6180
-1.299 0.001
NM_026114 similar to Eukaryotic translation initiation factor 2 subunit 1 (Eukaryotic translation initiation factor 2 alpha subunit) (eIF-2-alpha) (EIF-2alpha) (EIF-2A); eukaryotic translation initiation factor 2, subunit 1 alpha; predicted gene 7459
-1.301 0.007
NM_016799 serine/arginine repetitive matrix 1 -1.303 0.018
NM_025692 ubiquitin-like modifier activating enzyme 5 -1.303 0.019
NM_030035 golgi autoantigen, golgin subfamily b, macrogolgin 1 -1.304 0.003
NM_011319 seryl-aminoacyl-tRNA synthetase -1.307 0.007
NM_017379 tubulin, alpha 8 -1.307 0.020
NM_178213 histone cluster 2, H2ab -1.308 0.014
NM_009088 polymerase (RNA) I polypeptide A -1.311 0.012
NM_134125 thyroid hormone receptor interactor 10 -1.313 0.026
NM_008014 protein phosphatase 1G (formerly 2C), magnesium-dependent, gamma isoform
-1.319 0.027
NM_133925 RNA binding motif protein 28 -1.323 0.008
NM_175294 nuclear casein kinase and cyclin-dependent kinase substrate 1 -1.329 0.036
NM_008481 laminin, alpha 2 -1.335 0.035
NM_001081247 polymerase (RNA) III (DNA directed) polypeptide A -1.335 0.030
NM_030238 dynein cytoplasmic 1 heavy chain 1 -1.339 0.030
NM_198303 eukaryotic translation initiation factor 5B -1.339 0.022
NM_026171 nuclear VCP-like -1.340 0.005
NM_028782 lon peptidase 1, mitochondrial -1.344 0.006
NM_026816 general transcription factor IIF, polypeptide 2 -1.345 0.001
NM_133716 stromal membrane-associated GTPase-activating protein 2 -1.346 0.039
NM_152803 heparanase -1.349 0.004
NM_009933 collagen, type VI, alpha 1 -1.358 0.042
NM_146229 dynein cytoplasmic 1 light intermediate chain 1 -1.358 0.010
NM_172381 expressed sequence AI314180 -1.359 0.020
NM_011714 bromodomain adjacent to zinc finger domain, 1B -1.364 0.018
NM_007858 diaphanous homolog 1 (Drosophila) -1.367 0.035
NM_023119 predicted gene 4735; enolase 1, alpha non-neuron; similar to enolase 1, alpha non-neuron; hypothetical protein LOC100044223; predicted gene 5506; predicted gene 5855; hypothetical protein LOC100045967
-1.371 0.015
NM_009388 transketolase -1.374 0.003
NM_026662 phosphoribosyl pyrophosphate synthetase 2 -1.376 0.002
NM_008826 phosphofructokinase, liver, B-type -1.380 0.030
NM_007949 excision repair cross-complementing rodent repair deficiency, complementation group 2
-1.380 0.017

Appendix B
- 67 -
NM_007530 B-cell receptor-associated protein 29 -1.381 0.006
NM_008537 alpha-methylacyl-CoA racemase -1.388 0.023
NM_019869 RNA binding motif protein 14 -1.395 0.000
NM_144825 TAO kinase 1 -1.396 0.033
NM_145625 eukaryotic translation initiation factor 4B -1.397 0.006
NM_021884 tumor susceptibility gene 101 -1.401 0.008
NM_172407 CDKN2A interacting protein -1.412 0.001
NP_001106817 similar to Transcriptional repressor p66 alpha (GATA zinc finger domain-containing protein 2A); GATA zinc finger domain containing 2A
-1.414 0.042
NM_015728 solute carrier family 33 (acetyl-CoA transporter), member 1 -1.417 0.041
NM_021511 predicted gene 5067; RRS1 ribosome biogenesis regulator homolog (S. cerevisiae)
-1.420 0.025
NM_144731 UDP-N-acetyl-alpha-D-galactosamine: polypeptide N-acetylgalactosaminyltransferase 7
-1.422 0.012
NM_145416 KRI1 homolog (S. cerevisiae) -1.426 0.002
NM_001081043 protein tyrosine phosphatase, non-receptor type 23 -1.429 0.008
NM_010830 mutS homolog 6 (E. coli) -1.432 0.028
NM_019763 SPEN homolog, transcriptional regulator (Drosophila) -1.433 0.038
NM_027016 SEC62 homolog (S. cerevisiae) -1.439 0.017
NM_011076 ATP-binding cassette, sub-family B (MDR/TAP), member 1A -1.441 0.009
NM_013768 protein arginine N-methyltransferase 5 -1.442 0.006
NM_029437 cytoskeleton associated protein 5 -1.442 0.005
NM_026476 RIKEN cDNA 2610101N10 gene -1.448 0.016
NM_028083 chromatin assembly factor 1, subunit B (p60) -1.450 0.013
NM_011574 cirrhosis, autosomal recessive 1A (human) -1.457 0.007
NM_144543 thymocyte nuclear protein 1 -1.457 0.004
NM_133921 nuclear transcription factor, X-box binding-like 1 -1.457 0.007
NM_009481 ubiquitin specific peptidase 9, X chromosome -1.461 0.004
NM_029600 ATP-binding cassette, sub-family C (CFTR/MRP), member 3 -1.462 0.007
NM_027379 fatty acyl CoA reductase 1 -1.464 0.025
NM_026370 MYST histone acetyltransferase 1 -1.465 0.038
NM_027346 coiled-coil domain containing 44 -1.468 0.009
NM_011654 predicted gene 3756; tubulin, alpha 1B; predicted gene 5620; similar to alpha-tubulin isotype M-alpha-2; predicted gene 14150; predicted gene 3226
-1.470 0.025
NM_178923 splicing factor, arginine/serine-rich 15 -1.479 0.035
NP_001258788 Beta-adducin -1.481 0.018
NM_019553 DEAD (Asp-Glu-Ala-Asp) box polypeptide 21 -1.481 0.002
NM_013507 eukaryotic translation initiation factor 4, gamma 2 -1.482 0.009
NM_011830 predicted gene 15210; inosine 5'-phosphate dehydrogenase 2 -1.483 0.014
NM_010925 ribosomal RNA processing 1 homolog (S. cerevisiae) -1.488 0.001
NM_013700 ubiquitin specific peptidase 5 (isopeptidase T) -1.489 0.019
NM_025959 proteasome (prosome, macropain) 26S subunit, ATPase, 6 -1.489 0.003
NM_145358 calcium/calmodulin-dependent protein kinase kinase 2, beta -1.490 0.021
NM_023871 predicted gene, EG625349; predicted gene 5789; predicted gene 7085; predicted gene 5708; predicted gene 6847; SET translocation; cDNA sequence BC085271; predicted gene 7239; similar to protein phosphatase 2A inhibitor-2 I-2PP2A; predicted
-1.490 0.012

Appendix B
- 68 -
gene 9531
NM_134188 acyl-CoA thioesterase 2 -1.492 0.000
NP_997603 widely-interspaced zinc finger motifs -1.504 0.008
NM_145954 aldehyde dehydrogenase 16 family, member A1 -1.504 0.011
NM_028032 protein phosphatase 2 (formerly 2A), regulatory subunit B (PR 52), alpha isoform
-1.518 0.002
NM_080287 engulfment and cell motility 2, ced-12 homolog (C. elegans) -1.522 0.028
NM_025623 nipsnap homolog 3A (C. elegans) -1.527 0.028
NM_029746 component of oligomeric golgi complex 2 -1.530 0.012
NM_172712 ubiquitin-like modifier activating enzyme 6 -1.531 0.022
NM_178883 golgin, RAB6-interacting -1.534 0.036
NM_133702 nucleolar protein 11 -1.542 0.008
NM_198411 subacute ozone induced inflammation; RIKEN cDNA 2610204M08 gene
-1.543 0.004
NM_016721 IQ motif containing GTPase activating protein 1 -1.549 0.005
NM_026160 microtubule-associated protein 1 light chain 3 beta -1.558 0.036
NM_134151 tyrosyl-tRNA synthetase -1.563 0.002
NM_007714 CDC like kinase 4 -1.569 0.015
NM_030678 glycogen synthase 1, muscle -1.571 0.043
NM_021505 anaphase-promoting complex subunit 5; similar to anaphase-promoting complex subunit 5
-1.575 0.006
NM_177992 guanosine monophosphate reductase 2 -1.575 0.006
NM_026550 PAK1 interacting protein 1 -1.576 0.015
NM_133826 ATPase, H+ transporting, lysosomal V1 subunit H -1.576 0.009
NM_145147 GTP binding protein 6 (putative) -1.590 0.024
NM_029775 DCN1, defective in cullin neddylation 1, domain containing 5 (S. cerevisiae)
-1.599 0.000
NM_025816 Tax1 (human T-cell leukemia virus type I) binding protein 1 -1.604 0.040
NM_001039388 WD repeat domain 37 -1.607 0.006
NM_133806 UDP-N-acetylglucosamine pyrophosphorylase 1 -1.611 0.013
NM_028181 cell cycle progression 1 -1.613 0.008
XM_001479591 similar to Eukaryotic translation initiation factor 5; eukaryotic translation initiation factor 5
-1.621 0.035
NM_024436 RAB22A, member RAS oncogene family -1.627 0.030
NM_011723 xanthine dehydrogenase -1.642 0.016
NM_019746 predicted gene 3837; programmed cell death 5 -1.645 0.047
NM_023554 nucleolar protein 7 -1.648 0.029
NM_011018 sequestosome 1 -1.649 0.037
NP_001240821 Anion exchange protein 2 -1.650 0.010
NM_026432 transmembrane protein 66 -1.651 0.047
NM_009254 serine (or cysteine) peptidase inhibitor, clade B, member 6a -1.651 0.003
NM_020587 splicing factor, arginine/serine-rich 4 (SRp75) -1.666 0.001
NM_001033293 UDP-N-acteylglucosamine pyrophosphorylase 1-like 1 -1.673 0.004
NM_172952 gephyrin -1.675 0.019
NM_010442 heme oxygenase (decycling) 1 -1.678 0.016
NP_001107603 protein phosphatase 4, regulatory subunit 1 -1.679 0.014
NM_009288 serine/threonine kinase 10 -1.691 0.012
NM_175121 solute carrier family 38, member 2 -1.702 0.017

Appendix B
- 69 -
NM_013678 surfeit gene 2 -1.709 0.013
NM_009628 activity-dependent neuroprotective protein -1.710 0.017
NM_027371 brix domain containing 5 -1.730 0.001
NM_016766 microspherule protein 1; predicted gene 13127 -1.731 0.000
NM_144806 predicted gene 13651; phosphoribosyl pyrophosphate synthetase-associated protein 2
-1.734 0.022
NM_010685 lysosomal-associated membrane protein 2 -1.738 0.012
NM_001081045 hypothetical protein LOC100043982; RIKEN cDNA 1700081L11 gene
-1.744 0.014
NM_001080928 recombination signal binding protein for immunoglobulin kappa J region
-1.748 0.007
NM_001111288 SCO cytochrome oxidase deficient homolog 2 (yeast) -1.760 0.014
NM_183106 tetratricopeptide repeat domain 17 -1.760 0.002
NM_019965 DnaJ (Hsp40) homolog, subfamily B, member 12 -1.846 0.025
NM_001029895 arginyltransferase 1 -1.875 0.019
Table 2-B: Differentially regulated CHO K1 proteins determined in samples corresponding to
culture using spent media from CHO DP-12 cells prepared under a reduced bioprocess
temperature of 32.0oC.
RefSeq Annotation
Description Fold Change
P-Value
NM_028266 collagen, type XVI, alpha 1 1.676 0.019
NM_009810 caspase 3 1.594 0.039
NM_025700 phosphoglucomutase 1 1.554 0.005
NM_011127 paired related homeobox 1 1.499 0.031
NM_007406 adenylate cyclase 7 1.489 0.016
NM_001003949 open reading frame 61 1.470 0.019
NM_009939 COP9 (constitutive photomorphogenic) homolog, subunit 2 (Arabidopsis thaliana)
1.450 0.021
NM_146252 TBC1 domain family, member 13 1.442 0.020
NM_146258 StAR-related lipid transfer (START) domain containing 13; similar to serologically defined colon cancer antigen 13
1.435 0.026
NM_010906 nuclear factor I/X 1.428 0.010
NM_175115 IKAROS family zinc finger 5 1.400 0.018
NM_007392 actin, alpha 2, smooth muscle, aorta 1.400 0.046
NM_175113 tRNA methyltransferase 6 homolog (S. cerevisiae) 1.396 0.043
NM_001009818 septin 11 1.363 0.049
NM_019542 N-acetylglucosamine kinase 1.347 0.043
NM_025968 prostaglandin reductase 1 1.331 0.016
NM_022988 Ngg1 interacting factor 3-like 1 (S. pombe) 1.327 0.007
NM_022653 thimet oligopeptidase 1 1.301 0.023
NM_001077529 predicted gene 7730; non-metastatic cells 2, protein (NM23B) expressed in; predicted gene 5566; predicted gene 5425; similar to Nucleoside diphosphate kinase B (NDK B) (NDP kinase B) (P18)
1.296 0.016
NM_144846 family with sequence similarity 49, member B 1.294 0.045
NM_001037166 predicted gene 4925 1.285 0.024

Appendix B
- 70 -
NM_009289 STE20-like kinase (yeast) 1.268 0.003
NM_025958 cullin-associated and neddylation-dissociated 2 (putative) 1.268 0.029
NM_001033533 coiled-coil domain containing 102A 1.247 0.045
NM_023248 Shwachman-Bodian-Diamond syndrome homolog (human) 1.240 0.028
NM_009075 ribose 5-phosphate isomerase A 1.223 0.023
NM_011862 protein kinase C and casein kinase substrate in neurons 2 1.215 0.033
NM_028975 transmembrane protein 33 -1.204 0.025
NM_010303 guanine nucleotide binding protein, alpha 13 -1.217 0.047
NM_028083 chromatin assembly factor 1, subunit B (p60) -1.218 0.002
NM_175094 pyruvate dehydrogenase complex, component X; similar to pyruvate dehydrogenase complex, component X
-1.225 0.001
NP_001106817 similar to Transcriptional repressor p66 alpha (GATA zinc finger domain-containing protein 2A); GATA zinc finger domain containing 2A
-1.230 0.049
NM_022018 family with sequence similarity 129, member A -1.235 0.028
NM_024220 NADH dehydrogenase (ubiquinone) 1, subcomplex unknown, 2; similar to NADH dehydrogenase (ubiquinone) 1, subcomplex unknown, 2
-1.241 0.024
NM_001081252 UDP-glucose ceramide glucosyltransferase-like 2 -1.246 0.015
NM_001033293 UDP-N-acteylglucosamine pyrophosphorylase 1-like 1 -1.268 0.028
NM_024281 ribosome binding protein 1 -1.272 0.017
NM_012025 Rac GTPase-activating protein 1; predicted gene 1859 -1.276 0.001
NM_013495 carnitine palmitoyltransferase 1a, liver -1.283 0.014
NM_130867 kin of IRRE like (Drosophila) -1.291 0.002
NM_175212 transmembrane protein 65 -1.315 0.006
NM_001111279 WD repeat and FYVE domain containing 1 -1.320 0.001
NM_025816 Tax1 (human T-cell leukemia virus type I) binding protein 1 -1.333 0.030
NM_027371 brix domain containing 5 -1.352 0.029
NM_133983 CD276 antigen -1.365 0.016
NM_020587 splicing factor, arginine/serine-rich 4 (SRp75) -1.366 0.014
NM_020003 RIKEN cDNA 0610031J06 gene -1.420 0.044
NM_145541 predicted gene 9392; similar to Raichu404X; RAS-related protein-1a
-1.432 0.001
NM_001111288 SCO cytochrome oxidase deficient homolog 2 (yeast) -1.433 0.037
NM_176849 arginine and glutamate rich 1 -1.434 0.021
NM_024245 kinesin family member 23 -1.502 0.000
NM_146145 Janus kinase 1 -1.508 0.002
NM_152803 heparanase -1.566 0.002
NM_027213 mediator of RNA polymerase II transcription, subunit 6 homolog (yeast)
-1.582 0.030
NM_023056 transmembrane protein 176B -1.607 0.034
NM_026160 microtubule-associated protein 1 light chain 3 beta -1.647 0.003
NM_024436 RAB22A, member RAS oncogene family -1.684 0.028
NM_028181 cell cycle progression 1 -1.723 0.003
NM_183106 tetratricopeptide repeat domain 17 -1.896 0.001

Appendix B
- 71 -
Table 2-C: Differentially regulated CHO K1 proteins determined in samples corresponding to
culture using spent media from CHO DP-12 cells prepared using a media dissolved oxygen
content of 110%.
RefSeq Annotation
Description Fold Change
p-value
NM_028975 transmembrane protein 33 1.826 0.020
NM_025538 alkB, alkylation repair homolog 7 (E. coli) 1.821 0.035
NM_011594 tissue inhibitor of metalloproteinase 2 1.803 0.004
NM_011333 chemokine (C-C motif) ligand 2 1.776 0.002
NM_009105 Ras suppressor protein 1 1.770 0.001
NM_146015 epidermal growth factor-containing fibulin-like extracellular matrix protein 1
1.751 0.014
NM_021528 carbohydrate sulfotransferase 12 1.728 0.002
NM_009103 ribonucleotide reductase M1 1.727 0.003
NM_133804 transmembrane protein 132A 1.727 0.003
NM_183016 CDC42 binding protein kinase beta 1.726 0.020
NM_145376 lysophosphatidylcholine acyltransferase 1 1.726 0.003
NM_177592 transmembrane protein 164 1.723 0.001
NM_001039644 ER degradation enhancer, mannosidase alpha-like 3 1.722 0.000
NM_009861 cell division cycle 42 homolog (S. cerevisiae); predicted gene 7407 1.721 0.006
NM_010517 insulin-like growth factor binding protein 4 1.719 0.001
NM_011961 procollagen lysine, 2-oxoglutarate 5-dioxygenase 2 1.718 0.006
NM_001013786 zinc finger protein 187 1.712 0.012
NM_001013616 tripartite motif-containing 6; similar to Tripartite motif protein 6 1.710 0.004
NM_011341 stromal cell derived factor 4 1.707 0.002
NM_001081357 mitogen-activated protein kinase kinase kinase kinase 3; similar to mitogen-activated protein kinase kinase kinase kinase 3
1.706 0.005
NP_067263 thymidylate synthase 1.705 0.015
NM_172769 sterol-C5-desaturase (fungal ERG3, delta-5-desaturase) homolog (S. cerevisae)
1.698 0.018
NM_030743 ring finger protein 114 1.698 0.016
NM_026186 coiled-coil domain containing 49 1.698 0.028
NM_011258 replication factor C (activator 1) 1 1.697 0.014
NM_011497 aurora kinase A 1.697 0.002
NM_199032 centrosomal protein 135 1.697 0.007
NM_009873 cyclin-dependent kinase 6 1.695 0.024
NM_001003949 open reading frame 61 1.693 0.022
NM_021519 predicted gene 11964; endothelial differentiation-related factor 1 1.688 0.031
NM_025364 predicted gene 6563; SAP domain containing ribonucleoprotein 1.688 0.012
NM_025788 nucleus accumbens associated 1, BEN and BTB (POZ) domain containing
1.688 0.011
NM_007838 dolichyl-di-phosphooligosaccharide-protein glycotransferase 1.688 0.005
NM_001033192 expressed sequence C78339 1.687 0.024
NM_029730 motile sperm domain containing 2 1.685 0.002
NM_011870 calcium and integrin binding 1 (calmyrin) 1.682 0.010
NM_025436 sterol-C4-methyl oxidase-like 1.680 0.009
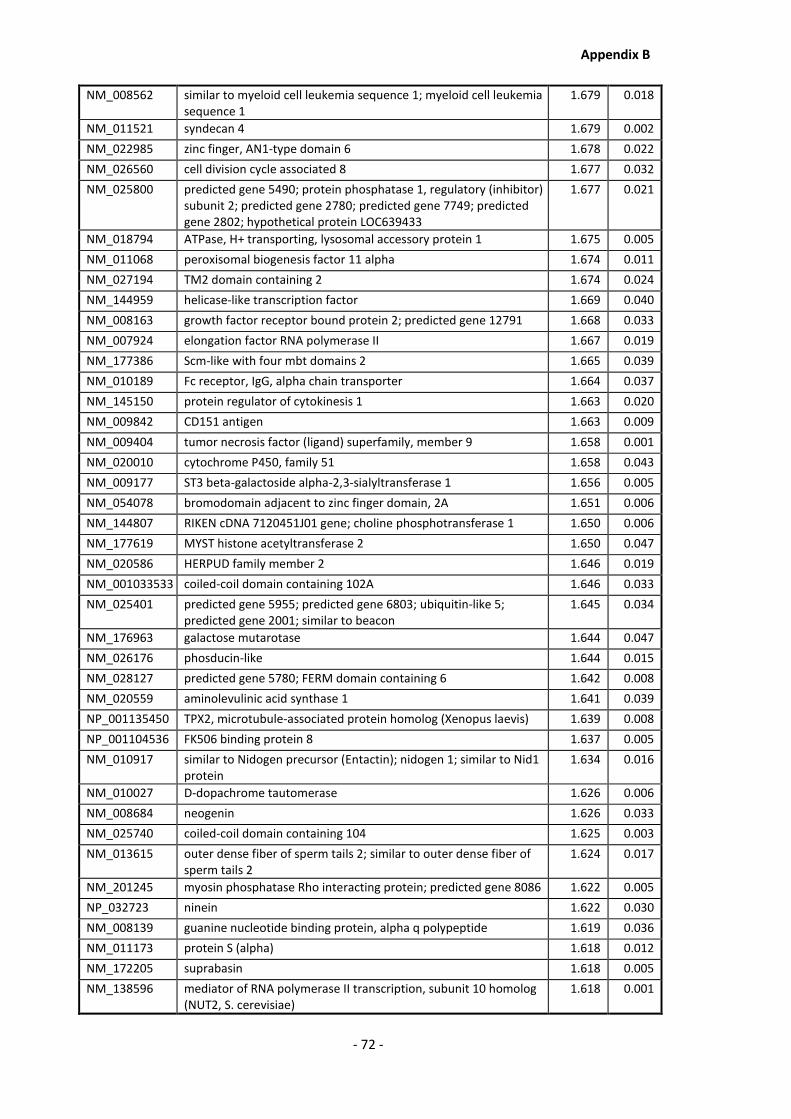
Appendix B
- 72 -
NM_008562 similar to myeloid cell leukemia sequence 1; myeloid cell leukemia sequence 1
1.679 0.018
NM_011521 syndecan 4 1.679 0.002
NM_022985 zinc finger, AN1-type domain 6 1.678 0.022
NM_026560 cell division cycle associated 8 1.677 0.032
NM_025800 predicted gene 5490; protein phosphatase 1, regulatory (inhibitor) subunit 2; predicted gene 2780; predicted gene 7749; predicted gene 2802; hypothetical protein LOC639433
1.677 0.021
NM_018794 ATPase, H+ transporting, lysosomal accessory protein 1 1.675 0.005
NM_011068 peroxisomal biogenesis factor 11 alpha 1.674 0.011
NM_027194 TM2 domain containing 2 1.674 0.024
NM_144959 helicase-like transcription factor 1.669 0.040
NM_008163 growth factor receptor bound protein 2; predicted gene 12791 1.668 0.033
NM_007924 elongation factor RNA polymerase II 1.667 0.019
NM_177386 Scm-like with four mbt domains 2 1.665 0.039
NM_010189 Fc receptor, IgG, alpha chain transporter 1.664 0.037
NM_145150 protein regulator of cytokinesis 1 1.663 0.020
NM_009842 CD151 antigen 1.663 0.009
NM_009404 tumor necrosis factor (ligand) superfamily, member 9 1.658 0.001
NM_020010 cytochrome P450, family 51 1.658 0.043
NM_009177 ST3 beta-galactoside alpha-2,3-sialyltransferase 1 1.656 0.005
NM_054078 bromodomain adjacent to zinc finger domain, 2A 1.651 0.006
NM_144807 RIKEN cDNA 7120451J01 gene; choline phosphotransferase 1 1.650 0.006
NM_177619 MYST histone acetyltransferase 2 1.650 0.047
NM_020586 HERPUD family member 2 1.646 0.019
NM_001033533 coiled-coil domain containing 102A 1.646 0.033
NM_025401 predicted gene 5955; predicted gene 6803; ubiquitin-like 5; predicted gene 2001; similar to beacon
1.645 0.034
NM_176963 galactose mutarotase 1.644 0.047
NM_026176 phosducin-like 1.644 0.015
NM_028127 predicted gene 5780; FERM domain containing 6 1.642 0.008
NM_020559 aminolevulinic acid synthase 1 1.641 0.039
NP_001135450 TPX2, microtubule-associated protein homolog (Xenopus laevis) 1.639 0.008
NP_001104536 FK506 binding protein 8 1.637 0.005
NM_010917 similar to Nidogen precursor (Entactin); nidogen 1; similar to Nid1 protein
1.634 0.016
NM_010027 D-dopachrome tautomerase 1.626 0.006
NM_008684 neogenin 1.626 0.033
NM_025740 coiled-coil domain containing 104 1.625 0.003
NM_013615 outer dense fiber of sperm tails 2; similar to outer dense fiber of sperm tails 2
1.624 0.017
NM_201245 myosin phosphatase Rho interacting protein; predicted gene 8086 1.622 0.005
NP_032723 ninein 1.622 0.030
NM_008139 guanine nucleotide binding protein, alpha q polypeptide 1.619 0.036
NM_011173 protein S (alpha) 1.618 0.012
NM_172205 suprabasin 1.618 0.005
NM_138596 mediator of RNA polymerase II transcription, subunit 10 homolog (NUT2, S. cerevisiae)
1.618 0.001
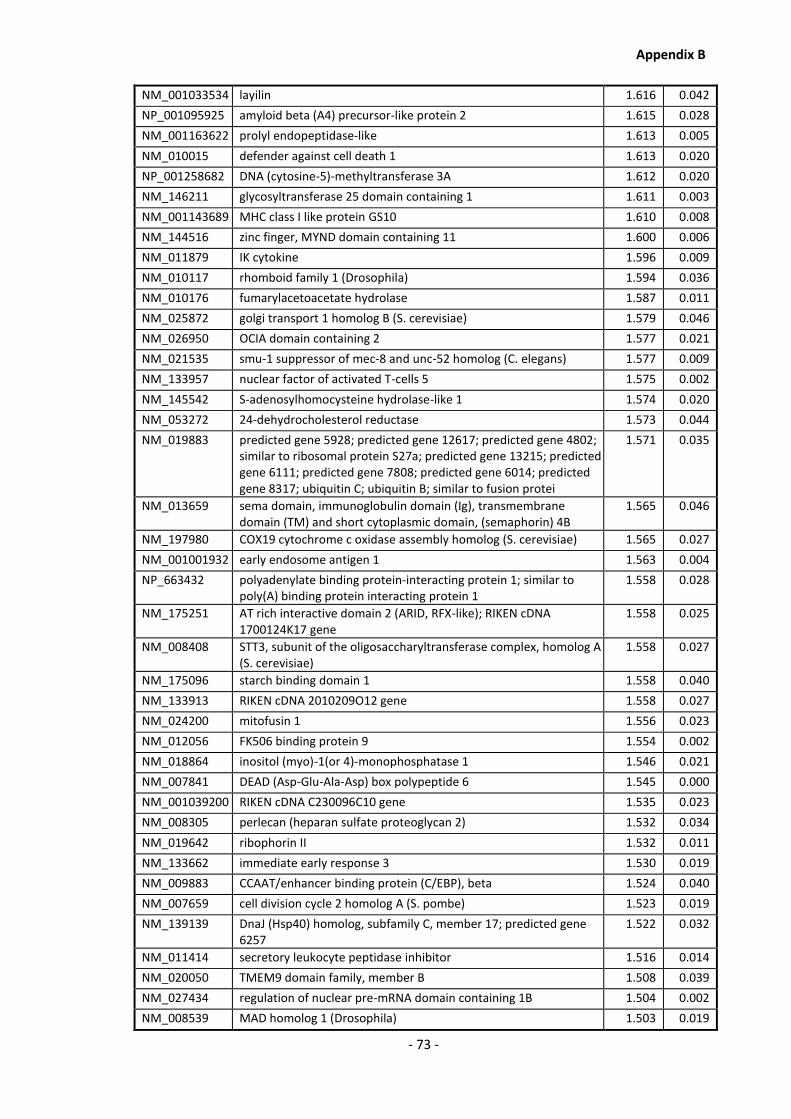
Appendix B
- 73 -
NM_001033534 layilin 1.616 0.042
NP_001095925 amyloid beta (A4) precursor-like protein 2 1.615 0.028
NM_001163622 prolyl endopeptidase-like 1.613 0.005
NM_010015 defender against cell death 1 1.613 0.020
NP_001258682 DNA (cytosine-5)-methyltransferase 3A 1.612 0.020
NM_146211 glycosyltransferase 25 domain containing 1 1.611 0.003
NM_001143689 MHC class I like protein GS10 1.610 0.008
NM_144516 zinc finger, MYND domain containing 11 1.600 0.006
NM_011879 IK cytokine 1.596 0.009
NM_010117 rhomboid family 1 (Drosophila) 1.594 0.036
NM_010176 fumarylacetoacetate hydrolase 1.587 0.011
NM_025872 golgi transport 1 homolog B (S. cerevisiae) 1.579 0.046
NM_026950 OCIA domain containing 2 1.577 0.021
NM_021535 smu-1 suppressor of mec-8 and unc-52 homolog (C. elegans) 1.577 0.009
NM_133957 nuclear factor of activated T-cells 5 1.575 0.002
NM_145542 S-adenosylhomocysteine hydrolase-like 1 1.574 0.020
NM_053272 24-dehydrocholesterol reductase 1.573 0.044
NM_019883 predicted gene 5928; predicted gene 12617; predicted gene 4802; similar to ribosomal protein S27a; predicted gene 13215; predicted gene 6111; predicted gene 7808; predicted gene 6014; predicted gene 8317; ubiquitin C; ubiquitin B; similar to fusion protei
1.571 0.035
NM_013659 sema domain, immunoglobulin domain (Ig), transmembrane domain (TM) and short cytoplasmic domain, (semaphorin) 4B
1.565 0.046
NM_197980 COX19 cytochrome c oxidase assembly homolog (S. cerevisiae) 1.565 0.027
NM_001001932 early endosome antigen 1 1.563 0.004
NP_663432 polyadenylate binding protein-interacting protein 1; similar to poly(A) binding protein interacting protein 1
1.558 0.028
NM_175251 AT rich interactive domain 2 (ARID, RFX-like); RIKEN cDNA 1700124K17 gene
1.558 0.025
NM_008408 STT3, subunit of the oligosaccharyltransferase complex, homolog A (S. cerevisiae)
1.558 0.027
NM_175096 starch binding domain 1 1.558 0.040
NM_133913 RIKEN cDNA 2010209O12 gene 1.558 0.027
NM_024200 mitofusin 1 1.556 0.023
NM_012056 FK506 binding protein 9 1.554 0.002
NM_018864 inositol (myo)-1(or 4)-monophosphatase 1 1.546 0.021
NM_007841 DEAD (Asp-Glu-Ala-Asp) box polypeptide 6 1.545 0.000
NM_001039200 RIKEN cDNA C230096C10 gene 1.535 0.023
NM_008305 perlecan (heparan sulfate proteoglycan 2) 1.532 0.034
NM_019642 ribophorin II 1.532 0.011
NM_133662 immediate early response 3 1.530 0.019
NM_009883 CCAAT/enhancer binding protein (C/EBP), beta 1.524 0.040
NM_007659 cell division cycle 2 homolog A (S. pombe) 1.523 0.019
NM_139139 DnaJ (Hsp40) homolog, subfamily C, member 17; predicted gene 6257
1.522 0.032
NM_011414 secretory leukocyte peptidase inhibitor 1.516 0.014
NM_020050 TMEM9 domain family, member B 1.508 0.039
NM_027434 regulation of nuclear pre-mRNA domain containing 1B 1.504 0.002
NM_008539 MAD homolog 1 (Drosophila) 1.503 0.019

Appendix B
- 74 -
NM_146131 similar to Pre-B-cell leukemia transcription factor interacting protein 1; pre-B-cell leukemia transcription factor interacting protein 1
1.503 0.005
NM_028762 RNA binding motif protein 19 1.502 0.015
NM_018888 ubiquinol-cytochrome c reductase complex chaperone, CBP3 homolog (yeast)
1.500 0.011
NM_145997 lysine (K)-specific demethylase 5A 1.499 0.013
NM_197991 RIKEN cDNA 2310044H10 gene 1.499 0.012
NM_013885 chloride intracellular channel 4 (mitochondrial) 1.497 0.036
NM_001033297 predicted gene 561 1.497 0.009
NM_212450 CTD (carboxy-terminal domain, RNA polymerase II, polypeptide A) small phosphatase like 2
1.497 0.005
NM_172276 splicing factor, arginine/serine-rich 8 1.495 0.008
NM_013626 peptidylglycine alpha-amidating monooxygenase 1.493 0.022
NM_133900 phosphoserine phosphatase 1.490 0.000
NP_001034283 apoptosis-inducing factor, mitochondrion-associated 2 1.489 0.012
NM_133669 retinitis pigmentosa 2 homolog (human) 1.489 0.007
NM_133803 dipeptidylpeptidase 3 1.487 0.004
NM_172266 lysophosphatidylglycerol acyltransferase 1 1.486 0.017
NM_019693 HLA-B-associated transcript 1A 1.481 0.002
NM_011711 formin-like 3 1.474 0.014
NM_016786 ubiquitin-conjugating enzyme E2K (UBC1 homolog, yeast) 1.473 0.025
NM_009145 neuroplastin 1.471 0.030
NM_019832 G kinase anchoring protein 1 1.470 0.014
NM_007471 amyloid beta (A4) precursor protein 1.464 0.006
NM_172528 leucine rich repeat containing 1 1.462 0.040
NM_018768 syntaxin 8 1.458 0.004
NM_001001738 inositol 1,4,5-triphosphate receptor interacting protein 1.457 0.004
NM_053252 EH domain binding protein 1-like 1 1.457 0.009
NM_026964 coiled-coil domain containing 124 1.457 0.044
NM_010577 integrin alpha 5 (fibronectin receptor alpha) 1.453 0.033
NM_011962 procollagen-lysine, 2-oxoglutarate 5-dioxygenase 3 1.448 0.001
NM_009833 cyclin T1 1.444 0.033
NM_013790 ATP-binding cassette, sub-family C (CFTR/MRP), member 5 1.443 0.035
NM_145500 ubiquitin domain containing 1 1.442 0.039
NM_011693 vascular cell adhesion molecule 1 1.437 0.019
NM_175414 tetraspanin 9 1.433 0.023
NM_007886 dystrobrevin, beta 1.431 0.049
NM_019773 RAB9, member RAS oncogene family; predicted gene 9181 1.424 0.012
NM_011083 phosphatidylinositol 3-kinase, C2 domain containing, alpha polypeptide
1.420 0.040
NM_021548 cAMP-regulated phosphoprotein 19 1.420 0.025
NM_001004140 cytoskeleton associated protein 2 1.418 0.005
NM_009941 cytochrome c oxidase subunit IV isoform 1 1.417 0.002
NM_145553 predicted gene 7527; family with sequence similarity 76, member A
1.417 0.008
NM_207625 acyl-CoA synthetase long-chain family member 4 1.416 0.019
NM_207298 cerebral endothelial cell adhesion molecule 1.411 0.038

Appendix B
- 75 -
NM_001164663 hypothetical protein LOC639171; RIKEN cDNA 9830001H06 gene; similar to C34E11.3
1.409 0.016
NM_011218 protein tyrosine phosphatase, receptor type, S 1.405 0.036
NM_207209 similar to SEC24 related gene family, member B (S. cerevisiae); Sec24 related gene family, member B (S. cerevisiae)
1.404 0.020
NM_008875 phospholipase D1 1.398 0.035
NM_019975 2-hydroxyacyl-CoA lyase 1 1.396 0.015
NM_010755 v-maf musculoaponeurotic fibrosarcoma oncogene family, protein F (avian)
1.395 0.033
NM_008255 3-hydroxy-3-methylglutaryl-Coenzyme A reductase 1.387 0.028
NM_026130 signal recognition particle receptor ('docking protein') 1.385 0.028
NM_008047 follistatin-like 1 1.385 0.020
NM_026252 cytoplasmic polyadenylation element binding protein 4 1.382 0.008
NM_027450 GLI pathogenesis-related 2 1.381 0.049
NM_025594 zinc finger, matrin type 2 1.379 0.030
NM_008972 predicted gene 12504; predicted gene 9800; predicted gene 4617; predicted gene 6625; predicted gene 7614; similar to prothymosin alpha; prothymosin alpha; predicted gene 9009
1.371 0.042
NM_027238 tetratricopeptide repeat domain 39B 1.370 0.009
NM_001123371 purine-nucleoside phosphorylase 2 1.370 0.007
NM_010833 moesin 1.369 0.019
NM_015804 ATPase, class VI, type 11A 1.364 0.015
NM_197982 DEAD (Asp-Glu-Ala-Asp) box polypeptide 39 1.363 0.012
NM_010516 cysteine rich protein 61 1.361 0.030
NM_025463 hypothetical protein LOC100048454; RIKEN cDNA 1810009A15 gene
1.358 0.029
NM_021460 lysosomal acid lipase A 1.358 0.037
NM_199199 transmembrane protein 199 1.350 0.044
NM_010580 integrin beta 5 1.349 0.018
NP_031641 catenin (cadherin associated protein), delta 1 1.349 0.006
NM_001166450 solute carrier family 25 (mitochondrial carrier, brain), member 14 1.347 0.035
NM_053257 predicted gene 10191; predicted gene 7689; predicted gene 9401; similar to ribosomal protein L31; hypothetical protein LOC675768; predicted gene 13004; predicted gene 9228; predicted gene 10072; predicted gene 5437; predicted gene 9154; ribosomal protein
1.344 0.021
NM_030252 cDNA sequence BC003266 1.344 0.017
NM_010356 glutathione S-transferase, alpha 3 1.342 0.046
NM_009480 upstream transcription factor 1 1.341 0.004
NM_025983 ATP synthase, H+ transporting, mitochondrial F1 complex, epsilon subunit
1.339 0.045
NM_053075 Ras homolog enriched in brain; similar to RAS-homolog enriched in brain
1.338 0.009
NM_025846 related RAS viral (r-ras) oncogene homolog 2 1.337 0.000
NM_153807 acyl-CoA synthetase family member 2 1.331 0.016
NP_001186624 Alpha-taxilin 1.330 0.002
NM_133933 ribophorin I 1.326 0.003
NM_175512 dehydrogenase/reductase (SDR family) member 9 1.326 0.018
NM_194342 unc-84 homolog B (C. elegans) 1.325 0.012
NM_033320 glucuronyl C5-epimerase 1.322 0.008
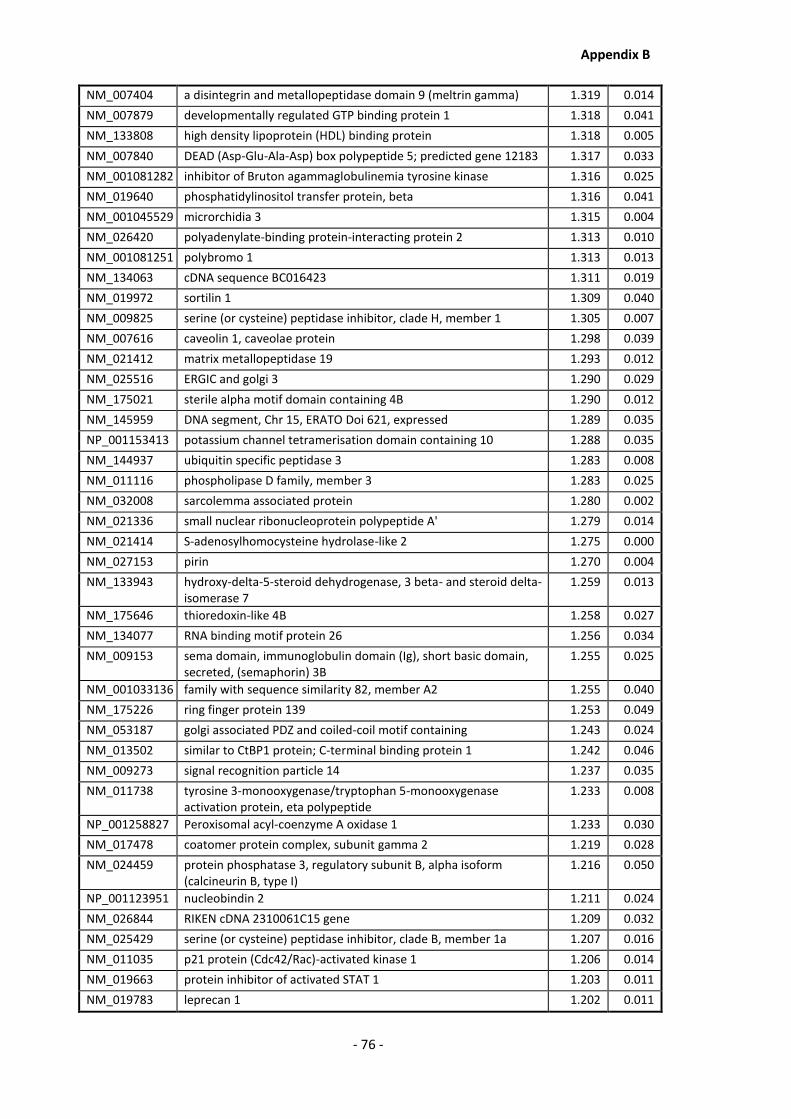
Appendix B
- 76 -
NM_007404 a disintegrin and metallopeptidase domain 9 (meltrin gamma) 1.319 0.014
NM_007879 developmentally regulated GTP binding protein 1 1.318 0.041
NM_133808 high density lipoprotein (HDL) binding protein 1.318 0.005
NM_007840 DEAD (Asp-Glu-Ala-Asp) box polypeptide 5; predicted gene 12183 1.317 0.033
NM_001081282 inhibitor of Bruton agammaglobulinemia tyrosine kinase 1.316 0.025
NM_019640 phosphatidylinositol transfer protein, beta 1.316 0.041
NM_001045529 microrchidia 3 1.315 0.004
NM_026420 polyadenylate-binding protein-interacting protein 2 1.313 0.010
NM_001081251 polybromo 1 1.313 0.013
NM_134063 cDNA sequence BC016423 1.311 0.019
NM_019972 sortilin 1 1.309 0.040
NM_009825 serine (or cysteine) peptidase inhibitor, clade H, member 1 1.305 0.007
NM_007616 caveolin 1, caveolae protein 1.298 0.039
NM_021412 matrix metallopeptidase 19 1.293 0.012
NM_025516 ERGIC and golgi 3 1.290 0.029
NM_175021 sterile alpha motif domain containing 4B 1.290 0.012
NM_145959 DNA segment, Chr 15, ERATO Doi 621, expressed 1.289 0.035
NP_001153413 potassium channel tetramerisation domain containing 10 1.288 0.035
NM_144937 ubiquitin specific peptidase 3 1.283 0.008
NM_011116 phospholipase D family, member 3 1.283 0.025
NM_032008 sarcolemma associated protein 1.280 0.002
NM_021336 small nuclear ribonucleoprotein polypeptide A' 1.279 0.014
NM_021414 S-adenosylhomocysteine hydrolase-like 2 1.275 0.000
NM_027153 pirin 1.270 0.004
NM_133943 hydroxy-delta-5-steroid dehydrogenase, 3 beta- and steroid delta-isomerase 7
1.259 0.013
NM_175646 thioredoxin-like 4B 1.258 0.027
NM_134077 RNA binding motif protein 26 1.256 0.034
NM_009153 sema domain, immunoglobulin domain (Ig), short basic domain, secreted, (semaphorin) 3B
1.255 0.025
NM_001033136 family with sequence similarity 82, member A2 1.255 0.040
NM_175226 ring finger protein 139 1.253 0.049
NM_053187 golgi associated PDZ and coiled-coil motif containing 1.243 0.024
NM_013502 similar to CtBP1 protein; C-terminal binding protein 1 1.242 0.046
NM_009273 signal recognition particle 14 1.237 0.035
NM_011738 tyrosine 3-monooxygenase/tryptophan 5-monooxygenase activation protein, eta polypeptide
1.233 0.008
NP_001258827 Peroxisomal acyl-coenzyme A oxidase 1 1.233 0.030
NM_017478 coatomer protein complex, subunit gamma 2 1.219 0.028
NM_024459 protein phosphatase 3, regulatory subunit B, alpha isoform (calcineurin B, type I)
1.216 0.050
NP_001123951 nucleobindin 2 1.211 0.024
NM_026844 RIKEN cDNA 2310061C15 gene 1.209 0.032
NM_025429 serine (or cysteine) peptidase inhibitor, clade B, member 1a 1.207 0.016
NM_011035 p21 protein (Cdc42/Rac)-activated kinase 1 1.206 0.014
NM_019663 protein inhibitor of activated STAT 1 1.203 0.011
NM_019783 leprecan 1 1.202 0.011
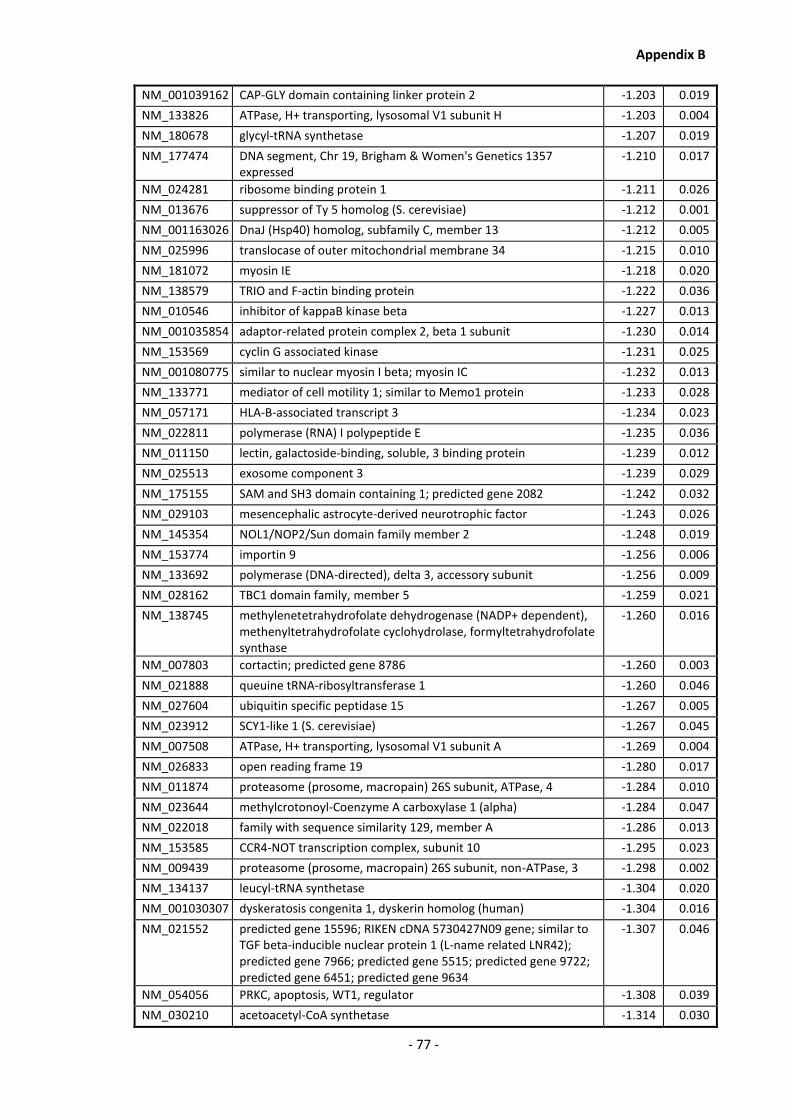
Appendix B
- 77 -
NM_001039162 CAP-GLY domain containing linker protein 2 -1.203 0.019
NM_133826 ATPase, H+ transporting, lysosomal V1 subunit H -1.203 0.004
NM_180678 glycyl-tRNA synthetase -1.207 0.019
NM_177474 DNA segment, Chr 19, Brigham & Women's Genetics 1357 expressed
-1.210 0.017
NM_024281 ribosome binding protein 1 -1.211 0.026
NM_013676 suppressor of Ty 5 homolog (S. cerevisiae) -1.212 0.001
NM_001163026 DnaJ (Hsp40) homolog, subfamily C, member 13 -1.212 0.005
NM_025996 translocase of outer mitochondrial membrane 34 -1.215 0.010
NM_181072 myosin IE -1.218 0.020
NM_138579 TRIO and F-actin binding protein -1.222 0.036
NM_010546 inhibitor of kappaB kinase beta -1.227 0.013
NM_001035854 adaptor-related protein complex 2, beta 1 subunit -1.230 0.014
NM_153569 cyclin G associated kinase -1.231 0.025
NM_001080775 similar to nuclear myosin I beta; myosin IC -1.232 0.013
NM_133771 mediator of cell motility 1; similar to Memo1 protein -1.233 0.028
NM_057171 HLA-B-associated transcript 3 -1.234 0.023
NM_022811 polymerase (RNA) I polypeptide E -1.235 0.036
NM_011150 lectin, galactoside-binding, soluble, 3 binding protein -1.239 0.012
NM_025513 exosome component 3 -1.239 0.029
NM_175155 SAM and SH3 domain containing 1; predicted gene 2082 -1.242 0.032
NM_029103 mesencephalic astrocyte-derived neurotrophic factor -1.243 0.026
NM_145354 NOL1/NOP2/Sun domain family member 2 -1.248 0.019
NM_153774 importin 9 -1.256 0.006
NM_133692 polymerase (DNA-directed), delta 3, accessory subunit -1.256 0.009
NM_028162 TBC1 domain family, member 5 -1.259 0.021
NM_138745 methylenetetrahydrofolate dehydrogenase (NADP+ dependent), methenyltetrahydrofolate cyclohydrolase, formyltetrahydrofolate synthase
-1.260 0.016
NM_007803 cortactin; predicted gene 8786 -1.260 0.003
NM_021888 queuine tRNA-ribosyltransferase 1 -1.260 0.046
NM_027604 ubiquitin specific peptidase 15 -1.267 0.005
NM_023912 SCY1-like 1 (S. cerevisiae) -1.267 0.045
NM_007508 ATPase, H+ transporting, lysosomal V1 subunit A -1.269 0.004
NM_026833 open reading frame 19 -1.280 0.017
NM_011874 proteasome (prosome, macropain) 26S subunit, ATPase, 4 -1.284 0.010
NM_023644 methylcrotonoyl-Coenzyme A carboxylase 1 (alpha) -1.284 0.047
NM_022018 family with sequence similarity 129, member A -1.286 0.013
NM_153585 CCR4-NOT transcription complex, subunit 10 -1.295 0.023
NM_009439 proteasome (prosome, macropain) 26S subunit, non-ATPase, 3 -1.298 0.002
NM_134137 leucyl-tRNA synthetase -1.304 0.020
NM_001030307 dyskeratosis congenita 1, dyskerin homolog (human) -1.304 0.016
NM_021552 predicted gene 15596; RIKEN cDNA 5730427N09 gene; similar to TGF beta-inducible nuclear protein 1 (L-name related LNR42); predicted gene 7966; predicted gene 5515; predicted gene 9722; predicted gene 6451; predicted gene 9634
-1.307 0.046
NM_054056 PRKC, apoptosis, WT1, regulator -1.308 0.039
NM_030210 acetoacetyl-CoA synthetase -1.314 0.030

Appendix B
- 78 -
NP_001005331 eukaryotic translation initiation factor 4, gamma 1 -1.315 0.042
NM_009837 chaperonin containing Tcp1, subunit 4 (delta) -1.316 0.031
NM_001160319 ubiquitin protein ligase E3 component n-recognin 4 -1.317 0.015
NM_026658 mitochondrial translation optimization 1 homolog (S. cerevisiae) -1.322 0.012
NM_026653 replication protein A1 -1.328 0.018
NM_022027 synaptic nuclear envelope 1 -1.329 0.043
NM_022410 myosin, heavy polypeptide 9, non-muscle -1.344 0.029
NM_027250 RIKEN cDNA 2010305A19 gene -1.345 0.050
NM_016748 cytidine 5'-triphosphate synthase -1.346 0.018
NP_033778 A kinase (PRKA) anchor protein 1 -1.346 0.005
NM_015787 histone cluster 1, H1e -1.348 0.031
NM_009679 predicted gene 8717; adaptor protein complex AP-2, mu1 -1.349 0.009
NM_011811 phenylalanyl-tRNA synthetase, beta subunit -1.354 0.013
NM_021315 nucleolar complex associated 3 homolog (S. cerevisiae) -1.354 0.004
NM_198645 coiled-coil domain containing 58 -1.354 0.033
NP_705782 aldehyde dehydrogenase 18 family, member A1 -1.355 0.012
NM_007509 ATPase, H+ transporting, lysosomal V1 subunit B2 -1.359 0.001
NM_011654 predicted gene 3756; tubulin, alpha 1B; predicted gene 5620; similar to alpha-tubulin isotype M-alpha-2; predicted gene 14150; predicted gene 3226
-1.359 0.003
NM_011777 zyxin -1.360 0.018
NM_029878 tubulin-specific chaperone d -1.360 0.004
NM_133916 hypothetical protein LOC100047993; eukaryotic translation initiation factor 3, subunit B
-1.362 0.010
NM_001033375 RIKEN cDNA A230046K03 gene -1.370 0.019
NP_001185796 Dynactin subunit 1 -1.371 0.041
NM_011049 PCTAIRE-motif protein kinase 1 -1.371 0.038
NM_001164677 programmed cell death 6 interacting protein -1.377 0.033
NM_026396 brix domain containing 2 -1.380 0.016
NM_019966 malonyl-CoA decarboxylase -1.384 0.007
NM_027815 RIKEN cDNA 9030624J02 gene -1.385 0.046
NM_139063 muted -1.387 0.028
XP_003085306 Polyadenylate -binding protein 1-like 2 -1.390 0.005
NM_138593 similar to La ribonucleoprotein domain family, member 7; La ribonucleoprotein domain family, member 7
-1.391 0.010
NM_021473 aldo-keto reductase family 1, member A4 (aldehyde reductase) -1.393 0.010
NM_019553 DEAD (Asp-Glu-Ala-Asp) box polypeptide 21 -1.394 0.033
NM_021514 phosphofructokinase, muscle -1.395 0.010
NM_080463 protein O-fucosyltransferase 1 -1.398 0.010
NM_080445 similar to UDP-Gal:betaGal beta 1,3-galactosyltransferase, polypeptide 6; UDP-Gal:betaGal beta 1,3-galactosyltransferase, polypeptide 6
-1.398 0.006
NM_029633 CLIP associating protein 2 -1.401 0.041
NM_021303 nucleolar complex associated 2 homolog (S. cerevisiae) -1.411 0.019
NM_001128601 5, 10-methenyltetrahydrofolate synthetase; predicted gene 2372; predicted gene 2382
-1.427 0.046
NM_199447 ribosomal RNA processing 12 homolog (S. cerevisiae) -1.427 0.018
NM_146200 eukaryotic translation initiation factor 3, subunit C; similar to Eukaryotic translation initiation factor 3, subunit 8
-1.427 0.019
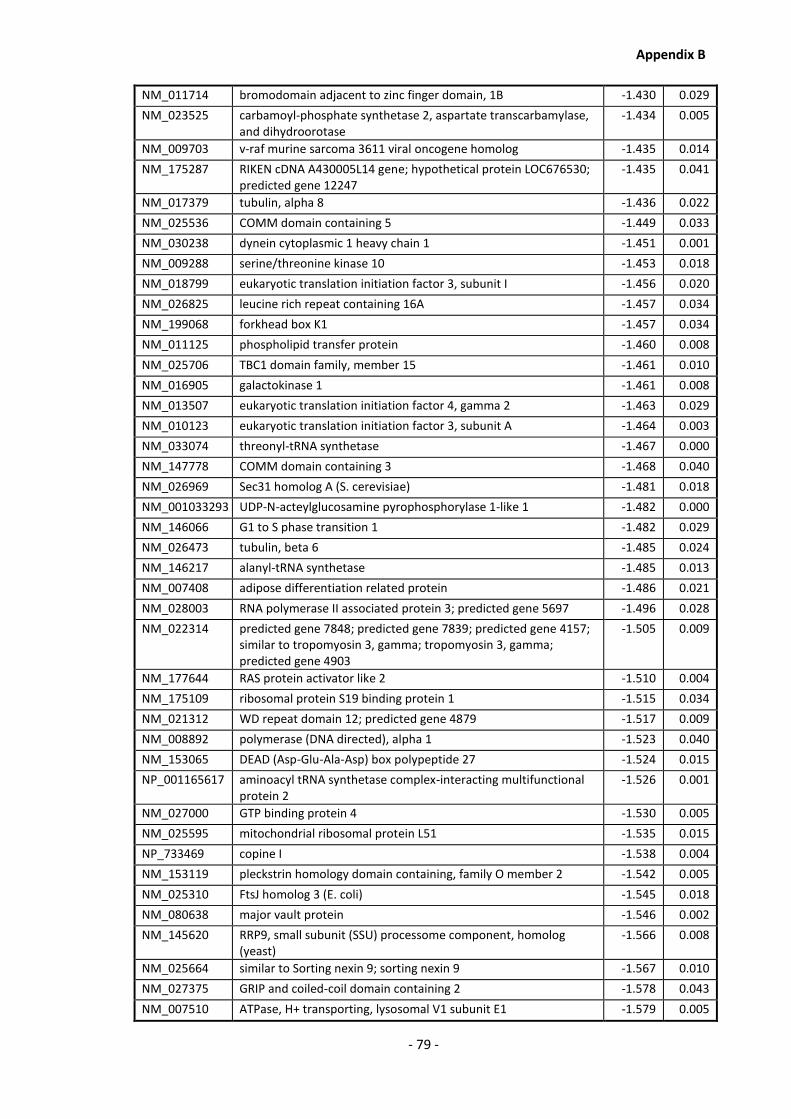
Appendix B
- 79 -
NM_011714 bromodomain adjacent to zinc finger domain, 1B -1.430 0.029
NM_023525 carbamoyl-phosphate synthetase 2, aspartate transcarbamylase, and dihydroorotase
-1.434 0.005
NM_009703 v-raf murine sarcoma 3611 viral oncogene homolog -1.435 0.014
NM_175287 RIKEN cDNA A430005L14 gene; hypothetical protein LOC676530; predicted gene 12247
-1.435 0.041
NM_017379 tubulin, alpha 8 -1.436 0.022
NM_025536 COMM domain containing 5 -1.449 0.033
NM_030238 dynein cytoplasmic 1 heavy chain 1 -1.451 0.001
NM_009288 serine/threonine kinase 10 -1.453 0.018
NM_018799 eukaryotic translation initiation factor 3, subunit I -1.456 0.020
NM_026825 leucine rich repeat containing 16A -1.457 0.034
NM_199068 forkhead box K1 -1.457 0.034
NM_011125 phospholipid transfer protein -1.460 0.008
NM_025706 TBC1 domain family, member 15 -1.461 0.010
NM_016905 galactokinase 1 -1.461 0.008
NM_013507 eukaryotic translation initiation factor 4, gamma 2 -1.463 0.029
NM_010123 eukaryotic translation initiation factor 3, subunit A -1.464 0.003
NM_033074 threonyl-tRNA synthetase -1.467 0.000
NM_147778 COMM domain containing 3 -1.468 0.040
NM_026969 Sec31 homolog A (S. cerevisiae) -1.481 0.018
NM_001033293 UDP-N-acteylglucosamine pyrophosphorylase 1-like 1 -1.482 0.000
NM_146066 G1 to S phase transition 1 -1.482 0.029
NM_026473 tubulin, beta 6 -1.485 0.024
NM_146217 alanyl-tRNA synthetase -1.485 0.013
NM_007408 adipose differentiation related protein -1.486 0.021
NM_028003 RNA polymerase II associated protein 3; predicted gene 5697 -1.496 0.028
NM_022314 predicted gene 7848; predicted gene 7839; predicted gene 4157; similar to tropomyosin 3, gamma; tropomyosin 3, gamma; predicted gene 4903
-1.505 0.009
NM_177644 RAS protein activator like 2 -1.510 0.004
NM_175109 ribosomal protein S19 binding protein 1 -1.515 0.034
NM_021312 WD repeat domain 12; predicted gene 4879 -1.517 0.009
NM_008892 polymerase (DNA directed), alpha 1 -1.523 0.040
NM_153065 DEAD (Asp-Glu-Ala-Asp) box polypeptide 27 -1.524 0.015
NP_001165617 aminoacyl tRNA synthetase complex-interacting multifunctional protein 2
-1.526 0.001
NM_027000 GTP binding protein 4 -1.530 0.005
NM_025595 mitochondrial ribosomal protein L51 -1.535 0.015
NP_733469 copine I -1.538 0.004
NM_153119 pleckstrin homology domain containing, family O member 2 -1.542 0.005
NM_025310 FtsJ homolog 3 (E. coli) -1.545 0.018
NM_080638 major vault protein -1.546 0.002
NM_145620 RRP9, small subunit (SSU) processome component, homolog (yeast)
-1.566 0.008
NM_025664 similar to Sorting nexin 9; sorting nexin 9 -1.567 0.010
NM_027375 GRIP and coiled-coil domain containing 2 -1.578 0.043
NM_007510 ATPase, H+ transporting, lysosomal V1 subunit E1 -1.579 0.005

Appendix B
- 80 -
NM_011830 predicted gene 15210; inosine 5'-phosphate dehydrogenase 2 -1.579 0.017
NM_145507 aspartyl-tRNA synthetase -1.585 0.015
NM_013742 cysteinyl-tRNA synthetase -1.585 0.024
NM_011829 inosine 5'-phosphate dehydrogenase 1 -1.593 0.016
NP_001107603 protein phosphatase 4, regulatory subunit 1 -1.594 0.017
NM_010212 four and a half LIM domains 2 -1.596 0.001
NM_008033 farnesyltransferase, CAAX box, alpha; similar to farnesyltransferase alpha subunit
-1.603 0.025
NM_001038589 ubiquitin specific peptidase 14 -1.605 0.007
NM_026788 methylenetetrahydrofolate dehydrogenase (NADP+ dependent) 2-like
-1.607 0.008
NM_021448 elongation protein 2 homolog (S. cerevisiae) -1.610 0.020
NM_025918 coiled-coil domain containing 43 -1.618 0.022
NM_027498 similar to Serine/threonine-protein kinase QSK; cDNA sequence BC033915
-1.621 0.007
NM_025380 eukaryotic translation elongation factor 1 epsilon 1 -1.625 0.000
NM_025494 ATPase, H+ transporting, lysosomal V1 subunit C1 -1.636 0.005
NM_013562 interferon-related developmental regulator 1 -1.636 0.006
NM_001033318 component of oligomeric golgi complex 7 -1.645 0.043
NM_133775 interleukin 33 -1.647 0.041
NM_153125 SEC16 homolog A (S. cerevisiae) -1.659 0.027
NM_134188 acyl-CoA thioesterase 2 -1.660 0.021
NM_029005 mixed lineage kinase domain-like -1.663 0.040
NM_178623 RIKEN cDNA 2010005J08 gene -1.663 0.018
NM_019795 DnaJ (Hsp40) homolog, subfamily C, member 7 -1.667 0.018
NM_153116 GTP-binding protein 10 (putative); predicted gene 6877 -1.675 0.029
NM_013752 nibrin -1.686 0.018
NM_001037746 mirror-image polydactyly gene 1 homolog (human); phosphoribosyl pyrophosphate synthetase 1; phosphoribosyl pyrophosphate synthetase 1-like 1
-1.688 0.028
NM_181348 RIKEN cDNA A230083H22 gene -1.696 0.010
NM_153164 predicted gene 6158; CCR4-NOT transcription complex, subunit 1 -1.707 0.033
NM_028427 transmembrane protein 192 -1.711 0.011
NM_172582 coenzyme Q6 homolog (yeast) -1.714 0.011
NM_054102 influenza virus NS1A binding protein -1.718 0.001
NM_054099 RIKEN cDNA 1110038F14 gene -1.729 0.001
NM_138603 coiled-coil domain containing 22 -1.731 0.012
Table 2-D: Differentially regulated CHO K1 proteins determined in samples corresponding to
culture using spent media from CHO DP-12 cells prepared using a media dissolved oxygen
content of 60%.
RefSeq Annotation
Description Fold Change
p-value
NM_011333 chemokine (C-C motif) ligand 2 1.761 0.004
NM_054078 bromodomain adjacent to zinc finger domain, 2A 1.749 0.010

Appendix B
- 81 -
NM_133957 nuclear factor of activated T-cells 5 1.730 0.017
NP_001258682 DNA (cytosine-5)-methyltransferase 3A 1.728 0.002
NM_021528 carbohydrate sulfotransferase 12 1.707 0.014
NM_028945 DNA segment, Chr 14, Abbott 1 expressed 1.701 0.018
NM_009103 ribonucleotide reductase M1 1.699 0.029
NM_199032 centrosomal protein 135 1.692 0.007
NM_001013616 tripartite motif-containing 6; similar to Tripartite motif protein 6 1.691 0.011
NM_011341 stromal cell derived factor 4 1.690 0.001
NM_010235 fos-like antigen 1 1.685 0.027
NM_011961 procollagen lysine, 2-oxoglutarate 5-dioxygenase 2 1.683 0.005
NM_025788 nucleus accumbens associated 1, BEN and BTB (POZ) domain containing
1.678 0.010
NM_001033534 layilin 1.665 0.045
NM_001081357 mitogen-activated protein kinase kinase kinase kinase 3; similar to mitogen-activated protein kinase kinase kinase kinase 3
1.656 0.007
NM_001039644 ER degradation enhancer, mannosidase alpha-like 3 1.653 0.005
NP_067263 thymidylate synthase 1.644 0.040
NM_133804 transmembrane protein 132A 1.641 0.011
NM_010117 rhomboid family 1 (Drosophila) 1.637 0.047
NM_197999 RIKEN cDNA 2210023G05 gene 1.621 0.049
NM_172205 suprabasin 1.620 0.018
NM_009186 transformer 2 beta homolog (Drosophila); predicted gene 6439 1.612 0.016
NM_001039522 Leo1, Paf1/RNA polymerase II complex component, homolog (S. cerevisiae)
1.611 0.038
NM_001080931 mediator complex subunit 13 1.611 0.047
NM_012056 FK506 binding protein 9 1.610 0.008
NM_024459 protein phosphatase 3, regulatory subunit B, alpha isoform (calcineurin B, type I)
1.608 0.002
NM_001081163 similar to mKIAA0990 protein; chondroitin sulfate synthase 1 1.601 0.039
NM_028762 RNA binding motif protein 19 1.595 0.030
NM_028975 transmembrane protein 33 1.595 0.024
NM_009177 ST3 beta-galactoside alpha-2,3-sialyltransferase 1 1.590 0.006
NM_009404 tumor necrosis factor (ligand) superfamily, member 9 1.584 0.003
NM_146211 glycosyltransferase 25 domain containing 1 1.577 0.013
NM_029730 motile sperm domain containing 2 1.569 0.007
NM_212450 CTD (carboxy-terminal domain, RNA polymerase II, polypeptide A) small phosphatase like 2
1.567 0.001
NM_029581 mitochondrial translational initiation factor 3 1.561 0.013
NM_011962 procollagen-lysine, 2-oxoglutarate 5-dioxygenase 3 1.560 0.000
NM_144814 REST corepressor 3 1.544 0.031
NM_010517 insulin-like growth factor binding protein 4 1.540 0.028
NM_023645 KDEL (Lys-Asp-Glu-Leu) containing 1 1.525 0.045
NM_021460 lysosomal acid lipase A 1.519 0.002
NM_008255 3-hydroxy-3-methylglutaryl-Coenzyme A reductase 1.516 0.049
NM_001033297 predicted gene 561 1.490 0.044
NM_001033533 coiled-coil domain containing 102A 1.482 0.023
NM_172266 lysophosphatidylglycerol acyltransferase 1 1.481 0.040
NM_010516 cysteine rich protein 61 1.479 0.004

Appendix B
- 82 -
NP_001106817 similar to Transcriptional repressor p66 alpha (GATA zinc finger domain-containing protein 2A); GATA zinc finger domain containing 2A
1.477 0.016
NM_026950 OCIA domain containing 2 1.465 0.020
NM_011580 thrombospondin 1; similar to thrombospondin 1 1.444 0.012
NM_025740 coiled-coil domain containing 104 1.433 0.016
NP_001159505 general transcription factor IIIC, polypeptide 4 1.433 0.007
NM_010799 predicted gene 12818; multiple inositol polyphosphate histidine phosphatase 1
1.432 0.023
NM_011879 IK cytokine 1.423 0.000
NM_001146296 adenosine deaminase, RNA-specific 1.421 0.044
NM_027658 similar to hexamthylene bis-acetamide inducible 2; hexamthylene bis-acetamide inducible 2
1.409 0.012
NM_029620 procollagen C-endopeptidase enhancer 2 1.390 0.047
NM_008917 palmitoyl-protein thioesterase 1 1.389 0.040
NM_026186 coiled-coil domain containing 49 1.386 0.048
NM_153421 polyhomeotic-like 3 (Drosophila) 1.384 0.039
NM_080558 sperm specific antigen 2 1.379 0.010
NM_001081340 SET domain containing 2 1.373 0.002
NM_007392 actin, alpha 2, smooth muscle, aorta 1.371 0.027
NM_138596 mediator of RNA polymerase II transcription, subunit 10 homolog (NUT2, S. cerevisiae)
1.371 0.002
NM_010580 integrin beta 5 1.365 0.024
NM_026252 cytoplasmic polyadenylation element binding protein 4 1.364 0.030
NM_001163741 RIKEN cDNA 1110021J02 gene 1.361 0.032
NM_025554 polymerase (RNA) II (DNA directed) polypeptide E 1.358 0.008
NM_144954 peptidylprolyl isomerase (cyclophilin)-like 2 1.352 0.016
NM_027373 actin filament associated protein 1 1.344 0.001
NM_145619 poly (ADP-ribose) polymerase family, member 3 1.343 0.003
NM_026130 signal recognition particle receptor ('docking protein') 1.341 0.013
NM_178367 DEAH (Asp-Glu-Ala-His) box polypeptide 33 1.341 0.038
NM_145215 abhydrolase domain containing 11 1.339 0.024
NM_172276 splicing factor, arginine/serine-rich 8 1.338 0.011
NM_025783 vacuolar protein sorting 24 (yeast); predicted gene 7464 1.332 0.041
NP_001104536 FK506 binding protein 8 1.326 0.011
NM_153783 polyamine oxidase (exo-N4-amino) 1.322 0.003
NM_001164663 hypothetical protein LOC639171; RIKEN cDNA 9830001H06 gene; similar to C34E11.3
1.321 0.001
NM_175153 RIKEN cDNA 2010321M09 gene 1.314 0.026
NM_009825 serine (or cysteine) peptidase inhibitor, clade H, member 1 1.303 0.006
NM_146239 PCTAIRE-motif protein kinase 2 1.302 0.049
NM_007840 DEAD (Asp-Glu-Ala-Asp) box polypeptide 5; predicted gene 12183 1.300 0.047
NM_153412 pleckstrin homology-like domain, family B, member 2 1.284 0.002
NM_018774 polyhomeotic-like 2 (Drosophila) 1.280 0.042
NM_023403 mesoderm development candidate 2 1.272 0.018
NM_001163622 prolyl endopeptidase-like 1.266 0.003
NM_145553 predicted gene 7527; family with sequence similarity 76, member A
1.262 0.037

Appendix B
- 83 -
NM_018888 ubiquinol-cytochrome c reductase complex chaperone, CBP3 homolog (yeast)
1.257 0.004
NM_029365 mediator of RNA polymerase II transcription, subunit 25 homolog (yeast)
1.250 0.006
NM_153559 quiescin Q6 sulfhydryl oxidase 2 1.237 0.012
NM_028017 N-ethylmaleimide sensitive fusion protein attachment protein gamma
1.233 0.029
NM_021412 matrix metallopeptidase 19 1.218 0.028
NM_177592 transmembrane protein 164 1.214 0.013
NM_019975 2-hydroxyacyl-CoA lyase 1 1.213 0.019
NM_033320 glucuronyl C5-epimerase 1.208 0.029
NM_172259 myosin, light polypeptide 6B 1.208 0.016
NM_198160 SWI/SNF related, matrix associated, actin dependent regulator of chromatin, subfamily c, member 2
1.207 0.038
NM_011521 syndecan 4 1.207 0.028
NM_001033136 family with sequence similarity 82, member A2 1.202 0.020
NM_019966 malonyl-CoA decarboxylase -1.202 0.035
NM_028276 UTP14, U3 small nucleolar ribonucleoprotein, homolog A (yeast) -1.204 0.044
NM_146200 eukaryotic translation initiation factor 3, subunit C; similar to Eukaryotic translation initiation factor 3, subunit 8
-1.205 0.050
NM_010442 heme oxygenase (decycling) 1 -1.206 0.020
NM_017379 tubulin, alpha 8 -1.209 0.025
XP_003085306 Polyadenylate-binding protein 1-like 2 -1.211 0.012
NM_138745 methylenetetrahydrofolate dehydrogenase (NADP+ dependent), methenyltetrahydrofolate cyclohydrolase, formyltetrahydrofolate synthase
-1.212 0.027
NM_170669 predicted gene 13048; predicted gene 11968; predicted gene 13253; predicted gene 14166; predicted gene 10196; similar to ribosomal protein S15a; predicted gene 5623; ribosomal protein S15A; similar to hCG1994130; predicted gene 7263
-1.214 0.031
NM_011654 predicted gene 3756; tubulin, alpha 1B; predicted gene 5620; similar to alpha-tubulin isotype M-alpha-2; predicted gene 14150; predicted gene 3226
-1.216 0.042
NM_011291 predicted gene 4754; ribosomal protein L7; predicted gene 12174; LOC100049084; predicted gene 6543; predicted gene 7059; predicted gene 4734
-1.223 0.015
NM_023060 eukaryotic elongation factor, selenocysteine-tRNA-specific -1.227 0.021
NM_018829 adaptor-related protein complex 3, mu 1 subunit; similar to Adapter-related protein complex 3 mu 1 subunit (Mu-adaptin 3A) (AP-3 adapter complex mu3A subunit)
-1.239 0.021
NP_705782 aldehyde dehydrogenase 18 family, member A1 -1.244 0.019
NM_025380 eukaryotic translation elongation factor 1 epsilon 1 -1.256 0.036
NM_019808 PDZ and LIM domain 5 -1.257 0.024
NM_026545 proteasome (prosome, macropain) 26S subunit, non-ATPase, 8 -1.262 0.037
NM_172735 zinc finger, C3HC type 1 -1.267 0.038
NM_146217 alanyl-tRNA synthetase -1.268 0.014
NM_013507 eukaryotic translation initiation factor 4, gamma 2 -1.280 0.046
NM_134137 leucyl-tRNA synthetase -1.283 0.036
NM_013742 cysteinyl-tRNA synthetase -1.299 0.010
NM_011975 predicted gene 14439; predicted gene 8213; predicted gene 13981; predicted gene 8451; predicted gene 6378; predicted gene
-1.315 0.001

Appendix B
- 84 -
8667; predicted gene 4923; predicted gene 5908; ribosomal protein L27a; predicted gene 14044; predicted gene 7536; predicted gene 144
NM_145546 general transcription factor IIB -1.318 0.009
NM_009082 similar to ribosomal protein; predicted gene 6344; predicted gene 11449; predicted gene 13841; predicted gene 8210; hypothetical protein LOC675793; ribosomal protein L29; predicted gene 12704; predicted gene 7252; predicted gene 8965; predicted gene 13213
-1.318 0.002
NM_023525 carbamoyl-phosphate synthetase 2, aspartate transcarbamylase, and dihydroorotase
-1.320 0.025
NM_013454 ATP-binding cassette, sub-family A (ABC1), member 1 -1.321 0.040
NM_028636 mannosidase, alpha, class 2C, member 1 -1.321 0.029
NM_198007 activating signal cointegrator 1 complex subunit 3 -1.324 0.023
NM_053181 pyridoxal-dependent decarboxylase domain containing 1 -1.329 0.009
NM_023372 similar to ribosomal protein L38; predicted gene 13020; ribosomal protein L38; predicted gene 4991; karyopherin (importin) alpha 2; predicted gene 9028; predicted gene 8129; predicted gene 7123; predicted gene 5832; predicted gene 10184; predicted gene 73
-1.330 0.040
NM_028032 protein phosphatase 2 (formerly 2A), regulatory subunit B (PR 52), alpha isoform
-1.347 0.011
NM_021514 phosphofructokinase, muscle -1.350 0.006
NP_001135450 TPX2, microtubule-associated protein homolog (Xenopus laevis) -1.352 0.037
NM_080638 major vault protein -1.360 0.006
NM_133973 component of oligomeric golgi complex 4 -1.368 0.027
NM_026969 Sec31 homolog A (S. cerevisiae) -1.370 0.043
NM_009391 RAS-like, family 2, locus 9; RAN, member RAS oncogene family; similar to RAN, member RAS oncogene family
-1.379 0.019
NM_019581 GTP binding protein 2 -1.386 0.011
NM_008388 eukaryotic translation initiation factor 3, subunit E -1.393 0.010
NM_011889 septin 3 -1.395 0.014
NM_028390 anillin, actin binding protein -1.402 0.012
NM_033074 threonyl-tRNA synthetase -1.406 0.004
NM_027815 RIKEN cDNA 9030624J02 gene -1.408 0.007
NM_016905 galactokinase 1 -1.409 0.025
NM_153058 microtubule-associated protein, RP/EB family, member 2 -1.409 0.046
NM_028427 transmembrane protein 192 -1.409 0.043
NM_025494 ATPase, H+ transporting, lysosomal V1 subunit C1 -1.409 0.006
NM_011874 proteasome (prosome, macropain) 26S subunit, ATPase, 4 -1.421 0.004
NM_001045489 milk fat globule-EGF factor 8 protein -1.422 0.021
NM_001080929 cerebellar degeneration-related protein 2-like -1.431 0.021
NM_133900 phosphoserine phosphatase -1.435 0.009
NM_011484 signal transducing adaptor molecule (SH3 domain and ITAM motif) 1
-1.444 0.032
NP_001165617 aminoacyl tRNA synthetase complex-interacting multifunctional protein 2
-1.455 0.048
NM_012003 COP9 (constitutive photomorphogenic) homolog, subunit 7a (Arabidopsis thaliana)
-1.458 0.001
NP_955769 Protein FAM63A -1.458 0.030
NM_008033 farnesyltransferase, CAAX box, alpha; similar to farnesyltransferase alpha subunit
-1.468 0.001
NM_007386 aconitase 1 -1.470 0.019
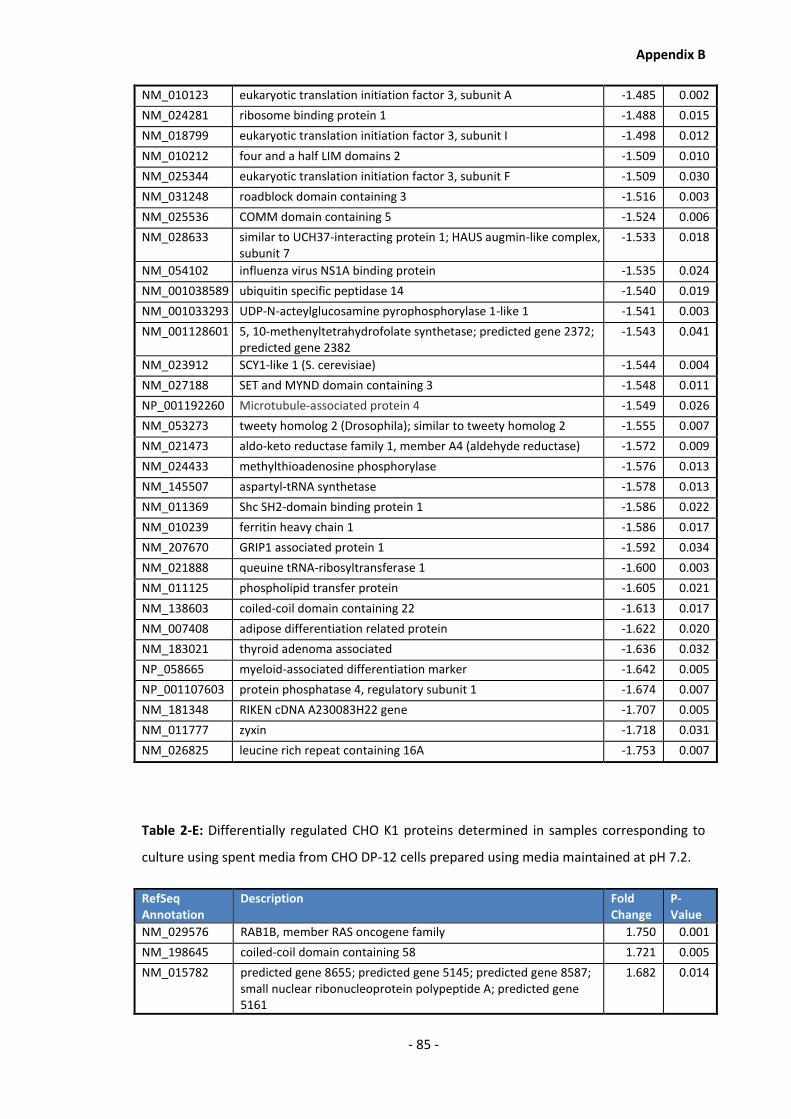
Appendix B
- 85 -
NM_010123 eukaryotic translation initiation factor 3, subunit A -1.485 0.002
NM_024281 ribosome binding protein 1 -1.488 0.015
NM_018799 eukaryotic translation initiation factor 3, subunit I -1.498 0.012
NM_010212 four and a half LIM domains 2 -1.509 0.010
NM_025344 eukaryotic translation initiation factor 3, subunit F -1.509 0.030
NM_031248 roadblock domain containing 3 -1.516 0.003
NM_025536 COMM domain containing 5 -1.524 0.006
NM_028633 similar to UCH37-interacting protein 1; HAUS augmin-like complex, subunit 7
-1.533 0.018
NM_054102 influenza virus NS1A binding protein -1.535 0.024
NM_001038589 ubiquitin specific peptidase 14 -1.540 0.019
NM_001033293 UDP-N-acteylglucosamine pyrophosphorylase 1-like 1 -1.541 0.003
NM_001128601 5, 10-methenyltetrahydrofolate synthetase; predicted gene 2372; predicted gene 2382
-1.543 0.041
NM_023912 SCY1-like 1 (S. cerevisiae) -1.544 0.004
NM_027188 SET and MYND domain containing 3 -1.548 0.011
NP_001192260 Microtubule-associated protein 4 -1.549 0.026
NM_053273 tweety homolog 2 (Drosophila); similar to tweety homolog 2 -1.555 0.007
NM_021473 aldo-keto reductase family 1, member A4 (aldehyde reductase) -1.572 0.009
NM_024433 methylthioadenosine phosphorylase -1.576 0.013
NM_145507 aspartyl-tRNA synthetase -1.578 0.013
NM_011369 Shc SH2-domain binding protein 1 -1.586 0.022
NM_010239 ferritin heavy chain 1 -1.586 0.017
NM_207670 GRIP1 associated protein 1 -1.592 0.034
NM_021888 queuine tRNA-ribosyltransferase 1 -1.600 0.003
NM_011125 phospholipid transfer protein -1.605 0.021
NM_138603 coiled-coil domain containing 22 -1.613 0.017
NM_007408 adipose differentiation related protein -1.622 0.020
NM_183021 thyroid adenoma associated -1.636 0.032
NP_058665 myeloid-associated differentiation marker -1.642 0.005
NP_001107603 protein phosphatase 4, regulatory subunit 1 -1.674 0.007
NM_181348 RIKEN cDNA A230083H22 gene -1.707 0.005
NM_011777 zyxin -1.718 0.031
NM_026825 leucine rich repeat containing 16A -1.753 0.007
Table 2-E: Differentially regulated CHO K1 proteins determined in samples corresponding to
culture using spent media from CHO DP-12 cells prepared using media maintained at pH 7.2.
RefSeq Annotation
Description Fold Change
P-Value
NM_029576 RAB1B, member RAS oncogene family 1.750 0.001
NM_198645 coiled-coil domain containing 58 1.721 0.005
NM_015782 predicted gene 8655; predicted gene 5145; predicted gene 8587; small nuclear ribonucleoprotein polypeptide A; predicted gene 5161
1.682 0.014
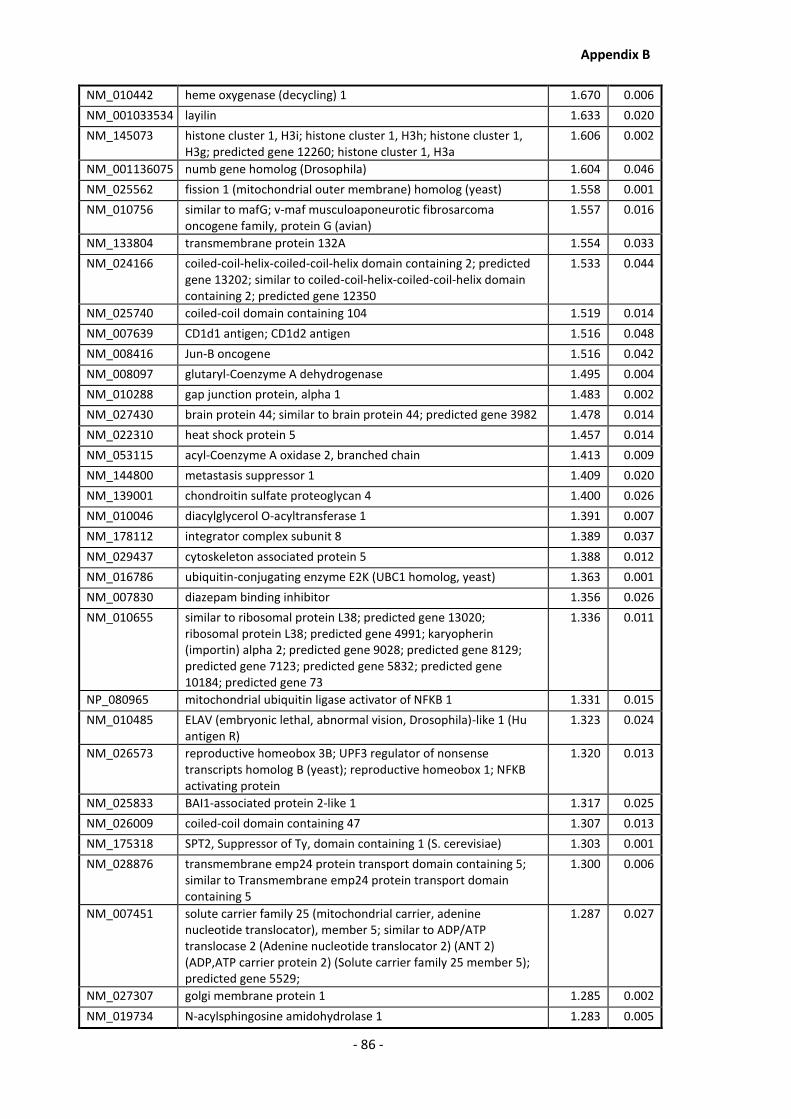
Appendix B
- 86 -
NM_010442 heme oxygenase (decycling) 1 1.670 0.006
NM_001033534 layilin 1.633 0.020
NM_145073 histone cluster 1, H3i; histone cluster 1, H3h; histone cluster 1, H3g; predicted gene 12260; histone cluster 1, H3a
1.606 0.002
NM_001136075 numb gene homolog (Drosophila) 1.604 0.046
NM_025562 fission 1 (mitochondrial outer membrane) homolog (yeast) 1.558 0.001
NM_010756 similar to mafG; v-maf musculoaponeurotic fibrosarcoma oncogene family, protein G (avian)
1.557 0.016
NM_133804 transmembrane protein 132A 1.554 0.033
NM_024166 coiled-coil-helix-coiled-coil-helix domain containing 2; predicted gene 13202; similar to coiled-coil-helix-coiled-coil-helix domain containing 2; predicted gene 12350
1.533 0.044
NM_025740 coiled-coil domain containing 104 1.519 0.014
NM_007639 CD1d1 antigen; CD1d2 antigen 1.516 0.048
NM_008416 Jun-B oncogene 1.516 0.042
NM_008097 glutaryl-Coenzyme A dehydrogenase 1.495 0.004
NM_010288 gap junction protein, alpha 1 1.483 0.002
NM_027430 brain protein 44; similar to brain protein 44; predicted gene 3982 1.478 0.014
NM_022310 heat shock protein 5 1.457 0.014
NM_053115 acyl-Coenzyme A oxidase 2, branched chain 1.413 0.009
NM_144800 metastasis suppressor 1 1.409 0.020
NM_139001 chondroitin sulfate proteoglycan 4 1.400 0.026
NM_010046 diacylglycerol O-acyltransferase 1 1.391 0.007
NM_178112 integrator complex subunit 8 1.389 0.037
NM_029437 cytoskeleton associated protein 5 1.388 0.012
NM_016786 ubiquitin-conjugating enzyme E2K (UBC1 homolog, yeast) 1.363 0.001
NM_007830 diazepam binding inhibitor 1.356 0.026
NM_010655 similar to ribosomal protein L38; predicted gene 13020; ribosomal protein L38; predicted gene 4991; karyopherin (importin) alpha 2; predicted gene 9028; predicted gene 8129; predicted gene 7123; predicted gene 5832; predicted gene 10184; predicted gene 73
1.336 0.011
NP_080965 mitochondrial ubiquitin ligase activator of NFKB 1 1.331 0.015
NM_010485 ELAV (embryonic lethal, abnormal vision, Drosophila)-like 1 (Hu antigen R)
1.323 0.024
NM_026573 reproductive homeobox 3B; UPF3 regulator of nonsense transcripts homolog B (yeast); reproductive homeobox 1; NFKB activating protein
1.320 0.013
NM_025833 BAI1-associated protein 2-like 1 1.317 0.025
NM_026009 coiled-coil domain containing 47 1.307 0.013
NM_175318 SPT2, Suppressor of Ty, domain containing 1 (S. cerevisiae) 1.303 0.001
NM_028876 transmembrane emp24 protein transport domain containing 5; similar to Transmembrane emp24 protein transport domain containing 5
1.300 0.006
NM_007451 solute carrier family 25 (mitochondrial carrier, adenine nucleotide translocator), member 5; similar to ADP/ATP translocase 2 (Adenine nucleotide translocator 2) (ANT 2) (ADP,ATP carrier protein 2) (Solute carrier family 25 member 5); predicted gene 5529;
1.287 0.027
NM_027307 golgi membrane protein 1 1.285 0.002
NM_019734 N-acylsphingosine amidohydrolase 1 1.283 0.005

Appendix B
- 87 -
NM_178772 arylacetamide deacetylase-like 1 1.283 0.005
NM_024452 leucine zipper protein 1 1.278 0.024
NM_010875 neural cell adhesion molecule 1 1.275 0.049
NM_001037166 predicted gene 4925 1.274 0.018
NM_172471 inter-alpha (globulin) inhibitor H5 1.273 0.019
NM_025994 similar to EF hand domain containing 2; EF hand domain containing 2
1.269 0.003
NM_026184 ERO1-like beta (S. cerevisiae) 1.269 0.017
NM_013771 YME1-like 1 (S. cerevisiae) 1.258 0.027
NM_001082961 small nuclear ribonucleoprotein N; SNRPN upstream reading frame; predicted gene 5802; similar to SNRPN upstream reading frame protein
1.258 0.018
NM_145605 kelch domain containing 4 1.251 0.008
NM_026487 ATPase family, AAA domain containing 1 1.246 0.034
NM_020000 mediator of RNA polymerase II transcription, subunit 8 homolog (yeast)
1.242 0.031
NP_083142 WD repeat domain 33 1.234 0.013
NM_010833 moesin 1.231 0.014
NM_175229 serine/arginine repetitive matrix 2; similar to Serine/arginine repetitive matrix protein 2; similar to retinitis pigmentosa GTPase regulator
1.228 0.009
NM_145706 nucleoporin 43 1.222 0.006
NM_023053 twisted gastrulation homolog 1 (Drosophila) 1.220 0.039
NM_021895 actinin alpha 4 1.208 0.001
NM_009101 Harvey rat sarcoma oncogene, subgroup R 1.208 0.005
NM_001033375 RIKEN cDNA A230046K03 gene -1.208 0.007
NM_001038589 ubiquitin specific peptidase 14 -1.218 0.016
NM_009097 ribosomal protein S6 kinase polypeptide 1 -1.218 0.032
NM_019703 phosphofructokinase, platelet -1.219 0.011
NM_172712 ubiquitin-like modifier activating enzyme 6 -1.219 0.050
NP_001157290 protein phosphatase 1, regulatory subunit 10 -1.225 0.026
NM_145925 pituitary tumor-transforming 1 interacting protein -1.233 0.016
NM_008950 protease (prosome, macropain) 26S subunit, ATPase 5 -1.237 0.025
NM_152801 Rac/Cdc42 guanine nucleotide exchange factor (GEF) 6 -1.239 0.038
NM_011029 predicted gene 9323; predicted gene 7516; ribosomal protein SA pseudogene; predicted gene 9819; predicted gene 6339; predicted gene 9083; ribosomal protein SA; predicted gene 13374; predicted gene 12595; similar to laminin receptor 1 (ribosomal protein SA
-1.252 0.041
NM_178616 predicted gene 14048; proteasome (prosome, macropain) 26S subunit, non-ATPase, 11
-1.253 0.043
NM_008017 structural maintenance of chromosomes 2 -1.261 0.046
NM_019564 HtrA serine peptidase 1 -1.269 0.001
NM_001033300 guanine monphosphate synthetase; predicted gene 7282 -1.273 0.007
NM_009457 ubiquitin-like modifier activating enzyme 1 -1.287 0.002
NM_133823 methylmalonic aciduria (cobalamin deficiency) type A -1.288 0.017
NM_175115 IKAROS family zinc finger 5 -1.292 0.028
NM_153116 GTP-binding protein 10 (putative); predicted gene 6877 -1.303 0.031
NM_009439 proteasome (prosome, macropain) 26S subunit, non-ATPase, 3 -1.314 0.020

Appendix B
- 88 -
NM_008567 minichromosome maintenance deficient 6 (MIS5 homolog, S. pombe) (S. cerevisiae)
-1.314 0.015
NM_080554 proteasome (prosome, macropain) 26S subunit, non-ATPase, 5 -1.317 0.048
NM_009462 ubiquitin specific peptidase 10 -1.335 0.006
NM_017380 septin 9 -1.337 0.007
NM_023248 Shwachman-Bodian-Diamond syndrome homolog (human) -1.341 0.002
NM_025382 transmembrane protein 57 -1.342 0.016
NM_133786 structural maintenance of chromosomes 4 -1.344 0.006
NM_025706 TBC1 domain family, member 15 -1.348 0.002
NM_009794 calpain 2 -1.352 0.021
NM_030678 glycogen synthase 1, muscle -1.352 0.030
NM_008481 laminin, alpha 2 -1.355 0.048
NM_175126 zinc finger, CCHC domain containing 3 -1.358 0.037
NM_019771 destrin -1.368 0.015
NM_138584 spastic paraplegia 21 homolog (human); similar to spastic paraplegia 21 homolog
-1.369 0.038
NM_021523 HECT, UBA and WWE domain containing 1 -1.372 0.017
NM_146093 UBX domain protein 1 -1.380 0.012
NM_023871 predicted gene, EG625349; predicted gene 5789; predicted gene 7085; predicted gene 5708; predicted gene 6847; SET translocation; cDNA sequence BC085271; predicted gene 7239; similar to protein phosphatase 2A inhibitor-2 I-2PP2A; predicted gene 9531
-1.383 0.015
NM_177364 SH3 and PX domains 2B -1.405 0.003
NM_173379 leprecan-like 1 -1.406 0.010
NM_018859 aldo-keto reductase family 1, member E1 -1.408 0.000
NM_009120 SAR1 gene homolog A (S. cerevisiae) -1.421 0.019
NM_010220 FK506 binding protein 5 -1.423 0.005
NM_001033191 ARD1 homolog B (S. cerevisiae) -1.429 0.009
NM_026277 NIN1/RPN12 binding protein 1 homolog (S. cerevisiae) -1.430 0.040
NM_145564 F-box protein 21 -1.435 0.023
NM_008708 N-myristoyltransferase 2 -1.438 0.042
NM_007388 acid phosphatase 5, tartrate resistant -1.441 0.038
NM_026969 Sec31 homolog A (S. cerevisiae) -1.448 0.028
NM_015765 heat shock protein 14 -1.466 0.002
NM_025864 transmembrane protein 206 -1.478 0.029
NM_010239 ferritin heavy chain 1 -1.486 0.007
NM_001077687 LPS-responsive beige-like anchor -1.489 0.018
NM_013472 annexin A6 -1.491 0.010
NM_146041 GDP-mannose 4, 6-dehydratase -1.492 0.003
NM_001166024 ADP-ribosylation factor GTPase activating protein 2 -1.496 0.024
NM_029005 mixed lineage kinase domain-like -1.511 0.041
NM_016710 predicted gene 11914; nucleosome binding protein 1 -1.526 0.004
NM_029839 TruB pseudouridine (psi) synthase homolog 1 (E. coli) -1.543 0.002
NM_145836 similar to polyglutamine-containing protein; RIKEN cDNA 6430527G18 gene
-1.549 0.022
NM_028152 MMS19 (MET18 S. cerevisiae) -1.562 0.014
NM_001045528 FK506 binding protein 15 -1.596 0.009

Appendix B
- 89 -
NP_733469 copine I -1.596 0.030
NM_178726 protein phosphatase 1 (formerly 2C)-like -1.602 0.018
NM_021354 hypothetical protein LOC674305; predicted gene 8918; developmentally regulated GTP binding protein 2
-1.623 0.001
NM_001164559 TRM1 tRNA methyltransferase 1 homolog (S. cerevisiae) -1.669 0.028
NM_025692 ubiquitin-like modifier activating enzyme 5 -1.689 0.025
Table 2-F: Differentially regulated CHO K1 proteins determined in samples corresponding to
culture using spent media from CHO DP-12 cells prepared using media maintained at pH 6.8.
RefSeq Annotation
Description Fold Change
p-value
NM_010708 lectin, galactose binding, soluble 9 1.663 0.027
NM_138589 ubiquitin family domain containing 1 1.650 0.048
NM_133775 interleukin 33 1.648 0.006
NM_001081218 host cell factor C2 1.648 0.008
NM_025740 coiled-coil domain containing 104 1.589 0.038
NM_009242 secreted acidic cysteine rich glycoprotein; similar to Secreted acidic cysteine rich glycoprotein
1.520 0.027
NM_133804 transmembrane protein 132A 1.512 0.041
NM_011127 paired related homeobox 1 1.485 0.002
NM_013558 heat shock protein 1B; heat shock protein 1A; heat shock protein 1-like
1.465 0.007
NM_023232 diablo homolog (Drosophila) 1.458 0.028
NM_001033534 layilin 1.456 0.039
NM_011961 procollagen lysine, 2-oxoglutarate 5-dioxygenase 2 1.443 0.003
NM_009811 caspase 6 1.406 0.036
NM_177068 olfactomedin-like 2B 1.392 0.028
NM_010302 guanine nucleotide binding protein, alpha 12; similar to Guanine nucleotide-binding protein alpha-12 subunit (G alpha-12)
1.390 0.006
NP_080965 mitochondrial ubiquitin ligase activator of NFKB 1 1.386 0.001
NM_031185 A kinase (PRKA) anchor protein (gravin) 12 1.371 0.037
NM_027373 actin filament associated protein 1 1.307 0.026
NM_026267 NECAP endocytosis associated 1 1.296 0.027
NM_011862 protein kinase C and casein kinase substrate in neurons 2 1.295 0.045
NM_015782 predicted gene 8655; predicted gene 5145; predicted gene 8587; small nuclear ribonucleoprotein polypeptide A; predicted gene 5161
1.292 0.005
NM_016706 RIKEN cDNA 2210409E12 gene; coilin 1.288 0.019
NM_026184 ERO1-like beta (S. cerevisiae) 1.282 0.003
NM_007803 cortactin; predicted gene 8786 1.277 0.036
NM_026623 nudix (nucleoside diphosphate linked moiety X)-type motif 21 1.259 0.026
NM_010288 gap junction protein, alpha 1 1.256 0.034
NM_021493 RIKEN cDNA 4933428G20 gene 1.216 0.039
NM_207625 acyl-CoA synthetase long-chain family member 4 1.209 0.012
NP_001156986 exostoses (multiple)-like 2 1.201 0.023

Appendix B
- 90 -
NM_134037 ATP citrate lyase -1.205 0.008
NM_008388 eukaryotic translation initiation factor 3, subunit E -1.231 0.014
NP_001159610 armadillo repeat containing 8 -1.238 0.045
NM_008017 structural maintenance of chromosomes 2 -1.242 0.037
NM_008788 procollagen C-endopeptidase enhancer protein -1.256 0.017
NM_027375 GRIP and coiled-coil domain containing 2 -1.311 0.014
NM_183016 CDC42 binding protein kinase beta -1.315 0.003
XP_483949 predicted gene 6807; predicted gene 6136; predicted gene 6883; predicted gene 5428; similar to ribosomal protein L6; predicted gene 5247; ribosomal protein L6
-1.333 0.038
NM_001004436 wings apart-like homolog (Drosophila) -1.337 0.014
NM_017380 septin 9 -1.338 0.002
NP_705782 aldehyde dehydrogenase 18 family, member A1 -1.339 0.036
NM_133786 structural maintenance of chromosomes 4 -1.342 0.007
NM_001081122 centrosomal protein 63 -1.346 0.020
NM_001015507 Vpr (HIV-1) binding protein -1.347 0.017
NM_015765 heat shock protein 14 -1.353 0.025
NM_001033231 cDNA sequence BC003940 -1.417 0.031
NM_012053 ribosomal protein L8; similar to 60S ribosomal protein L8 -1.427 0.001
NM_011125 phospholipid transfer protein -1.436 0.050
NM_001037166 predicted gene 4925 -1.453 0.038
NM_008605 matrix metallopeptidase 12 -1.466 0.005
NM_177884 expressed sequence AW146020 -1.508 0.035
NM_021354 hypothetical protein LOC674305; predicted gene 8918; developmentally regulated GTP binding protein 2
-1.536 0.003
NM_009120 SAR1 gene homolog A (S. cerevisiae) -1.538 0.033
NM_145925 pituitary tumor-transforming 1 interacting protein -1.541 0.020
NM_175294 nuclear casein kinase and cyclin-dependent kinase substrate 1 -1.548 0.001
NM_026539 chromodomain helicase DNA binding protein 1-like -1.582 0.042
NM_145836 similar to polyglutamine-containing protein; RIKEN cDNA 6430527G18 gene
-1.685 0.014
NM_138315 microtubule associated monoxygenase, calponin and LIM domain containing 1
-1.726 0.044
Copyright © 2022 FDOKUMEN