University of Birmingham Strategic Resource Decisions to Enhance ...
49
University of Birmingham Strategic Resource Decisions to Enhance the Performance of Global Engineering Services Zhang, Yufeng; Yang, Zhibo; Zhang, Tao DOI: 10.1016/j.ibusrev.2017.11.004 License: Creative Commons: Attribution-NonCommercial-NoDerivs (CC BY-NC-ND) Document Version Peer reviewed version Citation for published version (Harvard): Zhang, Y, Yang, Z & Zhang, T 2018, 'Strategic Resource Decisions to Enhance the Performance of Global Engineering Services', International Business Review, pp. 1-48. https://doi.org/10.1016/j.ibusrev.2017.11.004 Link to publication on Research at Birmingham portal Publisher Rights Statement: Finally published on https://doi.org/10.1016/j.ibusrev.2017.11.004 General rights Unless a licence is specified above, all rights (including copyright and moral rights) in this document are retained by the authors and/or the copyright holders. The express permission of the copyright holder must be obtained for any use of this material other than for purposes permitted by law. • Users may freely distribute the URL that is used to identify this publication. • Users may download and/or print one copy of the publication from the University of Birmingham research portal for the purpose of private study or non-commercial research. • User may use extracts from the document in line with the concept of ‘fair dealing’ under the Copyright, Designs and Patents Act 1988 (?) • Users may not further distribute the material nor use it for the purposes of commercial gain. Where a licence is displayed above, please note the terms and conditions of the licence govern your use of this document. When citing, please reference the published version. Take down policy While the University of Birmingham exercises care and attention in making items available there are rare occasions when an item has been uploaded in error or has been deemed to be commercially or otherwise sensitive. If you believe that this is the case for this document, please contact [email protected] providing details and we will remove access to the work immediately and investigate. Download date: 01. Mar. 2020 brought to you by CORE View metadata, citation and similar papers at core.ac.uk provided by University of Birmingham Research Portal
-
Upload
khangminh22 -
Category
Documents
-
view
2 -
download
0
Transcript of University of Birmingham Strategic Resource Decisions to Enhance ...
University of Birmingham
Strategic Resource Decisions to Enhance thePerformance of Global Engineering ServicesZhang, Yufeng; Yang, Zhibo; Zhang, Tao
DOI:10.1016/j.ibusrev.2017.11.004
License:Creative Commons: Attribution-NonCommercial-NoDerivs (CC BY-NC-ND)
Document VersionPeer reviewed version
Citation for published version (Harvard):Zhang, Y, Yang, Z & Zhang, T 2018, 'Strategic Resource Decisions to Enhance the Performance of GlobalEngineering Services', International Business Review, pp. 1-48. https://doi.org/10.1016/j.ibusrev.2017.11.004
Link to publication on Research at Birmingham portal
Publisher Rights Statement:Finally published on https://doi.org/10.1016/j.ibusrev.2017.11.004
General rightsUnless a licence is specified above, all rights (including copyright and moral rights) in this document are retained by the authors and/or thecopyright holders. The express permission of the copyright holder must be obtained for any use of this material other than for purposespermitted by law.
•Users may freely distribute the URL that is used to identify this publication.•Users may download and/or print one copy of the publication from the University of Birmingham research portal for the purpose of privatestudy or non-commercial research.•User may use extracts from the document in line with the concept of ‘fair dealing’ under the Copyright, Designs and Patents Act 1988 (?)•Users may not further distribute the material nor use it for the purposes of commercial gain.
Where a licence is displayed above, please note the terms and conditions of the licence govern your use of this document.
When citing, please reference the published version.
Take down policyWhile the University of Birmingham exercises care and attention in making items available there are rare occasions when an item has beenuploaded in error or has been deemed to be commercially or otherwise sensitive.
If you believe that this is the case for this document, please contact [email protected] providing details and we will remove access tothe work immediately and investigate.
Download date: 01. Mar. 2020
brought to you by COREView metadata, citation and similar papers at core.ac.uk
provided by University of Birmingham Research Portal

Page 1 of 48
This manuscript has been accepted for publication in International Business Review
Strategic Resource Decisions to Enhance the Performance of
Global Engineering Services
Yufeng Zhang Senior Lecturer in Operations Management, University of Birmingham
Zhibo Yang
Research Fellow, Henan Academy of Social Sciences
Tao Zhang Lecturer in Marketing, University of Birmingham
Abstract- This paper extends our understanding of the internationalisation and firm
performance (I-FP) relationship of service firms by considering the influence of
strategic decisions on three types of slack resources. The research focusses on an
important type of service operations - global engineering services, which are a major
part of the global economy and represent a distinctive business model in the
contemporary business environment. In doing so, we theorise the I-FP relationship by
addressing the knowledge-intensive, project-based and people-centric features of
engineering service firms (ESFs); and test the relationship with a carefully assembled
dataset containing 12 years’ data from 242 ESFs. We identify a negative overall I-FP
relationship, i.e. ESFs’ international expansion leads to worse financial performance in
general. The presence of slack resources explains why such a result exists. Our findings
have significant implications, both for future research on internationalisation and
performance and for firms to effectively deploy their resources to support global service
operations in a strategic manner.
Keywords: Internationalisation-Firm Performance (I-FP) Relationship, Strategic
Resource Decisions, Engineering Services Firms (ESFs)

Page 2 of 48
1. Introduction
Understanding the relationship between internationalisation and firm performance has
been a key task for senior decision makers. The task is particularly challenging in global
service operations because the existing theoretical insights which might help to frame
the decision making practices are mainly drawn from a manufacturing-focussed
empirical ground (Caper and Kotabe 2003; Contractor et al. 2007; Heineke and Davis
2007; Chase and Apte 2007; Harvey et al. 2016). However, service operations are
substantially different from manufacturing in a number of distinctive features, e.g.
heterogeneity, intangibility, perishability or inseparability (Løwendahl 2005;
Greenwood et al., 2005; Lewis and Brown 2012; Karpen et al. 2012). Such different
features of service operations may have significant implications for the relationship
between their internationalisation and performance in ways that challenge the received
wisdom as reflected in existing theories of internationalisation and firm performance (I-
FP). It thus becomes a critical research task to understand the varying form of the I-FP
relationship for service firms and eventually generate new knowledge to guide strategic
decisions of global service operations in a sector-specific context.
While some important recent studies have made considerable progress in illustrating
the features of service operations that may influence the I-FP relationship, there are still
considerable unknown areas, both empirically and conceptually, regarding whether,
how, why, and when internationalisation leads to improved firm performance
(Contractor 2012; Marano et al. 2016; Miller et al. 2016; Powell 2014). Empirical
research has generated very varied evidence (Contractor et al. 2003; Contractor 2012; Li
2007), which has prompted scholars to propose a range of contingencies in the
relationship including the motives of internationalisation and the modes of
internationalisation pursued (Contractor 2007; 2012), home and host country
institutional influences (Berry et al. 2010), and the progress of developing institutional
capabilities across borders (Carney et al. 2016). The highly ambiguous evidence-base
has prompted scholars to propose increasingly refined conceptual models, especially
those that pay increased attention to the roles of strategic decisions, such as those on
geographic diversification (Wiersema and Bowen 2011), product diversification (Oh
and Contractor 2012), learning approaches (Hsu et al. 2013), strategic alignment
Page 3 of 48
(Powell 2014), international coherence (Celo and Chacar 2015), as well as international
intensity, diversity and distance (Miller et al. 2016) in the I-FP relationship.
Within this context, we theorise that service firms’ strategic decisions on slack
resources, which have been widely considered as the key property enhancing the ability
of an organisation to cope with challenges in the complex process of
internationalisation (Cyert and March 1963; Nohria and Gulati 1996; Greenley and
Oktemgil 1998; Mishina et al. 2004), are of critical importance for payoffs to their
internationalisation. As pointed out by Bourgeois (1981, p30)- “Slack […] allows an
organisation to adapt successfully to internal pressures for adjustment or to external
pressures for change in policy, as well as to initiate changes in strategy with respect to the
external environment.” Specifically, we proposed that the overall I-FP relationship for
service firms are governed by the presence of three types of slack resources (Nohria
and Gulati 1996; Mishina et al. 2004), i.e. absorbed slack human resources (AHR), other
kinds of absorbed slack resources (OAR) and unabsorbed slack resources (USR). Albeit
their obvious importance, such strategic resource decisions are very difficult to be made
appropriately due to their complex implications in international service operations (Tan
and Peng 2003; Daniel et al. 2004). On the one hand, service firms need a certain
amount of slack resources to expand their service operations in global business
networks. On the other hand, a high level of slack resources may lead to a low utilisation
rate, thus threatening firm performance. In brief, we believe that it is theoretically
valuable and practically useful to investigate the I-FP relationship for service firms in
the global context with a particular attention to examining the influence of slack
resources.
We in our investigations focus on a particular type of service operations - global
engineering services, which are typically knowledge-intensive, project-based, and
people-centric, representing a distinctive business model of professional service firms
in general (Løwendahl 2005; Malhotra and Morris 2009; Von Nordenflycht 2010; Zhang
et al. 2016). In doing so, we are able to generate theoretical insights potentially useful
for a wider range of service firms which have attracted a growing research interest
among IB scholars (Zhang et al. 2015; Bello et al. 2016; Shin et al. 2017). At the same
time, the research focus itself has significant industrial implications. Global engineering
services, as one of the largest professional service industries in the world, is an

Page 4 of 48
important part of the contemporary global economy, directly contributing to GDP and
employment and indirectly providing critical inputs for organisations creating high
value products and services across sectors. ISG (2013) estimated the global spend on
engineering services to be around US$930 billion in 2012, rising to US$1.4 trillion by
2020. In addition, this sector provides a fertile context in which to examine the I-FP
relationship because internationalisation has been a major strategic focus in the sector
in recent years as many engineering service firms (ESFs) have sought to grow and
enhance their competitiveness on a global scale, driven by the rapid growth of the
emerging economies (Fernandez-Stark et al. 2010), increasing engineering capabilities
(and work force) in the developing countries, the global race for talent (Lewin et al.
2009) and opportunities made available by the progress of information technologies
(Zhang et al. 2016).
To report our research in a more accessible manner, the next section of the paper sets
out the state of knowledge regarding the I-FP relationship for service (and non-service)
firms. We formulate a set of hypotheses to advance our understanding about the I-FP
relationship for ESFs by addressing their knowledge-intensive, project-based and
people-centric features. We subsequently introduce our research approach, before
reporting our findings. We finally conclude this paper by discussing the main
contributions and suggesting directions for future research.
2. The I-FP Relationship for Service Firms
In this section, we briefly review the state of knowledge regarding the relationship
between internationalisation and firm performance, paying particular attention to a
comparison between research focussing on manufacturing and service firms. Li (2007)
provided a synthetic review of the I-FP theories. We updated his summary and
produced the latest view of empirical studies on the I-FP relationship which consists of
56 studies in major IB journals based on their relevance to the topic as well as their
contribution to the research method (see Appendix 1). Our update confirms that over
the past four decades the I-FP relationship has been an important research issue in
literature, which is reflected in a large and growing body of academic research,
including a number of meta-analyses (e.g. Li 2007; Ruigrok and Wagner 2004; Geleilate
et al. 2016), the latest and most comprehensive of which identifies 359 studies of the I-

Page 5 of 48
FP relationship collectively encompassing 2.5 million firm-year observations (Marano et
al. 2016). As mentioned earlier, the vast majority of the existing empirical I-FP studies
were in the manufacturing sector. In a large number of empirical studies identified in
our literature review, only 7 of them look into the service sector. These studies
suggested five primary views about the I-FP relationship: (i) not significant, (ii) positive
linear, (iii) negative linear, (iv) U-shaped and (v) inverted U-shaped. Our review
indicates that such seemingly contradictory findings were caused by the different
conceptualisation and measurement of the variables, the quality of data, and the
methods adopted (see Appendix 1). Nevertheless, they provided rich and constructive
insights for international expansions of manufacturing firms.
The dearth of research into the I-FP relationship of service firms has been continuingly
reported. Contractor et al. (2003, p.9) claimed that “although services are more
important than manufacturing [justified by their shares of GDP worldwide], there is little
research on the growth and internationalisation of service firms”, and Caper and Kotabe
(2003, p.345) repeated the message by saying that “a major gap in the literature has
been the non-existence of studies that have examined the effect of international
diversification on performance in service firms [although the relationship has been
extensively investigated in manufacturing firms].” The message was reinforced by
Greenwood et al. (2007, p.661)- “despite their [service firms’] significance, little is known
of the determinants of their performance”; and Contractor et al. (2007, p.407) - “it is
ironic, therefore, that virtually all the empirical studies on performance versus
internationalisation in the past 30 years have been in manufacturing”.
Having acknowledged this major gap and recognised the importance of the service
sector in the global economy, a handful of studies examined the I-FP relationships of
service firms (see Table 1, extracted from Appendix 1). These studies discussed the
differences between service firms and manufacturing firms and argued for a different
trajectory of internationalisation for service operations. Albeit that they provide a good
start point for our research, there are major limitations to their findings due to the
narrow time span and multiple service sectors covered in their datasets. Different kinds
of services, for example knowledge-intensive and capital-intensive service firms (Shin et
al. 2017), may operate very differently in international expansions. Studies aggregating
data across multiple industries in general face more empirical obstacles (Delios and

Page 6 of 48
Beamish 1999; Hennart 2007; Powell 2014). It is not ridiculously unreasonable to
speculate that differences among the existent I-FP theories might result from the vast
diversity of service firms in different operations settings. It is therefore more likely to
advance our theoretical understanding of the I-FP relationship that might be influenced
by strategic decisions among professional service firms (with ESFs as a typical example)
that adopt a distinctive business model generally recognised by their knowledge-
intensive, project-based and people-centric features (Løwendahl 2005; Zhang et al.
2016).

Page 7 of 48
Table 1: Summary of empirical I-FP studies involving service firms
Empirical studies
Degree of Internationalisation (I) Firm Performance (FP) Sampling Analytical
method Key moderator or
control Results (I-FP relationship) Dimensions Measures Types Measures
Capar and Kotabe (2003)
Single; sales-based
FSTS Accounting based financial indicator
ROS 81 major German service firms in 4 industries (1997 to 1999)
OLS regression Firm size; industrial effect
U curve
Contractor et al. (2003)
Single; index-based
3-component index (FSTS, foreign to total employees, ratio of foreign to total offices)
Accounting based financial indicators
ROS/ROA 103 largest service Companies from 11 industries (1983 to 1988)
Time series cross-sectional regression
Firm size; Industrial sector effect, and home country effect
Horizontal S-shaped curve (esp. the knowledge-intensive sub-sample)
Li (2005) Single; sales-based
FSTS Accounting-based financial indicator
ROS 574 American service firm (1997 to 2001)
Feasible GLS regression
Size; business diversity; capital intensity; market share; financial leverage; growth and downsize; industry control
Horizontal S-curve for the whole sample; Home region oriented strategy positively moderates I-FP relationship
Hitt et al. (2006)
Single; count-based
Entropy index based on number of foreign offices and number of lawyers
Self-reported and unaudited data from American Lawyer
ROS 72 largest US law firms (1992 to 1999)
GLS regression Firm size; leverage; location in NYC; service diversification; domestic geographic dispersion; prior performance
Positive and inverted U curve; human capital positively moderates I-FP; Relational capital does not have a moderating effect on I-FP
Contractor et al. (2007)
Single; sales-based
FSTS Accounting-based financial indicator
ROA; ROE; ROS; tested separately
269 Indian firms (142 manufacturing & 127 service firms in 4 industries, 1997 to 2011)
Two-stage GLS regression
Firm size; firm age; a dummy variable for industry sub-sectors
U curve; service firms gain the positive benefits sooner than manufacturing firms
Powell (2014)
Single; count-based
Count of host countries where a firm maintains offices in an observation year divided by the sample maximum number of host countries across all observation years.
Accounting-based financial indicator
Profits-Per-Partner (PPP); Revenue-Per-Lawyer (RPL); downside risk on PPP; downside risk on RPL
102 US largest law firms (1986 to 2008)
OLS regression Firm age; firm size; ratio of associates to partners; international experience; environmental complexity etc.
S curve; firm-specific optimal levels of internationalisation exists so we need MA-P relationship.

Page 8 of 48
Shin et al. (2017)
Single; count-based
The mean of two ratios (0 to 1): [the number of foreign affiliates/the max number in samples], and [the number of countries/the max number]
Accounting-based financial indicator
ROA, with robustness test of ROE
1082 Spanish micro service firms over an eight-year period 2005-2012
Feasible generalised least square regression
Firm age, Firm size, Indebtedness, Entry Mode
Inverted U-Shaped relationship for knowledge intensive micro service firms; U-shaped relationship for capital intensive micro service firms.

Page 9 of 48
3. Distinctive Features of ESFs and Theoretical Development
We start our quest for an improved I-FP theory for service firms with a proper
understanding of their distinctive features, beginning with ESFs that represent a
knowledge-intensive, project-based, people-centric business model also adopted by a
wider range of professional service firms. This allows us to assess their influences on
the I-FP relationship, and thus possibly identifying additional theoretical constructs to
reconcile contradictory views in literature.
3.1 Revisit the I-FP relationship for Service Firms
The knowledge-intensive feature has a positive influence on the I-FP relationship.
First, effective value creation in professional service operations is primarily based on
the application of knowledge (e.g. the know-how, skills, expertise and experience of
professionals), as opposed to manufacturing where the use of equipment and special
facility is usually predominant (Zhang et al. 2016). This allows service firms to easily
expand their businesses in a different country without investing heavily in equipment
or facility at the early stages. Service firms may then be able to avoid high upfront
spending for international expansion and thus more likely having a better financial
performance than manufacturing firms.
Second, service firms in general need to have some local resources due to the
simultaneous production-consumption (i.e. inseparability and perishability) nature of
service operations (Zhang and Zhang 2014). Contractor et al. (2003) distinguished
between capital-intensive and knowledge-intensive service firms. EFSs as typical
knowledge-intensive service firms, compared with capital-intensive service firms (e.g.
hotels, restaurants or retailers), have more intangible resources and a much lower fixed
cost burden. It is not necessary for them to invest heavily into local branches to serve
customers; instead they can expatriate experienced engineers to deliver services or
collaborate with local engineers. Various moderating effects of such industrial
characters have been reported in Shin et al. (2017)’ recent study on Spanish micro
service firms.
Third, many countries have strict control over the extent of foreign involvement in their
service industries, which results in a lower operations efficiency of foreign service firms
(Capar and Kotabe 2003; Feketeluty 1988). This happens to many capital-intensive
Page 10 of 48
service firms rather than knowledge-intensive service firms such as ESFs - many
countries actually provide favourable policies and incentives to encourage foreign ESFs
with global leading expertise to participate in important engineering projects. For
example, the UK’s high speed railway project HS2 welcomed international participation
and attracted bids from more than 1000 ESFs from across the world. These favourable
policies can have a positive effect on the performance of service firms.
For these reasons we would like to suggest the following hypothesis to kick off the
investigation-
H1: A higher level of internationalisation generates better financial
performance for ESFs.
The project-based feature will also influence the I-FP relationship. Professional
service firms in general provide one-off solutions to address the particular need of a
client instead of repeating production in a large volume as many manufacturers do. This
may influence the I-FP relationship in a much complex manner. First, for many service
firms (e.g. hotels or retailers) operating internationally, the revenues they gained from
international markets are mainly from individual consumers. At the initial stage of
foreign expansion their revenues are generally small - this implies a negative effect on
their performance. However for ESFs, overseas engineering projects are usually large
scale contracts of high monetary values. For example, the UK nuclear power plant
contract is worth above £80 billion. The high value nature of international engineering
projects can have a positive effect on the performance of ESFs at the initial stage of their
foreign expansion.
Second, many foreign service firms have to adapt their service offerings extensively for
local clients because of linguistic, cultural and institutional differences. This applies to
capital-intensive service firms such as retailers and hotels as well as some knowledge-
intensive service firms such as accounting and legal service firms. However, as
engineering knowledge is culture-neutral thanks to the well-developed international
standards for engineering procedures, specifications and outputs. ESFs are “less prone
to severe adaptation or cultural assimilation costs” (Contractor et al. 2007), which may
lead to a positive effect on their performance.
Page 11 of 48
Third, engineering projects have to be client oriented with a high level of interaction,
participation and customisation (Løwendahl 2005; Machuca et al. 2007), i.e. ESFs have
to understand and adapt to clients’ changing needs whilst collaborating on service
provision. Major drivers for engineering task choice are often external, e.g. clients or
collaborators, rather than solely based on the curiosity of an engineer or driven by an
ESF’s desire for discovery (Zhang et al. 2014). It is difficult to specify such tasks
comprehensively and precisely at the outset of a complex engineering project. To
produce a useful solution in an effective manner, ESFs increasingly depend on inputs
from different technological disciplines and multiple collaborative organisations. Each
project may involve a different set of collaborators to complete the planned tasks, e.g.
sub-contractors, equipment providers, auditors or other third parties, for better
proximity of and probably collocation at the project site. In addition, ESFs have to adapt
their working methods effectively and respond quickly to changing contexts to solve
unpredictable problems with limited resources and limited time available. As the result,
from a long-term point of view ESFs have to cope with high uncertainty and complexity
in international operations, including external changes from markets and customers,
and internal changes from operational and technological aspects. This has a negative
influence on the I-FP relationship due to a degree of operations uncertainty, and thus
high cost for coordination and transaction (Williamson 1981). As the degree of
internationalisation increases, coordination costs also increase. ESFs have to cope with
more governance and coordination problems, which lead to high uncertainty and
complexity in their international service operations. When ESFs’ degree of
internationalisation reaches a certain point their increased coordination costs will
surpass gains from internationalisation (Galbraith and Kazanjian 1986). This rationale
was well addressed also in Contractor et al. (2007), i.e. the stage 3 negative slope:
internationalisation beyond an optimum level. We would therefore like to argue that the
project-based feature of ESFs has a positive influence on the I-FP relationship at the
initial stage and a negative influence on the I-FP relationship later.
The above reasoning suggests an inverted U-shaped curvilinear I-FP relationship for
ESFs. As there are two opposite forces governing the relationship, an optimal level of
internationalisation would exist. Before the degree of internationalisation reaches the
optimal point, a positive slope exists; the performance then moves down as the degree

Page 12 of 48
of internationalisation increases after the optimal point, making the slope negative. An
alternative hypothesis to H1 has been formulated as following:
H1_alt: The relationship between internationalisation and the financial
performance of ESFs is an inverted U-shape, with positive slope at low levels of
internationalisation and negative slope at high levels of internationalisation.
3.2 The influence of strategic resource decisions
We expect H1 to be supported by our data because there is a trend in reality for ESFs to
grow their businesses on a global scale (Lewin et al. 2009; Fernandez-Stark et al. 2010;
Zhang and Gregory 2011; Zhang et al. 2016). H1_alt might also be supported for
considering that the trend is a fairly recent phenomenon, and that the knowledge-
intensive and project-based features of ESFs will influence the I-FP relationship in
various ways. But if both H1 and H1_alt were rejected, e.g. our data suggested a negative
relationship between internationalisation and firm performance, we would face a
fundamentally very interesting question - how on earth could ESFs expand their
international businesses to get worse financial performance?
In order to answer this question, our proposition is to further investigate various
approaches that ESFs deploy their resources to support international growth since the
distinctive features of ESFs suggest significant differences in the composition and
deployment of resources which may alter the fundamental I-FP relationship
(Løwendahl 2005; Malhotra and Morris 2009; Lewis and Brown 2012; Zhang et al.
2016). The key is to understand whether it is the scarcity or abundance of slack
resources that is most beneficial to the financial performance of ESFs (Bradley et al.
2011). Some scholars argued that in order to exploit opportunities for expansion, ESFs
must have access to slack resources to buffer costs and risks incurred overseas due to
greater managerial complexity and liability of foreignness (Pierce and Aguinis 2011;
Tseng et al. 2007); while others held the opposite view which insists that slack
resources could promote risk-taking activities and breed inefficiency (Tan and Peng
2003). Therefore it is critical to understand the moderating effect of slack resources on
the I-FP relationship in the process of international expansion (Lin et al. 2009).
3.2.1 The moderating effect of absorbed slack human resources (AHR)

Page 13 of 48
The people-centric feature may lead to various moderating effects through resource
decisions (Lewis and Brown 2012; Zhang et al. 2016). The process of service provision
and delivery is underpinned by the application of professionals’ intangible knowledge
to provide complex solutions customised to clients’ needs. Clients cannot easily
understand or accurately weight the engineering competence that involved in this
process, and therefore have to rely on the professional judgement of ESFs. Human
resources, i.e. well educated/trained professionals with in-depth knowledge about
certain engineering discipline(s), are critical resources of ESFs. A close scrutiny on the
influence of human resources is therefore necessary. Human resources, and particularly
the absorbed slack human resources (AHR) that are specialised, rare and absorbed in
engineering service operations, have been widely considered an important factor that
facilitates the exploitation of business opportunities abroad (Westhead et al. 2001;
Mishina et al. 2004). At the early stage of the internationalisation, because of lacking
foreign operations experience ESFs need to deal with a certain level of liabilities of
foreignness. ESFs need also to keep a certain level of AHR to buffer uncertainties or
uncontrollable contingencies that could lead to lower performance in a foreign market.
We posit that AHR can strengthen the I-FP relationship at the early stage of
internationalisation based on the following theoretical arguments.
First, according to the replacement cost argument, when an ESF ample AHR, employee
turnover will result in limited replacement costs for the firm; any resignation threat will
not be considered as threatening, leading to lower bargaining power of the employees
(Lal et al. 1999; Wang et al. 2013). Second, AHR are a kind of accumulated resources;
thus the slack could be consistent with an ESF’s international strategies. These firm-
specific and path-dependent human resources are valuable for the firm because it is
difficult for its competitors to obtain them, thus contributing to sustainable competitive
advantages over its competitors (Mishina et al. 2004). Third, engineering service
operations in a less predictable international environment requires an ESF to have
highly skilled (and experienced) engineers who can secure the success of critical
international projects. It normally takes many years for an engineer to gain necessary
experiences, skills and capabilities. Thus it is often difficult for an ESF to recruit
engineers with required skills in a short time to deal with emergent issues in an
international environment; keeping a proper level of slack is a cost-effective means to
handle emergent needs in relation to international engineering projects (Huang and

Page 14 of 48
Hsueh 2007). Fourth, according to Wefald et al. (2010) ESFs with a certain level of AHR
are able to reduce employee turnover because employees are not required to work
excessive hours on a routine basis when new services are introduced or customer
demands change. A proper level of slack will give engineers time, space, and necessary
support to actively participate in learning and knowledge creation activities, which is
critical in bidding for innovative engineering projects (Chen and Huang 2010) and
improving international reputation (Glückler and Armbrüster 2003).
On the other hand, after a number of years’ internationalisation ESFs would obtain
useful experience to deal with uncertainties abroad. A high level of AHR would become
an increasingly heavy burden for ESFs because of the high cost of keeping qualified
professionals. Voss et al. (2008) argued that AHR are highly rigid and often embedded
in organisations, thus are very sticky. Resource “stickiness” is the extent to which slack
resources can be quickly and opportunistically utilised to boost business expansion
(Mishina et al. 2004). Once sticky resources have been allocated, they cannot be easily
utilised in other areas. This is particularly the case for ESFs, as Davenport (2005, p.10)
pointed out “they (engineers) have high degrees of expertise, education or experience and
the primary purpose of their jobs involves the creation, distribution or application of
knowledge”. Engineering expertise and knowledge are typically domain-specific,
therefore can hardly be applied to other domains. For example, chemical engineers can
hardly do mechanical engineering work if the market demand shifts toward the latter
type of engineering services. ESFs often recruit and develop engineers with specific
disciplinary skills, e.g. electrical, mechanical or chemical skills. Their skills and
knowledge tend to be embedded in some specific tasks so it is difficult to deploy these
skills across different task situations (Szulanski 2003). Hence we posit that when
internationalisation reaches a mature stage, the stickiness of AHR would have a
negative effect on ESFs’ performance. H2 is developed based on these arguments.
H2: Absorbed slack human resources (AHR) have an inverted U-shaped
moderating effect on the relationship between internationalisation and ESFs’
performance.
3.2.2 The moderating effect of other kinds of absorbed slack resources (OAR)
Other kinds of absorbed slack resources (OAR) are the recoverable non-human
resources that are embedded in an organisation as excess resources and are difficult to

Page 15 of 48
be re-deployed (Bourgeois 1981; Daniel et al. 2004). These resources are absorbed in
operations (e.g. excess capacity) and have limited use for alternative purposes.
Managers have less flexibility to use these resources quickly when they need them.
Because of their discretionary characteristics, the most important role of OAR is to act
as an “internal shock absorber” that prevents international service operations from
disruption and synchronises an ESF’s international work flows to improve their
efficiency. Positive performance implications of OAR have been reported in literature,
for example, Huang and Chen (2010) found that OAR positively moderate the
relationship between technological diversification and innovation, and thus firm
performance; and Gary (2005) suggested that without the cushion provided by these
excess resources to buffer the internal and external pressures, ESFs’ resources would be
overextended and the costs of internationalisation may offset the benefits quickly.
However, OAR’s negative effects on firm performance have also been reported due to
inconsiderate investments, an unnecessary waste of resources, or the delay of necessary
reforms (Schemeil 2013).
We would like to extend this reasoning for considering that ESFs are more directly
influenced by the economy circle than manufacturing firms due to their direct links to
long-term, large-scale infrastructural investments. In the economic downturn,
governments and investors will be very cautious to plan and approve this kind of mega
projects to avoid pessimistic scenarios in the future, although they tend to increase
long-term infrastructure projects to stabilise and accelerate economic growth in a
booming time. When ESFs operate internationally the uncertainty and unpredictability
of engineering service operations will sharply contrast the embedded nature of OAR. In
addition, when external factors trigger the need for change, perhaps through a lower
level of demand for engineering services, reductions in OAR may occur over a long
period of time through downsizing (Wefald et al. 2010). In brief, although OAR may act
as internal shock absorber to smooth the international expansion process by reducing
conflicts and contention of internal resources, they may also negatively influence the I-
FP relationship. Based on the above reasoning we develop the following hypothesis.
H3: Other kinds of absorbed slack resources (OAR) negatively moderate the I-
FP relationship in such a way that high levels of OAR decrease firm
performance resulting from internationalisation.
Page 16 of 48
3.2.3 The moderating effect of unabsorbed slack resources (USR)
Unabsorbed slack resources (USR) are the currently uncommitted resources that can be
easily redeployed in an organisation (Singh 1986). Because of their easy-to-deploy
nature, they are more likely to be used as additional resources to help ESFs implement
international strategies, e.g. entering a new market, launching a new solution, etc. As
mentioned earlier, internationalisation entails great costs, risks and uncertainties
because international engineering projects are often large and complex. Voss et al.
(2008) argued that some USR, such as financial reserves, retained earnings, and other
liquid assets can ease capital restrictions and enable firms to generate new knowledge
in advance of the actual need and pursue projects with uncertain outcomes. Huang and
Chen (2010) pointed out that USR can isolate ESFs from external pressures, and provide
necessary protection for them to maintain their aspirations and achieve ambitious
strategic targets. Specifically, as USR are easy to be redeployed as needed, we would like
to argue that these resources are conducive because they provide ESFs with readily
available resources to invest across different geographic locations and business areas.
This flexibility enables ESFs to transform USR into higher firm performance by
capturing growth and optimisation opportunities as soon as they arise, and thus
extracting the full benefit from internationalisation.
Although USR are conducive in the internationalisation process, a high level of USR can
result in loose management control in an ESF, which in turn causes low productivity.
There are several reasons for this. First, managers facing resource constraints will
perceive a higher opportunity cost for their limited available resources (Wei et al. 2002);
thus compared with managers with excess resources they tend to utilise the limited
resources more cautiously and efficiently (Baker and Nelson 2005; George 2005).
Second, the agency theory (Eisenhardt 1989) further points out that because managers
and firm owners have different goals, managers may divert USR away from productive
uses in order to pursue private and self-aggrandising benefits, making synergies across
different business areas difficult to realise (Jensen 1998). With the progress of
internationalisation, USR might be squandered as a result of the emerging constraints
and the rising levels of difficulty and complexity in understanding and coordinating
different business units across countries. Third, a high level of USR may reduce the
pressure to utilise administrative resources efficiently across the geographic portfolio,

Page 17 of 48
which could “hide” the rising complexity in the internationalisation process, eventually
resulting in inefficient disposal of valuable resources and undermining an ESF’s ability
to coordinate different geographic units. In light of the above reasoning, we develop the
following hypothesis.
H4: Unabsorbed slack resources (USR) have an inverted U-shaped moderating
effect on the I-FP relationship.
3.3 The conceptual model and hypotheses
Figure 1 shows a conceptual model to illustrate our theoretical developments. At the
beginning we assume a positive linear I-FP relationship thanks to the knowledge-
intensive feature of ESFs (H1). However, the coordination cost may increase with the
progress of internationalisation due to the project-based feature of ESFs, which will
hinder firm performance at the later stage of internationalisation. For this reason we
further suggest an alternative inverted U-shaped curvilinear I-FP relationship (H1_alt),
just in case that H1 is not accepted. In the situation that both H1 and H1_alt are rejected
by our data, we will have to introduce an additional theoretical construct focussing on
strategic resource decisions, to possibly explain the seemingly unreasonable
phenomenon that ESFs expand their international businesses to get worse financial
performance. The influences of strategic decisions on three types of slack resources
were hypothesised with a particular attention to human resources to reflect the people-
centric feature of ESFs- (i) absorbed slack human resources (AHR) have an inverted U-
shaped moderating effect on the I-FP relationship (H2), (ii) other kinds of absorbed
slack resources (OAR) have a negative moderating effect on the I-FP relationship (H3),
and (iii) unabsorbed slack resources (USR) have an inverted U-shaped moderating
effect on the I-FP relationship (H4).

Page 18 of 48
Figure 1. The conceptual model and hypotheses
4. Research Approach
4.1 Sample data
This research was based on a dataset of ESFs drawn from the OSIRIS database - one of
the main databases consisting of information about listed and major unlisted/delisted
companies around the world. Recent studies, e.g. Banalieva and Dhanaraj (2013) and
Barroso and Giarratana (2013) suggested that OSIRIS consists of good quality and up-
to-date data about internationalisation and firm performance. We developed a set of SIC
codes to retrieve an initial list of ESFs from OSIRIS, including primary codes such as
5413 for Architectural, Engineering, and Related Services and 5414 for Specialised
Design Services, as well as sub-level codes. The initial sample includes 2717 firms with
complete financial records available from 2002 to 2013. We developed a software
toolkit with Microsoft Excel VBA to automatically filter out unqualified entries in two
steps. The 1st filtering was to exclude firms with less than 5 years’ sales data because we
would use this data to assess the degree of internationalisation. The 2nd filtering was to
exclude firms with less than 5 years’ data of employee numbers because we would use
this data as a key indicator for AHR. 325 firms remained after this 2nd filtering. Six
research assistants then manually checked the data by comparing them with
information from the websites of these firms and updating the dataset if there was a
difference or missing. After that, we manually removed firms without sales information
by geographic regions since we would need that to indicate the degree of
internationalisation, and gained the final sample of 242 firms.
Internationalisation Firm Performance
Absorbed slack Human Resources (AHR)
Unabsorbed Slack Resources (USR)
Other kind of Absorbed
slack Resources (OAR)
Control Variables Firm Size (C1)
Firm Age (C2)
Reputation (C3)
Hypothesised Relationship
Additional
Tests
H2 H3
H4 H1 & H1_alt

Page 19 of 48
Out of these 242 ESFs, 64 are US firms (26.45%), followed by Indian (25, or 10.33%),
Australian (20, or 8.26%), Japanese (19, or 7.85%), Canadian (17, or 7.02%), UK (14, or
5.79%), Chinese (13, or 5.37%), Korean (12, or 4.96% ), German (9, or 3.72% ) and
French (6, or 2.48%) firms. The remaining 43 (17.8%) firms in the sample are from
many other countries. Details of the sample characteristics, including industry, average
number of employees, average firm age and average degree of internationalisation
(DOI), are shown in Table 2.
Table 2. Sample characteristics
Industry Number of
firms
Average number
employees
Average firm
age
Average
DOI*
21311 Support Activities for Mining 11 11645 82 0.72
221310 Water Supply and Irrigation Systems 17 3762 76 0.23
23621 Industrial Building Construction 19 17619 39 0.48
237310 Highway,Street, and Bridge Construction 45 21328 47 0.43
2379 Other Heavy and Civil Engineering
Construction
11 15740 83 0.39
5413 Architectural,Engineering, and Related
Services
18 9668 65 0.61
5414 Specialised Design Services 7 512 39 0.26
541620 Environmental Consulting Services 20 6347 37 0.51
54169 Other Scientific and Physical,
Engineering, and Life Science
22 4038 42 0.20
562 Waste Management and Remediation
Services
21 5325 29 0.46
2371 Utility System Construction 28 6723 73 0.33
221320 Sewage Treatment Facilities 23 2389 28 0.24
* For DOI please see Section 4.2.1
4.2 Measures
4.2.1 Degree of internationalisation
A simple way to assess the degree of internationalisation has been based on two kinds
of information: (i) the number of countries in which a firm had overseas business units
in a given year and (ii) a firm’s number of overseas subsidiaries in each year (Lu and
Beamish 2004; Shin et al. 2017). Researchers sometimes will integrate these measures
into a composite measure as suggested by Sanders and Carpenter (1998). This
composite measure however has some critical pitfalls due to the high correlation
between these single measures. For this reason, we decided to measure the degree of
internationalisation with an improved method- the entropy method as suggested by
Hitt et al. (1997), which can take into account both the depth and breadth of
international expansion.

Page 20 of 48
Internationalisation = ∑[GSi ∗ ln(1/GSi)]
i
Where GSi is the proportion of a firm’s sales obtained from geographic region i and
ln(1/GSi) is the weight of each geographic region.
4.2.2 Firm performance
The dependent variables used in the I-FP relationship studies usually include three
types of accounting-based performance indicators: return on assets (ROA), return on
sales (ROS) and return on equity (ROE). With reference to previous studies on the I-FP
relationship in the services industry, we chose ROA as the measure of ESFs’
performance (see Hitt et al. 2006). This was because ROA has been popularly used by
ESFs and external analysts. Another consideration was that the influence of strategic
decision on ESFs’ performance has been more directly reflected by accounting profit
rather than stock prices. We saw little necessity to use multiple indicators (i.e. ROA, ROS
and ROE) because many researchers reached the same conclusion that there is a high
consistency across these indicators in general and questioned the validity and necessity
of using these interchangeable indicators as dependent variables (Contractor et al. 2003;
Contractor et al. 2007; Grant et al. 1987; Lee 2013).
4.2.3 Moderating variables
Three moderating variables were considered in this study as introduced in the
conceptual model: AHR, OAR and USR. With reference to earlier studies such as Greenley
and Oktemgil (1998) and Mishina et al. (2004) we used the ratio of the number of
employees to sales as the measure for AHR. The total number of employees is a
measure close enough to indicate an ESF’s human engineering resources because
engineers account for a dominant portion of its workforce. In addition, we have to
consider the practical difficulties in acquiring the exact number of engineers since that
information is generally not available in public domains. By following the suggestion of
Singh (1986) and Chen et al. (2012), we measured OAR by using the sum of an ESF’s
working capital minus the cost of employees and then divided by total sales; and USR
were measured by the ratio of current assets to current liabilities.
4.2.4 Control variables

Page 21 of 48
To empirically test the I-FP relationship and the moderating effects of slack resources
on this relationship, we included three control variables: firm size (C1), firm age (C2)
and firm reputation (C3). Firm size was considered because, as argued by Harris and Li
(2009), large firms have more human and financial resources so it might be easier for
them to use these resources to compete in international markets. Firm size has been
measured by the natural logarithmic of the total number of employees (Zahra 2003) or
the total sales (Gaur and Kumar 2009; Hitt et al. 1997; Lampel and Giachetti 2013; Lu
and Beamish 2004). Lee and Habte-Giorgis (2004) suggested that using the total
number of employees will lead to better results than using the total sales in empirical
studies. We for this reason decided to measure C1 with the natural logarithmic of the
total number of employees. C2, firm age, was considered because it is related to the level
of experience and managerial competencies of an ESF in international expansion. It was
measured by the natural logarithmic of the number of years a firm has been in business
by following the suggestion of Singla and George (2013).
C3, firm reputation determines how different stakeholders perceive its past actions and
future prospects (Barnett et al. 2006). The factor is important for ESFs in at least three
aspects: (1) reputation is more easily to exploit in international engineering operations
because it can be utilised simultaneously in multiple markets at no additional expenses
or at a very low cost (Podolny 1993; 1994); (2) reputation enables ESFs to attract and
hire best employees (Greenwood et al. 2005); and (3) reputation enables ESFs to charge
premiums because of their ‘reputable brand names’ (Krishnan and Schauer 2000). C3
was measured by using business media data as suggested by Deephouse (2000). The
FACTIVA database was used. Names of the 242 ESFs were used as keywords for
searching within five major international publications from 2002 to 2013, including
Economist, Forbes, The Wall street Journal, Financial Times, and Fortune. The result
included 324,503 articles mentioning these firms. The assessment of these articles
began with two researchers reading 100 randomly selected articles to develop a coding
scheme to count positive media reports and negative ones (for details of the coding
scheme please see Appendix 2). The two researchers used the same coding scheme to
access these 100 articles independently and compared their results. The coding scheme
was refined until a 0.9 inter-reliability rate was reached, i.e. these two researchers
reached the same result on at least 90 out of 100 articles. With this coding scheme, all
the articles were assessed to get the numbers of positive and negative ones for each

Page 22 of 48
company in each year. Firm reputation was measured by the number of positive media
reports (logged) in our analysis because it is less correlated with firm size.
In addition, dummy variable Year was introduced to test the influence of time scale.
4.3 The Model
The hypotheses (H1-4) were tested by using repeated observations on the same set of
cross-sectional units with different time series. The data has a cross-sectional time
series structure with each firm as an unbalanced panel that spans over a period of at
least 5 years. Considering that using the ordinary least squares (OLS) model to estimate
panel data may lead to biased results due to unobserved heterogeneity (Greene 2012),
in this study we used generalized linear models (GLM) which can transform original
variables to satisfy the standard least-square assumptions and modified emergence of
autocorrelation and heteroskedasticity problems in time series data (Gujarati 2004).
The following model was used to conduct panel data analyses:
𝑌𝑖𝑡 = 𝛼𝐷𝑖,𝑡−1 + 𝛽𝑋𝑖,𝑡−1 + 𝑢𝑖 + 𝜀𝑖𝑡 (1)
Where Di,t-1 is a row vector of year dummy variables, Xi,t-1 is a row vector of explanatory
variables, ui is the firm-specific residual, and εit is a standard residual (mean 0,
uncorrelated with itself, ui and the X matrix, homoskedastic). This model can be
estimated by fixed-effects models. Echoing previous studies such as Hitt et al. (2001),
we conducted the Hausman test (Hausman 1978), and the result indicated that fixed
effects models are better than random effects models for our dataset. In summary, the
following is a list of all the variables used in this research.
Firm Performance: measured by Return of Assets (ROA)
Degree of Internationalisation: measured by the entropy method which takes into
account both the depth and breadth of international expansion
Absorbed slack human resources (AHR): measured by the ratio of the number of
employees to sales
Other kind of absorbed slack resources (OAR): measured by the sum of a firm’s working
capital minus the cost of employees and then divided by total sales
Unabsorbed slack resources (USR): measured by the ratio of current assets to current
liabilities
Firm Size (C1): measured by the natural logarithmic of the total number of employees

Page 23 of 48
Firm Age (C2): measured by the natural logarithmic of the number of years a firm has
been in business
Firm Reputation (C3): measured by the number of positive media reports (logged).
Specific empirical design is as follows:
Model 1 tests the relationship between three control variables (e.g. firm size (C1), firm
age (C2) and firm reputation (C3)) and Firm Performance.
Model 2(1) tests the effect of Internationalisation on Firm Performance.
Model 2(2) tests the effect of Internationalisation2 on Firm Performance.
Model 3 tests the moderating effect of absorbed slack human resources (AHR) on the I-
FP relationship.
Model 4 tests the moderating effect of other kind of absorbed slack resources (OAR) on
the I-FP relationship.
Model 5 tests the moderating effect of unabsorbed slack resources (USR) on the I-FP
relationship.
Model 6 is an overall model including all independent variables.
Model 7 is an additional model comparing the effect of unabsorbed slack resources and
the effect of absorbed slack human resources on firm performance.
5. Results
Table 3 presents an overview of the variables, including the means, standard deviations,
and correlations for variables used in this study. The result indicates that that all the
bivariate correlations are lower than 0.3. This low level of correlation is unlikely to
produce biased estimators for the coefficients of the independent variables. Considering
that the coefficient estimators may still have high standard errors leading to difficulties
in obtaining significant coefficients of the correlated variables, we checked the
collinearity using Variance Inflation Factors (VIF). The highest VIF is 1.15 in our
analysis, which is far below the suggested threshold 10 as suggested by Neter et al.
(1990). We therefore concluded that multi-collinearity is unlikely to cause a problem in
this study.

Page 24 of 48
Table 3. Descriptive statistics and correlation matrix
Mean Std. dev 1 2 3 4 5 6 7
Internationalisation 0.4019 0.2707 Firm size 12015 26798 0.1392 Firm reputation 124.0837 286.6188 0.2495 0.2254 Firm age 47.7226 39.2041 0.2720 0.1562 0.1578 Performance 3.6545 14.5871 0.0701 0.0879 0.1484 0.1385 USR 2.1171 2.3562 -0.1252 -0.1493 -0.0517 -0.2177 -0.1044 AHR 0.0068 0.0112 -0.1271 -0.0133 -0.1354 -0.1582 -0.1346 0.1475 OAR 0.1558 0.7348 0.0375 -0.0291 -0.0127 -0.0203 -0.0121 0.0590 -0.1193
Table 4 shows the coefficient estimates for the interaction effects of ESFs’
internationalisation and slack resources on their performance. Model 1 contains the
dummy variable year and three control variables, i.e. firm size, firm age and firm
reputation. Internationalisation and squared Internationalisation are included from
Model 2(1) and Model 2(2) respectively. The three moderating variables, i.e. AHR, OAR,
and USR, are included in the regression analysis one at a time in Model 3, 4 & 5
respectively. Model 6 includes all the dummy, control, main and moderating variables.
Results of the F-test and the p-value are included to indicate the statistical significance
of the models.
Results from Model 1 suggest that firm size has positive influence on the performance of
ESFs, which is in consistent with literature (e.g. Elango et al. 2013; Lin et al. 2011; Singla
and George 2013); firm age has a negative effect on firm’s performance, which is
consistent with literature (e.g. Berger and Udell 1995; Evans 1990; Lin et al. 2011). The
results also show a positive effect of firm reputation on performance. We would like to
clarify that firm age does not reflect the length of its internationalisation experience,
which may have a more direct impact on performance. We attempted but were not able
to get that data even through manually checking annual reports of the firms. This
suggests an interesting research area to investigate when the data is available about the
year and length of an ESF started its internationalisation strategy.
Results from Model 2(1) and Model 2(2) show that the coefficient of
internationalisation2 is not statistical significant but the degree of internationalisation is
negatively related to the performance of ESFs, and the negative relation remains all the
way through from Model 2 to Model 6. Both H1 & H1_alt are therefore not supported.

Page 25 of 48
Model 3 studies the moderating effect of absorbed slack human resources (AHR). The
significant coefficient of internationalisation - AHR2 indicates that H2 is supported.
That is, AHR have an inverted U shape moderating effect on the I-PF relationship.
Model 4 investigates the moderating effect of other kinds of absorbed slack resources
(OAR) on the I-FP relationship. The coefficient of internationalisation – OAR is not
statistically significant. H3 is therefore not supported.
Table 4.Results of the GLM analysis (firm performance as the dependent variable)
Variables Performance
Model 1 Model 2(1) Model2(2) Model 3 Model 4 Model 5 Model 6 Model7
Firm size (C1) 4.944254*
(5.72831)
5.04728*
(11.28653)
2.00321
(7.93787)
5.188314*
(6.41347)
5.126739*
(12.71132)
5.415267*
(9.45872)
5.569058*
(6.73480)
4.387484*
(16.35528)
Firm age (C2) -6.618318*
(7.90019)
-6.0401129
(17.20983)
-4,23854*
(16.90127)
-4.913303*
(9.89110)
-6.322566*
(17.42356)
-5.208886**
(6.91241)
-4.187086*
(5.36783)
-3.876946*
(12.99773)
Firm reputation (C3) 0.9384622*
(13.46452)
0.8616956*
(16.15630)
1.07438**
(14.75031)
1.057797
(11.28673)
0.8706395*
(13.16421)
1.047862*
(8.28757)
1.240784
(3.09176)
0.964264**
(13.50312)
Internationalisation -3.452005*
(13.07574)
-4.37941*
(16.34435)
-5.125074*
(6.18754)
-3.769776
(12.32415)
-5.110981*
(6.17823)
-5.959294**
(7.96342)
-4.368941**
(16.30206)
Internationalisation2 -0.00014749
(1.09047)
--- ---
AHR 0.14856*
(8.66741)
0.15158*
(4.17283)
0.1738*
(12.19513)
AHR2 0.35472
(13.12181)
0.64791**
(10.71295)
0.563732*
(13.44257)
Inter’n - AHR 1.89e-02*
(12.03448)
2.7e-02 *
(0.35469)
---
Inter’n - AHR2 -1.27e-02*
(18.78152)
-1.32e-02*
(0.68154)
---
OAR -2.660224 2.122151 ---
OAR2 -3.31738 2.878324 ---
Inter’n - OAR 2.511582 -7.760424 ---
Inter’n - OAR2 1.238767 3.287664 ---
USR 1.855949*
(9.44013)
1.840643*
(10.96475)
1.773722*
(11.87253)
USR2 1.345428
(12.67453)
0.986763*
(9.87254)
1.002713*
(12.36428)
Inter’n -USR 1.699036*
(11.57629)
1.682342*
(12.96433)
---
Inter’n - USR2 -0.2100042*
(0.17683)
-0.2073226*
(13.74321)
---
Dummy variable: Year controlled Controlled controlled controlled Controlled controlled controlled Controlled
R2 0.1009 0.1038 0.0982 0.1251 0.1069 0.1210 0.1387 0.1024
Adjusted R2 0.0925 0.0897 0.0934 0.1172 0.0928 0.1173 0.1209 0.0985
F-Value 29.21 22.93 8.8421 14.40 15.96 24.68 14.53 17,36
N=1914; ***p<0.001, **p<0.01, *p<0.05
Robust Standard Errors are within parenthesis

Page 26 of 48
Model 5 tests the moderating effect of unabsorbed slack resources (USR) on the I-PF
relationship. The significant coefficient of internationalisation – USR2 indicates that H4
is supported. That is, USR have an inverted U shape moderating effect on the I-FP
relationship. Additionally, the result also indicates that USR have a positive effect on
firm performance, and the influence is much stronger than AHR. This has been further
confirmed by the additional test in Model 7.
Model 6 includes all variables that may affect firm performance. The result strongly
supports H2 and H4 and disapproves H1, H1_alt and H2. Both Model 2 and Model 6
support the negative effect of internationalisation on ESFs’ performance. For H3, the
results of both Model 4 and Model 6 are not statistically significant, which suggests an
interesting research issue for further investigation.
In order to examine the robustness and accuracy of the estimates, we conducted some
additional tests. As suggested by Ketechen and Palmer (1999), we used an alternative
measure of firm performance (i.e. ROS) to substitute the one used in our model, i.e. ROA.
The results of these tests are shown in Appendix 3, from which we can see that all
relationships in the study hold after we use ROS. Overall, the results of our additional
analyses by using ROS support our main findings as well as indicating that our results
are robust.
4. Discussions
These results contribute to our understanding of the I-FP relationship for global
engineering services by clarifying the moderating effects of slack resources. The
negative I-FP relationship for ESFs provides an important amendment to the existing I-
FP theories. This finding is in contradiction to the U-shaped I-FP relationship for general
service firms claimed by Capar and Kotabe (2003), the three-state sigmoid I-FP
relationship for general service firms identified by Contractor et al. (2003), or the
positive I-FP relationship for professional service firms found in Hitt et al. (2006). It
echoes our earlier statement to re-examine the existing theories to address the
particularity of a specific type of services instead of providing a generic theory for
different service sectors. Our theoretical explanation is that the different form of I-FP
relationship for ESFs results from their distinctive features. Especially, international

Page 27 of 48
engineering projects are often of large scale and high value. ESFs make commitment to
such mega projects for long-term strategic reasons, such as investing in engineering
capabilities, developing emerging markets and challenging the home markets of
competitors, rather than for short-term financial payoffs only. ESFs would then be
prepared to continue supporting international expansion for potential long-term
benefits; for example, many large ESFs are expanding their operations to China to
benefit from the high quality and low cost engineering talents. We would also like to
point out another possibility for this negative I-FP relationship. Large scale engineering
projects often have a long lifecycle. For this reason, our dataset covered a time span of
12 years, which is longer than Caper and Kotabe (2003) 3 years, Contractor et al. (2003)
6 years, and Contractor et al. (2007) 5 years. We may need to extend the time span even
longer to observe some possible turning point in the I-FP relationship due to the long
lifecycle nature of international engineering projects. That however will lead to more
challenges by introducing macro level variables to examine the influence of the broader
global economic context. In brief, our study extends the existing theories of the I-FP
relationship for a particular type of services of increasing importance in the modern
economy. This paper provides an integrative theoretical model based on the existing IB
literature focussing on the I-FP studies in the service sector, and incoroprating a
comprehensive set of factors as moderating variables and control variables which may
have some significant influence to the I-FP relationship due to the distinctive business
model of global engineering services.
Our findings clarify the influence of strategic resource decisions on the I-FP relationship.
Particularly, absorbed slack human resources and unabsorbed slack resources have
significant inverted U-shape moderating effects on the I-FP relationship, although the
effect of unabsorbed slack resources is much stronger. This suggests the existence of an
optimal level of slack resources. Before reaching this optimal level, the increase of
absorbed slack human resources and especially unabsorbed slack resources would
enhance the performance of global engineering services. After this optimal level, the
increase of absorbed slack human resources and unabsorbed slack resources would
undermine the performance of global engineering services. The moderating effect of
other kinds of absorbed slack resources is unclear, as indicated by the insignificant
results from Models 5 & 6. This suggests an interesting research question for further
investigations in the future. A promising direction is to explore optional measures for

Page 28 of 48
other kinds of absorbed slack resources of service firms, for example by using fixed
assets based measures. To do that, we will have to cope with challenges in accessing the
required data, since many service firms tend to improve their operational and financial
performance through hiring specialised equipment and expensive facility (through
collaborative arrangements with partners) rather than owning them. As the result, fixed
tangible assets in their accounting reports are often very small and sometimes even not
reported in public domains.
A take away message for managers, especially to senior decision makers of an ESF is to
bear in mind the negative I-FP relationship for global engineering services, i.e. ESFs in
general are not able to achieve the expected financial payoffs from international
expansion. Managers will very likely be disappointed if short-term financial return is
the most important target in their management regime. Investments for international
expansion can only pay off when other longer-term strategic objectives outweigh short-
term financial performance, e.g. developing strategic capabilities in a new operations
context, or accessing international engineering resources. Nevertheless decision-
makers should be cautious when expanding their engineering service operations abroad,
as their performance tends to deteriorate with the increasing degree of
internationalisation. This is because global engineering services are knowledge-
intensive, project-based and people-centric and usually have a long lifecycle. All these
factors will introduce great risks and uncertainties, which may result in project
disruptions, increased costs and potential losses. So a rigorous risk management
approach must be embedded in ESFs’ decision making process for international growth.
Another takeaway message is that managers should make a good use of the inverted U-
shaped moderating effects of absorbed slack human resources and unabsorbed slack
resources on the I-FP relationship. Absorbed slack human resources and especially
unabsorbed slack resources may help to ease the pressure of a declining performance at
the early stage of internationalisation. However, when internalisation reaches the
mature stage, increasing absorbed slack human resources and unabsorbed slack
resources will further jeopardise firm performance. Our suggestion is to enhance
resource sharing within an ESF and collaborating with local partners in the process of
internationalisation. This often provides more flexibility for ESFs to effectively manage
their absorbed slack human resources and unabsorbed slack resources in the search for

Page 29 of 48
an optimal level, and thus leading to an improved firm performance. At the point that
managers have to make a choice between absorbed human slack resources and
unabsorbed slack resources, the latter will lead to a stronger and quicker result.
5. Conclusion
In this paper we studied the I-FP relationship for global engineering services and the
influence of strategic decisions on three types of slack resources. The distinctive
features of engineering service operations were identified, and their influence on the I-
FP relationship was discussed. An integrative model composed of four theoretical links
(H1-4) was developed, and empirically tested with a dataset of 242 ESFs. Our study
suggested a negative I-FP relationship for global engineering services. Both absorbed
slack human resources and unabsorbed slack resources have significant inverted U-
shaped moderating effects on the relationship.
In so doing, we make three significant contributions. First, we contribute to the growth
of research on firm internationalisation within the context of the varied and novel
business models that characterise much of the contemporary global economy (Amit and
Zott 2012; Kastalli and Van Looy 2013). We examine the implications of
internationalisation for financial performance in the context of engineering service
firms, whose business models differ significantly to the manufacturing models studied
in most internationalisation research. Second, we contribute to the development of
theorisation in relation to the internationalisation-firm performance relationship, by
proposing a new theoretical construct focussing on strategic resource decisions as a key
moderator of the relationship in the context of service firm internationalisation. We
build on prior research to propose that firms’ strategic choices in deploying resources in
the contexts that ESFs operate in are critical to successful internationalisation for
service businesses. This, we argue, provides an especially fertile ground for future
research. Third, we provide significant new insights for ESFs and their leaders and
managers, especially in relation to the need to consider the role of the
interdependencies between their business models and their strategic resource
decisions in relation to the likely impacts of their internationalisation on their
performance. To be specific, we would like to remind decision-makers to balance the
need for long-term strategic gains and short-term financial payoffs, and at the same
Page 30 of 48
time make a suggestion to use slack resources to effectively leverage strategic growth
and performance in the process of internationalisation.
We have been advised to advance our theoretical understanding of service firms by
focussing on a specific type of service operations (Løwendahl 2005; Von Nordenflycht
2010; Lewis and Brown 2012). We followed this insightful suggestion and focussed our
studies on ESFs which represent a distinctive business model of service firms. This has
helped us to avoid empirical obstacles from different types of services and then more
precisely capture the essential governing forces over the I-FP relationship (Delios and
Beamish 1999; Hennart 2007; Powell 2014). However, our focus on ESFs leaves some
further questions regarding the types of slack resources and the dynamics in deploying
them. For example, in some service sectors slack resources can be easily recombined for
multiple service offerings, while in other service sectors recombining slack resources is
very difficult. The types of service operations determine the flexibility of redeploying
slack resources. Therefore, as suggested by Von Nordenflycht (2010), the next step is to
develop a theoretically robust typology to possibly extend our findings in a wider range
of services firms based on some generalizable features of service firms. Our study
suggests three such features: knowledge-intensive, project-based, and people-centric.
To be specific, our findings confirm a negative I-FP relationship in general. This
unnecessarily dismisses the positive influence of the knowledge-intensive feature. A
possible explanation is that international engineering operations are highly project-
based. The coordination cost of such complex and uncertain projects are so high that it
overtakes the benefit from the knowledge-intensive feature. To continue this line of
investigations, it will be useful to develop an index to reflect various degrees of the
knowledge-intensive and project-based features. We can then study their varying
impacts on the I-FP relationship and thus extending our findings to a wider range of
service firms with different degrees of knowledge-intensity and project-based
operations. Furthermore, considering that service operations require a high degree of
interaction and value co-creation between service providers and customers, our
findings on slack human resources are expected to have a generic implication for
service firms. Nevertheless, the emergence of Artificial Intelligence and Internet-based
service provision may lead to a greater reliance on technology infrastructure and thus
challenging the people-centric feature of service firms. It will then be useful to

Page 31 of 48
investigate the impact of people-centric vs. technology-centric features for such new
forms of service operations.
In addition to the above suggestions, we would also like to suggest some more
important research directions for the future. First, we did not consider how long ESFs
have adopted the internationalisation strategy due to data availability. We used firm age
as a control variable instead, which however was not able to indicate its influence on
the I-FP relationship as our results indicate. We would encourage IB scholars to use the
period of internationalisation as a control variable which may have a more direct link to
performance through perhaps large-scale surveys. Second, we did not take into account
the country effect on the I-PF relationship because the majority of global engineering
service providers are from a few dominant developed countries (for example, nearly all
the world’s largest ESFs are from the developed countries). In the process of
internationalisation, ESFs in different countries may have different strategic choices for
economic, cultural or historical reasons, thus leading to different forms of I-FP
relationships. We therefore would like to call for further studies to understand the
influence of such contextual factors. Third, we have mentioned the impact of long-term,
large-scale projects in international service operations. In reality, service firms are
trying to maintain a dynamic portfolio of projects of different scales and cycles. When
such operational level of data is available, we can carry out very valuable studies to
understand the impact of project cycles and their implications for resource deployment.
In addition, slack might present at different levels of an organisation. This opens up a
series of interesting research issues around resource sharing, allocation and
deployment at subsidiary vs. firm levels for which the agency theory and the resource
constrains theory will be able to provide useful guidance. Last but not the least,
considering the fact that the nature of this study is a grounding effort to identify and
understand the generic trends in global engineering services, we would like to suggest
some micro-level case studies to further investigate the behaviours and the cause-effect
consequences of an ESF’s internationalisation decisions in further detail.
Acknowledgement: This work was supported by the Seventh Framework Programme of the European Union through Marie
Curie Actions IRSES Europe-China High Value Engineering Network (EC-HVEN) under Grant Number
PIRSES-GA-2011-295130; the National Social Science Fund of China for Young Scholars under Grant
Number 13CGL010.

Page 32 of 48
Appendix 1: Summary of empirical I-FP studies in mainstream business management journals*
Degree of Internationalisation (I) Firm Performance (FP) Empirical studies Dimensions Measures Types Measures Sampling Analytical method Key moderator or
control Results (I-FP relationship)
Vernon (1971) Single; sales-based
FSTS Accounting based financial indicators
ROS/ROA 187 large US manufacturing firms in 1964
Comparative (MNE vs Non-MNE): t-test
None Positive
Severn and Laurence (1974)
Single; Assets-based
Dummy variable/FATA
Accounting based financial indicators/ economic profit
ROA (Before and after tax)/ economic profitability
62 US MNEs from Fortune 500 and 70 US domestic firms in manufacturing industries
Comparative: t-test and OLS regression (Cross-section)
R&D intensity No significant relationship, but intervened by R&D intensity
Hughes et al. (1975)
Single; sales-based
FSTS Market based financial indicators
Risk adjusted returns
46 US MNEs and 50 US non-MNEs (1970–1973)
Comparative (MNE vs Non-MNE): χ2 test
None Positive
Siddharthan and Lall(1982)
Single; sales-based
FSTS Operational indicator Firm growth The 500 and 100 largest US and non-US MNEs in 1972
N/A Firm size; advertising intensity; R&D intensity
Negative
Kumar (1984) Single; sales-based
FSTS Accounting based financial indicators
ROA 672 UK firms (1972–1976)
Comparative and multivariate regression
Firm size; lagged ROA; industry
Not significant
Dunning (1985) Single; sales-based
FSTS Accounting based financial indicators
ROS 188 large UK MNEs in 1979
N/A N/A Not significant
Rugmanet al. (1985) Single; sales-based
FSTS Accounting based financial indicators
ROE 154 largest MNEs from US, Europe, Japan, Canada and developing nations
N/A N/A Not significant
Yoshihara (1985) Single; sales-based
FSTS Accounting based financial indicators
ROE 118 largest Japanese firms
Comparative None Not significant
Michel and Shaked (1986)
Single; sales-based
FSTS (20% as threshold)
Market based financial indicator
Risk-adjusted Returns (i.e. Sharpe, Jensen and Treynor measures)
58 US MNEs and 43 non-MNEs (1973–1982)
Comparative (MNE vs non-MNE): t-test
None Negative
Shaked (1986) Single; sales-based
FSTS (20% as threshold)
Accounting based financial indicators
ROA/insolvency probability
58 US MNEs and 43 non-MNEs (1980–1982)
Comparative (MNE vs non-MNE): t-test
None No difference in terms of average ROA; insolvency probability lower for MNEs
Buehner (1987) Single; sales-based
Sales-based Herfindahl index/ FSTS
Market and accounting based financial indicators
Risk-adjusted returns/ROS/ROA
40 largest West German firms
GLS regression (cross-section) and partial correlation
Firm size; growth; leverage; product diversification
Positive in general
Grant (1987) Single; sales-based
FSTS Operational indicator/accounting based financial indicators
Sales growth/ROS/ ROA/ROE/profit
304 large British manufacturing firms (1972–84)
Multivariate regression (FSTS lagged by 4 years)
Firm size and industrial effects
Positive in general; in addition, suggestive evidence that overseas production increased profitability

Page 33 of 48
Grant et al. (1988) Single; sales-based
FSTS Accounting based financial indicator
ROA 304 large British manufacturing firms (1972–84)
Multivariate regression (FSTS lagged by 4 years)
Industrial effects; firm size; leverage
Profitability encourages overseas expansion, which in turn generates increased profit
Daniels and Bracker (1989)
Two but examined separately; sales-and assets based
FSTS/FAFA Accounting based financial indicator
ROS/ROA 116 US firms in Forbes 1984 (1974–83)
ANOVA Industrial effects Inverted J curve
Geringeret al. (1989)
Single; sales-based
FSTS Accounting based financial indicator
ROS/ROA (standardized)
100 largest MNEs from US and Europe respectively (1977–1981)
ANOVA None Inverted J curve (‘threshold of Internationalisation’)
Kim et al. (1989) Single; sales-based
Sales based entropy index capturing product and market diversification
Accounting based financial indicator
Growth of ROA and ROS/instability of ROA and ROS
62 US MNEs (1982–1985)
Comparative: t-test None Indeterminate; contingent upon the relatedness of business diversification
Collins (1990) Single; sales-based
FSTS Market based financial indicators
Average rate of return, Jensen measure
133 US firms from Fortune 500 (1976–1985)
Comparative: t-test None Insignificant between MNEs with presence in developed countries and domestic firms; negative if MNEs with main presence in less developed nations
Morck and Yeung (1991)
Single; count-based
No. of subsidiaries/ No. of nations hosting subsidiaries
Market based financial indicator
Tobin’s Q 1644 US firms (1980–81)
Multivariate regression (cross-section)
Leverage; firm size; labour growth
Internationalisation has no direct or marginal negative impact but enhances the impact of R&D and advertising on Tobin’s q
Kim et al. (1993) Single; sales-based
Sales based entropy index capturing product and market diversification
Market based financial indicator
Risk-adjusted ROA 125 largest US MNEs in 1982 Forbes survey
Comparative: ANCOVA and multivariate regression(cross-section)
Industrial effect Positive
Sullivan (1994) Single; index-based
Multi-item index Accounting based financial indicator
ROS/ROA 75 most international US manufacturing firms in 1990
ANOVA None Horizontal S
Al-Obaidan and Scully (1995)
Single; categorical
Dummy variable Economic efficiency Scale efficiency/ technical efficiency
44 largest petroleum enterprises (1976–1982)
Deterministic and stochastic frontier production function (pooled data)
Government ownership; extent of vertical integration
MNEs are about 3% higher in scale efficiency but 10% lower in technical efficiency compared with non-MNEs
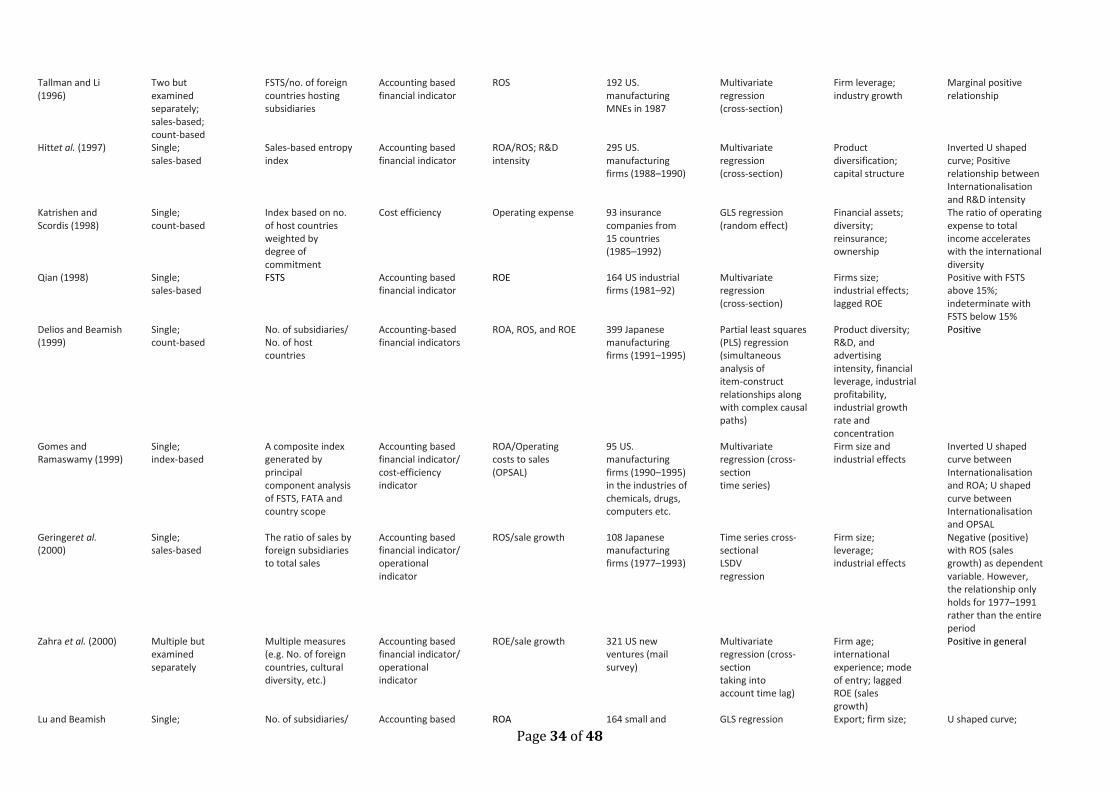
Page 34 of 48
Tallman and Li (1996)
Two but examined separately; sales-based; count-based
FSTS/no. of foreign countries hosting subsidiaries
Accounting based financial indicator
ROS 192 US. manufacturing MNEs in 1987
Multivariate regression (cross-section)
Firm leverage; industry growth
Marginal positive relationship
Hittet al. (1997) Single; sales-based
Sales-based entropy index
Accounting based financial indicator
ROA/ROS; R&D intensity
295 US. manufacturing firms (1988–1990)
Multivariate regression (cross-section)
Product diversification; capital structure
Inverted U shaped curve; Positive relationship between Internationalisation and R&D intensity
Katrishen and Scordis (1998)
Single; count-based
Index based on no. of host countries weighted by degree of commitment
Cost efficiency Operating expense 93 insurance companies from 15 countries (1985–1992)
GLS regression (random effect)
Financial assets; diversity; reinsurance; ownership
The ratio of operating expense to total income accelerates with the international diversity
Qian (1998) Single; sales-based
FSTS Accounting based financial indicator
ROE 164 US industrial firms (1981–92)
Multivariate regression (cross-section)
Firms size; industrial effects; lagged ROE
Positive with FSTS above 15%; indeterminate with FSTS below 15%
Delios and Beamish (1999)
Single; count-based
No. of subsidiaries/ No. of host countries
Accounting-based financial indicators
ROA, ROS, and ROE 399 Japanese manufacturing firms (1991–1995)
Partial least squares (PLS) regression (simultaneous analysis of item-construct relationships along with complex causal paths)
Product diversity; R&D, and advertising intensity, financial leverage, industrial profitability, industrial growth rate and concentration
Positive
Gomes and Ramaswamy (1999)
Single; index-based
A composite index generated by principal component analysis of FSTS, FATA and country scope
Accounting based financial indicator/ cost-efficiency indicator
ROA/Operating costs to sales (OPSAL)
95 US. manufacturing firms (1990–1995) in the industries of chemicals, drugs, computers etc.
Multivariate regression (cross-section time series)
Firm size and industrial effects
Inverted U shaped curve between Internationalisation and ROA; U shaped curve between Internationalisation and OPSAL
Geringeret al. (2000)
Single; sales-based
The ratio of sales by foreign subsidiaries to total sales
Accounting based financial indicator/ operational indicator
ROS/sale growth 108 Japanese manufacturing firms (1977–1993)
Time series cross-sectional LSDV regression
Firm size; leverage; industrial effects
Negative (positive) with ROS (sales growth) as dependent variable. However, the relationship only holds for 1977–1991 rather than the entire period
Zahra et al. (2000) Multiple but examined separately
Multiple measures (e.g. No. of foreign countries, cultural diversity, etc.)
Accounting based financial indicator/ operational indicator
ROE/sale growth 321 US new ventures (mail survey)
Multivariate regression (cross-section taking into account time lag)
Firm age; international experience; mode of entry; lagged ROE (sales growth)
Positive in general
Lu and Beamish Single; No. of subsidiaries/ Accounting based ROA 164 small and GLS regression Export; firm size; U shaped curve;

Page 35 of 48
(2001) count-based No. of host countries
financial indicator medium sized Japanese firms (1986–1997)
(time series cross-section)
R&D intensity; product diversity; joint venture
exporting moderates the relationship negatively
Pantzalis (2001) Single; count-based
No. of foreign regions or subsidiaries in developed (or developing) countries
Market based financial indicators
Tobin’s Q and excess Q
420 US MNEs in 1990
Multivariate regression (cross-section)
Firm size; leverage; R&D and advertising intensity; ownership; corporate business focus; industry effects
Market value of MNEs with operations in developing countries is significantly higher than that of MNEs without operations in developing countries
Ramirez-Aleson and Espitia-Escuer (2001)
Single; count-based
Categorical measure (no. of invested countries); entropy index based on the no. of foreign subsidiaries
Accounting and market based financial indicators
Ratio of net operating profit to net operating assets (ROA)/Tobin’s Q
103 Spanish nonfinancial firms (mostly manufacturing) (1991–1995)
t-test/GLS regression (time series cross-section)
Firm size; industry effects
Insignificant with ROA but positive with Tobin’s Q as dependent variable
Kotabeet al. (2002) Single; income-based
Foreign income/ total income
Accounting based financial indicator/ cost-efficiency indicator
ROA/ratio of sales to operating costs (OPSALINV)
49 US manufacturing firms (1988–1993)
Time series cross-sectional regression
R&D intensity; advertising intensity; firm size; industrial effects
R&D intensity and advertising intensity jointly moderate the M–P relationship positively
Qian (2002) Single; sales-based
FSTS Accounting based financial indicator
ROS 71 US small and medium-sized manufacturing firms (1989–1993)
OLS regression Firm size; firm age; R&D, and advertising intensity; product diversification; financial leverage
Positive; Moderate product diversification moderates I-FP relationship positively
Capar and Kotabe (2003)
Single; sales-based
FSTS Accounting based financial indicator
ROS 81 major German service firms (1997–1999)
OLS regression Firm size; industrial effect
U curve
Contractor et al. (2003)
Single; index-based
3-component index (FSTS, foreign to total employees, ratio of foreign to total offices)
Accounting based financial indicators
ROS/ROA 103 largest service companies (1983–1988)
Time series cross-sectional regression
Firm size; Industrial sector effect, and home country effect
Horizontal S-shaped curve (esp. the knowledge-intensive sub-sample)
Goerzen and Beamish (2003)
Two dimensions (international asset dispersion and country environment diversity) simultaneously examined
Sales-based entropy index; Entropy indices based on political, economic, and cultural index
Market-based financial indicators
Jensen’s Alpha; Sharpe’s measure; Market to book ratio
580 Japanese MNEs in 1999
Structural equation modelling
Product diversity; proprietary assets; industry profitability; firm size; capital structure; international experience
Positive between International asset dispersion (IAD) and performance; negative between country environment diversity (CED) and performance; interaction between IAD and CED is positively related to performance
Ruigrok and Wagner (2003)
Single; sales-based
FSTS Accounting based financial indicator/ cost-efficiency indicator
Pre-tax ROA/ operating costs to total sales (OCTS)
84 largest German manufacturing firms (1993–1997)
Pooled cross-section time series regression
Firm size; industrial effect
U curve for ROA; inverted U curve for OCTS

Page 36 of 48
Li and Qian (2004) Single; index-based
3-component index (FSTS, FATA, foreign to total employees); sales-based entropy
Accounting based financial indicator
ROS and ROA 167 largest US firms on Fortune 500 list (1991–1997)
OLS regression Firm size; R&D intensity; Financial leverage; country GNP growth; GNP per capita
Reflecting an inverted U curve
Lu and Beamish (2004)
Single; count-based
Composite index based on no. of subsidiaries and no. of countries
Accounting and market based financial indicators
ROA; Tobin’s Q 1489 Japanese firms (1986–1997)
GLS random effect regression
R&D and advertising intensity; size; exchange rate; product diversity; export intensity; capital structure
Horizontal S-curve; R&D intensity and advertising intensity moderates the I-FP relationship positively
Thomas and Eden (2004)
Three dimensions: market penetration, production presence, country scope
Composite index based on FSTS, FATA, and no. of foreign countries
Accounting and market based financial indicators
ROA, ROE; Excess and average market value
151 US manufacturing firms
White-corrected OLS regression, and Spline analysis
R&D intensity; Administrative costs/sales; Size; financial leverage; industry control
A mixture of nonlinear results; weak evidence of S-curve using Spline analysis
Annavarjulaet al. (2005)
(De facto) single; index-based
Multi-item index Accounting-based financial indicator
ROE 197 relatively large US manufacturing firms
Generalized linear model (GLM)
R&D, and advertising intensity; capital intensity; market to book value ratio; product diversity; firm size
Positive; Market to book value positively moderates I-FP relationship
Li (2005) Single; sales-based
FSTS Accounting-based financial indicator
ROS 574 American service firm (1997– 2001)
Feasible GLS regression
Size; business diversity; capital intensity; market share; financial leverage; growth and downsize; industry control
Horizontal S-curve for the whole sample; Home region oriented strategy positively moderates I-FP relationship
Hittet al. (2006)
Single; count-based
Entropy index based on number of foreign offices and number of lawyers
Self-reported and unaudited data from American Lawyer
ROS 72 largest US law firms (1992—1999)
GLS regression Firm size; leverage; location in NYC; service diversification; domestic geographic dispersion; prior performance
Positive and inverted U curve; human capital positively moderates I-FP; Relational capital does not have a moderating effect on I-FP
Contractor et al. 2007
Single; sales-based
FSTS Accounting-based financial indicator
ROA; ROE; ROS; tested separately
269 Indian firms (142 manufacturing and 127 service firms, 1997 –2011)
Two-stage GLS regression
Firm size; firm age; a dummy variable for industry sub-sectors
U curve; service firms gain the positive benefits sooner than manufacturing firms

Page 37 of 48
Chang and Wang (2007)
Single; sales-based
Sales-based entropy Index and the sales-based Herfindahl index
Market-based financial indicator
Tobin’s Q 2402 US firms (including both manufacturing and service firms; 1996-2002)
Comparative; GLM on pooled data and GLM on 7-year averaged data
Product diversification; firm size; leverage; R&D intensity; effect of country scope; industry effect
Inverted U curve; Related product diversification positively moderates I-FP; Un-related product diversification negatively moderates I-FP
Ruigroket al. (2007)
Single; sales-based
FSTS Accounting-based financial indicator
ROA 87 Swiss multinational companies in manufacturing industries (1998-2005)
Panel data analysis; t-test; ANOVA
Firm size; industry effect
S-curve; firms with extreme degrees of internationalisation face lower average performance and higher average performance variation.
Zhou et al. (2007)
Two; scale-based
Outward-internationalisation measured by: (1) aggressively seek foreign markets; and (2) develop alliances with foreign partners Inward-internationalisation measured by: (1) utilized advanced management skills from foreign countries; (2) utilized advanced and new technology fromforeign countries; and (3) utilized foreign direct investment.
Three self-reported financial indicators
Export growth; profitability growth; total sales growth
129 manufacturing SMEs in Zhejiang, China
Structural equation modelling
Guanxi network as a mediating factor; Firm age; firm ownership; competition Intensity; market uncertainty; technology complexity
Outward-internationalisation orientation is significantly related to all of the three performance measures; Inward-internationalisation orientation is significantly related to both export performance sales performance but not to profitability performance ; Guanxi network mediates I-FP
Hsu and Pereira (2008)
Single; Survey-based
FSTS; FATA; FPTP Survey-based ROS; ROI; ROE 110 US MNEs Multivariate regression
Moderating variables: social learning; technological learning; marketing learning; Control variables: firm size; technology uncertainty; market uncertainty
Positive; marketing learning and social learning positively moderate I-FP

Page 38 of 48
Pangarka (2008)
Two but tested separately; sales-based
DOI1 = (1 X % of sales from SE Asia) + (2 X % of sales from rest of Asia) + (3 X % of sales from rest of the world); DOI2 = Foreign sales/[(% of sales from SE Asia)2 + (% of sales from the rest of Asia)2 + (% of sales from Europe)2 + (% of sales from the Americas)2 + (% of sales from the rest of the world)2]
Accounting-based financial indicator
Composite measure including six items: ROS, growth in sales, foreign profits, growth in profits, ROA, experience and knowledge gained from foreign operations
94 SMEs in Singapore Multivariate regression
Firm size; capability; Host market attractiveness
Positive
Qian et al. (2008)
Single; Regional diversification rather than DOI; count-based
Entropy measure of regional diversification
Accounting-based financial indicator
ROA and ROS 189 large US firms (1996 to 2000)
GMM Multinationality; firm size; firm age; firm leverage; firm risk; R&D intensity, product scope; industry effect
Positive when regional diversification is low to moderate; curvilinear and negative when regional diversification is moderate to high
Lin et al. (2011)
Three dimension: foreign sales; foreign production; geographic dispersion; both sales-based and count-based
Composite measure covering FSTS, FATA and geographic dispersion
Accounting-based financial indicator
ROA 197 Taiwanese high-manufacturing firms (2000-2005)
GLS regression Moderating variables: high-discretion slack; low-discretion slack; attainment discrepancy; Control variables: firm age; firm size; insider shareholding; degree of diversification; R&D intensity
Negative; high-discretion slack; low-discretion slack and attainment discrepancy positively moderate I-FP
Hsu et al. (2013)
Single; sales-based
Composite index based on FSTS, FATA, and no. of foreign countries
Accounting-based financial indicator
ROA 187 Taiwanese SMEs covering eight industries (food and beverage, plastics, textiles, electric machinery, chemicals and biotechnology, rubber, information and electronics, and other miscellaneous industries, 2000-2009)
GLS regression CEO attributes as moderating variables; Control variables including firm size, debt ratio, R&D intensity, product diversity and sub-industry effect
Positive when using FSTS/FATA; inverted U curve when using number of countries; CEO’s attributes have different types of moderating effect on I-FP
Tsai (2014) Single; FSTS Accounting-based ROA 155 Taiwanese firms Multivariate Firm size; firm age S curve; R&D intensity

Page 39 of 48
Sales-based financial indicator (2011) regression industry effect and learning capacity positively moderate I-FP
Powell (2014)
Single; count-based
Count ofhost countries where a firm maintains offices in an observation year divided by the sample maximumnumber of host countries across all observation years.
Accounting-based financial indicator
Profits-Per-Partner (PPP); Revenue-Per-Lawyer (RPL); downside risk on PPP; downside risk on RPL
102 US largest law firms (1986 to 2008)
OLS regression Firm age; firm size; ratio of associates to partners; international experience; environmental complexity etc.
S curve; firm-specific optimal levels of internationalisation exists so we need MA-P relationship.
Shin et al. (2017) Single; count-based
The mean of two ratios (0 to 1): [the number of foreign affiliates/the max number in samples], and [the number of countries/the max number]
Accounting-based financial indicator
ROA, with robustness test of ROE
1082 Spanish micro service firms over an eight-year period 2005-2012
Feasible generalised least square regression
Firm age, Firm size, Indebtedness, Entry Mode
Inverted U-Shaped relationship for knowledge intensive micro service firms; U-shaped relationship for capital intensive micro service firms.
FSTS: Ratio of foreign to total sales; FATA: Ratio of foreign to total assets; ROS: Return on sales; ROA: Return on assets; ROE: Return on equity.
*This list has been adopted from Li (2007). We have updated the list by adding the empirical I-FP studies appearing in Grade 3 and Grade 4 journals in the Association of Business Schools’ Academic Journal Guide 2015 from 2005 onwards
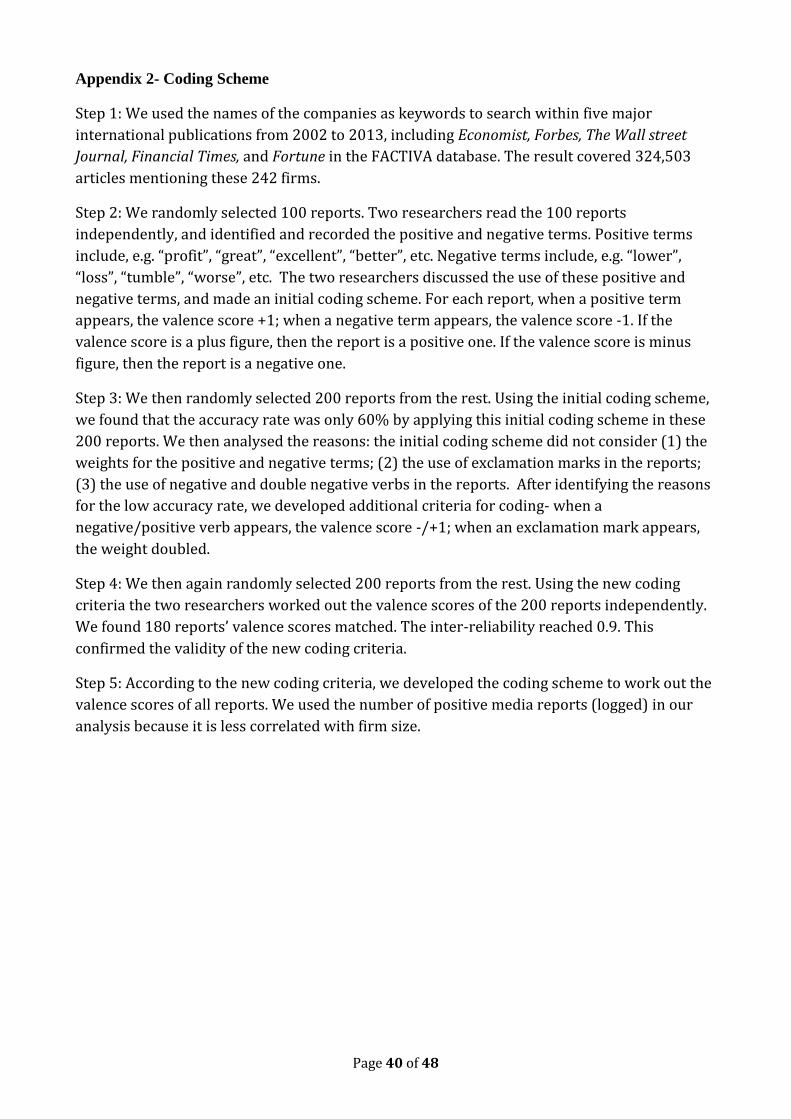
Page 40 of 48
Appendix 2- Coding Scheme
Step 1: We used the names of the companies as keywords to search within five major
international publications from 2002 to 2013, including Economist, Forbes, The Wall street
Journal, Financial Times, and Fortune in the FACTIVA database. The result covered 324,503
articles mentioning these 242 firms.
Step 2: We randomly selected 100 reports. Two researchers read the 100 reports
independently, and identified and recorded the positive and negative terms. Positive terms
include, e.g. “profit”, “great”, “excellent”, “better”, etc. Negative terms include, e.g. “lower”,
“loss”, “tumble”, “worse”, etc. The two researchers discussed the use of these positive and
negative terms, and made an initial coding scheme. For each report, when a positive term
appears, the valence score +1; when a negative term appears, the valence score -1. If the
valence score is a plus figure, then the report is a positive one. If the valence score is minus
figure, then the report is a negative one.
Step 3: We then randomly selected 200 reports from the rest. Using the initial coding scheme,
we found that the accuracy rate was only 60% by applying this initial coding scheme in these
200 reports. We then analysed the reasons: the initial coding scheme did not consider (1) the
weights for the positive and negative terms; (2) the use of exclamation marks in the reports;
(3) the use of negative and double negative verbs in the reports. After identifying the reasons
for the low accuracy rate, we developed additional criteria for coding- when a
negative/positive verb appears, the valence score -/+1; when an exclamation mark appears,
the weight doubled.
Step 4: We then again randomly selected 200 reports from the rest. Using the new coding
criteria the two researchers worked out the valence scores of the 200 reports independently.
We found 180 reports’ valence scores matched. The inter-reliability reached 0.9. This
confirmed the validity of the new coding criteria.
Step 5: According to the new coding criteria, we developed the coding scheme to work out the
valence scores of all reports. We used the number of positive media reports (logged) in our
analysis because it is less correlated with firm size.

Page 41 of 48
Appendix 3. Robustness Test*
Variables Models (measured by ROS)
Model 1 Model 2(1) Model2(2) Model 3 Model 3 (without firm size) Model 4 Model 5 Model 6 Model7
Firm size(C1) 4.945281* 5.048307* 2.004237* 5.189341* --- 5.127766* 5.416294* 5.570085* 4.388511*
(7.68423) (11.07389) (13.54012) (8.76584)
(8.27624) (19.14323) (19.75322) (16.43219)
Firm age(C2) -6.617293* -6.0390879** -4.622829** -4.912278* -5.743281* -6.321541 -5.207861* -4.186061* -3.875921*
(1.86415) (7.05321) (5.97523) (6.17745) (13.32589) (9.55317) (6.99810) (15.72462) (12.98137)
Firm reputation(C3) 0.9401342* 0.8633676 1.076052* 1.059469* 1.001924 0.8723115* 1.049534** 1.242456** 0.965936**
(13.44651) (12.11942) (13.72419) (13.65274) (12.97368) (12.19764) (13.43291) (13.79543) (13.93480)
GDP per capita 0.0004371* 0.0003245* 0.0005116 0.0003359* 0.0007645* 0.0006006* 0.0007101 0.0005034* 0.0003783
(4.87254) (3.98761) (2.11705) (2.00973) (10.68003) (12.65808) (2.98509) (11.28791) (12.95891)
Internationalisation
-3.449215* -4.37662* -5.122284* -6.734210* -3.766986 -5.108191** -5.956504 -4.366151*
(12.10956) (16.02692) (16.18273) (12.98773) (12.85719) (6.96542) (7.84328) (16.98643)
Internationalisation2
-0.00008651
--- ---
(3.14721)
AHR
0.14965* 0.11032*
0.15267* 0.17489**
(2.01765) (12.56920)
12.78431 13.90412
AHR2
0.35703 0.43061*
0.65022* 0.566042**
(3.00112) (12.87539)
(0.99840) (3.73718)
Inter’n-AHR
0.041* 0.03176*
0.0481* ---
(12.68247) (12.58935)
(12.74765)
Inter’n-AHR2
-0.014* -0.0093*
-0.015* ---
(0.29543) (2.96349)
(2.99216)
OAR
-2.660195
2.12218 ---
OAR2
-3.317002
2.878702 ---
Inter’n-OAR
2.512562
-7.759444 ---
Inter’n-OAR2
1.238864
3.287761 ---
USR
1.856058* 1.840752* 1.773831*
(12.68091) (11.74907) (11.87916)
USR2
1.347226* 0.988561* 1.004511*
(12.78918) (12.01127) (12.65804)
Inter’n-USR
1.699797* 1.683103* ---

Page 42 of 48
(11.09160) (11.99728)
Inter’n-USR2
-0.2099052** -0.2072236** ---
(3.75134) (3.87115)
Dummy variable: Year controlled controlled controlled controlled controlled controlled controlled controlled controlled
R2 0.1022 0.1051 0.07644 0.1264 0.1135 0.1082 0.1223 0.1401 0.1037
Adjusted R2 0.0972 0.0876 0.0643 0.1109 0.1007 0.0980 0.1107 0.1296 0.0928
F-Value 30.54 24.26 6.84 15.73 18.87 17.29 26.01 15.86 18.45
N=1914; ***p<0.001, **p<0.01, *p<0.05
Robust Standard Errors are within parenthesis
* Based on the reviewers’ comments, we have also done two additional tests in Appendix 3. First, we included GDP per capita in the empirical model when we conducted the
test of robustness. Our results show that in general there is a positive relationship between GDP per capita and firm performance, although this positive relationship is very
weak. We believe that this finding can be explained by the knowledge-intensive nature of engineering services. When we look at the development of engineering services
globally, most of the established engineering services firms are in developed countries (as shown in our sample) where GDP per capita is relatively high. Engineering services
are based on advanced knowledge and technologies, which are mostly concentrated on developed countries. This relationship is like: developed countries (higher GDP per
capita) advanced knowledge/technologiesstronger ESF performance. We do not include this in the body text of the paper, as it is an additional test and we do not have a
hypothesis for this relationship in our literature review. We therefore place this additional note here. Second, we removed firm size from Model 3 and re-run the model
because the variable “number of employees” has been used twice in Model 3. The results are shown in the Model (without firm size). From the results we can see that H2 is
consistent in both models.
Page 43 of 48
References:
Al-Obaidan, A.M. and Scully, G.W. 1995. The theory and measurement of the net benefits of multinationality: the case of the
international petroleum industry. Applied Economics, 27(2): 231–238.
Amit, R., & Zott, C. 2012. Creating value through business model innovation. MIT Sloan Management Review, 53(3), 41-49.
Annavarjula, M., Beldona, S. and Sadrieh, F. 2005. Corporate performance implications of multinationality: the role of firm-specific
moderators. Journal of Transnational Management, 10(4): 5–27.
Baker, T. and Nelson, R. E. 2005.Creating something from nothing: Resource construction through entrepreneurial bricolage.
Administrative Science Quarterly, 50, 329-366.
Banalieva, E. R. and Dhanaraj, C. 2013.Home-region orientation in international expansion strategies. Journal of International
Business Studies, 44(2): 89-116.
Barnett,M. L., Jermier, J.M. et al. 2006. Corporate Reputation: The Definitional Landscape. Corporate Reputation Review, 9(1): 26-
38.
Barroso, A. and Giarratana, M.S. 2013. Product proliferation strategies and firm performance: The moderating role of product space
complexity. Strategic Management Journal, 34(12): 1435-1452.
Bello, D., Radulovich, L. Javalqi, R., Scherer, R. and Taylor, J. 2016. Performance of professional service firms from emerging
markets: Role of innovative services and firm capabilities. Journal of World Business, 51(3): 413-424.
Berger, A. N. and Udell, G.F. 1995. Lines of Credit and Relationship Lending in Small Firm Finance. Journal of Business, 68: 351-
381
Berry, H., Guillen, M. & Zhou, N. 2010. An institutional approach to cross-national distance. Journal of International Business
Studies, 41(9): 1460-1480.
Berthon, P., Pitt, L., Katsikeas, C.S. and Berthon, J.P. 1999. Virtual services go international: international services in the marketplace.
Journal of International Marketing, 7(3): 84-105.
Boddewyn, J.J., Halbrich, M.B. and Perry, A.C. 1986. Service multinationals: conceptualisation, measurement and theory. Journal of
International Business Studies, 17(3): 41-57.
Bourgeois, L. J. 1981. On the measurement of organizational slack. Academy of Management Review, 6, 29-39.
Bradley, S. W., D. A. Shepherd, et al. 2011.The Importance of Slack for New Organizations Facing ‘Tough’ Environments. Journal of
Management Studies,48(5): 1071-1097.
Buehner, R. 1987. Assessing international diversification of West German corporations. Strategic Management Journal, 8 (1): 25–37.
Capar, N. and Kotabe, M. 2003. The relationship between international diversification and performance in service firms. Journal of
International Business Studies, 34(4): 345-355.
Carney, M., Dieleman, M. & Taussig, M. 2016. How are institutional capabilities transferred across borders? Journal of World
Business. 51(6): 882–894.
Celo, S. and Chacar, A. 2015. International coherence and MNE performance. Journal of International Business Studies, 46: 620.
Chang, S. and Wang, C. 2007.The effect of product diversification strategies on the relationship between international diversification
and firm performance. Journal of Word Business, 42: 61-79.
Chase, R.B. and Apte, U.M. 2007. A history of research in service operations: What’s the big idea? Journal of Operations
Management, 25: 375-386.
Chen, C. and Huang, Y. 2010. Creative workforce density, organizational slack, and innovation performance. Journal of Business
Research, 63(4): 411-417.
Chen, C, Huang, Y. et al. 2012.How firms innovate through R&D internationalisation? An S-curve hypothesis. Research Policy,41(9):
1544-1554.
Collins, J.M. 1990. A market performance comparison of US firms active in domestic, developed and developing countries. Journal of
International Business Studies, 21(2): 271–287.
Contractor, F.J., Kundu, S.K. and Hsu, C.C. 2003. A three-stage theory of international expansion: the link between multinationality
and performance in the service sector. Journal of International Business Studies, 34(1): 5-18.
Contractor, F.J., Kumar, V. and Kundu, S.K. 2007. Nature of the relationship between international expansion and performance: The
case of emerging market firms. Journal of World Business, 42: 401-417.
Cyert, R. and March, J. 1963. A behavioral theory of the firm. Englewood Cliffs, NJ: Prentice Hall.
Daniels, J.D. and Bracker, J. 1989. Profit performance: do foreign operations make a difference? Management International Review,
29(1):46–56.

Page 44 of 48
Daniel, F., Lohrke, F. T., Fornaciari, C. J., & Turner Jr., R. A. 2004. Slack resources and firm performance: A meta-analysis. Journal
of Business Research, 57, 565-574.
Davenport, T. H. 2005. Thinking for a Living: How to Get Better Performance and Results from Knowledge Workers. Boston:
Harvard Business School Press.
Deephouse, D. L. 2000. Media Reputation as a Strategic Resource: An Integration of Mass Communication and Resource-Based
Theories. Journal of Management,26(6): 1091-1112.
Delios A and Beamish P. 1999. Ownership strategy of Japanese firms: transactional, institutional, and experience influences. Strategic
Management Journal 20: 915-933.
Dunning, J.H. 2003. Some antecedents of internalization theory. Journal of International Business Studies, 34(2): 108–115.
Eisenhardt, K. M. 1989. Agency theory: An assessment and review. Academy of Management Review, 14(1): 57–74.
Evans, D. S. 1990. The Relationship Between Firm Growth, Size, and Age: Estimates for 100 Manufacturing Industries. Journal of
Industrial Economics, 35(4): 567-581.
Elango, B., Talluri, S. et al. 2013. Understanding Drivers of Risk-Adjusted Performance for Service Firms with International
Operations. Decision Sciences,44(4): 755-783.
Engelseth, P. and Zhang, Y. 2012. Engineering Roles in Global Maritime Construction Value Network. International Journal of
Product Development, 17(3/4): 254-276.
Fernandez-Stark, K., Bamber, P. and Gereffi, G. 2010. Engineering Services in the Americas, Centre on Globalisation, Governance
and Competitiveness, Duck University, July, Durham NC, USA.
Feketekuty, G. 1988. International Trade in Services, Balinger: Cambridge, MA.
Gary, M.S. 2005. Implementation strategy and performance outcomes in related diversification. Strategic Management Journal, 26(7):
643-664.
Gaur A.S. and Kumar, V. 2009. International diversification, business group affiliation and firm performance: empirical evidence
from India. British Journal of Management,20(2): 172-186.
Galbraith, J.R. and Kazanjian, R. 1986. Strategy Implementation, West Publishing: St Paul.
Geleilate, J. M. G., Magnusson, P., Parente, R. C., & Alvarado-Vargas, M. J. 2016. Home Country Institutional Effects on the
Multinationality–Performance Relationship: A Comparison Between Emerging and Developed Market Multinationals. Journal of
International Management.
Ghoshal, S. 1987. Global strategy: an organizing framework. Strategic Management Journal, 8(5): 425-440.
George, G. 2005. Slack resources and the performance of privately held firms. Academy of Management Journal, 48, 661-676.
Geringer, J.M., Beamish, P.W. and DaCosta, R.C. 1989. Diversification strategy and internationalisation: implications for MNE
performance. Strategic Management Journal, 10(2): 109–119.
Geringer, J.M., Tallman, S. and Olsen, D.M. 2000. Product and international diversification among Japanese multinational firms.
Strategic Management Journal, 21(1): 51–80.
Glückler, J. and Armbrüster, T.2003. Bridging Uncertainty in Management Consulting: The Mechanisms of Trust and Networked
Reputation. Organization Studies,24(2): 269-297.
Goerzen, A. and Beamish, P. 2003. Geographic scope and multinational enterprise performance. Strategic Management Journal,
24(13): 1289–1306.
Gomes, L. and Ramaswamy, K. 1999. An empirical examination of the form of the relationship between multinationality and
performance. Journal of International Business Studies, 30(1):173–188.
Goodale, J.C., Kuratko, D.F. and Hornsby, J.S. 2008. Influence factors for operational control and compensation in professional
service firms. Journal of Operations Management, 26, 669-688.
Grant, R. M.1987.Multinationality and Performance among British Manufacturing Companies. Journal of International Business
Studies,18(3): 79-89.
Grant, R.M., Jammine, A.P. and Thomas, H. 1988. Diversity, diversification, and profitability among British manufacturing
companies 1972–84. Academy of Management Journal, 31(4): 771–801.
Greene, W. H. 2012. Econometric Analysis 7th ed., Pearson, London.
Greenley, G. E. and Oktemgil, M. 1998. A Comparison of Slack Resources in High and Low Performing British Companies. Journal
of Management Studies,35(3): 377-398.
Greenwood, R., Li, S. et al. 2005.Reputation, Diversification, and Organizational Explanations of Performance in Professional
Service Firms. Organization Science,16(6): 661-673.
Gujarati, D. N. 2004. Basic Econometrics, 4th Edition. The McGraw−Hill, NY.

Page 45 of 48
Harris, R. and Li, Q. 2009. Exporting, R&D, and absorptive capacity in UK establishments. Oxford Economic Papers, 61(1): 74-103.
Harvey, J. 2011. Complex service delivery processes: Strategy to operations, 2nd Ed, ASQ Quality Press, Milwaukee, Wisconsin.
Hausman, J. A. 1978. Specification Tests in Econometrics. Econometrica 46 (6): 1251–1271.
Heineke, J. and Davis, M. 2007. The Evolution of Service Operations in Business Schools. Journal of Operations Management, 25(2):
364-374.
Hennart, J. 2007. The Theoretical Rationale for a Multinationality-Performance Relationship. Management International Review, 47:
423-452
Hitt, M. A., Bierman, L. et al.2006.The Importance of Resources in the Internationalisation of Professional Service Firms: The Good,
the Bad, and the Ugly. The Academy of Management Journal, 49(6): 1137-1157.
Hitt, M. A., Biermant, L. et al.2001.Direct and Moderating Effects of Human Capital on Strategy and Performance in Professional
Service Firms: A Resource-Based Perspective. Academy of Management Journal, 44(1): 13-28.
Hitt, M. A. and Hoskisson, R.E. et al.1997.International Diversification: Effects on Innovation and Firm Performance in Product-
Diversified Firms.The Academy of Management Journal,40(4): 767-798
Hsu, W., Chen, H. and Cheng, C. 2013. Internationalisation and firm performance of SMEs: The moderating effects of CEO attributes.
Journal of World Business, 48: 1-12.
Hsu, C. and Pereira, A. 2008. Internationalisation and performance: The moderating effects of organizational learning. Omega: The
International Journal of Management Science, 36: 188-205.
Huang, C. F. and Hsueh, S.L. 2007.A study on the relationship between intellectual capital and business performance in the
engineering consulting industry: A path analysis. Journal of Civil Engineering and Management,13(4): 265-271.
Huang, Y. and Chen. C. 2010. The impact of technological diversity and organizational slack on innovation.Technovation, 30(7–8):
420-428.
Hughes, J.S., Logue, D.E. and Sweeney, R.J. 1975. Corporate international diversification and market assigned measures of risk and
diversification. Journal of Financial and Quantitative Analysis, 10(4):627–637.
ISG. 2013. Robust growth for engineering services outsourcing: spend shifts to emerging markets, captives reassessed. Information
Services Group, retrieved on 1st Feb 2014 via www.isg-one.com.
Jensen, M. 1998. Foundations of organizational strategy. Cambridge, MA: Harvard University Press.
Karpen, I.O., Bove, L.L. and Lukas, B.A. 2012. Linking Service-Dominant Logic and Strategic Business Practice: A Conceptual
Model of a Service-Dominant Orientation, Journal of Service Research, 15(1): 21-38.
Kastalli, I. V., & Van Looy, B. 2013. Servitization: Disentangling the impact of service business model innovation on manufacturing
firm performance. Journal of Operations Management, 31(4): 169-180.
Katrishen, F.A. and Scordis, N.A. 1998. Economies of scale in services: a study of multinational insurers. Journal of International
Business Studies, 29(2):305–324.
Ketchen,D.J.,and Palmer, T.B. 1999. Strategic Responses to Poor Organizational Performance: A Test of Competing Perspectives.
Journal of Management, 25(5): 683-706
Kim,W. C., Hwang, P.,&Burgers,W. P. 1989. Global diversification strategy and corporate profit performance. Strategic Management
Journal, 10: 45– 57.
Kim, W.C., Hwang, P. and Burgers, W.P. 1993. Multinationals’ diversification and the risk–return trade-off. Strategic Management
Journal, 14(4): 275–286.
Kotabe, M., Srinivasan, S.S. and Aulakh, P.S. 2002.Multinationality and firm performance: the moderating role of R&D and
marketing capabilities. Journal of International Business Studies, 33(1): 79–97.
Krishnan, J. and Schauer, P.C.2000. The Differentiation of Quality among Auditors: Evidence from the Not-for-Profit Sector.
AUDITING: A Journal of Practice & Theory,19(2): 9-25.
Kumar, M.S. 1984. Growth, Acquisition and Investment: an Analysis of the Growth of Industrial Firms and Their Overseas Activities.
Cambridge: Cambridge University Press.
Lal, R., Sarvary, M. et al. 1999.When Competitive Advantage Doesn't Lead to Performance: the Resource-Based View and
Stakeholder Bargaining Power. Organization Science, 10(2): 119-133.
Lampel, J. and Giachetti, C.2013.International diversification of manufacturing operations: Performance implications and moderating
forces. Journal of Operations Management, 31(4): 213-227.
Lee, H. 2013. The M Curve and the multinationality-performance relationship of Korean INVs. Multinational Business
Review,21(3):214-231
Lee, J. and Habte-Giorgis, B. 2004.Empirical approach to the sequential relationships between firm strategy, export activity, and
performance in U.S. manufacturing firms. International Business Review, 13(1): 101-129.
Page 46 of 48
Lewin, A. Y., Massini, S. and Peeters, C. 2009. Why are companies offshoring innovation? The emerging global race for talent.
Journal of International Business Studies, 40(6): 901–925.
Lewis, M. and Brown, A. 2012. How different is Professional Service Operations Management? Journal of Operations Management,
30(1-2): 1-11.
Li, J. and Guisinger, S. 1992. The globalization of service multinationals in the 'triad' regions: Japan, Western Europe, and North
America. Journal of International Business Studies, 23(4): 675-696.
Li, L. 2005. Is regional strategy more effective than global strategy in the US service industries? Management International Review,
45(1): 37-57.
Li, L.2007.Multi-nationality and performance: a synthetic review and research agenda. International Journal of Management
Reviews,9(2): 117-139.
Li, L. and Qian, G. 2005. Dimensions of international diversification: the joint effects on firm performance. Journal of Global
Marketing, 18(3/4): 7–35.
Lin, W., Cheng, K. et al. 2009. Organizational slack and firm’s internationalisation: A longitudinal study of high-technology firms.
Journal of World Business, 44(4): 397-406.
Lin, W., Liu, Y. et al. 2011. The internationalisation and performance of a firm: Moderating effect of a firm's behaviour. Journal of
International Management,17(1): 83-95.
Lovelock, C. and Gummesson, E. 2004. Whither services marketing? In search of a paradigm and fresh perspectives, Journal of
Services Research, 7(1): 20-41.
Løwendahl, B., 2005. Strategic management of professional service firms.3rd ed., Copenhagen Business School Press, Copenhagen.
Lu, J.W. and Beamish, P.W. 2001.The internationalisation and performance of SMEs. Strategic Management Journal, 22,(6-7):565–
586.
Lu, J.W. and Beamish, P.W. 2004. International diversification and firm performance: the S-curve hypothesis. The academy of
management journal, 47(4): 598-609.
Machuca, J., Gonzalez-Zamora, M.d.M., Aguilar-Escobar, V.G. 2007.Service operations management research. Journal of Operations
Management 25, 585-603.
Malhotra, N. and Morris, T. 2009. Heterogeneity in professional service firms. Journal of Management Studies, 46(6): 895-922.
Marano, V., Arregle, J. Hitt, M., Spadafora, E. and van Essen, M. 2016. Home Country Institutions and the Internationalization-
Performance Relationship:A Meta-Analytic Review. Journal of Management 42(5): 1075-1110.
Michel, A. and Shaked, I. 1986. Multinational corporations vs. domestic corporations: financial performance and characteristics.
Journal of International Business Studies, 17(3):89–100.Miller, S., Lavie, D. and Delios, A. 2016. International intensity, diversity,
and distance: Unpacking the internationalization–performance relationship. International Business Review, 25(4): 907-920.
Mishina, Y., Pollock, T.G. and Porac, J.F. 2004. Are more resources always better for growth? Resource stickiness in market and
product expansion. Strategic Management Journal, 25: 1179-1197.
Morck, R. and Yeung, B. 1991. Why investors value multinationality? Journal of Business, 64(2):165–187.
Neter, J., Wasserman, W., Kutner, M.H. 1990. Applied linear statistical models. Irwin-Burr Ridge, Illinois, USA
Nohria, N. and R. Gulati, R. 1996. Is slack good or bad for innovation? Academy of Management Journal, 39: 1245-1264.
Oh, C. & Contractor F. 2012. The role of territorial coverage and product diversification in the multinationality-performance
relationship. Global Strategy Journal, 2(2): 122–136.
Pangarkar, N. 2008. Internationalisation and performance of small- and medium-sized enterprises. Journal of World Business, 43:
475-485.
Pantzalis, C. 2001. Does location matter? An empirical analysis of geographic scope and MNC market valuation. Journal of
International Business Studies, 32(1):133–155.
Patterson, P.G. and Cicic, M. 1995. Typology of service firms in international markets: an empirical investigation. Journal of
International Marketing, 3(4): 57-83.
Pierce, J. R. and Aguinis, H. 2011.The Too-Much-of-a-Good-Thing Effect in Management. Journal of Management,39(2):313-338.
Podolny, J. M.1993. A Status-Based Model of Market Competition. American Journal of Sociology,98(4): 829-872.
Podolny, J. M.1994. Market Uncertainty and the Social Character of Economic Exchange. Administrative Science Quarterly,39(3):
458-483.
Powell, K.S. 2014. From M-P to MA-P: Multionationality alignment and performance. Journal of International Business Studies, 45:
211-226.
Qian, G. 1998. Determinants of profit performance for the largest US.firms 1981–92. Multinational Business Review, 62(2):, 44–51.

Page 47 of 48
Qian, G. 2002. Multinationality, product diversification, and profitability of US emerging and medium-sized enterprises. Journal of
Business Venturing, 17(6):611–634.
Qian, G., Li, L. and Qian, Z. 2008. Regional diversification and firm performance. Journal of International Business Studies, 39: 197–
214.
Ramirez-Aleson, M. and Espitia-Escuer, M.A. 2001.The effect of international diversification on performance. Management
International Review, 41(3): 291–315.
Roth, A.V. and Menor, L.J. 2003. Insights into service operations management: a research agenda. Production and Operations
Management, 12(2):145-164.
Rugman, A.M., Lecraw, D.L. and Booth, L.D. 1985. International Business: Firm and Environment. New York: McGraw-Hill.
Ruigrok, W. and Wagner, H. 2003. Internationalisation and performance: an organizational learning perspective. Management
International Review, 43(1): 63–83.
Ruigrok, W. & Wagner, H. 2004. Internationalization and performance: a meta-analytic review and future research directions.
Academy of International Business Meeting, Stockholm Sweden.
Ruigrok, W., Amann, W. and Wagner, H. 2007. The internationalisation-performance relationship at Swiss Firms: A test of the S-
Shape and Extreme degrees of internationalisation. Management International Review, 47: 349—368.
Sanders, W. G. and Carpenter, M.A. 1998. Internationalisation and Firm Governance: The Roles of CEO Compensation, Top Team
Composition, and Board Structure. Academy of Management Journal, 41(2): 158-178.
Schemeil, Y. 2013. Bringing International Organization In: Global Institutions as Adaptive Hybrids. Organization Studies, 34(2): 219-
252.
Severn, A.K. and Laurence, M.M. 1974. Direct investment, research intensity, and profitability. Journal of Financial and Quantitative
Analysis, 9(2): 181–190.
Shaked, I. 1986. Are multinational corporations safer? Journal of International Business Studies, 17(Spring): 83–106.
Shin, J., Mendoza, Z., Hawkins, M. and Choi, H. 2017. The relationship between multinationality and performance: knowledge-
intensive vs. capital-intensive service micro-multinational enterprises. International Business Review, forthcoming.
Singh, J. V. 1986. Performance, Slack, and Risk Taking in Organizational Decision Making. The Academy of Management Journal,
29(3): 562-585.
Singla, C. and George, R. 2013. Internationalisation and performance: A contextual analysis of Indian firms. Journal of Business
Research, 66(12): 2500-2506.
Siddharthan, N.S. and Lall, S. 1982. Recent growth of the largest US.multinationals. Oxford Bulletin of Economics and Statistics,
44(1): 1–13.
Sullivan, D. 1994. Measuring the degree of internationalisation of a firm. Journal of International Business Studies, 25(2):325–342.
Szulanski, G. 2003. Sticky Knowledge: Barriers to Knowing in the Firm, London: SAGE Publications.
Tallman, S. and Li, J.T. 1996.Effects of international diversity and product diversity on the performance of multinational firms.
Academy of Management Journal, 39(1):179–196.
Tan, J. and Peng, M.W. 2003.Organizational slack and firm performance during economic transitions: two studies from an emerging
economy. Strategic Management Journal,24(13): 1249-1263.
Thomas, D.E. and Eden, L. 2004. What is the shape of the multinationality–performance relationship? Multinational Business Review,
12(1): 89–110.
Tsai, H. 2014. Moderators on international diversification of advanced emerging market firms. Journal of Business Research, 67:
1243-1248.
Tseng, C. Tansuhaj, P. et al. 2007. Effects of firm resources on growth in multinationality. Journal of International Business
Studies,38: 961–974.
Vargo, S. and Lusch, R. 2008, Service-dominant logic: continuing the evolution. Journal of the Academy of Marketing Science, 36(1):
1-10.
Vernon, R. 1971. Sovereignty at Bay: the Multinational Spread of US Enterprises. New York: Basic Books.
Von Nordenflycht. 2010. What is professional service firm? Toward a theory and typology of knowledge-intensive firms. Academy of
Management Review 35(1), 184-187.
Voss, G.B., Sirdeshmukh, D., Glenn B. et al. 2008. The Effects of Slack Resources and Environmental threat on Product Exploration
and Exploitation. Academy of Management Journal, 51(1): 147-164.
Wang, H., Choi, J. et al. 2013. Slack Resources and the Rent-Generating Potential of Firm-Specific Knowledge. Journal of
Management, in press

Page 48 of 48
Wefald, A.J., Katz, J.P. et al.2010. Organizational Slack, Firm Performance, and the Role of Industry.Journal of Managerial Issues,
22(1): 70-87.
Wei, C., Liu, P. and Tsai, Y. 2002. Resource-constrained project management using enhanced theory of constraint.
International Journal of Project Management, 20(7): 561–567.
Westhead, P., Wright, M. et al. 2001. The internationalisation of new and small firms: A resource-based view. Journal of Business
Venturing, 16(4): 333-358.
Williamson, O.E. 1981. The Economics of Organization: The Transaction Cost Approach. The American Journal of Sociology, 87(3):
548-577
Wiersema, M. & Bowen, H. 2011. The relationship between international diversification and firm performance: why it remains a
puzzle. Global Strategy Journal, 1(1): 152–170.
Yoshihara, H. 1985. Multinational growth of Japanese manufacturing enterprises in the postwar era.Proceedings of the Fuji
International Conference on Business History. Tokyo: University of Tokyo Press.
Zahra, S. A.2003.International expansion of U.S. manufacturing family businesses: the effect of ownership and involvement. Journal
of Business Venturing, 18(4): 495-512.
Zahra, S.A., Ireland, R.D. and Hitt, M.A. 2000. International expansion by new venture firms: international diversity, mode of market
entry, technological learning, and performance. Academy of Management Journal, 43(5): 925–950.
Zeithaml, V., Parasuraman, A. and Berry, L.L. 1985.Problems and strategies in services marketing', Journal of Marketing, 49: 33-46.
Zhang, X., Zhong, W. and Makino, S. 2015. Customer involvement and service firm internationalization performance: An integrative
framework. Journal of International Business Studies, 46: 355.
Zhang, Y. and Gregory, M. 2011. Managing global network operations along the engineering value chain. International Journal of
Operations and Production Management 31(7): 736-764.
Zhang, Y. and Zhang, L. 2014. Organizing complex engineering operations throughout the lifecycle: A service-centred view and case
studies. Journal of Service Management, 25(2): 580-602.
Zhang, Y., Gregory, M. and Shi, Y. 2014. Managing global engineering networks Part I: Theoretical foundations and the unique
nature of engineering. Proceedings of the Institution of Mechanical Engineers, Part B: Journal of Engineering Manufacture, 228(2):
163-171.
Zhang, Y., Gregory, M. & Neely, A. 2016. Global Engineering Services: Shedding Light on Network Capabilities. Journal of
Operations Management, 42/3: 80-94.
Zhou, L., Wu, W. and Luo, X. 2007. Internationalisation and the performance of born-global SMEs: the mediating role of social
networks. Journal of International Business Studies, 38: 673-690.