THE POPULAR REPUBLIC OF CHINA: AN INCREASINGLY ATTRACTIVE MARKET
37
THE POPULAR REPUBLIC OF CHINA: AN INCREASINGLY ATTRACTIVE MARKET 1. Introduction to the Popular Republic of China. Key indicators. The Chinese economy grew by 9.2% in 2011, a robust pace of growth that, even though it is the lowest in the last decade, shows that China’s economy is not going to stop growing, as some reports have suggested. Instead, China is heading for a slow landing. The reasons for its downturn lie in the slow recovery of exports due to a lower demand of the global economy, plus a decrease in investment. According to most of the surveys consulted, for instance, those of La Caixa 1 , the risks of a recession are very limited. In the first place, China still has enormous potential to increase its internal demand. Even though it is true that certain consumer goods are approaching saturation (mobile phones, televisions or home appliances), particularly in urban areas, other sectors, such as cars, still have a very long way to go. Regarding investment, the factors that suggest a decreasing trend are very limited, and centre on infrastructures and building. The former was seriously affected by the high-speed-train accident that took place in Wenzhou last summer. The latter is distressed due to credit restrictions being applied in order to stop the growth of inflation. However, bearing in mind that more than 300 million people in rural areas are willing to move into cities, the demand for housing is ensured. The activity indicators such as industrial production and electric production are still growing strongly (by 14% and 11% respectively in the third quarter of 2011). Finally, foreign trade, both exports and imports, are on the increase, even though not as strongly as in the past decade. Therefore, it can be concluded that the Chinese economy is not going to crash, but to cool down slightly. Perhaps the main risk is the high rates of inflation, still at 6.1% in September 2011. The rate of inflation of food is at a worryingly high 13.4%, a factor of considerable social relevance that is a cause for concern for Chinese authorities. Associated with price increases are swelling labour costs, which erodes the competitiveness of traditionally cheap Chinese labour. As a result, it obliges the country to reorient the economy towards more domestic consumption and to produce more sophisticated goods. Therefore, we can conclude that growth is set to continue, even though perhaps at a slower rate. We would like to stress the idea at this point that, independently of whatever happens in the short term, the interest for China in the long run remains unaffected. This is not a fashion and does not depend on short-term indicators: China is here to stay and its influence as a second world power is unquestionable. 1 LA CAIXA. Monthly and Annual Report. November 2011 (p. 12-14).
Transcript of THE POPULAR REPUBLIC OF CHINA: AN INCREASINGLY ATTRACTIVE MARKET

THE POPULAR REPUBLIC OF CHINA: AN INCREASINGLY ATTRACTIVE MARKET 1. Introduction to the Popular Republic of China. Key indicators. The Chinese economy grew by 9.2% in 2011, a robust pace of growth that, even though it is the lowest in the last decade, shows that China’s economy is not going to stop growing, as some reports have suggested. Instead, China is heading for a slow landing. The reasons for its downturn lie in the slow recovery of exports due to a lower demand of the global economy, plus a decrease in investment. According to most of the surveys consulted, for instance, those of La Caixa1, the risks of a recession are very limited. In the first place, China still has enormous potential to increase its internal demand. Even though it is true that certain consumer goods are approaching saturation (mobile phones, televisions or home appliances), particularly in urban areas, other sectors, such as cars, still have a very long way to go. Regarding investment, the factors that suggest a decreasing trend are very limited, and centre on infrastructures and building. The former was seriously affected by the high-speed-train accident that took place in Wenzhou last summer. The latter is distressed due to credit restrictions being applied in order to stop the growth of inflation. However, bearing in mind that more than 300 million people in rural areas are willing to move into cities, the demand for housing is ensured. The activity indicators such as industrial production and electric production are still growing strongly (by 14% and 11% respectively in the third quarter of 2011). Finally, foreign trade, both exports and imports, are on the increase, even though not as strongly as in the past decade. Therefore, it can be concluded that the Chinese economy is not going to crash, but to cool down slightly. Perhaps the main risk is the high rates of inflation, still at 6.1% in September 2011. The rate of inflation of food is at a worryingly high 13.4%, a factor of considerable social relevance that is a cause for concern for Chinese authorities. Associated with price increases are swelling labour costs, which erodes the competitiveness of traditionally cheap Chinese labour. As a result, it obliges the country to reorient the economy towards more domestic consumption and to produce more sophisticated goods. Therefore, we can conclude that growth is set to continue, even though perhaps at a slower rate. We would like to stress the idea at this point that, independently of whatever happens in the short term, the interest for China in the long run remains unaffected. This is not a fashion and does not depend on short-term indicators: China is here to stay and its influence as a second world power is unquestionable.
1 LA CAIXA. Monthly and Annual Report. November 2011 (p. 12-14).

Table 1. The Popular Republic of China: A selection of key indicators
2006 2007 2008 2009 2010
POPULATION
Total population millions; as of 31 December 1,314.5 1,321.3 1,328.0 1,334.7 1,339.7
Population density persons per square km. 136.9 137.6 138.3 139.0 140.0
Population annual change, percent 0.5 0.5 0.5 0.5 0.4
Urban population percent of total population 43.9 44.9 45.7 46.6 49.7
LABOUR FORCE millions; calendar year 782.4 786.5 792.4 798.1 ...
Employed
Agriculture 764.0 769.9 774.8 780.0 ...
Manufacturing 325.6 314.4 306.5 297.1 ...
Others 438.4 455.5 468.3 482.9 ...
Unemployed 8.5 8.3 8.9 9.2 ...
Unemployment rate percent
4.1 4.0 4.2 4.3 4.1
Labour force annual change, percent 0.5 0.5 0.8 0.7 ...
NATIONAL ACCOUNTS billions Yuan; calendar
year
At Current Prices
GDP, total at current market prices 21,631.4 26,581.0 31,404.5 34,050.7 39,798.3
At Current Market Prices Yuan
Per capita GDP 16,500.0 20,169.0 23,708.0 25,605.0 29,762.0
Price Indexes annual change, percent
Consumer price index 1.5 4.8 5.9 -0.7 3.3
Producer price index 3.0 3.1 6.9 -5.4 5.5
EXTERNAL TRADE billions US Dollars; calendar
year
Exports, fob 969.0 1,217.8 1,430.7 1,201.7 1,577.9
Imports, cif 791.5 956.0 1,132.6 1,005.6 1,394.8
Trade balance 177.5 261.8 298.1 196.1 183.1
External Trade annual change, percent
Exports 27.2 25.7 17.5 -16.0 31.3
Imports 19.9 20.8 18.5 -11.2 38.7
Balance of Payments percent of GDP at
current market prices
Exports 35.7 34.9 31.7 24.2 26.9
Imports -27.7 -25.9 -23.8 -19.1 -22.6
Balance on goods 8.0 9.0 8.0 5.0 4.3
Current account balance 9.3 10.6 9.6 6.0 5.2
EXCHANGE RATES Yuan per US Dollar
End of period 7.81 7.30 6.83 6.83 6.62
Average of period 7.97 7.61 6.95 6.83 6.77
Source: Asian Development Bank (ADB). www.adb.org. July 2012.
There are, however, certain facts that indicate that the economic growth model needs to be revised, in order to counterbalance certain challenges affecting the Chinese economy. These are increasing inequality, social contradictions, environmental hazards, weak technological innovation, irrational industrial structure and fragile agricultural structure, to name a few. This is the summary for China by the ADB Outlook 20122. It reflects precisely the situation in a few lines:
Domestic demand rather than exports was the driving force behind 2011’s strong performance, with high investment and consumption. The outlook for 2012 and 2013, despite uncertain global prospects, is for only moderately slower growth. The economy is gradually diversifying, with imports rising rapidly and the trade surplus now much less as a percentage of economic output. Currency appreciation, rising wage rates, increasing income disparities, and environmental concerns underscore the need for modifying the country’s growth model. With a strong fiscal position and declining inflation, the Government is well positioned to implement the 12th Five-Year Plan, designed to further transform the economy.
The Chinese Government is aware of the need for a change of economic model and, to that purpose, it has developed a tool to implement such change: the 12th Five-Year Plan 2011-2015. Premier Wen Jiabao said in a speech at the Fifth Plenary Session in Beijing 6th March 20123:
2012 is an important year for the 12th Five-Year Plan period and the last year of the current administration. We should accelerate the transformation of economic development model and adjustment of economic structure, strengthen self-innovation and energy saving and emission reduction, and facilitate socialist economic, political, cultural, social and ecological development in an all-round way.
Premier Wen Jiabao noted that the expected annual growth of GDP this year will be 7.5%, which, although slightly lower than that of last year, is in line with the targets of the 12th Five-Year Plan. It will guide each region and department to focus on accelerating the transformation of economic development model and raising economic development quality and benefits to achieve long, high-level and better development.
We will make new progress in areas such as industrial restructuring, self- innovation, energy saving and emission reduction (…) We will keep on the implementation of a steady monetary policy, and keep on strict control of the loans to the industries with high energy consumption, heavy pollution or excessive productivity. We will achieve better combination of keeping steady growth with controlling price, adjusting economic structure, benefiting public welfare, promoting reform and facilitating harmony.
2 ASIAN DEVELOPMENT BANK (ADB). ADB Outlook 2012. Confronting rising inequality in Asia. www.adb.org.
(p. 131 onwards). July 2012. 3 Wen Jiabao stresses that China will not seek economic growth at the cost of the environment and
public health at the Fifth Plenary Session of the 11th National People’s Congress (NPC). Ministry of Environmental Protection. www.english.mep.gov.cn. August 2012.

To summarise, the Popular Republic of China is expected to continue growing, although at a slower pace compared to the last 25 years. With a population of over 1.3 billion people, it is surely going to surpass the US GDP within a few years, a fact that is perfectly natural due to its much larger population. In addition, several factors are challenging China’s economy and they will have to be dealt with in the coming years. The following sections analyse in depth the accession of China to the World Trade Organization, the economic variables that influence the attractiveness of the Chinese marketplace (such as income, employment, an expanding middle class), and the challenges China faces in the future.
2. China, the most populated country in the world The population of China was approximately 1,347 million people in 2011, around 30 times the population of Spain. As such, China is the most populous country in the world, accounting for more than 20% of the world’s population. By 2016 the population is expected to be 1,380 million people, compared to 47 million in Spain (estimates carried out by the IMF4). In Figure 5 we can appreciate both the evolution and population difference between the two countries. Figure 1. Evolution of Population: China, Japan, USA and Spain 1980-2017. In millions.
Source: IMF, World Economic Outlook Database (WEO), 2012. Estimates start after 2011.
While the population of Spain has grown at a rate of 18% in the last twenty years (1996-2016), in the same period the population of China grew at a slower pace, at 12% over the time period. However, if we consider the absolute figures, the growth in China means that
4 INTERNATIONAL MONETARY FUND (IMF). According to the official IMF web site (www.imf.org), the
International Monetary Fund (IMF) is an organization of 187 countries, working to foster global monetary cooperation, secure financial stability, facilitate international trade, promote high employment and sustainable economic growth, and reduce poverty around the world. The IMF publishes a range of time series data on IMF external trade, exchange rates and other economic and financial indicators. Some IMF data have been used for the present research, mostly the World Economic Outlook Database (WEO), the International Financial Statistics (IFS) and the Direction of Trade Statistics (DOTS) Database. September 2012.
0
200
400
600
800
1000
1200
1400
1600
19
80
19
82
19
84
19
86
19
88
19
90
19
92
19
94
19
96
19
98
20
00
20
02
20
04
20
06
20
08
20
10
20
12
20
14
20
16
China
Japan
Spain
United States

for every year, in the period 2000-2016, the total population increases by 6 to 8 million people. Figure 2. Evolution of the annual population growth in China 1980-2014 (in thousands)
Source: IMF, World Economic Outlook Database (WEO), 2012. Estimates start after 2011
It is of special relevance in the case of China to establish a clear difference between the rural and urban population. While the majority of the population (55.1%) is still rural compared to the urban population (44.9%), the intense migratory movements leads us believe that by 2035, 70% of the population will be living in the five largest urban areas: Shanghai (18.9 million), Beijing (16.7), Canton (7.8), Tianjin (11.8) and Chongqing (28.4)5. That means that the urban population—with access to products and services, with needs to be fulfilled and with considerable purchasing power—will grow from being around 600 million people at present to 1,000 million in the next 14 years. To summarise, we can conclude that population growth accounts for an increase of 6-8 million people annually (80-100 million people in the next 14 years), but more importantly, some 400 million people will move from rural to urban areas in the same period of time. At the end of 2012, the total employed population in China was over 800 million people, of whom around 128 million were employed in urban areas. According to the National Bureau of Statistics, the unemployment rate was 4.1%. This figure has been questioned by some surveys, which believe that the figure does not really reflect the real situation. Active population accounts for 59% of the total population (quite a low figure if we compare it with developed countries, where it stands around 65%). The primary sector, which accounts for 11% of the GDP, employs 40% of the workers, indicating that productivity is very low in this sector. The secondary sector accounts for 27% of employment, while services employ the remaining 33%. To a certain extent, the growth of employment and productivity in China comes from the migratory movements from low productivity rural areas to urban areas, where activities are more productive.
5 INSTITUTO ESPAÑOL DE COMERCIO EXTERIOR (ICEX), Country Guide, China, 2010.
0
2000
4000
6000
8000
10000
12000
14000
16000
18000
20000
1980
1982
1984
1986
1988
1990
1992
1994
1996
1998
2000
2002
2004
2006
2008
2010
2012
2014

As we can see, migratory movements towards urban areas, combined with the increase in wealth in these areas, represent a new world of opportunities in terms of market growth that are currently taking place and that can be expected to continue in the future. In 2011, the proportion of urban population stood at more than 50% for the first time ever. Statistics show that from an urban population of 18% in 1978, it reached 51.3% in 2011. Figure 7 shows clearly the growing importance of the urban population over the whole, mostly since the 1980s. Figure 3. Evolution of rural and urban population in China, 1950s-2010
Source: National Bureau of Statistics, Popular Republic of China.
Migration policy in China since the revolution has evolved significantly. According to Webber, Wang and Ying6, the period 1958-84 was one of restricted migration, since industrialization was unable to absorb all the peasants who had migrated to the cities. People could only move to cities if they had an employment certificate, were enrolled at a university or had specific permission from the immigrating city. Since 1984, migration has been partially restricted. Peasants could migrate to market towns if they had savings, could provide their own accommodation or had managerial skills (they had to prove they had worked at a firm for several years). Such people could become legal town residents. More recently, however, mostly since 2000, several provinces have begun to lift restrictions controlling migration. For instance, Guangdong province, according to the above mentioned authors, has completely removed all controls. Other provinces, such as Zhejiang, Beijing, Shanghai or Anhui have relaxed their restrictions over people mobility.
6 WEBBER, M.; WANG, M. China´s transition to a global economy. Palgrave MacMillan. New York, 2002. (p.
12).
The main migration stream is, as one could expect, from the rural world to the cities. “Now, in rural areas of the centre and the east of the country, it is hard to find a household from which at least one male has not worked in a city, at least temporarily”11.
As peasants move to the cities, they shift residence, at least temporarily. But, even though they live in the city most part of the year, they mostly keep their registration in the village where they come from, because they prefer to remain tied to the land. In fact, they continue to do part-time farm work, helping the family that has stayed in the country. As a consequence, there is a mismatch between the location where they are employed (the city) and the location of registration (the village). Therefore, information about the rate of migration is scarce. It is not easy to know exactly how many people live in rural areas versus urban citizens. It is very likely that urban figures are under-estimated.
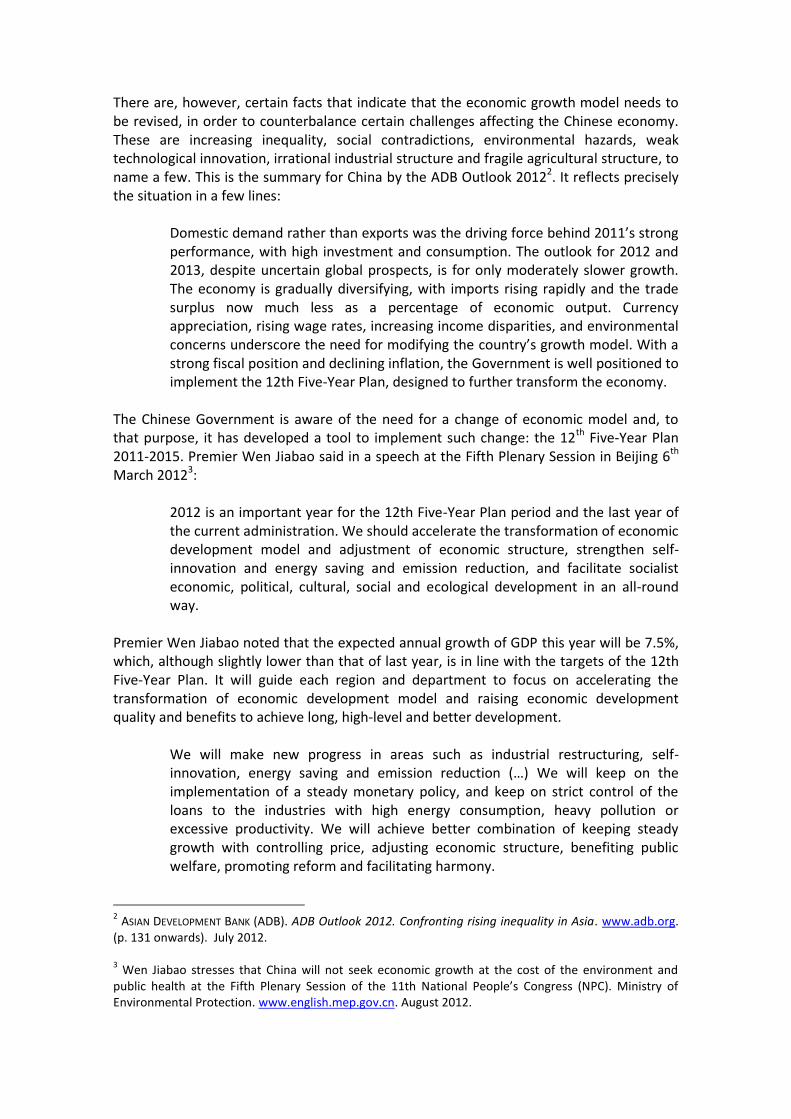
3. China is still the fastest-growing country of the major economies In 1980, the GDP of Spain was higher than that of China. As we can appreciate in the Figure 8 below, the situation changed in the 1980s when the Chinese GDP overtook that of Spain, and since then the gap has annually become more pronounced. Deng Xiaoping, the leader considered to have led China towards a market economy, is responsible for the economic reforms. In fact, his reputation is as "the architect" of a new brand of socialist thinking: he developed socialism with Chinese characteristics and led his country’s economic transformation through a series of reforms that became known as the "socialist market economy". Deng’s initiatives included the opening of China to foreign investment, the global market and private competition. The goals of his reforms were summed up by the “Four Modernizations”: agriculture, industry, science and technology, and the military. Deng emphasized that socialism does not mean shared poverty and therefore he allowed the entry of competition of market forces. In his famous quote “It doesn't matter if a cat is black or white, as long as it catches mice”, he referred to the dilemma of communism versus capitalism. History has given him the credit for developing China into one of the fastest growing economies in the world for over 30 years and raising the standard of living of hundreds of millions of Chinese. Figure 4. Evolution of GDP in China, Japan, USA and Spain, 1980-2017 (billions of US$)
0
5000
10000
15000
20000
25000
19
80
19
82
19
84
19
86
19
88
19
90
19
92
19
94
19
96
19
98
20
00
20
02
20
04
20
06
20
08
20
10
20
12
20
14
20
16
China
Japan
Spain
United States

Estimates start after 2011. Billion US$. Source: IMF, World Economic Outlook Database (WEO), 2012.
China´s GDP in 2010 was 5,800 billion US$, second in the world after the USA (14,600 billion US$). It has only been in the past few years that China´s GDP overtook that of Japan, Germany and France. China is still the most dynamic driver of growth in the world economy, with a growth rate of 9.2% in 2011. The growth target set by the Chinese authorities for 2011-2015 is 7% a year, which is below the recent trend. Estimates for the coming years are all around 8-8.6%, which means that the country continues to be the fastest-growing of the world’s major economies. Figure 9 below shows China’s contribution to world GDP, which has been over 8% since 2010. As parts of the world go into a recession, China’s contribution to global GDP consolidates itself. Figure 5. World growth rate and China’s contribution to world GDP, 2000-2012
Source: IMF, WEO Database. 2012. To continue with the comparison between China and Spain, if we stated that in 1980 Spanish GDP was higher that the Chinese, by 2010 Chinese GDP was four times that of Spain. Estimates forecast that by 2016 Chinese GDP will amount to 6.5 times that of Spain. This is due to the astounding growth of the Chinese GDP: the average annual increase since 1990 has been 10%, compared to 2.3% in Spain. China has therefore grown at a speed five times that of Spain. We can see the annual growth details in the Table 4 below: Table 2. Evolution of real GDP annual growth (in %)
GDP Annual growth (in %)
Estimates start after 2011.
Year China Spain
1991 9.2 2.5
1995 10.9 4.1
2000 8.4 5
2005 11.3 3.6 2010 10.4 -0.1
-1,0%
0,0%
1,0%
2,0%
3,0%
4,0%
5,0%
6,0%
7,0%
8,0%
9,0%
10,0%
11,0%
12,0%
-1
0
1
2
3
4
5
6
2000 2001 2002 2003 2004 2005 2006 2007 2008 2009 2010 2011 2012
Contribution to World Product (in percent of GlobalOutput, Right Axis)
World Growth Rate (Annual Change, Left Axis)

2011 9.2 0.8
2012 9.5 1.6
2015 9.5 1.8
2016 9.5 1.7
Total growth 266.0 59.6
Average annual growth 10.2 2.3
Source: IMF, World Economic Outlook Database (WEO), 2012, and own calculations.
Figure 6. Evolution of GDP annual growth, 1980-2016, China and Spain (%)
Source: IMF, World Economic Outlook Database (WEO), 2012, and own calculations.
The picture changes when we talk about GDP per capita, the unresolved (or one of the unresolved) matter for China. It is estimated that by 2013 the GDP per capita of China will more or less represent the same as in Spain in 1980. It will only get to 5000 US$ per capita by 2012, but it is undoubtedly growing at a very stable and unmistakable pace. In fact, if in 1980 the GDP of a Spanish person was 30 times that of a Chinese, by 2016, it is estimated it will be only four times as big. Still a remarkable difference, no doubt, but significantly lower all the same (see Table 5).

Table 3. GDP per capita, current prices. US$
GDP per capita, current prices. US$
China Spain
1980 205 6,005
1985 290 4,600
1990 341 13,408
1995 601 15,164
2000 946 14,464
2005 1,726 26,305
2006 2,064 28,244
2007 2,645 32,468
2008 3,404 35,364
2009 3,739 32,030
2010 4,382 30,639
2011 4,833 32,176
2012 5,321 32,947
2013 5,917 33,730
2014 6,589 34,601
2015 7,316 35,539
Source: IMF, World Economic Outlook Database (WEO), 2012. Estimates start after 2011.
Figure 7. Evolution of GDP per capita, China, Japan, USA and Spain, current prices, US$. 1980-2017
Source: IMF, World Economic Outlook Database (WEO), 2012. Estimates start after 2011. Considering how diverse China is and, more in particular, the great difference between rural and urban areas, we can probably say that the 8,000 US$ per capita estimated for 2016 will not be very equally distributed: the one thousand million inhabitants concentrated in the main cities will probably account for most of the wealth, while it is estimated that the remaining 600 million living in the rural areas would hardly benefit from the per capita increase.
0
10000
20000
30000
40000
50000
60000
70000
19
80
19
82
19
84
19
86
19
88
19
90
19
92
19
94
19
96
19
98
20
00
20
02
20
04
20
06
20
08
20
10
20
12
20
14
20
16
China
Japan
Spain
United States

GDP per capita in China is projected to grow by 10%, and even quite possibly to 20% or 30% year on year and it is forecast that it will continue to follow IMF estimates until 2016, although perhaps at a slower pace (around 9-10%), which is, nonetheless, a marked increase (compared with Spanish growth projections of 2 or 3% annually). In order to continue with the analysis the evolution of GDP, we can compare the growth in both countries, China and Spain, using the GDP Deflator7. The Index equals 100 for year 2005 (see Table 6 below). While the final index increases in both cases, the pace is remarkably different. The evolution of the Spanish index corresponds to that of a developed country, with an economic slow down starting in year 2008. China´s index, on the contrary, experiences an enormous pace of growth: more than 13 points from 2005 to 2011.
Table 4. GDP Deflator Index. Year 2005=100
GDP, Deflator Index 2008 2009 2010 2011 Q2 2011 Q3 2011 Q4
China 119 120 127 132 134 139
Spain 110 110 111 112 112 113
Source: IMF. IFS Database. April 2012
Figure 12 shows the evolution of this deflator in the form of a graph comparing both countries. The line in black represents year 2005 and is equal to 100. As we can clearly observe, while the evolution is positive in both cases, the pace of the growth is much higher for China, especially after 2009. Figure 8. GDP Deflator Index – China and Spain. Year 2005=100
Source: IMF. IFS Database, April 2012.
7 The Gross Domestic Deflator (GDP Deflator) is an economic measure that tracks the cost of goods
produced in an economy relative to the purchasing power of the US dollar.
Year 2005 = 100

Increasing GDP with rising inflation According to IMF estimates, GDP growth for China is still very high but slowing down slightly (forecast at 8.3% for 2012). At the same time, inflation is on the increase (estimated at 3.7% for 2012). To summarise, while GDP growth is still strong, inflation is starting to pose a risk. However, increases in consumer prices have been kept under control. Figures published by the Asian Development Bank (ADB) show an inflation rate of 5.4% in 20118. One year later, the figure has been kept to a minimum of 3.7%. Industrial production in China grew by 9.3% in 2011, following the same sources as above. Apart from China, only three other other countries managed to increase their industrial production by more than 8%: Egypt, Taiwan and Japan. In the same period, Spain’s industrial production fell by 10.4%.
4. Low unemployment figures The number of people employed in China has increased, rising from 720 million in 2000 to 780 million by 2009, according to IMF figures. This means that 60 million more people obtained employment in the short period of 9 years, representing an increase of 8% (see Figure 13 below). In the same period in Spain, the number of people employed rose from 15 to 18 million. Figure 1 Evolution of employment levels in China, in millions.
Source: IMF. IFS Database, April 2011.
Below we can see the main three indicators in clearly differing evolution: constantly growing Gross Domestic Product, unemployment rate and variable consumer prices.
8 ASIAN DEVELOPMENT BANK (ADB). Development Indicators and Policy Research Division. Basic Statistics
2012. www.adb.org. July 2012.
100 200 300 400 500 600 700 800 900
2000 2001 2002 2003 2004 2005 2006 2007 2008 2009

Figure 2. Evolution of China’s key indicators: GDP, unemployment rate and consumer prices, 1980-2009
Gross Domestic Products, National Currency
Source: IMF. IFS Database, June 2012.
4.1. Urban workforce New employment positions filled in China's urban areas hit 8.51 million in the first nine months of 2009, according to the the Ministry of Human Resources and Social Security (MHRSS)9. The figure accounted for 94 percent of the Government's annual target of 9 million, ministry spokesman Yin Chengji told a press conference. The number of newly employed people in China's urban areas had reached 900,000 a month in 2010. Moreover, in the first nine months of 2009, 4.02 million laid-off workers found new jobs, accounting for 80 percent of the Government's target of 5 million for the whole year. By the end of the third quarter, 9.15 million people had registered as unemployed in urban areas, a rate of about 4.3 percent, unchanged from the number reported at the end of the second quarter. 74% of the 6.11 million new graduates from the country's universities and colleges had been employed as of Sept. 1, which was moderately higher than the ratio from a year earlier. The Government has resorted to a series of measures to help college graduates find jobs, such as giving them preference in military recruitment and encouraging them to take grass-roots posts in the countryside and relatively poor western regions.
4.2. Unemployment
9 XINHUANET NEWS AGENCY. www.news.xinhuanet.com/english/. October 2011.

Unemployment is remarkably low in China, standing at 4.1% in 201010, and is estimated around 4% for the coming years until at least 2016, according to IMF estimates. Although an effort is being made by the Chinese Government to improve the quatily of statistics, there are still doubts about their accuracy. Therefore, data should be analysed with caution. Nevertheles, it can be stated that the unemployment rate is low, meaning that demand for goods and services is going to continue to grow as more and more workers join the workforce. Clearly, if we compare these figures with 24.1% unemployment in Spain in March 201211, we can see how the Spanish market is very mature—and not expected to grow significantly in the coming five years. Such low unemployment rates as those found in China could only be found in very few countries in the Western world, such as Switzerland (3.1%), Norway (3.2%), or Austria (4.0%), or in Asian countries such as Malaysia (2.9%), South Korea (3.5%), or Taiwan (4.2%). At the other end of the spectrum, we find countries with soaring rates, such as South Africa (25.2%), Spain (24.1%) or Greece (21.7%).
5. China is optimistic about the future When analysing Chinese confidence levels, we can quickly appreciate how, compared to the general pessimism found in Europe, the Chinese are confident about the future. It is a well-known fact that, in economics, confidence means a great deal. Table 5. Chinese business climate, entrepreneur confidence and consumer confidence indexes.
Evolution 1999-2011
Climate Business index (a)
Entrepreneur Confidence
index (b)
Consumer confidence
index (c)
1999 115.4 100.7 109.9
2000 125.4 117.9 112.9
2001 117.6 111.3 113.3
2002 131.0 125.6 113.8
2003 136.0 133.7 111.2
2004 134.7 130.8 108.7
2005 131.7 125.4 110.0
2006 139.4 135.3 113.1
2007 143.6 139.6 113.1
2008 107.0 94.6 101.8
2009 130.6 127.7 103.9
2010 138.0 137.0 100.4
2011 128.2 122.0 100.5
Source: Bloomberg
10
NATIONAL BUREAU OF STATISTICS OF CHINA. www.stats.gov.cn. June 2012. 11
INSTITUTO NACIONAL DE ESTADÍSTICA (INE). www.ine.es. June 2012.

(a) The Business climate index is the quantitative description of the business climate survey, which directly reflects the real situation of the economy. The business climate index ranges from 0 to 200. 100 is the critical value: when the climate index is larger than 100, it indicates that the economic performance is picking up or improving. When it is lower than 100, it shows that the economic performance is declining or worsening.
(b) The Entrepreneur confidence index reflects the confidence of entrepreneurs in China’s macroeconomic environment and takes the same ranges as (a).
(c) The Consumer confidence index is an average of responses to the following
questions: 1. Respondents appraisal of current business conditions. 2. Respondents expectations regarding business conditions six months hence. 3. Respondents appraisal of the current employment conditions. 4. Respondents expectations regarding employment conditions six months hence. 5. Respondents expectations regarding their total family income six months hence.
Apart from the sudden drop in the confidence levels for both the general climate and the entrepreneurs in 2008, which recovered quickly afterwards, the indexes remain well over 100 (see Figure 15). The consumer confidence index is far from the levels of 2007 and before, which stood well over 110. It can be stated that consumers have been no doubt affected by the general world economic recession. However, overall, the climate is of moderate optimism, with confidence on the performance of the economy. Figure 11. Evolution of different Confidence Indexes in China 1999-2011
Source: Bloomberg
6. Household and government consumption on the rise Expenditure on GDP at current market prices in China is on the rise. During the period between 1990 and 2010 expenditure multiplied by more than twenty times, reaching almost forty thousand billion yuan. In other words, in twenty years it has multiplied by
0,0
20,0
40,0
60,0
80,0
100,0
120,0
140,0
160,0
1999 2000 2001 2002 2003 2004 2005 2006 2007 2008 2009 2010 2011
Climate Business index Entrepreneur Confidence index
Consumer confidence index

twenty times, showing the increasingly urgent need for China to provide itself with absolutely everything (see Figure 16). Figure 12. Evolution of expenditure on GDP at current market prices. China 1990-2010. Billions of RMB, calendar year
Source: Asian Development Bank. Key Indicators for Asia and the Pacific.
This soaring consumption is related to both domestic and public spending. If we look at Table 8, we can appreciate that both indicators increase by 14 and 20 times in the relatively brief period of 20 years. We can therefore conclude that, in principle, there are opportunities for both the private and the public sector. Table 6. Consumer spending in China, billions of RMB
Year
Expenditure on
GDP at current
market prices
Private
consumption
Government
consumption
1990 1866,8 945,1 264,0
1995 6079,4 2837,0 837,9
2000 9921,5 4585,5 1566,1
2005 18493,7 7265,3 2639,9
2006 21631,4 8210,4 3052,8
2007 26581,0 9561,0 3590,0
2008 31404,5 11059,5 4175,2
2009 34050,7 12171,3 4441,3
2010 39798,3 13329,1 5361,4
Source: Asian Development Bank, 2012
Figure 13 shows the evolution of both private and government consumption.

Figure 3. China: Consumer spending, 1990-2010, Billions of RMB
Source: ADB, 2012.
Average salaries are also increasing rapidly, at least in the cities. In the last decades these wages have increased every year by more than 10%: sometimes by 12% but in other years up to 18%. One of the consequences of this—one that interests us at this point—is that workers in urban areas have an increasing disposable income to spend on consumption goods12. Figure 14. Average earnings by urban workers. RMB
Source: Bloomberg
As wage levels in China have recently been criticized, the country’s minimum wage levels have been rapidly rising (for instance, Foxconn, a key supplier for Apple, amongst others, raised salaries at their China factories by 25 percent recently following international disapproval after suicide scandals). The Chinese Government has been increasing
12
Such increases in salaries have other immediate consequences, such as the loss of competitiveness of the Chinese economy. However, this factor is fully analysed in a different section of this paper.

minimum wage levels by 15 to 25 percent annually for the past three years. Rates vary by region and are set by each respective local government, calculated together with a number of other indicators, including the local housing market. They are also expected to grow over the coming years as China looks to shift its economy towards a more consumer-oriented society. To achieve that goal, Chinese citizens need to have increasing levels of disposable income so demand for products and services can increase. A contradiction between two models is appearing. On the one hand, China must keep salaries low and working hours long, to remain competitive. On the other hand, there is a strategy to raise salaries and promote the consolidation of a large middle class. In the next few years, China will have to decide which path to take. The map in Figure 19 below helps understand how the wage levels are distributed throughout the country: the east coast provinces boast relatively higher minimum wage levels than the more slow-to-develop western areas. It is, however, important to note that, to retain workers, employers must normally pay more than the mimimum salaries fixed by law: “Minimum wages are of course the legal minimum, and increasingly in China are not applicable in any sensible business model—assuming one wishes to retain workers”. It is also important to add that “on top of wages, employers must also contribute mandatory social welfare benefits for each of its employees. This again varies by region, but can add an additional 40 to 50 percent on top of each Chinese employee’s base salary”13.
Figure 4. Geographical distribution of minimum wages
13
CHINA BRIEFING. www.china-briefing.com. March 2012.
Source: China Briefing.
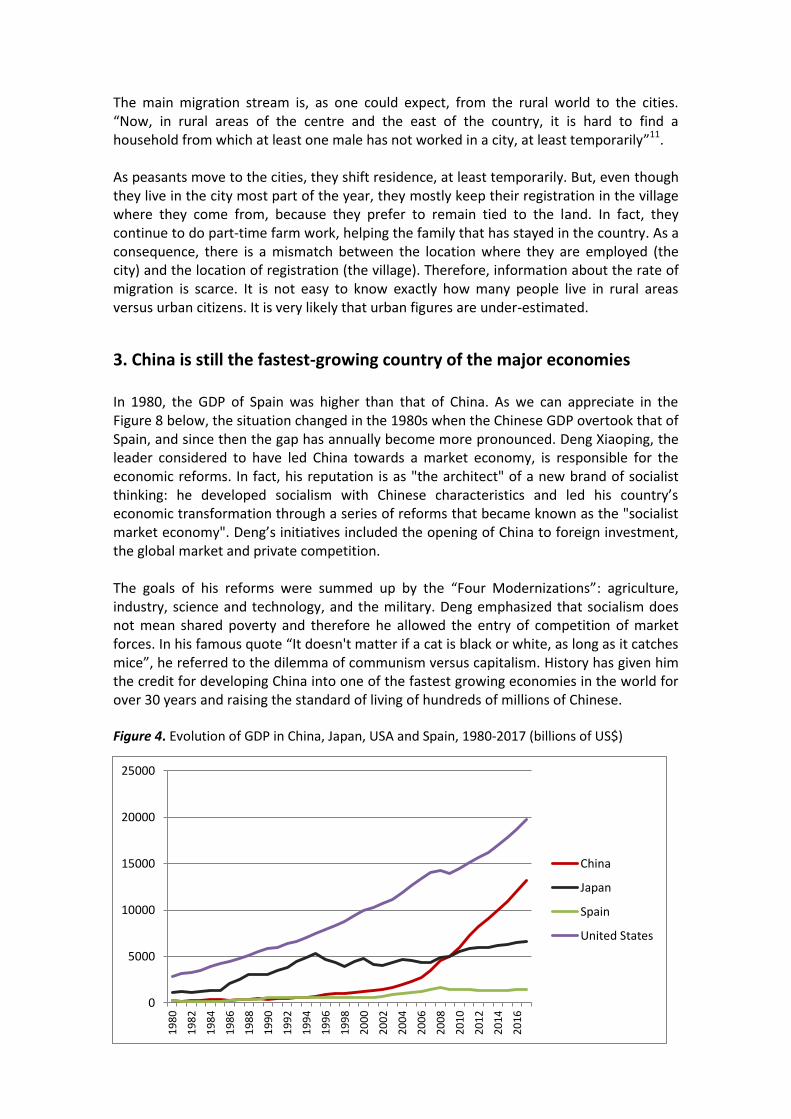
Continuing with our analysis, we move on to analyse the evolution of retail sales (Figure 20). According to Bloomberg’s CNRSCONS Index14, Chinese retail sales have increased on average by 11% in the last 22 years. Moreover, in some years—in particular 2005, 2007 and 2010—the growth has surpassed 20%. Figure 16. Evolution of retail sales in China. Billions of RMB
Source: Bloomberg
7. High income inequality but a powerful emerging middle class Moving on with our research, we should now consider a very different kind of variable that takes into account not the evolution of absolute numbers but how the wealth that is undoubtedly being created in China is distributed. For this, we will analyse the “income equality”: the ratio of the share of national income going to the richest 20% of households in a country to the share of the poorest 20%. This indicator, calculated by the World Bank15, gives an idea of the existing inequality in a
14
Retail Sales of consumer goods include: 1) Sales by wholesale and retail enterprises; consumer goods sold to urban and rural households; commodities sold to foreigners, overseas Chinese and Chinese compatriots from Hong Kong, Macao and Taiwan visiting in China; commodities sold to Government agencies, institutions, social organizations, military and armed police units; and commodities sold to enterprises in the form of retail sales. 2) Sales of staple foods, cooked dishes, beverage, tobacco and other articles by catering units. 3) Sales of books, newspapers, magazines, audio-visual products and post products by publishing and post departments to urban and rural households and to enterprises, institutions, military and armed police units. 4) Sales of food, beverage, tobacco, garments, footwear, headgear, articles for daily use, medicines, medical and health articles, works of art, handicrafts, toys, funeral articles and other articles by other service trades. 15
WORLD BANK. www.worldbank.org. The Gini index measures the extent to which the distribution of income (or, in some cases, consumption expenditure) among individuals or households within an economy deviates from a perfectly equal distribution. A Lorenz curve plots the cumulative percentages of total income received against the cumulative number of recipients, starting with the poorest individual or household. The Gini index measures the area between the Lorenz curve and a hypothetical
0
200
400
600
800
1000
1200
1400
1600
1800
2000
19
91
19
92
19
93
19
94
19
95
19
96
19
97
19
98
19
99
20
00
20
01
20
02
20
03
20
04
20
05
20
06
20
07
20
08
20
09
20
10
20
11

country: the highest world figures are mostly found in Latin American countries (in Colombia, the most extreme case, the income of the top fifth is almost 25 times that of the bottom fifth). Most emerging Asian countries are less unequal: in China, the income of the richest 20% people is 8 times the income of the 20% poorest. If we take a similar index, the Gini index, where 100 points would mean perfect inequality, China scores 41.5 points: inequality in this country is higher than in countries such as India, Pakistan or Egypt. To complete the international comparison, the average for the EU is 30 points, with Spain at 34. Figure 17. Income inequality comparison amongst different countries, measured by the Gini Index (100=perfect inequality), 2010
Source: World Bank. April 2011. According to some authors, such as Wei, overall inequality is not only high in China, but “over the last two decades, overall inequality in China has risen”.16 This is one of the problems that the Chinese Government has not yet been able to tackle successfully and it is certain to become one of the weaknesses of the Chinese society in the future. As a matter of fact, the problem lies mostly in the evolution of inequality: in 1970, China possessed one of the most equal distributions of income and wealth in the world. However, the formidable growth experienced since opening to the outside world in 1978 has also brought with it growing inequality. However, according to an economic report by the OECD in February 2010, this trend is no longer so, and the gap between the poorest and the richest are no longer growing. The change in the trend has been favoured mostly by two factors: first, the increase in social expenditure in rural areas and, second, by the migratory movements from the rural areas towards urban areas. This shows that the poverty pockets are mostly concentrated in China’s rural world.
line of absolute equality, expressed as a percentage of the maximum area under the line. Thus a Gini index of 0 represents perfect equality, while an index of 100 implies perfect inequality. August 2012. 16
WEI, S. J. China as a window to the world: trade openness, living standards and income inequality.
Reserve Bank of Australia, 2002. www.rba.gov.au/publications. June 2011.
22.6 28.2
32.1 32.7
36.8
40.
41.1 41.5
45.8 51.7
53.6 53.9
58.5
0 10 20 30 40 50 60
Chile Serbia
Egypt Pakistan
India Morocco
Qatar China
Argentina Mexico
Brazil Colombia
Thailand

According to the latest ICEX China Country Report17, Gini’s Index of 16 (relative equality) moved to 48 in 2011. Moreover, some experts believe its value to be as high as 53: this implies that income inequality in China is larger than that of the United States, Korea, or most of Europe, but lower than that of South Africa, Russia, Indonesia or Turkey. While economic growth in China in the last three decades has lifted some hundred million people out of poverty, the income of the richest has grown even faster. Most of the inequality comes from the differences between rural versus urban areas. In 2010 the rent per capita in Chinese cities was about 5,500 US$, whereas that in rural areas was between a third and a fourth of that. If we add to this the fact that the propensity to save is greater for those who earn more, we conclude that the inequality tends to grow over time. In terms of market opportunities, if private consumption is to be increased, rent distribution needs to be improved considerably. This may not be true for some sectors, namely the luxury goods, but it is certain for most others and, more importantly, for China’s wellbeing, justice and development of a fair and stable country.
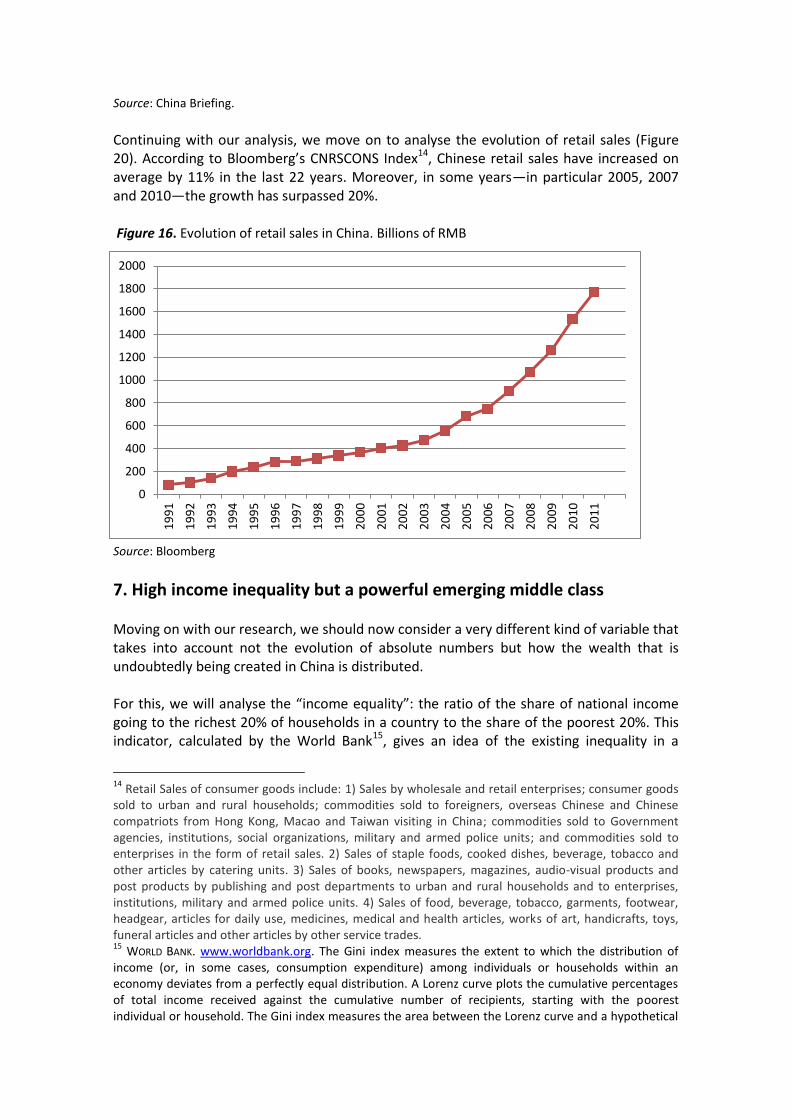
7.1 The emerging middle class While there has been a shift in wealth from Western countries towards the so-called emerging countries, or BRICS, the structure of social classes in these countries has also altered, mainly with the emergence of a powerful middle class. All the authors, experts and publications consulted coincide that the middle class in China is, firstly, increasing at a very high rate, and, secondly, the engine of the economy and consumption in China. H. Kharas, a world expert on the subject, states in his well-known paper on the emerging middle classes in developing countries that “over the coming decades, Asia´s emerging middle class will be large enough to become one of the main drivers of the global economy”18. Two-thirds of the world’s middle-class population is expected to be in the Asia-Pacific region by 2030, compared to 21% in Europe and North America. The dynamic growth that is forecast for the middle class in China and India could partly offset the stagnation expected in North America and Europe. It is also consistent with the greater emphasis the Chinese authorities wish to place on domestic demand (and, with this, consumption) in future growth, partly in response to the need to reduce imbalances between rural and urban areas and between the dynamic coastal zones and the less developed interior. Figures 22 and 23 below show the distribution of the middle-class population by main world regions.
17
ICEX, Country Guide: China. www.icex.es. May 2012. 18
HOMI K. The emerging middle class in developing countries. OECD Development Centre. Working Paper n. 285. January 2010. Homi Kharas is a senior fellow and deputy director for the Global Economy and Development program. Kharas also works with the Development Assistance and Governance Initiative. Formerly a chief economist in the East Asia and Pacific Region of the World Bank, Kharas currently leads a research project on aid agency effectiveness, and also has expertise in East Asia development and global economic trends.
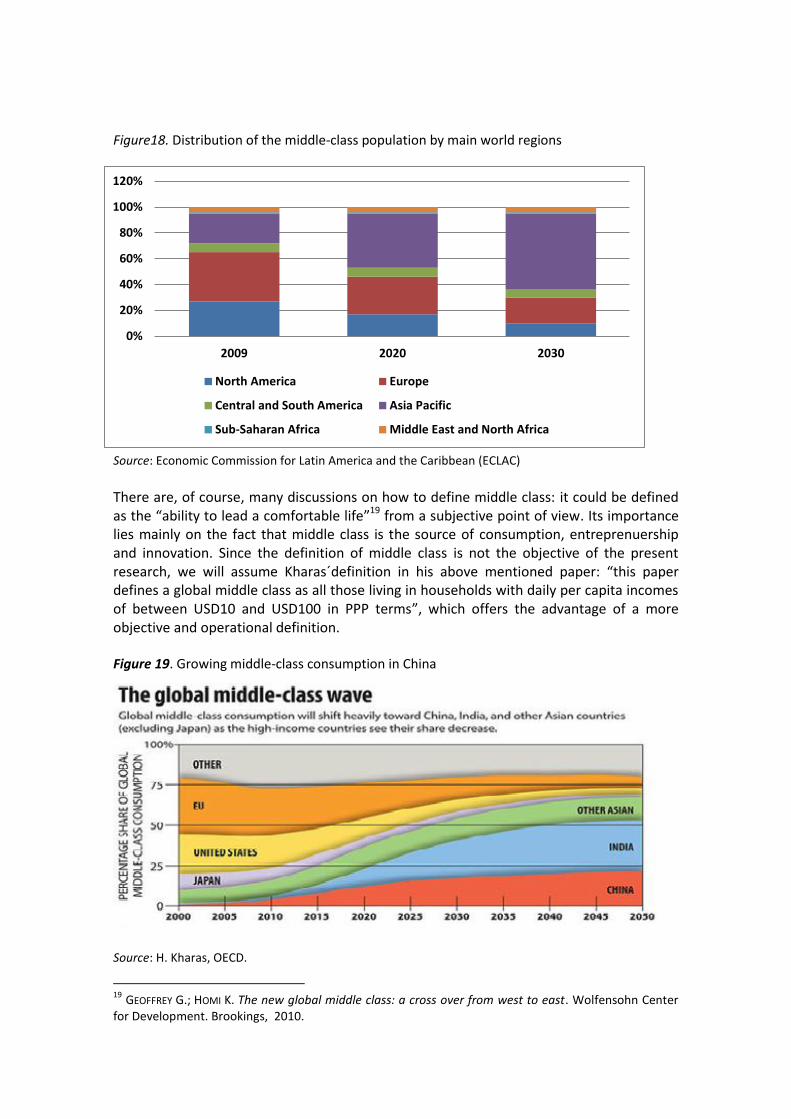
Figure18. Distribution of the middle-class population by main world regions
Source: Economic Commission for Latin America and the Caribbean (ECLAC)
There are, of course, many discussions on how to define middle class: it could be defined as the “ability to lead a comfortable life”19 from a subjective point of view. Its importance lies mainly on the fact that middle class is the source of consumption, entreprenuership and innovation. Since the definition of middle class is not the objective of the present research, we will assume Kharas´definition in his above mentioned paper: “this paper defines a global middle class as all those living in households with daily per capita incomes of between USD10 and USD100 in PPP terms”, which offers the advantage of a more objective and operational definition.
Figure 19. Growing middle-class consumption in China
Source: H. Kharas, OECD.
19
GEOFFREY G.; HOMI K. The new global middle class: a cross over from west to east. Wolfensohn Center for Development. Brookings, 2010.
0%
20%
40%
60%
80%
100%
120%
2009 2020 2030
North America Europe
Central and South America Asia Pacific
Sub-Saharan Africa Middle East and North Africa

Kharas, by combining household survey data with growth projections for 145 countries, showed that Asia accounts nowadays for less than one quarter of today’s middle class. But, and here lies the most important fact, by 2020, that share could double. As a result, more than half the world’s middle class will be in Asia, and Asian consumers will soon account for over 40 per cent of global middle-class consumption. How can this be explained? According to Kharas, a large mass of Asian households have incomes today that position them just below the global middle-class threshold. Therefore, increasingly large numbers of Asians are expected to become middle class in the next ten years. How is that general trend for Asia translated into a reality for China? According to Kharas, China’s middle class today is already very large in absolute terms—estimated at 157 million people. Only the United States has a larger middle class. This represents an enormous opportunity and explains why so many retailers and businesses are anxious to penetrate the Chinese market. China accounts for over 20% of the world population and has a constantly growing middle class, making it a market with huge potential. The rise in per capita income expected over the coming decades should boost both the size and the purchasing power of the Chinese middle class, turning it into a key market for food, higher-quality wearing apparel, tourism, pharmaceuticals, medical services, retail services and luxury goods, among other goods and services. Table 7. Population growth in the world
Selected regions and countries: population growth (Millions of people annualized growth rates)
2010 2020 2030 2040 2050
Annualized
growth
rate, 2010-2050
Latin America and the
Caribbean 585.0 647.1 696.5 696.5 746.0 0.6
Central America 42.5 50.5 58.3 58.3 71.6 1.3
South America 392.3 431.2 461.1 461.1 487.6 0.5
The Caribbean 36.3 39.2 41.2 41.2 42.3 0.4
Mexico 113.4 125.9 135.4 135.4 143.9 0.6
Asia 4164.3 4565.5 4867.7 4867.7 5142.2 0.5
China 1341.3 1387.8 1393.1 1393.1 1295.6 -0,1
South East Asia 593.4 655.9 706.0 706.0 759.2 0.6
India 1224.6 1386.9 1523.5 1523.5 1692.0 0.8
Other Asia 1004.9 1134.9 1245.2 1245.2 1395.4 0.8
United States 310.4 337.1 361.7 361.7 403.1 0.7
European Union 499.3 509.7 514.5 514.5 510.3 0.1
World 6895.9 7656.7 8321.4 8321.4 9306.1 0.8
Chinese share of the total 19.5 18.1 16.7 16.7 13.9 …
*Includes Brunei Darussalam, Cambodia, Philippines, Indonesia, Lao People's Democratic Republic,
Malaysia, Myanmar, Singapore, Thailand, Timor-Leste and Vietnam.
Source: Economic Commission for Latin America and the Caribbean (ECLAC), on the basis of United
Nations, World Population Prospects, 2010 revision.

Figure 24 below illustrates this point: China’s middle class is still small compared to the size of the total population, but is rising quickly thanks to economic growth. Figure 20. Percentage of middle-class population falling within the threshold of US$10/day to
US$100/day
Source: H. Kharas, OECD Over the last 25 years, America’s consumption has been perceived as a major driver of the world economy. However, China’s middle class is expected to surpass America’s by 2020. According of the authors of the study The $10 trillion prize20, the real growth of the middle classes is going to take place in India and China: “Consumers in India and China are the new kings and queens of the global economy. They have fast-changing tastes and appetites and they are transforming the world with their consumption”. Table 8. Lifetime consumption patterns in China
Consumption patterns Born in 1960 Born in 2009 Life expectancy (years) 47 73 Per capita consumption at birth (US$)
102 1,429
Per capita consumption at death (US$)
1,129 21,400
Lifetime consumption (US$) 16,443 632,024 multiplied by 38 times
Source: Silverstein and other authors. The $10 trillion Prize.
The newly affluent consumers save enormous percentages of their income (over 50% of the GDP is saved for future use). They save, among others, because of the lack of social security safety net, education for their children and rising job insecurity.
20
SILVERSTEIN, M.J. AND OTHER AUTHORS. The $10 Trillion Prize. Captivating the Newly Affluent in China and
India. Harvard Business Review Press. Boston, 2012. (p. IX)

However, it is expected that the feeling of optimism for the long term will gradually move them from saving to spending. As they become wealthier, Chinese consumers look for branded goods. They focus mostly on the brand because they see it as an indicator of quality and functionality. The first goods that are chosen by the new upper class are luxury items and prestige cars. After these two, they choose life-enhancing activities, such as dining out, going to the cinema, playing sports and going on overseas trips, especially to the USA and Europe. Table 9. Consumers’ reasons for trading up, by country
Respondents (%)
Reasons for trading
up
China India Brazil Russia USA Europe Japan
Because of the
brand name
70% 64% 60% 26% 30% 19% 24%
Source: Silverstein and other authors. The $10 trillion Prize.
China’s twelfth five-year plan (2011-2015) is designed to reorient the Chinese economy towards a model that is more reliant on domestic consumption, more sustainable, more socially cohesive and more innovative. Rebalancing towards greater domestic consumption is necessary not only to offset the expected weakness in demand from industrialized countries but also to improve distribution indicators, which show deterioration in earnings and a rise in income concentration21: “One very ambitious goal is to universalize medical insurance coverage by incorporating a further 200 million people into the scheme. This will be accompanied by greater public spending on social housing and social insurance in an attempt to narrow differences in incomes and quality of life between the urban and rural populations”. According to Evelyn Hollands22, Director at HKTDC, by 2012 the middle class in China will be 18% of its population. This represents 243 million people, the world’s largest. Another interesting variable can be added here, the per capita annual disposable income of urban households. The evolution in absolute figures has been from 1,374 in 1989 to 21,810, which represents a sixteen-fold increase in the 23-year period (see Figure 25). This means that in urban areas, the disposable income of households has grown enormously, with the resulting increase in demand for all sorts of consumer goods. This represents a great market opportunity for Chinese products and for foreign ones as well. As will be explained in Chapter 5, Chinese people spend a lot of time shopping and they value very highly all Western goods, in particular European and American brands.
21
ECLAC. The People’s Republic of China and Latin America and the Caribbean. United Nations. 2012 (p.18). 22
HONG KONG TRADE CENTRE. www.hktdc.com. Evelyne Hollands, Director at Hong Kong Trade Centre, a
service organization whose mission is to create opportunities for Hong Kong companies by promoting
trade in goods and services, while connecting the world's small and medium-sized enterprises through
Hong Kong's business platform. June 2012.

Figure 21. Per capita annual disposable income of urban households. RMB
Source: Bloomberg
But the figures do not stop here. Going back to Gertz and Kharas, “by 2021 there could be more than 2 billion Asians in middle-class households. In China alone, there could be over 670 million middle-class consumers, compared with the 150 million today”23.
7.2. Other variables to consider: an aging population and the real estate market The situation of the labour market is becoming a source of concern for the authorities, since it is feared that the decline in the supply of labour, due to structural reasons, will cause a rapid increase in wages that limits the economy’s competitiveness. As a result, issues such as the retirement age or the flexibility of the "one-child" policy have recently been opened to public debate. Currently, the retirement age is established between 50 and 55 years for women and 60 years for men. According to the latest ICEX country report24, 170 million people exceed this age, which represents 12.8% of the population. Chinese people are aging and that is a fact to be taken into account for many aspects: in terms of labour, in terms of market needs, market size, consumption habits and future trends, just to mention a few. On the other hand, some studies indicate that the "one-child" policy has prevented 400 million births since its implementation 30 years ago. These discussions are being carried out in parallel with a changing economic model and the recognized need of the Government to increase wages. In the long term, the Government expects the Chinese
23
GEOFFREY G.; HOMI K. The new global middle class: a cross over from west to east. Wolfensohn Center for Development, Brookings, 2010. 24
ICEX, Country Guide: China. www.icex.es. May 2012.
0
5000
10000
15000
20000
25000
19
89
19
90
19
91
19
92
19
93
19
94
19
95
19
96
19
97
19
98
19
99
20
00
20
01
20
02
20
03
20
04
20
05
20
06
20
07
20
08
20
09
20
10
20
11

economy to rise several steps in the value chain and becomes less intensive in labour, in order to rebalance the labour market. The big doubt is if this path can be taken progressively and maintain social stability. Regarding the real estate market, a year ago, in 2010, public measurements began to be implemented to limit speculation, cut the demand for housing and reduce the medium and long-term risks to the financial sector. In the cities of Shanghai and Chonqing, a new tax on the purchase of a second home has been implemented. The new tax levies between 0.4 and 1.2 on the price of the purchase of second homes whose value is higher than the average market price. Another measure to prevent speculation has been the increase in the down payment requirement for a mortgage: it used to be a minimum of 50% of the total cost of the housing but has been increased to 60%. Beijing has limited access to purchasing a second home by residents and a first home by non-residents, measures that are considered even more restrictive than those implemented in Shanghai and Chonqing. In general, these types of restrictive initiatives in the housing market are being implemented in the majority of first, second and third-tier cities. At the same time, the Government has established an objective to build 10 million subsidized flats during 2011, an increase of 74% compared to 2010. In conclusion, the latest data confirm that the price of housing continues to rise, but is doing so at a slower rate than before the adoption of the measures explained above.
8. Towards the future: China’s some important challenges China’s weight in the global economy is so strong that the world is constantly watching it. In fact, “no previous industrial revolution has been so widely watched”25. Its rapid development has caused some long-term problems that are a challenge for the Chinese Government, and that should be tackled before long. These challenges could be the object of a study on its own. We will only outline very briefly the main ones that pose a bigger threat on the Chinese authorities:
8.1. Social inequality China’s economic model is unfair on its people. For instance, the system denies equal access to public services for rural migrants who work in the cities but are registered in the villages. Following the article we have just mentioned, “arbitrary land laws allow local governments to cheat farmers, by underpaying them for the agricultural plots they buy off them for development. And many of the proceeds end up in the pockets of officials”. Rural health care is another example of unfairness: one family doctor for every 22,000 people. If ordinary Chinese knew that their health would be looked after in their old age, they would save more and spend more. Household consumption accounts for little more than a third of the economy.
25
THE ECONOMIST. How strong is China’s economy? May 26th 2012 (p.13).

Unequal distribution of the income will result in increasing social tension and contradictions. Also, migratory movements will accentuate the conflict: “The movement of some 200 million farmers (and their 200–300 million dependents) to cities over the next two decades will create tremendous social pressures unless the Chinese Government provides them with greater rights and an effective social safety net.”26
8.2. Corruption China suffers from widespread corruption. For 2010, China was ranked 78 of 179 countries in Transparency International's Corruption Perceptions Index, ranking slightly above fellow BRIC nations India and Russia, but below Brazil and most developed countries. It is nearly impossible to conduct significant business in China without participating in corruption. In 2009, according to internal Party reports, there were 106,000 officials found guilty of corruption, an increase of 2.5 percent on the previous year. The number of officials caught embezzling more than one million Yuan (US$146,000) went up by 19% over the year. With no independent oversight such as NGOs or free media, corruption has flourished. These efforts are punctuated by an occasional harsh prison term for major offenders, or even executions. But rules and values for business and bureaucratic conduct are in flux, sometimes contradictory, and “deeply politicized.” In many countries systematic anti-corruption measures include independent trade and professional associations, which help limit corruption by promulgating codes of ethics and imposing quick penalties, watchdog groups such as NGOs, and a free media. In China, these measures do not exist as a result of the CCP’s means of rule. “Money-worship, irresponsibility and corruption have spread to all strata of society. Scandals have implicated local Party leaders in numerous cases, such as the illegal sale of blood in Henan and the use of slave labour in Shaanxi brick kilns with protection from local authorities”27.
8.3. Environmental problems Although progress has been made in some areas, China is struggling to harmonize economic development and environmental protection. As a result of the fast economic growth, some fundamental dilemmas are arising. The gross domestic product is continuously increasing, but the natural resources on which the economic development relies have been heavily exploited or even overexploited. This leads to acute environmental problems and a tenser relationship between humans and nature. One of the fields where problems are more severe is water shortage and pollution:
China is one of the 13 countries in the world with the most limited water resources. The available per capita volume of water is ~2200 m3, only 25% of the
26
PERKINS, D. The Challenges of China’s growth. American Enterprise Institute for Public Policy Research (AEI). Feb. 2007. 27
ALLÈS, E. Class struggles in China today: towards a third Chinese Revolution? Article from CHINA
PERSPECTIVES. Special Feature China’s WTO Decade. (p. 3-4).

world average. In addition, water resources are unevenly distributed in China. About 44% of the population lives in the north but has access to only ~15% of the water resources. More than 60% of the 669 cities (of population >0.1 million) in China have problems with water shortages, and the situation in 110 of those is categorized as serious. In addition, more than 24 million rural people have insufficient drinking-water supplies.28
In the “bicycle kingdom”, the bicycle is being replaced by cars, with the resulting problems of traffic jams and pollution. There is a popular expression that says “I’d rather cry in the back of your BMW than laugh on the back of your bicycle”, which shows that people in the cities want to leave behind poverty, underdevelopment and everything that resembles rural China. This is quite the opposite of the trend we see in developed countries, where the use of bicycle is on the increase and where local authorities are trying to promote its use. Natural resources are being depleted and growth is unsustainable: “Rapid urbanization has taken place in China ever since the economic development and socioeconomic changes of the 1980s. Approximately 40% of the population now lives in cities, compared with ~20% in 1980. The current annual urbanization rate is 1%, which means that 13 million people move into cities every year.”29 Rapid urbanization has created huge pressure on the maintenance of agriculture. To achieve a higher production rate from the remaining smaller arable land, China has become the largest user of fertilizers and second of pesticides. Domestic waste, air pollution, acid rain and ecological degradation are just a few of the subjects combined in a multi-faceted environmental problem. The impacts include damage to human health, social conflicts and economic losses. Strategically, China is trying to establish an integrative decision-making mechanism for harmonizing the environment and economic development. The country is changing its mode of economic development and is trying to promote a sustainable economy that includes resource recycling. This provides a favourable socio-political environment for making policies and laws oriented toward sustainable development.
8.4. The real Estate bubble Examples of waste are abundant, such as the ghost city of Ordos, in China’s northern part, to decadent resorts on its southern shores. Some reports suggest that middle-class bankruptcies will rise dramatically: “buyers have aggressively bought multiple properties with every penny of free cash flow. All that is needed for a wave of bankruptcies is further interest rate rises (targeting inflation) that result in a blip down in house prices just as mortgage payments rise”. This has happened already in many major cities in Asia. It would seem that government leaders are totally out of touch with the true cost of urban housing.
28
FU B. J. AND OTHER AUTHORS. Environmental problems and challenges in China. Chinese Academy of Sciences. Environmental Science & Technology. November 2007. 29
FU B. J. AND OTHER AUTHORS. Op. cit.

Restrictions on buying second homes will put a stop to speculation. Increasing interest rates will also contribute to lessen the demand for housing. However, China’s banks are highly liquid. Their deposits are higher than their loans and they keep a fifth of their deposits in reserve at the central bank. That gives the banks enough scope to handle potential troublesome loans. In fact, China´s saving rate, at 51%, is one of the world’s highest.
8.5. The financial system - banking system According to the World Bank’s Institute of Policy Studies, the Chinese financial system is underdeveloped and in urgent need of a structural reform: “the underdevelopment of the domestic financial system may help explain the high rates of both savings and investment in China”30. It adds that a better financial system could stimulate consumption (by providing more credit to families and businesses) and reduce the need for maintaining high savings levels (either for precautionary motives or to finance future consumption). Savers are starting to be tired of the miserable returns on their deposits and demand alternatives: according to The Economist (26th May 2012) “some are also finding ways to take their money out of the country, contributing to unusual downward pressure on the currency. China´s bank deposits grew at their slowest rate on record in the year to April (2012)”. The reform of the Chinese banking system has progressed favourably since 2002, supported by capital injections, tax exemptions, introduction of foreign funds and other key government policy changes. The major Chinese commercial banks have improved their capital and asset structures remarkably: in fact, four of the five biggest commercial banks have changed their ownership structure and have been successfully listed on stock exchanges. Medium-sized nationwide commercial banks have also aggressively developed their business, although a few of them are still facing serious deterioration in their balance sheets. “However, these changes do not mean that the business foundation of Chinese banks has become completely stable. Compared to the world’s leading banks, major Chinese commercial banks are still very weak in terms of asset quality, business profitability, and the diversification of their services. More broadly, the Chinese banking system is not yet functioning as an efficient financial intermediary due to the banks’ own weaknesses and to environmental problems such as the loose credit culture and widespread disregard for the rule of law”31. There is also a problem of credit risk management: risk in China has not been valued historically as in Western financial organizations. As the system tries to incorporate risk management, an obstacle has been found: there is not enough historical data to perform an accurate assessment. In addition, banks find themselves in a transition period towards
30
WINTERS L. A.; YUSUF, S. Dancing with giants. Institute of Policy Studies, PPS. The World Bank.
Washington DC, 2007 (p. 117). 31
OKAZAKI, K. Banking system reform in China. The challenges of moving toward a market-oriented economy. Rand Corporation. www.rand.org/pubs. December 2011.

price formation of financial assets. It is the Central Bank who fixes the prices nowadays. In the future, as the market becomes liberalized, commercial banks will have to learn how to price their products. Although China´s somewhat repressed banking system is inefficient, it is also resilient because most of its vast pool of depositors have nowhere else to go. So far, there is not a serious fear that the Chinese banking system will fall into serious panic in the near future. According to Zhang Jiuquin32, researcher at the International Trade Academy in China’s Commerce Ministry, Chinese institutions are still limited in their size, relatively weak in their capacity to foresee market risks and have mostly an obsolete mentality. Regarding their employees, he considers they do not yet have the required professional level, legal consciousness, skills, or experience compared to staff in more developed countries. Therefore, in his opinion, the financial sector in China requires some deep reforms and more openness: “In the future, the Chinese Government will need to continue adopting flexible and innovating systems to learn from how direct investment is being done abroad (…) The key to evaluate the reform and the financial development resides in the quality of the service that it supplies to the economy in general. To develop the financial sector, it must not just think of itself, but must have a global vision. This is the main lesson to be learned after the financial crisis of 2008”.
8.6. Inefficiency China´s fast growth has been possible thanks to the shift of workers from low productivity agriculture to industry. But maintaining economic growth will be difficult with the drag of inefficient state-owned enterprises (SOEs), which benefit from implicit subsidies, sheltered markets and politically encouraged loans. China is going to have to learn how to use its capital more wisely. While agriculture is organized in a fragile structure, industry presents an irrational one. According to C.H. Dahlman33, China will have to build solid foundations for a knowledge-based economy and it “must raise the technological level of the economy by:
diffusing new technologies actively throughout the country; improving the research and development system; exploiting global knowledge”.
The country's sustainable agricultural development has encountered many obstacles. These include, as mentioned above, agricultural water-use shortage; loss of cultivated land; inappropriate usage of fertilizers and pesticides; and environmental degradation.
32
ZHANG J. La situación del sector financiero en China: balances y perspectivas. Magazine CHINA HOY. 10 años de China en la OMC. Balance para el país y para el mundo. Vol. LII num. 12 December 2011. (p. 25-28). 33
DAHLMAN, C. H.; AUBERT J. E. China and the knowledge economy. Seizing the 21st
century. WBI Development Studies. World Bank Institute. Washington, 2002.

Finally, the composition of the energy mix is highly inefficient in China. The amount of energy required to obtain their production is far too high compared to developed countries. In the long run, if it is not optimized, this will cause a loss of competitiveness.
8.7. The labour Market The decreasing labour market is becoming a source of worry for the authorities: with less people willing to work, salaries will continue to grow, diminishing competitiveness in the Chinese economy. A debate has started concerning how to raise retirement age (nowadays the retirement age is between 50 and 55 for women and 60 for men). Also there is an increasing call to make the one-child-policy more flexible. All these measures are aimed at trying to incorporate more workers into the labour market in a bid to stop salaries increasing so much. Only a few years ago, in 2003, the IMF’s main concern was to absorb surplus labour:
A more market-oriented labour market has emerged in China in the past twenty years with growing importance of the urban private sector, as state-owned enterprises have downsized. Despite the progress on reforms, a sizable surplus of labour still exists in the rural sector and state-owned enterprises. The main challenge facing China’s labour market in coming years is to absorb the surplus labour into quality jobs while adjusting to World Trade Organization (WTO) accession34.
Nowadays the worry is exactly the opposite: the labour market is decreasing alarmingly. Policy should focus on encouraging private sector development while reducing barriers to labour mobility, improving worker skills, upgrading job search services, and strengthening the social safety net.
8.8. Inflation With a heated economy, inflation poses a major risk. In 2011 there was a deep concern about the inflation menace, but one year later there are symptoms of it being controlled by the Government. Efforts have been made to control this inflation, with considerable success. If we analyse the figures (see Figure 26 below), it is quite clear that after the sharp increase to 6.5% in 2007, it has been kept under control over the last two years, even though it is still above 4%.
34
BROOKS, R.; TAO, R. China’s labor market Performance and challenges. IMF Working Paper. Nov. 2003.
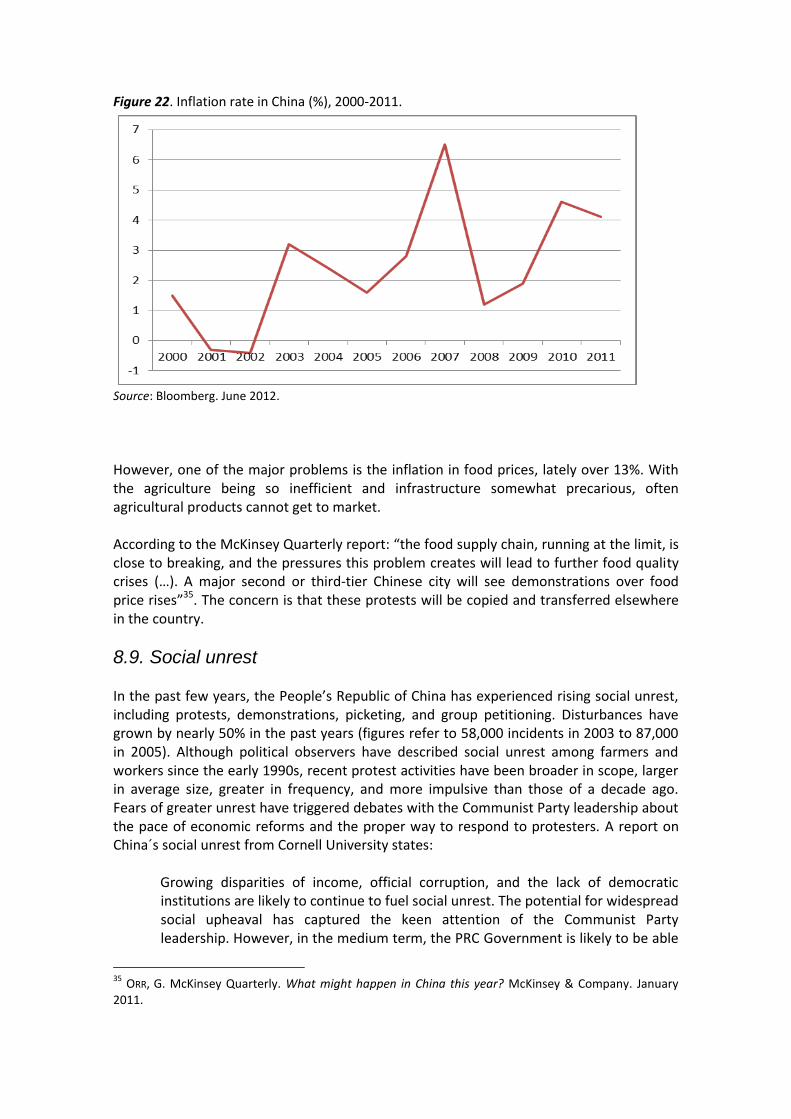
Figure 22. Inflation rate in China (%), 2000-2011.
Source: Bloomberg. June 2012. However, one of the major problems is the inflation in food prices, lately over 13%. With the agriculture being so inefficient and infrastructure somewhat precarious, often agricultural products cannot get to market. According to the McKinsey Quarterly report: “the food supply chain, running at the limit, is close to breaking, and the pressures this problem creates will lead to further food quality crises (…). A major second or third-tier Chinese city will see demonstrations over food price rises”35. The concern is that these protests will be copied and transferred elsewhere in the country.
8.9. Social unrest In the past few years, the People’s Republic of China has experienced rising social unrest, including protests, demonstrations, picketing, and group petitioning. Disturbances have grown by nearly 50% in the past years (figures refer to 58,000 incidents in 2003 to 87,000 in 2005). Although political observers have described social unrest among farmers and workers since the early 1990s, recent protest activities have been broader in scope, larger in average size, greater in frequency, and more impulsive than those of a decade ago. Fears of greater unrest have triggered debates with the Communist Party leadership about the pace of economic reforms and the proper way to respond to protesters. A report on China´s social unrest from Cornell University states:
Growing disparities of income, official corruption, and the lack of democratic institutions are likely to continue to fuel social unrest. The potential for widespread social upheaval has captured the keen attention of the Communist Party leadership. However, in the medium term, the PRC Government is likely to be able
35
ORR, G. McKinsey Quarterly. What might happen in China this year? McKinsey & Company. January 2011.

to contain protests through policies that mix accommodation and violence and that promote continued economic growth. Most analysts do not expect social unrest to evolve into a national political movement unless linkages among disaffected groups strengthen and other social groups, particularly the middle class, intellectuals, and students, join the protests as well.36
According to this report, the most active protest groups are:
In first place, farmers, due to increasing unemployment, rising taxes, stagnant income, land confiscation as a result of local project development, declining social services and environmental degradation;
In second place, workers in SOEs protesting against layoffs, unpaid wages, low pensions, government corruption and the arrest of labour activists. These protests are considered more “dangerous” since the protesters are more educated, have access to social networks, other activists, intellectuals and the media so that they can replicate the protests easily;
In third place, workers in Special Economic Zones (SEZ). Until recently, workers in China’s light or labour intensive industrial sector, located in the coastal Special Economic Zones, generally avoided labour activism. Mostly young, female migrants from poor rural areas, these workers possessed a strong desire to earn money to send home and little understanding of labour rights, and were reluctant to complain despite enduring appallingly abusive conditions. Many factories in the SEZs are owned and managed by investors from Hong Kong, Taiwan, and South Korea, who supply U.S. retailers and brands. However, lately, these workers feel they are in a stronger position to protest for higher pay and unpaid wages;
Finally, homeowners: a relatively recent social phenomenon in China is the rise
of protests involving home owners and peasants opposing eviction or the loss of farmland due to urban renewal, industrialization, and other problems related to economic development: “Many aggrieved citizens have claimed that they were not sufficiently consulted or properly compensated and have engaged in public demonstrations when their complaints were ignored by local officials. Guangzhou police estimated that in 2003 and 2004, forcible evictions constituted nearly one-fourth of protest activities in the city — becoming the largest source of social unrest”37.
8.10. Political issues
36
LUM, T. Specialist in Asian Affairs. Social unrest in China. p. 4. Congressional Research Service (CRS) Report for China. Cornell University, ILR School. May 2006 (p.4). 37
LUM, T. Op. cit. p. 12.

According to Professor Simai 38, the main challenge for China is the political future, with two major worries:
1. How to cope with increasing inequalities and social tensions. Uprisings are likely to increase.
2. How to cope with the increasing power of regional centres. Two institutions keep the country together: the Communist Party and the army. However, these two are evolving but nobody knows for certain how they will do so.
He sees a Chinese version of the Arab spring as unlikely, because in these latter countries there was a large group of unemployed youth with no hope and no family support. In China there has been employment for all so far, and the social lift works. Who wants democracy in China? The middle class is pragmatic and therefore not interested. The rural class neither. Only the intellectuals are willing, and that is not enough to start a change process. Researchers at the UN have detected certain conditions that need to be present for sustainable democracy:
highly educated population who understand problems and cannot be easily manipulated;
tolerant and enlightened political leaders;
resilient and flexible institutions;
a standard of living that creates an increasing cake that satisfies most people. Out of these, Simai considers that China only fulfils the last one: the cake is big and growing enough. However, even that condition is doubtful since China has been affected by the world crisis: because of the demand crisis in the West, plus an economy based mainly in exports, China has lost more than 14 million salaried employees, who have had to go back to their villages. The direction in which the political power will take is still uncertain and will depend on two factors: first, if the economic development continues and second, if it does, will the growth be integrative? Will the economic development favour the majority of the population? As long as the state can ensure economic growth, it retains the support of a large section of the middle class. Furthermore, to the extent that the leadership remains united and overcomes divergent interests, it will be able to control tensions in the country. However,
38
Economist. Professor at Corvinus University. Professor Simai is a member of the Hungarian Academy of Sciences. He is currently working at the Institute for World Economics of the Hungarian Academy of Sciences as a Research Professor. He is also a Professor at Corvinus University in Budapest. He is the Honorary President of the World Federation of United Nations Associations.

revolutions cannot be always be predicted. As Mao Zedong said, “a single spark can start a prairie fire”. Municipal elections have taken place in China since 1978 and have been continued on a trial basis since then. Even though it is an incomplete system and cannot be compared to Western democracies, it may well be a start. The elections could be consolidating Communist rule, as CCP leaders may claim some legitimacy through these elections. At the same time, village elections are also preparing—perhaps—the way for a democratic transition. People are becoming familiarized with democratic procedures and with representative institutions. All these developments suggest that the Chinese Communist Party is undergoing a significant transformation. We may be witnessing the beginning of a local-to-national model of democratization. China’s internal market as an attractive option
Following the various analyses carried out above, we can conclude that there are many combined factors that suggest a significant remarkable opportunity in terms of marketplace, as perhaps has never been witnessed before. These factors include:
1. Chinese population is growing by 6-8 million people per year in absolute figures;
2. Moreover, the migration from rural to urban areas means that 400 more people will be living in cities by 2035 (therefore one billion in total): these are people who will have access to the market and needs for products and services. This will represent, in turn, a vast potential for growth;
3. GDP grew at an annual average of 10%, from 1991 till 2008. This growth is
unprecedented and will mean the opening of many opportunities. Even though the growth has slowed down, it is not expected to halt but to experience a “soft landing”;
4. GDP per capita is still low by Western standards, but is also growing significantly by
more than 10% per year; 5. The population, especially the urban population, is growing and people in the cities
are working, with unemployment around 4%. Disposable income in urban areas has multiplied sixteen times in the last 23 years. Retail sales are booming, and have experienced an annual growth rate of 11% on average in the last 22 years;
6. Although income inequality is still acute in China, there is a powerful emerging
middle class. If today it is estimated to be just over 150 million people, their number is growing incessantly: while some experts estimate the number of people considered middle class will reach 243 million people by 2012, others sustain that it will reach 670 million by 2021.

Figure 5. Summary of the attractiveness of the Chinese market
Source: author
Growing urban population
GDP and GDP per capita on the rise
Low unemployment
Expanding middle class Ascending per capita
annual disposable
income
Public and private consumption booming
Vast scope for opportunities in the
market
=