Salivary Fluoride Concentration Following the Application of ...
Upload
independentCategory
view
1download
0
Seediscussions,stats,andauthorprofilesforthispublicationat:http://www.researchgate.net/publication/261802374
Fluorideremovalfromaqueoussolutionbydirectcontactmembranedistillation:Theoreticalandexperimentalstudies
ARTICLEinENVIRONMENTALSCIENCEANDPOLLUTIONRESEARCH·APRIL2014
ImpactFactor:2.83·DOI:10.1007/s11356-014-2858-z·Source:PubMed
CITATIONS
9
READS
109
4AUTHORS:
AliBoubakri
CentredeRechercheetdesTechnologiesd…
11PUBLICATIONS54CITATIONS
SEEPROFILE
RajaBouchrit
CentredeRechercheetdesTechnologiesd…
2PUBLICATIONS9CITATIONS
SEEPROFILE
HafianeAmor
CentredeRechercheetdesTechnologiesd…
37PUBLICATIONS458CITATIONS
SEEPROFILE
SalahAlTaharBouguecha
KingAbdulazizUniversity
21PUBLICATIONS306CITATIONS
SEEPROFILE
Allin-textreferencesunderlinedinbluearelinkedtopublicationsonResearchGate,
lettingyouaccessandreadthemimmediately.
Availablefrom:AliBoubakri
Retrievedon:10November2015

RESEARCH ARTICLE
Fluoride removal from aqueous solution by direct contactmembrane distillation: theoretical and experimental studies
Ali Boubakri & Raja Bouchrit & Amor Hafiane &
Salah Al-Tahar Bouguecha
Received: 24 January 2014 /Accepted: 31 March 2014# Springer-Verlag Berlin Heidelberg 2014
Abstract Direct contact membrane distillation (DCMD) pro-cess using polyvinylidene fluoride (PVDF) membrane wasused for fluoride removal from aqueous solution. This studyhas been carried out on heat and mass transfer analyses inDCMD. The dusty-gas model was used to analyze the masstransfer mechanism and to calculate the permeate flux. Theheat transfer is analyzed based on energy balance, and thedifferent layers are considered as a series of thermal resis-tances. Mass transfer analysis showed that the transitionKnudsen-molecular diffusion is the dominant mechanismto describe the transport of water vapor through thepores of the PVDF membrane. The most significantoperating parameter is the feed temperature. The perme-ate increases sensitively with feed temperature and ve-locity, and it shows insignificant change with feed saltsconcentration. Heat transfer analysis showed the conduc-tion through the matrix of the membrane presents themajor part of available energy. The increasing feedtemperature leads to increase thermal efficiency (TE)and decrease temperature polarization coefficient(TPC). The experimental results are in good agreementwith theoretical values. Therefore, it is suggested towork at high feed temperature, which will benefit boththe thermal efficiency and permeate flux. The
experimental results proved that DCMD process is ableto produce almost fluoride-free water suitable for manybeneficial uses.
Keywords Fluoride removal . Direct contact membranedistillation . PVDFmembrane . Diffusionmodel . Mass andheat transfer
Nomenclatureaw Water activityBm Membrane distillation coefficient (kg/m2 s Pa)Dh Hydraulic diameter (m)dp Pore diameter (m)Dw Diffusion coefficient for water (m2/s)hf Heat transfer coefficient of the heat transfer boundary
layer in feed side (W/m2 K)hm Heat transfer coefficient of membrane (W/m2 K)hp Heat transfer coefficient of the heat transfer boundary
layer in permeate side (W/m2 K)ΔHv Latent heat of vaporization (J/kg)J Permeate flux (kg/m2 h)k Thermal conductivity (W/m K)kB Boltzman constant (1.380 10−23 J/K)Kn Knudsen numberM Molecular weight (kg/kmol)Nu Nusselt numberP Total pressure inside the pore (Pa)Pmf Vapor pressure at the feed side of the membrane
surface (Pa)Pmp Vapor pressure at the permeate side of the membrane
surface (Pa)Pr Prandtl numberQ Heat flux (W/m2)R Gas constant (8.314 J/mol K)Re Reynolds numberT Temperature (K)
Responsible editor: Bingcai Pan
A. Boubakri (*) : R. Bouchrit :A. HafianeLaboratory of Wastewater Treatment, Center of Researches andWater Technologies, PB 273, 8020 Soliman, Tunisiae-mail: [email protected]
S. Al-Tahar BouguechaDepartment of Mechanical Engineering, Faculty of Engineer, KingAbdul-Aziz University, PB 80204, Jeddah 21589, Kingdom of SaudiArabiae-mail: [email protected]
Environ Sci Pollut ResDOI 10.1007/s11356-014-2858-z
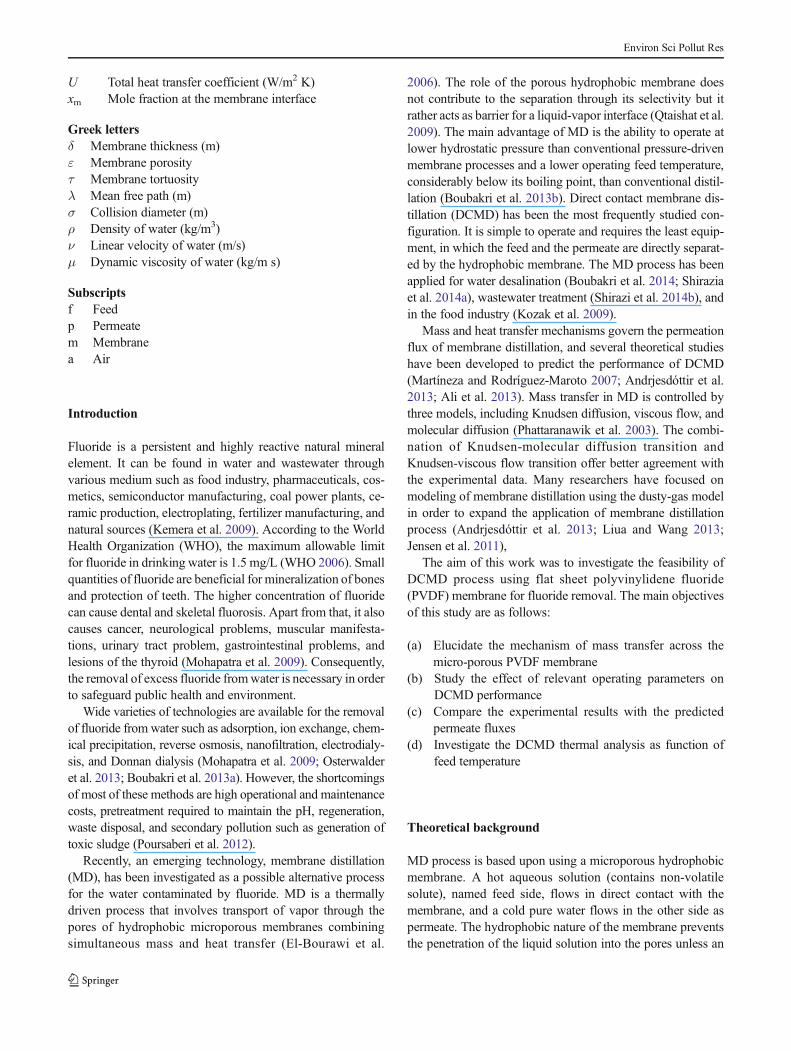
U Total heat transfer coefficient (W/m2 K)xm Mole fraction at the membrane interface
Greek lettersδ Membrane thickness (m)ε Membrane porosityτ Membrane tortuosityλ Mean free path (m)σ Collision diameter (m)ρ Density of water (kg/m3)ν Linear velocity of water (m/s)μ Dynamic viscosity of water (kg/m s)
Subscriptsf Feedp Permeatem Membranea Air
Introduction
Fluoride is a persistent and highly reactive natural mineralelement. It can be found in water and wastewater throughvarious medium such as food industry, pharmaceuticals, cos-metics, semiconductor manufacturing, coal power plants, ce-ramic production, electroplating, fertilizer manufacturing, andnatural sources (Kemera et al. 2009). According to the WorldHealth Organization (WHO), the maximum allowable limitfor fluoride in drinking water is 1.5 mg/L (WHO 2006). Smallquantities of fluoride are beneficial for mineralization of bonesand protection of teeth. The higher concentration of fluoridecan cause dental and skeletal fluorosis. Apart from that, it alsocauses cancer, neurological problems, muscular manifesta-tions, urinary tract problem, gastrointestinal problems, andlesions of the thyroid (Mohapatra et al. 2009). Consequently,the removal of excess fluoride fromwater is necessary in orderto safeguard public health and environment.
Wide varieties of technologies are available for the removalof fluoride from water such as adsorption, ion exchange, chem-ical precipitation, reverse osmosis, nanofiltration, electrodialy-sis, and Donnan dialysis (Mohapatra et al. 2009; Osterwalderet al. 2013; Boubakri et al. 2013a). However, the shortcomingsof most of these methods are high operational and maintenancecosts, pretreatment required to maintain the pH, regeneration,waste disposal, and secondary pollution such as generation oftoxic sludge (Poursaberi et al. 2012).
Recently, an emerging technology, membrane distillation(MD), has been investigated as a possible alternative processfor the water contaminated by fluoride. MD is a thermallydriven process that involves transport of vapor through thepores of hydrophobic microporous membranes combiningsimultaneous mass and heat transfer (El-Bourawi et al.
2006). The role of the porous hydrophobic membrane doesnot contribute to the separation through its selectivity but itrather acts as barrier for a liquid-vapor interface (Qtaishat et al.2009). The main advantage of MD is the ability to operate atlower hydrostatic pressure than conventional pressure-drivenmembrane processes and a lower operating feed temperature,considerably below its boiling point, than conventional distil-lation (Boubakri et al. 2013b). Direct contact membrane dis-tillation (DCMD) has been the most frequently studied con-figuration. It is simple to operate and requires the least equip-ment, in which the feed and the permeate are directly separat-ed by the hydrophobic membrane. The MD process has beenapplied for water desalination (Boubakri et al. 2014; Shiraziaet al. 2014a), wastewater treatment (Shirazi et al. 2014b), andin the food industry (Kozak et al. 2009).
Mass and heat transfer mechanisms govern the permeationflux of membrane distillation, and several theoretical studieshave been developed to predict the performance of DCMD(Martíneza and Rodríguez-Maroto 2007; Andrjesdóttir et al.2013; Ali et al. 2013). Mass transfer in MD is controlled bythree models, including Knudsen diffusion, viscous flow, andmolecular diffusion (Phattaranawik et al. 2003). The combi-nation of Knudsen-molecular diffusion transition andKnudsen-viscous flow transition offer better agreement withthe experimental data. Many researchers have focused onmodeling of membrane distillation using the dusty-gas modelin order to expand the application of membrane distillationprocess (Andrjesdóttir et al. 2013; Liua and Wang 2013;Jensen et al. 2011),
The aim of this work was to investigate the feasibility ofDCMD process using flat sheet polyvinylidene fluoride(PVDF) membrane for fluoride removal. The main objectivesof this study are as follows:
(a) Elucidate the mechanism of mass transfer across themicro-porous PVDF membrane
(b) Study the effect of relevant operating parameters onDCMD performance
(c) Compare the experimental results with the predictedpermeate fluxes
(d) Investigate the DCMD thermal analysis as function offeed temperature
Theoretical background
MD process is based upon using a microporous hydrophobicmembrane. A hot aqueous solution (contains non-volatilesolute), named feed side, flows in direct contact with themembrane, and a cold pure water flows in the other side aspermeate. The hydrophobic nature of the membrane preventsthe penetration of the liquid solution into the pores unless an
Environ Sci Pollut Res

applied pressure exceeds the liquid-entry pressure (LEP). Asresult, liquid/vapor interfaces are formed at the membranepores feed side. The temperature and composition differencesacross the solution layers adjusted to the membrane create avapor-pressure difference, the driving force in DCMD pro-cess, since both mechanisms occur simultaneously across themembrane including mass and heat transfer.
Mass transfer
The mass flux (J) of water vapor diffusing through the dryporous membrane is proportional to the vapor pressure differ-ence across the membrane, and can be expressed by Darcy’slaw for laminar flow in packed beds (Pal and Manna 2010):
J ¼ Bm Pmf −Pmp
� � ð1Þ
where Bm is the membrane coefficient and Pmf and Pmp are thevapor pressures at the feed and permeate vapor/liquid inter-face, respectively. Pmf and Pmp at the temperature Tmf and Tmp,respectively, are related to the activity of the solution by:
Pmi ¼ awiP0mi i ¼ f ; p ð2Þ
Where awi is the water activity and Pmi0 is pure water vapor
and can be evaluated by using Antoine equation (Bouguechaet al. 2002):
P0mi ¼ exp 23:273 −
3841; 2
Tmi�45
� �ð3Þ
Pmi0 in Pascal and Tmi in Kelvin.The vapor pressure composition can be estimated using
Raoult’s law, which can be written in case of dilute solutions:
Pmi ¼ 1−xmið ÞP0mi ð4Þ
where xmi is the mole fraction of the solute at the membraneinterface.
According to the dusty-gas model, the diffusive masstransfer through microporous membrane can be divided intothree mechanisms, including Knudsen diffusion, viscous flow,and molecular or transition mechanism (Andrjesdóttir et al.2013; Alkhudhiri et al. 2012; Kurdian et al. 2013). Thesemodels relate the transport with collisions between moleculesand/or molecules with membrane. To judge the dominatingmechanism of the mass transfer in the pores, the Kn number isused:
Kn ¼ λdp
ð5Þ
where dp is the membrane pore diameter and λ is the meanfree path of transported molecules which can be calculated asfollows (Phattaranawik et al. 2003):
λ ¼ kBTm
π σw�σa2
� �2 � P �ffiffiffiffiffiffiffiffiffiffiffiffiffiffiffiffiffiffiffiffiffiffiffi
1þ Mw
M a
� �s ð6Þ
where kB is the Boltzman constant, P is the total pressureinside the pore, Tm is the average membrane temperature, σwand σa are the collision diameters for water vapor and air,respectively, and Mw and Ma are the molecular weights ofwater and air, respectively.
Table 1 shows the relative equations dominating the masstransfer mechanism based on Kn in a gas mixture with auniform pressure throughout the system (Geancoplis1993).where dp, ε, τ, and δ are the pore diameter, membraneporosity, pore tortuosity, and membrane thickness, respective-ly, Pa is the air pressure, and D is the water diffusion. Thevalue of PDw (Pa m2/s) for water-air can be calculated fromthe following expression (Phattaranawik et al. 2003; Qtaishatet al. 2008):
PDw ¼ 1:895 10�5T 2:072 ð10Þ
The value of the tortuosity factor can be estimated by thefollowing relationship (Iversen et al. 1997):
τ ¼ 2� εð Þ2ε
ð11Þ
Heat transfer
Heat transport mechanisms in DCMD are mainly three:Heat flux from the hot stream to the hot membrane surface,
referred as temperature polarization in the hot side:
Q f ¼ h f T f � T fmð Þ ð12Þ
Heat flux thought the membrane, which is the sum ofconductive flux through membrane material and pores andlatent heat flux related to the diffusion of the vapor:
Qm ¼ Qv þ Qc ¼ JΔHv þ hm T fm � Tpm
� � ð13Þ
Table 1 Mass transfer mechanism and membrane coefficient as functionof Knudsen number
Kn<0.01 0.01<Kn<1 Kn>1
Moleculardiffusion
Knudsen-molecular diffusion Knudsen diffusionTransition mechanism
BDm ¼ ε PDw Mw
τδPaRT
(Eq. 7)BCm ¼ 3τδ
ε dp
ffiffiffiffiffiffiffiffiπRT8 Mw
qþ τδPaRT
ε PDw Mw
h i−1
(Eq. 8)
BKm ¼ ε dp
3 τ δ
ffiffiffiffiffiffiffi8MwπRT
q
(Eq. 9)
Environ Sci Pollut Res

Heat flux from the cold membrane surface to the coldstream, often referred as temperature polarization in the coldside:
Qp ¼ hp Tp � Tpm
� � ð14Þ
where Tf, Tfm, Tp, and Tpm are the bulk feed, surface feed, bulkpermeate, and surface permeate temperature, respectively;ΔHv is the latent heat of vaporization, and hf, hp, and hm arethe heat transfer coefficients for feed side, permeate side, andmembrane, respectively.
hm ¼ kmδ
ð15Þ
where km is the thermal conductivity of the porous membrane,which calculated from the following equation:
km ¼ εkg þ 1εð Þkp ð16Þ
where kg and kp are the thermal conductivities of air andmembrane material, respectively.
Under steady state conditions, the overall heat transfer fluxthrough the whole DCMD system is given by:
Q ¼ Q f ¼ Qp ¼ Qm ð17Þ
h f T f � T fmð Þ ¼ hp Tp � Tpm
� � ¼ JΔHv þ kmδ
T fm � Tpm
� � ð18Þ
Q ¼ U T f � Tp
� � ð19Þ
where U is the overall heat transfer coefficient for DCMDprocess.
Through energy balance, feed and permeate side tempera-ture at the membrane surface can be defined as follows:
T fm ¼kmδ
T f þ h f
hp
� �T f þ h fT f � JΔHv
�
kmδ
þ h f þ kmδ
� h f
hp
ð20Þ
Tpm ¼kmδ
T p þ hph f
� �T p þ hpT p � JΔHv
�
kmδ
þ hp þ kmδ
� hph f
ð21Þ
The boundary layers heat transfer coefficients hp and hf canbe estimated by the Nusselt number:
hi ¼ Nuik iDh
; i ¼ f ; p ð22Þ
Where Dh is the hydraulic diameter and Nu is the Nusseltnumber which correlated with Reynolds number (Re) and thePrandtl number (Pr).
In the case of laminar flow, the heat transfer coefficient maybe described from a number of ways; the wide adoptionequation is (Gryta et al. 1997):
Nu ¼ 0:13 Re0:64Pr0:38 Re < 2100 ð23Þ
Re ¼ ρνDh
μð24Þ
Pr ¼ Cpμ
kmð25Þ
where ρ, ν, μ, and Cp are the density, the average velocity, theviscosity, and specific heat, respectively.
In the case of turbulent flow, the well-known equation usedis (Lawson and Lloyd 1997):
Nu ¼ 0:023 Re0:8Pr0:33 Re > 2100 ð26Þ
The temperature at the membrane surface is lower than thecorresponding value at the bulk phase. This temperature gra-dient is due to the heat flux through the liquid layer, which isneeded to provide the required heat for evaporation at themembrane interface (Lovineh et al. 2013). This phenomenonis called temperature polarization, which described by a coef-ficient (TPC) that is defined as:
TPC ¼ T fm � Tpm
T f � Tpð27Þ
Thermal efficiency (TE) can be defined as the ratio be-tween the heat transported with the vapors to the total heattransported across the membrane:
TE ¼ JΔHv
JΔHv þ kmδ
� �T fm � Tpm
� � � 100 ð28Þ
Materials and methods
PVDF membrane
A commercially available hydrophobic micro-porouspolyvinylidene fluoride (PVDF) membrane is used in ourDCMD pilot scale. Table 2 shows The principal characteris-tics of used membrane as specified by manufacturers andcompleted by others analysis techniques including atomicforce microscopy (AFM), differential scanning calorimetry(DSC), and contact angle measurement, which present inFig. 1.
AFM image can give an idea on the surface roughness,which is an important property of polymeric membranes(Shirazi et al. 2013). The roughness parameters, obtained with
Environ Sci Pollut Res

AFM analysis software, characterize the surface of studiedPVDF membrane, and the values of the average roughnessand maximum roughness were 31.73 and 145.99 nm, respec-tively. The thermal properties of polymer samples can berealized by DSC analysis. DSC thermogram gives the enthal-py of melting, and the melting point of PVDFmembrane were24.275 J/g and 163.49 °C, respectively. The contact angle of avalue of 127.3 gives information on the hydrophobic characterof the PVDF membrane surface.
DCMD setup
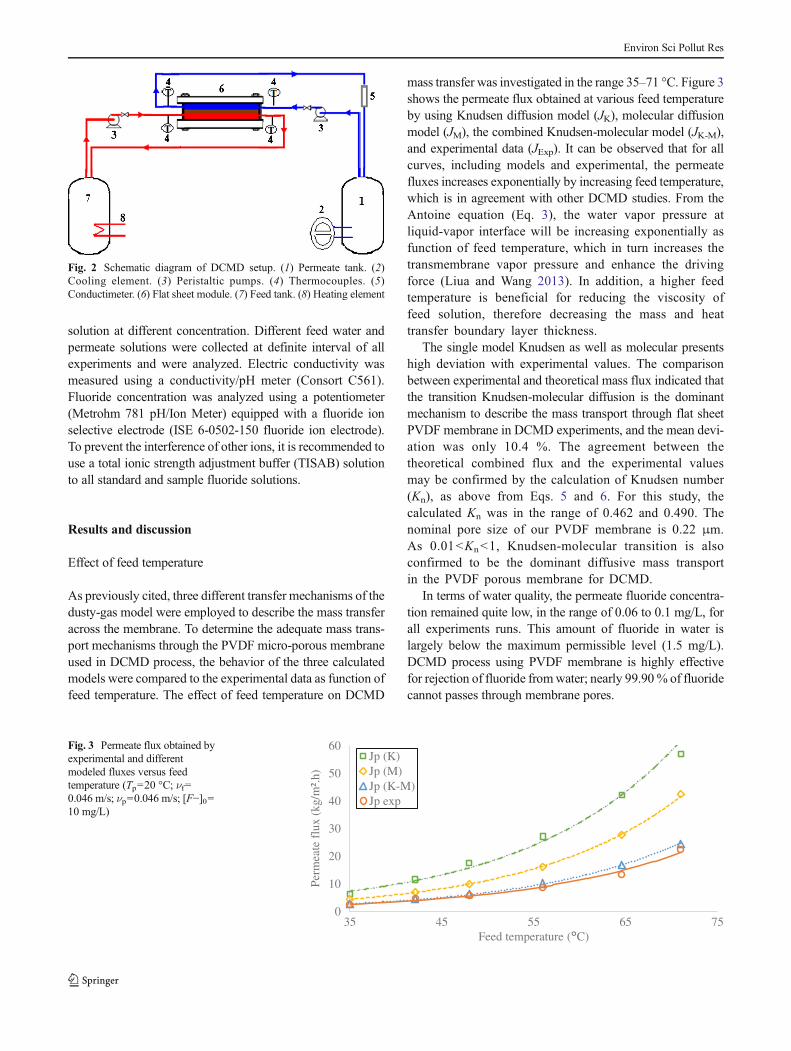
The schematic diagram of the laboratory scale flat sheetDCMD process designed, built, and tested for this studyis shown in Fig. 2. The installation consisted of twothermostatic cycles (feed and permeate) that were con-nected to a membrane module which was made byPlexiglas. The feed compartment, which connected to aheating system, is maintained at a hot temperature, andthe permeate compartment, which connected to acooling system, is maintained at a cold temperature.The hydrophobic membrane was placed between thetwo compartments with spacer material. The effectivemembrane area is 0.0032 m2. The bulk feed and per-meate temperatures were measured inside each compart-ment by a digital thermocouples with an accuracy of±0.1 °C. Two peristaltic pumps are used to circulate thehot feed and the cold permeate in batch mode operation.The ionic strength of feed and permeate solution weremeasured using a conductivity meter.
The permeate flux (kg/m2 h) was calculated by the follow-ing equation:
J ¼ Δm
S Δtð29Þ
where Δm is the masse of permeate (kg), S is the effectivemembrane area (m2), and Δt is the sampling time (h).
Reagent and analysis methods
Chemicals agent are at high purity grade and were supplied byFluka. Synthetic fluoride solutions were prepared by addingappropriate amounts of sodium fluoride (NaF) to deionizedwater. Stock solution (1,000 mg/L) was prepared by dissolv-ing 2.21 g anhydrous sodium fluoride to 1 L of deionizedwater. The desired fluoride solution was prepared by dilutingthe stock fluoride solution. Polypropylene containers havebeen used to store the samples during experiments.
The effect of feed ionic strength on fluoride removal andDCMD permeate flux was determined by using NaCl salt
Table 2 Characteristics of PVDF membrane
Material Polyvinylidene fluoride
Contact angle 127.3°
Nominal pore size 0.22 μm
Thickness 125 μm
Porosity 62 %
Thermal conductivity 0.041 W/m K
Melting point 163.49 °C
Melting enthalpy 24.275 J/g
Manufacturer GVHP, Millipore
Liquid entry pressure 204 kPa
Effective membrane area 3.2 10−3 m2
Fig. 1 a AFM, b DSC, and c contact angle measurement of the PVDFcommercial membrane
Environ Sci Pollut Res
solution at different concentration. Different feed water andpermeate solutions were collected at definite interval of allexperiments and were analyzed. Electric conductivity wasmeasured using a conductivity/pH meter (Consort C561).Fluoride concentration was analyzed using a potentiometer(Metrohm 781 pH/Ion Meter) equipped with a fluoride ionselective electrode (ISE 6-0502-150 fluoride ion electrode).To prevent the interference of other ions, it is recommended touse a total ionic strength adjustment buffer (TISAB) solutionto all standard and sample fluoride solutions.
Results and discussion
Effect of feed temperature
As previously cited, three different transfer mechanisms of thedusty-gas model were employed to describe the mass transferacross the membrane. To determine the adequate mass trans-port mechanisms through the PVDF micro-porous membraneused in DCMD process, the behavior of the three calculatedmodels were compared to the experimental data as function offeed temperature. The effect of feed temperature on DCMD
mass transfer was investigated in the range 35–71 °C. Figure 3shows the permeate flux obtained at various feed temperatureby using Knudsen diffusion model (JK), molecular diffusionmodel (JM), the combined Knudsen-molecular model (JK-M),and experimental data (JExp). It can be observed that for allcurves, including models and experimental, the permeatefluxes increases exponentially by increasing feed temperature,which is in agreement with other DCMD studies. From theAntoine equation (Eq. 3), the water vapor pressure atliquid-vapor interface will be increasing exponentially asfunction of feed temperature, which in turn increases thetransmembrane vapor pressure and enhance the drivingforce (Liua and Wang 2013). In addition, a higher feedtemperature is beneficial for reducing the viscosity offeed solution, therefore decreasing the mass and heattransfer boundary layer thickness.
The single model Knudsen as well as molecular presentshigh deviation with experimental values. The comparisonbetween experimental and theoretical mass flux indicated thatthe transition Knudsen-molecular diffusion is the dominantmechanism to describe the mass transport through flat sheetPVDF membrane in DCMD experiments, and the mean devi-ation was only 10.4 %. The agreement between thetheoretical combined flux and the experimental valuesmay be confirmed by the calculation of Knudsen number(Kn), as above from Eqs. 5 and 6. For this study, thecalculated Kn was in the range of 0.462 and 0.490. Thenominal pore size of our PVDF membrane is 0.22 μm.As 0.01<Kn<1, Knudsen-molecular transition is alsoconfirmed to be the dominant diffusive mass transportin the PVDF porous membrane for DCMD.
In terms of water quality, the permeate fluoride concentra-tion remained quite low, in the range of 0.06 to 0.1 mg/L, forall experiments runs. This amount of fluoride in water islargely below the maximum permissible level (1.5 mg/L).DCMD process using PVDF membrane is highly effectivefor rejection of fluoride fromwater; nearly 99.90% of fluoridecannot passes through membrane pores.
Fig. 2 Schematic diagram of DCMD setup. (1) Permeate tank. (2)Cooling element. (3) Peristaltic pumps. (4) Thermocouples. (5)Conductimeter. (6) Flat sheet module. (7) Feed tank. (8) Heating element
0
10
20
30
40
50
60
35 45 55 65 75
Perm
eate
flu
x (k
g/m
².h)
Feed temperature ( C)
Jp (K)Jp (M)Jp (K-M)Jp exp
Fig. 3 Permeate flux obtained byexperimental and differentmodeled fluxes versus feedtemperature (Tp=20 °C; νf=0.046 m/s; νp=0.046 m/s; [F−]0=10 mg/L)
Environ Sci Pollut Res
Effect of feed velocity
Figure 4 presents the performance of DCMD process usingflat sheet PVDF membrane as function of feed velocity. Tofind the influence of feed hydrodynamic condition on perme-ate flux, the feed velocity was varied from 0.007 to 0.057 m/s.It can be seen that increasing feed velocity lead toenhanced the permeate flux from 4.38 to 10 kg/m2 h,and seems to reach an asymptotic trends for high feedvelocity. The reason is that increasing feed velocity leadto increasing Reynolds number, which will decrease themass and heat transfer boundary layer thickness andincrease their mass and heat transfer coefficient (Paland Manna 2010). Therefore, the vapor mass and heatwas easier to transfer through micro-porous membrane,and consequently, a higher DCMD flux can beachieved. However, the asymptotic trends can be attrib-uted to that at higher feed velocity; the conduction heatloss across the membrane was enhanced. The drivingforce will be reduced, and then leading to a slowincrease of permeate flux. In several other studies, theincreasing trend of DCMD permeate flux to approach anasymptotic value was observed (Hwang et al. 2011;Peng et al. 2013).
In all experiments performed at various feed velocity whenusing a feed water with 10 mg/L of fluoride, the permeatefluoride concentration was below 0.14 mg/L, which indicatesa fluoride rejection more than 98.6 %.
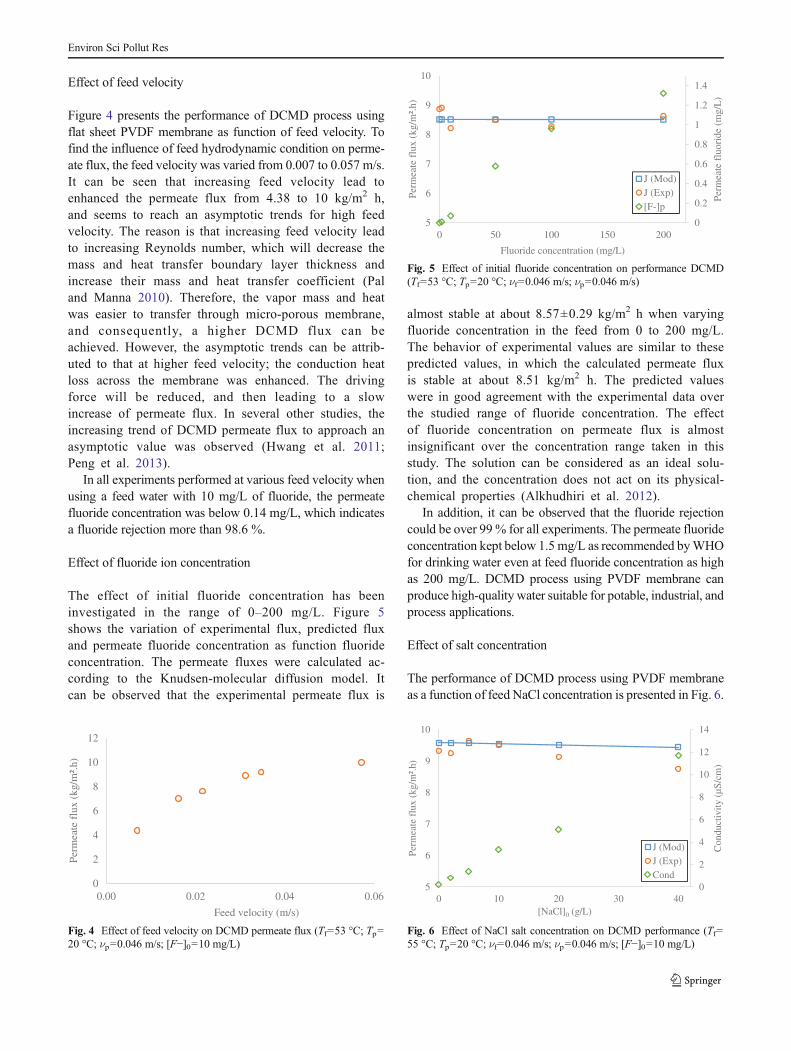
Effect of fluoride ion concentration
The effect of initial fluoride concentration has beeninvestigated in the range of 0–200 mg/L. Figure 5shows the variation of experimental flux, predicted fluxand permeate fluoride concentration as function fluorideconcentration. The permeate fluxes were calculated ac-cording to the Knudsen-molecular diffusion model. Itcan be observed that the experimental permeate flux is
almost stable at about 8.57±0.29 kg/m2 h when varyingfluoride concentration in the feed from 0 to 200 mg/L.The behavior of experimental values are similar to thesepredicted values, in which the calculated permeate fluxis stable at about 8.51 kg/m2 h. The predicted valueswere in good agreement with the experimental data overthe studied range of fluoride concentration. The effectof fluoride concentration on permeate flux is almostinsignificant over the concentration range taken in thisstudy. The solution can be considered as an ideal solu-tion, and the concentration does not act on its physical-chemical properties (Alkhudhiri et al. 2012).
In addition, it can be observed that the fluoride rejectioncould be over 99 % for all experiments. The permeate fluorideconcentration kept below 1.5 mg/L as recommended byWHOfor drinking water even at feed fluoride concentration as highas 200 mg/L. DCMD process using PVDF membrane canproduce high-quality water suitable for potable, industrial, andprocess applications.
Effect of salt concentration
The performance of DCMD process using PVDF membraneas a function of feed NaCl concentration is presented in Fig. 6.
0
2
4
6
8
10
12
0.00 0.02 0.04 0.06
Perm
eate
flu
x (k
g/m
².h)
Feed velocity (m/s)
Fig. 4 Effect of feed velocity on DCMD permeate flux (Tf=53 °C; Tp=20 °C; νp=0.046 m/s; [F−]0=10 mg/L)
0
0.2
0.4
0.6
0.8
1
1.2
1.4
5
6
7
8
9
10
0 50 100 150 200
Perm
eate
flu
orid
e (m
g/L
)
Perm
eate
flu
x (k
g/m
².h)
Fluoride concentration (mg/L)
J (Mod)J (Exp)[F-]p
Fig. 5 Effect of initial fluoride concentration on performance DCMD(Tf=53 °C; Tp=20 °C; νf=0.046 m/s; νp=0.046 m/s)
0
2
4
6
8
10
12
14
5
6
7
8
9
10
0 10 20 30 40
Con
duct
ivity
(µ S
/cm
)
Perm
eate
flu
x (k
g/m
².h)
[NaCl]0 (g/L)
J (Mod)J (Exp)Cond
Fig. 6 Effect of NaCl salt concentration on DCMD performance (Tf=55 °C; Tp=20 °C; νf=0.046 m/s; νp=0.046 m/s; [F−]0=10 mg/L)
Environ Sci Pollut Res

It can be seen that experimental permeate flux decreasedslightly in the range 9.65–8.75 kg/m2 h when increasingNaCl concentration from 0 to 40 g/L. In the same rangeof salt concentration, the predicted flux diminished from9.58 to 9.43 kg/m2 h, which present a percentage re-duction of 1.56 %. Therefore, experimental data showeda good agreement with predicted values calculated fromthe Knudsen-molecular diffusion model. The reductionof permeate flux can be attributed to the fact that theaddition of salt reduces the partial vapor pressure offeed water according to Raoult’s law, Eq. 4, and asconsequence reduces the driving force. In addition, thepresence of NaCl salt can form an additional boundarylayer adjacent to the membrane surface (Kurdian et al.2013). This concentration of boundary layer accompa-nied by the temperature of boundary layer reduces thedriving force more.
For all DCMD experimental runs, the permeate conductiv-ity increases almost linearly as function feed NaCl concentra-tion and was kept below 12 μS/cm for a high salt concentra-tion of 40 g/L. The presence of NaCl salt in feed watercontaining 10 mg/L of fluoride cannot change the per-meate fluoride concentration which still around0.06 mg/L. Even at high salt concentration, DCMDprocess can produce a high quality of water with lowcontent of fluoride and low electrical conductivity.
DCMD thermal analysis
The effect of various operating conditions on DCMDprocess using PVDF membrane to remove fluoride re-vealed that feed temperature is the most important pa-rameters that improved the DCMD performance by en-hancing the permeate flux. Therefore, it is important tostudy the thermal analysis of DCMD process as func-tion of feed temperature, including thermal efficiency(TE) and temperature polarization coefficient (TPC).
As stated previously, the TPC and TE were calculatedusing Eqs. 27 and 28, respectively.
Figure 7 shows the effect of feed temperature onthermal efficiency and temperature polarization coeffi-cient. It can be observed that TE increases from 30.38to 69.19 % when increasing feed temperature from 35to 71 °C. At high temperature, the energy used forvaporization of water is greater than the energy lossby conduction through the PVDF membrane. The ener-gy used for vaporization increases at higher feed tem-perature due to their proportionality to permeate flux,but the conductive heat transfer is not directly linked tofeed temperature (Winter et al. 2013). Therefore, it issuggested to work at high feed temperature, which willbenefit both the thermal efficiency and permeate flux. Inthe same Fig. 7, it can be seen that TPC decreases from0.746 to 0.372 when increasing feed temperature from35 to 71 °C. This trend can be explained by the factthat increasing feed temperature leads to increase theenergy consumed by vaporization (Kurdian et al.2013). Then, TPC will be lower and their effect willbe more significant.
Conclusion
The performance of DCMD process using PVDF membranefor the removal of fluoride from aqueous solution has beeninvestigated in this work. Experimental studies have beencarried out, and the DCMD performance, such as permeateflux, product water quality, and thermal efficiency, were ana-lyzed under different conditions. The most relevant results areas follows:
& The mass transfer, based on the combined Knudsen-molecular diffusion model, presents a good agreementwith the experimental permeate flux.
& The feed temperature has the highest influence on DCMDperformance. At high feed temperature of 71 °C, a max-imum permeate flux of 22.38 kg/m2 h was obtained withthermal efficiency of 69.19 %, but the temperature polar-ization coefficient diminished to 0.372.
& The effect of feed velocity, in the range of 0.007–0.057 m/s, has a positive effect on DCMD permeate flux but couldbe reached an asymptotic trend for high feed velocity.
& Feed salt concentration have a slight negative effect onpermeate flux, and feed fluoride concentration have insig-nificant effect in the studied range.
& In the studied range of feed fluoride concentration, thepermeate fluoride concentration was largely below1.5 mg/L. Therefore, the DCMD process using PVDFmembrane can produce high-quality water suitable forpotable, industrial, and process applications.
0.2
0.3
0.4
0.5
0.6
0.7
0.8
20
30
40
50
60
70
80
32 42 52 62 72
Tem
pera
ture
pol
ariz
atio
n co
effi
cien
t
The
rmal
eff
icie
ncy
(%)
Feed temperature ( C)
TE (%)
TPC
Fig. 7 Effect of feed temperature on TE and TPC (Tp=20 °C; νf=0.046 m/s; νp=0.046 m/s; [F−]0=10 mg/L)
Environ Sci Pollut Res

Acknowledgments The authors wish to thank Nesrine Hmidi for theirhelp and constant support during this work.
References
Ali A, Macedonio F, Drioli E, Aljlil S, Alharbi OA (2013) Experimentaland theoretical evaluation of temperature polarization phenomenonin direct contact membrane distillation. Chem Eng Res Des 91:1966–1977
Alkhudhiri A, Drwish N, Hilal N (2012) Membrane distillation: a com-prehensive review. Desalination 287:2–18
Andrjesdóttir O, Ong CL, Nabavi M, Paredes S, Khalil ASG, Michel B,Poulikakos D (2013) An experimentally optimized model for heatand mass transfer in direct contact membrane distillation. Int J HeatMass Transfer 66:855–867
Boubakri A, HafianeA, Bouguecha SAT (2013a) Application of responsesurface methodology for modeling and optimization of membranedistillation desalination process. J Ind Eng Chem. doi:10.1016/j.jiec.2013.11.060
Boubakri A, Helali N, Tlili M, Ben Amor M (2013b) Fluoride removalfrom diluted solutions byDonnan dialysis using full factorial design.Korean J Chem Eng. doi:10.1007/s11814-013-0263-9
Boubakri A, Hafiane A, Bouguecha SAT (2014) Direct contact mem-brane distillation: capability to desalt raw water. Arab J Chem. doi:10.1016/j.arabjc.2014.02.010
Bouguecha S, Chouikh R, Dhahbi M (2002) Numerical study of thecoupled heat and mass transfer in membrane distillation.Desalination 152:245–252
El-Bourawi MS, Ding Z,Ma R, Khayet M (2006) A framework for betterunderstanding membrane distillation separation process. J MembrSci 285:4–29
Geancoplis C (1993) Transport processes and unit operations, 3rd edn.Prentice-Hall, Englewood Cliffs
Gryta M, Tomaszewska M, Morawski AW (1997) Membrane distillationwith laminar flow. Sep Purif Technol 11:93–101
Hwang HJ, He K, Gray S, Zhang J, Moon IS (2011) Directcontact membrane distillation (DCMD): experimental studyon the commercial PTFE membrane and modeling. JMembr Sci 371:90–98
Iversen SB, Bhatia VK, Dam-Johansen K, Jonsson G (1997)Characterization of microporous membranes for use in membranecontactors. J Membr Sci 130:205–217
Jensen MB, Christensen KV, Andrésen R, Søtoft LF, Norddahl B (2011)A model of direct contact membrane distillation for black currantjuice. J Food Eng 107:405–414
Kemera B, Ozdesa D, Gundogdua A, Buluta VN, Durana C, Soylak M(2009) Removal of fluoride ions from aqueous solution by wastemud. J Hazard Mater 168:888–894
Kozak A, Bekassy-Molnar E, Vatai G (2009) Production of black-currantjuice concentrate by using membrane distillation. Desalination 241:309–314
Kurdian AR, Bahreini M, Montazeri GH, Sadeghi S (2013) Modeling ofDCMD process: flux prediction of sodium chloride solutions.Desalination 323:75–82
Lawson K, Lloyd D (1997) Review membrane distillation. J Membr Sci124:1–25
Liua H, Wang J (2013) Treatment of radioactive wastewater using directcontact membrane distillation. J Hazard Mater 261:307–315
Lovineh SG, Asghari M, Rajaei B (2013) Numerical simulation andtheoretical study on simultaneous effects of operating parametersin vacuum membrane distillation. Desalination 314:59–66
Martíneza L, Rodríguez-Maroto JM (2007) Effects of membrane andmodule design improvements on flux in direct contact membranedistillation. Desalination 205:97–103
MohapatraM, Anand S,Mishra BK, Dion EG, Singh P (2009) Review offluoride removal from drinking water. J Environ Manag 91:67–77
Osterwalder L, Johnson C, Yang H, Johnston RB (2013) Multi-criteriaassessment of community-based fluoride-removal technologies forrural Ethiopia. Sci Total Environ. doi:10.1016/j.scitotenv.2013.10.072
Pal P, Manna AK (2010) Removal of arsenic from contaminated ground-water by solar-driven membrane distillation using three differentcommercial membranes. Water Res 44:5750–5760
Peng Y, Dong Y, Fan H, Chen P, Li Z, Jiang Q (2013) Preparation ofpolysulfone membranes via vapor-induced phase separation andsimulation of direct-contact membrane distillation by measuringhydrophobic layer thickness. Desalination 316:53–66
Phattaranawik J, Jiraratananon R, Fane AG (2003) Effect of pore sizedistribution and air flux on mass transport in direct contact mem-brane distillation. J Membr Sci 215:75–85
Poursaberi, HassanisadiM, Torkestani K, ZareM (2012) Development ofzirconium (IV)-metalloporphyrin grafted Fe3O4 nanoparticles forefficient fluoride removal. Chem Eng J 189–190:117–125
Qtaishat M, Matsuura T, Kruczek B, Khayet M (2008) Heat and masstransfer analysis in direct contact membrane distillation.Desalination 219:272–292
Qtaishat M, Khayet M, Matsuura T (2009) Guidelines for preparation ofhigher flux hydrophobic/hydrophilic composite membranes formembrane distillation. J Membr Sci 329:193–200
Shirazi MMA, Kargari, Bazgir S, Tabatabaei M, Shirazi MJA, AbdullahaMS, Matsuura T, Ismail AF (2013) Characterization of electrospunpolystyrene membrane for treatment of biodiesel’s water-washingeffluent using atomic force microscopy. Desalination 329:1–8
Shirazi MMA, Kargari A, Tabatabaei M (2014a) Evaluation of commer-cial PTFE membranes in desalination by direct contact membranedistillation. Chem Eng Process 76:16–25
Shirazi MMA, Kargari A, Tabatabaei M, Ismail AF, Matsuura T (2014b)Concentration of glycerol from dilute glycerol wastewater usingsweeping gas membrane distillation. Chem Eng Process 78:58–66
Winter D, Koschikowski J, Düver D, Hertel P, Beuscher U (2013)Evaluation of MD process performance: effect of backing structuresand membrane properties under different operating conditions.Desalination 323:120–133
World Health Organization (2006) Guidelines for drinking water quality,3rd edn, vol 1
Environ Sci Pollut Res
Copyright © 2022 FDOKUMEN