Fluctuating synaptic conductances recreate in vivo-like activity in neocortical neurons
12
FLUCTUATING SYNAPTIC CONDUCTANCES RECREATE IN VIVO-LIKE ACTIVITY IN NEOCORTICAL NEURONS A. DESTEXHE, a * M. RUDOLPH, a J.-M. FELLOUS b and T. J. SEJNOWSKI b;c a Unite ¤ de Neurosciences Inte ¤gratives et Computationnelles, CNRS, UPR-2191, Avenue de la Terrasse, Ba “timent 33, 91198 Gif-sur-Yvette, France b Howard Hughes Medical Institute and the Salk Institute, 10010 North Torrey Pines Road, La Jolla, CA 92037, USA c Department of Biology, University of California at San Diego, La Jolla, CA 92093, USA AbstractöTo investigate the basis of the £uctuating activity present in neocortical neurons in vivo, we have combined computational models with whole-cell recordings using the dynamic-clamp technique. A simpli¢ed ‘point-conductance’ model was used to represent the currents generated by thousands of stochastically releasing synapses. Synaptic activity was represented by two independent fast glutamatergic and GABAergic conductances described by stochastic random- walk processes. An advantage of this approach is that all the model parameters can be determined from voltage-clamp experiments. We show that the point-conductance model captures the amplitude and spectral characteristics of the synaptic conductances during background activity. To determine if it can recreate in vivo-like activity, we injected this point-conductance model into a single-compartment model, or in rat prefrontal cortical neurons in vitro using dynamic clamp. This procedure successfully recreated several properties of neurons intracellularly recorded in vivo, such as a depolarized membrane potential, the presence of high-amplitude membrane potential £uctuations, a low-input resistance and irregular spontaneous ¢ring activity. In addition, the point-conductance model could simulate the enhancement of responsiveness due to background activity. We conclude that many of the characteristics of cortical neurons in vivo can be explained by fast glutamatergic and GABAergic conductances varying stochastically. ß 2001 IBRO. Published by Elsevier Science Ltd. All rights reserved. Key words: computational models, pyramidal neurons, dynamic clamp, synaptic bombardment, high-conductance states, CV. Synaptic background activity is invariably present in intracellular recordings of neocortical neurons in vivo, and modeling studies have suggested that it may have important consequences on the integrative properties of these neurons (Barrett, 1975; Holmes and Woody, 1989; Bernander et al., 1991; Destexhe and Pare ¤, 1999). Back- ground activity is maximal during the active states of the brain, when cortical neurons ¢re spontaneously at rela- tively high rates (5^20 Hz in awake animals; see Hubel, 1959; Evarts, 1964; Steriade, 1978; Matsumura et al., 1988; Steriade et al., 2001). This highly £uctuating activ- ity was simulated in vitro by injecting noisy current wave- forms (Mainen and Sejnowski, 1995; Stevens and Zador, 1998; Fellous et al., 2001). This approach, however, does not take into account the conductance due to back- ground activity. Given that the neocortex is characterized by a very dense synaptic connectivity (5000^60 000 excitatory syn- apses per neuron; Cragg, 1967; DeFelipe and Farin ‹ as, 1992), these cells could potentially experience considerable amounts of synaptic conductances during periods of intense network activity. A recent estimation of the elec- trophysiological parameters of background activity in cat parietal cortex in vivo (Pare ¤ et al., 1998) provided evidence for a ‘high-conductance’ state (see also Borg- Graham et al., 1998). By combining intracellular recordings in vivo with computational models of camera lucida-recon- structed pyramidal neurons, it was estimated that synaptic background activity accounts for up to 80% of the total conductance of the cell (Destexhe and Pare ¤, 1999). This high-conductance state of cortical neurons could be repro- duced by assuming that glutamatergic and GABAergic synapses release at relatively high rates (about 1 Hz and 5 Hz, respectively; see Destexhe and Pare ¤, 1999). This type of detailed biophysical model reproduces membrane properties typical of cortical neurons in vivo, such as a lowered input resistance, a depolarized mem- brane potential (V m ) around 365 mV and persistent V m £uctuations. However, such models require relatively large computational resources to simulate the amount of synaptic inputs and their location in dendrites, and cannot be used for applications in real time, such as recreating in vivo-like membrane activity in cortical neu- rons in vitro. To address this problem, we introduce here a new model of background activity. We used a para- 13 *Corresponding author. Tel. : +33-1-69-82-34-35 ; fax : +33-1-69-82- 34-27. E-mail address : [email protected] (A. Destexhe). Abbreviations : ACSF, arti¢cial cerebrospinal £uid; AMPA, K-amino-3-hydroxy-5-methyl-4-isoxazole propionate ; CV, coe/- cient of variation ; EGTA, ethylene glycol-bis(2-aminoethyl- ether)-N,N,NP,NP-tetraacetic acid ; HEPES, N-(2-hydroxyethyl)- piperazine-NP-(2-ethanesulfonic acid) ; ISI, interspike interval ; NMDA, N-methyl-D-aspartate ; TTX, tetrodotoxin ; V m , mem- brane potential. NSC 5185 25-10-01 www.neuroscience-ibro.com Neuroscience Vol. 107, No. 1, pp. 13^24, 2001 ß 2001 IBRO. Published by Elsevier Science Ltd Printed in Great Britain. All rights reserved PII:S0306-4522(01)00344-X 0306-4522 / 01 $20.00+0.00
Transcript of Fluctuating synaptic conductances recreate in vivo-like activity in neocortical neurons

FLUCTUATING SYNAPTIC CONDUCTANCES RECREATE IN VIVO-LIKEACTIVITY IN NEOCORTICAL NEURONS
A. DESTEXHE,a* M. RUDOLPH,a J.-M. FELLOUSb and T. J. SEJNOWSKIb;c
aUnite de Neurosciences Integratives et Computationnelles, CNRS, UPR-2191, Avenue de la Terrasse, Baªtiment 33,91198 Gif-sur-Yvette, France
bHoward Hughes Medical Institute and the Salk Institute, 10010 North Torrey Pines Road, La Jolla, CA 92037, USAcDepartment of Biology, University of California at San Diego, La Jolla, CA 92093, USA
AbstractöTo investigate the basis of the £uctuating activity present in neocortical neurons in vivo, we have combinedcomputational models with whole-cell recordings using the dynamic-clamp technique. A simpli¢ed `point-conductance'model was used to represent the currents generated by thousands of stochastically releasing synapses. Synaptic activitywas represented by two independent fast glutamatergic and GABAergic conductances described by stochastic random-walk processes. An advantage of this approach is that all the model parameters can be determined from voltage-clampexperiments. We show that the point-conductance model captures the amplitude and spectral characteristics of thesynaptic conductances during background activity. To determine if it can recreate in vivo-like activity, we injected thispoint-conductance model into a single-compartment model, or in rat prefrontal cortical neurons in vitro using dynamicclamp. This procedure successfully recreated several properties of neurons intracellularly recorded in vivo, such as adepolarized membrane potential, the presence of high-amplitude membrane potential £uctuations, a low-input resistanceand irregular spontaneous ¢ring activity. In addition, the point-conductance model could simulate the enhancement ofresponsiveness due to background activity.
We conclude that many of the characteristics of cortical neurons in vivo can be explained by fast glutamatergic andGABAergic conductances varying stochastically. ß 2001 IBRO. Published by Elsevier Science Ltd. All rights reserved.
Key words: computational models, pyramidal neurons, dynamic clamp, synaptic bombardment, high-conductance states, CV.
Synaptic background activity is invariably present inintracellular recordings of neocortical neurons in vivo,and modeling studies have suggested that it may haveimportant consequences on the integrative properties ofthese neurons (Barrett, 1975; Holmes and Woody, 1989;Bernander et al., 1991; Destexhe and Pare, 1999). Back-ground activity is maximal during the active states of thebrain, when cortical neurons ¢re spontaneously at rela-tively high rates (5^20 Hz in awake animals; see Hubel,1959; Evarts, 1964; Steriade, 1978; Matsumura et al.,1988; Steriade et al., 2001). This highly £uctuating activ-ity was simulated in vitro by injecting noisy current wave-forms (Mainen and Sejnowski, 1995; Stevens and Zador,1998; Fellous et al., 2001). This approach, however, doesnot take into account the conductance due to back-ground activity.
Given that the neocortex is characterized by a very
dense synaptic connectivity (5000^60 000 excitatory syn-apses per neuron; Cragg, 1967; DeFelipe and Farin¬as,1992), these cells could potentially experience considerableamounts of synaptic conductances during periods ofintense network activity. A recent estimation of the elec-trophysiological parameters of background activity in catparietal cortex in vivo (Pare et al., 1998) provided evidencefor a `high-conductance' state (see also Borg- Graham etal., 1998). By combining intracellular recordings in vivowith computational models of camera lucida-recon-structed pyramidal neurons, it was estimated that synapticbackground activity accounts for up to 80% of the totalconductance of the cell (Destexhe and Pare, 1999). Thishigh-conductance state of cortical neurons could be repro-duced by assuming that glutamatergic and GABAergicsynapses release at relatively high rates (about 1 Hz and5 Hz, respectively; see Destexhe and Pare, 1999).
This type of detailed biophysical model reproducesmembrane properties typical of cortical neurons in vivo,such as a lowered input resistance, a depolarized mem-brane potential (Vm) around 365 mV and persistent Vm
£uctuations. However, such models require relativelylarge computational resources to simulate the amountof synaptic inputs and their location in dendrites, andcannot be used for applications in real time, such asrecreating in vivo-like membrane activity in cortical neu-rons in vitro. To address this problem, we introduce herea new model of background activity. We used a para-
13
*Corresponding author. Tel. : +33-1-69-82-34-35; fax: +33-1-69-82-34-27.E-mail address: [email protected] (A. Destexhe).Abbreviations: ACSF, arti¢cial cerebrospinal £uid; AMPA,
K-amino-3-hydroxy-5-methyl-4-isoxazole propionate; CV, coe¤-cient of variation; EGTA, ethylene glycol-bis(2-aminoethyl-ether)-N,N,NP,NP-tetraacetic acid; HEPES, N-(2-hydroxyethyl)-piperazine-NP-(2-ethanesulfonic acid) ; ISI, interspike interval;NMDA, N-methyl-D-aspartate ; TTX, tetrodotoxin; Vm, mem-brane potential.
NSC 5185 25-10-01
www.neuroscience-ibro.com
Neuroscience Vol. 107, No. 1, pp. 13^24, 2001ß 2001 IBRO. Published by Elsevier Science Ltd
Printed in Great Britain. All rights reservedPII: S 0 3 0 6 - 4 5 2 2 ( 0 1 ) 0 0 3 4 4 - X 0306-4522 / 01 $20.00+0.00

digm which could in principle be applied experimentally,and which consists in representing background activityby a stochastic point-conductance model that can be ¢tto voltage-clamp data. We show how to obtain the opti-mal parameters of this point-conductance model, and useit to recreate in vivo-like activity in a single-compartmentmodel of cortical neurons and in dynamic clamp in vitro.Parts of these results have appeared in two conferenceabstracts (Destexhe and Rudolph, 2000; Fellous et al.,2000).
EXPERIMENTAL PROCEDURES
Detailed biophysical models
Computational models were based on morphologically recon-
structed neocortical pyramidal cells from cat parietal cortex (onefrom layer II^III, two from layer V and one from layer VI),which were obtained from two previous studies (Douglas et al.,1991; Contreras et al., 1997). The cell primarily used here isdepicted in Fig. 1 (top). The passive properties were adjustedby matching the model to intracellular recordings obtained inthe absence of synaptic activity (Destexhe and Pare, 1999). Volt-age-dependent conductances were inserted in the soma, den-drites and axon and were described by Hodgkin and Huxley(1952) type models. Low densities of Na� currents were usedin the soma and dendrites (30^120 pS/Wm2), and densities were10 times higher in the axon (Destexhe and Pare, 1999).
To simulate synaptic inputs, pyramidal cells were divided intodi¡erent regions (soma, perisomatic dendrites, main dendrites,axon initial segment) and the density of glutamatergic K-amino-3-hydroxy-5-methyl-4-isoxazole propionate (AMPA) andGABAergic (GABAA) synapses in each region was estimatedfrom morphological studies (see White, 1989; DeFelipe andFarin¬as, 1992). The number of synapses per 100 Wm2 of mem-brane were: 10^20 (GABAA, soma and perisomatic dendrites),
Fig. 1. Properties of neocortical neurons in the presence of background activity simulated using a detailed biophysical model.(Top) A layer VI pyramidal neuron reconstructed and incorporated in simulations. (A) Membrane potential in the presenceof background activity (A1) and at rest (A2). Background activity was simulated by random release events described byweakly correlated Poisson processes of average releasing frequency of 1 Hz and 5 Hz for excitatory and inhibitory synapses,respectively (Destexhe and Pare, 1999). (B) E¡ect on input resistance. A hyperpolarizing pulse of 30.1 nA was injected at365 mV in both cases (average of 100 pulses in B1). The presence of background activity (B1) was responsible for about¢ve-fold decrease in input resistance compared to rest (B2). (C) Membrane potential distribution in the presence (C1) and in
the absence (C2) of background activity.
NSC 5185 25-10-01
A. Destexhe et al.14

40^80 (GABAA, axon initial segment), 8^12 (GABAA, den-drites) and 55^65 (AMPA, dendrites), leading to a total of16 563 glutamatergic and 3376 GABAergic synapses for thelayer VI cell shown in Fig. 1.
Synaptic currents were simulated by kinetic models of gluta-matergic (AMPA) and GABAergic (GABAA) receptor types(Destexhe et al., 1998). Quantal conductances were estimatedfrom matching the model to recordings of miniature synapticevents in cat parietal cortex (Pare et al., 1997), and were 1200 pSfor AMPA and 600 pS for GABAA (Destexhe and Pare, 1999).Metabotropic and N-methyl-D-aspartate (NMDA) receptorswere not included.
The release conditions corresponding to synaptic backgroundactivity were estimated based on intracellular recordings per-formed in cat parietal cortex during active states. The samecells were recorded before and after total suppression of net-work activity by microperfusion of tetrodotoxin (TTX) (Pareet al., 1998). Based on the model of miniature events, the releasefrequency at synapses was increased to match the recordingsduring active states, assuming that synaptic conductances andrelease properties are uniform and described by Poisson process-es. This led to estimates of the average release frequency duringactive states, which was about 1 Hz and 5.5 Hz for glutamater-gic and GABAergic synapses, respectively (Destexhe and Pare,1999). In addition, the model had to include a weak correlationbetween release events to match the amplitude of Vm £uctua-tions observed experimentally.
Point-conductance model
A point-conductance model was generated to approximatesynaptic background activity. The total synaptic current, Isyn,was decomposed into a sum of two independent conductances:
I syn � ge�t��V3Ee� � gi�t��V3Ei� �1�where ge(t) and gi(t) are time-dependent excitatory and inhibi-tory conductances, respectively; Ee = 0 mV and Ei =375 mV aretheir respective reversal potentials and were identical to that ofthe detailed biophysical model.
The conductances ge(t) and gi(t) were described by a one-variable stochastic process similar to the Ornstein^Uhlenbeckprocess (Uhlenbeck and Ornstein, 1930):
dge�t�dt� 3
1d e�ge�t�3ge0� �
������De
pM 1�t� �2a�
dgi�t�dt� 3
1d i�gi�t�3gi0� �
�����Di
pM 2�t� �2b�
where ge0 and gi0 are average conductances, de and di are timeconstants, De and Di are noise `di¡usion' coe¤cients, M1(t) andM2(t) are Gaussian white noise of zero mean and unit standarddeviation (see Results for values).
The numerical scheme for integration of these stochastic dif-ferential equations takes advantage of the fact that these sto-chastic processes are Gaussian, which leads to an exact updaterule (Gillespie, 1996):
ge�t� h� � ge0 � �ge�t�3ge0� exp�3h=d e� � Ae N1�0; 1� �3a�
gi�t� h� � gi0 � �gi�t�3gi0� exp�3h=d i� � Ai N2�0; 1� �3b�where N1(0,1) and N2(0,1) are normal random numbers (zeromean, unit standard deviation) and Ae, Ai are amplitude coef-¢cients given by:
Ae ������������������������������������������������De d e
213exp
32hd e
� �� �s
Ai �����������������������������������������������Di d i
213exp
32hd i
� �� �sThis update rule provides a stable integration procedure for
Gaussian stochastic models, which guarantees that the statistical
properties of the variables ge(t) and gi(t) are not dependent onthe integration step h.
Single-compartment models
The point-conductance model was inserted in a single com-partment that included voltage-dependent conductancesdescribed by Hodgkin and Huxley (1952) type models:
CmdVdt� 3gL �V3EL�3INa3IKd3IM3
1aI syn �4�
INa � �gNa m3h �V3ENa�
IKd � �gKd n4 �V3EK�
IM � �gM p �V3EK�where Cm = 1 WF/cm2 is the speci¢c membrane capacitance,gL = 0.045 mS/cm2 is the leak conductance density, andEL =380 mV is the leak reversal potential. INa is the voltage-dependent Na� current and IKd is the `delayed-recti¢er' K�current responsible for action potentials. IM is a non-inactivat-ing K� current responsible for spike frequency adaptation.These currents and their parameters were the same as in thebiophysical model (see Destexhe and Pare, 1999). a is the totalmembrane area, which was 34 636 Wm2 for the layer VI celldescribed in Fig. 1.
All simulations and analyses were performed in the NEU-RON simulation environment (Hines and Carnevale, 1997)and were run on DELL workstations (Dell Computer Corpora-tion, Round Rock, TX, USA) under the LINUX operating sys-tem.
In vitro experiments
Coronal slices of rat pre-limbic and infra-limbic areas of pre-frontal cortex were obtained from 2^4-week-old Sprague^Daw-ley rats. Rats (Harlan, Indianapolis, IL, USA) were anesthetizedwith Metofane (methoxy£urane, Mallinckrodt, Mundelien, IL,USA) and decapitated. Their brains were removed and cut into350-Wm-thick slices using standard techniques. Slices were thenplaced in a submerged chamber containing arti¢cial cerebrospi-nal £uid (ACSF, mM: NaCl, 125; NaH2CO3, 25; D-glucose, 10;KCl, 2.5; CaCl2, 2; MgCl2, 1.3; NaH2PO4, 1.25) saturated with95% O2/5% CO2, at room temperature. Whole-cell patch-clamprecordings were achieved using glass electrodes (4^10 M6) con-taining (mM: KMeSO4, 140; HEPES, 10; NaCl, 4; EGTA, 0.1;Mg-ATP, 4; Mg-GTP, 0.3; phosphocreatine 14). Patch clampwas performed under visual control at room temperature. Thevoltage was corrected for a 10-mV junction potential. In someexperiments, synaptic transmission was blocked by D-2-amino-5-phosphonovaleric acid (50 WM), 6,7-dinitroquinoxaline-2,3-dione (10 WM), and bicuculline methiodide (20 WM). All drugswere obtained from RBI-Sigma (Natick, MA, USA), freshlyprepared in ACSF and bath-applied. Data were acquired incurrent-clamp mode using an Axoclamp 2A ampli¢er (AxonInstruments, Foster City, CA, USA). We used regularly spikinglayer V pyramidal cells. A total of nine visually identi¢ed pyr-amidal cells were used in this study.
Data were acquired using a dual computer setup. The ¢rstcomputer was used for standard data acquisition and currentinjection. Programs were written using Labview 6.1 (NationalInstrument, Austin, TX, USA), and data were acquired with aPCI-16-E1 data acquisition board (National Instrument). Dataacquisition rate was either 10 or 20 kHz. The second computerwas dedicated to dynamic clamp. Programs were written usingeither a Labview RT 5.1 or a Dapview (Microstar Laboratory,Bellevue, WA, USA) front-end and a language C back-end.Dynamic clamp (Sharp et al., 1993) was implemented using aPCI-7030 board (National Instrument) at a rate of 1 kHz, or aDAP-5216a board (Microstar Laboratory) at a rate of 10 kHz.
NSC 5185 25-10-01
Point-conductance models of in vivo activity 15

Dynamic clamp was achieved by implementing a rapid (1 ms or0.1 ms) acquisition/injection loop in current-clamp mode. Datawere analyzed o¥ine using MATLAB (The Mathworks, Natick,MA, USA).
All experiments were carried in accordance with animal pro-tocols approved by the NIH.
RESULTS
We ¢rst analyze the properties of background activityin a detailed biophysical model of a neocortical pyrami-dal cell and decompose this activity into excitatory andinhibitory conductances. We then design a simple modelthat captures the spectral and amplitude characteristicsof these conductances. This model is tested using a sin-gle-compartment representation and in real cortical neu-rons maintained in vitro. In both cases, we show to whatextent this point-conductance representation captures theproperties of neurons in vivo.
Detailed biophysical model of synaptic background activity
We ¢rst illustrate a detailed biophysical model of invivo-like activity (Destexhe and Pare, 1999), which wasbuilt based on intracellular recordings in cat parietalcortex in vivo (Pare et al., 1998). This model incorporatedthe dendritic morphology of reconstructed neocorticalpyramidal neurons from cat cortex, it contained volt-age-dependent currents in the soma, dendrites and
axon, and synaptic activity was simulated by Poisson-distributed random release events at excitatory andinhibitory synapses. The model was matched to intra-cellular recordings obtained during total suppressionof network activity using TTX. By comparingelectrophysiological parameters (average Vm, input resis-tance, Vm distribution) before and after TTX, in controlconditions and by reversing inhibitory postsynapticpotentials using chloride-¢lled pipettes, one could esti-mate the release conditions at glutamatergic andGABAergic synapses corresponding to backgroundactivity. Excitatory and inhibitory synapses had torelease according to weakly correlated Poisson processes(Destexhe and Pare, 1999).
Figure 1 shows an example of such activity simulatedin a layer VI cell. The membrane £uctuated around 365mV and spontaneously generated action potentials at anaverage ¢ring rate of about 10 Hz (Fig. 1A1), which iswithin the range of experimental measurements in corti-cal neurons of awake animals (Hubel, 1959; Evarts,1964; Steriade, 1978; Matsumura et al., 1988; Steriadeet al., 2001). Without background activity, the cell wasresting at 380 mV (Fig. 1A2), similar to experimentalmeasurements after microperfusion of TTX (Pare et al.,1998). The model reproduced the V80% decreaseof input resistance (Fig. 1B), as well as thedistribution of membrane potential (Fig. 1C) typical ofin vivo activity (see Pare et al., 1998; Destexhe and Pare,1999).
Fig. 2. Statistical properties of the conductances underlying background activity in the detailed biophysical model. (A) Timecourse of the total excitatory (top) and inhibitory (bottom) conductances during synaptic background activity. (B) Distribu-tion of values for each conductance, calculated from A. (C) Power spectral density of each conductance. The insets show the
inverse of the power spectral density (1/S(f)) represented against squared frequency (f2 ; same scale used).
NSC 5185 25-10-01
A. Destexhe et al.16

Statistical and spectral properties of synaptic backgroundactivity
A model of synaptic background activity must includethe large conductance due to synaptic activity and alsoits large Vm £uctuations, as both aspects are importantand determine cellular responsiveness (Hoª and Destexhe,2000). To build such a model, we ¢rst need to character-ize these £uctuations. To this end, we recorded the totalsynaptic current resulting from synaptic backgroundactivity using an `ideal' voltage clamp (series resistanceof 0.001 M6) in the soma. This current (Isyn in Eq. 1)was decomposed into a sum of two currents, associatedrespectively with an excitatory (ge) and an inhibitory (gi)conductance. The latter were calculated by running themodel twice at two di¡erent clamped voltages (365 and355 mV), leading to two equations similar to Eq. 1. Thetime course of the conductances was obtained by solvingthese equations for ge and gi, at each time step.
The time course of ge and gi during synaptic back-ground activity is illustrated in Fig. 2A. As expectedfrom the stochastic nature of the release processes,these conductances were highly £uctuating and had abroad, approximately symmetric distribution (Fig. 2B).It is also apparent that the inhibitory conductance gi
accounts for most of the conductance seen in the soma,similar to voltage-clamp measurements in cat visual cor-tex in vivo (Borg-Graham et al., 1998). This is not sur-prising here, because the release frequency of GABAergicsynapses is ¢ve times larger than that of glutamatergicsynapses, their decay time constant is slower, and theperisomatic region contains exclusively GABAergic syn-apses (DeFelipe and Farin¬as, 1992). The average valuesand standard deviations were respectively 0.012 and0.0030 WS for ge, and 0.057 and 0.0066 WS for gi.
The power spectral density of ge and gi (Fig. 2C)shows a broad spectral structure, as expected fromtheir apparent stochastic behavior, but also there was aclear decay at larger frequencies, showing that these pro-cesses are analogous to `colored noise'. Interestingly, thepower spectrum clearly seems to decay in 1/f2 for inhib-itory synapses, as shown by representing the inverse ofthe power spectrum as a function of f2 (Fig. 2C, insets).However, for excitatory synapses, the 1/f2 decay wasonly true for high frequencies.
Point-conductance model of synaptic background activity
Next, we searched for stochastic representations thatwould capture the amplitude of the conductances, theirstandard deviation and their spectral structure. We con-sidered the Ornstein^Uhlenbeck process, which was orig-inally introduced to describe Brownian motion(Uhlenbeck and Ornstein, 1930):
dxdt� 3
xd�
����Dp
M �t� �5�
where x is the random variable, D is the amplitude of thestochastic component, M(t) is a normally distributed(zero-mean) noise source, and d is the time constant(d= 0 gives white noise, ds 0 gives `colored' noise).
The advantage of using this type of stochastic model isthat the distribution of variable x and its spectral char-acteristics are known analytically (see details in Gillespie,1996). x is Gaussian and its variance is given by:
c2 � Dd=2 �6�and its power spectral density is:
S�f � � 2Dd 2
1� �2Zf d �2 �7�
where f is the frequency.The Gaussian nature of the Ornstein^Uhlenbeck pro-
cess and its spectrum in 1/f2 qualitatively match thebehavior of the conductances underlying backgroundactivity in the detailed biophysical model. Moreover,the variance and the spectral structure of this modelcan be manipulated by only two variables (D and d),which is very convenient to ¢t this model to experimentaldata (using Eqs. 6 and 7).
We applied this procedure to obtain a simple point-conductance representation of synaptic backgroundactivity. The model described by Eq. 2a, b was ¢t tothe detailed biophysical simulations shown in Fig. 2.The results of this ¢tting procedure are shown in Fig. 3.Eq. 7 provided excellent ¢ts to the power spectral density(Fig. 3A), for both excitatory and inhibitory conductan-ces. By using average values and standard deviationsestimated from the distribution of conductances inFig. 2B, the parameters of the model could be estimated(values listed in Table 1 and Experimental procedures).The resulting stochastic model had a distribution(Fig. 3B) and temporal behavior (Fig. 3C) consistentwith the conductances estimated from the detailedmodel (compare with Fig. 2). Moreover, the point-con-ductance model was more than two orders of magnitudefaster to simulate.
Meaning of the di¡erent parameters
To characterize the e¡ect of the di¡erent parametersand understand their biophysical signi¢cance, we com-pared the best ¢ts of the point-conductance model
Table 1. E¡ect of cellular morphology
Cell Layer VI Layer III Layer Va Layer Vb
Area (Wm2) 34 636 20 321 55 017 93 265Rin (M6) 58.9 94.2 38.9 23.1ge0 (WS) 0.012 0.006 0.018 0.029ce (WS) 0.0030 0.0019 0.0035 0.0042de (ms) 2.7 7.8 2.6 2.8gi0 (WS) 0.057 0.044 0.098 0.16ci (WS) 0.0066 0.0069 0.0092 0.01di (ms) 10.5 8.8 8.0 8.5
Synaptic background activity was simulated in four reconstructedneurons from cat cerebral cortex, using several thousand gluta-matergic and GABAergic inputs distributed in the soma anddendrites (see Experimental procedures; Destexhe and Pare,1999). The same respective densities of synapses were used in allfour cells. The table shows the parameters of the best ¢t of thepoint-conductance model using the same procedure. Theseparameters generally depended on the morphology, but theirratios were approximately constant (ge0/gi0 and ce/ci).
NSC 5185 25-10-01
Point-conductance models of in vivo activity 17

obtained for di¡erent variations of the biophysicalmodel. Table 1 shows the optimal parameters of thepoint-conductance models obtained from biophysicalmodels with the same densities of all conductances, butdi¡erent cellular morphologies. The average conductan-ces (ge0, gi0) clearly depend on cellular morphology,which is expected because larger cells have larger num-bers of synapses. Consequently, ge0 and gi0 vary approx-imately as the inverse of the the input resistance of thecell (Table 1).
Interestingly, although the absolute values of ge0 andgi0 clearly depended on the particular cell morphology,their ratio was approximately constant (gi0v5 ge0 ; seeTable 1). As discussed above, inhibitory conductancesare larger because inhibitory synapses release on average¢ve times more than excitatory synapses. Also, the decaytime constant of GABAA-mediated currents is slowerthan that of AMPA-mediated currents, resulting inlarger integrated conductances. However, the quantalconductance is twice smaller for GABAA (600 pS) com-pared to AMPA (1200 pS). These factors combine sothat the net inhibitory conductance is approximately¢ve times larger than excitatory conductances.
Table 1 also shows that the time constants de and di
seem approximately independent of cellular morphology,with the exception of the layer III pyramidal cell. Thelatter e¡ect is presumably due to the fact that these cellsare electrotonically more compact and have fewer exci-tatory synapses than large cells from deep layers. How-ever, de and di were greatly a¡ected by changing thedecay time constant of the synaptic currents in thedetailed biophysical model (not shown).
The standard deviations (ce, ci) were only weaklya¡ected by the above parameters. However, changingthe correlation in the background activity had a markede¡ect on ce and ci, as shown in Table 2. In these simu-lations, the only parameter that changed was the corre-lation, while the same cellular morphology andbiophysical parameters were used. This e¡ect may beunderstood by noting that, when changing the correla-tion, the release statistics are una¡ected at individualsynapses, and therefore the total conductance remainsthe same. However, the correlation a¡ects the respectivetiming of release events at di¡erent pairs of synapses,which translates into a change of ce and ci in thepoint-conductance model.
Single-compartment models of in vivo-like activity
We next used the point-conductance approach to build
Fig. 3. Fit of a point-conductance model of background synaptic activity. (A) Power spectral density of the conductancesfrom the biophysical model (top = excitatory, bottom = inhibitory). The continuous lines show the best ¢ts obtained with thestochastic point-conductance model. (B) Distribution of conductance values for the point-conductance model. (C) Time courseof the excitatory and inhibitory conductances of the best stochastic model. The same data lengths as in Fig. 2 were used for
all analyses.
Table 2. E¡ect of input correlation
Correlation 0.000056 0.00042 0.0012
ge0 (WS) 0.012 0.012 0.012ce (WS) 0.0014 0.0030 0.0050de (ms) 2.4 2.7 2.96gi0 (WS) 0.058 0.057 0.058ci (WS) 0.0029 0.0066 0.011di (ms) 11.2 10.5 9.6
Three simulations of the layer VI pyramidal neuron (Fig. 1A)were run with identical parameters, except for the correlationwhich is indicated. The table shows the values of the best ¢t ofthe point-conductance model for each case.
NSC 5185 25-10-01
A. Destexhe et al.18

a single-compartment model of synaptic backgroundactivity in neocortical neurons. We ¢rst investigated thebasic membrane properties of the model, including thee¡ect of background activity on the average Vm andinput resistance, as well as the statistical properties ofsubthreshold voltage £uctuations (Fig. 4). In the absenceof background activity, the cell was resting at a Vm ofaround 380 mV (Fig. 4A2), similar to measurements invivo in the presence of TTX (Pare et al., 1998). In thepresence of synaptic background activity, intracellularrecordings indicate that the Vm of cortical neurons £uc-tuates around 365 mV, a feature that was reproduced bythe point-conductance model (Fig. 4A1; compare withthe biophysical model in Fig. 1A1). The point-conduc-tance model also captured the e¡ect of background activ-ity on input resistance (Fig. 4B; compare with Fig. 1B),as well as on the amplitude of voltage £uctuations(Fig. 4C; compare with Fig. 1C). The standard deviationcalculated from the Vm distributions (see Fig. 4B) wasabout cV = 4 mV for both models.
We next compared the ¢ring behavior of the two typesof model. The presence of background activity gave riseto Vm £uctuations and irregular ¢ring in both models(see Figs. 1A1 and 4A1). The variation of the average¢ring rate as a function of the conductance parameters isremarkably similar in both models (Fig. 5A). Althoughthe absolute ¢ring rates were di¡erent, the shape ofthe 3-D plot was correctly captured by the point-con-ductance model. A rescaling of the absolute value canbe obtained by changing the excitability of the cell
by manipulating Na�/K� channel densities (notshown).
The point-conductance model also captured the mod-ulation of cellular responsiveness by background activityshown previously in detailed biophysical models (Hoª andDestexhe, 2000). The protocol used was to simulate auniformly distributed AMPA-mediated synaptic conduc-tance of progressively larger strength. The probability ofspikes speci¢cally evoked by this stimulus was then com-puted from the post-stimulus time histograms and is rep-resented as a function of stimulus strength. This responsecurve was shown to be shifted by in vivo-like synapticbackground activity compared to quiescent conditions(Fig. 5B, left panel; Hoª and Destexhe, 2000). Withoutbackground activity (dashed line) the probability was all-or-none, re£ecting the threshold for action potentials.With background activity (continuous line), the responsecurve was graded and there was a non-null response forsubthreshold inputs (6 0.2 mS/cm2).
This enhancement of responsiveness was also presentin a single-compartment model where synaptic back-ground activity was simulated by a point-conductancerepresentation (Fig. 5B, right panel). In this case, theprobability of response was computed following activa-tion of a single AMPA-mediated synapse. Using di¡erentvalues of ce and ci, yielding di¡erent cV, gave rise todi¡erent responsiveness (Fig. 5B, symbols in right panel),with no e¡ect on the average Vm. This e¡ect of £uctua-tions was qualitatively similar to that observed in thedetailed model (Hoª and Destexhe, 2000).
Fig. 4. Membrane potential and input resistance of the point-conductance model. (A) Membrane potential in the presence(A1) and in the absence (A2) of synaptic background activity represented by two £uctuating conductances. The point-conduc-tance model was inserted in a single compartment with only a leak current (same conductance density as the detailed model).(B) E¡ect on input resistance (same description and hyperpolarizing pulse as in Fig. 1B). (C) Vm distribution in the presence
(C1) and in the absence (C2) of the £uctuating conductances.
NSC 5185 25-10-01
Point-conductance models of in vivo activity 19
Recreation of in vivo-like activity by dynamic clamp
We next used the point-conductance model to recreatein vivo type activity in real neurons. To this end, weinjected the current computed from the point-conduc-tance model in rat prefrontal cortical pyramidal cells invitro. We took advantage of the relation between theparameter values and the input resistance of the cell(Table 1) to estimate heuristically these parametersusing the following criteria. The parameters ge0 and gi0
were estimated such as to provide a V15-mV depolariz-ing drive and four to ¢ve times reduction of input resis-tance, as found experimentally (Pare et al., 1998;Destexhe and Pare, 1999). The parameters ce and ci
(or De and Di) were then adjusted to yield voltage £uc-tuations with a standard deviation around cV = 4 mV.These conditions are illustrated in Fig. 6A for the voltagee¡ect and Fig. 6B for the input resistance. The Vm dis-tributions are depicted in Fig. 6C. Similar results wereobtained for all the neurons tested (n = 9; the absolutevalues of the parameters ge0, gi0, ce and ci depended onthe cell, but their ratio was kept constant: ge0/gi0 = 0.2,ce/ci = 0.4). Thus, the point-conductance representationrecreates intracellular conditions similar to in vivorecordings.
Finally, to test whether the timing of £uctuations ^
and therefore the spike discharges ^ are also similar toin vivo, we analyzed the statistics of the spontaneousdischarge recreated by the point-conductance model.The spontaneous discharge of cortical neurons inawake animals is highly variable (Softky and Koch,1993; Shadlen and Newsome, 1998). This variability isquanti¢ed by the coe¤cient of variation (CV), which isde¢ned as:
CV � cISI
GISIf�8�
where GISIf and cISI are, respectively, the average valueand the standard deviation of interspike intervals.
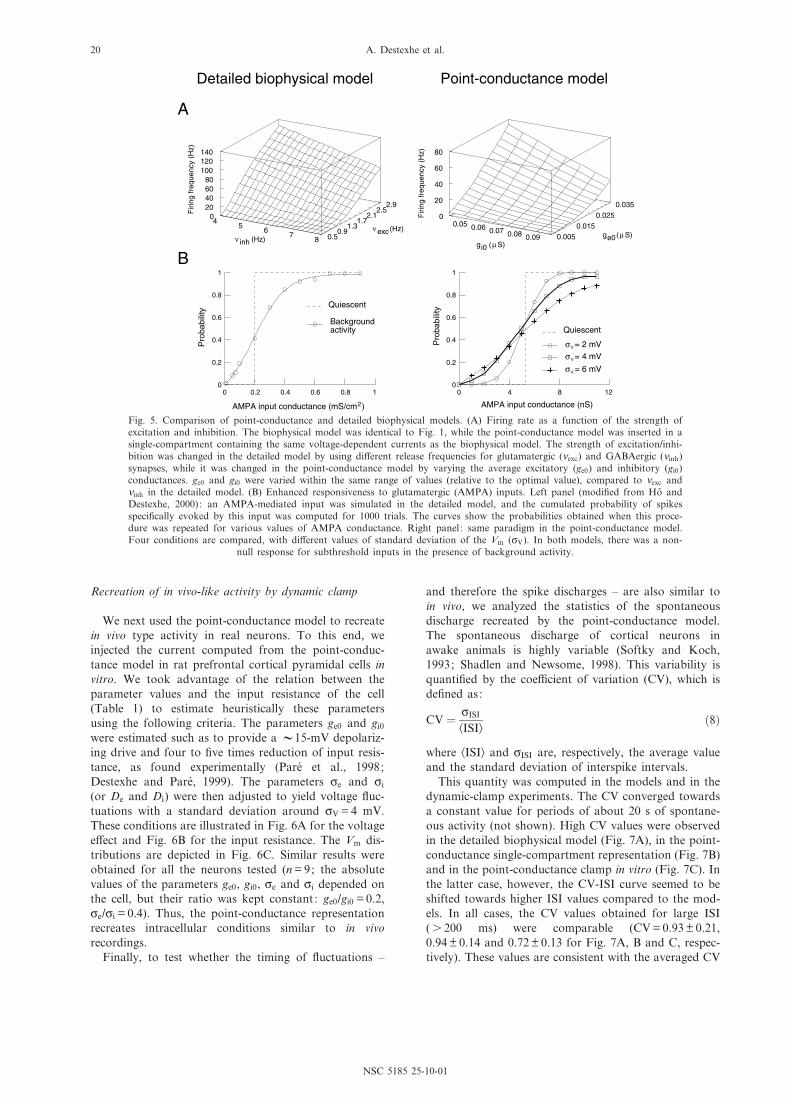
This quantity was computed in the models and in thedynamic-clamp experiments. The CV converged towardsa constant value for periods of about 20 s of spontane-ous activity (not shown). High CV values were observedin the detailed biophysical model (Fig. 7A), in the point-conductance single-compartment representation (Fig. 7B)and in the point-conductance clamp in vitro (Fig. 7C). Inthe latter case, however, the CV-ISI curve seemed to beshifted towards higher ISI values compared to the mod-els. In all cases, the CV values obtained for large ISI(s 200 ms) were comparable (CV = 0.93 þ 0.21,0.94 þ 0.14 and 0.72 þ 0.13 for Fig. 7A, B and C, respec-tively). These values are consistent with the averaged CV
Fig. 5. Comparison of point-conductance and detailed biophysical models. (A) Firing rate as a function of the strength ofexcitation and inhibition. The biophysical model was identical to Fig. 1, while the point-conductance model was inserted in asingle-compartment containing the same voltage-dependent currents as the biophysical model. The strength of excitation/inhi-bition was changed in the detailed model by using di¡erent release frequencies for glutamatergic (Xexc) and GABAergic (Xinh)synapses, while it was changed in the point-conductance model by varying the average excitatory (ge0) and inhibitory (gi0)conductances. ge0 and gi0 were varied within the same range of values (relative to the optimal value), compared to Xexc andXinh in the detailed model. (B) Enhanced responsiveness to glutamatergic (AMPA) inputs. Left panel (modi¢ed from Hoª andDestexhe, 2000): an AMPA-mediated input was simulated in the detailed model, and the cumulated probability of spikesspeci¢cally evoked by this input was computed for 1000 trials. The curves show the probabilities obtained when this proce-dure was repeated for various values of AMPA conductance. Right panel: same paradigm in the point-conductance model.Four conditions are compared, with di¡erent values of standard deviation of the Vm (cV). In both models, there was a non-
null response for subthreshold inputs in the presence of background activity.
NSC 5185 25-10-01
A. Destexhe et al.20

values measured in awake monkeys (Softky and Koch,1993; Shadlen and Newsome, 1998).
DISCUSSION
We have shown here that it is possible to draw arelatively simple point-conductance representation ofsynaptic background activity with only two variablesand that this model is su¤cient to account for severaltypical properties of neocortical neurons in vivo. We dis-cuss here possible applications and further developmentsof this model, as well as how it could be tuned usingexperimental data.
Point-conductance models of in vivo activity
In the past, several ways have been considered forintroducing noise in neurons. First, the addition ofnoise as a membrane current, which was realized boththeoretically (Stein, 1967; Ricciardi and Sacerdote, 1979;Smith, 1992) and experimentally (Mainen and Sejnowski,1995; Stevens and Zador, 1998; Fellous et al., 2001). A
related approach consisted in introducing noise throughstochastic variations of the spike threshold (Gerstner,1995). These approaches, however, neglected an impor-tant component of background activity: the conduc-tance, which is predominant in cortical neurons in vivo(Pare et al., 1998). Here we have proposed a method thatexplicitly incorporates this component by introducingtwo stochastic `point' conductances varying accordingto the Ornstein^Uhlenbeck process. This approach cap-tures several basic membrane properties of cortical neu-rons recorded in vivo, such as the lowered inputresistance, a depolarized Vm, persistent voltage £uctua-tions and high variability of discharges.
One of the advantages of this approach is that variousparameters of background activity translate into di¡erentparameters of the simpli¢ed model. The average releasefrequency of excitatory and inhibitory synapses a¡ectsthe average conductances (ge0 and gi0), whereas the cor-relations among the synaptic inputs mostly a¡ect thestandard deviation of synaptic conductances (ce and ci
in Table 2). The latter observation extends previousapproaches which have demonstrated a profound impactof input correlations on the standard deviation of the
Fig. 6. Point-conductance clamp of neurons from rat prefrontal cortex in vitro. (A) Intracellular recording of a prefrontalcortex layer V pyramidal cell in control condition (A2), and injected with the point-conductance model (A1; ge0 = 0.014 WS,gi0 = 0.05 WS, ce = 0.0058 WS, ci = 0.0145 WS, de = 2.7 ms, di = 10.7 ms). The current computed by the point-conductancemodel, and injected in real time, is depicted in A1, lower trace. The point-conductance clamp depolarized the cell by about15 mV, and introduced membrane potential £uctuations. (B) Average response of a di¡erent cell to a 200-pA hyperpolarizingpulse in control (B2) and in point-conductance clamp (B1) conditions (10 trials ; ge0 = 0.02 WS, gi0 = 0.1 WS, ce = 0.005 WS,ci = 0.012 WS, de = 2.7 ms, di = 10.7 ms). The input resistance was decreased by 4.3-fold. (C) Distribution of membrane poten-tial before (C2) and after (C1) the activation of the point-conductance clamp (same cell as in A). The standard deviation of
the membrane £uctuations (cV) was increased to about 4 mV.
NSC 5185 25-10-01
Point-conductance models of in vivo activity 21
membrane potential (Destexhe and Pare, 1999; Feng andBrown, 2000; Harsch and Robinson, 2000; Salinas andSejnowski, 2000; Svirskis and Rinzel, 2000). We suggesthere that background activity can be represented by twostochastically varying conductances, whose average valueis related to the average release frequency, and standarddeviation re£ects input correlations.
The point-conductance approach can also be appliedto build a single-compartment model to capture themembrane properties (Fig. 4) and responsiveness(Fig. 5B) of more detailed biophysical models. This con-
¢rms the previous suggestion that responsiveness isdependent on both the conductance and the membranepotential £uctuations present in background activity(Hoª and Destexhe, 2000). It also con¢rms that variationsin the morphology of dendrites ^ including their suppres-sion ^ only lead to qualitative changes of responsiveness.These questions could be investigated further by combin-ing point-conductance clamp with controlled synapticstimulation in vitro.
Future developments of this model should address thepresence of glutamate NMDA receptors, which were not
Fig. 7. High variability of spontaneous discharges. The left panels show a 6-s trace of spontaneous activity to illustrate thevariability of discharges; the right panels show the CV calculated for periods of s 33 s of activity in di¡erent conditions andrepresented against the mean ISI. (A) Detailed biophysical model (same parameter settings as in Fig. 1). The di¡erent CVvalues on the left were obtained by varying excitatory and inhibitory release frequencies (range of 0.5^2.9 Hz and of 4.0^8.0Hz, respectively). (B) Point-conductance model (identical parameters as in Fig. 5; ge0 and gi0 were varied within the range of0.003^0.035 WS and 0.017^0.145 WS, respectively). (C) Point-conductance clamp in vitro (same parameters as in Fig. 6). Thedi¡erent symbols in the right panel indicate di¡erent cells ; the di¡erent points correspond to variations of the parameters(ge0 = 0.005^0.0375 WS; gi0 = 0.025^0.05 WS; ce = 0.00025^0.009 WS; ci = 0.00025^0.033 WS). All three models gave high CV
values.
NSC 5185 25-10-01
A. Destexhe et al.22
included here but may play a role in the pattern of ¢ringand the variability of discharges (Harsch and Robinson,2000). The principal di¤culty here is that NMDA recep-tors are voltage-dependent, which would result in theinclusion of voltage-dependent parameters in Eq. 2a, b.However, assuming that AMPA and NMDA receptorsare colocalized, NMDA receptors would have the samepresynaptic signal as AMPA receptors and both receptortypes could possibly be merged into a single equation.This should allow the inclusion of NMDA receptors in amodel of roughly the same complexity as the presentone.
Recreating in vivo-like activity in vitro
We have shown here that point-conductance modelscan be injected into real cells in vitro by the dynamic-clamp technique, leading to in vivo-like membrane activ-ity. The conductance injected represents the total synap-tic current that converges to the soma, and thereforeprobably recreates conditions close to the somaticrecording during intense network activity in vivo. How-ever, one has to bear in mind that the dendrites areprobably not correctly a¡ected by a somatic point-con-ductance injection because of their remote electrotoniclocation. Consequently, point-conductance modelsshould be used in neurons that are as small as possibleto limit electrotonic artifacts of this type. Another pos-sibility is to augment electrotonic compactness by usingrecordings in the presence of cesium in the electrode, orin the presence of neuromodulators.
If electrotonic artifacts can be minimized, the point-conductance injection could be used in conjunction withsynaptic stimulation to investigate how the membranepotential £uctuations a¡ect cellular responsiveness. Itshould also be possible to use this model to determineif neocortical pyramidal cells display phenomena likestochastic resonance, which is an enhancement ofresponsiveness in the presence of noise (Wiesenfeld andMoss, 1995). In this case, the point-conductance modelwould provide a more realistic source of `noise' to inves-tigate such phenomena.
The high variability of spontaneous dischargesobserved in neocortex in vivo (Softky and Koch, 1993;Shadlen and Newsome, 1998) can be reproduced by themodels and by the point-conductance clamp (Fig. 7).However, the CV-ISI curves obtained here were signi¢-cantly shifted compared to in vivo curves (compare rightpanels of Fig. 7 with Fig. 2 of Softky and Koch, 1993).The main reason for this di¡erence was that the latter
study investigated visual responses, with average ¢ringrates well above 100 Hz, while we focused here on spon-taneous activity, which involves much lower ¢ring rates(around 10 Hz). The CV-ISI curve was also more shiftedin the point-conductance clamp compared to the models.Possible reasons for this di¡erence may be more prom-inent K� currents underlying spike after-hyperpolariza-tion and spike-frequency adaptation, or the high inputresistance (and slow membrane time constant) inherentin whole-cell recordings. This predicts that a¡ecting theinput resistance and K� currents using neuromodulators(McCormick, 1992; McCormick et al., 1993) shoulda¡ect the CV-ISI relations. Future models and morere¢ned experiments will be needed to characterize thein£uence of these di¡erent factors and identify the deter-minants of irregular ¢ring activity in vivo.
Applications to in vivo experiments
Another useful property of the point-conductancemodel is that the distribution and the power spectraldensity of the stochastic variables can be tracked analyti-cally (see Eqs. 6 and 7). Consequently, the parameters ofthis model can be completely determined from experi-ments. This could be applied to characterize the £uctuat-ing synaptic activity in vivo by using voltage-clamprecordings. Voltage-clamp experiments in vivo are feasi-ble (Borg-Graham et al., 1998) and it should be possibleto use this technique to record long periods of sponta-neous activity at di¡erent clamped voltages, calculate thedistributions and spectra of excitatory and inhibitoryconductances, and ¢t the model as described in Figs. 2and 3. This possibility is presently under investigation.
Another possible application derives from the obser-vation that the average conductances, ge0 and gi0, aremostly in£uenced by the intensity of background activityand cellular geometry, whereas their standard deviations,ce and ci, mostly re£ect the correlation between synapticevents (Tables 1 and 2). Fitting the point-conductancemodel to voltage-clamp recordings in vivo may thereforeprovide an independent estimate of these parameters,and therefore a possible method to probe and comparedi¡erent states of network activity recorded during thesame intracellular experiment.
AcknowledgementsöResearch supported by the Centre Nationalde la Recherche Scienti¢que (CNRS), the Howard HughesMedical Institute and the National Institutes of Health.
REFERENCES
Barrett, J.N., 1975. Motoneuron dendrites: role in synaptic integration. Fed. Proc. 34, 1398^1407.Bernander, O., Douglas, R.J., Martin, K.A., Koch, C., 1991. Synaptic background activity in£uences spatiotemporal integration in single
pyramidal cells. Proc. Natl. Acad. Sci. USA 88, 11569^11573.Borg-Graham, L.J., Monier, C., Fregnac, Y., 1998. Visual input evokes transient and strong shunting inhibition in visual cortical neurons. Nature
393, 369^373.Contreras, D., Destexhe, A., Steriade, M., 1997. Intracellular and computational characterization of the intracortical inhibitory control of
synchronized thalamic inputs in vivo. J. Neurophysiol. 78, 335^350.Cragg, B.G., 1967. The density of synapses and neurones in the motor and visual areas of the cerebral cortex. J. Anat. 101, 639^654.
NSC 5185 25-10-01
Point-conductance models of in vivo activity 23

DeFelipe, J., Farin¬as, I., 1992. The pyramidal neuron of the cerebral cortex: morphological and chemical characteristics of the synaptic inputs.Prog. Neurobiol. 39, 563^607.
Destexhe, A., Mainen, Z., Sejnowski, T.J., 1998. Kinetic models of synaptic transmission. In: Koch, C., Segev, I. (Eds.), Methods in NeuronalModeling, MIT, Cambridge, MA, pp. 1^26.
Destexhe, A., Pare, D., 1999. Impact of network activity on the integrative properties of neocortical pyramidal neurons in vivo. J. Neurophysiol.81, 1531^1547.
Destexhe, A., Rudolph, M., 2000. Simpli¢ed models of correlated synaptic background activity in neocortical pyramidal neurons. Soc. Neurosci.Abstr. 26, 1623.
Douglas, R.J., Martin, K.A., Whitteridge, D., 1991. An intracellular analysis of the visual responses of neurones in cat visual cortex. J. Physiol.440, 659^696.
Evarts, E.V., 1964. Temporal patterns of discharge of pyramidal tract neurons during sleep and waking in the monkey. J. Neurophysiol. 27, 152^171.
Fellous, J.M., Destexhe, A., Sejnowski, T.J., 2000. Dynamic clamp of cortical neurons in vitro simulates in vivo activity patterns. Soc. Neurosci.Abstr. 26, 1623.
Fellous, J.M., Houweling, A.R., Modi, R.H., Rao, R.P.N., Tiesinga, P.H.E., Sejnowski, T.J., 2001. The frequency dependence of spike timingreliability in cortical pyramidal cells and interneurons. J. Neurophysiol., 85, 1782^1787.
Feng, J., Brown, D., 2000. Impact of correlated inputs on the output of the integrate-and-¢re model. Neural Comput. 12, 671^692.Gerstner, W., 1995. Time structure of the activity in neural network models. Phys. Rev. E 51, 738^758.Gillespie, D.T., 1996. The mathematics of Brownian motion and Johnson noise. Am. J. Phys. 64, 225^240.Harsch, A., Robinson, P.C., 2000. Postsynaptic variability of ¢ring in rat cortical neurons: the roles of input synchronization and synaptic NMDA
receptor conductance. J. Neurosci. 20, 6181^6192.Hines, M.L., Carnevale, N.T., 1997. The NEURON simulation environment. Neural Comput. 9, 1179^1209.Hoª, N., Destexhe, A., 2000. Synaptic background activity enhances the responsiveness of neocortical pyramidal neurons. J. Neurophysiol. 84,
1488^1496.Hodgkin, A.L., Huxley, A.F., 1952. A quantitative description of membrane current and its application to conduction and excitation in nerve.
J. Physiol. 117, 500^544.Holmes, W.R., Woody, C.D., 1989. E¡ects of uniform and non-uniform synaptic `activation-distributions' on the cable properties of modeled
cortical pyramidal neurons. Brain Res. 505, 12^22.Hubel, D., 1959. Single-unit activity in striate cortex of unrestrained cats. J. Physiol. 147, 226^238.Mainen, Z.F., Sejnowski, T.J., 1995. Reliability of spike timing in neocortical neurons. Science 268, 1503^1506.Matsumura, M., Cope, T., Fetz, E.E., 1988. Sustained excitatory synaptic input to motor cortex neurons in awake animals revealed by intra-
cellular recording of membrane potentials. Exp. Brain Res. 70, 463^469.McCormick, D.A., 1992. Neurotransmitter actions in the thalamus and cerebral cortex and their role in neuromodulation of thalamocortical
activity. Prog. Neurobiol. 39, 337^388.McCormick, D.A., Wang, Z., Huguenard, J., 1993. Neurotransmitter control of neocortical neuronal activity and excitability. Cerebral Cortex 3,
387^398.Pare, D., Lebel, E., Lang, E.J., 1997. Di¡erential impact of miniature synaptic potentials on the somata and dendrites of pyramidal neurons in
vivo. J. Neurophysiol. 78, 1735^1739.Pare, D., Shink, E., Gaudreau, H., Destexhe, A., Lang, E.J., 1998. Impact of spontaneous synaptic activity on the resting properties of cat
neocortical neurons in vivo. J. Neurophysiol. 79, 1450^1460.Ricciardi, L.M., Sacerdote, L., 1979. The Ornstein^Uhlenbeck process as a model for neuronal activity. I. Mean and variance of the ¢ring time.
Biol. Cybernet. 35, 1^9.Salinas, E., Sejnowski, T.J., 2000. Impact of correlated synaptic input on output ¢ring rate and variability in simple neuronal models. J. Neurosci.
20, 6193^6209.Shadlen, M.N., Newsome, W.T., 1998. The variable discharge of cortical neurons: implications for connectivity, computation, and information
coding. J. Neurosci. 18, 3870^3896.Sharp, A.A., O'Neil, M.B., Abbott, L.F., Marder, E., 1993. The dynamic clamp: arti¢cial conductances in biological neurons. Trends Neurosci.
16, 389^394.Smith, C.E., 1992. A note on neuronal ¢ring and input variability. J. Theor. Biol. 154, 271^275.Softky, W.R., Koch, C., 1993. The highly irregular ¢ring of cortical cells is inconsistent with temporal integration of random EPSPs. J. Neurosci.
13, 334^350.Stein, R.B.M., 1967. Some models of neuronal variability. Biophys. J. 7, 37^68.Steriade, M., 1978. Cortical long-axoned cells and putative interneurons during the sleep-waking cycle. Behav. Brain Sci. 3, 465^514.Steriade, M., Timofeev, I., Grenier, F., 2001. Natural waking and sleep states: a view from inside neocortical neurons. J. Neurophysiol. 85, 1969^
1985.Stevens, C.F., Zador, A.M., 1998. Input synchrony and the irregular ¢ring of cortical neurons. Nature Neurosci. 1, 210^217.Svirskis, G., Rinzel, J., 2000. In£uence of temporal correlation of synaptic input on the rate and variability of ¢ring in neurons. Biophys. J. 79,
629^637.Uhlenbeck, G.E., Ornstein, L.S., 1930. On the theory of the Brownian motion. Phys. Rev. 36, 823^841.White, E.L., 1989. Cortical Circuits. Birkhauser, Boston, MA.Wiesenfeld, K., Moss, F., 1995. Stochastic resonance and the bene¢ts of noise: from ice ages to cray¢sh and SQUIDs. Nature 373, 33^36.
(Accepted 1 August 2001)
NSC 5185 25-10-01
A. Destexhe et al.24