Flow induced by upwelling winds in an equatorward facing bay: Gulf of Arauco, Chile
14
Flow induced by upwelling winds in an equatorward facing bay: Gulf of Arauco, Chile Arnoldo Valle-Levinson and Larry P. Atkinson Center for Coastal Physical Oceanography, Ocean, Earth and Atmospheric Sciences Department Old Dominion University, Norfolk, Virginia, USA Dante Figueroa Departamento de Fı ´sica de la Atmo ´sfera y del Oce ´ano, Universidad de Concepcio ´n, Concepcio ´n, Chile Leonardo Castro Departamento de Oceanografı ´a, Universidad de Concepcio ´n, Concepcio ´n, Chile Received 18 December 2001; revised 3 July 2002; accepted 23 September 2002; published 27 February 2003. [1] Shipborne observations of hydrographic and flow velocity profiles were combined with wind velocity measurements to describe the characteristics of the wind-induced flow in an equatorward facing bay of central Chile in South America. The measurements, which were taken from two transects and one anchor station, were made during late austral spring, between 4 and 10 December 2000. Most observations concentrated on Boca Grande, a transect that crossed the deep, northern (equatorward) entrance to the bay. The other transect crossed the smaller and shallower, westward entrance to the bay, Boca Chica. The anchor station was located inside the bay, close to Boca Chica. The period of observations was characterized by persistent upwelling winds of up to 17 m/s. The direction of the wind showed very little variability, but its magnitude exhibited well- defined diurnal fluctuations. Wind speeds peaked at around sunset (2100 local time), which coincided with the deepest pycnocline location. The shallowest pycnocline depth appeared a couple of hours after sunrise. These pycnocline oscillations had amplitudes of 5 m and were believed to propagate poleward along the coast and dissipate at the shallow entrance in Boca Chica. This mechanism could have mixed low-oxygen, nutrient- rich waters into the photic zone and enhanced the primary productivity. Observed flows at the Boca Grande transect consisted of downwind flow over the shallow ends and upwind flow in the deepest part. This wind-induced pattern is believed to cause a pair of counterrotating gyres that allow near-surface divergence and ventilation of upwelled subsurface waters at the southern end of the bay. This is the region where the highest concentrations of chlorophyll are identified in color imagery. INDEX TERMS: 4279 Oceanography: General: Upwelling and convergences; 4219 Oceanography: General: Continental shelf processes; 4227 Oceanography: General: Diurnal, seasonal, and annual cycles; KEYWORDS: equatorward facing bay, upwelling, Gulf of Arauco, circulation Citation: Valle-Levinson, A., L. P. Atkinson, D. Figueroa, and L. Castro, Flow induced by upwelling winds in an equatorward facing bay: Gulf of Arauco, Chile, J. Geophys. Res., 108(C2), 3054, doi:10.1029/2001JC001272, 2003. 1. Introduction [2] Equatorward facing bays that appear adjacent to east- ern boundary currents usually represent locations of upwell- ing and productivity that may be favored by changes of coastline orientation [e.g., Figueroa and Moffat, 2000]. Two typical examples of these systems are the Gulf of Arauco in central Chile (Figure 1) and Monterey Bay in central California in the United States [e.g., Rosenfeld et al., 1994]. Despite long-term interest in systems of high pro- ductivity, there is still a large gap in the basic understanding of the physical mechanisms that affect these bays and their influence on the biological productivity inherent to these systems. An overarching objective should be to try to understand why these systems are highly productive. A key to the answer should be to understand the wind-induced circulation and mixing in these embayments. With that in mind the objective of this work was to increase our under- standing of the wind-induced flow in the Gulf of Arauco, an equatorward facing bay in central Chile. This was done with a combination of shipborne, underway acoustic Doppler current profiler (ADCP) measurements, conductivity-tem- perature-depth (CTD) profiles at fixed stations, and anchor time series obtained between 4 and 10 December 2000 during the austral upwelling season. Although Djurfeldt JOURNAL OF GEOPHYSICAL RESEARCH, VOL. 108, NO. C2, 3054, doi:10.1029/2001JC001272, 2003 Copyright 2003 by the American Geophysical Union. 0148-0227/03/2001JC001272$09.00 36 - 1
Transcript of Flow induced by upwelling winds in an equatorward facing bay: Gulf of Arauco, Chile

Flow induced by upwelling winds in an equatorward facing bay:
Gulf of Arauco, Chile
Arnoldo Valle-Levinson and Larry P. AtkinsonCenter for Coastal Physical Oceanography, Ocean, Earth and Atmospheric Sciences Department Old Dominion University,Norfolk, Virginia, USA
Dante FigueroaDepartamento de Fısica de la Atmosfera y del Oceano, Universidad de Concepcion, Concepcion, Chile
Leonardo CastroDepartamento de Oceanografıa, Universidad de Concepcion, Concepcion, Chile
Received 18 December 2001; revised 3 July 2002; accepted 23 September 2002; published 27 February 2003.
[1] Shipborne observations of hydrographic and flow velocity profiles were combinedwith wind velocity measurements to describe the characteristics of the wind-induced flowin an equatorward facing bay of central Chile in South America. The measurements, whichwere taken from two transects and one anchor station, were made during late australspring, between 4 and 10 December 2000. Most observations concentrated on BocaGrande, a transect that crossed the deep, northern (equatorward) entrance to the bay. Theother transect crossed the smaller and shallower, westward entrance to the bay, BocaChica. The anchor station was located inside the bay, close to Boca Chica. The period ofobservations was characterized by persistent upwelling winds of up to 17 m/s. Thedirection of the wind showed very little variability, but its magnitude exhibited well-defined diurnal fluctuations. Wind speeds peaked at around sunset (2100 local time),which coincided with the deepest pycnocline location. The shallowest pycnocline depthappeared a couple of hours after sunrise. These pycnocline oscillations had amplitudes of�5 m and were believed to propagate poleward along the coast and dissipate at theshallow entrance in Boca Chica. This mechanism could have mixed low-oxygen, nutrient-rich waters into the photic zone and enhanced the primary productivity. Observed flows atthe Boca Grande transect consisted of downwind flow over the shallow ends and upwindflow in the deepest part. This wind-induced pattern is believed to cause a pair ofcounterrotating gyres that allow near-surface divergence and ventilation of upwelledsubsurface waters at the southern end of the bay. This is the region where the highestconcentrations of chlorophyll are identified in color imagery. INDEX TERMS: 4279
Oceanography: General: Upwelling and convergences; 4219 Oceanography: General: Continental shelf
processes; 4227 Oceanography: General: Diurnal, seasonal, and annual cycles; KEYWORDS: equatorward
facing bay, upwelling, Gulf of Arauco, circulation
Citation: Valle-Levinson, A., L. P. Atkinson, D. Figueroa, and L. Castro, Flow induced by upwelling winds in an equatorward facing
bay: Gulf of Arauco, Chile, J. Geophys. Res., 108(C2), 3054, doi:10.1029/2001JC001272, 2003.
1. Introduction
[2] Equatorward facing bays that appear adjacent to east-ern boundary currents usually represent locations of upwell-ing and productivity that may be favored by changes ofcoastline orientation [e.g., Figueroa and Moffat, 2000]. Twotypical examples of these systems are the Gulf of Arauco incentral Chile (Figure 1) and Monterey Bay in centralCalifornia in the United States [e.g., Rosenfeld et al.,1994]. Despite long-term interest in systems of high pro-ductivity, there is still a large gap in the basic understanding
of the physical mechanisms that affect these bays and theirinfluence on the biological productivity inherent to thesesystems. An overarching objective should be to try tounderstand why these systems are highly productive. Akey to the answer should be to understand the wind-inducedcirculation and mixing in these embayments. With that inmind the objective of this work was to increase our under-standing of the wind-induced flow in the Gulf of Arauco, anequatorward facing bay in central Chile. This was done witha combination of shipborne, underway acoustic Dopplercurrent profiler (ADCP) measurements, conductivity-tem-perature-depth (CTD) profiles at fixed stations, and anchortime series obtained between 4 and 10 December 2000during the austral upwelling season. Although Djurfeldt
JOURNAL OF GEOPHYSICAL RESEARCH, VOL. 108, NO. C2, 3054, doi:10.1029/2001JC001272, 2003
Copyright 2003 by the American Geophysical Union.0148-0227/03/2001JC001272$09.00
36 - 1

[1989] used a similar approach to address the circulation inthe Gulf of Arauco, this is the first time that the gulfcirculation is studied with observations of high resolutionin the horizontal plane (hundreds of meters). Also, theseobservations are among the few of their kind in an equator-ward facing bay adjacent to an eastern boundary current. Inparticular, the Gulf of Arauco appears to enhance theformation of filaments and eddies that export nutrient-rich,upwelled waters to the open ocean [Caceres, 1992; Mesiaset al., 2001] owing to the abrupt change of orientation ofcoastline and bathymetry. The present study continues toaddress some of the reasons that explain the high biologicalproductivity of the region and the function of the gulf as aspawning and nursery area for small pelagic fishes andcopepods that encroach upon the coastal area during theupwelling season [Castro et al., 1993].
2. Study Area
[3] The Gulf of Arauco is an embayment with an approx-imate ‘‘U’’- or crescent-shaped opening equatorward,located off the central coast of Chile at 37�S (Figure 2). Itis characterized by a marked change in the general orienta-tion of the coastline from N-S to E-W. The presence of Isla
Santa Marıa, on the west, gives it its crescent appearance. Inthe N-S direction the gulf extends for almost 20 km fromBoca Grande to the coast on the south, and in the E-Wdirection it stretches for �25 km from Boca Chica on thewest to the coast on the east. Its surface area is �500 km2.[4] The bathymetry of the gulf is relatively smooth with
isobaths roughly following the coastline. Immediately to thenorth, the smooth isobaths are drastically modified by theBio-Bio Canyon, which cuts through the entire continentalshelf on the Itata Terrace [e.g., Djurfeldt, 1989; Sobarzo etal., 2001]. Maximum depths at Boca Grande, in the north-ern entrance, are 60 m. The presence of Isla Santa Marıamakes Boca Chica a shallow area of restricted waterexchange with the adjacent continental shelf to the west.[5] Wind forcing in the area of the gulf presents a well-
defined semiannual signal. Winds are southwesterly,upwelling favorable, during most of the austral spring andsummer (September to March) and shift to predominantlynortherly and northwesterly directions in late autumn andwinter (May to July) with transitional periods of variablewinds in April and August [Saavedra, 1980; Parada, 1999;Parada et al., 2001]. They are believed to be the maindriving agent of the nontidal circulation in the gulf [Paradaet al., 2001]. Autumn-winter winds are associated with
Figure 1. Sea surface temperature and color in the area of central Chile on 11 December 2000. Insertsof color in the Gulf of Arauco for 4 and 6 December illustrate the largest productivity in the gulfappearing on the southern end and also show a front that emanates northward from Punta Lavapie.
36 - 2 VALLE-LEVINSON ET AL.: FLOW IN AN EQUATORWARD FACING BAY

synoptic-scale winds that affect the Chilean coast. Spring-summer winds feature a sea breeze regime with its onshorecomponent peaking at around 3–5 m/s in the afternoon(between 1500 and 2000 local time) and reversing toweakly offshore at night. This summer regime is developedby the large air temperature gradients between land andocean that are boosted by the relatively cold waters of thecoastal ocean (typically 11�–15�C) and the relatively largeheat fluxes from the atmosphere.[6] The gulf receives buoyancy forcing from local
(atmospheric) and advective (from upwelling) heat fluxesand from freshwater discharge. During the summer, atmos-pheric heat fluxes exhibit marked diurnal variations relatedto periods of appreciable solar radiation during the day(Figure 3). This buoyancy forcing should readjust thebaroclinic pressure field and induce some type of circulationwith diurnal variability. Freshwater inputs to the gulf shouldonly be influential to the subtidal circulation in the winter,when the Bio-Bio River discharge reaches values of close to
3000 m3/s [Sobarzo et al., 1993]. In the summer, freshwaterinfluence on the hydrodynamics of the gulf is minimal,typically 200 m3/s.[7] The tides in the Gulf of Arauco are mixed with
semidiurnal dominance. Typical neap to spring tidal rangesoscillate between 0.5 and 1.5 m, a threefold increase thatshould cause fortnightly variations in the subtidal flows ofthe gulf. This issue remains to be explored formally. Theobservations described in this study were carried out underweak river discharge conditions and around neap tides, sotides and buoyancy from river forcing were weak andexerted minimal influence in the patterns observed.
3. Data Collection and Processing
[8] A variety of sampling activities took place in the Gulfof Arauco between 4 and 10 December 2000. Hydrographicvariables consisting of current velocity, temperature, salinity,and density were collected in combination with biological
Figure 2. Map of the study area in the Gulf of Arauco showing the two transects where observationstook place: Boca Grande and Boca Chica. The fixed station was located at ‘‘T.’’ The bathymetry of thearea is shown in shaded contours at intervals of 10 m between 0 and 100 m. The contour interval changesto 100 m from 100 to 500 m. The bathymetry to the south of Punta Lavapie is only nominal. Theanemometer was located at ‘‘A,’’ and the radiation measurements were taken at ‘‘R.’’ The top panelshows the location of the Gulf of Arauco in the context of a portion of South America.
VALLE-LEVINSON ET AL.: FLOW IN AN EQUATORWARD FACING BAY 36 - 3

variables (nutrients, chlorophyll, and ichtyoplankton) alongtwo transects and one fixed station. Only the hydrographicvariables are reported here. The first transect was locatedacross Boca Grande, between Punta Puchoco and PuntaEspolon on Isla Santa Marıa (Figure 2). The second transectcrossed Boca Chica between Punta Lavapie and Isla SantaMarıa (Figure 2). The fixed station was located within 2 kmto the east of Punta Lavapie (Figure 2).[9] The Boca Grande transect (Figure 2) was the most
intensively sampled during the period of study. The transectwas repeated 8 times over a 25-hour period on 5 and 6December. Current velocity measurements were recordedunderway and hydrographic stations were carried out at theend of each transect repetition. Individual repetitions of theBoca Grande transect, which typically lasted 3 hours, werealso carried out on 4, 6, and 8 December. In the Boca Chicatransect (Figure 2), hydrographic and underway currentvelocity profiles were sampled for 10 hours on 7 December.Wind and sea conditions hindered sampling throughout a fullsemidiurnal cycle and allowed only seven repetitions of thetransect. The fixed (anchored) station off Punta Lavapie was
occupied for 25 hours from 8 to 9 December 2000. Measure-ments of velocity profiles were combined with hydrographicdata collected every hour.[10] A 307.2-kHz Workhorse RD Instruments acoustic
Doppler current profiler (ADCP) was mounted on a boomon the starboard side of the R/V Kay-Kay of the Universidadde Concepcion in Chile. Underway data collection took placeat speeds between 2.5 and 3 m/s and consisted of 2-s pings,with a bin size of 1 m, that were averaged over 2 min to give aspatial resolution between 300 and 360 m. The first bin wascentered at a depth of 3m.Navigation datawere obtainedwitha Trimble 2000D Global Positioning System and used tocalibrate the ADCP compass according to Joyce [1989]. Baddata were identified and eliminated from further analysisfollowing the criteria presented by Valle-Levinson and Atkin-son [1999]. For the anchored station off Lavapie on 8 and 9December the ADCP pinged at 5-s intervals that wereaveraged over 30 min.[11] A SeaBird SBE19 conductivity-temperature-depth
(CTD) recorder with an oxygen sensor was used to obtainprofiles of temperature, salinity, and density. Data were
Figure 3. (a) Tidal forcing, (b) wind forcing, and (c) daily solar radiation, instantaneous and integrated,in the area of the Gulf of Arauco during the period of study. The shaded times denote when hydrographicand flow measurements took place. The tides (Figure 3a) were recorded in Talcahuano, just to the northof the gulf. The winds (Figure 3b) were measured at Punta Lavapie (‘‘A’’ in Figure 2) and show thedirection from which the wind blew, which was southerly for the entire period. The wind speed is shownas the solid line in (Figure 3b). The solar radiation (Figure 3c) in watts per square meter is plotted in ashaded line that increases and decreases within each day. The integrated solar radiation (in joules persquare meter) increases throughout the day.
36 - 4 VALLE-LEVINSON ET AL.: FLOW IN AN EQUATORWARD FACING BAY

recorded at 2 Hz, processed with the manufacturer’s soft-ware, and averaged to 1-m bins. Wind data were recordedwith a RM Young 05103 anemometer located on PuntaLavapie (37�100S, 73�350W, Figure 2). Solar radiation inwatts per square meter was measured at Bellavista (36�470S,73�070W, Figure 2).[12] For the data collected during the transect repetitions
at Boca Grande on 5 and 6 December a least squares fit tosemidiurnal ( period of 12.42 hours inherent of the M2constituent, the lunar semidiurnal tidal constituent) anddiurnal ( period of 23.93 hours of the K1 constituent, thediurnal tidal constituent) harmonics, as well as for a subtidalor net flow, was performed as in the Valle-Levinson et al.[2000] work. The fit had typical rms errors between fittedand observed signals of 0.03–0.05 m/s. A similar approachwas used for the transect repetitions at Boca Chica on 7December but fitting a semidiurnal harmonic only becauseof the sampling period (10 hours). In this case the rms errorswere smaller because the currents were weaker.
4. Data Description
4.1. Forcing From Tides and Winds
[13] During the 7 days of sampling (4–10 December),tidal forcing was predominantly semidiurnal but concen-
trated in neap tides (Figure 3a). Between 4 and 7 Decemberthe minimum tidal amplitude a of 0.25 m would yield adepth-averaged tidal current amplitude u0 that equals 2aYs/A[Stigebrandt, 1977] or �0.04 m/s, where s is the frequencyof the semidiurnal tide (2p/12.42 hours), Y is the area of thebasin to the south of Boca Grande (�5 � 108 m2), and A isthe area of the cross section at Boca Grande (�1 � 106 m2).Therefore tidal forcing was weak and should have had asmall influence on the observed patterns of subtidal flow.Note that the tidal amplitude can reach 0.9 m during springtides (almost a fourfold increase), so tidal forcing should bemore influential then.[14] During the 7 days of sampling the wind was strong
and steady from the south (Figure 3b). Its magnitudeincreased from the beginning to the end of our experimentsand in general showed a diurnal fluctuation consistent with asea breeze regime, as indicated by the 3-hour running mean.The daily maximum magnitude appeared close to midnightUT or 2000–2100 local time, right around sunset (in theaustral summer). As seen later, this timing, in which the peakof the vertical flux of horizontal momentum by the windstress coincides with the end of the vertical (downward) fluxof heat at the air-water interface, at least during our samplingperiod, may allow vertical exchange of properties in thewater column. Such vertical exchange should have important
Figure 4. Hydrographic sections across Boca Grande at the northern entrance to the Gulf of Arauco.The symbols denote the location of the conductivity-temperature-depth profiles. A well-definedpycnocline, thermocline, and oxycline appear between 10 and 20 m depth looking northward.
VALLE-LEVINSON ET AL.: FLOW IN AN EQUATORWARD FACING BAY 36 - 5

implications for the productivity of the gulf. Sections 4.2 and4.3 present the flow and hydrographic distributions observedat Boca Grande and Boca Chica, respectively.
4.2. Boca Grande
[15] The hydrographic distribution obtained from fiveCTD casts across Boca Grande on 6 December (Figure 4)showed a well-defined pycnocline, tracing the thermocline,and a strong oxycline between depths of 10 and 20 m. Theupper layer is warmed by atmospheric heating, reaching14�C, and is well oxygenated up to 9 mL/L. The character-istics of the upper layer were in sharp contrast to the lowerlayer, where the deepest water was �8�C and <1 mL/L.These water characteristics were typical of upwelled watersfrom the Gunther Current (or the Peru-Chile Undercurrent),which is the poleward undercurrent frequently found under-neath the Humboldt (or Peru-Chile) Current [Strub et al.,1998; Sobarzo et al., 2001]. The wind forcing and thehydrographic conditions observed were thus indicative of anactive upwelling situation that is explored next with the netor subtidal flows.
Figure 5. Mean flows obtained at Boca Grande during 25 hours of transect sampling at Boca Grande.(top) Contours, looking northward, denoting N-S component of the flow (in centimeters per second).Positive (open) contours denote northward flow. Line contours interval is 2.5 cm/s. The zero isotachdelineates the dark region that shows net inflow. (bottom) Vector representation of the mean flow atdifferent depths at Boca Grande. Each depth level is displaced in latitude and longitude for bettervisualization.
Figure 6. Fit (solid line) of diurnal and semidiurnalconstituents to the flow observations (asterisks) obtained atone point of the Boca Grande transect from 4 to 9 December2000.
36 - 6 VALLE-LEVINSON ET AL.: FLOW IN AN EQUATORWARD FACING BAY

[16] The subtidal flow measured at Boca Grande duringthe 25-hour period of transect repetitions on 5 and 6December indicated a net downwind flow over the shallowareas of the flanks of the gulf and a net upwind flow in the
deepest part in the middle of the section (Figure 5). Thesenet flows were practically in the same direction throughoutthe water column and agreed with theoretical wind-inducedpatterns over a bay with a parabolic or triangular shape [e.g.,
Figure 7. (a–c) Detided flow at Boca Grande for three different days and (d) net transport through BocaGrande as a function of northerly wind speed. In Figures 7a–7c, solid contours denote southward flow.Line contour interval is 10 cm/s with the zero isotach represented by a dashed line. Times in the middle ofthe transect are shown in UT (local time plus 3 hours). Figure 7d shows observed net transports ( plussigns) during the 3 days (Figures 7a–7c) in addition to the net transport on 5 and 6 December depicted onFigure 5. The estimates also show the range of uncertainty of the transports as the entire transect was notresolved by sampling. The diagonal line represents the fit between wind speed and transport. Negativevalues in the ordinate denote southward transports caused by northward winds.
VALLE-LEVINSON ET AL.: FLOW IN AN EQUATORWARD FACING BAY 36 - 7

Csanady, 1973; Hearn et al., 1987; Signell et al., 1990;Wong, 1994; Friedrichs and Hamrick, 1996]. The upwindflow seems to recirculate in a clockwise fashion over thewestern portion of the gulf and in a counterclockwisefashion over the eastern side. The volume influx (south-ward) through Boca Grande was �1.8 � 104 m3/s, while thevolume outflux (northward) was �1.5 � 104 m3/s. Thisrepresented a net upwelling-induced southward flux of�3000 m3/s, approximately two thirds of which was flushedthrough Boca Chica (see section 4.3) with the remainderprobably recirculated in the gulf.[17] The importance of wind forcing to the dynamics of
the Gulf of Arauco is indeed corroborated by the Wedder-burn number Wn [e.g., Geyer, 1997] that compares windstresses to baroclinic influences and is commonly used todetermine the wind stress influence on stratified lakes:
Wn ¼tSL
g�rH2u
;
where ts is the wind stress, L is the length of the gulf (20km), g is the acceleration due to gravity (9.8 m/s2),�r is thedensity contrast in the gulf (0.5 kg/m3), and Hu is thethickness of the upper layer. During the period ofmeasurements, ts was typically 0.1 Pa, and Hu was 10–20 m. For these values, Wn could be between 1 and 4, whichillustrates the importance of wind forcing.
[18] In order to investigate the persistence of the observedwind-induced pattern, we examined the data collected dur-ing the other individual crossings of Boca Grande on 4, 6,and 8 December. The observed currents during these cross-ings obviously had some tidal forcing influence, which hadto be subtracted to obtain the net flows. The tidal signal foreach period of observation was obtained from fitting semi-diurnal and diurnal harmonics to the entire time series(Figure 6). The assumption here was that both semidiurnaland diurnal contributions did not change over 5 days. Thisis a bit restrictive, but a longer time series is required toobtain a more reliable fit. In fact, a fit that included the S2tidal constituent ( period of 12 hours) did not improve the fitas the time series could not distinguish M2 from S2 in 5days of data. The length of the time series required to isolatethe individual contribution of these two constituents is givenby the difference in their frequencies, i.e., 0.00282 hour�1,which is equivalent to 14.79 days.[19] The detided flow showed persistent downwind flow
at the surface and over the shallow sides and upwind flow(related to upwelled water) in the deeper portions of thetransect (Figure 7). This pattern was consistent with thatobtained with the 25-hour time series (Figure 5). Thepersistence of the water exchange patterns at Boca Grandeindicated continuous upwelling during our period of obser-vations (Figures 7a–7c) as the northward wind increased.The net volume inflow (volume influx minus volume out-flux) through Boca Grande increased linearly with north-ward wind forcing (Figure 7d). This response was congruentwith the wind-induced flow that arises mainly from surfacestresses and the establishment of a barotropic pressuregradient. It should be noted that regardless of the dominantdynamics the net flux should be proportional to wind stressat these spatial scales. The volume fluxes extrapolated tocalm conditions are undistinguishable from zero (400 m3/s,likely within measurement error), which agrees with theconcept of no net volume flux for zero wind velocity. Analternative explanation for the flux patterns observed is thatthe separation of an upwelling jet at Punta Lavapie leads tothe downstream formation of eddies, some of which areentrained into the Gulf of Arauco [Mesias et al., 2001]. Therelative influence of local and remote forcing mechanismson the exchange patterns in the Gulf of Arauco, then,remains to be explored with longer time series.[20] The distributions of the amplitude and phase (Figure
8) of the diurnal currents revealed the locations in BocaGrande that responded best to the sea breeze forcing. Thesedistributions showed maximum diurnal variability at a sur-face layer that tilted upward toward the east (Figure 8a).They also exhibited large variability below the surface andnear the ends of the transect. The diurnal phase distributionsshowed a subsurface layer with a 12-hour lag relative to thesurface layer, which indicated flows in opposite directions(Figure 8b). The combination of the diurnal amplitude andphase distributions illustrated a surface layer, approximatelydelimited by the pycnocline (Figure 4), moving in the samedirection as the sea breeze and a subsurface layer movingsimultaneously in the opposite direction. The regions ofgreatest diurnal variability were likely related to local windforcing. The band of minimum diurnal variability thatalmost crossed from one side to the other of Boca Grande(Figure 8a) represented the transitions in the vertical plane
Figure 8. (a) Amplitude (in centimeters per second) andphase (in hours) of the semimajor axis of the diurnal tidalellipses derived from the fit to the 25-hour transectrepetitions of 5 and 6 December. Flows are represented byopen areas >10 cm/s. (b) Positive phase represented by openareas and negative phase represented by shaded areas. Viewis northward.
36 - 8 VALLE-LEVINSON ET AL.: FLOW IN AN EQUATORWARD FACING BAY
of the oppositely directed flows. The other region of lowvariability in the deepest part of the section was likelyconnected to the relatively steady, southward flowing upw-elled water that was forced remotely.[21] The hydrographic and flow measurements described
above indicated a southward advection of upwelled waterthrough Boca Grande. This upwelled water is probablyventilated (reaches the surface) at regions that are shallowenough, i.e., at the depth equivalent to the thickness of thebottom layer, andwhere the surface layer diverges to the sidesof the gulf at its southernmost end to give way to the upwelledwaters. The proximity of the Gunther current to the coastmight contribute to whether upwelled water has the appro-priate characteristics to enhance productivity. It is unclearwhat controls the proximity of the Gunther Current to thecoast. The section at Boca Grande must be the main pathwayof low-oxygen (usually nutrient-rich) water that is advectedto the southern part of the gulf. The persistence of thesouthward advection of upwelled water throughBocaGrandeshould represent one of the reasons why the gulf is highlyproductive relative to its adjacent waters (Figure 1).
4.3. Boca Chica
[22] The transect measurements across Boca Chica on 7December 2000 were influenced by relatively strong windsthat exceeded 15 m/s around sunset. Despite this windforcing the distribution of net flows exhibited an exchangepattern consistent with estuarine-like flow but not directlyforced by wind stress. Net surface outflow was restricted tothe upper 3 m, southward flow across the mouth was
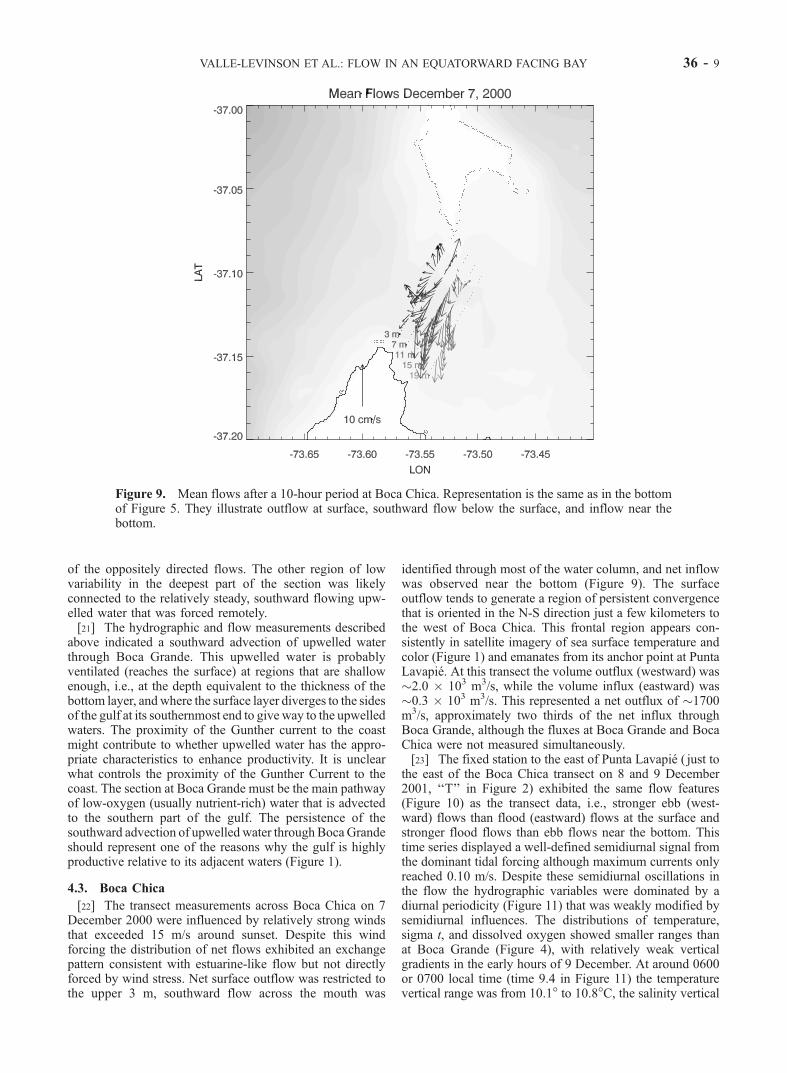
identified through most of the water column, and net inflowwas observed near the bottom (Figure 9). The surfaceoutflow tends to generate a region of persistent convergencethat is oriented in the N-S direction just a few kilometers tothe west of Boca Chica. This frontal region appears con-sistently in satellite imagery of sea surface temperature andcolor (Figure 1) and emanates from its anchor point at PuntaLavapie. At this transect the volume outflux (westward) was�2.0 � 103 m3/s, while the volume influx (eastward) was�0.3 � 103 m3/s. This represented a net outflux of �1700m3/s, approximately two thirds of the net influx throughBoca Grande, although the fluxes at Boca Grande and BocaChica were not measured simultaneously.[23] The fixed station to the east of Punta Lavapie ( just to
the east of the Boca Chica transect on 8 and 9 December2001, ‘‘T’’ in Figure 2) exhibited the same flow features(Figure 10) as the transect data, i.e., stronger ebb (west-ward) flows than flood (eastward) flows at the surface andstronger flood flows than ebb flows near the bottom. Thistime series displayed a well-defined semidiurnal signal fromthe dominant tidal forcing although maximum currents onlyreached 0.10 m/s. Despite these semidiurnal oscillations inthe flow the hydrographic variables were dominated by adiurnal periodicity (Figure 11) that was weakly modified bysemidiurnal influences. The distributions of temperature,sigma t, and dissolved oxygen showed smaller ranges thanat Boca Grande (Figure 4), with relatively weak verticalgradients in the early hours of 9 December. At around 0600or 0700 local time (time 9.4 in Figure 11) the temperaturevertical range was from 10.1� to 10.8�C, the salinity vertical
Figure 9. Mean flows after a 10-hour period at Boca Chica. Representation is the same as in the bottomof Figure 5. They illustrate outflow at surface, southward flow below the surface, and inflow near thebottom.
VALLE-LEVINSON ET AL.: FLOW IN AN EQUATORWARD FACING BAY 36 - 9

range was from 34.48 to 34.49, the sigma t vertical rangewas from 26.4 to 26.5 kg/m3, and the vertical range indissolved oxygen was from 3.3 to 3.9 mL/L. The weakvertical gradients during the early hours of the day suggestenhanced vertical mixing in Boca Chica relative to BocaGrande. This concept is further explored in section 4.4 bycomparing the diurnal changes in stratification at bothlocations.
4.4. Diurnal Changes in Stratification
[24] The water column stratification may be described interms of one parameter j that represents the energy requiredto completely mix the water column or the potential energyanomaly [e.g., Simpson et al., 1990] in joules per cubicmeter:
f ¼ g
h
Z0
�h
r� �rð Þzdz
where r, �r, g, z, and h are the water density as a function ofdepth, the depth-averaged water density, the accelerationdue to gravity, the vertical coordinate (positive upward), andthe water column depth, respectively. The values of j fromthe eastern station at Boca Grande (Figure 8a) for 5 and 6December indicate the greatest stratification (greatest valuesof j) late in the day, around 2000 local time, and weakest
stratification early in the day, around 0600 (circles and plussigns in Figure 12a). These stratification patterns are verysimilar, qualitatively, to those observed in Boca Chica(asterisks in Figure 12a), although the values are markedlysmaller. These patterns indicate (1) that stratificationextremes are approximately in phase at both locations and(2) that Boca Grande is more stratified than Boca Chica by�15 J/m3. The causes for this difference in startification canbe explored through the changes of j over time.[25] The changes in j over time, as shown in Figures 12b
and 12c, should result from the competition between mixingand stratifying tendencies. Mixing tendencies include sur-face and bottom stresses, and stratifying tendencies includeheat fluxes and advection of buoyancy. In the study area,bottom stresses are at least 1 order of magnitude weakerthan surface stresses, and advection of buoyancy requiresknowledge of the horizontal density gradients. Thereforeonly the temporal changes in j owing to surface stresses(dj/dtW) and heat fluxes (dj/dtQ) were estimated with thedata available. For these estimates the relationships dj/dtW’ �1.6 � 10�6W 3/h, where W is the wind speed in metersper second, and dj/dtQ � 2 � 10�7Q, where Q is heat fluxin watts per square meter, were used [Simpson et al., 1990].In this application it is assumed that the solar radiationshown in Figure 3c accounts for most of the heat flux.These relationships show that wind mixing power is inver-sely related to the local depth, so more mixing power perunit volume is expected at Boca Chica than at Boca Grande,and this should explain the weaker stratification of thatlocation.[26] The combined effect of dj/dtW and dj/dtQ results in
negative values that indicate that destratification shouldoccur for both Boca Grande (Figure 12b) and Boca Chica(Figure 12c) throughout the diurnal cycle. This destratifica-tion tendency agrees with the observed temporal changes inj during the period between 0500 and 1000 but is oppositeto that observed in the afternoon, when the wind is strongestand yet stratification increases. This result suggests thatwind stresses and heat fluxes are enough to explain thestratification changes during the early daylight hours but areinsufficient to account for the afternoon stratification. Thisdiscrepancy could be the result of (1) sensible and latentfluxes, not taken into consideration in the heat flux esti-mates, accounting for much larger heat fluxes than thosemeasured from solar radiation, (2) advection of buoyancy,an element missing in the calculations, playing a crucial rolein the stratification patterns of the Gulf of Arauco, or (3) acombination of both. The fact that maximum stratification isachieved approximately at the time of maximum wind speedsuggests that wind forcing in this area acts more to advectbuoyancy than to mix it at least at the time of positive heatfluxes (from air to water). This finding is consistent withthat of Atkinson et al. [1989] in the South Atlantic Bightwhere Ekman transport overcame strong winds and largeheat losses.
5. Discussion
[27] Two phenomena worth noting were identified in theGulf of Arauco, and they are illustrated for Boca Grande inFigures 13 and 14. They are related to the generation ofovertides and the formation and propagation of internal
Figure 10. Time series (in UT) of flows at different depthsat anchored station ‘‘T’’ shown in Figure 2. North ispointing upward. Westward flow (out of the gulf) ispredominantly observed near the surface (4 and 7 m), andeastward flow (into the gulf) dominates near the bottom(below 13 m).
36 - 10 VALLE-LEVINSON ET AL.: FLOW IN AN EQUATORWARD FACING BAY

motions along the coast that dissipate in the shallow area ofBoca Chica. The generation of overtides is suggested by theamplitude of the semidiurnal tidal currents, which wascomparable to that of the diurnal currents but only overthe shallow (<30 m) areas (Figure 13). The semidiurnalvariability was negligible in the deep part of the section,which indicated that semidiurnal tidal forcing was unim-portant at Boca Grande as expected from the small tidalranges during the period of study. The relatively largesemidiurnal amplitudes over the shallow regions must thenreflect a harmonic response to diurnal forcing (overtide) thatarises from nonlinearities related to bottom friction, advec-tion, and/or continuity [e.g., Parker, 1991]. The specificmechanism that generated these semidiurnal overtides is atopic that merits more attention, but that may only besubstantiated with a time series across Boca Grande oflonger coverage than those obtained in this study.[28] The formation and propagation of internal motions
may be quite energetic as identified from the time series of
the hydrographic variables on the eastern side of BocaGrande (Figure 14). This time series illustrates diurnalvertical excursions of the pycnocline of around the 10-mrange. The vertical excursions seem to be forced by verticalfluxes of (1) heat (through air-sea diurnal heating) and (2)horizontal momentum (through the diurnal sea breezeregime). The pycnocline is deepest in the early evening(2000–2100 local time) at the end of the landward wind,which approximately coincides with the end of the heatinput to the sea surface. This diurnal perturbation of thepycnocline could generate internal motions that propagatewith the coast on the left, as in an internal Kelvin wave, andwould dissipate once they get to the shallow (<20 m)southwestern mouth of the gulf at Boca Chica. It is possiblethat, at that location, nutrients are mixed upward to thephotic layer and enhance the productivity of the area. Thishypothesis is consistent with a mechanism proposed byDjurfeldt [1989], although his mechanism was triggered bya wind reversal from southerly to northerly and had a
Figure 11. Time series of wind speed, flow, and hydrographic variables during the anchored station at‘‘T’’shown in Figure 2.
VALLE-LEVINSON ET AL.: FLOW IN AN EQUATORWARD FACING BAY 36 - 11

periodicity of 2–5 days. The mechanism proposed hereinoccurs at a higher frequency, i.e., every day versus every 2–5 days. The hypothesis related to the diurnal periodicity issupported by the 25-hour time series measurements carriedout to the east of Punta Lavapie (close to Boca Chica) thatshowed weakened vertical gradients in all hydrographicproperties relative to those observed at Boca Grande. Analternative to this hypothesis is that the weakened verticalgradients could be caused entirely by wind-driven mixing.Such hypotheses are worth exploring with more compre-hensive measurements.[29] The exchange pattern at Boca Chica was likely
driven by remotely forced Ekman dynamics on the outershelf or by curvature effects associated with flow around aheadland [e.g., Pattiaratchi and Collins, 1987; Geyer,1993]. The near-surface net flow away from the headlandarises from a balance between centrifugal accelerations andpressure gradient. The near-bottom net flow toward theheadland results from an imbalance in favor of the pressuregradient force owing to the weakening of the centrifugalaccelerations as the flow decreases with depth. This has
Figure 12. Diurnal variations of (a) j at Boca Grande and Boca Chica, (b) dj/dt at Boca Grande, and(c) dj/dt at Boca Chica. In Figure 12a the circles denote measurements on 5 and 6 December 2000. Theplus signs denote the average j for both days. The asterisks indicate observed j on 8–9 December. InFigures 12b and 12c the solid lines represent observed values (derived from Figure 12a) and the shadedlines denote the estimates of dj/dtW + dj/dtQ.
Figure 13. Amplitude (in centimeters per second) of thesemimajor axis of the semidiurnal tidal ellipses derivedfrom the fit to the 25-hour transect repetitions of 5 and 6December. Open areas indicate flows >10 cm/s.
36 - 12 VALLE-LEVINSON ET AL.: FLOW IN AN EQUATORWARD FACING BAY

been identified as a region of coastal flow separation by themodeling results of Mesias et al. [2001]. The mechanismthat generates the exchange pattern at Boca Chica is anothertopic that is worth exploring further.
6. Summary
[30] Shipborne observations of current and hydrographicvariables in an equatorward facing bay adjacent to a coastalupwelling center, the Gulf of Arauco in Chile, suggestedtwo mechanisms that may cause the high primary produc-tivity of the system. The first mechanism was related to apersistent flow into the gulf through the deepest part ofBoca Grande (the equatorward facing entrance to theembayment). This poleward flow was cool and had lowdissolved oxygen, characteristic of the upwelled water in theregion. The poleward flow was likely part of a double gyre(Figure 15) that caused flow divergence in the southern endof the gulf and allowed the cool upwelled water to surfacein that southern portion of the gulf. A portion of thisupwelled flux was recirculated in and out of the gulfthrough the same area of Boca Grande and also through awestward opening at Boca Chica. The second mechanism
Figure 14. Time series of hydrographic variables at the eastern end of Boca Grande. Small symbolsdenote the location and time (in UT, local plus 3 hours) of observations. The diurnal excursions of thepycnocline were resolved best on 5 and 6 December.
Figure 15. Schematic representation of the proposedcirculation in the Gulf of Arauco during upwelling (south-erly) winds.
VALLE-LEVINSON ET AL.: FLOW IN AN EQUATORWARD FACING BAY 36 - 13

was not as evident with our observations but has to do withthe diurnal variability in heat (from air-sea interactions) andhorizontal momentum (from wind stress) fluxes. This diur-nal forcing causes oscillations of the pycnocline with rangesof �10 m that may propagate poleward along the coast,emulating a Kelvin wave. These oscillations may breakdown in the shallow portions (<20 m) of Boca Chica,hindering the wave from further propagation and allowingthe mixing of properties in the water column. These twomechanisms should be responsible for the high productivityof the gulf, and both are located in the southern end of thegulf, where color images suggest maxima in concentrationsof chlorophyll (e.g., Figure 1).
[31] Acknowledgments. This study was funded by the U.S. NationalScience Foundation (NSF) under a supplement to project OCE-9812206and by a FONDECYT (Chilean equivalent of NSF) Project 1990470. Weare very grateful to the captain and crew of the R/V Kay-Kay for theircooperation during the data collection. Also, the help of Rosario Sanay,Rodrigo Veas, Chris Katzenmiller, and Wolfgang Schneider was pivotal forthe successful collection of data. The SeaWifs images were processed byGabriel Yuras (PROFC, Universidad de Concepcion), and the SST imageswere processed by the CARSAT Laboratory of the Universidad Catolica deValparaıso. A cooperative program between NSF (U.S.) and CONICYT(Chile) also contributed to the collaboration between the investigators fromOld Dominion University and Universidad de Concepcion. The commentsof two anonymous reviewers are gratefully acknowledged as they improvedthe presentation of the manuscript.
ReferencesAtkinson, L. P., E. Oka, S. Y. Wu, T. J. Berger, J. O. Blanton, and T. N. Lee,Hydrographic variability of southeastern United States shelf and slopewaters during the Genesis of Atlantic Lows Experiment: Winter 1986,J. Geophys. Res., 94(C8), 10,699–10,713, 1989.
Caceres, M., Vortices y filamentos observados en imagenes de satelitefrente al area de surgencia de Talcahuano, Chile central, Invest. Pesq.Chile, 37, 55–66, 1992.
Castro, L. R., P. A. Bernal, and V. A. Troncoso, Coastal intrusion ofcopepods: Mechanisms and consequences in the population biology ofRhincalanus nasutus, J. Plankton Res., 15(5), 501–515, 1993.
Csanady, G. T., Wind-induced barotropic motion in long lakes, J. Phys.Oceanogr., 3, 429–438, 1973.
Djurfeldt, L., Circulation and mixing in a coastal upwelling embayment;Gulf of Arauco, Chile, Cont. Shelf Res., 9, 1003–1016, 1989.
Figueroa, D., and C. Moffat, On the influence of topography in the induc-tion of coastal upwelling along the Chilean coast, Geophys. Res. Lett.,27(23), 3905–3908, 2000.
Friedrichs, C. T., and J. M. Hamrick, Effects of channel geometry on crosssectional variations in along channel velocity in partially stratified estu-aries, in Buoyancy Effects on Coastal and Estuarine Dynamics, CoastalEstuarine Stud., edited by D. G. Aubrey and C. T. Frederichs, vol. 53,pp. 283–300, AGU, Washington, D. C., 1996.
Geyer, W. R., Three-dimensional tidal flow around headlands, J. Geophys.Res., 98(C1), 955–966, 1993.
Geyer, W. R., Influence of wind dynamics and flushing of shallow estu-aries, Estuarine Coastal Shelf Sci., 44, 713–722, 1997.
Hearn, C. J., J. R. Hunter, and M. L. Heron, The effects of a deep channelon the wind-induced flushing of a shallow bay or harbor, J. Geophys.Res., 92(C4), 3913–3924, 1987.
Joyce, T. M., On in situ ‘‘calibration’’ of shipboard ADCPs, J. Atmos.Oceanic Technol., 6, 169–172, 1989.
Mesias, J. M., R. P. Matano, and P. T. Strub, A numerical study of theupwelling circulation off central Chile, J. Geophys. Res., 106(C9),19,611–19,623, 2001.
Parada, C. E., Influencia de factores fisicos en la variabilidad interdiaria dela distribucion de estados tempranos de Engraulis ringens en el Golfo deArauco, M.S. thesis, 98 pp., Univ. Concepcion, Concepcion, Chile, 1999.
Parada, C. E., M. A. Sobarzo, D. Figueroa, and L. Castro, Circulation of theArauco Gulf in a seasonal transitional period: A new approach (in Span-ish), Invest. Mar. CICIMAR, 29(1), 11–23, 2001.
Parker, B. B., The relative importance of the various non-linear mechanismsin a wide range of tidal interactions (review), in Tidal Hydrodynamics,edited by B. B. Parker, pp. 237–268, John Wiley, New York, 1991.
Pattiaratchi, C., and M. Collins, Mechanisms for linear sandbank formationand maintenance in relation to dynamical oceanographic observations,Prog. Oceanogr., 19, 117–176, 1987.
Rosenfeld, L., F. B. Schwing, N. Garfield, and D. E. Tracy, Bifurcated flowfrom an upwelling center: A cold water source for Monterey Bay, Cont.Shelf Res., 14, 931–964, 1994.
Saavedra, N., La presion y la direccion del viento en Concepcion, Tralka, 1,153–162, 1980.
Signell, R. P., R. C. Beardsley, H. C. Graber, and A. Capotondi, Effect ofwave-current interaction on wind-driven circulation in narrow, shallowembayments, J. Geophys. Res., 95(C6), 9671–9678, 1990.
Simpson, J. H., J. Brown, J. Matthews, and G. Allen, Tidal straining,density currents and stirring in the control of estuarine stratification,Estuaries, 13(2), 125–132, 1990.
Sobarzo, M., E. Sansone, A. Demaio, D. Arcos, M. Salamanca, andJ. Henrıquez, Variabilidad espacio temporal de la estructura hidrograficade las aguas del Golfo de Arauco, Sci. Rep. Ser., vol. 4, Cent. Univ. Int.Europa-Lationoamerica de Investigacion y Formacion en Ciencias Am-bientales Environ. Sci. Cent., Univ. Concepcion, Conception, Chile,1993.
Sobarzo, M., D. Figueroa, and L. Djurfeldt, Upwelling of subsurface waterinto the rim of the Biobıo submarine canyon as a response to surfacewinds, Cont. Shelf Res., 21, 279–299, 2001.
Stigebrandt, A., On the effect of barotropic current fluctuations on the two-layer transport capacity of a constriction, J. Phys. Oceanogr., 7, 118–122, 1977.
Strub, T., J. Mesıas, V. Montecino, J. Rutllant, and S. Salinas, Coastal oceancirculation off western South America, Coastal Segment (6,E), in TheSea, vol. 11, edited by A. Robinson and K. Brink, pp. 273–313, JohnWiley, New York, 1998.
Valle-Levinson, A., and L. P. Atkinson, Spatial gradients in the flow over anestuarine channel, Estuaries, 22(2A), 179–193, 1999.
Valle-Levinson, A., K.-C. Wong, and K. M. M. Lwiza, Fortnightly varia-bility in the transverse dynamics of a coastal plain estuary, J. Geophys.Res., 105(C2), 3413–3424, 2000.
Wong, K.-C., On the nature of transverse variability in a coastal plainestuary, J. Geophys. Res., 99(C7), 14,209–14,222, 1994.
�����������������������L. P. Atkinson and A. Valle-Levinson, Center for Coastal Physical
Oceanography, Ocean, Earth and Atmospheric Sciences Department OldDominion University, Crittenton Hall, 768 W. 52nd Street, Norfolk, VA23539, USA. ([email protected]; [email protected])L. Castro, Departamento de Oceanografıa, Universidad de Concepcion,
Barrio Universitario s/n, Vıctor Lamas 1290, Casilla 160-C, Concepcion,Octavia Region, Chile. ([email protected])D. Figueroa, Departamento de Fısica de la Atmosfera y del Oceano,
Universidad de Concepcion, Barrio Universitario s/n, Vıctor Lamas 1290,Casilla 160-C, Concepcion, Octavia Region, Chile. ([email protected])
36 - 14 VALLE-LEVINSON ET AL.: FLOW IN AN EQUATORWARD FACING BAY