fire-resistant geopolymer concrete and its application in ...
180
FIRE-RESISTANT GEOPOLYMER CONCRETE AND ITS APPLICATION IN CONCRETE FILLED STEEL TUBES YI-FANG CAO 2017
-
Upload
khangminh22 -
Category
Documents
-
view
0 -
download
0
Transcript of fire-resistant geopolymer concrete and its application in ...

FIRE-RESISTANT GEOPOLYMER CONCRETE
AND ITS APPLICATION IN
CONCRETE FILLED STEEL TUBES
YI-FANG CAO
2017

FIRE-RESISTANT GEOPOLYMER CONCRETE
AND ITS APPLICATION IN
CONCRETE FILLED STEEL TUBES
YI-FANG CAO
A THESIS SUBMITTED
FOR THE DEGREE OF MASTER OF PHILOSOPHY
CENTRE FOR INFRASTRUCTURE ENGINEERING
SCHOOL OF COMPUTING, ENGINEERING AND MATHEMATICS
WESTERN SYDNEY UNIVERSITY
August 2017

Declaration
I hereby declare this thesis is my original work and it has been written by me in its
entirety. I have duly acknowledged all the sources of information which have been
used in this thesis.
This thesis contains no material which has been accepted for the award of any other
degree or diploma in any university.
(Signature)
Yi-Fang Cao
21-August -2017

Dedication
This thesis is dedicated to my parents who have always been
a source of encouragement and stamina to undertake my research and to
face the eventualities of life with zeal, enthusiasm and fear of god.

Abstract
YI-FANG CAO i
ABSTRACT
Concrete-filled steel tubular (CFST) columns, composed of core concrete and
outer tubes, have been extensively used as main structural elements in high-rise
buildings to carry loads. Due to the composite action between the steel and core
concrete, this type of composite construction has been reported to have many
constructional and structural benefits, such as easy construction from the omission of
formwork, restraint to local buckling of the steel tube provided by the core concrete,
high strength, stiffness and ductility. Recently, there is increased interest in adopting
CFST columns in composite frame systems.
In recent years, fire disasters have frequently been reported worldwide, and
seriously threatened personal and public safety. Exposure of concrete and steel to fire
will lead to serious structural deterioration and possible failure of columns, thus
resulting in local or global collapse of a building. However, in most cases, unprotected
CFST columns are not able to maintain structural integrity for sufficient time under
fire conditions. External insulating coating or internal reinforcing steel are required to
improve the fire resistance of CFST columns, but these two methods tremendously
increase the cost of CFST columns and the difficulty of construction.
Although ordinary Portland cement (OPC) concrete is classified as a fire-
resistant construction material, during fire exposure severe spalling may occur, as well
as significant deterioration of strength and stiffness. Therefore, there is a need to find
alternative materials to replace OPC to further improve the fire resistance of concrete.
Geopolymer is aluminosilicate synthesised from a material of geological origin or
industry by-products (e.g. fly ash) with alkaline solutions. In Australia, fly ash is
abundantly available from numerous thermal power plants. The use of fly ash to
Abstract
YI-FANG CAO ii
manufacture construction materials can promote the better utilisation of this industry
by-product, avoiding disposal into landfill. Previous studies have demonstrated that
geopolymer can be successfully used as a binder to make geopolymer concrete. The
absence of OPC in geopolymer concrete (GPC) can significantly reduce CO2
emissions for the construction industry. Recent research has proved that GPC has
substantially better fire performance than OPC concrete. Therefore, GPC has the
potential to be used in CFST columns to improve their fire performance. So far, very
little research has been conducted to investigate the behaviour of geopolymer concrete-
filled steel tubular (GCFST) columns, and this research aims to address this knowledge
gap.
In this thesis, salient parameter analysis of GPC mix was conducted based on
the Taguchi method, and three optimised GPC mix designs were proposed. Material
properties such as slump, density, Young’s modulus, compressive strength, flexural
strength and splitting tensile strength were experimentally studied. The measured
values of Young’s modulus, flexural strength and splitting tensile strength of GPC are
compared favourably to the predictions of existing standards. The measured hot
strength and displacement of GPC under combined loading and elevated temperature
were reported. Full-range stress-strain curves of GPC and reference OPC after exposed
to elevated temperatures were evaluated. The results further confirm that GPC has the
potential to improve the fire performance of CFST columns.
A total of 15 tests were carried out on GCFST columns and conventional CFST
columns to compare their behaviours. The main experimental parameters included: (1)
Concrete type (geopolymer concrete and OPC concrete); (2) Curing procedure of GPC
(ambient curing and elevated temperature curing); (3) Strength of geopolymer concrete

Abstract
YI-FANG CAO iii
(37.4, 58.6 and 68.4 MPa); (4) Test method (tested at ambient temperature, in fire, or
after fire exposure). The axial load, axial strain and lateral strain were measured for
ambient temperature tests and residual property tests. The axial displacement versus
the temperature curves were recorded for the specimens tested under combined load
and temperature increase. The results were compared to predictions of numerical
models developed with ABAQUS, and the agreement between them is reasonable.
This research confirms that the behaviour of GPC at an ambient temperature is
comparable to that of OPC concrete at an ambient temperature. However, GPC has
better fire performance and a higher post-fire residual strength than OPC concrete.
This study has proved the potential of using GPC as fire-resistant concrete in CFST
columns. Thus, the use of external insulating coating or internal reinforcing steel could
be potentially eliminated for CFST columns.
Acknowledgements
YI-FANG CAO iv
Acknowledgements
I would like to acknowledge and offer thanks to many people who helped me
during the journey to my degree. This journey of discovery would not have been
possible without their support, advice and contributions.
First and foremost, I would like to express my deepest gratitude to my
supervisors, Prof. Zhong Tao Dr. Zhu Pan and Dr. Richard Wuhrer, not only for
providing me guidance, but also for encouraging me to pursue an academic career. I
never felt helpless in the whole process as a candidature of MPhil degree. Their
knowledge, wisdom and feedback during various stage of this study are highly
appreciated. I would also like to thank them for editing my thesis chapters and
manuscripts despite their busy schedule.
My sincere appreciation is dedicated to all lab staff at the Structural Research
and Testing Laboratory, especially Robert Marshall, Murray Bolden, Zachariah White
and Ali Gharizadeh for their help in tackling all experimental challenges.
I extend my gratitude to all staff in Advanced Materials Characterisation
Facility (AMCF) for vital equipment support. Special thank was addressed to Timothy
Murphy, Laurel George and Shamila Salek for their technical assistance and training.
My thanks were acknowledged to Dr. Md Kamrul Hassan and Utsab Katwal
for giving me important support in CFST modelling. The help of Dr. Xin Yu was
appreciated for his valuable suggestions. I am grateful to David Batten, Bec Breust,
Ashley Bertholdand and other administrative staffs. They offered a professional
support to my study. I am deeply thankful to Ann-Marie Blanchard for editing my
Acknowledgements
YI-FANG CAO v
thesis who also gave me some insightful advice on word choice. Thanks also go to Ms.
Xue Liu for proofreading and constant help.
Last but certainly not the least, I would like to express my gratitude to my
friends and colleagues who made my past 2 years much more enjoyable and
memorable: A/Prof. Yongjin Li, Prof. Qingxin Ren, Dr. Mengning Lyu, Dr. Yang An,
A/Prof. Zhibin Wang, Dr. Ee Loon Tan, A/Prof. Xingqiang Wang, A/Prof. Guihan
Peng, Dr. Rui Li, Dr. Parveen Khanehzaei, Dr. Graeme McKenzie, Ms. Soheila
Peyrovi Cheshnasar, Mr. Richard Abubakar Shuaibu and Mr. Neelam Bajracjarya.

List of Publications
YI-FANG CAO vi
List of Publications
Refereed Journal Paper:
Y.M. Wang, Y.B. Shao and Y.F. Cao (2017), Static behavior of steel tubular structures
considering local joint flexibility, Steel and Composite Structures, 24(4) 425-439.
Submitted Journal Paper:
Pan Z., Tao Z., Cao Y. F., Wuhrer R., Murphy T. Compressive strength and
microstructure of alkali-activated fly ash/slag binders at high temperature. Cement and
Concrete Composites, Minor revision.
Refereed Conference Papers:
Y.F Cao, Z. Tao, Z. Pan T. Murphy & R. Wuhrer (2016), Influence of calcium
aluminate cement on strength development of geopolymers cured at room temperature,
pp. 927-932, Mechanics of Structures and Materials: Advancements and Challenges,
24th Australasian Conference on the Mechanics of Structures and Materials (Perth),
2016, Taylor & Francis Group (London).
Z. Pan, Z. Tao, Y.F. Cao & N. Bajracharya, T. Murphy & R. Wuhrer (2016),
Comparative performance of alkali-activated slag and fly ash at elevated temperatures,
pp. 415-420, Mechanics of Structures and Materials: Advancements and Challenges,
24th Australasian Conference on the Mechanics of Structures and Materials (Perth),
2016, Taylor & Francis Group (London).

List of Publications
YI-FANG CAO vii
Submitted Conference Papers:
Y.F Cao, Z. Tao, Z. Pan T. Murphy & R. Wuhrer (2017), Fire resistance of fly ash-
based geopolymer concrete blended with calcium aluminate cement, submitted to 1st
International Conference on Structural Engineering Research (iCSER), Sydney, 2017.
Z. Pan, Z. Tao, Y.F. Cao & N. Bajracharya, T. Murphy & R. Wuhrer (2016), Effect
of temperature on thermal properties of alkali-activated fly ash/slag binders, submitted
to 1st International Conference on Structural Engineering Research (iCSER), Sydney,
2017.
Z. Tao, Y.F. Cao, Z. Pan & Hassan, M, (2017), Behaviour of Geopolymer Concrete-
Filled Steel Tubular Columns at Ambient and Elevated Temperatures, submitted to
The 9th Chinese Conference on Fire Resistance of Structures, Lanzhou.

Table of Contents
YI-FANG CAO viii
Table of Contents
Abstract……………………………………………….………………………..…….i
Acknowledgements………………………………………………...……………….iv
List of Publications………………………………………………………..………..vi
Table of Contents……………………………………………………………...…..viii
List of Figures………………………………………………………...………...…..xv
List of Tables………………………………………………………………..……...xx
Abbreviations, Acronyms and Symbols…………………………...…...………..xxii
Chapter 1 Introduction………………………………………………….……...…..1
1.1 General……………………………………………...……………………..1
1.2 Background………………………….…...…………………..…………....3
1.2.1 Fire hazard in structures………………….………………………….3
1.2.2 Fly ash-based geopolymer.…… ……………………….….…...…....5
1.2.3 Concrete filled steel tubular columns………………….…….......…..5
1.3 Research motivation………………………………………………...……..6
1.4 Research objectives, limitation and scope of work………………………..8
1.4.1 Research objectives...……………… ……….….…………………...8

Table of Contents
YI-FANG CAO ix
1.4.2 Research limitation.……………… …………………………….…....9
1.4.3 Research scope…..………………….…….………………….….…...9
1.5 Layout of the thesis………….……………..………………….…………..9
Chapter 2 Literature Review………………………………………...…...….…….12
2.1 General…………………………………………………………....…...…12
2.2 Geopolymer concrete (GPC)………….…………………….……………12
2.2.1 Current development………….………….….………………..........12
2.2.2 Effect of alkali solution.…………………………………......……..13
2.2.3 Effect of curing procedures……..….…….……....………..………..16
2.2.4 Effect of additives.…………..….… ….……………..…….……….17
2.3 Properties of GPC at an ambient temperature………….…………..….….19
2.3.1 Workability………………………….…………………..…..….…..19
2.3.2 Compressive stress-strain models….…...……….……………..…...20
2.4 Properties of GPC at elevated temperatures……..……..…….……….…..24
2.4.1 Hot strength ………………..………….………….……………......24
2.4.2 Residual strength…………………………….…………………......26
2.5 CFST columns…….………………………...…………….…….…..…….29

Table of Contents
YI-FANG CAO x
2.5.1 Development of CFST columns…………..………………….…......29
2.5.2 CFST columns at elevated ambient temperature……..………..……30
2.5.3 CFST columns at elevated temperatures………………..….……….33
2.6 Summary…………………………....…………………………..…...…....35
Chapter 3 Experimental Program………………………………….…..…………37
3.1 Introduction……………………………………………...…………...…..37
3.2 Materials…...……………………………………...…...………....………37
3.2.1 Fly ash and calcium aluminate cement (CAC)…..……..……...........37
3.2.2 Alkaline activators……………………..……………….….....……..39
3.2.3 Aggregates…………………......….………...…………….………...40
3.2.4 Superplasticiser………………………….………………………….40
3.3 Concrete experimental method……………………………….……….…..41
3.3.1 Sample preparation…………….....…………………………....……41
3.3.2 Testing regime…………………….……………………….………..42
3.4 CFST experimental method…………………………………..….……….50
3.4.1 Sample preparation……………….…………...….….....….……….50
3.4.2 Testing regime……………….……………………………….…….51

Table of Contents
YI-FANG CAO xi
3.5 Summary…………….…………………………………...…....……….....54
Chapter 4 Development of Optimised Mix Design for Geopolymer Concrete…55
4.1 Introduction……………………………………………………..………..55
4.2 Background of Taguchi method….…………………………….…….…..55
4.3 Controlling ratios in GPC….………………………...………..….………57
4.3.1 Alkali solution concentration………….………………………..…..57
4.3.2 Calcium aluminate cement replacement ratio...…...………….….…58
4.3.3 Activator to binder ratio…….…..……..………..………..………...58
4.4 Salient parameter analysis and optimised mixing design...……….…….…..59
4.4.1Salient parameter analysis on workability……….……………..……..61
4.4.2 Salient parameter analysis on compressive strength….………...…….62
4.4.3 Optimised mixing design…………………………........…..…….…...66
4.5 Summary………………….………..………..……………....………….…67
Chapter 5 Behaviour of GPC at Ambient Temperature…………….…….…….69
5.1 Introduction………………………………...………...……...….………..69
5.2 Test results and discussion of GPC…………………………….…..…….69
5.2.1 Workability of fresh concrete………..……..………....……............70

Table of Contents
YI-FANG CAO xii
5.2.2 Density of hardened concrete………………………….….…..…….72
5.2.3 Young’s modulus………..….………..………………….…............72
5.2.4 Compressive strength………………………………………..….….73
5.2.5 Splitting tensile strength…………...……..………….…….……….74
5.2.6 Flexural strength…………..……….………….....…….……...........74
5.3 Microstructure characterisation of geopolymer pastes…………..………..75
5.3.1 Conversion of CAC………….……...………......…………...……..76
5.3.2 Thermal gravimetric analysis (TGA)..……..……...….….....……....79
5.3.3 Scanning electron microscopy (SEM) analysis..………….…..……80
5.4 Comparison of experimental results with existing models.….…..………..84
5.4.1 Comparison of Young’s modulus………...………….….….…........84
5.4.2 Comparison of splitting tensile strength ………………..............….86
5.4.3 Comparison of flexural strength……….........…....…….…….….....88
5.5 Summary…………………………………..………....………..….………89
Chapter 6 Performance of GPC at Elevated Temperatures….…...............…….91
6.1 Introduction……………………………………………...……….……….91
6.2 Performance of geopolymer mortar at elevated temperatures…….……….92

Table of Contents
YI-FANG CAO xiii
6.2.1 Specimen preparation...…...….……..............................................92
6.2.2 Test method. ….……..……………………………………..…….93
6.2.3 Test results ………………………………..……….…………..…95
6.2.4 Parameter analysis on hot strength…………………..……………97
6.3 Performance of GPC at elevated temperatures….….............................101
6.3.1 Hot strength…...……................ …...………...............................101
6.3.2 Deformation of GPC at high temperature under constant load ….102
6.4 Residual properties of GPC after exposure to elevated temperatures.....105
6.4.1 Experimental setup………..….……............................................105
6.4.2 Density ……….….……………………......................................106
6.4.3 Stress-strain relationship curve…………………........................107
6.5 Summary………………………………………………………......…109
Chapter 7 Performance of GCFST Columns at Ambient Temperature and
Elevated Temperature…………………………....………………………………111
7.1 Introduction…………………………………………………………...…111
7.2 Experimental investigation…………………………...….…….……...…112
7.2.1 Specimen preparation……….……….…………….…………..…...112

Table of Contents
YI-FANG CAO xiv
7.2.2 Test setup…………………………..………………………….……114
7.3 Experimental results and discussion.….………………………….………116
7.3.1 Performance of CFST columns at ambient temperature…….………116
7.3.2 Comparison between test results and FE predictions…………..……125
7.3.3 Performance of CFST columns after elevated temperature exposure.133
7.3.4 Performance of CFST columns under combined temperature and
loading……………………...………………………………..…….…..….138
7.4 Summary…………….………………………………………………….139
Chapter 8 Conclusions and Future Research Needs...….............................……141
8.1 Conclusions………………………………………….………..…………141
8.2 Recommendations for future research…….……….….……….……...…143
References...…....…….………….…………….……….………….………………145

List of Figures
YI-FANG CAO xv
List of Figures
Figure 1.1World’s tallest buildings by year (Gable, 2016) ……………………….…..1
Figure 1.2Fire engulfs a 63-story Hotel in Dubai (AHMED JADALLAH, Reuters)...4
Figure 2.1 Stress-strain curves for OPC and GPC (Noushini et al., 2016) …....….….22
Figure 2.2 Typical buildings using CFST columns……………………………..……29
Figure 2.3Load versus longitudinal strain relation of geopolymer concrete filled
columns from a modified model (Shi et al., 2015) …………….……………….……31
Figure 3.1 SEM images of raw materials………………………………….…………38
Figure 3.2 Sieve analysis of combined coarse aggregate and fine aggregate. ....……39
Figure 3.3 Mini-slump mould………………………………………………….…….41
Figure 3.4 Young’s modulus test setup………………………………….…….……..42
Figure 3.5 Flexural strength test setup………………………………………….……43
Figure 3.6 Stress-strain relationship experiment setup………………….…….……..44
Figure 3.7 Fire test setup of concrete cylinder………………………….……...…….45
Figure 3.8 Heating regime………………………………………………...….……...46
Figure 3.9 Bruker D8 Advance Powder Diffractometer X-ray diffraction ….…..…..47
Figure 3.10 JEOL 6510 LV Scanning electron microscope……………….…….…..48

List of Figures
YI-FANG CAO xvi
Figure3.11 Bruker Vertex 70 coupled Netzsch 449C Jupiter DSC-TGA instrument...48
Figure 3.12 Fire test setup of steel coupon………………………………….…….....50
Figure 3.13 Setup and location of strain gauges and LVDTs……………….…….…51
Figure 3.14 Fire test setup of CFST………………………………………....……….52
Figure 4.1 Average effect of factors on the workability of fresh geopolymer
paste………………………………………………………………....……………....61
Figure 4.2 Average effect of factors on the compressive strength of geopolymer
mortar…………………………………………………………………….………….64
Figure 5.1 Slump test of fresh GPC……….………………………………..….…….70
Figure 5.2 Conversion curing temperature and humidity………………….….……..76
Figure 5.3 TGA results of geopolymer pastes……………………………….....…….78
Figure 5.4 Geopolymer paste sample for SEM……………………...........................79
Figure 5.5 SEM images of pastes at a) 3 days and b) 7 days………………..……….80
Figure 5.6 SEM images and EDS results of pastes at 28 days………...……..………82
Figure 5.7 Relationship of modulus of elasticity with compressive strength……...…83
Figure 5.8 Relationship of splitting tensile strength with compressive strength…..…85
Figure 5.9 Relationship of flexural strength with compressive strength……….....….87

List of Figures
YI-FANG CAO xvii
Figure 6.1 Setup of GPM fire test…………………………………………..………..92
Figure 6.2 Typical fracture patterns of specimens during elevated temperature
Exposure…….………………………………………………………………………93
Figure 6.3 Influence of activator concentration……………...………………….…..97
Figure 6.4 Influence of CAC replacement ratio…………………...……….…..…….97
Figure 6.5 Influence of activator to binder ratio……………...…………….……….98
Figure 6.6 Hot strength of concrete……………………………...……..…….….…100
Figure 6.7 Deformation of concrete under constant load and high temperature….…101
Figure 6.8 Deformation of concrete under constant load and high temperature…….102
Figure 6.9 Experimental setup of GPC residual properties………………….....…...103
Figure 6.10 GPC specimens before and after heat process………..…………….…..105
Figure 6.11 Stress-strain relationship curve of concretes……………………..…….106
Figure 7.1 Heating regime……………………………………………………….…113
Figure 7.2 Tested specimens at ambient temperature………………………………114
Figure 7.3 Comparison between N-ε curves of GCFST columns with different strength
levels……….……………………………………………………………...……….115

List of Figures
YI-FANG CAO xviii
Figure 7.4 Comparison between N-ε curves of GCFST columns with different heating
regimes……………………..…………………………………….……………..….116
Figure 7.5 Comparison between N-ε curves of GCFST and conventional CFST
columns.……………...…………………………………………………………….116
Figure 7.6 Comparison of different strength indexes…...…………….……………117
Figure 7.7 Comparison of compressive stiffness………...……...………….………119
Figure 7.8 Comparison of different ductility indexes…………...………….………121
Figure 7.9 Axial load versus strains at mid-height of test specimens…….….......…122
Figure 7.10 Development of lateral-to-axial strain ratio for CFST columns…..……123
Figure 7.11 3D FE model of CFST column……………………………….…...…...124
Figure 7.12 Model of concrete in CFST column…………………….…..................126
Figure 7.13 Model of steel in CFST column……………….…...…………..………128
Figure 7.14 Comparison of N-ε curves for GCFST columns with FE model…….…129
Figure 7.15 Comparison of compressive stiffness for GCFST columns with FE model
………...…………………………………………………………………………....130
Figure 7.16 Tested specimens after exposed to elevated temperature………..…..…131
Figure7.17 Comparison of N-ε curves for CFST with different concretes after exposure
to elevated temperature………..…………………………...………………...…….132
Figure 7.18 Comparison of different strength indexes……………..…...….………134

List of Figures
YI-FANG CAO xix
Figure 7.19 Comparison of compressive stiffness of CFST columns at ambient and
post-fire test………………………………………………………..….…..………..135
Figure 7.20 Failed specimens under constant load and elevated temperature…..….136
Figure 7.21 Axial deformation-time curves of CFST columns at heating stage…….137
List of Tables
YI-FANG CAO xx
List of Tables
Table2.1 Stress-strain models for unconfined concrete under uniaxial
compression…………………………………………………………………………19
Table 3.1 Chemical analysis by X-ray fluorescence of fly ash and CAC……...….…37
Table 3.2 Weight of NaOH pellets of solution per kilogram in different molarities…38
Table 4.1 Orthogonal experimental factors………………………………....…...…..56
Table 4.2 Mixture proportions of geopolymer mortar (kg/m3) ………………..….....58
Table 4.3 Results of nine geopolymer mortar mixtures…………………..….….…...59
Table 4.4 Range analysis on workability…………………………………...…….….60
Table 4.5 Range analysis on early-age strength………………….………..………...62
Table 4.6 Range analysis on strength at 28 days…………………………….…..…..62
Table 4.7 Range analysis on long-term strength………………………….…….........63
Table 5.1 GPC mixing proportions…………………………………………..…..…..69
Table 5.2 Workability test of fresh GPC……………………………………...……..70
Table 5.3 Density of hardened GPC………………………………………....…...….71
Table 5.4 Young’s modulus test results…………………………………….…...…...72
Table 5.5 Compressive strength…………………………………………...………...72
Table 5.6 Splitting tensile strength…………………………………...………….......73
Table 5.7 Flexural strength……………………………………...…………....……...73
Table 5.8 Geopolymer paste mixing proportions………………………….…..…….74
Table 5.9 Conversion test………………………………………………...…...….….77

List of Tables
YI-FANG CAO xxi
Table 6.1 Orthogonal experimental factors……………………………………...…..91
Table 6.2 Compressive strengths of GPMs at different temperatures…………....…..95
Table 6.3 Concrete mixing proportions (kg/m3). ………………………………....…99
Table 6.4 Concrete mixing proportions (kg/m3) …………….………………..……104
Table 6.5 Density of different concrete……………………………………….…….105
Table 7.1 Proportions of concrete mixes (kg/m3) ……………………….….….…...111
Table 7.2 Summary of CFST stub column specimens………………….……..……112
Table 7.3 Compressive stiffness (kN) ……………………….……….…….………119
Table 7.4 Compressive stiffness (kN) …………………………………..…….……131
Abbreviations, Acronyms and Symbols
YI-FANG CAO xxii
Abbreviations, Acronyms and Symbols
AMCF: Advanced Materials Characterization Facility
ASTM: American Society for Testing and Materials
CAC: calcium aluminate cement
CFST: Concrete-filled steel tubular
C-S-H: Calcium silicate hydrate
DSC: Differential scanning calorimeter
DI: Ductility index
Ec: Young’s modulus of concrete
Es: Young’s modulus of steel
EA: Compressive stiffness
EDS: Energy-dispersive X-ray spectroscopy
𝒇𝐁: Confining stress for circular CFST
𝒇𝒄′: Mean value of compressive strength
fu: Ultimate strength of steel
𝒇𝐫: Residual stress of confined concrete
FE: Finite element
GPC: Geopolymer concrete
GF: Fracture energy
GGBFS: Ground granulated blast furnace slag
GCFST: Geopolymer concrete-filled steel tubular
GPC: Geopolymer concrete
GPM: Geopolymer mortar
HGPC: heat cured GPC

Abbreviations, Acronyms and Symbols
YI-FANG CAO xxiii
Kc: Compressive meridian
LVDT: Linear variable differential transducers
Ms: Modulus of silicate ratio
N: Measured axial load
Nue: Measured ultimate strengths
Nu,r: Residual ultimate strengths after elevated temperature
N-A-S-H: Sodium alumina silicate hydrate
OPC: Ordinary Portland cement
RSI: Residual strength index
REA: Residual compressive stiffness
SFRC: Steel fibre reinforced concrete
SEM: Scanning electron microscopy
SI: Strength index
TGA: Thermal gravimetric analysis
XRF: X-ray fluorescence spectroscopy
XRD: X-ray Diffraction Analysis
ν: The normalized axial load ratio
Ψ: Dilation angle
e: Flow potential eccentricity
𝜺𝐜𝟎: Strain at peak stress under uniaxial compression
εy: Yield strain of steel

Chapter 1 Introduction
YI-FANG CAO 1
Chapter 1 Introduction
1.1 General
In recent years, fire disasters have frequently been reported worldwide, and
have seriously threatened personal and public property safety. High temperatures lead
to serious damage to concrete structures, resulting in significant mechanical decay of
concrete and even fatal effects at the structural level, due to the spalling phenomenon
of concrete (Connolly, 1995). Geopolymer is a relatively new construction material
and has fire-resistant properties that are much better than those of Portland cement
concrete (Fernández‐Jiménez et al., 2008a). Composite structures have been widely
used in civil engineering, such as high-rise buildings shown in Figure 1.1.
Figure 1.1 World’s tallest buildings by year (Gable, 2016)
The tallest buildings completed in 2011, 2014, 2015 and 2016 used a composite
structure, which utilises a combination of both steel and concrete acting compositely
in the main structural elements. Concrete-filled steel tubular (CFST) columns have

Chapter 1 Introduction
YI-FANG CAO 2
been extensively used for years (Han et al., 2014). Although the fire performance of
CFST columns is better than that of hollow tubular columns (Yin et al., 2006), some
extra procedures need to be implemented to protect CFST from a fire. In order to
improve the fire performance of CFST members, this research aims to use geopolymer
concrete for manufacturing of fire-resistant concrete-filled steel tubes.
Concrete is one of the most commonly used materials on the earth, and it is
conventionally produced by using ordinary Portland cement (OPC) as a binder which
is a calcium silicate hydrate (C-S-H) gel. In contrast, the chemical composition of
geopolymers is similar to zeolites, but shows an amorphous microstructure. The
mechanism of geopolymerisation may consist of dissolution, transportation, and
polycondensation, and takes place through an exothermic process (Provis and van
Deventer, 2014). The main chemical process in geopolymers is polymerisation, unlike
concretes made with Portland cement and blended cement, where the main product of
hydration is C-S-H gel, which is the major provider of concrete strength. Strength of
OPC concrete decreases when subjected to fire conditions, and this is mainly caused
by the Ca(OH)2 ingredient which decomposes under elevated temperatures (Arioz,
2007). However, Ca(OH)2 is not a main ingredient of geopolymer. Pan and Sanjayan
(2012) reported that geopolymer samples retained a higher strength at elevated
temperatures, in contrast to OPC concrete
CFST combines the advantages of concrete and steel, and has further benefits,
namely its high load bearing capacity, stiffness and ductility, convenience for
fabrication and construction, large energy dissipation, and it is also considerably cost-
effective. When CFST columns are exposed to fire, concrete can absorb the heat from
the steel tube, whereas the steel tube can prevent the concrete from spalling. However,

Chapter 1 Introduction
YI-FANG CAO 3
suitable measures are often still required in practice to ensure its fire resistance, which
leads to increased costs and difficulties in construction. By using geopolymer concrete,
it is possible to significantly increase the fire resistance of CFST columns. This chapter
will provide the knowledge background, aims of this project and layout of the report.
1.2 Background
1.2.1 Fire hazards in structures
Fire hazards are a major concern in structural engineering. Most of structures
need to consider the measurements of most structures to reduce the destruction caused
by fire. The weak spots and strengths of structural members should be checked in the
design to ensure the highest possible level of safety. If it is necessary, fire insulation
materials need to be used to protect structural members by slowing down heat transfer.
In addition, fire sprinkler systems, fire extinguishers, fire alarms and smoking
detectors can be used for suppression of fire.
As shown in Figure 1.2, an immense fire erupted on a 63-story luxury hotel in
Dubai, caused by fireworks on New Year’s Day of 2016. Luckily, the fire did not
spread inside the building, and the building maintained its good integrity after the fire
was extinguished. Fire in high-rise buildings presents a significant threat to residents’
properties and safety. On one hand, the fire spread very rapidly across the Dubai high-
rise because of the wind; a witness described that the entire side of the building was
engulfed in flames within seven minutes. In addition, the sheer height limited the use
of normal water hoses, and fire fighters had to enter the building to find the outbreak
and extinguish the fire; these minutes allowed the fire to spread further before the fire
crews could find the location of the outbreak.

Chapter 1 Introduction
YI-FANG CAO 4
Figure 1.2 Fire engulfs a 63-story Hotel in Dubai (AHMED JADALLAH, Reuters)
Generally, the fire behaviour of structural members depends on the applied loads and
the duration of the fire, so fire resistance varies in different structural forms. In the
event of a fire, the strength of the materials in structural members is gradually reduced
as temperatures increase, while the speed of heat transfer depends on the thermal
conductivity and heat absorption capacity of the materials. However, fire protection
materials can help to slow the speed of heat transfer. During the fire exposure of a
CFST member, the temperature of the steel tube rises faster than that of the concrete,
due to its direct exposure to fire and higher thermal conductivity, and then the loads
are distributed to the concrete. If the concrete cannot support an increased load, the
composite column will collapse. These findings demonstrate that concrete plays an
important role in CFST columns under fire conditions.
Chapter 1 Introduction
YI-FANG CAO 5
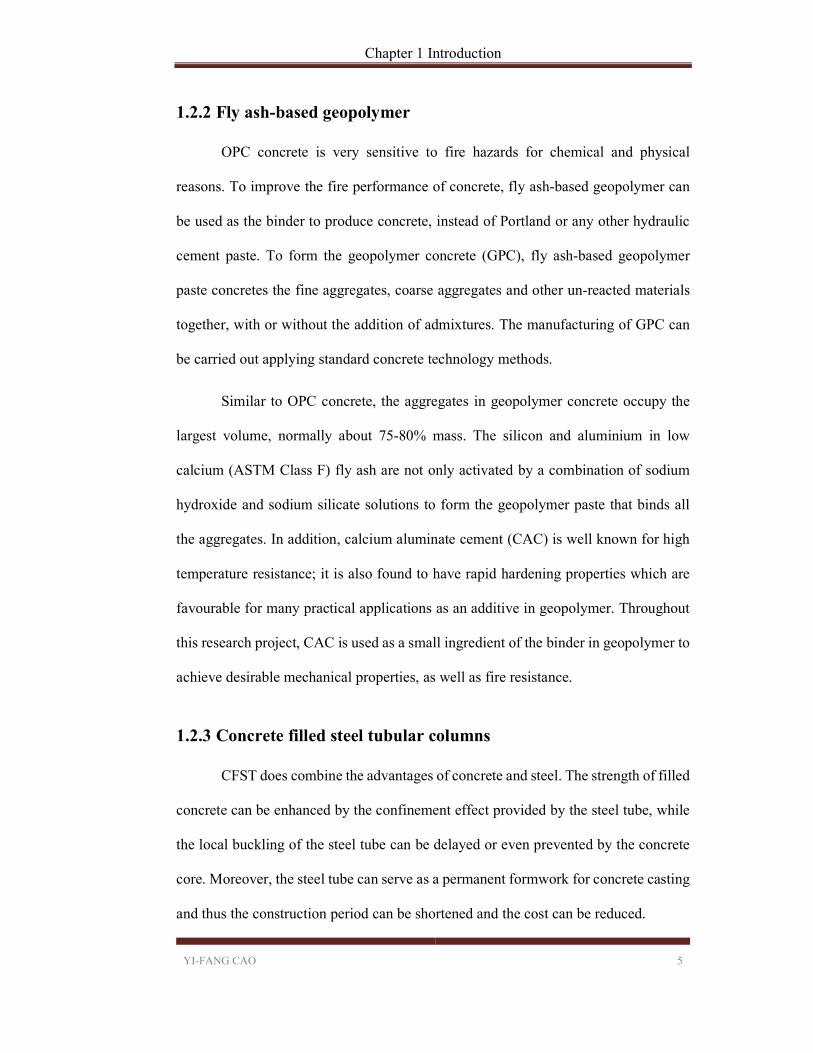
1.2.2 Fly ash-based geopolymer
OPC concrete is very sensitive to fire hazards for chemical and physical
reasons. To improve the fire performance of concrete, fly ash-based geopolymer can
be used as the binder to produce concrete, instead of Portland or any other hydraulic
cement paste. To form the geopolymer concrete (GPC), fly ash-based geopolymer
paste concretes the fine aggregates, coarse aggregates and other un-reacted materials
together, with or without the addition of admixtures. The manufacturing of GPC can
be carried out applying standard concrete technology methods.
Similar to OPC concrete, the aggregates in geopolymer concrete occupy the
largest volume, normally about 75-80% mass. The silicon and aluminium in low
calcium (ASTM Class F) fly ash are not only activated by a combination of sodium
hydroxide and sodium silicate solutions to form the geopolymer paste that binds all
the aggregates. In addition, calcium aluminate cement (CAC) is well known for high
temperature resistance; it is also found to have rapid hardening properties which are
favourable for many practical applications as an additive in geopolymer. Throughout
this research project, CAC is used as a small ingredient of the binder in geopolymer to
achieve desirable mechanical properties, as well as fire resistance.
1.2.3 Concrete filled steel tubular columns
CFST does combine the advantages of concrete and steel. The strength of filled
concrete can be enhanced by the confinement effect provided by the steel tube, while
the local buckling of the steel tube can be delayed or even prevented by the concrete
core. Moreover, the steel tube can serve as a permanent formwork for concrete casting
and thus the construction period can be shortened and the cost can be reduced.
Chapter 1 Introduction
YI-FANG CAO 6
The cross-sections for the CFST are various and circular; square and
rectangular sections are commonly adopted in engineering design. Basically, only
plain concrete was used to fill the steel tube. Sometimes in order to improve the
strength and ductility of concrete, glass or steel fibres will be added to the concrete. In
addition, steel bars or I-section steel can be encased in the concrete core to improve
the resistance as well as reduce the section sizes. In general, CFST columns are better
than conventional steel and columns in terms of fire resistance, due to the fact that the
concrete can absorb the heat from the steel tube while the steel tube can prevent the
concrete from spalling.
1.3 Research motivation
Due to the fast development of population and growth of economies in many
cities, high-rise buildings have long been a necessity. According to a report completed
by Gable (2016), the composite structure system has become popular in multi-storey
and high-rise buildings over the last few decades. CFST columns have been widely
applied in high-rise buildings with great success. Fire hazards are a major threat to life
and property in buildings, and can lead to building collapse. Unfortunately, large
resident density in high-rise buildings increases the probability of the occurrence and
severity of fire hazards. Engineers regularly adopt suitable measures to maintain
structural integrity under fire conditions. Conventional CFST columns usually cannot
satisfy fire resistance requirements. In practice, a large amount of internal steel
reinforcement is put in the steel tube to retain the strength of CFST columns during a
fire outbreak. However, the use of reinforcement substantially increases the
construction cost and time, while reducing the constructability. This thesis aims to
develop fire-resistant CFST without internal steel reinforcement.
Chapter 1 Introduction
YI-FANG CAO 7
To improve the fire endurance of CFST columns, this research proposes to
replace OPC with GPC. The manufacture of OPC is responsible for 5% global carbon
dioxide emission while consuming a lot energy. As an alternative, GPC uses geological
origin (e.g. metakaolin) or industrial by-products (e.g. fly ash) as raw material. In
Australia each year, 12 million tonnes of coal combustion ash is produced, of which
only 40% is effectively utilised in construction application. The application of GPC is
not only able to reduce the CO2 emission but also save the land fill from industry by-
products.
The majority of unused ash is low calcium fly ash. Conventional GPC
synthesised by low calcium fly ash was cured at elevated temperatures to obtain
adequate strength. Many attempts were made to eliminate the elevated temperature
curing procedure, which impedes the onsite application of GPC in buildings. Most
recently, researchers have investigated some additives, including OPC (Nath and
Sarker, 2015) and ground granulated blast furnace slag (GGBFS) (Nath and Sarker,
2014), to make geopolymer cured at an ambient temperature. Very little information
is available about the use of CAC as an additive and its influence on properties of
geopolymer, although it has been widely used in making refractory concrete. Moreover,
the fire performance of geopolymer has been conducted on GPC (Rivera et al., 2016),
and it exhibited better fire performance. However, less research can be found on the
study of using CAC, which is a fire-resistant cement, to improve the fire performance
of geopolymer.
It was reported that GPC exhibited different mechanical properties from OPC
(Hardjito, 2005). Compared to the extensive knowledge of geopolymer materials,
much less research has been done on the behaviour of GPC structural members.

Chapter 1 Introduction
YI-FANG CAO 8
Extensive research was conducted on CFST, but little research has been done on
geopolymer concrete-filled steel tubular (GCFST) columns. Espinos et al. (2015)
reported an improvement in the fire performance of GPC filled double-skin steel tube.
No fire tests have been reported on the fire performance of GCFST. Without the
knowledge of GCFST, it will not be possible to generalise the application of using
geopolymer in construction. In this thesis, the fire resistance of GPC and behaviour of
GCFST under ambient and elevated temperatures will be fully explored, modelled and
predicted.
1.4 Research objectives, limitation and scope of work
1.4.1 Research objectives
As previously discussed, there is no widely accepted holistic approach for the mix
design of geopolymer, and limited research work has been done on GCFST. The aims
of this research is as follows:
To identify and study the salient parameters that affect the properties of fly ash-
based geopolymer.
To develop a fire-resistant concrete using geopolymer and study its properties.
To study the fire performance and mechanical properties of GCFST.
To develop a finite element (FE) model for GCFST and verify it with test
results.

Chapter 1 Introduction
YI-FANG CAO 9
1.4.2 Research limitation
Due to the limit of time and knowledge of the author, this research is focused
on the static behaviour of geopolymer concrete. The FE prediction of GCFST was
mainly limited to performance at an ambient temperature.
1.4.3 Research scope
The salient parameter analysis of geopolymer was conducted, and the
performance of optimised GPC mix designs under elevated temperatures was studied.
The properties of GPC studied included workability, hot strength and residual
compressive strength, Young’s modulus, tensile strength and indirect tensile strength.
Therefore, the GPC was fully comprehended and used to manufacture fire-
resistant GCFST. The GCFST was tested at ambient temperature, then a proposed FE
model was verified by the test results. The residual strength of GCFST was also tested
after elevated temperature exposure. Finally, the deformation of GCFST at combined
load and elevated temperature was analysed.
1.5 Layout of thesis
This thesis investigates the performance of fire-resistant geopolymer concrete
and its application in CFST columns. Eight chapters are included:
Chapter 1: Introduces the general background of building fire hazards, geopolymer
and CFST columns. The research motivation is introduced, along with the objectives,
limitations and scope.
Chapter 2: Reviews the existing knowledge of alkali-activated materials with an
emphasis on low calcium fly ash based geopolymers. The current research is covered

Chapter 1 Introduction
YI-FANG CAO 10
of GPC at ambient and elevated temperatures. Subsequently, a review of research of
CFST is presented to appreciate the potential of using GPC to improve the
performance of CFST.
Chapter 3: Describes the experimental program throughout this research.
Chapter 4: Details the methodological approach towards optimised mix design of
ambient cured GPC. The salient factors that influence the workability and compressive
strength of geopolymer paste and mortar are identified, respectively. The mix design
optimised process is illustrated with the help of the Taguchi method.
Chapter 5: Presents the mechanical properties of GPC at ambient temperature,
including density, Young’s modulus, compressive strength, splitting tensile strength
and flexural strength. The microstructure characterisation of geopolymer was
conducted. The measured mechanical properties were compared with standard
prediction.
Chapter 6: Presents the performance of GPC at elevated temperatures. Firstly, studies
are presented of the residual strength of GPC after being exposed to elevated
temperatures, followed by studies of the deformation of GPC under combined load
and elevated temperatures. The performance of GPC at elevated temperatures is
compared to that of OPC.
Chapter 7: Investigates the experimental study on the mechanical properties of
GCFST at ambient temperatures. The comparisons of test results with standard
prediction, simplified model prediction and FE prediction are presented.

Chapter 1 Introduction
YI-FANG CAO 11
The test results of GCFST at elevated temperatures are also reported. Firstly, the
residual strength of GCFST is tested after exposure to elevated temperatures. Secondly,
the deformation of GCFST was studied under constant load and elevated temperatures.
Chapter 8: Draws conclusions and proposes recommendations for future research.

Chapter 2 Literature Review
YI-FANG CAO 12
Chapter 2 Literature Review
2.1 General
Chapter 1 introduced an overview of the question and motivation for the
research. The main scope of this thesis is to evaluate the potential of using GPC as a
fire resistant material and its application in CFST columns. This chapter summarises
the development of geopolymers and CFST columns. A literature review is presented
on the applications of geopolymers and CAC in concretes, along with the past research
on the properties of concretes, focusing on, but not limited to, mechanical properties
and fire performance. Furthermore, the mechanical properties of CFST columns at
ambient and elevated temperatures are presented.
2.2 Geopolymer concrete (GPC)
2.2.1 Current development
After lime and OPC, geopolymer has been commonly considered as the third
generation cement (Li et al., 2010). The potential of geopolymer binders to extensively
use in industrial construction is supported by the fact that there are abundant industrial
wastes generated in various industries that are found to be suitable to use as
geopolymer raw materials. Geopolymers are commonly referred to “alkali-activated
materials” which are produced from a series of reactions between alkaline activator
and an aluminosilicate rich source. A repeating unit of silicate monomer (Si-O-Al-O)
is created in this reaction, and following this the monomers are converted into silicate
polymers. The amorphous sodium alumina silicate hydrate (N-A-S-H) gel is produced
from a reaction of alkali and alumina-silicate (Davidovits, 1991). The main criteria for
developing suitable geopolymer is that the source material should be highly

Chapter 2 Literature Review
YI-FANG CAO 13
amorphous and have a low water demand, sufficient reactive glassy content and be
able to release aluminium easily. Despite this variety of nomenclature in the reaction,
the term geopolymerisation describes all materials synthesised utilising the same
chemistry (Duxson et al., 2007). Although a variety of aluminosilicate materials, such
as kaolinite, fly ash, GGBFS, have been used as solid raw materials in the
geopolymerisation technology, this research mainly focuses on fly ash-based
geopolymer due to the abundance of fly ash in Australia.
2.2.2 Effect of alkali solution
Alkali activator plays an important role in the initiation of the
geopolymerisation reaction. The concentration of alkali activator has an effect on the
compressive strength of geopolymer because a strong alkaline solution is useful to help
the dissolution of aluminosilicate in raw materials.
The alkaline activators—such as sodium hydroxide (NaOH), potassium
hydroxide (KOH), sodium silicate (Na2SiO3) and potassium silicate (K2SiO3)—can be
used to activate aluminosilicate materials. Compared to NaOH, KOH shows a higher
level of alkalinity. However, in practice, it has been found that sodium hydroxide
possesses a better capacity to liberate silicate and aluminate monomers than potassium
hydroxide (Duxson et al., 2007). Shaikh and Hosan (2016) studied the performance of
steel reinforced geopolymers using Na and K based activators. Steel fibre reinforced
geopolymer concrete (Na) was slightly stronger than steel fibre reinforced concrete
(SFRC) in terms of residual indirect tensile strength and residual compressive strength.
However, K activated geopolymer lost strength quickly under high temperatures. In

Chapter 2 Literature Review
YI-FANG CAO 14
this research, sodium hydroxide was used in alkali solution to obtain better fire
performance.
Nematollahi and Sanjayan (2014) studied the effect of two different activators
and superplasticisers on the workability of fly ash based geopolymer pastes, i.e 8 M
sodium hydroxide and multi-compound activator composed of 8 M NaOH solution
and sodium silicate solution with a SiO2/Na2O ratio of 2.0. The experimental results
indicated that using 8 M NaOH solution as the activator, naphthalene based
superplasticiser was an effective type; whereas modified Polycarboxylate based
superplasticiser was the most efficient type when the multi-compound activator was
used. Fernández-Jiménez and Palomo (2005) studied the mechanical strength of alkali-
activated fly ash, with several activators in which the Na2O content changed from 5%
to 15%. They concluded that the SiO2/Na2O molar ratio affects mechanical strength.
They noticed that using a Na2O content of 5.5% by fly ash mass leads to a very low
pH, affecting the reaction development in a negative way and also that the Na2O
content increase leads a mechanical strength increase. The use of 14% of Na2O by fly
ash mass leads to optimum mechanical performance. Duxson et al. (2007) studied the
alkali-activation of metakaolin geopolymers with a mixture of sodium or potassium
hydroxide with sodium waterglass or potassium waterglass. Those authors reported
that using a combination of sodium hydroxide and sodium waterglass leads to higher
mechanical strength, as compared to specimens activated by a combination of
potassium hydroxide and potassium waterglass.
Görhan and Kürklü (2014) investigated the effect of NaOH solution on the 7-
day compressive strength of low calcium fly ash geopolymers cured at 65 and 85 °C.
The concentrations of NaOH solution were designed at 3, 6 and 9 M, and the sodium

Chapter 2 Literature Review
YI-FANG CAO 15
silicate/sodium hydroxide ratio was constantly kept at 2.5. An optimised solution was
acquired from the test result, and this 6 M concentration mix design obtained 22 MPa
at 7 days.
Somna et al. (2011) reported the test results of ground fly ash geopolymer with
NaOH concentration ranged from 4.5 to 16.5 M. The strength increased substantially
with the increased concentration of geopolymer with a solution concentration under
9.5 M. The strength of geopolymer paste increased more slowly when the
concentration was over 9.5 M. A decrease of compressive strength was observed after
the concentration achieved 16.5 M. The excessive hydroxide ions caused the
precipitation of N-A-S-H gel at early ages, which resulted in a decrease in compressive
strength.
Xu and Van Deventer (2000) confirmed that the use of sodium silicate
increases dissolution of raw materials. They studied the alkali-activator with different
natural alumina-silicate minerals. The results have shown most natural minerals could
not provide enough free Si to initiate the reaction. Fernández-Jiménez and Palomo
(2005) studied the geopolymerisation of fly ash, with several activators in which the
Na2O content ranged from 5% to 15%. They concluded that the SiO2/Na2O molar ratio
and water/binder ratio influenced the mechanical properties. Furthermore, they
reported that using a Na2O content of 5.5% by mass of fly ash led to a very low pH,
affecting the reaction development in a negative way, and the Na2O content increase
led to a mechanical strength increase. The use of 14% Na2O by fly ash mass had
optimum mechanical performance.

Chapter 2 Literature Review
YI-FANG CAO 16
2.2.3 Effect of curing procedures
Attempts have been made to evaluate the effect of different curing regimes on
the properties of geopolymer at elevated temperatures. Palomo et al. (1999) studied
different curing conditions of alkali activated fly ash-based geopolymer at 65 °C and
85 °C. They proposed the compressive strength of samples ranging from 8–12 M and
cured at 85 °C for 24 h was higher than samples cured at 65 °C. The rise of strength
was very small when the curing time was longer than 24 h.
Heah et al. (2011) supposed that the curing of Metakaolin-based geopolymers
at an ambient temperature was not viable, while an increase in temperature (40 °C,
60 °C, 80 °C and 100 °C) favoured the strength development after 1–3 days. Rovnaník
(2010) concluded the curing regime of geopolymer at an elevated temperature (40–
80 °C) accelerated the strength development, but the mechanical properties decreased
in comparison with results obtained at an ambient temperature within 28 days. In
general, adequate curing of geopolymeric materials is required to achieve optimal
mechanical and durability performance in order to maintain their structural integrity.
Collins and Sanjayan (1999) noticed a strength decrease following long curing
times with high temperature. They suggested that some water may remain in the
hardened binder, maintaining the ‘gelular’ character of geopolymers. Bakharev (2005)
also claim the need for isolating the hardened specimens in order to prevent water
evaporation, and some of them kept the concrete specimens cured in sealed bags.
However, the heat curing procedure extensively impedes the application of
geopolymer in on-site construction. Some researchers have studied different additives

Chapter 2 Literature Review
YI-FANG CAO 17
to eliminate the necessity of the heat curing procedure. In this thesis, the main purpose
is to study the geopolymer cured at room temperature.
2.2.4 Effect of additives
The relative ratio of essential elements (Si, Al, Na and Ca) in raw material
plays an important role in the gepolymerisation reaction. Some cements or wastes were
added into the raw material to obtain the ideal balance of elements. The additives
included calcium hydroxide, aluminium hydroxide, silica fume, nano-SiO2, and nano-
Al2O3 etc. (Mijarsh et al., 2014). Some researchers utilised the “waste to waste”
stabilisation technique by incorporating waste materials such as flue gas
desulfurisation gypsum (Chindaprasirt et al., 2012) and Al-rich waste sludge
(Boonserm et al., 2012) to achieve a more efficient geopolymerisation.
Reuse and recycling of industrial wastes are the ideal solutions for current
waste management problems. Chindaprasirt et al. (2012) found a way to utilise Al-rich
waste, originated from waste water of a plant, as an additive to make high calcium fly
ash based geopolymer mortar. This alumina-rich waste material was dried and
grounded into powder at a high temperature. Test results showed the increased strength
of geopolymer by adding 2.5 wt.% of Al-rich waste calcined at 1000 °C. However, a
further increase in the dosage resulted in a reduced compressive strength because of
the excess alumina which acts as non-functional filler in geopolymer matrix.
Hanjitsuwan et al. (2017) used calcium carbide residue as an additive to promote the
mechanical properties of geopolymer cured at an ambient temperature; the addition
ratios were 10%, 20% and 30% by weight of binder. The activator was a mixture of

Chapter 2 Literature Review
YI-FANG CAO 18
sodium hydroxide and sodium silicate. The addition of calcium promoter enhances the
mechanical properties and also decreases setting time.
Khan et al. (2016c) studied the potential of making geopolymer with a small
amount of slag, hydrated lime and ultra-fine fly ash, and found the compressive
strength of geopolymer is mainly dependent on the raw material. They observed that
geopolymer partially replaced by slag is able to achieve 100 MPa in 28 days. However,
the effect of adding a small part of hydrated lime and ultra-fine fly ash is relatively
diminutive for geopolymer. Puligilla and Mondal (2013) conducted research on the
role of slag in the formation of slag-fly ash geopolymer. The calcium dissolved from
slag is the main character on the influence of early strength development of
geopolymer; this is due to the fact that free calcium ions prolong fly ash dissolution
and enhance geopolymer gel formation. Puligilla and Mondal proposed the hardening
process is initiated by the precipitation of C-A-S-H.
The conventional OPC was also investigated to improve the performance of
geopolymer by previous researchers. Nath and Sarker (2015) studied the influence of
OPC on the mechanical properties of geopolymer. The inclusion of OPC successfully
eliminates the requirement of a heat-curing procedure. The results indicated that the
inclusion of OPC as a small portion of binder can accelerate the setting time while
causing a small decrease in workability. Shehab et al. (2016) investigated the OPC-fly
ash geopolymer on the compressive strength, splitting tensile strength, flexural
strength and bond strength. The replacement ratios of OPC are 0%, 25%, 75% and
100%, respectively. The strength development rate of geopolymer is different from
that of OPC concrete. However, the relationship between compressive strength and
flexural, splitting and bond strength of geopolymer have few differences with OPC.
Chapter 2 Literature Review
YI-FANG CAO 19
Khan et al. (2016a) investigated geopolymer consisting of 90% low calcium
fly ash and 10% GGBFS, and the geopolymer concrete samples were cured in an oven
at 75 °C for 18 hours after casting. Two geopolymer concrete designs contained 13.3
kg/m3 free water, and both geopolymer concretes achieved more than 200 mm in a
slump test. Steel furnace slag aggregate concretes achieved a higher modulus of
elasticity, and geopolymer blended with SFS had a slight improvement in 28-day
compressive strength.
2.3 Properties of GPC at an ambient temperature
2.3.1 Workability
Workability indicates the ease which concrete can be transported and
consolidated. GPC made with low water content can be very sticky and would not
meet the workability requirement.
Previously, a number of superplasticisers were used to improve the flowability
in OPC. Nematollahi and Sanjayan (2014) analysed influences of different
superplasticisers and activator combinations on the workability and compressive
strength of GPC. They tested naphthalene, melamine and modified Polycarboxylate as
superplasticiser on geopolymer pastes with two kinds of activator combinations. The
result show modified Polycarboxylate based SP was most effective for most activator
combinations. Naphthalene based SP is better for sodium hydroxide activator.
However, the compressive strength reduced with the addition of SP.
Sathonsaowaphak et al. (2009) reported the sodium silicate/sodium hydroxide
ratio and sodium hydroxide concentration were main factors on workability. The
increase of these two factors resulted in less water content in geopolymer. The

Chapter 2 Literature Review
YI-FANG CAO 20
influence of adding extra water on the workability was also studied. This practice was
also used by other researchers (Rickard et al., 2016, Hardjito and Rangan, 2005), and
it was proven to be effective. In this thesis, extra water was added into mix to improve
the workability of GPC.
2.3.2 Compressive stress-strain models
The stress-strain models were studied. Table 2.1 lists typical stress-strain
models for unconfined OPC concrete.
Table 2.1. Stress-strain models for unconfined concrete under uniaxial compression
Source Stress-strain model
Sargin et al. (1971)
𝑓 = 𝑘 𝑓 ′𝐴𝑋 + (𝐷 − 1)𝑋
1 + (𝐴 − 2)𝑋 + 𝐷𝑋
where: 𝑋 = 𝜀/𝜀 ; 𝐴 = ; 𝐷 = 0.65 − 7.25𝑓 ′ × 10 ;
𝐸 = 5975(𝑓 ′) / ; 𝜀 = 0.0024; 𝑘 = 1.0
Popovics (1973) 𝑓 =
𝑓 ′𝛽(𝜀/𝜀 )
𝛽 − 1 + (𝜀/𝜀 )
where: 𝛽 = 1.0 + 0.058𝑓 ′; 𝜀 = 735(𝑓 ′) . × 10
Carreira and Chu (1985)
𝑓 =𝑓 ′𝛽(𝜀/𝜀 )
𝛽 − 1 + (𝜀/𝜀 )
where: 𝛽 =( )⁄
; 𝜀 ′ = (4.88𝑓 + 168) × 10
𝐸 = 0.0736𝜌 . (𝑓 ′) .
Collins et al. (1993)
𝑓 = 𝑓 ′𝜀
𝜀
𝛽
𝛽 − 1 + (𝜀/𝜀 )
where: 𝛽 = 0.8 + 𝑓 ′ 17⁄ ;
𝐸 =1.0, 𝑤ℎ𝑒𝑛 0 ≤ 𝜀 ≤ 𝜀 ;
0.67 + 𝑓 ′ 62⁄ , 𝑤ℎ𝑒𝑛 𝜀 > 𝜀 ;
Table 2.1. Stress-strain models for unconfined concrete under uniaxial compression
(continued)

Chapter 2 Literature Review
YI-FANG CAO 21
Source Stress-strain model
Wee et al. (1996)
𝑓 =𝑓 ′𝛽(𝜀/𝜀 )
𝛽 − 1 + (𝜀/𝜀 ) when 0 ≤ ε ≤ 𝜀 ;
𝑓 =𝑘 𝑓 ′𝛽(𝜀/𝜀 )
𝑘 𝛽 − 1 + (𝜀/𝜀 ) when ε > 𝜀 ;
where: 𝛽 =( )⁄
; 𝜀 = 780(𝑓 ′) . × 10 ;
𝐸 = 10200(𝑓 ′) / ; 𝑘 = (50/𝑓 ′) ; 𝑘 = (50/𝑓 ′) .
Samani and Attard (2012)
𝑓
𝑓 ′=
𝐴𝑋 + 𝐵𝑋
1 + (𝐴 − 2)𝑋 + (𝐵 + 1)𝑋 when 0 ≤ ε ≤ 𝜀 ;
𝑓
𝑓 ′= (
𝑓
𝑓 ′)
( ) when ε > 𝜀 ;
where: 𝑋 = 𝜀/𝜀 ; 𝐴 = ; 𝐵 =( )
.− 1;
𝐸 =0.043𝜌 . 𝑓 ′, 𝑓𝑜𝑟 𝑐𝑟𝑢𝑠ℎ𝑒𝑑 𝑎𝑔𝑔𝑟𝑒𝑔𝑎𝑡𝑒𝑠
(3320 𝑓 + 6900)𝜌
2320
.
, 𝑓𝑜𝑟 𝑤𝑒𝑎𝑘𝑒𝑟 𝑎𝑔𝑔𝑟𝑒𝑔𝑎𝑡𝑒𝑠
𝜀 =
⎩⎪⎨
⎪⎧
𝑓 ′
𝐸
4.26
𝑓 ′, 𝑓𝑜𝑟 𝑐𝑟𝑢𝑠ℎ𝑒𝑑 𝑎𝑔𝑔𝑟𝑒𝑔𝑎𝑡𝑒𝑠
𝑓 ′
𝐸
3.78
𝑓 ′, 𝑓𝑜𝑟 𝑔𝑟𝑎𝑣𝑒𝑙 𝑎𝑔𝑔𝑟𝑒𝑔𝑎𝑡𝑒𝑠
𝜀
𝜀= 2.76 − 0.35 ln(𝑓 ) ;
𝑓
𝑓 ′= 1.41 − 0.17 ln(𝑓 ) ; 𝑓 ≥ 20MPa
Lim and Ozbakkaloglu
(2014)
𝑓 =𝑓 ′(𝜀/𝜀 )𝑟
𝑟 − 1 + (𝜀/𝜀 ) when 0 ≤ ε ≤ 𝜀 ;
𝑓 = 𝑓 −𝑓 ′
1 + (𝜀 − 𝜀
𝜀 − 𝜀)
when ε > 𝜀 ;
where: 𝑟 =/
; 𝐸 = 4400 𝑓 ′( ) . ; 𝜀 =( ) .
𝑘 𝑘 ;
𝑘 = (2400
𝜌) . ; 𝑘 = (
152
𝐷) . ; 𝑘 = (
2𝐷
𝐻) . ;
𝜀 = 10𝜀 (𝑓 ) . (𝜌
2400) . ;
D and H are the diameter and height of specimen in mm, while D ranged from 50 to 400 mm and H ranged from 100 to 850 mm.
Noushini et al. (2016)
𝑓 =𝑓 ′𝛽(𝜀/𝜀 )
𝛽 − 1 + (𝜀/𝜀 )
𝛽 =
⎩⎪⎨
⎪⎧ [1.02 − 1.17(
𝑓
𝜀 𝐸)] . , 𝑤ℎ𝑒𝑛 0 ≤ 𝜀 ≤ 𝜀 ;
[1.02 − 1.17(𝑓
𝜀 𝐸)] . + ϖ + 28ξ, 𝑤ℎ𝑒𝑛 𝜀 > 𝜀 ;
ϖ = 𝐶(12.4 − 0.015𝑓 ) . ; ξ = 0.83 × 𝑒 / ;
𝐶 =
15; water and internal cruings 7; heat curing − OPC concrete17; heat curing − GPC
In structural application, an accurate stress-strain curve of concrete is necessary for
evaluating the degree of safety and serviceability. Generally, the stress-strain

Chapter 2 Literature Review
YI-FANG CAO 22
relationship of concrete can be expressed as a parabolic curve with its vertex at peak
stress (Yang et al., 2014). Two major categories of methods were applied to describe
the parabolic expression of the stress-strain curve of unconfined concrete. Sargin et al.
(1971) proposed a stress-strain relationship expression of unconfined concrete with a
quadratic fractional model. Further improvements in the accuracy of ascending and
descending phases were achieved by revising some parameters. Attard and Setunge
(1996) improved the quadratic fractional function by alternating two sets of
parameters, and the model was widely adopted. The model was further improved on
the post-peak softening part (Samani and Attard, 2012).
Another widely-accepted method, as proposed by Popvics, used a key
parameter β in an exponential function to describe the stress-strain curve (Popovics,
1973); such a model was proposed by Carreira and Chu (1985) by considering the
influence of Young’s modulus to avoid underestimating β parameter. In addition, a
modified β parameter was proposed by Wee et al. (1996) to achieve a better accuracy
on the descending branch of high strength concrete. The general trend for the
descending branch was the rate of stress drop increases as 𝑓 increases. Recently, Lim
and Ozbakkaloglu (2014) proposed a similar model by updating the strain at peak
stress based on a wide range of collected data on unconfined concrete.
Chapter 2 Literature Review
YI-FANG CAO 23
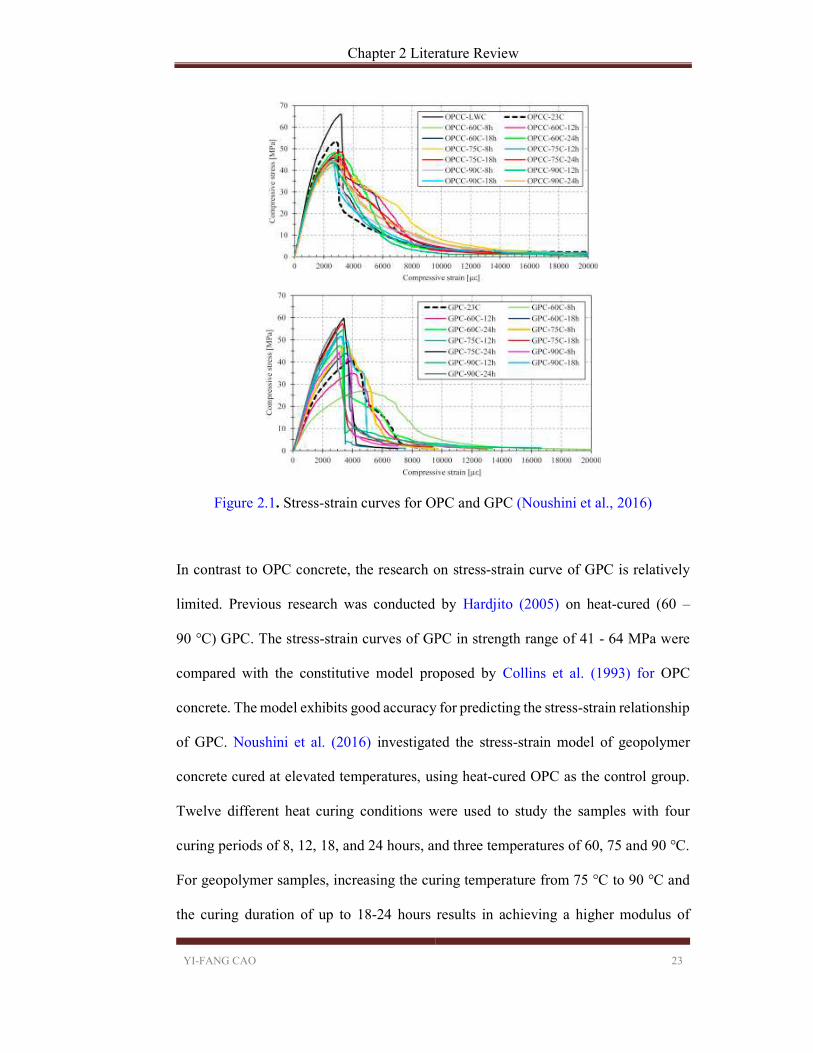
Figure 2.1. Stress-strain curves for OPC and GPC (Noushini et al., 2016)
In contrast to OPC concrete, the research on stress-strain curve of GPC is relatively
limited. Previous research was conducted by Hardjito (2005) on heat-cured (60 –
90 °C) GPC. The stress-strain curves of GPC in strength range of 41 - 64 MPa were
compared with the constitutive model proposed by Collins et al. (1993) for OPC
concrete. The model exhibits good accuracy for predicting the stress-strain relationship
of GPC. Noushini et al. (2016) investigated the stress-strain model of geopolymer
concrete cured at elevated temperatures, using heat-cured OPC as the control group.
Twelve different heat curing conditions were used to study the samples with four
curing periods of 8, 12, 18, and 24 hours, and three temperatures of 60, 75 and 90 °C.
For geopolymer samples, increasing the curing temperature from 75 °C to 90 °C and
the curing duration of up to 18-24 hours results in achieving a higher modulus of

Chapter 2 Literature Review
YI-FANG CAO 24
elasticity (increasing the initial slope of curve). As shown in Figure 2.1, OPC and GPC
exhibited different strains at peak stress, and the stiffness of GPC was lower than that
of conventional OPC concrete. In order to predict the performance of geopolymer
concrete, a new stress-strain model was proposed by this literature (Noushini et al.,
2016) which considers the parameters of the curing regime.
2.4 Properties of GPC at elevated temperatures
2.4.1 Hot strength
Geopolymers (Davidovits, 1993) have been reported to possess excellent
mechanical properties, fire resistance, and environmental resistant properties. They are
produced by synthesising aluminosilicate source materials with alkaline silicate
solutions. Due to the ceramic-like properties, geopolymers are believed to possess
good fire resistance. By comparison, Sanjayan and Stocks (1993) illustrated chemical
and physical properties of OPC concrete degenerating at elevated temperatures.
Furthermore, concrete spalling of OPC was commonly reported to occur in fire which
causes a rapid layer-by-layer loss of concrete cover, potentially leading to the exposure
of the main reinforcements within the concrete to fire.
Research on geopolymer as a fire-resistant binder has been extensive. However,
published research on fly ash-based geopolymer is commonly limited to responses at
elevated temperatures. Cheng and Chiu (2003) reported that the strength of GGBFS
geopolymer binders was enhanced in fire. To further investigate the performance of
GPC at elevated temperatures, Pan and Sanjayan (2012) studied the hot strength of
geopolymer, and they illustrated all the geopolymer samples tested at high temperature
had a lot improvement in the compressive strength. They hypothesised that the

Chapter 2 Literature Review
YI-FANG CAO 25
geopolymer with low initial strength has more unreacted materials. At high
temperatures, these unreacted materials will be transformed into reaction products by
geopolymer reactions. The higher content of unreacted materials the higher strength
increase, which is due to the high extent of geopolymer reactions.
Rickard et al. (2016) investigated the in-situ thermo-mechanical properties of
geopolymer concretes. A microstructure analysis was employed to explain the
mechanism of strength development under fire. The evaporation of capillary water is
responsible for the strength loss at temperatures below 300 °C. After higher
temperature exposure (higher than 500 °C), GPC exhibited sintering phenomena which
led to the strength advantage over OPC concrete. However, geopolymer suffered more
strength loss than OPC at 550 °C which was attributed to lower transient thermal creep.
The fire performance was also examined on different cellular structures. Rickard and
Van Riessen (2014) studied the fire performance of different cellular structures on
GPC panels. The fire testing was conducted on 50 mm thick panels with an exposure
area of 200 mm × 200 mm. The fire testing lasted for 120 min which complied with
the maximum temperature increase limit by Australia Standard 1530.4. The surface
cracking condition was inspected and the results showed solid geopolymers exhibited
better fire endurance than cellular structure geopolymer.
A parameter analysis on fire performance was conducted by Shaikh and
Vimonsatit (2015). The effects of NaOH concentration, aggregate sizes, curing
condition and extra water of geopolymer at 200, 400, 600 and 800°C were investigated.
Low molarities of NaOH lead to increase in the compressive strength after 800 °C.
The addition of extra water adversely affects the compressive strength of geopolymer
concrete at all elevated temperatures. However, the extended steam curing regime

Chapter 2 Literature Review
YI-FANG CAO 26
improves performance at elevated temperatures. Eurocode EN1994:2005 was used to
predict the compressive strength at elevated temperatures, and the predicting equation
gives a great agreement with the test results up to 400 °C.
2.4.2 Residual strength
Given that geopolymer increases in strength after elevated temperature
exposure, the fire resistance of geopolymer is likely to be superior to OPC concrete
which loses most of its strength after elevated temperature exposure at about 800°C
(Crozier and Sanjayan, 1999). Guerrieri and Sanjayan (2010) studied the fire
performance of fly ash-based geopolymer blended with slag. The compressive strength
of geopolymer paste tested at ambient temperature ranged from 3 to 83 MPa, and the
specimens were tested after exposure to 800 °C for fire performance. They found
higher initial strength results in a higher residual strength. Some low initial strength
specimens exhibited higher strength after exposure to 800°C. They also found the
ductility of specimen decreased as the initial strength increased as observed from the
compressive stress versus strain curves.
Rivera et al. (2016) analysed the differences in the elevated temperature performance
of geopolymer and OPC concrete. The samples were heated to 650 °C from ambient
temperature in 60 seconds, and the temperature was held for 10 minutes without
loading. They found fly ash-based geopolymer showed no damage after fire exposure
compared to OPC. They explained that despite the chemical composition, the pore size
and distribution of geopolymer improved the fire performance. Hussin et al. (2015)
studied mass loss, strength and microstructural changes of geopolymer at elevated
temperatures. The initial strengths of geopolymer specimens and OPC control were 25

Chapter 2 Literature Review
YI-FANG CAO 27
and 26 MPa, respectively. The mass loss of OPC is more severe than that of
geopolymer concrete (BAG); especially at 800 °C, the mass loss of OPC is two times
more than that of geopolymer. After high temperature exposure, geopolymer concrete
maintains an 80% initial strength while the OPC concrete has 50% residual strength.
Kong and Sanjayan (2010) studied the influences of different parameters of
geopolymer concrete under fire conditions. The results show specimen size and
aggregate size governed the performance of concrete at room temperature and elevated
temperatures. They also analysed the influence of different types of aggregates and
illustrated slag aggregate geopolymer concrete has the same fire performance and
compressive strength as basalt aggregate geopolymer concrete.
GPC with other different aggregates was tested. Junaid et al. (2015) studied the
residual strength after exposure of up to 1000 °C of fly ash aggregates with geopolymer
binder. GPC has better fire endurance than OPC, they explained, for three reasons: 1.
Dehydration of Ca(OH)2 at elevated temperatures; 2. Disparity between thermal
expansion of limestone and shrinkage of OPC binder; 3. Aggregate undergoes phase
change under elevated temperature. Rickard et al. (2016) investigated the geopolymer
concretes with quartz aggregate or expanded clay aggregate exposed to elevated
temperatures of up to 750 °C. They found that dehydration of water in a capillary
caused cracks which led to strength loss in temperature ranging from 110-300 °C. The
condition is even severe for geopolymer concrete with quartz aggregate due to its low
permeability. However, the strength of geopolymer concrete will increase in
temperatures higher than 500 °C which showed an advantage over conventional OPC
concrete.

Chapter 2 Literature Review
YI-FANG CAO 28
The residual strength was tested on GPC structural elements. Sarker and
Mcbeath (2015) investigated the fire endurance of steel reinforced GPC. The fire
performance of geopolymer was tested on 500 mm × 500 mm steel reinforced concrete.
One side of the panel was exposed to fire according to heating rate in Australia
Standard, and the opposite face was exposed to room temperature, then the panel was
cooled to room temperature and tested. The residual strength of GPC was, on average,
30% better than OPC panels.
Shoaib et al. (2001) studied the influence of cooling mode of slag mortars on
compressive strength and crack patterns. Three cooling patterns were implemented on
samples cured after 7 months: water cooling, furnace cooling and air cooling. Water-
cooled mortar retained the best compressive strength. The strength retain ratio of air-
cooled mortar is around 50% of a water-cooled specimen. The strength of a furnace-
cooled specimen is slightly better than an air-cooled specimen. Shaikh and Vimonsatit
(2014) also investigated the effects of different cooling methods on the residual
strength of concrete blended with fly ash. Two cooling methods (slow cooling and
rapid water cooling) were implemented on specimens exposed to 200, 400, 600 and
800 °C. The test results show the residual compressive strength decreased with the
increase in the temperature irrespective of cooling regimes. All concrete exhibited 10%
to 35% more reduction in residual strength with the rapid cooling regime. Furthermore,
crack development for slowly cooled concrete is smaller than rapid water cooled
concrete. The existing Eurocode accurately predicted the compressive strength of fly
ash concretes exposed to elevated temperatures.

Chapter 2 Literature Review
YI-FANG CAO 29
2.5 CFST columns
2.5.1 Development of CFST columns
CFST columns offer numerous structural benefits, including high strength and
fire resistance, favourable ductility and large energy absorption capacities. There is
also no need for the use of formwork during concrete construction, hence the
construction cost and time are reduced. These advantages have been widely exploited
and have led to the extensive use of CFST columns in civil engineering structures. In
CFST columns, steel and concrete are used to combine their advantages. The
confinement of concrete is provided by the steel tube, and the local buckling of the
steel tube is improved due to the support of the concrete core.
Concrete-filled steel tubes have been used in Australia for many years. They
can be used as major compressive components or key members under various loading
conditions in buildings, bridges and other structures. Two examples are presented in
Figure 2.2.
(a) Brisbane International Terminal (Airport, 1996)

Chapter 2 Literature Review
YI-FANG CAO 30
(b) Latitude (Multiplex, 2005)
Figure 2.2 Typical buildings using CFST columns
Brisbane International Terminal was completed in 1996 and is a major international
gateway into Australia. The four levels of the 140 m × 100 m building comprise of
structural steel columns and floor beams, with a 120 mm thick in-situ concrete slab on
steel decking. The steel columns were filled with 40 MPa concrete prior to pouring
slab in order to increase the column stiffness. The Latitude Building in Sydney was
built in 2005 and exists on George Street on the World Square Site. The building has
a total height of 222 m over 45 floors. The twin composite column was used on the
perimeter frame and 508 mm diameter steel tubes were filled with 80 MPa concrete.
2.5.2 CFST Columns at ambient temperature
In recent years, many researchers have tried to improve the performance of
CFST columns. One of the scopes is to use high performance materials in CFST
columns. It is known that most of the load-carrying capacity of CFST columns is
provided by core concrete. Therefore, the higher the strength of the concrete, the higher
the load-carrying capacity of the CFST column.
Chapter 2 Literature Review
YI-FANG CAO 31
With the advancements in technology in developing high strength concrete,
researchers have tried to fill steel tube with high strength concrete in order to reduce
the size of CFST columns. Several experiments were carried out on the CFST columns
by employing a concrete strength higher than 100 MPa. Dexin (2012) recently carried
out tests on CFST columns with ultra-high strength concrete with a cube strength of
filled concrete close to 200 MPa. However, the problem of brittleness might become
critical for high strength concrete. One of the methods to solve this problem is to add
steel fibres in the high strength concrete. The ductility of concrete could be improved
when 1% of steel fibres by volume were added into the concrete (Varma et al., 2002).
Another method was to increase the thickness of the steel tube or use high strength
steel.
Application of high strength steel in CFST columns is currently being studied.
High strength steel with a yield strength of up to 1247 MPa has been used in steel tubes
of CFST columns and several experimental investigations have been carried out
(Javidan et al., 2016). However, local buckling is the most significant problem and it
may limit the usage of high strength steel, due to the fact that the thickness of the steel
tube could be reduced when using high strength steel. Stainless steel is another type of
high performance steel with high strength and better corrosion resistance and hardness;
it has been investigated as outer materials of CFST columns by researchers for nearly
a decade (Young and Ellobody, 2006).
Shi et al. (2015) investigated the performance of 12 geopolymer concrete filled
square section columns under axial loading. The CFSTs with geopolymer concrete
were cured at 80 °C for 24 h in an oven, and they tested the compressive strength at an
ambient temperature. Following this, they used an existing theoretical model to

Chapter 2 Literature Review
YI-FANG CAO 32
predicted the load-deformation curves of CFST columns with geopolymer concrete.
They revised the model to achieve a better correlation between the theoretical model
and test results. The results are shown in Figure 2.3.
Figure 2.3 Load versus longitudinal strain relation of geopolymer concrete filled
columns from a modified model (Shi et al., 2015)
The confinement factor which indicates the constraining effect of the steel tube to the
core concrete is defined as ξ = As fy/Ac fck. The square hollow sections of 200 mm × 200
mm × 6 mm and 150 mm × 150 mm × 5 mm specimens were labelled as “S1” and
“S2”, respectively. GRC0 means all the aggregates are limestone, and GRC50 means
50% of aggregates are recycled aggregates. According to the results, the predictions
are more accurate for specimens with a higher ξ. However, the elevated temperature-

Chapter 2 Literature Review
YI-FANG CAO 33
curing procedure they used limits the implement of geopolymer in construction
application. Future research should focus on CFST with geopolymer concrete cured at
an ambient temperature.
Geopolymer is a new type of concrete which has the potential to be used in
CFST columns. According to former research, the material properties of geopolymer
are different from those of OPC concrete. Pan et al. (2011) pointed out that the
brittleness of geopolymer is higher than OPC at equivalent compressive strength.
Although brittleness could impede the application of geopolymer, the ductility of core
concrete will be improved due to the confinement offered by the tube when the CFST
column is subjected to axial force.
More work should be undertaken on CFST columns with geopolymer concrete
in order to fully understand the behaviour of this new type of composite columns.
2.5.3 CFST Columns at elevated temperatures
The fire resistance of unprotected hollow steel tubular columns in high-rise
buildings has generally been found to be less than half an hour (Han et al., 2014). For
concrete-filled steel tubular columns, the filled concrete can significantly increase the
fire resistance. Because the heat is absorbed by the core concrete, the temperature in
the steel tube increases much slower than that of the bare hollow steel tubes. Moreover,
the outer tube provides a confinement to the core concrete during the fire exposure;
the spalling of the core concrete thus can be prevented. Numerous studies (Song et al.,
2010) have been conducted on the fire performance of CFST columns, and it has been
found that the cross-sectional profile and fire protection thickness had the most
significant influence on the temperature distribution in the column.
Chapter 2 Literature Review
YI-FANG CAO 34
For the concrete filled steel tube, several parameters could affect its fire
resistance, such as the cross-sectional profile, the load eccentricity and the thickness
of fire protection. It was found that the cross-sectional profile and the fire protection
thickness had the most significant influence on the temperature distribution in the
column. It is noted that among some studies (Lu et al., 2011), most experiments were
carried out under an ISO 834 standard fire, and the cooling phase was usually not
considered. A time-force-temperature path was also proposed to illustrate the fire and
the load action during fire exposure. The specimen was loaded at the ambient
temperature and heated while the load was kept constant. After the heating, the
specimen was once again cooled to an ambient temperature and loaded until failure.
Since the mechanical properties of steel and concrete depend on the temperature and
loading histories—even when the specimen has survived the heating stage—it would
still be possible to fail in the cooling stage. The proposed full range analysis provides
a reasonable approach to the evaluation of the structural fire performance.
In practice, the fire exposed CFST column could be strengthened by using fire-
resistant coating or internal reinforcement. The measure of using fire-resistant coating
is very common in construction, but it still has some problems. Wang (2003) reported
that using this method to protect the structures made with steel generally accounted for
about 30% of the total cost. In addition, the external coating could be deemed non-
functional if it is damaged by the explosion blast in a fire disaster. Another common
method is to use reinforcement in columns. For this type of method, typical column
reinforcement consists of longitudinal and transverse steel bars tied together at
intersections to form a cage; in practice, on-site fabricated cages are lifted and placed
in position. Jarkas (2012) illustrated that the complex procedure has significantly

Chapter 2 Literature Review
YI-FANG CAO 35
increased the cost of labour by approximately 30%, and the addition of these steel bars
further increases the cost of columns. Besides the increase in cost, the installation of
steel cages also has side effects, such as insufficient concrete coverage of the
reinforcing bars, poor quality of filling concrete due to improper compaction, and
restricting the minimum size of the column.
Recently, with the rapid development of high performance materials, the fire
performance of CFST columns using innovative steel and concrete has been studied.
Experimental investigations on CFST columns coupled with high strength concrete
and high strength steel indicate that the use of those high performance materials has a
detrimental effect on the fire resistance of CFST columns (Han et al., 2014). This
highlights the need to increase the fire performance of CFST columns.
2.6 Summary
Based on the above literature review on the development of geopolymer and
CFST columns, the following findings can be summarised:
(1) Geopolymer is an emerging fire-resistant concrete. Unlike OPC,
geopolymer concrete can retain a large portion of its strength at elevated temperatures
and geopolymer has no risk of spalling. Whilst current research is based on mechanical
properties of geopolymer cured at elevated temperatures, this research will focus on
the fire performance of geopolymer concrete cured at an ambient temperature.
Elevated temperature curing regimes will be seen to impede the application of GPC.
Simplifying the curing regime is of great importance in order to fully develop the
potential of geopolymer in fire-resistant application. Adding some cement into
geopolymer allows it to be cured at an ambient temperature (Nath and Sarker, 2015).

Chapter 2 Literature Review
YI-FANG CAO 36
Although Kırca et al. (2013) studied the strength development of CAC and GGBFS
blends at different temperatures; no studies were found to investigate the potential of
using CAC as an additive in fly ash-based geopolymer for ambient curing conditions.
CAC is also famous for its high fire performance. Due to the high fire performance
and better mechanical properties of geopolymer, it is necessary to carry out study on
geopolymer blended with CAC.
(2) CFST columns are increasingly being used in engineering practice, but fire-
protection measures need to be implemented to meet the requirement to avoid fire
hazards. However, these methods lead to a heavy increase of construction costs or a
decrease of the quality of concrete compaction. Filling fire-resistant concrete in tubes
will improve the fire performance of CFST columns by absorbing heat from tubes.
Geopolymer concrete is a potential fire-resistant concrete. In this case, the CFST
column cast with fire-resistant geopolymer concrete is able to improve fire
performance without additional fire protection, such as external fire-resistant coating
or internal steel bars. Some current questions on the feasibility of the CFST column
with geopolymer should also be fully studied for its widely expanded application.
However, few researchers (Shi et al., 2015) have investigated the structural behaviour
of CFST columns with geopolymer concrete tested at ambient temperatures.
Considering geopolymer has a good fire performance, it is worthwhile to carry out
investigations to promote the potential applications of fire-resistant geopolymer
concretes in CFST columns.

Chapter 3 Experimental Program
YI-FANG CAO 37
Chapter 3 Experimental Program
3.1 Introduction
This chapter provides a detailed introduction to the experimental program and
materials used for this research. Firstly, the properties of concrete raw materials were
investigated, if not reported by the suppliers. The second part of this chapter introduces
the concrete test method. The last section provides the experimental program for CFST
columns. Both GPC and OPC concrete cylinders were cast and tested according to the
experiment method discussed in this chapter.
In addition to a workability test of fresh concrete, the main tests for concrete
properties include Young’s modulus test, the compression test, the indirect tensile
strength test and the flexural strength test. An extensometer was used to capture the
deformational performance of concrete cylinders at elevated temperatures. The heating
regime and microstructure analysis were reported on concrete testing. Additionally
introduced is the sample preparation for CFST columns. Fifteen CFST columns were
tested in this thesis, five of which at ambient temperature (ultimate loads recorded),
while five other columns were heated to failure, exposed to fire at a constant load level
(50% of ultimate load). The post-fire loading phases were tested on the remaining five
specimens.
3.2 Materials
3.2.1 Fly ash and calcium aluminate cement (CAC)
As mentioned in Chapter 2, a variety of aluminosilicate source materials such
as kaolinite, fly ash, and GGBFS can be utilised to synthesise geopolymer. Fly ash is
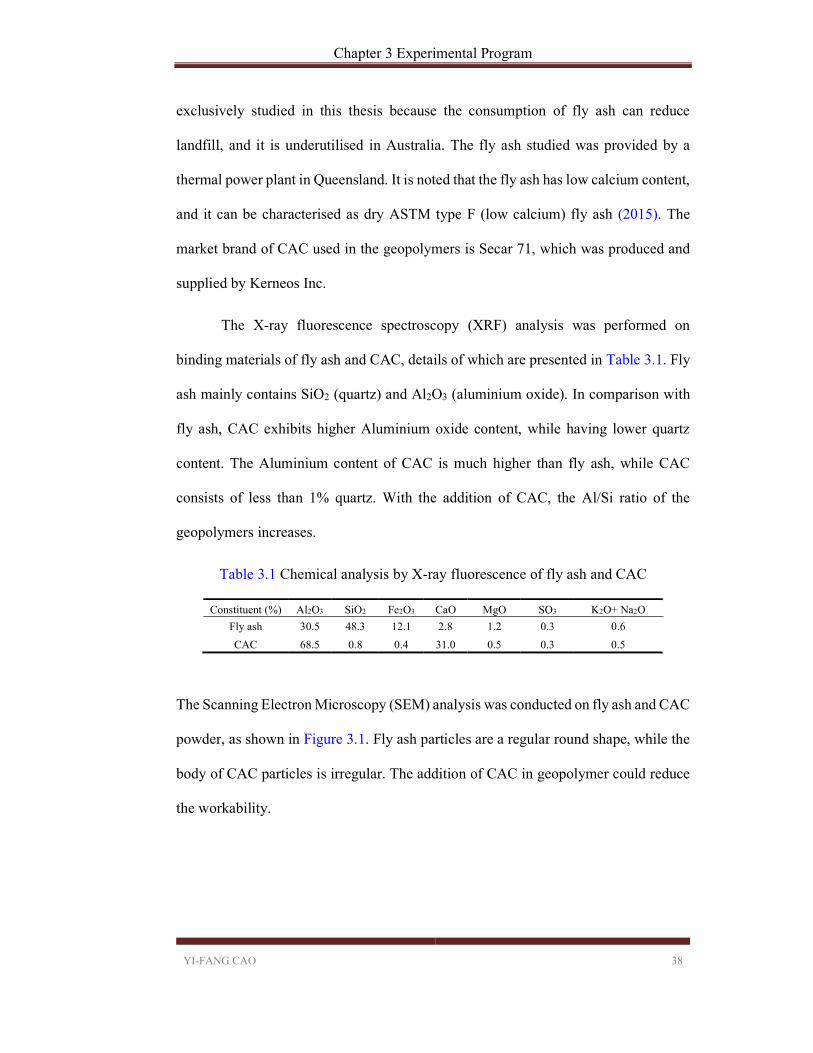
Chapter 3 Experimental Program
YI-FANG CAO 38
exclusively studied in this thesis because the consumption of fly ash can reduce
landfill, and it is underutilised in Australia. The fly ash studied was provided by a
thermal power plant in Queensland. It is noted that the fly ash has low calcium content,
and it can be characterised as dry ASTM type F (low calcium) fly ash (2015). The
market brand of CAC used in the geopolymers is Secar 71, which was produced and
supplied by Kerneos Inc.
The X-ray fluorescence spectroscopy (XRF) analysis was performed on
binding materials of fly ash and CAC, details of which are presented in Table 3.1. Fly
ash mainly contains SiO2 (quartz) and Al2O3 (aluminium oxide). In comparison with
fly ash, CAC exhibits higher Aluminium oxide content, while having lower quartz
content. The Aluminium content of CAC is much higher than fly ash, while CAC
consists of less than 1% quartz. With the addition of CAC, the Al/Si ratio of the
geopolymers increases.
Table 3.1 Chemical analysis by X-ray fluorescence of fly ash and CAC
Constituent (%) Al2O3 SiO2 Fe2O3 CaO MgO SO3 K2O+ Na2O
Fly ash 30.5 48.3 12.1 2.8 1.2 0.3 0.6
CAC 68.5 0.8 0.4 31.0 0.5 0.3 0.5
The Scanning Electron Microscopy (SEM) analysis was conducted on fly ash and CAC
powder, as shown in Figure 3.1. Fly ash particles are a regular round shape, while the
body of CAC particles is irregular. The addition of CAC in geopolymer could reduce
the workability.
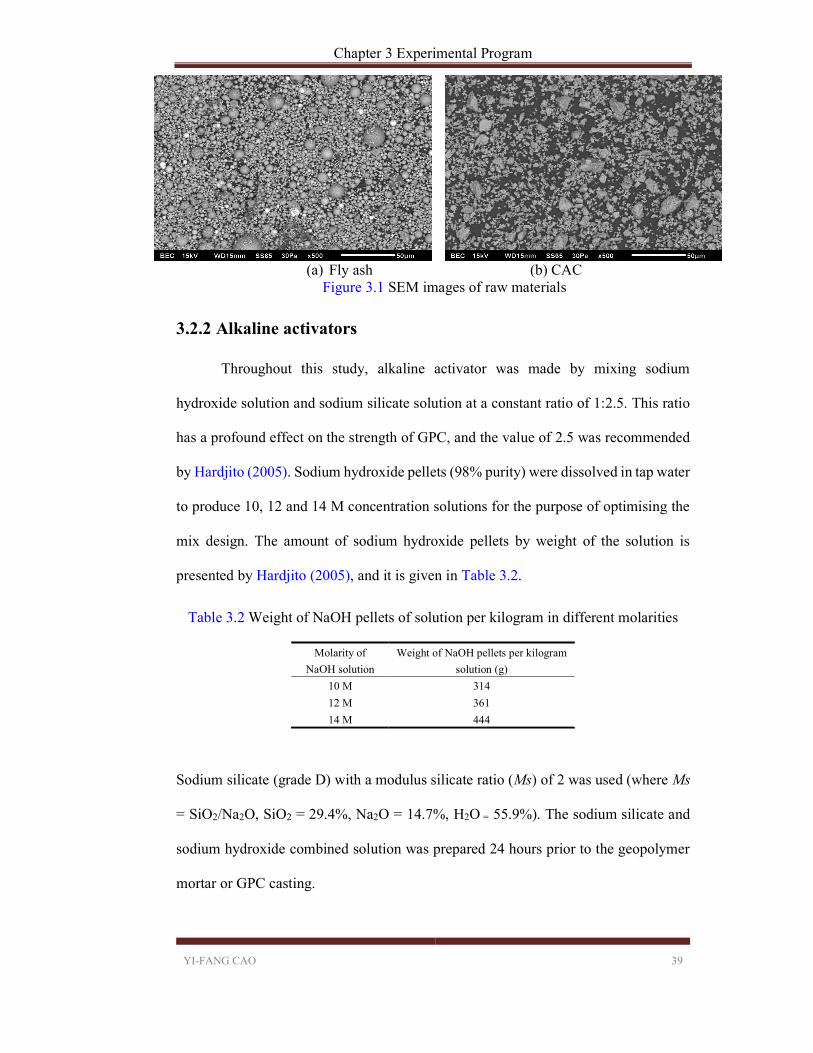
Chapter 3 Experimental Program
YI-FANG CAO 39
(a) Fly ash (b) CAC Figure 3.1 SEM images of raw materials
3.2.2 Alkaline activators
Throughout this study, alkaline activator was made by mixing sodium
hydroxide solution and sodium silicate solution at a constant ratio of 1:2.5. This ratio
has a profound effect on the strength of GPC, and the value of 2.5 was recommended
by Hardjito (2005). Sodium hydroxide pellets (98% purity) were dissolved in tap water
to produce 10, 12 and 14 M concentration solutions for the purpose of optimising the
mix design. The amount of sodium hydroxide pellets by weight of the solution is
presented by Hardjito (2005), and it is given in Table 3.2.
Table 3.2 Weight of NaOH pellets of solution per kilogram in different molarities
Molarity of
NaOH solution
Weight of NaOH pellets per kilogram
solution (g)
10 M 314
12 M 361
14 M 444
Sodium silicate (grade D) with a modulus silicate ratio (Ms) of 2 was used (where Ms
= SiO2/Na2O, SiO2 = 29.4%, Na2O = 14.7%, H2O = 55.9%). The sodium silicate and
sodium hydroxide combined solution was prepared 24 hours prior to the geopolymer
mortar or GPC casting.

Chapter 3 Experimental Program
YI-FANG CAO 40
3.2.3 Aggregates
Locally available river sand and limestone were used as fine aggregates and
coarse aggregates, respectively; fine aggregates and coarse aggregates (maximum size
20 mm) were used in its saturated surface dry condition. The grading curves of sand
and limestone are shown in Figure 3.2. Both fine aggregate grading requirements and
coarse aggregate grading requirements were followed, as suggested in ASTM C33
Standard (2003).
Figure 3.2 Sieve analysis of combined coarse aggregate and fine aggregate.
3.2.4 Superplasticiser
High range water reducing admixture in an aqueous solution was used for
improving the workability of OPC concrete, which has the product name
MasterGlenium SKY 8100. It is a polycarboxylic ether polymer superplasticiser and
complies with AS1478.1-2000 Type HWR High Range Water-reducing, which
requires 10% water reduction level.
0
10
20
30
40
50
60
70
80
90
100
0.1 1 10 100
Per
cent
of
pass
ing
by w
eigh
t (%
)
Sieve size (mm)
Coarse aggregateASTM upper-limitCoarse aggregateASTM lower-limitCoarse aggregategarding curveFine aggregateASTM upper-limitFine aggregateASTM lower-limitFine aggregategrading curve
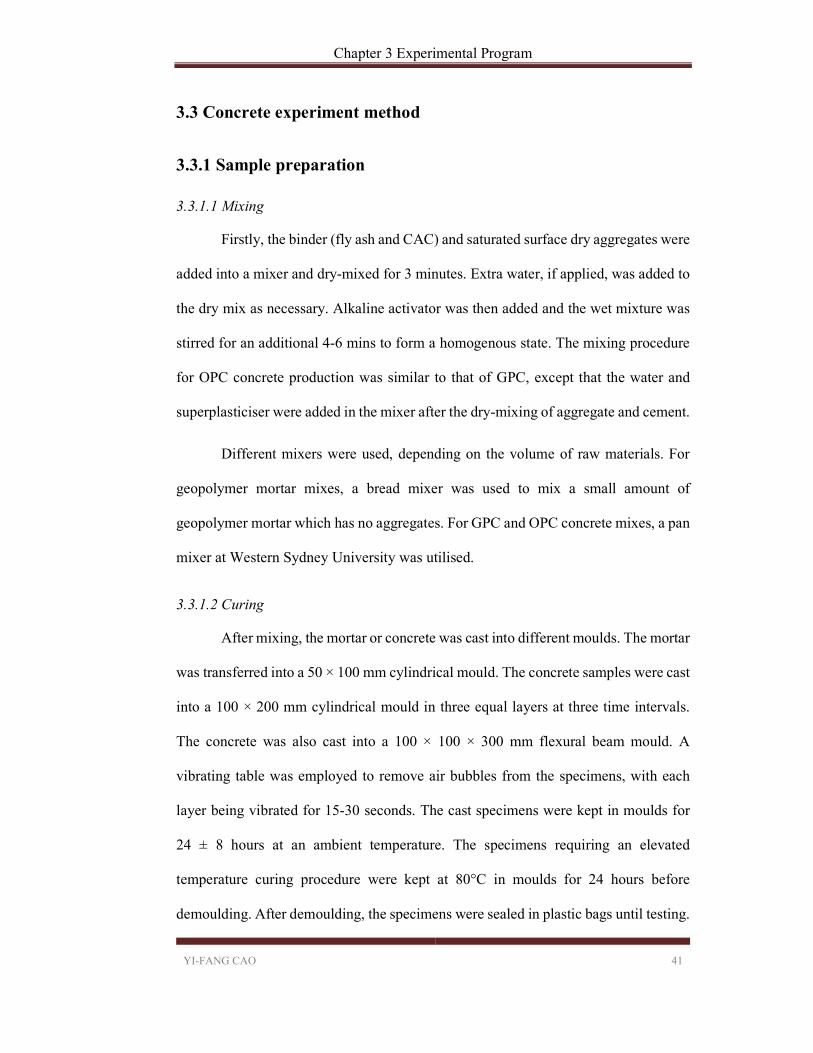
Chapter 3 Experimental Program
YI-FANG CAO 41
3.3 Concrete experiment method
3.3.1 Sample preparation
3.3.1.1 Mixing
Firstly, the binder (fly ash and CAC) and saturated surface dry aggregates were
added into a mixer and dry-mixed for 3 minutes. Extra water, if applied, was added to
the dry mix as necessary. Alkaline activator was then added and the wet mixture was
stirred for an additional 4-6 mins to form a homogenous state. The mixing procedure
for OPC concrete production was similar to that of GPC, except that the water and
superplasticiser were added in the mixer after the dry-mixing of aggregate and cement.
Different mixers were used, depending on the volume of raw materials. For
geopolymer mortar mixes, a bread mixer was used to mix a small amount of
geopolymer mortar which has no aggregates. For GPC and OPC concrete mixes, a pan
mixer at Western Sydney University was utilised.
3.3.1.2 Curing
After mixing, the mortar or concrete was cast into different moulds. The mortar
was transferred into a 50 × 100 mm cylindrical mould. The concrete samples were cast
into a 100 × 200 mm cylindrical mould in three equal layers at three time intervals.
The concrete was also cast into a 100 × 100 × 300 mm flexural beam mould. A
vibrating table was employed to remove air bubbles from the specimens, with each
layer being vibrated for 15-30 seconds. The cast specimens were kept in moulds for
24 ± 8 hours at an ambient temperature. The specimens requiring an elevated
temperature curing procedure were kept at 80°C in moulds for 24 hours before
demoulding. After demoulding, the specimens were sealed in plastic bags until testing.

Chapter 3 Experimental Program
YI-FANG CAO 42
Both concrete and mortar cylindrical specimens were ground using a CIVILAB core
facing grinder to achieve smooth and flat ends before testing.
3.3.2 Testing regime
3.3.2.1 Workability test
The workability of both fresh GPC and OPC concrete was measured by
conventional slump testing. For geopolymer paste, workability was assessed by a mini-
slump test. The slump mould, shown in Figure 3.3, had an inner cone, with the top
diameter = 19 mm, the end diameter = 38 mm and the height = 57 mm.
Figure 3.3 Mini-slump mould
During the test, the mould was steadily placed on a plastic sheet on a flat table and
filled with paste. The excessive paste was removed and the top surface was levelled
after the inner cone was full. The mould was then removed vertically to ensure the
paste was laterally undisturbed. The diameter of the spread circle was determined from
the mean of two orthogonal direction measurements.
3.3.2.2 Compression test
Mortar and concrete cylinders were tested using an INSTRON 8036 universal
testing machine which has an uncertainty of 0.45% for loads below 200 kN. The
57 m
m
38 mm
19 mm

Chapter 3 Experimental Program
YI-FANG CAO 43
compression test was conducted in accordance with ASTM C39 Standard (1996). The
loading rate was 0.25 ± 0.05 MPa/s. The tests were conducted at an ambient
temperature, and the averaged results of three samples were recorded. The diameter
and height of cylinders in conjunction with mass were measured before the testing to
calculate density.
3.3.2.3 Young’s modulus test
Young’s modulus test was conducted following the ASTM C469 Standard
(2002) and the testing results were carried out using an INSTRON 8036 testing
machine. The loading and unloading rates were 0.25 ± 0.05 MPa/s. The initial loading
and unloading cycle of the test was abandoned. The cylinders were unloaded after
loading to 40% of ultimate strength and the whole test cycled three times.
Figure 3.4 Young’s modulus test setup
As shown in Figure 3.4, the strain of concrete was measured by two linear variable
differential transducers (LVDTs). The two LVDTs were fixed on two rings oppositely.
LVDT
Head of testing machine
Cylinder

Chapter 3 Experimental Program
YI-FANG CAO 44
The relative movements of the concrete cylinder under compression were recorded by
LVDTs.
3.3.2.4 Splitting tensile strength test
The splitting tensile strength (indirect tensile strength) test was conducted in
accordance with procedure prescribed by ASTM C496 Standard (2011). The testing
was conducted using the INSTRON 6027 testing machine. Three specimens were
tested for each mixing design. The cylinder was subjected to compressive force on
either side which caused the splitting of the sample.
3.3.2.5 Flexural strength test
The flexural strength was measured according to the ASTM C78 Standard
(2010) using the INSTRON 6027 testing machine. As specified in the Standard, two
beam specimens were tested for each mix. The specimen was loaded constantly at a
rate of 1.0 MPa/min until rupture occurred. The testing setup is shown in Figure 3.5.
Figure 3.5 Flexural strength test setup
Specimen Loading block
Head of testing machine

Chapter 3 Experimental Program
YI-FANG CAO 45
3.3.2.6 Strain measurement
There were two strain measurement setups for the concrete experiments.
Firstly, Young’s modulus was measured under compression using two LVDTs, while
the second stain measurement was used to record stress-strain curves of concrete. To
obtain complete stress-strain curves, a CM-10H compressometer was employed to
measure the strain of concrete cylinders under compression. Two high-sensitivity
displacement transducers, with a gauge length of 100 mm, were installed in this
compressometer. However, the strain measured by the compressometer became
invalid, as extensive cracks developed on the concrete specimen after peak stress.
Following this, four LVDTs were used to measure the platen-platen deformation of
machine. The LVDTs were fixed on the bottom platen at four sides of the concrete
cylinder.
Figure 3.6 Stress-strain relationship experiment setup
The experiment setup is shown in Figure 3.6. The compression load for stress-strain
testing was applied by a closed-loop servo controlled hydraulic MTS machine with a
LVDTs Cylinder
Compressometer
Head of testing machine

Chapter 3 Experimental Program
YI-FANG CAO 46
maximum capacity of 5000 kN. A loading rate was kept at 0.05 mm/min for all stress-
strain tests of concrete cylindrical specimens.
3.3.2.7 Heating regime
Two heating regimes were used in the examination of the fire performance of
GPC. Firstly, the slow heating rate was employed to test the post-fire performance of
GPC. The specimen was placed in the electrical furnace, see Figure 3.7.
Figure 3.7 Fire test setup of concrete cylinder
The temperature of the furnace was increased to target temperatures (200, 400, 600
and 800°C) at the rate of 5°C/min, and the furnace held this target temperature once
Type S Thermocouples
Cylinder
Furnace
Exhaust
Steel casing
Lower support
Loading jack
Lower support
Heating elements
Displacement transducer

Chapter 3 Experimental Program
YI-FANG CAO 47
achieved for 3 hours, so as to obtain a state of equilibrium. Afterwards, the furnace
was naturally cooled to an ambient temperature. The slow heating regime is shown in
Figure 3.8.
Figure 3.8 Heating regime
The rapid heating was used to test the high temperature performance of a concrete
cylinder with constant loading. Firstly, the specimen was loaded by the hydraulic
machine to a constant rate of 0.25 ± 0.05 MPa/s. The furnace was closed after keeping
the load on specimen for 10 mins. The furnace was ignited and heated the specimen to
800 °C with the maximum capacity. The rapid heating curve, compared to the standard
heating curve provided by the Australia Standard 1530.4 (1997), is shown in Figure
3.8. The strength of the specimen decreased in the condition of high temperatures, and
once it could no longer bear the constant loading, the test ended. The deformation
under high temperatures and high temperature endurance period were recorded.
3.3.2.8 X-ray diffraction analysis (XRD)
The X-ray Diffraction Analysis was conducted on a Bruker D8 Advance
Powder Diffractometer, as shown in Figure 3.9. The geopolymer paste sample was
0
200
400
600
800
1000
1200
0 60 120 180 240 300 360
Δ(m
m)
Time (min)
Standard Heating Curve
Rapid Heating Regime
Slow Heating Regime
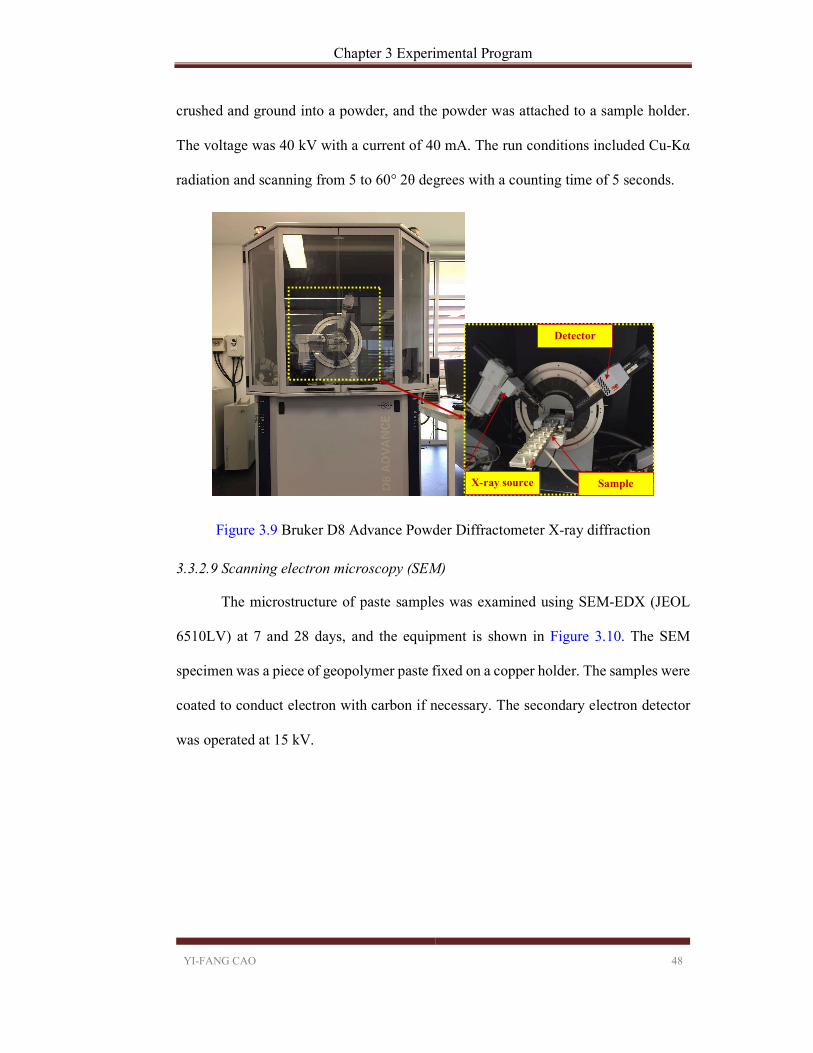
Chapter 3 Experimental Program
YI-FANG CAO 48
crushed and ground into a powder, and the powder was attached to a sample holder.
The voltage was 40 kV with a current of 40 mA. The run conditions included Cu-Kα
radiation and scanning from 5 to 60° 2θ degrees with a counting time of 5 seconds.
Figure 3.9 Bruker D8 Advance Powder Diffractometer X-ray diffraction
3.3.2.9 Scanning electron microscopy (SEM)
The microstructure of paste samples was examined using SEM-EDX (JEOL
6510LV) at 7 and 28 days, and the equipment is shown in Figure 3.10. The SEM
specimen was a piece of geopolymer paste fixed on a copper holder. The samples were
coated to conduct electron with carbon if necessary. The secondary electron detector
was operated at 15 kV.
Detector
Sample X-ray source
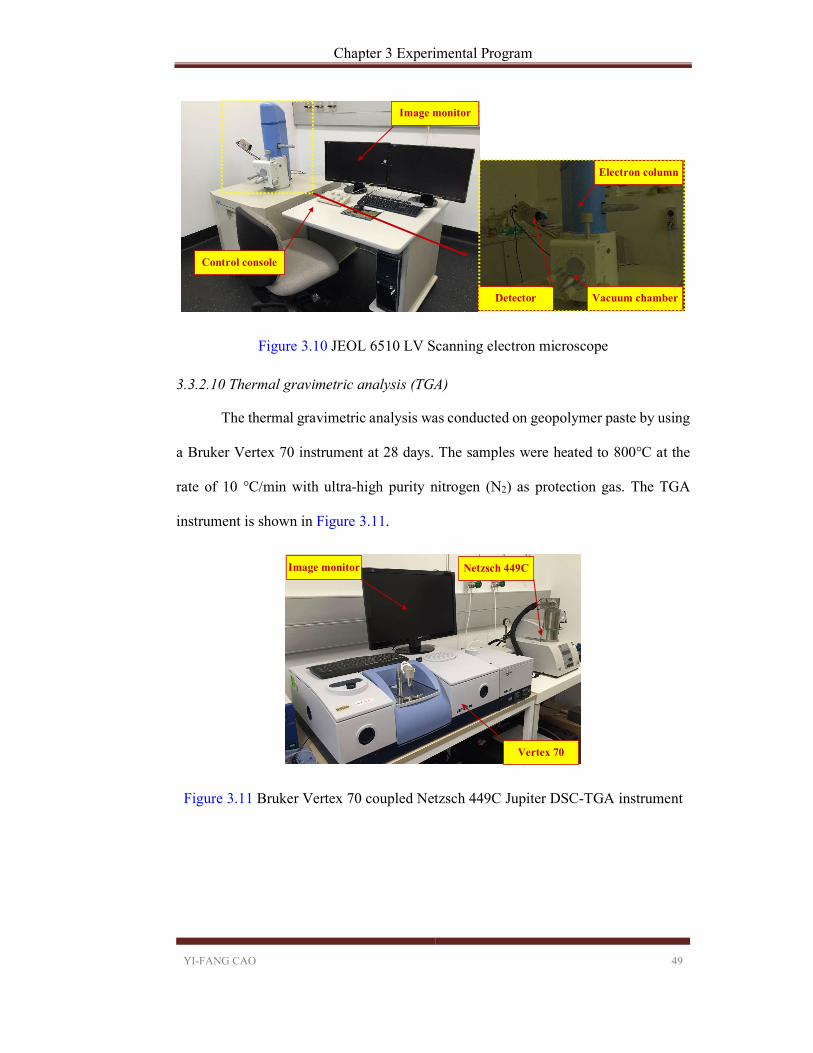
Chapter 3 Experimental Program
YI-FANG CAO 49
Figure 3.10 JEOL 6510 LV Scanning electron microscope
3.3.2.10 Thermal gravimetric analysis (TGA)
The thermal gravimetric analysis was conducted on geopolymer paste by using
a Bruker Vertex 70 instrument at 28 days. The samples were heated to 800°C at the
rate of 10 °C/min with ultra-high purity nitrogen (N2) as protection gas. The TGA
instrument is shown in Figure 3.11.
Figure 3.11 Bruker Vertex 70 coupled Netzsch 449C Jupiter DSC-TGA instrument
Image monitor
Control console
Electron column
Vacuum chamber Detector
Image monitor
Vertex 70
Netzsch 449C

Chapter 3 Experimental Program
YI-FANG CAO 50
3.4 CFST experiment method
3.4.1 Sample preparation
3.4.1.1 Casting
As discussed, a total of fifteen circular steel tubes were cast with concrete, and
all the tubes were fabricated from the same batch. All specimens had a designed length
(L) of 340 mm, including two endplates with a thickness of 12 mm. The diameter of
the endplate was 200 mm, and a 120 mm hole was cut on the top of the endplate to
pour concrete into. The nominal external diameter (D) of the steel tube was 150 mm,
and the nominal thickness (t) was 3 mm.
The concrete was mixed in a uniform state according to Section 3.3.1.1, and
then the concrete was cast into the steel tube in three equal layers at three time
intervals. At the same time, a concrete vibrator was utilised to compact the concrete
and expel the internal air bubbles.
3.4.1.2 Curing
After casting, the top ends of all fifteen steel tubes were wrapped by
polyethylene films. The ten fresh OPC concrete and GPC filled steel tubes were left at
ambient temperature. The rest of GPC filled steel tubes were firstly cured at 80°C in
an oven for 24 h, and then the GCFSTs were cured at an ambient temperature until the
test was carried out.

Chapter 3 Experimental Program
YI-FANG CAO 51
3.4.2 Testing regime
3.4.2.1 Material properties test
Tensile tests, performed by the INSTRON 6027, were conducted on three steel
coupons cut from one of the original steel tubes; all steel tubes came from one batch
of fabricating. The material properties were recorded, including Young’s modulus, the
yield stress, yield strain and ultimate strength of the steel tube. The residual strength
of steel was also tested with the same machine. The material test setup is show in
Figure 3.12, and the heating rate is identical to that recorded in Figure 3.8.
Figure 3.12 Fire test setup of steel coupon
Head of testing machine
Extensometer
Steel coupon
Heating elements
Furnace
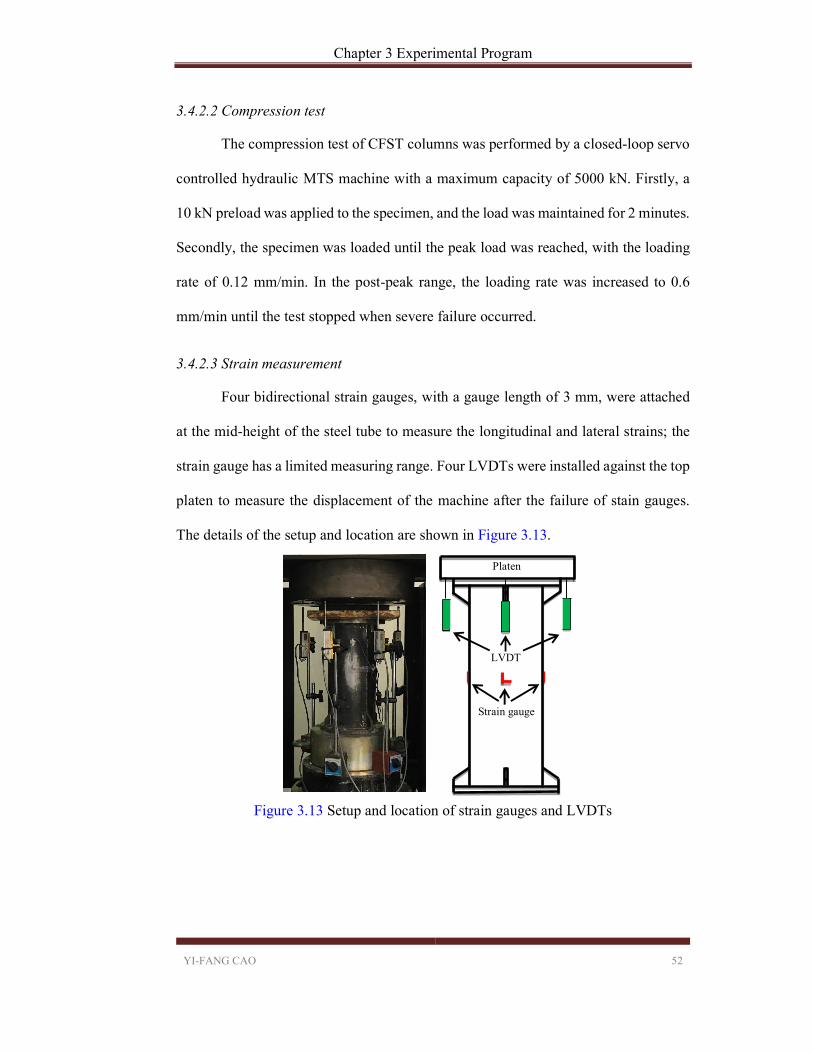
Chapter 3 Experimental Program
YI-FANG CAO 52
3.4.2.2 Compression test
The compression test of CFST columns was performed by a closed-loop servo
controlled hydraulic MTS machine with a maximum capacity of 5000 kN. Firstly, a
10 kN preload was applied to the specimen, and the load was maintained for 2 minutes.
Secondly, the specimen was loaded until the peak load was reached, with the loading
rate of 0.12 mm/min. In the post-peak range, the loading rate was increased to 0.6
mm/min until the test stopped when severe failure occurred.
3.4.2.3 Strain measurement
Four bidirectional strain gauges, with a gauge length of 3 mm, were attached
at the mid-height of the steel tube to measure the longitudinal and lateral strains; the
strain gauge has a limited measuring range. Four LVDTs were installed against the top
platen to measure the displacement of the machine after the failure of stain gauges.
The details of the setup and location are shown in Figure 3.13.
Figure 3.13 Setup and location of strain gauges and LVDTs
LVDT
Strain gauge
Platen

Chapter 3 Experimental Program
YI-FANG CAO 53
3.4.2.4 Heating regime
Two heating regimes were used to evaluate the fire performance of CFST
columns, as seen in Figure 3.14. The first one was a slow heating regime used to study
the post-fire performance of CFST columns. The CFST column was put in the
electrical furnace, and the temperature of the furnace was increased to 800°C at the
rate of 5°C/min. The furnace maintained the target temperature for 3 hours to achieve
a state of equilibrium. Lastly, the furnace was naturally cooled to room temperature.
Figure 3.14 Fire test setup of CFST
The rapid heating regime was used to test the response of CFST columns to fire when
holding a constant load. The control model of the compression machine was set to load
control for the whole testing process. The CFST column was firstly loaded to 50% of
Type S thermocouples
CFST
Furnace
Exhaust
Lower support Heating elements

Chapter 3 Experimental Program
YI-FANG CAO 54
its ultimate load. The furnace was then started and the heating rate was the same as
noted in Figure 3.8. The load bearing capacity of a CFST column decreased after
sufficient fire exposure, which caused deformation to the column. When the
deformation exceeded 40 mm, the experiment was stopped.
3.5 Summary
This chapter presented a detailed description of raw materials and the
experimental methods adopted in this thesis. The results are reported of tests on raw
material properties in the laboratory, which were not provided by suppliers. The
preparation process of both concrete and CFST specimens were introduced in detail.
Following this, standard test methods and microstructure characterisation methods on
the mechanical properties of concrete were explained. The testing regimes of CFST
columns were also summarised in this chapter.

Chapter 4 Development of Optimised Mix Design for Geopolymer Concrete
YI-FANG CAO 55
Chapter 4 Development of Optimised Mix Design for
Geopolymer Concrete
4.1 Introduction
Several factors of GPC were considered to develop successful GPC mixing
designs with optimised mechanical properties and workability. In a conventional
experimental study, changing one factor at a time and keeping other factors constantly
is a common approach. However, this approach requires extensive experimental work
as the mechanical properties of GPC depend on various mixing parameters. In addition
to different factors of mixing design, each factor has several values, for example, the
alkaline solution concentration has four levels commonly used by former researchers:
8, 10, 12 and 14 M (Hardjito, 2005). Therefore, employing an effective strategy to
design the salient parameter experiment of GPC is of great importance.
To save the cost and time of doing experiments, the Taguchi method will be
implemented to determine the optimal mixtures of geopolymer with high strength and
good workability. The Taguchi experimental design method has been widely applied
in determining concrete mix design through experiments. Instead of the “one-variable-
one-value” experimental method, the Taguchi method changes one variable and its
level once, whilst keeping others fixed. The Taguchi method efficiently optimises the
experiment with multi-variables and multi-levels, whilst ensuring satisfactory and
reliable results (Wu and Naik, 2003).
4.2 Background of Taguchi method
The influence of using CAC as a supplementary material to simplify the curing
procedure of geopolymer was analysed with the Taguchi method. This method is an
Chapter 4 Development of Optimised Mix Design for Geopolymer Concrete
YI-FANG CAO 56
effective approach to designing multifactor experiments, with the advantage of
selecting an optimal test scheme and salient parameters.
The five-step parameter analysing method was carried out as follows (Ross, 1988):
(1) The influencing factors and ranges of factors were chosen, based on former
experimental research (Cao et al., 2016a). Tests were conducted on the
workability and compressive strength of nine geopolymer mixtures.
(2) To investigate the significance of all factors, the range analysis was analysed
on flow ability and compressive strength. The results of an orthogonal test were
analysed with the direct-viewing analysis method (means k and maximal range
R) (Li et al., 2015), by taking the mini-slump test results of the orthogonal
experiment shown in Table 4.3, as an example, so as to demonstrate the data
processing of K, k and R in Table 4.4. For each factor in the Kw1 row, the test
results of level 1 of this factor were summed. For instance, A factor at Kw1 row
is Kw1 = 100 + 114 + 120. The Kw1 was divided by 3 which gave the mean
values of level (kw1), and so on. For each factor, the minimum value (among
kw1, kw2, kw3) was subtracted by the corresponding maximum value to get the
range value R of each factor. For example, Rw for A factor is Rw = kw1 - kw2 =
111.3 – 107.7.
(3) The bigger mean value R equates to a better response. The factor order was
sorted by the mean values and then the optimum level was determined to be
the maximum value among kw1, kw2, kw3.
(4) Two optimal mixture designs based on compressive strength and workability
were proposed. Another mixture design was also proposed which considered
economic factors.
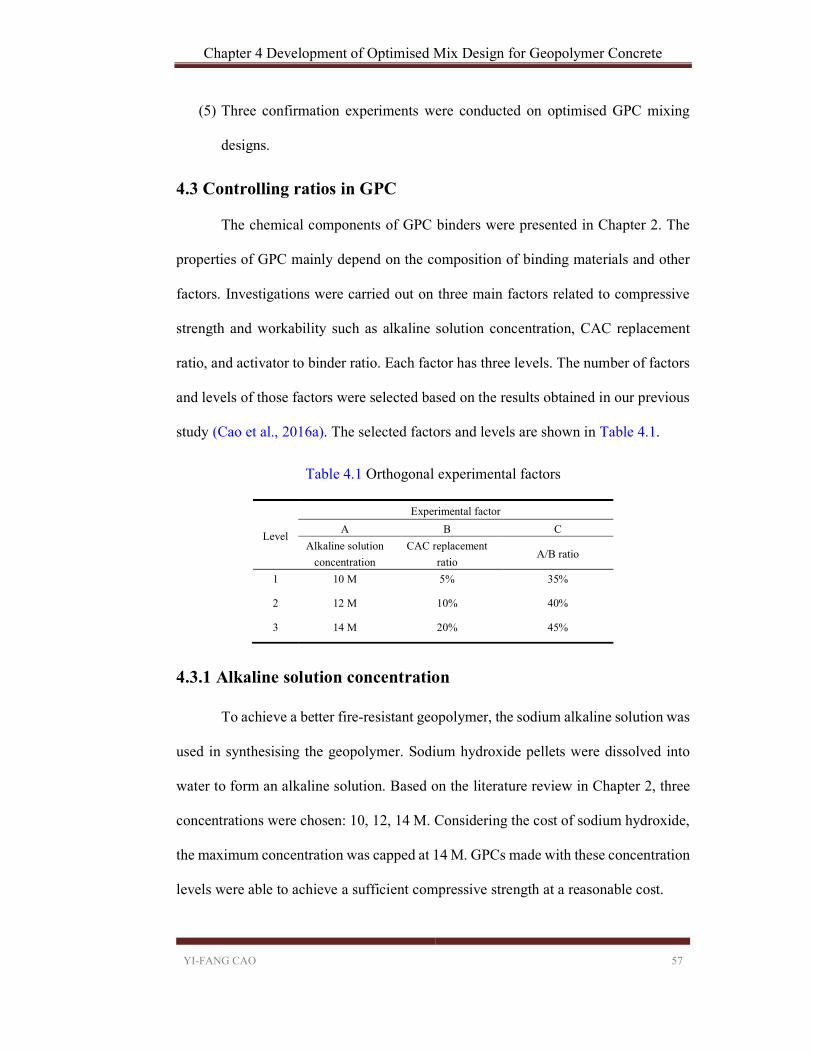
Chapter 4 Development of Optimised Mix Design for Geopolymer Concrete
YI-FANG CAO 57
(5) Three confirmation experiments were conducted on optimised GPC mixing
designs.
4.3 Controlling ratios in GPC
The chemical components of GPC binders were presented in Chapter 2. The
properties of GPC mainly depend on the composition of binding materials and other
factors. Investigations were carried out on three main factors related to compressive
strength and workability such as alkaline solution concentration, CAC replacement
ratio, and activator to binder ratio. Each factor has three levels. The number of factors
and levels of those factors were selected based on the results obtained in our previous
study (Cao et al., 2016a). The selected factors and levels are shown in Table 4.1.
Table 4.1 Orthogonal experimental factors
Level
Experimental factor
A B C
Alkaline solution
concentration
CAC replacement
ratio A/B ratio
1 10 M 5% 35%
2 12 M 10% 40%
3 14 M 20% 45%
4.3.1 Alkaline solution concentration
To achieve a better fire-resistant geopolymer, the sodium alkaline solution was
used in synthesising the geopolymer. Sodium hydroxide pellets were dissolved into
water to form an alkaline solution. Based on the literature review in Chapter 2, three
concentrations were chosen: 10, 12, 14 M. Considering the cost of sodium hydroxide,
the maximum concentration was capped at 14 M. GPCs made with these concentration
levels were able to achieve a sufficient compressive strength at a reasonable cost.

Chapter 4 Development of Optimised Mix Design for Geopolymer Concrete
YI-FANG CAO 58
4.3.2 Calcium aluminate cement replacement ratio
CAC is well known for its high temperature resistance, and it has also been
found to have rapid hardening properties (Hewlett, 2003). Therefore, part of the fly
ash was replaced by CAC to achieve better mechanical properties and eliminate the
heat-curing procedure. The CAC replacement ratio was selected as 5%, 10% and 20%
of fly ash by mass. The maximum amount of CAC was controlled below 20% for the
following reasons:
(1) First, a process called ‘conversion’ occurs in hydrated CAC over time
(Fernández-Jiménez and Puertas, 1997), whereby metastable hydrates
convert to stable hydrates, leading to an increase in porosity and a
subsequent decrease in strength. It is not clear if the same problem would
occur if excessive CAC is used in making GPC.
(2) Secondly, CAC is more expensive than Portland cement, with the cost
related directly to the limited supply of bauxite, which is the main source
of alumina in CAC production.
4.3.3 Activator to binder ratio
The activator was a mixed solution—from a sodium silicate and sodium
hydroxide solution at the ratio of 2.5—and the binder was a mix of fly ash and CAC.
The activator to binder ratio had three levels: 35%, 40%, 45%. Since the amount of
binder was relatively similar, the activator to binder ratio directly indicated the amount
of alkaline solution, which was an indication of the workability.
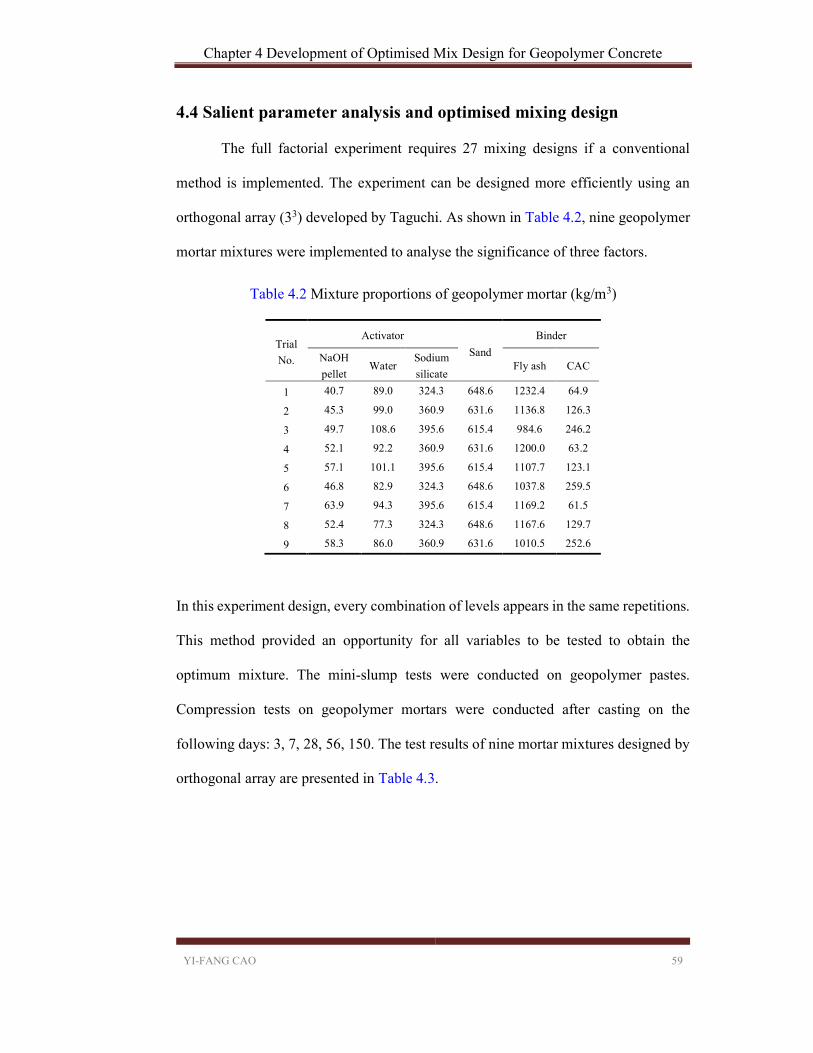
Chapter 4 Development of Optimised Mix Design for Geopolymer Concrete
YI-FANG CAO 59
4.4 Salient parameter analysis and optimised mixing design
The full factorial experiment requires 27 mixing designs if a conventional
method is implemented. The experiment can be designed more efficiently using an
orthogonal array (33) developed by Taguchi. As shown in Table 4.2, nine geopolymer
mortar mixtures were implemented to analyse the significance of three factors.
Table 4.2 Mixture proportions of geopolymer mortar (kg/m3)
Trial
No.
Activator
Sand
Binder
NaOH
pellet Water
Sodium
silicate Fly ash CAC
1 40.7 89.0 324.3 648.6 1232.4 64.9
2 45.3 99.0 360.9 631.6 1136.8 126.3
3 49.7 108.6 395.6 615.4 984.6 246.2
4 52.1 92.2 360.9 631.6 1200.0 63.2
5 57.1 101.1 395.6 615.4 1107.7 123.1
6 46.8 82.9 324.3 648.6 1037.8 259.5
7 63.9 94.3 395.6 615.4 1169.2 61.5
8 52.4 77.3 324.3 648.6 1167.6 129.7
9 58.3 86.0 360.9 631.6 1010.5 252.6
In this experiment design, every combination of levels appears in the same repetitions.
This method provided an opportunity for all variables to be tested to obtain the
optimum mixture. The mini-slump tests were conducted on geopolymer pastes.
Compression tests on geopolymer mortars were conducted after casting on the
following days: 3, 7, 28, 56, 150. The test results of nine mortar mixtures designed by
orthogonal array are presented in Table 4.3.
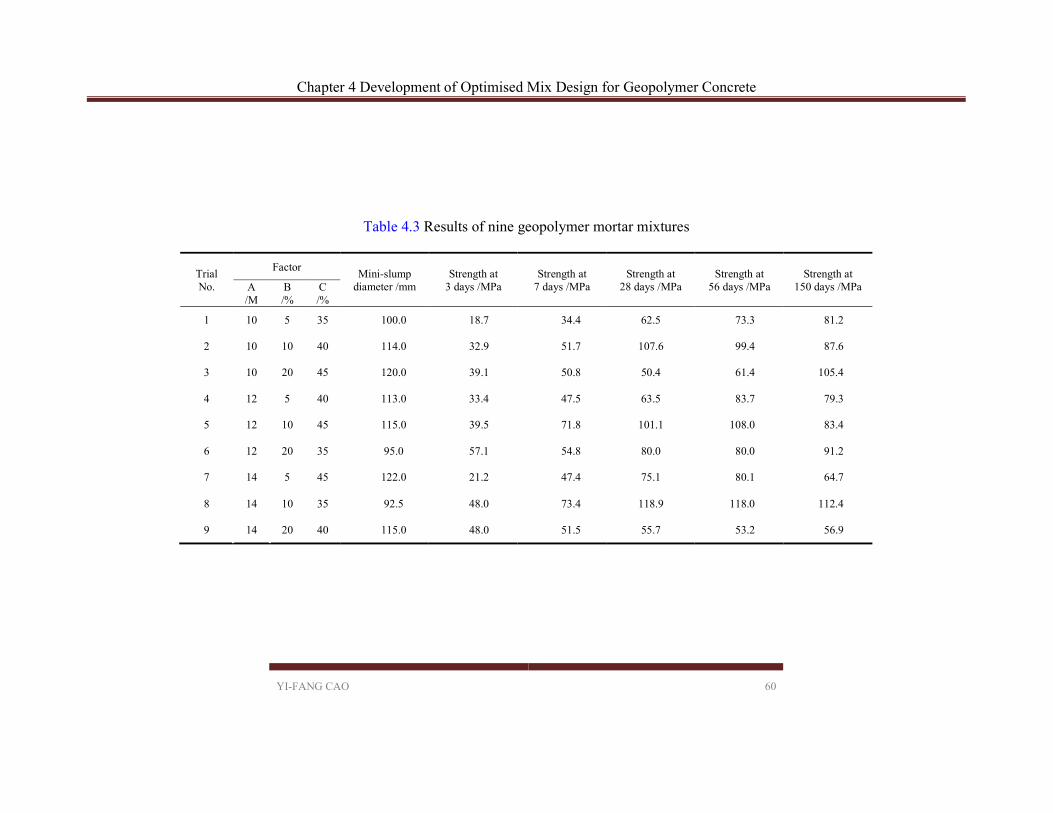
Chapter 4 Development of Optimised Mix Design for Geopolymer Concrete
YI-FANG CAO 60
Table 4.3 Results of nine geopolymer mortar mixtures
Trial No.
Factor Mini-slump
diameter /mm Strength at
3 days /MPa Strength at
7 days /MPa Strength at
28 days /MPa Strength at
56 days /MPa Strength at
150 days /MPa A /M
B /%
C /%
1 10 5 35 100.0 18.7 34.4 62.5 73.3 81.2
2 10 10 40 114.0 32.9 51.7 107.6 99.4 87.6
3 10 20 45 120.0 39.1 50.8 50.4 61.4 105.4
4 12 5 40 113.0 33.4 47.5 63.5 83.7 79.3
5 12 10 45 115.0 39.5 71.8 101.1 108.0 83.4
6 12 20 35 95.0 57.1 54.8 80.0 80.0 91.2
7 14 5 45 122.0 21.2 47.4 75.1 80.1 64.7
8 14 10 35 92.5 48.0 73.4 118.9 118.0 112.4
9 14 20 40 115.0 48.0 51.5 55.7 53.2 56.9
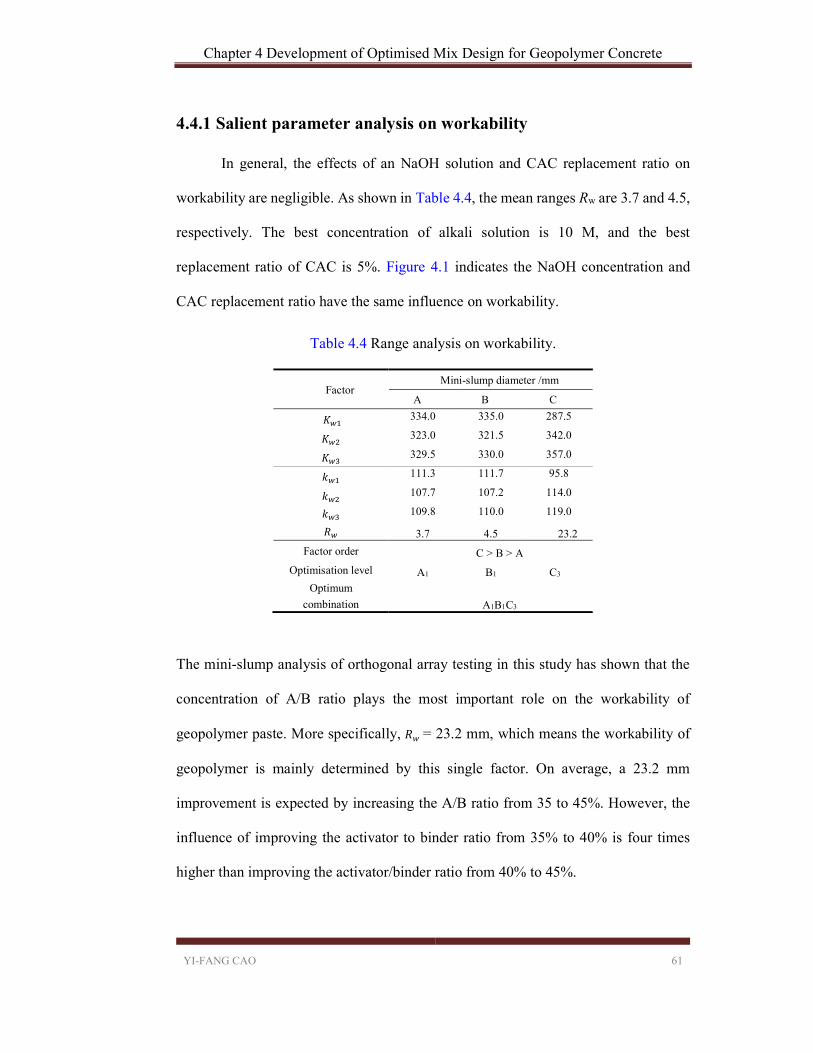
Chapter 4 Development of Optimised Mix Design for Geopolymer Concrete
YI-FANG CAO 61
4.4.1 Salient parameter analysis on workability
In general, the effects of an NaOH solution and CAC replacement ratio on
workability are negligible. As shown in Table 4.4, the mean ranges Rw are 3.7 and 4.5,
respectively. The best concentration of alkali solution is 10 M, and the best
replacement ratio of CAC is 5%. Figure 4.1 indicates the NaOH concentration and
CAC replacement ratio have the same influence on workability.
Table 4.4 Range analysis on workability.
Factor Mini-slump diameter /mm
A B C
𝐾 334.0 335.0 287.5
𝐾 323.0 321.5 342.0
𝐾 329.5 330.0 357.0
𝑘 111.3 111.7 95.8
𝑘 107.7 107.2 114.0
𝑘 109.8 110.0 119.0
𝑅 3.7 4.5 23.2
Factor order C > B > A
Optimisation level A1 B1 C3
Optimum
combination A1B1C3
The mini-slump analysis of orthogonal array testing in this study has shown that the
concentration of A/B ratio plays the most important role on the workability of
geopolymer paste. More specifically, 𝑅𝑤 = 23.2 mm, which means the workability of
geopolymer is mainly determined by this single factor. On average, a 23.2 mm
improvement is expected by increasing the A/B ratio from 35 to 45%. However, the
influence of improving the activator to binder ratio from 35% to 40% is four times
higher than improving the activator/binder ratio from 40% to 45%.

Chapter 4 Development of Optimised Mix Design for Geopolymer Concrete
YI-FANG CAO 62
Figure 4.1 Average effect of factors on the workability of fresh geopolymer
paste.
Activator to binder ratio is the most salient factor for workability, of which 45% has
the best results. CAC replacement ratio is the second important factor, and the NaOH
concentration is the least important factor. The optimised design based on workability
is A1B1C3.
4.4.2 Salient parameter analysis on compressive strength
Nine trial mixtures were implemented to analyse the significance of three
factors. Compression tests on GPM were conducted at the following days after casting:
3, 7, 28, 56, 150. Table 4.4 provides the compressive strength of GPM cylinders at 3,
7, 28, 56 and 150 days. Three mix designs had higher compressive strengths than 100
MPa after being cured for 28 days, while the weakest mixture design was 50.4 MPa.
The factor has a distinct influence on the compressive strength of geopolymer. As
shown in Table 4.5, the range analysis of strength at early ages was reported. With the
addition of CAC, the strength of geopolymer develops very fast at early ages.
90
95
100
105
110
115
120
125
10M 12M 14M 5% 10% 20% 35% 40% 45%
Min
i-sl
ump
test
(m
m)
NaOH concentration CAC replacement ratio A/B ratio

Chapter 4 Development of Optimised Mix Design for Geopolymer Concrete
YI-FANG CAO 63
Table 4.5 Range analysis on early-age strength
Factor 3 day compressive strength 7 day compressive strength
A B C A B C
𝐾 90.7 73.3 123.8 136.9 129.3 162.6
𝐾 130.0 120.4 114.3 174.1 196.9 150.7
𝐾 117.2 144.2 99.8 172.3 157.1 170.0
𝑘 30.2 24.4 41.3 45.6 43.1 54.2
𝑘 43.3 40.1 38.1 58.0 65.6 50.2
𝑘 39.1 48.1 33.3 57.4 52.4 56.7
𝑅 13.1 23.6 8.0 12.4 22.5 6.5
Factor order B > A > C B > A > C
Optimisation level A2 B3 C1 A2 B2 C3
Optimum combination A2B3C1 A2B2C3
As shown in Table 4.6, the range analysis was conducted on compressive strength of
geopolymer mortar at 28 days. The influence of three factors is different with the early
age strength. The results offered information for the design of GPC mixtures. The
mechanical properties of GPC were also tested and reported at 28 days in Chapter 5.
Table 4.6 Range analysis on strength at 28 days
Factor 28 day compressive strength
A B C
𝐾 220.5 201.1 261.4
𝐾 244.6 327.6 226.8
𝐾 249.7 186.1 226.6
𝑘 73.5 67.0 87.1
𝑘 81.5 109.2 75.6
𝑘 83.2 62.0 75.5
𝑅 9.7 47.2 11.6
Factor order B > C > A
Optimisation level A3 B2 C1
Optimum combination A3B2C1
The range analysis of long-term strength was reported in Table 4.7. The strength of
some geopolymer mortar cylinders increases steadily from the 3 days to 150 days,
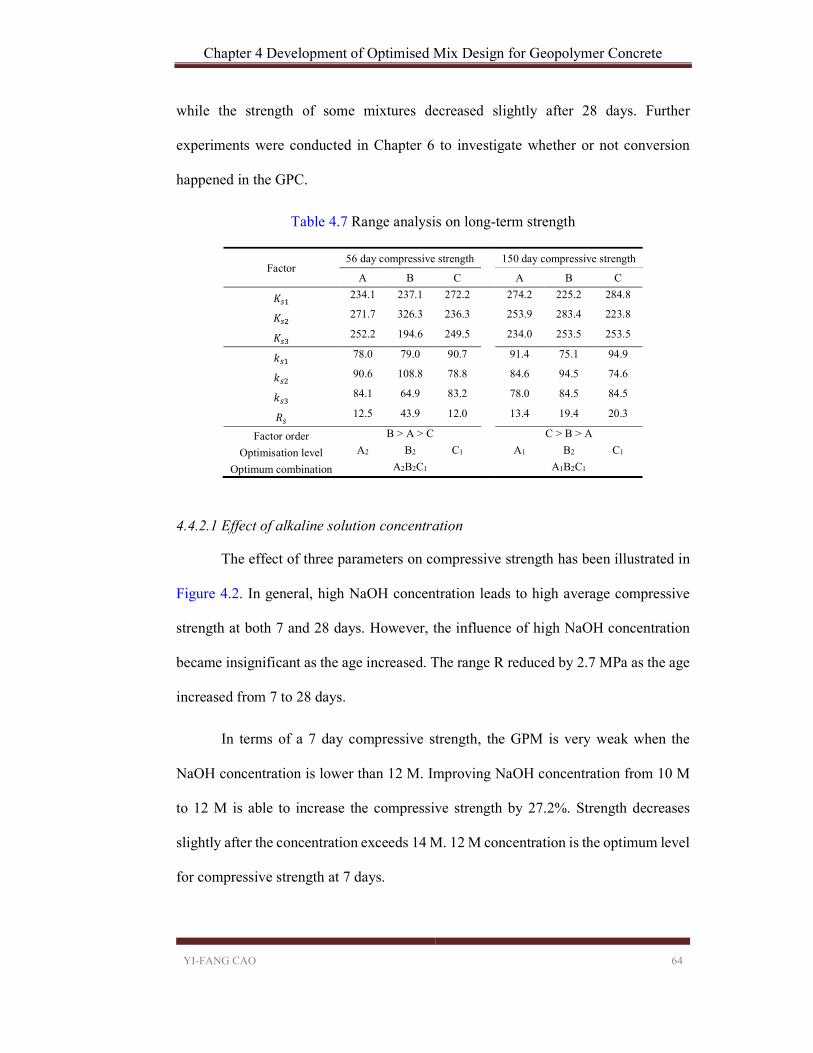
Chapter 4 Development of Optimised Mix Design for Geopolymer Concrete
YI-FANG CAO 64
while the strength of some mixtures decreased slightly after 28 days. Further
experiments were conducted in Chapter 6 to investigate whether or not conversion
happened in the GPC.
Table 4.7 Range analysis on long-term strength
Factor 56 day compressive strength 150 day compressive strength
A B C A B C
𝐾 234.1 237.1 272.2 274.2 225.2 284.8
𝐾 271.7 326.3 236.3 253.9 283.4 223.8
𝐾 252.2 194.6 249.5 234.0 253.5 253.5
𝑘 78.0 79.0 90.7 91.4 75.1 94.9
𝑘 90.6 108.8 78.8 84.6 94.5 74.6
𝑘 84.1 64.9 83.2 78.0 84.5 84.5
𝑅 12.5 43.9 12.0 13.4 19.4 20.3
Factor order B > A > C C > B > A
Optimisation level A2 B2 C1 A1 B2 C1
Optimum combination A2B2C1 A1B2C1
4.4.2.1 Effect of alkaline solution concentration
The effect of three parameters on compressive strength has been illustrated in
Figure 4.2. In general, high NaOH concentration leads to high average compressive
strength at both 7 and 28 days. However, the influence of high NaOH concentration
became insignificant as the age increased. The range R reduced by 2.7 MPa as the age
increased from 7 to 28 days.
In terms of a 7 day compressive strength, the GPM is very weak when the
NaOH concentration is lower than 12 M. Improving NaOH concentration from 10 M
to 12 M is able to increase the compressive strength by 27.2%. Strength decreases
slightly after the concentration exceeds 14 M. 12 M concentration is the optimum level
for compressive strength at 7 days.

Chapter 4 Development of Optimised Mix Design for Geopolymer Concrete
YI-FANG CAO 65
Figure 4.2 Average effect of factors on the compressive strength of geopolymer
mortar.
The strength of GPM at 28 days developed with the increase of the NaOH
concentration. The average compressive strength of GPM at 28 days is 83.2 MPa when
the concentration is 14 M. The optimised level of NaOH concentration for 28 days
compressive strength is 14 M.
4.4.2.2 Effect of calcium aluminate cement replacement ratio
In general, the CAC replacement ratio is the most important factor for strength
development of geopolymer mortar. According to the k value, 5% and 20% are not
optimal CAC addition ratios. The optimal CAC addition for GPM is 10% for both 7
day and 28 day compressive strength.
In regards to a 7 day compressive strength, 5% and 20% CAC addition
contributed to 43.1 MPa and 52.4 MPa of GPM, respectively. However, the average
strength of 10% CAC addition geopolymer is 65.6 MPa.
30
40
50
60
70
80
90
100
110
120
10M 12M 14M 5% 10% 20% 35% 40% 45%
Ave
rage
com
pres
sive
str
engt
h (M
Pa)
NaOH concentration CAC replacement ratio A/B ratio
7 days 28 days

Chapter 4 Development of Optimised Mix Design for Geopolymer Concrete
YI-FANG CAO 66
On the 28th day, the level two has the highest compressive strength of 109.2
MPa, while level 1 and level 3 have a strength of 67 MPa and 62 MPa, respectively.
The optimised level is 10% CAC addition.
4.4.2.3 Effect of activator to binder ratio
Based on the R value, the influence of A/B ratio for 7 day compressive strength
of GPM is comparatively small. The optimum level is 45%, which has an averaged
result of 56.7 MPa.
The influence of A/B ratio on 28 day compressive strength is different to the
influence on 7 day compressive strength. The optimised averaged strength is 87.1
MPa, and its activator to binder ratio is 35%. When the A/B ratio increased to 40%
and 45%, the average strength decreased to 75.6 MPa and 75.5 MPa.
4.4.3 Optimised mixing design
Table 4.4 provides the factor order for workability, which is in sequence A/B
ratio, CAC replacement ratio and NaOH concentration. The optimum combination for
workability is A1B1C3.
Tables 4.5 - 4.7 contain the range analysis on compressive strength. The factor
order for early compressive strength is CAC replacement ratio, NaOH concentration
and A/B ratio. However, the factor order for a 28 day result is different, being CAC
replacement ratio, A/B ratio and NaOH concentration. The factor order for long term
compressive strength is also different. The sequence for 56 day compressive strength
is CAC replacement ratio, NaOH concentration and A/B ratio. The sequence for 150
day compressive strength is A/B ratio, CAC replacement ratio and NaOH

Chapter 4 Development of Optimised Mix Design for Geopolymer Concrete
YI-FANG CAO 67
concentration. The optimum combinations for 3, 7, 28, 56 and 150 day compressive
strengths are A2B3C1, A2B2C3, A3B2C1, A2B2C1 and A1B2C1, respectively.
The design based on workability is A1B1C3 i.e. alkali solution concentration =
10 M, CAC replacement ratio = 5% and activator to binder ratio = 45%. The GPC
mixed by this design should have the best workability.
The optimised design which has good workability and good mechanical
property is A3B2C1 (alkali solution = 14M, CAC replacement ratio = 10% and activator
to binder ratio = 35%) with extra water. Alkali solution concentration and CAC
replacement ratio are chosen based on compressive strength. The liquid phase of
concrete mixture was increased to improve workability, which decreases compressive
strength. Considering the cost of the alkaline solution, extra water was added into the
aggregate to improve workability.
The design to achieve high compressive strength is concentration of alkali
solution = 14M, CAC replacement ratio = 10% and activator to binder ratio = 35%
(A3B2C1). This concrete mixture will exhibit better compressive strength than others
on 28 days.
4.5 Summary
This chapter details the study of the influence of CAC on fly ash based geopolymers
cured at ambient temperature. Three factors were studied using the Taguchi method.
The results of the experiments are summarised below:
1. The presence of CAC is able to help the geopolymerisation reaction at ambient
temperature. The mechanical properties of the alkali-activated fly ash blended
with CAC are very good. By adding 10% of CAC in fly ash, it is reasonable to
Chapter 4 Development of Optimised Mix Design for Geopolymer Concrete
YI-FANG CAO 68
expect a compressive strength of 100 MPa for mortar after being cured for 28
days.
2. Optimisation of geopolymer mixture design can be conducted by the Taguchi
method. Alkali solution concentration plays a complex role. Increasing the
concentration will improve compressive strength while it will decrease the
workability. CAC replacement ratio is the most important factor for the
mechanical property. The mechanical property on 28 days is strengthened by
adding 10% CAC. Activator to binder ratio is crucial for workability. However,
too much activator will diminish the compressive strength. Considering both
compressive strength and flowability, the optimal design is 10M alkali solution
concentration, 10% CAC replacement and 45% activator to binder ratio.
The Taguchi method is a good tool for analysing the influence of different
parameters. In Chapter 5, the three optimal designs will be made to further study
the mechanical property of concrete.

Chapter 5 Behaviour of GPC at Ambient Temperature
YI-FANG CAO 69
Chapter 5 Behaviour of GPC at Ambient Temperature
5.1 Introduction
Using Taguchi method, three optimised geopolymer mix designs were
proposed in the preliminary study of Chapter 4. To fully understand the properties of
GPC, the performances of three proposed GPCs at ambient temperature are studied in
this chapter. Firstly, the workability of fresh GPC is reported, then the mechanical
properties such as density, Young’s modulus, compressive strength, splitting tensile
strength, and flexural strength are investigated. The experimental method of Chapter
3 is followed. Further, the material microstructure characterisations of three
geopolymer pastes were conducted to confirm GPC has no risk of conversion. Lastly,
the mechanical properties of GPC including Young’s modulus, splitting tensile
strength and flexural strength were compared with predictions from existing models
and a standard prediction equation.
5.2 Test results and discussion of GPC
The development of concrete mixtures using the Taguchi method resulted in
three mix designs, as shown in Table 5.1. GPC1 is the first optimised design which
results in the best workability performance. The alkali solution concentration used in
GPC1 is 10 M, and activator to binder ratio is 45% which provides more solution for
GPC. The CAC replacement ratio is 5% which decreases the strength of concrete made
by GPC1.
The parameters of the second optimised design (GPC2) are A1B2C3, which has
good workability and mechanical property. The alkali solution, CAC replacement ratio
and activator to binder ratio are 14 M, 10% and 35%, respectively. Considering the
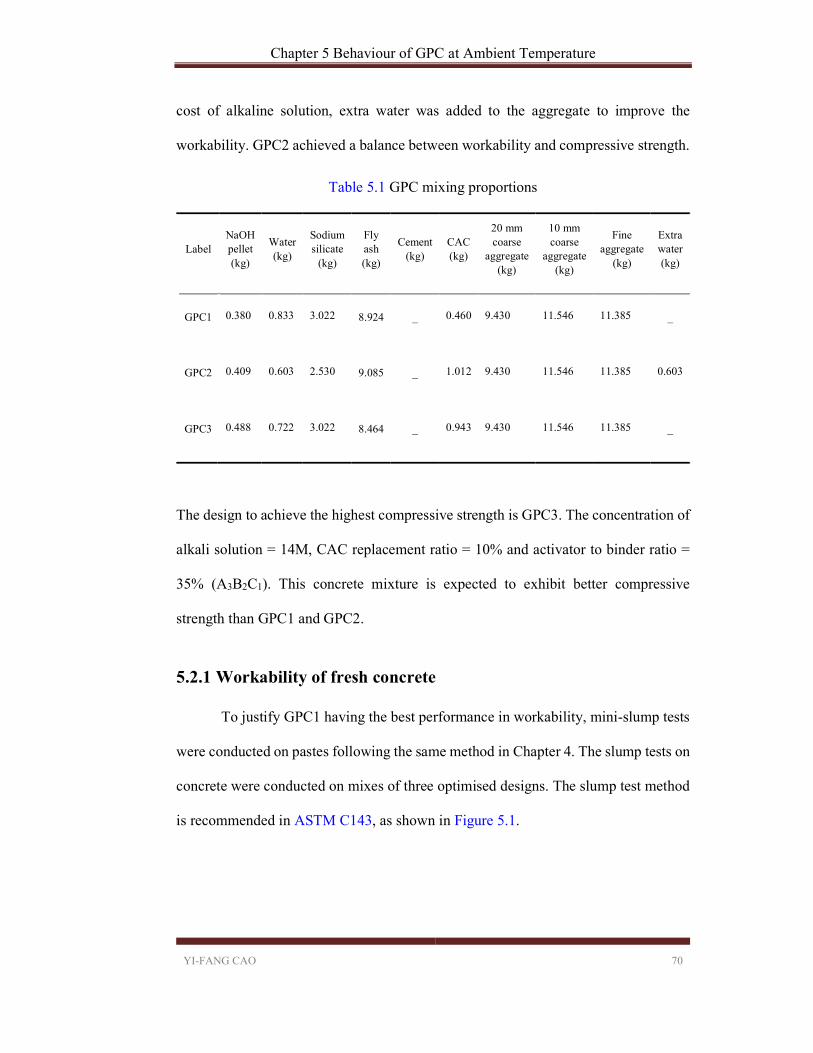
Chapter 5 Behaviour of GPC at Ambient Temperature
YI-FANG CAO 70
cost of alkaline solution, extra water was added to the aggregate to improve the
workability. GPC2 achieved a balance between workability and compressive strength.
Table 5.1 GPC mixing proportions
Label NaOH pellet (kg)
Water (kg)
Sodium silicate
(kg)
Fly ash (kg)
Cement (kg)
CAC (kg)
20 mm coarse
aggregate (kg)
10 mm coarse
aggregate (kg)
Fine aggregate
(kg)
Extra water (kg)
GPC1 0.380 0.833 3.022 8.924 _ 0.460 9.430 11.546 11.385 _
GPC2 0.409 0.603 2.530 9.085 _ 1.012 9.430 11.546 11.385 0.603
GPC3 0.488 0.722 3.022 8.464 _ 0.943 9.430 11.546 11.385 _
The design to achieve the highest compressive strength is GPC3. The concentration of
alkali solution = 14M, CAC replacement ratio = 10% and activator to binder ratio =
35% (A3B2C1). This concrete mixture is expected to exhibit better compressive
strength than GPC1 and GPC2.
5.2.1 Workability of fresh concrete
To justify GPC1 having the best performance in workability, mini-slump tests
were conducted on pastes following the same method in Chapter 4. The slump tests on
concrete were conducted on mixes of three optimised designs. The slump test method
is recommended in ASTM C143, as shown in Figure 5.1.

Chapter 5 Behaviour of GPC at Ambient Temperature
YI-FANG CAO 71
Figure 5.1 Slump test of fresh GPC
The test results are illustrated in Table 5.2. GPC1 has 210 mm slump test result which
is much better than GPC2 and GPC3 on workability. The activator to binder of GPC1
is 45%; by contrast, activator to binder ratio of GPC2 and GPC3 is 35%. However, the
slump test of GPC2 is 120 mm because it has extra water compared to GPC3. The test
results are compared to results reported by Hardjito and Rangan (2005), and their test
results agree well with the current test results.
Table 5.2 Workability test of fresh GPC
Label
Workability Test (mm) Hardjito and Rangan (2005)
Mini-slump test
for geopolymer
paste
Slump test for
fresh GPC Slump test results (mm)
GPC1 127.5 210 Maximum 215
GPC2 122.0 120 Average 135
GPC3 95.0 55 Minimum 39

Chapter 5 Behaviour of GPC at Ambient Temperature
YI-FANG CAO 72
5.2.2 Density of hardened concrete
The average density of GPC at 28 days is presented in Table 5.3. GPC3 exhibits
higher density than GPC1 and GPC2, as the mixture with higher liquid content loses
more moisture during the curing process. GPC3 has the highest density because it has
the least liquid content. Compared to the results reported by Olivia (2011), the average
density tested in this study is higher for 3.1%. The density of GPC is close to a density
of conventional concrete in practice, which ranges from 2200-2600 kg / m3.
Table 5.3 Density of hardened GPC
Label Density of GPC at 28 days (kg / m3) Density of GPC (kg / m3) (Olivia, 2011)
GPC1 2363.4 Maximum 2336.0
GPC2 2368.5 Average 2291.4
GPC3 2371.7 Minimum 2248.5
5.2.3 Young’s modulus
The measured static elastic modulus was calculated as the secant modulus
measured at a stress value corresponding to 40% of the average compressive strength
of concrete cylinder specimens. The test data is shown in Table 5.4. The Young’s
modulus increases as the age increases. GPC2 and GPC3 exhibit similar Young’s
modulus test results with 10% higher than GPC1. The results obtained are also higher
than the results reported by Hardjito and Rangan (2005).

Chapter 5 Behaviour of GPC at Ambient Temperature
YI-FANG CAO 73
Table 5.4 Young’s modulus test results
Label Young’s modulus (MPa) Hardjito and Rangan (2005)
Test at 7 days Test at 28 days Young modulus results (MPa)
GPC 1 23096 30271 Maximum 30800
GPC 2 20138 33015 Average 26800
GPC 3 22837 32820 Minimum 23000
5.2.4 Compressive strength
Compressive strength tests were conducted to justify that the GPC3 mixing
design has the best compressive strength. The compressive strengths of GPC are tested
after being cured for 7 and 28 days, as shown in Table 5.5. The strength tested at 7
days was around 30 MPa for all three mixtures. After being cured for 28 days, GPC3
reached 61.3 MPa, which is the highest among the three GPC mixtures. Compared
with the results tested by Olivia (2011), GPCs cured at elevated temperature in this
research are stronger at 28 days, while the early strengths are inferior.
Table 5.5 Compressive strength
Label Compressive strength (MPa) Olivia (2011) (MPa)
Test at 7 days Test at 28 days Test at 7 days Test at 28 days
GPC 1 27.4 42.4 Maximum 52.3 54.9
GPC 2 30.4 55.0 Average 38.4 39.6
GPC 3 30.5 61.3 Minimum 27.2 29.7
The mix design for geopolymer mortar Trial No. 8 had an activator to binder
ratio = 35%, concentration of alkali solution = 14 M and CAC replacement ratio =
10%. As can be seen, the mix design was the same as the mix design for GPC3 except
the addition of coarse aggregate in GPC3. The compressive strengths of geopolymer
mortar Trial No. 8 tested at 7 and 28 days were 73.4 and 118.9 MPa, respectively. In

Chapter 5 Behaviour of GPC at Ambient Temperature
YI-FANG CAO 74
contrast, the strengths of GPC3 tested at 7 and 28 days were 30.5 and 61.3 MPa. The
strength ratios of geopolymer concrete and geopolymer mortar were 41.6% and 51.6%
at 7 and 28 days, respectively.
5.2.5 Splitting tensile strength
To measure the splitting tensile strength, at least two specimens were tested for
each mix at each age, as shown in Table 5.6. GPC3 gained a significant splitting tensile
strength increase after being cured for 28 days. GPC1 and GPC2 have gradual
increases on the splitting tensile strength with age. Lee and Van Deventer (2004)
suggests that high splitting tensile strength is assumed from the improved bonding at
the interface of geopolymer paste and aggregate. Pacheco-Torgal et al. (2007)
explained that this phenomenon was caused by a chemical interaction between an
aggregate and alkaline solution.
Table 5.6 Splitting tensile strength
Label Splitting tensile strength (MPa)
Test at 7 days Test at 28 days
GPC 1 2.59 3.64
GPC 2 2.66 4.25
GPC 3 2.52 5.78
5.2.6 Flexural strength
The flexural strengths of GPC were measured using at least two moulded
flexural test beams for each mix design. Table 5.7 presents the averaged flexural
strengths of GPC compared with the previously considered research (Olivia, 2011).

Chapter 5 Behaviour of GPC at Ambient Temperature
YI-FANG CAO 75
Table 5.7 Flexural strength
Label Flexural Strength of GPC at 28 days (MPa) Flexural Strength Olivia (2011) (MPa)
GPC1 4.78 Maximum 9.91
GPC2 5.78 Average 8.47
GPC3 6.02 Minimum 7.02
Similar to splitting strength, GPC3 has a higher flexural strength than the other two
GPC mixtures. The flexural strength tested in this research is lower than the strength
reported by Olivia (2011). A trend similar to splitting tensile strength can be observed,
as high compressive strength leads to a high flexural strength. In contrast to OPC, Lee
and Van Deventer reported higher bonding at the interface of geopolymer paste and
aggregate, which contributes to the improvement of flexural strength (Lee and Van
Deventer, 2004).
5.3 Microstructure characterisation of geopolymer pastes
A microstructure study was conducted on geopolymer paste samples. As
mentioned in Chapter 3, SEM and TGA experiments were tested using the JEOL
6510LV and a Bruker Vertex 70 coupled with a Netzsch 449C Jupiter DSC-TGA
instrument. Three pastes were prepared using the geopolymer paste mixing
proportions presented in Table 5.8, which were the same as the three optimised GPC
proportions, except for the aggregates.
Table 5.8 Geopolymer paste mixing proportions
Label NaOH pellet
(kg) Water (kg)
Sodium silicate (kg)
Fly ash (kg)
CAC (kg)
Extra water (kg)

Chapter 5 Behaviour of GPC at Ambient Temperature
YI-FANG CAO 76
Firstly, the conversion phenomenon of a CAC structure was explained. A test
recommended by Jambunathan et al. (2013a) was conducted on a geopolymer
specimen to determine if there was any conversion affecting the compressive strength.
Secondly, TGA and differential scanning calorimeter (DSC) experiments were
conducted on three geopolymer pastes to further prove three optimised GPC has no
risk of conversion. Lastly, the SEM images of some freshly-fractured geopolymer
paste samples were examined at the ages of 3 days, 7 days and 28 days.
5.3.1 Conversion of CAC
5.3.1.1 Literature Review
Conversion is the reaction of unstable hexagonal calcium aluminate hydrates
(CAH10 or C2AH8 or C4AH13) converting into stable cubic hydrogarnet (C3AH6); this
reaction is mainly determined by a reaction to temperature. Conversion destructs the
material because of increasing porosity. Talabér (1993) concluded the transformation
accelerating factors are temperature, water content (high w/c ratio), CO2 content and
the presence of alkaline. Ding et al. (1996a) studied the reacting mechanism in a HAC-
Na2SiO3 system and found a small addition of Na2SiO3 is able to delay C3AH6
formation, but that inhibition is not able to prevent a conversion reaction.
GPP1 0.380 0.833 3.022 8.924 0.460 _
GPP2 0.409 0.603 2.530 9.085 1.012 0.603
GPP3 0.488 0.722 3.022 8.464 0.943 _

Chapter 5 Behaviour of GPC at Ambient Temperature
YI-FANG CAO 77
Puertas et al. (2000) revealed the products of carbonation in the form of CAC
is predominantly CaCO3, which leads to a reduction of porosity. Following this, the
hydration process of CAC is retarded (or even stopped) when specimens are
simultaneously subjected to an accelerated carbonation process. In a nutshell, alkali
accelerates carbonation and conversion but it retards hydration, therefore little material
is available for the conversion reaction. Ding et al. (1996b) found inorganic salt or
alkali is able to inhibit hydrogarnet (C3AH6): for example, sodium salts, sodium
nitrate, sodium chloride, sodium sulphate, and sodium metaphosphate. If conversion
happened in CAC concrete, inorganic salt or alkali can be added to restrain the
conversion reaction.
In this study, a small portion of CAC was added into GPC binder. Further
studies need to be undertaken to ascertain whether or not the conversion phenomenon
will occur, by microstructure characterisation.
5.3.1.2 Conversion Test
To study the influence of potential conversion of CAC to geopolymer, four
geopolymer mortar specimens were cast and two of them were cured at 50°C with 26%
humidity for 24 hours before the test, as shown in Figure 5.2. According to
Jambunathan et al. (2013a), after exposure to 50°C, some hydration products of alkali-
activated ground-granulated blast-furnace slag pastes convert to C3AH6, leading to a
rapid deterioration in the strength of the paste.

Chapter 5 Behaviour of GPC at Ambient Temperature
YI-FANG CAO 78
Figure 5.2 Conversion curing temperature and humidity
The compressive strength test results, before and after the conversion processing, are
presented in Table 5.9. The geopolymer specimens after conversion processing lose
0.9% of the original compressive strength, which illustrates that conversion, if any, is
insignificant for GPC.
Table 5.9 Conversion test
In conclusion, the material may not degrade, however, if it does, the impact can be
disregarded for the following reasons: the Na2SiO3 in reaction environment of CAC
will postpone the conversion reaction (Ding et al., 1996a), and from the GPC mixing
design recorded, CAC contributes small proportion to the GPC raw materials. The
GPC using CAC could act just like alloy, which displays only the best property of the
constituents.
Compressive strength(MPa) Degradation
percentage Control group
(56-day-curing)
Conversion test
(56-day-curing)
84.7 79.8 80.1 83.0 0.9%

Chapter 5 Behaviour of GPC at Ambient Temperature
YI-FANG CAO 79
5.3.2 Thermal gravimetric analysis (TGA)
After a conversion test, the result of TGA was reported. The samples were
heated to 800°C at the rate of 10 °C/min with ultra-high purity nitrogen (N2) as
protection gas. As mentioned, conversion is the reaction of unstable hexagonal calcium
aluminate hydrates (CAH10 or C2AH8 or C4AH13) converting into stable cubic
hydrogarnet (C3AH6).
Figure 5.3 TGA results of geopolymer pastes
According to the research conducted by Reig et al. (2016) and Pacewska et al. (2011),
the signal of C3AH6 cubic compounds will appear at around 340 °C. The test results
are shown in Figure 5.3. However, no signal appeared in all three of our test results
which indicates negligible or no C3AH6 was detected. Cubic katoite (C3AH6) is a
hexagonal hydrate and it contributes to the conversion of CAC material.
Geopolymer Paste 2
Geopolymer Paste 1
Geopolymer Paste 3
340 ℃
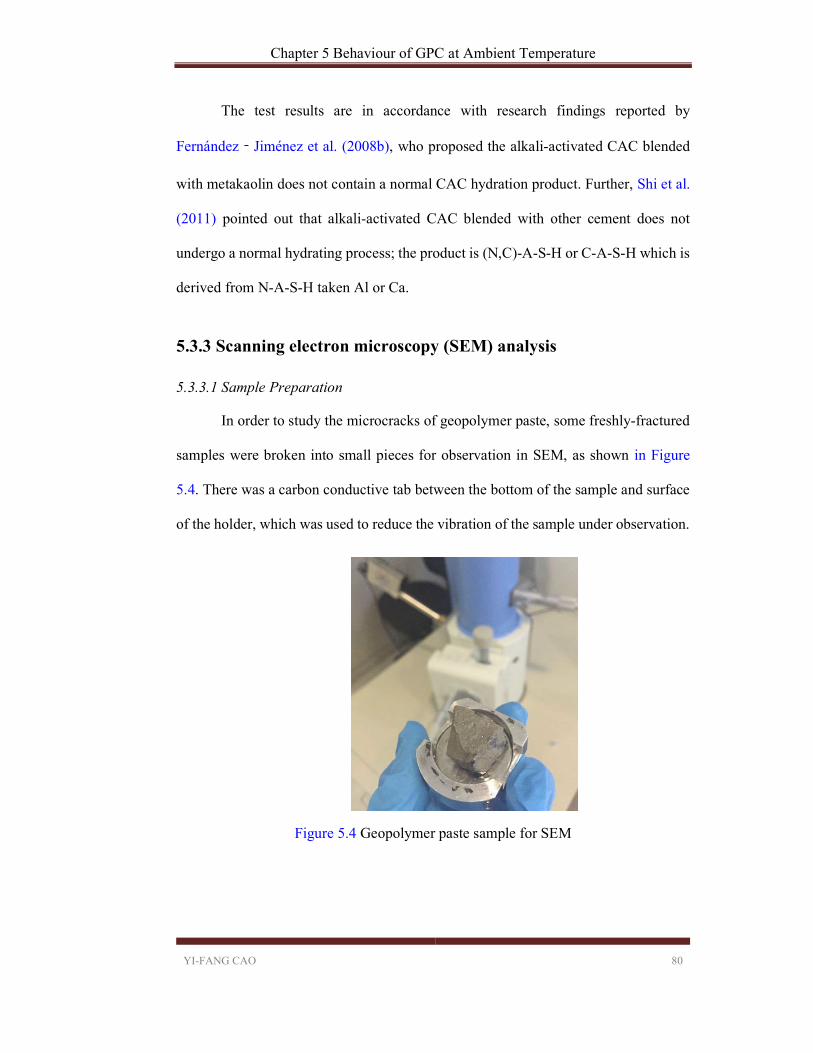
Chapter 5 Behaviour of GPC at Ambient Temperature
YI-FANG CAO 80
The test results are in accordance with research findings reported by
Fernández‐Jiménez et al. (2008b), who proposed the alkali-activated CAC blended
with metakaolin does not contain a normal CAC hydration product. Further, Shi et al.
(2011) pointed out that alkali-activated CAC blended with other cement does not
undergo a normal hydrating process; the product is (N,C)-A-S-H or C-A-S-H which is
derived from N-A-S-H taken Al or Ca.
5.3.3 Scanning electron microscopy (SEM) analysis
5.3.3.1 Sample Preparation
In order to study the microcracks of geopolymer paste, some freshly-fractured
samples were broken into small pieces for observation in SEM, as shown in Figure
5.4. There was a carbon conductive tab between the bottom of the sample and surface
of the holder, which was used to reduce the vibration of the sample under observation.
Figure 5.4 Geopolymer paste sample for SEM

Chapter 5 Behaviour of GPC at Ambient Temperature
YI-FANG CAO 81
5.3.3.2 Microstructure at Early Ages
Early age SEM results of paste at 3 days and 7 days are shown in Figure 5.5. GPP1
demonstrates that the section of geopolymer paste is very loose at 3 days, which could
be caused by the low NaOH concentration. After being cured for 7 days, the matrix
became solid, but it was still looser than GPP2 and GPP3. GPP2 and GPP3 are very
similar to each other; however, a sizeable amount of part-solved fly ash can be found
in GPP3 at 3 days. GPP2 is more solid than GPP3, and the 3-day compressive strength
of GPP2 could be stronger than GPP3. At the age of 7 days, fewer unsolved fly ash
can be found in the GPP2 and GPP3 matrix. However, minor cracks appeared on the
surface because the matrix used up the solution.
As previously discussed, GPP1 has more activator solution than GPP2 and
GPP3 after casting. No major crack was observed in GPP1 after 3 days. Minor cracks
were observed in GPP2 after 3 days. By comparison, several cracks—including a
major crack—was observed in GPP3 after 3 days. The SEM images illustrate the liquid
content of GPP1 was still more than GPP2 and GPP3 after being cured for 7 days. By
comparing GPP2 and GPP3, more unreacted fly ashes can be found in GPP2 which
means the matrix of GPP2 is weaker than GPP3. The mechanical properties of GPC
have proven the assumption.
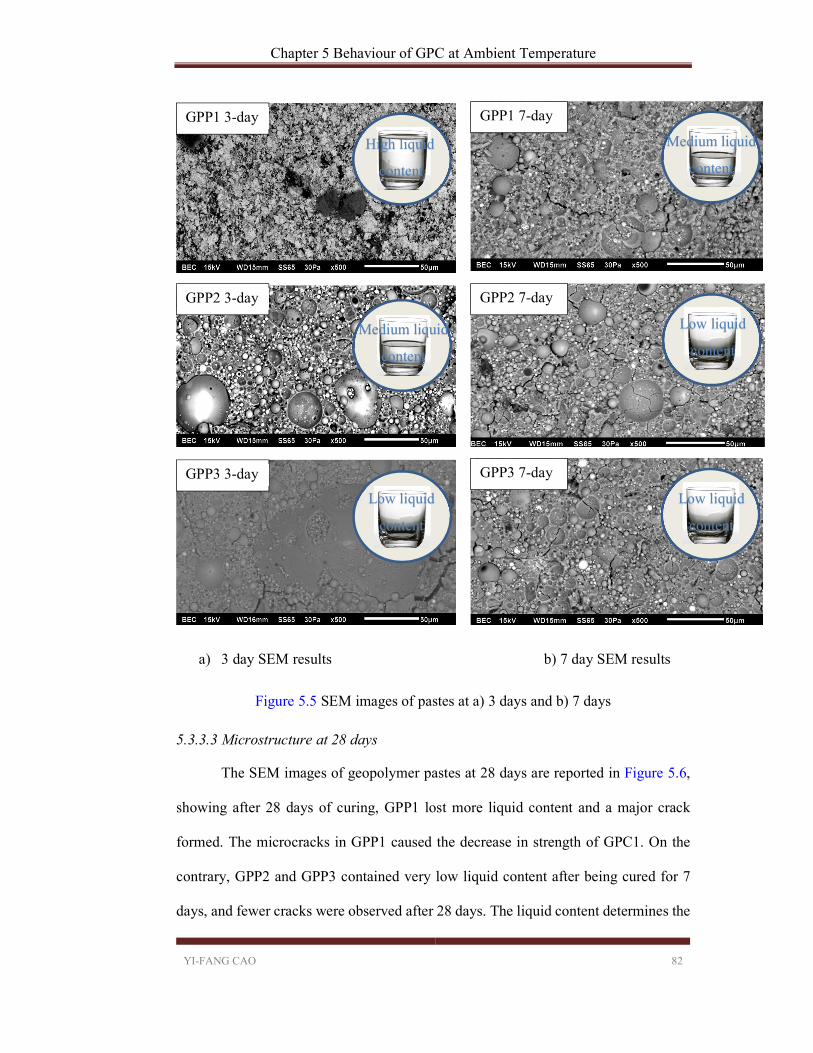
Chapter 5 Behaviour of GPC at Ambient Temperature
YI-FANG CAO 82
a) 3 day SEM results b) 7 day SEM results
Figure 5.5 SEM images of pastes at a) 3 days and b) 7 days
5.3.3.3 Microstructure at 28 days
The SEM images of geopolymer pastes at 28 days are reported in Figure 5.6,
showing after 28 days of curing, GPP1 lost more liquid content and a major crack
formed. The microcracks in GPP1 caused the decrease in strength of GPC1. On the
contrary, GPP2 and GPP3 contained very low liquid content after being cured for 7
days, and fewer cracks were observed after 28 days. The liquid content determines the
GPP1 3-day
GPP2 3-day
GPP3 3-day
GPP1 7-day
GPP2 7-day
GPP3 7-day
High liquid
content
Low liquid
content
Low liquid
content
Medium liquid
content
Medium liquid
content
Low liquid
content

Chapter 5 Behaviour of GPC at Ambient Temperature
YI-FANG CAO 83
strength development of GPC; this assumption is able to explain why GPC2 and GPC3
are stronger at 28 days, while GPC1 has the same strength at 7 days.
Figure 5.6 SEM images and EDS results of pastes at 28 days
The Energy-dispersive X-ray spectroscopy (EDS) result shows a similar composition
of the geopolymer pastes. However, a slight change in the composition can lead to
different mechanical properties of GPC. GPP3 has more Na, Si and Ca than GPP1 and
GPP2. The high content of Na is caused by the high concentration of alkaline solution.

Chapter 5 Behaviour of GPC at Ambient Temperature
YI-FANG CAO 84
GPP1 has smaller unreacted fly ash and major cracks. GPP2 and GPP3 have a denser
microstructure than GPP1 and less unreacted fly ash. A large amount of unreacted fly
ash is responsible for the inferior strength of GPC1.
5.4 Comparison of experimental results with existing models
5.4.1 Comparison of Young’s modulus
The elastic modulus is commonly expressed in terms of compressive strength
for OPC using empirical equations. The elastic modulus was compared with the
prediction of OPC concrete empirical equations provided by AS 3600-2009 (2009)
and ACI 318-14 (2015). The comparison between existing models and test data are
shown in Figure 5.7, where the data points are shown as solid triangles.
Figure 5.7 Relationship of modulus of elasticity with compressive strength
For concrete strength up to 65 MPa, the Australia standard 3600-2001 recommends:
𝐸 = 0.043 × 𝜌 . × 𝑓 ′ (MPa) (5.1)
10000
15000
20000
25000
30000
35000
40000
45000
5 5.5 6 6.5 7 7.5 8 8.5
Mod
ulus
of
elas
ticity
(M
Pa)
fc' 1/2 (MPa1/2)
AS 3600-2009ACI 318-14Hardjito and RanganLee and LeeNoushini et al.

Chapter 5 Behaviour of GPC at Ambient Temperature
YI-FANG CAO 85
to calculate the elasticity, where ρ is the density of concrete which is 2370 kg / m3 on
average for GPC. The 𝑓 ′ is the mean value of compressive strength. The predicted
result of 𝐸 has an error of plus or minus 20%. The prediction usually overestimates
the elastic modulus of concrete. AS 3600-2009 proposed another model for strength,
higher than 40 MPa, as shown in Eq. (5.2). In this research, Eq.(5.1) is used for 𝑓 ′ ≤
40 MPa, and Eq. (5.2) is used when 𝑓 ′ ≥ 40 MPa
𝐸 = 0.024 × 𝑓 ′ + 0.12 × 𝜌 . (MPa) (5.2)
According to the ACI 318-14 building code, the elastic modulus of concrete (normal
weight) stronger than 21 MPa at 28 days can be calculated from the following
expression:
𝐸 = 4700 × 𝑓 ′ (MPa) (5.3)
Hardjito and Rangan (2005) proposed the following equation to calculate the elastic
modulus for GPC:
𝐸 = 2707 × 𝑓 ′ + 5300 (MPa) (5.4)
Lee and Lee (2013) summarised the results of GPC from Sofi et al. (2007) and
Fernandez-Jimenez et al. (2006); the following prediction equation was proposed
based on these results:
𝐸 = 4700 × 𝑓 ′ (5.5)
Noushini et al. (2016) tested 195 GPC concrete cylinders and proposed an expression
to predict the elastic modulus of GPC.
𝐸 = 2707 × 𝑓 ′ − 11400 (MPa) (5.6)

Chapter 5 Behaviour of GPC at Ambient Temperature
YI-FANG CAO 86
The elastic modulus for geopolymer is commonly lower than its OPC counterpart
which has been reported in the studies (Pan et al., 2011). The prediction equation of
GPC on elastic modulus is also lower than code prediction; however, it cannot be
concluded that alkali activated fly ash reduced the strength, because the elastic
modulus of concrete is mainly affected by the amount and type of coarse aggregate
(Lee and Lee, 2013). According to the comparison of predictions from Eq. (5.1-5.6),
the prediction made by ACI 318-14 (2015) is more accurate for the current GPC
samples. The most accurate prediction among former research on the elastic modulus
was made by Hardjito and Rangan (2005), which is very close to the prediction in ACI
318-14 (2015).
5.4.2 Comparison of splitting tensile strength
Measured splitting tensile strengths were compared with the predictions of AS
3600-2009 (2009), ACI 318-14 (2015) and Eurocode 2 (2004). The comparison is
plotted in Figure 5.8.
Figure 5.8 Relationship of splitting tensile strength with compressive strength
0
2
4
6
8
10
20 30 40 50 60 70
Split
ting
tens
ile s
tren
gth
(MP
a)
fc' (MPa)
AS 3600-09ACI 318-14Hardjito and RanganLee and LeeShehab et al.Eurocode 2
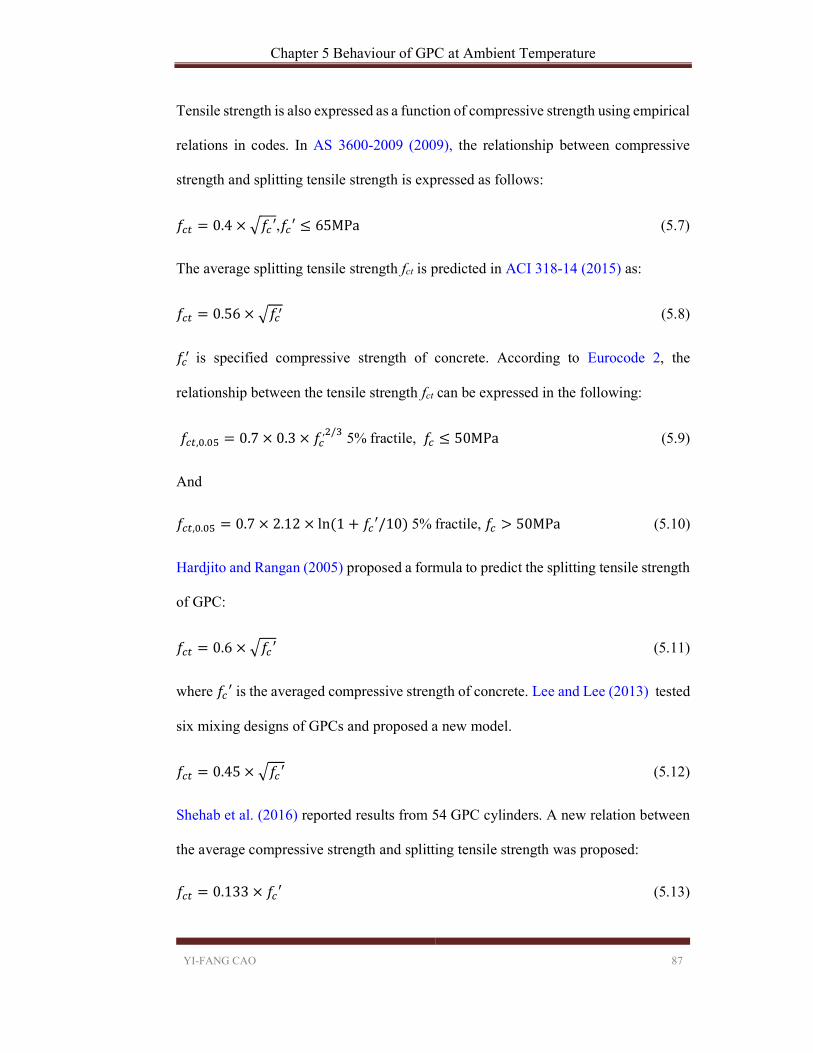
Chapter 5 Behaviour of GPC at Ambient Temperature
YI-FANG CAO 87
Tensile strength is also expressed as a function of compressive strength using empirical
relations in codes. In AS 3600-2009 (2009), the relationship between compressive
strength and splitting tensile strength is expressed as follows:
𝑓 = 0.4 × 𝑓 ′,𝑓 ′ ≤ 65MPa (5.7)
The average splitting tensile strength fct is predicted in ACI 318-14 (2015) as:
𝑓 = 0.56 × 𝑓 (5.8)
𝑓 is specified compressive strength of concrete. According to Eurocode 2, the
relationship between the tensile strength fct can be expressed in the following:
𝑓 , . = 0.7 × 0.3 × 𝑓, / 5% fractile, 𝑓 ≤ 50MPa (5.9)
And
𝑓 , . = 0.7 × 2.12 × ln(1 + 𝑓 ′/10) 5% fractile, 𝑓 > 50MPa (5.10)
Hardjito and Rangan (2005) proposed a formula to predict the splitting tensile strength
of GPC:
𝑓 = 0.6 × 𝑓 ′ (5.11)
where 𝑓 ′ is the averaged compressive strength of concrete. Lee and Lee (2013) tested
six mixing designs of GPCs and proposed a new model.
𝑓 = 0.45 × 𝑓 ′ (5.12)
Shehab et al. (2016) reported results from 54 GPC cylinders. A new relation between
the average compressive strength and splitting tensile strength was proposed:
𝑓 = 0.133 × 𝑓 ′ (5.13)

Chapter 5 Behaviour of GPC at Ambient Temperature
YI-FANG CAO 88
It is observed in Figure 5.7 that all the measured strengths are constantly higher than
the prediction by AS 3600-2009 (2009) and Eurocode 2 (2004), while ACI 318-14
(2015) demonstrated better accuracy than AS 3600-2009 (2009) and Eurocode 2
(2004). Hardjito and Rangan (2005) proposed an accurate expression to predict the
splitting tensile strength of GPC. The prediction made by Shehab et al. (2016) severely
overestimates the splitting tensile strength of GPC. Lee and Lee (2013) reported most
measured splitting tensile strengths are lower than the predictions by the codes, while
the predictions made by Lee and Lee (2013) underestimates splitting tensile strength.
The higher tensile strength can be explained due to the stronger connection between
aggregate and geopolymer binder Nguyen et al. (2016).
5.4.3 Comparison of flexural strength
The average flexural strengths were reported in Figure 5.9 with respect to the
square roots of their compressive strengths.
Figure 5.9 Relationship of flexural strength with compressive strength
The Australia standard AS 3600-2009 (2009) provides the estimation of the flexural
strength of OPC concrete using the following equation:
2
3
4
5
6
7
8
5 5.5 6 6.5 7 7.5 8 8.5
Flex
ural
str
engt
h (M
Pa)
fc' 1/2 (MPa1/2)
AS 3600-2009Shehab et al.Sofi et al.

Chapter 5 Behaviour of GPC at Ambient Temperature
YI-FANG CAO 89
𝑓 = 0.6 × 𝑓 (5.14)
Shehab et al. (2016) reported a new relation between average compressive strength
and flexural strength for GPC concrete, which is proposed as the following:
𝑓 = 0.1098 × 𝑓 ′ (5.15)
The measured flexural—along with the previous study on flexural strength of
inorganic polymer concrete conducted by Sofi et al. (2007)—are compared to AS
3600-2009 (2009) and the expression provided by Shehab et al. (2016). Similarity can
be found between splitting tensile strength and flexural strength. As the flexural
strength results show in Figure 5.9, GPC exhibits considerably better performance than
OPC, which is attributed to the supreme structural strength of geopolymer matrix (Sofi
et al., 2007). On average the flexural strengths of GPC are 1MPa higher than the
standard model line for OPC. The predicting expression proposed by Shehab et al.
(2016) exhibits good accuracy compared to the test results.
5.5 Summary
This chapter details the studies of the mechanical properties of three proposed
GPCs at ambient temperature. These properties include density, Young’s modulus,
compressive strength, splitting tensile strength, and flexural strength. To justify that
GPC has no risk of conversion, the material microstructure characterisations and
compressive strength test of three geopolymer pastes were conducted. Lastly, the
mechanical properties of GPC, including Young’s modulus, splitting tensile strength
and flexural strength, were compared with existing models and standard prediction
equations. A good agreement was found between the test results and ACI 318-14 (2015)
Chapter 5 Behaviour of GPC at Ambient Temperature
YI-FANG CAO 90
prediction expressions for Young’s modulus and splitting tensile strength, while
Shehab et al. (2016) reported an accurate expression to calculate flexural strength.
Chapter 6 Performance of GPC at elevated temperatures
YI-FANG CAO 91
Chapter 6 Performance of GPC at elevated temperatures
6.1 Introduction
Concrete is known to be a fire-resistant material; however, while conventional
concrete uses OPC as a binding material, the binder suffers severe damage under fire
conditions. Due to increasing populations, high rise buildings have become prevalent
in megacities. Extremely high residential density has increased the probability of fire
outbreaks, as well as the severity of the aftermath. The threat of fire has raised
researchers’ interest in studying fire-resistant binders, as such geopolymer has been
considered as a promising alternative to OPC in construction applications.
GPC has better fire performance than OPC because of the ceramic-like
properties of alkali aluminosilicate binding materials. The properties of geopolymers
are dependent on compositions of raw material. Regarding compositions, Al2O3, SiO2,
and the calcium content have an important role in determining the mechanical
properties and fire performance. Some researchers have found the addition of CAC
(Cao et al., 2016b), OPC (Nath and Sarker, 2015) or GGBFS (Khan et al., 2016b) is
able to improve the mechanical properties at an ambient temperature. These three
additions are considered as a solution for curing geopolymers at an ambient
temperature. However, the addition of OPC introduces the hazard of spalling into
geopolymer under high temperatures, while the GGBFS blended geopolymer was
reported to have a strength decrease when exposed to temperatures of 50 °C and above
(Jambunathan et al., 2013b). In contrast, CAC is known for its high early strength and
fire performance. While the mechanical properties of geopolymer blended with CAC
Chapter 6 Performance of GPC at elevated temperatures
YI-FANG CAO 92
at an ambient temperature were studied in Chapter 5, this chapter will focus on the
study of elevated temperature performance of GPC.
Hot strengths of nine geopolymer mortars (GPM) tested at 600 and 800 °C are
reported and analysed firstly. The crack patterns of GPMs under fire are compared to
typical failure patterns proposed by ASTM C39 (ASTM, 1996). Analysis is undertaken
of the influence of three different factors, including activator concentration, CAC
replacement ratio, and activator to binder ratio, on the hot strength of GPM.
In order to investigate the fire performance of GPC, the hot strength of GPC
under high temperatures is reported, using the slow heating rate. The hot strengths of
GPC after exposed to different high temperatures are compared with those of OPC,
including 23, 200, 400, 600 and 800 °C. The deformation of GPC under combined
loading and a high temperature is studied, while the rapid heating rate has been
implemented. Lastly, the residual properties of GPC—such as residual density and
stress-strain relationship after exposed to 800 °C—are reported and compared with
those of OPC concrete.
6.2 Performance of geopolymer mortar at elevated temperatures
6.2.1 Specimen preparation
Raw materials (fly ash and CAC) and sand were dry-mixed in a mixer for 3
minutes before the alkali activator was added. The mixing proceeded for 4-6 minutes
until the mixture formed a homogenous slurry. The fresh mortar was cast into 60 ×
180 mm cylinder moulds in three layers. A vibrating table was working all the process
of casting fresh mortar into moulds. Each layer was kept vibrating for 15 to 30 seconds
to chase the bubbles out. The specimens were demoulded after one day and cured at a

Chapter 6 Performance of GPC at elevated temperatures
YI-FANG CAO 93
constant room temperature with vacuum bags. A CIVILAB core facing grinder was
employed to grind both ends of each cylinder to achieve smooth and flat surfaces.
Three factors (activator concentration, CAC replacement ratio, activator to
binder ratio) at three levels were investigated with nine mixture designs. These three
factors were designed from the knowledge of preliminary experiments. The sodium
silicate to sodium hydroxide ratio was kept constantly at 2.5, similarly to the activator
discussed in Chapter 4. The key factors of the nine mixture designs are shown in Table
6.1.
Table 6.1 Orthogonal experimental factors
Level
Experimental factor
A B C
Alkaline solution
concentration
CAC replacement
ratio A/B ratio
1 10 M 5% 35%
2 12 M 10% 40%
3 14 M 20% 45%
6.2.2 Test method
After 28 days of curing, compression and fire performance tests were
conducted. The mortar cylinders (GPM) were tested by an hydraulic loading jack with
a vertical tube furnace testing machine, in accordance with the requirement in ASTM
C39 (ASTM, 1996). The loading rate was 0.25 ± 0.05 MPa/s. The testing was
conducted in the Structural Research and Testing Laboratory at Western Sydney
University. The cross-sectional area of each cylinder was measured to calculate the
stress before the test.

Chapter 6 Performance of GPC at elevated temperatures
YI-FANG CAO 94
Figure 6.1 Setup of GPM fire test
As shown in Figure 6.1, a hydraulic loading jack, which had 1000 kN capacity, was
located at the top of the vertical tube furnace. The steel casing was installed after the
cylinder sample was steadily put on the lower holder. Following this, the furnace
temperature was increased to the target temperature of 600 or 800 °C with a heating
rate of 5 °C/min. To investigate the ultimate strength of GPMs in a hot state, the
hydraulic jack started loading when the furnace had held the target temperature for 2
hours. Two specimens were conducted in the same condition to get an average
compressive strength. The furnace was cooled naturally to an ambient temperature to
avoid thermal shock.
Test specimen
Furnace
Exhaust
Lower support Heating elements
Type S Thermocouples
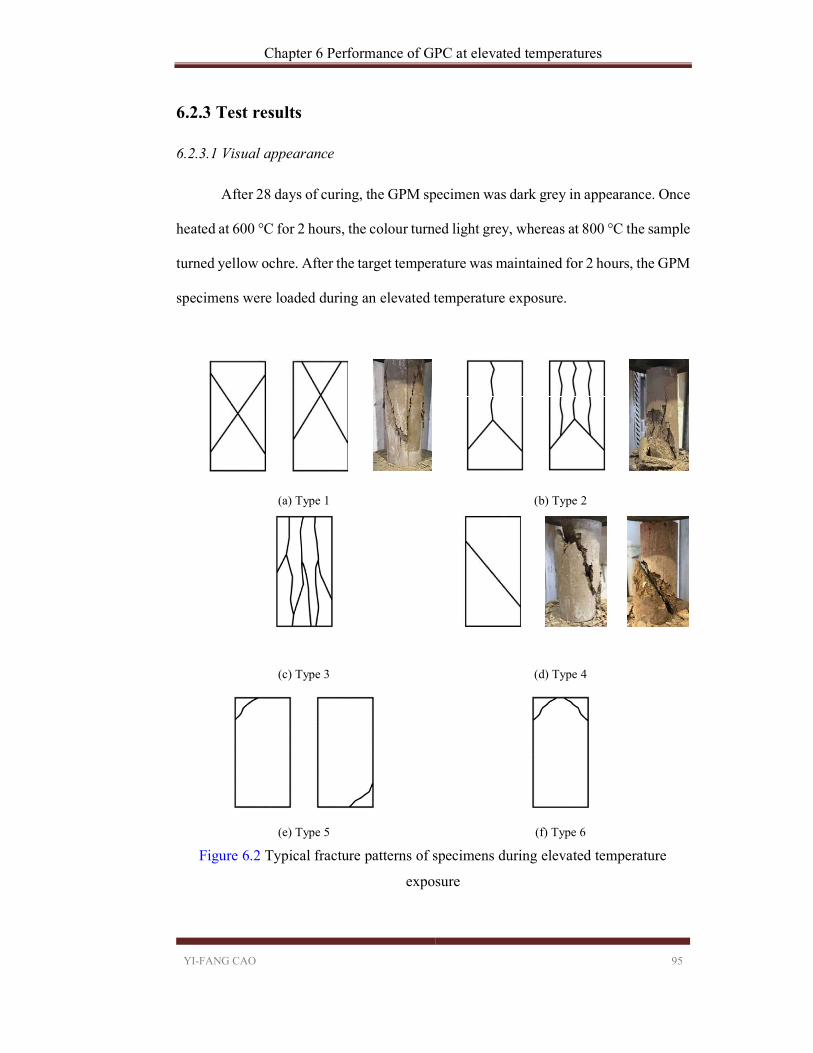
Chapter 6 Performance of GPC at elevated temperatures
YI-FANG CAO 95
6.2.3 Test results
6.2.3.1 Visual appearance
After 28 days of curing, the GPM specimen was dark grey in appearance. Once
heated at 600 °C for 2 hours, the colour turned light grey, whereas at 800 °C the sample
turned yellow ochre. After the target temperature was maintained for 2 hours, the GPM
specimens were loaded during an elevated temperature exposure.
(a) Type 1 (b) Type 2
(c) Type 3 (d) Type 4
(e) Type 5 (f) Type 6
Figure 6.2 Typical fracture patterns of specimens during elevated temperature
exposure

Chapter 6 Performance of GPC at elevated temperatures
YI-FANG CAO 96
Figure 6.2 presents the crack patterns of the specimens after compressive strength
testing for high temperature exposure. The crack patterns are compared with typical
fracture patterns defined in ASTM C39 (ASTM, 1996). Type 1 was discovered to be
very common in GPMs: reasonably well-formed cones on both ends, less than 25 mm
cracking through caps. Type 2 was least common among the three fracture patterns
that appeared: well-formed cone on one end, no well-defined cone on the other end,
vertical cracks running through caps. Type 4 was the most common fracture pattern in
GPM specimens exposed to high temperature: diagonal fracture with no cracking
through ends (tap with a hammer to distinguish from Type 1). No Type 3 fracture
pattern was observed among all the specimens recorded: columnar vertical cracking
through both ends, no well-formed cones. Neither Type 5 or Type 6 fracture patterns
were observed in GPM samples. In conclusion, GPM was easier to form cones or
diagonal fracture. Vertical cracks were observed less than shear failure cracks.
6.2.3.2 Hot strength
The results were calculated based on at least two samples after being cured for
28 days. A third specimen was tested if the deviation exceeded 5%, which was a rare
condition. Table 6.2 shows the compression testing results of different GPM mixes at
23, 600 and 800 °C. The average strength at ambient temperature was 79.4 MPa, while
the strength tested at 600 and 800 °C were 33.0 MPa and 48.1 MPa, respectively. The
compressive strength of geopolymer blended with CAC tested at a high temperature
was lower than its ambient temperature strength.
In general, GPM exhibited ideal mechanical properties and fire resistance.
After being exposed to 600 °C for two hours, the strength of OPC mortar specimens
decreased by 58.4% on average, while geopolymer subjected to 800 °C decreased only
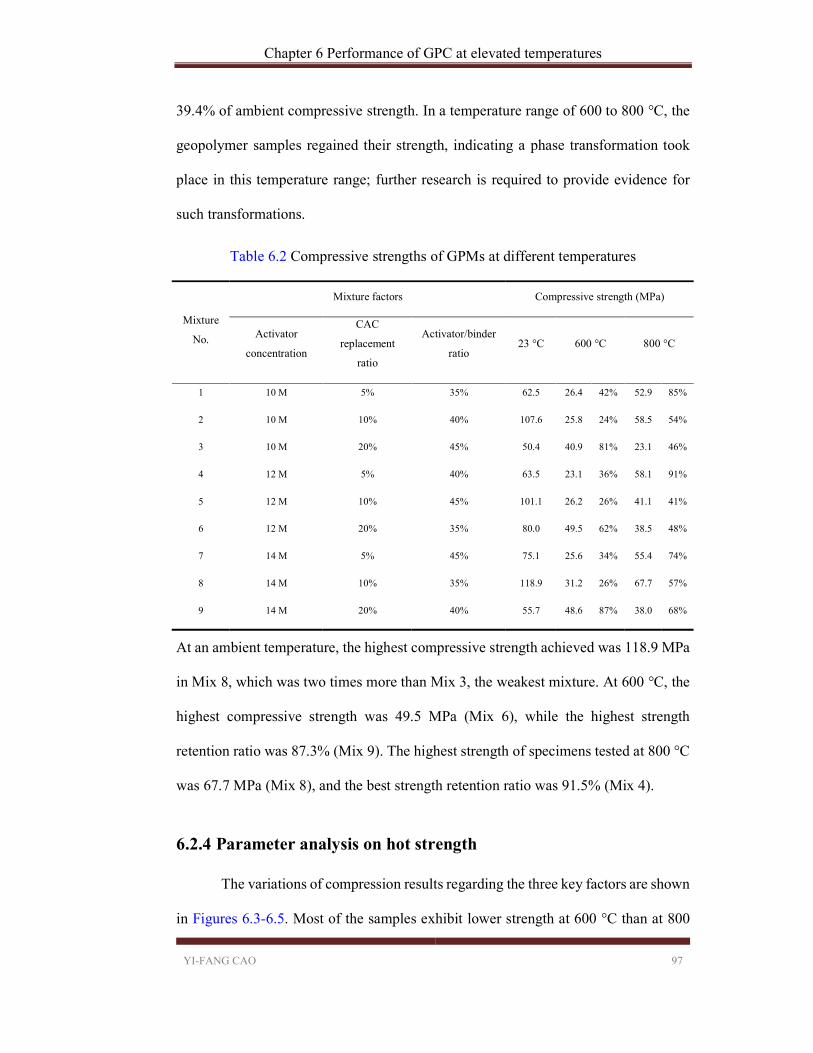
Chapter 6 Performance of GPC at elevated temperatures
YI-FANG CAO 97
39.4% of ambient compressive strength. In a temperature range of 600 to 800 °C, the
geopolymer samples regained their strength, indicating a phase transformation took
place in this temperature range; further research is required to provide evidence for
such transformations.
Table 6.2 Compressive strengths of GPMs at different temperatures
At an ambient temperature, the highest compressive strength achieved was 118.9 MPa
in Mix 8, which was two times more than Mix 3, the weakest mixture. At 600 °C, the
highest compressive strength was 49.5 MPa (Mix 6), while the highest strength
retention ratio was 87.3% (Mix 9). The highest strength of specimens tested at 800 °C
was 67.7 MPa (Mix 8), and the best strength retention ratio was 91.5% (Mix 4).
6.2.4 Parameter analysis on hot strength
The variations of compression results regarding the three key factors are shown
in Figures 6.3-6.5. Most of the samples exhibit lower strength at 600 °C than at 800
Mixture
No.
Mixture factors Compressive strength (MPa)
Activator
concentration
CAC
replacement
ratio
Activator/binder
ratio 23 °C 600 °C 800 °C
1 10 M 5% 35% 62.5 26.4 42% 52.9 85%
2 10 M 10% 40% 107.6 25.8 24% 58.5 54%
3 10 M 20% 45% 50.4 40.9 81% 23.1 46%
4 12 M 5% 40% 63.5 23.1 36% 58.1 91%
5 12 M 10% 45% 101.1 26.2 26% 41.1 41%
6 12 M 20% 35% 80.0 49.5 62% 38.5 48%
7 14 M 5% 45% 75.1 25.6 34% 55.4 74%
8 14 M 10% 35% 118.9 31.2 26% 67.7 57%
9 14 M 20% 40% 55.7 48.6 87% 38.0 68%
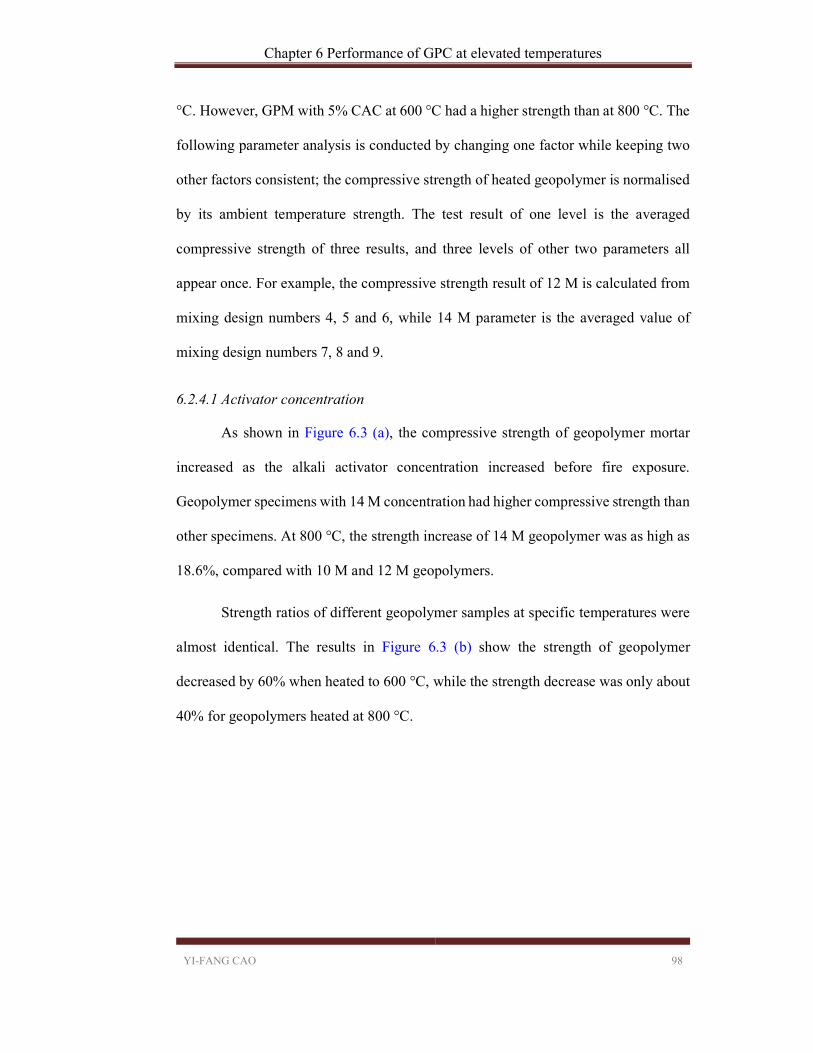
Chapter 6 Performance of GPC at elevated temperatures
YI-FANG CAO 98
°C. However, GPM with 5% CAC at 600 °C had a higher strength than at 800 °C. The
following parameter analysis is conducted by changing one factor while keeping two
other factors consistent; the compressive strength of heated geopolymer is normalised
by its ambient temperature strength. The test result of one level is the averaged
compressive strength of three results, and three levels of other two parameters all
appear once. For example, the compressive strength result of 12 M is calculated from
mixing design numbers 4, 5 and 6, while 14 M parameter is the averaged value of
mixing design numbers 7, 8 and 9.
6.2.4.1 Activator concentration
As shown in Figure 6.3 (a), the compressive strength of geopolymer mortar
increased as the alkali activator concentration increased before fire exposure.
Geopolymer specimens with 14 M concentration had higher compressive strength than
other specimens. At 800 °C, the strength increase of 14 M geopolymer was as high as
18.6%, compared with 10 M and 12 M geopolymers.
Strength ratios of different geopolymer samples at specific temperatures were
almost identical. The results in Figure 6.3 (b) show the strength of geopolymer
decreased by 60% when heated to 600 °C, while the strength decrease was only about
40% for geopolymers heated at 800 °C.

Chapter 6 Performance of GPC at elevated temperatures
YI-FANG CAO 99
(a) Compressive strength vs. activator concentration
(b) Strength ratio vs. activator concentration
Figure 6.3 Influence of activator concentration
6.2.4.2 CAC replacement ratio
CAC replacement ratio is the most important parameter on the fire performance
of geopolymer mortar, as shown in Figure 6.4 (a). The geopolymer mortar with 10%
CAC exhibited the highest compressive strength at an ambient temperature.
Geopolymer with 5% CAC had the lowest compressive strength of 25 MPa when
under fire conditions. The compressive strength of geopolymer at 800 °C was higher
than the strength at 600 °C when the CAC addition was 5%.
(a) Compressive strength vs. CAC replacement ratio
(b) Strength ratio vs. CAC replacement ratio
Figure 6.4 Influence of CAC replacement ratio
As can be seen from the results in Figure 6.4 (b), geopolymer with 20% CAC only
decreased 15.3% in compressive strength at 600 °C, while 46.5% of strength was lost
0.0
20.0
40.0
60.0
80.0
100.0
23°C 600°C 800°C
Hot
str
engt
h (M
Pa)
Test temperature
10M
12M
14M
0%
20%
40%
60%
80%
100%
120%
10M 12M 14M
Stre
ngth
rat
io
Activator concentration
23°C
600°C
800°C
0.0
20.0
40.0
60.0
80.0
100.0
23°C 600°C 800°C
Hot
str
engt
h (M
Pa)
Test temperature
5%
10%
20%
0%
20%
40%
60%
80%
100%
120%
5% 10% 20%
Stre
ngth
rat
io
CAC replacement ratio
23°C
600°C
800°C

Chapter 6 Performance of GPC at elevated temperatures
YI-FANG CAO 100
at 800 °C. The addition of 5% CAC improved the fire performance of geopolymer at
800 °C, as it maintained an 82.7% compressive strength in contrast to the strength
results tested at room temperature.
6.2.4.3 Activator to binder ratio
Increasing liquid content in geopolymer mortar caused the decrease of strength
at all temperatures. For specimens tested at 23 and 600 °C, the average strengths
dropped 15.4% and 15.5%, respectively, when the activator content was increased
from 35% to 45%. Meanwhile, the strength loss increased 33.0% for geopolymer
exposed to 800 °C, as shown in Figure 6.5 (a).
(a) Compressive strength vs. activator to binder ratio
(b) Strength ratio vs. activator to binder ratio
Figure 6.5 Influence of activator to binder ratio
Changing the activator to binder ratio had a negligible influence on the strength ratio
of geopolymers at 600 °C, which was around 41% of that at ambient temperature, see
Figure 6.5 (b). At 800 °C, the relative changes of strength—for geopolymers with
activator contents ranging from 35% to 45%, were 60.7%, 68.2% and 52.8%,
respectively.
0.0
20.0
40.0
60.0
80.0
100.0
23°C 600°C 800°C
Hot
str
engt
h (M
Pa)
Test temperatures
35%
40%
45%
0%
20%
40%
60%
80%
100%
120%
35% 40% 45%
Stre
ngth
rat
io
Activator to binder ratio
23°C
600°C
800°C

Chapter 6 Performance of GPC at elevated temperatures
YI-FANG CAO 101
6.3 Performance of GPC at elevated temperatures
6.3.1 Hot strength
In this section investigations are conducted on the hot strength of GPC at
temperatures ranging from 23 to 800 °C. Furthermore, reference OPC samples with
similar strength are tested under the same conditions. The GPC and OPC mixing
designs are shown in Table 6.3. Extra water was added into the GPC mixture to
improve workability.
Table 6.3 Concrete mixing proportions (kg/m3)
Label NaOH pellet
Water Sodium silicate
Fly ash
Cement CAC 20 mm coarse
aggregate
10 mm coarse
aggregate
Fine aggregate
Extra water
GPC 19.6 29.0 121.6 437.8 _ 48.6 501.4 612.8 600.0 29.0
OPC _ 220.0 _ _ 400.0 _ 459.0 561.0 680.0 _
As shown in Figure 6.6, CAC geopolymer concrete exhibited a better fire performance
than the OPC at all temperatures. The strength reduction of concrete was calculated by
dividing the strength at the elevated temperature to the initial strength (at ambient
temperature).
By comparing the relative changes in strength, it was found that geopolymer
had much higher strength than OPC at 200 and 800 °C. The strength decrease at 200
°C was accounted for an increase in porosity caused by water evaporation. The
geopolymer also had a mild drop of strength at 400 °C which was possibly caused by
the evaporation. At the temperature of 800 °C, the strength of geopolymer dropped

Chapter 6 Performance of GPC at elevated temperatures
YI-FANG CAO 102
slowly because of the ceramic-like property of matrix. Some researchers even reported
strength gain of geopolymers at high temperatures (Pan et al., 2009). However, OPC
exposed to 800 °C suffered a severe decrease in the mechanical properties which was
likely due to the chemical decomposition of its matrix. OPC and GPC have similar
performance at 400 °C. The hot strength of GPC increased slight after 400°C. By
comparison, the hot strength of OPC decreased severely at 600 and 800 °C.
Figure 6.6 Hot strength of concrete
In general, GPC exhibited better fire performance than OPC among the whole range
of temperatures, owing to the matrix of geopolymer which was much more stable and
durable than OPC.
6.3.2 Deformation of GPC at high temperature under constant load
6.3.2.1 Test result
A rapid heating regime was implemented to study the deformation of GPC
under combined loading and high temperature. A constant axial load was applied (40%
of ultimate strength) on the cylinder for the first stage. In the second stage, the
0 200 400 600 8000.2
0.4
0.6
0.8
1.0
1.2
Initial strength 57.7MPa
Nor
mal
ised
Com
pres
sive
Str
engt
h
Temperature (oC)
GPC OPC
Initial strength 55.8MPa
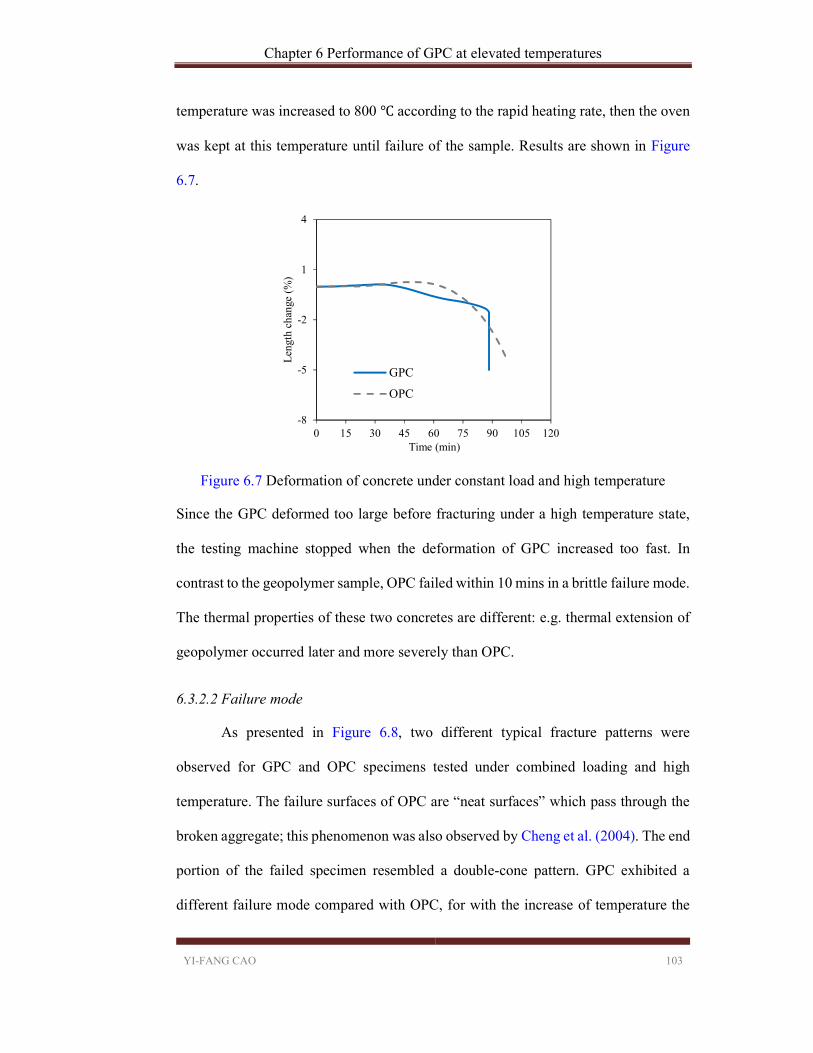
Chapter 6 Performance of GPC at elevated temperatures
YI-FANG CAO 103
temperature was increased to 800 ℃ according to the rapid heating rate, then the oven
was kept at this temperature until failure of the sample. Results are shown in Figure
6.7.
Figure 6.7 Deformation of concrete under constant load and high temperature
Since the GPC deformed too large before fracturing under a high temperature state,
the testing machine stopped when the deformation of GPC increased too fast. In
contrast to the geopolymer sample, OPC failed within 10 mins in a brittle failure mode.
The thermal properties of these two concretes are different: e.g. thermal extension of
geopolymer occurred later and more severely than OPC.
6.3.2.2 Failure mode
As presented in Figure 6.8, two different typical fracture patterns were
observed for GPC and OPC specimens tested under combined loading and high
temperature. The failure surfaces of OPC are “neat surfaces” which pass through the
broken aggregate; this phenomenon was also observed by Cheng et al. (2004). The end
portion of the failed specimen resembled a double-cone pattern. GPC exhibited a
different failure mode compared with OPC, for with the increase of temperature the
-8
-5
-2
1
4
0 15 30 45 60 75 90 105 120
Len
gth
chan
ge (
%)
Time (min)
GPC
OPC

Chapter 6 Performance of GPC at elevated temperatures
YI-FANG CAO 104
specimen deformed gradually. Several vertical cracks developed at the mid-height of
the specimen where large expansion happened. The deformation rate accelerated after
100 mins due to the propagation of vertical cracks in the GPC.
Figure 6.8 Deformation of concrete under constant load and high temperature
The brittle failure mode was observed in OPC specimens; in contrast, ductile failure
mode occurred in GPC specimens. Large deformation in both lateral and longitudinal
directions was observed on GPC specimen before it lost load carrying capacity. During
elevated temperature exposure, the GPC structure had more obvious signs of failure,
which is a critical consideration in structural design when attempting to target the
collapse of buildings.
The performance of GPC is also better than OPC under a rapid heating rate and
loading. As studied in Figure 6.6, by replacing OPC with GPC in a structure, a 40-50%
improvement was expected on the hot strength at 800 °C. During the test at elevated
temperatures and constant loading, GPC lasted for 98 mins, which is 11.4% better than
OPC which only maintained its integrity for 88 mins. However, the failure mode of
GPC is much more ductile than OPC. The improved ductility makes the GPC safer
than OPC to be used in the building with fire hazards.
OPC GPC
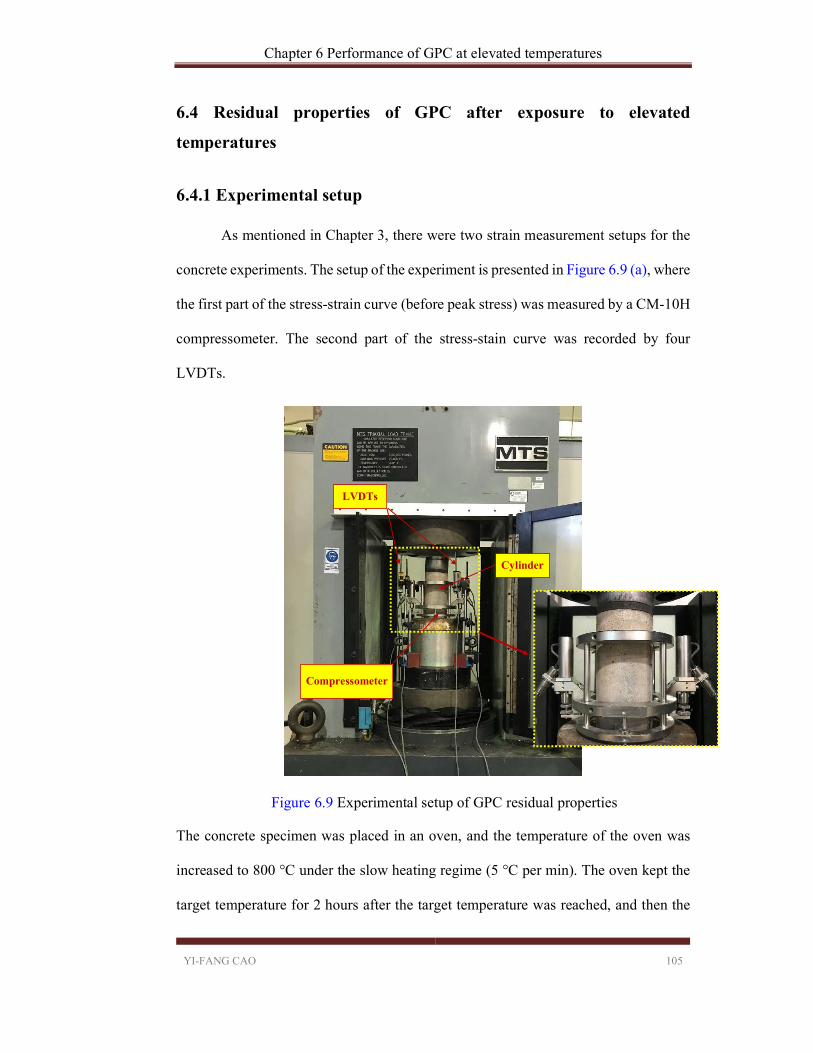
Chapter 6 Performance of GPC at elevated temperatures
YI-FANG CAO 105
6.4 Residual properties of GPC after exposure to elevated
temperatures
6.4.1 Experimental setup
As mentioned in Chapter 3, there were two strain measurement setups for the
concrete experiments. The setup of the experiment is presented in Figure 6.9 (a), where
the first part of the stress-strain curve (before peak stress) was measured by a CM-10H
compressometer. The second part of the stress-stain curve was recorded by four
LVDTs.
Figure 6.9 Experimental setup of GPC residual properties
The concrete specimen was placed in an oven, and the temperature of the oven was
increased to 800 °C under the slow heating regime (5 °C per min). The oven kept the
target temperature for 2 hours after the target temperature was reached, and then the
Cylinder
LVDTs
Compressometer
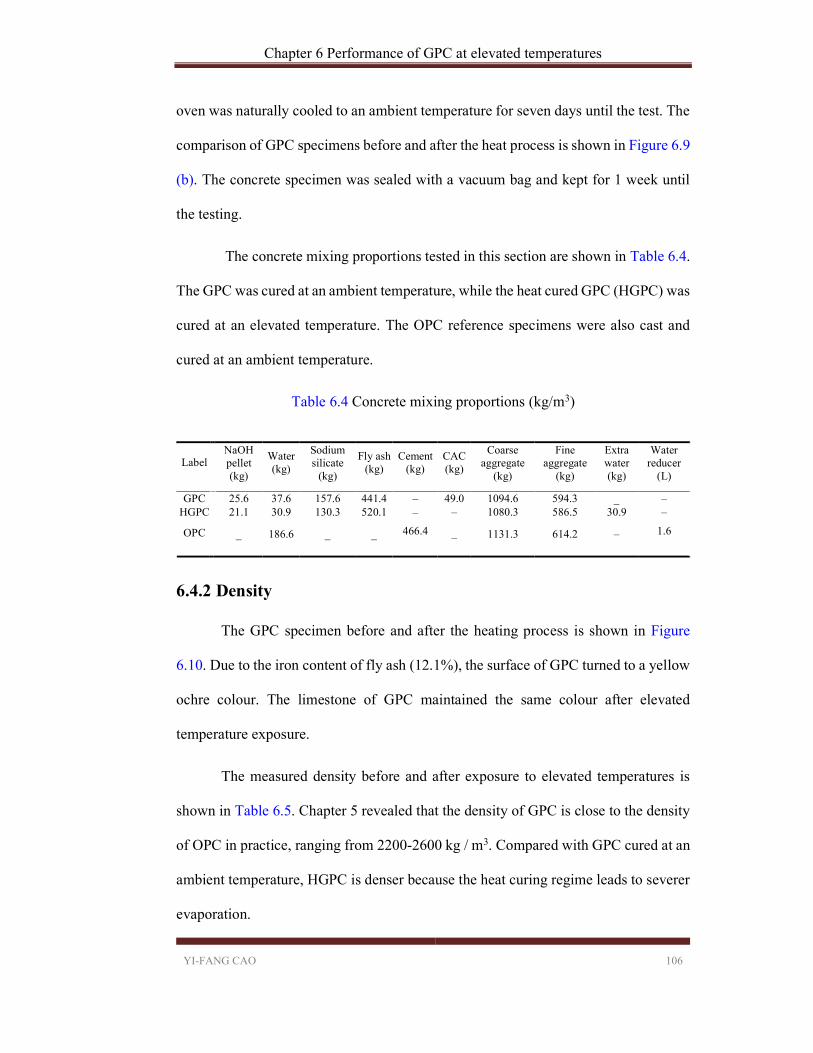
Chapter 6 Performance of GPC at elevated temperatures
YI-FANG CAO 106
oven was naturally cooled to an ambient temperature for seven days until the test. The
comparison of GPC specimens before and after the heat process is shown in Figure 6.9
(b). The concrete specimen was sealed with a vacuum bag and kept for 1 week until
the testing.
The concrete mixing proportions tested in this section are shown in Table 6.4.
The GPC was cured at an ambient temperature, while the heat cured GPC (HGPC) was
cured at an elevated temperature. The OPC reference specimens were also cast and
cured at an ambient temperature.
Table 6.4 Concrete mixing proportions (kg/m3)
6.4.2 Density
The GPC specimen before and after the heating process is shown in Figure
6.10. Due to the iron content of fly ash (12.1%), the surface of GPC turned to a yellow
ochre colour. The limestone of GPC maintained the same colour after elevated
temperature exposure.
The measured density before and after exposure to elevated temperatures is
shown in Table 6.5. Chapter 5 revealed that the density of GPC is close to the density
of OPC in practice, ranging from 2200-2600 kg / m3. Compared with GPC cured at an
ambient temperature, HGPC is denser because the heat curing regime leads to severer
evaporation.
Label NaOH
pellet (kg)
Water (kg)
Sodium silicate
(kg)
Fly ash (kg)
Cement (kg)
CAC (kg)
Coarse aggregate
(kg)
Fine aggregate
(kg)
Extra water (kg)
Water reducer
(L)
GPC 25.6 37.6 157.6 441.4 – 49.0 1094.6 594.3 _ – HGPC 21.1 30.9 130.3 520.1 – – 1080.3 586.5 30.9 –
OPC
_ 186.6 _ _ 466.4 _ 1131.3 614.2 – 1.6

Chapter 6 Performance of GPC at elevated temperatures
YI-FANG CAO 107
Figure 6.10 GPC specimens before and after heat process
Among three types of concretes, HGPC has the smallest density and OPC has the
highest density before elevated temperature exposure. However, the density of OPC
decreased by 8.62% after exposure to 800°C, and the averaged densities of all three
concretes was 2195.0 kg/m3 after elevated temperature exposure.
Table 6.5 Density of different concrete
Concrete type
Density (kg/m3)
Before exposure to 800°C After exposure to high
temperatures
GPC 2371.7 2186.1 (-7.82%)
HGPC 2343.4 2190.9 (-6.51%)
OPC 2416.5 2208.0 (-8.62%)
6.4.3 Stress-strain relationship curve
Normally, a complete stress-strain curve of concrete consists of two branches:
the ascending branch before peak strength and descending branch until the concrete is
crushed. As previously mentioned, the strain measured by the compressometer will be
affected by the contact points between the compressometer and surface of a specimen.
The strain recorded by the compressometer was used for the ascending branch of
stress-strain curve. The platen-to-platen deformation of the machine was calibrated
and used for the descending branch.
Before heating After heating

Chapter 6 Performance of GPC at elevated temperatures
YI-FANG CAO 108
The comparison of stress-strain curves of GPC tested at elevated temperatures
and after elevated temperature exposure is shown in Figure 6.11. Junaid et al. (2017)
tested the stress-strain curve of low calcium fly ash geopolymer at elevated
temperatures. A significant softening phenomenon of HGPC (cured at 80 °C) after
being heated to 800 °C was observed, as shown in Figure 6.11 (a). The strain of the
peak load increased severely and the ultimate strain also increased.
(a) Stress-strain relationship of GPC samples at
high temperatures (Junaid et al., 2017)
(b) Stress-strain relationship of OPC after
exposure to high temperatures (Chang et al.,
2006)
(c) Test results of concretes after exposure to 800°C
Figure 6.11 Stress-strain relationship curve of concretes
0
10
20
30
0 4000 8000 12000 16000
Com
pres
sive
str
engt
h (M
Pa)
Axial strain, e (×10-6)
GPC
HGPC
OPC

Chapter 6 Performance of GPC at elevated temperatures
YI-FANG CAO 109
According to the results reported by Chang et al. (2006), after exposure to 800°C the
ultimate strain of OPC is higher than GPC. As presented in Figure 6.11 (b), the strain
of peak strength and the ultimate strain increased with the temperature increase. The
test result in Figure 6.11 (c) further prove that the ductility of GPC is higher than OPC
after exposure to 800 °C; performance reported in Section 6.3.2, little influence was
found for HGPC after exposure to elevated temperatures, which was attributed to its
denser matrix. After exposure to elevated temperatures and seven days cooling, GPC
and OPC suffered a severe load carrying capacity loss, in contrast to HGPC. By
comparison, HGPC kept more than half of its strength after elevated temperature
exposure. According to the density loss proposed in Table 6.5, GPC and OPC lost
more density than HGPC. The severe mass losses lead to a loose matrix of GPC and
OPC, and these loose matrixes were responsible for the low strength of the samples.
6.5 Summary
This chapter reported the hot strengths of nine GPM mixtures tested at 600 and
800 °C, and the influence of three factors on the hot strength of geopolymer was
analysed. A GPC mixture was chosen based on the results of a salient parameter
analysis. The hot strength of this GPC was tested at temperatures ranging from 23, 200,
400, 600 and 800 °C. In contrast to OPC, GPC exhibited a similar performance at
400°C, and a higher fire endurance at 200, 600 and 800°C.
To evaluate the performance of a loaded GPC specimen under the condition of
a fire, the deformation of GPC under combined loading and temperature was analysed.
The GPC cylinder maintained its integrity for 10 mins longer than the OPC cylinder
under the same condition. The failure modes of these two concretes are also different:

Chapter 6 Performance of GPC at elevated temperatures
YI-FANG CAO 110
GPC exhibited large deformation before failure, while a brittle failure mode was
observed in OPC.
Lastly investigated were the residual properties of GPC after exposure to
800 °C. The density of three types of concretes was studied and it was found that heat
cured GPC exhibited a higher density than the other concretes. The stress-strain
relationships of GPC after exposure to 800 °C were reported and compared with
current research work.

Chapter 7 Performance of GCFST columns at ambient temperature
YI-FANG CAO 111
Chapter 7 Performance of GCFST columns at ambient and
elevated temperatures
7.1 Introduction
Fire disasters have been frequently reported worldwide in recent years,
seriously threatening personal and public safety. Exposure of concrete and steel to fire
leads to serious structural deterioration and possible failure of columns, thus resulting
in the local or global collapse of a building (Han et al., 2010). However, in most cases,
unprotected CFST columns are not able to maintain structural integrity for sufficient
time under fire conditions. External insulating coating or internal reinforcing steel are
required to improve the fire resistance of CFST columns, but these two methods
tremendously increase the cost of CFST columns and heighten the difficulty of
construction.
Despite the fact that using industry by-product in concrete can achieve
significant economic and environmental benefits, the supreme fire endurance of GPC
and its application in structures has not been fully explored. Furthermore, to the best
knowledge of the authors, very little research has been conducted to investigate the
behaviour of GCFST columns. In addition to detailing the background of GCFST
columns, the mechanical properties and fire performance of these columns are
investigated in this chapter. Reference specimens made from OPC concrete were tested
and compared with GPC specimens. A finite element (FE) model is employed to
predict the behaviour of GCFST columns and the model is verified by experimental
results.
Chapter 7 Performance of GCFST columns at ambient temperature
YI-FANG CAO 112
7.2 Experimental investigation
7.2.1 Specimen preparation
7.2.1.1 Concrete sample
Firstly, the binder (fly ash and CAC) and saturated surface dry aggregates were
added into a mixer and dry-mixed for 3 minutes. Afterwards, extra water was added to
the dry-mix for GPC-2 and GPC-4 to ensure there was adequate slump. The alkaline
activator was then added, and the wet mixture was stirred for an additional 4-6 minutes
to form a homogenous state. The mixing procedure for OPC concrete production was
similar to that of the GPC. Superplasticiser was added in the mixer, after the dry-mix
of aggregate and cement; extra water was added into GPC, after dry-mix of aggregate
and fly ash. A vibrating table was employed to remove air bubbles from the specimens.
Each layer was vibrated for 15-30 seconds. The cast specimens were kept in moulds
for 24 ± 8 hours. After demolding, all specimens were cured in an ambient temperature
until compressive strength testing. Before demolding specimen GPC-4, this specimen
was cured at 80 ℃ in moulds for 24 hours to check the effect of the elevated
temperature curing method. After demolding, all specimens were sealed in plastic bags
until being tested. Both concrete and mortar cylindrical specimens were ground using
a CIVILAB core facing grinder to get smooth and flat ends before the testing.
Five types of concrete were mixed to fill the steel tubes. During casting, a
concrete vibrator was utilised to compact the concrete to expel the internal air bubbles.
After casting, the specimens were stored in a laboratory at an ambient temperature.
The specimens requiring a heat curing regime were firstly cured at 80 ℃ for 24 hours
before being stored in the laboratory.
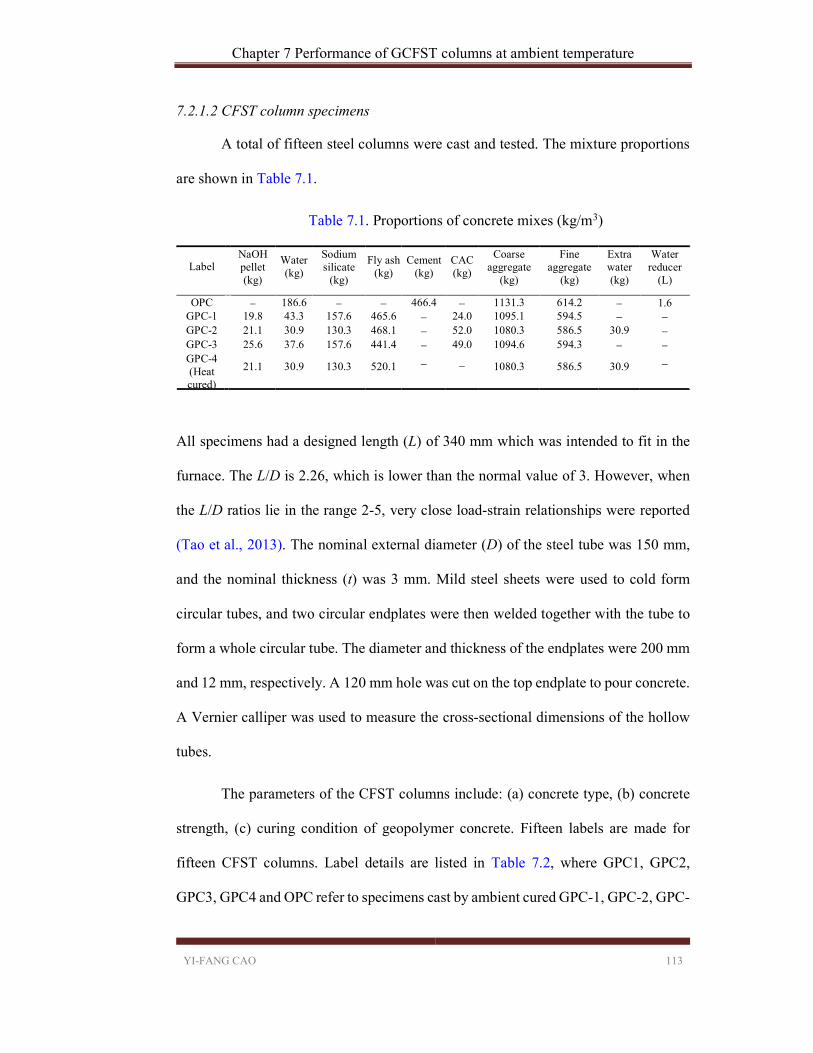
Chapter 7 Performance of GCFST columns at ambient temperature
YI-FANG CAO 113
7.2.1.2 CFST column specimens
A total of fifteen steel columns were cast and tested. The mixture proportions
are shown in Table 7.1.
Table 7.1. Proportions of concrete mixes (kg/m3)
All specimens had a designed length (L) of 340 mm which was intended to fit in the
furnace. The L/D is 2.26, which is lower than the normal value of 3. However, when
the L/D ratios lie in the range 2-5, very close load-strain relationships were reported
(Tao et al., 2013). The nominal external diameter (D) of the steel tube was 150 mm,
and the nominal thickness (t) was 3 mm. Mild steel sheets were used to cold form
circular tubes, and two circular endplates were then welded together with the tube to
form a whole circular tube. The diameter and thickness of the endplates were 200 mm
and 12 mm, respectively. A 120 mm hole was cut on the top endplate to pour concrete.
A Vernier calliper was used to measure the cross-sectional dimensions of the hollow
tubes.
The parameters of the CFST columns include: (a) concrete type, (b) concrete
strength, (c) curing condition of geopolymer concrete. Fifteen labels are made for
fifteen CFST columns. Label details are listed in Table 7.2, where GPC1, GPC2,
GPC3, GPC4 and OPC refer to specimens cast by ambient cured GPC-1, GPC-2, GPC-
Label NaOH
pellet (kg)
Water (kg)
Sodium silicate
(kg)
Fly ash (kg)
Cement (kg)
CAC (kg)
Coarse aggregate
(kg)
Fine aggregate
(kg)
Extra water (kg)
Water reducer
(L)
OPC 186.6 466.4 1131.3 614.2 1.6 GPC-1 19.8 43.3 157.6 465.6 24.0 1095.1 594.5 GPC-2 21.1 30.9 130.3 468.1 52.0 1080.3 586.5 30.9 GPC-3 25.6 37.6 157.6 441.4 49.0 1094.6 594.3 GPC-4 (Heat cured)
21.1 30.9 130.3 520.1 1080.3 586.5 30.9
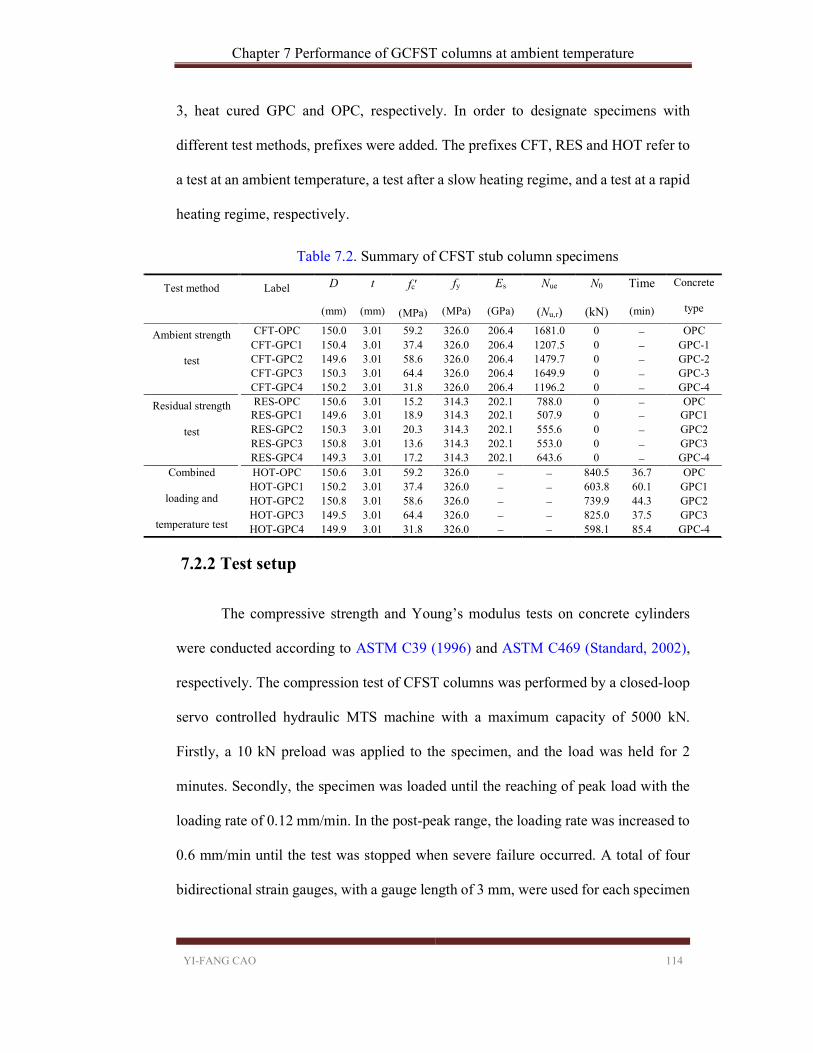
Chapter 7 Performance of GCFST columns at ambient temperature
YI-FANG CAO 114
3, heat cured GPC and OPC, respectively. In order to designate specimens with
different test methods, prefixes were added. The prefixes CFT, RES and HOT refer to
a test at an ambient temperature, a test after a slow heating regime, and a test at a rapid
heating regime, respectively.
Table 7.2. Summary of CFST stub column specimens
7.2.2 Test setup
The compressive strength and Young’s modulus tests on concrete cylinders
were conducted according to ASTM C39 (1996) and ASTM C469 (Standard, 2002),
respectively. The compression test of CFST columns was performed by a closed-loop
servo controlled hydraulic MTS machine with a maximum capacity of 5000 kN.
Firstly, a 10 kN preload was applied to the specimen, and the load was held for 2
minutes. Secondly, the specimen was loaded until the reaching of peak load with the
loading rate of 0.12 mm/min. In the post-peak range, the loading rate was increased to
0.6 mm/min until the test was stopped when severe failure occurred. A total of four
bidirectional strain gauges, with a gauge length of 3 mm, were used for each specimen
Test method Label D
(mm)
t
(mm)
fc
(MPa)
fy
(MPa)
Es
(GPa)
Nue
(Nu,r)
N0
(kN)
Time
(min)
Concrete
type
Ambient strength
test
CFT-OPC 150.0 3.01 59.2 326.0 206.4 1681.0 0 OPC CFT-GPC1 150.4 3.01 37.4 326.0 206.4 1207.5 0 GPC-1 CFT-GPC2 149.6 3.01 58.6 326.0 206.4 1479.7 0 GPC-2 CFT-GPC3 150.3 3.01 64.4 326.0 206.4 1649.9 0 GPC-3 CFT-GPC4 150.2 3.01 31.8 326.0 206.4 1196.2 0 GPC-4
Residual strength
test
RES-OPC 150.6 3.01 15.2 314.3 202.1 788.0 0 OPC RES-GPC1 149.6 3.01 18.9 314.3 202.1 507.9 0 GPC1 RES-GPC2 150.3 3.01 20.3 314.3 202.1 555.6 0 GPC2 RES-GPC3 150.8 3.01 13.6 314.3 202.1 553.0 0 GPC3 RES-GPC4 149.3 3.01 17.2 314.3 202.1 643.6 0 GPC-4
Combined
loading and
temperature test
HOT-OPC 150.6 3.01 59.2 326.0 840.5 36.7 OPC HOT-GPC1 150.2 3.01 37.4 326.0 603.8 60.1 GPC1 HOT-GPC2 150.8 3.01 58.6 326.0 739.9 44.3 GPC2 HOT-GPC3 149.5 3.01 64.4 326.0 825.0 37.5 GPC3 HOT-GPC4 149.9 3.01 31.8 326.0 598.1 85.4 GPC-4

Chapter 7 Performance of GCFST columns at ambient temperature
YI-FANG CAO 115
to measure the longitudinal and transverse strains of the steel tube at mid-height. Four
LVDTs were used to measure the column’s axial deformation.
Two heating rates were used in the examination of CFST columns, as shown
in Figure 7.1. The first rate is a slow heating regime which was used to study the post-
fire performance of CFST columns. The CFST column, aged 28 days, was put in the
electrical furnace, and the temperature of the furnace was increased to 800 ℃ at the
rate of 5 ℃/min, without loading. The furnace kept the target temperature for 3 hours
to achieve an equilibrium state of temperature distribution. Lastly, the furnace was
naturally cooled to room temperature. The post-fire testing was conducted on the
specimen after 7 days of cooling.
Figure 7.1. Heating regime
A rapid heating regime was used to test the response of CFST columns to fire with a
constant load. The control mode of the compression machine was set to load control
for the whole testing process. The CFST column was firstly loaded to 50% of the
ultimate load measured at ambient temperature. The actually applied axial load (N0) is
shown in Table 7.2. Following this, the temperature was rapidly increased to 800 ℃,
0
200
400
600
800
1000
0 60 120 180 240 300 360
Tem
pera
ture
(℃
)
Time (min)
Rapid Heating Regime
Slow Heating Regime

Chapter 7 Performance of GCFST columns at ambient temperature
YI-FANG CAO 116
and 800 ℃ was maintained until the failure of specimens. Due to the maximum
capacity of the furnace, the rapid heating regime is slower than the standard heating
curve provided by the Australian Standard (1997).
7.3 Experimental results and discussion
7.3.1 Performance of CFST columns at ambient temperature
7.3.1.1 Axial load versus axial strain curves
The specimens tested at ambient temperature are shown in Figure 7.2. Figures
7.3-7.5 present the effects of different concrete strength levels, the heating regime, and
concrete types on the measured axial load (N) versus axial strain curves, respectively.
In the figures, the strain values were obtained from the measurements of strain gauges
and LVDTs. The values from four strain gauges were implemented before the steel
tube buckled. After the steel tube buckled, the axial strain ε was calculated from
average readings of the four LVDTs divided by the overall length of the specimen.
Each figure indicates the steel yield point.
Figure 7.2. Tested specimens at ambient temperature
Figure 7.3 presents a comparison between GCFST columns with different strength
levels on the N-ε curves. The concrete strengths for CFT-GPC1, CFT-GPC2 and CFT-
CFT-GPC1 CFT-GPC2 CFT-GPC3 CFT-GPC4 CFT-OPC

Chapter 7 Performance of GCFST columns at ambient temperature
YI-FANG CAO 117
GPC3 are 37.4 MPa, 58.6 MPa and 64.4 MPa, respectively. A typical N-ε curve can
be found in high strength GCFST, and has an ascending branch, a descending branch
and a stable branch. However, GCFST made with low strength CFT-GPC1 was seen
to have no obvious descending branch before the curve reached a stable condition.
Figure 7.3. Comparison between N-ε curves of GCFST columns with different
strength levels
As can be seen in Figure 7.4, the influence of different heating regimes on the N-ε
performance of GCFST is illustrated. The curing regimes for CFT-GPC1, CFT-GPC2
and CFT-GPC4 GCFST columns are ambient curing, ambient curing and elevated
temperature curing, respectively. The CFT-GPC4 GCFST column was firstly cured at
80 ℃ in an oven for 24 hours, then it was cured at ambient temperature. The mixing
design for CFT-GPC2 and CFT-GPC4 were the same, except for the CAC addition in
CFT-GPC2. With the addition of CAC, the strength of GPC in CFT-GPC2 could be
developed at an ambient temperature. By comparison, the CFT-GPC4, which was
cured at an elevated temperature, exhibited a lower load-bearing capacity than CFT-
GPC2.
Also conducted was a comparison of N-ε performance on two columns with
similar GPC compressive strengths (CFT-GPC1 and CFT-GPC). The curves of CFT-
GPC1 and CFT-GPC4 GCFST columns almost superpose each other. The behaviours
0
300
600
900
1200
1500
1800
0 10000 20000 30000 40000
Axi
al lo
ad, N
(kN
)
Axial strain, e (×10-6)
CFT-GPC1CFT-GPC2CFT-GPC3
εy = 1579 µε

Chapter 7 Performance of GCFST columns at ambient temperature
YI-FANG CAO 118
of GCFST columns are similar if the GPC strengths are relatively similar under two
curing conditions.
Figure 7.4. Comparison between N-ε curves of GCFST columns with different
heating regimes
Figure 7.5 presents the differences found when comparing N-ε curves of GCFST
(CFT-GPC3) and conventional CFST (CFT-OPC) columns. The descending branch of
the N-ε curve is very steep for GCFST columns. The CFT-OPC CFST column has a
slow descending part once it reaches peak strength.
Figure 7.5. Comparison between N-ε curves of GCFST and conventional CFST
columns
Furthermore, the load carrying capacity of CFT-OPC increased slightly after 34000
µε, while the CFT-GPC3 GCFST column reached a relatively stable residual strength.
The residual strength of the CFT-GPC1 GCFST column was observed to be generally
close to the minimum strength of CFT-OPC CFST column.
0
300
600
900
1200
1500
1800
0 10000 20000 30000 40000
Axi
al lo
ad, N
(kN
)
Axial strain, e (×10-6)
CFT-GPC1CFT-GPC2CFT-GPC4
εy = 1579 µε
0
300
600
900
1200
1500
1800
0 10000 20000 30000 40000
Axi
al lo
ad, N
(kN
)
Axial strain, e (×10-6)
CFT-OPCCFT-GPC3
εy = 1579 µε
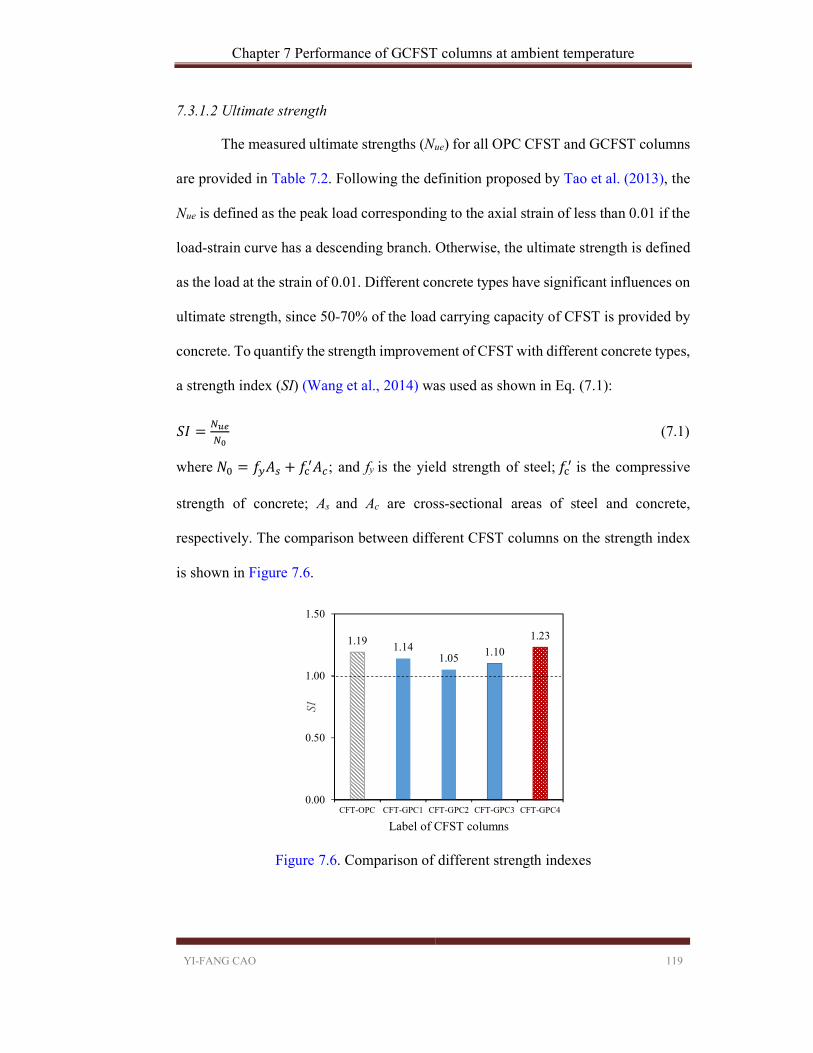
Chapter 7 Performance of GCFST columns at ambient temperature
YI-FANG CAO 119
7.3.1.2 Ultimate strength
The measured ultimate strengths (Nue) for all OPC CFST and GCFST columns
are provided in Table 7.2. Following the definition proposed by Tao et al. (2013), the
Nue is defined as the peak load corresponding to the axial strain of less than 0.01 if the
load-strain curve has a descending branch. Otherwise, the ultimate strength is defined
as the load at the strain of 0.01. Different concrete types have significant influences on
ultimate strength, since 50-70% of the load carrying capacity of CFST is provided by
concrete. To quantify the strength improvement of CFST with different concrete types,
a strength index (SI) (Wang et al., 2014) was used as shown in Eq. (7.1):
𝑆𝐼 = (7.1)
where 𝑁 = 𝑓 𝐴 + 𝑓 𝐴 ; and fy is the yield strength of steel; 𝑓 is the compressive
strength of concrete; As and Ac are cross-sectional areas of steel and concrete,
respectively. The comparison between different CFST columns on the strength index
is shown in Figure 7.6.
Figure 7.6. Comparison of different strength indexes
1.19 1.141.05 1.10
1.23
0.00
0.50
1.00
1.50
CFT-OPC CFT-GPC1 CFT-GPC2 CFT-GPC3 CFT-GPC4
SI
Label of CFST columns
Chapter 7 Performance of GCFST columns at ambient temperature
YI-FANG CAO 120
The SI values for GCFST columns ranged from 1.05 to 1.23, while the value for a OPC
CFST column reference specimen is 1.19. Once GCFST undergoes a heat-curing
process it exhibits higher SI value than GCFST column cured at ambient temperature.
The higher SI value means a higher concrete confinement. In conclusion, the GCFST
column with initial 24 hours heat-curing process presented better confinement than
both OPC CFST and GCFST columns cured at ambient temperature.
7.3.1.3 Compressive stiffness
Steel tubes of CFST columns exhibit a linear stress-strain relation before
yielding. The previous study proves that microcracks in concrete leads to a decrease
in Young’s modulus (Neville, 1995). The secant modulus of CFST columns will also
decrease after cracks develop in the concrete core under compression. The
compressive stiffness (EA) was defined as the secant stiffness corresponding to 0.4Nue.
This definition was widely adopted by previous researchers (Yang et al., 2013, Wang
et al., 2017, Huo et al., 2013).
According to the previous study by Wang et al. (2017), the compressive
stiffness of circular CFST columns under axial compression can be calculated by Eq.
(7.2) and Eq. (7.3). The results of the experiment and empirical prediction of
compressive stiffness are shown in Table 7.3.
𝐸𝐴 = 𝐸 𝐴 + 𝜅 𝐸 𝐴 (7.2)
𝜅 = ( ) . + [56.8 − 56.3( ) . ] ≤ 1 (7.3)
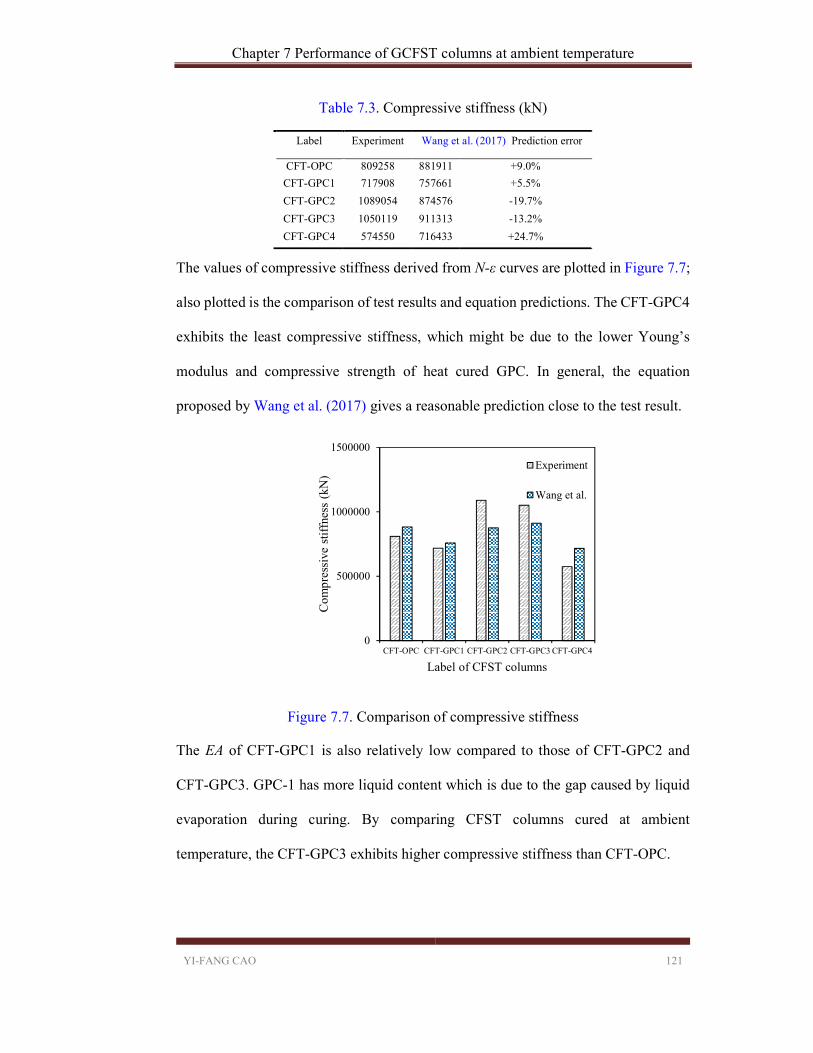
Chapter 7 Performance of GCFST columns at ambient temperature
YI-FANG CAO 121
Table 7.3. Compressive stiffness (kN)
The values of compressive stiffness derived from N-ε curves are plotted in Figure 7.7;
also plotted is the comparison of test results and equation predictions. The CFT-GPC4
exhibits the least compressive stiffness, which might be due to the lower Young’s
modulus and compressive strength of heat cured GPC. In general, the equation
proposed by Wang et al. (2017) gives a reasonable prediction close to the test result.
Figure 7.7. Comparison of compressive stiffness
The EA of CFT-GPC1 is also relatively low compared to those of CFT-GPC2 and
CFT-GPC3. GPC-1 has more liquid content which is due to the gap caused by liquid
evaporation during curing. By comparing CFST columns cured at ambient
temperature, the CFT-GPC3 exhibits higher compressive stiffness than CFT-OPC.
0
500000
1000000
1500000
CFT-OPC CFT-GPC1 CFT-GPC2 CFT-GPC3 CFT-GPC4
Com
pres
sive
stif
fnes
s (k
N)
Label of CFST columns
Experiment
Wang et al.
Label Experiment Wang et al. (2017) Prediction error
CFT-OPC 809258 881911 +9.0%
CFT-GPC1 717908 757661 +5.5%
CFT-GPC2 1089054 874576 -19.7%
CFT-GPC3 1050119 911313 -13.2%
CFT-GPC4 574550 716433 +24.7%
Chapter 7 Performance of GCFST columns at ambient temperature
YI-FANG CAO 122
7.3.1.4 Ductility
A ductile structure design was recommended by the Eurocode (2004) to
drastically reduce the seismic force. The ductile structure design can also mitigate the
influence of extreme events, such as blasts and high-impact. The ductility of CFST
columns was studied to estimate the difference in the ability to sustain deformation
beyond the elastic limit, while maintaining a sufficient load-bearing capacity until
failure. The ductility index (Yu et al., 2016) was defined in Eq. (7.4) to evaluate the
ductility of CFST columns:
𝐷𝐼 = % (7.4)
where 𝜀 % is axial strain when the load decreased to 90% of the ultimate strength;
𝜀 = 𝜀 %/0.75 , 𝜀 % is axial strain when the load attained 75% of the ultimate
strength in the pre-peak stage.
Figure 7.8 presents the ductility index of CFST stub columns. In general, low
strength CFST columns exhibit better ductility. The ultimate strengths for CFT-GPC1
and CFT-GPC4 GCFST columns are 1207.5 kN and 1196.2 kN, respectively. The peak
strength for CFT-GPC3 GCFST column is 1649.9 kN, and it had the worst ductility.
The ductility index of conventional CFST columns is 7.1 which is relatively high. By
comparing DI of GPCs with different curing methods, it is concluded that the curing
methods have little relationship with ductility. The ductility index of CFST columns
was mainly determined by the strength of core concrete.

Chapter 7 Performance of GCFST columns at ambient temperature
YI-FANG CAO 123
Figure 7.8. Comparison of different ductility indexes
7.3.1.5 Lateral and axial strain curves
The axial load versus axial and lateral stain relationships are shown in Figure
7.9. The steel yield strain obtained from a steel coupon test is also plotted in the figures.
The figure indicates that the steel tube yielded before the CFST column achieved its
ultimate load, and the steel strength, was fully developed in the CFST columns.
It can be seen that the high strength CFST columns (CFT-GPC2, CFT-GPC3,
CFT-OPC) exhibit a descending branch after peak strength, while low strength GCFST
columns (CFT-GPC1, CFT-GPC4) have no obvious descending branch. The
difference between low and high strength CFST columns agrees with the axial load
versus strain curve test result. The descending branch of a conventional CFST column
(CFT-OPC) is slower than GCFST columns after peak strength, due to the OPC CFST
column exhibiting better ductility than GCFST columns at the high strength level.
7.1
30.2
6.64.4
18.9
0
5
10
15
20
25
30
35
CFT-OPC CFT-GPC1 CFT-GPC2 CFT-GPC3 CFT-GPC4
DI
Label of CFST columns

Chapter 7 Performance of GCFST columns at ambient temperature
YI-FANG CAO 124
Figure 7.9. Axial load versus strains at mid-height of test specimens
In Figure 7.10, the normalised axial load ratio (N/Nue) of CFST columns is depited and
the development of lateral-to-axial strain ratio (ν) is compared. The ratio is calculated
by the strain readings from corresponding strain gauges, and is used to evaluate the
concrete confinement of steel tube. The axial loads N was normalised with respect to
the corresponding peak loads Nue for a meaningful comparison. The initial ν values of
all specimens are around 0.3, which is the normal Possion’s ratio for mild steel before
yield. The lateral expansion of the steel tube is higher than the concrete core which has
a Possion’s ratio of 0.2. Due to the incongruous deformation, a gap between the steel
tube and concrete appeared, and no confinement effect on the concrete was provided
by the steel tube. After the nominalised axial load reached 90% of its peak strength,
the interaction of the steel tube and core concrete occurred. The lateral-to-axial stain
ratios ν quickly increased to around 0.6, while load-bearing capacities were kept
constant. The same lateral-to-axial strain ratio development curves indicate the same
volumetric expansion of different core concretes, despite different curing methods,
strength levels and concrete types.
0
300
600
900
1200
1500
1800
-16000 -12000 -8000 -4000 0 4000 8000 12000 16000
Axi
al lo
ad N
(kN
)
Compressive strain ε (µε) Tensile strain
CFT-OPCCFT-GPC1CFT-GPC2CFT-GPC3CFT-GPC4
εy = 1579 µε
εy = 1579 µε

Chapter 7 Performance of GCFST columns at ambient temperature
YI-FANG CAO 125
Figure 7.10. Development of lateral-to-axial strain ratio for CFST columns
The lateral-to-axial strain ratio of CFT-OPC increased earlier than GCFST columns,
which means GCFST columns developed interaction later than CFT-OPC. The early
interaction can be explained by the fact that the Young’s modulus of GPC is smaller
than OPC. The lateral-to-axial strain ratio of OPC increases sharply at the normalised
axial load ratio of 0.85; Yu et al. (2016) reported the normalised axial load ratio of
0.95. Compared to CFT-OPC, the lateral-to-axial ratio of GCFST columns have no
sharp increase, as most of GCFST columns have a higher DI value than OPC, and a
part of the load was transferred to the GPC core after the steel failed.
7.3.2 Comparison between test results and FE predictions
7.3.2.1 Introduction to FE model
The model proposed by Tao et al. (2013) was implemented in this thesis. A
typical 3D FE model built in ABAQUS 6.12 is shown in Figure 7.11. After meshing
the model, 3744 8-node solid (C3D8R) elements were generated for concrete and 792
4-node shell (S4R) elements for the steel tube. Surface-to-surface contact was used to
0
0.3
0.6
0.9
1.2
0 0.3 0.6 0.9 1.2N
omin
alis
ed a
xial
load
N /
Nue
Lateral-to-axial strain ratio v
CFT-OPC
CFT-GPC1
CFT-GPC2
CFT-GPC3
CFT-GPC4
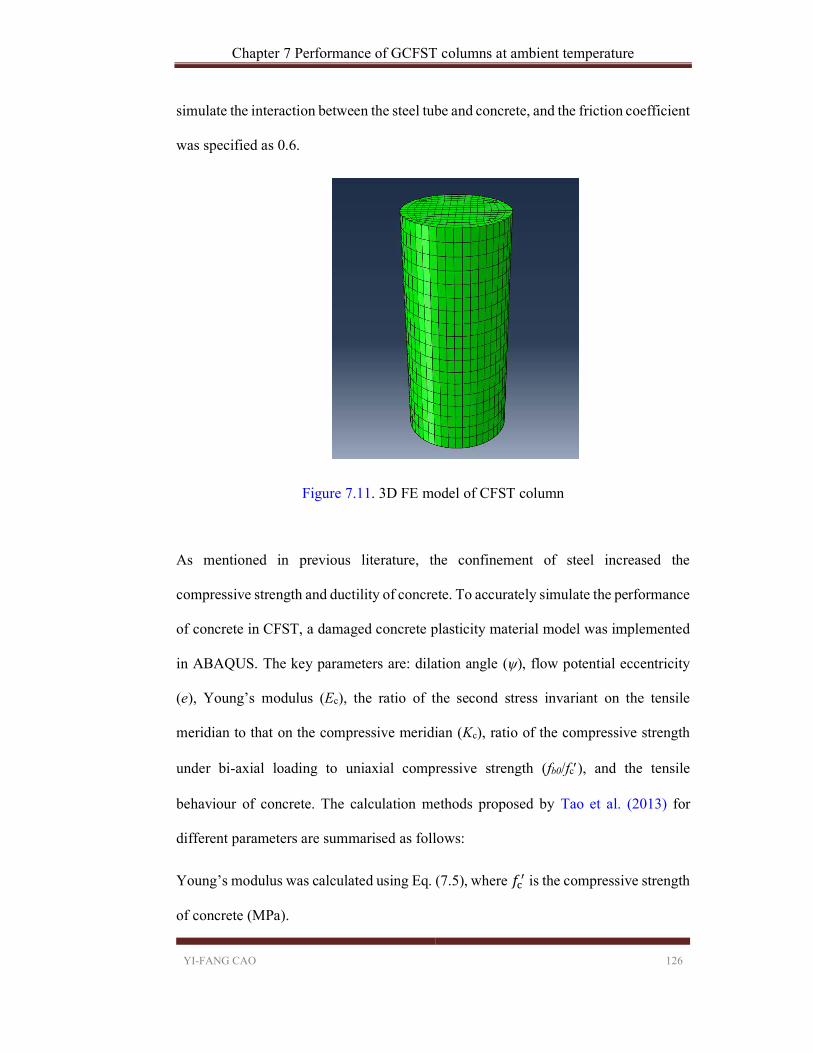
Chapter 7 Performance of GCFST columns at ambient temperature
YI-FANG CAO 126
simulate the interaction between the steel tube and concrete, and the friction coefficient
was specified as 0.6.
Figure 7.11. 3D FE model of CFST column
As mentioned in previous literature, the confinement of steel increased the
compressive strength and ductility of concrete. To accurately simulate the performance
of concrete in CFST, a damaged concrete plasticity material model was implemented
in ABAQUS. The key parameters are: dilation angle (ѱ), flow potential eccentricity
(e), Young’s modulus (Ec), the ratio of the second stress invariant on the tensile
meridian to that on the compressive meridian (Kc), ratio of the compressive strength
under bi-axial loading to uniaxial compressive strength (fb0/fc), and the tensile
behaviour of concrete. The calculation methods proposed by Tao et al. (2013) for
different parameters are summarised as follows:
Young’s modulus was calculated using Eq. (7.5), where 𝑓 is the compressive strength
of concrete (MPa).

Chapter 7 Performance of GCFST columns at ambient temperature
YI-FANG CAO 127
𝐸 = 4700 𝑓 (7.5)
Dilation angle was determined by Eq. (7.6).
ѱ=56.3(1 − 𝜉 ) for 𝜉 ≤ 0.5
6.672𝑒.
. for 𝜉 > 0.5 (7.6)
in which,
𝜉 = (7.7)
As = cross-sectional area of steel
Ac = cross-sectional area of concrete
fy = yield strength of steel, MPa
𝑓 = compressive strength of concrete, MPa
The ratio of the second stress invariant on the tensile meridian to that on the
compressive meridian (Kc) was calculated using Eq. (7.8).
𝐾 =.
. (7.8)
Ratio of the compressive strength under bi-axial loading to uniaxial compressive
strength (fb0/fc) was calculated using Eq. (7.9).
𝑓 /𝑓 = 1.5(𝑓 ) . (7.9)
The assumption of tensile behaviour of concrete is: tensile strength is linear until 0.1𝑓 ;
tensile softening was characterised by facture energy (GF) beyond 0.1𝑓 , as illustrated
in Eq. (7.10).
𝐺 = (0.0469𝑑 − 𝑑 + 26)( ) . (7.10)

Chapter 7 Performance of GCFST columns at ambient temperature
YI-FANG CAO 128
where 𝑑 is the maximum size of coarse aggregate (mm), the unit for GF is N/m.
The strain hardening and softening of confined concrete in a CFST column was
illustrated in three stages, as shown in Figure 7.12.
Figure 7.12. Model of confined concrete in CFST column
The ascending branch of confined concrete was defined in Eq. (7.11), as shown in
stage OA of Figure 7.12.
=
( ) ( ) 0 < 𝜀 < 𝜀 (7.11)
where,
𝑋 = (7.12)
𝐴 = (7.13)
𝐵 = ( )
.− 1 (7.14)
The strain at peak stress under uniaxial compression 𝜀 has been calculated by using
the equation proposed by Nicolo et al. (1994) in Eq. (7.15), and corresponds to the
strain at Point A in Figure 7.12.
𝜀 = 0.00076 + (0.626 𝑓 − 4.33) × 10 (7.15)
The 𝜀 at point B, end of plateau AB, has been calculated based on the equation
proposed by Samani and Attard (2012), as shown in Eq. (7.16) and Eq. (7.17).
Stre
ss σ
Strain e
𝑓⬚⬚
ec0 ecc
Confined concrete
Unconfined concretefr
C
BA
O
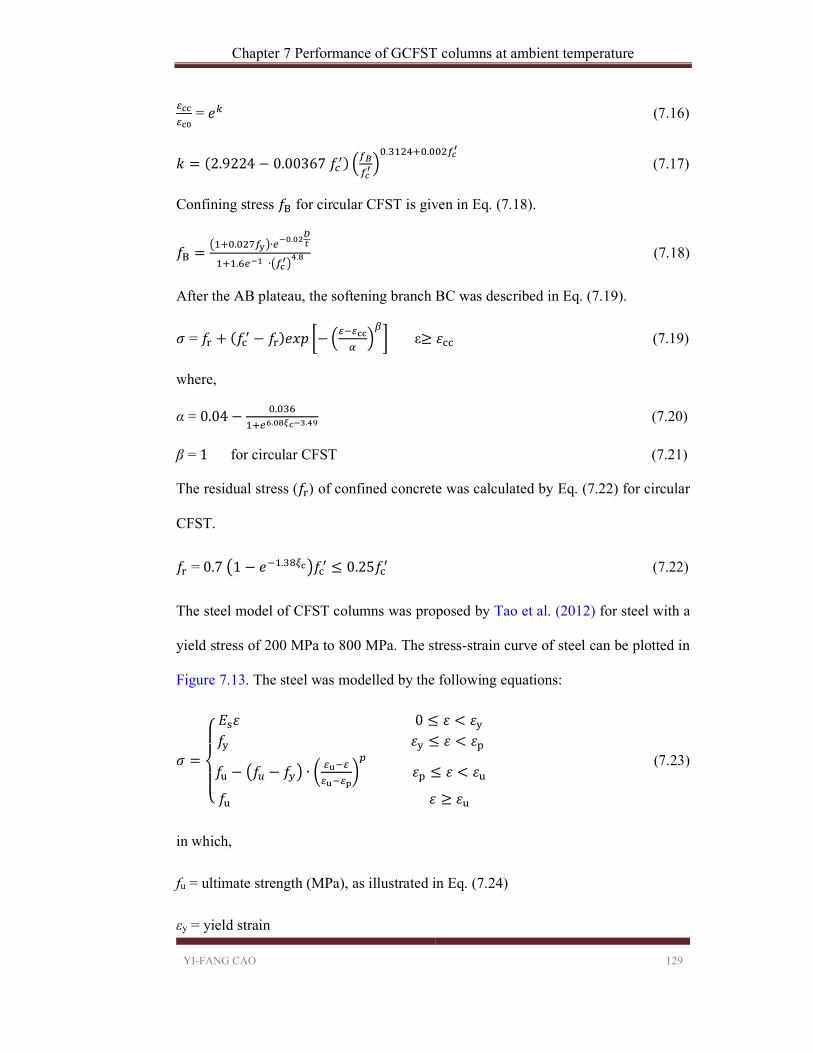
Chapter 7 Performance of GCFST columns at ambient temperature
YI-FANG CAO 129
= 𝑒 (7.16)
𝑘 = (2.9224 − 0.00367 𝑓 ). .
(7.17)
Confining stress 𝑓 for circular CFST is given in Eq. (7.18).
𝑓 =. ∙
.
. ∙. (7.18)
After the AB plateau, the softening branch BC was described in Eq. (7.19).
𝜎 = 𝑓 + (𝑓 − 𝑓 )𝑒𝑥𝑝 − ε≥ 𝜀 (7.19)
where,
α = 0.04 −.
. . (7.20)
β = 1 for circular CFST (7.21)
The residual stress (𝑓 ) of confined concrete was calculated by Eq. (7.22) for circular
CFST.
𝑓 = 0.7 1 − 𝑒 . 𝑓 ≤ 0.25𝑓 (7.22)
The steel model of CFST columns was proposed by Tao et al. (2012) for steel with a
yield stress of 200 MPa to 800 MPa. The stress-strain curve of steel can be plotted in
Figure 7.13. The steel was modelled by the following equations:
𝜎 =
⎩⎪⎨
⎪⎧
𝐸 𝜀 0 ≤ 𝜀 < 𝜀
𝑓 𝜀 ≤ 𝜀 < 𝜀
𝑓 − 𝑓 − 𝑓 ∙ 𝜀 ≤ 𝜀 < 𝜀
𝑓 𝜀 ≥ 𝜀
(7.23)
in which,
fu = ultimate strength (MPa), as illustrated in Eq. (7.24)
εy = yield strain
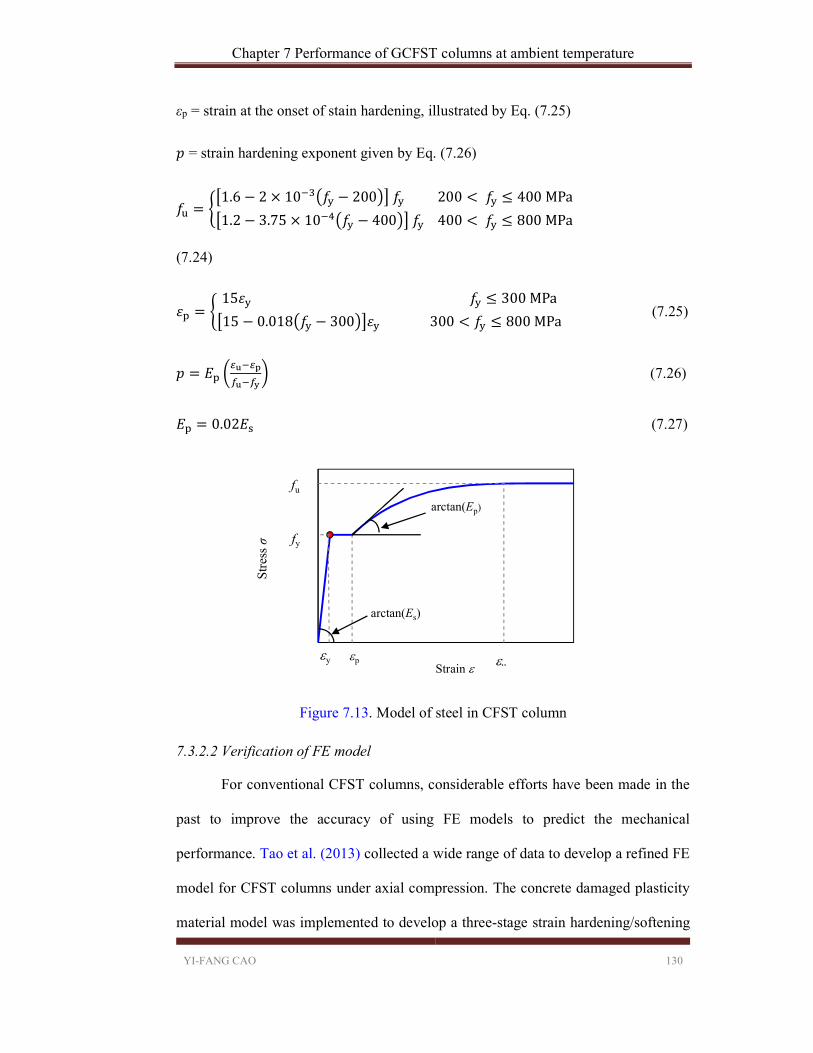
Chapter 7 Performance of GCFST columns at ambient temperature
YI-FANG CAO 130
εp = strain at the onset of stain hardening, illustrated by Eq. (7.25)
𝑝 = strain hardening exponent given by Eq. (7.26)
𝑓 =1.6 − 2 × 10 𝑓 − 200 𝑓 200 < 𝑓 ≤ 400 MPa
1.2 − 3.75 × 10 𝑓 − 400 𝑓 400 < 𝑓 ≤ 800 MPa
(7.24)
𝜀 =15𝜀 𝑓 ≤ 300 MPa
15 − 0.018 𝑓 − 300 𝜀 300 < 𝑓 ≤ 800 MPa (7.25)
𝑝 = 𝐸 (7.26)
𝐸 = 0.02𝐸 (7.27)
Figure 7.13. Model of steel in CFST column
7.3.2.2 Verification of FE model
For conventional CFST columns, considerable efforts have been made in the
past to improve the accuracy of using FE models to predict the mechanical
performance. Tao et al. (2013) collected a wide range of data to develop a refined FE
model for CFST columns under axial compression. The concrete damaged plasticity
material model was implemented to develop a three-stage strain hardening/softening
Str
ess
σ
Strain e
fu
fy
ey eu ep
arctan(Ep)
arctan(Es)
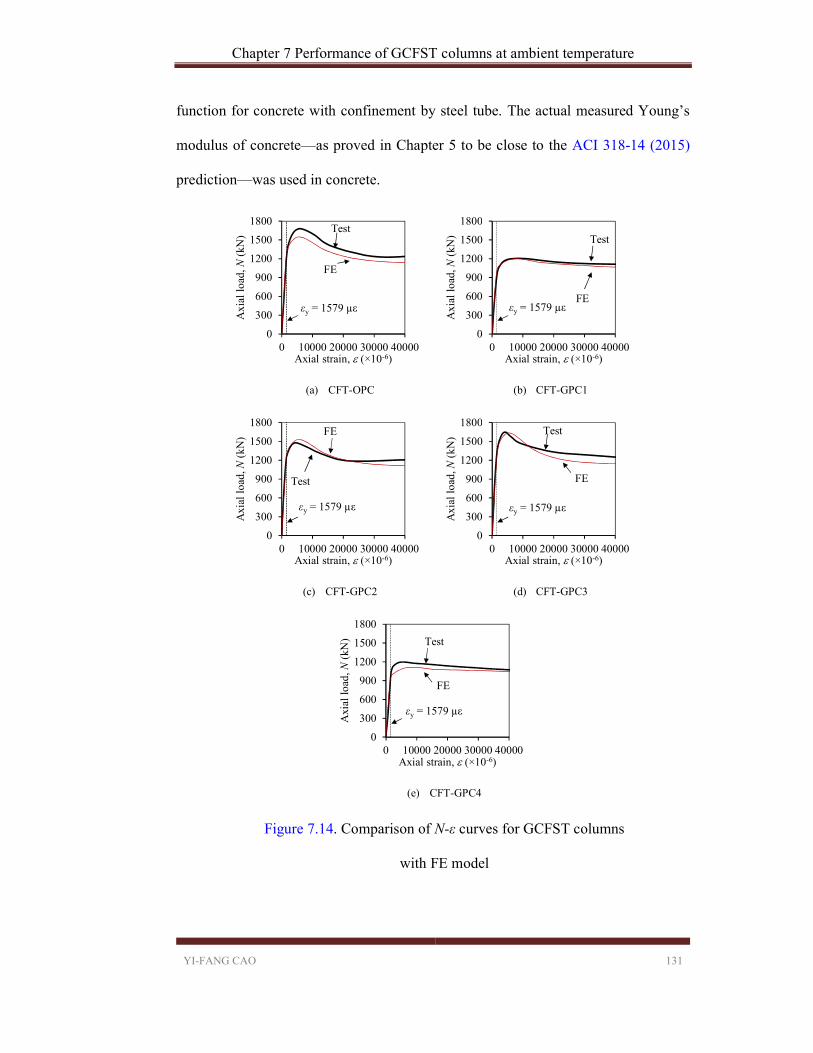
Chapter 7 Performance of GCFST columns at ambient temperature
YI-FANG CAO 131
function for concrete with confinement by steel tube. The actual measured Young’s
modulus of concrete—as proved in Chapter 5 to be close to the ACI 318-14 (2015)
prediction—was used in concrete.
(a) CFT-OPC (b) CFT-GPC1
(c) CFT-GPC2 (d) CFT-GPC3
(e) CFT-GPC4
Figure 7.14. Comparison of N-ε curves for GCFST columns
with FE model
0
300
600
900
1200
1500
1800
0 10000 20000 30000 40000
Axi
al lo
ad, N
(kN
)
Axial strain, e (×10-6)
FE
εy = 1579 µε
Test
0
300
600
900
1200
1500
1800
0 10000 20000 30000 40000
Axi
al lo
ad, N
(kN
)
Axial strain, e (×10-6)
FEεy = 1579 µε
Test
0
300
600
900
1200
1500
1800
0 10000 20000 30000 40000
Axi
al lo
ad, N
(kN
)
Axial strain, e (×10-6)
FE
εy = 1579 µε
Test
0
300
600
900
1200
1500
1800
0 10000 20000 30000 40000
Axi
al lo
ad, N
(kN
)
Axial strain, e (×10-6)
FE
εy = 1579 µε
Test
0
300
600
900
1200
1500
1800
0 10000 20000 30000 40000
Axi
al lo
ad, N
(kN
)
Axial strain, e (×10-6)
FE
εy = 1579 µε
Test

Chapter 7 Performance of GCFST columns at ambient temperature
YI-FANG CAO 132
The FE model has been proved to have high accuracy when modelling conventional
CFST columns (Yu et al., 2016); this is further confirmed by the comparison between
predicted and measured Nε curves for CFT-OPC, as shown in Figure 7.14 (e). The
feasibility of using this model to predict the performance of GCFST columns at an
ambient temperature is conducted in this part. As shown in Figure 7.14, the FE model
also accurately predicts the axial load versus axial strain relationship of GCFST
columns under compression. Both ascending and descending branches of load-strain
curve are close to FE prediction. Using the model proposed by Tao et al. (2013) is able
to get an accurate result before peak strength and conservative prediction after peak
strength.
7.3.2.3 Comparison with compressive stiffness
The experiment test result and FE modelling result compressive stiffness are
shown in Table 7.4. The FE result of each specimen has also been plotted in Figure
7.15 for comparison with test results. As can be seen, the FE model makes an accurate
prediction for CFT-OPC. In general, the FE model gives a prediction close to test
results on the compressive stiffness.
0
500000
1000000
1500000
CFT-OPC CFT-GPC1 CFT-GPC2 CFT-GPC3 CFT-GPC4
Com
pres
sive
stif
fnes
s (k
N)
Label of CFST columns
Experiment
FE

Chapter 7 Performance of GCFST columns at ambient temperature
YI-FANG CAO 133
Figure 7.15. Comparison of compressive stiffness for GCFST columns with FE model
Table 7.4. Compressive stiffness (kN)
7.3.3 Performance of CFST columns after elevated temperature
exposure
7.3.3.1 Axial load versus axial strain curves
The failure mode of specimens after elevated temperature exposure is similar
to that of specimens tested at an ambient temperature, as presented in Figure 7.16. The
test results of CFST columns after exposure to elevated temperatures were reported in
this part. Axial load (N) versus axial strain curves are shown in Figure 7.17. To get a
more reasonable comparison, the results tested at ambient temperature are also plotted
in each figure.
Figure 7.16. Tested specimens after exposure to elevated temperatures
After exposure to elevated temperatures, no post-peak descending phenomenon can be
observed in GCFST columns cured at an ambient temperature. The post-peak branch
Label Experiment FE model
CFT-OPC 809258 894959 -10.6%
CFT-GPC1 717908 768630 +7.1%
CFT-GPC2 1089054 874458 -19.7%
CFT-GPC3 1050119 911167 -13.2%
CFT-GPC4 574550 721093 +25.5%
RES-GPC1 RES-GPC2 RES-GPC3 RES-GPC4 RES-OPC

Chapter 7 Performance of GCFST columns at ambient temperature
YI-FANG CAO 134
can be found in RES-GPC4 and RES-OPC specimens, and the descending branch of
heat cured GCFST column is steeper than a conventional CFST column.
(a) RES-OPC (b) RES-GPC1
(c) RES-GPC2 (d) RES-GPC3
(e) RES-GPC4
Figure 7.17. Comparison of N-ε curves for CFST with different concretes after
exposure to elevated temperatures
It seems that the load-carrying capacities of GCFST columns (RES-GPC1, RES-GPC2
and RES-GPC3) after exposure to elevated temperatures have no relation with the
0
300
600
900
1200
1500
1800
0 10000 20000 30000 40000
Axi
al lo
ad, N
(kN
)
Axial strain, e (×10-6)
Post-fire test
Ambient test
0
300
600
900
1200
1500
1800
0 10000 20000 30000 40000
Axi
al lo
ad, N
(kN
)
Axial strain, e (×10-6)
Post-fire test
Ambient test
0
300
600
900
1200
1500
1800
0 10000 20000 30000 40000
Axi
al lo
ad, N
(kN
)
Axial strain, e (×10-6)
Post-fire test
Ambient test
0
300
600
900
1200
1500
1800
0 10000 20000 30000 40000
Axi
al lo
ad, N
(kN
)
Axial strain, e (×10-6)
Post-fire test
Ambient test
0
300
600
900
1200
1500
1800
0 10000 20000 30000 40000
Axi
al lo
ad, N
(kN
)
Axial strain, e (×10-6)
Post-fire test
Ambient test
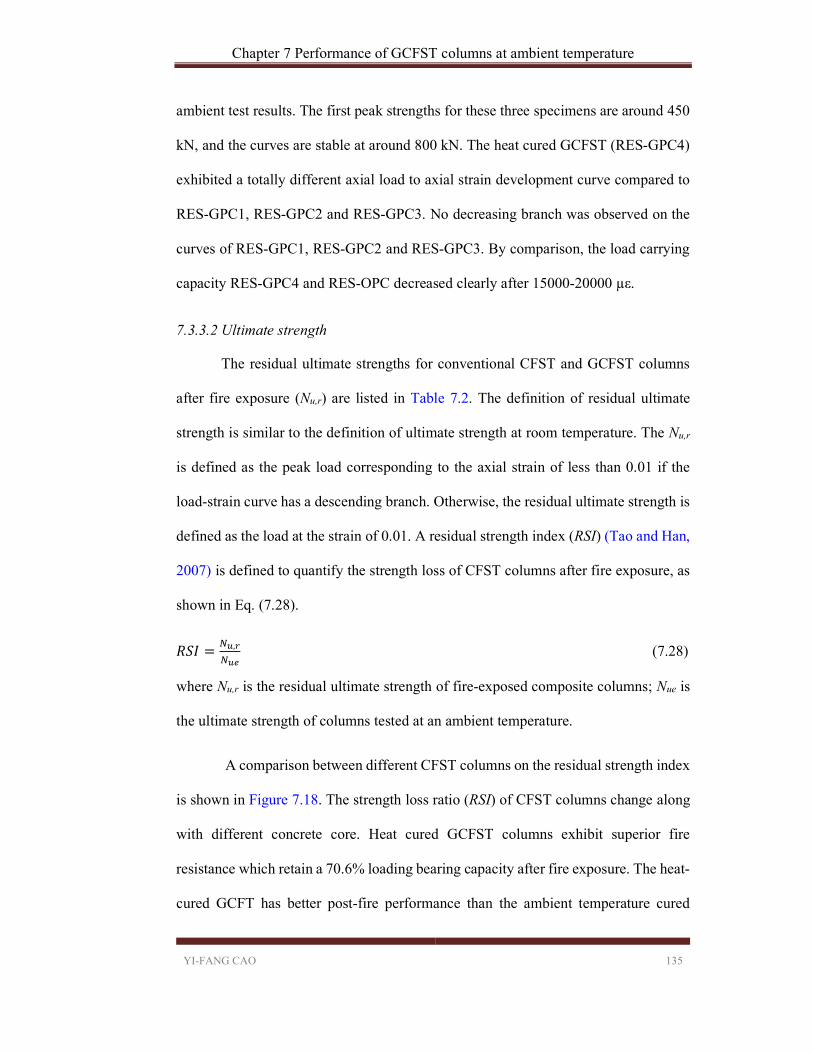
Chapter 7 Performance of GCFST columns at ambient temperature
YI-FANG CAO 135
ambient test results. The first peak strengths for these three specimens are around 450
kN, and the curves are stable at around 800 kN. The heat cured GCFST (RES-GPC4)
exhibited a totally different axial load to axial strain development curve compared to
RES-GPC1, RES-GPC2 and RES-GPC3. No decreasing branch was observed on the
curves of RES-GPC1, RES-GPC2 and RES-GPC3. By comparison, the load carrying
capacity RES-GPC4 and RES-OPC decreased clearly after 15000-20000 µε.
7.3.3.2 Ultimate strength
The residual ultimate strengths for conventional CFST and GCFST columns
after fire exposure (Nu,r) are listed in Table 7.2. The definition of residual ultimate
strength is similar to the definition of ultimate strength at room temperature. The Nu,r
is defined as the peak load corresponding to the axial strain of less than 0.01 if the
load-strain curve has a descending branch. Otherwise, the residual ultimate strength is
defined as the load at the strain of 0.01. A residual strength index (RSI) (Tao and Han,
2007) is defined to quantify the strength loss of CFST columns after fire exposure, as
shown in Eq. (7.28).
𝑅𝑆𝐼 = , (7.28)
where Nu,r is the residual ultimate strength of fire-exposed composite columns; Nue is
the ultimate strength of columns tested at an ambient temperature.
A comparison between different CFST columns on the residual strength index
is shown in Figure 7.18. The strength loss ratio (RSI) of CFST columns change along
with different concrete core. Heat cured GCFST columns exhibit superior fire
resistance which retain a 70.6% loading bearing capacity after fire exposure. The heat-
cured GCFT has better post-fire performance than the ambient temperature cured
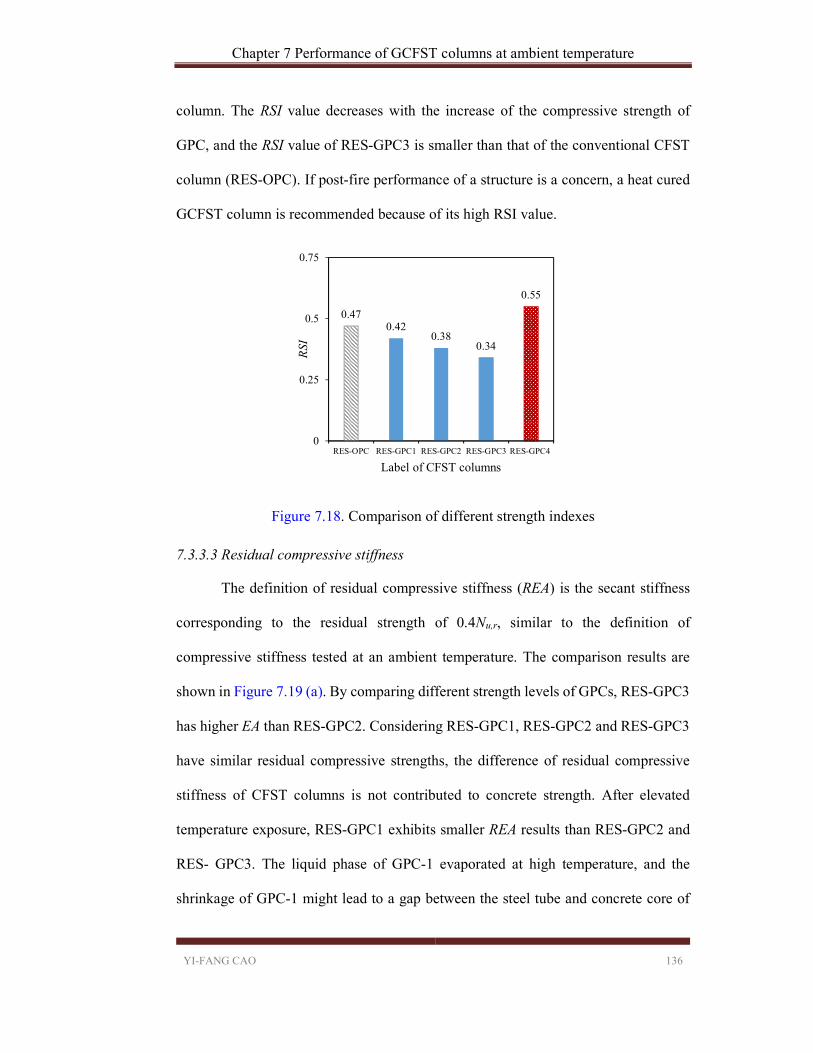
Chapter 7 Performance of GCFST columns at ambient temperature
YI-FANG CAO 136
column. The RSI value decreases with the increase of the compressive strength of
GPC, and the RSI value of RES-GPC3 is smaller than that of the conventional CFST
column (RES-OPC). If post-fire performance of a structure is a concern, a heat cured
GCFST column is recommended because of its high RSI value.
Figure 7.18. Comparison of different strength indexes
7.3.3.3 Residual compressive stiffness
The definition of residual compressive stiffness (REA) is the secant stiffness
corresponding to the residual strength of 0.4Nu,r, similar to the definition of
compressive stiffness tested at an ambient temperature. The comparison results are
shown in Figure 7.19 (a). By comparing different strength levels of GPCs, RES-GPC3
has higher EA than RES-GPC2. Considering RES-GPC1, RES-GPC2 and RES-GPC3
have similar residual compressive strengths, the difference of residual compressive
stiffness of CFST columns is not contributed to concrete strength. After elevated
temperature exposure, RES-GPC1 exhibits smaller REA results than RES-GPC2 and
RES- GPC3. The liquid phase of GPC-1 evaporated at high temperature, and the
shrinkage of GPC-1 might lead to a gap between the steel tube and concrete core of
0.470.42
0.380.34
0.55
0
0.25
0.5
0.75
RES-OPC RES-GPC1 RES-GPC2 RES-GPC3 RES-GPC4
RSI
Label of CFST columns

Chapter 7 Performance of GCFST columns at ambient temperature
YI-FANG CAO 137
RES-GPC1. The difference of the liquid content of GPC-1, GPC-2 and GPC-3 is
accounted for by the difference of compressive stiffness of GCFST columns after
elevated temperature exposure. The micro-crack development of the GPC-1 concrete
core decreases the secant modulus. In the comparison of the influence between
ambient cured GPC-2 and elevated cured GPC-4, RES-GPC4 has better behaviour than
RES-GPC2 which complies to the test results in Figure 7.18.
(a) Compressive stiffness
(b) Index of compressive stiffness
Figure 7.19. Comparison of compressive stiffness of CFST columns at ambient and
post-fire test
0
500000
1000000
1500000
OPC GPC1 GPC2 GPC3 GPC4
Res
idua
l com
pres
sive
sti
ffne
ss (
kN)
Type of CFST columns
Compressive stiffness at ambient test
Residual compressive stiffness at post-fire test
0.42
0.30.26
0.33
0.56
0
0.25
0.5
0.75
RES-OPC RES-GPC1 RES-GPC2 RES-GPC3 RES-GPC4
Inde
x of
com
pres
sive
stif
fnes
s
Label of CFST columns
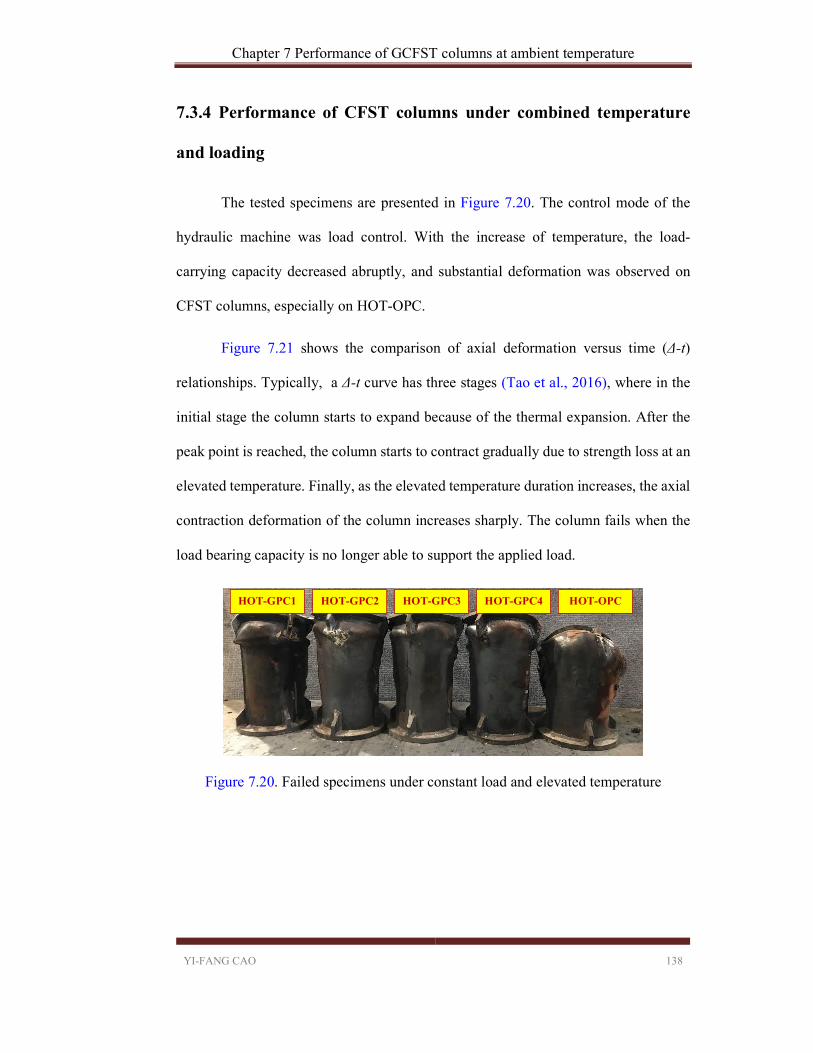
Chapter 7 Performance of GCFST columns at ambient temperature
YI-FANG CAO 138
7.3.4 Performance of CFST columns under combined temperature
and loading
The tested specimens are presented in Figure 7.20. The control mode of the
hydraulic machine was load control. With the increase of temperature, the load-
carrying capacity decreased abruptly, and substantial deformation was observed on
CFST columns, especially on HOT-OPC.
Figure 7.21 shows the comparison of axial deformation versus time (Δ-t)
relationships. Typically, a Δ-t curve has three stages (Tao et al., 2016), where in the
initial stage the column starts to expand because of the thermal expansion. After the
peak point is reached, the column starts to contract gradually due to strength loss at an
elevated temperature. Finally, as the elevated temperature duration increases, the axial
contraction deformation of the column increases sharply. The column fails when the
load bearing capacity is no longer able to support the applied load.
Figure 7.20. Failed specimens under constant load and elevated temperature
HOT-GPC1 HOT-GPC2 HOT-GPC3 HOT-GPC4 HOT-OPC
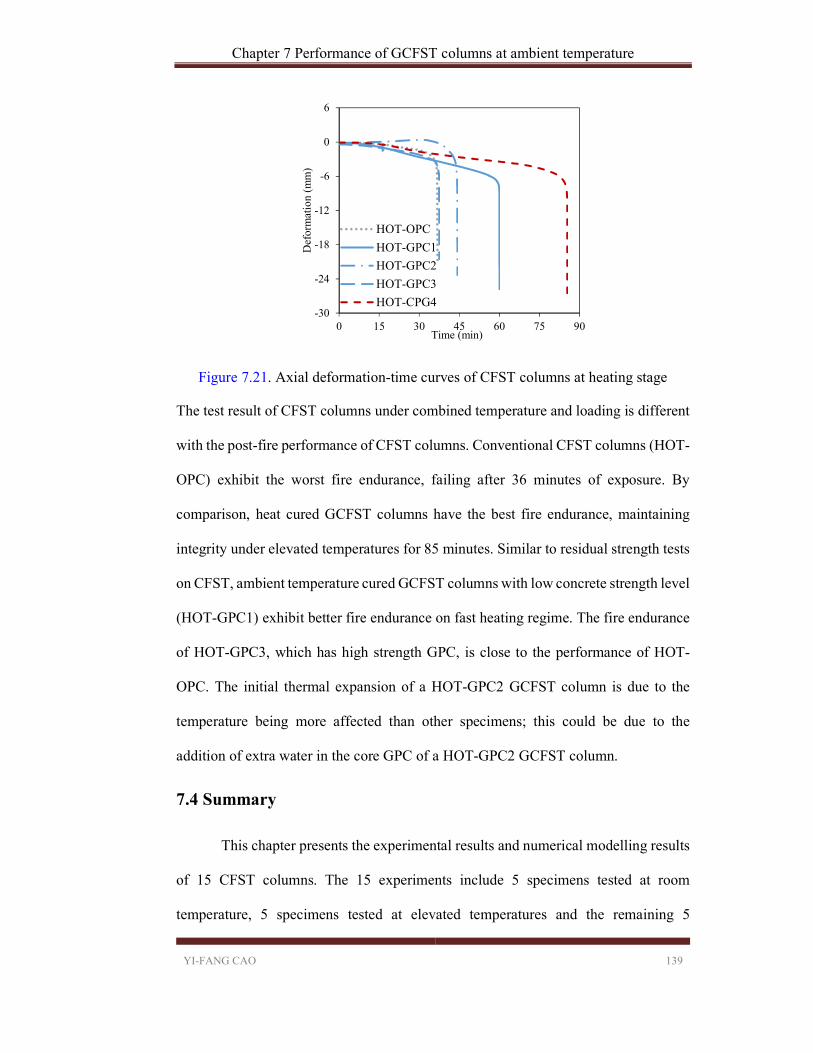
Chapter 7 Performance of GCFST columns at ambient temperature
YI-FANG CAO 139
Figure 7.21. Axial deformation-time curves of CFST columns at heating stage
The test result of CFST columns under combined temperature and loading is different
with the post-fire performance of CFST columns. Conventional CFST columns (HOT-
OPC) exhibit the worst fire endurance, failing after 36 minutes of exposure. By
comparison, heat cured GCFST columns have the best fire endurance, maintaining
integrity under elevated temperatures for 85 minutes. Similar to residual strength tests
on CFST, ambient temperature cured GCFST columns with low concrete strength level
(HOT-GPC1) exhibit better fire endurance on fast heating regime. The fire endurance
of HOT-GPC3, which has high strength GPC, is close to the performance of HOT-
OPC. The initial thermal expansion of a HOT-GPC2 GCFST column is due to the
temperature being more affected than other specimens; this could be due to the
addition of extra water in the core GPC of a HOT-GPC2 GCFST column.
7.4 Summary
This chapter presents the experimental results and numerical modelling results
of 15 CFST columns. The 15 experiments include 5 specimens tested at room
temperature, 5 specimens tested at elevated temperatures and the remaining 5
-30
-24
-18
-12
-6
0
6
0 15 30 45 60 75 90
Def
orm
atio
n (m
m)
Time (min)
HOT-OPC
HOT-GPC1
HOT-GPC2
HOT-GPC3
HOT-CPG4

Chapter 7 Performance of GCFST columns at ambient temperature
YI-FANG CAO 140
specimens tested for residual strength after exposure to elevated temperatures. The
following conclusions can be drawn within the scope of this study:
(1) The mechanical properties of GCFST columns, such as the axial load versus
axial strain curve and the ultimate strength index and lateral to axial strain
curve, are similar to those of conventional CFST columns. Two GCFST
columns exhibit higher ductility than conventional CFST columns on average,
while two GCFST columns have lower ductility than conventional CFST
columns.
(2) The existing FE model proposed by Tao et al. (2013) can be used to accurately
predict the loaddeformation curves of GCFST columns at ambient
temperature.
(3) GCFST columns exhibit better performance than the conventional CFST
columns under elevated temperatures. The residual strength of GCFST
columns were found slightly better than conventional CFST column. The fire
endurance of CFST columns under combined loading and elevated temperature
can be extensively improved by using GPC (especially heat cured GPC) as core
concrete.

Chapter 8 Conclusions and future research needs
YI-FANG CAO 141
Chapter 8 Conclusions and future research needs
8.1 Conclusions
This thesis has presented an in-depth study on the performance of GPC and the
behaviour of CFST columns with GPC at both ambient and elevated temperatures. In
relation to the objectives of this research, the major findings are summarised as follows:
(1) The addition of CAC in GPC can accelerate the geopolymerisation reaction
at an ambient temperature. With the addition of CAC, the heat-curing regime was
eliminated. The mechanical properties of the alkali-activated fly ash, blended with
CAC, are improved significantly.
(2) The optimal geopolymer mixture design can be achieved using the Taguchi
method. Alkali solution concentration plays a complex role; increasing the
concentration will improve compressive strength while it will decrease workability.
CAC replacement ratio is the most important factor for the mechanical properties. The
optimal addition amount of CAC is 10% by mass of fly ash. Activator to binder ratio
is crucial for workability; however, too much activator will diminish the compressive
strength. Considering both compressive strength and workability, the optimal design
is 10M alkali solution concentration, 10% CAC replacement and 45% activator to
binder ratio.
(3) The conversion test was conducted on GPM cylinders and GPP samples.
When undergoing a conversion test on a GPM specimen, there was no strength loss
after the specimen cured at an elevated temperature. The TGA test was conducted on
GPP samples, and no significant C3AH6 signal appeared on three GPP samples. The

Chapter 8 Conclusions and future research needs
YI-FANG CAO 142
strength test and material microstructure characterisations illustrate no severe risk of
conversion existing in GPC.
(4) Both test results on workability and density of GPC presented in this thesis
are comparable to those of conventional OPC. By varying the mixing designs of GPC,
the slump results of fresh GPCs can be improved from 55 mm to 210 mm. The
averaged density of hardened GPC is 2367.9 kg / m3.
(5) This thesis confirmed the Young’s modulus of GPC, tested by previous
researchers, is lower than that of OPC. With the addition of CAC, the Young’s
modulus tested in this thesis was higher than that of conventional GPC reported by
previous literature.
(6) The failure mode of GPM under elevated temperature was compared with
typical fracture patterns defined in ASTM C39. The fracture patterns of GPM tended
to form cones or diagonal fractures. Vertical cracks were less commonly observed than
shear failure cracks.
(7) A parameter analysis was conducted on the hot strength of GPM. The
results showed that activator concentration had little influence on the hot strength of
GPM. By raising the amount of CAC from 5% to 20%, the strength increased at 600
°C, but a decrease in strength was observed at 800 °C; similar observations were made
in regard to activator concentration: activator to binder ratio has little influence on the
hot strength.
(8) GPC exhibited much better hot strength performance than reference OPC
specimens. The residual strength of GPC was tested after exposure to elevated
temperatures, and GPC exhibited a similar performance to OPC. Further, the

Chapter 8 Conclusions and future research needs
YI-FANG CAO 143
deformation of GPC at high temperatures under a constant load was examined. OPC
failed earlier than geopolymer at 10 minutes in a brittle failure mode. The failure mode
of GPC is much more ductile than that of OPC, although a significant improvement
was not recorded on the duration time. The improved ductility makes the GPC safer
than OPC in the application building during fire condition. The stress-strain curves of
GPC and OPC were tested, and found to be similar, by the samples being exposed to
elevated temperatures and cooled for seven days.
(9) The mechanical properties of GCFST columns—including axial load
versus axial strain curve, ultimate strength index and lateral to axial strain curve—are
similar to those of the conventional CFST columns. Two GCFST columns exhibited
higher ductility than conventional CFST columns, while two GCFST columns
exhibited lower ductility.
(10) The existing FE model proposed by previous researchers can be used to
accurately predict the load-deformation curves of GCFST columns at an ambient
temperature.
(11) GCFST columns were found to exhibit better fire resistance than the
conventional CFST columns, whereas the residual strength of GCFST columns after
exposure to elevated temperatures was also slightly improved. The fire endurance of
CFST columns under combined loading and elevated temperature can be substantially
improved by using GPC (especially heat cured GPC) as core concrete.
8.2 Recommendations for future research
This thesis examined fire-resistant GPC and its application in CFST columns.
Although the objectives of this MPhil project have been successfully accomplished, a

Chapter 8 Conclusions and future research needs
YI-FANG CAO 144
number of issues could not be addressed due to equipment and time constraint. The
following recommendations are suggested for future research:
(1) Study of shrinkage, creep and durability of GPC, along with the correlation
between mechanical properties and durability of GPC.
(2) Study of the mechanical behaviour of GPC for a wider range of loading and
temperature regimes. In order to further understand the fire resistance of GPC, tests
need to be carried out on the thermal conductivity, capacity, diffusivity and coefficient
of thermal expansion of GPC. In addition, the visualisation of heat transfer by using a
thermal camera during the test can be investigated.
(3) The stress-strain curves of GPC under high temperatures should be
investigated. Further requiring consideration are the effects of various parameters such
as the aggregate type and size on the stress-strain curves of GPC. Studies of the
performance of GPC under bi-axial and tri-axial loading are also required to
understand the behaviour of this concrete under different loading conditions.
(4) Liquid alkali activated fly ash based GPC impedes the onsite application of
GPC. Future research should consider the powder alkali activated GPC for on-site
application.
(5) Further research is required to investigate the microscopic change of GPC
under elevated temperatures and after elevated temperature exposure. Such knowledge
is essential to providing a foundation for the future effort in improving the elevated
temperature performance of GPC.
(6) GCFST slender columns should be investigated in future work, as well as
the performance of such columns under eccentric loading.
References
YI-FANG CAO 145
References
2015. Standard Specification for Coal Fly Ash and Raw or Calcined Natural Pozzolan
for Use in Concrete. ASTM International. 318, A. C. Building Code Requirements for Structural Concrete (ACI 318-14): An
ACI Standard: Commentary on Building Code Requirements for Structural Concrete (ACI 318R-14), an ACI Report. 2015. American Concrete Institute.
AIRPORT, B. 1996. Brisbane International Terminal. ARIOZ, O. 2007. Effects of elevated temperatures on properties of concrete. Fire
safety journal, 42, 516-522. ASTM, C. 1996. 39, Standard test method for compressive strength of cylindrical
concrete specimens. Annual book of ASTM standards, 4. ATTARD, M. & SETUNGE, S. 1996. Stress-strain relationship of confined and
unconfined concrete. Materials Journal, 93, 432-442. AUSTRALIA, S. 2009. Concrete Structures (AS 3600-2009). BAKHAREV, T. 2005. Geopolymeric materials prepared using Class F fly ash and
elevated temperature curing. Cement and Concrete Research, 35, 1224-1232. BOONSERM, K., SATA, V., PIMRAKSA, K. & CHINDAPRASIRT, P. 2012.
Improved geopolymerization of bottom ash by incorporating fly ash and using waste gypsum as additive. Cement and Concrete Composites, 34, 819-824.
CAO, Y., TAO, Z., PAN, Z., MURPHY, T. & WUHRER, R. 2016a. Effect of calcium aluminate cement on workability and compressive strength of fly ash geopolymer mortar cured at ambient temperature. Mechanics of Structures and Materials: Advancements and Challenges. CRC Press.
CAO, Y., TAO, Z., PAN, Z., MURPHY, T. D. & WUHRER, R. Effect of calcium aluminate cement on workability and compressive strength of fly ash geopolymer mortar cured at ambient temperature. Mechanics of Structures and Materials: Advancements and Challenges: Proceedings of the 24th Australasian Conference on the Mechanics of Structures and Materials (ACMSM24), Perth, Australia, 6-9 December 2016, 2016b. 927-932.
CARREIRA, D. J. & CHU, K.-H. Stress-strain relationship for plain concrete in compression. Journal Proceedings, 1985. 797-804.
CHANG, Y.-F., CHEN, Y.-H., SHEU, M.-S. & YAO, G. C. 2006. Residual stress–strain relationship for concrete after exposure to high temperatures. Cement and Concrete Research, 36, 1999-2005.
CHENG, F.-P., KODUR, V. & WANG, T.-C. 2004. Stress-strain curves for high strength concrete at elevated temperatures. Journal of Materials in Civil Engineering, 16, 84-90.
CHENG, T. & CHIU, J. 2003. Fire-resistant geopolymer produced by granulated blast furnace slag. Minerals Engineering, 16, 205-210.
CHINDAPRASIRT, P., RATTANASAK, U., VONGVORADIT, P. & JENJIRAPANYA, S. 2012. Thermal treatment and utilization of Al-rich waste in high calcium fly ash geopolymeric materials. International Journal of Minerals, Metallurgy, and Materials, 19, 872-878.

References
YI-FANG CAO 146
COLLINS, F. & SANJAYAN, J. 1999. Strength and shrinkage properties of alkali-activated slag concrete placed into a large column. Cement and concrete research, 29, 659-666.
COLLINS, M. P., MITCHELL, D. & MACGREGOR, J. G. 1993. Structural design considerations for high-strength concrete. Concrete international, 15, 27-34.
COMMITEE, A. 2003. C09. ASTM C33-03, Standard Spesification for Concrete Agregates. ASTM International.
CONNOLLY, R. J. 1995. The spalling of concrete in fires. Aston University. CROZIER, D. & SANJAYAN, J. 1999. Chemical and physical degradation of
concrete at elevated temperatures. Concrete in Australia, 25, 18-20. DAVIDOVITS, J. 1991. Geopolymers: inorganic polymeric new materials. Journal of
Thermal Analysis and calorimetry, 37, 1633-1656. DAVIDOVITS, J. 1993. Geopolymer cements to minimise carbon-dioxide
greenhouse-warming. Ceram. Trans., 37, 165-182. DEXIN, X. 2012. Structural Behaviour of Concrete Filled Steel Tubes With High
Strength Materials. DING, J., FU, Y. & BEAUDOIN, J. 1996a. Study of hydration mechanisms in the high
alumina cement-sodium silicate system. Cement and concrete research, 26, 799-804.
DING, J., FU, Y. & BEAUDOINT, J. 1996b. Effect of different inorganic salts/alkali on conversion-prevention in high alumina cement products. Advanced cement based materials, 4, 43-47.
DUXSON, P., FERNÁNDEZ-JIMÉNEZ, A., PROVIS, J. L., LUKEY, G. C., PALOMO, A. & VAN DEVENTER, J. 2007. Geopolymer technology: the current state of the art. Journal of Materials Science, 42, 2917-2933.
EN, C. 2004. 1–1. Eurocode 4: design of composite steel and concrete structures—Part 1.1: General rules and rules for buildings. Brussels: European Committee for Standardization.
ESPINOS, A., ROMERO, M. L., HOSPITALER, A., PASCUAL, A. M. & ALBERO, V. Advanced materials for concrete-filled tubular columns and connections. Structures, 2015. Elsevier, 105-113.
EUROCODE, C. 2004. 8: Design of structures for earthquake resistance—Part 1: General rules, seismic actions and rules for buildings (EN 1998-1: 2004). European Committee for Normalization, Brussels.
FERNÁNDEZ-JIMÉNEZ, A. & PALOMO, A. 2005. Composition and microstructure of alkali activated fly ash binder: effect of the activator. Cement and concrete research, 35, 1984-1992.
FERNÁNDEZ-JIMÉNEZ, A. & PUERTAS, F. 1997. Alkali-activated slag cements: kinetic studies. Cement and Concrete Research, 27, 359-368.
FERNANDEZ-JIMENEZ, A. M., PALOMO, A. & LOPEZ-HOMBRADOS, C. 2006. Engineering properties of alkali-activated fly ash concrete. ACI Materials Journal, 103, 106.
FERNÁNDEZ‐JIMÉNEZ, A., PALOMO, A., PASTOR, J. Y. & MARTIN, A. 2008a. New Cementitious Materials Based on Alkali‐Activated Fly Ash: Performance at High Temperatures. Journal of the American Ceramic Society, 91, 3308-3314.
FERNÁNDEZ‐ JIMÉNEZ, A., PALOMO, A., VAZQUEZ, T., VALLEPU, R., TERAI, T. & IKEDA, K. 2008b. Alkaline activation of blends of metakaolin
References
YI-FANG CAO 147
and calcium aluminate. Journal of the American Ceramic Society, 91, 1231-1236.
GÖRHAN, G. & KÜRKLÜ, G. 2014. The influence of the NaOH solution on the properties of the fly ash-based geopolymer mortar cured at different temperatures. Composites part b: engineering, 58, 371-377.
GUERRIERI, M. & SANJAYAN, J. G. 2010. Behavior of combined fly ash/slag‐based geopolymers when exposed to high temperatures. Fire and materials, 34, 163-175.
HAN, L.-H., LI, W. & BJORHOVDE, R. 2014. Developments and advanced applications of concrete-filled steel tubular (CFST) structures: Members. Journal of Constructional Steel Research, 100, 211-228.
HAN, L.-H., WANG, W.-H. & YU, H.-X. 2010. Experimental behaviour of reinforced concrete (RC) beam to concrete-filled steel tubular (CFST) column frames subjected to ISO-834 standard fire. Engineering Structures, 32, 3130-3144.
HANJITSUWAN, S., PHOO-NGERNKHAM, T. & DAMRONGWIRIYANUPAP, N. 2017. Comparative study using Portland cement and calcium carbide residue as a promoter in bottom ash geopolymer mortar. Construction and Building Materials, 133, 128-134.
HARDJITO, D. 2005. Studies of fly ash-based geopolymer concrete. HARDJITO, D. & RANGAN, B. V. 2005. Development and properties of low-
calcium fly ash-based geopolymer concrete. HEAH, C., KAMARUDIN, H., AL BAKRI, A. M., BINHUSSAIN, M., LUQMAN,
M., NIZAR, I. K., RUZAIDI, C. & LIEW, Y. 2011. Effect of curing profile on kaolin-based geopolymers. Physics Procedia, 22, 305-311.
HEWLETT, P. 2003. Lea's chemistry of cement and concrete, Butterworth-Heinemann.
HUO, J., ZHANG, J., WANG, Z. & XIAO, Y. 2013. Effects of sustained axial load and cooling phase on post-fire behaviour of reinforced concrete stub columns. Fire Safety Journal, 59, 76-87.
HUSSIN, M., BHUTTA, M., AZREEN, M., RAMADHANSYAH, P. & MIRZA, J. 2015. Performance of blended ash geopolymer concrete at elevated temperatures. Materials and Structures, 48, 709-720.
JAMBUNATHAN, N., SANJAYAN, J., PAN, Z., LI, G., LIU, Y., KORAYEM, A., DUAN, W. & COLLINS, F. 2013a. The role of alumina on performance of alkali-activated slag paste exposed to 50 C. Cement and Concrete Research, 54, 143-150.
JAMBUNATHAN, N., SANJAYAN, J. G., PAN, Z., LI, G., LIU, Y., KORAYEM, A. H., DUAN, W. & COLLINS, F. 2013b. The role of alumina on performance of alkali-activated slag paste exposed to 50° C. Cement and Concrete Research, 54, 143-150.
JARKAS, A. 2012. Influence of Buildability Factors on Rebar Installation Labor Productivity of Columns. Journal of Construction Engineering and Management, 138, 258-267.
JAVIDAN, F., HEIDARPOUR, A., ZHAO, X.-L., HUTCHINSON, C. R. & MINKKINEN, J. 2016. Effect of weld on the mechanical properties of high strength and ultra-high strength steel tubes in fabricated hybrid sections. Engineering Structures, 118, 16-27.

References
YI-FANG CAO 148
JUNAID, M. T., KAYALI, O. & KHENNANE, A. 2017. Response of alkali activated low calcium fly-ash based geopolymer concrete under compressive load at elevated temperatures. Materials and Structures, 50, 50.
JUNAID, M. T., KHENNANE, A. & KAYALI, O. 2015. Performance of fly ash based geopolymer concrete made using non-pelletized fly ash aggregates after exposure to high temperatures. Materials and Structures, 48, 3357-3365.
KHAN, M., CASTEL, A., AKBARNEZHAD, A., FOSTER, S. J. & SMITH, M. 2016a. Utilisation of steel furnace slag coarse aggregate in a low calcium fly ash geopolymer concrete. Cement and Concrete Research, 89, 220-229.
KHAN, M., SHAIKH, F., HAO, Y. & HAO, H. 2016b. Workability and compressive strength properties of high strength geopolymer mortars. Mechanics of Structures and Materials: Advancements and Challenges. CRC Press.
KHAN, M. Z. N., HAO, Y. & HAO, H. 2016c. Synthesis of high strength ambient cured geopolymer composite by using low calcium fly ash. Construction and Building Materials, 125, 809-820.
KıRCA, Ö., YAMAN, İ. Ö. & TOKYAY, M. 2013. Compressive strength development of calcium aluminate cement–GGBFS blends. Cement and Concrete Composites, 35, 163-170.
LEE, N. & LEE, H. 2013. Setting and mechanical properties of alkali-activated fly ash/slag concrete manufactured at room temperature. Construction and Building Materials, 47, 1201-1209.
LEE, W. & VAN DEVENTER, J. 2004. The interface between natural siliceous aggregates and geopolymers. Cement and Concrete Research, 34, 195-206.
LI, C., SUN, H. & LI, L. 2010. A review: The comparison between alkali-activated slag (Si+ Ca) and metakaolin (Si+ Al) cements. Cement and Concrete Research, 40, 1341-1349.
LI, Y., LIU, X., YUAN, J. & WU, M. 2015. Toughness improvement of epoxy resin mortar by incorporation of ground calcium carbonate. Construction and Building Materials, 100, 122-128.
LIM, J. C. & OZBAKKALOGLU, T. 2014. Stress–strain model for normal-and light-weight concretes under uniaxial and triaxial compression. Construction and Building Materials, 71, 492-509.
LU, H., ZHAO, X.-L. & HAN, L.-H. 2011. FE modelling and fire resistance design of concrete filled double skin tubular columns. Journal of Constructional Steel Research, 67, 1733-1748.
MIJARSH, M., JOHARI, M. M. & AHMAD, Z. 2014. Synthesis of geopolymer from large amounts of treated palm oil fuel ash: application of the Taguchi method in investigating the main parameters affecting compressive strength. Construction and Building Materials, 52, 473-481.
MULTIPLEX 2005. Latitude. NATH, P. & SARKER, P. K. 2014. Effect of GGBFS on setting, workability and early
strength properties of fly ash geopolymer concrete cured in ambient condition. Construction and Building Materials, 66, 163-171.
NATH, P. & SARKER, P. K. 2015. Use of OPC to improve setting and early strength properties of low calcium fly ash geopolymer concrete cured at room temperature. Cement and Concrete Composites, 55, 205-214.

References
YI-FANG CAO 149
NEMATOLLAHI, B. & SANJAYAN, J. 2014. Effect of different superplasticizers and activator combinations on workability and strength of fly ash based geopolymer. Materials & Design, 57, 667-672.
NEVILLE, A. M. 1995. Properties of concrete, Longman London. NGUYEN, K. T., AHN, N., LE, T. A. & LEE, K. 2016. Theoretical and experimental
study on mechanical properties and flexural strength of fly ash-geopolymer concrete. Construction and Building Materials, 106, 65-77.
NICOLO, B. D., PANI, L. & POZZO, E. 1994. Strain of concrete at peak compressive stress for a wide range of compressive strengths. Materials and Structures, 27, 2206-210.
NOUSHINI, A., ASLANI, F., CASTEL, A., GILBERT, R. I., UY, B. & FOSTER, S. 2016. Compressive stress-strain model for low-calcium fly ash-based geopolymer and heat-cured Portland cement concrete. Cement and Concrete Composites, 73, 136-146.
OLIVIA, M. 2011. Durability related properties of low calcium fly ash based geopolymer concrete. Curtin University.
PACEWSKA, B., NOWACKA, M., WILIŃSKA, I., KUBISSA, W. & ANTONOVICH, V. 2011. Studies on the influence of spent FCC catalyst on hydration of calcium aluminate cements at ambient temperature. Journal of thermal analysis and calorimetry, 105, 129-140.
PACHECO-TORGAL, F., CASTRO-GOMES, J. & JALALI, S. 2007. Investigations about the effect of aggregates on strength and microstructure of geopolymeric mine waste mud binders. Cement and Concrete Research, 37, 933-941.
PALOMO, A., GRUTZECK, M. & BLANCO, M. 1999. Alkali-activated fly ashes: a cement for the future. Cement and concrete research, 29, 1323-1329.
PAN, Z. & SANJAYAN, J. G. 2012. Factors influencing softening temperature and hot-strength of geopolymers. Cement and Concrete Composites, 34, 261-264.
PAN, Z., SANJAYAN, J. G. & RANGAN, B. V. 2009. An investigation of the mechanisms for strength gain or loss of geopolymer mortar after exposure to elevated temperature. Journal of Materials Science, 44, 1873-1880.
PAN, Z., SANJAYAN, J. G. & RANGAN, B. V. 2011. Fracture properties of geopolymer paste and concrete. Magazine of concrete research, 63, 763-771.
POPOVICS, S. 1973. A numerical approach to the complete stress-strain curve of concrete. Cement and concrete research, 3, 583-599.
PROVIS, J. L. & VAN DEVENTER, J. S. 2014. Alkali activated materials, Springer. PUERTAS, F., MARTıNEZ-RAMıREZ, S., ALONSO, S. & VAZQUEZ, T. 2000.
Alkali-activated fly ash/slag cements: strength behaviour and hydration products. Cement and Concrete Research, 30, 1625-1632.
PULIGILLA, S. & MONDAL, P. 2013. Role of slag in microstructural development and hardening of fly ash-slag geopolymer. Cement and Concrete Research, 43, 70-80.
REIG, L., SORIANO, L., BORRACHERO, M., MONZÓ, J. & PAYÁ, J. 2016. Influence of calcium aluminate cement (CAC) on alkaline activation of red clay brick waste (RCBW). Cement and Concrete Composites, 65, 177-185.
RICKARD, W. D., GLUTH, G. J. & PISTOL, K. 2016. In-situ thermo-mechanical testing of fly ash geopolymer concretes made with quartz and expanded clay aggregates. Cement and Concrete Research, 80, 33-43.
References
YI-FANG CAO 150
RICKARD, W. D. & VAN RIESSEN, A. 2014. Performance of solid and cellular structured fly ash geopolymers exposed to a simulated fire. Cement and Concrete Composites, 48, 75-82.
RIVERA, O., LONG, W., WEISS JR, C., MOSER, R., WILLIAMS, B., TORRES-CANCEL, K., GORE, E. & ALLISON, P. 2016. Effect of elevated temperature on alkali-activated geopolymeric binders compared to portland cement-based binders. Cement and Concrete Research, 90, 43-51.
ROSS, P. J. 1988. Taguchi methods for quality engineering. McGraw-Hill, New York. ROVNANÍK, P. 2010. Effect of curing temperature on the development of hard
structure of metakaolin-based geopolymer. Construction and Building Materials, 24, 1176-1183.
SAMANI, A. K. & ATTARD, M. M. 2012. A stress–strain model for uniaxial and confined concrete under compression. Engineering Structures, 41, 335-349.
SANJAYAN, G. & STOCKS, L. 1993. Spalling of high-strength silica fume concrete in fire. Materials Journal, 90, 170-173.
SARGIN, M., GHOSH, S. & HANDA, V. 1971. Effects of lateral reinforcement upon the strength and deformation properties of concrete. Magazine of concrete research, 23, 99-110.
SARKER, P. K. & MCBEATH, S. 2015. Fire endurance of steel reinforced fly ash geopolymer concrete elements. Construction and Building Materials, 90, 91-98.
SATHONSAOWAPHAK, A., CHINDAPRASIRT, P. & PIMRAKSA, K. 2009. Workability and strength of lignite bottom ash geopolymer mortar. Journal of Hazardous Materials, 168, 44-50.
SHAIKH, F. & VIMONSATIT, V. 2015. Compressive strength of fly‐ash‐based geopolymer concrete at elevated temperatures. Fire and Materials, 39, 174-188.
SHAIKH, F. U. A. & HOSAN, A. 2016. Mechanical properties of steel fibre reinforced geopolymer concretes at elevated temperatures. Construction and Building Materials, 114, 15-28.
SHEHAB, H. K., EISA, A. S. & WAHBA, A. M. 2016. Mechanical properties of fly ash based geopolymer concrete with full and partial cement replacement. Construction and Building Materials, 126, 560-565.
SHI, C., JIMÉNEZ, A. F. & PALOMO, A. 2011. New cements for the 21st century: the pursuit of an alternative to Portland cement. Cement and concrete research, 41, 750-763.
SHI, X.-S., WANG, Q.-Y., ZHAO, X.-L. & COLLINS, F. G. 2015. Structural behaviour of geopolymeric recycled concrete filled steel tubular columns under axial loading. Construction and Building Materials, 81, 187-197.
SHOAIB, M., AHMED, S. & BALAHA, M. 2001. Effect of fire and cooling mode on the properties of slag mortars. Cement and Concrete Research, 31, 1533-1538.
SOFI, M., VAN DEVENTER, J., MENDIS, P. & LUKEY, G. 2007. Engineering properties of inorganic polymer concretes (IPCs). Cement and Concrete Research, 37, 251-257.
SOMNA, K., JATURAPITAKKUL, C., KAJITVICHYANUKUL, P. & CHINDAPRASIRT, P. 2011. NaOH-activated ground fly ash geopolymer cured at ambient temperature. Fuel, 90, 2118-2124.

References
YI-FANG CAO 151
SONG, T.-Y., HAN, L.-H. & UY, B. 2010. Performance of CFST column to steel beam joints subjected to simulated fire including the cooling phase. Journal of constructional steel research, 66, 591-604.
STANDARD, A. C78, 2010,“Standard Test Method for Flexural Strength of Concrete (Using Simple Beam with Third-Point Loading)", ASTM International, West Conshohocken, PA, 2010, DOI: 10.1520/C0078_C0078M-10.
STANDARD, A. C496 (2003). Standard Test Method for Splitting Tensile Strength of Cylindrical Concrete Specimens. Annual Book of ASTM Standards, 4.
STANDARD, A. 1997. Methods for fire tests on building materials, componets and structures. Part 4: Fire-resistance test of elements of construction. AS1530, 4.
STANDARD, A. 2002. C469 (2002) Standard test method for static modulus of elasticity and Poisson’s ratio of concrete in compression. ASTM International, West Conshohocken, PA. doi, 10, 1520.
TAKE, C. slump tests for every test cylinders in accordance with ANSI. ASTM C143. TALABÉR, J. 1993. FACTORS ACCELERATING TRANSFORMATION OF HIGH
ALUMINA CEMENTS. Periodica Polytechnica. Civil Engineering, 37, 345. TAO, Z., GHANNAM, M., SONG, T.-Y. & HAN, L.-H. 2016. Experimental and
numerical investigation of concrete-filled stainless steel columns exposed to fire. Journal of Constructional Steel Research, 118, 120-134.
TAO, Z. & HAN, L.-H. 2007. Behaviour of fire-exposed concrete-filled steel tubular beam columns repaired with CFRP wraps. Thin-walled structures, 45, 63-76.
TAO, Z., WANG, X.-Q. & UY, B. 2012. Stress-strain curves of structural and reinforcing steels after exposure to elevated temperatures. Journal of Materials in Civil Engineering, 25, 1306-1316.
TAO, Z., WANG, Z.-B. & YU, Q. 2013. Finite element modelling of concrete-filled steel stub columns under axial compression. Journal of Constructional Steel Research, 89, 121-131.
VARMA, A. H., RICLES, J. M., SAUSE, R. & LU, L.-W. 2002. Experimental behavior of high strength square concrete-filled steel tube beam-columns. Journal of Structural Engineering, 128, 309-318.
WANG, W.-H., HAN, L.-H., LI, W. & JIA, Y.-H. 2014. Behavior of concrete-filled steel tubular stub columns and beams using dune sand as part of fine aggregate. Construction and Building Materials, 51, 352-363.
WANG, Y. C. 2003. Steel and composite structures: Behaviour and design for fire safety, CRC Press.
WANG, Z.-B., TAO, Z., HAN, L.-H., UY, B., LAM, D. & KANG, W.-H. 2017. Strength, stiffness and ductility of concrete-filled steel columns under axial compression. Engineering Structures, 135, 209-221.
WEE, T., CHIN, M. & MANSUR, M. 1996. Stress-strain relationship of high-strength concrete in compression. Journal of Materials in Civil Engineering, 8, 70-76.
WU, Z. & NAIK, T. R. 2003. Chemically activated blended cements. Materials Journal, 100, 434-440.
XU, H. & VAN DEVENTER, J. 2000. The geopolymerisation of alumino-silicate minerals. International Journal of Mineral Processing, 59, 247-266.
YANG, K.-H., MUN, J.-H., CHO, M.-S. & KANG, T. H. 2014. Stress-strain model for various unconfined concretes in compression. ACI Structural Journal, 111, 819.

References
YI-FANG CAO 152
YANG, Y.-F., CAO, K. & WANG, T.-Z. 2013. Experimental behavior of CFST stub columns after being exposed to freezing and thawing. Cold Regions Science and Technology, 89, 7-21.
YIN, J., ZHA, X.-X. & LI, L.-Y. 2006. Fire resistance of axially loaded concrete filled steel tube columns. Journal of Constructional Steel Research, 62, 723-729.
YOUNG, B. & ELLOBODY, E. 2006. Experimental investigation of concrete-filled cold-formed high strength stainless steel tube columns. Journal of Constructional Steel Research, 62, 484-492.
YU, X., TAO, Z. & SONG, T.-Y. 2016. Effect of different types of aggregates on the performance of concrete-filled steel tubular stub columns. Materials and Structures, 49, 3591-3605.