
Nguyen anh duong geopolymer seminar.pptx - Geopolymer Institute
Upload
independentCategory
view
1download
0
Energy Conversion and Management 51 (2010) 677–684
Contents lists available at ScienceDirect
Energy Conversion and Management
journal homepage: www.elsevier .com/ locate /enconman
Effects of microstructure characteristics of gas diffusion layer and microporouslayer on the performance of PEMFC
Chung-Jen Tseng *, Shih-Kun LoDepartment of Mechanical Engineering, National Central University, Chungli, Taoyuan 320, Taiwan
a r t i c l e i n f o a b s t r a c t
Article history:Received 6 April 2009Accepted 7 November 2009Available online 25 November 2009
Keywords:Gas diffusion layerMicroporous layerFuel cell
0196-8904/$ - see front matter � 2009 Elsevier Ltd. Adoi:10.1016/j.enconman.2009.11.011
* Corresponding author. Tel.: +886 3 4267348.E-mail address: [email protected] (C.-J. Tseng).
Water management is an important issue in proton exchange membrane (PEM) fuel cell design and oper-ation. The purpose of this work is to investigate the effects of the microstructure characteristics of the gasdiffusion layer (GDL) and microporous layer (MPL), including pore size distribution, hydrophobic treat-ment, gas permeability, and other factors, on the water management and performance of a PEM fuel cell.
A commercial catalyst-coated membrane with an active area of 25 cm2 is used along with a GDL and anMPL for assembling a single cell. The effects of the MPL, the thickness of the MPL, the PTFE loading of car-bon paper and MPL, and the baking time of the MPL have been investigated. Results show that the addi-tion of MPL increases cell performance in the high current density region due to the elimination of masstransfer limitation. There exists an optimum thickness of MPL. Furthermore, increasing the MPL bakingtime enhances cell performance due to enlarged pore size and permeability.
� 2009 Elsevier Ltd. All rights reserved.
1. Introduction
Proton exchange membrane fuel cells (PEMFCs) convert thechemical energy of a fuel directly into electricity in an electro-chemical reaction. PEMFCs are a viable alternative for environ-ment-friendly and efficient power production and have a widerange of potential applications. In terms of environmental and glo-bal energy problems, the replacement of fossil fuels by renewableenergy is being considered all over the world. The fuel cell as a re-vived energy technology is believed to be an ideal energy systembecause of its high conversion efficiency and excellent regenerativeand zero-emission properties. However, like many emerging en-ergy technologies, PEMFCs must overcome certain engineeringand economic obstacles if they are to ever become commerciallyand popularly viable. Therefore, in order to ensure, without spatialconcession, high power for a commercial-scale system, it is pre-dicted that fuel cell operation at high current density conditionsper unit electrode area will be necessary.
Fig. 1 depicts the schematic diagram of the configuration andmass transport mechanism in the membrane electrode assembly(MEA) and flow channels. Water vapor or liquid water, along withhydrogen and oxygen gases, enters and exits through the diffusionpath in the electrode. Electrodes for a PEMFC have, in general, two-or three-layered structures that can be divided into two parts, onecatalytic and the other noncatalytic. The catalytic part is the cata-lyst layer. It is formed by depositing a mixture of a carbon-sup-
ll rights reserved.
ported platinum catalyst. A hydrophobic gas diffusion layer(GDL) and sometimes an additional microporous layer (MPL) areplaced between the catalyst layer and the flow channel plate.Although the GDL and MPL have no electrochemical reaction sites,they are known to play an important role in providing the reac-tants a good access to the catalytic sites and in the effective re-moval of product water from the electrode.
Mass transport problems in a PEMFC can be classified into threecategories: (1) water flooding, i.e., the liquid water entrapped insidethe electrodes or flow channels interrupts the flux of the reactant/product gases; (2) dilution of oxidant concentration due to the useof air instead of pure oxygen; and (3) depletion of reactants alongthe flow channel, which results in a nonuniform current distributionover the whole electrode area and is particularly severe in a large-scale fuel cell [1]. Appropriate water management is critical in orderto obtain a stable cell performance of the PEMFC. On one hand,water is needed to hydrate the ionically conducting membraneand the ionic conductor in the catalyst layer for proton conductance.That is, the higher the water content, the better is the ionic conduc-tivity. Water can be introduced by external humidification and as aproduct of the oxygen reduction reaction at the cathode side. On theother hand, this water can flood the pores in the catalyst layers aswell as those in the gas diffusion layers, resulting in a higher masstransport resistance. That is, the less the water content, the loweris the resistance to reactant flow. Clearly, water plays a conflictingrole; therefore, appropriate water management is required.
The GDL is usually made of either a nonwoven carbon paperor a woven carbon cloth due to its high porosity and electricconductivity. Even if the MEA based on a carbon cloth has a higher
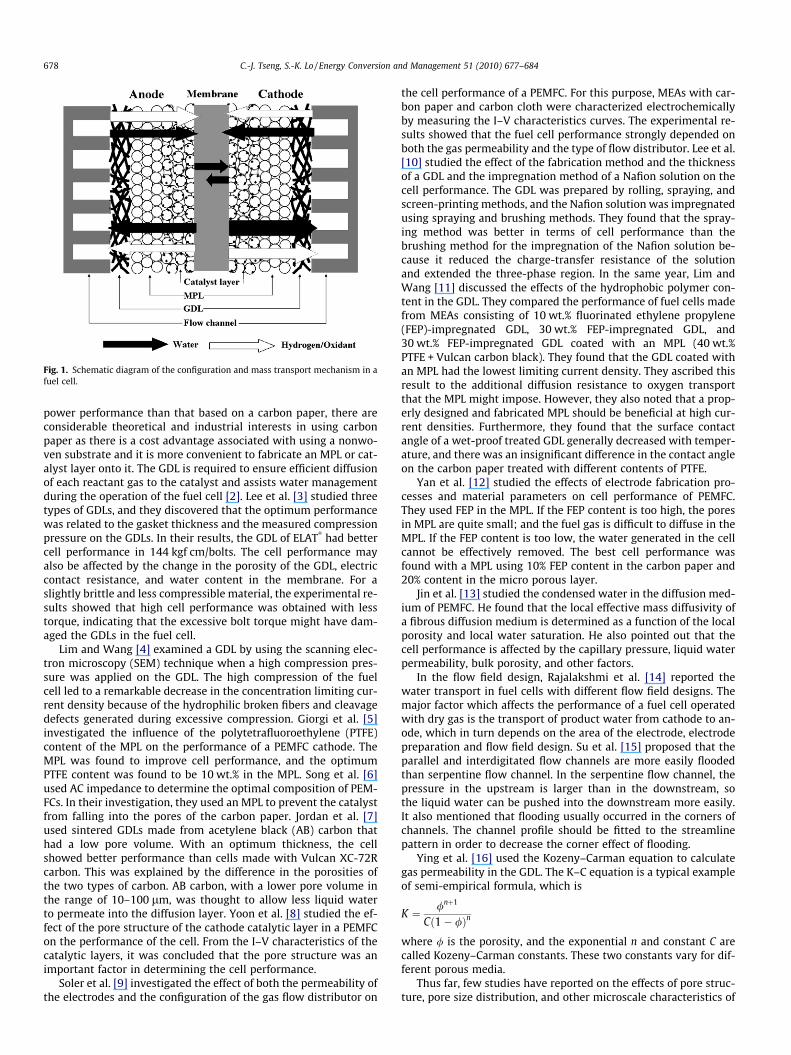
Fig. 1. Schematic diagram of the configuration and mass transport mechanism in afuel cell.
678 C.-J. Tseng, S.-K. Lo / Energy Conversion and Management 51 (2010) 677–684
power performance than that based on a carbon paper, there areconsiderable theoretical and industrial interests in using carbonpaper as there is a cost advantage associated with using a nonwo-ven substrate and it is more convenient to fabricate an MPL or cat-alyst layer onto it. The GDL is required to ensure efficient diffusionof each reactant gas to the catalyst and assists water managementduring the operation of the fuel cell [2]. Lee et al. [3] studied threetypes of GDLs, and they discovered that the optimum performancewas related to the gasket thickness and the measured compressionpressure on the GDLs. In their results, the GDL of ELAT
�had better
cell performance in 144 kgf cm/bolts. The cell performance mayalso be affected by the change in the porosity of the GDL, electriccontact resistance, and water content in the membrane. For aslightly brittle and less compressible material, the experimental re-sults showed that high cell performance was obtained with lesstorque, indicating that the excessive bolt torque might have dam-aged the GDLs in the fuel cell.
Lim and Wang [4] examined a GDL by using the scanning elec-tron microscopy (SEM) technique when a high compression pres-sure was applied on the GDL. The high compression of the fuelcell led to a remarkable decrease in the concentration limiting cur-rent density because of the hydrophilic broken fibers and cleavagedefects generated during excessive compression. Giorgi et al. [5]investigated the influence of the polytetrafluoroethylene (PTFE)content of the MPL on the performance of a PEMFC cathode. TheMPL was found to improve cell performance, and the optimumPTFE content was found to be 10 wt.% in the MPL. Song et al. [6]used AC impedance to determine the optimal composition of PEM-FCs. In their investigation, they used an MPL to prevent the catalystfrom falling into the pores of the carbon paper. Jordan et al. [7]used sintered GDLs made from acetylene black (AB) carbon thathad a low pore volume. With an optimum thickness, the cellshowed better performance than cells made with Vulcan XC-72Rcarbon. This was explained by the difference in the porosities ofthe two types of carbon. AB carbon, with a lower pore volume inthe range of 10–100 lm, was thought to allow less liquid waterto permeate into the diffusion layer. Yoon et al. [8] studied the ef-fect of the pore structure of the cathode catalytic layer in a PEMFCon the performance of the cell. From the I–V characteristics of thecatalytic layers, it was concluded that the pore structure was animportant factor in determining the cell performance.
Soler et al. [9] investigated the effect of both the permeability ofthe electrodes and the configuration of the gas flow distributor on
the cell performance of a PEMFC. For this purpose, MEAs with car-bon paper and carbon cloth were characterized electrochemicallyby measuring the I–V characteristics curves. The experimental re-sults showed that the fuel cell performance strongly depended onboth the gas permeability and the type of flow distributor. Lee et al.[10] studied the effect of the fabrication method and the thicknessof a GDL and the impregnation method of a Nafion solution on thecell performance. The GDL was prepared by rolling, spraying, andscreen-printing methods, and the Nafion solution was impregnatedusing spraying and brushing methods. They found that the spray-ing method was better in terms of cell performance than thebrushing method for the impregnation of the Nafion solution be-cause it reduced the charge-transfer resistance of the solutionand extended the three-phase region. In the same year, Lim andWang [11] discussed the effects of the hydrophobic polymer con-tent in the GDL. They compared the performance of fuel cells madefrom MEAs consisting of 10 wt.% fluorinated ethylene propylene(FEP)-impregnated GDL, 30 wt.% FEP-impregnated GDL, and30 wt.% FEP-impregnated GDL coated with an MPL (40 wt.%PTFE + Vulcan carbon black). They found that the GDL coated withan MPL had the lowest limiting current density. They ascribed thisresult to the additional diffusion resistance to oxygen transportthat the MPL might impose. However, they also noted that a prop-erly designed and fabricated MPL should be beneficial at high cur-rent densities. Furthermore, they found that the surface contactangle of a wet-proof treated GDL generally decreased with temper-ature, and there was an insignificant difference in the contact angleon the carbon paper treated with different contents of PTFE.
Yan et al. [12] studied the effects of electrode fabrication pro-cesses and material parameters on cell performance of PEMFC.They used FEP in the MPL. If the FEP content is too high, the poresin MPL are quite small; and the fuel gas is difficult to diffuse in theMPL. If the FEP content is too low, the water generated in the cellcannot be effectively removed. The best cell performance wasfound with a MPL using 10% FEP content in the carbon paper and20% content in the micro porous layer.
Jin et al. [13] studied the condensed water in the diffusion med-ium of PEMFC. He found that the local effective mass diffusivity ofa fibrous diffusion medium is determined as a function of the localporosity and local water saturation. He also pointed out that thecell performance is affected by the capillary pressure, liquid waterpermeability, bulk porosity, and other factors.
In the flow field design, Rajalakshmi et al. [14] reported thewater transport in fuel cells with different flow field designs. Themajor factor which affects the performance of a fuel cell operatedwith dry gas is the transport of product water from cathode to an-ode, which in turn depends on the area of the electrode, electrodepreparation and flow field design. Su et al. [15] proposed that theparallel and interdigitated flow channels are more easily floodedthan serpentine flow channel. In the serpentine flow channel, thepressure in the upstream is larger than in the downstream, sothe liquid water can be pushed into the downstream more easily.It also mentioned that flooding usually occurred in the corners ofchannels. The channel profile should be fitted to the streamlinepattern in order to decrease the corner effect of flooding.
Ying et al. [16] used the Kozeny–Carman equation to calculategas permeability in the GDL. The K–C equation is a typical exampleof semi-empirical formula, which is
K ¼ /nþ1
Cð1� /Þn
where / is the porosity, and the exponential n and constant C arecalled Kozeny–Carman constants. These two constants vary for dif-ferent porous media.
Thus far, few studies have reported on the effects of pore struc-ture, pore size distribution, and other microscale characteristics of
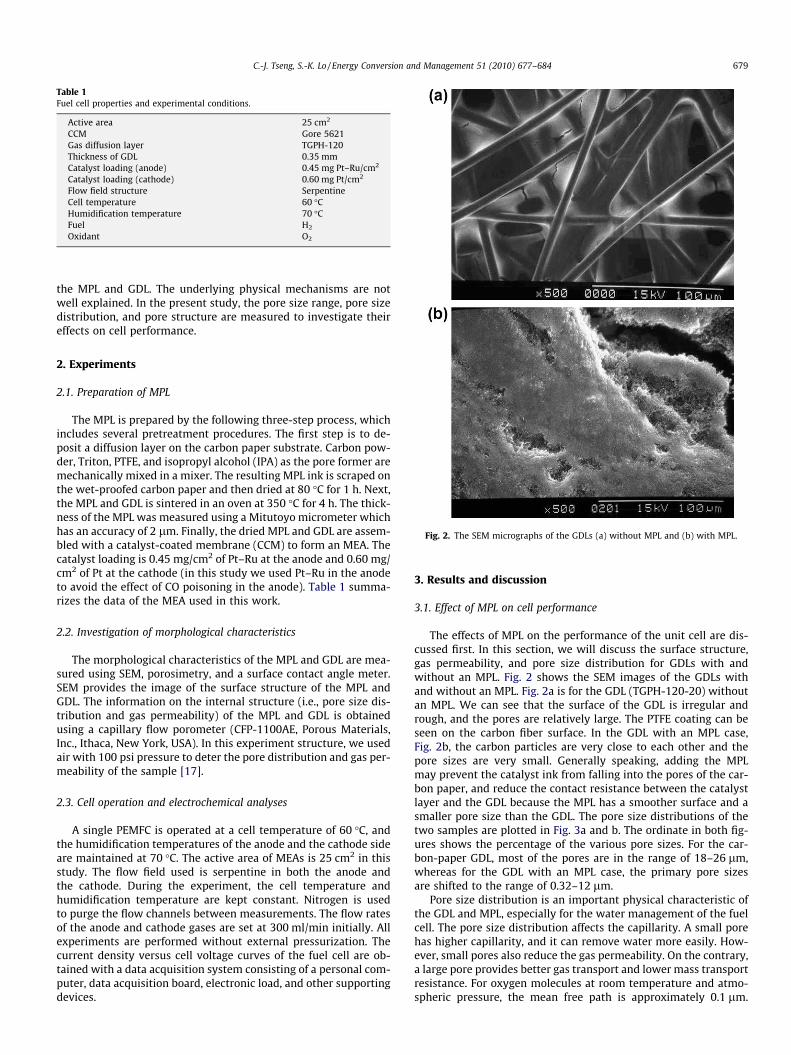
Table 1Fuel cell properties and experimental conditions.
Active area 25 cm2
CCM Gore 5621Gas diffusion layer TGPH-120Thickness of GDL 0.35 mmCatalyst loading (anode) 0.45 mg Pt–Ru/cm2
Catalyst loading (cathode) 0.60 mg Pt/cm2
Flow field structure SerpentineCell temperature 60 �CHumidification temperature 70 �CFuel H2
Oxidant O2
C.-J. Tseng, S.-K. Lo / Energy Conversion and Management 51 (2010) 677–684 679
the MPL and GDL. The underlying physical mechanisms are notwell explained. In the present study, the pore size range, pore sizedistribution, and pore structure are measured to investigate theireffects on cell performance.
Fig. 2. The SEM micrographs of the GDLs (a) without MPL and (b) with MPL.
2. Experiments
2.1. Preparation of MPL
The MPL is prepared by the following three-step process, whichincludes several pretreatment procedures. The first step is to de-posit a diffusion layer on the carbon paper substrate. Carbon pow-der, Triton, PTFE, and isopropyl alcohol (IPA) as the pore former aremechanically mixed in a mixer. The resulting MPL ink is scraped onthe wet-proofed carbon paper and then dried at 80 �C for 1 h. Next,the MPL and GDL is sintered in an oven at 350 �C for 4 h. The thick-ness of the MPL was measured using a Mitutoyo micrometer whichhas an accuracy of 2 lm. Finally, the dried MPL and GDL are assem-bled with a catalyst-coated membrane (CCM) to form an MEA. Thecatalyst loading is 0.45 mg/cm2 of Pt–Ru at the anode and 0.60 mg/cm2 of Pt at the cathode (in this study we used Pt–Ru in the anodeto avoid the effect of CO poisoning in the anode). Table 1 summa-rizes the data of the MEA used in this work.
2.2. Investigation of morphological characteristics
The morphological characteristics of the MPL and GDL are mea-sured using SEM, porosimetry, and a surface contact angle meter.SEM provides the image of the surface structure of the MPL andGDL. The information on the internal structure (i.e., pore size dis-tribution and gas permeability) of the MPL and GDL is obtainedusing a capillary flow porometer (CFP-1100AE, Porous Materials,Inc., Ithaca, New York, USA). In this experiment structure, we usedair with 100 psi pressure to deter the pore distribution and gas per-meability of the sample [17].
2.3. Cell operation and electrochemical analyses
A single PEMFC is operated at a cell temperature of 60 �C, andthe humidification temperatures of the anode and the cathode sideare maintained at 70 �C. The active area of MEAs is 25 cm2 in thisstudy. The flow field used is serpentine in both the anode andthe cathode. During the experiment, the cell temperature andhumidification temperature are kept constant. Nitrogen is usedto purge the flow channels between measurements. The flow ratesof the anode and cathode gases are set at 300 ml/min initially. Allexperiments are performed without external pressurization. Thecurrent density versus cell voltage curves of the fuel cell are ob-tained with a data acquisition system consisting of a personal com-puter, data acquisition board, electronic load, and other supportingdevices.
3. Results and discussion
3.1. Effect of MPL on cell performance
The effects of MPL on the performance of the unit cell are dis-cussed first. In this section, we will discuss the surface structure,gas permeability, and pore size distribution for GDLs with andwithout an MPL. Fig. 2 shows the SEM images of the GDLs withand without an MPL. Fig. 2a is for the GDL (TGPH-120-20) withoutan MPL. We can see that the surface of the GDL is irregular andrough, and the pores are relatively large. The PTFE coating can beseen on the carbon fiber surface. In the GDL with an MPL case,Fig. 2b, the carbon particles are very close to each other and thepore sizes are very small. Generally speaking, adding the MPLmay prevent the catalyst ink from falling into the pores of the car-bon paper, and reduce the contact resistance between the catalystlayer and the GDL because the MPL has a smoother surface and asmaller pore size than the GDL. The pore size distributions of thetwo samples are plotted in Fig. 3a and b. The ordinate in both fig-ures shows the percentage of the various pore sizes. For the car-bon-paper GDL, most of the pores are in the range of 18–26 lm,whereas for the GDL with an MPL case, the primary pore sizesare shifted to the range of 0.32–12 lm.
Pore size distribution is an important physical characteristic ofthe GDL and MPL, especially for the water management of the fuelcell. The pore size distribution affects the capillarity. A small porehas higher capillarity, and it can remove water more easily. How-ever, small pores also reduce the gas permeability. On the contrary,a large pore provides better gas transport and lower mass transportresistance. For oxygen molecules at room temperature and atmo-spheric pressure, the mean free path is approximately 0.1 lm.

Fig. 3. Pore size distribution in the GDLs (a) without MPL and (b) with MPL.
Fig. 4. Effect of MPL on the cell performance of a single cell.
Fig. 5. Effect of the MPL thickness on the cell performance.
680 C.-J. Tseng, S.-K. Lo / Energy Conversion and Management 51 (2010) 677–684
Therefore, pores larger than 5 lm may be classified as macropores;diffusion in these pores is mainly due to molecular collisions. Onthe other hand, pores smaller than 0.01 lm may be classified asmicropores, and Knudsen diffusion is dominant in these pores.The pores in the range of 0.01–5 lm can be called mesoporesand are a transition between the micropores and the macropores.As shown in Fig. 3, for the sample without MPL, most of the poresare macropores; these pores provide efficient gas diffusion and
water transport from the GDL to the flow channels. However, itmay not be very easy to remove the water that forms in the cata-lyst layer. For the sample with an MPL, the pores consist of mesop-ores and macropores. While the macropores provide efficient gasdiffusion and water removal, the mesopores help in transportingwater from the catalyst layer to the GDL.
Finally, with the same MEA, the effect of the GDL with and with-out an MPL on the performance of a single cell is measured througha performance test using hydrogen and oxygen as the fuel and oxi-dant, respectively. The results are illustrated in Fig. 4. In the lowand intermediate current density regions, the two setups showsimilar performances. However, in the high current density region,the influence of the MPL is very clear. The cell with the MPL doesnot show any sign of water flooding for current densities up to1350 mA/cm2. On the other hand, the output voltage of the cellwithout the MPL drops very fast after 700 mA/cm2 due to masstransfer polarization.
3.2. Effect of MPL thickness on cell performance
Fig. 5 shows the effect of the thickness of an MPL on the perfor-mance of a cell. Measured after baking, the thicknesses of the MPLare varied as 38, 84, and 136 lm. There seems to exist an optimumthickness of 84 lm for the cases tested. An explanation for this va-lue will be given after examining the pore characteristics. The poresize distributions for the three cases are presented in Fig. 6, and thepore characteristics are summarized in Table 2. We also used theK–C equation to calculate the theoretical gas permeability inMPL. And we in which C ¼ 180=k2
mean, the mean pore diameterkmean is computed by experimental data from CFP. And the meanpore diameter increases with the thickness, the averaged gas per-meability also. We can see that the gas permeability of 136-lmis the smallest. The difference in MPL thickness on the cell perfor-mance results as shown in Fig. 5. We can see the 84-lm sample hasbetter performance than the 38-lm sample in all current densityregions; the 136-lm sample has worse performance than the 84-lm sample in the intermediate and high current density regionswhere mass transport dominates.
A suitable MPL improves the reactant gas supply and facilitatesthe removal of the product water. An extremely thin MPL has smal-ler pores that may hinder gas supply and increase mass transportresistance. On the other hand, an extremely thick MPL has a higher

Fig. 6. Pore size distribution in an MPL with different thicknesses. MPL thickness:(a) 38 lm, (b) 84 lm, and (c) 136 lm.
Fig. 7. Pore size distributions in carbon paper. (a) 0 wt.% PTFE loading, (b) 20 wt.%PTFE loading, and (c) 40 wt.% PTFE loading.
Table 2Pore characteristics for three different thicknesses of MPL.
Sample(lm)
Mean porediameter(lm)
Smallestpore size(lm)
Average Darcypermeability(darcy)
K–C equationpermeability(darcy)
TGPH-120-20-38 3.57 0.39 0.442 0.403TGPH-120-20-84 3.84 0.32 0.340 0.342TGPH-120-20-136 7.84 0.49 0.205 0.217
Table 3Pore characteristics of MPL-coated GDLs with different PTFE loadings.
Sample(lm)
Mean porediameter(lm)
Smallestpore size(lm)
Average Darcypermeability(darcy)
K–C equationpermeability(darcy)
TGPH-120-0-84 4.22 0.43 0.299 0.281TGPH-120-20-84 3.84 0.32 0.340 0.342TGPH-120-40-84 2.33 0.32 0.086 0.097
C.-J. Tseng, S.-K. Lo / Energy Conversion and Management 51 (2010) 677–684 681
electronic resistance because of the increased amount of PTFE. Athick layer also hampers the accessibility of the reactant gas dueto the lengthened diffusion path.
3.3. Effect of PTFE loading of GDL
In this section, we discuss the effect of PTFE loading of GDL oncell performance. The PTFE loadings in the GDL are 0 wt.%, 20 wt.%,

Fig. 8. Polarization curves of cells with different PTFE loading in GDL.
Fig. 9. Comparison of polarization curves of cells with MPLs having different PTFEloadings.
Fig. 10. Pore size distributions of MPLs with different PTFE loadings. (a) 10 wt.%, (b)25 wt.%, (c) 40 wt.%, and (d) 55 wt.%.
682 C.-J. Tseng, S.-K. Lo / Energy Conversion and Management 51 (2010) 677–684
and 40 wt.%. All three GDLs are coated with the same MPL. Themean pore diameter of the resulting MPL + GDL decreases withincreasing PTFE loading in the GDL as shown in Table 3. The tablealso shows the gas permeability data. The carbon paper with20 wt.% PTFE has the highest gas permeability in the three casesstudied. The measured value of the gas permeability for the40 wt.% sample is very low compared to that of the other samplesand is only about 1/4 of the 20 wt.% sample. Fig. 7 presents the poresize distribution of the GDL with different PTFE loading. For the40 wt.% PTFE loading sample, although the pore size range is from0.32 to 24.59 lm, almost 70% of the pores are smaller than 4.0 lm.This may be the reason that it has the lowest gas permeability.
Polarization curves of the cells made of the three GDLs are illus-trated in Fig. 8. The 20 wt.% PTFE case has the best cell perfor-mance. This implies that 20 wt.% PTFE can facilitate the reactantgas and product water transport better than other PTFE loadings.In Fig. 8, the cell performance without any PTFE content in carbonpaper is very poor, even with the MPL. The product water is re-moved quickly from the catalyst layer to the GDL but remains in

Fig. 11. Comparison of polarization curves of cells with MPLs with different bakingtimes.
Fig. 12. Pore size distributions of MPLs with different baking times. (a) 1 h, (b) 3 h,(c) 9 h, and (d) 13 h.
C.-J. Tseng, S.-K. Lo / Energy Conversion and Management 51 (2010) 677–684 683
the pores of the GDL and hinders the reactant gas from enteringinto the MPL and the catalyst layer. Therefore, the presence of PTFEin a GDL is necessary for efficient removal of water. However, ahigher PTFE loading in carbon paper will increase the electronicresistance and decrease the pore size and gas permeability in theGDL. Therefore, there exists an optimum amount of PTFE loading.
3.4. Effect of PTFE loading of MPL
In this section, we will discuss the effect of the PTFE loading ofan MPL. From Fig. 9, it is observed that the MPL that has 40 wt.% ofPTFE has a better cell performance than others. The reason for thisbetter performance is that using more PTFE loading in the MPL re-sults in higher gas permeability and easier water removal. In otherwords, PTFE loading of 40 wt.% provides lower mass transportresistance in the high current density zone. Moreover, as shownin Fig. 10, the pore size distribution results also showed that theMPL with PTFE loading less than 25 wt.% had more small poresthan the MPL with 25 and 40 wt.% PTFE. This may be due to the factthat during the baking process, part of PTFE vaporizes, and theremaining part cures, producing larger pores. Therefore, the MPLwith a greater PTFE loading has less small pores and higher gaspermeability.
3.5. Effect of the baking time of MPL
From Fig. 11, it is observed that the MPL baked for 9 h has a bet-ter cell performance than that baked for 1 or 5 h. But in the bakedfor 13 h, the cell performance is almost the same with 9 h. Fig. 12shows the pore size distribution with different baking times. In thisexperiment, we find that a longer baking time will result in largerpores and higher gas permeability. That is, when the baking time is9 h, the fuel and oxidant can be transported more easily in the GDLand MPL. Therefore, when an MPL that was baked for 9 h is used,the cell performance is better than that of the other MPLs consid-ered in this experiment.
4. Conclusions
In this study, the effects of the physical characteristics of theGDL and MPL on the cell performance are investigated. A commer-cial CCM with an active area of 25 cm2 is used along with a GDL

684 C.-J. Tseng, S.-K. Lo / Energy Conversion and Management 51 (2010) 677–684
and an MPL for assembling a single cell. The effects of the MPL, thethickness of the MPL, the PTFE loading of carbon paper, and theMPL have been investigated. The main findings based on the exper-imental results are summarized as follows:
1. Under light and intermediate load conditions, fuel cells withand without MPL show similar performances. However, in highcurrent density region, the cell with an MPL has much betterperformance and does not show any sign of mass transferlimitation.
2. A suitable MPL improves the reactant gas supply and facilitatesthe removal of the product water. An extremely thin MPL hasvery small pores and low gas permeability that limits the gassupply and increases the mass transport resistance. An extre-mely thick MPL has a higher electronic resistance because ofthe increased amount of PTFE.
3. For the three PTFE loadings in the GDL studied in this work, the20 wt.% case has the best cell performance.
4. The 40 wt.% PTFE loading in MPL case has the best cell perfor-mance. The highest PTFE loading in this experiment has thehighest gas permeability.
5. A longer MPL baking time can provide higher gas permeability,and the cell performance is also better than that in the shorterbaking time cases.
Acknowledgements
The authors would like to thank the National Science Council ofTaiwan for the partial funding for this work through the GrantNSC93-2212-E-008-004.
References
[1] Kong CS, Kim DY, Lee HK, Shul YG, Lee TH. Influence of pore-size distribution ofdiffusion layer on mass-transport problems of proton exchange membranefuel cells. J Power Sources 2002;108:185–91.
[2] K Kordesch, Simader G. Fuel cells and their applications. Weinheim: VCHVerlagsgesellschaft mbH; 1996.
[3] Lee WK, Ho CH, Van Zee JW, Murthy M. The effects of compression and gasdiffusion layers on the performance of a PEM fuel cell. J Power Sources1999;84:45–51.
[4] Lim C, Wang CY. Development of high-power electrodes for a liquid-feed directmethanol fuel cell. J Power Sources 2003;113:145–50.
[5] Giorgi L, Antolini E, Pozio A, Passalacqua E. Influence of the PTFE content in thediffusion layer of low-Pt loading electrodes for polymer electrolyte fuel cells.Electrochim Acta 1998;43:3675–80.
[6] Song JM, Cha SY, Lee WM. Optimal composition of polymer electrolyte fuel cellelectrodes determined by the AC impedance method. J Power Sources2001;94:78–84.
[7] Jordan LR, Shukla AK, Behrsing T, Avery NR, Muddle BC, Forsyth M. Diffusionlayer parameters influencing optimal fuel cell performance. J Power Sources2000;86:250–4.
[8] Yoon YG, Park GG, Yang TH, Han JN, Lee WY, Kim CS. Effect of pore structure ofcatalyst layer in a PEMFC on its performance. Int J Hydrogen Energy2003;28:657–62.
[9] Soler J, Hontanon E, Daza L. Electrode permeability and flow-fieldconfiguration: influence on the performance of a PEMFC. J Power Sources2003;118:172–8.
[10] Lee HK, Park JH, Kim DY, Lee TH. A study on the characteristics of the diffusionlayer thickness and porosity of the PEMFC. J Power Sources 2004;131:200–6.
[11] Lim C, Wang CY. Effects of hydrophobic polymer content in GDL on powerperformance of a PEM fuel cell. Electrochim Acta 2004;49:4149–56.
[12] Yan WM, Hsueh CY, Soong CY, Chen F, Cheng CH, Mei SC. Effects of fabricationprocesses and material parameters of GDL on cell performance of PEM fuelcell. Int J Hydrogen Energy 2007;32:4452–8.
[13] Jin HN, Massoud K. Effective diffusivity and water-saturation distribution insingle- and two-layer PEMFC diffusion medium. Int J Heat Mass Transfer2003;46:4595–611.
[14] Rajalakshmi N, Jayanth TT, Thangamuthu R, Sasikumar G, Sridhar P,Dhathathreyan KS. Water transport characteristics of polymer electrolyte. IntJ Hydrogen Energy 2004;29:1009–14.
[15] Su A, Weng FB, Hsu CY, Chen YM. Studies on flooding in PEM fuel cell cathodechannels. Int J Hydrogen Energy 2006;31:1031–9.
[16] Shi Y, Xiao JS, Pan M, Yuan RZ. A fractal permeability model for the gasdiffusion layer of PEM fuel cells. J Power Sources 2006;160:277–83.
[17] The instruction manual for capillary flow porometer, PMI, Inc. <http://www.pmiapp.com/products/permeability.html>.
Copyright © 2022 FDOKUMEN