Revisiting the concept of characteristic compressive strength ...
55
HAL Id: hal-03001586 https://hal.archives-ouvertes.fr/hal-03001586 Submitted on 19 Nov 2020 HAL is a multi-disciplinary open access archive for the deposit and dissemination of sci- entific research documents, whether they are pub- lished or not. The documents may come from teaching and research institutions in France or abroad, or from public or private research centers. L’archive ouverte pluridisciplinaire HAL, est destinée au dépôt et à la diffusion de documents scientifiques de niveau recherche, publiés ou non, émanant des établissements d’enseignement et de recherche français ou étrangers, des laboratoires publics ou privés. Revisiting the concept of characteristic compressive strength of concrete Chi-Cong Vu, Olivier Plé, Jérôme Weiss, David Amitrano To cite this version: Chi-Cong Vu, Olivier Plé, Jérôme Weiss, David Amitrano. Revisiting the concept of characteristic compressive strength of concrete. Construction and Building Materials, Elsevier, 2020, 263, pp.120126. 10.1016/j.conbuildmat.2020.120126. hal-03001586
-
Upload
khangminh22 -
Category
Documents
-
view
0 -
download
0
Transcript of Revisiting the concept of characteristic compressive strength ...

HAL Id: hal-03001586https://hal.archives-ouvertes.fr/hal-03001586
Submitted on 19 Nov 2020
HAL is a multi-disciplinary open accessarchive for the deposit and dissemination of sci-entific research documents, whether they are pub-lished or not. The documents may come fromteaching and research institutions in France orabroad, or from public or private research centers.
L’archive ouverte pluridisciplinaire HAL, estdestinée au dépôt et à la diffusion de documentsscientifiques de niveau recherche, publiés ou non,émanant des établissements d’enseignement et derecherche français ou étrangers, des laboratoirespublics ou privés.
Revisiting the concept of characteristic compressivestrength of concrete
Chi-Cong Vu, Olivier Plé, Jérôme Weiss, David Amitrano
To cite this version:Chi-Cong Vu, Olivier Plé, Jérôme Weiss, David Amitrano. Revisiting the concept of characteristiccompressive strength of concrete. Construction and Building Materials, Elsevier, 2020, 263, pp.120126.�10.1016/j.conbuildmat.2020.120126�. �hal-03001586�
1
Revisiting the concept of characteristic compressive strength of concrete
Chi-Cong Vua, Olivier Pléb, Jérôme Weissc, David Amitranoc
a National University of Civil Engineering (NUCE), 55 Giai Phong, Hanoi, Vietnam
b Univ. Savoie Mont Blanc, CNRS, LOCIE, 73000 Chambéry, France
c Univ. Grenoble Alpes, CNRS, IRD, IFSTTAR, ISTerre, 38000 Grenoble, France
Abstract
The characteristic compressive strength is one of the most important material property used in
structural design and quality control of concrete. Here we show that the estimation of this
characteristic strength following classical standard rules (e.g. EN 1992 or ACI-318) is sample size
dependent, i.e. is not a characteristic of the material. From an extensive experimental dataset, an
analysis of published strength data, and an interpretation of compressive failure as a critical phase
transition from an intact to a failed state, we show that the compressive strength of concrete is
characterized by a non-vanishing asymptotic mean strength, 𝜎 , but a vanishing associated
variability towards very large system sizes. Consequently, the asymptotic strength 𝜎 can be
regarded as the genuine characteristic compressive strength of concrete. Based on this, we propose a
new procedure to evaluate this genuine characteristic strength as well as to check the conformity of
concrete with strength requirements.
Keywords: characteristic compressive strength, size effect, finite-size scaling, concrete, strength
variability
1. Introduction
In civil engineering, concrete is mostly used under compression loading configurations since its
compressive strength is much larger than its tensile and/or flexural strengths. Generally, the tensile
and flexural strengths of concrete are of the order of respectively ~10% and ~15% of the
compressive strength [1]. Furthermore, the compressive strength is often considered as a marker of

2
the concrete quality because it is directly related to the structure of the hydrated cement paste [2].
For these reasons, the compressive strength is usually used as the basis for taking decisions
regarding the strength and serviceability of concrete members and structures [1].
For the purpose of structural design, concrete is classified into several strength classes based on
the so-called characteristic compressive strength (𝑓 ) in most of European standards (e.g. EN 1992
[3] and NF EN 206-1 [4]) or on the specified compressive strength (𝑓 ) in the American standard
(ACI-318 [5]). Hereafter, both 𝑓 and 𝑓 are referred as the characteristic strength (𝑓 ) . For
example, in the standard EN 1992 [3], the concrete strength class ranges from C12/15 to C90/105,
meaning that the characteristic strength of cylinders and that of cubic specimens are respectively in
a range 12-90MPa and 15-105MPa. During the design stage, designers must size the dimensions of
the concrete members to resist the imposed loads based on some compressive strength classes.
These chosen strength grades are then used to define the concrete mix to be used for construction.
In the construction stage, the concrete used must be in conformity with the strength requirements
previously specified by the designers from the characteristic strength. Therefore, the characteristic
strength can be considered as a key property for structural design, concrete mix design and quality
control of concrete.
Implicitly assuming a normal distribution for the compressive strength of concrete samples, in
agreement with experimental data [1–3,5], the characteristic strength of concrete (𝑓 ) is calculated
from the corresponding mean value (𝑓 ) and standard deviation (𝑠) as follows:
𝑓 = 𝑓 − 𝜆. 𝑠 (1)
, where the constant 𝜆 sets the acceptable percentage of tests that will fail under a stress lower
than 𝑓 (e.g. a fractile of 5% is used in EN 1992 [3]). These two statistical parameters (𝑓 and 𝑠)
are obtained from an adequate number of uniaxial compression tests (e.g. ≥ 30 tests recommended
in ACI-318 [5]), carried out on standard concrete specimens at a minimum age of 28 days. Different
standard samples are used in different countries and sometimes even in the same country. For
instance, both 150x300-mm (or 6x12-in.) cylinders and 150-mm (or 6-in.) cubes are used as

3
standard specimens in the United States [1,5,6] and in most European countries [3], while 160x320-
mm (i.e. 200 cm² of normalized strength surface) or 110x220-mm (i.e. 100 cm² of normalized
strength surface) cylinders are recommended and used in France [4,7]. However, quasibrittle
materials in general, and concrete in particular, exhibit a size-dependent behavior on the nominal
compressive strength [8]. Precisely, the mean compressive strength (𝑓 in (1)) decreases with
increasing specimen size [9–15]. In addition, it has been shown recently that the strength variability
of concrete (𝑠 in Eq. (1)) also decrease with increasing sample size [15,16]. These size effects on
both 𝑓 and 𝑠 imply, from relation (1), that the so-called characteristic compressive strength (𝑓 )
will depend on the size of tested concrete samples, an effect generally not taken into account in
concrete mix and structural design. Such size dependence implies that 𝑓 is actually not a
characteristic of the material.
We proposed recently that the compressive failure of quasibrittle materials can be interpreted as
a critical phase transition between an intact and a failed state [16–19]. This interpretation enabled us
to derive finite-size scaling laws for the mean compressive strength (𝑓 ) as well as the standard
deviation (𝑠) which are in remarkable agreement with strength data in various materials like rocks,
concrete, coal and ice [16]. In [15], from a large number (527) of uniaxial compression tests,
conducted on concrete specimens with three different mixtures (mean aggregate size and
proportion) and four different sizes, we demonstrated the pertinence of our critical interpretation as
well as of the finite-size scaling laws to account for size effects on the compressive strength of
concrete. In particular, this experimental study indicated that (i) a very large system (𝐿 → +∞) will
have a non-vanishing asymptotic strength 𝑓 ( → ) → 𝜎 but a vanishing strength variability
𝑠( → ) → 0 , and (ii) the pore structure in hardened concrete samples, rather than the concrete
mix, plays a key role in controlling the size effects on compressive strength. These results suggest
two important points in terms of estimating the characteristic compressive strength of concrete as
follows:

4
1- In this framework, the asymptotic strength (𝜎 ), which is by construction independent of
system size, appears as the genuine characteristic compressive strength of concrete;
2- A laboratory concrete specimen can only be considered as a standard specimen if its size is
very large compared with the characteristic size of its pore structure.
Following this statistical size effect analysis of the compressive strength of concrete detailed in
[15], we revisit here the concept of characteristic strength by taking into account the two points
noted above, through a comparison with the classical expressions of characteristic strength
proposed in concrete design codes (EN 1992 [3] and ACI-318 [5]).
Section 2 details the experimental program. Section 3 deals with the density and moisture
content of our concretes, and their variations with the sample size and microstructure
characteristics. The statistical size effects on compressive strength of our concretes are discussed in
Section 4, and then compared with experimental data of size effect on concrete strength available in
the literature in Section 5. Results and discussion about the characteristic compressive strength,
taking into account these statistical size effects, are discussed in Section 6. Finally, some overall
conclusions of this study are given in Section 7.
2. Experimental program
Here we present an extensive experimental program based on the physical and mechanical
characterizations of 539 concrete cylindrical samples of 3 different concrete mixes and 4 different
sizes including 527 tested in compression. While the moisture and density data are presented here
for the first time, the compressive strength data have been used in [15] to analyze size effects on
both the mean strength (𝑓 ) and the associated variability (𝑠). Here these data are used to re-
examine the concept of characteristic strength, whose the classical definition directly relies on 𝑓
and 𝑠 (see Eq. (1)). This problem is then further discussed from compressive strength data available
in the literature (section 5). Our dataset is however unique, as it allows a sound estimation of
strength variability, 𝑠, which is not the case for these previously published data.

5
2.1. Materials and mix proportions
The cement used in all mixes was CEM I 52.5N type Portland cement, satisfying the standard
NF EN 197-1 [20]. In this study, locally available natural sand was used as the fine aggregate, while
coarse aggregates were natural gravel. All the aggregates were dry and clean, and their specific
properties conform to the NF EN 12620 [21] and NF EN 1097-5 [22] regulations. The size
distribution of aggregates was investigated from a sieving analysis, following NF EN 933-1 [23].
The gradation curves of aggregates used in this work are shown in Fig. 1. Ordinary potable water
available in the laboratory was used for the mixing and curing of concrete.
Following the French standard NF EN 206-1 [4], the weight method was applied to prepare
three different concrete mixtures based on three different aggregate sizes 𝑑 (see Fig. 1 and Table
1): sand (3.15mm), medium gravel (16mm) and coarse gravel (25mm). The corresponding
abbreviations for identifying each concrete group are: Fine aggregate (F), Medium aggregate (M)
and Coarse aggregate (C) (see Fig. 2b). The volume fraction of aggregates for the coarser mixes
(M- and C-concretes) was kept constant at 0.7m3/m3 of concrete and the finesse modulus of
aggregates for the three mixtures are reported in Table 1. The water-to-cement (W/C) ratio was set
constant for all specimens in each concrete mixture. The details of each mixture proportion for 1m3
of concrete are summarized in Table 1. While the F-concrete is a normal mortar in accordance with
the standard NF-EN 196-1 [24], the M-concrete can be actually considered as a standard concrete
[1,4,21,25].
2.2. Specimen preparation
In this work, all concrete specimens were cylinders with a fixed height-to-diameter ratio ℎ/𝜙 =
2 and, for each concrete mixture, the diameter (𝜙) ranged as follows: 40, 70, 110 and 160 mm (see
Fig. 2a). About 45 samples for each sample diameter (𝜙) and aggregate size 𝑑 , for a total of 539
concrete specimens, were produced. Among these, 12 samples were selected for analyzing the

6
initial microstructure (see Appendix A) and the 527 remaining samples were used for compression
tests (see section 4).
All concrete samples were cast according to the procedure of normal weight concrete described
in NF EN 206-1 [4]. During mixing, cement and aggregates were firstly blended in dry conditions,
and water was then added in the mixer. Due to the limited capacity of the concrete mixing center,
for a given concrete mixture, samples of 110 mm and 160 mm diameters were fabricated from
different batches. The smaller samples (40 mm and 70 mm in diameter) were coming from a single
batch, however different from the batches used for larger samples. The different batches can be
considered as a source of strength variability for each material, which will be taken into account by
our approach. According to the regulation NF EN 12390-2 [26], the concrete mixtures were poured
in cylindrical cardboard molds and compacted by an internal vibrator combined with an external
vibrating table to improve the consolidation of the samples.
After casting, all concrete specimens were cured initially for 48 hours by covering the molds
with a plastic sheet in a moisture room, following the recommendation of the regulation NF EN
12390-2 [26]. After demolding, the specimens were continually cured in a water basin at a
temperature of approximately 20oC for 2 months.
At the age of 56 days, all the specimens were cut by diamond grinding discs to ensure planar
surfaces and prevent flexural stresses when loading applies. After sawing, the concrete specimens
were immediately immersed again in the water basin for an additional month and left exposed to
atmosphere in the laboratory until the testing day. According to the recommendation of the
regulation NF EN 12390-3 [7], loading tests should be performed after a minimum age of 28 days.
In this work, all the loading tests were carried out five months after concrete preparation.
2.3. Testing procedure
A series of 527 uniaxial compressive tests was carried out under a load control protocol,
following the procedure recommended by the regulation NF EN 12390-3 [7]. As the samples were
7
very different in size, two load-control uniaxial compression machines (of different stiffness and
loading capacity), complying with the standard NF EN 12390-4 [27], were used. Machine A (Fig.
2c) with a capacity of 3000kN was used for the three larger sample sizes (70x140-mm; 110x220-
mm and 160x320-mm cylinders). The stiffness of this machine is 2.9 times stiffer than that of the
largest samples. For the remaining size (40x80mm-samples), the uniaxial compression tests were
conducted with machine B (Fig. 2d). This machine has a capacity of 300kN and its stiffness is 3.5
times larger than the stiffness of the small samples. Consequently, the compression machines used
in this work are stiff enough to perform reliable strength measurements on our samples. In addition,
these two machines have also been verified and certified by the French Accreditation Committee
(COFRAC), i.e. are suited for standardized tests.
A constant stress rate of 0.5MPa/s, corresponding to a strain rate ranging from 2.4x10⁻⁵/s to
3.2x10⁻⁵/s was applied on the concrete samples placed between two steel-hardened platens of the
compression machine until the specimen failed. Loads were continuously measured by the load cell
positioned at the top platen (see Fig. 2c) and directly transmitted to the data acquisition system.
When the load fell below 50% of the peak load, loading was automatically stopped. While the
bottom steel platen was fixed, the top one could rotate. This enables the upper platen to adjust to the
geometrical imperfections of the specimens.
During loading, the load (𝐹) and the axial displacement (𝛿) were continuously monitored and
recorded at a 5 Hz frequency. The axial displacement of the bottom platen (𝛿) was measured by
one Linear Variable Differential Transducer (LVDT) attached on the frame of the machine.
However, when a concrete specimen is loaded, both the specimen and the machine deform. As a
result, the measured displacement (𝛿) is larger than the true axial shortening of the specimen (Δ ).
By using a calibration test on an Aluminum sample of known elastic modulus, the elastic
deformation of the loading frame was determined as a function of the applied load. The associated
displacement was then eliminated from the axial displacement (𝛿) to obtain Δ .

8
3. Density and Moisture content of hardened concrete
As a multiphase heterogeneous material, the response of concrete to applied stress is a result of
complex interactions and is affected by various factors [28]. According to [1], these factors can be
classified into four categories: (1) characteristics and proportions of materials, (2) curing conditions,
(3) loading parameters, and (4) specimen parameters.
Within each concrete mixture, all the samples were produced from the same mix proportion as
well as using the same casting and curing process (section 2.2). As an identical loading protocol
was applied for all the tests (section 2.3), we can neglect the influence of the loading parameters on
compressive strength. Regarding specimen parameters, this includes the sample size, and geometry,
the microstructural characteristics, the density and the moisture state of hardened concrete
[1,29,30]. As all our cylindrical concrete samples were prepared with a constant of height/diameter
ratio (ℎ/𝜙 = 2), the effect of specimen geometry is thus ignored in this study. The effect of sample
size on the compressive strength will be discussed in section 4. The microstructural characteristics
of our concretes (including porosity) have been already detailed elsewhere [15]. We characterize in
the appendix the pore structure related to air voids, which plays a major role on size effects on
strength (see section 6.2). In the section below, we examine the density and moisture state of our
hardened concrete samples, which are potentially affected by the curing conditions [1,2]. The
influences of sample size and microstructure on these properties are also described.
3.1. Density
Before each loading test, the dimensions and the weight of the sample were measured. An
average diameter, 𝜙, was computed from six measures (two for each end of sample and two in the
middle of the sample length). The average length, ℎ , was obtained from three measurements.
Following the standard NF EN 12390-7 [31], the apparent density, 𝜌, of the hardened concrete
sample is simply given by:

9
𝜌 =𝑚
𝑉 (2)
where 𝑚 is the mass of the concrete sample and V the apparent volume 𝑉 = ℎ .
Fig. 3a shows the mean density and its standard deviation for all concrete samples. It is observed
that: (i) for a given concrete mixture, the mean apparent densities and the associated standard
deviations are similar for all sample sizes. In other words, there is no significant sample size effect
on density; (ii) there is a clear correlation between the apparent density and the aggregate gradation
(F-, M- and C-concretes) (see Fig. 3a and Table 1), with an increasing density when increasing the
aggregate size, as expected; and (iii) the apparent densities range from 2180kg/m3 to 2400kg/m3, i.e.
all our concrete samples comply with the definition of normal-weight concrete [1–4]. Point (i)
shows that the size effects on strength discussed below in section 4 cannot result from a size effect
on density, as this characteristics is size-independent in our samples.
3.2. Moisture content
In hardened concrete, water is present in various states: (i) chemically bounded water within the
hydration products, (ii) adsorbed or physically bounded water in gel pores (gel water), and (iii) free
water in capillary pores (capillary water) [32]. These different types of water content control the
moisture state inside hardened concrete samples and have a considerable effect on the mechanical
properties of concrete [1,2,33]. In general, the moisture content, which depends on the
microstructural characteristics of the material and environmental conditions such as temperature,
relative humidity, and air velocity [1], is used to quantitatively characterize the moisture state of
concrete.
In this study, the moisture content, 𝑤 , of the concrete samples was investigated from the
following procedure:
1- Right after loading, 10 deformed concrete samples were collected for each sample size and each
concrete mixture, and weighted. This weight is noted 𝑚 ;

10
2- The deformed concrete samples were kept in a drying oven at (105±5)oC for a minimum duration of
3 days, according to the regulation NF EN 12390-7 [31]. After this 3-days period, the mass of each
dried specimens was measured every 2 hours. When no significant change of the mass was detected
over three consecutive measurements, the sample was considered as totally dry and its weight called
𝑚 ; This procedure was done on samples collected after loading, as the moisture content (and so, in
particular, such drying procedure) is known to play a significant role on strength.
3- The moisture content of the hardened concrete sample is defined as the mass ratio of water to solid
phases in the sample [34], : 𝑤 =( )
× 100%
The mean value and standard deviation of moisture contents for all concrete samples are
displayed in Fig. 3b. For a given concrete group, no significant sample size dependence can be
observed. In contrast with the density (see Fig. 3a), the largest moistures are observed for the F-
concrete (see Fig. 3b and Table 1). The moisture content is generally affected by the environmental
humidity, the cement content and the porosity of the hardened cement paste [1]. In our case, all
loading tests were performed on the concrete samples during a short period (an average of 50
loading tests per day). Hence, the environmental conditions can be considered similar for all
samples of each concrete group. The F-concrete was prepared with the largest water to cement ratio
in the mix (see Table 1). This is the main reason to explain why the F-concrete samples show the
highest moisture content.
Compressive strength is known to increase with decreasing moisture in hardened concrete
[2,35]. However, owing to the low moisture contents (< 5.5%) observed in our concrete samples
(see Table 1), this factor is not expecting to play a significant role on strength in this study [2,33]. In
addition, the size-independence of density and moisture content demonstrates that at the time of
loading tests, all concrete samples of a given concrete mixture were in a stable moisture state after a
long period of curing (5 months). In other words, this enables us to conclude that all loading tests
for a given concrete mixture were performed under similar initial conditions. Consequently, the size

11
effects on strength discussed below in section 4 must result from some other reasons, and cannot be
affected by the density or the moisture content of our samples.
4. Size effects on compressive strength
The compressive strength of concrete (𝜎 ) is defined as the maximum stress that the concrete
sample can withstand [1,6,7], hence is calculated by dividing the maximum load, 𝐹 , carried by
the concrete specimen during the test by the average cross-sectional area (𝜎 = 4𝐹 /𝜋𝜙 ). Fig. 4
shows the histograms and the corresponding fits to a normal distribution for the compressive
strength of our concrete samples. Low values of both the skewness and the kurtosis of the
distributions (see Table 2) demonstrate that the compressive strength of our concretes is distributed
according to Gaussian statistics. For each individual distribution (fixed sample size and concrete
mixture), we also performed Shapiro-Wilk tests with 𝛼 = 0.01 and found that the assumption of
Gaussian statistics was never rejected.
For a specific concrete mixture and each sample size, the mean value and the standard deviation
of the compressive strength were calculated from about 44 tested samples. These values are
summarized in Table 2. We observe that both the mean compressive strength, ⟨𝜎 ⟩ , and the
associated variability, 𝛿 𝜎 , decrease with increasing sample diameter ( 𝜙 ) (see Fig. 4) and
increasing aggregate size. This is the signature of the size effects on strength mentioned in the
introduction.
An energetic, deterministic approach has been proposed to explain size effects on strength in
quasi-brittle materials like concrete [8,36]. It is related to stress redistribution and associated energy
release within a fracture process zone (FPZ), before macroscopic failure. In this framework, size
effects on strength ensue when the FPZ becomes non-negligible compared with the structure size.
By construction, such a deterministic approach cannot deal with statistical properties such as
strength variability, or the probability of failure under a given stress, while these concepts are

12
essential in the definition of the characteristic strength (see Eq. (1)). The statistical approach
proposed here is fundamentally different. For a more detailed comparison between them, see [15].
The simplest statistical theory of failure is based on the weakest-link hypothesis [37,38], which
assumes that microfracturing and damage events do not interact during the rupture process.
Recently, we have demonstrated the inadequacy of this assumption [15], hence the inability of the
weakest-link theory to describe these external size effects on the compressive failure and strength of
heterogeneous materials such as rocks, concrete, etc. Instead, this failure process can be interpreted
as a critical phase transition from an intact to a failed state [16]. This is based on an analogy with a
generic physical framework for such a critical transition, the so-called depinning transition of an
elastic interface moving against a field of obstacles (e.g. [39,40]). In the case of concrete, the
critical nature of compressive failure was investigated and confirmed from an acoustic emission
(AE) survey of damage and microfracturing [19].
In this framework, finite-size effects on strength arise when the correlation length between
microfracturing events, which grows during loading, starts interacting with the (finite) sample size
as approaching failure. This gives rise to the finite-size scaling laws for the mean value of the
compressive strength, ⟨𝜎 ⟩, and its standard deviation, 𝛿 𝜎 as follows [16,41]:
⟨𝜎 ⟩ = 𝜎 ×𝐿
𝐿
/
+ 𝜎 (3)
𝛿 𝜎 = 𝜎 ×𝐿
𝐿
/
(4)
where 𝜈 is the finite-size exponent. The mean-field (material-independent) prediction [39] for
this exponent is 𝜈 = 1. The length scales 𝐿 and 𝐿 are material constants, which are related to
the characteristics of the microstructural disorder [15,16]. In this context, 𝜎 is a non-vanishing
asymptotic strength for a system of infinite size (𝐿 → +∞). Eq. (3) resembles the scaling laws for
the mean strength proposed by Bazant [8,12] and Carpinteri [42]. However, it is noteworthy that, in
the case of the Bazant’s approach, the exponent is a free (empirical) parameter extracted by fitting

13
the experimental data (see reviews in [8,11,43]), while our physical approach gives a theoretical
prediction for 𝜈 . The approach of Bazant is based on a “deterministic” energetic size effect and
that of Carpinteri is based on geometrical arguments of a fracture surface at the ultimate load, while
our approach, based on a statistical physics framework (the critical depinning transition), is fully
different. It is noteworthy that both previous approaches, by construction, do not give any
prediction for the size effects on the associated strength variability, while our approach does (see
Eq. (4)). The comparison of our approach with these two previous works was further detailed in a
recent paper [15].
A remarkable agreement between Eq. (3) and numerous published data on the mean
compressive strength of various materials such as rocks, ice, coal, and concrete, argued for this
critical interpretation of compressive failure of heterogeneous materials [16]. In order to describe
the size effects on the compressive strength for our concretes, this critical interpretation was also
applied in [15]. Once again, a full agreement between the finite-size scaling predictions (Eq. (3) and
Eq. (4)) and the compressive strength data was achieved, regardless of the concrete mixture. For
each concrete mixture, the asymptotic strength 𝜎 and the length scales 𝐿 , were extracted from
the best fits of the scaling on the mean compressive strength ⟨𝜎 ⟩ (Eq. (3)) and the standard
deviation 𝛿 𝜎 (Eq. (4)), using 𝜈 = 1 (see [15] for more details). The values of 𝜎 and of the
length scales 𝐿 , for our three concrete mixtures are recalled in Table 3. While the length scales
𝐿 , strongly vary the concrete mix, the asymptotic strength appears almost independent of the
material. In [15], we also reported that the pore structure of the material, rather than the aggregate
content, plays a significant role on size effects on the compressive strength of concrete, i.e. the
length scales 𝐿 , are linked to the characteristics of the pore structure in hardened concrete
samples.
In [19], from a campaign of acoustic emission (AE) measurements carried out on our concrete
samples during loading (30 tests), the critical nature of compressive failure process was analyzed
and confirmed. In particular, this AE analysis gave an experimental value of 𝜈 = 1.1 ± 0.2, very

14
close to the theoretical value. Consequently, using 𝜈 = 1, the values of 𝐿 reported in Table 3,
and taking 𝐿 = 𝜙 in Eq. (3), we obtain a remarkable fit of the mean strength scaling (Eq. (3)) for all
the concrete samples (see Fig. 5a). A material–independent value of 𝜎 = 36.9MPa is obtained
from the linear fit on a ⟨𝜎 ⟩ 𝑣𝑠. (𝜙/𝐿 ) / plot (see the inset graph of Fig. 5a). Taking this
asymptotic strength value 𝜎 as well as the values of 𝐿 reported in Table 3, we also obtain an
excellent agreement between the scaling prediction for the standard deviation (Eq. (4)) and our
experimental data (all sample sizes and all concrete mixtures) (see Fig. 5b). This last point shows
that our framework adequately takes into account various sources of strength variability, including
the internal microstructure, moisture content variability (see section 3.2), as well as the effect of
different batches (see section 2.2).
Fig. 5 reveals that, when a structure is of size 𝐿 much larger than its microstructural disorder
related scale 𝐿 , (i) the mean compressive strength ⟨𝜎 ⟩ is not affected by either the concrete mix or
the pore structure; (ii) the mean strength ⟨𝜎 ⟩ is close to the asymptotic strength 𝜎 , while the
associated variability 𝛿 𝜎 is low. In other words, the asymptotic compressive strength (𝜎 ) can
be safely estimated from the mean compressive strength of concrete samples whose the size (𝐿) is
large enough to neglect the effect of the pore structure (𝐿 ).
5. Extension to published datasets
The size effects on the compressive strength 𝜎 of our concretes were found to be in
remarkable agreement with finite-size scaling predictions for both the mean value (Eq. (3)) and its
standard deviation (Eq. (4)). In order to further validate our approach, we analyze below different
experimental data coming from the literature. We focus (i) on strength datasets obtained from
cylindrical samples with a height-to-diameter ratio ℎ/𝜙 = 2 similar to our conditions, and (ii) on
the size effect on the mean strength ⟨𝜎 ⟩, as the limited number of independent tests in these
previous works did not allow an analysis of strength variability. Because the qualities of the
aggregates in these previous studies as well as their 𝑊/𝐶 ratios are different from our study, a

15
comparison of the asymptotic strength (𝜎 ) is not possible. In addition, as the microstructural
characteristics of the concretes, and particularly the pore content, were not detailed in these
references, the role of these heterogeneities on compressive strength is not examined.
The first example considered refers to the tests carried out by Dehestani et al. [44] on cylindrical
samples of self-consolidating concrete (SCC) under uniaxial compressive loading. In their work,
three different concrete mixes were fabricated using three different 𝑊/𝐶 ratios, but with a fixed
maximum aggregate size of 12.5 mm and a cement proportion of 400 kg/m3. Cylindrical specimen
diameters were 50, 75, 100, and 150 mm. The experimental results are summarized in Table 4.
Using 𝜈 = 1, Eq. (3) well describes the size effect on compressive strength for these three SCC
mixes (see Fig. 6a, b, c). A similar agreement is obtained for another strength data of normal-weight
concrete provided by Muciaccia et al. [13], reported in Table 4 and Fig. 6d (same range of 𝑊/𝐶
ratio). The corresponding asymptotic strength (𝜎 ) and length scale (𝐿 ) for each of these four
concrete mixtures were obtained from non-linear fits (Eq. (3)) and summarized in Table 4. As
shown in this table, the 𝐿 value for the three SSC groups 𝑀 , 𝑀 , 𝑀 varies with the 𝑊/𝐶 ratio,
while the maximum aggregate size 𝑑 was kept constant. This is consistent with our previous
observations presented in section 4, confirming that the size effect on compressive strength of
concrete is not controlled by the aggregate size. As already mentioned above, the asymptotic
strengths (𝜎 ) reported in Table 4 are not constant and significantly different from our results. (see
Table 3). This could be explained by different W/C ratio and the use of high range water-reducing
(HRWR) admixture type superplasticizer during the casting of the SSC groups (see Table 4 and Fig.
6a, b, c). The main task of using a superplasticizer is to increase the fluidity of concrete by
dispersing cement particles in paste without adding excess water [45–47]. For a given cement
content, the use of superplasticizer enables to achieve a high concrete strength and durability due to
the reduced amount of free water (low 𝑊/𝐶 ratio) in the mixture [45,48,49]. In the work of
Dehestani et al. [44], the three SSC mixtures were prepared with three different weight percentages
of HRWR and three different 𝑊/𝐶 ratios while keeping constant the cement content (400kg/m3) for

16
all mixes. This could lead to a different nature of the binder matrix which caused the different
values of asymptotic strength for the three SSC groups. For the results provided by Muciaccia et al.
[13], a comparison of the asymptotic strength is not possible as well because the quality of
aggregates as well as the 𝑊/𝐶 ratio are different.
The second example considered is the size effect on the compressive strength of concrete
observed by Sim et al. [50]. From their data, we considered here only three different concrete
mixtures (named A43-0, S47-100, and N55-100) for which they performed mechanical test with the
largest range of cylindrical sample sizes (𝜙 = 50, 100, 150, 250, 300, 350, 400 𝑚𝑚) and with an
aspect ratio of ℎ/𝜙 = 2. In accordance with ACI 213R-03 [51], mixtures A43-0, S47-100 and N55-
100 are classified following their densities (𝜌) as lightweight concrete, mortar and normal-weight
concrete, respectively. The details of these concrete mixes are summarized in Table 5. The A43-0
concrete mix used expanded clay granule as the aggregate, while the N55-100 mix used granite
(coarse aggregate) and natural sand (fine aggregate) for casting. As the nature and the quality of the
aggregates in the mixture are different from our work and previously detailed studies, a comparison
of the asymptotic strength (𝜎 ) is not possible. However, the maximum coarse aggregate size was
fixed at 19 mm for both mixtures. Only natural sand with a maximum size of 5 mm was used to cast
the S47-100 mixture. The size effect on mean compressive strength and the corresponding best-fit
following Eq. (3) with 𝜈 = 1 for the three experimental strength data are shown in Fig. 7a, b, c.
The agreement with the scaling prediction (Eq. (3)) is remarkable. The corresponding 𝜎 − and
𝐿 − values for these three concrete mixtures are presented in Table 5. We confirm an excellent
collapse of all data (all sample sizes, all concrete mixtures) on a [⟨𝜎 ⟩ 𝑣𝑠. (𝐿/𝐿 ) / ] plot (Fig.
7d), in full agreement with our previous results (Fig. 5a). A corresponding asymptotic strength of
𝜎 = 28.0 ± 0.6 (MPa) is obtained for these three concrete mixtures. This confirms that (i) the
asymptotic strength 𝜎 is not affected by the concrete mixture if using the same nature of
aggregates for casting; and (ii) all the three concrete mixtures were batched for the same target
concrete grade. As mentioned by Sim et al. [50] “The targeted compressive strength of all ready-

17
mixed concrete batches was 35 MPa”, meaning that, according to the EN 1992 regulation [3], the
characteristic compressive strength for all three considered mixtures is 𝑓 = 𝑓 − 8 = 27MPa.
This 𝑓 -value is close to the asymptotic strength 𝜎 extracted from the non-linear fits of
experimental data (see Fig. 7d). In other words, the asymptotic strength 𝜎 can be regarded as the
characteristic strength 𝑓 of concrete. This observation will be discussed further in section 6.
The last example is offered by the experimental campaign of Blanks and McNamara [52] on
large concrete cylinders. In their work, different concrete mixtures obtained by varying the
maximum aggregate size 𝑑 were tested for various sizes with a constant aspect ratio (ℎ/𝜙 = 2).
We consider here only three concrete mixtures named B-8, B-9 and B-10 as they were associated
with the widest range of sample size. Details on the mix proportions, specimen sizes and the
corresponding 28-days mean compressive strength ⟨𝜎 ⟩ can be found in [52]. Fig. 8 shows the best-
fitted finite-size scaling (Eq. (3), taking 𝜈 = 1) for the mean compressive strength of the three
considered concrete mixtures. The values of the asymptotic strength 𝜎 as well as the length scale
𝐿 for the three considered concrete mixtures, obtained from non-linear fits of Eq. (3), are
presented in Table 6. We observe that the scaling prediction (3) is in remarkable agreement with the
published experimental data of [52]. Using 𝑣 = 1 and the values of 𝐿 in Table 6, we plot all
strength data on a ⟨𝜎 ⟩ 𝑣𝑠. (𝐿/𝐿 ) / plot. As shown in Fig. 8d, a good collapse of all data (all
sample size, all considered concrete mixtures) is obtained, with an asymptotic strength 𝜎 =
22.4 ± 0.3 (MPa) independent of the concrete mixture. These observations, are consistent with our
results (see section 4) and validate our theoretical framework.
Overall, the analysis of these previously published datasets is fully consistent with our results
detailed in section 4, validating further our theoretical framework.
6. Characteristic compressive strength of concrete
Concrete design codes evaluate the characteristic compressive strength from subtracting the
strength variability from the mean compressive strength obtained from a set of tested concrete

18
specimens with a unique size (see Eq. (1)). However, due to the sample size effects on both the
mean value and the associated variability of compressive strength (see section 4), this traditional
estimation necessarily leads to size effects on the characteristic compressive strength 𝑓 as
estimated from Eq. (1). This questions the concept of characteristic strength itself, which should be
representative of the material only and independent of external size. In this section, we show that
the asymptotic strength, deduced from the external size effects towards the limit 𝐿 → +∞ ,
represents the genuine characteristic strength of concrete. We also propose some recommendations
to determine accurately this asymptotic strength as well as to check the conformity of concrete with
strength requirements.
6.1. Asymptotic versus characteristic compressive strength
Owing to the vanishing strength variability for a system of infinite size (𝐿 → +∞) , the
asymptotic strength 𝜎 (see Eq. (3)) can be considered as the genuine characteristic strength of
concrete to be used to design large scale structures. However, as mentioned in section 1, the
characteristic strength is instead classically calculated from the mean value and the standard
deviation of compressive strength from the relation (1). In EN 1992 [3], the characteristic strength
(𝑓 ) is defined as that strength value below which only 5% of the compression tests are expected to
fall. This corresponds to 𝜆 = 1.645 in Eq. (1) (see Fig. 9). In ACI 318 [5], the tolerance is larger
(10%), corresponding to 𝜆 = 1.34 (see Fig. 9).
Hence, from the mean strengths ⟨𝜎 ⟩ and standard deviations 𝛿 𝜎 reported in Table 2, we can
compute the characteristic strengths for each concrete mixture and sample size, as defined by the
EN 1992 and the ACI 318 codes, using respectively 𝜆 = 1.645 and 𝜆 = 1.34 in Eq. (1).
Fig. 10 shows that the so-defined “characteristic” strength (i) differs for the three different
concrete mixtures, and, more surprisingly, (ii) is sample size dependent. If point (i) could be
expected at first glance, it results in our case only from different finite size effects for our three
concretes (different 𝐿 -values), as the asymptotic strength 𝜎∞ is essentially independent of the

19
concrete mix for the three materials prepared for this study (see Fig. 5). It is worth noting that this
does not mean that 𝜎 = 36.9 MPa would be a characteristic strength for all types of concrete. As
already discussed in [15], the value of 𝜎 will be of course different if we change the nature of
either the fresh or hardened states of concrete (e.g. changing the type of aggregate or adding some
kinds of concrete admixtures). This is illustrated by the fact that the asymptotic strength obtained
for our concretes (Table 3), for the work of Sim et al. [50] (Table 5), or that of Blanks and
McNamara [52] (Table 6), are significantly different, while essentially independent of the aggregate
content within each of these studies.
Point (ii) strongly challenges the classical definition of the “characteristic” strength, which
should be a size-independent material characteristic. This is in full contrast with our definition of
the asymptotic strength 𝜎∞, which is, by construction, sample size independent. The differences of
the 𝑓 values for the three concretes and different sample sizes obtained by applying Eq. (1) from
our strength dataset are actually the perfect illustration of the limitation of the classical
methodology used to determine the characteristic strength. In addition, we note that for most of the
F-concrete and M-concrete dataset (one material, one sample size) the characteristic strength (𝑓 )
calculated from the structural design codes are larger than the asymptotic strength 𝜎 , while an
opposite result is observed for the C-concrete. This illustrates that the use of classical structural
design codes and small concrete samples can lead to unreliable estimations of the asymptotic
strength, relevant for large scale structures. These classical methods give sometimes unsafe
estimations (e.g. F-and M-concretes) (see Fig. 10a and b), or occasionally too conservative ones (C-
concrete) (see Fig. 10c).
In most structural design codes, 150x300mm cylindrical samples [3,5,6] (or 160x320mm in
France [7]) are used as a standard to determine the characteristic compressive strength. Here, even
though the 160x320-mm samples provide the values of the characteristic strength that are the
closest to 𝜎 , the accuracy of the estimation of 𝜎 depends on the confidence level chosen (i.e. the
constant 𝜆 in Eq. (1)), as well as on the concrete mix. Taking 𝑓 = ⟨𝜎 ⟩, 𝑠 = 𝛿 𝜎 , 𝜈 = 1, a

20
combination of Eq. (3) and Eq. (4) with Eq. (1) yields the following scaling for the characteristic
strength (𝑓 ):
𝑓 = 𝜎 ×𝐿
𝐿+ 𝜎 (5)
where 𝐿 = 𝐿 − 𝜆𝐿 . Considering the corresponding strength 𝜎 for each concrete mixture
(Table 3), Eq. (5) fits well the 𝑓 values for all concrete mixtures, and for both the EN 1992 [3]
and ACI 318 [5] design codes (Fig. 10). For a given concrete mixture, the minimum sample size
(𝐿 ) that would allow a correct estimation of the asymptotic strength (𝜎 ± 0.01𝜎 ) while using
classical design codes are reported in Table 3. These sample sizes are always larger than 160mm
and depend on the concrete mixture as well as the constant 𝜆, i.e. on the code. In some cases, e.g. F-
concrete, to perform compression tests on samples large enough to give a correct estimate of 𝜎
would require an unusually large loading capacity for laboratory testing (e.g., 37.5 ×
𝜋 × 𝑚𝑚 ≈ 24 × 10 𝑁 for F-concrete with the ACI 318 code).
This raises important problems while trying to estimate a reliable characteristic strength of
concrete for large scales structural design from classical codes and a unique series of tests with a
single sample size. To avoid sample size effects on strength, the sample size 𝐿 should be much
larger than 𝐿 which itself depends on the microstructural characteristics (i.e. pore structure) of the
hardened concrete.
On the other hand, the asymptotic strength (𝜎 ) could be approximately determined by the
mean strength ⟨𝜎 ⟩ of samples whose the size (𝐿) is much larger than the characteristic size of the
pore structure (𝐿 ) (see Fig. 5a and section 4). Based on this idea, some recommendations for
predicting the genuine characteristic strength of concrete, 𝜎 , are presented in the following
section.

21
6.2. Recommendations for the determination of the asymptotic compressive strength
As discussed above, the form of the finite-size scaling laws for both the mean strength (Eq. (3)),
with a non-vanishing asymptotic strength (𝜎 ), and the associated variability 𝛿(𝜎) vanishing at
large scales, implies that 𝜎 can be considered as the genuine characteristic strength (𝑓 ) of
concrete. We have also stressed that using a single concrete sample size for laboratory testing leads
to different estimations of the characteristic strength from classical codes. Therefore, performing a
series of compression tests with different sample sizes is highly recommended to reliably estimate
the characteristic (asymptotic) compressive strength of concrete. We suggest below an experimental
procedure:
1- Prepare cylindrical concrete samples with a length-to-diameter ratio of 2 and at least four different
sizes. This condition is required to perform a good fit of the finite-size scaling laws (Eq. (3) and Eq.
(4)) to the data in order to estimate the length scales 𝐿 and 𝐿 as well as the asymptotic strength
𝜎 . The number of test specimens in each size should be as large as possible, and not less than 30
specimens, following the standard ACI 318 [5].
2- The diameter of the smallest concrete cylinders should be at least 3 times the nominal maximum size
of the coarse aggregate, following the regulations ASTM C31 [53], NF EN 206-1 [4] and NF EN
12390-1 [54]. This condition allows to reduce the “wall effect” that might happen when the
maximum aggregate size is large relatively to the size of the mold, and to ensure the quality of the
compaction procedure and the uniformity of the aggregate distribution in the samples.
3- The largest sample size should be as large as possible depending on the laboratory loading capacity.
However, it should not be less than 160mm.
4- All the concrete samples must be cast, cured and tested under the same conditions.
5- Using 𝜈 = 1 in Eq. (3), the asymptotic strength (𝜎 ) is determined by a linear regression in a
[⟨𝜎 ⟩ vs. 𝐿 ] graph. The pertinence of the finite-size scaling can then be checked by plotting the
strength variability 𝛿(𝜎) as a function of 𝐿 (see Eq. (4)).
A crucial advantage of such experimental program is that it provides a well-defined value of the
characteristic (asymptotic) compressive strength of concrete which is no more affected by the

22
sample size or the chosen 𝜆-value. However, this requires a larger number of tests with samples of
different sizes, making this procedure lengthy and costly. To circumvent this problem, a simple
analysis of the pore structure of the concrete can be performed (see Appendix A). Indeed, Eq. (3)
implies that the asymptotic strength will be correctly estimated from ⟨𝜎 ⟩ if ≪ 0.
In [15], we have shown that the length scale 𝐿 mainly depends on the intrinsic characteristic of
the pore structure (air voids) in the hardened concrete. Fig. 11 shows the positive correlation
between 𝐿 and the the maximum pore diameter (𝑑 , ) times the porosity 𝑝 in (%) . A good
linear regression (𝑅 = 0.85) is obtained:
𝐿 = 70 ×𝑝
100× 𝑑 , (6)
This suggests an acceptance criterion for the minimum sample size with respect to the pore
structure characteristics. Combining Eq. (3) with 𝜈 = 1 and Eq. (6), this condition reads:
𝐿 ≥0.7 × 𝑝 × 𝑑 ,
𝑘 (7)
where 𝑘 can be seen as the acceptance constant, corresponding to the expected deviation of the
average strength ⟨𝜎 ⟩ from the asymptotic strength 𝜎 . For example, to determine the characteristic
asymptotic strength of C-concrete with an acceptance constant of 𝑘 = 5%, using the values of 𝑝
and 𝑑 , reported in Table A.1, the minimum sample size required is 𝐿 = 120mm. This means
that the mean compressive strength obtained on cylindrical samples with a diameter larger 120-mm
can be regarded as an estimation of the characteristic strength of C-concrete with a confidence level
of 95%. On the other hand, with the same acceptance constant 𝑘, samples with a diameter of at
least 464mm would be needed to determine the characteristic strength of F-concrete. Although the
asymptotic strength 𝜎 is similar for the three different concrete mixtures (see Table 3 and Fig. 5),
the sample size required for its estimation with the same accuracy, from a single series of tests,
strongly varies with the material. This is another illustration of the role of the internal pore structure
on the size effects on strength, while its impact on the asymptotic strength appears limited in our

23
low-porosity concretes [15]. Consequently, if one uses only one sample size to estimate the
characteristic strength of the material from laboratory testing, the sample size criterion (Eq. (7))
should be taken into account.
Quality control during construction is required to check the conformity of concrete to the
strength requirements posed at the design stage. Usually, the acceptance strength criterion is derived
from the characteristic strength determined from standard procedures [3], without paying attention
to sample size effects or to the internal pore structure. However, based on the above discussion, we
argue that, besides the strength criterion, an additional condition on the sample size for laboratory
tests should be examined for the final acceptance decision. Hence, we propose the following step-
by-step checking procedure:
1- Assign the strength grade of concrete (𝑓 ), specified at the design stage, to the asymptotic strength
(𝜎 ) of the considered concrete.
2- Obtain the mean value ⟨𝜎 ⟩ and the standard deviation 𝛿 𝜎 of the compressive strength of the
considered concrete from a series of at least 30 compression tests carried out on sample cylinders of
diameter 𝐿.
3- Perform an image analysis of internal sections on virgin concrete samples to estimate the porosity
(𝑝 ) and the pore maximum diameter 𝑑 , (see Appendix A). A minimum of three sections
including one vertical and two horizontal sections (see Fig. A.1a) for each sample are
recommended. In the case of concrete samples fabricated from different batches, one sample in each
batch has to be selected and analyzed. Note that other methods and techniques can be used
alternatively to determine the porosity and the pore size distribution of concrete or of other cement
based materials, such as the fluid displacement method [55], mercury intrusion porosimetry (MIP)
[56–61], capillary condensation measurement [61,62], and back scattered electron microscopy [63–
67]. All these methods can be used to determine the porosity.
4- Calculate the minimum required average strength (𝑓 ) of the considered concrete at the sample size
𝐿 from the equations (3) and (6) with 𝜈 = 1, based on the values of the required asymptotic

24
strength, 𝜎 (step 1), of the porosity, 𝑝 (step 3) and of the pore maximum diameter, 𝑑 , (step 3),
yielding:
𝑓 = 𝜎0.7 × 𝑝 × 𝑑 ,
𝐿+ 1 (8)
where the porosity 𝑝 is expressed in %.
5- Compare the experimental mean strength ⟨𝜎 ⟩ (obtained at the step 2) with the minimum required
average strength 𝑓 (calculated by using Eq. (8)). If ⟨𝜎 ⟩ ≥ 𝑓 , we can state that the examined
concrete complies with the strength requirements.
We note that the relation between the length scale 𝐿 and the characteristics of the pore structure
(Fig. 11) has only been validated for our low-porosity concrete. It is doubtful that it would hold for
large porosity concretes, for which the pore structure is much more complex (non-spherical,
interconnected pores) and the direct impact of porosity on strength is strong ([57,68–70]).
Therefore, the above procedure should be applied only for normal-weight concretes with a total
porosity of less than 10%. In addition, a smaller sample size 𝐿 implies a larger “correcting factor” 𝑘
in the relation (7) as well as a larger strength variability 𝛿(𝜎) at this size. We therefore recommend
using cylindrical samples with a diameter larger than 110mm.
Two examples illustrating the application of the above procedure are presented below.
Application examples
1. In the first example (Table 7), we check the conformity of our three concrete mixtures with the
strength class C35/45 expressed in EN 1992 [3]. The values of parameters obtained for the 160x320-
mm samples are used for this example. As shown in Table 7, all of the three concrete mixtures have
an experimental mean compressive strength ⟨𝜎 ⟩ larger than the minimum required average strength
𝑓 calculated by using Eq. (8). Therefore, we can conclude that these three mixtures comply with
the strength requirements for the strength class C35/45. In this example, the C-mixture provides the
closest mean strength value to the required value of strength class C35/45 in comparison with the
other mixtures. This means that a coarser concrete mixture, having a lower porosity in its hardened
form, will comply better the targeted characteristic strength than finer mixtures.

25
2. For the second example (Table 8), based on the original data of the C-160x320mm samples (Case 1),
two additional cases are considered after changing either the value of porosity (Case 2) or the value
of the mean compressive strength (Case 3). As the results presented in Table 8, the two last cases do
not comply with the strength requirement for the strength class C35/45. Although Case 2 has the
same mean strength for 160x320mm samples as experimental Case 1, the strength requirement is not
satisfied for Case 2, owing to a larger porosity. This results from the fact that a larger porosity means
stronger size effects on strength, hence a larger value of the minimum average strength required at a
fixed sample size. The production of normal-weight concrete with a porosity as small as possible is
an important goal to achieve a good quality of concrete as well as to be able to correctly estimate the
asymptotic strength for laboratory samples. Case 3, characterized by an unchanged porosity but a
smaller mean strength than Case 1, also fails the strength requirement. This illustrates the fact that
both the strength and the sample size criteria must be examined for the acceptance decision.
7. Conclusion
In this paper, from an experimental study of the statistical size effects on the compressive
strength of concrete as well as an analysis of published strength data: we (i) discussed the definition
of the characteristic compressive strength of concrete when size effects on strength are taken into
account; and (ii) proposed to revise the procedures to estimate this characteristic strength and to
check the conformity of concrete to the strength requirements defined at the design stage. The
following main conclusions can be drawn:
1. The observed size effects on both the mean compressive strength and the standard deviation
of our concretes can be rationalized from finite-size effects associated with an interpretation
of the compressive failure of concrete as a critical transition. This implies that a very large
system system (𝐿 → +∞) has a non-vanishing strength (𝜎 > 0) but its strength variability
vanishes 𝛿 𝜎 → 0 .
2. Owing to these vanishing intrinsic fluctuations of strength at large scales 𝛿 𝜎→
→ 0 ,
the asymptotic strength (𝜎 ) can be considered as the genuine characteristic compressive

26
strength of concrete. Therefore, an experimental study conducted on a series of at least four
different sample sizes is strongly recommended to allow an accurate determination of the
size effects on strength, hence of the characteristic compressive strength of concrete.
3. For low-porosity concretes, the pore structure of the hardened concrete samples plays a key
role in controlling the size effects on strength but does not have a significant impact on the
asymptotic compressive strength. A concrete with a lower porosity will be less affected by
size effects on compressive strength than a concrete with a larger porosity. Another
important consequence is that, if one wants to estimate the characteristic (asymptotic)
strength of the material from a series of tests with a single sample size, a condition on this
size with respect to the characteristic scale of the pore structure should be fulfilled.
4. This characteristic scale of the pore structure in a hardened concrete sample can be estimated
from the product of the maximum pore diameter and the total porosity. In order to determine
these two parameters, we proposed a simple image analysis procedure on internal sections of
concrete samples, but other techniques can be used to measure these parameters. This
procedure was tested so far only on a limited number of different concrete mixtures. An
extension of this work to other concrete materials with various microstructures would be
necessary to refine this estimation.

27
Appendix A. Characterization of the pore structure
The strength of concrete can be significantly affected by the volume of all pores: capillary pores,
gel pores and air voids (entrained and entrapped air voids) [2,61]. Hence, the porosity and size
distribution of pores must be quantified [71]. Mehta and Monteiro [1] noted that “entrapped and
entrained air voids in the hydrated cement paste are much bigger than the capillary voids, and are
capable of adversely affecting the strength”. Actually, there is no consensus on the role of the
capillary pores of the hardened concrete on compressive strength (e.g. [72–74]). In addition, due to
their small sizes (ranging from 0.5nm to 1μm), gel and capillary pores are hard to detect by optical
methods. Thus, we just focus here on air voids (referred as pores in the following). In the present
work, an image analysis procedure was used to characterize the pore structure of our undamaged
concrete samples based on the procedure presented in [75,76].
First, one sample was selected for each size and each concrete mixture (for a total 12 samples
used for this image analysis) and then cut into four pieces (see Fig. A.1a). To remove any scratching
on the sample surfaces due to the sawing process, the surfaces were ground flat using hand pressure
on a water-cooler wheel topped with more and more grit size of metal-bonded diamond plates [75].
Then, these surfaces were polished by using successively finer grit resin-bonded diamond plates to
remove any striations from the grinding materials (see Fig. A.1b). After that, the sample surfaces
were treated to enhance the contrast between pores and other components (aggregates, cement
paste). This was done by filling the depressions with a calcium carbonate paste.
After this preparation, the sample surfaces were scanned by a flatbed scanner at a resolution of
1200dpi (equivalent to 21.17μm/pixel). Thanks to the white color of the calcium carbonate paste,
the pores were easily distinguished from the solid phases (aggregates and hardened cement paste)
after applying a manual contrast enhancement (Fig. A.1c) and thresholding (Fig. A.1d). Fig. A.2
illustrates a comparison of the pore structures for three different concrete mixtures.
28
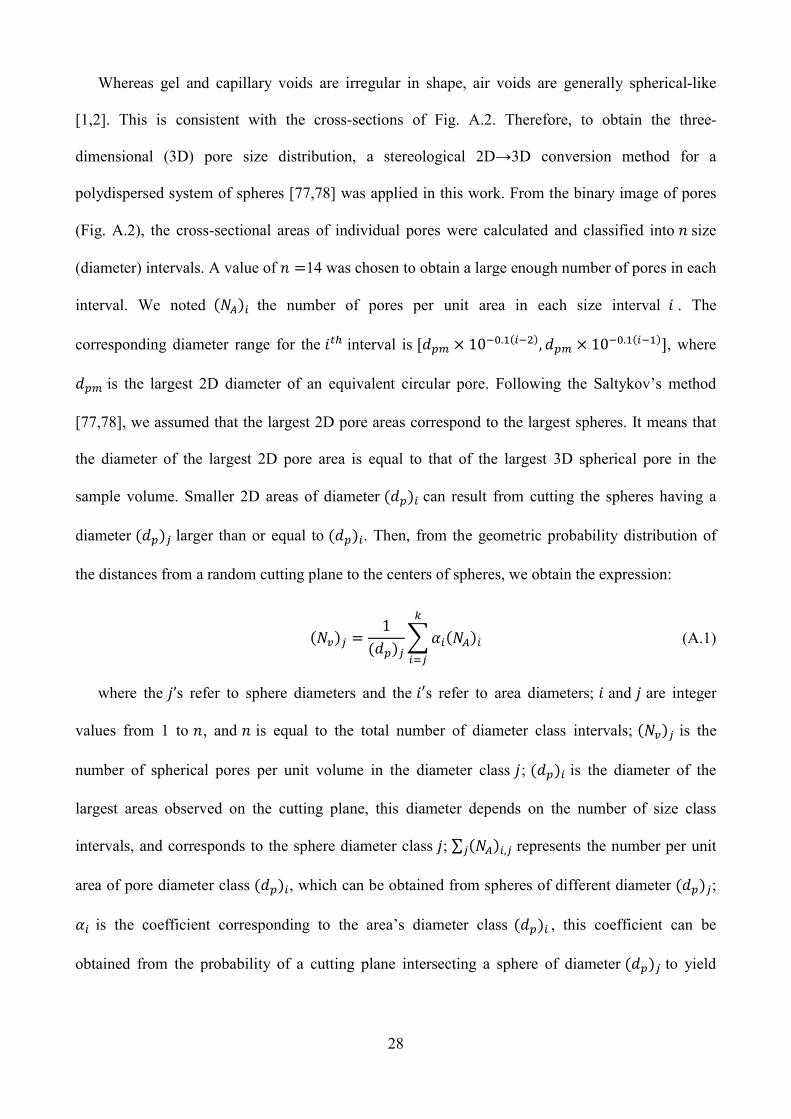
Whereas gel and capillary voids are irregular in shape, air voids are generally spherical-like
[1,2]. This is consistent with the cross-sections of Fig. A.2. Therefore, to obtain the three-
dimensional (3D) pore size distribution, a stereological 2D→3D conversion method for a
polydispersed system of spheres [77,78] was applied in this work. From the binary image of pores
(Fig. A.2), the cross-sectional areas of individual pores were calculated and classified into 𝑛 size
(diameter) intervals. A value of 𝑛 =14 was chosen to obtain a large enough number of pores in each
interval. We noted (𝑁 ) the number of pores per unit area in each size interval 𝑖 . The
corresponding diameter range for the 𝑖 interval is [𝑑 × 10 . ( ), 𝑑 × 10 . ( )], where
𝑑 is the largest 2D diameter of an equivalent circular pore. Following the Saltykov’s method
[77,78], we assumed that the largest 2D pore areas correspond to the largest spheres. It means that
the diameter of the largest 2D pore area is equal to that of the largest 3D spherical pore in the
sample volume. Smaller 2D areas of diameter (𝑑 ) can result from cutting the spheres having a
diameter (𝑑 ) larger than or equal to (𝑑 ) . Then, from the geometric probability distribution of
the distances from a random cutting plane to the centers of spheres, we obtain the expression:
(𝑁 ) =1
(𝑑 )𝛼 (𝑁 ) (A.1)
where the 𝑗’s refer to sphere diameters and the 𝑖′s refer to area diameters; 𝑖 and 𝑗 are integer
values from 1 to 𝑛, and 𝑛 is equal to the total number of diameter class intervals; (𝑁 ) is the
number of spherical pores per unit volume in the diameter class 𝑗; (𝑑 ) is the diameter of the
largest areas observed on the cutting plane, this diameter depends on the number of size class
intervals, and corresponds to the sphere diameter class 𝑗; ∑ (𝑁 ) , represents the number per unit
area of pore diameter class (𝑑 ) , which can be obtained from spheres of different diameter (𝑑 ) ;
𝛼 is the coefficient corresponding to the area’s diameter class (𝑑 ) , this coefficient can be
obtained from the probability of a cutting plane intersecting a sphere of diameter (𝑑 ) to yield

29
areas of diameter (𝑑 ) . Using the values of the coefficients 𝛼 given in [77–79], the 3D pore size
distribution was determined for each concrete sample.
Fig. A.3 presents the (cumulative) probability distribution of pore sizes for different concrete
samples. We observe: (i) an absence of sample size effect on the pore size distribution for a given
type of concrete; (ii) that the pore size distributions have a power law shape, 𝑃 > 𝑑 ~𝑑 , with
an exponent 𝛼 slightly varying with the material (see Fig. A.3).
From these distributions, the average diameter and the total porosity were estimated and
reported in Table A.1 for the different concrete samples. We note that the number of pore per 𝑚 ,
the mean as well as the maximum pore diameter, and the total porosity, all decrease with increasing
aggregate size (see Fig. A.2 and Table A.1). In this study, the maximum pore diameter, 𝑑 , , was
calculated by averaging the values of 𝑑 , of all four different sections (Fig. A.1a) of a given size,
and of all sections and samples (whatever the size) of a given concrete mixture.
The presence of pores in hardened concrete is related to the water and cement contents of the
mix. Larger cement and water contents imply a larger ability for holding the free water in the
hardened cement paste after the hydration process, hence more air voids (pores) in the hardened
concrete [1]. This explains why the F-concrete, which has the largest water-to-cement ratio, shows
the largest pore sizes and porosity (see Table A.1) as well as the largest moisture. When large
enough, porosity is known to directly impact the compressive strength of concrete [57,68–70].
However, as the porosity of our samples always remained below 5% (Table A.1), it did not impact
significantly the asymptotic strength (𝜎 ) of our materials (see Table 3).

30
Acknowledgement
This work was supported by the program of AGIR-POLE-PAGE from the University of Grenoble Alpes
(UGA), France. The authors are thankful to technicians of UGA and USMB for technical assistance.
References
[1] P.K. Mehta, P.J.M. Monteiro, Concrete: microstructure, properties, and materials, Third, McGraw-Hill, 2006. https://doi.org/10.1036/0071462899.
[2] A.M. Neville, J.J. Brooks, Properties of concrete, 4th ed., Pearson Education Limited, 2010. https://doi.org/10.4135/9781412975704.n88.
[3] EN 1992, Eurocode 2: Design of concrete structures - Part 1-1 : General rules and rules for buildings, European Committee for Standardization, 2004.
[4] NF EN 206-1, Béton - Partie 1 : Spécification, performances, production et conformité, Association Française de Normalisation (AFNOR), 2004.
[5] ACI 318-05, Building Code Requirements for Structural Concrete and Commentary, American Concrete Institute, 2005.
[6] ASTM C39/C39M-14, Standard Test Method for Compressive Strength of Cylindrical Concrete Specimens, ASTM Int. (2014) 1–7. https://doi.org/10.1520/C0039_C0039M-14.
[7] NF EN 12390-3, Essais pour béton durci - Partie 3 : Résistance à la compression des éprouvettes, Association Française de Normalisation (AFNOR), 2012.
[8] Z.P. Bazant, J. Planas, Fracture and size effect in concrete and other quasibrittle materials, CRC Press, Boca Raton, Florida, USA, 1998.
[9] S.L. Burtscher, J. Kollegger, Size-effect experiments on concrete in compression, Struct. Concr. 4 (2003) 163–174.
[10] J. Ozbolt, R. Eligehausen, Size effect in concrete and reinforced concrete structures, Fract. Mech. Concr. Struct. (1995) 665–674.
[11] Z.P. Bazant, Size Effect on Structural Strength: A Review, Arch. Appl. Mech. 69 (1999) 703–725. https://doi.org/10.1007/s004190050252.
[12] Z.P. Bazant, Size effect in tensile and compression fracture of concrete structures: Computational modeling and design, Fract. Mech. Concr. Struct. Proceeding (1998) 1905–1922.
[13] G. Muciaccia, G. Rosati, G. Di Luzio, Compressive failure and size effect in plain concrete cylindrical specimens, Constr. Build. Mater. 137 (2017) 185–194. https://doi.org/10.1016/j.conbuildmat.2017.01.057.
[14] J.R. del Viso, J.R. Carmona, G. Ruiz, Shape and size effects on the compressive strength of high-strength concrete, Cem. Concr. Res. 38 (2008) 386–395. https://doi.org/10.1016/j.cemconres.2007.09.020.
[15] C.C. Vu, J. Weiss, O. Plé, D. Amitrano, D. Vandembroucq, Revisiting statistical size effects on compressive failure of heterogeneous materials, with a special focus on concrete, J. Mech. Phys. Solids. 121 (2018) 47–70. https://doi.org/10.1016/j.jmps.2018.07.022.
[16] J. Weiss, L. Girard, F. Gimbert, D. Amitrano, D. Vandembroucq, (Finite) statistical size effects on compressive strength, Proc. Natl. Acad. Sci. U. S. A. 111 (2014) 6231–6236. https://doi.org/10.1073/pnas.1403500111.
[17] L. Girard, J. Weiss, D. Amitrano, Damage-cluster distributions and size effect on strength in compressive failure, Phys. Rev. Lett. 108 (2012) 1–5.

31
https://doi.org/10.1103/PhysRevLett.108.225502.
[18] L. Girard, D. Amitrano, J. Weiss, Failure as a critical phenomenon in a progressive damage model, J. Stat. Mech. Theory Exp. 2010 (2010) P01013. https://doi.org/10.1088/1742-5468/2010/01/P01013.
[19] C. Vu, D. Amitrano, O. Pl, Compressive Failure as a Critical Transition : Experimental Evidence and Mapping onto the Universality Class of Depinning, Phys. Rev. Lett. 122 (2019) 6. https://doi.org/10.1103/PhysRevLett.122.015502.
[20] NF EN 197-1, Ciment -Partie 1: Compostition, spécifications et critères de conformité des ciments courants, Association Française de Normalisation (AFNOR), 2012.
[21] NF EN 12620, Granulats pour béton, Association Française de Normalisation (AFNOR), 2008.
[22] NF EN 1097-5, Essais pour déterminer les caractéristiques mécaniques et physiques des granulats - Partie 5 : détermination de la teneur en eau par séchage en étuve ventilée, Association Française de Normalisation (AFNOR), 2008.
[23] NF EN 933-1, Essais pour déterminer les caractéristiques géométriques des granulats - Partie 1 : détermination de la granularité - Analyse granulométrique par tamisage, Association Française de Normalisation (AFNOR), 2012.
[24] NF EN 196-1, Méthodes d’essais des ciments - Partie 1 : détermination des résistances, Association Française de Normalisation (AFNOR), 2016.
[25] G. Dreux, F. Gorisse, Composition des bétons : méthode Dreux Gorisse, bilan de cinq années d’application en Côte d’Ivoire, Annales de l’Institut Technique du bâtiment et des Travaux Publiques, 1983.
[26] NF EN 12390-2, Essais pour béton durci - Partie 2 : Confection et conservation des éprouvettes pour essais de résistance, Association Française de Normalisation (AFNOR), 2012.
[27] NF EN 12390-4, Essais pour béton durci - Partie 4 : Résistance à la compression - Caractéristiques des machines d’essai, Association Française de Normalisation (AFNOR), 2000. https://doi.org/10.1017/CBO9781107415324.004.
[28] J. Mazars, G. Pijaudier-Cabot, C. Saouridis, Size effect and continuous damage in cementitious materials, Int. J. Fract. 51 (1991) 159–173. https://doi.org/10.1007/BF00033976.
[29] D. Jeulin, M. Ostoja-Starzewski, Mechanics of random and multiscale microstructures, 1st ed., Springer-Verlag Wien, 2001. https://doi.org/10.1007/978-3-7091-2780-3.
[30] S. Torquato, Random heterogeneous media: Microstructure and improved bounds on effective properties, Appl. Mech. Rev. 44 (1991) 37–76. https://doi.org/10.1115/1.3119494.
[31] NF EN 12390-7, Essais pour béton durci - Partie 7 : Masse volumique du béton durci, Association Française de Normalisation (AFNOR), 2012.
[32] H.K. Hilsdorf, A method to estimate the water content of concrete shields, Nucl. Eng. Des. 6 (1967) 251–263. https://doi.org/10.1016/0029-5493(67)90022-2.
[33] F.M. Bartlett, J.G. MacGregor, Effect of Moisture Condition on Concrete Core Strengths, ACI Mater. J. 91 (1994) 227–236.
[34] Ifsttar, Caractérisation du béton durci: Essais liés à a corrosion des armatures, (1994) 15.
[35] S.E. Pihlajavaara, A review of some of the main results of a research on the ageing phenomena of concrete: Effect of moisture conditions on strength, shrinkage and creep of mature concrete, Cem. Concr. Res. 4 (1974) 761–771. https://doi.org/10.1016/0008-8846(74)90048-9.
[36] Z.P. Bazant, Size Effect in Blunt Fracture: Concrete, Rock, Metal, J. Eng. Mech. 110 (1984) 518–535. https://doi.org/10.1061/(ASCE)0733-9399(1984)110:4(518).

32
[37] W. Weibull, A statistical theory of the strength of materials, R. Swedish Inst. Eng. Res. 151 (1939) 45.
[38] W. Weibull, A Statistical Distribution Function of Wide Applicability, J. Appl. Mech. 18 (1951) 293–297.
[39] D. Ertas, M. Kardar, Critical dynamics of contact line depinning, Phys. Rev. E. 49 (1994) 2532–2535. https://doi.org/10.1103/PhysRevE.49.R2532.
[40] D.S. Fisher, Collective ransport in random media: from superconductors to earthquakes, Phys. Rep. 301 (1998) 113–150.
[41] S. Zapperi, Current challenges for statistical physics in fracture and plasticity, Eur. Phys. J. B. 85 (2012) 329. https://doi.org/10.1140/epjb/e2012-30471-9.
[42] A. Carpinteri, B. Chiaia, G. Ferro, Size effects on nominal tensile strength of concrete structures: multifractality of material ligaments and dimensional transition from order to disorder, Mater. Struct. 28 (1995) 311–317. https://doi.org/10.1007/BF02473145.
[43] Z.P. Bazant, Scaling theory for quasibrittle structural failure., Proc. Natl. Acad. Sci. U. S. A. 101 (2004) 13400–13407. https://doi.org/10.1073/pnas.0404096101.
[44] M. Dehestani, I.M. Nikbin, S. Asadollahi, Effects of specimen shape and size on the compressive strength of self-consolidating concrete (SCC), Constr. Build. Mater. 66 (2014) 685–691. https://doi.org/10.1016/j.conbuildmat.2014.06.008.
[45] P.C. Aïtcin, R.J. Flatt, Science and technology of concrete admixtures, 2015. https://doi.org/10.1016/C2015-0-00150-2.
[46] K. Yoshioka, E.I. Tazawa, K. Kawai, T. Enohata, Adsorption characteristics of superplasticizers on cement component minerals, Cem. Concr. Res. 32 (2002) 1507–1513. https://doi.org/10.1016/S0008-8846(02)00782-2.
[47] B. Łaźniewska-Piekarczyk, The influence of selected new generation admixtures on the workability, air-voids parameters and frost-resistance of self compacting concrete, Constr. Build. Mater. 31 (2012) 310–319. https://doi.org/10.1016/j.conbuildmat.2011.12.107.
[48] J. Gołaszewski, Influence of cement properties on new generation superplasticizers performance, Constr. Build. Mater. 35 (2012) 586–596. https://doi.org/10.1016/j.conbuildmat.2012.04.070.
[49] F. Puertas, H. Santos, M. Palacios, S. Martınez-Ramirez, Polycarboxylate superplasticiser admixtures: effect on hydration, microstructure and rheological behaviour in cement pastes, Adv. Cem. Res. 17 (2005) 77–89.
[50] J. Il Sim, K.H. Yang, H.Y. Kim, B.J. Choi, Size and shape effects on compressive strength of lightweight concrete, Constr. Build. Mater. 38 (2013) 854–864. https://doi.org/10.1016/j.conbuildmat.2012.09.073.
[51] ACI 213R-03, Guide for structural lightweight aggregate concrete, Am. Concr. Inst. (2003). https://doi.org/10.1016/0262-5075(79)90004-6.
[52] R.F. Blanks, C. McNamara, Mass concrete tests in large cylinders, J. Am. Concr. Inst. 31 (1935) 280–303.
[53] ASTM C31/C31M-03, Standard Practice for Making and Curing Concrete Test Specimens in the Field, ASTM Int. (2003) 1–5.
[54] NF EN 12390-1, Essais pour béton durci - Partie 1 : Forme , dimensions et autres exigences relatives, Association Française de Normalisation (AFNOR), 2012.
[55] B.B. Das, B. Kondraivendhan, Implication of pore size distribution parameters on compressive strength, permeability and hydraulic diffusivity of concrete, Constr. Build. Mater. 28 (2012) 382–386. https://doi.org/10.1016/j.conbuildmat.2011.08.055.
[56] C. Gallé, Effect of drying on cement-based materials pore structure as identified by mercury intrusion porosimetry - A comparative study between oven-, vacuum-, and freeze-drying,

33
Cem. Concr. Res. 31 (2001) 1467–1477. https://doi.org/10.1016/S0008-8846(01)00594-4.
[57] R. Kumar, B. Bhattacharjee, Porosity, pore size distribution and in situ strength of concrete, Cem. Concr. Res. 33 (2003) 155–164. https://doi.org/10.1016/S0008-8846(02)00942-0.
[58] R. Kumar, B. Bhattacharjee, Assessment of permeation quality of concrete through mercury intrusion porosimetry, Cem. Concr. Res. 34 (2004) 321–328. https://doi.org/10.1016/j.cemconres.2003.08.013.
[59] R.A. Cook, K.C. Hover, Mercury porosimetry of cement-based materials and associated correction factors, Constr. Build. Mater. 7 (1993) 231–240. https://doi.org/10.1016/0950-0618(93)90007-Y.
[60] R.A. Cook, K.C. Hover, Mercury porosimetry of hardened cement pastes, Cem. Concr. Res. 29 (1999) 933–943. https://doi.org/10.1016/S0008-8846(99)00083-6.
[61] S. Diamond, A critical comparison of mercury porosimetry and capillary condensation pore size distributions of portland cement pastes, Cem. Concr. Res. 1 (1971) 531–545. https://doi.org/10.1016/0008-8846(71)90058-5.
[62] R.S. Mikhail, L.E. Copeland, S. Brunauer, Pore structures and surface areas of hardened portland cement pastes by nitrogen adsorption, Can. J. Chem. 42 (1964) 426–438. www.nrcresearchpress.com.
[63] S.I. Igarashi, A. Watanabe, M. Kawamura, Evaluation of capillary pore size characteristics in high-strength concrete at early ages, Cem. Concr. Res. 35 (2005) 513–519. https://doi.org/10.1016/j.cemconres.2004.06.036.
[64] D.A. Lange, H.M. Jennings, S.P. Shah, Image analysis techniques for characterization of pore structure of cement-based materials, Cem. Concr. Res. 24 (1994) 841–853. https://doi.org/10.1016/0008-8846(94)90004-3.
[65] S. Diamond, Aspects of concrete porosity revisited, Cem. Concr. Res. 29 (1999) 1181–1188. https://doi.org/10.1016/S0008-8846(99)00122-2.
[66] P. Soroushian, M. Elzafraney, A. Nossoni, Specimen preparation and image processing and analysis techniques for automated quantification of concrete microcracks and voids, Cem. Concr. Res. 33 (2003) 1949–1962. https://doi.org/10.1016/S0008-8846(03)00219-9.
[67] H.S. Wong, M.K. Head, N.R. Buenfeld, Pore segmentation of cement-based materials from backscattered electron images, Cem. Concr. Res. 36 (2006) 1083–1090. https://doi.org/10.1016/j.cemconres.2005.10.006.
[68] X. Chen, S. Wu, J. Zhou, Influence of porosity on compressive and tensile strength of cement mortar, Constr. Build. Mater. 40 (2013) 869–874. https://doi.org/10.1016/j.conbuildmat.2012.11.072.
[69] S. Kolias, Investigation of the possibility of estimating concrete strength by porosity measurements, Mater. Struct. 27 (1994) 265–272. https://doi.org/10.1007/BF02473043.
[70] C. Lian, Y. Zhuge, S. Beecham, The relationship between porosity and strength for porous concrete, Constr. Build. Mater. 25 (2011) 4294–4298. https://doi.org/10.1016/j.conbuildmat.2011.05.005.
[71] P.C. Fonseca, G.W. Scherer, An image analysis procedure to quantify the air void system of mortar and concrete, Mater. Struct. 48 (2015) 3087–3098. https://doi.org/10.1617/s11527-014-0381-9.
[72] H. Zhao, Q. Xiao, D. Huang, S. Zhang, Influence of pore structure on compressive strength of cement mortar., Sci. World J. 2014 (2014) 1–12. https://doi.org/10.1155/2014/247058.
[73] B. Kondraivendhan, B. Bhattacharjee, Effect of age and water-cement ratio on size and dispersion of pores in ordinary portland cement paste, ACI Mater. J. 107 (2010) 147–154.
[74] L. Zingg, M. Briffaut, J. Baroth, Y. Malecot, Influence of cement matrix porosity on the triaxial behaviour of concrete, Cem. Concr. Res. 80 (2016) 52–59.

34
https://doi.org/10.1016/j.cemconres.2015.10.005.
[75] ASTM C 457/C 457M-16, Standard Test Method for Microscopical Determination of Parameters of the Air-Void System in Hardened Concrete, ASTM Int. (2016). www.astm.org.
[76] U.H. Jakobsen, C. Pade, N. Thaulow, D. Brown, S. Sahu, O. Magnusson, S. De Buck, G. De Schutter, Automated air void analysis of hardened concrete - a Round Robin study, Cem. Concr. Res. 36 (2006) 1444–1452. https://doi.org/10.1016/j.cemconres.2006.03.005.
[77] S.A. Saltykov, The determination of the size distribution of particles in an opaque material from a measurement of the size distribution of their sections, Springer Berlin Heidelberg, 1967. https://doi.org/10.1007/978-3-642-88260-9_31.
[78] E.E. Underwood, Quantitative stereology, Addison-Wesley Pub. Co., 1970.
[79] H. Shen, S.M. Oppenheimer, D.C. Dunand, L.C. Brinson, Numerical modeling of pore size and distribution in foamed titanium, Mech. Mater. 38 (2006) 933–944. https://doi.org/10.1016/j.mechmat.2005.06.027.
[80] S.U. Pillai, D. Menon, Reinforced Concrete Design, 3rd ed., Tata McGraw-Hill Education Pvt. Ltd., 2009.

35
Table captions
Table 1. Mixture proportions for 1m3 of concrete, density and moisture content
Concrete mixture
Water (kg)
Cement (kg)
W/C Sand (kg)
Medium aggregate
(kg)
Coarse aggregate
(kg)
Maximum aggregate size,
𝒅𝒈 (mm)
Finesse modulus
Density, 𝝆 (kg/m3)
Moisture content, 𝒘𝒄 (%)
Mean SD Mean SD
F 225 450 0.50 1350 0 0 3.15 3.24 2184.0 20.5 5.3 0.4
M 195 335 0.58 800 1065 0 16 6.95 2391.4 14.7 3.2 0.2
C 195 335 0.58 800 0 1065 25 9.21 2403.8 18.2 3.2 0.3
Table 2. Compressive strength of concrete samples
Concrete
group
Specimen size,
𝝓 × 𝒉 (mm x mm)
Compressive strength, 𝝈𝒇 (MPa)
Mean SD Skewness Kurtosis
F
40x80 56.4 7.9 -0.21 -0.74
70x140 49.7 5.3 0.08 -0.88
110x220 44.3 2.4 -0.12 0.06
160x320 41.9 2.4 0.29 -0.94
M
40x80 49.6 6.2 0.31 -0.73
70x140 45.2 4.2 -0.58 -0.64
110x220 41.9 1.9 0.04 -0.62
160x320 39.2 1.8 -0.14 -0.66
C
40x80 39.5 4.6 0.47 -0.27
70x140 40.0 6.3 -0.05 -0.86
110x220 37.1 2.7 -0.35 -0.66
160x320 36.7 1.4 -0.59 -0.05

36
Table 3. Finite-size scaling parameters (Eq. (3) and (4)) (after [15]), and estimated parameters of the characteristic strength expressed according to EN-1992 and ACI 318.
Concrete mixture
Finite-size scaling EN 1992 ACI 318
𝝈 (MPa) 𝑳𝒎 (mm) 𝑳𝜹 (mm) 𝑳𝒊 𝑳𝐦𝐢𝐧 (mm)
𝑳𝒊 𝑳𝐦𝐢𝐧 (mm)
Mean SD Mean SD Mean SD Mean SD Mean SD
F 37.5 4.2 20.5 0.4 8.8 0.2 6.3 2.0 631.0 9.0 1.7 897.0
M 36.7 4.5 14.4 0.6 7.0 0.2 3.1 2.5 305.0 5.2 2.5 517.0
C 36.2 5.9 4.1 2.5 6.9 0.8 -7.1 6.2 319.0 -5.0 4.7 224.0
Table 4. Concrete mixture proportions, sample sizes and mean compressive strengths for the three concrete mixtures (M1, M2, M3) of the experiments presented by Dehestani et al. [44], and for the mixture R2 of Muciaccia et al. [13].
Concrete mix data Cylinders (𝒉/𝝓 = 𝟐)
Mean compressive strength,
Asymptotic strength, 𝝈 (MPa)
𝑳𝒎 (mm)
⟨𝝈𝒇⟩ (MPa)
Mixture code W/C 𝒅𝒎𝒂𝒙 (mm) 𝝓 (mm)
Mean SD Mean SD
M1a 0.35 12.5
50 51.3
43.7 8.6 9.6 6.4 75 51.0
100 48.1
150 45.6
M2a 0.39 12.5
50 41.7
29.7 3.1 19.7 9.7 75 36.9
100 35.5
150 33.9
M3a 0.43 12.5
50 28.4
22.1 1.5 14.6 5.8 75 26.5
100 25.5
150 24.0
R2b 0.41 20.0
100 54.4
25.0 13.8 90.5 37.6 200 45.7
400 37.0
800 22.8
a Self-Consolidating Concrete (SCC) mixture; b Normal-weight concrete mixture.

37
Table 5. Concrete mixture proportions, sample sizes and mean compressive strengths for the three concrete mixes (A43-0, S47-100, N55-100) of the experiments reported by Sim et al. [50].
Concrete mix data Cylinders (𝒉/𝝓 = 𝟐)
Mean compressive strength, ⟨𝝈𝒇⟩ (MPa)
Asymptotic strength, 𝝈 (MPa)
𝑳𝒎 (mm)
Mix notationa W/C 𝒅𝒎𝒂𝒙 (mm)
Density, 𝛒 (kg/cm3)
𝝓 (mm)
Mean SD Mean SD
A43-0 0.43 19 1661
50 50.9
27.6 4.1 46.2 23.0
100 43.6
150 39.4
250 33.1
300 30.2
350 30.0
400 28.6
S47-100 0.47 5 1920
50 50.7
28.6 2.7 41.3 14.1
100 43.4
150 37.8
250 33.0
300 32.2
350 31.4
400 30.0
N55-100 0.55 19 2314
50 49.9
27.9 1,6 40.5 8.9
100 40.5
150 35.5
250 33.8
300 30.8
350 30.9
400 29.8 a In the concrete mix notation, the first part indicates the type of concrete (A: lightweight concrete; S: mortar; N: normal-weight concrete), while the second and third parts give the water-to-cement ratio and replacement sand. For example, A43-0 indicates an all-
lightweight concrete mix with 𝑊/𝐶 = 0.43 and do not use natural sand for casting.

38
Table 6. Concrete mixture proportions, specimen sizes and mean compressive strengths for the experiments reported by Blanks and McNamara [52].
Concrete mix data Cylinders
(𝒉/𝝓 = 𝟐)
Compressive strength,
⟨𝝈𝒇⟩ (MPa)
Asymptotic strength, 𝝈 (MPa)
𝑳𝒎 (mm)
No. W/C 𝒅𝐦𝐚𝐱 (mm) 𝝓 (mm) Mean SD Mean SD
B-8 0.53 38.10
152.4 27.92
21.8 1.3 40.1 5.2
203.2 25.72
304.8 24.75
457.2 22.89
609.6 23.44
914.4 23.30
B-9 0.55 19.05
50.8 27.99
22.5 1.4 14.5 2.1
76.2 27.72
152.4 25.86
203.2 23.92
304.8 23.30
457.2 23.17
609.6 22.13
B-10 0.54 9.52
50.8 29.03
22.9 0.8 13.8 1.3
76.2 27.10
152.4 24.48
203.2 24.89
304.8 24.34
457.2 23.03

39
Table 7. Example of application of the proposed procedure for checking the conformity of concrete with the strength requirement for our three concrete mixtures.
Parameter F-concrete M-concrete C-concrete
Compressive strength class C35/45 𝜎 = 𝑓 = 35 MPa
Mean compressive strength (MPa) ⟨𝜎 ⟩ 41.9 39.2 36.7
Sample size (mm) 𝐿 160 160 160
Porosity (%) 𝑝 4.8 1.6 1.5
Maximum pore diameter (mm) 𝑑 , 6.9 6.7 5.4
Minimum required average strength1
(MPa) 𝑓 = 𝜎
0.7 𝑝 × 𝑑 ,
𝐿+ 1 40.1 36.6 36.2
Acceptance condition ⟨𝜎 ⟩ ≥ 𝑓 passed passed passed
1 The porosity 𝑝 expressed in %.
Table 8. Example of application of the proposed procedure for checking the conformity of concrete with the strength requirement for three assumed cases of C-concrete.
Parameter Case 1 Case 2 Case 3
Compressive strength class C35/45 𝜎 = 𝑓 = 35 MPa
Mean compressive strength (MPa) ⟨𝜎 ⟩ 36.7 36.7 35.7
Sample size (mm) 𝐿 160 160 160
Porosity (%) 𝑝 1.5 3.5 1.5
Maximum pore diameter (mm) 𝑑 , 5.4 5.4 5.4
Minimum required average strength1
(MPa) 𝑓 = 𝜎
0.7 𝑝 × 𝑑 ,
𝐿+ 1 36.2 37.9 36.2
Acceptance condition ⟨𝜎 ⟩ ≥ 𝑓 passed failed failed
1 The porosity 𝑝 expressed in %.

40
Table A.1. Pore structure parameters, averaged over all sections and sample sizes, for the 3 different concrete mixtures.
Concrete group
Mean pore diameter, ⟨𝒅𝒑⟩ (mm)
Maximum pore diameter, 𝒅𝒑,𝐦𝐚𝐱 (mm) Porosity, 𝒑𝒐 (%)
Mean SD Mean SD Mean SD
F 0.33 0.24 6.9 1.8 4.8 1.2
M 0.31 0.21 6.7 1.2 1.6 0.4
C 0.28 0.20 5.4 1.3 1.5 0.3

41
Figure captions
Fig. 1. Grading curves of aggregates for three concrete mixtures

42
Fig. 2. Concrete specimens and testing setup: (a) Geometries of the four different sizes of concrete specimens; (b) Cross sections of the three different concrete mixtures; (c) Uniaxial compression testing setup (Machine A); (d) Uniaxial compression testing setup (Machine B).

43
Fig. 3. Properties of hardened concrete samples as a function of the sample diameter: (a) Apparent density; (b) Moisture content

44
Fig. 4. Histograms and normal distribution fits of the compressive strength of concrete samples: (a) F-concrete; (b) M-concrete and (c) C-concrete.
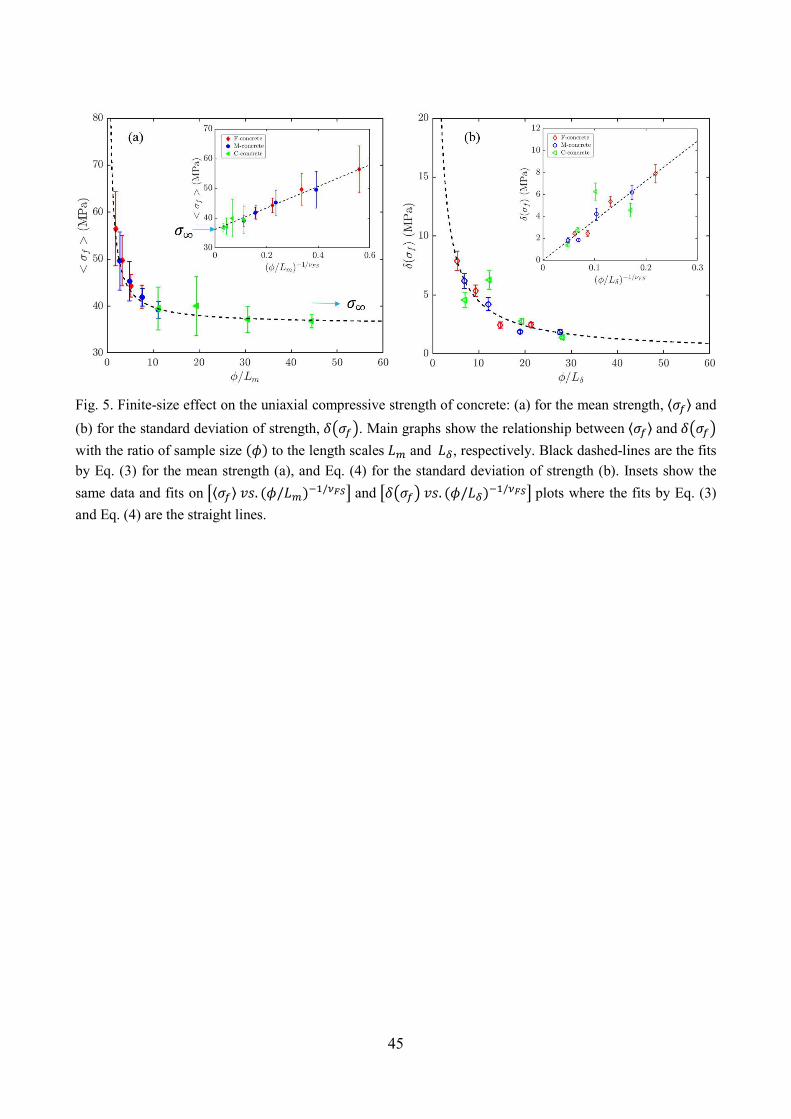
45
Fig. 5. Finite-size effect on the uniaxial compressive strength of concrete: (a) for the mean strength, ⟨𝜎 ⟩ and
(b) for the standard deviation of strength, 𝛿 𝜎 . Main graphs show the relationship between ⟨𝜎 ⟩ and 𝛿 𝜎
with the ratio of sample size (𝜙) to the length scales 𝐿 and 𝐿 , respectively. Black dashed-lines are the fits by Eq. (3) for the mean strength (a), and Eq. (4) for the standard deviation of strength (b). Insets show the
same data and fits on ⟨𝜎 ⟩ 𝑣𝑠. (𝜙/𝐿 ) / and 𝛿 𝜎 𝑣𝑠. (𝜙/𝐿 ) / plots where the fits by Eq. (3)
and Eq. (4) are the straight lines.

46
Fig. 6. Finite-size effect on the uniaxial compressive strength (experimental data): for three self-consolidating concrete (SSC) mixtures (a) M1, (b) M2, and (c) M3 in ref. [44]; and (d) for normal-weight
concrete mixture (R2) in ref. [13]. Main graphs show the relationship between ⟨𝜎 ⟩ and the sample diameter
(𝜙). Black symbols are the published experimental data. Red curves are the fits by using Eq. (3) for the
mean strength with 𝜈 = 1. Insets show the same data and fits on ⟨𝜎 ⟩ 𝑣𝑠. (𝜙) / plots where the fits
by Eq. (3) are the straight lines. The best-fit asymptotic strength 𝜎 and the associated length scale 𝐿 for each concrete group are listed in Table 4.

47
Fig. 7. Finite-size effect on the mean compressive strength for three different concrete mixtures of ref. [50]:
(a) A43-0; (b) S47-100; (c) N55-100. Main graphs show the mean compressive strength, ⟨𝜎 ⟩ as a function of
sample diameter (𝜙). Black symbols are the experimental data reported by [50]. Red curves are the fitting by
Eq. (3). Insets show the same data and fits in a ⟨𝜎 ⟩ 𝑣𝑠. 𝜙 / graph. In this smaller graph, the fitting by
Eq. (3) becomes a straight line and the asymptotic strength 𝜎 is determined. In (d), the collapse of all data
for all concrete mix with a common asymptotic strength (𝜎 = 28.0 ± 0.6) is shown.

48
Fig. 8. Finite-size effect on the mean compressive strength for: (a) B-8; (b) B-9; (c) B-10 concrete mixtures
of ref. [52]. Main graphs show the mean compressive strength, ⟨𝜎 ⟩ as a function of specimen size. Black
symbols are the experimental data reported by [52]. Red curves are the fitting by Eq. (3). Insets show the
same data and fits in a ⟨𝜎 ⟩ 𝑣𝑠. 𝜙 / graph. In this smaller graph, the fitting by Eq. (3) becomes a
straight line and the asymptotic strength 𝜎 is determined. In (d), the collapse of all data for all concrete mix
with a common asymptotic strength (𝜎 = 22.4 ± 0.3) is shown.

49
Fig. 9. Normal distribution curve for the compressive strength of concrete samples (modified from [80]).
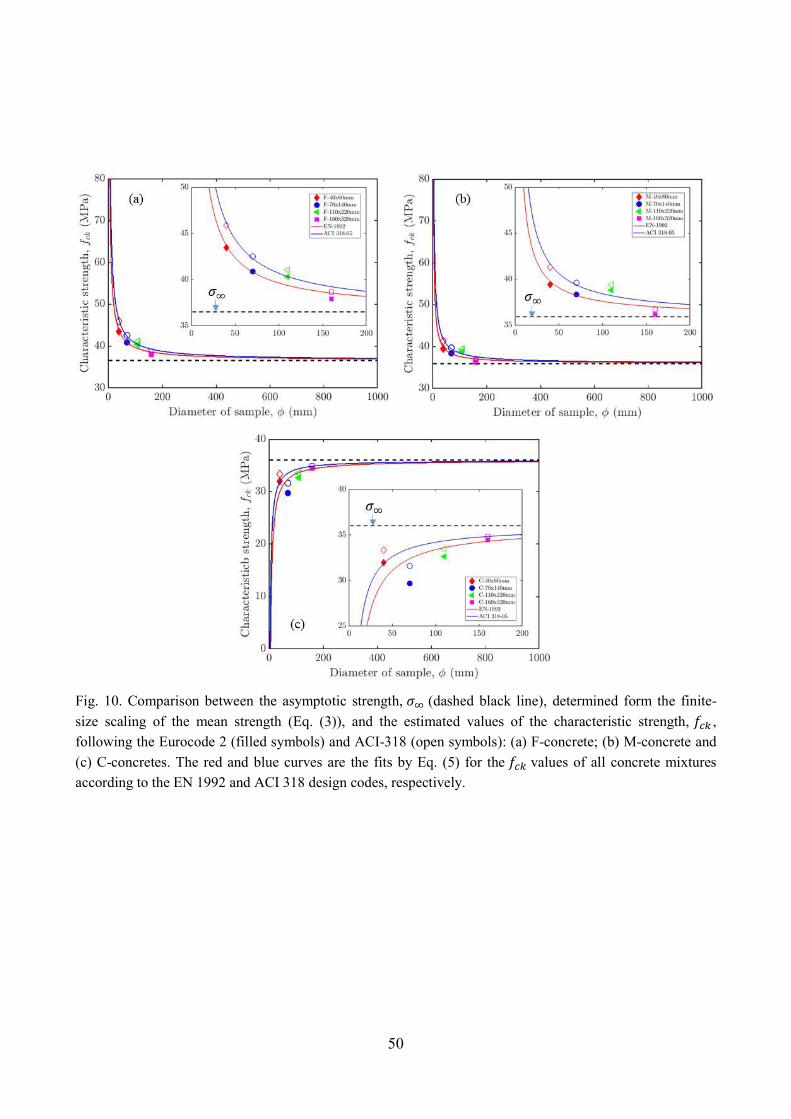
50
Fig. 10. Comparison between the asymptotic strength, 𝜎 (dashed black line), determined form the finite-
size scaling of the mean strength (Eq. (3)), and the estimated values of the characteristic strength, 𝑓 , following the Eurocode 2 (filled symbols) and ACI-318 (open symbols): (a) F-concrete; (b) M-concrete and
(c) C-concretes. The red and blue curves are the fits by Eq. (5) for the 𝑓 values of all concrete mixtures according to the EN 1992 and ACI 318 design codes, respectively.

51
Fig. 11. Relationship between the length scale (𝐿 ) and the product 𝑝 × 𝑑 , .

52
Fig. A.1. Image analysis procedure of the pore structure: (a) cutting sections of the concrete sample; (b) concrete sample surface after grinding and polishing; (c) scanned image of pores after the contrast enhancement operation; (d) binary image of pores obtained after thresholding. (adapted from [15]).

53
Fig. A.2. Comparison of the pore structure for three different concrete mixtures; (a) F-110x220mm; (b) M-110x220mm; (c) C-110x220mm. Top figures are the original scanned images and bottom figures are the corresponding binary images of pores. (from [15]).

54
Fig. A.3. Size distribution of pores per unit volume for different concrete samples. (a) F-concrete; (b) M-concrete; (c) C-concrete and (d) All concrete samples.