Original Research Article Statistical Modelling of Compressive ...
10
331 Nigerian Research Journal of Engineering and Environmental Sciences 4(1) 2019 pp. 331-340 Original Research Article Statistical Modelling of Compressive Strength of Hollow Sandcrete Blocks *Osegbowa, D.E. and Orie, U.O. Department of Civil Engineering, Faculty of Engineering, University of Benin, Benin City, Nigeria. *[email protected]; [email protected] ARTICLE INFORMATION ABSTRACT Article history: Received 31 December, 2018 Revised 15 March, 2019 Accepted 24 March, 2019 Available online 30 June, 2019 Sandcrete blocks are used as load and non-load bearing walls in the construction of buildings, and structures. The variations in the quality and quantity of its constituent materials with the methods of curing affect the compressive strength of sandcrete blocks. Modelling using multiple regression approach was used to develop a compressive strength model in terms of constituent materials for 28 days curing age of hollow sandcrete blocks made with St Saviour fine aggregate sourced from Benin City, Edo State, Nigeria. The model formulated for 28 days compressive strength using Microsoft Excel gave coefficient of determination (R 2 ) of 0.9879 for the hollow sandcrete block, indicating good correlation. The student – t and F – distribution tests also showed that the model was adequate for hollow sandcrete blocks compressive strength prediction. The formulated model eliminates trial and error of mixes, reduce cost and time of production of hollow sandcrete blocks. © 2019 RJEES. All rights reserved. Keywords: Sandcrete blocks Compressive strength Modelling Student-t test F-distribution test 1. INTRODUCTION Sandcrete block is a composite material made up of water, cement, and sand and it differs from concrete in terms of material composition due to the non-inclusion of coarse aggregate in the mix and from mortar in that the slump is zero (NIS, 2004). Anosike (2011) revealed that sandcrete technology or block moulding is becoming the backbone of infrastructural development of every country. The lack of adherence to standards and quality control result in the production of sub-standard materials, the use of which has dangerous consequences for the building delivery process such as rampant building failure or collapse which in many instances involve loss of human lives and high maintenance cost of buildings and structures. A study carried out in Benin City showed that the maximum and minimum strength of sandcrete blocks for 28 days curing period were 2.60 N/mm 2 and 0.96 N/mm 2 , while 27% out of the 90 blocks tested did not meet the minimum requirements (Alohan, 2002). Sandcrete blocks are widely used in Nigeria and other countries like Ghana as walling units for load bearing and non-load bearing structures (Oyekan and Kamiyo, 2011; Anosike and Oyebade, 2012; Morenikeji et al., 2015). Sandcrete blocks can be made either in solid or hollow form and the most commonly available sizes are 450 mm x 225 mm x 225 mm for load bearing walls and 450 mm x 150 mm x 225 mm for non-load bearing walls (Odeyemi et al., 2015).
-
Upload
khangminh22 -
Category
Documents
-
view
0 -
download
0
Transcript of Original Research Article Statistical Modelling of Compressive ...
331
Nigerian Research Journal of Engineering and Environmental Sciences 4(1) 2019 pp. 331-340
Original Research Article
Statistical Modelling of Compressive Strength of Hollow Sandcrete Blocks
*Osegbowa, D.E. and Orie, U.O. Department of Civil Engineering, Faculty of Engineering, University of Benin, Benin City, Nigeria.
*[email protected]; [email protected]
ARTICLE INFORMATION ABSTRACT
Article history:
Received 31 December, 2018
Revised 15 March, 2019
Accepted 24 March, 2019
Available online 30 June, 2019
Sandcrete blocks are used as load and non-load bearing walls in
the construction of buildings, and structures. The variations in the
quality and quantity of its constituent materials with the methods
of curing affect the compressive strength of sandcrete blocks.
Modelling using multiple regression approach was used to
develop a compressive strength model in terms of constituent
materials for 28 days curing age of hollow sandcrete blocks made
with St Saviour fine aggregate sourced from Benin City, Edo
State, Nigeria. The model formulated for 28 days compressive
strength using Microsoft Excel gave coefficient of determination
(R2) of 0.9879 for the hollow sandcrete block, indicating good
correlation. The student – t and F – distribution tests also showed
that the model was adequate for hollow sandcrete blocks
compressive strength prediction. The formulated model
eliminates trial and error of mixes, reduce cost and time of
production of hollow sandcrete blocks.
© 2019 RJEES. All rights reserved.
Keywords:
Sandcrete blocks
Compressive strength
Modelling
Student-t test
F-distribution test
1. INTRODUCTION
Sandcrete block is a composite material made up of water, cement, and sand and it differs from concrete in
terms of material composition due to the non-inclusion of coarse aggregate in the mix and from mortar in
that the slump is zero (NIS, 2004). Anosike (2011) revealed that sandcrete technology or block moulding is
becoming the backbone of infrastructural development of every country. The lack of adherence to standards
and quality control result in the production of sub-standard materials, the use of which has dangerous
consequences for the building delivery process such as rampant building failure or collapse which in many
instances involve loss of human lives and high maintenance cost of buildings and structures. A study carried
out in Benin City showed that the maximum and minimum strength of sandcrete blocks for 28 days curing
period were 2.60 N/mm2 and 0.96 N/mm2, while 27% out of the 90 blocks tested did not meet the minimum
requirements (Alohan, 2002). Sandcrete blocks are widely used in Nigeria and other countries like Ghana as
walling units for load bearing and non-load bearing structures (Oyekan and Kamiyo, 2011; Anosike and
Oyebade, 2012; Morenikeji et al., 2015). Sandcrete blocks can be made either in solid or hollow form and
the most commonly available sizes are 450 mm x 225 mm x 225 mm for load bearing walls and 450 mm x
150 mm x 225 mm for non-load bearing walls (Odeyemi et al., 2015).

332 D.E. Osegbowa and U.O. Orie / Nigerian Research Journal of Engineering and Environmental Sciences
4(1) 2019 pp. 331-340 Building materials account for over 60 percent of the total cost of building construction projects. Therefore,
their quality is of primary concern for their reliabilities and efficient performances in buildings (Okereke,
2002). One of the most important qualities of hollow sandcrete blocks is its compressive strength and there
are many factors that affect it such as quality, grading and density of fine aggregates/sand, curing conditions,
quality control, vibration time, quality/amount of water used, cement-sand mix ratios, cavity volume and
centre-web to end-web ratio (Abdullahi, 2005; Oyekan, 2008; Mahmoud et al., 2010; Omoregie, 2012;
Ezeokonkwo 2012; Adeyeye, 2013; Onwuka et al., 2013; Ewa and Ukpata, 2013).
Many researchers have developed and used different models to ascertain different properties of sandcrete
blocks, and concrete, with a view to reducing cost of production and meeting the standards as stipulated in
the relevant codes of practice (Sedat et al., 2004; Palika and Maneek, 2014; Osuji and Inerhunwa, 2015;
Ibrearugbulem; Ajoke, 20s16; Iyeke et al., 2016). This work thus applied multiple regression approach
(MRA) to solving invariable mix proportions of the constituent materials of hollow sandcrete blocks.
2. MATERIALS AND METHODS
2.1. Materials
The fine aggregate (sand) used for this work was collected from St Saviour pit in Benin City, Edo State. The
cement used for this work was Ordinary Portland Cement (OPC), Dangote brand, grade 42.5 while the water
used for this work was potable water, obtained from a tap and it was colourless, odourless, and tasteless.
2.2. Methods
2.2.1. Specific gravity determination
The procedure for its determination involves weighing density bottles and recorded as (M1) g, some cooled
quantities of oven dried sample was sieved through sieve 425 µm. Some sieved samples were used to fill the
density bottles and weighed as (M2) g. The bottles with the sample were then filled with distilled water,
shaken to ensure removal of air, and then left for 24 hours. After shaking the bottle and its content, it was
weighed and noted as M3 (g). After the 24 hours, the density bottle was emptied, washed and filled the
distilled water only, weighed and noted as M4 (g). The readings were tabulated and the specific gravity were
computed for each bottle and the average value taken as the specific gravity. The specific gravity was
computed using Equation 1.
Specific gravity (Gs) = �����
��������������� (1)
2.2.2. Sieve analysis of the fine aggregate
The sieve analysis was carried out by shaking the fine aggregate through a stack of screen with openings of
known sizes. The equipment used for this analysis includes British sieve, mechanical shaker and a balance
device for measuring the weight of the sample. The procedure was carried out by weighing out a sample of
the sand and oven dried for twenty-four hours at 110 oC (100 g of the sand sample). The sieves were arranged
in order of decreasing diameter and a pan was placed after the smallest sieve. The fine aggregate was sieved
through the nest of the sieves by using a mechanical shaker. The sieve sizes are numbered as follows: 236,
200, 1.18, 600, 425, 300, 212, 150, and 75 respectively and a pan arranged in that order with 5 mm carrying
the sand at the top of the assembly which in turn was firmly clamped on the top of the shaker. After the
sieving was conducted by mechanical shaker, the sand retained on each of sieve (including any material
cleared from the mesh was weighed and expressed as percentage of the weight of the total sample.

333 D.E. Osegbowa and U.O. Orie / Nigerian Research Journal of Engineering and Environmental Sciences
4(1) 2019 pp. 331-340 Percentage retained =
�� � ����������� �� � × 100 (2)
The gradation curve obtained from the sieve analysis is used to determine coefficient of uniformity (Cu) and
the coefficient of gradation, (Cc).
�� = ������
(3)
C = ����������
(4)
Where D10, D30, D60 are particle size diameters corresponding to 10, 30 and 60% passing on the cumulative
size distribution(gradation) curve respectively.
2.2.3. Mix proportions
Findings from block industries in Nigeria showed that the average value of water cement ratio is between
0.6 to 0.7, while the sand-cement ratio is 8.0 (Obodoh, 1999). Cement/sand ratio of 1:6 was also
recommended in for sandcrete block production (NBC, 2006). Based on these, values for water-cement ratios
adopted were 0.50, 0.55, 0.6, 0.65 and 0.70 while cement-sand ratios of 1:4, 1:5, 1:6, 1:8, 1:9, 1:10, and 1:12
were used as shown in Table 1.
2.2.4. Batching and mixing
The fine aggregates were batched by mass in the proportions of water and cement ratios. The constituent
materials were mixed with a mixer for about 75 seconds until a uniform colour and consistency were
observed. The equivalent quantities of each constituent material based on the different mixes were done
using the averages weight of 450 mm x 225 mm x 225 mm blocks (Nzeh, 2008).
Average weight of 450 mm x 225 mm x 225 mm is 23.50 kg. 15% was added to take care of wastes and
slump to obtain: 23.50 × 1.15 = 27.025 kg.
Based on the ratios of constituent materials, their weights were calculated from 27.025 kg. For mix ratio of
cement:sand (1:4) and water-cement ratio of 0.5.
Total ratio = 1 + 4 + 0.5 = 5.50
!".$!%%.% × 1 = 4.91 kg of cement
27.0255.5 × 4 = 19.65 kg of sand
27.0255.5 × 0.5 = 2.46 kg of water
The results of the mix proportions by weight of (fine aggregates, cement and water) from each of the mix
ratios are shown in Table 1.

334 D.E. Osegbowa and U.O. Orie / Nigerian Research Journal of Engineering and Environmental Sciences
4(1) 2019 pp. 331-340 Table 1: Mix ratios/proportions
Mix ratios Mix proportions (kg)
Water/cement Cement Sand Water Cement Sand
0.50 1 4 2.46 4.91 19.65
0.50 1 5 2.08 4.16 20.79
0.55 1 6 1.97 3.58 21.48
0.60 1 8 1.65 2.78 22.06
0.60 1 9 1.53 2.55 22.95
0.65 1 10 1.51 2.32 23.20
0.70 1 12 1.38 1.97 23.67
2.2.5. Manufacture of hollow sandcrete blocks
The moulding of the sandcrete blocks were carried out with a machine with metal mould to produce 450 mm
x 225 mm x 225 mm hollow block. The process involved filling the mould with the mixed components and
vibrating it for 10 seconds for compaction. One block was moulded at a time (i.e. one pallet, one block). Ten
blocks were moulded for each mix ratio, thus making a total of seventy (70) blocks moulded for the
compressive strength test.
2.2.5.1. Mould size and void computation of the sandcrete blocks
As shown in figure 1, the size of the mould used in making the hollow sandcrete blocks is as follows: t = 50
mm, y = 150 mm, a = 125 mm, b = 225 mm
Net volume = 450 x 225 x 225 = 22781250 mm3
Volume of void = 2 x 225 x 125 x 150 = 8437500 mm3
Percentage of void =:;<"%$$ ×=$$
!!":=!%$ = 37.04%.
The percentage volume of solid materials is given as 100 – 37.04 = 62.96%. This meant the sandcrete block
mould condition of solid material between 50% and 75% of the total volume of sandcrete block, calculated
from the overall dimensions (Nzeh, 2008). The web of the mould used in making the hollow sandcrete blocks
was 50 mm as stipulated by NIS (2007).
Figure 1: Mould size and void computation of the hollow sandcrete blocks
335 D.E. Osegbowa and U.O. Orie / Nigerian Research Journal of Engineering and Environmental Sciences
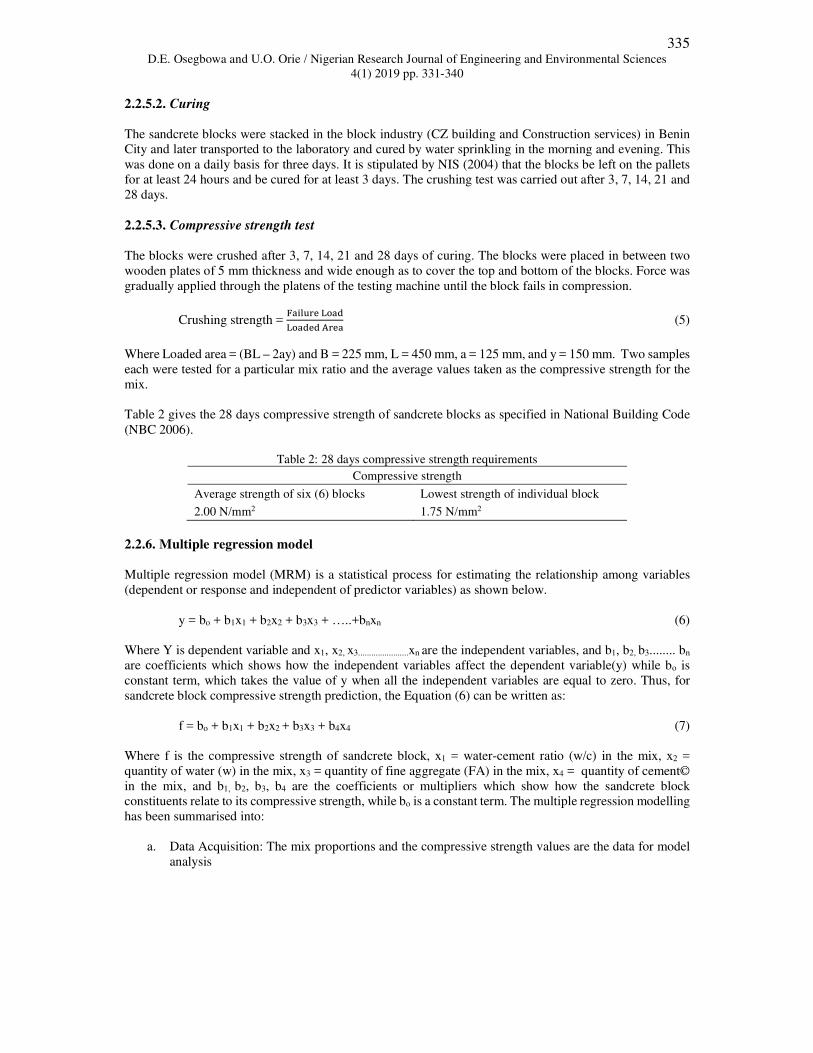
4(1) 2019 pp. 331-340 2.2.5.2. Curing
The sandcrete blocks were stacked in the block industry (CZ building and Construction services) in Benin
City and later transported to the laboratory and cured by water sprinkling in the morning and evening. This
was done on a daily basis for three days. It is stipulated by NIS (2004) that the blocks be left on the pallets
for at least 24 hours and be cured for at least 3 days. The crushing test was carried out after 3, 7, 14, 21 and
28 days.
2.2.5.3. Compressive strength test
The blocks were crushed after 3, 7, 14, 21 and 28 days of curing. The blocks were placed in between two
wooden plates of 5 mm thickness and wide enough as to cover the top and bottom of the blocks. Force was
gradually applied through the platens of the testing machine until the block fails in compression.
Crushing strength = @���A� B���B���� C�� (5)
Where Loaded area = (BL – 2ay) and B = 225 mm, L = 450 mm, a = 125 mm, and y = 150 mm. Two samples
each were tested for a particular mix ratio and the average values taken as the compressive strength for the
mix.
Table 2 gives the 28 days compressive strength of sandcrete blocks as specified in National Building Code
(NBC 2006).
Table 2: 28 days compressive strength requirements
Compressive strength
Average strength of six (6) blocks Lowest strength of individual block
2.00 N/mm2 1.75 N/mm2
2.2.6. Multiple regression model
Multiple regression model (MRM) is a statistical process for estimating the relationship among variables
(dependent or response and independent of predictor variables) as shown below.
y = bo + b1x1 + b2x2 + b3x3 + …..+bnxn (6)
Where Y is dependent variable and x1, x2, x3.......................xn are the independent variables, and b1, b2, b3........ bn
are coefficients which shows how the independent variables affect the dependent variable(y) while bo is
constant term, which takes the value of y when all the independent variables are equal to zero. Thus, for
sandcrete block compressive strength prediction, the Equation (6) can be written as:
f = bo + b1x1 + b2x2 + b3x3 + b4x4 (7)
Where f is the compressive strength of sandcrete block, x1 = water-cement ratio (w/c) in the mix, x2 =
quantity of water (w) in the mix, x3 = quantity of fine aggregate (FA) in the mix, x4 = quantity of cement©
in the mix, and b1, b2, b3, b4 are the coefficients or multipliers which show how the sandcrete block
constituents relate to its compressive strength, while bo is a constant term. The multiple regression modelling
has been summarised into:
a. Data Acquisition: The mix proportions and the compressive strength values are the data for model
analysis
336 D.E. Osegbowa and U.O. Orie / Nigerian Research Journal of Engineering and Environmental Sciences
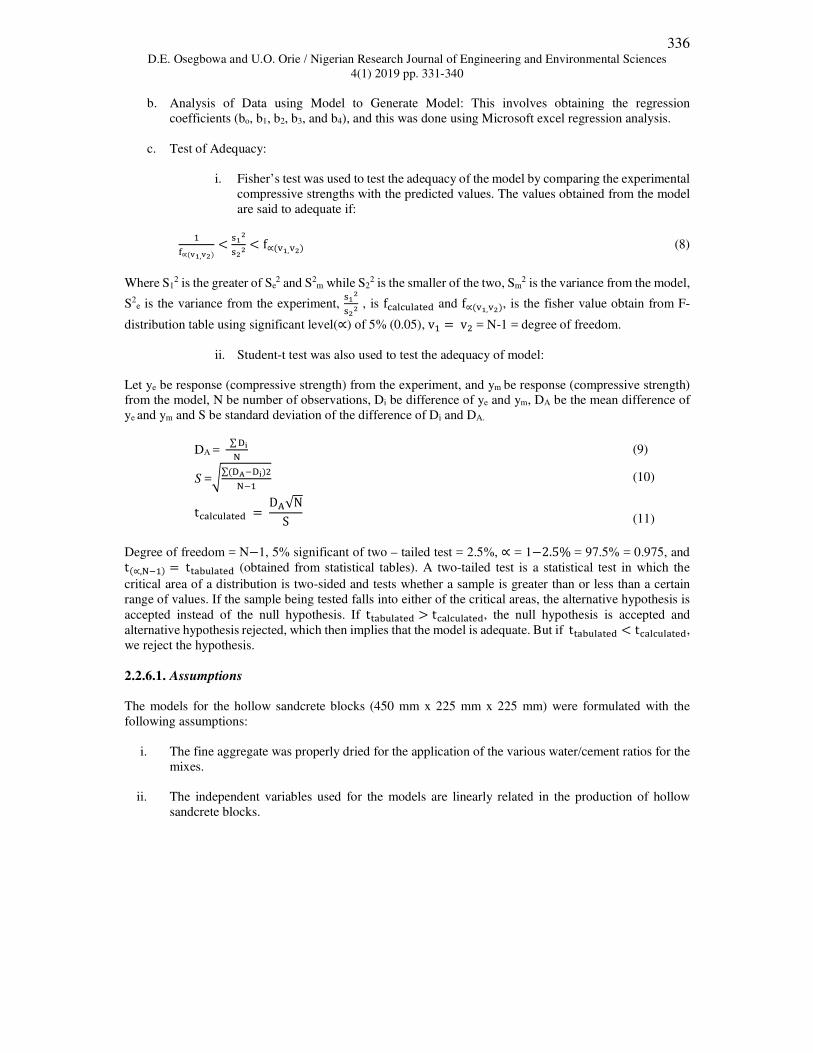
4(1) 2019 pp. 331-340 b. Analysis of Data using Model to Generate Model: This involves obtaining the regression
coefficients (bo, b1, b2, b3, and b4), and this was done using Microsoft excel regression analysis.
c. Test of Adequacy:
i. Fisher’s test was used to test the adequacy of the model by comparing the experimental
compressive strengths with the predicted values. The values obtained from the model
are said to adequate if:
=D∝�F�,F��
< I��I�� < f∝�J�,J�� (8)
Where S12 is the greater of Se
2 and S2m while S2
2 is the smaller of the two, Sm2 is the variance from the model,
S2e is the variance from the experiment,
I��I�� , is fK��KA���� and f∝�J�,J��, is the fisher value obtain from F-
distribution table using significant level(∝) of 5% (0.05), v= = v! = N-1 = degree of freedom.
ii. Student-t test was also used to test the adequacy of model:
Let ye be response (compressive strength) from the experiment, and ym be response (compressive strength)
from the model, N be number of observations, Di be difference of ye and ym, DA be the mean difference of
ye and ym and S be standard deviation of the difference of Di and DA.
DA = ∑ �NO (9)
S =P∑��Q��N�!O�= (10)
tK��KA���� = DC√NS
(11)
Degree of freedom = N−1, 5% significant of two – tailed test = 2.5%, ∝ = 1−2.5% = 97.5% = 0.975, and
t�∝,O�=� = t��WA���� (obtained from statistical tables). A two-tailed test is a statistical test in which the
critical area of a distribution is two-sided and tests whether a sample is greater than or less than a certain
range of values. If the sample being tested falls into either of the critical areas, the alternative hypothesis is
accepted instead of the null hypothesis. If t��WA���� > tK��KA����, the null hypothesis is accepted and
alternative hypothesis rejected, which then implies that the model is adequate. But if t��WA���� < tK��KA����,
we reject the hypothesis.
2.2.6.1. Assumptions
The models for the hollow sandcrete blocks (450 mm x 225 mm x 225 mm) were formulated with the
following assumptions:
i. The fine aggregate was properly dried for the application of the various water/cement ratios for the
mixes.
ii. The independent variables used for the models are linearly related in the production of hollow
sandcrete blocks.

337 D.E. Osegbowa and U.O. Orie / Nigerian Research Journal of Engineering and Environmental Sciences
4(1) 2019 pp. 331-340 3. RESULTS AND DISCUSSION
3.1. Specific Gravity
The specific gravity of St Saviour fine aggregate was 2.65 while the percent passing for sieve No. 25 was
46.82%. Also, the coefficient of curvature (CC) and uniformity (Cu) were 2.44 and 6.10 respectively. Thus,
the fine aggregate sample was well graded soil as it met the conditions (Cu ≥ 6 and 1< Cc ≥ 3) for well graded
soils (West, 1995; Tezaghi et al., 1996).
3.2. Compressive Strength
The compressive strengths of the hollow sandcrete blocks as shown in Tables 3 increased with increase in
cement contents and curing ages with the maximum values obtained at 28 days. The compressive strength
of the hollow sandcrete blocks were high in that they were produced with block vibrating machine thus
conforming to the conclusion given by Odeyemi et al. (2015). The 28 days compressive strength of the
hollow sandcrete blocks made with cement/sand ratio of 1:6 as commended by NBC (2006) and water
cement ratio of 0.55, met the minimum compressive strength requirement of 1.75 N/mm2 and 2.76 N/mm2
as recommended by NIS (2007) and reported by Anya, (2015).
Table 3: Compressive strengths of the hollow sandcrete blocks
Mix ratios Compressive strength (N/mm2)
3 7 14 21 28
0.50:1:4 1.89 2.15 2.63 3.10 3.78
0.50:1:5 1.60 1.75 2.46 2.89 3.55
0.55:1:6 1.36 1.69 2.38 2.58 3.49
0.60:1:8 1.02 1.33 1.69 2.10 2.88
0.60:1:9 0.93 1.21 1.49 1.89 2.65
0.65:1:10 0.81 1.13 1.32 1.69 2.23
0.70:1:12 0.62 0.78 1.02 1.25 1.88
3.3. Determination Model Fit
The 28 days compressive strength model of hollow sandcrete block obtained is given as:
F28 = 12.6166 - 11.8026x1 + 3.4563x2 - 0.1747x3 - 1.6201x4 (12)
Where F = the compressive strength (N/mm2) of the sandcrete blocks, x1 = water-cement ratio(w/c), x2 =
quantity of water(w) in (kg), x3 = quantity of fine aggregate (kg), and x4= quantity of cement (kg).
As seen in Table 4, the coefficient of determination (R2) was 0.9879 which indicates that the independent
variables had 98.79% of variation of the dependent variable (compressive strength) for 28 days curing of the
hollow sandcrete blocks. The correlation between predicted and observed compressive strength was 0.9939.
The multiple regression approach (MRA) - which is a statistical process used for this study was found to be
adequate for the prediction of compressive strength of hollow sandcrete blocks, as shown in Table 5 and the
test of adequacy.

338 D.E. Osegbowa and U.O. Orie / Nigerian Research Journal of Engineering and Environmental Sciences
4(1) 2019 pp. 331-340 Table 4: 28 days compressive strength coefficient and regression statistics
Regression Statistics
Multiple R 0.9939
R Squared 0.9879
Adjusted R Squared 0.9638
Table 5: 28 days observed and predicted compressive strength for the hollow sandcrete blocks
S/N
Observed
compressive Strength
(N/mm2)
Predicted
compressive strength
(N/mm2)
1 3.78 3.83
2 3.55 3.53
3 3.49 3.38
4 2.88 2.88
5 2.65 2.68
6 2.23 2.35
7 1.88 1.80
3.4. Tests of Adequacy of the Models
a) Fisher Test: The regression analysis of the hollow sandcrete blocks had value of fcomputed to be 1.0122
while ftabulated to be 4.2839 for 28 days of curing using significance level of 0.05 and degree of freedom of 6,
thus satisfying =
Y∝�Z�,Z��< [��
[�� < \∝�]�,]��. Hence the 28 days model is adequate for the hollow sandcrete block.
b) Student t – test: The regression analysis of the hollow sandcrete blocks had value of tcomputed to be 1.06 x
10-14, while ttabulated to be 2.4469, for 28days of curing using significance level of 0.05 and degree of freedom
of 6. Since the ttatulated>tcomputed, the null hypothesis is accepted while alternate hypothesis is rejected, hence
the model is adequate.
4. CONCLUSION
The major objective of this work was to model the compressive strength of hollow sandcrete blocks made
with fine aggregate sourced from Benin City, Edo State, for 28 days ages. It was recommended that the
developed model can be used in predicting the compressive strength of hollow sandcrete blocks for 28 days
curing period.
5. ACKNOWLEDGEMENT
The authors wish to acknowledge the assistance and contributions of the staff of CZ building and
Construction services in Benin City and the laboratory staff of Department of Civil Engineering, Faculty of
Engineering, University of Benin, Benin City toward the success of this work.
6. CONFLICT OF INTEREST
There is no conflict of interest associated with this work.
339 D.E. Osegbowa and U.O. Orie / Nigerian Research Journal of Engineering and Environmental Sciences
4(1) 2019 pp. 331-340 REFERENCES
Abdullahi, M. (2005). Compressive Strength of Sandcrete Blocks in Bosso and Shiroro Areas of Mina, Nigeria. AU
Journal of Technology, 9(2), pp. 126-132.
Adeyeye, A.O. (2013). Strength Properties of Commercially produces Sandcrete Blocks in Ado Ekiti, Akure and Ile
Ife Nigeria. International Journal of Engineering Science Invention, 2(8), pp. 25-34.
Alohan, O. (2002). The Influence of Fine Aggregate Combinations and Vibration Time on the Compressive Strength
of Sandcrete Blocks in Benin City. B.ENG Project, Civil Engineering Department, University of Benin.
Anosike, M. N. (2011). Parameters for Good Site Concrete Production Management Practice in Nigeria. Unpublished
PhD Thesis, Covenant University, Ota, Nigeria.
Anya, C. U. (2015). Models for Predicting the Structural Characteristics of Sand-Quarry Dust Blocks. Ph.D Thesis,
Department of Civil Engineering, University of Nigeria, Nsukka.
Anosike, M. N. and Oyebade, A. A. (2012). Sandcrete Blocks and Quality Management in Nigeria Building Industry.
Journal of Engineering, Project, and Production Management. 2(1), pp. 37- 46.
Ewa, D.E. and Ukpata, J.O. (2013). Investigation of the Compressive Strengths of Commercial Sandcrete Blocks in
Calabar Nigeria. International Journal of Engineering and Technology, 3(4), pp. 447–482.
Ezeokonkwo, J. C. (2012). Optimisation of Cavity Size in Hollow Sandcrete Blocks. Journal of Emerging Trends in
Engineering and Applied Sciences (JETEAS), 3(1), pp. 86-90.
Ibrearugbulem, O. M and Ajoku, C. A. (2016). Prediction of the Flexural Strengths of Lightweight Periwinkle Shell-
River Gravel Concrete. International Journal of Engineering Sciences and Research Technology, 5(2), pp. 732–744.
Iyeke, S. D., Eze, E. O., Ehiorobo, J. O. and Osuji, S. O. (2016). Estimation of Shear Strength Parameters of Lateritic
Soils using Artificial Neural Network. Nigeria Journal of Technology, 35(2), pp. 260-269.
Mahmoud, H., Hamma, H. A. and Abba, H. A. (2010). Compressive strength of marketed sandcrete blocks produced
in Yola, Nigeria. Journal of Engineering and Applied Sciences, 2, pp. 72-81.
Morenikeji, G., Umaru, E. T., Liman, S. H. and Ajagbe, M. A. (2015). Application of Remote Sensing and
Geographic Information System in Monitoring the Dynamics of Land use in Minna, Niger State, Nigeria.
International Journal of Academic Research in Business and Social Sciences, 5(6), pp. 320-337.
National Building Code (NBC) (2006). Federal Republic of Nigeria, 1st Ed.
Nigerian Industrial Standard (NIS):(2004). Standard for Sandcrete Blocks approved by Standard Organization of
Nigeria (SON), Lagos, Nigeria.
Nigerian Industrial Standard (NIS) (2007). Standards for Sandcrete Blocks approved by Standard Organization of
Nigeria (SON). Lagos, Nigeria.
Nzeh, R. E. (2008). Standardization of Sandcrete – Block’s Strength through Mathematical Modeling and Precision.
M.ENG thesis, Department of Civil Engineering, University of Nigeria, Nsukka.
Obodoh, D. A. (1999). Optimization of Components Mix in Sandcrete Blocks using Fine Aggregates from Different
Sources. M.ENG Project, Civil Engineering Department, University of Nigeria, Nsukka.
Odeyemi, S. O, Otunola, O. O, Adeyemi, A. A, Oyeniyan, W. O and Olawuyi, M. Y. (2015). Compressive Strength of
Manual and Machine Compacted Sandcrete Hollow Blocks Produced from Brands of Nigerian Cement. American
Journal of Civil Engineering, 3(2-3), pp. 6 – 9.
Okereke, P.A. (2002). Climatic Conditions and Construction Materials: INFRADEV Associate, Owerri, Nigeria.
Omoregie, A. (2012). Impact of Vibration Time on Compressive Strength of Hardened Sandcrete Building Blocks.
Buildings, 2, pp. 153-172.
Onwuka, D.O., Osadebe, N.N. and Okere, C.E. (2013). Structural Characteristics of Sandcrete Blocks Produced in
South-East Nigeria. Journal of Innovative Research in Engineering and Sciences, 4(3), pp. 483-490.
Osuji, S. O. and Inerhunwa, I. (2015). Determination and Modelling of Effects of Variation in Fine Aggregate Size on
Concrete Properties. Journal of Emerging Trends in Engineering and Applied Science, 6(1), pp. 62–70.
Oyekan, G.L. (2008). Single and mix size coarse aggregate in sandcrete blocks production. Proceeding of the 33rd
Conference on our world in concrete and structures: 25-27. Singapore.
Oyekan, G.L and Kamiyo, M.O. (2011). A study on the engineering properties of sandcrete blocks produced with rice
husk ash blended cement. Journal of Engineering and Technology Research, 3(3), pp. 88-98.

340 D.E. Osegbowa and U.O. Orie / Nigerian Research Journal of Engineering and Environmental Sciences
4(1) 2019 pp. 331-340 Palika, S. R. and Maneek, K. (2014). Regression Models for the Prediction of Compressive Strength of Concrete with
and without Fly Ash. International Journal of Latest Trends in Engineering and Technology, 3(4), pp. 400–406.
Sedat, A, Gokmen, T and Sever, C. (2004). Fuzzy Logic Model for the Prediction of Cement Compressive Strength.
Cement and Concrete Research, 34, pp. 1429–1433.
Tezaghi, K., Peck, K., and Mersri, G. (1996). Soil Mechanic in Engineering Practice. 3rd Ed., John Wiley and Sons,
New York, USA.
West, T. (1995). Geology Applied to Engineering. Prentice Hall; Upper Saddle River, NJ, USA.