Fingerprinting petroleum hydrocarbons in plankton and surface sediments during the spring and early...
26
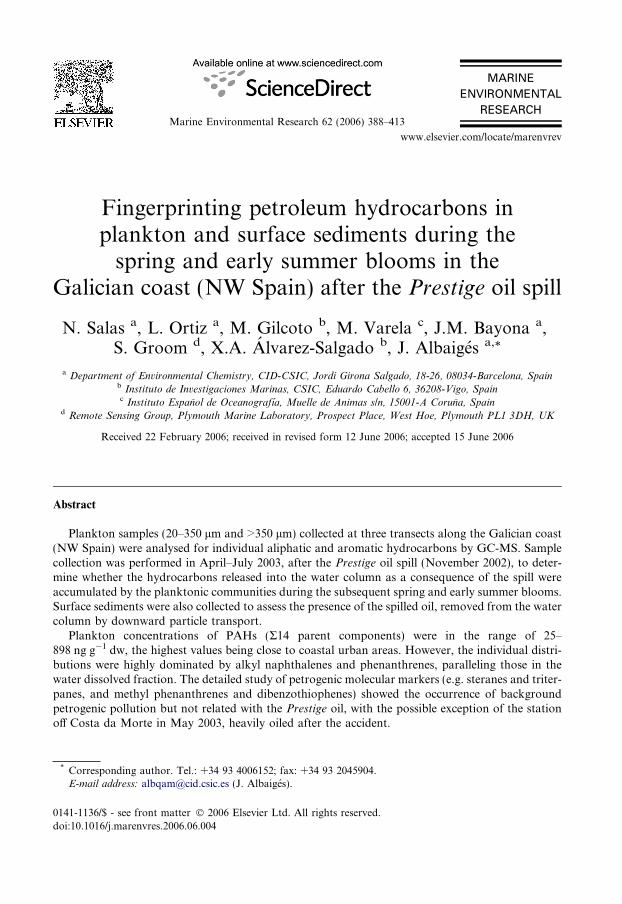
Fingerprinting petroleum hydrocarbons in plankton and surface sediments during the spring and early summer blooms in the Galician coast (NW Spain) after the Prestige oil spill N. Salas a , L. Ortiz a , M. Gilcoto b , M. Varela c , J.M. Bayona a , S. Groom d , X.A. A ´ lvarez-Salgado b , J. Albaige ´s a, * a Department of Environmental Chemistry, CID-CSIC, Jordi Girona Salgado, 18-26, 08034-Barcelona, Spain b Instituto de Investigaciones Marinas, CSIC, Eduardo Cabello 6, 36208-Vigo, Spain c Instituto Espan ˜ol de Oceanografı ´a, Muelle de Animas s/n, 15001-A Corun ˜a, Spain d Remote Sensing Group, Plymouth Marine Laboratory, Prospect Place, West Hoe, Plymouth PL1 3DH, UK Received 22 February 2006; received in revised form 12 June 2006; accepted 15 June 2006 Abstract Plankton samples (20–350 lm and >350 lm) collected at three transects along the Galician coast (NW Spain) were analysed for individual aliphatic and aromatic hydrocarbons by GC-MS. Sample collection was performed in April–July 2003, after the Prestige oil spill (November 2002), to deter- mine whether the hydrocarbons released into the water column as a consequence of the spill were accumulated by the planktonic communities during the subsequent spring and early summer blooms. Surface sediments were also collected to assess the presence of the spilled oil, removed from the water column by downward particle transport. Plankton concentrations of PAHs (R14 parent components) were in the range of 25– 898 ng g 1 dw, the highest values being close to coastal urban areas. However, the individual distri- butions were highly dominated by alkyl naphthalenes and phenanthrenes, paralleling those in the water dissolved fraction. The detailed study of petrogenic molecular markers (e.g. steranes and triter- panes, and methyl phenanthrenes and dibenzothiophenes) showed the occurrence of background petrogenic pollution but not related with the Prestige oil, with the possible exception of the station off Costa da Morte in May 2003, heavily oiled after the accident. 0141-1136/$ - see front matter Ó 2006 Elsevier Ltd. All rights reserved. doi:10.1016/j.marenvres.2006.06.004 * Corresponding author. Tel.: +34 93 4006152; fax: +34 93 2045904. E-mail address: [email protected] (J. Albaige ´s). Marine Environmental Research 62 (2006) 388–413 www.elsevier.com/locate/marenvrev MARINE ENVIRONMENTAL RESEARCH
-
Upload
independent -
Category
Documents
-
view
1 -
download
0
Transcript of Fingerprinting petroleum hydrocarbons in plankton and surface sediments during the spring and early...
MARINE
Marine Environmental Research 62 (2006) 388–413
www.elsevier.com/locate/marenvrev
ENVIRONMENTAL
RESEARCH
Fingerprinting petroleum hydrocarbons inplankton and surface sediments during the
spring and early summer blooms in theGalician coast (NW Spain) after the Prestige oil spill
N. Salas a, L. Ortiz a, M. Gilcoto b, M. Varela c, J.M. Bayona a,S. Groom d, X.A. Alvarez-Salgado b, J. Albaiges a,*
a Department of Environmental Chemistry, CID-CSIC, Jordi Girona Salgado, 18-26, 08034-Barcelona, Spainb Instituto de Investigaciones Marinas, CSIC, Eduardo Cabello 6, 36208-Vigo, Spainc Instituto Espanol de Oceanografıa, Muelle de Animas s/n, 15001-A Coruna, Spain
d Remote Sensing Group, Plymouth Marine Laboratory, Prospect Place, West Hoe, Plymouth PL1 3DH, UK
Received 22 February 2006; received in revised form 12 June 2006; accepted 15 June 2006
Abstract
Plankton samples (20–350 lm and >350 lm) collected at three transects along the Galician coast(NW Spain) were analysed for individual aliphatic and aromatic hydrocarbons by GC-MS. Samplecollection was performed in April–July 2003, after the Prestige oil spill (November 2002), to deter-mine whether the hydrocarbons released into the water column as a consequence of the spill wereaccumulated by the planktonic communities during the subsequent spring and early summer blooms.Surface sediments were also collected to assess the presence of the spilled oil, removed from the watercolumn by downward particle transport.
Plankton concentrations of PAHs (R14 parent components) were in the range of 25–898 ng g�1 dw, the highest values being close to coastal urban areas. However, the individual distri-butions were highly dominated by alkyl naphthalenes and phenanthrenes, paralleling those in thewater dissolved fraction. The detailed study of petrogenic molecular markers (e.g. steranes and triter-panes, and methyl phenanthrenes and dibenzothiophenes) showed the occurrence of backgroundpetrogenic pollution but not related with the Prestige oil, with the possible exception of the stationoff Costa da Morte in May 2003, heavily oiled after the accident.
0141-1136/$ - see front matter � 2006 Elsevier Ltd. All rights reserved.
doi:10.1016/j.marenvres.2006.06.004
* Corresponding author. Tel.: +34 93 4006152; fax: +34 93 2045904.E-mail address: [email protected] (J. Albaiges).
N. Salas et al. / Marine Environmental Research 62 (2006) 388–413 389
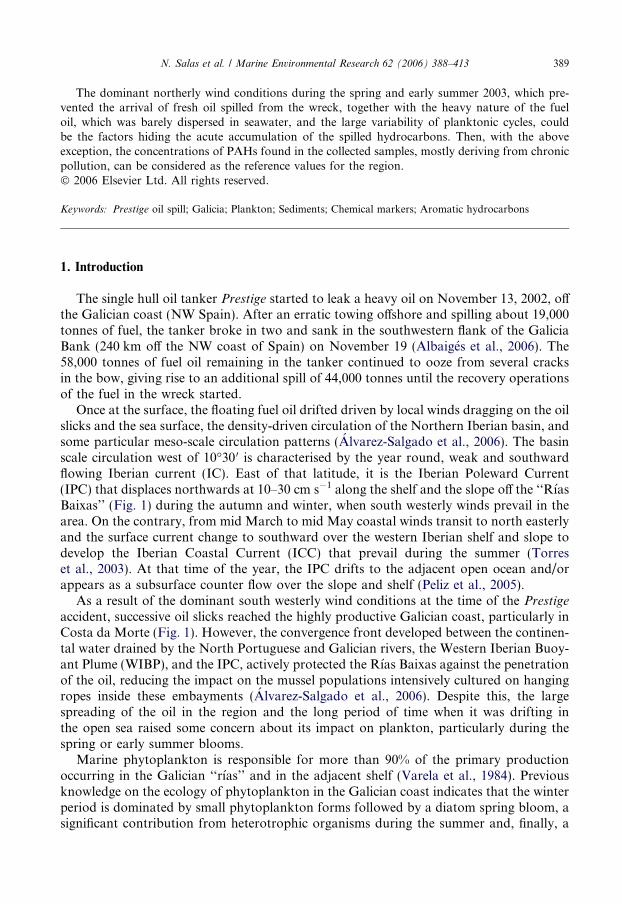
The dominant northerly wind conditions during the spring and early summer 2003, which pre-vented the arrival of fresh oil spilled from the wreck, together with the heavy nature of the fueloil, which was barely dispersed in seawater, and the large variability of planktonic cycles, couldbe the factors hiding the acute accumulation of the spilled hydrocarbons. Then, with the aboveexception, the concentrations of PAHs found in the collected samples, mostly deriving from chronicpollution, can be considered as the reference values for the region.� 2006 Elsevier Ltd. All rights reserved.
Keywords: Prestige oil spill; Galicia; Plankton; Sediments; Chemical markers; Aromatic hydrocarbons
1. Introduction
The single hull oil tanker Prestige started to leak a heavy oil on November 13, 2002, offthe Galician coast (NW Spain). After an erratic towing offshore and spilling about 19,000tonnes of fuel, the tanker broke in two and sank in the southwestern flank of the GaliciaBank (240 km off the NW coast of Spain) on November 19 (Albaiges et al., 2006). The58,000 tonnes of fuel oil remaining in the tanker continued to ooze from several cracksin the bow, giving rise to an additional spill of 44,000 tonnes until the recovery operationsof the fuel in the wreck started.
Once at the surface, the floating fuel oil drifted driven by local winds dragging on the oilslicks and the sea surface, the density-driven circulation of the Northern Iberian basin, andsome particular meso-scale circulation patterns (Alvarez-Salgado et al., 2006). The basinscale circulation west of 10�30 0 is characterised by the year round, weak and southwardflowing Iberian current (IC). East of that latitude, it is the Iberian Poleward Current(IPC) that displaces northwards at 10–30 cm s�1 along the shelf and the slope off the ‘‘RıasBaixas’’ (Fig. 1) during the autumn and winter, when south westerly winds prevail in thearea. On the contrary, from mid March to mid May coastal winds transit to north easterlyand the surface current change to southward over the western Iberian shelf and slope todevelop the Iberian Coastal Current (ICC) that prevail during the summer (Torreset al., 2003). At that time of the year, the IPC drifts to the adjacent open ocean and/orappears as a subsurface counter flow over the slope and shelf (Peliz et al., 2005).
As a result of the dominant south westerly wind conditions at the time of the Prestige
accident, successive oil slicks reached the highly productive Galician coast, particularly inCosta da Morte (Fig. 1). However, the convergence front developed between the continen-tal water drained by the North Portuguese and Galician rivers, the Western Iberian Buoy-ant Plume (WIBP), and the IPC, actively protected the Rıas Baixas against the penetrationof the oil, reducing the impact on the mussel populations intensively cultured on hangingropes inside these embayments (Alvarez-Salgado et al., 2006). Despite this, the largespreading of the oil in the region and the long period of time when it was drifting inthe open sea raised some concern about its impact on plankton, particularly during thespring or early summer blooms.
Marine phytoplankton is responsible for more than 90% of the primary productionoccurring in the Galician ‘‘rıas’’ and in the adjacent shelf (Varela et al., 1984). Previousknowledge on the ecology of phytoplankton in the Galician coast indicates that the winterperiod is dominated by small phytoplankton forms followed by a diatom spring bloom, asignificant contribution from heterotrophic organisms during the summer and, finally, a
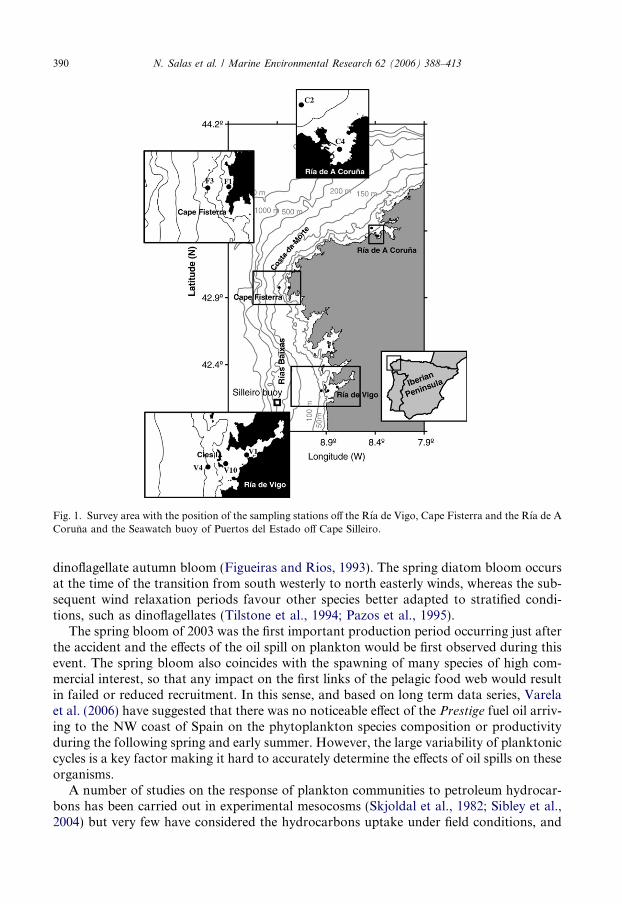
Fig. 1. Survey area with the position of the sampling stations off the Rıa de Vigo, Cape Fisterra and the Rıa de ACoruna and the Seawatch buoy of Puertos del Estado off Cape Silleiro.
390 N. Salas et al. / Marine Environmental Research 62 (2006) 388–413
dinoflagellate autumn bloom (Figueiras and Rios, 1993). The spring diatom bloom occursat the time of the transition from south westerly to north easterly winds, whereas the sub-sequent wind relaxation periods favour other species better adapted to stratified condi-tions, such as dinoflagellates (Tilstone et al., 1994; Pazos et al., 1995).
The spring bloom of 2003 was the first important production period occurring just afterthe accident and the effects of the oil spill on plankton would be first observed during thisevent. The spring bloom also coincides with the spawning of many species of high com-mercial interest, so that any impact on the first links of the pelagic food web would resultin failed or reduced recruitment. In this sense, and based on long term data series, Varelaet al. (2006) have suggested that there was no noticeable effect of the Prestige fuel oil arriv-ing to the NW coast of Spain on the phytoplankton species composition or productivityduring the following spring and early summer. However, the large variability of planktoniccycles is a key factor making it hard to accurately determine the effects of oil spills on theseorganisms.
A number of studies on the response of plankton communities to petroleum hydrocar-bons has been carried out in experimental mesocosms (Skjoldal et al., 1982; Sibley et al.,2004) but very few have considered the hydrocarbons uptake under field conditions, and

N. Salas et al. / Marine Environmental Research 62 (2006) 388–413 391
particularly of polycyclic aromatic hydrocarbons (PAHs) (Mackie et al., 1978; Middle-ditch et al., 1979; Serrazanetti et al., 1991; Kowaleska and Konat, 1997). The aim ofthe present study is to determine whether the hydrocarbons released into the pelagic sys-tem as a consequence of the Prestige oil spill were accumulated by the planktonic commu-nities in the NW shelf of the Iberian Peninsula during the spring and early summer 2003,being potentially harmful for the pelagic food web. On the other hand, as zooplankton hasalso been recognized to play a significant role in relation to the mechanisms of removinghydrophobic pollutants from surface waters to the sea floor through faecal pellets deposi-tion (Prahl and Carpenter, 1979), surface sediments were collected at the sampling stationsto assess the presence of the spilled oil.
2. Experimental
2.1. Sampling strategy
A total of six surveys at three stations in Rıa de Vigo, and three surveys in two stationsoff Cape Fisterra and in two off Rıa de A Coruna (Fig. 1) were conducted during springand early summer 2003, as shown in Table 1. Station V1 was in the central part of Rıa deVigo, not affected by the Prestige oil spill but under high maritime traffic pressure, whereasstations V4 and V10 were in the western and eastern sides of Cies Islands, which wereseverely damaged by Prestige oil slicks that arrived to the coast during November andDecember 2002. Stations F1 and F3 were in the area most heavily impacted by the spill,the former in the semi-enclosed bay of El Rostro beach, were Prestige oil patches arrivedintermittently during winter, spring and summer 2003. Stations C2 and C4 were in Rıa deA Coruna, the latter close to the tanker terminal of the oil refinery.
Full-depth salinity, temperature and chlorophyll fluorescence profiles were recordedwith a SBE 19 conductivity–temperature–depth probe and a Sea-Tech submersible
Table 1Location of sampling sites
Station Location Water depth (m) Sampling dates (2003)
April May June July
A Coruna C4 43�21.8 0 N 22 23 27 3 108�22.2 0 W
C2 43�25.3 0 N 778�26.2 0 W
Finisterre F1 43�48.1 0 N 20 – 10 3 49�12.3 0 W
F3 43�48.1 0 N 1009�24.3 0 W
Vigo V1 42�25.2 0 N 45 10 5, 26 5, 30 28�42.2 0 W
V10 42�18.5 0 N 358�50.6 0 W
V4 42�20.8 0 N 908�48.6 0 W

392 N. Salas et al. / Marine Environmental Research 62 (2006) 388–413
fluorometer attached to a rosette sampler. Conductivity measurements were convertedinto practical salinity scale values with the equation of UNESCO (1985).
2.2. Seawatch buoy off Cape Silleiro
The Seawatch buoy off Cape Silleiro, at 42�7 0 N, 9�24 W (Fig. 1), operated by theAgency ‘‘Puertos del Estado’’ (www.puertos.es), has been shown to be the most suitablefor studying the oceanographic conditions on the western Galician shelf (Torres et al.,2003). The buoy records atmospheric (wind velocity, air temperature and atmosphericpressure) and oceanic (surface temperature, conductivity and current velocity, wave periodand significant height) data and the agency distributes these real-time observations onlinethrough its website. The series of wind, current velocity, and surface temperature dataused in this work have been processed with a Godin A24 Æ A24 Æ A25 filter (Godin, 1972)to eliminate the diurnal and semi-diurnal tidal frequencies.
2.3. Satellite estimates of primary production
Estimates of phytoplankton primary production (PP) were computed using the modelof Morel (1991). Following Morel et al. (1996), the maximum value of the chl-a-specificphytoplankton absorption spectrum and the quantum yield for growth were parameter-ised as a function of chl-a concentration. PP was integrated over all daylight hours, forwavelengths 400–700 nm and to the productive depth, Z0.1%, which is defined here asthe 0.1% light level and computed through the iterative approach of Morel and Berthon(1989). The model has been parameterised against 24-h in situ incubations and, hence,retrieves net primary production.
The model was forced with daily satellite derived estimates of chl-a and sea-surface tem-perature and irradiance computed from Gregg and Carder (1990) with input meteorolog-ical variables from National Center for Environmental Prediction (NCEP) reanalysisfields, and cloud cover from the European Centre for Medium-range Weather Forecasting(ECMWF). Ocean colour was measured by the Sea-viewing Wide Field-of-view Sensor(SeaWiFS) obtained as ‘‘9 km’’ spatial composite data from the Goddard GES Distrib-uted Active Archive Center. Chlorophyll a (Chl a) was computed using the NASA stan-dard global bio-optical algorithm OC4v4 (O’Reilly et al., 1998). The composite dataprovide abstraction at lower spatial or temporal resolution and include all data that passthe SeaWiFS quality flags (Baith et al., 2001). Sea-surface temperature data were obtainedfrom the NASA Pathfinder project (Vazquez et al., 1994) also at ‘‘9 km’’ resolution. Whereno valid satellite chl-a or SST data were available the last valid data were used. Verticalprofiles of chl-a were computed from SeaWiFS Csat values following the method of Moreland Berthon (1989) modified to ensure that the retrieved Csat value equalled the initialspecified Csat value. Following Bosc et al. (2004), where the euphotic depth (1% light level)was found to be shallower than the mixed layer given by Levitus (1982) the chl-a wasassumed to be constant with depth. Vertical temperature profiles were constructed follow-ing a similar method to Bricaud et al. (2002): surface temperature was extracted from Rey-nolds SST (Reynolds and Smith, 1995) fields and combined with the Levitus climatologicalvertical profiles for that location. Where Levitus gave different surface values the mixedlayer was set equal to the Reynolds value.

N. Salas et al. / Marine Environmental Research 62 (2006) 388–413 393
2.4. Collection of plankton and sediment samples
Plankton nets of 20 and 350-lm mesh sizes were used to collect two fractions of surfaceplankton material at the sampling sites: (i) 20–350 lm and (ii) >350 lm. The 20–350 lmfraction includes the microphyto- and zooplankton whereas the >350 lm fraction includesthe herbivorous and carnivorous mesozooplankton as well as the abundant cephalopodand fish larvae in Galician shelf waters (Gonzalez et al., 2005).
The nets were cleaned with cotton soaked up with hexane before use. Ten and 15 minhorizontal tows at 5 m depth were done to collect the material in the 20 and 350-lm meshsize nets. The plankton collected from the 20-lm mesh size net was pre-filtered through a350-lm mesh size sieve, then concentrated in pre-combusted (450 �C, 4 h) Whatman GF/Ffilters, with an equivalent pore size of 0.7 lm, and finally set in a polycarbonate Petri Boxcovered with pre-combusted aluminium foil. The plankton collected from the 350-lmmesh size net was directly set in aluminium-covered Petri Boxes. Samples were frozen to�20 �C until analysis.
Surface sediments were sampled using a Van Veen dredge. The surface layer was col-lected, wrapped in clean aluminium foil, frozen on board (�20 �C) and then freeze-driedand homogenized in the laboratory. Plankton net tows were preformed 5 m off the vessel’sstarboard side and sediments were collected ahead of the sea current, to ensure that thesampling gear was not contaminated by oil from vessel operation.
3. Analysis of hydrocarbons in plankton and sediment samples
3.1. Sample handling
3.1.1. Particulate fraction of 20–350 lm
The filters with the particulate material were placed in a centrifuge tube containing7 mL of hexane:dichloromethane (1:1), 1 g of Hydromatrix� and 25 lL of a surrogatesolution containing 25 ng g�1 of perdeuterated naphthalene, anthracene, pyrene and ben-zo[a]pyrene (Cambridge Isotope Laboratories, Andover, USA). The tube was sonicatedfor 10 min, centrifuged and the solution poured onto a small column of anhydrous sodiumsulphate (1 g), which was subsequently washed twice with 5 mL of hexane:dichlorometh-ane (1:1).
The combined extracts were fractionated by column chromatography with 3% waterdeactivated silica gel (2 g). Two fractions were collected, (i) aliphatic hydrocarbons elutedwith 2.5 mL of hexane and (ii) polycyclic aromatic hydrocarbons with 10 mL of hex-ane:ethyl acetate (90:10). Decafluorobiphenyl (25 lL of a solution of 80 ng g�1) (Merck,Hohenbrunn, Germany) was added as internal standard to the collected fractions thatwere concentrated by rotary evaporation and finally under a gentle nitrogen stream.
3.1.2. Particulate fraction >350 lm
An aliquot of the sample (2 g dry weight) was Soxhlet extracted with 100 mL of dichlo-romethane after the addition of 25 lL of a solution containing 2 lg g�1 of the above per-deuterated standards. The extracts were passed through a small column of anhydroussodium sulphate (1 g), rotary evaporated to around 1 mL and fractionated by columnchromatography with 6 g of alumina and 6 g of silica gel both 5% deactivated. Twofractions were collected, (i) aliphatic hydrocarbons eluted with 20 mL of hexane and (ii)

394 N. Salas et al. / Marine Environmental Research 62 (2006) 388–413
polycyclic aromatic hydrocarbons with 50 mL of hexane:dichloromethane (80:20). Thisfraction required a further fractionation to remove the high predominance of wax esters,which rendered the analysis difficult. This was performed by gel permeation chromatogra-phy, by injecting the residue, dissolved in 500 lL of dichloromethane, onto a SX12(45 · 1.0 cm) Bio-Beads column, and eluting with dichloromethane at 3 mL min�1. Theeluate was UV monitored (220 nm and 254 nm) and the fraction from 4.8 to 7.8 minwas collected.
Finally, 10 lL of a decafluorobiphenyl solution (8 lg g�1) were added as internal stan-dard to the collected fractions that were rotary evaporated and then concentrated under agentle nitrogen stream.
3.1.3. Sediments
The sediment samples (5 g, dry weight) were extracted with a Pressurized SolventExtraction apparatus from Applied Separations (Allentown, PA, USA) and fractionatedand analysed as described elsewhere (Franco et al., 2006).
3.2. Chemical analysis
The two fractions were analysed by gas chromatography coupled to mass spectrometry(GC-MS) using a Trace Thermo-Electron Corporation (Austin, TX, USA) apparatus inthe electron impact (EI) mode at 70 eV. Acquisition was performed in the full scan acqui-sition mode from 50 to 350 atomic mass units at 2.5 scans/s. Injection was performed inthe splitless mode at 280 �C using isooctane as a solvent. A 30 m · 0.25 mm ID capillarycolumn coated with 0.25 lm of TRB-5MS stationary phase was obtained from Teknok-roma (Sant Cugat, Spain). The injector port temperature was held at 280 �C and the purgevalve was activated following 50 s from the injection. The column temperature was held at60 �C for 1 min, then the temperature was programmed until 200 �C at 10 �C/min andfinally to 320 at 5 �C/min holding that temperature for 10 min. The transfer line andion source temperatures were held at 250 and 200 �C, respectively.
Quantitation of the polycyclic aromatic hydrocarbons (PAHs) was performed from thereconstructed ion chromatograms obtained for the corresponding molecular ions by theinternal standard procedure. Recoveries ranged from 70% to 110% except for naphthalenethat were from 40% to 60%. Procedural blanks showed incidental interferences (lower than5 ng g�1) occurring within the dimethyl and trimethyl phenanthrene profiles.
4. Results and discussion
4.1. Oceanographic conditions
4.1.1. Time series of meteorological and oceanographic data
Two main forces act on the NW Iberian shelf at the subtidal frequency (>30 h): localwinds and continental runoff. Wind intensity and direction at the Seawatch buoy off capeSillero from November 2002, when the Prestige oil spill occurred, to July 2003 is shown inFig. 2a. An alternation of southerly and northerly wind events of variable intensity andduration occurred, with the former dominant from November to April and the latter fromMay to July. This follows the expected seasonal cycle at our latitudes (Wooster et al., 1976;Bakun and Nelson, 1991). Therefore, most of the surveys, which started on 10/04/03 and
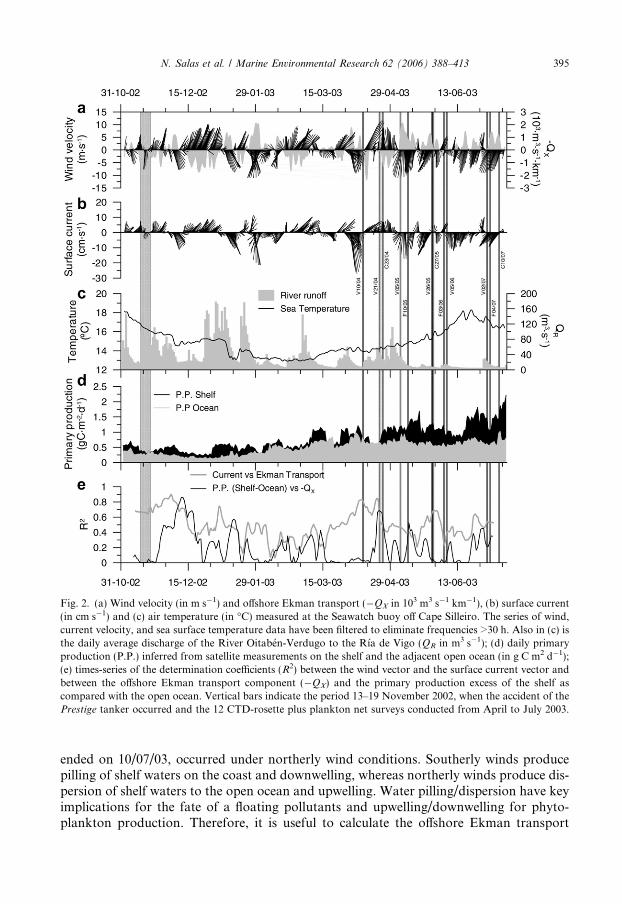
Fig. 2. (a) Wind velocity (in m s�1) and offshore Ekman transport (�QX in 103 m3 s�1 km�1), (b) surface current(in cm s�1) and (c) air temperature (in �C) measured at the Seawatch buoy off Cape Silleiro. The series of wind,current velocity, and sea surface temperature data have been filtered to eliminate frequencies >30 h. Also in (c) isthe daily average discharge of the River Oitaben-Verdugo to the Rıa de Vigo (QR in m3 s�1); (d) daily primaryproduction (P.P.) inferred from satellite measurements on the shelf and the adjacent open ocean (in g C m2 d�1);(e) times-series of the determination coefficients (R2) between the wind vector and the surface current vector andbetween the offshore Ekman transport component (�QX) and the primary production excess of the shelf ascompared with the open ocean. Vertical bars indicate the period 13–19 November 2002, when the accident of thePrestige tanker occurred and the 12 CTD-rosette plus plankton net surveys conducted from April to July 2003.
N. Salas et al. / Marine Environmental Research 62 (2006) 388–413 395
ended on 10/07/03, occurred under northerly wind conditions. Southerly winds producepilling of shelf waters on the coast and downwelling, whereas northerly winds produce dis-persion of shelf waters to the open ocean and upwelling. Water pilling/dispersion have keyimplications for the fate of a floating pollutants and upwelling/downwelling for phyto-plankton production. Therefore, it is useful to calculate the offshore Ekman transport

396 N. Salas et al. / Marine Environmental Research 62 (2006) 388–413
(�QX) from the wind data, a rough estimation of the volume of water upwelled/downw-elled per kilometre of coast (m3 s�1 km�1):
�QX ¼ �1000Cdqa
qf� W � W y
where Cd is the dimensionless drag coefficient (0.0014), qa the air density (1.22 kg m�3), qthe seawater density (1025 kg m�3), W the wind speed (m s�1) and Wy the northward com-ponent of the wind (m s�1). Positive values of �QX indicates upwelling and negative valuesdownwelling (Fig. 2a).
In general, the surface circulation on the continental slope (Fig. 2b) is driven by thewinds (Fig. 2a), with a dominant poleward flow from November to May and an equator-ward flow from May to July (Torres et al., 2003). The vector determination coefficient, R2
(Crosby et al., 1993), between the time series of wind and current velocities at the SilleiroBuoy was calculated, with a 2 wk running window, according to the time-scale of coastalupwelling in the NW Iberian shelf (Blanton et al., 1987; Alvarez-Salgado et al., 1993). Theresulting time series of R2 (Fig. 2e) shows that the influence of the wind on the shelfdynamics is not steady and frequently there are periods when R2 is >0.5 and episodes withvalues >0.8.
The dominant southerly winds from November to April were accompanied by intenserainfalls, which produced high continental runoff by the rivers that drain directly to theocean (the river Mino) or via the Rıas Baixas to form the WIBP. Fig. 2c shows the timeevolution of the discharge of the river Oitaben–Verdugo, the main tributary to the Rıa deVigo. From November to April, the average river discharge was 50 m3 s�1 with several epi-sodes of >100 m3 s�1. On the contrary, from May to July, when northerly winds weredominant, river discharge decreased to an average of 15 m3 s�1. The WIBP, which tendsto evacuate the freshwater drained from the continent, and the slope waters transportedby the IPC and by locals winds, which tend to pile on the coast, form a convergence frontthat migrates from the ‘‘rıas’’ to the outer shelf depending on the relative strength of thesetwo opposite forces (Alvarez-Salgado et al., 2006).
4.1.2. Vertical structure of the water column during the surveys
The thermohaline structure of three reference stations, V4 off the Rıa de Vigo, F3 offCape Fisterra and C2 off the Rıa de A Coruna (Fig. 1), is shown in Fig. 3 for each survey.Shelf waters during the study period, when northerly winds were dominant (Fig. 2a), werecharacterized by cold (<13.5 �C) and high salinity (>35.5&) upwelled Eastern NorthAtlantic Central Water (ENACW) in the bottom layer and a thermocline and haloclinethat stabilises the surface layer. The salinity of bottom waters decreased from south tonorth, demonstrating the well known transition from subtropical to subpolar vintagesof ENACW (Rıos et al., 1992). The chlorophyll maximum, which ranges from 0.5 to10 mg Chl m�3, is usually located around the pycnocline. The lowest chlorophyll levelsoccurred under strong upwelling (02/07 in V4, and 10/05 and 04/07 in F3) because ofthe offshore dispersion of phytoplankton (Zimmerman et al., 1987). On the contrary,maximum concentrations were observed under moderate upwelling (03/06 in F3) or therelaxation phase of strong upwelling (10/04 in V4), because of the concomitance ofupwelled nutrients and low flushing rates (Zimmerman et al., 1987). Maximum chloro-phyll levels were also found during weak downwelling (21/04 in V04) because of theaccumulation of phytoplankton in the convergence front between the IPC and the WIBP

12 14 16Temperature (ºC)
80
60
40
20
0
Pre
ssur
e (d
bar)
33 34 35 36
Salinity
0 2 4 6 8 10Chla (μg·l-1)
V4 10/04
12 14 16Temperature (ºC)
33 34 35 36
Salinity
0 2 4 6 8 10Chla (μg·l-1)
V4 21/04
12 14 16Temperature (ºC)
33 34 35 36
Salinity
0 2 4 6 8 10Chla (μg·l-1)
V4 05/05
12 14 16
80
60
40
20
0
Pre
ssur
e (d
bar)
33 34 35 36
0 2 4 6 8 10
V4 26/05
a b c
d e f
g h i
j k l
12 14 16
33 34 35 36
0 2 4 6 8 10
V4 05/06
12 14 16
33 34 35 36
0 2 4 6 8 10
V4 02/07
12 14 16
80
60
40
20
0
Pre
ssur
e (d
bar)
35.2 35.4 35.6
0 2 4 6 8 10
F3 10/05
12 14 16
35.2 35.4 35.6
0 2 4 6 8 10
F3 03/06
12 14 16
35.2 35.4 35.6
0 2 4 6 8 10
F3 04/07
Chlorophyll
Salinity
Temperature
12 14 16
80
60
40
20
0
Pre
ssur
e (d
bar)
35.2 35.4 35.6
0 2 4 6 8 10
C2 23/04
12 14 16
35.2 35.4 35.6
0 2 4 6 8 10
C2 27/05
12 14 16
35.2 35.4 35.6
0 2 4 6 8 10
C2 10/07
Fig. 3. Profiles of temperature (in �C), salinity and chlorophyll fluorescence (in g chla m�3) recorded with a CTDprobe in station V4 on (a) 10 April, (b) 21 April, (c) 5 May, (d) 26 May, (e), 5 June and (f) 2 July; station F3 on (g)10 May, (h) 3 June and (i) 4 July; and station C2 on (j) 23 April, (k) 27 May and (l) 10 July 2003.
N. Salas et al. / Marine Environmental Research 62 (2006) 388–413 397

398 N. Salas et al. / Marine Environmental Research 62 (2006) 388–413
(Alvarez-Salgado et al., 2003). On June 5 (Fig. 3e), a subsurface maximum centred at 60 mwas observed at stn V4, probably due to the sedimentation of a material produced duringa previous bloom. It is also remarkable that chlorophyll levels off the Rıa de A Corunawere lower than in the other two sites, with values <2 mg m�3 (Bode et al., 1996).
4.1.3. Primary production
Primary production either in the shelf seas or the open ocean was low from Novemberto mid April (Fig. 2d): average, 0.40 g C m�2 d�1 in the open ocean and0.60 g C m�2 d�1over the shelf. This is related to the limiting light conditions for phyto-plankton growth and the progressive cooling of the surface waters (Fig. 2c) during theautumn and winter (Alvarez-Salgado et al., 2003; Varela et al., 2006). The periods of sig-nificantly higher primary production over the shelf in January and March were related toshort-living upwelling episodes succeeding strong continental runoff events, able to stratifythe surface layer despite the dominant winter cooling conditions. On the contrary, primaryproduction rates doubled from mid April to July: average, 0.65 g C m�2 d�1 in the openocean and 1.20 g C m�2 d�1 over the shelf, with values up to 3 g C m�2 d�1. This seasonaldifference is related to: (1) the progressive increase in solar radiation and surface waterstratification (Fig. 2d), which produce a transition from light to nutrient limitation; and(2) coastal upwelling episodes (Fig. 2a), able to overcome the nutrient limitation (Perezet al., 2000). In fact, the difference between shelf and open ocean production (averageof 0.55 g C m�2 d�1) can be assigned to coastal upwelling (Joint et al., 2002). Supportingthis statement, Fig. 2e shows the time series of R2 between the primary production excessin the shelf seas and the offshore Ekman transport with a 2 wk running window.
4.1.4. Plankton community composition
The 20–350 lm fraction includes the microphytoplankton that dominates the biomassand primary production during the spring (diatoms) and autumn (dinoflagellate) bloomsas well as 50% of the biomass and 65% of the primary production during the summer (Til-stone et al., 1999). Plankton counts at stn C2 (Table 2) indicate that during the 23/04 sur-vey, conducted under downwelling conditions (Fig. 2a) cell abundances were low, almostin the range of winter values. Diatoms and dinoflagellates co-dominate the phytoplanktoncommunity. Leptocylindrus danicus was the diatom species more characteristic while nakeddinoflagellates were the most abundant dinoficeans. On the contrary, during the 27/05 and10/07 surveys, conducted under upwelling conditions, a noticeable increase of phytoplank-ton abundance occurred and diatoms were clearly dominant over other phytoplanktongroups. Leptocylindrus danicus in May and several species of Chaetoceros characterizethe phytoplankton community. Both diatom species are indicative of the high primaryproduction (Fig. 2d) associated to the upwelling of ENACW (Casas et al., 1997). The
Table 2Distribution of planktonic species in the 20–350 lm fraction (in cells mL�1)
Station C2 23/04/2003 27/05/2003 10/07/2003
Dinophyceae 11.3 43.6 43.4Diatomophyceae 13.5 750.5 286.4Chrysophyceae 0.4 62.2 –Prymnesiophyceae – 7.1 21.5Protozoa (Ciliates >20 lm) 4.1 10.7 27.1
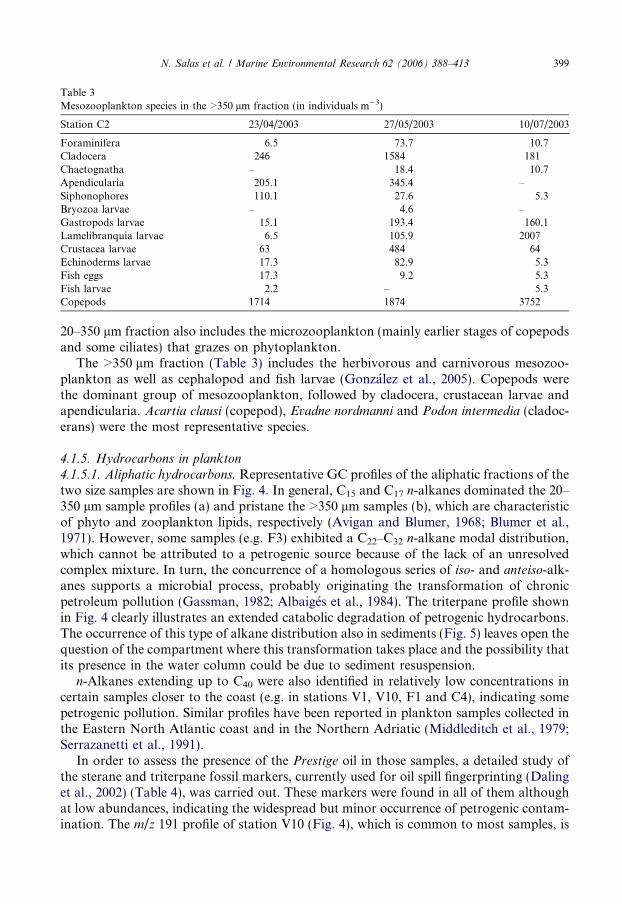
Table 3Mesozooplankton species in the >350 lm fraction (in individuals m�3)
Station C2 23/04/2003 27/05/2003 10/07/2003
Foraminifera 6.5 73.7 10.7Cladocera 246 1584 181Chaetognatha – 18.4 10.7Apendicularia 205.1 345.4 –Siphonophores 110.1 27.6 5.3Bryozoa larvae – 4.6 –Gastropods larvae 15.1 193.4 160.1Lamelibranquia larvae 6.5 105.9 2007Crustacea larvae 63 484 64Echinoderms larvae 17.3 82.9 5.3Fish eggs 17.3 9.2 5.3Fish larvae 2.2 – 5.3Copepods 1714 1874 3752
N. Salas et al. / Marine Environmental Research 62 (2006) 388–413 399
20–350 lm fraction also includes the microzooplankton (mainly earlier stages of copepodsand some ciliates) that grazes on phytoplankton.
The >350 lm fraction (Table 3) includes the herbivorous and carnivorous mesozoo-plankton as well as cephalopod and fish larvae (Gonzalez et al., 2005). Copepods werethe dominant group of mesozooplankton, followed by cladocera, crustacean larvae andapendicularia. Acartia clausi (copepod), Evadne nordmanni and Podon intermedia (cladoc-erans) were the most representative species.
4.1.5. Hydrocarbons in plankton
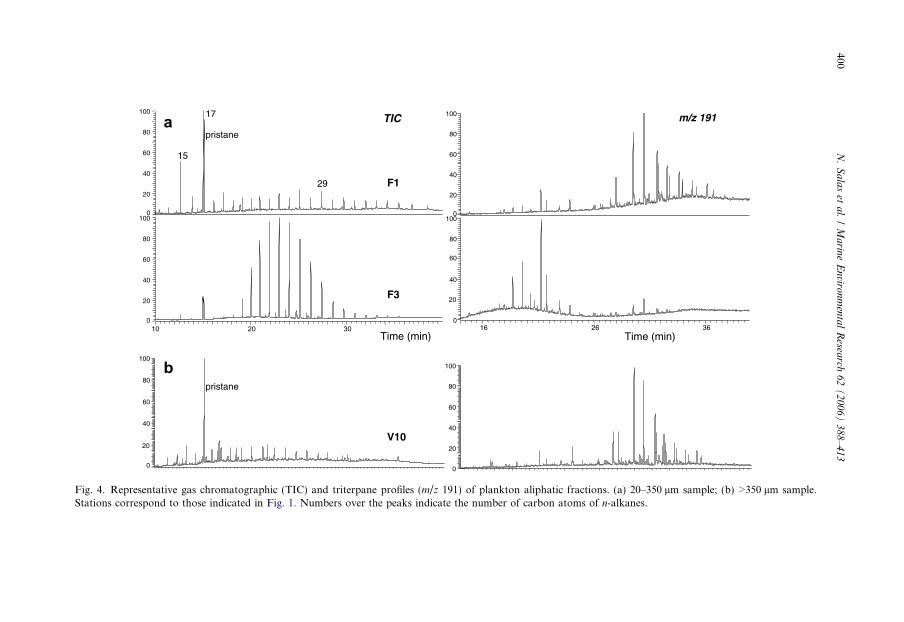
4.1.5.1. Aliphatic hydrocarbons. Representative GC profiles of the aliphatic fractions of thetwo size samples are shown in Fig. 4. In general, C15 and C17 n-alkanes dominated the 20–350 lm sample profiles (a) and pristane the >350 lm samples (b), which are characteristicof phyto and zooplankton lipids, respectively (Avigan and Blumer, 1968; Blumer et al.,1971). However, some samples (e.g. F3) exhibited a C22–C32 n-alkane modal distribution,which cannot be attributed to a petrogenic source because of the lack of an unresolvedcomplex mixture. In turn, the concurrence of a homologous series of iso- and anteiso-alk-anes supports a microbial process, probably originating the transformation of chronicpetroleum pollution (Gassman, 1982; Albaiges et al., 1984). The triterpane profile shownin Fig. 4 clearly illustrates an extended catabolic degradation of petrogenic hydrocarbons.The occurrence of this type of alkane distribution also in sediments (Fig. 5) leaves open thequestion of the compartment where this transformation takes place and the possibility thatits presence in the water column could be due to sediment resuspension.
n-Alkanes extending up to C40 were also identified in relatively low concentrations incertain samples closer to the coast (e.g. in stations V1, V10, F1 and C4), indicating somepetrogenic pollution. Similar profiles have been reported in plankton samples collected inthe Eastern North Atlantic coast and in the Northern Adriatic (Middleditch et al., 1979;Serrazanetti et al., 1991).
In order to assess the presence of the Prestige oil in those samples, a detailed study ofthe sterane and triterpane fossil markers, currently used for oil spill fingerprinting (Dalinget al., 2002) (Table 4), was carried out. These markers were found in all of them althoughat low abundances, indicating the widespread but minor occurrence of petrogenic contam-ination. The m/z 191 profile of station V10 (Fig. 4), which is common to most samples, is
20
40
60
80
100
0
pristane
m/z 191 TIC
100
0
20
40
60
80
b
V10
15
17
16 26 36Time (min)
0
20
40
60
80
100 0
20
40
60
80
100
10 20 30Time (min)
0
20
40
60
80
100 0
20
40
60
80
100
F1
F3
pristane a
29
Fig. 4. Representative gas chromatographic (TIC) and triterpane profiles (m/z 191) of plankton aliphatic fractions. (a) 20–350 lm sample; (b) >350 lm sample.Stations correspond to those indicated in Fig. 1. Numbers over the peaks indicate the number of carbon atoms of n-alkanes.
400N
.S
ala
set
al.
/M
arin
eE
nviro
nm
enta
lR
esearch
62
(2
00
6)
38
8–
41
3

0
30
60
90
120
150
180
N N1
N2
N3 D D1
D2
D3 P P1
P2
P3 Fl
Py
BA C
BF
lB
ePy
BaP
yP
erD
BA
Ipy
BP
er
ng/g
dw
0
50
100
150
200
250
N N1
N2
N3 D D1
D2
D3 P P1
P2
P3 Fl
Py
BA C
BF
lB
ePy
BaP
yP
erD
BA
Ipy
BP
er
ng/g
dw
0
30
60
90
120
150
180
N N1
N2
N3 D D1
D2
D3 P P1
P2
P3 Fl
Py
BA C
BF
lB
ePy
BaP
yP
erD
BA
Ipy
BP
er
ng/g
dw
0
50
100
150
200
250
N N1
N2
N3 D D1
D2
D3 P P1
P2
P3 Fl
Py
BA C
BF
lB
ePy
BaP
yP
erD
BA
Ipy
BP
er
ng/g
dw
0
30
60
90
120
150
180
N N1
N2
N3 D D1
D2
D3 P P1
P2
P3 Fl
Py
BA C
BF
lB
ePy
BaP
yP
erD
BA
Ipy
BP
er0
50
100
150
200
250
N N1
N2
N3 D D1
D2
D3 P P1
P Fl
Py
BA C
BF
lB
ePy
BaP
yP
er
D
BA
Ipy
BP
er
0
30
60
90
120
150
180
N N1
N2
N3 D D1
D2
D3 P P1
P2
P3 Fl
Py
BA C
BF
lB
ePy
BaP
yP
erD
BA
Ipy
BP
er
0
50
100
150
200
250
N N1
N2
N3 D D1
D2
D3 P P1
P2
P3 Fl
Py
BA C
BF
lB
ePy
BaP
yP
erD
BA
Ipy
BP
er
a bF1 F1
V1 C4
Fig. 5. Representative distributions of PAHs in (a) 20–350 lm, and (b) >350 lm plankton samples. Stations correspond to those indicated in Fig. 1. (N:Naphthalene, D: Dibenzothiophene, P: Phenanthrene, Fl: Fluoranthene, Py: Pyrene, BA: Benz[a]anthracene, C: Chrysene, BFl: Benzofluoranthenes, BePy:Benzo[e]pyrene, BaPy: Benzo[a]pyrene, Per: Perylene, DBA: Dibenz[a,h]anthracene, IPy: Indeno[1,2,3-cd]pyrene, BPer: Benzo[ghi]perylene. N1–N3, D1–D3 and P1–P3 are the corresponding C1–C3-alkyl derivatives).
N.
Sa
las
eta
l./
Ma
rine
En
viron
men
tal
Resea
rch6
2(
20
06
)3
88
–4
13
401

Table 4Diagnostic ratios used as source and weathering indicators for the plankton and sediment samples
Diagnosticion m/z
Index Definition Structuresa
191 %27Ts 100*Ts/(Ts+Tm) Ts: 18a(H)-22,29,30-trisnorneohopaneTm: 17a(H)-22,29,30-trisnorhopane
191 %29ab 100*29ab/(29ab+30ab) 29ab: 17a(H),21b(H)-30-norhopane30ab: 17a(H),21b(H)-hopane
217 %27d 100*27d(R+S)/[27d(R+S)+27bb(R+S)]
27d: 13b(H),17a(H)-diacholestane (20S and 20R)27bb: 14b(H),17b(H)-cholestane(20R and 20S)
217 %29aaS 100*29aaS/(29aaS+29aaR) 29aa: 24-ethyl-14a(H),17a(H)-cholestane (20S and 20R)
217 %29bb(R+S) 100*29bb(R+S)/[29bb(R+S)+29aa (R+S)]
29bb: 24-ethyl-14b(H), 17b(H)-cholestane (20R and 20S)
218 %27bb 100*[27bb(R+S)]/[27bb(R+S)+28bb(R+S)+ 29bb(R+S)]
27bb: 14b(H),17b(H)-cholestane(20R and 20S)
218 %28bb 100*[28bb(R+S)]/[27bb(R+S)+28bb(R+S)+ 29bb(R+S)]
28bb: 24-methyl-14b (H),17b(H)-cholestane (20R and 20S)
218 %29bb 100*[29bb(R+S)]/[27bb (R+S)+28bb(R+S)+ 29bb(R+S)]
29bb: 24-ethyl-14b(H), 17b(H)-cholestane (20R and 20S)
206/212 D2/P2 100*D2/(D2+P2) Dimethyldibenzothiophenes (D2)and phenathrenes (P2)
220/226 D3/P3 100*D3/(D3+P3) Trimethyldibenzothiophenes(D3) and phenathrenes (P3)
a The description of the structures as well as a complete explanation of the Prestige fuel oil profiles can be foundin Dıez et al. (2005).
402 N. Salas et al. / Marine Environmental Research 62 (2006) 388–413
clearly different from that of the Prestige oil (Dıez et al., 2005), and can be considered asrepresentative of the present background pollution in the region (Franco et al., 2006).However, in the samples collected in May 10 at station F1 (Fig. 4) the profile exhibitedsome features closer to those of the Prestige oil, which could suggest a certain accumula-tion in plankton, although this was not conclusive because besides the indicated molecularmarkers, the aliphatic fraction of the fuel-oil contains a series of n-alkylcyclohexane andbenzene derivatives (Dıez et al., 2005), which were not found in the samples.
The high primary production in Galician shelf waters on May 10 (1.2 g C m�2 d�1)probably favoured the accumulation of hydrocarbons in the plankton fractions. Neverthe-less, the dominant northerly wind conditions during the spring and early summer 2003,which prevented the arrival of fresh oil leaking from the wreck to the coast, together withits low solubility (the fuel was mainly in the form of aged floating patches in the sea sur-face), may explain the general lack of evidence of the spilled oil above the baseline pollu-tion in the collected samples, despite the amount spilt in the region.
4.1.5.2. Aromatic hydrocarbons. The total ion chromatograms of the aromatic fractionsshowed a number of resolved peaks corresponding to polyunsaturated alkanes of biogenicorigin, among them heneicosa-3,6,9,12,15,18-hexaene (HEH), highly branched isoprenoids
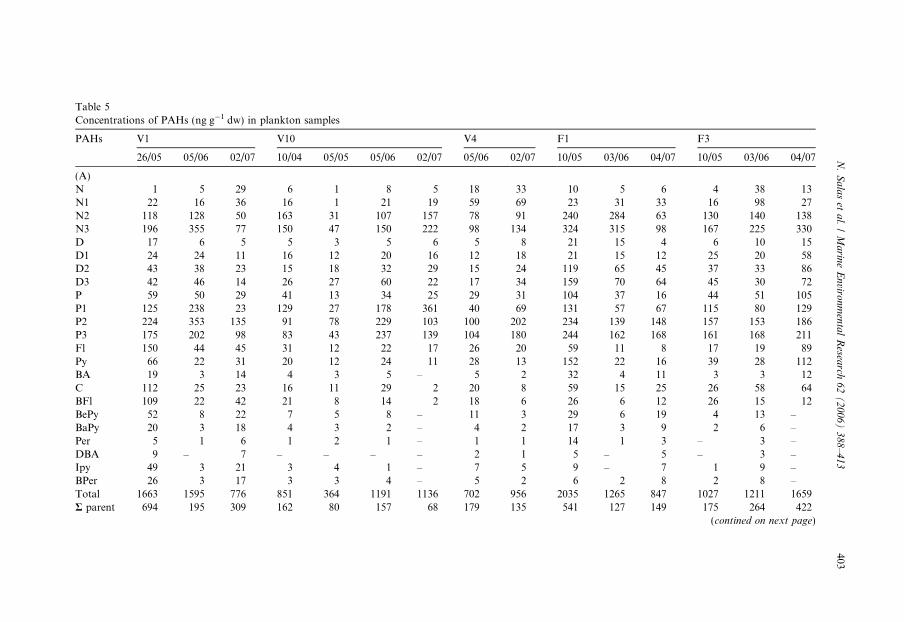
Table 5Concentrations of PAHs (ng g�1 dw) in plankton samples
PAHs V1 V10 V4 F1 F3
26/05 05/06 02/07 10/04 05/05 05/06 02/07 05/06 02/07 10/05 03/06 04/07 10/05 03/06 04/07
(A)N 1 5 29 6 1 8 5 18 33 10 5 6 4 38 13N1 22 16 36 16 1 21 19 59 69 23 31 33 16 98 27N2 118 128 50 163 31 107 157 78 91 240 284 63 130 140 138N3 196 355 77 150 47 150 222 98 134 324 315 98 167 225 330D 17 6 5 5 3 5 6 5 8 21 15 4 6 10 15D1 24 24 11 16 12 20 16 12 18 21 15 12 25 20 58D2 43 38 23 15 18 32 29 15 24 119 65 45 37 33 86D3 42 46 14 26 27 60 22 17 34 159 70 64 45 30 72P 59 50 29 41 13 34 25 29 31 104 37 16 44 51 105P1 125 238 23 129 27 178 361 40 69 131 57 67 115 80 129P2 224 353 135 91 78 229 103 100 202 234 139 148 157 153 186P3 175 202 98 83 43 237 139 104 180 244 162 168 161 168 211Fl 150 44 45 31 12 22 17 26 20 59 11 8 17 19 89Py 66 22 31 20 12 24 11 28 13 152 22 16 39 28 112BA 19 3 14 4 3 5 – 5 2 32 4 11 3 3 12C 112 25 23 16 11 29 2 20 8 59 15 25 26 58 64BFl 109 22 42 21 8 14 2 18 6 26 6 12 26 15 12BePy 52 8 22 7 5 8 – 11 3 29 6 19 4 13 –BaPy 20 3 18 4 3 2 – 4 2 17 3 9 2 6 –Per 5 1 6 1 2 1 – 1 1 14 1 3 – 3 –DBA 9 – 7 – – – – 2 1 5 – 5 – 3 –Ipy 49 3 21 3 4 1 – 7 5 9 – 7 1 9 –BPer 26 3 17 3 3 4 – 5 2 6 2 8 2 8 –Total 1663 1595 776 851 364 1191 1136 702 956 2035 1265 847 1027 1211 1659R parent 694 195 309 162 80 157 68 179 135 541 127 149 175 264 422
(contined on next page)
N.
Sa
las
eta
l./
Ma
rine
En
viron
men
tal
Resea
rch6
2(
20
06
)3
88
–4
13
403
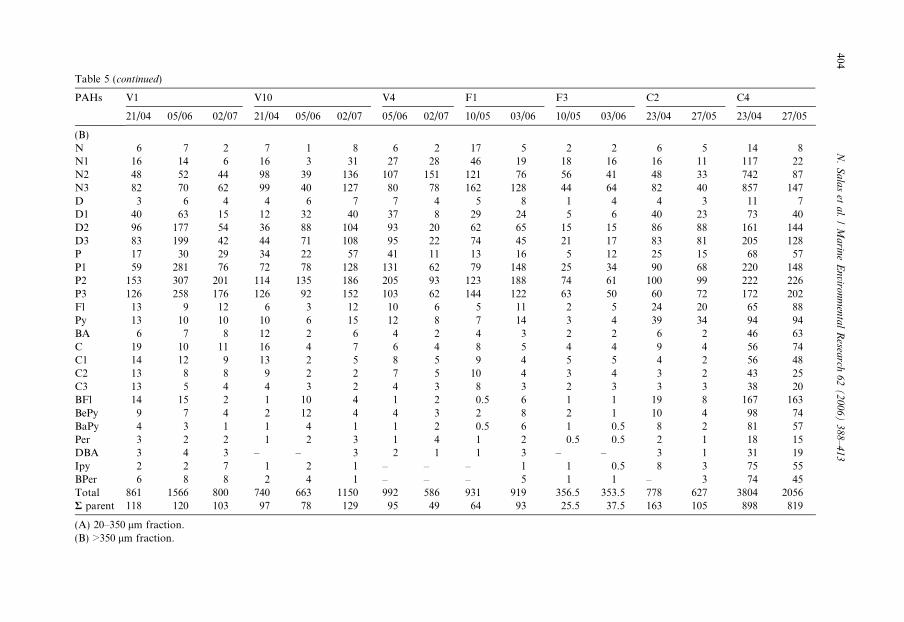
Table 5 (continued)
PAHs V1 V10 V4 F1 F3 C2 C4
21/04 05/06 02/07 21/04 05/06 02/07 05/06 02/07 10/05 03/06 10/05 03/06 23/04 27/05 23/04 27/05
(B)N 6 7 2 7 1 8 6 2 17 5 2 2 6 5 14 8N1 16 14 6 16 3 31 27 28 46 19 18 16 16 11 117 22N2 48 52 44 98 39 136 107 151 121 76 56 41 48 33 742 87N3 82 70 62 99 40 127 80 78 162 128 44 64 82 40 857 147D 3 6 4 4 6 7 7 4 5 8 1 4 4 3 11 7D1 40 63 15 12 32 40 37 8 29 24 5 6 40 23 73 40D2 96 177 54 36 88 104 93 20 62 65 15 15 86 88 161 144D3 83 199 42 44 71 108 95 22 74 45 21 17 83 81 205 128P 17 30 29 34 22 57 41 11 13 16 5 12 25 15 68 57P1 59 281 76 72 78 128 131 62 79 148 25 34 90 68 220 148P2 153 307 201 114 135 186 205 93 123 188 74 61 100 99 222 226P3 126 258 176 126 92 152 103 62 144 122 63 50 60 72 172 202Fl 13 9 12 6 3 12 10 6 5 11 2 5 24 20 65 88Py 13 10 10 10 6 15 12 8 7 14 3 4 39 34 94 94BA 6 7 8 12 2 6 4 2 4 3 2 2 6 2 46 63C 19 10 11 16 4 7 6 4 8 5 4 4 9 4 56 74C1 14 12 9 13 2 5 8 5 9 4 5 5 4 2 56 48C2 13 8 8 9 2 2 7 5 10 4 3 4 3 2 43 25C3 13 5 4 4 3 2 4 3 8 3 2 3 3 3 38 20BFl 14 15 2 1 10 4 1 2 0.5 6 1 1 19 8 167 163BePy 9 7 4 2 12 4 4 3 2 8 2 1 10 4 98 74BaPy 4 3 1 1 4 1 1 2 0.5 6 1 0.5 8 2 81 57Per 3 2 2 1 2 3 1 4 1 2 0.5 0.5 2 1 18 15DBA 3 4 3 – – 3 2 1 1 3 – – 3 1 31 19Ipy 2 2 7 1 2 1 – – – 1 1 0.5 8 3 75 55BPer 6 8 8 2 4 1 – – – 5 1 1 – 3 74 45Total 861 1566 800 740 663 1150 992 586 931 919 356.5 353.5 778 627 3804 2056R parent 118 120 103 97 78 129 95 49 64 93 25.5 37.5 163 105 898 819
(A) 20–350 lm fraction.(B) >350 lm fraction.
404N
.S
ala
set
al.
/M
arin
eE
nviro
nm
enta
lR
esearch
62
(2
00
6)
38
8–
41
3
N. Salas et al. / Marine Environmental Research 62 (2006) 388–413 405
(HBI) and squalene. HEH is abundant in plankton species, notably diatoms, and has beenassociated to spring blooms (Osterroht et al., 1983), however it was scarce in our samples.HBI have also been found in diatoms and widely distributed in the marine environment,particularly in sediments (Wraige et al., 1999). The occurrence of these compounds inthe region has already been reported in bivalves that may suggest a favourable habitatfor these planktonic species (Porte et al., 2000). Squalene is a lipid constituent of most mar-ine organisms and particularly of phytoplankton (Bieger et al., 1997). No significant trendswere observed that allowed the occurrence of these hydrocarbons to be related to thehydrographic scenarios or the variation of biological parameters such as chlorophyll or pri-mary production.
The corresponding GC-MS (single ion monitoring) analysis revealed the occurrence ofthe whole series of parent and alkylated PAHs. Representative profiles are shown in Fig. 5and the individual concentrations for the two particle size samples are listed in Table 5. Ingeneral, the profiles exhibited a marked predominance of the alkylated low molecularweight components (2–3 aromatic rings), typical constituents of petroleum, parallelingthose of the seawater dissolved hydrocarbons in the area after the spill (Gonzalez et al.,2006). Mackie et al. (1978) also found that plankton samples collected after the Amoco
Cadiz oil spill often contained substituted naphthalenes as the major hydrocarbon compo-nents. On the other hand, the samples collected inside the embayments affected by theurban, industrial and port activities (e.g. V1 and C4) were relatively enriched in the higherPAHs (4–5 aromatic rings), which are characteristic hydrocarbons of the surface runoff.
The ratios of methyl dibenzothiophene and phenanthrene isomers, as well as those ofC2 alkyl homologs (D2 and P2), have been found useful in differentiating sources of spilledoils in sediments (Wang and Fingas, 1995; Douglas et al., 1996). In order to assess thepresence of the Prestige oil in the plankton samples, the corresponding ratios were deter-mined. From the values shown in Table 6, it could be concluded that only those corre-sponding to station F1 in May and early June were close enough to those of thePrestige oil, to support a possible input, in agreement with the results obtained by the ali-phatic fraction. In fact, the area of Costa da Morte (Fig. 1) was the most heavily and per-sistently oiled after the accident.
The total PAH concentrations (R24) ranged from 353 to 2035 ng g�1 dw in the Vigo andFisterra transects, averaging 1120 and 809 ng g�1 dw for the 20–350 and >350 lm fractions,respectively, although the differences were not statistically significant. Temporal trendswere not observed either, but values were higher in the stations closer to the coast (V1and F1), particularly in May. The samples collected inside the Rıa de A Coruna (C4), closeto the tanker terminal of the oil refinery, exhibited consistently higher concentrations.
Although PAHs have been determined in seawater particulate material, mainly col-lected with particle-interceptor traps, to estimate downward fluxes to the sediment (Prahland Carpenter, 1979; Bates et al., 1984; Broman et al., 1988; Raoux et al., 1999; Ko et al.,2003), they have been rarely determined in living plankton. Seston samples collected at theNorthern Baltic proper exhibited average concentrations of 1470 ng g�1 dw for 19 PAHs(from phenanthrene to coronone; Broman et al., 1990), and values up to 16,000 ng g�1 dw(R12 PAHs) have been reported in plankton samples collected in the southern Baltic(Kowaleska and Konat, 1997). Therefore, the values reported here are in the lower rangeof those published elsewhere and can be considered as reference values in the region, inagreement with the background concentrations of dissolved hydrocarbons found in thearea during the same period (Gonzalez et al., 2006).
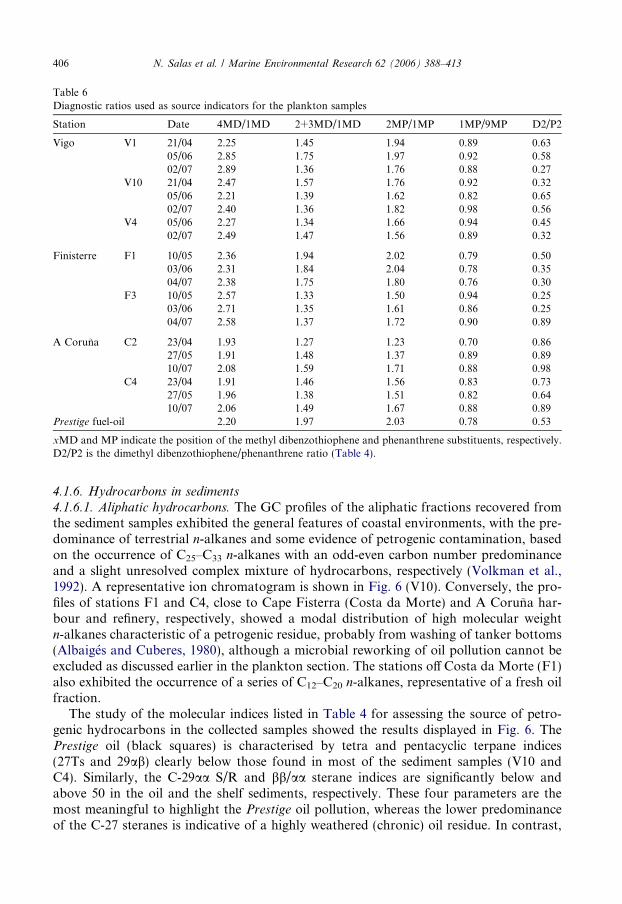
Table 6Diagnostic ratios used as source indicators for the plankton samples
Station Date 4MD/1MD 2+3MD/1MD 2MP/1MP 1MP/9MP D2/P2
Vigo V1 21/04 2.25 1.45 1.94 0.89 0.6305/06 2.85 1.75 1.97 0.92 0.5802/07 2.89 1.36 1.76 0.88 0.27
V10 21/04 2.47 1.57 1.76 0.92 0.3205/06 2.21 1.39 1.62 0.82 0.6502/07 2.40 1.36 1.82 0.98 0.56
V4 05/06 2.27 1.34 1.66 0.94 0.4502/07 2.49 1.47 1.56 0.89 0.32
Finisterre F1 10/05 2.36 1.94 2.02 0.79 0.5003/06 2.31 1.84 2.04 0.78 0.3504/07 2.38 1.75 1.80 0.76 0.30
F3 10/05 2.57 1.33 1.50 0.94 0.2503/06 2.71 1.35 1.61 0.86 0.2504/07 2.58 1.37 1.72 0.90 0.89
A Coruna C2 23/04 1.93 1.27 1.23 0.70 0.8627/05 1.91 1.48 1.37 0.89 0.8910/07 2.08 1.59 1.71 0.88 0.98
C4 23/04 1.91 1.46 1.56 0.83 0.7327/05 1.96 1.38 1.51 0.82 0.6410/07 2.06 1.49 1.67 0.88 0.89
Prestige fuel-oil 2.20 1.97 2.03 0.78 0.53
xMD and MP indicate the position of the methyl dibenzothiophene and phenanthrene substituents, respectively.D2/P2 is the dimethyl dibenzothiophene/phenanthrene ratio (Table 4).
406 N. Salas et al. / Marine Environmental Research 62 (2006) 388–413
4.1.6. Hydrocarbons in sediments
4.1.6.1. Aliphatic hydrocarbons. The GC profiles of the aliphatic fractions recovered fromthe sediment samples exhibited the general features of coastal environments, with the pre-dominance of terrestrial n-alkanes and some evidence of petrogenic contamination, basedon the occurrence of C25–C33 n-alkanes with an odd-even carbon number predominanceand a slight unresolved complex mixture of hydrocarbons, respectively (Volkman et al.,1992). A representative ion chromatogram is shown in Fig. 6 (V10). Conversely, the pro-files of stations F1 and C4, close to Cape Fisterra (Costa da Morte) and A Coruna har-bour and refinery, respectively, showed a modal distribution of high molecular weightn-alkanes characteristic of a petrogenic residue, probably from washing of tanker bottoms(Albaiges and Cuberes, 1980), although a microbial reworking of oil pollution cannot beexcluded as discussed earlier in the plankton section. The stations off Costa da Morte (F1)also exhibited the occurrence of a series of C12–C20 n-alkanes, representative of a fresh oilfraction.
The study of the molecular indices listed in Table 4 for assessing the source of petro-genic hydrocarbons in the collected samples showed the results displayed in Fig. 6. ThePrestige oil (black squares) is characterised by tetra and pentacyclic terpane indices(27Ts and 29ab) clearly below those found in most of the sediment samples (V10 andC4). Similarly, the C-29aa S/R and bb/aa sterane indices are significantly below andabove 50 in the oil and the shelf sediments, respectively. These four parameters are themost meaningful to highlight the Prestige oil pollution, whereas the lower predominanceof the C-27 steranes is indicative of a highly weathered (chronic) oil residue. In contrast,

0
20
40
60
80
100
m/z 85
C4
40
80
100
60
0
20
F1
0
20
40
60
80
100
10 20 30 40Time (min)
V10
2917
10
20
30
40
50
60
70
%27Ts %29ab %27dia %29aaS %29bb %27bb %28bb %29bb
10
20
30
40
50
60
%27Ts %29ab %27dia %29aaS %29bb %27bb %28bb %29bb
10
20
30
40
50
60
%27Ts %29ab %27dia %29aaS %29bb %27bb %28bb %29bb
Fig. 6. Representative mass fragmentograms of alkanes (m/z 85) and sterane and triterpane source diagnostic ratios of sediment aliphatic hydrocarbon fractions.Stations correspond to those indicated in Fig. 1. Numbers over the peaks indicate the number of carbon atoms of n-alkanes. Definitions of molecular indices areindicated in Table 4. Filled squares correspond to the Prestige oil values.
N.
Sa
las
eta
l./
Ma
rine
En
viron
men
tal
Resea
rch6
2(
20
06
)3
88
–4
13
407
10 20 30 40Time (min)
0
20
40
60
80
100
V10
0
20
40
60
80
100
F1
TIC Squalene
HBI (C25)
0
20
40
60
80
100
120
140
N N1
N2
N3 P A P1
P2
P3
DB
TD
BT
1
DB
T2
DB
T3 Fl
Py
BaA
C C1
C2
C3
B(b
+k)F
BeP
y
BaP
y
Per
DB
A
Ipy
BP
er
ng
/ g
0
2
4
6
8
10
12
14
N N1
N2
N3 P A P1
P2
P3
DB
T
DB
T1
DB
T2
DB
T3 Fl
Py
BaA
C C1
C2
C3
B(b
+k)F
BeP
yB
aPy
Per
DB
AIp
y
BP
er
ng
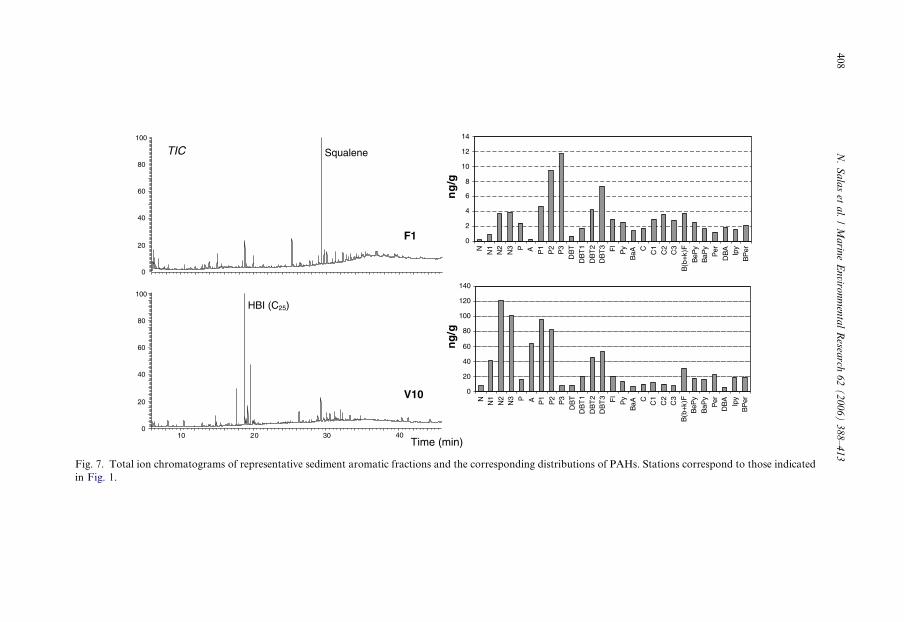
/gFig. 7. Total ion chromatograms of representative sediment aromatic fractions and the corresponding distributions of PAHs. Stations correspond to those indicatedin Fig. 1.
408N
.S
ala
set
al.
/M
arin
eE
nviro
nm
enta
lR
esearch
62
(2
00
6)
38
8–
41
3
N. Salas et al. / Marine Environmental Research 62 (2006) 388–413 409
the values displayed by some samples collected in the area of Costa da Morte (F1) were inan intermediate position, suggesting a possible mixture of the Prestige oil with the pre-existing (chronic) pollution in the sediments, as was confirmed in a larger survey of sedi-ments carried out in the area (Franco et al., 2006).
The apparently low incidence of the oil on the continental shelf, despite the importanceand scale of the spill, can be attributed to the heavy nature of the product that was barelydispersed in the water column and accumulated in zooplankton, although some tar aggre-gates were deposited along the continental shelf and were collected during the study ofbottom fauna by beam trawling (Serrano et al., 2006).
4.1.6.2. Aromatic hydrocarbons. The total ion chromatograms of the aromatic fractionsshowed a number of resolved peaks corresponding to polyunsaturated alkanes of biogenicorigin, such as highly branched isoprenoids (HBI) and squalene (Fig. 7), already found inthe plankton samples. The almost absence of another planktonic indicator, namely HEH,is consistent with its relatively higher degradation rate in the sedimentary compartment(Jeng and Huh, 2004).
The single ion chromatograms corresponding to the molecular ions of parent and alkyl-ated PAHs proved the occurrence of low molecular weight PAHs (2–3 aromatic ring)together with their alkylated derivatives, typical constituents of petroleum, as well ashigher molecular weight (>4 aromatic ring) non-alkylated compounds, particularly peri-condensed, which derive from high temperature combustion sources (Fig. 7). This typeof mixed profiles is common in coastal sediments of urban/industrial areas (Bromanet al., 1988; Tolosa et al., 1996), and is currently attributed to chronic inputs of urban run-off. The relatively higher abundance of the more condensed components with respect tothe plankton samples can be attributed to its higher persistence in the marine environment,partially due to its enclosure in soot particles (Simo et al., 1997).
The ratios of C1 and C2 dibenzothiophenes and phenanthrene/anthracenes, determinedin the plankton samples, were rather disperse in the case of the present sediment samples(not shown). This may reflect a variety of hydrocarbon sources in the different coastaltransects, although those corresponding to station F1 were close to those of the Prestige
oil, consistently with the molecular marker ratios shown above.Total concentrations of the 15 parent sedimentary PAHs shown in Fig. 7 were of 240,
27 and 453 ng g�1 dw for stations V10, F1 and C4, respectively. Sediment backgroundconcentrations of parent PAHs for the NE Atlantic have been established in the rangeof 25–125 ng g�1 dw (OSPAR, 2000). Concentrations in the range of 100–500 ng g�1 oftotal parent PAHs were reported to be usual in subtidal sediments affected by chronicinputs (Franco et al., 2006). It is interesting to note that the values were rather similarfor each station along the sampling cruises, therefore confirming the representative natureof the data obtained within the area.
5. Conclusion
The data presented here show the lack of Prestige fuel oil accumulation in two size frac-tions (20–350 lm and >350 lm) of plankton during the spring and early summer bloomsafter the spill, with the possible exception of station F1 (Cape Fisterra) during May 10,which was off the most heavily oiled shoreline after the accident. This supports the previ-ous observation of Varela et al. (2006) on the lack of a significant effect of the oil spill on
410 N. Salas et al. / Marine Environmental Research 62 (2006) 388–413
the phytoplankton species composition and productivity during the following springbloom. The main reasons being the dominant northerly wind conditions during the springand early summer 2003, which prevented the arrival of fresh oil spilled from the wreck,together with the heavy nature of the fuel oil, which was barely dispersed in the seawater.This was reflected in the background concentrations of dissolved hydrocarbons found inthe area during the same period (Gonzalez et al., 2006). Moreover, the large variability ofplanktonic cycles could be a key factor hiding the acute accumulation of the spilled hydro-carbons. Then, the concentrations of PAHs found in the collected samples mainly arisefrom chronic pollution and can be considered as the reference values in the region. A seriesof molecular indicators were also found useful to ascertain the source of petroleum hydro-carbons in the planktonic organisms.
Acknowledgements
The authors are very grateful to the captains and crews of R/V Mytilus andLura fortheir help during the sampling programme and the Remote Sensing Data Analysis Serviceof the Plymouth Marine Laboratory. Special thanks to J. Gago, A.F.G. Gonzalez, O.G.Pereira and J. Otero for their collaboration during the collection of plankton samples, to J.Lorenzo and M. Alvarez-Ossorio for their counting. Financial support came from a Spe-cial Action of the Plan de Intervencion Cientıfica sobre el vertido y hundimiento del buque
Prestige and grant REN2002-02111/MAR from the Ministry of Education and Science.
References
Albaiges, J., Cuberes, M.R., 1980. On the environmental degradation of petroleum residues in the open sea.Chemosphere 9, 539–545.
Albaiges, J., Algaba, J., Grimalt, J., 1984. Extractable and bound neutral lipids in some lacustrine sediments.Organic Geochemistry 6, 223–236.
Albaiges, J., Morales, B., Vilas, F., 2006. The Prestige oil spill: A scientific response. Marine Pollution Bulletin 53,205–207.
Alvarez-Salgado, X.A., Roson, G., Perez, F.F., Pazos, Y., 1993. Hydrographic variability off the Rıas Baixas(NW Spain) during the upwelling season. Journal of Geophysical Research 98, 14447–14455.
Alvarez-Salgado, X.A., Figueiras, F.G., Perez, F.F., Groom, S., Nogueira, E., Borges, A.V., Chou, L., Castro,C.G., Moncoiffe, G., Rıos, A.F., Miller, A.E.J., Frankignoulle, M., Savidge, G., Wollast, R., 2003. ThePortugal coastal counter current off NW Spain: new insights on its biogeochemical variability. Progress inOceanography 56, 281–321.
Alvarez-Salgado, X.A., Herrera, J.L., Gago, J., Otero, P., Soriano, J.A., Pola, C.G., Garcıa-Soto, C., 2006.Influence of the oceanographic conditions during spring 2003 on the transport of the Prestige tanker fuel oil tothe Galician coast. Marine Pollution Bulletin 53, 239–249.
Avigan, J., Blumer, M., 1968. On the origin of pristane in marine organisms. Journal of Lipid Research 9, 350–352.
Baith, K., Lindsay, R., Fu, G., McClain, C.R., 2001. SeaDAS: data analysis system developed for ocean colorsatellite sensors. EOS, Transaction of the American Geophysical Union 82, 202–205.
Bakun, A., Nelson, C.S., 1991. The seasonal cycle of wind-stress curl in subtropical eastern boundary currentregions. Journal of Physical Oceanography 21, 1815–1834.
Bates, T.S., Hamilton, S.E., Cline, I.D., 1984. Vertical transport and sedimentation of hydrocarbons in thecentral main basin of Puget Sound, Washington. Environmental Science and Technology 18, 299–305.
Bieger, T., Abrajano, T.A., Hellou, J., 1997. Generation of biogenic hydrocarbons during a spring bloom inNewfoundland coastal (NW Atlantic) waters. Organic Geochemistry 26, 207–218.
Blanton, J.O., Tenore, K.R., Castillejo, F.F.de., Atkinson, L.P., Schwing, F.B., Lavın, A., 1987. The relationshipof upwelling to mussel production in the rıas on the Western coast of Spain. Journal of Marine Research 45,497–511.
N. Salas et al. / Marine Environmental Research 62 (2006) 388–413 411
Blumer, M., Guillard, R.R.L., Chase, T., 1971. Hydrocarbons in marine phytoplankton. Marine Biology 8, 183–189.
Bode, A., Casas, B., Fernandez, E., Maranon, E., Serret, P., Varela, M., 1996. Phytoplankton biomass andproduction in shelf waters off NW Spain: spatial and seasonal variability in relation to upwelling.Hydrobiologia 341, 225–234.
Bosc, E., Bricaud, A., Antoine, D., 2004. Seasonal and interannual variability in algal biomass and primaryproduction in the Mediterranean Sea, as derived from 4 years of SeaWiFS observations. GlobalBiogeochemical Cycles 18, GB1005.
Bricaud, A., Bosc, E., Antoine, D., 2002. Algal biomass and sea surface temperature in the Mediterranean Basin.Intercomparison of data from various satellite sensors, and implications for primary production estimates.Remote Sensing Environment 81, 163–178.
Broman, D., Colmsjo, A., Ganning, B., Naf, C., Zebuhr, Y., 1988. A multi-sediment-trap study on the temporaland spatial variability of polycyclic aromatic hydrocarbons and lead in an anthropogenic influencedarchipelago. Environmental Science and Technology 22, 1219–1234.
Broman, D., Naf, C., Lundbergh, I., Zebuhr, Y., 1990. An in situ study on the distribution, biotransformationand flux of polycyclic aromatic hydrocarbons (PAHs) in an aquatic food chain (seston–Mytilus edulis L.–Somateria mollissima L.) from the Baltic: An ecotoxicological perspective. Environmental Toxicology andChemistry 9, 429–442.
Casas, B., Varela, M., Canle, M., Gonzalez, N., Bode, A., 1997. Seasonal variations of nutrients, seston andphytoplankton, and upwelling intensity off La Coruna (NW Spain). Estuarine, Coastal and Shelf Science 44,767–778.
Crosby, D.S., Breaker, L.C., Gemmill, W.H., 1993. A proposed definition for vector correlation in geophysics:theory and application. Journal of Atmospheric Oceanic Technology 10, 355–367.
Daling, P.S., Faksness, L.G., Hansen, A.B., Stout, S.A., 2002. Improved and standardized methodology for oilspill fingerprinting. Environmental Forensics 3, 263–278.
Dıez, S., Sabate, J., Vinas, M., Bayona, J.M., Solanas, A.M., Albaiges, J., 2005. The Prestige oil spill. I.Biodegradation of a heavy fuel oil under simulated conditions. Environmental Toxicology and Chemistry 24,2203–2217.
Douglas, G.S., Bence, A.E., Prince, R.C., McMillen, S.J., Butler, E.L., 1996. Environmental stability of selectedpetroleum hydrocarbon source and weathering ratios. Environmental Science and Technology 30,2332–2339.
Figueiras, F.G., Rios, A.F., 1993. Phytoplankton succession, red tides and the hydrographic regime in the RiasBajas of Galicia. In: Smayda, T.J., Shimizu, Y. (Eds.), Toxic Phytoplankton blooms in the Sea. ElsevierScience Publishers B.V., The Netherlands, pp. 239–244.
Franco, M.A., Vinas, L., Soriano, J.A., de Armas, D., Gonzalez, J.J., Beiras, R., Salas, N., Bayona, J.M.,Albaiges, J., 2006. Spatial distribution and ecotoxicity of petroleum hydrocarbons in sediments from theGalicia continental shelf (NW Spain) after the Prestige oil spill. Marine Pollution Bulletin 53, 260–271.
Gassman, G., 1982. Detection of aliphatic hydrocarbons derived by recent bioconversion from fossil fuel oil inNorth Sea waters. Marine Pollution Bulletin 13, 309–315.
Godin, G., 1972. The Analysis of Tides. Liverpool University Press, Liverpool, 264 pp.Gonzalez, A.F., Otero, J., Guerra, A., Prego, R., Rocha, F.J., Dale, A.W., 2005. Distribution of common
octopus and common squid paralarvae in a wind-driven upwelling area (Ria of Vigo, northwestern Spain).Journal of Plankton Research 27, 271–277.
Gonzalez, J.J., Vinas, L., Franco, M.A., Fumega, J., Soriano, J.A., Grueiro, G., Muniategui, S., Lopez-Mahıa,P., Prada, D., Bayona, J.M., Alzaga, R., Albaiges, J., 2006. Spatial and temporal distribution of dissolved/dispersed aromatic hydrocarbons in seawater in the area affected by the Prestige oil spill. Marine PollutionBulletin 53, 250–259.
Gregg, W.W., Carder, K.L., 1990. A simple spectral solar irradiance model for cloudless maritime atmospheres.Limnology and Oceanography 35, 1657–1675.
Jeng, W-L., Huh, C-A., 2004. Lipids in suspended matter and sediments from the East China Sea Shelf. OrganicGeochemistry 35, 647–660.
Joint, I., Groom, S.B., Wollast, R., Chou, L., Tilstone, G.H., Figueiras, F.G., Loijens, M., Smyth, T.J., 2002. Theresponse of phytoplankton production to periodic upwelling and relaxation events at the Iberian shelf break:estimates by the C-14 method and by satellite remote sensing. Journal of Marine Systems 32, 219–238.
Ko, F., Sanford, L.P., Baker, J.E., 2003. Internal cycling of particle reactive organic chemicals in the ChesapeakeBay water column. Marine Chemistry 81, 163–176.
412 N. Salas et al. / Marine Environmental Research 62 (2006) 388–413
Kowaleska, G., Konat, J., 1997. The role of phytoplankton in the transport and distribution of polynucleararomatic hydrocarbons in the southern Baltic environment. Oceanologia 39, 267–277.
Levitus, S., 1982. Climatological atlas of the world ocean (NOAA Prof. Paper, 13). US Government PrintingOffice, Washington, DC.
Mackie, P.R., Hardy, R., Butler, E.I., 1978. Early samples of oil in water and some analyses of zooplankton.Marine Pollution Bulletin 9, 296–297.
Middleditch, B.S., Chang, E.S., Basile, B., 1979. Alkanes in plankton from the Buccaneer oilfield. Bulletin ofEnvironmental Contamination and Toxicology 21, 421–427.
Morel, A., 1991. Light and marine photosynthesis: a spectral model with geochemical and climatologicalimplications. Progress in Oceanography 26, 263–306.
Morel, A., Berthon, J.F., 1989. Surface pigments, algal biomass profiles, and potential production of the euphoticlayer: Relationship reinvestigated in view of remote-sensing applications. Limnology and Oceanography 34,1545–1562.
Morel, A., Antoine, D., Babin, M., Dandonneau, Y., 1996. Measured as modelled primary production in thenortheast Atlantic (EUMELI JGFS program): the impact of natural variations in photosynthetic parameterson model predictive skill. Deep-Sea Research I 43, 1273–1304.
O’Reilly, J.E., Maritorena, S., Mitchell, B.G., Siegel, D.A., Carder, K.L., Garver, S.A., Kahru, M., McClain, C.,1998. Ocean color chl a algorithms for SeaWiFS. Journal of Geophysical Research 103, 24937–24953.
OSPAR, 2000. Quality Status Report 2000: Region IV – Bay of Biscay and Iberian Coast. OSPAR Commission,London, UK.
Osterroht, C., Petrick, G., Wenck, A., 1983. Seasonal variation of particulate hydrocarbons in relation tobiological parameters. Marine Chemistry 14, 175–194.
Pazos, Y., Figueiras, F.G., Alvarez-Salgado, X.A., Roson, G., 1995. The control of succession in red tide speciesin the Rıa de Arousa (NW Spain) by upwelling and stability. In: Lassus, P., Arzul, G., Erard-Le Denn, E.,Gentien, P., Marcaillou-Le Baut, C. (Eds.), Harmful Marine Algal Blooms. Lavoisier Intercept Ltd, pp. 645–650.
Peliz, A., Dubert, J., Santos, A.M.P., Oliveira, P.B., Le Cann, B., 2005. Winter upper ocean circulation in theWestern Iberian Basin – Fronts, eddies and poleward flows: an overview. Deep Sea Research I 52, 621–646.
Perez, F.F., Alvarez-Salgado, X.A., Roson, G., 2000. Stochiometry of nutrients (C, N, P and Si) consumptionand organic matter production in a coastal inlet affected by upwelling. Marine Chemistry 69, 217–236.
Porte, C., Biosca, X., Pastor, D., Sole, M., Albaiges, J., 2000. The Aegean Sea oil spill. II. Temporal study of thehydrocarbons accumulation in bivalves. Environmental Science and Technology 34, 5067–5075.
Prahl, F.G., Carpenter, R., 1979. The role of zooplankton fecal pellets in the sedimentation of polycyclic aromatichydrocarbons in Dabob Bay, Washington. Geochimica Cosmochimica Acta 43, 1959–1972.
Raoux, C., Bayona, J.M., Miguel, J.C., Teyssie, J.L., Fowler, S.W., Albaiges, J., 1999. Particulate fluxes ofaliphatic and aromatic hydrocarbons in near-shore waters to the Northwestern Mediterranean Sea, and theeffect of continental runoff. Estuarine Coastal and Shelf Science 48, 605–616.
Reynolds, R.W., Smith, T.M., 1995. A high-resolution global sea surface temperature climatology. Journal ofClimate 8, 1571–1583.
Rıos, A.F., Perez, F.F., Fraga, F., 1992. Water masses in upper and middle North Atlantic Ocean east of Azores.Deep Sea Research I 39, 645–658.
Serrano, A., Sanchez, F., Preciado, I., Parra, S., Frutos, I., 2006. Spatial and temporal changes in benthic anddemersal communities of the Galician continental shelf after the Prestige oil spill. Marine Pollution Bulletin53, 315–331.
Serrazanetti, G.P., Conte, L.S., Carpene, E., Bergami, C., Fonda-Umani, S., 1991. Distribution of aliphatichydrocarbons in plankton of Adriatic Sea open waters. Chemosphere 23, 925–938.
Sibley, P.K., Harris, M.L., Bestari, K.T., Steele, T.A., Robinson, R.D., Gensemer, R.W., Day, K.E., Solomon,K.R., 2004. Response of zooplankton and phytoplankton communities to creosote-impregnated Douglas Firpilings in freshwater microcosms. Archives of Environmental Contamination and Toxicology 47, 56–66.
Simo, R., Grimalt, J., Albaiges, J., 1997. Loss of unburned-fuel hydrocarbons from combustion aerosols duringatmospheric transport. Environmental Science and Technology 31, 2697–2700.
Skjoldal, H.R., Dale, T., Haldorsen, H., Pengerud, B., Thingstad, T.F., Tjessem, K., Aberg, A., 1982. Oilpollution and plankton dynamics. 1. Controlled ecosystem experiments during the 1980 spring bloom inLindaspollene, Norway. Netherlands Journal of Sea Research 16, 511–523.
Tilstone, G.H., Figueiras, F.G., Fraga, F., 1994. Upwelling–downwelling sequences in the generation of red tidesin a coastal upwelling system. Marine Ecology Progress Series 112, 241–253.
N. Salas et al. / Marine Environmental Research 62 (2006) 388–413 413
Tilstone, G.H., Figueiras, F.G., Fermın, E.G., Arbones, B., 1999. Significance of nanoplankton photosynthesisand primary production in a coastal upwelling system (Rıa de Vigo, NW Spain). Marine Ecology ProgressSeries 183, 13–27.
Tolosa, I., Bayona, J.M., Albaiges, J., 1996. Aliphatic and polycyclic aromatic hydrocarbons and sulfur/oxygenderivatives in NW Mediterranean sediments: Spatial and temporal variability, fluxes and budgets.Environmental Science and Technology 30, 2495–2503.
Torres, R., Barton, E.D., Miller, P., Fanjul, E., 2003. Spatial patterns of wind and sea surface temperature in theGalician upwelling region. Journal of Geophysical Research 108 (C4), 27(1)–27(13).
UNESCO, 1985. The international system of units (SI) in oceanography. UNESCO Technical Papers in MarineSciences, vol. 45, pp. 1–124.
Varela, M., Fuentes Penas, E., Cabanas, J.M., 1984. Produccion primaria de las Rıas Baixas de Galicia.Cuadernos del Area de Ciencias Marinas 1, 137–182.
Varela, M., Bode, A., Lorenzo, J., Alvarez-Ossorio, M.T., Miranda, A., Patrocinio, T., Anadon, A., Viesca, L.,Rodrıguez, N., Valdes, L., Urrutia, A., Rodrıguez, M., Alvarez-Salgado, X.A., Groom, S., 2006. The effect ofthe Prestige oil spill on the plankton in the N–NW Spanish coast. Marine Pollution Bulletin 53, 272–286.
Vazquez, J., Hamilton, M., Van Tran, A., Sumagaysay, R.M., 1994. JPL Physical Oceanography DAACreprocesses ten years of sea-surface temperature measurements from NOAA AVHRR. The Earth Observer 6,16–17.
Volkman, J.K., Holdsworth, D.G., Neill, G.P., Bavor Jr., H.J., 1992. Identification of natural, anthropogenic andpetroleum hydrocarbons in aquatic sediments. The Science of the Total Environment 112, 203–219.
Wang, Z.D., Fingas, M., 1995. Use of methyldibenzothiophenes as markers for differentiation and sourceidentification of crude and weathered oils. Environmental Science and Technology 29, 2841–2849.
Wooster, W.S., Bakun, A., McClain, D.R., 1976. The seasonal upwelling cycle along the eastern boundary of theNorth Atlantic. Journal of Marine Research 34, 131–141.
Wraige, E.J., Johns, L., Belt, S.T., Masse, G., Rober, J-M., Rowland, S., 1999. Highly branched C25 isoprenoidsin axenic cultures of Haslea ostrearia. Phytochemistry 51, 69–73.
Zimmerman, R.C., Kremer, J.M., Dugdale, R.C., 1987. Acceleration of nutrient uptake by phytoplankton in acoastal upwelling ecosystem: A modeling analysis. Limnology and Oceanography 32, 359–367.